Embed Size (px)
Citation preview
Quarterly Report / Q2 December 2015
H1 FY16 production of 202,951 ounces, exceeded target
FY16 guidance revised upward
Accelerated debt reduction of US$33 million
Safety record - lowest recorded injury rate
St Barbara Limited Level 10, 432 St Kilda Road, Melbourne VIC 3004 T +61 3 8660 1900 F +61 3 8660 1999
ACN 009 165 066 Locked Bag 9, Collins Street East, Melbourne VIC 8003 W www.stbarbara.com.au
Executive Summary
Operations
˃ Consolidated gold production was 91,912 ounces for the
December quarter (Q1 Sep: 111,039 oz). Consolidated All-
In Sustaining Cost1 (AISC) was A$992 per ounce for the
quarter (Q1 Sep: A$863 per ounce). The average realised
gold price for the quarter was A$1,560 per ounce (Q1 Sep:
A$1,565 per ounce).
˃ Gwalia (Western Australia) gold production for the quarter
was 63,533 ounces (Q1 Sep: 72,388 oz) at AISC of A$846
per ounce (Q1 Sep A$692 per ounce). The lower
production was the result of ore being mined from lower
grade stopes as anticipated in the mine schedule, partially
offset by an increase in ore milled. As previously
announced, production from King of the Hills stockpiles
ceased in September 2015, and the mine was sold in
October 2015 (Q1 Sep: 9,112 oz).
˃ Simberi (PNG) gold production was 28,379 ounces for the
quarter (Q1 Sep: 29,539 oz), comfortably in excess of the
targeted 100,000 oz p.a. run rate. AISC was A$1,319 per
ounce (Q1 Sep: A$1,252 per ounce), impacted by a major
purchase of capital equipment in the quarter. Simberi
produced 107,553 ounces of gold in calendar 2015.
Health & Safety
˃ The Company-wide Total Recordable Injury Frequency
Rate (TRIFR), calculated as a rolling 12 month average, was
a record low 3.4 to 31 December 2015 (Q1 Sep: 4.1).
˃ St Barbara was the overall winner, as well as the winner in
three categories, in the CME (WA) Eastern Regional
Council 2015 Underground Mine Emergency Response
Competition, held at Kanowna Belle WA, in November
2015.
˃ In the previous quarter St Barbara was the winner in four
categories, including Most Improved and Multi-Casualty,
at the PNG National Mines Rescue Challenge held over
four days in Madang, Papua New Guinea, in August 2015.
Exploration
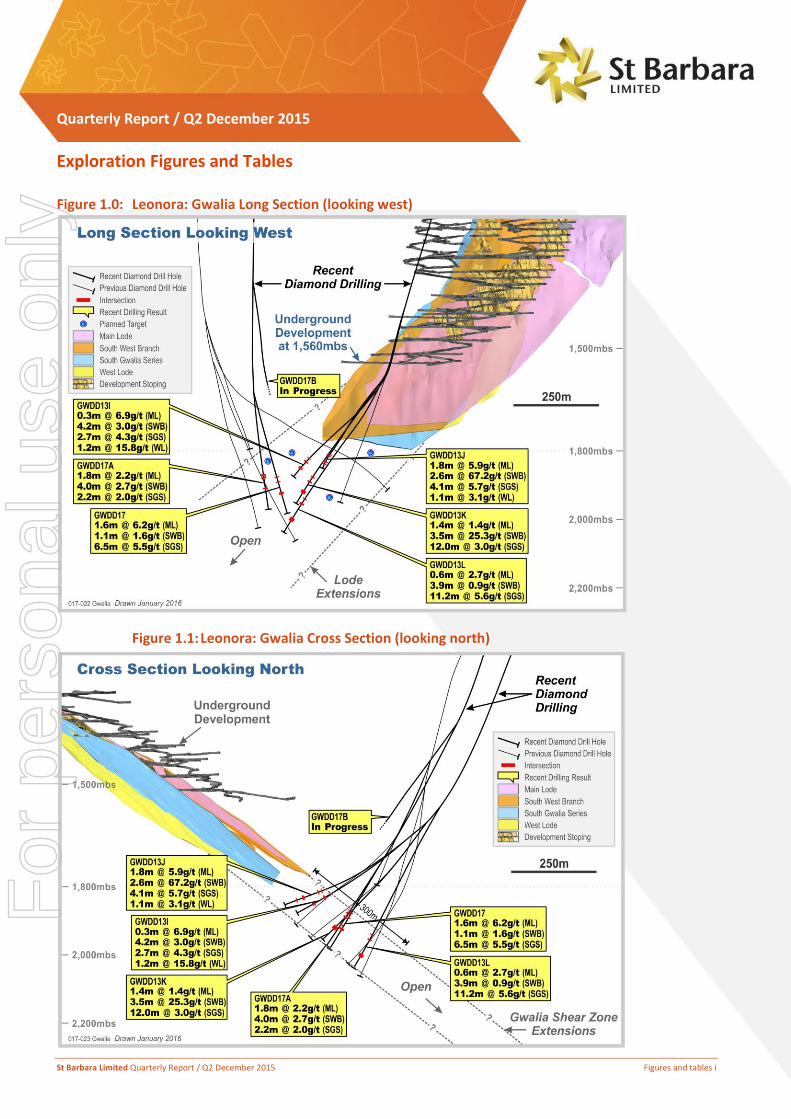
˃ Gwalia (Leonora) WA A program directed at extensions to
the Gwalia lode system approximately 400m below
current underground mine workings has continued with
the completion of parent hole GWDD17 to a downhole
1 Non-IFRS measure, refer page 12
depth of 2,155m and the subsequent drilling of daughter
hole GWDD17A to 2,140m. Additionally, four daughter
holes were completed from parent hole GWDD13 being
GWDD13I-J-K-L. The Gwalia Mine Sequence was
intersected in each drill hole and evaluated the lode
system over an approximate strike length of 200m,
between 1,800 to 2,000 metres below surface. Details are
set out in Figures 1.0, 1.1 and Table 1 in the Exploration
Figures and Tables appendix. Further drilling is in progress
targeting extensions to the lode system.
˃ Centenary Project (Leonora) WA An anomalous nickel
mineralisation has been identified in a diamond drill hole
(CNRD0004) which targeted an electromagnetic (EM)
anomaly located approximately 60 km north of Leonora,
announced during April 2015. A second phase of work to
further evaluate this target, as well as other base metal
opportunities in the Centenary Project area, is expected to
commence in the March 2016 quarter.
˃ Pinjin Project (Yilgarn) WA An aircore drilling program of
up to 25,000 metres to test bedrock geochemical and
geophysical targets within the Pinjin project is expected to
commence late in the March 2016 quarter.
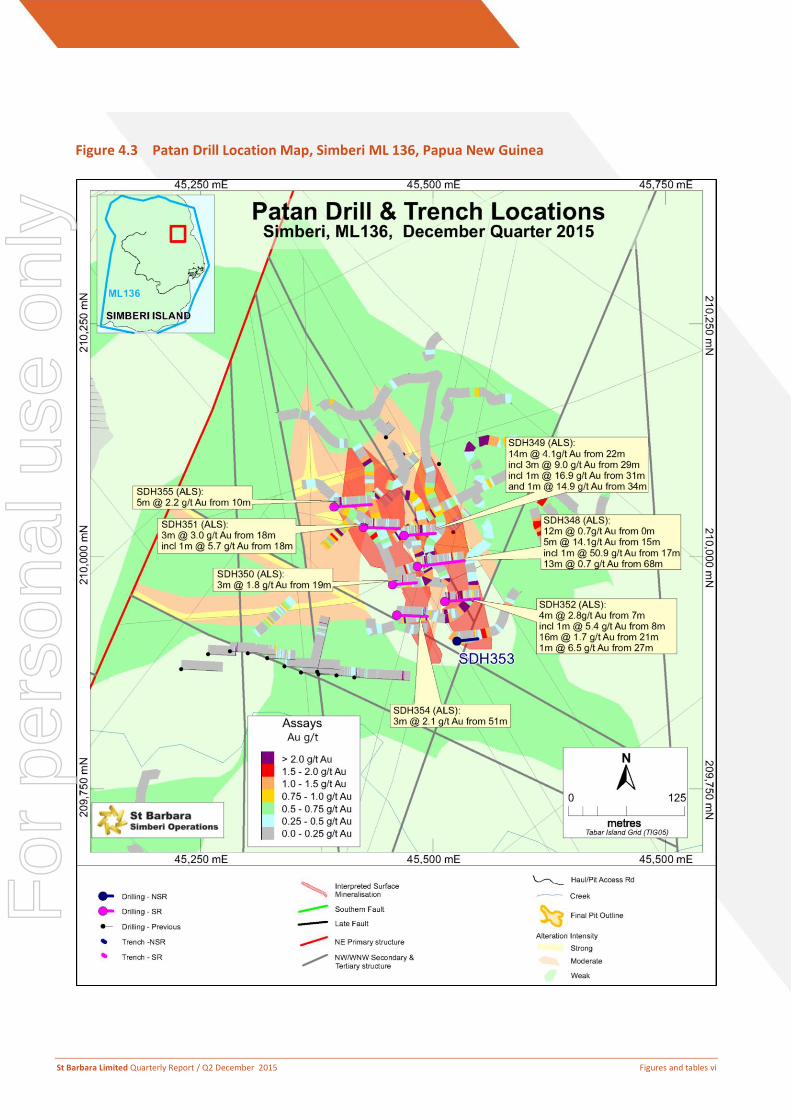
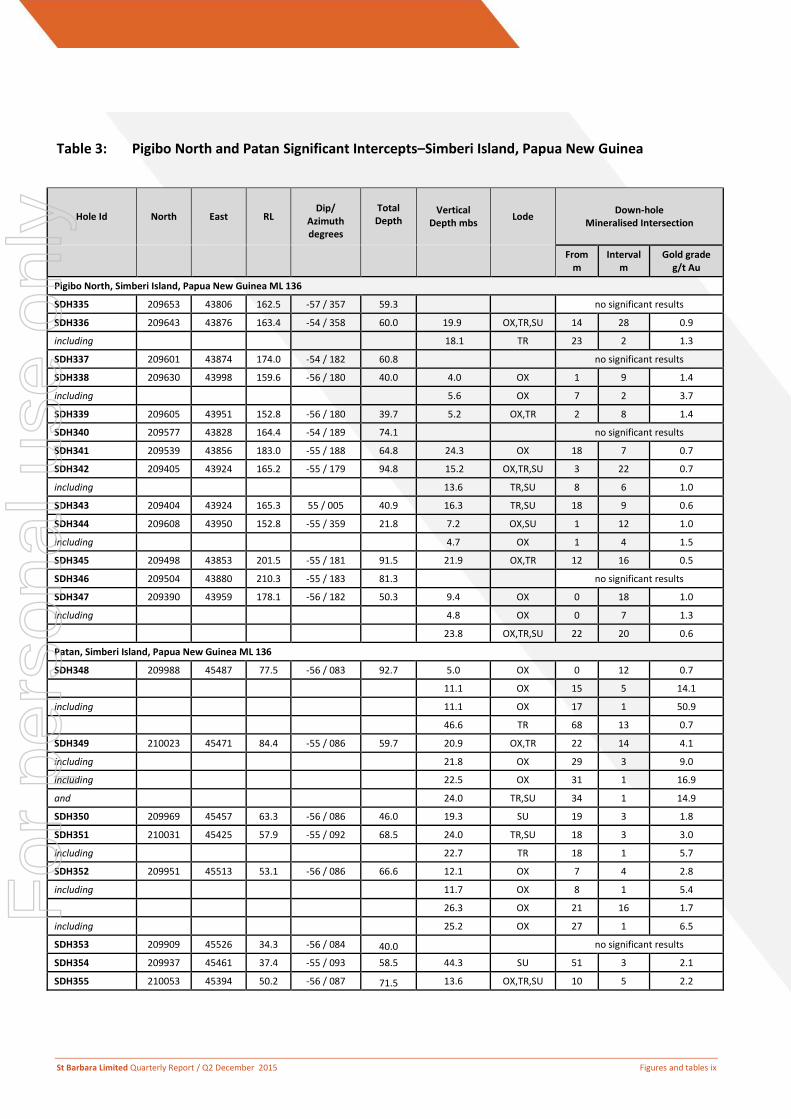
˃ Simberi PNG Drilling at Pigibo North and Patan on the
Simberi Mine Lease (PNG) targeting oxide mineralisation
was completed during the quarter. Encouraging results
were returned (all intercepts downhole, details in Figure
4.3 and Table 3) including:
Patan
˃ SDH348: 5m @ 14.1 g/t Au from 15m
˃ SDH349: 14m @ 4.1 g/t Au from 22m
˃ SDH352: 16m @ 1.7 g/t Au from 21m
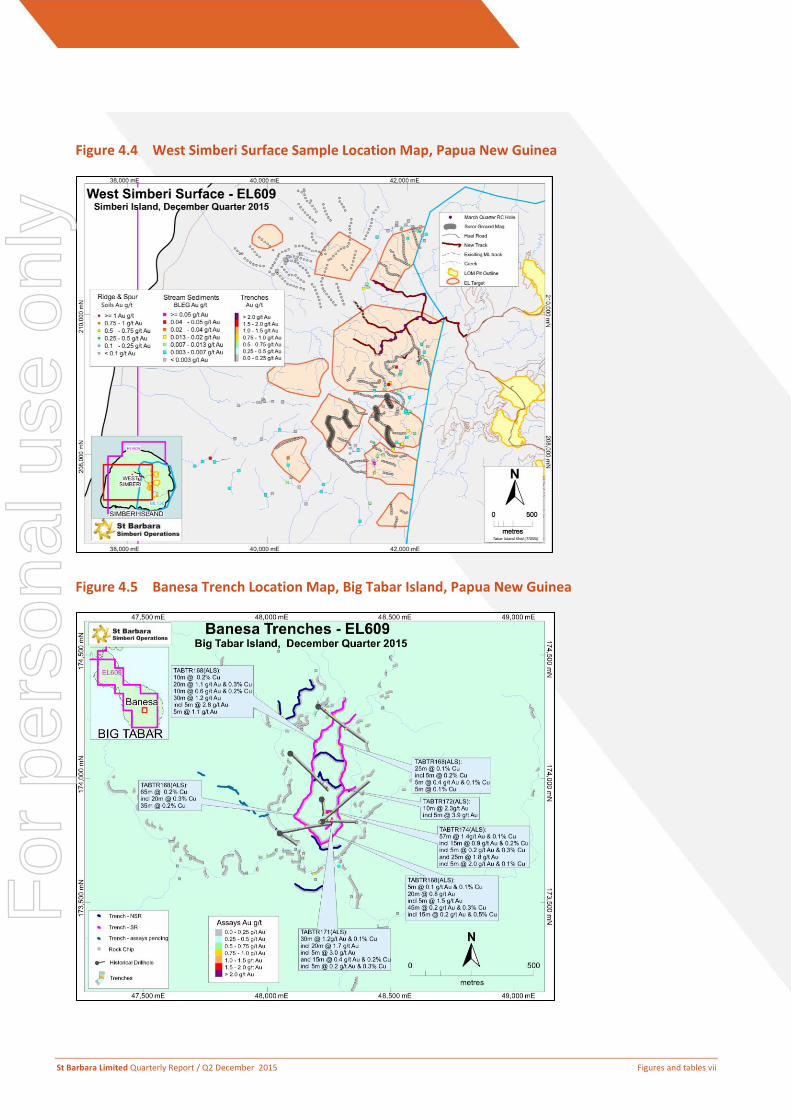
˃ Big Tabar Island PNG A program of detailed creek
mapping and channel sampling was completed at Banesa
Au-Cu porphyry prospect (EL609) during the December
quarter. Significant trench results were returned (details
in Figure 4.5 and Table 3) including:
˃ TABTR174: 57m @ 1.4 g/t Au and 0.1% Cu, including
25m @ 1.8 g/t Au
For
per
sona
l use
onl
y
St Barbara Limited Quarterly Report / Q2 December 2015 Page 2 of 14
Finance (unaudited)
˃ US dollar denominated debt was reduced by US$33 million
during the quarter to US$216 million at 31 December 2015
(Q1 Sep: US$249 million). US$109 million of debt has
been repaid since 1 June 2015 and debt repayment
remains the preferred use for the Company’s strong cash
flows. At 31 December 2015, interest bearing liabilities
totalled A$299 million (Q1 Sep: A$358 million).
˃ Cash contribution1 from operations for the quarter was
A$57 million, (Q1 Sep: A$80 million) with the Gwalia result
lower than the previous quarter because of the mining
schedule moving through lower grade areas and the
Simberi result affected by higher capital expenditure in the
quarter. Cash at bank as at 31 December 2015 was A$100
million2 (Q1 Sep: A$115 million) after repayment of debt
and financing costs in the quarter of A$58 million (Q1 Sep:
A$34 million).
Outlook
˃ Guidance for FY16 was revised upward (as announced on 8
January 2016) due to above-target production in the first
half as follows:
˃ Forecast Gwalia (Leonora) gold production of
between 245,000 and 260,000 ounces (previously
230,000 to 250,000 ounces) at an AISC of between
A$840 and A$900 per ounce (previously between
A$875 and A$940 per ounce), with capex unchanged
at between A$30 and A$35 million.
˃ Forecast Simberi gold production of between
100,000 and 110,000 ounces (previously 90,000 to
110,000 ounces) at an AISC of between A$1,350 and
A$1,430 per ounce (previously A$1,275 to A$1,400
per ounce), with capex of between A$10 and A$12
million (previously between A$8 and A$12 million).
˃ Forecast exploration expenditure of A$15 million
(previously A$10 million).
Bob Vassie Managing Director and CEO
21 January 2016
1 Non-IFRS measure, refer reconciliation of cash movements on page 11 2 Excluding A$1 million restricted cash
For
per
sona
l use
onl
y
St Barbara Limited Quarterly Report / Q2 December 2015 Page 3 of 14
St Barbara Gold Production & Guidance
Production Summary
Consolidated
Q3 Mar
FY15
Q4 Jun
FY15
Year
FY15
Q1 Sep
FY16
Q2 Dec
FY16
Guidance
FY16 [3]
Production
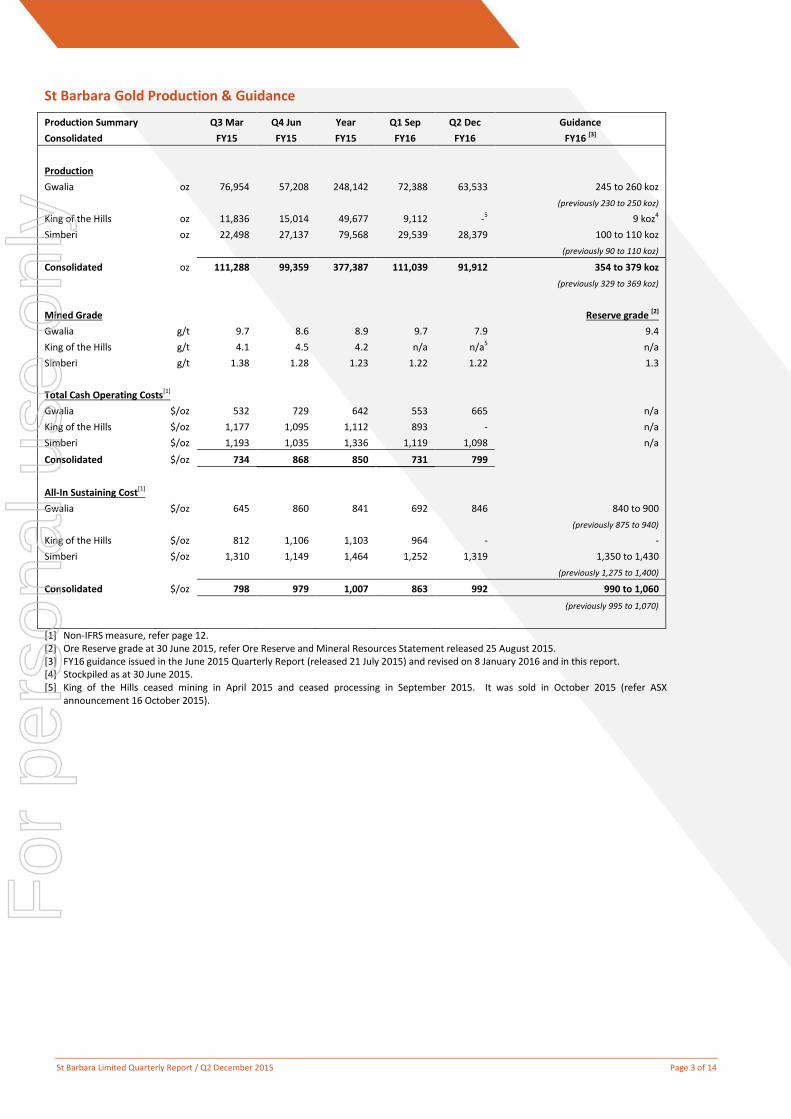
Gwalia oz 76,954 57,208 248,142 72,388 63,533 245 to 260 koz
(previously 230 to 250 koz)
King of the Hills oz 11,836 15,014 49,677 9,112 -5 9 koz4
Simberi oz 22,498 27,137 79,568 29,539 28,379 100 to 110 koz
(previously 90 to 110 koz)
Consolidated oz 111,288 99,359 377,387 111,039 91,912 354 to 379 koz
(previously 329 to 369 koz)
Mined Grade
Reserve grade [2]
Gwalia g/t 9.7 8.6 8.9 9.7 7.9 9.4
King of the Hills g/t 4.1 4.5 4.2 n/a n/a5 n/a
Simberi g/t 1.38 1.28 1.23 1.22 1.22 1.3
Total Cash Operating Costs[1]
Gwalia $/oz 532 729 642 553 665 n/a
King of the Hills $/oz 1,177 1,095 1,112 893 - n/a
Simberi $/oz 1,193 1,035 1,336 1,119 1,098 n/a
Consolidated $/oz 734 868 850 731 799
All-In Sustaining Cost[1]
Gwalia $/oz 645 860 841 692 846 840 to 900
(previously 875 to 940)
King of the Hills $/oz 812 1,106 1,103 964 - -
Simberi $/oz 1,310 1,149 1,464 1,252 1,319 1,350 to 1,430
(previously 1,275 to 1,400)
Consolidated $/oz 798 979 1,007 863 992 990 to 1,060
(previously 995 to 1,070)
[1] Non-IFRS measure, refer page 12. [2] Ore Reserve grade at 30 June 2015, refer Ore Reserve and Mineral Resources Statement released 25 August 2015. [3] FY16 guidance issued in the June 2015 Quarterly Report (released 21 July 2015) and revised on 8 January 2016 and in this report. [4] Stockpiled as at 30 June 2015. [5] King of the Hills ceased mining in April 2015 and ceased processing in September 2015. It was sold in October 2015 (refer ASX
announcement 16 October 2015).
For
per
sona
l use
onl
y
St Barbara Limited Quarterly Report / Q2 December 2015 Page 4 of 14
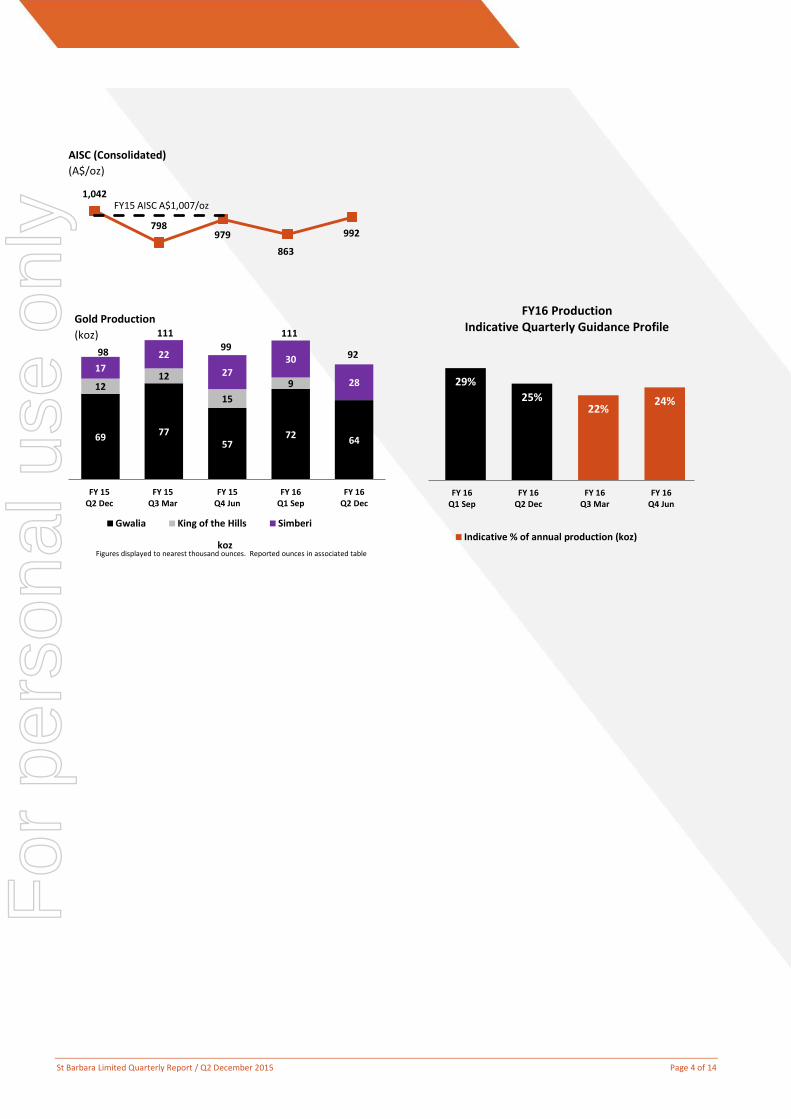
Gold Production
(koz)
AISC (Consolidated)
(A$/oz)
29%
25% 22%
24%
FY 16Q1 Sep
FY 16Q2 Dec
FY 16Q3 Mar
FY 16Q4 Jun
FY16 Production Indicative Quarterly Guidance Profile
Indicative % of annual production (koz)
1,042
798 979
863
992
FY15 AISC A$1,007/oz
69 77 57
72 64
12 12
15
9
17
22
27 30
28
98
111
99
111
92
FY 15Q2 Dec
FY 15Q3 Mar
FY 15Q4 Jun
FY 16Q1 Sep
FY 16Q2 Dec
Gwalia King of the Hills Simberi Total
Figures displayed to nearest thousand ounces. Reported ounces in associated table koz
For
per
sona
l use
onl
y
St Barbara Limited Quarterly Report / Q2 December 2015 Page 5 of 14
Gwalia, Leonora, WA
Operations
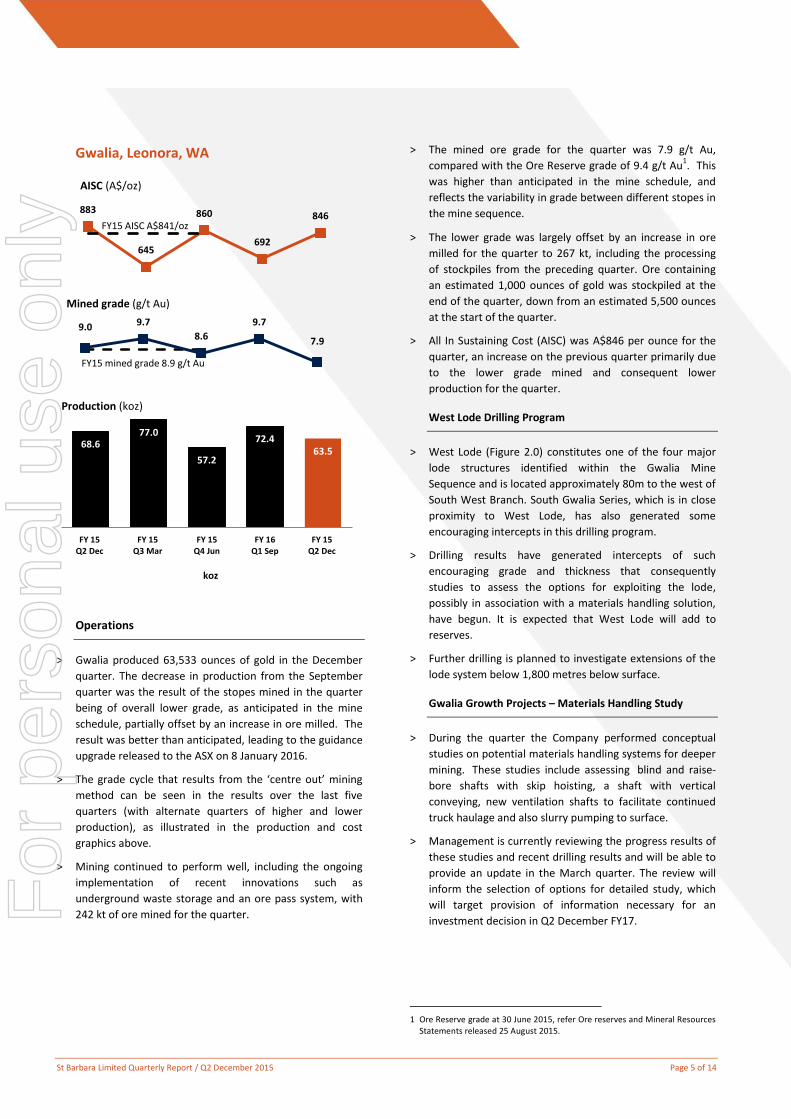
˃ Gwalia produced 63,533 ounces of gold in the December
quarter. The decrease in production from the September
quarter was the result of the stopes mined in the quarter
being of overall lower grade, as anticipated in the mine
schedule, partially offset by an increase in ore milled. The
result was better than anticipated, leading to the guidance
upgrade released to the ASX on 8 January 2016.
˃ The grade cycle that results from the ‘centre out’ mining
method can be seen in the results over the last five
quarters (with alternate quarters of higher and lower
production), as illustrated in the production and cost
graphics above.
˃ Mining continued to perform well, including the ongoing
implementation of recent innovations such as
underground waste storage and an ore pass system, with
242 kt of ore mined for the quarter.
˃ The mined ore grade for the quarter was 7.9 g/t Au,
compared with the Ore Reserve grade of 9.4 g/t Au1. This
was higher than anticipated in the mine schedule, and
reflects the variability in grade between different stopes in
the mine sequence.
˃ The lower grade was largely offset by an increase in ore
milled for the quarter to 267 kt, including the processing
of stockpiles from the preceding quarter. Ore containing
an estimated 1,000 ounces of gold was stockpiled at the
end of the quarter, down from an estimated 5,500 ounces
at the start of the quarter.
˃ All In Sustaining Cost (AISC) was A$846 per ounce for the
quarter, an increase on the previous quarter primarily due
to the lower grade mined and consequent lower
production for the quarter.
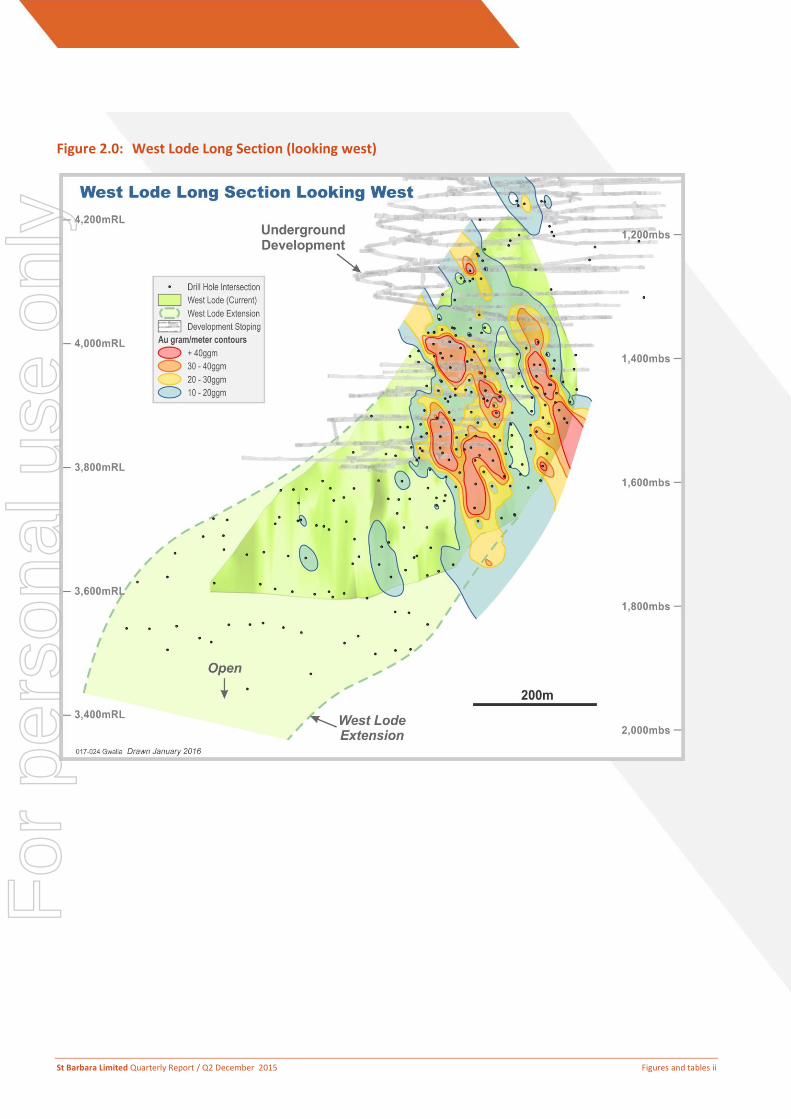
West Lode Drilling Program
˃ West Lode (Figure 2.0) constitutes one of the four major
lode structures identified within the Gwalia Mine
Sequence and is located approximately 80m to the west of
South West Branch. South Gwalia Series, which is in close
proximity to West Lode, has also generated some
encouraging intercepts in this drilling program.
˃ Drilling results have generated intercepts of such
encouraging grade and thickness that consequently
studies to assess the options for exploiting the lode,
possibly in association with a materials handling solution,
have begun. It is expected that West Lode will add to
reserves.
˃ Further drilling is planned to investigate extensions of the
lode system below 1,800 metres below surface.
Gwalia Growth Projects – Materials Handling Study
˃ During the quarter the Company performed conceptual
studies on potential materials handling systems for deeper
mining. These studies include assessing blind and raise-
bore shafts with skip hoisting, a shaft with vertical
conveying, new ventilation shafts to facilitate continued
truck haulage and also slurry pumping to surface.
˃ Management is currently reviewing the progress results of
these studies and recent drilling results and will be able to
provide an update in the March quarter. The review will
inform the selection of options for detailed study, which
will target provision of information necessary for an
investment decision in Q2 December FY17.
1 Ore Reserve grade at 30 June 2015, refer Ore reserves and Mineral Resources
Statements released 25 August 2015.
883
645
860
692
846
AISC (A$/oz)
FY15 AISC A$841/oz
68.6 77.0
57.2
72.4 63.5
FY 15Q2 Dec
FY 15Q3 Mar
FY 15Q4 Jun
FY 16Q1 Sep
FY 15Q2 Dec
koz
9.0 9.7
8.6
9.7
7.9
Mined grade (g/t Au)
FY15 mined grade 8.9 g/t Au
Production (koz)
For
per
sona
l use
onl
y

St Barbara Limited Quarterly Report / Q2 December 2015 Page 6 of 14
Outlook
˃ FY16 guidance has been revised due to above-target
production in the first half as follows:
˃ Production of between 245,000 ounces and 260,000
ounces (previously 230,000 to 250,000 ounces)
˃ AISC of between A$840 and A$900 per ounce
(previously between A$875 and A$940 per ounce)
˃ Capital expenditure of between A$30 and
A$35 million (unchanged).
Production Summary
Gwalia
Q4 Jun
FY15
Q1 Sep
FY16
Q2 Dec
FY16
Underground ore mined kt 216 254 242
Grade g/t 8.6 9.7 7.9
Low grade development
ore & stockpiles milled
kt 7 2 8
Grade g/t 1.9 2.6 3.3
Ore milled kt 225 241 267
Grade [1]
g/t 8.2 9.8 7.7
Recovery % 96 96 96
Gold production oz 57,208 72,388 63,533
All-In Sustaining Cost [2]
$ per ounce
Mining 469 356 410
Processing 99 121 123
Site services 65 52 51
Stripping and ore inventory
adjustments
58 (11) 42
691 518 626
By-product credits (2) (3) (2)
Third party refining & transport 1 1 1
Royalties 39 37 40
Total cash operating costs 729 553 665
less operating development (102) (45) (52)
Adjusted cash operating cost 627 508 613
Corporate and administration 36 40 48
Corporate royalty 24 23 23
Rehabilitation 2 3 3
On-site exploration - - -
Capitalised mine & op development 145 101 91
Sustaining capital expenditure 26 17 19
All-In Sustaining Cost (AISC) 860 692 846
[1] Includes Gwalia mineralised waste [2] Non-IFRS measure, refer page 12
231 250
216
254 242
FY 15Q2 Dec
FY 15Q3 Mar
FY 15Q4 Jun
FY 16Q1 Sep
FY 16Q2 Dec
Gwalia underground ore mined
kt
For
per
sona
l use
onl
y
St Barbara Limited Quarterly Report / Q2 December 2015 Page 7 of 14
Simberi, Papua New Guinea
[1] Non-IFRS measure, refer page 12
Operations
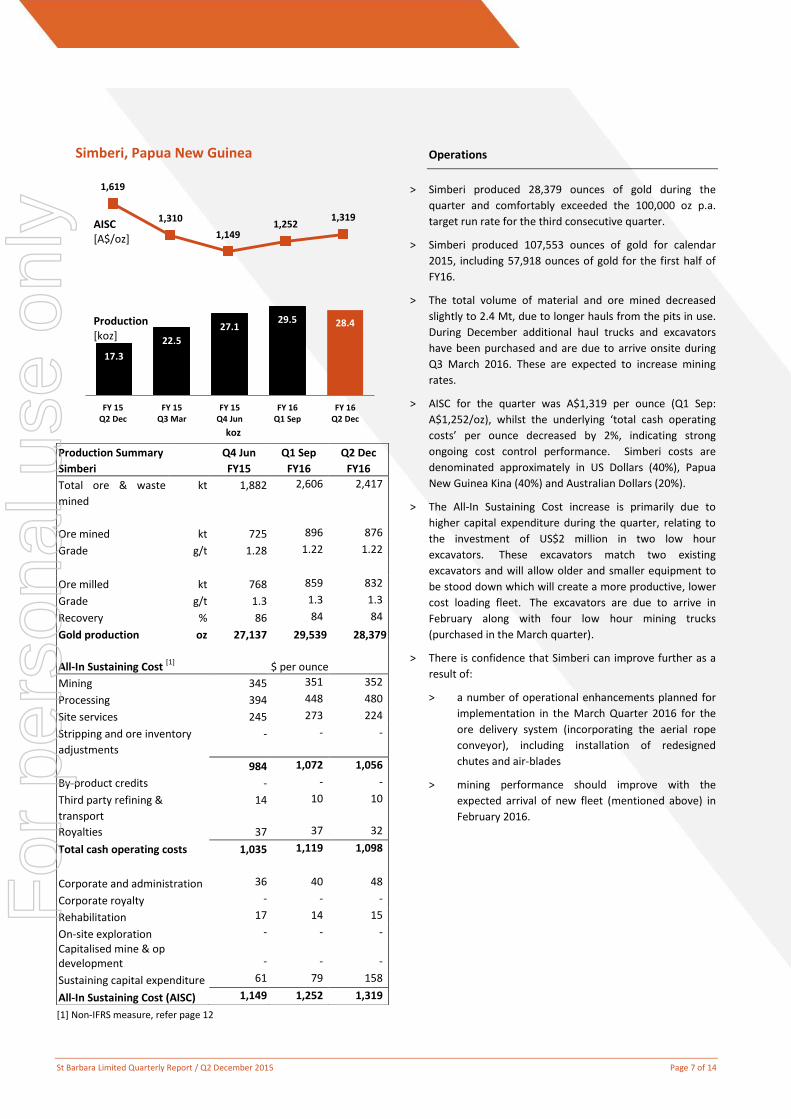
˃ Simberi produced 28,379 ounces of gold during the
quarter and comfortably exceeded the 100,000 oz p.a.
target run rate for the third consecutive quarter.
˃ Simberi produced 107,553 ounces of gold for calendar
2015, including 57,918 ounces of gold for the first half of
FY16.
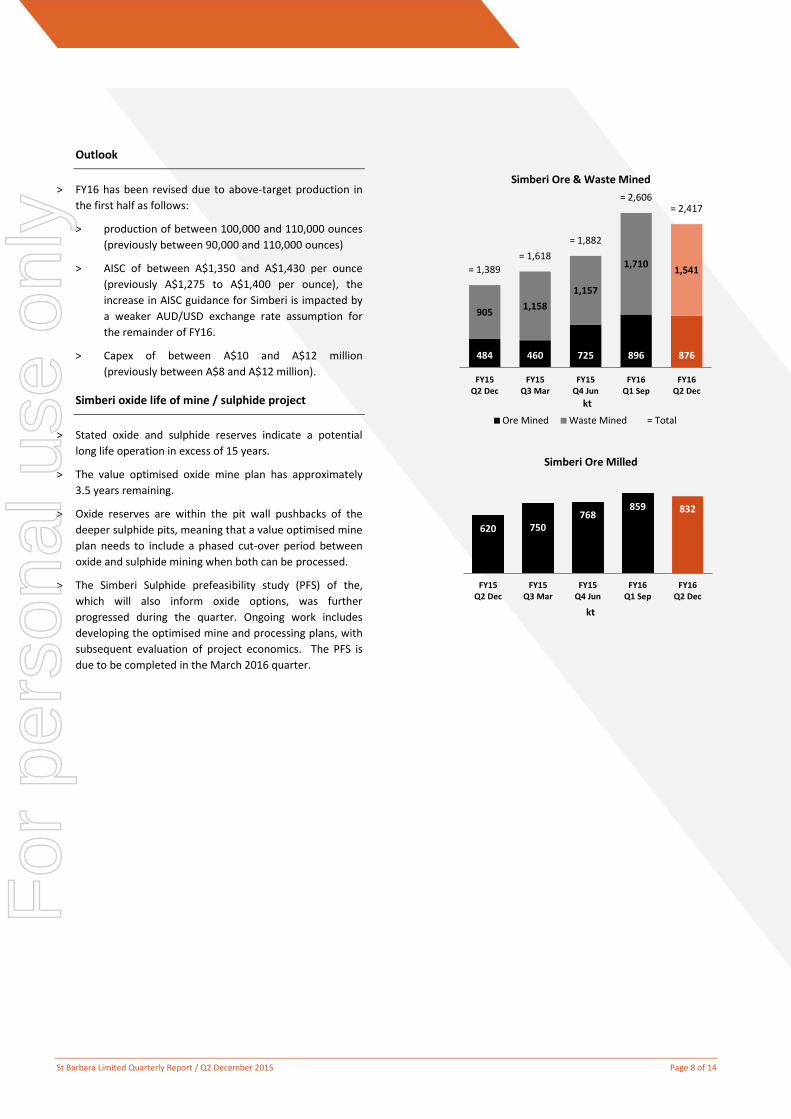
˃ The total volume of material and ore mined decreased
slightly to 2.4 Mt, due to longer hauls from the pits in use.
During December additional haul trucks and excavators
have been purchased and are due to arrive onsite during
Q3 March 2016. These are expected to increase mining
rates.
˃ AISC for the quarter was A$1,319 per ounce (Q1 Sep:
A$1,252/oz), whilst the underlying ‘total cash operating
costs’ per ounce decreased by 2%, indicating strong
ongoing cost control performance. Simberi costs are
denominated approximately in US Dollars (40%), Papua
New Guinea Kina (40%) and Australian Dollars (20%).
˃ The All-In Sustaining Cost increase is primarily due to
higher capital expenditure during the quarter, relating to
the investment of US$2 million in two low hour
excavators. These excavators match two existing
excavators and will allow older and smaller equipment to
be stood down which will create a more productive, lower
cost loading fleet. The excavators are due to arrive in
February along with four low hour mining trucks
(purchased in the March quarter).
˃ There is confidence that Simberi can improve further as a
result of:
˃ a number of operational enhancements planned for
implementation in the March Quarter 2016 for the
ore delivery system (incorporating the aerial rope
conveyor), including installation of redesigned
chutes and air-blades
˃ mining performance should improve with the
expected arrival of new fleet (mentioned above) in
February 2016.
Production Summary
Simberi
Q4 Jun
FY15
Q1 Sep
FY16
Q2 Dec
FY16
Total ore & waste
mined
kt 1,882 2,606 2,417
Ore mined kt 725 896 876
Grade g/t 1.28 1.22 1.22
Ore milled kt 768 859 832
Grade g/t 1.3 1.3 1.3
Recovery % 86 84 84
Gold production oz 27,137 29,539 28,379
All-In Sustaining Cost [1]
$ per ounce
Mining 345 351 352
Processing 394 448 480
Site services 245 273 224
Stripping and ore inventory
adjustments
- - -
984 1,072 1,056
By-product credits - - -
Third party refining &
transport
14 10 10
Royalties 37 37 32
Total cash operating costs 1,035 1,119 1,098
Corporate and administration 36 40 48
Corporate royalty - - -
Rehabilitation 17 14 15
On-site exploration - - -
Capitalised mine & op development - - -
Sustaining capital expenditure 61 79 158
All-In Sustaining Cost (AISC) 1,149 1,252 1,319
17.3
22.5
27.1 29.5 28.4
FY 15Q2 Dec
FY 15Q3 Mar
FY 15Q4 Jun
FY 16Q1 Sep
FY 16Q2 Dec
koz
1,619
1,310
1,149 1,252
1,319
Production [koz]
AISC [A$/oz]
For
per
sona
l use
onl
y
St Barbara Limited Quarterly Report / Q2 December 2015 Page 8 of 14
Outlook
˃ FY16 has been revised due to above-target production in
the first half as follows:
˃ production of between 100,000 and 110,000 ounces
(previously between 90,000 and 110,000 ounces)
˃ AISC of between A$1,350 and A$1,430 per ounce
(previously A$1,275 to A$1,400 per ounce), the
increase in AISC guidance for Simberi is impacted by
a weaker AUD/USD exchange rate assumption for
the remainder of FY16.
˃ Capex of between A$10 and A$12 million
(previously between A$8 and A$12 million).
Simberi oxide life of mine / sulphide project
˃ Stated oxide and sulphide reserves indicate a potential
long life operation in excess of 15 years.
˃ The value optimised oxide mine plan has approximately
3.5 years remaining.
˃ Oxide reserves are within the pit wall pushbacks of the
deeper sulphide pits, meaning that a value optimised mine
plan needs to include a phased cut-over period between
oxide and sulphide mining when both can be processed.
˃ The Simberi Sulphide prefeasibility study (PFS) of the,
which will also inform oxide options, was further
progressed during the quarter. Ongoing work includes
developing the optimised mine and processing plans, with
subsequent evaluation of project economics. The PFS is
due to be completed in the March 2016 quarter.
620 750 768
859 832
FY15Q2 Dec
FY15Q3 Mar
FY15Q4 Jun
FY16Q1 Sep
FY16Q2 Dec
Simberi Ore Milled
kt
484 460 725 896 876
905 1,158
1,157
1,710 1,541 = 1,389
= 1,618
= 1,882
= 2,606 = 2,417
FY15Q2 Dec
FY15Q3 Mar
FY15Q4 Jun
FY16Q1 Sep
FY16Q2 Dec
Simberi Ore & Waste Mined
Ore Mined Waste Mined = Total
kt
For
per
sona
l use
onl
y
St Barbara Limited Quarterly Report / Q2 December 2015 Page 9 of 14
Exploration
Gwalia Deep Drilling Program, Leonora WA
˃ Resource extension drilling at Gwalia has continued with
the objective of providing the required certainty to extend
the Gwalia resource and to develop the case for mining
below the current base of reserves at of 1,800 metres
below surface (mbs).
˃ Parent hole GWDD17 was completed at a downhole depth
of 2,155m and a first daughter hole GWDD17A at a
downhole depth of 2,140m. Parent hole GWDD13 was re-
opened and utilised for four further daughter holes, I, J, K
& L, that were completed to downhole depths of 2,272m,
2,257m, 2,262m and 2,293m respectively.
˃ All six drill holes have successfully intersected the mining
sequence for widths of between 50 and 100m, intersecting
variously either all or some of the mineralised veining
interpreted to be extensions of Main Lode South West
Branch, South Gwalia Series and West Lode. Results are
set out in Figures 1.0, 1.1 and Table 1.
˃ Daughter hole GWDD17B had obtained a downhole depth
of 2,248m at the end of the quarter and is expected to be
completed in January.
˃ Recent intercepts of the extension to the current source of
high grade ore, ‘South West Branch’, are similar to those
encountered in shallower parts of the deposit (1,100 –
1,200 mbs) but significantly thinner than at the current
depths being mined, and in the existing reserve.
˃ Drilling results thus far are still limited in coverage and not
capable of supporting a generalised conclusion. This
phase of the drilling program is expected to extend into
the September quarter of 2016, to properly delineate an
Indicated Resource, and a program to test the extensions
down to 2,200 mbs is being developed.
˃ It is also expected that the drilling program will create new
reserves, immediately below the base of existing reserves,
based on existing trucking methods. Studies will continue
to investigate alternative materials handling or ventilation
solutions to continue deeper.
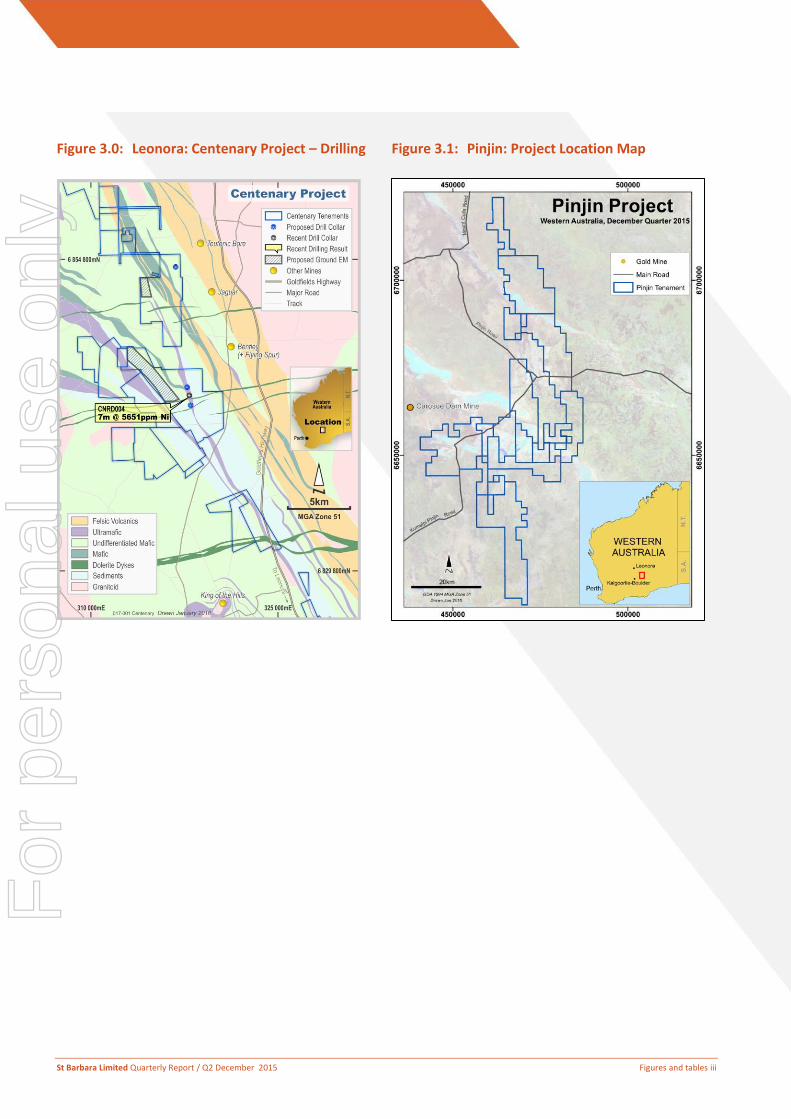
Centenary Project, Leonora WA
˃ The Centenary project is located approximately 60 km
north of Leonora, near the Jaguar and Bentley operations
of Independence Group.
˃ As previously announced St Barbara has completed a
drilling program and downhole electromagnetic (EM)
survey work on four target areas, three of which target
copper-zinc-silver volcanogenic massive sulphide systems
within E37-916 while a fourth focussed on a highly
conductive anomaly within E37-917, coincident with nickel
geochemistry.
˃ Previously unreported results from the drilling of a rotary
mud/ diamond hole (CNRD004) directed at the EM
anomaly in E37-917 returned elevated nickel geochemistry
within a shallow interval of weathered ultramafics. The
source of the EM anomaly is yet to be explained. The
following intercept was recorded (refer Table 2):
CNRD004: 7m @ 5,651ppm Ni from 58 m
˃ A second phase of work is expected to commence during
the March quarter of 2016.
Pinjin Project, Yilgarn WA
˃ Exploration continued on the Pinjin project within the
Yilgarn Province, WA. The Pinjin Project is located 150km
northeast of Kalgoorlie, comprising a large tenement
package of 20 exploration licences (1,358 km2)(Figure 3.1).
˃ Two reconnaissance field visits were conducted during the
quarter and necessary approvals obtained. A significant
aircore drilling program (of up to 25,000 metres) targeting
bedrock geochemical and geophysical targets is expected
to commence late in the March 2016 quarter and continue
through much of the June 2016 quarter.
Simberi, Tatau & Tabar Islands, Papua New Guinea
(ML 136 and EL 609)
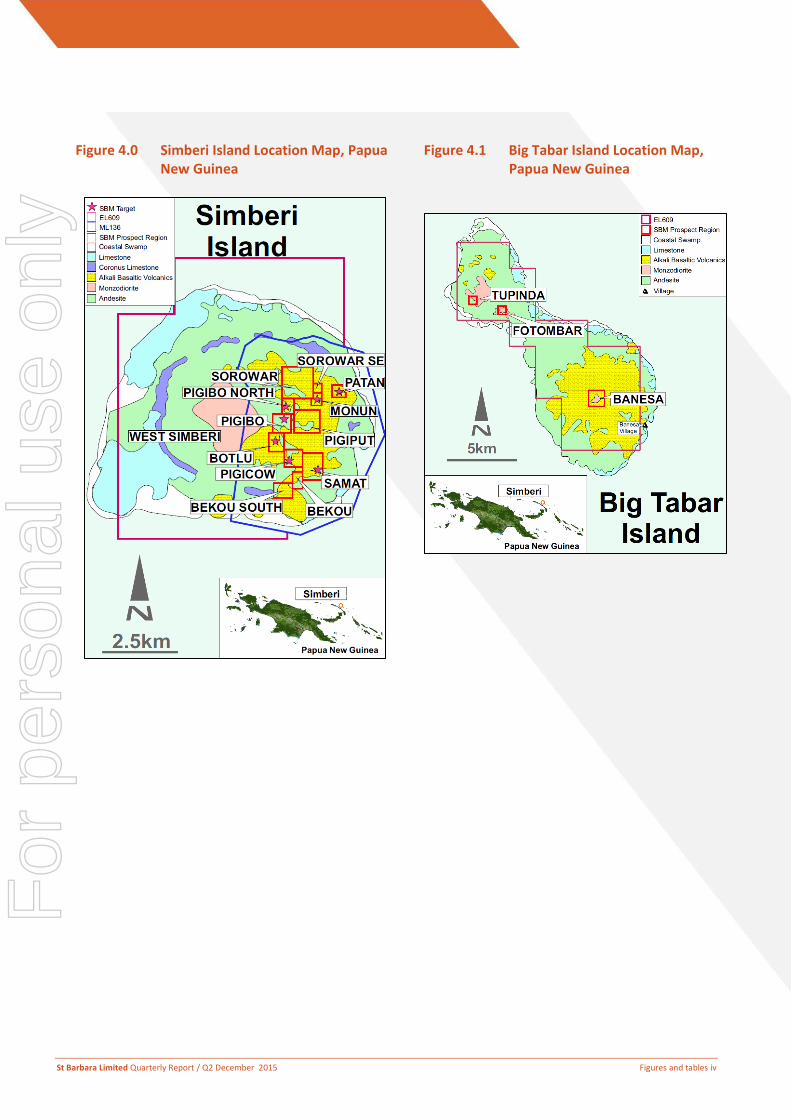
˃ Exploration continued on Simberi ML136 and EL609 at
Western Simberi Island and Big Tabar Island (Figures 4.0
and 4.1).
˃ On Simberi Island (Figure 4.0), the exploration program
continued to focus on identifying additional near-mine
higher grade oxide resources as potential ore feed sources
to extend oxide mine life.
˃ 59 bedrock jackhammer samples were collected from
Bekou South following up on an historical gold-in-soil
anomaly (Figure 4.0). Results are pending. A single trench
(SIMTR953) was completed for 35 metres and 7 samples
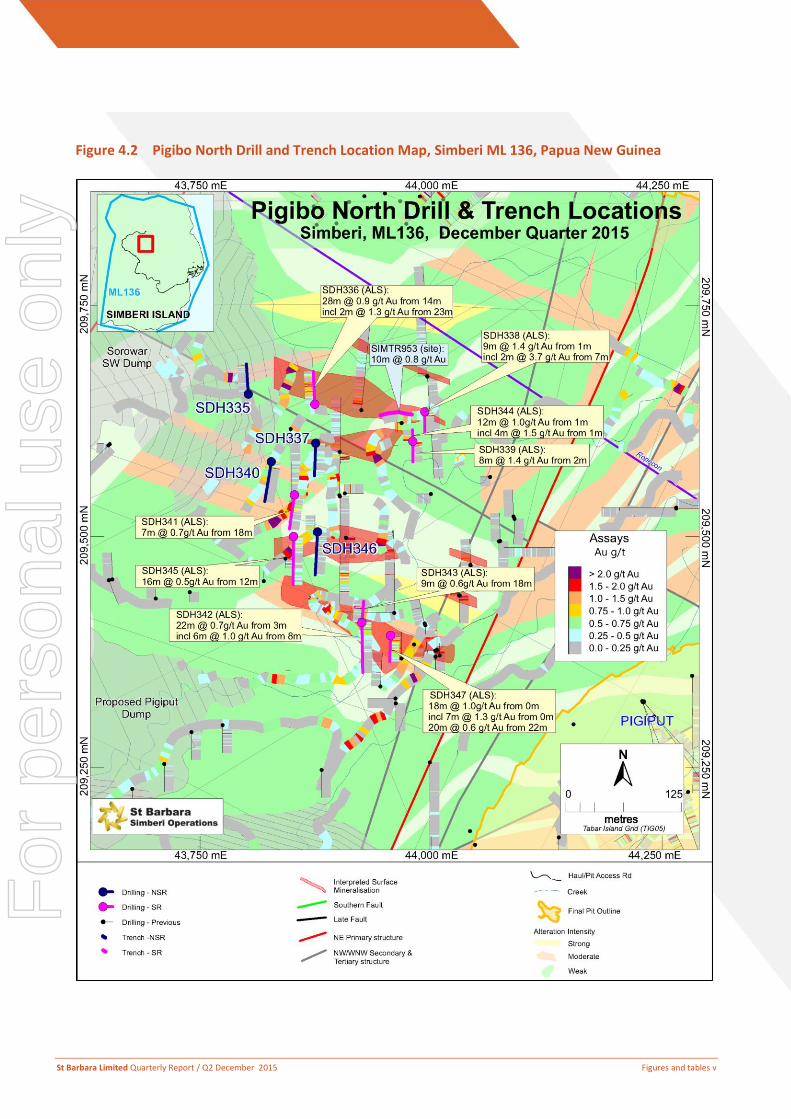
within ML136 at Pigibo North. Results are highlighted in
Figure 4.2.
Pigibo North:
˃ Seven diamond drill holes (SDH341 to SDH347) were
completed at Pigibo North in October 2015 for a total of
445.4m (Figure 4.2 and Table 3). The overall diamond drill
program comprised 13 holes (SDH335 to SDH347) for
779.3 metres. Encouraging results were returned including
(all intercepts down-hole, details in Table 3):
˃ SDH336: 28m @ 0.9 g/t Au from 14m
˃ SDH338: 9m @ 1.4 g/t Au from 1m
˃ SDH342: 22m @ 0.7 g/t Au from 3m
˃ SDH347: 18m @ 1.0 g/t Au from 0m
For
per
sona
l use
onl
y
St Barbara Limited Quarterly Report / Q2 December 2015 Page 10 of 14
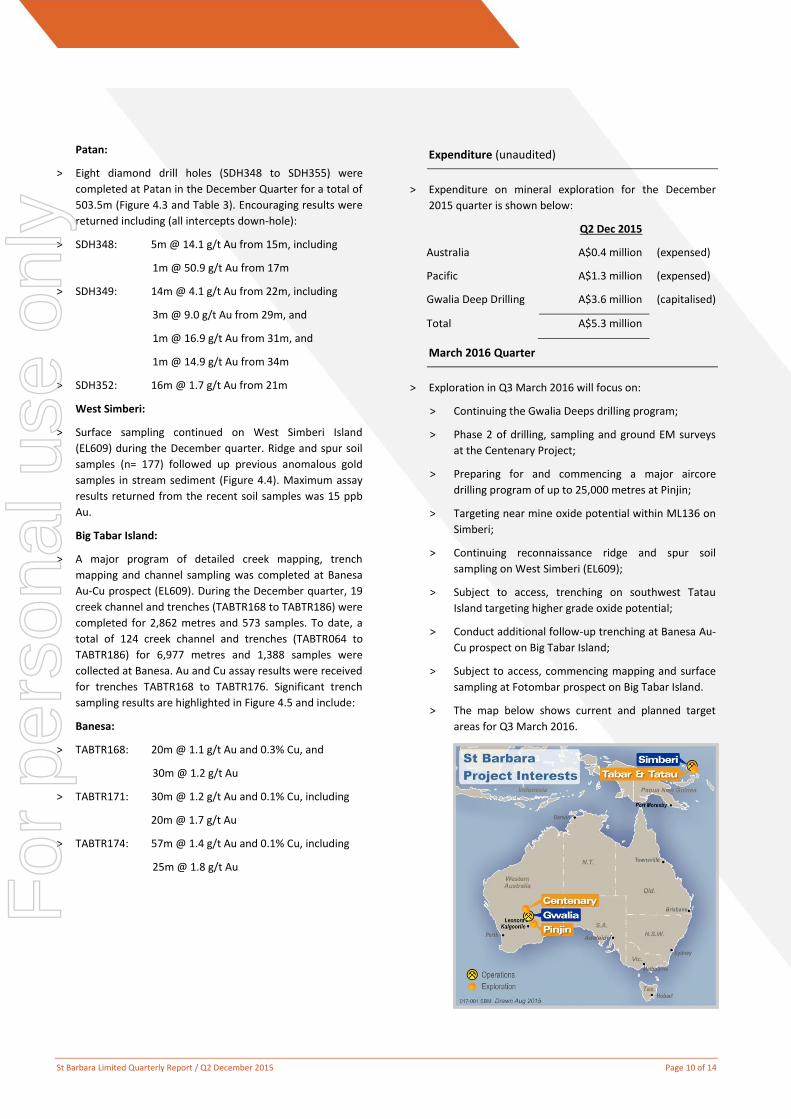
Patan:
˃ Eight diamond drill holes (SDH348 to SDH355) were
completed at Patan in the December Quarter for a total of
503.5m (Figure 4.3 and Table 3). Encouraging results were
returned including (all intercepts down-hole):
˃ SDH348: 5m @ 14.1 g/t Au from 15m, including
1m @ 50.9 g/t Au from 17m
˃ SDH349: 14m @ 4.1 g/t Au from 22m, including
3m @ 9.0 g/t Au from 29m, and
1m @ 16.9 g/t Au from 31m, and
1m @ 14.9 g/t Au from 34m
˃ SDH352: 16m @ 1.7 g/t Au from 21m
West Simberi:
˃ Surface sampling continued on West Simberi Island
(EL609) during the December quarter. Ridge and spur soil
samples (n= 177) followed up previous anomalous gold
samples in stream sediment (Figure 4.4). Maximum assay
results returned from the recent soil samples was 15 ppb
Au.
Big Tabar Island:
˃ A major program of detailed creek mapping, trench
mapping and channel sampling was completed at Banesa
Au-Cu prospect (EL609). During the December quarter, 19
creek channel and trenches (TABTR168 to TABTR186) were
completed for 2,862 metres and 573 samples. To date, a
total of 124 creek channel and trenches (TABTR064 to
TABTR186) for 6,977 metres and 1,388 samples were
collected at Banesa. Au and Cu assay results were received
for trenches TABTR168 to TABTR176. Significant trench
sampling results are highlighted in Figure 4.5 and include:
Banesa:
˃ TABTR168: 20m @ 1.1 g/t Au and 0.3% Cu, and
30m @ 1.2 g/t Au
˃ TABTR171: 30m @ 1.2 g/t Au and 0.1% Cu, including
20m @ 1.7 g/t Au
˃ TABTR174: 57m @ 1.4 g/t Au and 0.1% Cu, including
25m @ 1.8 g/t Au
Expenditure (unaudited)
˃ Expenditure on mineral exploration for the December
2015 quarter is shown below:
Q2 Dec 2015
Australia A$0.4 million (expensed)
Pacific A$1.3 million (expensed)
Gwalia Deep Drilling A$3.6 million (capitalised)
Total A$5.3 million
March 2016 Quarter
˃ Exploration in Q3 March 2016 will focus on:
˃ Continuing the Gwalia Deeps drilling program;
˃ Phase 2 of drilling, sampling and ground EM surveys
at the Centenary Project;
˃ Preparing for and commencing a major aircore
drilling program of up to 25,000 metres at Pinjin;
˃ Targeting near mine oxide potential within ML136 on
Simberi;
˃ Continuing reconnaissance ridge and spur soil
sampling on West Simberi (EL609);
˃ Subject to access, trenching on southwest Tatau
Island targeting higher grade oxide potential;
˃ Conduct additional follow-up trenching at Banesa Au-
Cu prospect on Big Tabar Island;
˃ Subject to access, commencing mapping and surface
sampling at Fotombar prospect on Big Tabar Island.
˃ The map below shows current and planned target
areas for Q3 March 2016.
For
per
sona
l use
onl
y
St Barbara Limited Quarterly Report / Q2 December 2015 Page 11 of 14
Revised exploration expenditure guidance for FY16
˃ Guidance on Exploration expenditure for FY16, is revised
as follows:
˃ A$15 million, approximately 70% Australia and 30%
Pacific (previously A$10 million, approximately 55% in
Australia and 45% in the Pacific).
˃ The increase is primarily due to accelerating the
Gwalia deep drilling program to support the materials
handling study and allow an investment decision on a
timely basis.
Health & Safety
˃ The Company-wide Total Recordable Injury Frequency
Rate (TRIFR), calculated as a rolling 12 month average,
decreased from 4.1 at 30 September 2015 to a record low
3.4 for the twelve months ended 31 December 2015.
˃ St Barbara was the overall winner, as well as winner in
three categories, in the CME (WA) Eastern Regional
Council 2015 Underground Mine Emergency Response
Competition, held at Kanowna Belle WA, in November
2015.
˃ In the previous quarter St Barbara were winners in four
categories, including Most Improved and Multi-Casualty,
at the PNG National Mines Rescue Challenge held over
four days in Madang, Papua New Guinea, in August 2015.
Financials (unaudited)
˃ 89,050 ounces of gold were sold in the December quarter,
at an average realised gold price of A$1,560 per ounce (Q1
Sep: 109,776 ounces at A$1,565 per ounce).
˃ Cash at bank at 31 December 2015 was $100 million1 after
total payments during the quarter of A$58 million for the
repurchase of US Notes and payment of bi-annual interest
and Red Kite interest and principal repayments noted
below:
˃ During the December quarter, the Company
repurchased US$3 million in aggregate principal of its
US Senior Secured Notes at a 4% discount to par
value. St Barbara has now repurchased a cumulative
US$70 million (28%) in aggregate principal of the
original US$250 million of Notes issued by St Barbara
in March 2013 at discounts of between 4% and 7%.
US$180 million of the Notes were on issue at the end
of the December quarter.
˃ Following the first US$9 million quarterly
amortisation repayment against the Red Kite debt
facility during the September 2015 quarter, a further
US$30 million principal was repaid during the
1. Excluding A$1 million restricted cash
December quarter. The balance of the Red Kite
facility at 31 December 2015 was US$36 million.
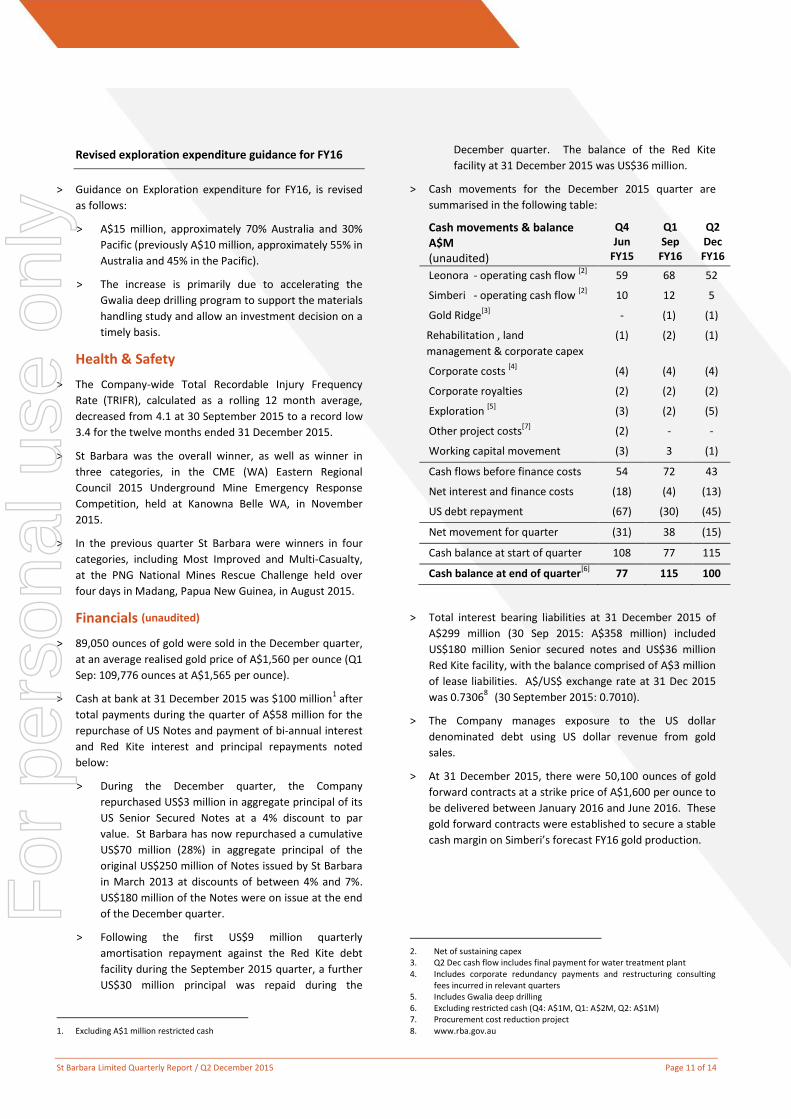
˃ Cash movements for the December 2015 quarter are
summarised in the following table:
Cash movements & balance A$M (unaudited)
Q4 Jun
FY15
Q1 Sep
FY16
Q2 Dec FY16
Leonora - operating cash flow [2]
59 68 52
Simberi - operating cash flow [2]
10 12 5
Gold Ridge[3]
- (1) (1)
Rehabilitation , land
management & corporate capex
(1) (2) (1)
Corporate costs [4]
(4) (4) (4)
Corporate royalties (2) (2) (2)
Exploration [5]
(3) (2) (5)
Other project costs[7]3
(2) - -
Working capital movement (3) 3 (1)
Cash flows before finance costs 54 72 43
Net interest and finance costs (18) (4) (13)
US debt repayment (67) (30) (45)
Net movement for quarter (31) 38 (15)
Cash balance at start of quarter 108 77 115
Cash balance at end of quarter[6]
77 115 100
˃ Total interest bearing liabilities at 31 December 2015 of
A$299 million (30 Sep 2015: A$358 million) included
US$180 million Senior secured notes and US$36 million
Red Kite facility, with the balance comprised of A$3 million
of lease liabilities. A$/US$ exchange rate at 31 Dec 2015
was 0.730684
(30 September 2015: 0.7010).
˃ The Company manages exposure to the US dollar
denominated debt using US dollar revenue from gold
sales.
˃ At 31 December 2015, there were 50,100 ounces of gold
forward contracts at a strike price of A$1,600 per ounce to
be delivered between January 2016 and June 2016. These
gold forward contracts were established to secure a stable
cash margin on Simberi’s forecast FY16 gold production.
2. Net of sustaining capex 3. Q2 Dec cash flow includes final payment for water treatment plant 4. Includes corporate redundancy payments and restructuring consulting
fees incurred in relevant quarters 5. Includes Gwalia deep drilling 6. Excluding restricted cash (Q4: A$1M, Q1: A$2M, Q2: A$1M) 7. Procurement cost reduction project 8. www.rba.gov.au
For
per
sona
l use
onl
y
St Barbara Limited Quarterly Report / Q2 December 2015 Page 12 of 14
Senior Secured Notes US$M
˃ Issued March 2013 250
˃ Repurchased Q4 Jun 2015 (54)
˃ Repurchased Q1 Sep 2015 (13)
˃ Repurchased Q2 Dec 2015 (3)
˃ Balance remaining at 31 Dec 2015 180
˃ Coupon 8.875% p.a.
˃ Redemption date 15 April 2018
˃ S&P rating B-
˃ Moody’s rating Caa1
Corporate
Share Capital
Issued shares
Opening balance 30 September 2015 495,102,525
Issued Nil
Closing balance 31 December 2015 495,102,525
Unlisted employee rights
Opening balance 30 September 2015 20,059,671
Issued 10 December 2015 (FY16 LTI) 3,974,617
Lapsed Nil
Closing balance 31 December 2015 24,034,288
ASX & ADR
The Company’s shares are listed on ASX (ASX:SBM) and
through American Depositary Receipts (ADR OTC: STBMY)
traded in the USA.
Scheduled Future Reporting
Date Report
23 February Half Year Financial Report
Late April March 2016 Quarterly Report
[Dates are tentative and subject to change]
Non-IFRS Measures
˃ The Company supplements its financial information reporting
determined under International Financial Reporting Standards
(IFRS) with certain non-IFRS financial measures, including cash
operating costs and All-In Sustaining Cost. We believe that these
measures provide additional meaningful information to assist
management, investors and analysts in understanding the
financial results and assessing our prospects for future
performance.
˃ Cash Operating Costs are calculated according to common mining
industry practice using The Gold Institute (USA) Production Cost
Standard (1999 revision).
˃ All-In Sustaining Cost (AISC) is based on Cash Operating Costs, and
adds items relevant to sustaining production. It includes some,
but not all, of the components identified in World Gold Council’s
Guidance Note on Non-GAAP Metrics - All-In Sustaining Costs and
All-In Costs (June 2013).
˃ AISC is calculated on gold production in the quarter.
˃ For underground mines, amortisation of operating
development is adjusted from “Total Cash Operating Costs” in
order to avoid duplication with cash expended on operating
development in the period contained within the “Mine &
Operating Development” line item.
˃ Rehabilitation is calculated as the amortisation of the
rehabilitation provision on a straight-line basis over the
estimated life of mine.
Competent Persons Statement
Exploration Results
˃ The information in this report that relates to Exploration Results
for Simberi and Pinjin is based on information compiled by Dr
Roger Mustard, who is a Member of The Australasian Institute of
Mining and Metallurgy. Dr Mustard is a full-time employee of
St Barbara and has sufficient experience relevant to the style of
mineralisation and type of deposit under consideration and to the
activity which he is undertaking to qualify as a Competent Person
as defined in the 2012 Edition of the ‘Australasian Code for
Reporting of Exploration Results, Mineral Resources and Ore
Reserves’. Dr Mustard consents to the inclusion in the report of
the matters based on his information in the form and context in
which it appears.
˃ The information in this report that relates to Exploration Results
for Gwalia and the Leonora region is based on information
compiled by Mr Robert Love, who is a Fellow of The Australasian
Institute of Mining and Metallurgy. Mr Love is a full-time
employee of St Barbara and has sufficient experience relevant to
the style of mineralisation and type of deposit under
consideration and to the activity which he is undertaking to
qualify as a Competent Person as defined in the 2012 Edition of
the ‘Australasian Code for Reporting of Exploration Results,
Mineral Resources and Ore Reserves’. Mr Love consents to the
For
per
sona
l use
onl
y
St Barbara Limited Quarterly Report / Q2 December 2015 Page 13 of 14
inclusion in the report of the matters based on his information in
the form and context in which it appears.
Mineral Resource and Ore Reserve Estimates
˃ The information in this report that relates to Mineral Resources or
Ore Reserves is extracted from the report titled ‘Ore Reserves and
Mineral Resources Statements 30 June 2015’ released to the
Australian Securities Exchange (ASX) on 25 August 2015 and
available to view at www.stbarbara.com.au and for which
Competent Persons’ consents were obtained. Each Competent
Person’s consent remain in place for subsequent releases by the
Company of the same information in the same form and context,
until the consent is withdrawn or replaced by a subsequent report
and accompanying consent.
˃ The Company confirms that it is not aware of any new
information or data that materially affects the information
included in the original ASX announcement released on 25 August
2015 and, in the case of estimates of Mineral Resources or Ore
Reserves, that all material assumptions and technical parameters
underpinning the estimates in the original ASX announcement
continue to apply and have not materially changed. The
Company confirms that the form and context in which the
Competent Person's findings are presented have not been
materially modified from the original ASX announcement.
˃ Competent Persons Dr Mustard and Mr John de Vries (prior to his
resignation from St Barbara in July 2015) are entitled to
participate in St Barbara’s long term incentive plan, details of
which are most recently included in the 2015 Annual Report and
Notice of 2015 Annual General Meeting released to the ASX on 20
October 2015. In 2012 and 2013 increase in Ore Reserves was
one of the performance measures under that plan.
˃ Full details are contained in the ASX release dated 25 August 2015
‘Ore Reserves and Mineral Resources Statements 30 June 2015’
available at www.stbarbara.com.au.
For
per
sona
l use
onl
y
St Barbara Limited Quarterly Report / Q2 December 2015 Page 14 of 14
Corporate Directory
St Barbara Limited ABN 36 009 165 066
Board of Directors
Tim Netscher ..................................... Non-Executive Chairman
Bob Vassie ........................................ Managing Director & CEO
Kerry Gleeson ....................................... Non-Executive Director
David Moroney ..................................... Non-Executive Director
Executives
Bob Vassie ........................................ Managing Director & CEO
Garth Campbell-Cowan .......................... Chief Financial Officer
Registered Office
Level 10, 432 St Kilda Road
Melbourne Victoria 3004 Australia
Telephone +61 3 8660 1900
Facsimile +61 3 8660 1999
Email [email protected]
Website www.stbarbara.com.au
Australian Securities Exchange (ASX) Listing code “SBM”
American Depositary Receipts (ADR OTC code “STBMY”)
through BNY Mellon,
www.adrbnymellon.com/dr_profile.jsp?cusip=852278100
Financial figures are in Australian dollars (unless otherwise
noted).
Shareholder Enquiries
Computershare Investor Services Pty Ltd
GPO Box 2975
Melbourne Victoria 3001 Australia
Telephone (within Australia) 1300 653 935
Telephone (international) +61 3 9415 4356
Facsimile +61 3 9473 2500
www-au.computershare.com/investor
American Depositary Receipt enquires:
BNY Mellon Depositary Receipts
www.bnymellon.com/shareowner
Investor Relations Contact
Rowan Cole, Company Secretary + 61 3 8660 1900
Substantial Shareholders % of Holdings1
Hunter Hall Investment Management Ltd 15.0%
M&G Investment Management Ltd
11.5%
Franklin Resources Inc 5.6%
1. As notified by the substantial shareholders to 18 January 2016
For
per
sona
l use
onl
y
Quarterly Report / Q2 December 2015
Exploration Figures and Tables
St Barbara Limited Quarterly Report / Q2 December 2015 Figures and tables i
Figure 1.0: Leonora: Gwalia Long Section (looking west)
Figure 1.1: Leonora: Gwalia Cross Section (looking north)
For
per
sona
l use
onl
y
St Barbara Limited Quarterly Report / Q2 December 2015 Figures and tables ii
Figure 2.0: West Lode Long Section (looking west)
For
per
sona
l use
onl
y
St Barbara Limited Quarterly Report / Q2 December 2015 Figures and tables iii
Figure 3.0: Leonora: Centenary Project – Drilling Figure 3.1: Pinjin: Project Location Map
For
per
sona
l use
onl
y
St Barbara Limited Quarterly Report / Q2 December 2015 Figures and tables iv
Figure 4.0 Simberi Island Location Map, Papua New Guinea
Figure 4.1 Big Tabar Island Location Map, Papua New Guinea
For
per
sona
l use
onl
y
St Barbara Limited Quarterly Report / Q2 December 2015 Figures and tables v
Figure 4.2 Pigibo North Drill and Trench Location Map, Simberi ML 136, Papua New Guinea
For
per
sona
l use
onl
y
St Barbara Limited Quarterly Report / Q2 December 2015 Figures and tables vi
Figure 4.3 Patan Drill Location Map, Simberi ML 136, Papua New Guinea
For
per
sona
l use
onl
y
St Barbara Limited Quarterly Report / Q2 December 2015 Figures and tables vii
Figure 4.4 West Simberi Surface Sample Location Map, Papua New Guinea
Figure 4.5 Banesa Trench Location Map, Big Tabar Island, Papua New Guinea
For
per
sona
l use
onl
y

St Barbara Limited Quarterly Report / Q2 December 2015 Figures and tables viii
Table 1: Gwalia Deeps Significant Intercepts– Leonora Operations, Gwalia Mine
Hole Id
Down-hole Mineralised Intersection
North
East
RL
Metres Below
Surface Lode
Dip/ Azimuth
From To Interval Gold grade
m m m degrees m m m g/t Au
GWDD13I 5520.0 9760.3 3533.4 1842 Main Lode -28/238 2151.6 2151.9 0.3 6.9
GWDD13I 5510.8 9744.7 3523.80 1851 South West Branch -28/241 2170.1 2174.3 4.2 3.0
GWDD13I 5495.7 9715.1 3506.7 1868 South Gwalia Series -27/243 2208.3 2211.0 2.7 4.3
GWDD13I 5493.8 9711.1 3504.5 1871 West Lode -27/243 2214.0 2215.2 1.2 15.8
GWDD13J 5581.5 9738.9 3546.0 1829 Main Lode -20/256 2135.4 2137.2 1.8 5.9
GWDD13J 5578.1 9725.6 3540.7 1834 South West Branch -21/256 2149.7 2152.3 2.6 67.2
GWDD13J 5568.1 9682.0 3523.9 1851 South Gwalia Series -20/260 2196.7 2200.8 4.1 5.7
GWDD13J 5564.7 9662.9 3516.8 1858 West Lode -20/260 2218.9 2220.0 1.1 3.1
GWDD13K 5529.7 9819.2 3479.4 1896 Main Lode -40/236 2139.7 2141.1 1.4 1.4
GWDD13K 5520.9 9805.9 3465.9 1909 South West Branch -40/237 2159.6 2163.1 3.5 25.3
GWDD13K 5502.5 9775.1 3436.1 1939 South Gwalia Series -39/240 2202.0 2214.0 12.00 3.0
GWDD13L 5507.5 9884.3 3414.8 1960 Main Lode -50/221 2166.0 2166.6 0.6 2.7
GWDD13L 5498.4 9876.7 3400.8 1974 South West Branch -50/220 2182.7 2186.6 3.9 0.9
GWDD13L 5469.2 9851.4 3355.2 2020 South Gwalia Series -50/222 2238.8 2250.0 11.2 5.6
GWDD17 5424.8 9824.0 3478.9 1896 Main Lode -57/295 2025.9 2027.5 1.6 6.2
GWDD17 5428.8 9815.6 3465.0 1910 South West Branch -56/295 2042.9 2044.0 1.1 1.6
GWDD17 5438.4 9795.4 3432.0 1943 South Gwalia Series -56/296 2080.1 2086.6 6.5 5.5
GWDD17A 5386.5 9818.4 3485.6 1889 Main Lode -56/282 2016.8 2018.6 1.8 2.2
GWDD17A 5387.7 9813.1 3477.7 1897 South West Branch -56/282 2025.3 2029.3 4.0 2.7
GWDD17A 5392.4 9792.0 3446.1 1929 South Gwalia Series -56/282 2064.5 2066.7 2.2 2.0
NOTES:
No high grade cut is applied. Dip and Azimuth angles estimated at intercept depth. Azimuth referenced to Mine Grid Reported intercepts are all down hole lengths.
Table 2: Centenary Significant Intercepts
Hole Id
North
East
RL
Metres Below
Surface
Down-hole Mineralised Intersection
Element Dip/
Azimuth From To Interval Grade
degrees m m m ppm
CNRD004 6,843,900 317,894 383 53 Ni -60/273 58 65 7.0 5651
NOTES:
No high grade cut is applied. Dip and Azimuth angles estimated at intercept depth. Azimuth referenced to MGA94_51 Grid Reported intercepts are all down hole lengths.
For
per
sona
l use
onl
y
St Barbara Limited Quarterly Report / Q2 December 2015 Figures and tables ix
Table 3: Pigibo North and Patan Significant Intercepts–Simberi Island, Papua New Guinea
Hole Id North East RL Dip/
Azimuth degrees
Total Depth
Vertical Depth mbs
Lode Down-hole
Mineralised Intersection
From
m Interval
m Gold grade
g/t Au
Pigibo North, Simberi Island, Papua New Guinea ML 136
SDH335 209653 43806 162.5 -57 / 357 59.3 no significant results
SDH336 209643 43876 163.4 -54 / 358 60.0 19.9 OX,TR,SU 14 28 0.9
including 18.1 TR 23 2 1.3
SDH337 209601 43874 174.0 -54 / 182 60.8 no significant results
SDH338 209630 43998 159.6 -56 / 180 40.0 4.0 OX 1 9 1.4
including 5.6 OX 7 2 3.7
SDH339 209605 43951 152.8 -56 / 180 39.7 5.2 OX,TR 2 8 1.4
SDH340 209577 43828 164.4 -54 / 189 74.1 no significant results
SDH341 209539 43856 183.0 -55 / 188 64.8 24.3 OX 18 7 0.7
SDH342 209405 43924 165.2 -55 / 179 94.8 15.2 OX,TR,SU 3 22 0.7
including 13.6 TR,SU 8 6 1.0
SDH343 209404 43924 165.3 55 / 005 40.9 16.3 TR,SU 18 9 0.6
SDH344 209608 43950 152.8 -55 / 359 21.8 7.2 OX,SU 1 12 1.0
including 4.7 OX 1 4 1.5
SDH345 209498 43853 201.5 -55 / 181 91.5 21.9 OX,TR 12 16 0.5
SDH346 209504 43880 210.3 -55 / 183 81.3 no significant results
SDH347 209390 43959 178.1 -56 / 182 50.3 9.4 OX 0 18 1.0
including 4.8 OX 0 7 1.3
23.8 OX,TR,SU 22 20 0.6
Patan, Simberi Island, Papua New Guinea ML 136
SDH348 209988 45487 77.5 -56 / 083 92.7 5.0 OX 0 12 0.7
11.1 OX 15 5 14.1
including 11.1 OX 17 1 50.9
46.6 TR 68 13 0.7
SDH349 210023 45471 84.4 -55 / 086 59.7 20.9 OX,TR 22 14 4.1
including 21.8 OX 29 3 9.0
including 22.5 OX 31 1 16.9
and 24.0 TR,SU 34 1 14.9
SDH350 209969 45457 63.3 -56 / 086 46.0 19.3 SU 19 3 1.8
SDH351 210031 45425 57.9 -55 / 092 68.5 24.0 TR,SU 18 3 3.0
including 22.7 TR 18 1 5.7
SDH352 209951 45513 53.1 -56 / 086 66.6 12.1 OX 7 4 2.8
including 11.7 OX 8 1 5.4
26.3 OX 21 16 1.7
including 25.2 OX 27 1 6.5
SDH353 209909 45526 34.3 -56 / 084 40.0 no significant results
SDH354 209937 45461 37.4 -55 / 093 58.5 44.3 SU 51 3 2.1
SDH355 210053 45394 50.2 -56 / 087 71.5 13.6 OX,TR,SU 10 5 2.2
For
per
sona
l use
onl
y
St Barbara Limited Quarterly Report / Q2 December 2015 Figures and tables x
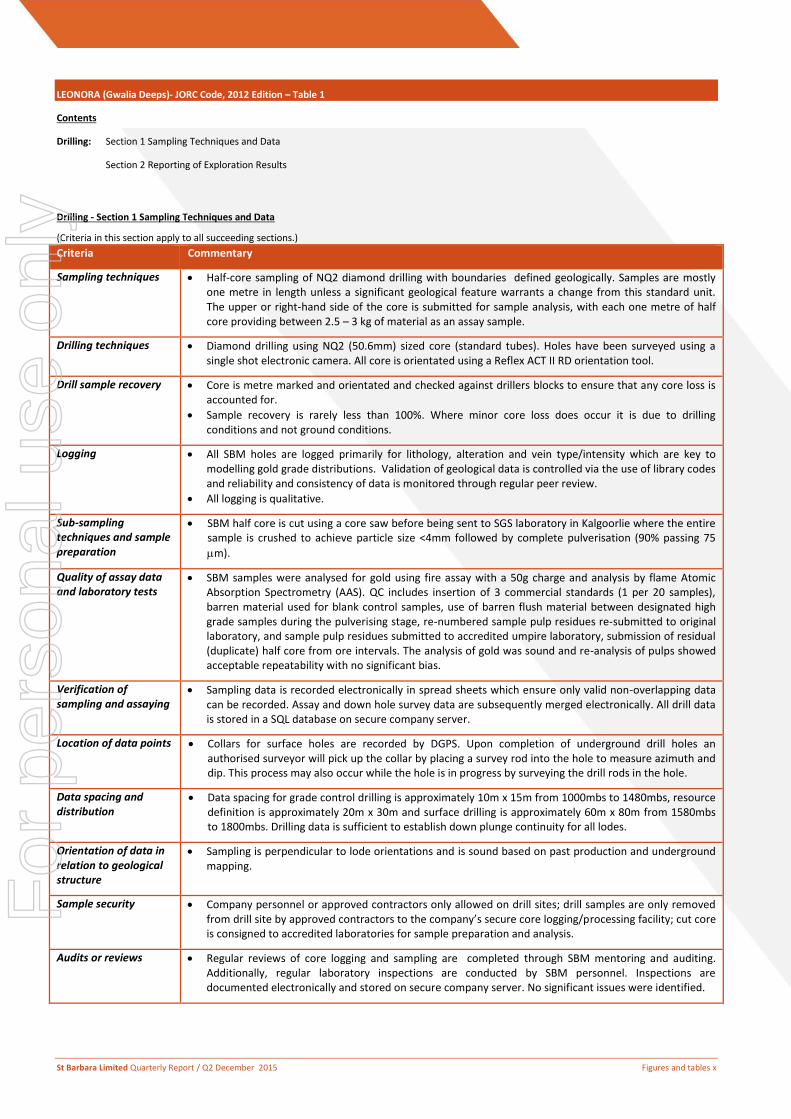
LEONORA (Gwalia Deeps)- JORC Code, 2012 Edition – Table 1
Contents
Drilling: Section 1 Sampling Techniques and Data
Section 2 Reporting of Exploration Results
Drilling - Section 1 Sampling Techniques and Data
(Criteria in this section apply to all succeeding sections.)
Criteria Commentary
Sampling techniques Half-core sampling of NQ2 diamond drilling with boundaries defined geologically. Samples are mostly one metre in length unless a significant geological feature warrants a change from this standard unit. The upper or right-hand side of the core is submitted for sample analysis, with each one metre of half core providing between 2.5 – 3 kg of material as an assay sample.
Drilling techniques Diamond drilling using NQ2 (50.6mm) sized core (standard tubes). Holes have been surveyed using a single shot electronic camera. All core is orientated using a Reflex ACT II RD orientation tool.
Drill sample recovery Core is metre marked and orientated and checked against drillers blocks to ensure that any core loss is accounted for.
Sample recovery is rarely less than 100%. Where minor core loss does occur it is due to drilling conditions and not ground conditions.
Logging All SBM holes are logged primarily for lithology, alteration and vein type/intensity which are key to modelling gold grade distributions. Validation of geological data is controlled via the use of library codes and reliability and consistency of data is monitored through regular peer review.
All logging is qualitative.
Sub-sampling techniques and sample preparation
SBM half core is cut using a core saw before being sent to SGS laboratory in Kalgoorlie where the entire sample is crushed to achieve particle size <4mm followed by complete pulverisation (90% passing 75
m).
Quality of assay data and laboratory tests
SBM samples were analysed for gold using fire assay with a 50g charge and analysis by flame Atomic Absorption Spectrometry (AAS). QC includes insertion of 3 commercial standards (1 per 20 samples), barren material used for blank control samples, use of barren flush material between designated high grade samples during the pulverising stage, re-numbered sample pulp residues re-submitted to original laboratory, and sample pulp residues submitted to accredited umpire laboratory, submission of residual (duplicate) half core from ore intervals. The analysis of gold was sound and re-analysis of pulps showed acceptable repeatability with no significant bias.
Verification of sampling and assaying
Sampling data is recorded electronically in spread sheets which ensure only valid non-overlapping data can be recorded. Assay and down hole survey data are subsequently merged electronically. All drill data is stored in a SQL database on secure company server.
Location of data points Collars for surface holes are recorded by DGPS. Upon completion of underground drill holes an authorised surveyor will pick up the collar by placing a survey rod into the hole to measure azimuth and dip. This process may also occur while the hole is in progress by surveying the drill rods in the hole.
Data spacing and distribution
Data spacing for grade control drilling is approximately 10m x 15m from 1000mbs to 1480mbs, resource definition is approximately 20m x 30m and surface drilling is approximately 60m x 80m from 1580mbs to 1800mbs. Drilling data is sufficient to establish down plunge continuity for all lodes.
Orientation of data in relation to geological structure
Sampling is perpendicular to lode orientations and is sound based on past production and underground mapping.
Sample security Company personnel or approved contractors only allowed on drill sites; drill samples are only removed from drill site by approved contractors to the company’s secure core logging/processing facility; cut core is consigned to accredited laboratories for sample preparation and analysis.
Audits or reviews Regular reviews of core logging and sampling are completed through SBM mentoring and auditing. Additionally, regular laboratory inspections are conducted by SBM personnel. Inspections are documented electronically and stored on secure company server. No significant issues were identified.
For
per
sona
l use
onl
y
St Barbara Limited Quarterly Report / Q2 December 2015 Figures and tables xi
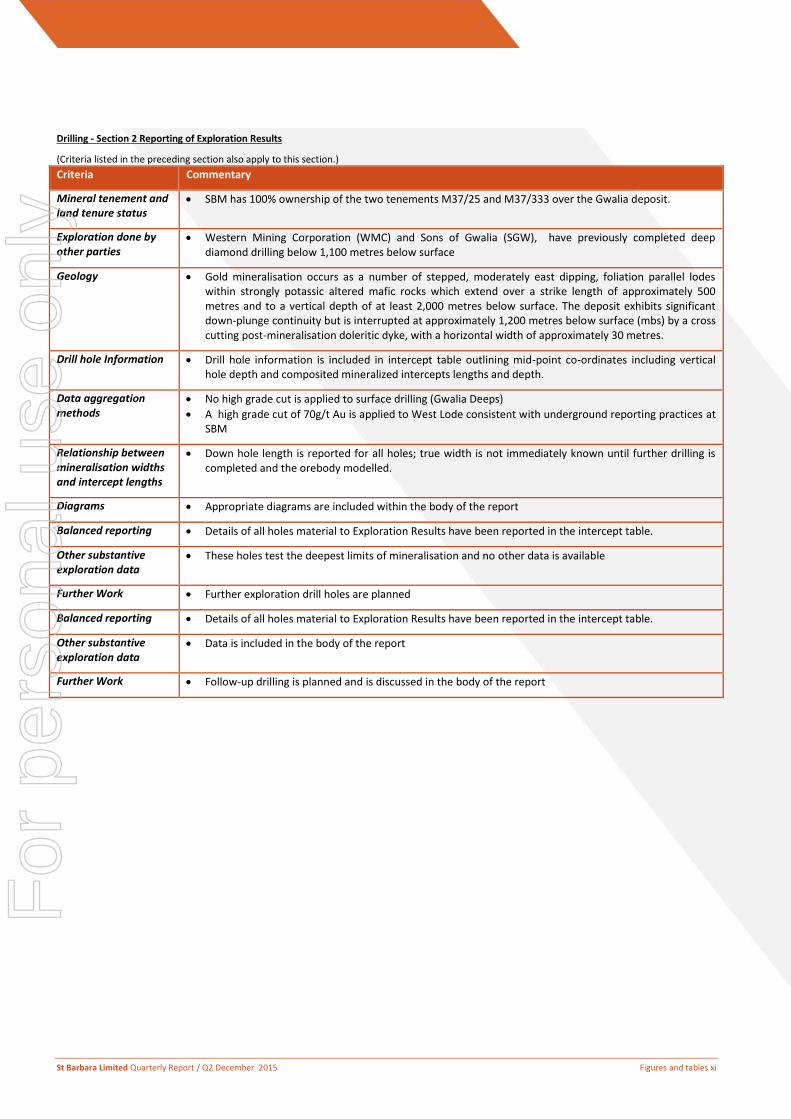
Drilling - Section 2 Reporting of Exploration Results
(Criteria listed in the preceding section also apply to this section.)
Criteria Commentary
Mineral tenement and land tenure status
SBM has 100% ownership of the two tenements M37/25 and M37/333 over the Gwalia deposit.
Exploration done by other parties
Western Mining Corporation (WMC) and Sons of Gwalia (SGW), have previously completed deep diamond drilling below 1,100 metres below surface
Geology Gold mineralisation occurs as a number of stepped, moderately east dipping, foliation parallel lodes within strongly potassic altered mafic rocks which extend over a strike length of approximately 500 metres and to a vertical depth of at least 2,000 metres below surface. The deposit exhibits significant down-plunge continuity but is interrupted at approximately 1,200 metres below surface (mbs) by a cross cutting post-mineralisation doleritic dyke, with a horizontal width of approximately 30 metres.
Drill hole Information Drill hole information is included in intercept table outlining mid-point co-ordinates including vertical hole depth and composited mineralized intercepts lengths and depth.
Data aggregation methods
No high grade cut is applied to surface drilling (Gwalia Deeps)
A high grade cut of 70g/t Au is applied to West Lode consistent with underground reporting practices at SBM
Relationship between mineralisation widths and intercept lengths
Down hole length is reported for all holes; true width is not immediately known until further drilling is completed and the orebody modelled.
Diagrams Appropriate diagrams are included within the body of the report
Balanced reporting Details of all holes material to Exploration Results have been reported in the intercept table.
Other substantive exploration data
These holes test the deepest limits of mineralisation and no other data is available
Further Work Further exploration drill holes are planned
Balanced reporting Details of all holes material to Exploration Results have been reported in the intercept table.
Other substantive exploration data
Data is included in the body of the report
Further Work Follow-up drilling is planned and is discussed in the body of the report
For
per
sona
l use
onl
y
St Barbara Limited Quarterly Report / Q2 December 2015 Figures and tables xii
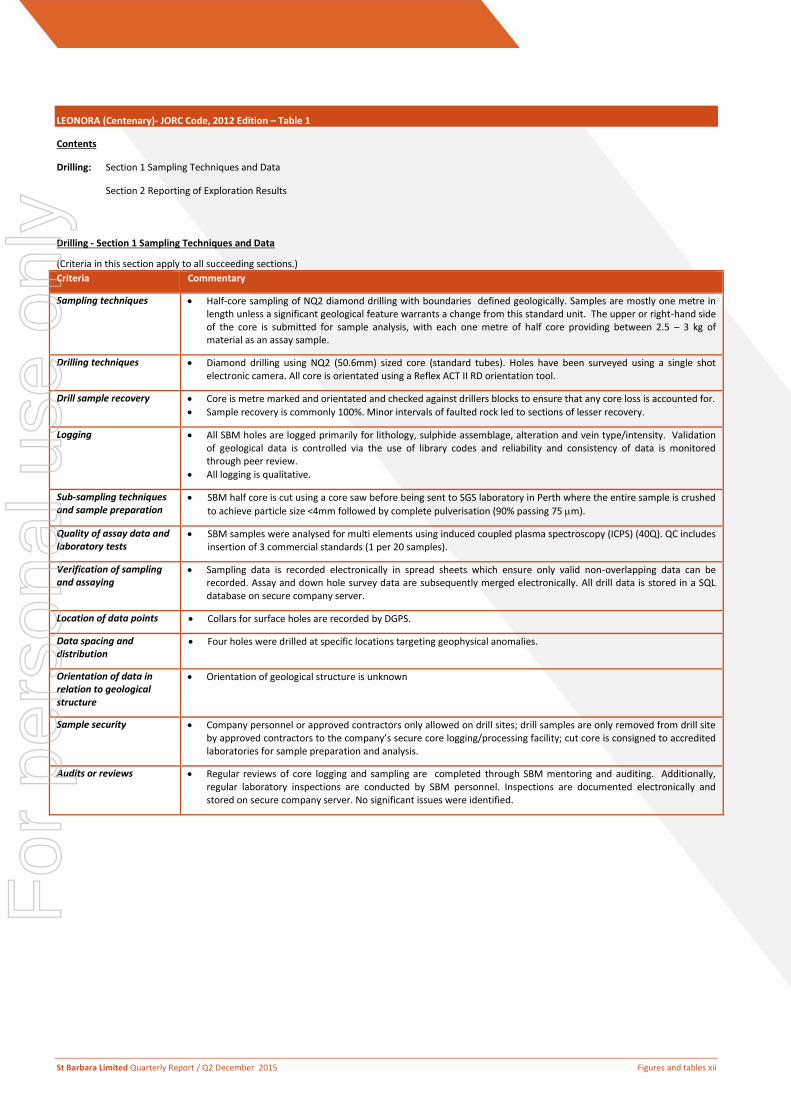
LEONORA (Centenary)- JORC Code, 2012 Edition – Table 1
Contents
Drilling: Section 1 Sampling Techniques and Data
Section 2 Reporting of Exploration Results
Drilling - Section 1 Sampling Techniques and Data
(Criteria in this section apply to all succeeding sections.)
Criteria Commentary
Sampling techniques Half-core sampling of NQ2 diamond drilling with boundaries defined geologically. Samples are mostly one metre in length unless a significant geological feature warrants a change from this standard unit. The upper or right-hand side of the core is submitted for sample analysis, with each one metre of half core providing between 2.5 – 3 kg of material as an assay sample.
Drilling techniques Diamond drilling using NQ2 (50.6mm) sized core (standard tubes). Holes have been surveyed using a single shot electronic camera. All core is orientated using a Reflex ACT II RD orientation tool.
Drill sample recovery Core is metre marked and orientated and checked against drillers blocks to ensure that any core loss is accounted for.
Sample recovery is commonly 100%. Minor intervals of faulted rock led to sections of lesser recovery.
Logging All SBM holes are logged primarily for lithology, sulphide assemblage, alteration and vein type/intensity. Validation of geological data is controlled via the use of library codes and reliability and consistency of data is monitored through peer review.
All logging is qualitative.
Sub-sampling techniques and sample preparation
SBM half core is cut using a core saw before being sent to SGS laboratory in Perth where the entire sample is crushed
to achieve particle size <4mm followed by complete pulverisation (90% passing 75 m).
Quality of assay data and laboratory tests
SBM samples were analysed for multi elements using induced coupled plasma spectroscopy (ICPS) (40Q). QC includes insertion of 3 commercial standards (1 per 20 samples).
Verification of sampling and assaying
Sampling data is recorded electronically in spread sheets which ensure only valid non-overlapping data can be recorded. Assay and down hole survey data are subsequently merged electronically. All drill data is stored in a SQL database on secure company server.
Location of data points Collars for surface holes are recorded by DGPS.
Data spacing and distribution
Four holes were drilled at specific locations targeting geophysical anomalies.
Orientation of data in relation to geological structure
Orientation of geological structure is unknown
Sample security Company personnel or approved contractors only allowed on drill sites; drill samples are only removed from drill site by approved contractors to the company’s secure core logging/processing facility; cut core is consigned to accredited laboratories for sample preparation and analysis.
Audits or reviews Regular reviews of core logging and sampling are completed through SBM mentoring and auditing. Additionally, regular laboratory inspections are conducted by SBM personnel. Inspections are documented electronically and stored on secure company server. No significant issues were identified.
For
per
sona
l use
onl
y
St Barbara Limited Quarterly Report / Q2 December 2015 Figures and tables xiii
Drilling - Section 2 Reporting of Exploration Results
(Criteria listed in the preceding section also apply to this section.)
Criteria Commentary
Mineral tenement and land tenure status
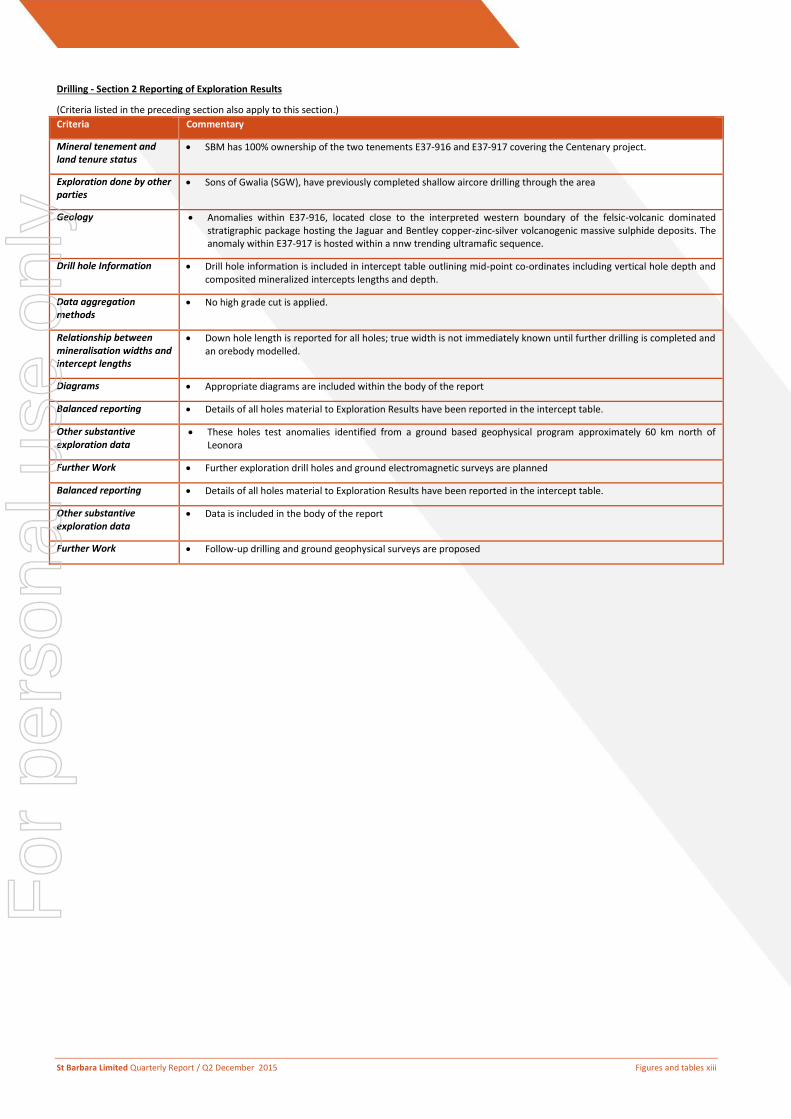
SBM has 100% ownership of the two tenements E37-916 and E37-917 covering the Centenary project.
Exploration done by other parties
Sons of Gwalia (SGW), have previously completed shallow aircore drilling through the area
Geology Anomalies within E37-916, located close to the interpreted western boundary of the felsic-volcanic dominated stratigraphic package hosting the Jaguar and Bentley copper-zinc-silver volcanogenic massive sulphide deposits. The anomaly within E37-917 is hosted within a nnw trending ultramafic sequence.
Drill hole Information Drill hole information is included in intercept table outlining mid-point co-ordinates including vertical hole depth and composited mineralized intercepts lengths and depth.
Data aggregation methods
No high grade cut is applied.
Relationship between mineralisation widths and intercept lengths
Down hole length is reported for all holes; true width is not immediately known until further drilling is completed and an orebody modelled.
Diagrams Appropriate diagrams are included within the body of the report
Balanced reporting Details of all holes material to Exploration Results have been reported in the intercept table.
Other substantive exploration data
These holes test anomalies identified from a ground based geophysical program approximately 60 km north of Leonora
Further Work Further exploration drill holes and ground electromagnetic surveys are planned
Balanced reporting Details of all holes material to Exploration Results have been reported in the intercept table.
Other substantive exploration data
Data is included in the body of the report
Further Work Follow-up drilling and ground geophysical surveys are proposed
For
per
sona
l use
onl
y
St Barbara Limited Quarterly Report / Q2 December 2015 Figures and tables xiv
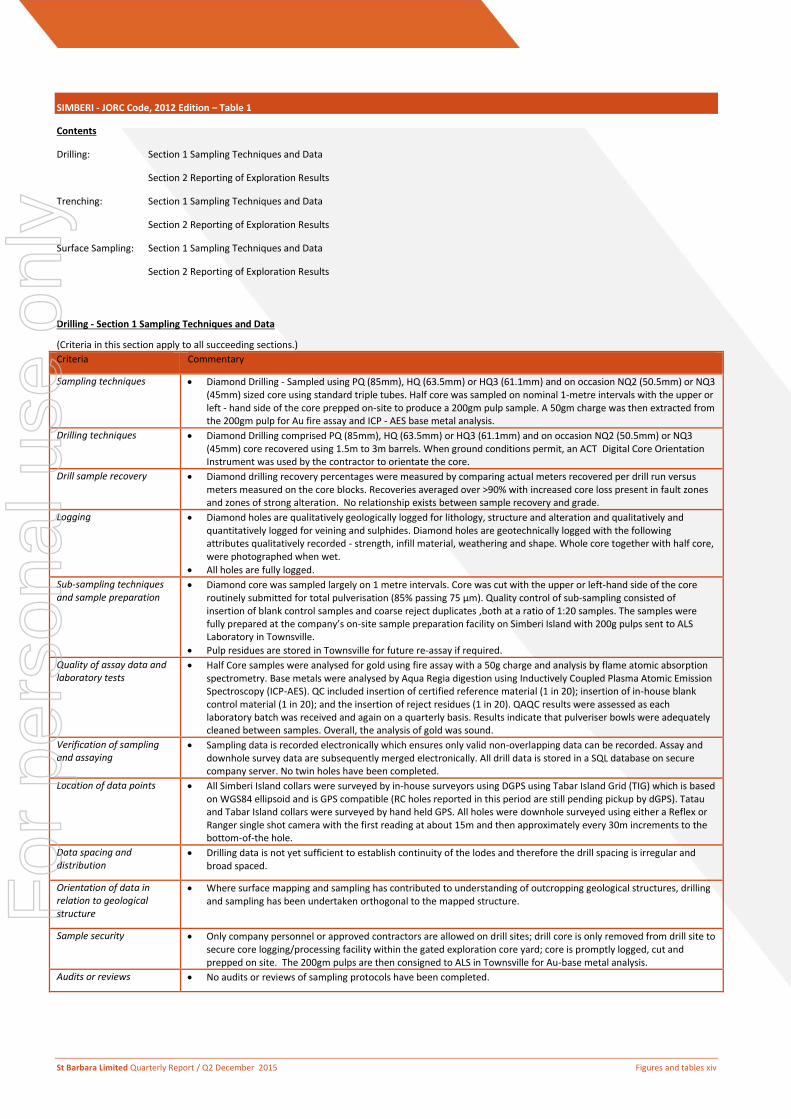
SIMBERI - JORC Code, 2012 Edition – Table 1
Contents
Drilling:
Trenching:
Section 1 Sampling Techniques and Data
Section 2 Reporting of Exploration Results
Section 1 Sampling Techniques and Data
Section 2 Reporting of Exploration Results
Surface Sampling: Section 1 Sampling Techniques and Data
Section 2 Reporting of Exploration Results
Drilling - Section 1 Sampling Techniques and Data
(Criteria in this section apply to all succeeding sections.)
Criteria Commentary
Sampling techniques Diamond Drilling - Sampled using PQ (85mm), HQ (63.5mm) or HQ3 (61.1mm) and on occasion NQ2 (50.5mm) or NQ3 (45mm) sized core using standard triple tubes. Half core was sampled on nominal 1-metre intervals with the upper or left - hand side of the core prepped on-site to produce a 200gm pulp sample. A 50gm charge was then extracted from the 200gm pulp for Au fire assay and ICP - AES base metal analysis.
Drilling techniques Diamond Drilling comprised PQ (85mm), HQ (63.5mm) or HQ3 (61.1mm) and on occasion NQ2 (50.5mm) or NQ3 (45mm) core recovered using 1.5m to 3m barrels. When ground conditions permit, an ACT Digital Core Orientation Instrument was used by the contractor to orientate the core.
Drill sample recovery Diamond drilling recovery percentages were measured by comparing actual meters recovered per drill run versus meters measured on the core blocks. Recoveries averaged over >90% with increased core loss present in fault zones and zones of strong alteration. No relationship exists between sample recovery and grade.
Logging Diamond holes are qualitatively geologically logged for lithology, structure and alteration and qualitatively and quantitatively logged for veining and sulphides. Diamond holes are geotechnically logged with the following attributes qualitatively recorded - strength, infill material, weathering and shape. Whole core together with half core, were photographed when wet.
All holes are fully logged.
Sub-sampling techniques and sample preparation
Diamond core was sampled largely on 1 metre intervals. Core was cut with the upper or left-hand side of the core routinely submitted for total pulverisation (85% passing 75 µm). Quality control of sub-sampling consisted of insertion of blank control samples and coarse reject duplicates ,both at a ratio of 1:20 samples. The samples were fully prepared at the company’s on-site sample preparation facility on Simberi Island with 200g pulps sent to ALS Laboratory in Townsville.
Pulp residues are stored in Townsville for future re-assay if required.
Quality of assay data and laboratory tests
Half Core samples were analysed for gold using fire assay with a 50g charge and analysis by flame atomic absorption spectrometry. Base metals were analysed by Aqua Regia digestion using Inductively Coupled Plasma Atomic Emission Spectroscopy (ICP-AES). QC included insertion of certified reference material (1 in 20); insertion of in-house blank control material (1 in 20); and the insertion of reject residues (1 in 20). QAQC results were assessed as each laboratory batch was received and again on a quarterly basis. Results indicate that pulveriser bowls were adequately cleaned between samples. Overall, the analysis of gold was sound.
Verification of sampling and assaying
Sampling data is recorded electronically which ensures only valid non-overlapping data can be recorded. Assay and downhole survey data are subsequently merged electronically. All drill data is stored in a SQL database on secure company server. No twin holes have been completed.
Location of data points All Simberi Island collars were surveyed by in-house surveyors using DGPS using Tabar Island Grid (TIG) which is based on WGS84 ellipsoid and is GPS compatible (RC holes reported in this period are still pending pickup by dGPS). Tatau and Tabar Island collars were surveyed by hand held GPS. All holes were downhole surveyed using either a Reflex or Ranger single shot camera with the first reading at about 15m and then approximately every 30m increments to the bottom-of-the hole.
Data spacing and distribution
Drilling data is not yet sufficient to establish continuity of the lodes and therefore the drill spacing is irregular and broad spaced.
Orientation of data in relation to geological structure
Where surface mapping and sampling has contributed to understanding of outcropping geological structures, drilling and sampling has been undertaken orthogonal to the mapped structure.
Sample security Only company personnel or approved contractors are allowed on drill sites; drill core is only removed from drill site to secure core logging/processing facility within the gated exploration core yard; core is promptly logged, cut and prepped on site. The 200gm pulps are then consigned to ALS in Townsville for Au-base metal analysis.
Audits or reviews No audits or reviews of sampling protocols have been completed.
For
per
sona
l use
onl
y
St Barbara Limited Quarterly Report / Q2 December 2015 Figures and tables xv
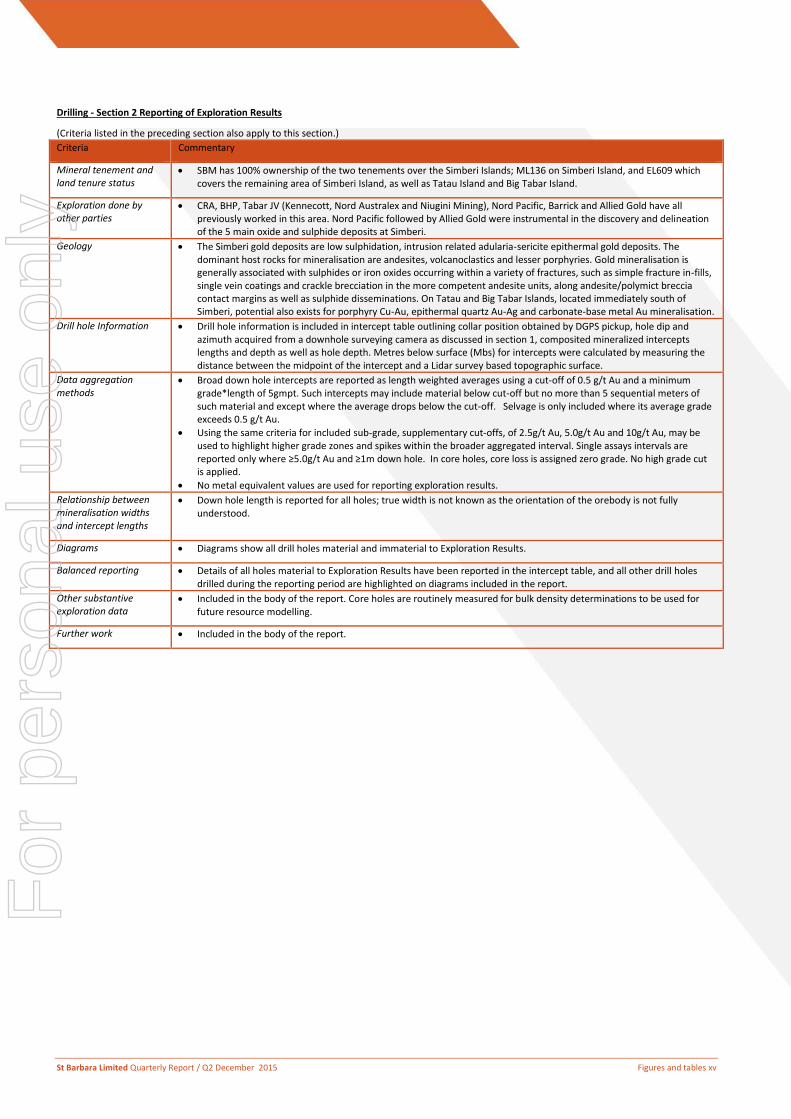
Drilling - Section 2 Reporting of Exploration Results
(Criteria listed in the preceding section also apply to this section.)
Criteria Commentary
Mineral tenement and land tenure status
SBM has 100% ownership of the two tenements over the Simberi Islands; ML136 on Simberi Island, and EL609 which covers the remaining area of Simberi Island, as well as Tatau Island and Big Tabar Island.
Exploration done by other parties
CRA, BHP, Tabar JV (Kennecott, Nord Australex and Niugini Mining), Nord Pacific, Barrick and Allied Gold have all previously worked in this area. Nord Pacific followed by Allied Gold were instrumental in the discovery and delineation of the 5 main oxide and sulphide deposits at Simberi.
Geology The Simberi gold deposits are low sulphidation, intrusion related adularia-sericite epithermal gold deposits. The dominant host rocks for mineralisation are andesites, volcanoclastics and lesser porphyries. Gold mineralisation is generally associated with sulphides or iron oxides occurring within a variety of fractures, such as simple fracture in-fills, single vein coatings and crackle brecciation in the more competent andesite units, along andesite/polymict breccia contact margins as well as sulphide disseminations. On Tatau and Big Tabar Islands, located immediately south of Simberi, potential also exists for porphyry Cu-Au, epithermal quartz Au-Ag and carbonate-base metal Au mineralisation.
Drill hole Information Drill hole information is included in intercept table outlining collar position obtained by DGPS pickup, hole dip and azimuth acquired from a downhole surveying camera as discussed in section 1, composited mineralized intercepts lengths and depth as well as hole depth. Metres below surface (Mbs) for intercepts were calculated by measuring the distance between the midpoint of the intercept and a Lidar survey based topographic surface.
Data aggregation methods
Broad down hole intercepts are reported as length weighted averages using a cut-off of 0.5 g/t Au and a minimum grade*length of 5gmpt. Such intercepts may include material below cut-off but no more than 5 sequential meters of such material and except where the average drops below the cut-off. Selvage is only included where its average grade exceeds 0.5 g/t Au.
Using the same criteria for included sub-grade, supplementary cut-offs, of 2.5g/t Au, 5.0g/t Au and 10g/t Au, may be used to highlight higher grade zones and spikes within the broader aggregated interval. Single assays intervals are reported only where ≥5.0g/t Au and ≥1m down hole. In core holes, core loss is assigned zero grade. No high grade cut is applied.
No metal equivalent values are used for reporting exploration results.
Relationship between mineralisation widths and intercept lengths
Down hole length is reported for all holes; true width is not known as the orientation of the orebody is not fully understood.
Diagrams Diagrams show all drill holes material and immaterial to Exploration Results.
Balanced reporting Details of all holes material to Exploration Results have been reported in the intercept table, and all other drill holes drilled during the reporting period are highlighted on diagrams included in the report.
Other substantive exploration data
Included in the body of the report. Core holes are routinely measured for bulk density determinations to be used for future resource modelling.
Further work Included in the body of the report.
For
per
sona
l use
onl
y
St Barbara Limited Quarterly Report / Q2 December 2015 Figures and tables xvi
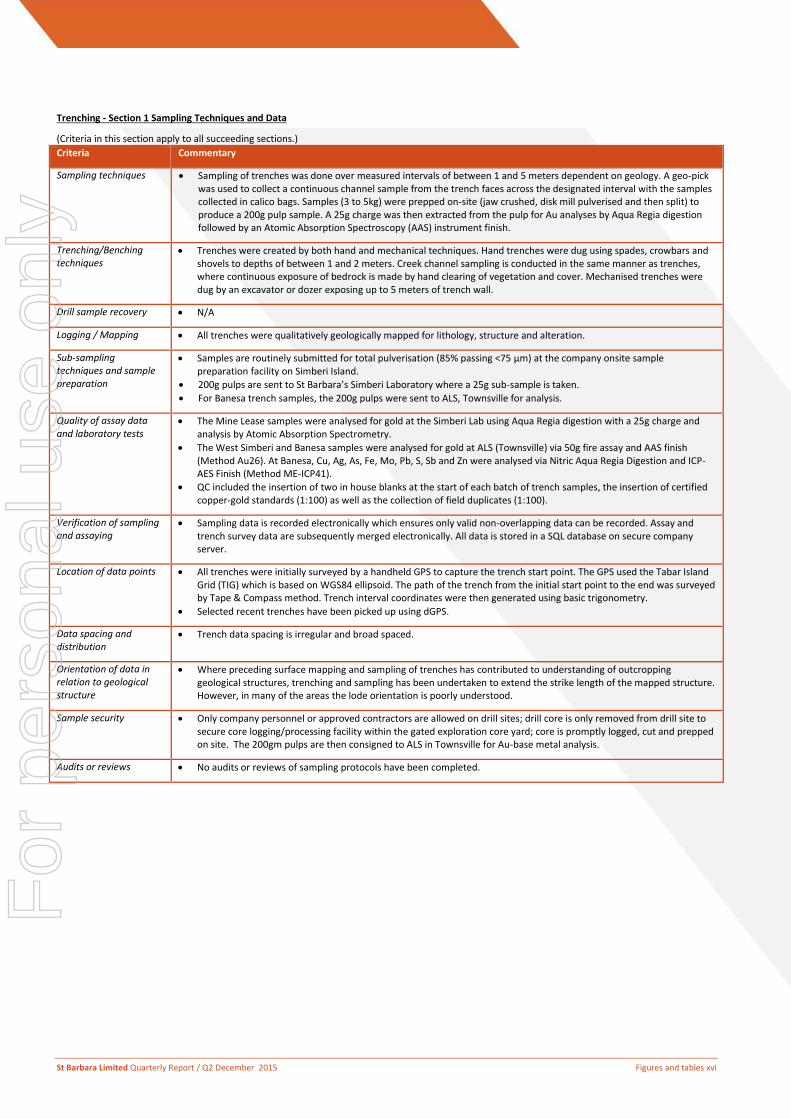
Trenching - Section 1 Sampling Techniques and Data
(Criteria in this section apply to all succeeding sections.)
Criteria Commentary
Sampling techniques Sampling of trenches was done over measured intervals of between 1 and 5 meters dependent on geology. A geo-pick was used to collect a continuous channel sample from the trench faces across the designated interval with the samples collected in calico bags. Samples (3 to 5kg) were prepped on-site (jaw crushed, disk mill pulverised and then split) to produce a 200g pulp sample. A 25g charge was then extracted from the pulp for Au analyses by Aqua Regia digestion followed by an Atomic Absorption Spectroscopy (AAS) instrument finish.
Trenching/Benching techniques
Trenches were created by both hand and mechanical techniques. Hand trenches were dug using spades, crowbars and shovels to depths of between 1 and 2 meters. Creek channel sampling is conducted in the same manner as trenches, where continuous exposure of bedrock is made by hand clearing of vegetation and cover. Mechanised trenches were dug by an excavator or dozer exposing up to 5 meters of trench wall.
Drill sample recovery N/A
Logging / Mapping All trenches were qualitatively geologically mapped for lithology, structure and alteration.
Sub-sampling techniques and sample preparation
Samples are routinely submitted for total pulverisation (85% passing <75 µm) at the company onsite sample preparation facility on Simberi Island.
200g pulps are sent to St Barbara’s Simberi Laboratory where a 25g sub-sample is taken.
For Banesa trench samples, the 200g pulps were sent to ALS, Townsville for analysis.
Quality of assay data and laboratory tests
The Mine Lease samples were analysed for gold at the Simberi Lab using Aqua Regia digestion with a 25g charge and analysis by Atomic Absorption Spectrometry.
The West Simberi and Banesa samples were analysed for gold at ALS (Townsville) via 50g fire assay and AAS finish (Method Au26). At Banesa, Cu, Ag, As, Fe, Mo, Pb, S, Sb and Zn were analysed via Nitric Aqua Regia Digestion and ICP-AES Finish (Method ME-ICP41).
QC included the insertion of two in house blanks at the start of each batch of trench samples, the insertion of certified copper-gold standards (1:100) as well as the collection of field duplicates (1:100).
Verification of sampling and assaying
Sampling data is recorded electronically which ensures only valid non-overlapping data can be recorded. Assay and trench survey data are subsequently merged electronically. All data is stored in a SQL database on secure company server.
Location of data points All trenches were initially surveyed by a handheld GPS to capture the trench start point. The GPS used the Tabar Island Grid (TIG) which is based on WGS84 ellipsoid. The path of the trench from the initial start point to the end was surveyed by Tape & Compass method. Trench interval coordinates were then generated using basic trigonometry.
Selected recent trenches have been picked up using dGPS.
Data spacing and distribution
Trench data spacing is irregular and broad spaced.
Orientation of data in relation to geological structure
Where preceding surface mapping and sampling of trenches has contributed to understanding of outcropping geological structures, trenching and sampling has been undertaken to extend the strike length of the mapped structure. However, in many of the areas the lode orientation is poorly understood.
Sample security Only company personnel or approved contractors are allowed on drill sites; drill core is only removed from drill site to secure core logging/processing facility within the gated exploration core yard; core is promptly logged, cut and prepped on site. The 200gm pulps are then consigned to ALS in Townsville for Au-base metal analysis.
Audits or reviews No audits or reviews of sampling protocols have been completed.
For
per
sona
l use
onl
y
St Barbara Limited Quarterly Report / Q2 December 2015 Figures and tables xvii
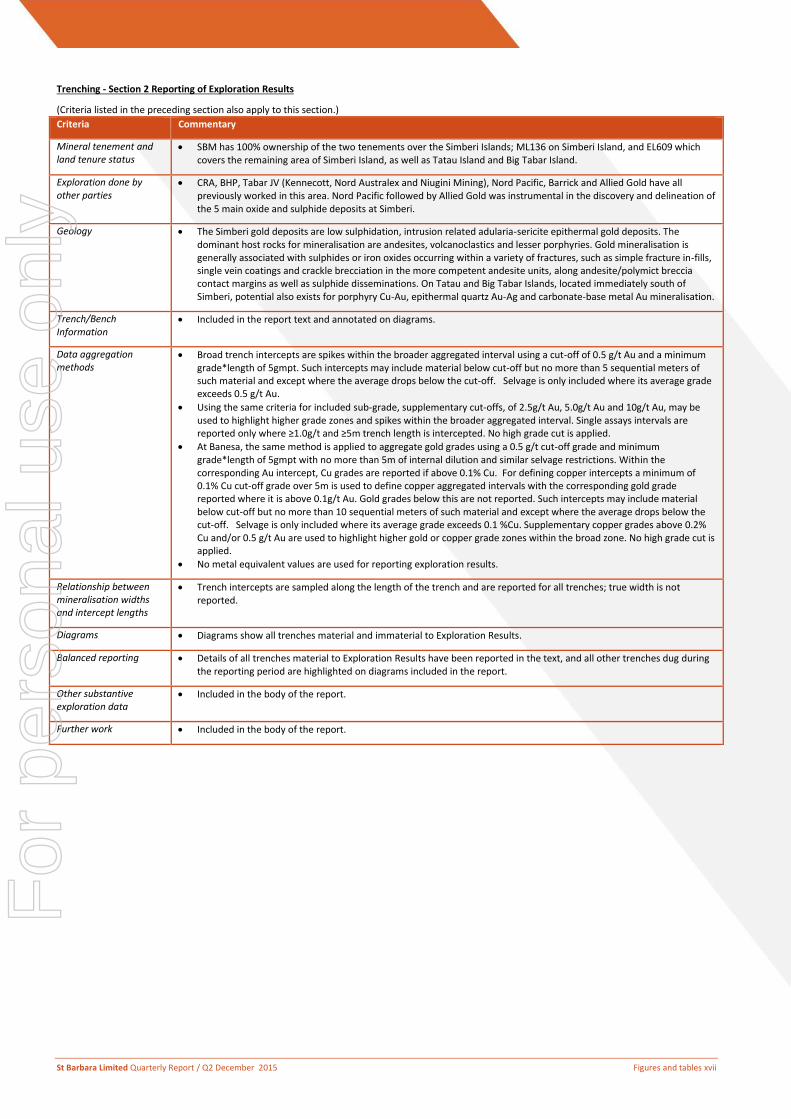
Trenching - Section 2 Reporting of Exploration Results
(Criteria listed in the preceding section also apply to this section.)
Criteria Commentary
Mineral tenement and land tenure status
SBM has 100% ownership of the two tenements over the Simberi Islands; ML136 on Simberi Island, and EL609 which covers the remaining area of Simberi Island, as well as Tatau Island and Big Tabar Island.
Exploration done by other parties
CRA, BHP, Tabar JV (Kennecott, Nord Australex and Niugini Mining), Nord Pacific, Barrick and Allied Gold have all previously worked in this area. Nord Pacific followed by Allied Gold was instrumental in the discovery and delineation of the 5 main oxide and sulphide deposits at Simberi.
Geology The Simberi gold deposits are low sulphidation, intrusion related adularia-sericite epithermal gold deposits. The dominant host rocks for mineralisation are andesites, volcanoclastics and lesser porphyries. Gold mineralisation is generally associated with sulphides or iron oxides occurring within a variety of fractures, such as simple fracture in-fills, single vein coatings and crackle brecciation in the more competent andesite units, along andesite/polymict breccia contact margins as well as sulphide disseminations. On Tatau and Big Tabar Islands, located immediately south of Simberi, potential also exists for porphyry Cu-Au, epithermal quartz Au-Ag and carbonate-base metal Au mineralisation.
Trench/Bench Information
Included in the report text and annotated on diagrams.
Data aggregation methods
Broad trench intercepts are spikes within the broader aggregated interval using a cut-off of 0.5 g/t Au and a minimum grade*length of 5gmpt. Such intercepts may include material below cut-off but no more than 5 sequential meters of such material and except where the average drops below the cut-off. Selvage is only included where its average grade exceeds 0.5 g/t Au.
Using the same criteria for included sub-grade, supplementary cut-offs, of 2.5g/t Au, 5.0g/t Au and 10g/t Au, may be used to highlight higher grade zones and spikes within the broader aggregated interval. Single assays intervals are reported only where ≥1.0g/t and ≥5m trench length is intercepted. No high grade cut is applied.
At Banesa, the same method is applied to aggregate gold grades using a 0.5 g/t cut-off grade and minimum grade*length of 5gmpt with no more than 5m of internal dilution and similar selvage restrictions. Within the corresponding Au intercept, Cu grades are reported if above 0.1% Cu. For defining copper intercepts a minimum of 0.1% Cu cut-off grade over 5m is used to define copper aggregated intervals with the corresponding gold grade reported where it is above 0.1g/t Au. Gold grades below this are not reported. Such intercepts may include material below cut-off but no more than 10 sequential meters of such material and except where the average drops below the cut-off. Selvage is only included where its average grade exceeds 0.1 %Cu. Supplementary copper grades above 0.2% Cu and/or 0.5 g/t Au are used to highlight higher gold or copper grade zones within the broad zone. No high grade cut is applied.
No metal equivalent values are used for reporting exploration results.
Relationship between mineralisation widths and intercept lengths
Trench intercepts are sampled along the length of the trench and are reported for all trenches; true width is not reported.
Diagrams Diagrams show all trenches material and immaterial to Exploration Results.
Balanced reporting Details of all trenches material to Exploration Results have been reported in the text, and all other trenches dug during the reporting period are highlighted on diagrams included in the report.
Other substantive exploration data
Included in the body of the report.
Further work Included in the body of the report.
For
per
sona
l use
onl
y
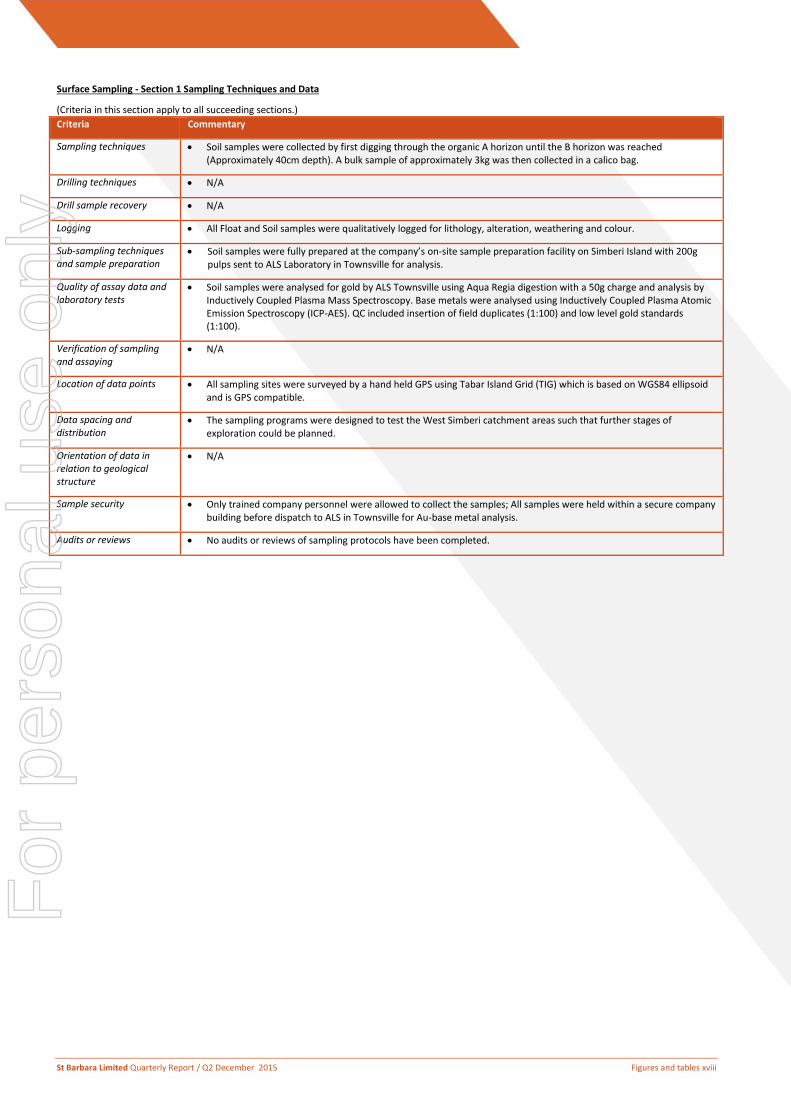
St Barbara Limited Quarterly Report / Q2 December 2015 Figures and tables xviii
Surface Sampling - Section 1 Sampling Techniques and Data
(Criteria in this section apply to all succeeding sections.)
Criteria Commentary
Sampling techniques Soil samples were collected by first digging through the organic A horizon until the B horizon was reached (Approximately 40cm depth). A bulk sample of approximately 3kg was then collected in a calico bag.
Drilling techniques N/A
Drill sample recovery N/A
Logging All Float and Soil samples were qualitatively logged for lithology, alteration, weathering and colour.
Sub-sampling techniques and sample preparation
Soil samples were fully prepared at the company’s on-site sample preparation facility on Simberi Island with 200g pulps sent to ALS Laboratory in Townsville for analysis.
Quality of assay data and laboratory tests
Soil samples were analysed for gold by ALS Townsville using Aqua Regia digestion with a 50g charge and analysis by Inductively Coupled Plasma Mass Spectroscopy. Base metals were analysed using Inductively Coupled Plasma Atomic Emission Spectroscopy (ICP-AES). QC included insertion of field duplicates (1:100) and low level gold standards (1:100).
Verification of sampling and assaying
N/A
Location of data points All sampling sites were surveyed by a hand held GPS using Tabar Island Grid (TIG) which is based on WGS84 ellipsoid and is GPS compatible.
Data spacing and distribution
The sampling programs were designed to test the West Simberi catchment areas such that further stages of exploration could be planned.
Orientation of data in relation to geological structure
N/A
Sample security Only trained company personnel were allowed to collect the samples; All samples were held within a secure company building before dispatch to ALS in Townsville for Au-base metal analysis.
Audits or reviews No audits or reviews of sampling protocols have been completed.
For
per
sona
l use
onl
y
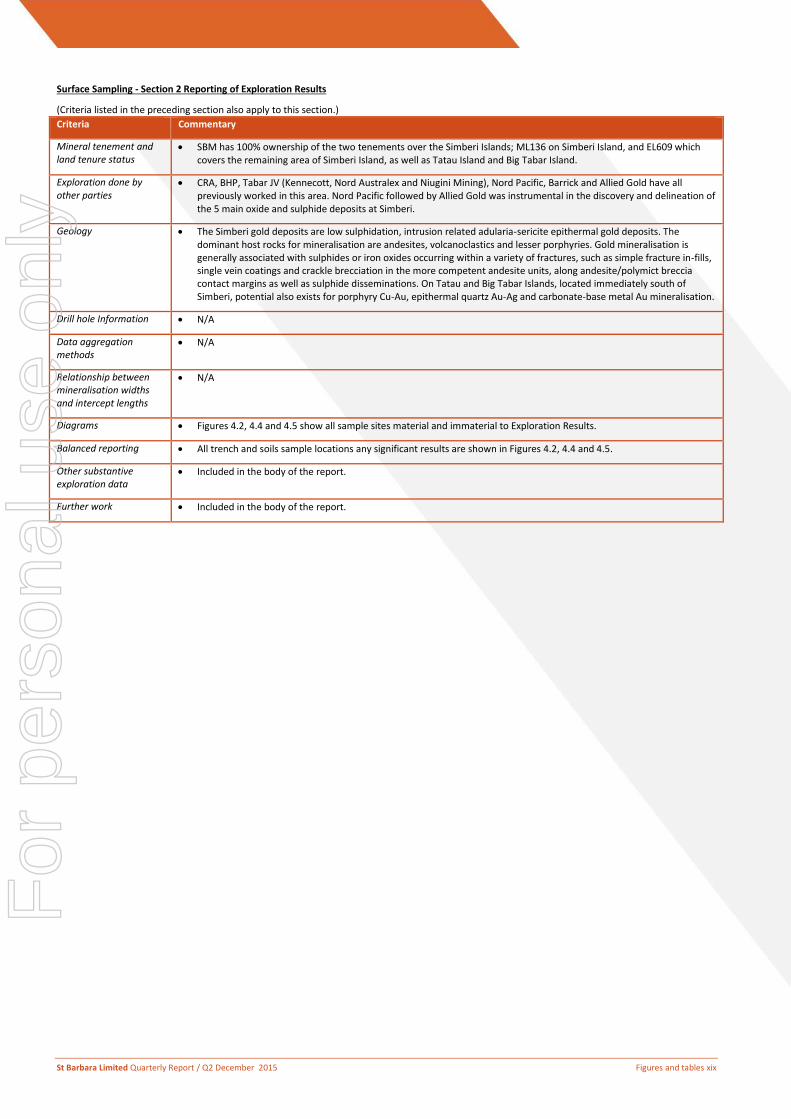
St Barbara Limited Quarterly Report / Q2 December 2015 Figures and tables xix
Surface Sampling - Section 2 Reporting of Exploration Results
(Criteria listed in the preceding section also apply to this section.)
Criteria Commentary
Mineral tenement and land tenure status
SBM has 100% ownership of the two tenements over the Simberi Islands; ML136 on Simberi Island, and EL609 which covers the remaining area of Simberi Island, as well as Tatau Island and Big Tabar Island.
Exploration done by other parties
CRA, BHP, Tabar JV (Kennecott, Nord Australex and Niugini Mining), Nord Pacific, Barrick and Allied Gold have all previously worked in this area. Nord Pacific followed by Allied Gold was instrumental in the discovery and delineation of the 5 main oxide and sulphide deposits at Simberi.
Geology The Simberi gold deposits are low sulphidation, intrusion related adularia-sericite epithermal gold deposits. The dominant host rocks for mineralisation are andesites, volcanoclastics and lesser porphyries. Gold mineralisation is generally associated with sulphides or iron oxides occurring within a variety of fractures, such as simple fracture in-fills, single vein coatings and crackle brecciation in the more competent andesite units, along andesite/polymict breccia contact margins as well as sulphide disseminations. On Tatau and Big Tabar Islands, located immediately south of Simberi, potential also exists for porphyry Cu-Au, epithermal quartz Au-Ag and carbonate-base metal Au mineralisation.
Drill hole Information N/A
Data aggregation methods
N/A
Relationship between mineralisation widths and intercept lengths
N/A
Diagrams Figures 4.2, 4.4 and 4.5 show all sample sites material and immaterial to Exploration Results.
Balanced reporting All trench and soils sample locations any significant results are shown in Figures 4.2, 4.4 and 4.5.
Other substantive exploration data
Included in the body of the report.
Further work Included in the body of the report.
For
per
sona
l use
onl
y