Embed Size (px)
Citation preview
Unaudited Quarterly Report | Q3 2021
1
Unaudited Quarterly Report
Q3 2021
Published on the 4thNovember 2021
Unaudited Quarterly Report | Q3 2021
All figures reported on a Clean CCS basis, unless otherwise stated. 2
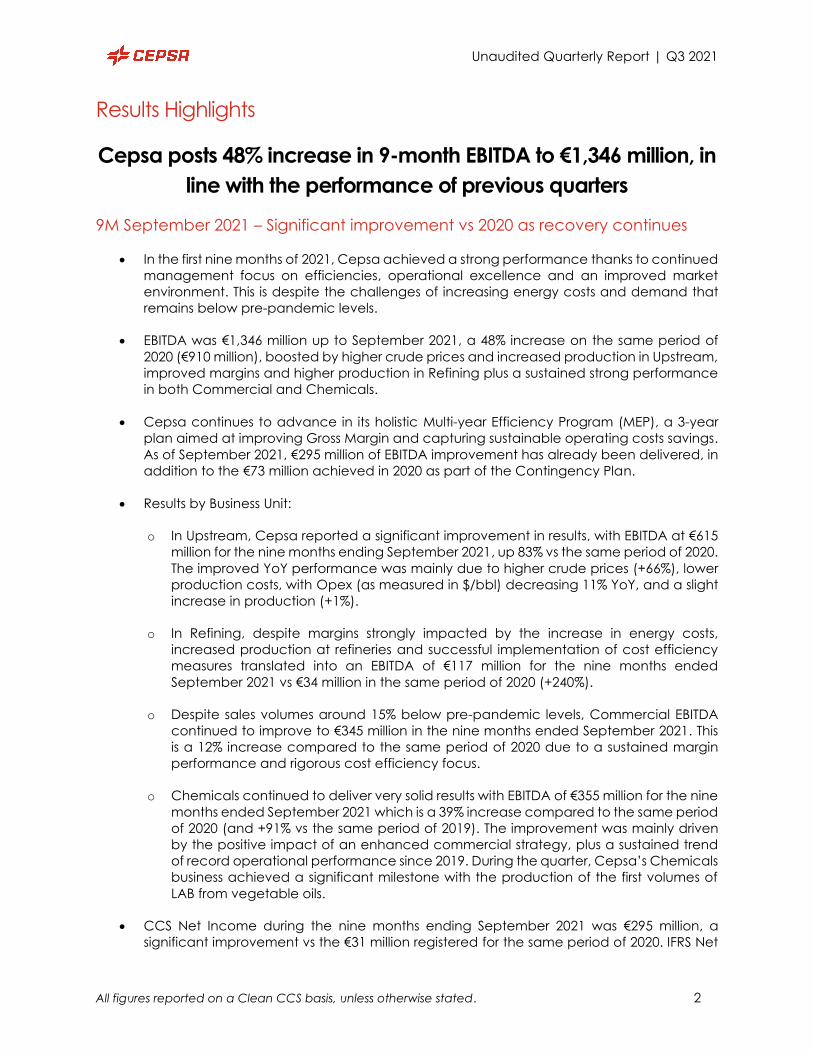
Results Highlights
Cepsa posts 48% increase in 9-month EBITDA to €1,346 million, in
line with the performance of previous quarters
9M September 2021 – Significant improvement vs 2020 as recovery continues
• In the first nine months of 2021, Cepsa achieved a strong performance thanks to continued
management focus on efficiencies, operational excellence and an improved market
environment. This is despite the challenges of increasing energy costs and demand that
remains below pre-pandemic levels.
• EBITDA was €1,346 million up to September 2021, a 48% increase on the same period of
2020 (€910 million), boosted by higher crude prices and increased production in Upstream,
improved margins and higher production in Refining plus a sustained strong performance
in both Commercial and Chemicals.
• Cepsa continues to advance in its holistic Multi-year Efficiency Program (MEP), a 3-year
plan aimed at improving Gross Margin and capturing sustainable operating costs savings.
As of September 2021, €295 million of EBITDA improvement has already been delivered, in
addition to the €73 million achieved in 2020 as part of the Contingency Plan.
• Results by Business Unit:
o In Upstream, Cepsa reported a significant improvement in results, with EBITDA at €615
million for the nine months ending September 2021, up 83% vs the same period of 2020.
The improved YoY performance was mainly due to higher crude prices (+66%), lower
production costs, with Opex (as measured in $/bbl) decreasing 11% YoY, and a slight
increase in production (+1%).
o In Refining, despite margins strongly impacted by the increase in energy costs,
increased production at refineries and successful implementation of cost efficiency
measures translated into an EBITDA of €117 million for the nine months ended
September 2021 vs €34 million in the same period of 2020 (+240%).
o Despite sales volumes around 15% below pre-pandemic levels, Commercial EBITDA
continued to improve to €345 million in the nine months ended September 2021. This
is a 12% increase compared to the same period of 2020 due to a sustained margin
performance and rigorous cost efficiency focus.
o Chemicals continued to deliver very solid results with EBITDA of €355 million for the nine
months ended September 2021 which is a 39% increase compared to the same period
of 2020 (and +91% vs the same period of 2019). The improvement was mainly driven
by the positive impact of an enhanced commercial strategy, plus a sustained trend
of record operational performance since 2019. During the quarter, Cepsa’s Chemicals
business achieved a significant milestone with the production of the first volumes of
LAB from vegetable oils.
• CCS Net Income during the nine months ending September 2021 was €295 million, a
significant improvement vs the €31 million registered for the same period of 2020. IFRS Net
Unaudited Quarterly Report | Q3 2021
All figures reported on a Clean CCS basis, unless otherwise stated. 3
Income was €498 million, positively affected by the increase in commodity prices and
materially above the net loss of €810 million registered in the same period of 2020, which
was affected by asset impairments, lower prices and subdued demand.
• Cepsa continued to optimize capex, with investments for the nine months ended
September 2021 of €310 million, compared to €464 million during the same period of 2020.
• Free cash flow before working capital up to September showed a significant improvement,
from €55 million in 2020 to €918 million in 2021, mainly due to improved results.
CEO appointment
• On October 15th, Cepsa announced the appointment of Maarten Wetselaar as CEO of
the company, effective 1st January 2022. Current CEO Philippe Boisseau will remain with
the Company after his handover, as an advisor to Maarten and the Board.
Philippe Boisseau, Cepsa CEO:
We have achieved a strong performance YTD and prospects are good for the remainder of 2021, despite
the recent volatility in global energy markets and the increase in European natural gas prices. The solid 2021
performance is thanks to management-led initiatives put in place since the onset of the Covid-19 crisis and
continued focus on efficiencies, both in costs and investments. These results provide a strong foundation to
implement our green energy transition plan.
During 2021 we have achieved significant progress in building a new organization and preparing and
reorienting the business to take full advantage of the opportunities that the energy transition has to offer. In
addition, we have put in place an ambitious optimization plan, which is on track and already delivering very
solid results, with approximately €300 million of positive EBITDA impact achieved in the first nine months of the
year.
Unaudited Quarterly Report | Q3 2021
All figures reported on a Clean CCS basis, unless otherwise stated. 4
Presentation of Results
Market Indicators
Financial Summary
Operational KPIs
Market Indicators Variation vs. YTD YTD
Q3'21 Q2'21 Q3'20 Q3'20 Q2'21 2021 2020
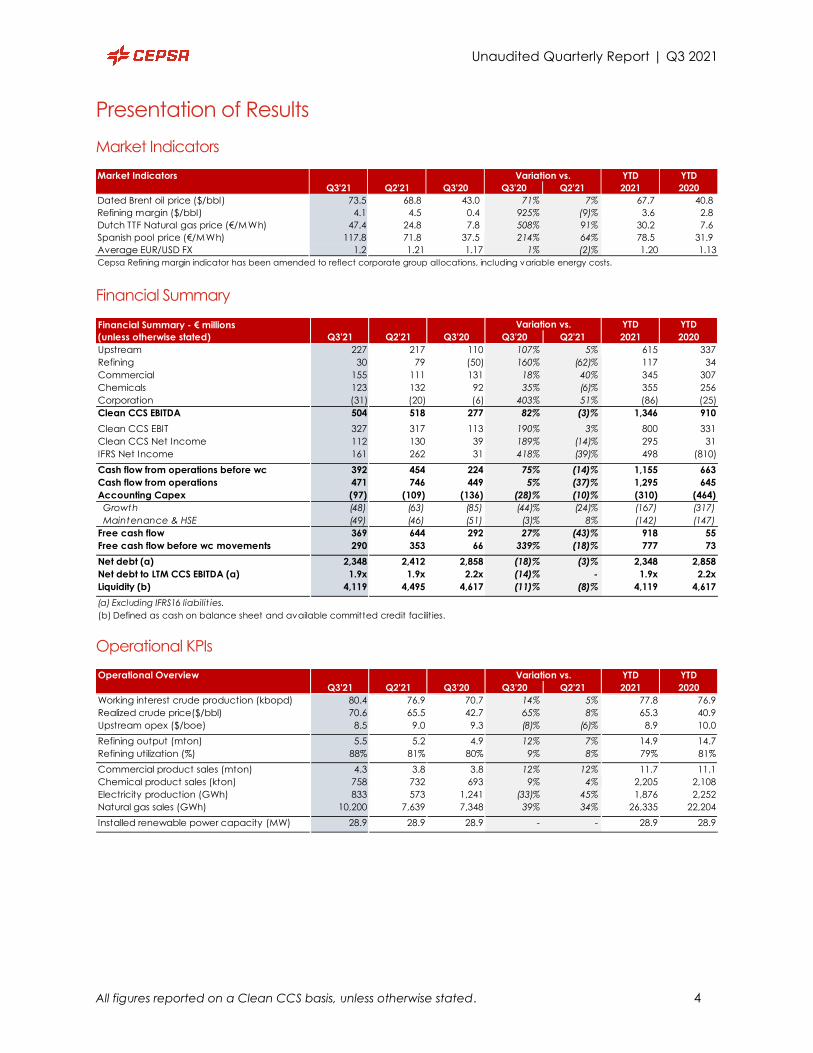
Dated Brent oil price ($/bbl) 73.5 68.8 43.0 71% 7% 67.7 40.8
Refining margin ($/bbl) 4.1 4.5 0.4 925% (9)% 3.6 2.8
Dutch TTF Natural gas price (€/MWh) 47.4 24.8 7.8 508% 91% 30.2 7.6
Spanish pool price (€/MWh) 117.8 71.8 37.5 214% 64% 78.5 31.9
Average EUR/USD FX 1.2 1.21 1.17 1% (2)% 1.20 1.13
Cepsa Refining margin indicator has been amended to reflect corporate group allocations, including variable energy costs.
Variation vs. YTD YTD
Q3'21 Q2'21 Q3'20 Q3'20 Q2'21 2021 2020
Upstream 227 217 110 107% 5% 615 337
Refining 30 79 (50) 160% (62)% 117 34
Commercial 155 111 131 18% 40% 345 307
Chemicals 123 132 92 35% (6)% 355 256
Corporation (31) (20) (6) 403% 51% (86) (25)
Clean CCS EBITDA 504 518 277 82% (3)% 1,346 910
Clean CCS EBIT 327 317 113 190% 3% 800 331
Clean CCS Net Income 112 130 39 189% (14)% 295 31
IFRS Net Income 161 262 31 418% (39)% 498 (810)
Cash flow from operations before wc 392 454 224 75% (14)% 1,155 663
Cash flow from operations 471 746 449 5% (37)% 1,295 645
Accounting Capex (97) (109) (136) (28)% (10)% (310) (464)
Growth (48) (63) (85) (44)% (24)% (167) (317)
Maintenance & HSE (49) (46) (51) (3)% 8% (142) (147)
Free cash flow 369 644 292 27% (43)% 918 55
Free cash flow before wc movements 290 353 66 339% (18)% 777 73
Net debt (a) 2,348 2,412 2,858 (18)% (3)% 2,348 2,858
Net debt to LTM CCS EBITDA (a) 1.9x 1.9x 2.2x (14)% - 1.9x 2.2x
Liquidity (b) 4,119 4,495 4,617 (11)% (8)% 4,119 4,617
(a) Excluding IFRS16 liabilit ies.
(b) Defined as cash on balance sheet and available committed credit facilities.
Financial Summary - € millions
(unless otherwise stated)
Operational Overview Variation vs. YTD YTD
Q3'21 Q2'21 Q3'20 Q3'20 Q2'21 2021 2020
Working interest crude production (kbopd) 80.4 76.9 70.7 14% 5% 77.8 76.9
Realized crude price($/bbl) 70.6 65.5 42.7 65% 8% 65.3 40.9
Upstream opex ($/boe) 8.5 9.0 9.3 (8)% (6)% 8.9 10.0
Refining output (mton) 5.5 5.2 4.9 12% 7% 14.9 14.7
Refining utilization (%) 88% 81% 80% 9% 8% 79% 81%
Commercial product sales (mton) 4.3 3.8 3.8 12% 12% 11.7 11.1
Chemical product sales (kton) 758 732 693 9% 4% 2,205 2,108
Electricity production (GWh) 833 573 1,241 (33)% 45% 1,876 2,252
Natural gas sales (GWh) 10,200 7,639 7,348 39% 34% 26,335 22,204
Installed renewable power capacity (MW) 28.9 28.9 28.9 - - 28.9 28.9
Unaudited Quarterly Report | Q3 2021
All figures reported on a Clean CCS basis, unless otherwise stated. 5
Consolidated Financial Results
Income Statement (CCS)
Q3 2021
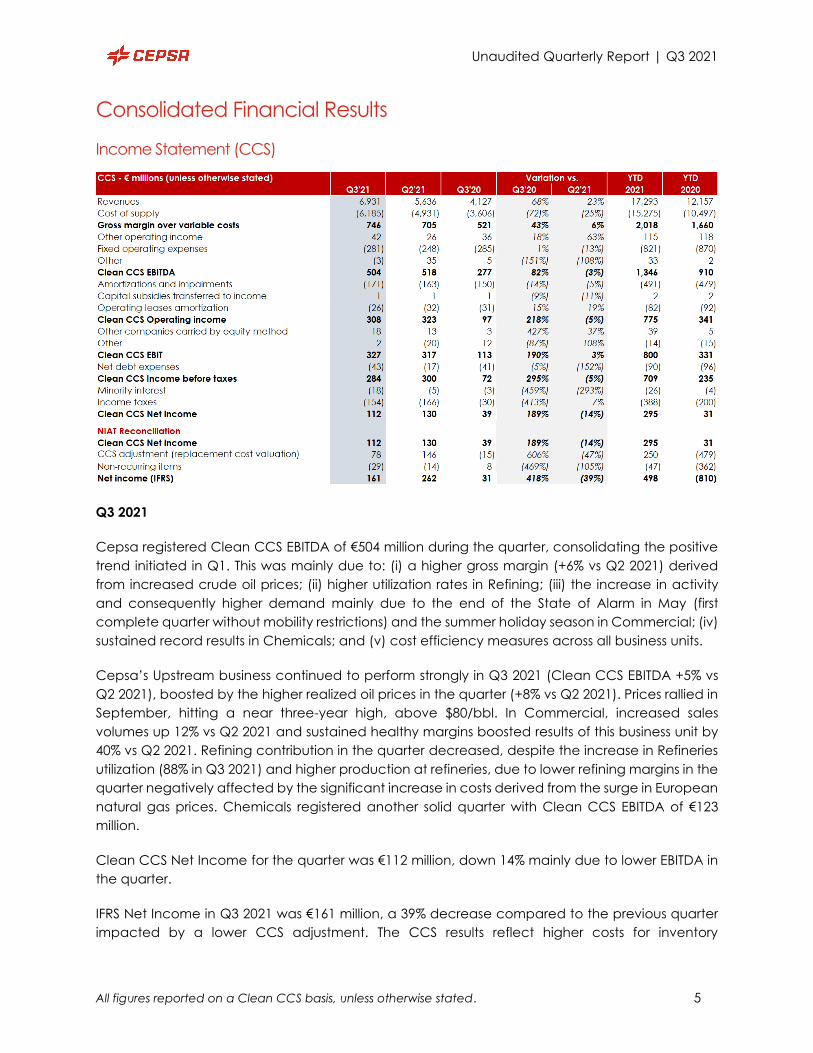
Cepsa registered Clean CCS EBITDA of €504 million during the quarter, consolidating the positive
trend initiated in Q1. This was mainly due to: (i) a higher gross margin (+6% vs Q2 2021) derived
from increased crude oil prices; (ii) higher utilization rates in Refining; (iii) the increase in activity
and consequently higher demand mainly due to the end of the State of Alarm in May (first
complete quarter without mobility restrictions) and the summer holiday season in Commercial; (iv)
sustained record results in Chemicals; and (v) cost efficiency measures across all business units.
Cepsa’s Upstream business continued to perform strongly in Q3 2021 (Clean CCS EBITDA +5% vs
Q2 2021), boosted by the higher realized oil prices in the quarter (+8% vs Q2 2021). Prices rallied in
September, hitting a near three-year high, above $80/bbl. In Commercial, increased sales
volumes up 12% vs Q2 2021 and sustained healthy margins boosted results of this business unit by
40% vs Q2 2021. Refining contribution in the quarter decreased, despite the increase in Refineries
utilization (88% in Q3 2021) and higher production at refineries, due to lower refining margins in the
quarter negatively affected by the significant increase in costs derived from the surge in European
natural gas prices. Chemicals registered another solid quarter with Clean CCS EBITDA of €123
million.
Clean CCS Net Income for the quarter was €112 million, down 14% mainly due to lower EBITDA in
the quarter.
IFRS Net Income in Q3 2021 was €161 million, a 39% decrease compared to the previous quarter
impacted by a lower CCS adjustment. The CCS results reflect higher costs for inventory
Unaudited Quarterly Report | Q3 2021
All figures reported on a Clean CCS basis, unless otherwise stated. 6
consumption in Q3 2021, given the rise in commodity prices, compared to the Last Twelve Months
(LTM) Average Unit Cost as per IFRS accounting.
First nine months 2021
Cepsa registered a significant increase in Clean CCS EBITDA as of September 2021 of +48%
compared to the same period of the previous year, with improvement in all business units.
Upstream business results were boosted by a higher crude price and slightly higher production.
Refining registered a significant improvement due to improved refining margins and increased
production at refineries. Commercial continued its trend of improved results with sustained healthy
margins and demand closing the gap vs pre-pandemic levels. Finally, Chemicals continued
outperforming, registering record results YTD vs a very strong 2020 base. This upturn in results was
achieved despite OPEC+ production quota restrictions (OPEC+ agreed to soften restrictions in July
by +0.4 mb/d per month until December) and mobility restrictions that remained in force until mid-
May.
Cepsa registered Clean CCS Net Income of €295 million up to September 2021, an improvement
of more than 8x vs the €31 million registered during the same period of 2020, following the
improved trend in EBITDA and good performance of equity investments.
Cash Flow Statement (CCS)
CCS - € millions (unless otherwise stated) Variation vs. YTD YTD
Q3'21 Q2'21 Q3'20 Q3'20 Q2'21 2021 2020
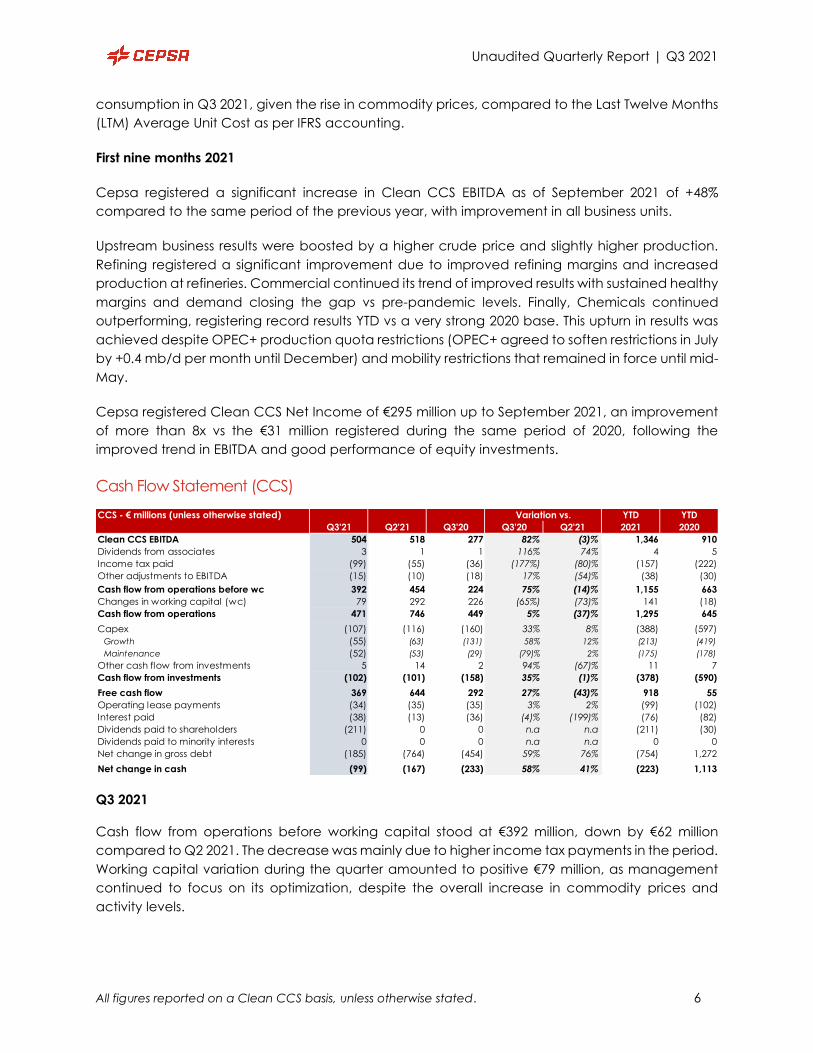
Clean CCS EBITDA 504 518 277 82% (3)% 1,346 910
Dividends from associates 3 1 1 116% 74% 4 5
Income tax paid (99) (55) (36) (177%) (80)% (157) (222)
Other adjustments to EBITDA (15) (10) (18) 17% (54)% (38) (30)
Cash flow from operations before wc 392 454 224 75% (14)% 1,155 663
Changes in working capital (wc) 79 292 226 (65%) (73)% 141 (18)
Cash flow from operations 471 746 449 5% (37)% 1,295 645
Capex (107) (116) (160) 33% 8% (388) (597)
Growth (55) (63) (131) 58% 12% (213) (419)
Maintenance (52) (53) (29) (79)% 2% (175) (178)
Other cash flow from investments 5 14 2 94% (67)% 11 7
Cash flow from investments (102) (101) (158) 35% (1)% (378) (590)
Free cash flow 369 644 292 27% (43)% 918 55
Operating lease payments (34) (35) (35) 3% 2% (99) (102)
Interest paid (38) (13) (36) (4)% (199)% (76) (82)
Dividends paid to shareholders (211) 0 0 n.a n.a (211) (30)
Dividends paid to minority interests 0 0 0 n.a n.a 0 0
Net change in gross debt (185) (764) (454) 59% 76% (754) 1,272
Net change in cash (99) (167) (233) 58% 41% (223) 1,113
Q3 2021
Cash flow from operations before working capital stood at €392 million, down by €62 million
compared to Q2 2021. The decrease was mainly due to higher income tax payments in the period.
Working capital variation during the quarter amounted to positive €79 million, as management
continued to focus on its optimization, despite the overall increase in commodity prices and
activity levels.
Unaudited Quarterly Report | Q3 2021
All figures reported on a Clean CCS basis, unless otherwise stated. 7
Capex payments during the quarter were similar to Q2, in a continued trend of strong discipline
on investments and preservation of cash flow.
Positive free cash flow of €369 million was achieved, out of which interest of €38 million and an
interim dividend of €211 million was paid during the quarter.
Gross debt reduction of €185 million during the period was mainly related to the repayment of
certain funded debt facilities and the reduction in cash balances, whilst maintaining strong
liquidity levels.
First nine months 2021
A significant increase in Cash Flow from operations as of September 2021 to €1,295 million was
achieved, doubling September 2020 figures, due to the material improvement in results and a
working capital release of approximately €150 million.
Lower capex payments were made in the period (-35% YoY) as a result of the rationalization
initiatives implemented as part of the Multi Year Efficiency program (MEP) put in place to preserve
cash flow generation.
There has been strong cash flow generation YTD, especially during Q2 and Q3 2021, as Q1 was still
impacted by the Covid-19 pandemic. As a result, free cash flow for YTD September 2021 stood at
€918 million, mainly driven by the improved results.
In 2020, as a precautionary measure and due to the uncertainties caused by the Covid-19
pandemic, Cepsa increased its liquidity position by approximately €1.2 billion. During Q2 and Q3
2021, as the situation improved, Cepsa has been gradually reducing its liquidity position and
consequently, its gross debt was reduced by a total of €754 million up to September 2021.
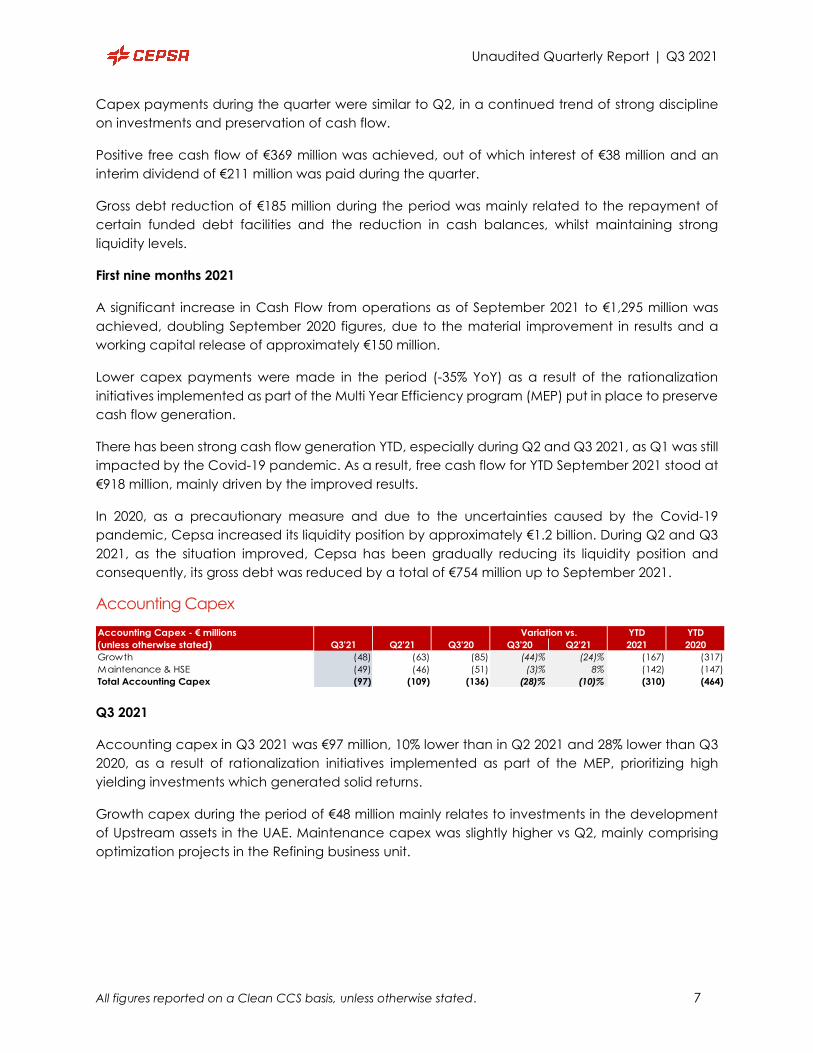
Accounting Capex
Accounting Capex - € millions Variation vs. YTD YTD
(unless otherwise stated) Q3'21 Q2'21 Q3'20 Q3'20 Q2'21 2021 2020
Growth (48) (63) (85) (44)% (24)% (167) (317)
Maintenance & HSE (49) (46) (51) (3)% 8% (142) (147)
Total Accounting Capex (97) (109) (136) (28)% (10)% (310) (464)
Q3 2021
Accounting capex in Q3 2021 was €97 million, 10% lower than in Q2 2021 and 28% lower than Q3
2020, as a result of rationalization initiatives implemented as part of the MEP, prioritizing high
yielding investments which generated solid returns.
Growth capex during the period of €48 million mainly relates to investments in the development
of Upstream assets in the UAE. Maintenance capex was slightly higher vs Q2, mainly comprising
optimization projects in the Refining business unit.
Unaudited Quarterly Report | Q3 2021
All figures reported on a Clean CCS basis, unless otherwise stated. 8
First nine months 2021
Accounting capex YTD was down by 33% vs September 2020 as a result of the rationalization
initiatives put in place at the onset of the pandemic, as outlined above.
Growth capex YTD decreased by 47% vs YTD September 2020, as the 2020 figure includes the
acquisition of a 40% stake in two leading asphalt manufacturing companies in Morocco. Up to
September 2021, growth investments were mainly related to the development of Upstream assets
in the UAE and efficiency investments at Cepsa refineries and chemical plants.
Maintenance capex remained in line with the same period of the previous year, mainly related to
investments in the Refining business associated with the extended maintenance of some units in
La Rábida (Huelva) refinery.
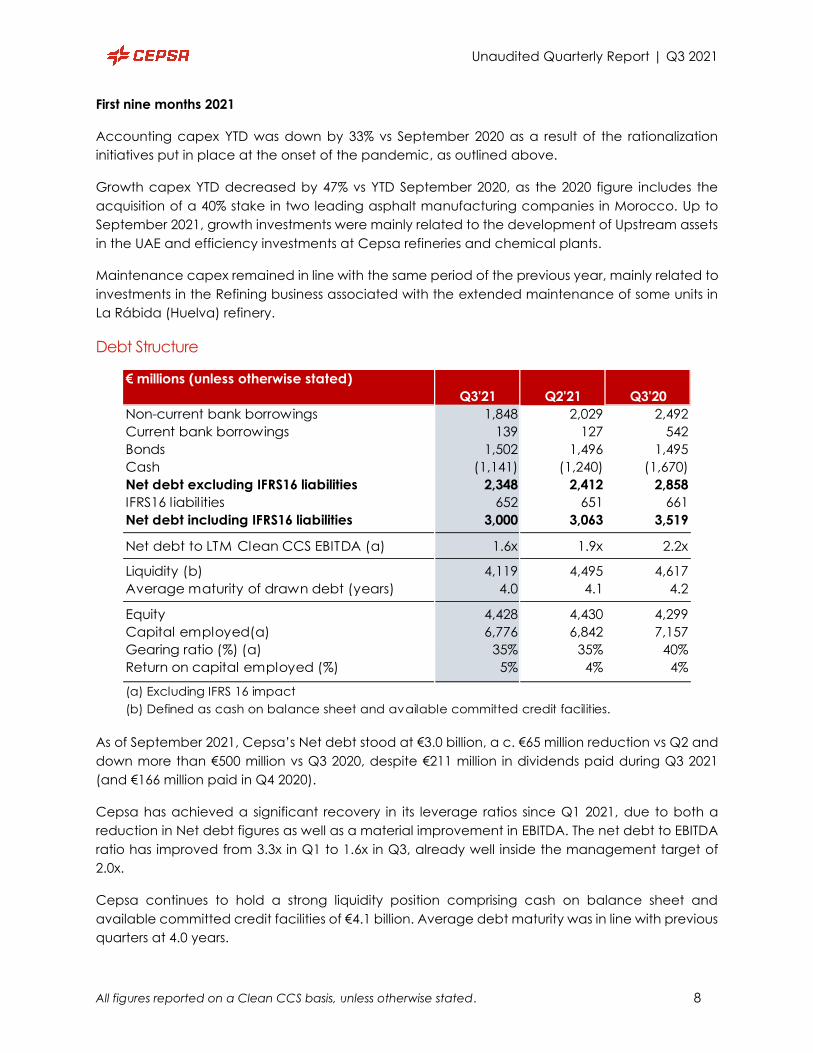
Debt Structure
€ millions (unless otherwise stated)
Q3'21 Q2'21 Q3'20
Non-current bank borrowings 1,848 2,029 2,492
Current bank borrowings 139 127 542
Bonds 1,502 1,496 1,495
Cash (1,141) (1,240) (1,670)
Net debt excluding IFRS16 liabilities 2,348 2,412 2,858
IFRS16 liabilities 652 651 661
Net debt including IFRS16 liabilities 3,000 3,063 3,519
Net debt to LTM Clean CCS EBITDA (a) 1.6x 1.9x 2.2x
Liquidity (b) 4,119 4,495 4,617
Average maturity of drawn debt (years) 4.0 4.1 4.2
Equity 4,428 4,430 4,299
Capital employed(a) 6,776 6,842 7,157
Gearing ratio (%) (a) 35% 35% 40%
Return on capital employed (%) 5% 4% 4%
(a) Excluding IFRS 16 impact
(b) Defined as cash on balance sheet and available committed credit facilities.
As of September 2021, Cepsa’s Net debt stood at €3.0 billion, a c. €65 million reduction vs Q2 and
down more than €500 million vs Q3 2020, despite €211 million in dividends paid during Q3 2021
(and €166 million paid in Q4 2020).
Cepsa has achieved a significant recovery in its leverage ratios since Q1 2021, due to both a
reduction in Net debt figures as well as a material improvement in EBITDA. The net debt to EBITDA
ratio has improved from 3.3x in Q1 to 1.6x in Q3, already well inside the management target of
2.0x.
Cepsa continues to hold a strong liquidity position comprising cash on balance sheet and
available committed credit facilities of €4.1 billion. Average debt maturity was in line with previous
quarters at 4.0 years.
Unaudited Quarterly Report | Q3 2021
All figures reported on a Clean CCS basis, unless otherwise stated. 9
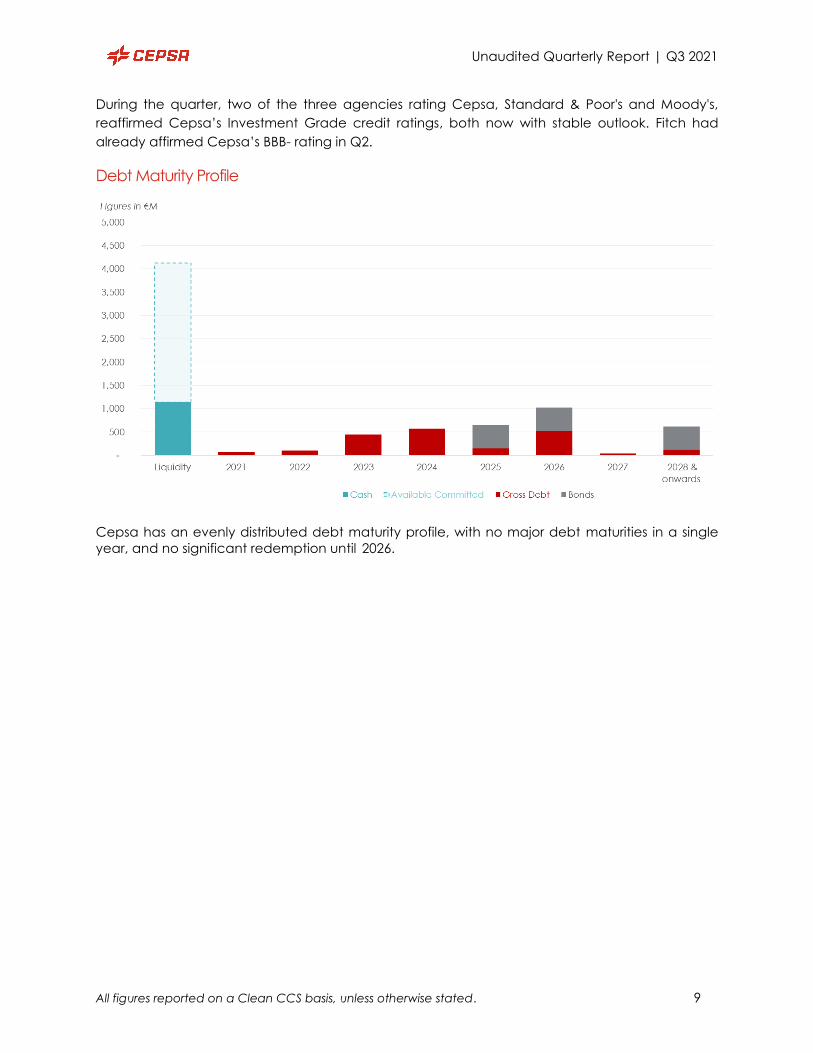
During the quarter, two of the three agencies rating Cepsa, Standard & Poor's and Moody's,
reaffirmed Cepsa’s Investment Grade credit ratings, both now with stable outlook. Fitch had
already affirmed Cepsa’s BBB- rating in Q2.
Debt Maturity Profile
Cepsa has an evenly distributed debt maturity profile, with no major debt maturities in a single
year, and no significant redemption until 2026.
Unaudited Quarterly Report | Q3 2021
All figures reported on a Clean CCS basis, unless otherwise stated. 10
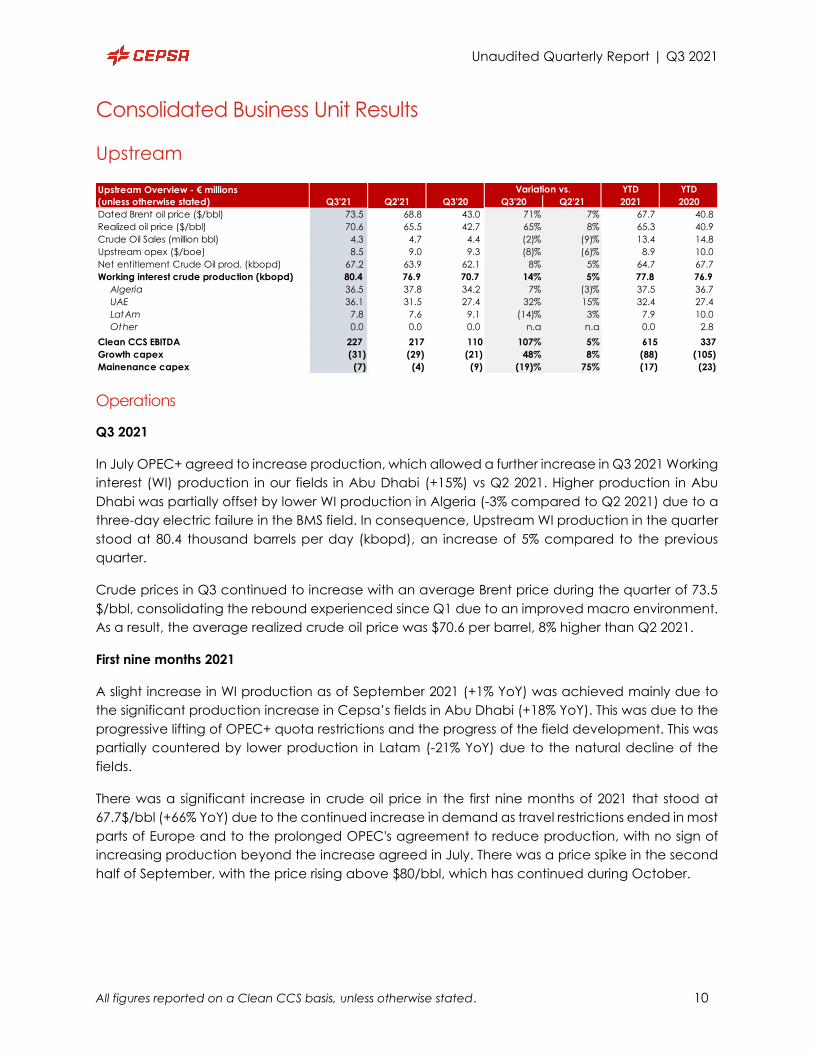
Consolidated Business Unit Results
Upstream
Operations
Q3 2021
In July OPEC+ agreed to increase production, which allowed a further increase in Q3 2021 Working
interest (WI) production in our fields in Abu Dhabi (+15%) vs Q2 2021. Higher production in Abu
Dhabi was partially offset by lower WI production in Algeria (-3% compared to Q2 2021) due to a
three-day electric failure in the BMS field. In consequence, Upstream WI production in the quarter
stood at 80.4 thousand barrels per day (kbopd), an increase of 5% compared to the previous
quarter.
Crude prices in Q3 continued to increase with an average Brent price during the quarter of 73.5
$/bbl, consolidating the rebound experienced since Q1 due to an improved macro environment.
As a result, the average realized crude oil price was $70.6 per barrel, 8% higher than Q2 2021.
First nine months 2021
A slight increase in WI production as of September 2021 (+1% YoY) was achieved mainly due to
the significant production increase in Cepsa’s fields in Abu Dhabi (+18% YoY). This was due to the
progressive lifting of OPEC+ quota restrictions and the progress of the field development. This was
partially countered by lower production in Latam (-21% YoY) due to the natural decline of the
fields.
There was a significant increase in crude oil price in the first nine months of 2021 that stood at
67.7$/bbl (+66% YoY) due to the continued increase in demand as travel restrictions ended in most
parts of Europe and to the prolonged OPEC's agreement to reduce production, with no sign of
increasing production beyond the increase agreed in July. There was a price spike in the second
half of September, with the price rising above $80/bbl, which has continued during October.
Variation vs. YTD YTD
Q3'21 Q2'21 Q3'20 Q3'20 Q2'21 2021 2020
Dated Brent oil price ($/bbl) 73.5 68.8 43.0 71% 7% 67.7 40.8
Realized oil price ($/bbl) 70.6 65.5 42.7 65% 8% 65.3 40.9
Crude Oil Sales (million bbl) 4.3 4.7 4.4 (2)% (9)% 13.4 14.8
Upstream opex ($/boe) 8.5 9.0 9.3 (8)% (6)% 8.9 10.0
Net entitlement Crude Oil prod. (kbopd) 67.2 63.9 62.1 8% 5% 64.7 67.7
Working interest crude production (kbopd) 80.4 76.9 70.7 14% 5% 77.8 76.9
Algeria 36.5 37.8 34.2 7% (3)% 37.5 36.7
UAE 36.1 31.5 27.4 32% 15% 32.4 27.4
LatAm 7.8 7.6 9.1 (14)% 3% 7.9 10.0
Other 0.0 0.0 0.0 n.a n.a 0.0 2.8
Clean CCS EBITDA 227 217 110 107% 5% 615 337
Growth capex (31) (29) (21) 48% 8% (88) (105)
Mainenance capex (7) (4) (9) (19)% 75% (17) (23)
Upstream Overview - € millions
(unless otherwise stated)
Unaudited Quarterly Report | Q3 2021
All figures reported on a Clean CCS basis, unless otherwise stated. 11
Results
Q3 2021
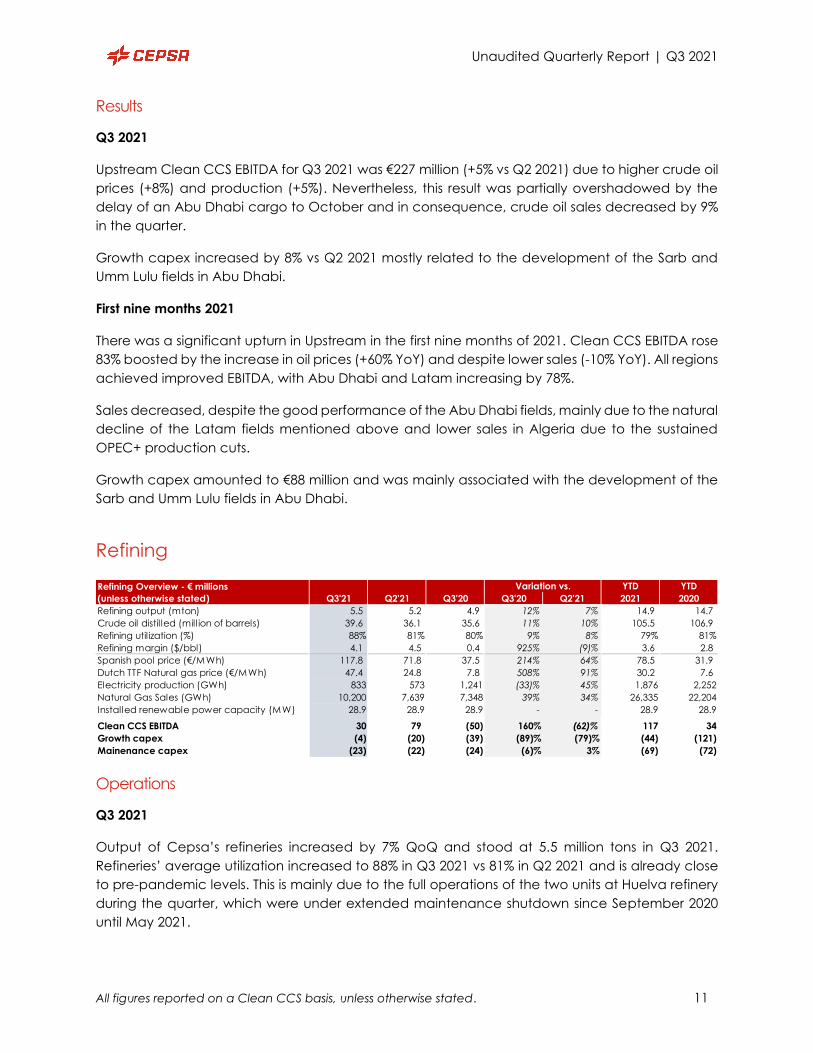
Upstream Clean CCS EBITDA for Q3 2021 was €227 million (+5% vs Q2 2021) due to higher crude oil
prices (+8%) and production (+5%). Nevertheless, this result was partially overshadowed by the
delay of an Abu Dhabi cargo to October and in consequence, crude oil sales decreased by 9%
in the quarter.
Growth capex increased by 8% vs Q2 2021 mostly related to the development of the Sarb and
Umm Lulu fields in Abu Dhabi.
First nine months 2021
There was a significant upturn in Upstream in the first nine months of 2021. Clean CCS EBITDA rose
83% boosted by the increase in oil prices (+60% YoY) and despite lower sales (-10% YoY). All regions
achieved improved EBITDA, with Abu Dhabi and Latam increasing by 78%.
Sales decreased, despite the good performance of the Abu Dhabi fields, mainly due to the natural
decline of the Latam fields mentioned above and lower sales in Algeria due to the sustained
OPEC+ production cuts.
Growth capex amounted to €88 million and was mainly associated with the development of the
Sarb and Umm Lulu fields in Abu Dhabi.
Refining
Operations
Q3 2021
Output of Cepsa’s refineries increased by 7% QoQ and stood at 5.5 million tons in Q3 2021.
Refineries’ average utilization increased to 88% in Q3 2021 vs 81% in Q2 2021 and is already close
to pre-pandemic levels. This is mainly due to the full operations of the two units at Huelva refinery
during the quarter, which were under extended maintenance shutdown since September 2020
until May 2021.
Variation vs. YTD YTD
Q3'21 Q2'21 Q3'20 Q3'20 Q2'21 2021 2020
Refining output (mton) 5.5 5.2 4.9 12% 7% 14.9 14.7
Crude oil distil led (mill ion of barrels) 39.6 36.1 35.6 11% 10% 105.5 106.9
Refining util ization (%) 88% 81% 80% 9% 8% 79% 81%
Refining margin ($/bbl) 4.1 4.5 0.4 925% (9)% 3.6 2.8
Spanish pool price (€/MWh) 117.8 71.8 37.5 214% 64% 78.5 31.9
Dutch TTF Natural gas price (€/MWh) 47.4 24.8 7.8 508% 91% 30.2 7.6
Electricity production (GWh) 833 573 1,241 (33)% 45% 1,876 2,252
Natural Gas Sales (GWh) 10,200 7,639 7,348 39% 34% 26,335 22,204
Installed renewable power capacity (MW) 28.9 28.9 28.9 - - 28.9 28.9
Clean CCS EBITDA 30 79 (50) 160% (62)% 117 34
Growth capex (4) (20) (39) (89)% (79)% (44) (121)
Mainenance capex (23) (22) (24) (6)% 3% (69) (72)
Refining Overview - € millions
(unless otherwise stated)
Unaudited Quarterly Report | Q3 2021
All figures reported on a Clean CCS basis, unless otherwise stated. 12
First nine months 2021
Refining operations in the first nine months of 2021 were slightly above the same period of the
previous year. Refining output was 14.9 million tons as of September 2021, representing a 2%
increase YoY. Cepsa’s refineries utilization rate was 79%, 3% lower compared to the same period
in 2020, with both figures impacted by the reduction in demand caused by COVID-19, as well as
several minor planned turnarounds that took place in the San Roque refinery and the extended
shutdown in Huelva.
Results
Q3 2021
Refining, margins declined to an average of 4.1 $/bbl vs 4.4 $/bbl in Q2 2021, due to the significant
increase in variable costs as a result of the surge in European natural gas prices (+91% vs Q2 2021),
not yet reflected in the prices of final products, offsetting the higher utilization rates during the
second quarter at Cepsa refineries. Consequently, EBITDA during the quarter was €30 million.
Growth capex decreased by 79% compared to the previous quarter, while maintenance capex
was in line with Q2 2021 at €23 million. Investments in the Refining business during the period were
mainly related to enhancing conversion capacity and efficiency.
First nine months 2021
Clean CCS EBITDA was €117 million, a 240% increase compared to the same period of the previous
year, due in part to higher refining margins during the period (+29%) despite the lower margins
performed in the first part of the year as well as the successful implementation of cost efficiency
measures.
Growth capex was down 64% compared to the same period of 2020, amounting to €44 million in
the period, due to the investment rationalization initiatives implemented to preserve cash flow
generation. Maintenance capex was €69 million, a 5% decrease YoY.
Commercial
Variation vs. YTD YTD
Q3'21 Q2'21 Q3'20 Q3'20 Q2'21 2021 2020
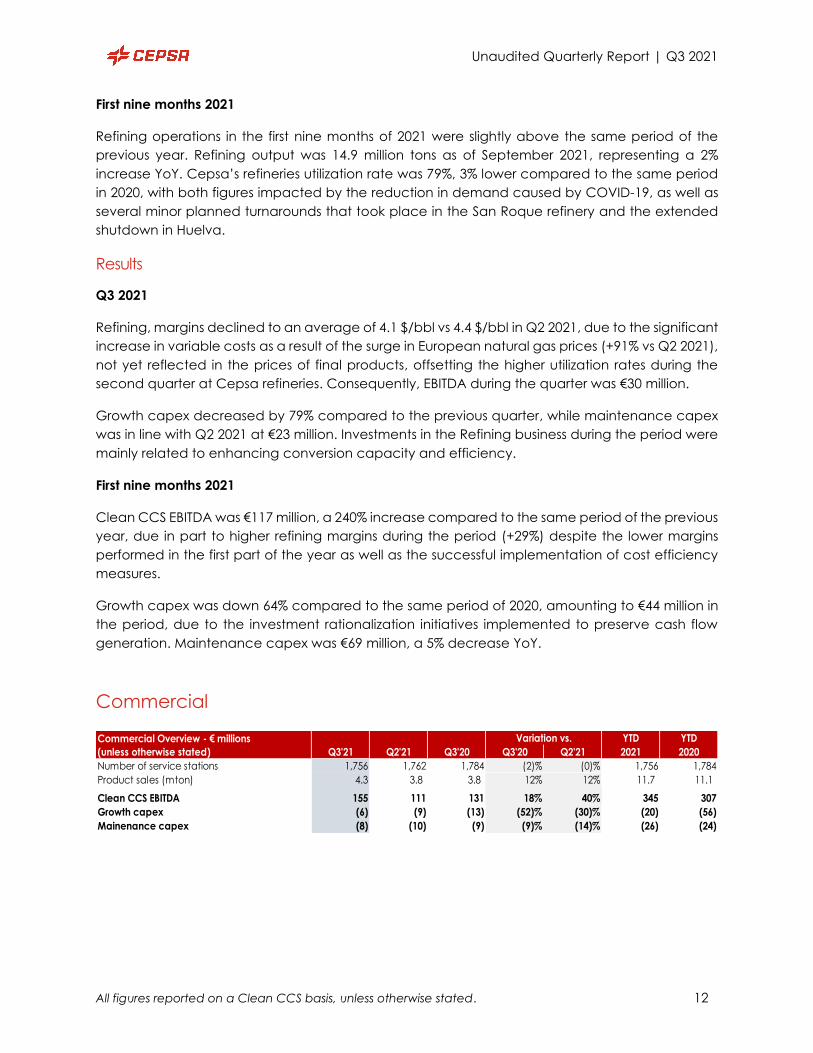
Number of service stations 1,756 1,762 1,784 (2)% (0)% 1,756 1,784
Product sales (mton) 4.3 3.8 3.8 12% 12% 11.7 11.1
Clean CCS EBITDA 155 111 131 18% 40% 345 307
Growth capex (6) (9) (13) (52)% (30)% (20) (56)
Mainenance capex (8) (10) (9) (9)% (14)% (26) (24)
Commercial Overview - € millions
(unless otherwise stated)
Unaudited Quarterly Report | Q3 2021
All figures reported on a Clean CCS basis, unless otherwise stated. 13
Operations
Q3 2021
Spanish fuel demand continued to show signs of recovery in the third quarter, with an 8% increase
compared to the second quarter of 2021, as this was the first complete quarter without travel
restrictions. This, together with higher sales in summer due to the holiday season, resulted in a
product sales improvement in the Commercial business of 12% to 4.3 million tons.
First nine months 2021
Product sales were slightly higher than same period of the previous year (+5%), with sales in the
last two quarters offsetting the poor start to the year, which was impacted by low demand due
to travel restrictions until May, with an additional impact from the disruption caused by the
Filomena snowstorm on the Iberian Peninsula in January.
Results
Q3 2021
Commercial continued to perform strongly in the quarter, especially in the Aviation, Lubricants
and Asphalts segments, due to both higher margins and volumes compared to the previous
quarter. As a result, Clean CCS EBITDA was 40% higher than in Q2 2021 (€155 million in Q3 2021).
The main investments in the quarter related to maintenance capex in the Network and LPG
businesses. Commercial accounting capex stood at €14 million in Q3 2021.
First nine months 2021
Clean CCS EBITDA reached €345 million, up 12% YoY, mainly due to increased demand and
improved margins with the second and third quarter outperforming and offsetting a first quarter
still impacted by pandemic. By segment, Bio (+54% YoY) and the International (+48% YoY)
businesses improved considerably, boosted by higher margins, while Aviation (+38% YoY)
improved results due to a recovery in volumes and prices. However, Lubricants (-62% YoY) was
negatively impacted by low margins due to high supply costs in the first six months of the year.
Growth capex during the period amounted to €20 million, significantly lower than in the same
period of the previous year (€56 million), due to the acquisition in 2020 of a 40% stake in two asphalt
manufacturing companies in Morocco. Maintenance capex was €26 million.
Chemicals
Variation vs. YTD YTD
Q3'21 Q2'21 Q3'20 Q3'20 Q2'21 2021 2020
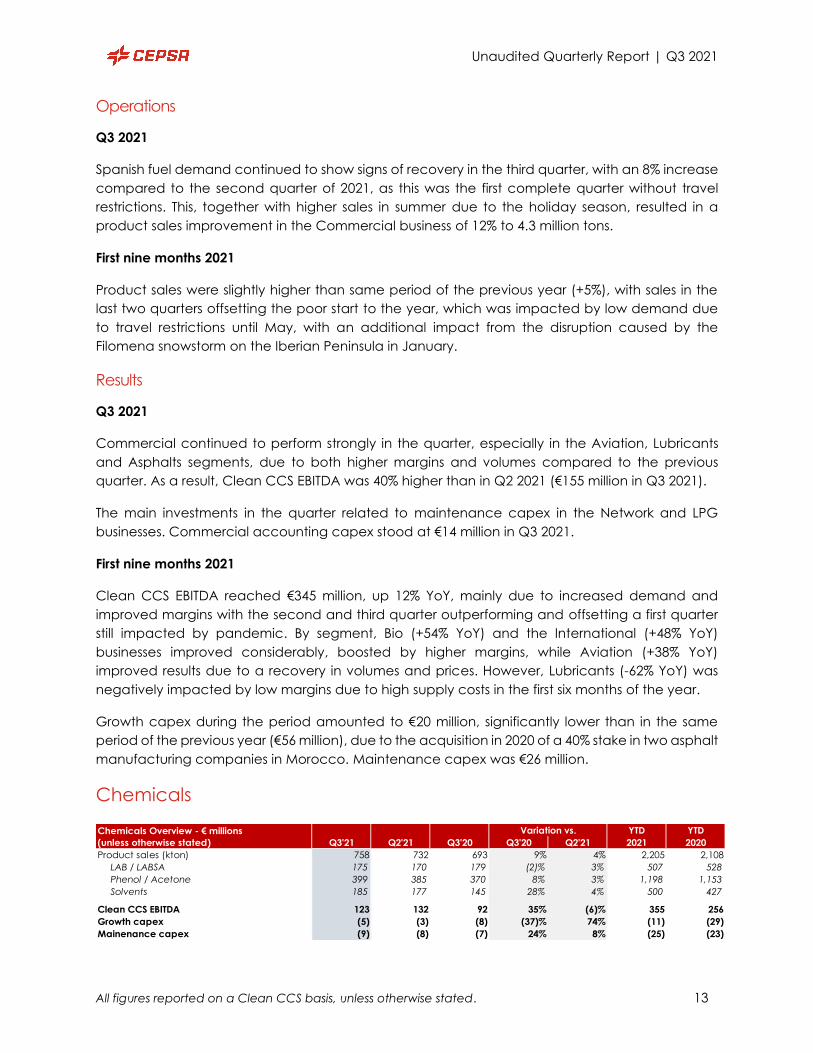
Product sales (kton) 758 732 693 9% 4% 2,205 2,108
LAB / LABSA 175 170 179 (2)% 3% 507 528
Phenol / Acetone 399 385 370 8% 3% 1,198 1,153
Solvents 185 177 145 28% 4% 500 427
Clean CCS EBITDA 123 132 92 35% (6)% 355 256
Growth capex (5) (3) (8) (37)% 74% (11) (29)
Mainenance capex (9) (8) (7) 24% 8% (25) (23)
Chemicals Overview - € millions
(unless otherwise stated)
Unaudited Quarterly Report | Q3 2021
All figures reported on a Clean CCS basis, unless otherwise stated. 14
Operations
Q3 2021
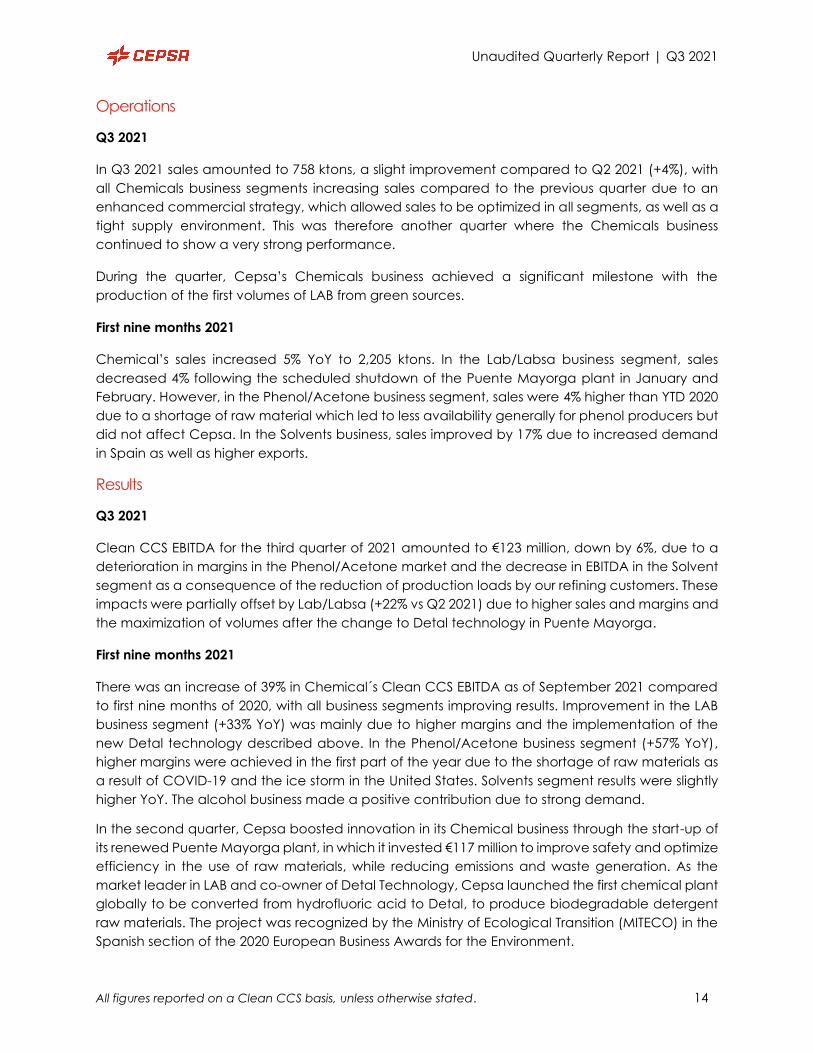
In Q3 2021 sales amounted to 758 ktons, a slight improvement compared to Q2 2021 (+4%), with
all Chemicals business segments increasing sales compared to the previous quarter due to an
enhanced commercial strategy, which allowed sales to be optimized in all segments, as well as a
tight supply environment. This was therefore another quarter where the Chemicals business
continued to show a very strong performance.
During the quarter, Cepsa’s Chemicals business achieved a significant milestone with the
production of the first volumes of LAB from green sources.
First nine months 2021
Chemical’s sales increased 5% YoY to 2,205 ktons. In the Lab/Labsa business segment, sales
decreased 4% following the scheduled shutdown of the Puente Mayorga plant in January and
February. However, in the Phenol/Acetone business segment, sales were 4% higher than YTD 2020
due to a shortage of raw material which led to less availability generally for phenol producers but
did not affect Cepsa. In the Solvents business, sales improved by 17% due to increased demand
in Spain as well as higher exports.
Results
Q3 2021
Clean CCS EBITDA for the third quarter of 2021 amounted to €123 million, down by 6%, due to a
deterioration in margins in the Phenol/Acetone market and the decrease in EBITDA in the Solvent
segment as a consequence of the reduction of production loads by our refining customers. These
impacts were partially offset by Lab/Labsa (+22% vs Q2 2021) due to higher sales and margins and
the maximization of volumes after the change to Detal technology in Puente Mayorga.
First nine months 2021
There was an increase of 39% in Chemical´s Clean CCS EBITDA as of September 2021 compared
to first nine months of 2020, with all business segments improving results. Improvement in the LAB
business segment (+33% YoY) was mainly due to higher margins and the implementation of the
new Detal technology described above. In the Phenol/Acetone business segment (+57% YoY),
higher margins were achieved in the first part of the year due to the shortage of raw materials as
a result of COVID-19 and the ice storm in the United States. Solvents segment results were slightly
higher YoY. The alcohol business made a positive contribution due to strong demand.
In the second quarter, Cepsa boosted innovation in its Chemical business through the start-up of
its renewed Puente Mayorga plant, in which it invested €117 million to improve safety and optimize
efficiency in the use of raw materials, while reducing emissions and waste generation. As the
market leader in LAB and co-owner of Detal Technology, Cepsa launched the first chemical plant
globally to be converted from hydrofluoric acid to Detal, to produce biodegradable detergent
raw materials. The project was recognized by the Ministry of Ecological Transition (MITECO) in the
Spanish section of the 2020 European Business Awards for the Environment.
Unaudited Quarterly Report | Q3 2021
All figures reported on a Clean CCS basis, unless otherwise stated. 15
Growth capex during the period amounted to €11 million, a decrease of 61% vs YTD September
2020 when the Detal project was developed. Maintenance capex was €25 million, mainly driven
by maintenance and safety works in all industrial plants.
Unaudited Quarterly Report | Q3 2021
All figures reported on a Clean CCS basis, unless otherwise stated. 16
Appendix
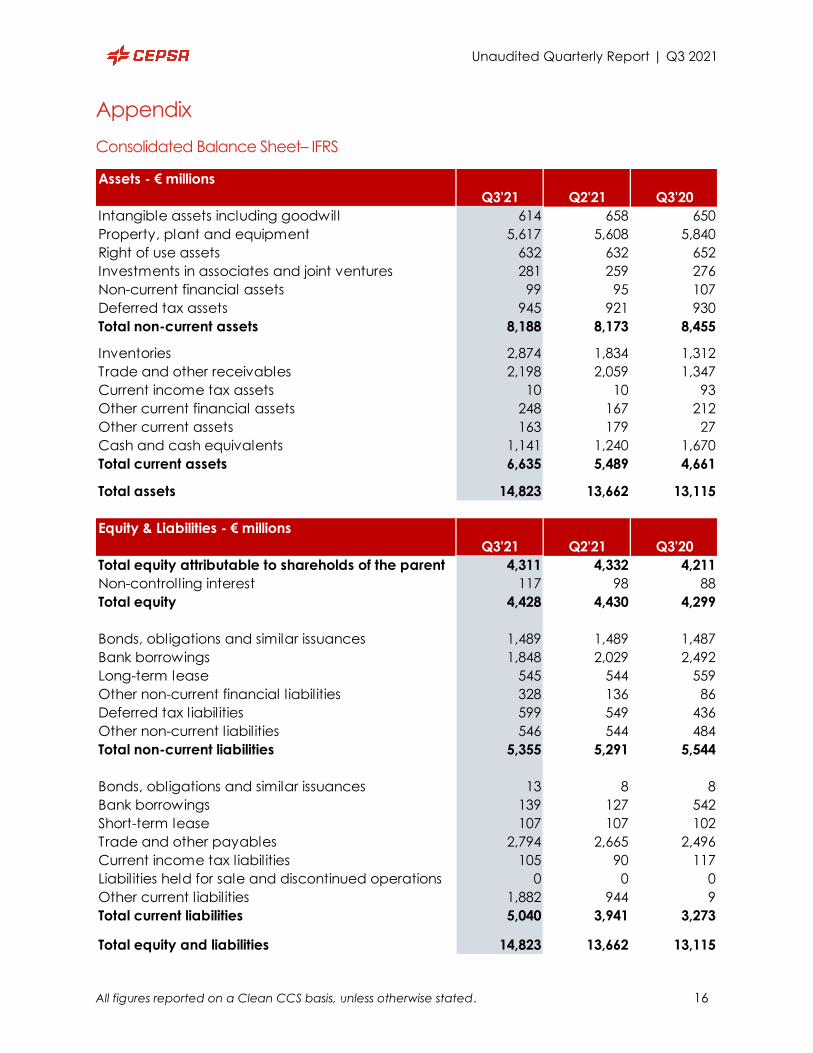
Consolidated Balance Sheet– IFRS
Assets - € millions
Q3'21 Q2'21 Q3'20
Intangible assets including goodwill 614 658 650
Property, plant and equipment 5,617 5,608 5,840
Right of use assets 632 632 652
Investments in associates and joint ventures 281 259 276
Non-current financial assets 99 95 107
Deferred tax assets 945 921 930
Total non-current assets 8,188 8,173 8,455
Inventories 2,874 1,834 1,312
Trade and other receivables 2,198 2,059 1,347
Current income tax assets 10 10 93
Other current financial assets 248 167 212
Other current assets 163 179 27
Cash and cash equivalents 1,141 1,240 1,670
Total current assets 6,635 5,489 4,661
Total assets 14,823 13,662 13,115
Equity & Liabilities - € millions
Q3'21 Q2'21 Q3'20
Total equity attributable to shareholds of the parent 4,311 4,332 4,211
Non-controlling interest 117 98 88
Total equity 4,428 4,430 4,299
Bonds, obligations and similar issuances 1,489 1,489 1,487
Bank borrowings 1,848 2,029 2,492
Long-term lease 545 544 559
Other non-current financial l iabilities 328 136 86
Deferred tax liabilities 599 549 436
Other non-current liabilities 546 544 484
Total non-current liabilities 5,355 5,291 5,544
Bonds, obligations and similar issuances 13 8 8
Bank borrowings 139 127 542
Short-term lease 107 107 102
Trade and other payables 2,794 2,665 2,496
Current income tax liabilities 105 90 117
Liabilities held for sale and discontinued operations 0 0 0
Other current liabilities 1,882 944 9
Total current liabilities 5,040 3,941 3,273
Total equity and liabilities 14,823 13,662 13,115
Unaudited Quarterly Report | Q3 2021
17
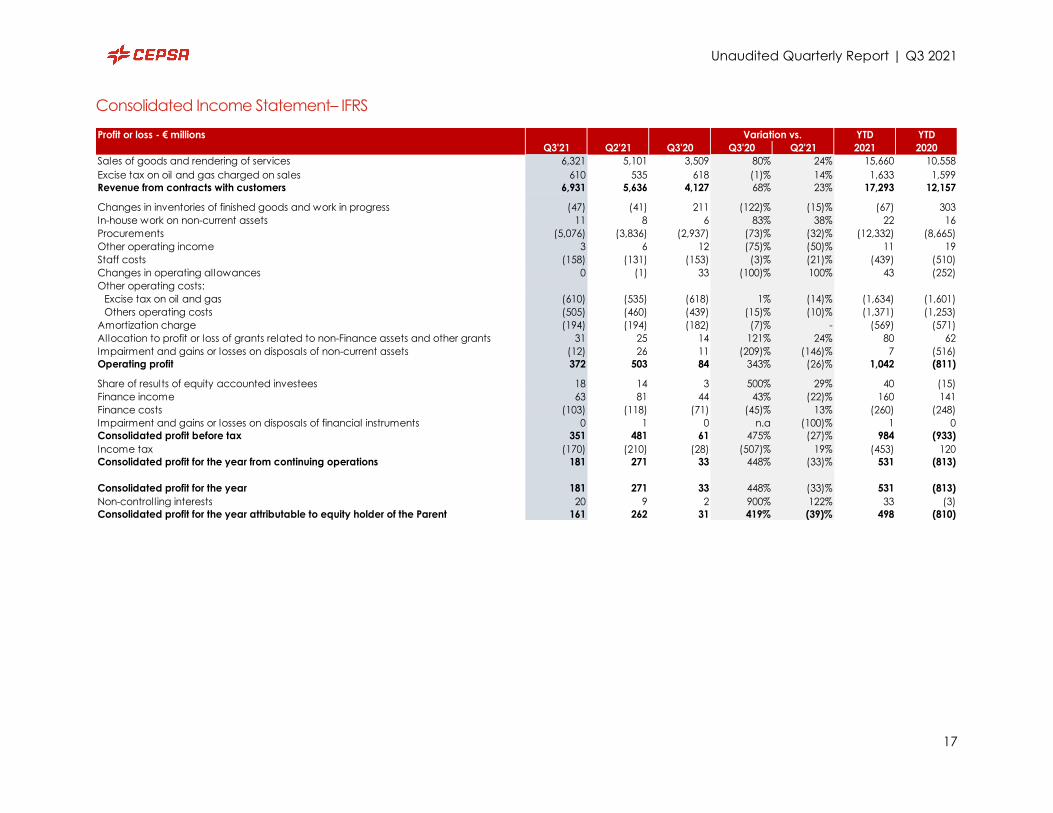
Consolidated Income Statement– IFRS
Profit or loss - € millions Variation vs. YTD YTD
Q3'21 Q2'21 Q3'20 Q3'20 Q2'21 2021 2020
Sales of goods and rendering of services 6,321 5,101 3,509 80% 24% 15,660 10,558
Excise tax on oil and gas charged on sales 610 535 618 (1)% 14% 1,633 1,599
Revenue from contracts with customers 6,931 5,636 4,127 68% 23% 17,293 12,157
Changes in inventories of finished goods and work in progress (47) (41) 211 (122)% (15)% (67) 303
In-house work on non-current assets 11 8 6 83% 38% 22 16
Procurements (5,076) (3,836) (2,937) (73)% (32)% (12,332) (8,665)
Other operating income 3 6 12 (75)% (50)% 11 19
Staff costs (158) (131) (153) (3)% (21)% (439) (510)
Changes in operating allowances 0 (1) 33 (100)% 100% 43 (252)
Other operating costs:
Excise tax on oil and gas (610) (535) (618) 1% (14)% (1,634) (1,601)
Others operating costs (505) (460) (439) (15)% (10)% (1,371) (1,253)
Amortization charge (194) (194) (182) (7)% - (569) (571)
Allocation to profit or loss of grants related to non-Finance assets and other grants 31 25 14 121% 24% 80 62
Impairment and gains or losses on disposals of non-current assets (12) 26 11 (209)% (146)% 7 (516)
Operating profit 372 503 84 343% (26)% 1,042 (811)
Share of results of equity accounted investees 18 14 3 500% 29% 40 (15)
Finance income 63 81 44 43% (22)% 160 141
Finance costs (103) (118) (71) (45)% 13% (260) (248)
Impairment and gains or losses on disposals of financial instruments 0 1 0 n.a (100)% 1 0
Consolidated profit before tax 351 481 61 475% (27)% 984 (933)
Income tax (170) (210) (28) (507)% 19% (453) 120
Consolidated profit for the year from continuing operations 181 271 33 448% (33)% 531 (813)
Consolidated profit for the year 181 271 33 448% (33)% 531 (813)
Non-controlling interests 20 9 2 900% 122% 33 (3)
Consolidated profit for the year attributable to equity holder of the Parent 161 262 31 419% (39)% 498 (810)
Unaudited Quarterly Report | Q3 2021
All figures reported on a Clean CCS basis, unless otherwise stated. 18
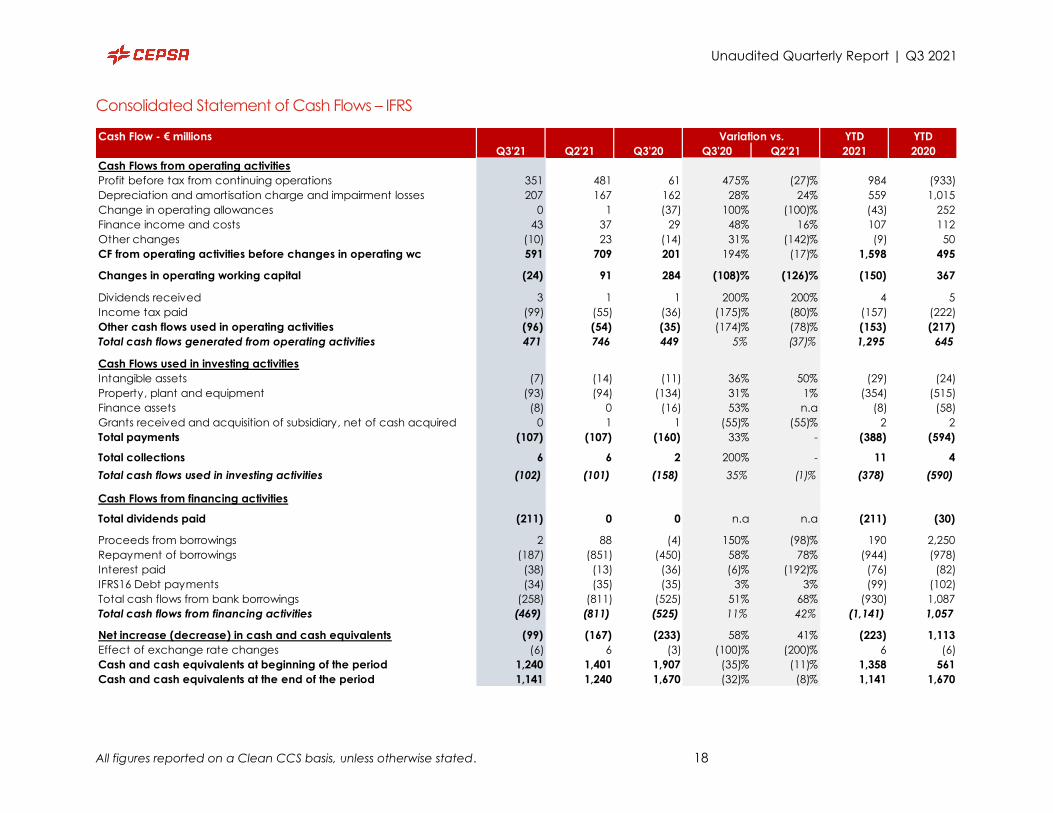
Consolidated Statement of Cash Flows – IFRS
Cash Flow - € millions Variation vs. YTD YTD
Q3'21 Q2'21 Q3'20 Q3'20 Q2'21 2021 2020
Cash Flows from operating activities
Profit before tax from continuing operations 351 481 61 475% (27)% 984 (933)
Depreciation and amortisation charge and impairment losses 207 167 162 28% 24% 559 1,015
Change in operating allowances 0 1 (37) 100% (100)% (43) 252
Finance income and costs 43 37 29 48% 16% 107 112
Other changes (10) 23 (14) 31% (142)% (9) 50
CF from operating activities before changes in operating wc 591 709 201 194% (17)% 1,598 495
Changes in operating working capital (24) 91 284 (108)% (126)% (150) 367
Dividends received 3 1 1 200% 200% 4 5
Income tax paid (99) (55) (36) (175)% (80)% (157) (222)
Other cash flows used in operating activities (96) (54) (35) (174)% (78)% (153) (217)
Total cash flows generated from operating activities 471 746 449 5% (37)% 1,295 645
Cash Flows used in investing activities
Intangible assets (7) (14) (11) 36% 50% (29) (24)
Property, plant and equipment (93) (94) (134) 31% 1% (354) (515)
Finance assets (8) 0 (16) 53% n.a (8) (58)
Grants received and acquisition of subsidiary, net of cash acquired 0 1 1 (55)% (55)% 2 2
Total payments (107) (107) (160) 33% - (388) (594)
Total collections 6 6 2 200% - 11 4
Total cash flows used in investing activities (102) (101) (158) 35% (1)% (378) (590)
Cash Flows from financing activities
Total dividends paid (211) 0 0 n.a n.a (211) (30)
Proceeds from borrowings 2 88 (4) 150% (98)% 190 2,250
Repayment of borrowings (187) (851) (450) 58% 78% (944) (978)
Interest paid (38) (13) (36) (6)% (192)% (76) (82)
IFRS16 Debt payments (34) (35) (35) 3% 3% (99) (102)
Total cash flows from bank borrowings (258) (811) (525) 51% 68% (930) 1,087
Total cash flows from financing activities (469) (811) (525) 11% 42% (1,141) 1,057
Net increase (decrease) in cash and cash equivalents (99) (167) (233) 58% 41% (223) 1,113
Effect of exchange rate changes (6) 6 (3) (100)% (200)% 6 (6)
Cash and cash equivalents at beginning of the period 1,240 1,401 1,907 (35)% (11)% 1,358 561
Cash and cash equivalents at the end of the period 1,141 1,240 1,670 (32)% (8)% 1,141 1,670
Unaudited Quarterly Report | Q3 2021
19
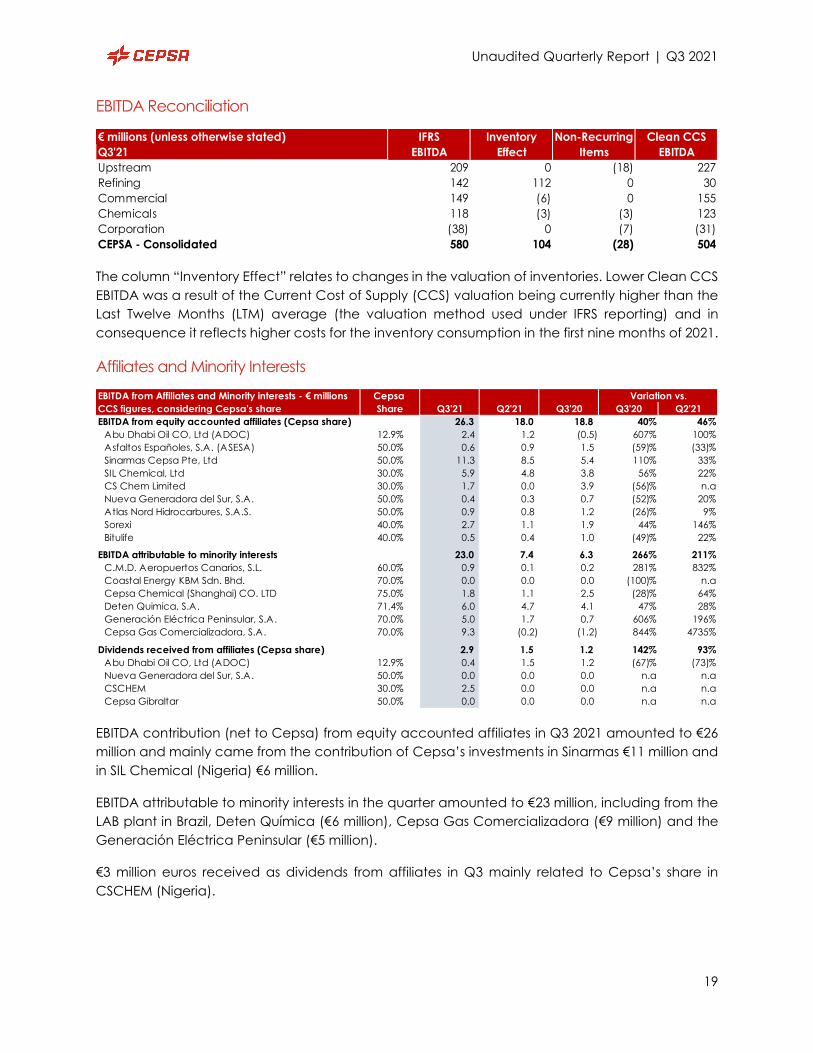
EBITDA Reconciliation
€ millions (unless otherwise stated) IFRS Inventory Non-Recurring Clean CCS
Q3'21 EBITDA Effect Items EBITDA
Upstream 209 0 (18) 227
Refining 142 112 0 30
Commercial 149 (6) 0 155
Chemicals 118 (3) (3) 123
Corporation (38) 0 (7) (31)
CEPSA - Consolidated 580 104 (28) 504
The column “Inventory Effect” relates to changes in the valuation of inventories. Lower Clean CCS
EBITDA was a result of the Current Cost of Supply (CCS) valuation being currently higher than the
Last Twelve Months (LTM) average (the valuation method used under IFRS reporting) and in
consequence it reflects higher costs for the inventory consumption in the first nine months of 2021.
Affiliates and Minority Interests
EBITDA contribution (net to Cepsa) from equity accounted affiliates in Q3 2021 amounted to €26
million and mainly came from the contribution of Cepsa’s investments in Sinarmas €11 million and
in SIL Chemical (Nigeria) €6 million.
EBITDA attributable to minority interests in the quarter amounted to €23 million, including from the
LAB plant in Brazil, Deten Química (€6 million), Cepsa Gas Comercializadora (€9 million) and the
Generación Eléctrica Peninsular (€5 million).
€3 million euros received as dividends from affiliates in Q3 mainly related to Cepsa’s share in
CSCHEM (Nigeria).
EBITDA from Affiliates and Minority interests - € millions Cepsa Variation vs.
CCS figures, considering Cepsa's share Share Q3'21 Q2'21 Q3'20 Q3'20 Q2'21
EBITDA from equity accounted affiliates (Cepsa share) 26.3 18.0 18.8 40% 46%
Abu Dhabi Oil CO, Ltd (ADOC) 12.9% 2.4 1.2 (0.5) 607% 100%
Asfaltos Españoles, S.A. (ASESA) 50.0% 0.6 0.9 1.5 (59)% (33)%
Sinarmas Cepsa Pte, Ltd 50.0% 11.3 8.5 5.4 110% 33%
SIL Chemical, Ltd 30.0% 5.9 4.8 3.8 56% 22%
CS Chem Limited 30.0% 1.7 0.0 3.9 (56)% n.a
Nueva Generadora del Sur, S.A. 50.0% 0.4 0.3 0.7 (52)% 20%
Atlas Nord Hidrocarbures, S.A.S. 50.0% 0.9 0.8 1.2 (26)% 9%
Sorexi 40.0% 2.7 1.1 1.9 44% 146%
Bitulife 40.0% 0.5 0.4 1.0 (49)% 22%
EBITDA attributable to minority interests 23.0 7.4 6.3 266% 211%
C.M.D. Aeropuertos Canarios, S.L. 60.0% 0.9 0.1 0.2 281% 832%
Coastal Energy KBM Sdn. Bhd. 70.0% 0.0 0.0 0.0 (100)% n.a
Cepsa Chemical (Shanghai) CO. LTD 75.0% 1.8 1.1 2.5 (28)% 64%
Deten Quimica, S.A. 71.4% 6.0 4.7 4.1 47% 28%
Generación Eléctrica Peninsular, S.A. 70.0% 5.0 1.7 0.7 606% 196%
Cepsa Gas Comercializadora, S.A. 70.0% 9.3 (0.2) (1.2) 844% 4735%
Dividends received from affiliates (Cepsa share) 2.9 1.5 1.2 142% 93%
Abu Dhabi Oil CO, Ltd (ADOC) 12.9% 0.4 1.5 1.2 (67)% (73)%
Nueva Generadora del Sur, S.A. 50.0% 0.0 0.0 0.0 n.a n.a
CSCHEM 30.0% 2.5 0.0 0.0 n.a n.a
Cepsa Gibraltar 50.0% 0.0 0.0 0.0 n.a n.a
Unaudited Quarterly Report | Q3 2021
All figures reported on a Clean CCS basis, unless otherwise stated. 20
Basis of Preparation
This report is based on the unaudited consolidated financial statements of Compañía Española
de Petróleos S.A. (CEPSA, or the Company), prepared in accordance with the International
Financial Reporting Standards (IFRS) issued by the International Accounting Standards Board
(IASB) and with all the interpretations issued by the International Financial Reporting Interpretations
Committee (IFRIC) of the IASB applicable at the date of closing provided that they have been
endorsed at that date by the European Union, with the exception of those applied in advance, if
any. For any matter of interpretation over the applied rule, please take the reference of the last
Audited Cepsa Group Consolidated Financial Statements, as publicly available on
https://www.cepsa.com/en/investors.
For a better Management Discussion & Analysis and consistent with industry practice, the IFRS Profit
& Loss Statement is adjusted as follows to obtain a CCS Profit & Loss Statement:
1) Inventories: IFRS Cepsa Group Consolidated P&L measures crude oil, oil derivatives and
petrochemical products, acquired as raw materials, at the lower of historical weighted average
cost (12 months) and net realizable value.
For the MD&A, we consider the replacement cost presents a more accurate view of the current
operations, considering therefore the stock variation in P&L at Current Cost of Supply (CCS), which
values the manufacturing consumption at the month´s average cost. The adjustment necessarily
eliminates also the crude & products hedging valuation and the inventories impairment, if any.
2) Clean adjustments: Those income or costs that are not directly related to the Group activities
are considered as non-recurring items and, therefore, excluded. Generally, these are incomes or
costs that occur atypically, are of a material amount and with minimal probability of recurrence.
Regarding the KPIs presented, for a better comprehension and to allow the accurate calculation
of different ratios, figures are always consolidated and adjusted to the associated financials by:
a) Elimination of intercompany transactions.
b) Considering JVs as third parties: As their financial information is only presented in the Equity
Method line and no Capital Employed is incorporated apart from the Financial Investment,
we also do not consider any contribution to the Group’s KPIs, with the sole exception of
the Reserves and Production of the Upstream JVs (Cosmo Abu Dhabi at the date of
issuance of this report), which are added to the BU KPIs following the Reserves Audit
criteria.