Embed Size (px)
Citation preview
Q1 2012
Q1 2012 1

To get back,
Agenda
Q1 highlights
Online classifieds
Media houses
Income statement and Financials
Schibsted Sverige
Outlook
2
Q1 2012
To get back,
Turn off ’CLASSIFICED’ via
2. Deactivate by clicking off the
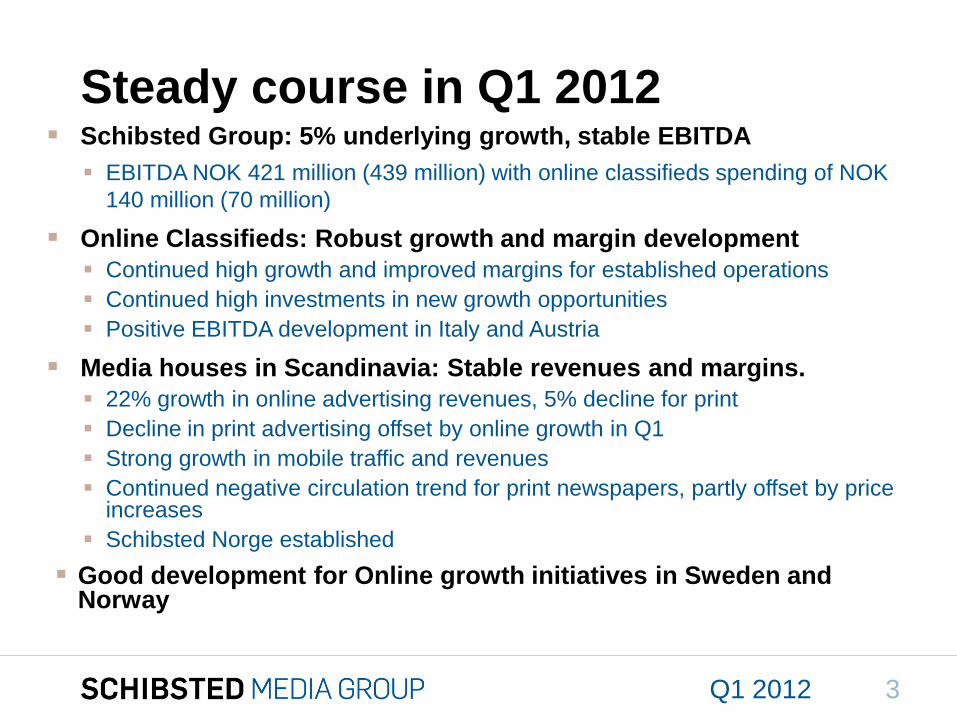
Schibsted Group: 5% underlying growth, stable EBITDA
EBITDA NOK 421 million (439 million) with online classifieds spending of NOK
140 million (70 million)
Online Classifieds: Robust growth and margin development
Continued high growth and improved margins for established operations
Continued high investments in new growth opportunities
Positive EBITDA development in Italy and Austria
Media houses in Scandinavia: Stable revenues and margins.
22% growth in online advertising revenues, 5% decline for print
Decline in print advertising offset by online growth in Q1
Strong growth in mobile traffic and revenues
Continued negative circulation trend for print newspapers, partly offset by price increases
Schibsted Norge established
Good development for Online growth initiatives in Sweden and Norway
Steady course in Q1 2012
Q1 2012 3
To get back,
Turn off ’CLASSIFICED’ via
2. Deactivate by clicking off the
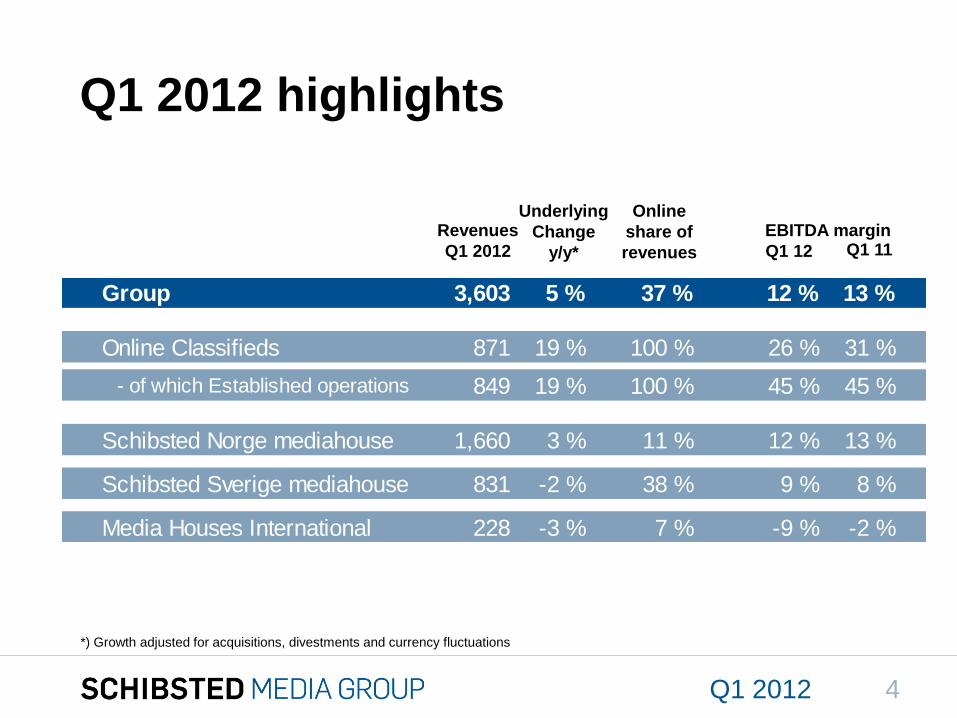
Q1 2012 highlights
Revenues
Q1 2012
EBITDA margin
Q1 12 Q1 11
Underlying
Change
y/y*
*) Growth adjusted for acquisitions, divestments and currency fluctuations
Q1 2012
Online
share of
revenues
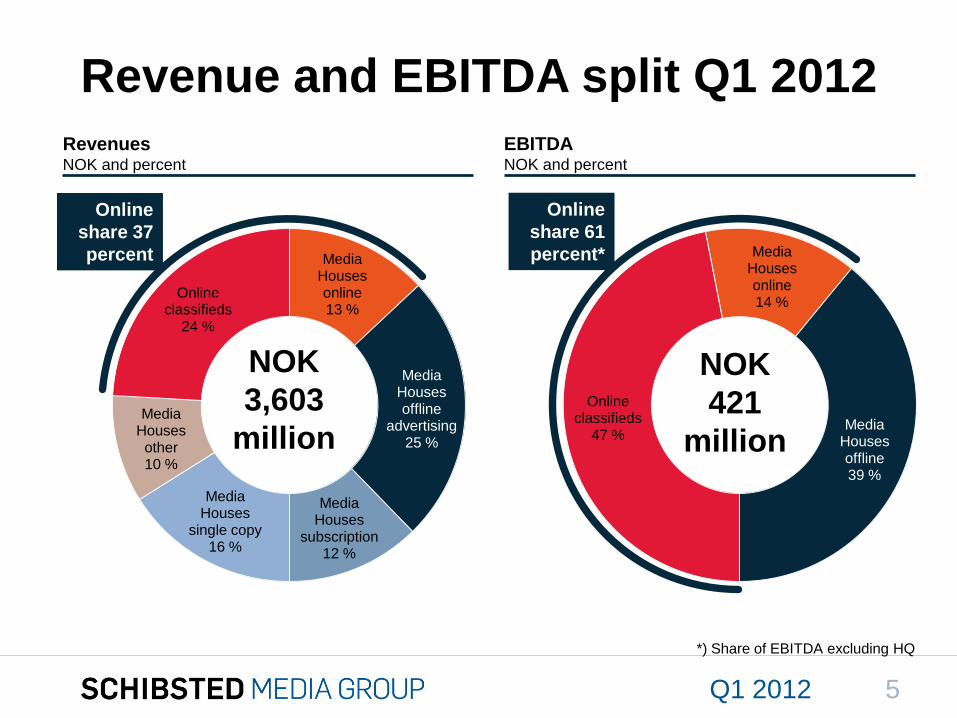
Group 3,603 5 % 37 % 12 % 13 %
Online Classifieds 871 19 % 100 % 26 % 31 %
- of which Established operations 849 19 % 100 % 45 % 45 %
Schibsted Norge mediahouse 1,660 3 % 11 % 12 % 13 %
Schibsted Sverige mediahouse 831 -2 % 38 % 9 % 8 %
Media Houses International 228 -3 % 7 % -9 % -2 %
4
To get back,
Turn off ’CLASSIFICED’ via
2. Deactivate by clicking off the
Media Houses online13 %
Media Houses offline
advertising25 %
Media Houses
subscription12 %
Media Houses
single copy16 %
Media Houses other10 %
Online classifieds
24 %
Online classifieds
47 %
Media Houses online14 %
Media Houses offline39 %
Revenue and EBITDA split Q1 2012
*) Share of EBITDA excluding HQ
Online
share 61
percent*
Online
share 37
percent
RevenuesNOK and percent
EBITDANOK and percent
NOK
3,603
million
NOK
421
million
Q1 2012 5
To get back,
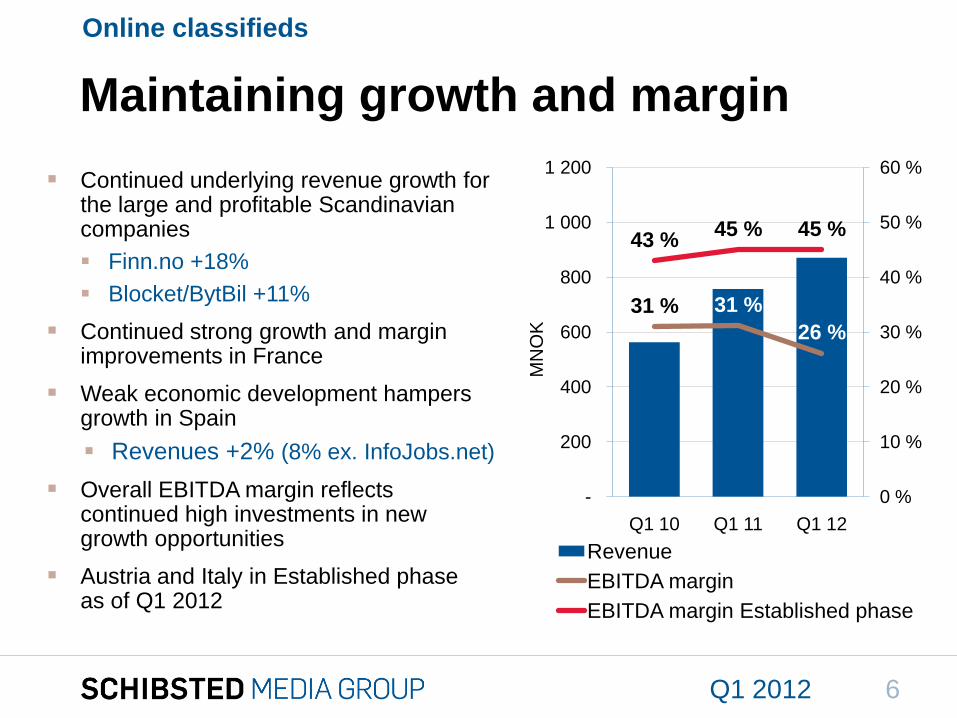
Maintaining growth and margin
Continued underlying revenue growth for the large and profitable Scandinavian companies
Finn.no +18%
Blocket/BytBil +11%
Continued strong growth and margin improvements in France
Weak economic development hampers growth in Spain
Revenues +2% (8% ex. InfoJobs.net)
Overall EBITDA margin reflects continued high investments in new growth opportunities
Austria and Italy in Established phase as of Q1 2012
Online classifieds
Q1 2012
MN
OK
31 % 31 %
26 %
43 %45 % 45 %
0 %
10 %
20 %
30 %
40 %
50 %
60 %
-
200
400
600
800
1 000
1 200
Q1 10 Q1 11 Q1 12
Revenue
EBITDA margin
EBITDA margin Established phase
6
To get back,
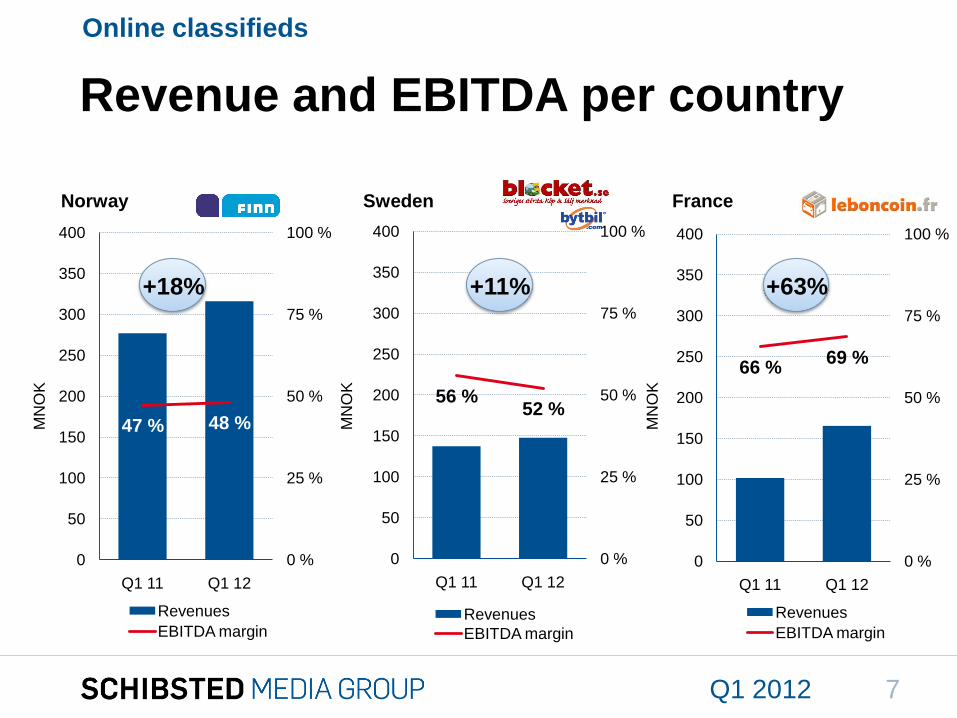
47 % 48 %
0 %
25 %
50 %
75 %
100 %
0
50
100
150
200
250
300
350
400
Q1 11 Q1 12
Revenues
EBITDA margin
56 %52 %
0 %
25 %
50 %
75 %
100 %
0
50
100
150
200
250
300
350
400
Q1 11 Q1 12
Revenues
EBITDA margin
66 %69 %
0 %
25 %
50 %
75 %
100 %
0
50
100
150
200
250
300
350
400
Q1 11 Q1 12
Revenues
EBITDA margin
Revenue and EBITDA per country
Online classifiedsM
NO
K
MN
OK
MN
OK
Norway Sweden France
Q1 2012
+18% +11% +63%
7
To get back,
Focus on product development and price optimization
Q1 2012
Online classifieds
8
To get back,
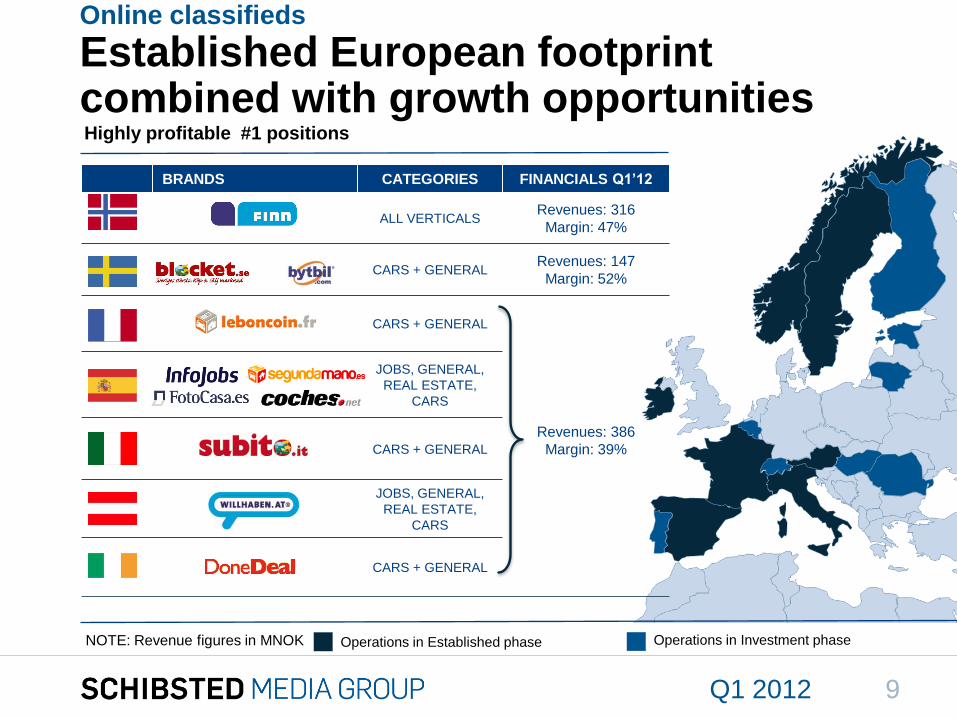
BRANDS CATEGORIES FINANCIALS Q1’12
ALL VERTICALSRevenues: 316
Margin: 47%
CARS + GENERALRevenues: 147
Margin: 52%
CARS + GENERAL
JOBS, GENERAL,
REAL ESTATE,
CARS
CARS + GENERAL
Revenues: 386
Margin: 39%
JOBS, GENERAL,
REAL ESTATE,
CARS
CARS + GENERAL
Online classifieds
Established European footprint combined with growth opportunitiesHighly profitable #1 positions
NOTE: Revenue figures in MNOK Operations in Established phase Operations in Investment phase
Q1 2012 9
To get back,
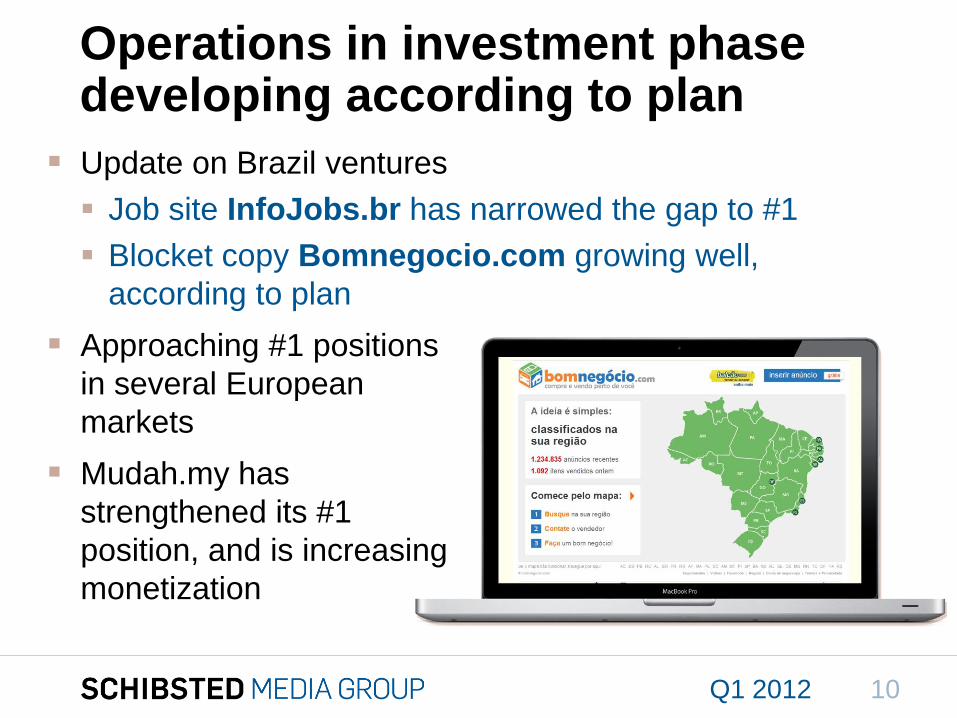
Operations in investment phasedeveloping according to plan
Update on Brazil ventures
Job site InfoJobs.br has narrowed the gap to #1
Blocket copy Bomnegocio.com growing well,
according to plan
Approaching #1 positions
in several European
markets
Mudah.my has
strengthened its #1
position, and is increasing
monetization
Q1 2012 10
To get back,
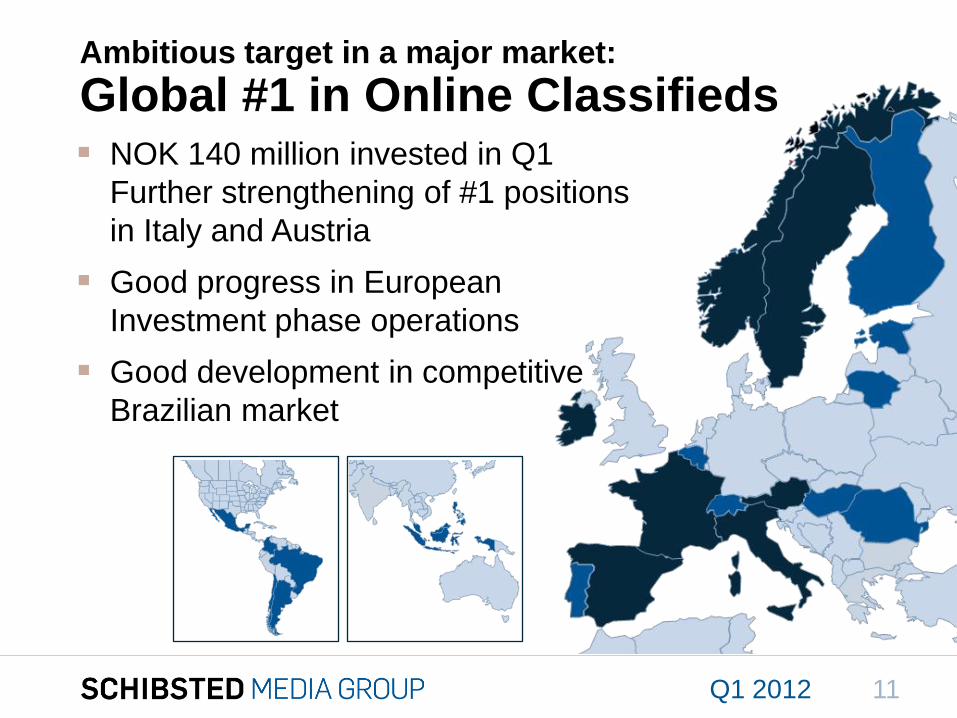
Ambitious target in a major market:
Global #1 in Online Classifieds
Q1 2012
NOK 140 million invested in Q1
Further strengthening of #1 positions
in Italy and Austria
Good progress in European
Investment phase operations
Good development in competitive
Brazilian market
11
Media houses
Q1 2012 12
To get back,
Turn off ’CLASSIFICED’ via
2. Deactivate by clicking off the
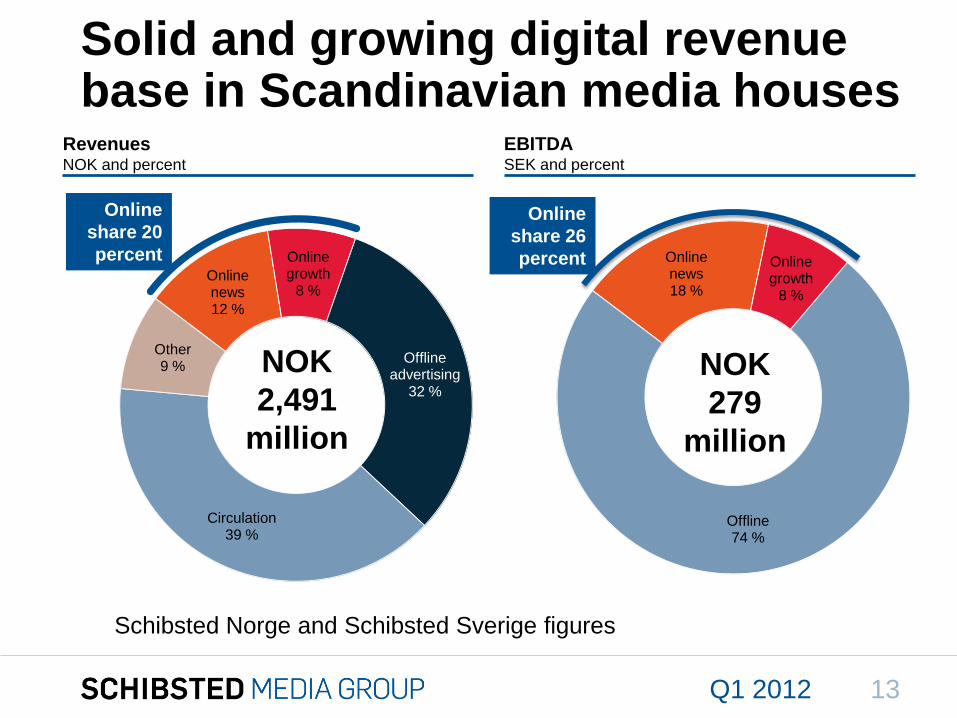
Online news18 %
Online growth
8 %
Offline74 %
NOK
2,491
million
Solid and growing digital revenue base in Scandinavian media houses
RevenuesNOK and percent
EBITDASEK and percent
NOK
279
million
Q1 2012
Online
share 26
percent
Online
share 20
percentOnline news12 %
Online growth
8 %
Offline advertising
32 %
Circulation39 %
Other9 %
Schibsted Norge and Schibsted Sverige figures
13
To get back,
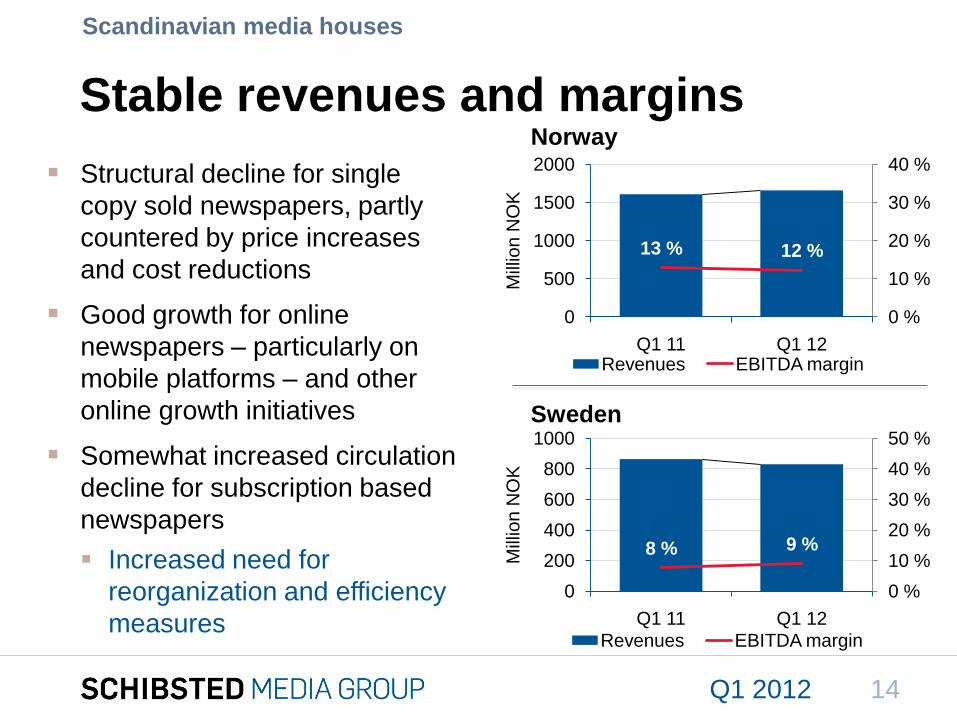
13 % 12 %
0 %
10 %
20 %
30 %
40 %
0
500
1000
1500
2000
Q1 11 Q1 12
Mill
ion
NO
K
Revenues EBITDA margin
Stable revenues and margins
Structural decline for single
copy sold newspapers, partly
countered by price increases
and cost reductions
Good growth for online
newspapers – particularly on
mobile platforms – and other
online growth initiatives
Somewhat increased circulation
decline for subscription based
newspapers
Increased need for
reorganization and efficiency
measures
Q1 2012
Norway
Sweden
8 % 9 %
0 %
10 %
20 %
30 %
40 %
50 %
0
200
400
600
800
1000
Q1 11 Q1 12
Mill
ion
NO
K
Revenues EBITDA margin
14
Scandinavian media houses
To get back,
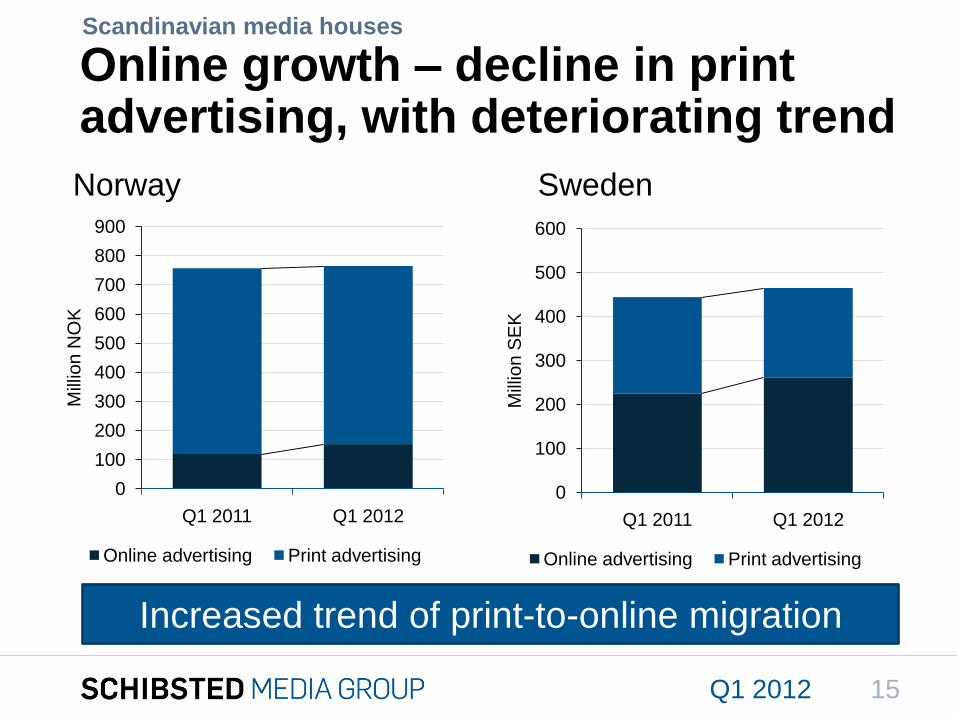
Online growth – decline in print advertising, with deteriorating trend
Q1 2012
Scandinavian media houses
SwedenNorway
Increased trend of print-to-online migration
0
100
200
300
400
500
600
700
800
900
Q1 2011 Q1 2012
Mill
ion
NO
K
Online advertising Print advertising
0
100
200
300
400
500
600
Q1 2011 Q1 2012M
illio
n S
EK
Online advertising Print advertising
15
To get back,
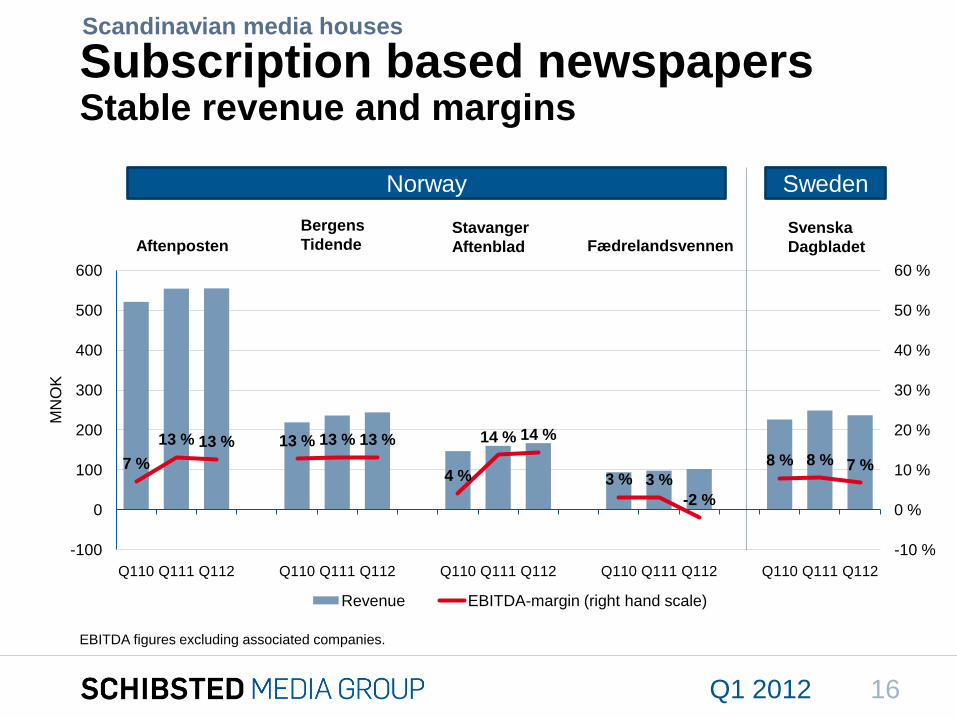
Subscription based newspapers Stable revenue and margins
Q1 2012
Aftenposten
Bergens
TidendeStavanger
Aftenblad FædrelandsvennenSvenska
Dagbladet
EBITDA figures excluding associated companies.
Norway Sweden
7 %
13 % 13 % 13 % 13 % 13 %
4 %
14 % 14 %
3 % 3 %
-2 %
8 % 8 % 7 %
-10 %
0 %
10 %
20 %
30 %
40 %
50 %
60 %
-100
0
100
200
300
400
500
600
Q110 Q111 Q112 Q110 Q111 Q112 Q110 Q111 Q112 Q110 Q111 Q112 Q110 Q111 Q112
MN
OK
Revenue EBITDA-margin (right hand scale)
16
Scandinavian media houses
To get back,
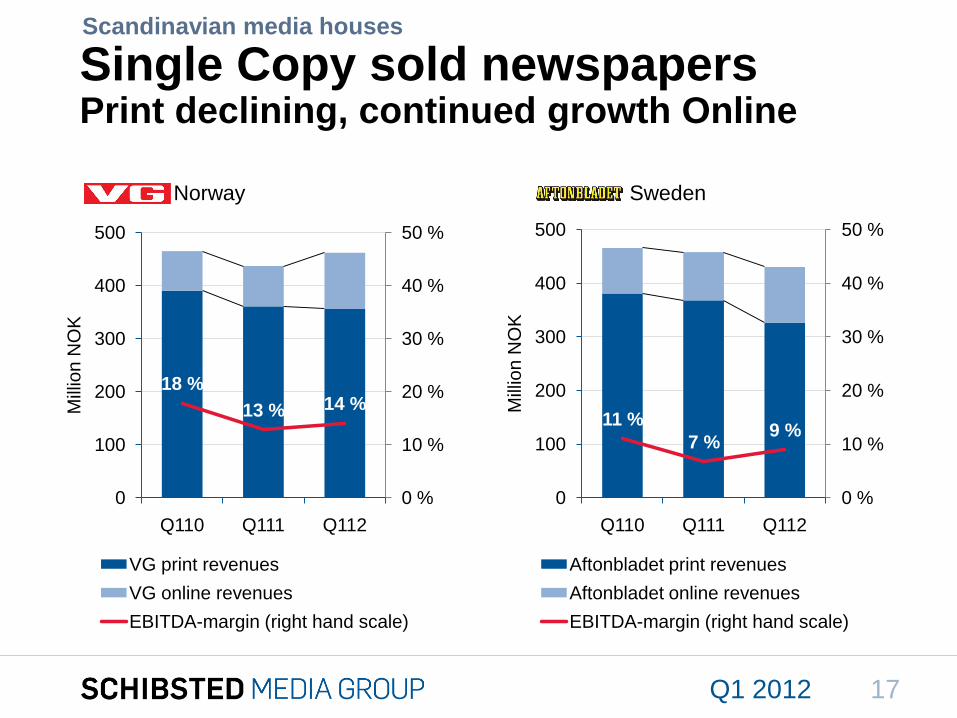
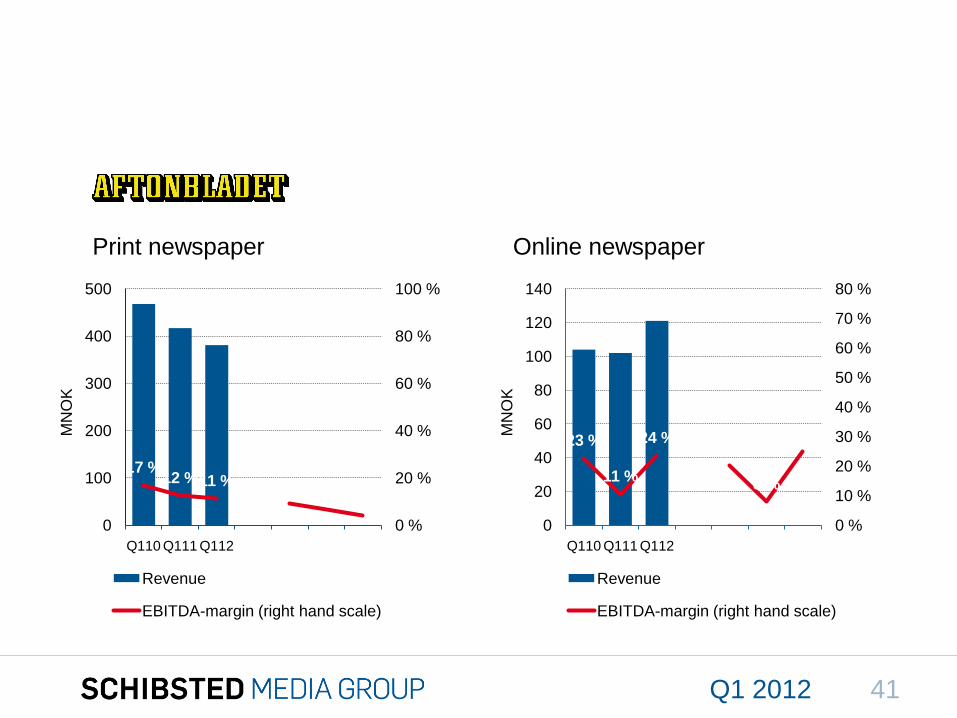
Single Copy sold newspapersPrint declining, continued growth Online
Q1 2012
Norway Sweden
11 %
7 %9 %
0 %
10 %
20 %
30 %
40 %
50 %
0
100
200
300
400
500
Q110 Q111 Q112M
illio
n N
OK
Aftonbladet print revenues
Aftonbladet online revenues
EBITDA-margin (right hand scale)
18 %
13 % 14 %
0 %
10 %
20 %
30 %
40 %
50 %
0
100
200
300
400
500
Q110 Q111 Q112
Mill
ion
NO
K
VG print revenues
VG online revenues
EBITDA-margin (right hand scale)
17
Scandinavian media houses
To get back,
Turn off ’CLASSIFICED’ via
2. Deactivate by clicking off the
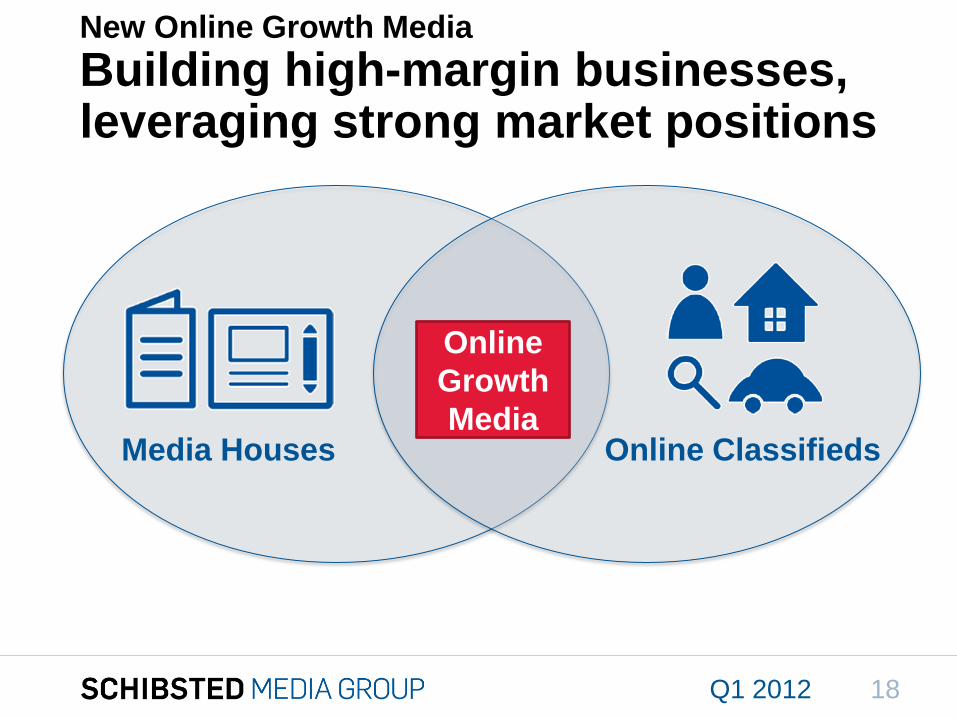
New Online Growth Media
Building high-margin businesses, leveraging strong market positions
Media Houses Online Classifieds
Online
Growth
Media
Q1 2012 18
To get back,
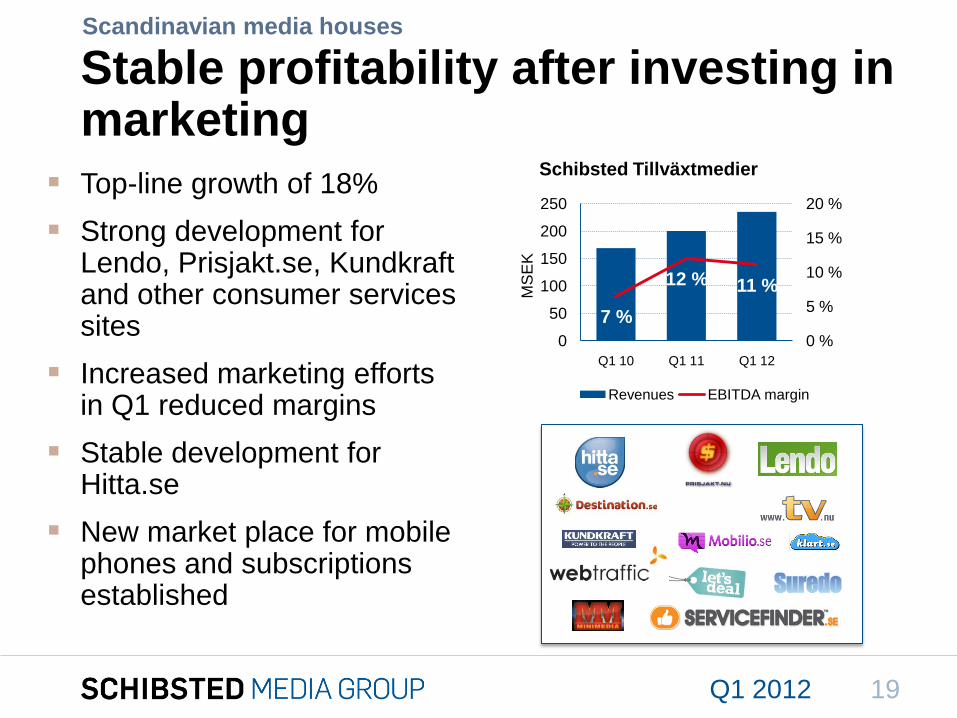
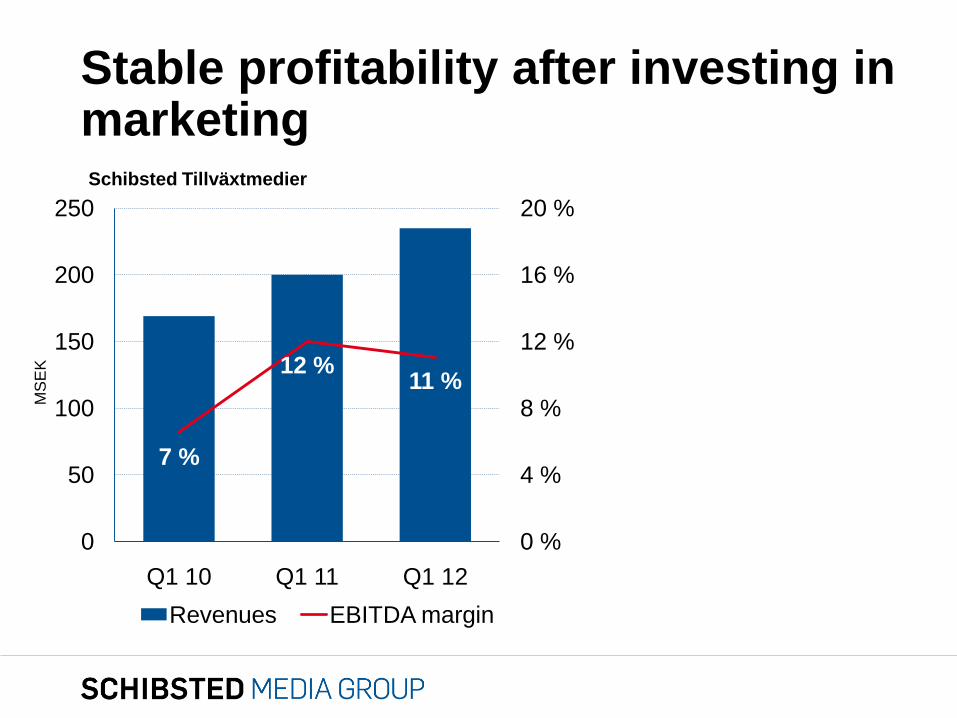
Stable profitability after investing in marketing
Top-line growth of 18%
Strong development for Lendo, Prisjakt.se, Kundkraftand other consumer services sites
Increased marketing efforts in Q1 reduced margins
Stable development for Hitta.se
New market place for mobile phones and subscriptions established
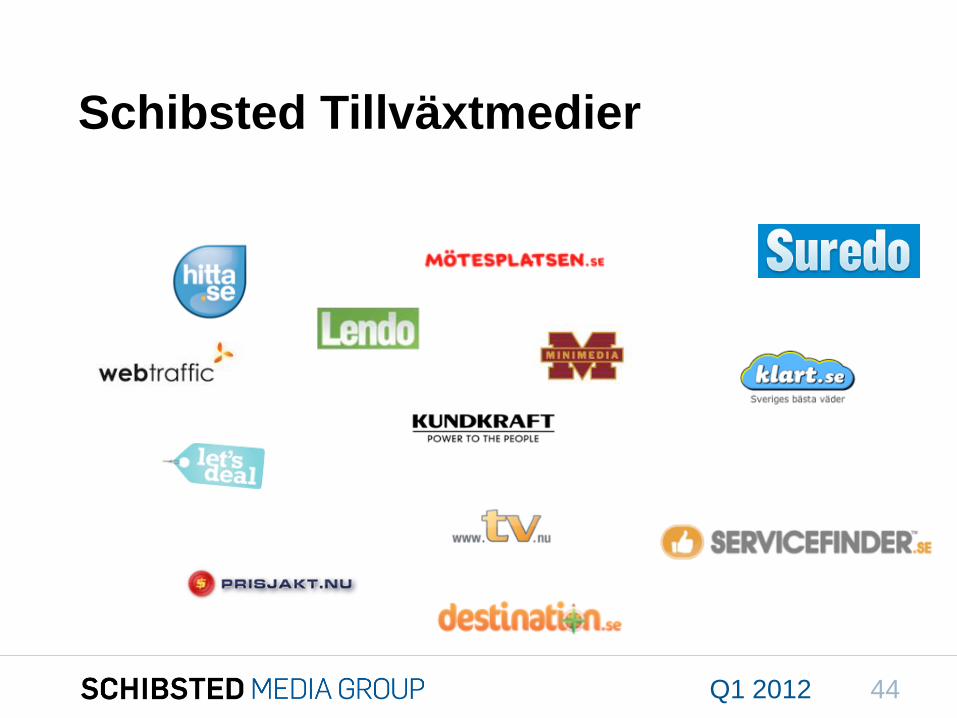
Schibsted Tillväxtmedier
MS
EK
Q1 2012
7 %
12 % 11 %
0 %
5 %
10 %
15 %
20 %
0
50
100
150
200
250
Q1 10 Q1 11 Q1 12
Revenues EBITDA margin
19
Scandinavian media houses
Financials
Q1 2012 20
To get back,
Turn off ’CLASSIFICED’ via
2. Deactivate by clicking off the
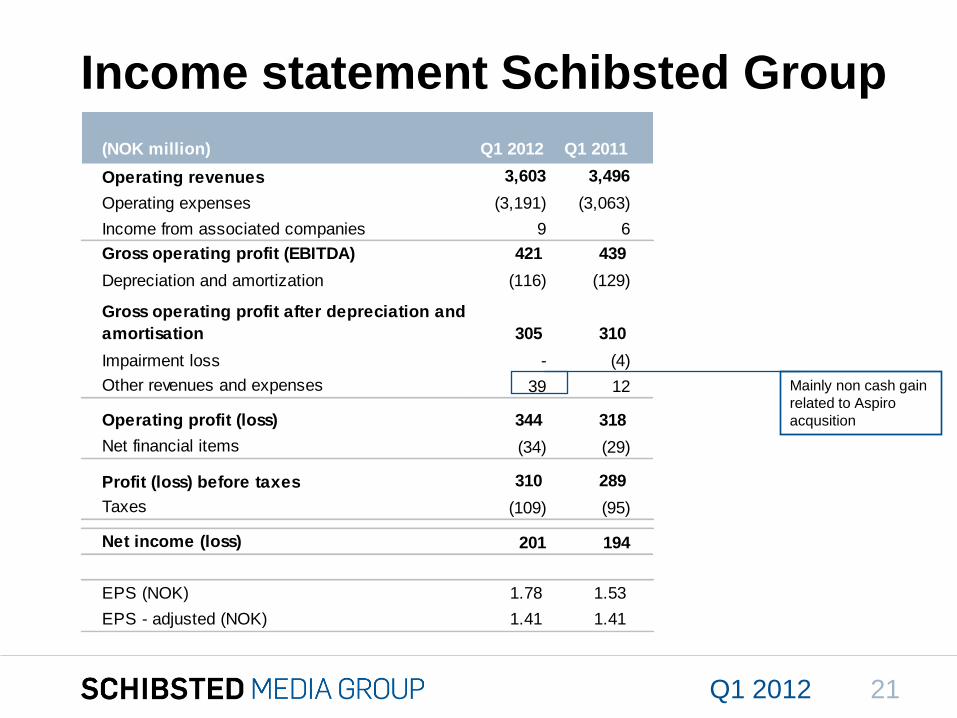
Income statement Schibsted Group
Q1 2012
Mainly non cash gain
related to Aspiro
acqusition
(NOK million) Q1 2012 Q1 2011
Operating revenues 3,603 3,496
Operating expenses (3,191) (3,063)
Income from associated companies 9 6
Gross operating profit (EBITDA) 421 439
Depreciation and amortization (116) (129)
Gross operating profit after depreciation and
amortisation 305 310
Impairment loss - (4)
Other revenues and expenses 39 12
Operating profit (loss) 344 318
Net financial items (34) (29)
Profit (loss) before taxes 310 289
Taxes (109) (95)
Net income (loss) 201 194
EPS (NOK) 1.78 1.53
EPS - adjusted (NOK) 1.41 1.41
21
To get back,
Turn off ’CLASSIFICED’ via
2. Deactivate by clicking off the
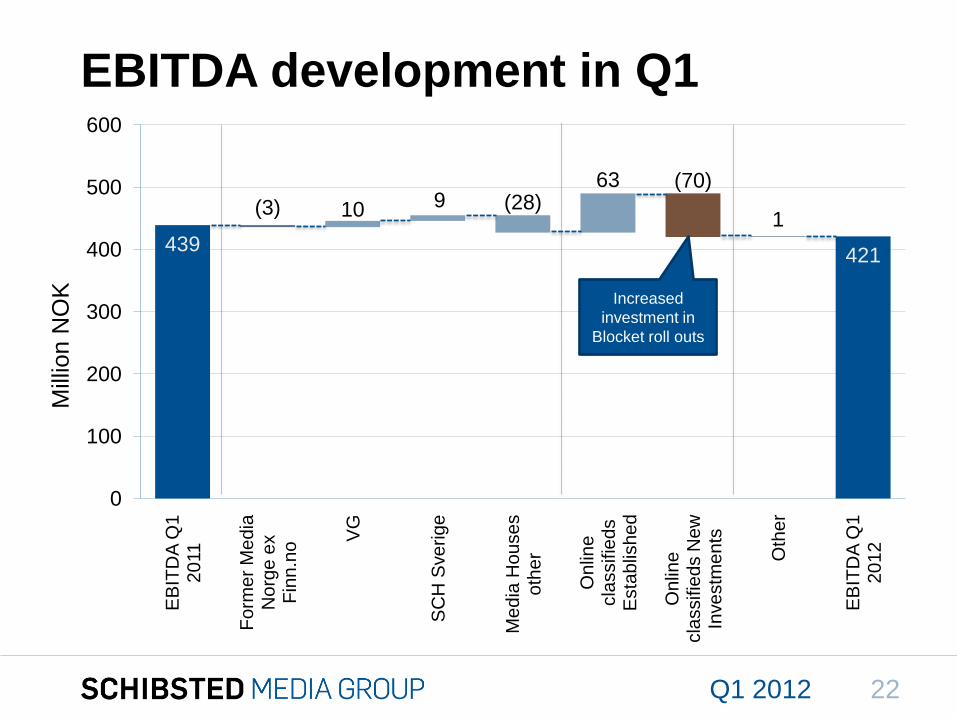
439421
(3) 10 9 (28)63 (70)
1
0
100
200
300
400
500
600
EB
ITD
A Q
1
20
11
Form
er
Media
N
org
e e
x
Fin
n.n
o
VG
SC
H S
ve
rig
e
Me
dia
Ho
use
s
oth
er
On
line
cla
ssifie
ds
Esta
blis
he
d
Onlin
e
cla
ssifie
ds N
ew
In
ve
stm
en
ts
Oth
er
EB
ITD
A Q
1
2012
EBITDA development in Q1M
illio
n N
OK Increased
investment in
Blocket roll outs
Q1 2012 22
To get back,
Turn off ’CLASSIFICED’ via
2. Deactivate by clicking off the
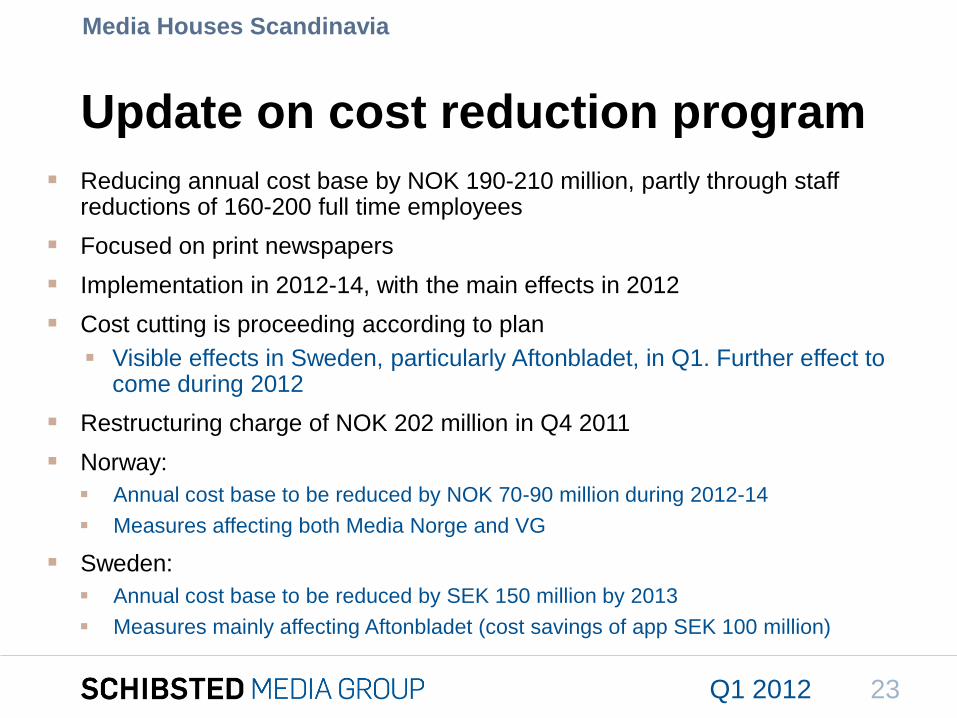
Reducing annual cost base by NOK 190-210 million, partly through staff reductions of 160-200 full time employees
Focused on print newspapers
Implementation in 2012-14, with the main effects in 2012
Cost cutting is proceeding according to plan
Visible effects in Sweden, particularly Aftonbladet, in Q1. Further effect to come during 2012
Restructuring charge of NOK 202 million in Q4 2011
Norway:
Annual cost base to be reduced by NOK 70-90 million during 2012-14
Measures affecting both Media Norge and VG
Sweden:
Annual cost base to be reduced by SEK 150 million by 2013
Measures mainly affecting Aftonbladet (cost savings of app SEK 100 million)
Update on cost reduction program
Media Houses Scandinavia
Q1 2012 23
To get back,
Turn off ’CLASSIFICED’ via
2. Deactivate by clicking off the
Q1 2012
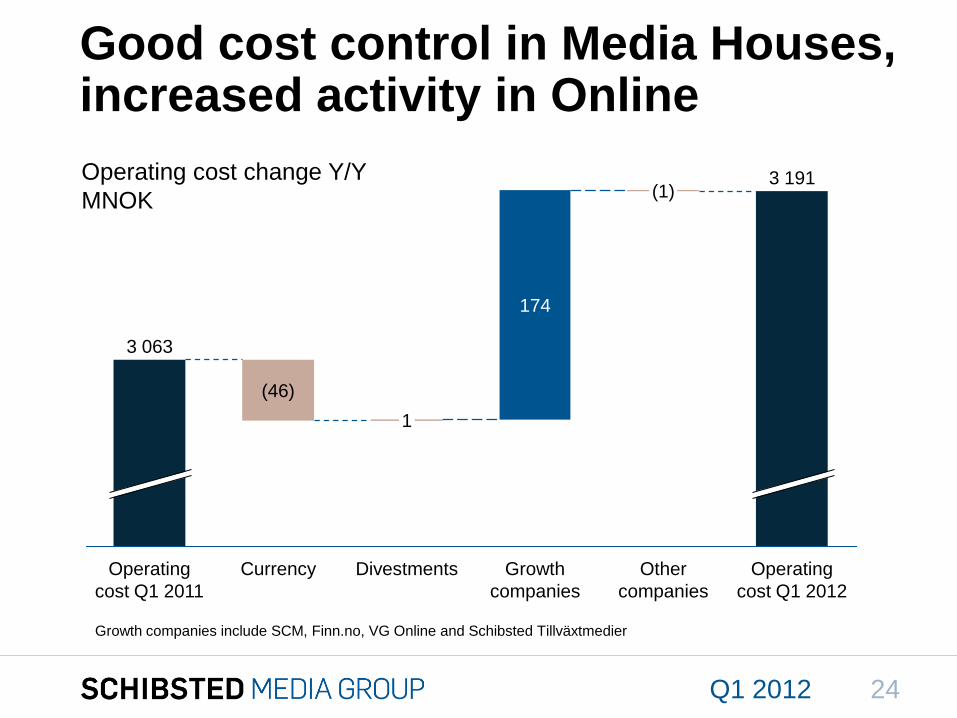
Good cost control in Media Houses, increased activity in Online
Growth
companies
Operating
cost Q1 2012
(1)3 191
Other
companies
1
Currency
174
Divestments
(46)
Operating
cost Q1 2011
3 063
Operating cost change Y/Y
MNOK
Growth companies include SCM, Finn.no, VG Online and Schibsted Tillväxtmedier
24
To get back,
Turn off ’CLASSIFICED’ via
2. Deactivate by clicking off the
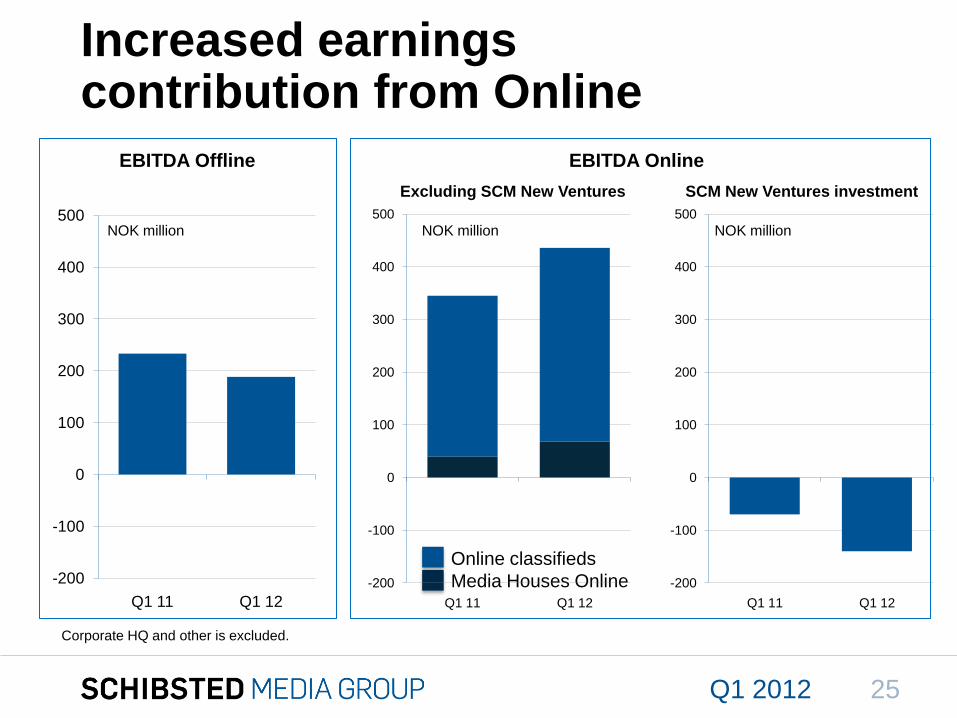
Increased earnings contribution from Online
EBITDA Offline EBITDA Online
Excluding SCM New Ventures SCM New Ventures investment
Q1 2012
Corporate HQ and other is excluded.
Online classifieds
Media Houses Online
NOK million NOK million NOK million
25
-200
-100
0
100
200
300
400
500
Q1 11 Q1 12
-200
-100
0
100
200
300
400
500
Q1 11 Q1 12
-200
-100
0
100
200
300
400
500
Q1 11 Q1 12
To get back,
Turn off ’CLASSIFICED’ via
2. Deactivate by clicking off the
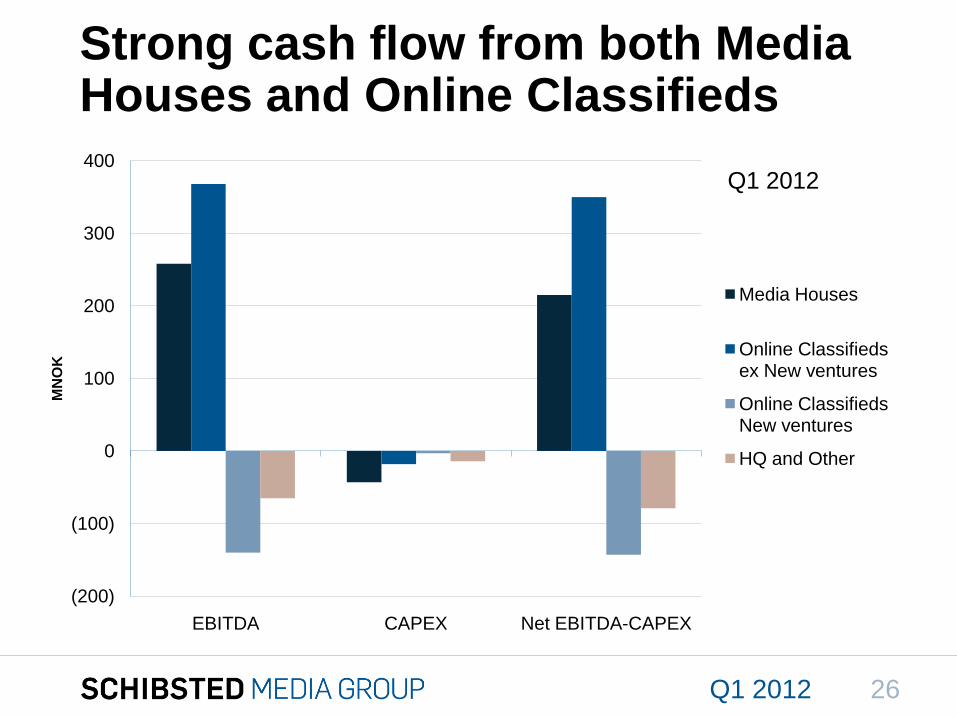
(200)
(100)
0
100
200
300
400
EBITDA CAPEX Net EBITDA-CAPEX
MN
OK
Media Houses
Online Classifieds ex New ventures
Online Classifieds New ventures
HQ and Other
Strong cash flow from both Media Houses and Online Classifieds
Q1 2012
Q1 2012 26
To get back,
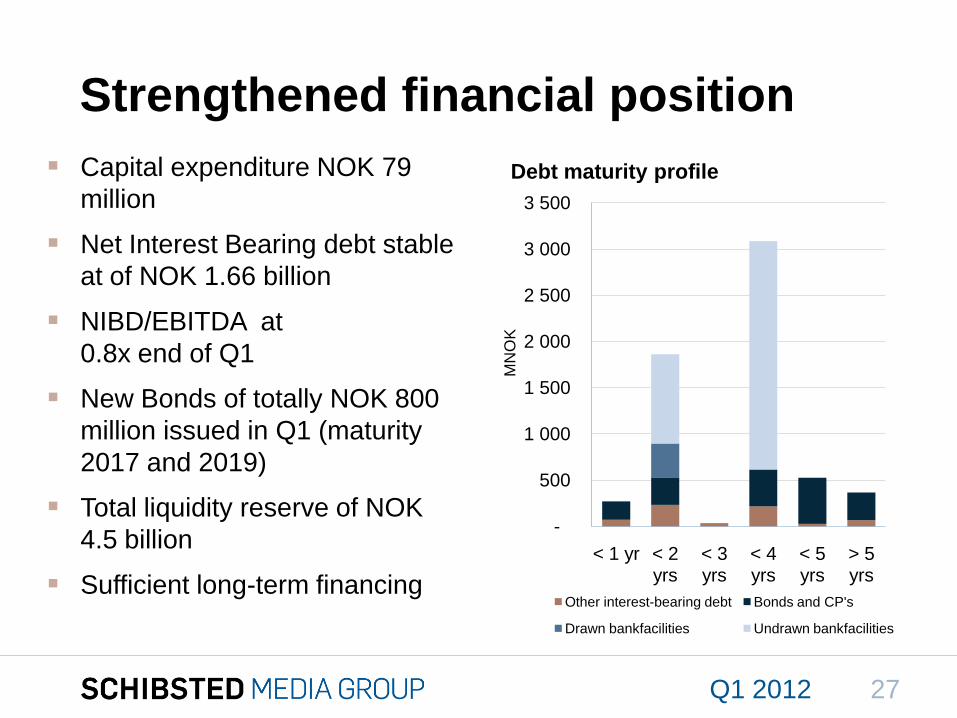
-
500
1 000
1 500
2 000
2 500
3 000
3 500
< 1 yr < 2 yrs
< 3 yrs
< 4 yrs
< 5 yrs
> 5 yrs
Other interest-bearing debt Bonds and CP's
Drawn bankfacilities Undrawn bankfacilities
Strengthened financial position
Capital expenditure NOK 79
million
Net Interest Bearing debt stable
at of NOK 1.66 billion
NIBD/EBITDA at
0.8x end of Q1
New Bonds of totally NOK 800
million issued in Q1 (maturity
2017 and 2019)
Total liquidity reserve of NOK
4.5 billion
Sufficient long-term financing
Q1 2012
Debt maturity profile
MN
OK
27
To get back,
New Business segments as of Q1 2012
Background: Alignment to our operating- and management structure
Schibsted Norge established, combining all Norwegian media house
activities
Hitta.se is now seen more as an integrated part of media Houses.
Directories not a part of our international expansion strategy
Main changes in operating segments:
Media Houses Scandinavia split in two:
Schibsted Norge and Schibsted Sverige
Hitta.se moved from Online classifieds to Schibsted Sverige
Aspiro reported in “Other” segment
Centralized functions, previously part of Media Houses Scandinavia,
are now part of “Headquarters”
Q1 2012 28
To get back,
Turn off ’CLASSIFICED’ via
2. Deactivate by clicking off the
Q1 2012
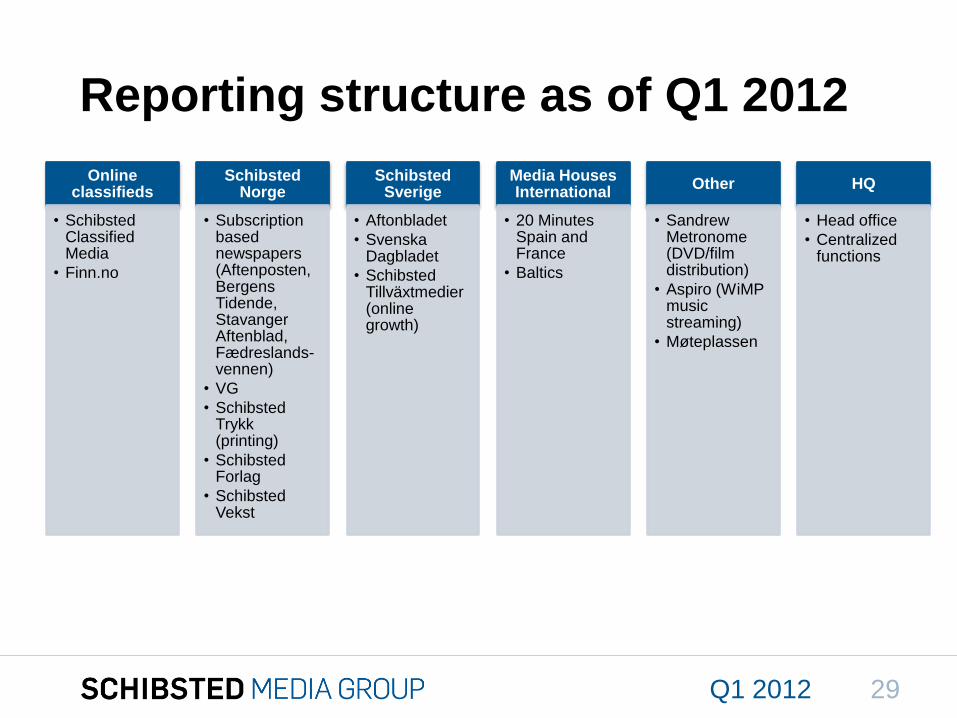
Reporting structure as of Q1 2012
Online classifieds
• Schibsted Classified Media
• Finn.no
Schibsted Norge
• Subscriptionbasednewspapers(Aftenposten, Bergens Tidende, Stavanger Aftenblad, Fædreslands-vennen)
• VG
• Schibsted Trykk (printing)
• Schibsted Forlag
• Schibsted Vekst
Schibsted Sverige
• Aftonbladet
• SvenskaDagbladet
• Schibsted Tillväxtmedier (online growth)
Media Houses International
• 20 MinutesSpain and France
• Baltics
Other
• SandrewMetronome(DVD/film distribution)
• Aspiro (WiMPmusicstreaming)
• Møteplassen
HQ
• Head office
• Centralizedfunctions
29
To get back,
Turn off ’CLASSIFICED’ via
2. Deactivate by clicking off the
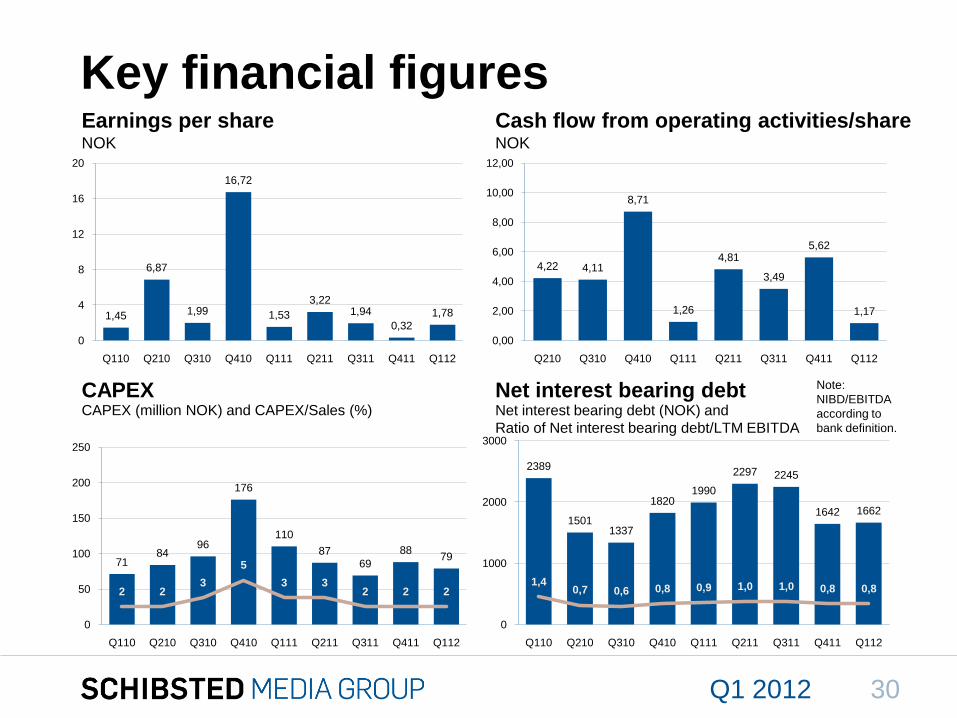
Key financial figuresEarnings per share Cash flow from operating activities/share
CAPEX Net interest bearing debt
NOK NOK
CAPEX (million NOK) and CAPEX/Sales (%) Net interest bearing debt (NOK) and
Ratio of Net interest bearing debt/LTM EBITDA
Note:
NIBD/EBITDA
according to
bank definition.
Q1 2012
1,45
6,87
1,99
16,72
1,53
3,221,94
0,32
1,78
0
4
8
12
16
20
Q110 Q210 Q310 Q410 Q111 Q211 Q311 Q411 Q112
4,22 4,11
8,71
1,26
4,81
3,49
5,62
1,17
0,00
2,00
4,00
6,00
8,00
10,00
12,00
Q210 Q310 Q410 Q111 Q211 Q311 Q411 Q112
2389
15011337
18201990
2297 2245
1642 1662
1,40,7 0,6 0,8 0,9 1,0 1,0 0,8 0,8
0
1000
2000
3000
Q110 Q210 Q310 Q410 Q111 Q211 Q311 Q411 Q112
7184
96
176
110
8769
8879
2 23
5
3 32 2 2
0
50
100
150
200
250
Q110 Q210 Q310 Q410 Q111 Q211 Q311 Q411 Q112
30
To get back,
Turn off ’CLASSIFICED’ via
2. Deactivate by clicking off the
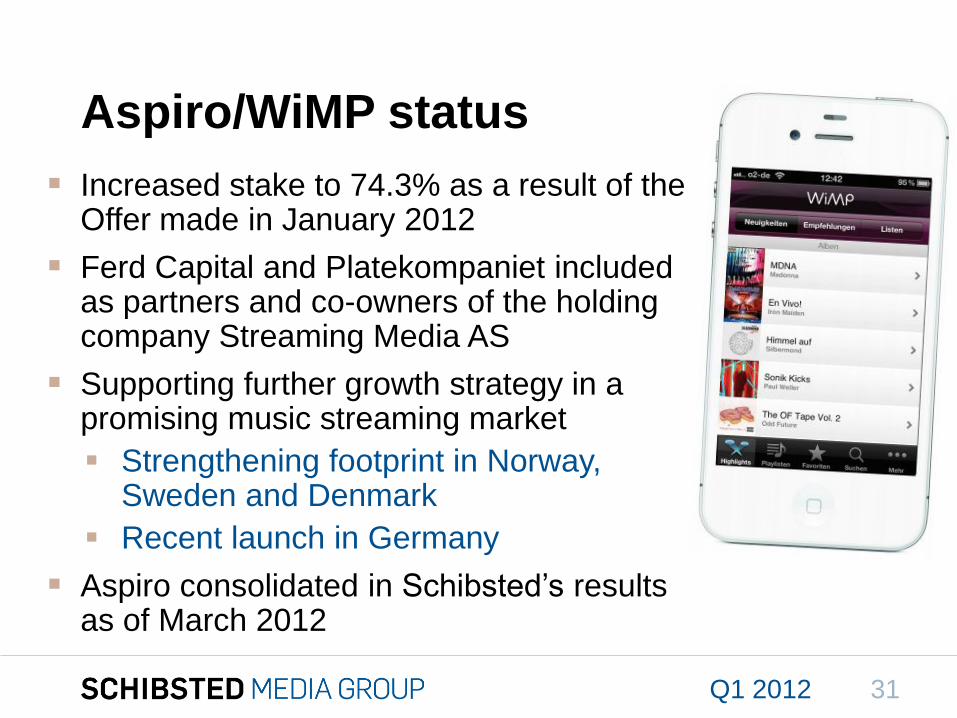
Increased stake to 74.3% as a result of the Offer made in January 2012
Ferd Capital and Platekompaniet included as partners and co-owners of the holding company Streaming Media AS
Supporting further growth strategy in a promising music streaming market
Strengthening footprint in Norway, Sweden and Denmark
Recent launch in Germany
Aspiro consolidated in Schibsted’s results as of March 2012
Q1 2012
Aspiro/WiMP status
31
To get back,
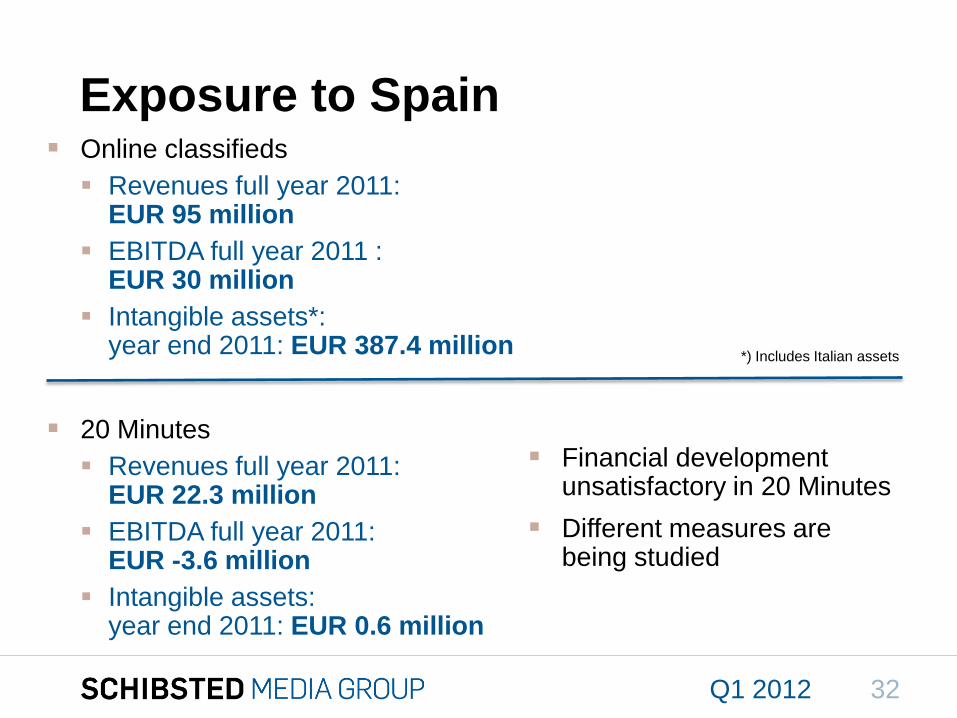
Exposure to Spain Online classifieds
Revenues full year 2011: EUR 95 million
EBITDA full year 2011 : EUR 30 million
Intangible assets*: year end 2011: EUR 387.4 million
20 Minutes
Revenues full year 2011: EUR 22.3 million
EBITDA full year 2011: EUR -3.6 million
Intangible assets: year end 2011: EUR 0.6 million
Financial development unsatisfactory in 20 Minutes
Different measures are being studied
Q1 2012 32
*) Includes Italian assets
Schibsted Sverige
Q1 2012 33
To get back,
Turn off ’CLASSIFICED’ via
2. Deactivate by clicking off the
Welcome to Schibsted Sverige
34Q1 2012
To get back,
Turn off ’CLASSIFICED’ via
2. Deactivate by clicking off the
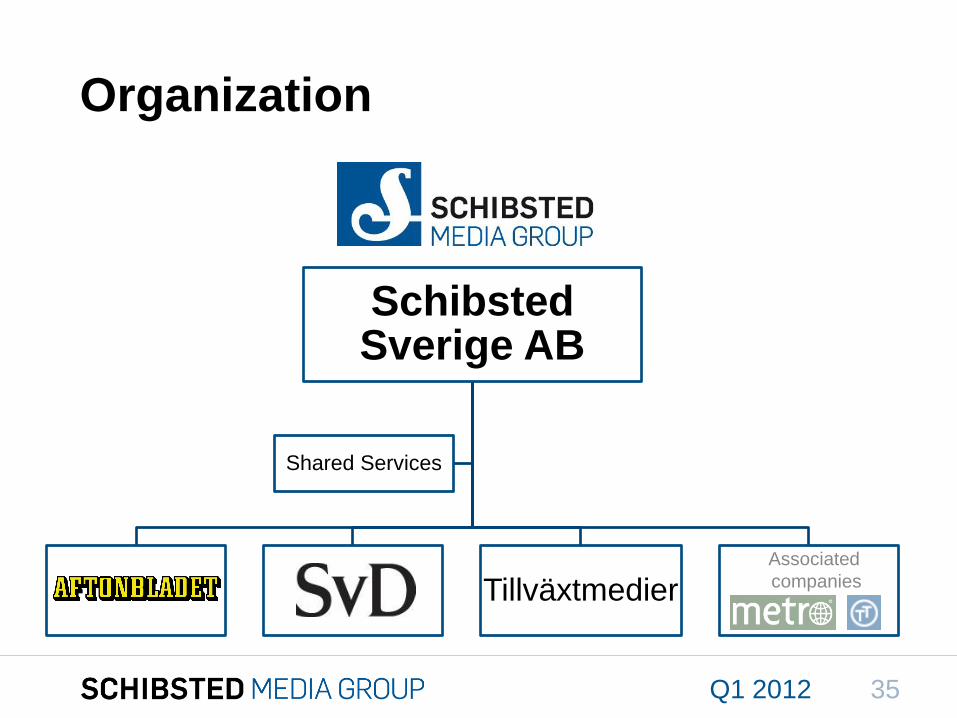
Schibsted Sverige AB
Tillväxtmedier
Shared Services
Organization
Associated
companies
35Q1 2012
To get back,
Turn off ’CLASSIFICED’ via
2. Deactivate by clicking off the
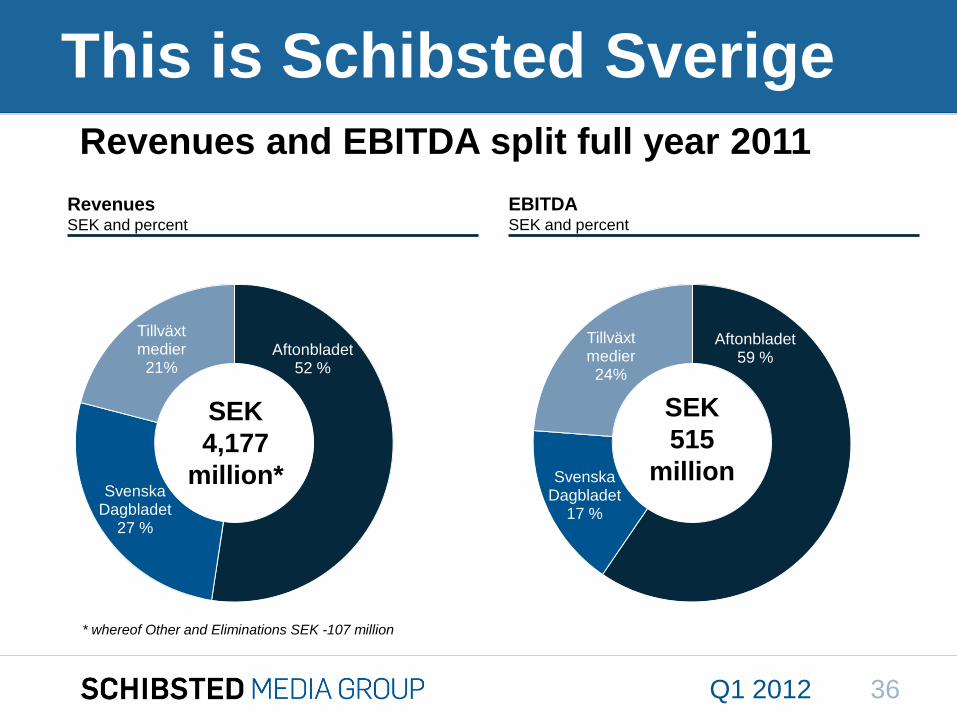
Revenues and EBITDA split full year 2011
Aftonbladet52 %
Svenska Dagbladet
27 %
Tillväxtmedier21%
SEK
4,177
million*
Aftonbladet59 %
Svenska Dagbladet
17 %
Tillväxtmedier24%
SEK
515
million
RevenuesSEK and percent
EBITDASEK and percent
* whereof Other and Eliminations SEK -107 million
This is Schibsted Sverige
36Q1 2012
To get back,
Turn off ’CLASSIFICED’ via
2. Deactivate by clicking off the
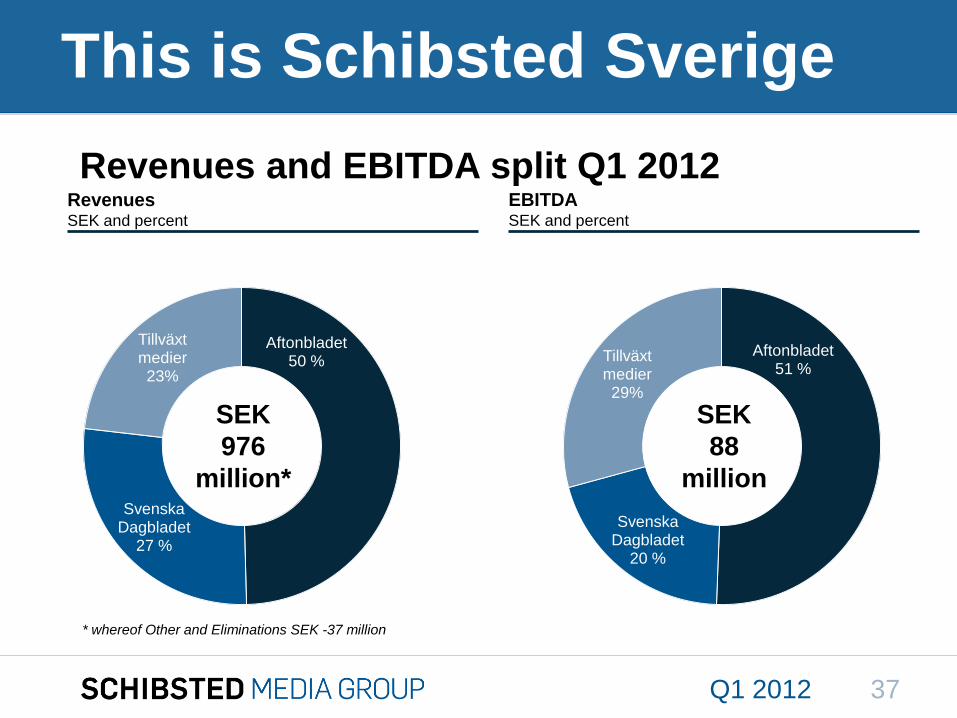
Aftonbladet50 %
Svenska Dagbladet
27 %
Tillväxtmedier23%
SEK
976
million*
Aftonbladet51 %
Svenska Dagbladet
20 %
Tillväxtmedier29%
SEK
88
million
Revenues and EBITDA split Q1 2012RevenuesSEK and percent
EBITDASEK and percent
* whereof Other and Eliminations SEK -37 million
This is Schibsted Sverige
37Q1 2012
To get back,
Turn off ’CLASSIFICED’ via
2. Deactivate by clicking off the
Every week
38
Strong digital position
Q1 2012
To get back,
Turn off ’CLASSIFICED’ via
2. Deactivate by clicking off the
39Q1 2012
To get back,
Turn off ’CLASSIFICED’ via
2. Deactivate by clicking off the
40Q1 2012
To get back,
17 %12 %11 % 9 % 6 % 4 %
0 %
20 %
40 %
60 %
80 %
100 %
0
100
200
300
400
500
Q110 Q111 Q112
MN
OK
Revenue
EBITDA-margin (right hand scale)
23 %
11 %
24 %20 %
8 %
25 %
0 %
10 %
20 %
30 %
40 %
50 %
60 %
70 %
80 %
0
20
40
60
80
100
120
140
Q110 Q111 Q112
MN
OK
Revenue
EBITDA-margin (right hand scale)
Print newspaper Online newspaper
41Q1 2012
To get back,
Turn off ’CLASSIFICED’ via
2. Deactivate by clicking off the
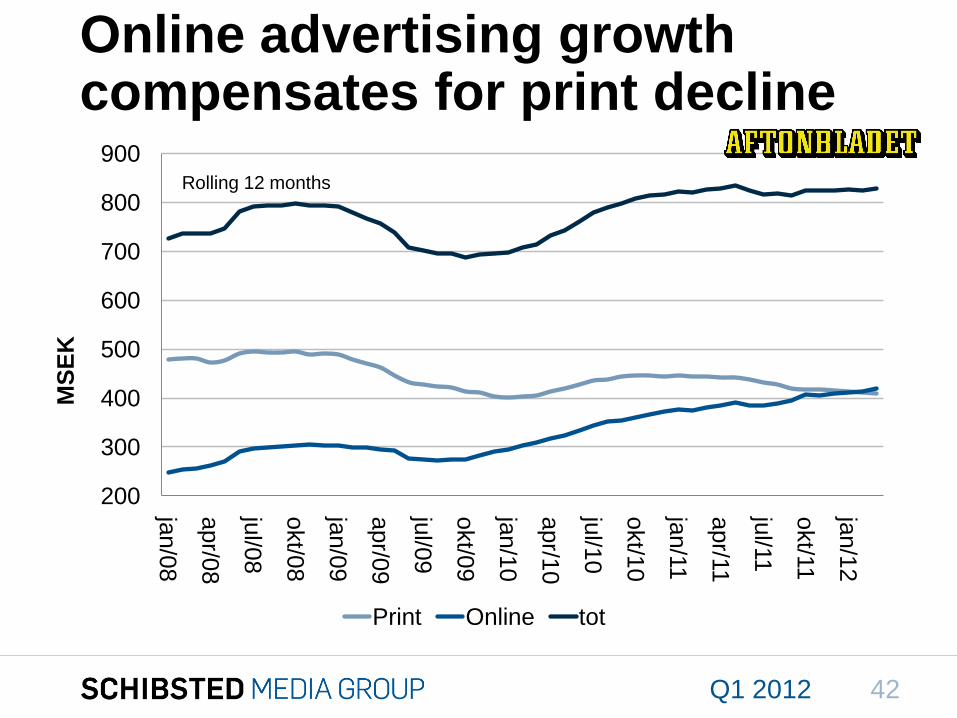
Online advertising growth compensates for print decline
200
300
400
500
600
700
800
900
jan/0
8
apr/0
8
jul/0
8
okt/0
8
jan/0
9
apr/0
9
jul/0
9
okt/0
9
jan/1
0
apr/1
0
jul/1
0
okt/1
0
jan/1
1
apr/1
1
jul/1
1
okt/1
1
jan/1
2
MS
EK
Print Online tot
Rolling 12 months
42Q1 2012
To get back,
Turn off ’CLASSIFICED’ via
2. Deactivate by clicking off the
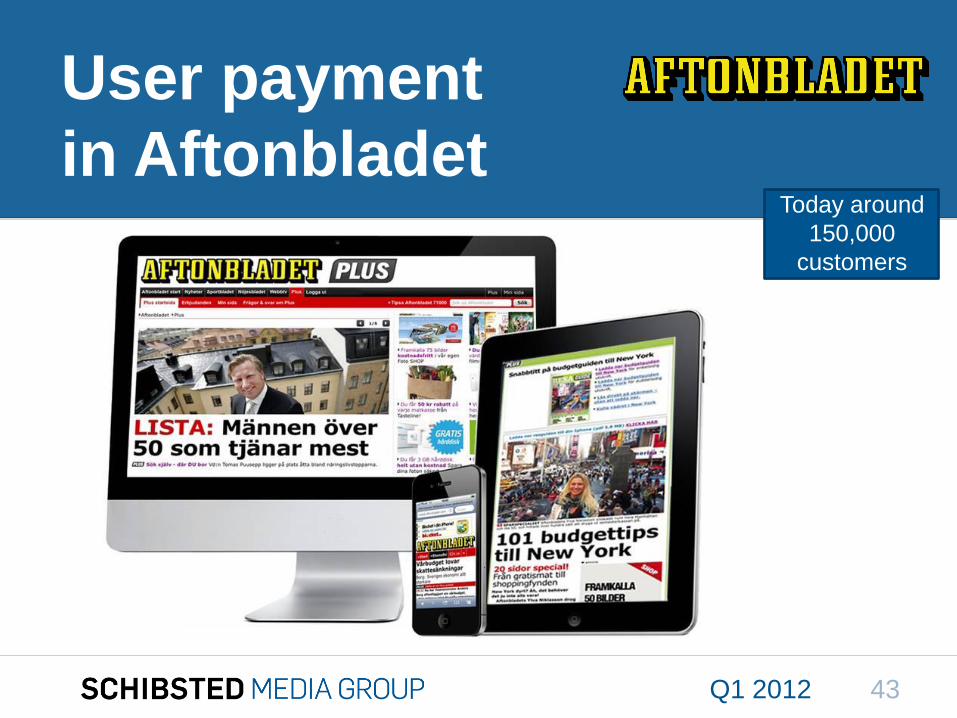
User payment
in AftonbladetToday around
150,000
customers
43Q1 2012
To get back,
Turn off ’CLASSIFICED’ via
2. Deactivate by clicking off the
Schibsted Tillväxtmedier
44Q1 2012
To get back,
Turn off ’CLASSIFICED’ via
2. Deactivate by clicking off the
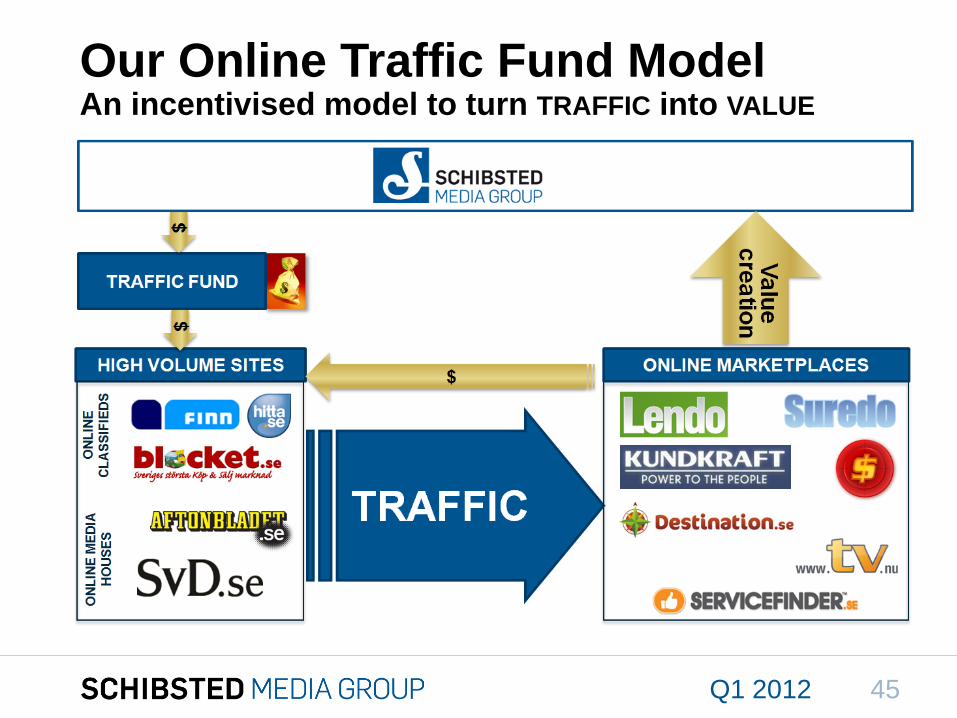
Our Online Traffic Fund ModelAn incentivised model to turn TRAFFIC into VALUE
45Q1 2012
To get back,
Stable profitability after investing in marketingSchibsted Tillväxtmedier
MS
EK
7 %
12 %11 %
0 %
4 %
8 %
12 %
16 %
20 %
0
50
100
150
200
250
Q1 10 Q1 11 Q1 12
Revenues EBITDA margin
To get back,
Turn off ’CLASSIFICED’ via
2. Deactivate by clicking off the
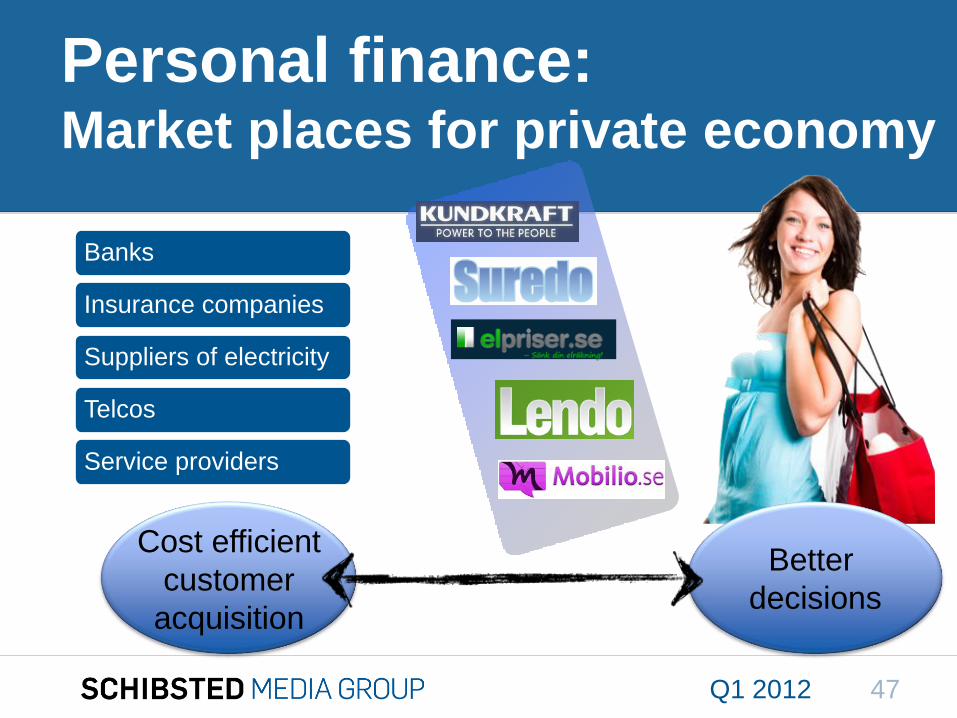
Personal finance: Market places for private economy
Banks
Insurance companies
Suppliers of electricity
Telcos
Service providers
Cost efficient
customer
acquisition
Better
decisions
47Q1 2012
To get back,
Turn off ’CLASSIFICED’ via
2. Deactivate by clicking off the
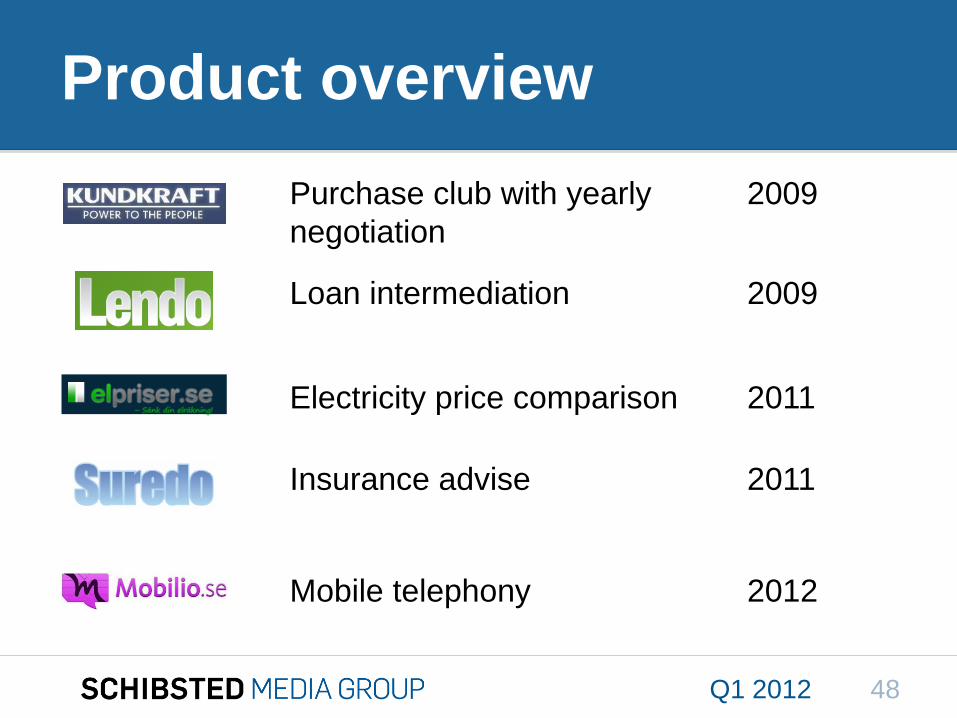
Product overview
Purchase club with yearly
negotiation
Loan intermediation
Electricity price comparison
Insurance advise
Mobile telephony
2009
2009
2011
2011
2012
48Q1 2012
To get back,
Turn off ’CLASSIFICED’ via
2. Deactivate by clicking off the
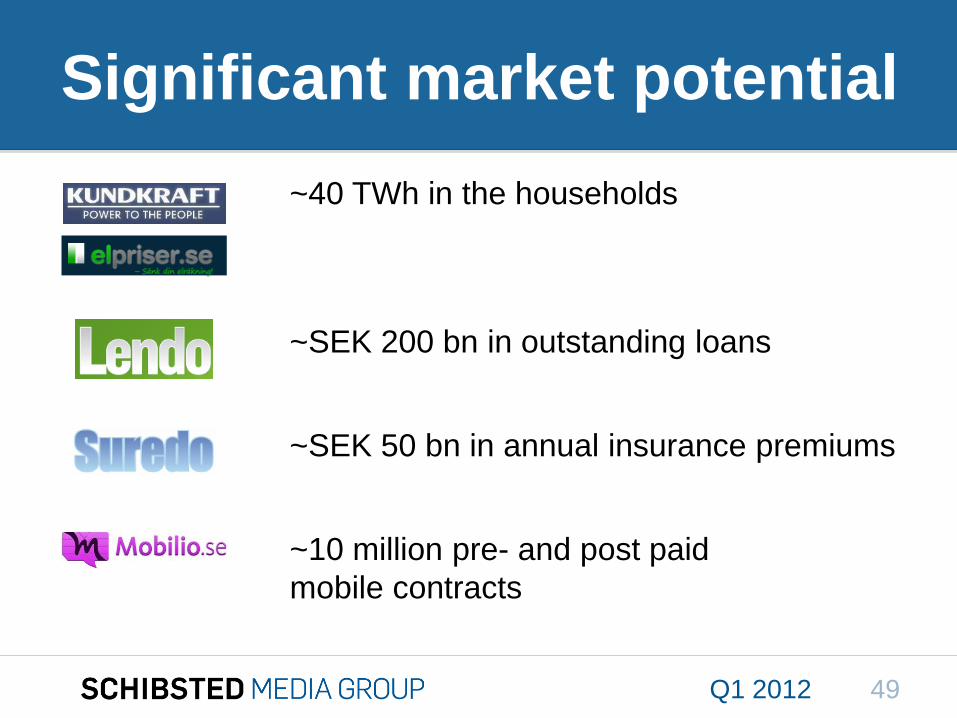
Significant market potential
~40 TWh in the households
~SEK 200 bn in outstanding loans
~SEK 50 bn in annual insurance premiums
~10 million pre- and post paid
mobile contracts
49Q1 2012
To get back,
Turn off ’CLASSIFICED’ via
2. Deactivate by clicking off the
Focus on growth in 2012
80% revenue growth in Q1 12 vs Q1 11
Significant increase in market- and product investments
Good profit margin despite being in a growth phase
Collaborations within and without Schibsted Media Group
Active search for new investments
50Q1 2012
To get back,
Turn off ’CLASSIFICED’ via
2. Deactivate by clicking off the
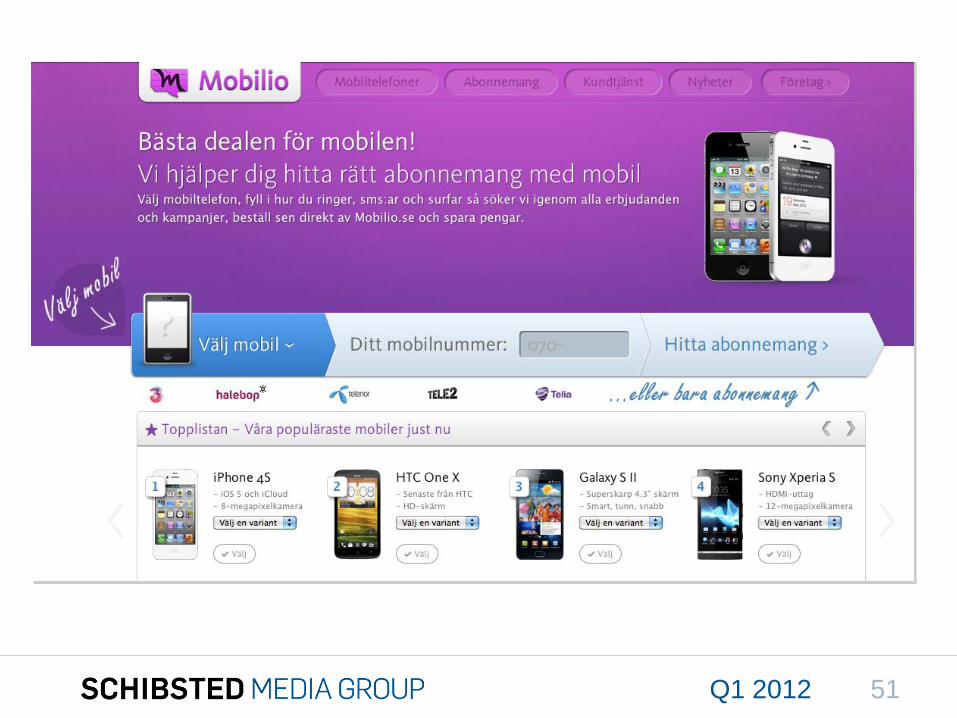
51Q1 2012
To get back,
Turn off ’CLASSIFICED’ via
2. Deactivate by clicking off the
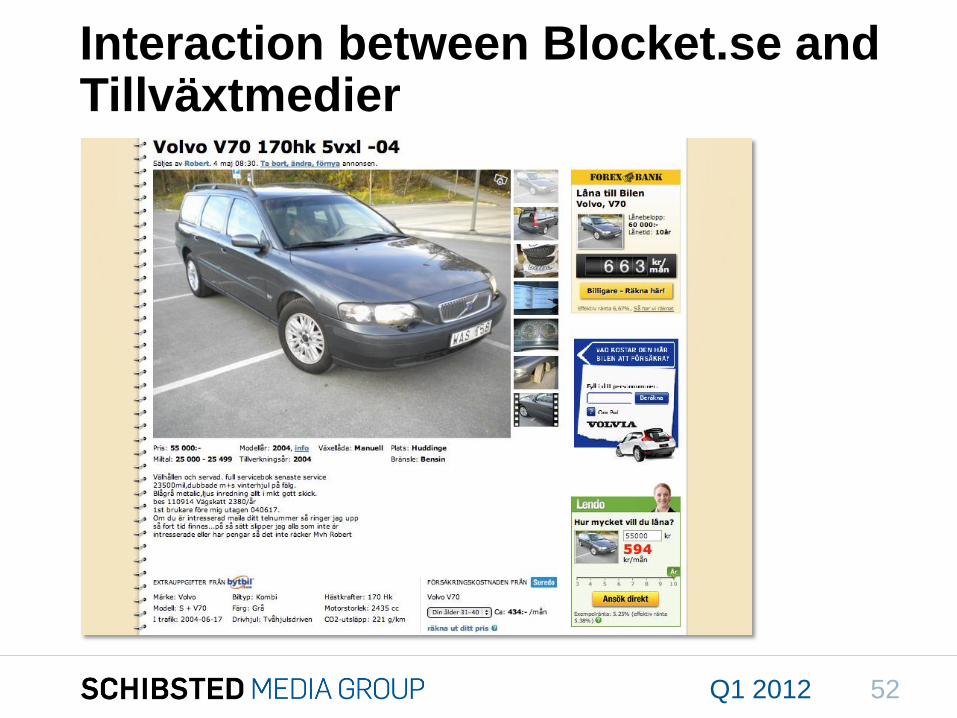
Interaction between Blocket.se and Tillväxtmedier
52Q1 2012
Outlook
Q1 2012 53
To get back,
Turn off ’CLASSIFICED’ via
2. Deactivate by clicking off the
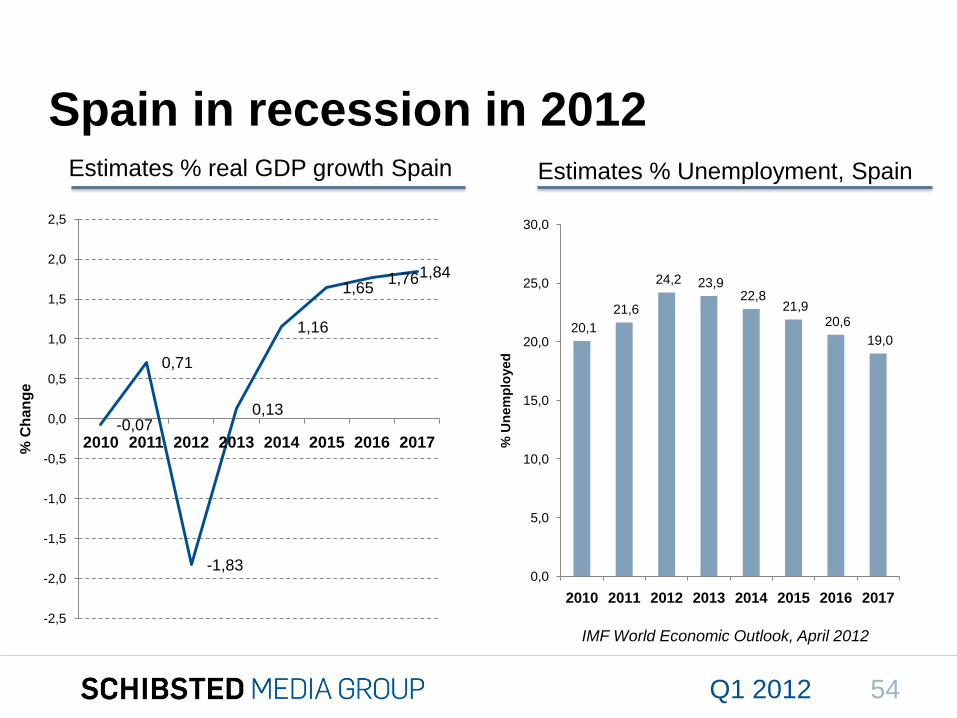
Spain in recession in 2012
-0,07
0,71
-1,83
0,13
1,16
1,65 1,76 1,84
-2,5
-2,0
-1,5
-1,0
-0,5
0,0
0,5
1,0
1,5
2,0
2,5
2010 2011 2012 2013 2014 2015 2016 2017% C
han
ge
20,1
21,6
24,2 23,9 22,8
21,9 20,6
19,0
0,0
5,0
10,0
15,0
20,0
25,0
30,0
2010 2011 2012 2013 2014 2015 2016 2017
% U
nem
plo
yed
Estimates % real GDP growth Spain Estimates % Unemployment, Spain
IMF World Economic Outlook, April 2012
Q1 2012 54
To get back,
Turn off ’CLASSIFICED’ via
2. Deactivate by clicking off the
Online Classifieds: Strong growth and high margins
Good growth in existing portfolio – less exposed to economic turmoil
Growth from increased reach, product development and new services
Italy and Austria will contribute positively to 2012 EBITDA
Investments in new positions continuing – approximately NOK 500 million
in negative EBITDA contribution
Media Houses: Stronger advertizing migration from print to online
Increased migration during the recent months. Trend continues in Q2
2012, which has had a challenging start for print advertising
Schibsted newspapers well positioned to benefit from web and mobile
growth
Continuous circulation decline for single copy newspapers, slightly weaker
trend also for subscription based newspapers
Outlook
Q1 2012 55
Q&A
56Q1 2012

57Q1 2012
AppendicesSpreadsheet containing detailed Q1 2012 and Historical and analytical
Information can be downloaded from www.schibsted.com/ir
58Q1 2012
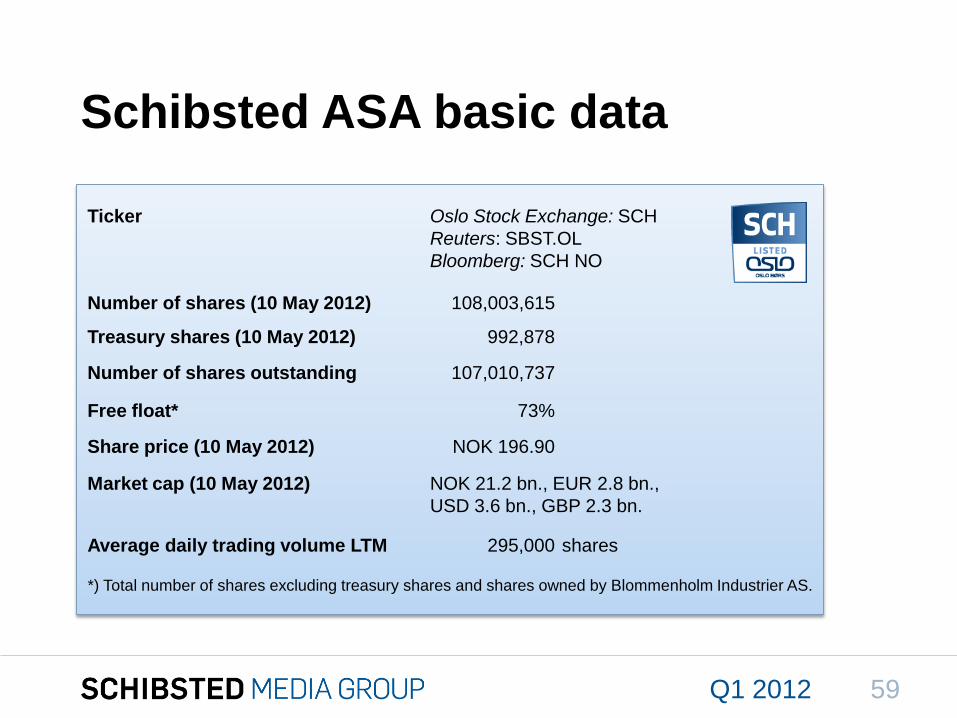
Schibsted ASA basic data
Ticker Oslo Stock Exchange: SCH
Reuters: SBST.OL
Bloomberg: SCH NO
Number of shares (10 May 2012) 108,003,615
Treasury shares (10 May 2012) 992,878
Number of shares outstanding 107,010,737
Free float* 73%
Share price (10 May 2012) NOK 196.90
Market cap (10 May 2012) NOK 21.2 bn., EUR 2.8 bn.,
USD 3.6 bn., GBP 2.3 bn.
Average daily trading volume LTM 295,000 shares
*) Total number of shares excluding treasury shares and shares owned by Blommenholm Industrier AS.
59Q1 2012
To get back,
Turn off ’CLASSIFICED’ via
2. Deactivate by clicking off the
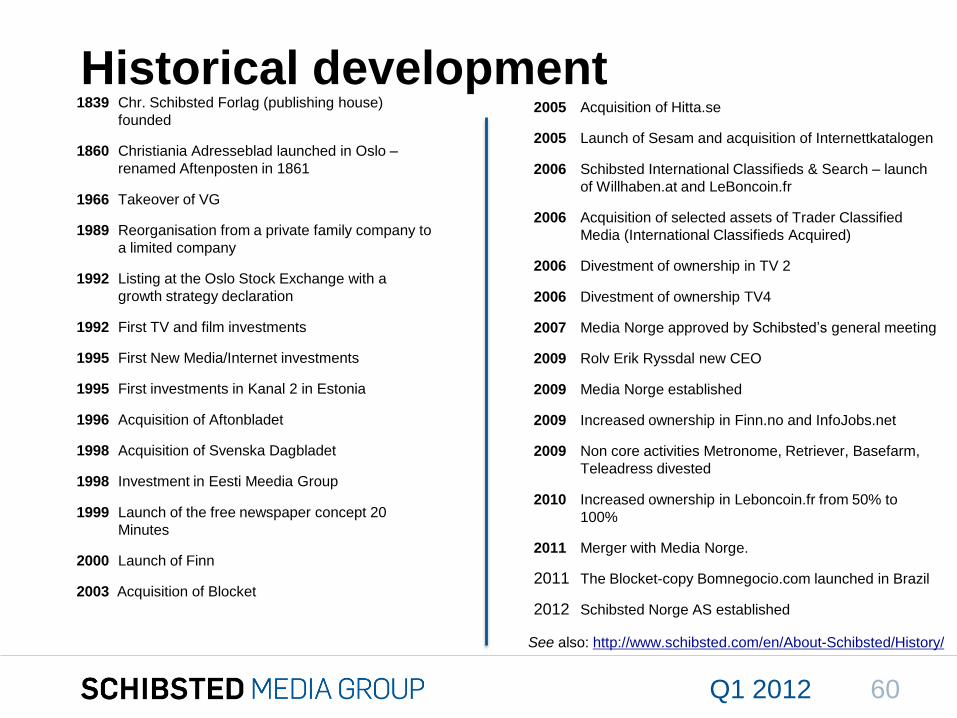
2005 Acquisition of Hitta.se
2005 Launch of Sesam and acquisition of Internettkatalogen
2006 Schibsted International Classifieds & Search – launch
of Willhaben.at and LeBoncoin.fr
2006 Acquisition of selected assets of Trader Classified
Media (International Classifieds Acquired)
2006 Divestment of ownership in TV 2
2006 Divestment of ownership TV4
2007 Media Norge approved by Schibsted’s general meeting
2009 Rolv Erik Ryssdal new CEO
2009 Media Norge established
2009 Increased ownership in Finn.no and InfoJobs.net
2009 Non core activities Metronome, Retriever, Basefarm,
Teleadress divested
2010 Increased ownership in Leboncoin.fr from 50% to
100%
2011 Merger with Media Norge.
2011 The Blocket-copy Bomnegocio.com launched in Brazil
2012 Schibsted Norge AS established
1839 Chr. Schibsted Forlag (publishing house)
founded
1860 Christiania Adresseblad launched in Oslo –
renamed Aftenposten in 1861
1966 Takeover of VG
1989 Reorganisation from a private family company to
a limited company
1992 Listing at the Oslo Stock Exchange with a
growth strategy declaration
1992 First TV and film investments
1995 First New Media/Internet investments
1995 First investments in Kanal 2 in Estonia
1996 Acquisition of Aftonbladet
1998 Acquisition of Svenska Dagbladet
1998 Investment in Eesti Meedia Group
1999 Launch of the free newspaper concept 20
Minutes
2000 Launch of Finn
2003 Acquisition of Blocket
Historical development
See also: http://www.schibsted.com/en/About-Schibsted/History/
60Q1 2012
To get back,
Turn off ’CLASSIFICED’ via
2. Deactivate by clicking off the
61Q1 2012
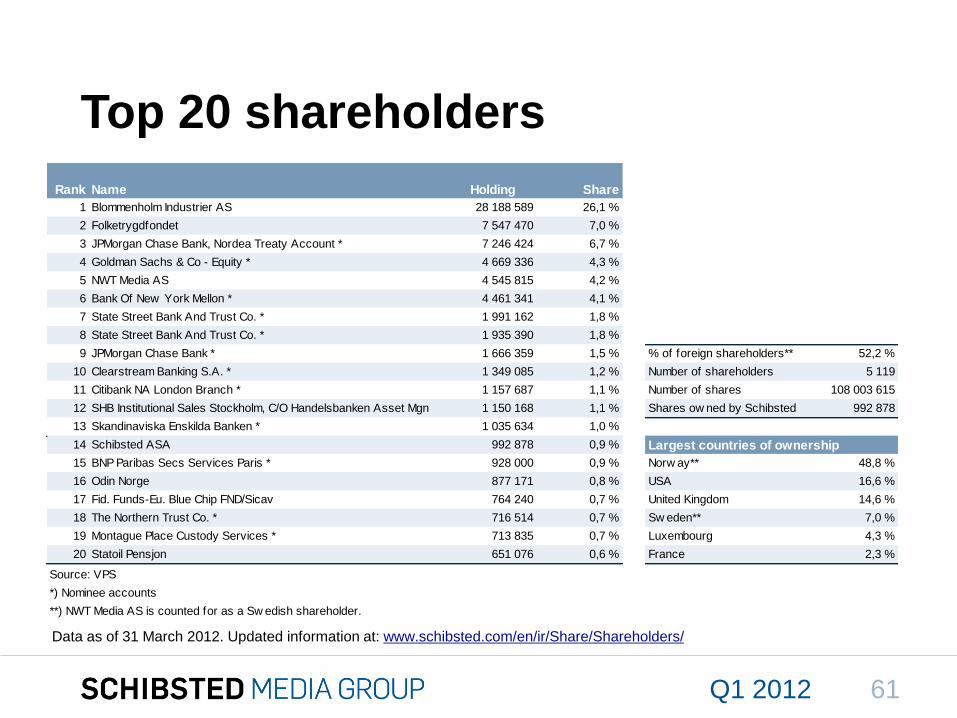
Top 20 shareholders
Data as of 31 March 2012. Updated information at: www.schibsted.com/en/ir/Share/Shareholders/
Rank Name Holding Share
1 Blommenholm Industrier AS 28 188 589 26,1 %
2 Folketrygdfondet 7 547 470 7,0 %
3 JPMorgan Chase Bank, Nordea Treaty Account * 7 246 424 6,7 %
4 Goldman Sachs & Co - Equity * 4 669 336 4,3 %
5 NWT Media AS 4 545 815 4,2 %
6 Bank Of New York Mellon * 4 461 341 4,1 %
7 State Street Bank And Trust Co. * 1 991 162 1,8 %
8 State Street Bank And Trust Co. * 1 935 390 1,8 %
9 JPMorgan Chase Bank * 1 666 359 1,5 % % of foreign shareholders** 52,2 %
10 Clearstream Banking S.A. * 1 349 085 1,2 % Number of shareholders 5 119
11 Citibank NA London Branch * 1 157 687 1,1 % Number of shares 108 003 615
12 SHB Institutional Sales Stockholm, C/O Handelsbanken Asset Mgn 1 150 168 1,1 % Shares ow ned by Schibsted 992 878
13 Skandinaviska Enskilda Banken * 1 035 634 1,0 %
14 Schibsted ASA 992 878 0,9 % Largest countries of ownership
15 BNP Paribas Secs Services Paris * 928 000 0,9 % Norw ay** 48,8 %
16 Odin Norge 877 171 0,8 % USA 16,6 %
17 Fid. Funds-Eu. Blue Chip FND/Sicav 764 240 0,7 % United Kingdom 14,6 %
18 The Northern Trust Co. * 716 514 0,7 % Sw eden** 7,0 %
19 Montague Place Custody Services * 713 835 0,7 % Luxembourg 4,3 %
20 Statoil Pensjon 651 076 0,6 % France 2,3 %
Source: VPS
*) Nominee accounts
**) NWT Media AS is counted for as a Sw edish shareholder.
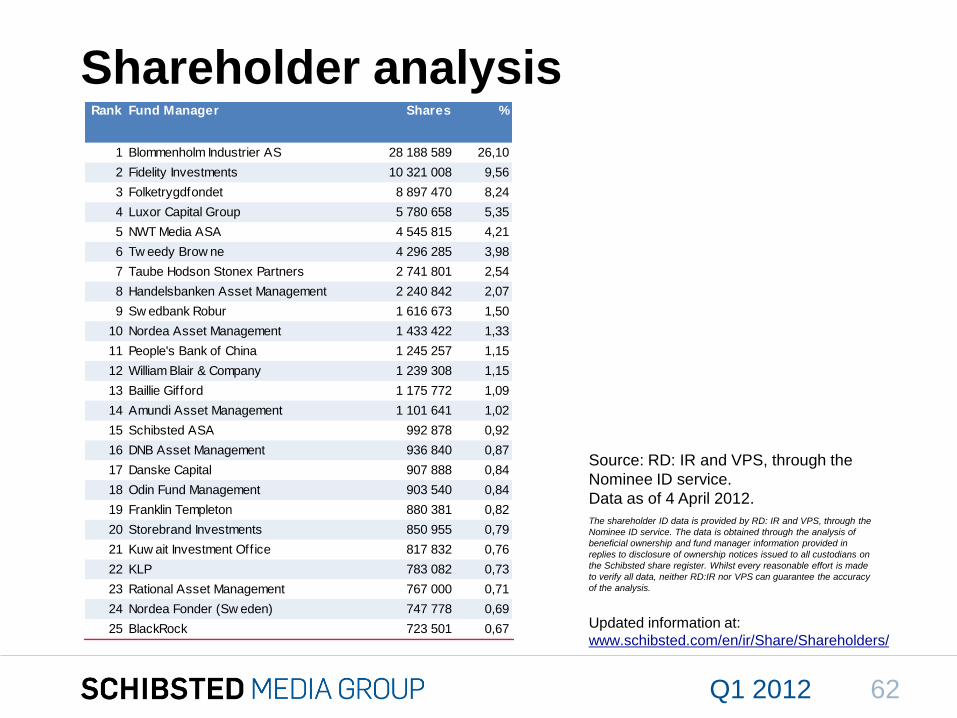
Shareholder analysis
The shareholder ID data is provided by RD: IR and VPS, through the
Nominee ID service. The data is obtained through the analysis of
beneficial ownership and fund manager information provided in
replies to disclosure of ownership notices issued to all custodians on
the Schibsted share register. Whilst every reasonable effort is made
to verify all data, neither RD:IR nor VPS can guarantee the accuracy
of the analysis.
Source: RD: IR and VPS, through the
Nominee ID service.
Data as of 4 April 2012.
Updated information at:
www.schibsted.com/en/ir/Share/Shareholders/
62Q1 2012
Rank Fund Manager Shares
1 Blommenholm Industrier AS 28 188 589 26,10
2 Fidelity Investments 10 321 008 9,56
3 Folketrygdfondet 8 897 470 8,24
4 Luxor Capital Group 5 780 658 5,35
5 NWT Media ASA 4 545 815 4,21
6 Tw eedy Brow ne 4 296 285 3,98
7 Taube Hodson Stonex Partners 2 741 801 2,54
8 Handelsbanken Asset Management 2 240 842 2,07
9 Sw edbank Robur 1 616 673 1,50
10 Nordea Asset Management 1 433 422 1,33
11 People's Bank of China 1 245 257 1,15
12 William Blair & Company 1 239 308 1,15
13 Baillie Gifford 1 175 772 1,09
14 Amundi Asset Management 1 101 641 1,02
15 Schibsted ASA 992 878 0,92
16 DNB Asset Management 936 840 0,87
17 Danske Capital 907 888 0,84
18 Odin Fund Management 903 540 0,84
19 Franklin Templeton 880 381 0,82
20 Storebrand Investments 850 955 0,79
21 Kuw ait Investment Office 817 832 0,76
22 KLP 783 082 0,73
23 Rational Asset Management 767 000 0,71
24 Nordea Fonder (Sw eden) 747 778 0,69
25 BlackRock 723 501 0,67
%
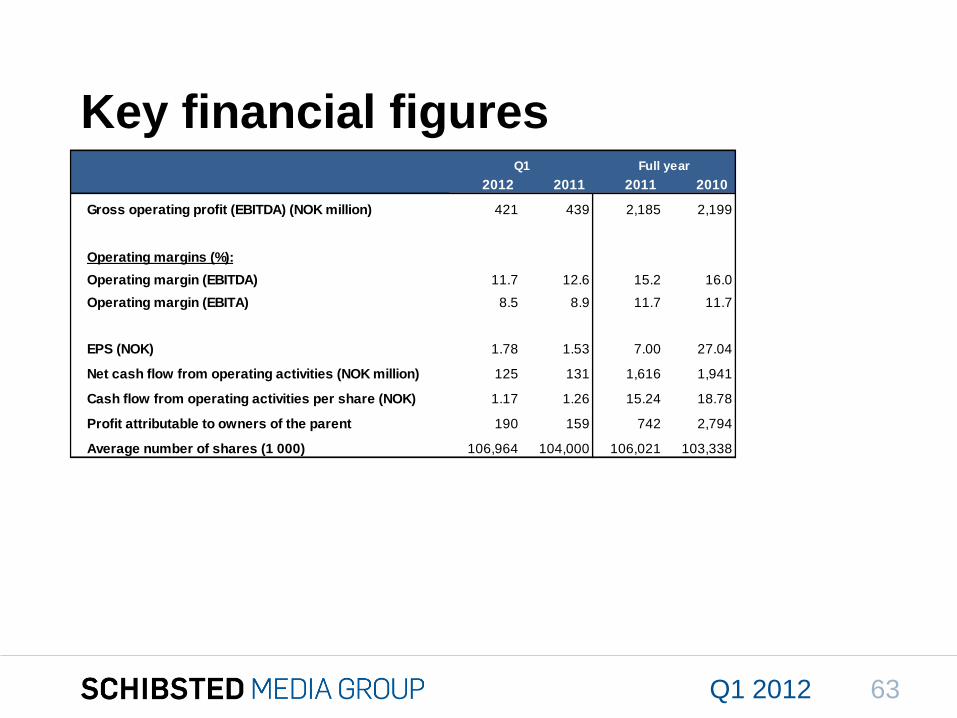
Key financial figures
2012 2011 2011 2010
Gross operating profit (EBITDA) (NOK million) 421 439 2,185 2,199
Operating margins (%):
Operating margin (EBITDA) 11.7 12.6 15.2 16.0
Operating margin (EBITA) 8.5 8.9 11.7 11.7
EPS (NOK) 1.78 1.53 7.00 27.04
Net cash flow from operating activities (NOK million) 125 131 1,616 1,941
Cash flow from operating activities per share (NOK) 1.17 1.26 15.24 18.78
Profit attributable to owners of the parent 190 159 742 2,794
Average number of shares (1 000) 106,964 104,000 106,021 103,338
Full yearQ1
Q1 2012 63
To get back,
Turn off ’CLASSIFICED’ via
2. Deactivate by clicking off the
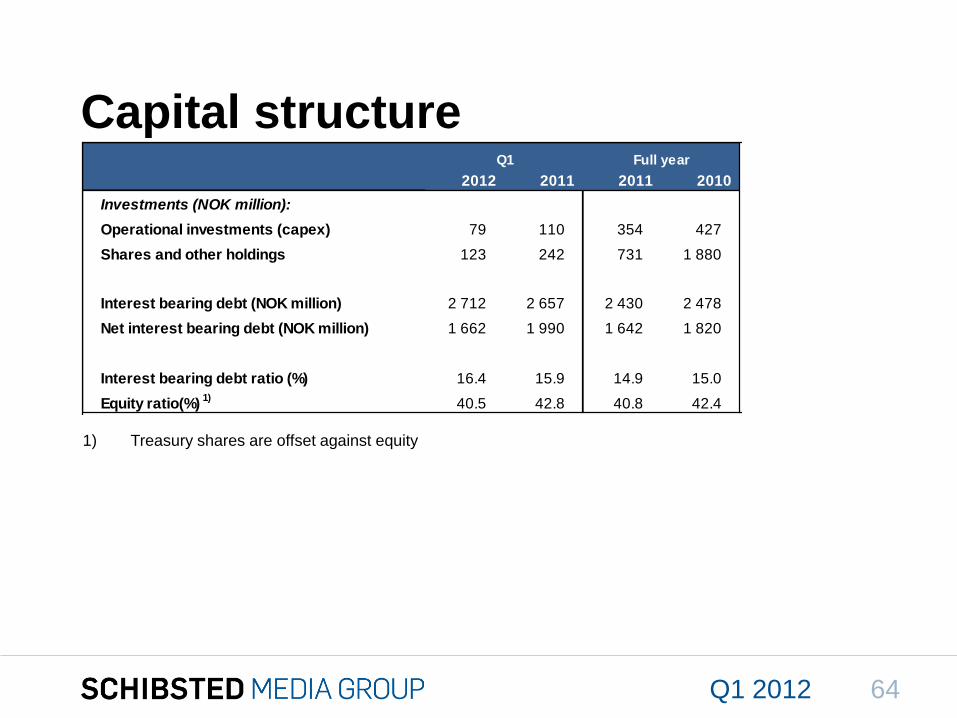
Capital structure
2012 2011 2011 2010
Investments (NOK million):
Operational investments (capex) 79 110 354 427
Shares and other holdings 123 242 731 1 880
Interest bearing debt (NOK million) 2 712 2 657 2 430 2 478
Net interest bearing debt (NOK million) 1 662 1 990 1 642 1 820
Interest bearing debt ratio (%) 16.4 15.9 14.9 15.0
Equity ratio(%) 1)
40.5 42.8 40.8 42.4
Full yearQ1
1) Treasury shares are offset against equity
Q1 2012 64
To get back,
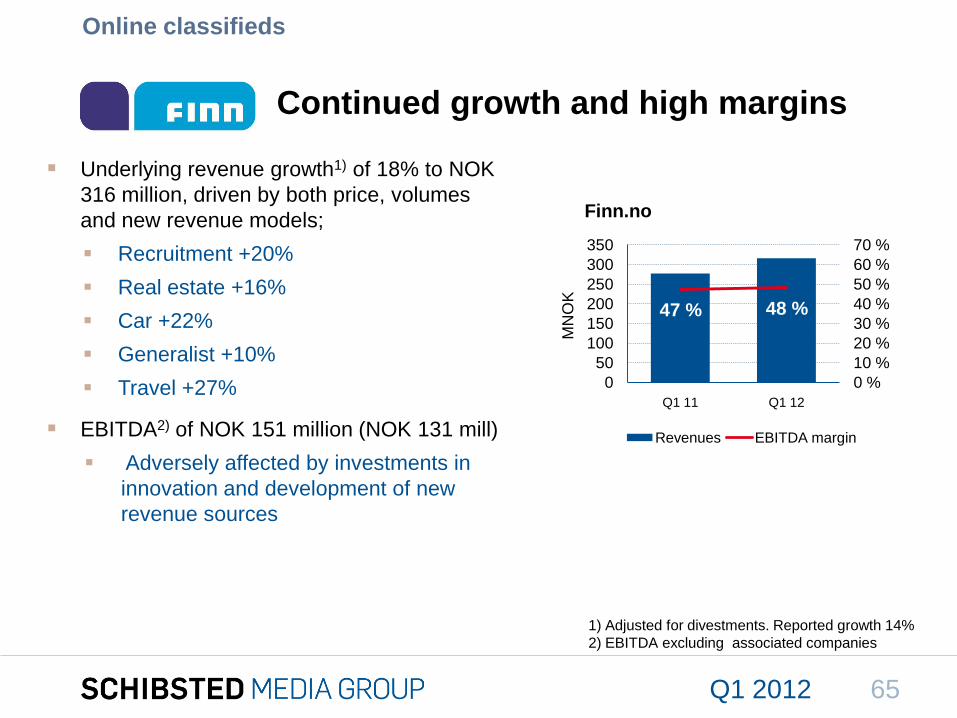
Continued growth and high margins
Underlying revenue growth1) of 18% to NOK
316 million, driven by both price, volumes
and new revenue models;
Recruitment +20%
Real estate +16%
Car +22%
Generalist +10%
Travel +27%
EBITDA2) of NOK 151 million (NOK 131 mill)
Adversely affected by investments in
innovation and development of new
revenue sources
Online classifieds
1) Adjusted for divestments. Reported growth 14%
2) EBITDA excluding associated companies
Finn.no
MN
OK
65Q1 2012
47 % 48 %
0 %
10 %
20 %
30 %
40 %
50 %
60 %
70 %
0
50
100
150
200
250
300
350
Q1 11 Q1 12
Revenues EBITDA margin
To get back,
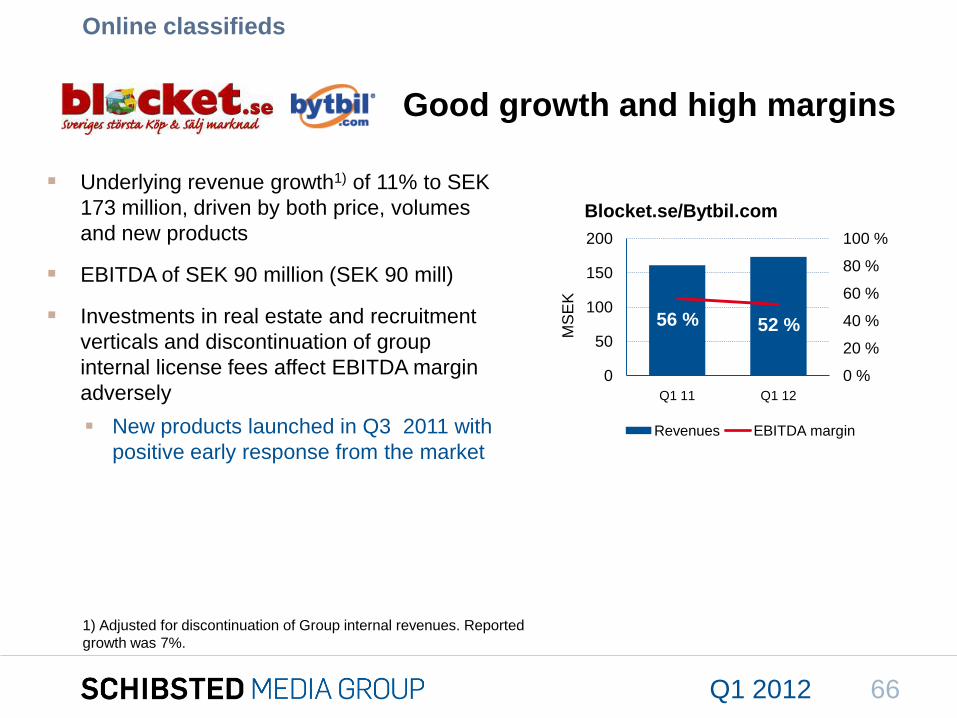
Good growth and high margins
Underlying revenue growth1) of 11% to SEK
173 million, driven by both price, volumes
and new products
EBITDA of SEK 90 million (SEK 90 mill)
Investments in real estate and recruitment
verticals and discontinuation of group
internal license fees affect EBITDA margin
adversely
New products launched in Q3 2011 with
positive early response from the market
Online classifieds
1) Adjusted for discontinuation of Group internal revenues. Reported
growth was 7%.
Blocket.se/Bytbil.com
MS
EK
66Q1 2012
56 % 52 %
0 %
20 %
40 %
60 %
80 %
100 %
0
50
100
150
200
Q1 11 Q1 12
Revenues EBITDA margin
To get back,
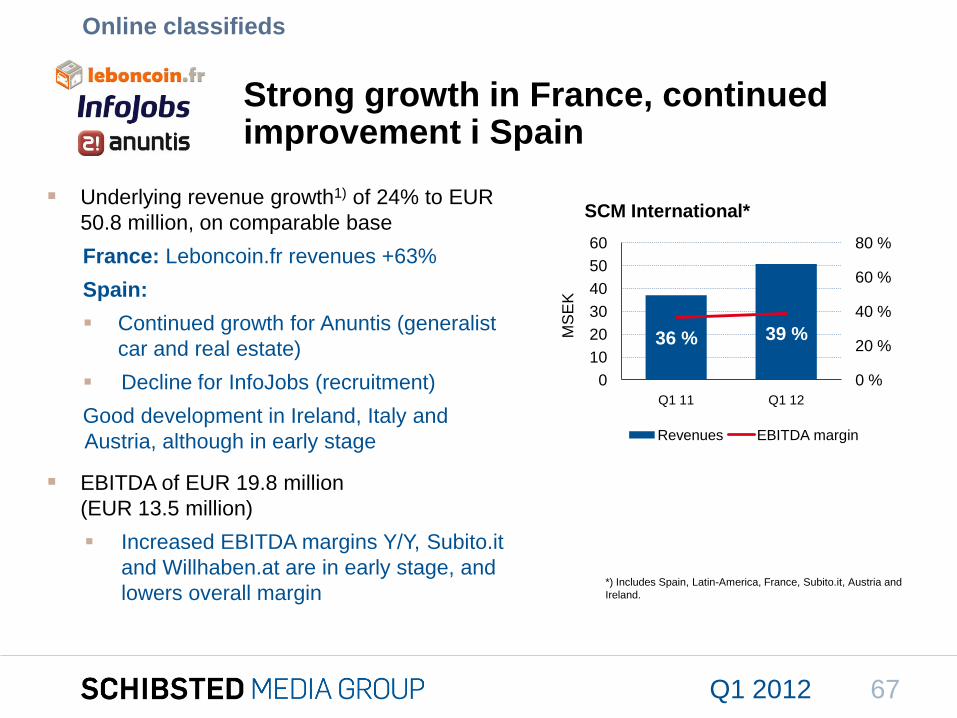
Strong growth in France, continuedimprovement i Spain
Underlying revenue growth1) of 24% to EUR
50.8 million, on comparable base
France: Leboncoin.fr revenues +63%
Spain:
Continued growth for Anuntis (generalist
car and real estate)
Decline for InfoJobs (recruitment)
Good development in Ireland, Italy and
Austria, although in early stage
EBITDA of EUR 19.8 million
(EUR 13.5 million)
Increased EBITDA margins Y/Y, Subito.it
and Willhaben.at are in early stage, and
lowers overall margin
Online classifieds
SCM International*
MS
EK
*) Includes Spain, Latin-America, France, Subito.it, Austria and
Ireland.
67Q1 2012
36 % 39 %
0 %
20 %
40 %
60 %
80 %
0
10
20
30
40
50
60
Q1 11 Q1 12
Revenues EBITDA margin
To get back,
Turn off ’CLASSIFICED’ via
2. Deactivate by clicking off the
3 y
ea
rs
5 y
ea
rs
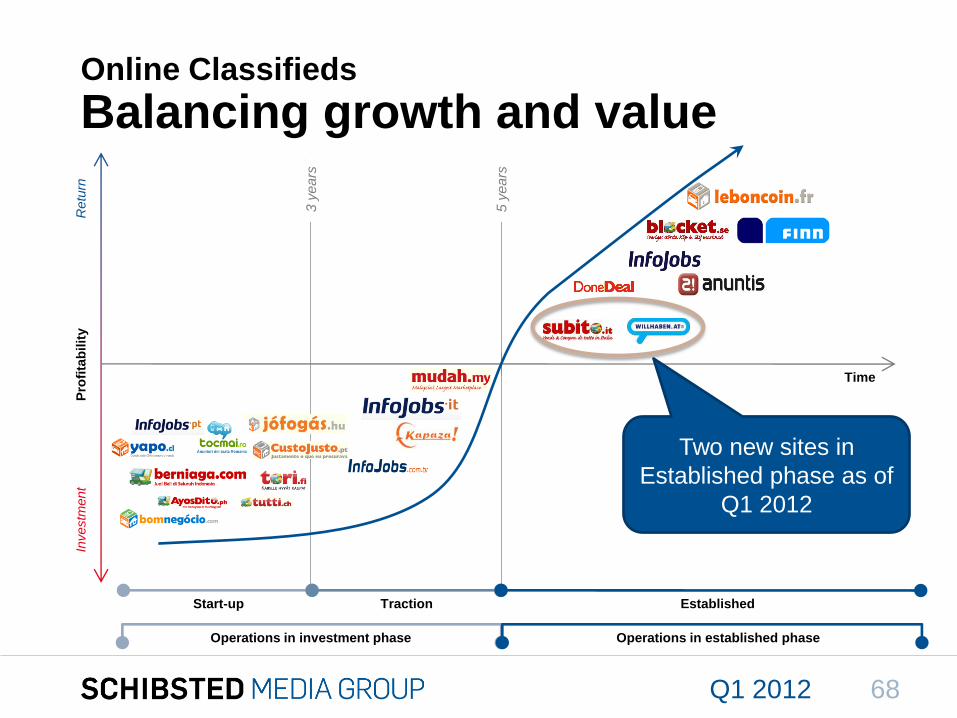
Online Classifieds
Balancing growth and valueP
rofi
tab
ilit
yIn
vestm
ent
Retu
rn
Start-up Traction Established
Time
Operations in established phaseOperations in investment phase
68Q1 2012
Two new sites in
Established phase as of
Q1 2012
To get back,
Turn off ’CLASSIFICED’ via
2. Deactivate by clicking off the
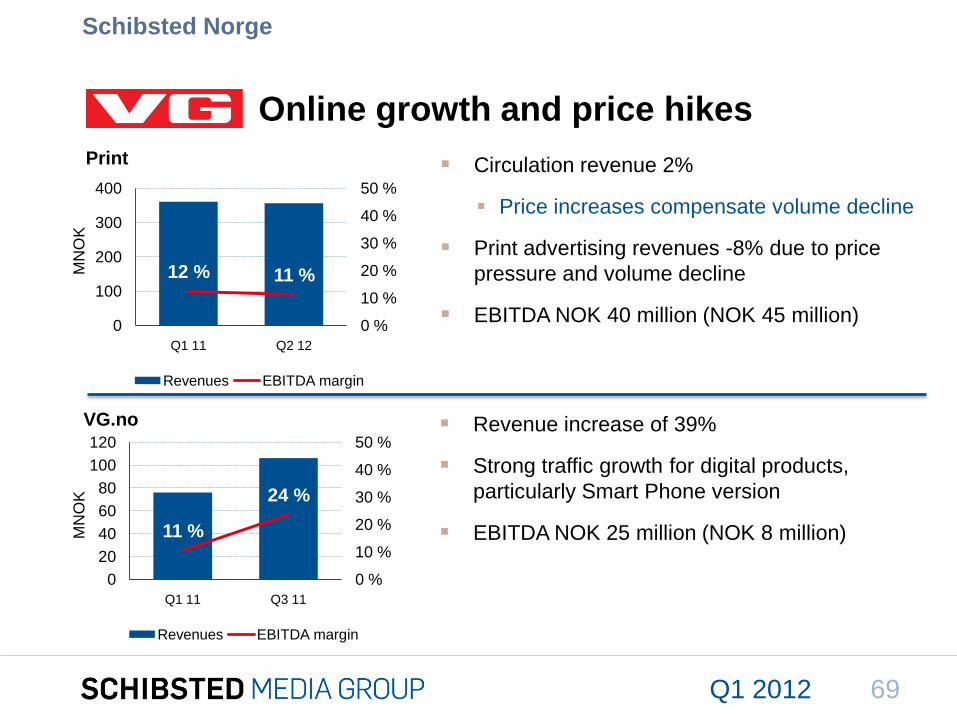
Circulation revenue 2%
Price increases compensate volume decline
Print advertising revenues -8% due to price
pressure and volume decline
EBITDA NOK 40 million (NOK 45 million)
Online growth and price hikes
Schibsted Norge
VG.no
MN
OK
MN
OK
Revenue increase of 39%
Strong traffic growth for digital products,
particularly Smart Phone version
EBITDA NOK 25 million (NOK 8 million)
69Q1 2012
11 %
24 %
0 %
10 %
20 %
30 %
40 %
50 %
0
20
40
60
80
100
120
Q1 11 Q3 11
Revenues EBITDA margin
12 % 11 %
0 %
10 %
20 %
30 %
40 %
50 %
0
100
200
300
400
Q1 11 Q2 12
Revenues EBITDA margin
To get back,
Turn off ’CLASSIFICED’ via
2. Deactivate by clicking off the
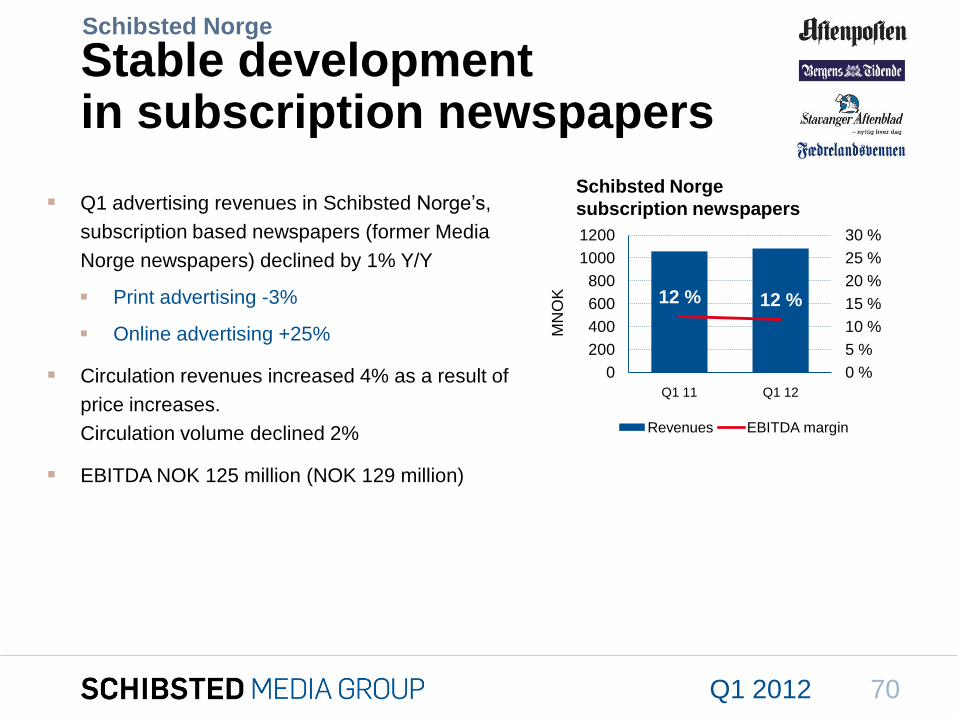
Q1 advertising revenues in Schibsted Norge’s,
subscription based newspapers (former Media
Norge newspapers) declined by 1% Y/Y
Print advertising -3%
Online advertising +25%
Circulation revenues increased 4% as a result of
price increases.
Circulation volume declined 2%
EBITDA NOK 125 million (NOK 129 million)
Stable development in subscription newspapers
Schibsted Norge
Schibsted Norge
subscription newspapers
MN
OK
70Q1 2012
12 % 12 %
0 %
5 %
10 %
15 %
20 %
25 %
30 %
0
200
400
600
800
1000
1200
Q1 11 Q1 12
Revenues EBITDA margin
To get back,
Turn off ’CLASSIFICED’ via
2. Deactivate by clicking off the
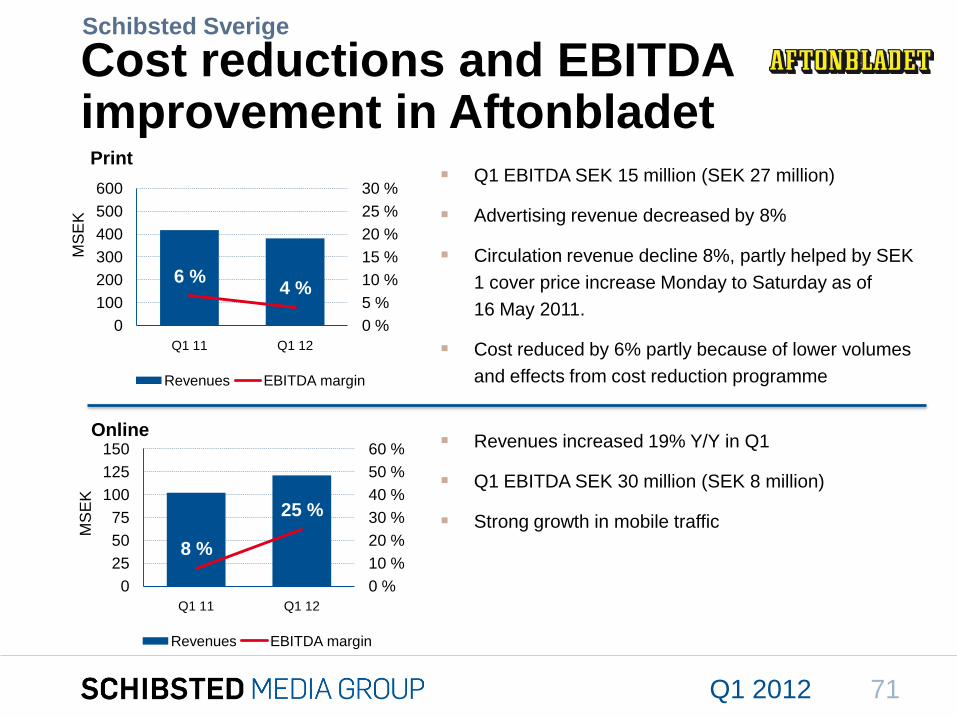
Q1 EBITDA SEK 15 million (SEK 27 million)
Advertising revenue decreased by 8%
Circulation revenue decline 8%, partly helped by SEK
1 cover price increase Monday to Saturday as of
16 May 2011.
Cost reduced by 6% partly because of lower volumes
and effects from cost reduction programme
Cost reductions and EBITDA improvement in Aftonbladet
Schibsted Sverige
Online Revenues increased 19% Y/Y in Q1
Q1 EBITDA SEK 30 million (SEK 8 million)
Strong growth in mobile traffic
MS
EK
MS
EK
71Q1 2012
6 %4 %
0 %
5 %
10 %
15 %
20 %
25 %
30 %
0
100
200
300
400
500
600
Q1 11 Q1 12
Revenues EBITDA margin
8 %
25 %
0 %
10 %
20 %
30 %
40 %
50 %
60 %
0
25
50
75
100
125
150
Q1 11 Q1 12
Revenues EBITDA margin
To get back,
Turn off ’CLASSIFICED’ via
2. Deactivate by clicking off the
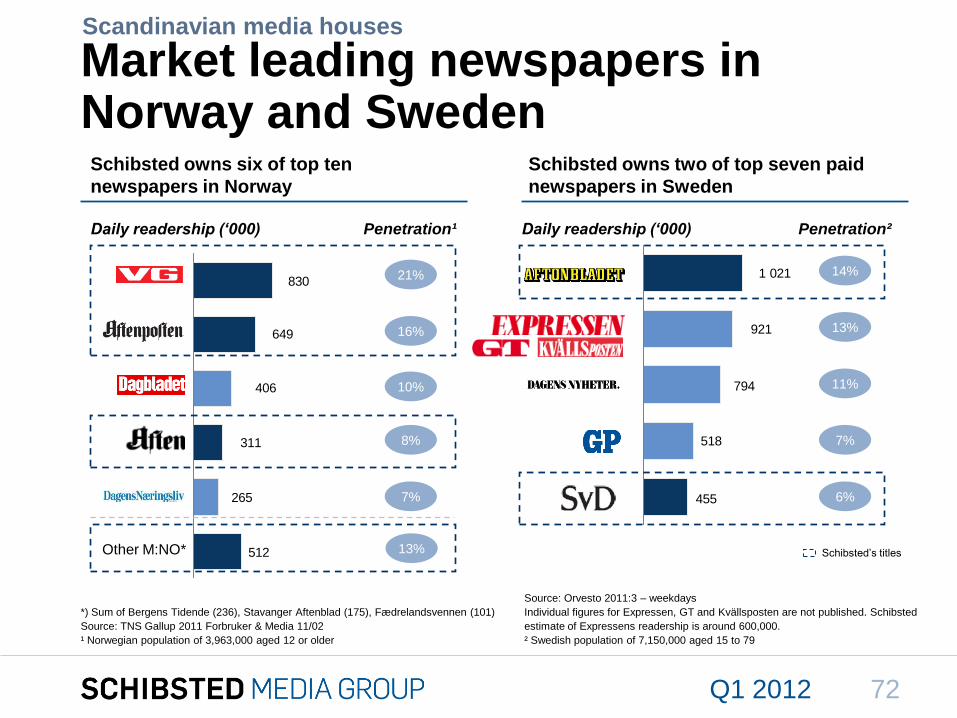
Market leading newspapers in Norway and Sweden
455
518
794
921
1 021830
649
406
311
265
512
Schibsted owns six of top ten
newspapers in Norway
Daily readership (‘000) Penetration¹ Daily readership (‘000) Penetration²
Source: Orvesto 2011:3 – weekdays
Individual figures for Expressen, GT and Kvällsposten are not published. Schibsted
estimate of Expressens readership is around 600,000.
² Swedish population of 7,150,000 aged 15 to 79
Schibsted owns two of top seven paid
newspapers in Sweden
Schibsted’s titles
21%
16%
10%
8%
7%
14%
13%
11%
7%
6%
Other M:NO* 13%
72Q1 2012
*) Sum of Bergens Tidende (236), Stavanger Aftenblad (175), Fædrelandsvennen (101)
Source: TNS Gallup 2011 Forbruker & Media 11/02
¹ Norwegian population of 3,963,000 aged 12 or older
Scandinavian media houses
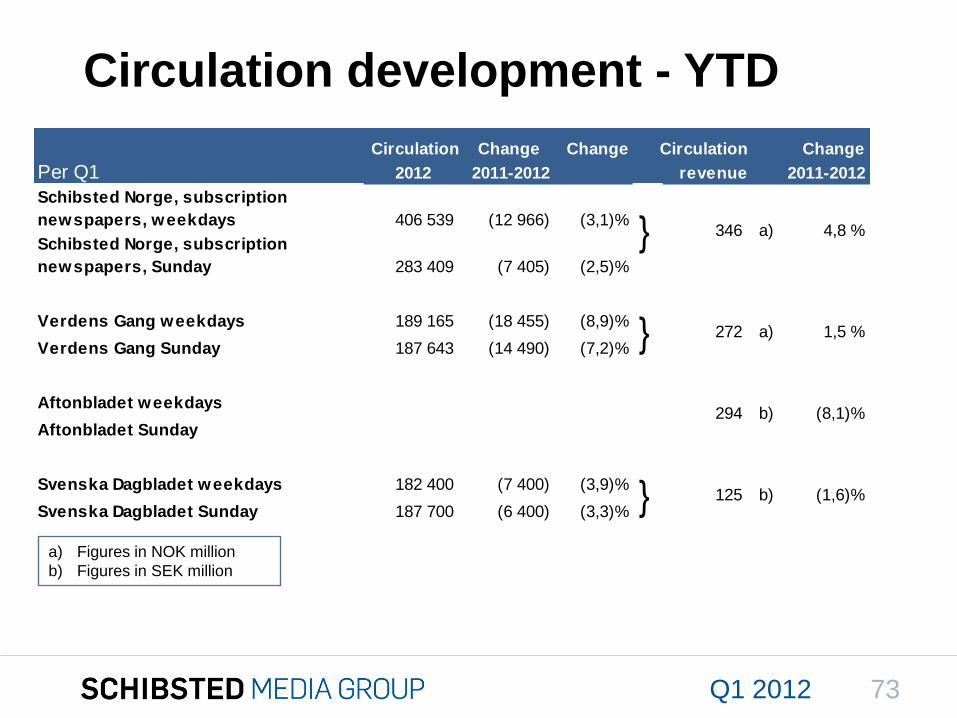
Circulation development - YTD
Circulation Change Change Circulation Change
Per Q1 2012 2011-2012 revenue 2011-2012
Schibsted Norge, subscription
newspapers, weekdays 406 539 (12 966) (3,1)%
Schibsted Norge, subscription
newspapers, Sunday 283 409 (7 405) (2,5)%
Verdens Gang weekdays 189 165 (18 455) (8,9)%
Verdens Gang Sunday 187 643 (14 490) (7,2)%
Aftonbladet weekdays
Aftonbladet Sunday
Svenska Dagbladet weekdays 182 400 (7 400) (3,9)%
Svenska Dagbladet Sunday 187 700 (6 400) (3,3)% } 125 b) (1,6)%
}
} 272
294
1,5 %
a) 4,8 %
(8,1)%
a)
b)
346
a) Figures in NOK million
b) Figures in SEK million
Q1 2012 73
To get back,
Turn off ’CLASSIFICED’ via
2. Deactivate by clicking off the
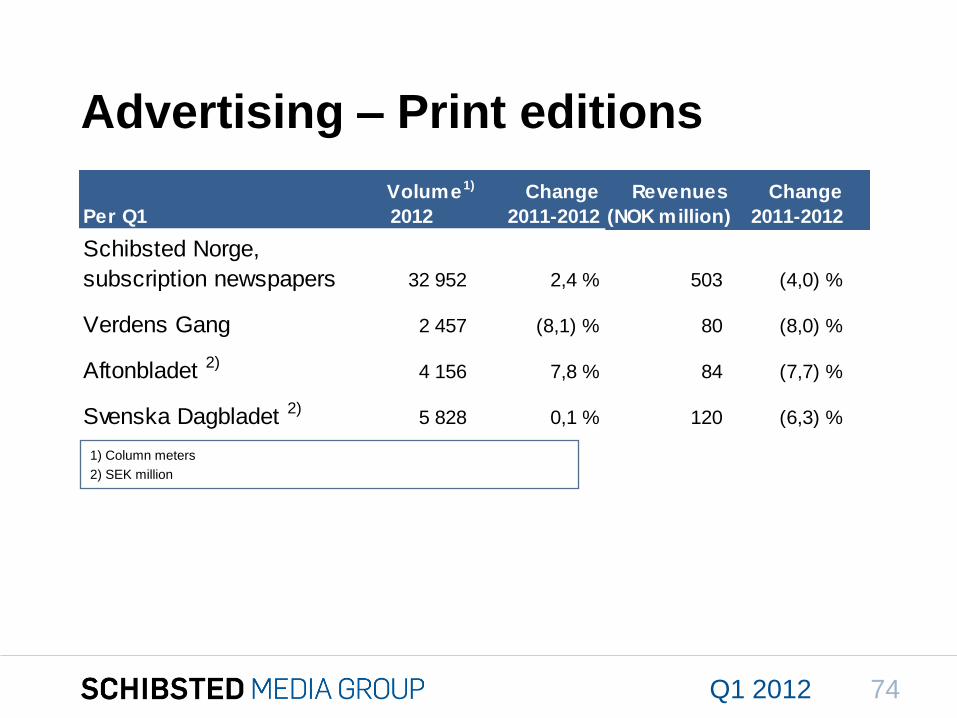
Advertising – Print editions
1) Column meters
2) SEK million
Volume1) Change Revenues Change
Per Q1 2012 2011-2012 (NOK million) 2011-2012
Schibsted Norge,
subscription newspapers 32 952 2,4 % 503 (4,0) %
Verdens Gang 2 457 (8,1) % 80 (8,0) %
Aftonbladet 2)4 156 7,8 % 84 (7,7) %
Svenska Dagbladet 2)5 828 0,1 % 120 (6,3) %
Q1 2012 74
To get back,
Turn off ’CLASSIFICED’ via
2. Deactivate by clicking off the
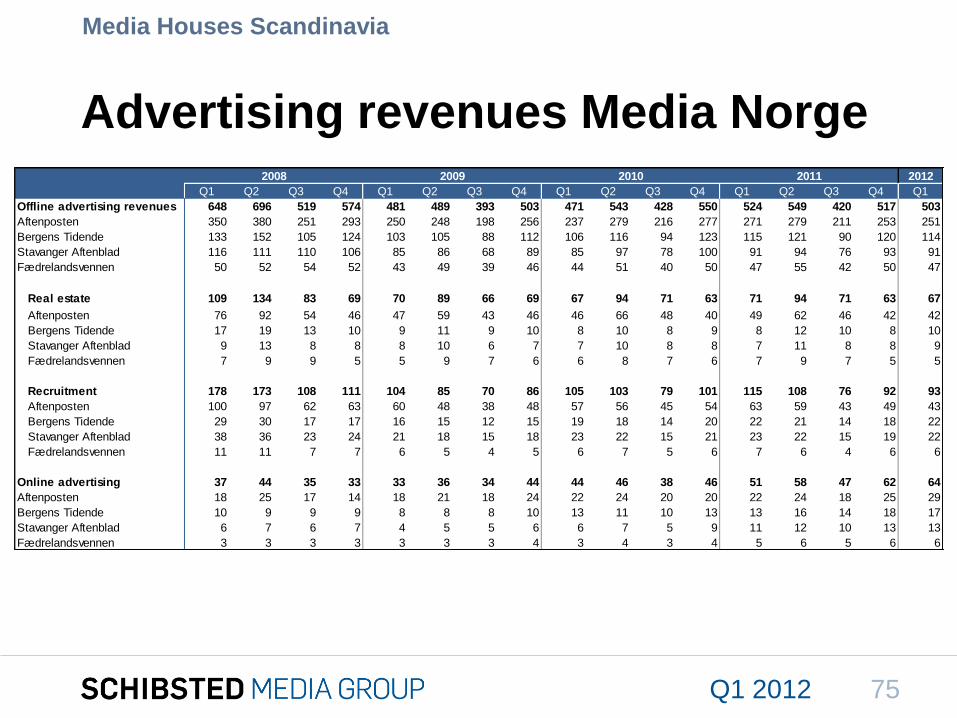
Advertising revenues Media Norge
Media Houses Scandinavia
75Q1 2012
Q1 Q2 Q3 Q4 Q1 Q2 Q3 Q4 Q1 Q2 Q3 Q4 Q1 Q2 Q3 Q4 Q1
Offline advertising revenues 648 696 519 574 481 489 393 503 471 543 428 550 524 549 420 517 503
Aftenposten 350 380 251 293 250 248 198 256 237 279 216 277 271 279 211 253 251
Bergens Tidende 133 152 105 124 103 105 88 112 106 116 94 123 115 121 90 120 114
Stavanger Aftenblad 116 111 110 106 85 86 68 89 85 97 78 100 91 94 76 93 91
Fædrelandsvennen 50 52 54 52 43 49 39 46 44 51 40 50 47 55 42 50 47
Real estate 109 134 83 69 70 89 66 69 67 94 71 63 71 94 71 63 67
Aftenposten 76 92 54 46 47 59 43 46 46 66 48 40 49 62 46 42 42
Bergens Tidende 17 19 13 10 9 11 9 10 8 10 8 9 8 12 10 8 10
Stavanger Aftenblad 9 13 8 8 8 10 6 7 7 10 8 8 7 11 8 8 9
Fædrelandsvennen 7 9 9 5 5 9 7 6 6 8 7 6 7 9 7 5 5
Recruitment 178 173 108 111 104 85 70 86 105 103 79 101 115 108 76 92 93
Aftenposten 100 97 62 63 60 48 38 48 57 56 45 54 63 59 43 49 43
Bergens Tidende 29 30 17 17 16 15 12 15 19 18 14 20 22 21 14 18 22
Stavanger Aftenblad 38 36 23 24 21 18 15 18 23 22 15 21 23 22 15 19 22
Fædrelandsvennen 11 11 7 7 6 5 4 5 6 7 5 6 7 6 4 6 6
Online advertising 37 44 35 33 33 36 34 44 44 46 38 46 51 58 47 62 64
Aftenposten 18 25 17 14 18 21 18 24 22 24 20 20 22 24 18 25 29
Bergens Tidende 10 9 9 9 8 8 8 10 13 11 10 13 13 16 14 18 17
Stavanger Aftenblad 6 7 6 7 4 5 5 6 6 7 5 9 11 12 10 13 13
Fædrelandsvennen 3 3 3 3 3 3 3 4 3 4 3 4 5 6 5 6 6
2008 2009 2010 2011 2012
To get back,
Turn off ’CLASSIFICED’ via
2. Deactivate by clicking off the
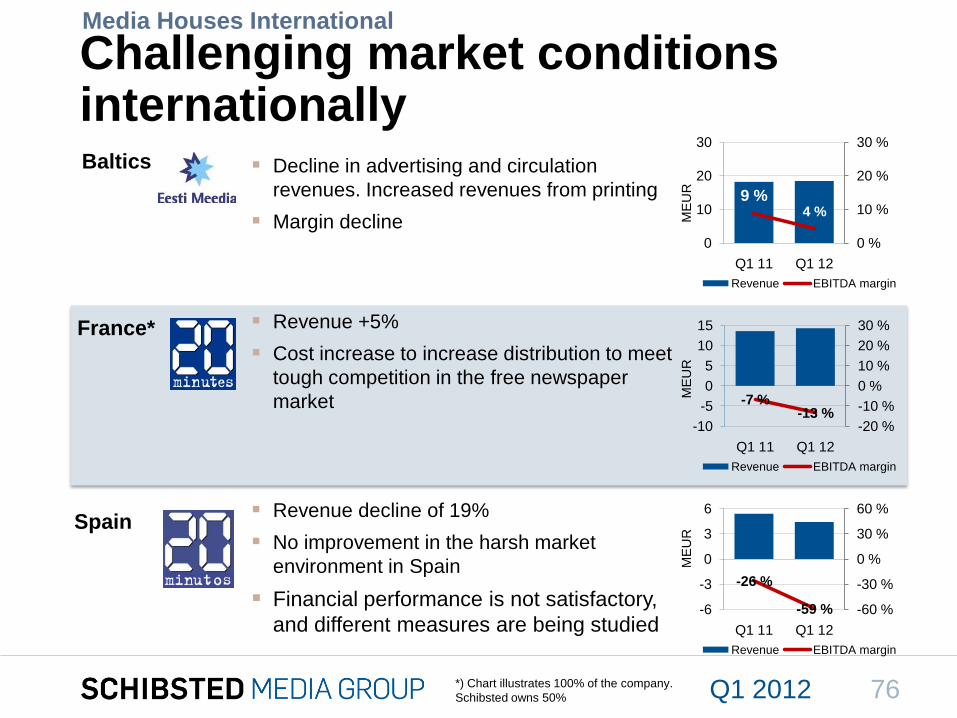
Challenging market conditions internationallyBaltics
France*
Spain
Decline in advertising and circulation
revenues. Increased revenues from printing
Margin decline
Revenue +5%
Cost increase to increase distribution to meet
tough competition in the free newspaper
market
Revenue decline of 19%
No improvement in the harsh market
environment in Spain
Financial performance is not satisfactory,
and different measures are being studied
Media Houses International
*) Chart illustrates 100% of the company.
Schibsted owns 50%M
EU
RM
EU
RM
EU
R76Q1 2012
-26 %
-59 % -60 %
-30 %
0 %
30 %
60 %
-6
-3
0
3
6
Q1 11 Q1 12
Revenue EBITDA margin
-7 %-13 %
-20 %
-10 %
0 %
10 %
20 %
30 %
-10
-5
0
5
10
15
Q1 11 Q1 12
Revenue EBITDA margin
9 %4 %
0 %
10 %
20 %
30 %
0
10
20
30
Q1 11 Q1 12
Revenue EBITDA margin
To get back,
Turn off ’CLASSIFICED’ via
2. Deactivate by clicking off the
Visit Schibsted’s homepages
www.schibsted.com/ir
Jo Christian Steigedal, VP Investor Relations
Tel: +47 2310 6600
Investor information
Schibsted ASA
Apotekergaten 10, P.O. Box 490 Sentrum, NO-0105 Oslo
Tel: +47 23 10 66 00. Fax: +47 23 10 66 01. E-mail:
www.schibsted.com
77Q1 2012

78Q1 2012