Embed Size (px)
Citation preview

3MQuarterly Statement
3 Month 2017

Quarterly Statement 3 Months 2017
1
Contents 1 Salzgitter Group Figures 2 Profitability of the Group and Business Units 3
Earnings Situation within the Group 3 Strip Steel Business Unit 4 Plate / Section Steel Business Unit 6 Mannesmann Business Unit 8 Trading Business Unit 9 Technology Business Unit 10 Industrial Participations / Consolidation 11
Financial Position and Net Assets 12 Employees 14 Guidance, Opportunities and Risk Report 15 Interim Income Report 18 Notes 22
Contents
Quarterly Statement 3 Months 2017
2
Q1 2017 Q1 20161) +/–
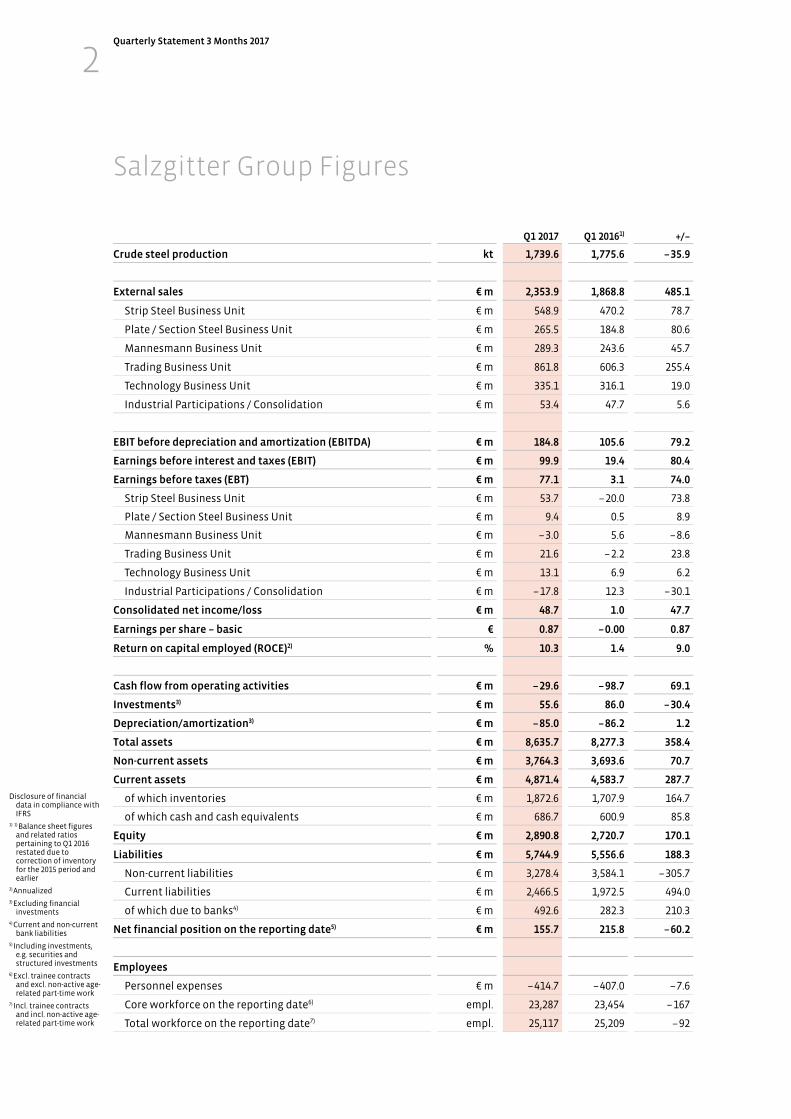
Crude steel production kt 1,739.6 1,775.6 – 35.9
External sales € m 2,353.9 1,868.8 485.1
Strip Steel Business Unit € m 548.9 470.2 78.7
Plate / Section Steel Business Unit € m 265.5 184.8 80.6
Mannesmann Business Unit € m 289.3 243.6 45.7
Trading Business Unit € m 861.8 606.3 255.4
Technology Business Unit € m 335.1 316.1 19.0
Industrial Participations / Consolidation € m 53.4 47.7 5.6
EBIT before depreciation and amortization (EBITDA) € m 184.8 105.6 79.2
Earnings before interest and taxes (EBIT) € m 99.9 19.4 80.4
Earnings before taxes (EBT) € m 77.1 3.1 74.0
Strip Steel Business Unit € m 53.7 – 20.0 73.8
Plate / Section Steel Business Unit € m 9.4 0.5 8.9
Mannesmann Business Unit € m – 3.0 5.6 – 8.6
Trading Business Unit € m 21.6 – 2.2 23.8
Technology Business Unit € m 13.1 6.9 6.2
Industrial Participations / Consolidation € m – 17.8 12.3 – 30.1
Consolidated net income/loss € m 48.7 1.0 47.7
Earnings per share – basic € 0.87 – 0.00 0.87
Return on capital employed (ROCE)2) % 10.3 1.4 9.0
Cash flow from operating activities € m – 29.6 – 98.7 69.1
Investments3) € m 55.6 86.0 – 30.4
Depreciation/amortization3) € m – 85.0 – 86.2 1.2
Total assets € m 8,635.7 8,277.3 358.4
Non-current assets € m 3,764.3 3,693.6 70.7
Current assets € m 4,871.4 4,583.7 287.7
of which inventories € m 1,872.6 1,707.9 164.7
of which cash and cash equivalents € m 686.7 600.9 85.8
Equity € m 2,890.8 2,720.7 170.1
Liabilities € m 5,744.9 5,556.6 188.3
Non-current liabilities € m 3,278.4 3,584.1 – 305.7
Current liabilities € m 2,466.5 1,972.5 494.0
of which due to banks4) € m 492.6 282.3 210.3
Net financial position on the reporting date5) € m 155.7 215.8 – 60.2
Employees
Personnel expenses € m – 414.7 – 407.0 – 7.6
Core workforce on the reporting date6) empl. 23,287 23,454 – 167
Total workforce on the reporting date7) empl. 25,117 25,209 – 92
Salzgitter Group Figures
Disclosure of financial data in compliance with IFRS
1) 1) Balance sheet figures and related ratios pertaining to Q1 2016 restated due to correction of inventory for the 2015 period and earlier
2) Annualized 3) Excluding financial
investments 4) Current and non-current
bank liabilities 5) Including investments,
e.g. securities and structured investments
6) Excl. trainee contracts and excl. non-active age-related part-time work
7) Incl. trainee contracts and incl. non-active age-related part-time work

Quarterly Statement 3 Months 2017
3
Earnings Situation within the Group
Q1 2017 Q1 20161)
Crude steel production kt 1,739.6 1,775.6
External sales € m 2,353.9 1,868.8
EBIT before depreciation and amortization (EBITDA) € m 184.8 105.6
Earnings before interest and taxes (EBIT) € m 99.9 19.4
Earnings before taxes (EBT) € m 77.1 3.1
Consolidated net income/loss € m 48.7 1.0
Return on capital employed (ROCE)2) % 10.3 1.4
Investments3) € m 55.6 86.0
Depreciation/amortization3) € m – 85.0 – 86.2
Cash flow from operating activities € m – 29.6 – 98.7
Net financial position4) € m 155.7 215.8
Equity ratio % 33.5 32.9
1) Balance sheet figures and related ratios pertaining to Q1 2016 restated due to correction of inventory for the 2015 period and earlier 2) Annualized 3) Excluding financial investments 4) Including investments, e.g. securities and structured investments
The Salzgitter Group was off to a good start to the financial year 2017 and, with its figures for the first three
months, recorded the highest quarterly result since 2008. This performance was mainly attributable to the
presentable results of the Strip Steel, Trading and Technology busi-ness units. Flanked by the effect of the
European Union’s trade defense measures, the Group’s internal programs laid the foundation for this
development.
The Salzgitter Group’s external sales (€ 2,353.9 million; first quarter of 2016: € 1,868.8 million) rose by a quarter in
a year-on-year comparison. The Trading, Strip Steel and Plate / Section Steel business units made major
contributions to this result, above all due to better average selling prices for steel products, with the other
business units also reporting growth. Pre-tax profit advanced to € 77.1 million (first quarter of 2016:
€ 3.1 million) and includes € –7.6 million from the Aurubis investment (first quarter of 2016: € 11.6 million) that
was negative due to the valuation of a bond exchangeable into shares. Earnings after taxes stood at
€ 48.7 million (first quarter of 2016: 1.0 million), which brings earnings per share to € 0.87 (first quarter of 2016:
€ –0.00), while return on capital employed (ROCE) came in at 10.3 % (first quarter of 2016: 1.4 %). With a net
financial position of € 155.7 million and an equity ratio of 33 %, the company has a sound balance sheet and a
comfortable financial basis.
Profitability of the Group and Business Units
Quarterly Statement 3 Months 2017
4
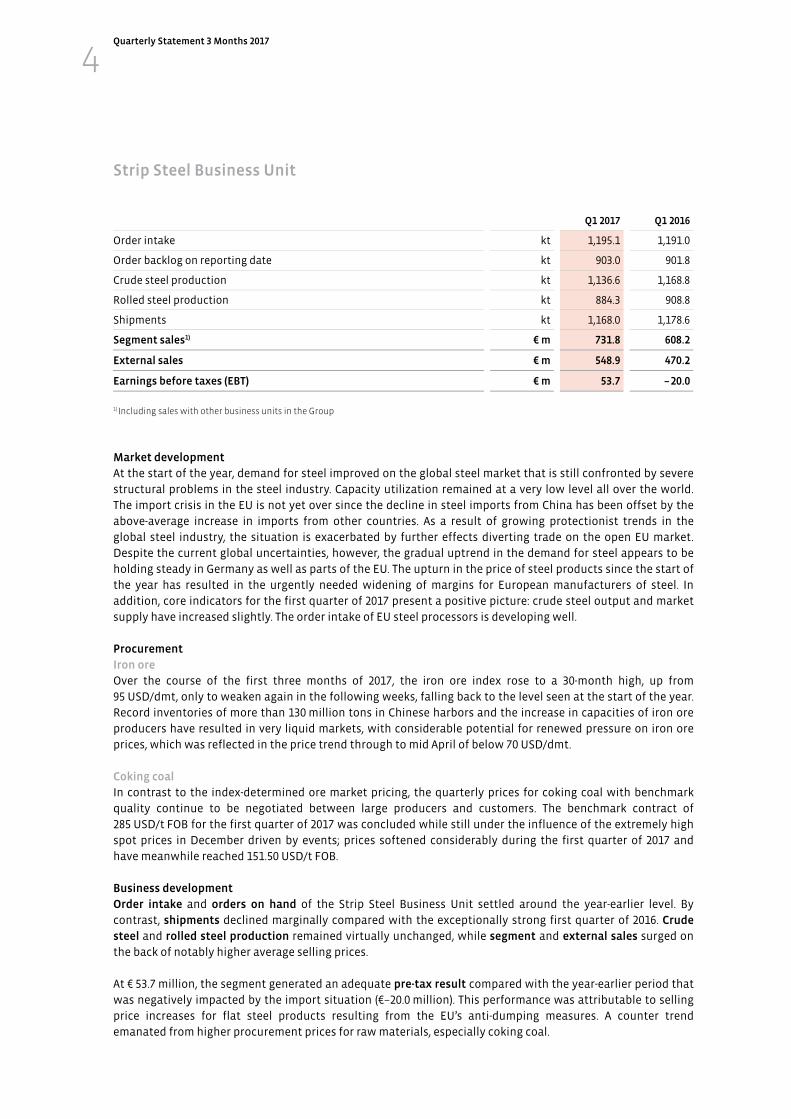
Strip Steel Business Unit
Q1 2017 Q1 2016
Order intake kt 1,195.1 1,191.0
Order backlog on reporting date kt 903.0 901.8
Crude steel production kt 1,136.6 1,168.8
Rolled steel production kt 884.3 908.8
Shipments kt 1,168.0 1,178.6
Segment sales1) € m 731.8 608.2
External sales € m 548.9 470.2
Earnings before taxes (EBT) € m 53.7 – 20.0
1) Including sales with other business units in the Group
Market development
At the start of the year, demand for steel improved on the global steel market that is still confronted by severe
structural problems in the steel industry. Capacity utilization remained at a very low level all over the world.
The import crisis in the EU is not yet over since the decline in steel imports from China has been offset by the
above-average increase in imports from other countries. As a result of growing protectionist trends in the
global steel industry, the situation is exacerbated by further effects diverting trade on the open EU market.
Despite the current global uncertainties, however, the gradual uptrend in the demand for steel appears to be
holding steady in Germany as well as parts of the EU. The upturn in the price of steel products since the start of
the year has resulted in the urgently needed widening of margins for European manufacturers of steel. In
addition, core indicators for the first quarter of 2017 present a positive picture: crude steel output and market
supply have increased slightly. The order intake of EU steel processors is developing well.
Procurement
Iron ore
Over the course of the first three months of 2017, the iron ore index rose to a 30-month high, up from
95 USD/dmt, only to weaken again in the following weeks, falling back to the level seen at the start of the year.
Record inventories of more than 130 million tons in Chinese harbors and the increase in capacities of iron ore
producers have resulted in very liquid markets, with considerable potential for renewed pressure on iron ore
prices, which was reflected in the price trend through to mid April of below 70 USD/dmt.
Coking coal
In contrast to the index-determined ore market pricing, the quarterly prices for coking coal with benchmark
quality continue to be negotiated between large producers and customers. The benchmark contract of
285 USD/t FOB for the first quarter of 2017 was concluded while still under the influence of the extremely high
spot prices in December driven by events; prices softened considerably during the first quarter of 2017 and
have meanwhile reached 151.50 USD/t FOB.
Business development
Order intake and orders on hand of the Strip Steel Business Unit settled around the year-earlier level. By
contrast, shipments declined marginally compared with the exceptionally strong first quarter of 2016. Crude
steel and rolled steel production remained virtually unchanged, while segment and external sales surged on
the back of notably higher average selling prices.
At € 53.7 million, the segment generated an adequate pre-tax result compared with the year-earlier period that
was negatively impacted by the import situation (€–20.0 million). This performance was attributable to selling
price increases for flat steel products resulting from the EU’s anti-dumping measures. A counter trend
emanated from higher procurement prices for raw materials, especially coking coal.
Quarterly Statement 3 Months 2017
5
Investments
The Strip Steel Business Unit is focusing its investments on new aggregates as well as on optimizing and
extending its existing facilities in 2017. To this end, the following projects in particular were advanced:
In order to strengthen its competitiveness, SZFG has invested a total of € 80 million in the construction of an
RH plant for the vacuum treatment of crude steel. The production of decarburized and desulphurized steels
and grades of the highest purity is intended to satisfy steadily growing customer requirements for specified
metallurgic composition and ease the capacity bottleneck in secondary metallurgy. Plant equipment is to be
further supplemented this year, and the plant is to go online.
During the blowing process on the converters hot steel gas is generated and captured in a boiler system,
cooled, refined and recovered for thermal reuse. The technological conversion of the cooling systems of all
three converter boilers is to be carried out. This measure will reduce the boiler systems’ energy requirements
by more than 10 %, and thereby lower the volume of natural gas purchased externally, as well as the CO2
emissions. Following the conversion of converter boiler B completed in 2016, converters A and C are to follow
on in 2017.

Quarterly Statement 3 Months 2017
6
Plate / Section Steel Business Unit
Q1 2017 Q1 2016
Order intake kt 586.1 637.0
Order backlog on reporting date kt 373.3 439.8
Crude steel production kt 254.1 296.7
Rolled steel production kt 598.8 548.7
Shipments1) kt 625.3 535.2
Segment sales2) € m 451.0 332.7
External sales € m 265.5 184.8
Earnings before taxes (EBT) € m 9.4 0.5
1) Excluding DMU Group 2) Including sales with other business units in the Group
Market development
The European the plate market continues to be dominated by production and supply capacities that
considerably exceed demand. Although the flow of Chinese imports into the EU has been massively stemmed,
this decline has been virtually offset by imports from non-EU countries such as Ukraine, South Korea, India and
Indonesia. The competitive situation can be described as very uneven. Western European heavy plate
manufacturers participating in current pipeline projects are operating at high capacity. The demand situation
in the on/offshore wind power is similarly satisfactory. By contrast, manufacturers with product structures
geared largely to merchandise are experiencing capacity utilization problems that partly do not result in offers
adequately reflecting the current trend in the cost of raw materials. This situation causes uncertainty on the
part of customers and consumers, with conflicting expectations regarding the further development of demand
and selling prices.
Price hikes in scrap steel on the European sections market and the associated increase in selling prices for
producers have contributed to improving the initially subdued demand. As early as January, however, it had
become evident that sales of the stockholding trade are weaker than expected. This resulted in a significant
increase in inventories here that caused a temporary decline in the order intake of the plants.
Procurement
Scrap steel
The start of the year in Germany saw price increases on the scrap steel market of between 25 and 38 €/t
depending on the grade and region driven by stronger demand of domestic consumers. In subsequent months,
prices fell within a range of between 15 and 20 €/t and then recovered again in March. As so often, the
determining factor for steel price declines in the European domestic markets and the immediate subsequent
recovery in prices was the buying patterns of Turkish scrap steel importers.
Business development
In the first three months of 2017, the order intake of the Plate / Section Steel Business Unit dropped below the
year-earlier figures. Stronger performance at Salzgitter Mannesmann Grobblech GmbH (MGB) was unable to
compensate for downturn in new orders at Peiner Träger GmbH (PTG) that were lower than the strong year-
earlier quarter. Moreover, since rolled steel output and shipments exceeded levels seen in the first quarter of
2016 due to the increase in tonnage in the heavy plate sector, orders on hand declined in a year on-year
comparison. Segment and external sales rose sharply in terms of selling prices and shipments.
At € 9.4 million, the segment lifted the pre-tax result compared with the first quarter of 2016 (€ 0.5 million).
While the heavy plate producers that received support from the release of order-related provisions made a
gratifying contribution to profit, PTG delivered a marginally negative result.
Quarterly Statement 3 Months 2017
7
Investments
In the Plate / Section Steel Business Unit, the “Plate Strategy – Finishing Section II” investment measure is
being realized in 2017 as part of the “Salzgitter 2021” growth program. This measure will enable the product
portfolio to be enlarged and an even stronger positioning in the higher-end grade segment to be achieved.

Quarterly Statement 3 Months 2017
8
Mannesmann Business Unit
Q1 2017 Q1 2016
Order intake € m 411.9 325.3
Order backlog on reporting date1) € m 457.7 458.3
Crude steel production Hüttenwerke Krupp Mannesmann (30 %) kt 348.9 310.0
Segment sales2) € m 416.3 327.6
External sales € m 289.3 243.6
Earnings before taxes (EBT) € m – 3.0 5.6
1) Tubes 2) Including sales with other business units in the Group
Market development
Steel output rose overall in the first quarter of 2017. Growth was particularly pronounced owing to demand
returning to normal levels in the energy industry in North America that had previously been hardest hit. Here,
seamless line pipe for oil country tubular goods and, supported by expectations of an upturn in strip steel
prices, welded line pipe were in demand. Requirements for seamless and welded precision steel tubes
remained stable.
Business development
The order intake of the Mannesmann Business Unit grew by a quarter compared with the year-earlier period,
which was especially attributable to Salzgitter Mannesmann Precision Tubes Group (SMP Group) and Salzgitter
Mannesmann Line Pipe GmbH (MLP). Orders on hand settled at the level of the previous year. Outside the group
of consolidated companies, order intake by the EUROPIPE Group (EP Group), a 50 %-percent participation
reported at equity, increased sharply, which was due in the main to the booking of the European gas pipeline
link (EUGAL). This booking and the Nord Stream 2 contract brought orders on hand to a considerably higher
level in a year-on-year comparison.
Shipments as well as segment and external sales exceeded the year-earlier figures on the back of growth in all
product segments. The key figures of the EP Group exceeded those of the first quarter of 2016 thanks to the
high delivery volumes of the German company, which compensated for counter developments in the United
States.
The business unit reported a pre-tax loss of € 3.0 million (first quarter 2016: € +5.6 million). The medium line pipe
segment as well as the precision and stainless steel tubes groups reduced their pre-tax losses. However, the
result of the EP Group, a company accounted for at equity, that almost achieved breakeven, as well as HKM’s
positive result dropped below the profit contributions of the prior year period.
Investments
The Mannesmann Business Unit is principally concentrating on replacement investments in 2017. This also
includes, for instance, renewing the automation system of the separation plant in the Zeithain rolling mill. In
addition, capital expenditure measures to raise plant performance at the SMP Group’s Hamm location are
continuing, along with organizational and logistics optimization.
Quarterly Statement 3 Months 2017
9
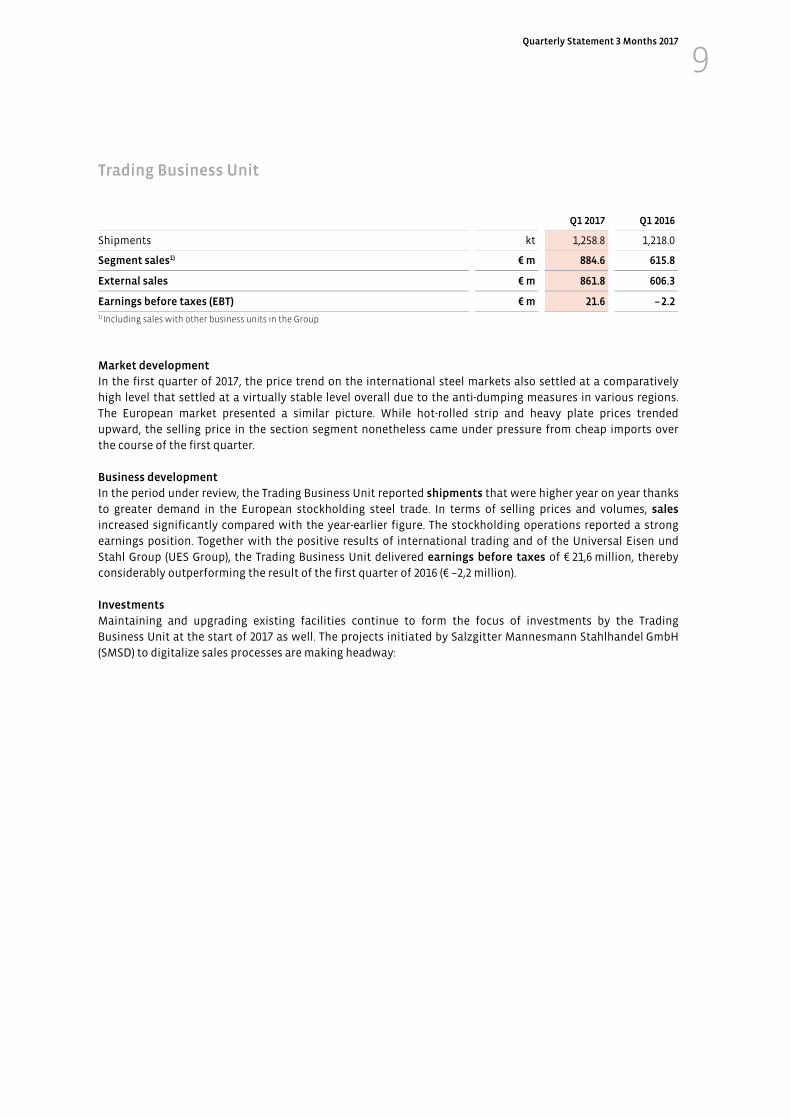
Trading Business Unit
Q1 2017 Q1 2016
Shipments kt 1,258.8 1,218.0
Segment sales1) € m 884.6 615.8
External sales € m 861.8 606.3
Earnings before taxes (EBT) € m 21.6 – 2.2
1) Including sales with other business units in the Group
Market development
In the first quarter of 2017, the price trend on the international steel markets also settled at a comparatively
high level that settled at a virtually stable level overall due to the anti-dumping measures in various regions.
The European market presented a similar picture. While hot-rolled strip and heavy plate prices trended
upward, the selling price in the section segment nonetheless came under pressure from cheap imports over
the course of the first quarter.
Business development
In the period under review, the Trading Business Unit reported shipments that were higher year on year thanks
to greater demand in the European stockholding steel trade. In terms of selling prices and volumes, sales
increased significantly compared with the year-earlier figure. The stockholding operations reported a strong
earnings position. Together with the positive results of international trading and of the Universal Eisen und
Stahl Group (UES Group), the Trading Business Unit delivered earnings before taxes of € 21,6 million, thereby
considerably outperforming the result of the first quarter of 2016 (€ –2,2 million).
Investments
Maintaining and upgrading existing facilities continue to form the focus of investments by the Trading
Business Unit at the start of 2017 as well. The projects initiated by Salzgitter Mannesmann Stahlhandel GmbH
(SMSD) to digitalize sales processes are making headway:
Quarterly Statement 3 Months 2017
10
Technology Business Unit
Q1 2017 Q1 2016
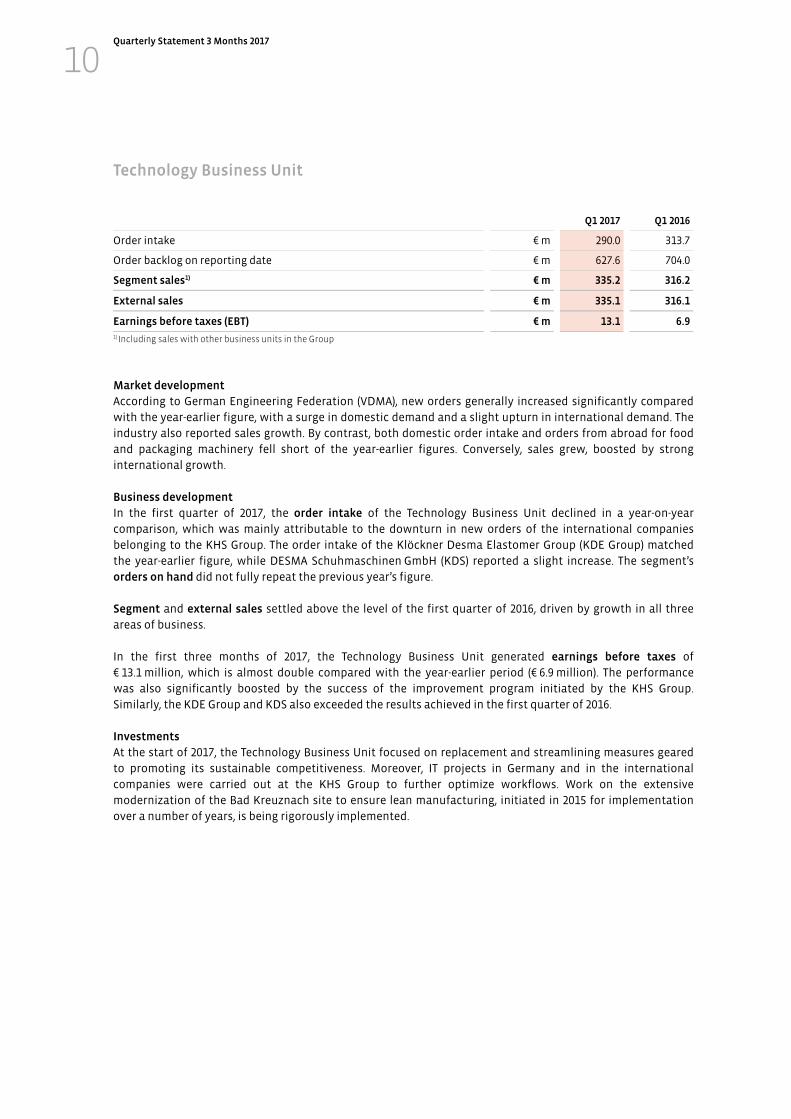
Order intake € m 290.0 313.7
Order backlog on reporting date € m 627.6 704.0
Segment sales1) € m 335.2 316.2
External sales € m 335.1 316.1
Earnings before taxes (EBT) € m 13.1 6.9
1) Including sales with other business units in the Group
Market development
According to German Engineering Federation (VDMA), new orders generally increased significantly compared
with the year-earlier figure, with a surge in domestic demand and a slight upturn in international demand. The
industry also reported sales growth. By contrast, both domestic order intake and orders from abroad for food
and packaging machinery fell short of the year-earlier figures. Conversely, sales grew, boosted by strong
international growth.
Business development
In the first quarter of 2017, the order intake of the Technology Business Unit declined in a year-on-year
comparison, which was mainly attributable to the downturn in new orders of the international companies
belonging to the KHS Group. The order intake of the Klöckner Desma Elastomer Group (KDE Group) matched
the year-earlier figure, while DESMA Schuhmaschinen GmbH (KDS) reported a slight increase. The segment’s
orders on hand did not fully repeat the previous year’s figure.
Segment and external sales settled above the level of the first quarter of 2016, driven by growth in all three
areas of business.
In the first three months of 2017, the Technology Business Unit generated earnings before taxes of
€ 13.1 million, which is almost double compared with the year-earlier period (€ 6.9 million). The performance
was also significantly boosted by the success of the improvement program initiated by the KHS Group.
Similarly, the KDE Group and KDS also exceeded the results achieved in the first quarter of 2016.
Investments
At the start of 2017, the Technology Business Unit focused on replacement and streamlining measures geared
to promoting its sustainable competitiveness. Moreover, IT projects in Germany and in the international
companies were carried out at the KHS Group to further optimize workflows. Work on the extensive
modernization of the Bad Kreuznach site to ensure lean manufacturing, initiated in 2015 for implementation
over a number of years, is being rigorously implemented.
Quarterly Statement 3 Months 2017
11
Industrial Participations / Consolidation
Q1 2017 Q1 2016
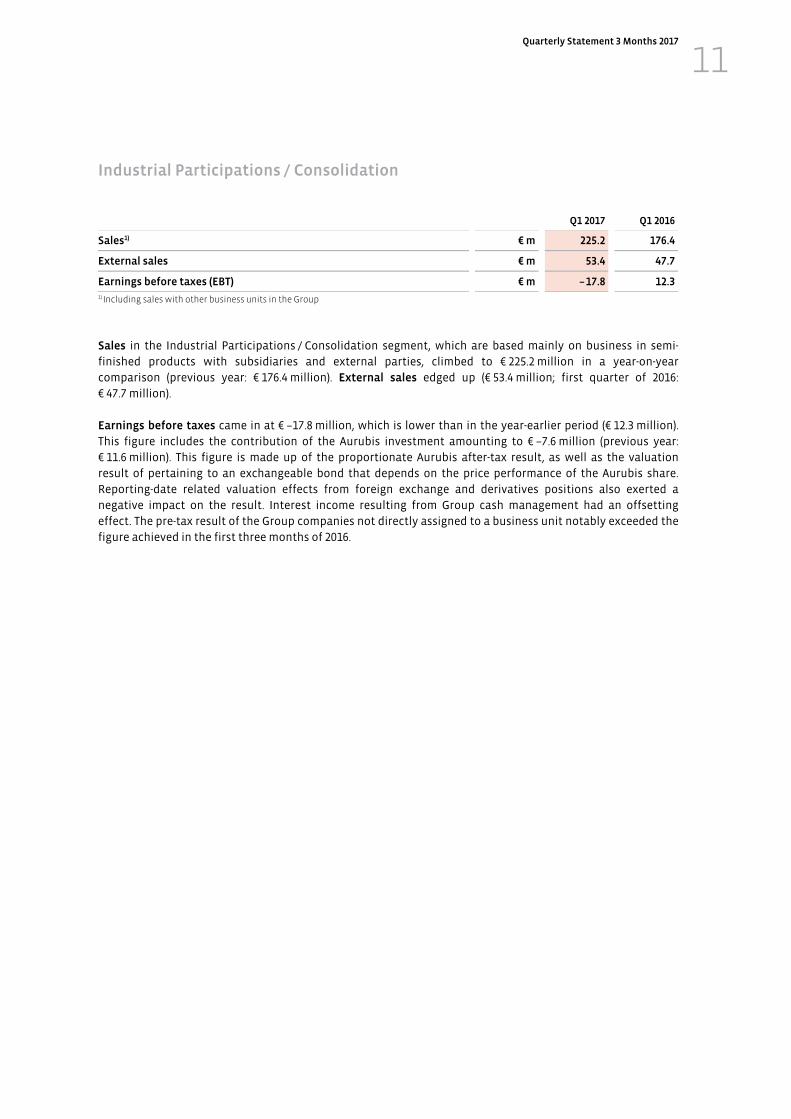
Sales1) € m 225.2 176.4
External sales € m 53.4 47.7
Earnings before taxes (EBT) € m – 17.8 12.3
1) Including sales with other business units in the Group
Sales in the Industrial Participations / Consolidation segment, which are based mainly on business in semi-
finished products with subsidiaries and external parties, climbed to € 225.2 million in a year-on-year
comparison (previous year: € 176.4 million). External sales edged up (€ 53.4 million; first quarter of 2016:
€ 47.7 million).
Earnings before taxes came in at € –17.8 million, which is lower than in the year-earlier period (€ 12.3 million).
This figure includes the contribution of the Aurubis investment amounting to € –7.6 million (previous year:
€ 11.6 million). This figure is made up of the proportionate Aurubis after-tax result, as well as the valuation
result of pertaining to an exchangeable bond that depends on the price performance of the Aurubis share.
Reporting-date related valuation effects from foreign exchange and derivatives positions also exerted a
negative impact on the result. Interest income resulting from Group cash management had an offsetting
effect. The pre-tax result of the Group companies not directly assigned to a business unit notably exceeded the
figure achieved in the first three months of 2016.
Quarterly Statement 3 Months 2017
12
Explanations on the balance sheet
The total assets of the Salzgitter Group rose by € 186 million in the current reporting period compared with
December 31, 2016.
Non-current assets (€ +65 million) increased owing in particular to the higher level of shares in the companies
accounted for using the equity method (€ +64 million), which was especially attributable to the good results of
these companies. In the reporting period, the sum total of scheduled depreciation and amortization of fixed
assets (€ –85 million) came in above the level of investments (€ +56 million) and reduced the non-current assets.
Non-current trade receivables as well as other receivables and assets increased in a year-on-year comparison
(€ +50 million) as opposed to income tax assets that declined (€ –13 million). The growth in current assets
(€ +121 million) resulted mainly from the higher level of trade receivables (€ +243 million). This was offset by lower
cash and cash equivalents (€ –131 million) and a decline in other receivables and other assets (€ –18 million).
On the liabilities side, equity grew on the back of the good result (€ +39 million). The equity ratio nevertheless
remains at the level of the previous financial year and amounts to a sound 33.5 %. Non-current liabilities were
€ 20 million higher compared with the prior-year reporting date. Non-current other provisions increased
(€ +20 million) while pension provisions declined (€ –11 million). Current liabilities climbed by €127 million,
mainly due to the increase in trade payables (€ +69 million) as well as the higher level of other current liabilities
(€ +78 million). A decline in provisions (€ –36 million) had a countermanding effect in the area of current
liabilities.
The net financial position dropped above all due to the increase in working capital to € 156 million (12/31/2016:
€ 302 million). Cash investment, including securities of € 1.08 billion (12/31/2016: € 1.22 billion), was offset by
liabilities of € 969 million (12/31/2016: € 916 million), of which € 493 million were owed to banks (12/31/2016:
€ 483 million).
Financial Position and Net Assets
Quarterly Statement 3 Months 2017
13
Notes to the cash flow statement
With a positive pre-tax result of € 77 million, the cash flow from operating activities was nonetheless negative
at € 30 million (previous year: € –99 million) due in particular to the higher level of trade receivables.
The cash outflow from investing activities of € 95 million (previous year: € –87 million) mainly reflects
disbursements for capital expenditure in intangible assets and property, plant and equipment (€ –66 million).
Interest payments, along with the redemption of loans, constituted cash outflow from financing activities of
€ 8 million (previous year: € –47 million).
Owing to the negative cash flow, cash and cash equivalents (€ 687 million) dropped accordingly compared with
December 31, 2016.
Quarterly Statement 3 Months 2017
14
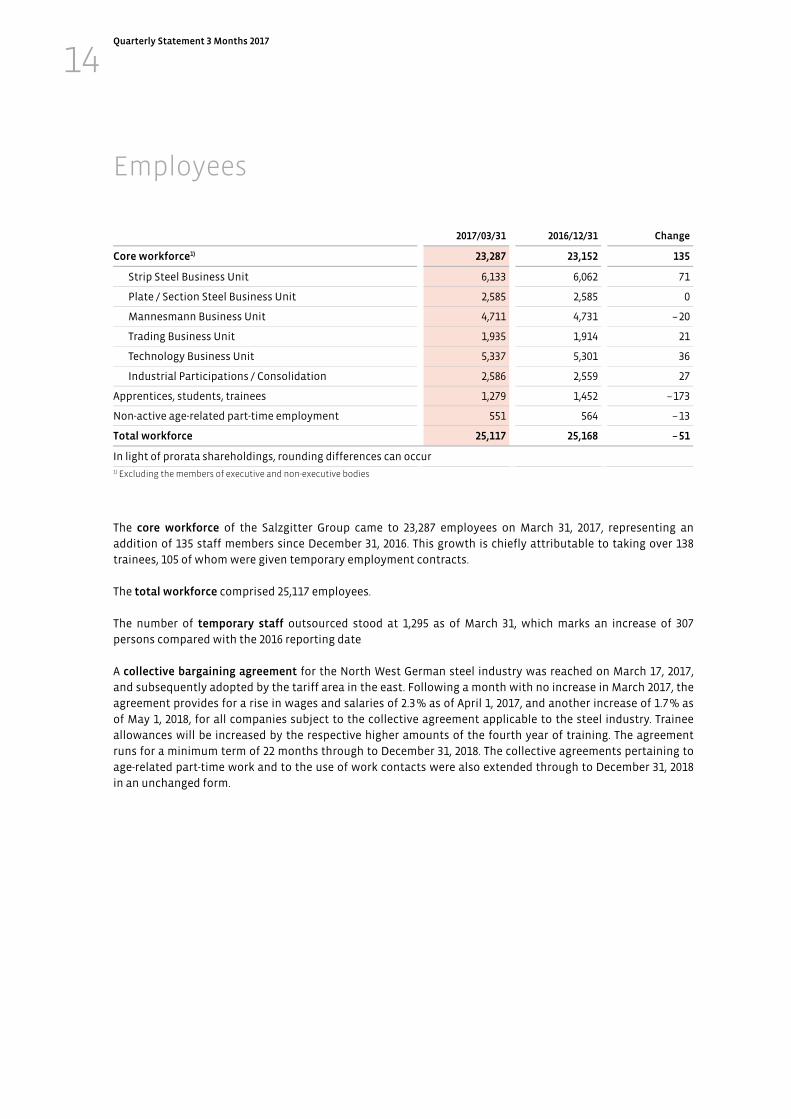
2017/03/31 2016/12/31 Change
Core workforce1) 23,287 23,152 135
Strip Steel Business Unit 6,133 6,062 71
Plate / Section Steel Business Unit 2,585 2,585 0
Mannesmann Business Unit 4,711 4,731 – 20
Trading Business Unit 1,935 1,914 21
Technology Business Unit 5,337 5,301 36
Industrial Participations / Consolidation 2,586 2,559 27
Apprentices, students, trainees 1,279 1,452 – 173
Non-active age-related part-time employment 551 564 – 13
Total workforce 25,117 25,168 – 51
In light of prorata shareholdings, rounding differences can occur
1) Excluding the members of executive and non-executive bodies
The core workforce of the Salzgitter Group came to 23,287 employees on March 31, 2017, representing an
addition of 135 staff members since December 31, 2016. This growth is chiefly attributable to taking over 138
trainees, 105 of whom were given temporary employment contracts.
The total workforce comprised 25,117 employees.
The number of temporary staff outsourced stood at 1,295 as of March 31, which marks an increase of 307
persons compared with the 2016 reporting date
A collective bargaining agreement for the North West German steel industry was reached on March 17, 2017,
and subsequently adopted by the tariff area in the east. Following a month with no increase in March 2017, the
agreement provides for a rise in wages and salaries of 2.3 % as of April 1, 2017, and another increase of 1.7 % as
of May 1, 2018, for all companies subject to the collective agreement applicable to the steel industry. Trainee
allowances will be increased by the respective higher amounts of the fourth year of training. The agreement
runs for a minimum term of 22 months through to December 31, 2018. The collective agreements pertaining to
age-related part-time work and to the use of work contacts were also extended through to December 31, 2018
in an unchanged form.
Employees

Quarterly Statement 3 Months 2017
15
Compared with the previous year, the business units anticipate that business in 2017 will develop as follows:
Thanks to selling prices rising in the EU steel market, the Strip Steel Business Unit expects a more positive
development of business. Assuming that robust demand holds steady, a notable increase in sales can be
expected. Supported by the measures and effects from various programs and projects, among others the
commissioning the RH vacuum plant in the steel mill, a significantly improved positive pre-tax result is
envisaged despite the tense market environment including in the price volatility of raw materials.
The Plate / Section Steel Business Unit will remain exposed to a difficult market environment in the current
financial year. Satisfactory capacity utilization is nevertheless expected for the two heavy plate producers. In
this context, the production of input materials for the Nord Stream II as well as the EUGAL contracts will
contribute to notable basic capacity utilization at the Mülheim mill. Moreover, the two companies will benefit
from the extensive cost cutting and efficiency enhancement measures initiated in 2016. Passing on the full
scope of hikes in raw material costs in a timely manner is, however, particularly challenging. Capacity
utilization in the section steel business is likely to run slightly below the satisfactory level of the previous year.
The volatile scrap price, however, encourages speculative purchasing by customers, with the respective impact
on order intake and the result. Drastic increases in grid usage fees for procuring electricity will pose an
additional burden. All in all, the business unit anticipates a notable volume- and selling price-induced increase
in sales as well as a result before taxes of around breakeven.
The development of the Mannesmann Business Unit’s companies is also proving very disparate in 2017. While
the German large-diameter pipe mills report very good capacity utilization due to bookings of major orders last
year and in the first quarter of 2017, the order situation on the North American market has deteriorated further.
The segments of medium-diameter line pipe, precision and stainless steel tubes anticipate an at minimum
hesitant recovery, albeit against the backdrop of a consistently tight margin situation. Rising shipment
volumes, supported by higher average prices, should result in moderate sales growth in the segment. In
conjunction with the profit improvement programs, both initiated and planned, a notably improved, though
still negative, pre-tax result is predicted.
In the financial year 2017, the Trading Business Unit anticipates marked sales growth on the back of the
recovery in the international project business, as well as an increase in the sale of pre-processed products.
Support should also emanate from expanding the customer base in the context of stepping up the
digitalization of sales. As it cannot be assumed that the temporary widening of margins attributable to the
steel price trend in 2016 will repeat to the same ex-tent in the financial year 2017, a very satisfactory pre-tax
profit is anticipated, albeit at a discernibly lower level than in the previous year.
Based on a high order backlog, the Technology Business Unit anticipates that sales will remain stable. In view
of the fierce price-led competition for the project business, the KHS Group will rely on growth in the profitable
product segments as well as on expanding its service business. Moreover, above all the efficiency enhancing
measures introduced under the new “Fit4Future 3.0” program are likely to develop their positive impact. In
conjunction with the promising out-look for the other specialist mechanical engineering companies, a tangible
increase in pre-tax profit is expected.
Guidance, Opportunities and Risk Report
Quarterly Statement 3 Months 2017
16
Against this backdrop, and following a good opening quarter, Salzgitter AG (SZAG) lifted its profit forecast on
May 2, 2017, which we affirm below. We anticipate:
an increase in sales to around € 9 billion,
a pre-tax profit of between € 125 million and € 175 million, as well as
a return on capital employed that is discernibly higher year on year.
The forward-looking statements on the individual business units assume the absence of renewed recessionary
developments. Instead, we anticipate that the economies of our fiercely contested main markets will continue
to firm up in the current financial year. As in recent years, please note that opportunities and risks from
currently unforeseeable trends in selling prices, input material prices and capacity level developments, as well
as exchange rate fluctuations, may considerably affect performance in the course of the financial year 2017.
The resulting fluctuation in the consolidated pre-tax result may be within a considerable range, either to the
positive or to the negative. The dimensions of this range become clear if one considers that, with around
12 million tons of steel products p.a. sold by the Strip Steel, Plate / Section Steel, Mannesmann and Trading
business units, an average € 25 change in the margin per ton is sufficient to cause a variation in the annual
result of more than € 300 million. Moreover, the accuracy of the company's planning is restricted by the volatile
cost of raw materials and shorter contractual durations, on the procurement as well as on the sales side.
Quarterly Statement 3 Months 2017
17
Risk management
At the time of reporting there were no risks which could endanger the Salzgitter Group as a going concern.
With regard to the individual opportunities and risks, we make reference to the Annual Report 2016.
In terms of risks arising from strained market conditions, including the volatility of raw materials prices, the
effects on the results of the companies in the current year have been factored in to the extent they can be
estimated. An additional burdening effect is meanwhile emanating from the numerous, often purely trade
defense mechanisms from countries outside the EU that are no longer aimed at China alone but also at EU
producers in equal measure. Salzgitter AG (SZAG) is directly affected by an ongoing anti-dumping lawsuit in the
US against heavy plate and wide strip imports from twelve countries, including Germany.
The anti-dumping duty of 22.9 % imposed on the heavy plate of Salzgitter Mannesmann Grobblech GmbH (MGB)
and Ilsenburger Grobblech GmbH (ILG) at the end of March is incomprehensible to the Group as its companies
produced evidence based on data verified by the authorities that they did not practice price dumping and,
furthermore, the preliminary anti-dumping duties announced in November 2016 stood at 5 % for SZAG.
Moreover, 90 % of the MGB and ILG exports were delivered to an associated US company, specifically Berg Steel
Pipe Corporation (BSPC), a subsidiary of EUROPIPE GmbH (EP). These deliveries concerned special plate for the
production of pipes for the oil and gas industry that the US steel industry is anyway only able to produce to a
limited extent or not at all.
The International Trade Commission (ITC) concluded its analysis on damage to the US- market from imports of
heavy plate and wide strip on May 5, 2017. As feared, the ITC ascertained that the US market has sustained
damage in this market segment. The anti-dumping duties announced will therefore remain in force until a
possible review (summer 2018 at the earliest).
Together with its lawyers, SZAG is analyzing the final dumping margins calculated by the US-Department of
Commerce (DOC). The Group reserves the right to take legal action against the dumping decision. Brussels and
Berlin have indicated that there could be willingness on the part of the European Commission and the German
government to take the anti-dumping decision against SZAG and Dillinger Hütte as grounds for bringing a
lawsuit against the US before the WTO. It would be two to three years before a ruling could be expected from
the WTO.
Quarterly Statement 3 Months 2017
18
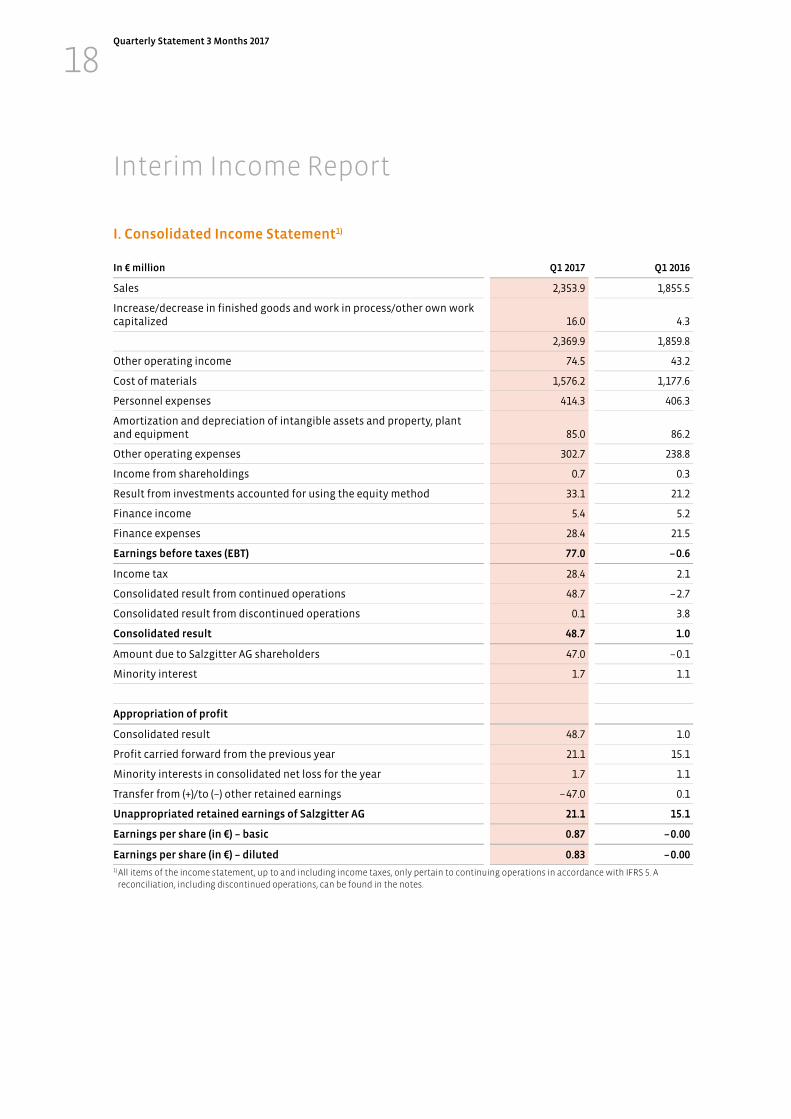
I. Consolidated Income Statement1)
In € million Q1 2017 Q1 2016
Sales 2,353.9 1,855.5
Increase/decrease in finished goods and work in process/other own work capitalized 16.0 4.3
2,369.9 1,859.8
Other operating income 74.5 43.2
Cost of materials 1,576.2 1,177.6
Personnel expenses 414.3 406.3
Amortization and depreciation of intangible assets and property, plant and equipment 85.0 86.2
Other operating expenses 302.7 238.8
Income from shareholdings 0.7 0.3
Result from investments accounted for using the equity method 33.1 21.2
Finance income 5.4 5.2
Finance expenses 28.4 21.5
Earnings before taxes (EBT) 77.0 – 0.6
Income tax 28.4 2.1
Consolidated result from continued operations 48.7 – 2.7
Consolidated result from discontinued operations 0.1 3.8
Consolidated result 48.7 1.0
Amount due to Salzgitter AG shareholders 47.0 – 0.1
Minority interest 1.7 1.1
Appropriation of profit
Consolidated result 48.7 1.0
Profit carried forward from the previous year 21.1 15.1
Minority interests in consolidated net loss for the year 1.7 1.1
Transfer from (+)/to (–) other retained earnings – 47.0 0.1
Unappropriated retained earnings of Salzgitter AG 21.1 15.1
Earnings per share (in €) – basic 0.87 – 0.00
Earnings per share (in €) – diluted 0.83 – 0.00
1) All items of the income statement, up to and including income taxes, only pertain to continuing operations in accordance with IFRS 5. A reconciliation, including discontinued operations, can be found in the notes.
Interim Income Report
Quarterly Statement 3 Months 2017
19
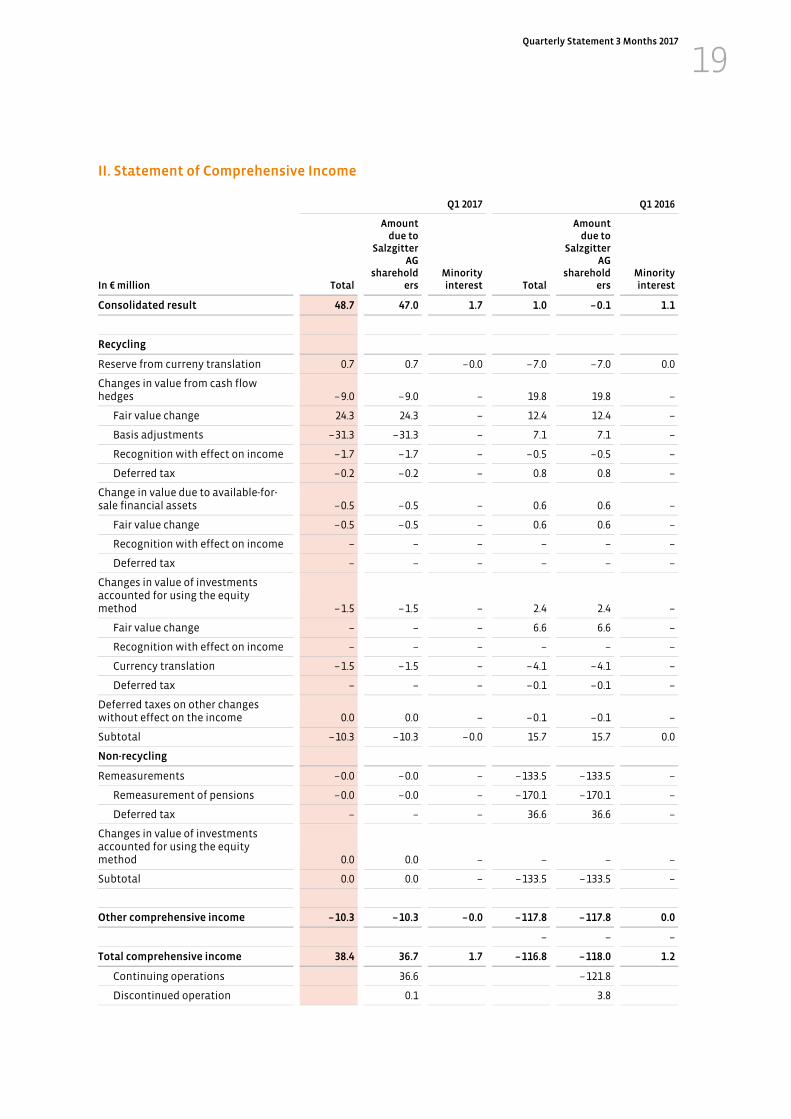
II. Statement of Comprehensive Income
Q1 2017 Q1 2016
In € million Total
Amount due to
Salzgitter AG
shareholders
Minority interest Total
Amount due to
Salzgitter AG
shareholders
Minority interest
Consolidated result 48.7 47.0 1.7 1.0 – 0.1 1.1
Recycling
Reserve from curreny translation 0.7 0.7 – 0.0 – 7.0 – 7.0 0.0
Changes in value from cash flow hedges – 9.0 – 9.0 – 19.8 19.8 –
Fair value change 24.3 24.3 – 12.4 12.4 –
Basis adjustments – 31.3 – 31.3 – 7.1 7.1 –
Recognition with effect on income – 1.7 – 1.7 – – 0.5 – 0.5 –
Deferred tax – 0.2 – 0.2 – 0.8 0.8 –
Change in value due to available-for-sale financial assets – 0.5 – 0.5 – 0.6 0.6 –
Fair value change – 0.5 – 0.5 – 0.6 0.6 –
Recognition with effect on income – – – – – –
Deferred tax – – – – – –
Changes in value of investments accounted for using the equity method – 1.5 – 1.5 – 2.4 2.4 –
Fair value change – – – 6.6 6.6 –
Recognition with effect on income – – – – – –
Currency translation – 1.5 – 1.5 – – 4.1 – 4.1 –
Deferred tax – – – – 0.1 – 0.1 –
Deferred taxes on other changes without effect on the income 0.0 0.0 – – 0.1 – 0.1 –
Subtotal – 10.3 – 10.3 – 0.0 15.7 15.7 0.0
Non-recycling
Remeasurements – 0.0 – 0.0 – – 133.5 – 133.5 –
Remeasurement of pensions – 0.0 – 0.0 – – 170.1 – 170.1 –
Deferred tax – – – 36.6 36.6 –
Changes in value of investments accounted for using the equity method 0.0 0.0 – – – –
Subtotal 0.0 0.0 – – 133.5 – 133.5 –
Other comprehensive income – 10.3 – 10.3 – 0.0 – 117.8 – 117.8 0.0
– – –
Total comprehensive income 38.4 36.7 1.7 – 116.8 – 118.0 1.2
Continuing operations 36.6 – 121.8
Discontinued operation 0.1 3.8

Quarterly Statement 3 Months 2017
20
III. Consolidated Balance Sheet
Assets in € million 2017/03/31 2016/12/31
Non-current assets
Intangible assets 218.9 223.3
Property, plant and equipment 2,314.4 2,343.4
Investment property 21.7 21.8
Financial assets 93.2 95.6
Investments accounted for using the equity method 724.2 660.4
Trade receivables 18.4 0.0
Other receivables and other assets 31.7 0.0
Deferred income tax assets 341.8 355.1
3,764.3 3,699.5
Current assets
Inventories 1,872.6 1,842.8
Trade receivables 1,719.0 1,476.2
Other receivables and other assets 486.6 504.3
Income tax assets 27.0 26.5
Securities 79.3 82.3
Cash and cash equivalents 686.7 818.1
4,871.4 4,750.3
8,635.7 8,449.8
Equity and liabilities in € million 2017/03/31 2016/12/31
Equity
Subscribed capital 161.6 161.6
Capital reserve 257.0 257.0
Retained earnings 2,750.8 2,703.4
Other reserves 61.1 71.4
Unappropriated retained earnings 21.1 21.1
3,251.6 3,214.5
Treasury shares – 369.7 – 369.7
2,881.9 2,844.8
Minority interests 8.8 7.1
2,890.7 2,852.0
Non-current liabilities
Provisions for pensions and similar obligations 2,438.0 2,449.0
Deferred tax liabilities 39.3 39.3
Income tax liabilities 76.2 67.7
Other provisions 265.5 245.3
Financial liabilities 452.0 452.4
Other liabilities 7.4 4.5
3,278.4 3,258.1
Current liabilities
Other provisions 256.3 292.5
Financial liabilities 504.0 493.6
Trade payables 1,223.6 1,154.5
Income tax liabilities 39.1 34.1
Other liabilities 443.5 365.1
2,466.5 2,339.7
8,635.6 8,449.8

Quarterly Statement 3 Months 2017
21
IV. Cash Flow Statement
In € million Q1 2017 Q1 2016
Earnings before taxes (EBT)1) 77.1 3.1
Depreciation, write-downs (+)/write-ups (–) of non-current assets 85.0 86.2
Income tax paid (–)/refunded (+) – 6.2 – 133.9
Other non-cash expenses (+)/income (–) 68.0 34.6
Interest expenses 27.9 21.5
Gain (–)/loss (+) from the disposal of non-current assets – 10.1 1.4
Increase (–)/decrease (+) in inventories – 36.8 44.5
Increase (–)/decrease (+) in trade receivables and other assets not attributable to investment or financing activities – 293.4 – 107.4
Use of provisions affecting payments, excluding income tax provisions – 76.9 – 72.2
Increase (+)/decrease (–) in trade payables and other liabilities not attributable to investment or financing activities 135.8 23.5
Cash outflow/inflow from operating activities – 29.6 – 98.7
Cash inflow from the disposal of fixed assets 12.5 3.1
Cash outflow for investments in intangible assets and property, plant and equipment – 65.8 – 89.5
Cash inflow (+)/outflow (–) for/from investments of funds 2.3 – 3.4
Cash inflow from the disposal of financial assets 2.5 4.0
Cash outflow for investments in financial assets – 46.9 – 1.6
Cash flow from investment activities – 95.4 – 87.4
Cash outflow in payments to company owners – –
Cash inflow (+)/outflow (–) as a result of the issuing of bonds, borrowings and other financial liabilities – 3.9 – 38.5
Interest paid – 3.8 – 8.9
Cash outflow/inflow from financing activities – 7.7 – 47.4
Cash and cash equivalents at the start of the period 818.1 836.2
Cash and cash equivalents relating to changes in the consolidated group – 0.2
Gains and losses from changes in foreign exchange rates 1.4 – 2.0
Payment-related changes in cash and cash equivalents – 132.8 – 233.4
Cash and cash equivalents at the end of the period 686.7 600.9
1) The result from ordinary activities (EBT) refers to the continuing and discontinued operations in total. A reconciliation of the result from discontinued operations can be found in the notes.
Quarterly Statement 3 Months 2017
22
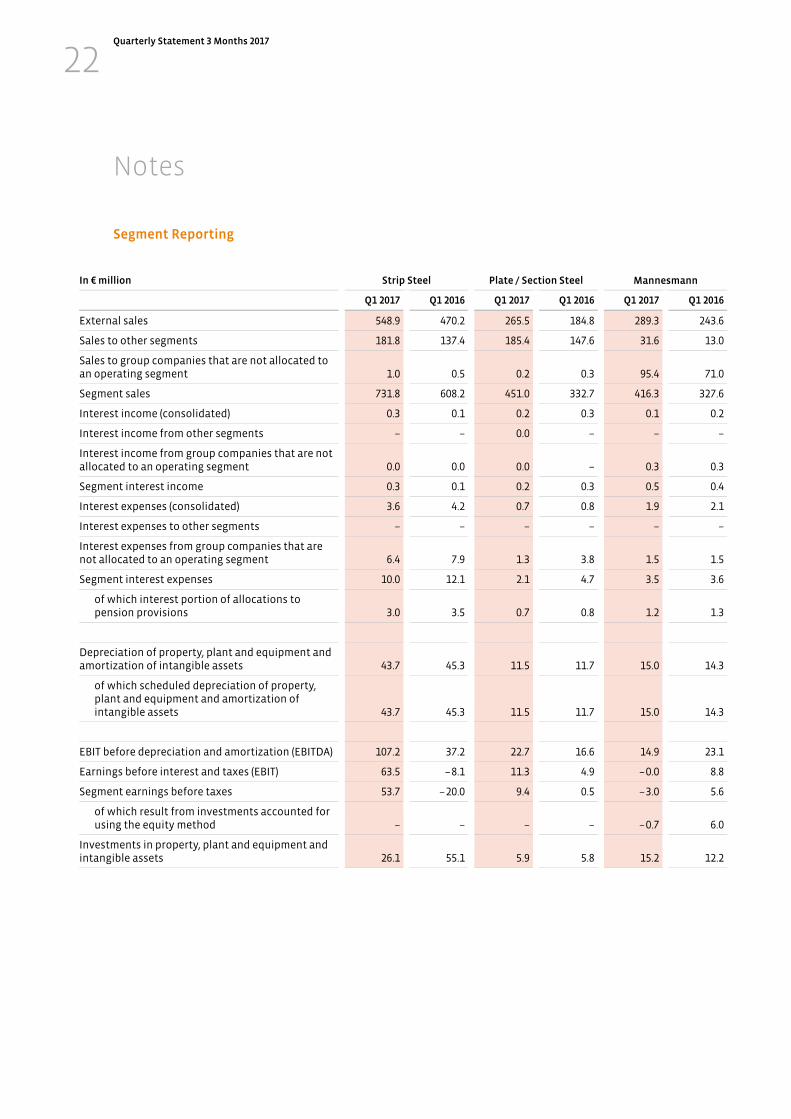
Segment Reporting
In € million Strip Steel Plate / Section Steel
Mannesmann
Q1 2017 Q1 2016 Q1 2017 Q1 2016 Q1 2017 Q1 2016
External sales 548.9 470.2 265.5 184.8 289.3 243.6
Sales to other segments 181.8 137.4 185.4 147.6 31.6 13.0
Sales to group companies that are not allocated to an operating segment 1.0 0.5 0.2 0.3 95.4 71.0
Segment sales 731.8 608.2 451.0 332.7 416.3 327.6
Interest income (consolidated) 0.3 0.1 0.2 0.3 0.1 0.2
Interest income from other segments – – 0.0 – – –
Interest income from group companies that are not allocated to an operating segment 0.0 0.0 0.0 – 0.3 0.3
Segment interest income 0.3 0.1 0.2 0.3 0.5 0.4
Interest expenses (consolidated) 3.6 4.2 0.7 0.8 1.9 2.1
Interest expenses to other segments – – – – – –
Interest expenses from group companies that are not allocated to an operating segment 6.4 7.9 1.3 3.8 1.5 1.5
Segment interest expenses 10.0 12.1 2.1 4.7 3.5 3.6
of which interest portion of allocations to pension provisions 3.0 3.5 0.7 0.8 1.2 1.3
Depreciation of property, plant and equipment and amortization of intangible assets 43.7 45.3 11.5 11.7 15.0 14.3
of which scheduled depreciation of property, plant and equipment and amortization of intangible assets 43.7 45.3 11.5 11.7 15.0 14.3
EBIT before depreciation and amortization (EBITDA) 107.2 37.2 22.7 16.6 14.9 23.1
Earnings before interest and taxes (EBIT) 63.5 – 8.1 11.3 4.9 – 0.0 8.8
Segment earnings before taxes 53.7 – 20.0 9.4 0.5 – 3.0 5.6
of which result from investments accounted for using the equity method – – – – – 0.7 6.0
Investments in property, plant and equipment and intangible assets 26.1 55.1 5.9 5.8 15.2 12.2
Notes
Quarterly Statement 3 Months 2017
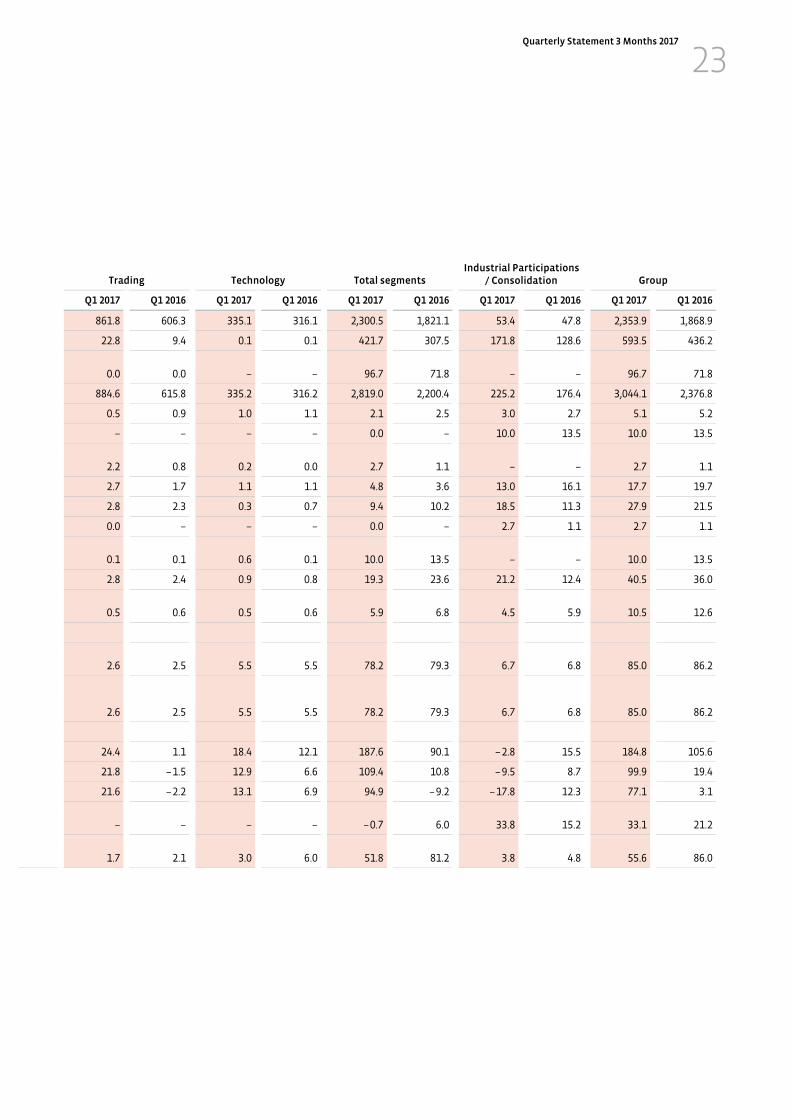
23
Trading Technology Total segments Industrial Participations
/ Consolidation Group
Q1 2017 Q1 2016 Q1 2017 Q1 2016 Q1 2017 Q1 2016 Q1 2017 Q1 2016 Q1 2017 Q1 2016
861.8 606.3 335.1 316.1 2,300.5 1,821.1 53.4 47.8 2,353.9 1,868.9
22.8 9.4 0.1 0.1 421.7 307.5 171.8 128.6 593.5 436.2
0.0 0.0 – – 96.7 71.8 – – 96.7 71.8
884.6 615.8 335.2 316.2 2,819.0 2,200.4 225.2 176.4 3,044.1 2,376.8
0.5 0.9 1.0 1.1 2.1 2.5 3.0 2.7 5.1 5.2
– – – – 0.0 – 10.0 13.5 10.0 13.5
2.2 0.8 0.2 0.0 2.7 1.1 – – 2.7 1.1
2.7 1.7 1.1 1.1 4.8 3.6 13.0 16.1 17.7 19.7
2.8 2.3 0.3 0.7 9.4 10.2 18.5 11.3 27.9 21.5
0.0 – – – 0.0 – 2.7 1.1 2.7 1.1
0.1 0.1 0.6 0.1 10.0 13.5 – – 10.0 13.5
2.8 2.4 0.9 0.8 19.3 23.6 21.2 12.4 40.5 36.0
0.5 0.6 0.5 0.6 5.9 6.8 4.5 5.9 10.5 12.6
2.6 2.5 5.5 5.5 78.2 79.3 6.7 6.8 85.0 86.2
2.6 2.5 5.5 5.5 78.2 79.3 6.7 6.8 85.0 86.2
24.4 1.1 18.4 12.1 187.6 90.1 – 2.8 15.5 184.8 105.6
21.8 – 1.5 12.9 6.6 109.4 10.8 – 9.5 8.7 99.9 19.4
21.6 – 2.2 13.1 6.9 94.9 – 9.2 – 17.8 12.3 77.1 3.1
– – – – – 0.7 6.0 33.8 15.2 33.1 21.2
1.7 2.1 3.0 6.0 51.8 81.2 3.8 4.8 55.6 86.0

Quarterly Statement 3 Months 2017
24
Principles of accounting and consolidation, balance sheet reporting and valuation methods
1. The consolidated financial report of Salzgitter AG, Salzgitter (SZAG), for the reporting period from January 1
to March 31, 2017, has been prepared as a condensed report with selected notes. The report has been drawn
up, as before, in accordance with the International Financial Reporting Standards (IFRS) published by the
International Accounting Standards Board (IASB) in consideration of the requirements set out under IAS 34
for condensed interim reports.
2. In comparison with the annual financial statements as at December 31, 2016, no changes have been made
in the accounting, valuation, calculation and consolidation methods applied to the interim financial
statement for the period ended March 31, 2017.
3. In calculating the fair value of defined benefit obligations as of March 31, 2017, an actuarial rate of 1.75 %
was applied, unchanged in comparison with December 31, 2016.
4. Owing to losses over many years, HSP Hoesch Spundwand und Profil Gesellschaft mit beschränkter
Haftung (HSP) terminated the production of heavy section steel products, in particular sheet piling and
mining sections, in December 2015. The delivery of products was, however, partly still scheduled in 2016.
The decommissioning of production sites is being carried out in 2017. HSP and all the associated sheet
piling activities are disclosed as a discontinued operation in accordance with the standards laid down
under IFRS 5. The results from this discontinued operation are disclosed in a separate line in the income
statement, set apart from the earnings and expenses of continuing operations. The tables below include a
transition of the income statement from continuing operations to an income statement that comprises
both continuing as well as discontinued operations.

Quarterly Statement 3 Months 2017
25
Result from discontinued operations
Q1 2017 Q1 2016
Discontinued
operationContinuing operations Total
Discontinued operation
Continuing operations Total
In € m
Sales – 2,353.9 2,353.9 13.3 1,855.5 1,868.8
Increase/decrease in finished goods and work in process/other own work capitalized – 16.0 16.0 – 6.8 4.3 – 2.6
– 2,369.9 2,369.9 6.4 1,859.8 1,866.3
Other operating income 1.6 74.5 76.1 0.8 43.2 44.1
Cost of materials – 1,576.2 1,576.2 1.2 1,177.6 1,178.8
Personnel expenses 0.3 414.3 414.7 0.8 406.3 407.0
Amortization and depreciation of intangible assets and property, plant and equipment – 85.0 85.0 – 86.2 86.2
Other operating expenses 1.2 302.7 303.9 1.5 238.8 240.2
Income from shareholdings – 0.7 0.7 – 0.3 0.3
Result from investments accounted for using the equity method – 33.1 33.1 – 21.2 21.2
Finance income – 5.4 5.4 0.0 5.2 5.2
Finance expenses 0.1 28.4 28.5 0.1 21.5 21.6
Earnings before taxes (EBT) 0.1 77.0 77.1 3.8 – 0.6 3.1
Income tax – 28.4 28.4 – 2.1 2.1
Consolidated result 0.1 48.7 48.7 3.8 – 2.7 1.0
The cash flow statement comprises the cash flows of the entire Group, including the discontinued operation.
The table below shows the cash flows only for the discontinued operation:
Condensed cash flow statement for the discontinued operation
In € m Q1 2017 Q1 2016
Cash flow from operating activities – 1.0 – 2.4
Cash outflow/inflow from investment activities – 0.1
Cash inflow/outflow from financing activities – – 0.0
Change in cash and cash equivalents of the discontinued operations – 1.0 – 2.3

Quarterly Statement 3 Months 2017
26
Selected explanatory notes to the income statement
1. Sales by business segment are shown in the segment report. 2. Earnings per share are calculated in accordance with IAS 33. Basic earnings per share, calculated from the
weighted number of shares of SZAG, came to € 0.87 in the period under review. Dilution would occur if
earnings per share were reduced through the issuance of potential shares from option and conversion
rights. Such rights, attached to a convertible bond, existed as of the balance sheet date. When taken into
account there is a decrease in earnings per share from continuing operations, as a result of which these option and conversion rights have a dilutive effect. Diluted earnings per share amount to € 0.83.
Correction of prior-year accounts
Due to a retrospective correction to the value of inventory belonging to a subsidiary in the Plate / Section Steel
Business Unit, the figure recognized for the 2014 period and earlier was adjusted by € 50.9 million directly in equity
in accordance with the pertinent IFRS standards. In the financial year 2015, a further reduction of € 8.5 million was
carried out through profit or loss. In this context, income tax liabilities of € 1.4 million were taken account of on
balance, thereby correcting the equity disclosed in previous years that was too high, without effect on income.
The adjustments to the account are shown in the table below:
€ m Issued consolidated financial statement Adjustment
Adjusted consolidated
financial statement
2016/03/31 2016/03/31
Income tax assets 22.1 3.2 25.4
Inventories 1,767.3 – 59.4 1,707.9
Equity 2,776.3 – 55.7 2,720.7
Deferred income tax liabilities 27.2 – 0.6 26.7
Disclosures on fair value
Fair value disclosures comply with the standards set out under IFRS 13 "Fair Value Measurement". A deviation
between the book value and fair value results from the reporting of a convertible bonds and a bond
exchangeable into shares at amortized cost.
The calculation of fair value disclosures for non-current financial assets and liabilities not accounted for by
applying fair value is always carried out by discounting future cash flows. In this instance, a term-dependent
interest rate was applied that reflected the risk-free rate and the default risk derived from a peer group of the
Salzgitter Group.
Book value and fair value of the bonds:
In € million Convertible bonds and exchangeable bond
2017/03/31 2016/12/31
Book value 416.5 414.0
Fair value 420.8 419.1
Quarterly Statement 3 Months 2017
27
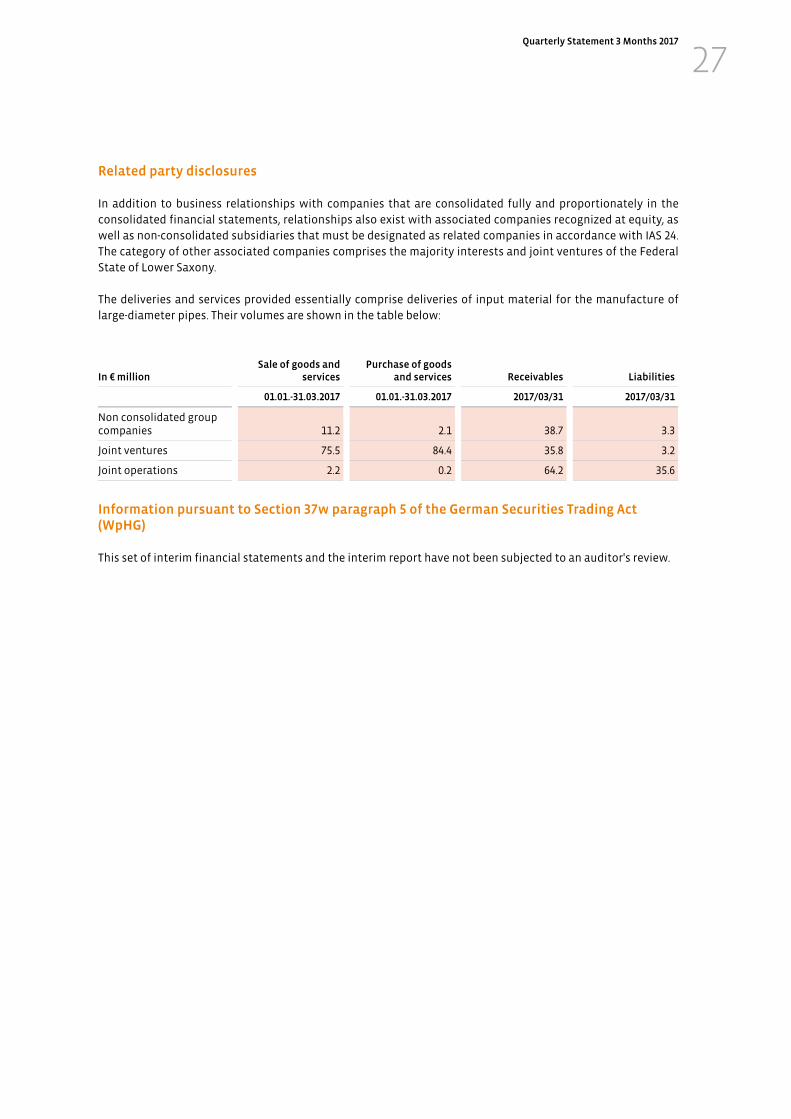
Related party disclosures
In addition to business relationships with companies that are consolidated fully and proportionately in the
consolidated financial statements, relationships also exist with associated companies recognized at equity, as
well as non-consolidated subsidiaries that must be designated as related companies in accordance with IAS 24.
The category of other associated companies comprises the majority interests and joint ventures of the Federal
State of Lower Saxony.
The deliveries and services provided essentially comprise deliveries of input material for the manufacture of
large-diameter pipes. Their volumes are shown in the table below:
In € million Sale of goods and
servicesPurchase of goods
and services Receivables Liabilities
01.01.-31.03.2017 01.01.-31.03.2017 2017/03/31 2017/03/31
Non consolidated group companies 11.2 2.1 38.7 3.3
Joint ventures 75.5 84.4 35.8 3.2
Joint operations 2.2 0.2 64.2 35.6
Information pursuant to Section 37w paragraph 5 of the German Securities Trading Act (WpHG)
This set of interim financial statements and the interim report have not been subjected to an auditor's review.
Legal disclaimer
Some of the statements made in this report possess the character of forecasts or may be interpreted as such.
They are made upon the best of information and belief and by their nature are subject to the proviso that no
unforeseeable deterioration occurs in the economy or in the specific market situation pertaining to the Busi-
ness Units, but rather that the underlying bases of plans and outlooks prove to be accurate as expected in
terms of their scope and timing. Notwithstanding prevailing statutory provisions and capital market law in
particular, the company undertakes no obligation to continuously update any forward-looking statements that
are made solely in connection with circumstances prevailing on the day of their publication.
For computational reasons, rounding-off differences of +/– one unit (€, % etc.) may occur in the tables.
The Quarterly statement of Salzgitter AG (SZAG) is also available in German. In the event of any discrepancy, the
German version shall prevail.
Unless otherwise indicated, all figures and corresponding information as well as the guidance include the
sheet piling activities that were discontinued at the end of 2015..
Editorial Details and Contact
Contact
SALZGITTER AG
Eisenhüttenstraße 99
38239 Salzgitter
Germany
Postal address
38223 Salzgitter
Germany
Public Relations
Telephone: +49 (0)53 41/21-27 01
Telefax: +49 (0)53 41/21-23 02
Investor Relations
Telephone: +49 (0)53 41/21-18 52
Telefax: +49 (0)53 41/21-23 02
Online
www.salzgitter-ag.com/en/
Publisher
SALZGITTER AG
Editorial Office
SALZGITTER AG, Investor Relations
Translation
Baker & Harrison, Munich
with the support of the firesys
editorial system.
This Quarterly Statement was prepared
qm-2017/3m