Embed Size (px)
Citation preview

1
Quarterly Trends for Consolidated U.S. Banking Organizations
Fourth Quarter 2013
Federal Reserve Bank of New York
Research and Statistics Group
This report presents consolidated financial statistics for the U.S. commercial banking industry,
including both bank holding companies (BHCs) and banks. Statistics are based on quarterly
regulatory filings.1 Statistics are inclusive of BHCs’ nonbank subsidiaries. Separate statistics are
reported on a merger-adjusted basis for the subset of BHCs with > $500bn in total assets as of
2013:Q42, for BHCs with $50bn-$500bn in total assets as of 2013:Q4, and for the remainder of the
industry.
Highlights
Banking industry capital, as measured by the ratio of tier 1 common equity to risk-weighted
assets, increased from 11.85% in 2013:Q3 to 11.94% in 2013:Q4. The leverage ratio, defined
as the ratio of tier 1 risk-based capital to average total assets, remained steady over the fourth
quarter at 8.77%.
Annualized return on assets (ROA) for the industry increased from 0.78% to 0.87%. Return on
equity (ROE) also rose from 7.3% to 8.2%. ROA and ROE increased for the largest BHCs (>
$500bn in assets), but decreased for the remainder of the industry.
Non-performing loans as a percentage of total loans decreased in 2013:Q4, from 2.9% to
2.7%. This ratio has now declined for 16 consecutive quarters. The non-performing loan ratio
was 3.8% for the largest BHCs, more than twice as high than the ratio for the remainder of the
banking industry. Loan loss provisions increased in 2013:Q4, while net charge-offs as a
percentage of total loans decreased slightly, reaching 0.63%, its lowest value since 2007:Q2.
Loan growth for the industry was positive at 2.1% on a four-quarter-ended basis. Industry four-
quarter-ended asset growth was also positive, at 1.2%.
1 Industry statistics are calculated by summing consolidated financial data across all reporting U.S. parent BHCs (from the
FR Y-9C report), plus values for “standalone” banks not controlled by a BHC, or whose parent BHC does not report on a consolidated basis (from the FFIEC 031/041 reports). The data do not include savings bank holding companies, branches and agencies of foreign banks, or nonbanks that are not held by a U.S. BHC. 2 Six BHCs exceed this $500bn size threshold: J.P. Morgan Chase, Bank of America, Citigroup, Wells Fargo, Goldman
Sachs, and Morgan Stanley.
2
Table of Contents
Charts and Tables
1. Composition of banking industry assets and liabilities
Balance sheet composition 3
Balance sheet percentages 3
Fed funds sold and purchased ratio 4
Repurchase agreements 4
2. Earnings and pre-provision net revenue
Return on assets 5
Return on equity 5
Net interest margin 6
Noninterest income share 6
Return on trading assets 7
Non-trading non-interest income ratio 7
Efficiency ratio 8
3. Asset quality
Non-performing loans 9
Non-performing real estate loans 9
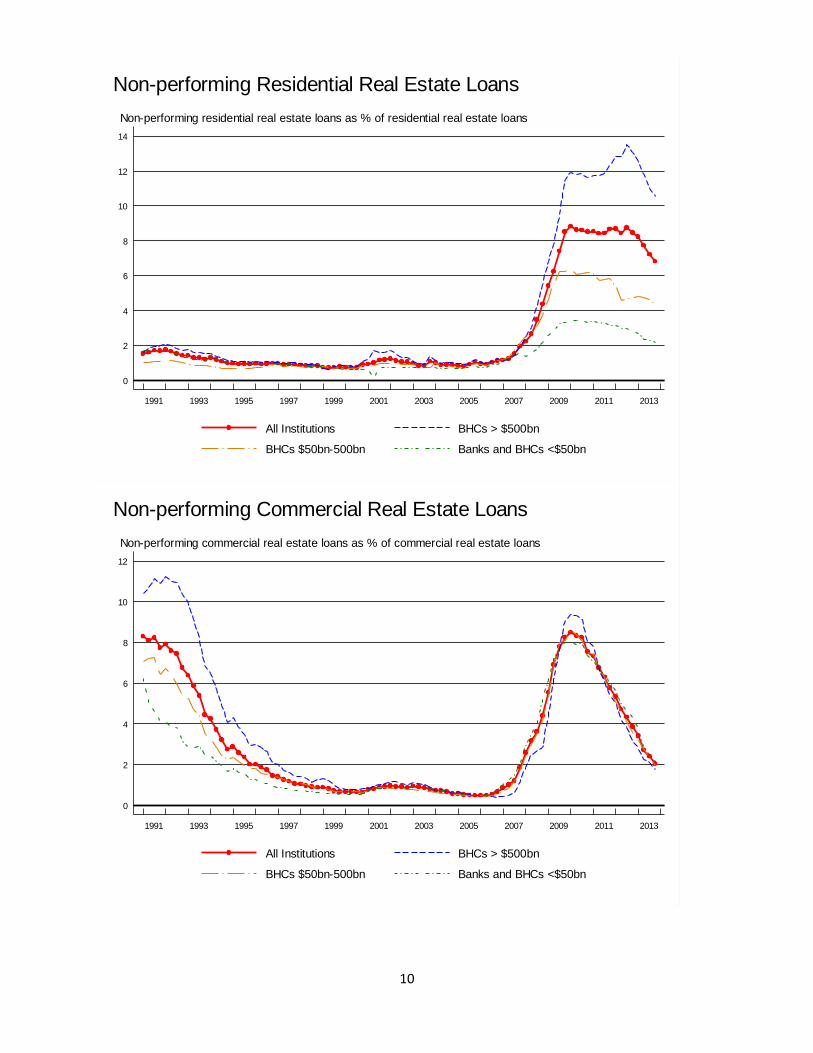
Non-performing residential real estate loans 10
Non-performing commercial real estate loans 10
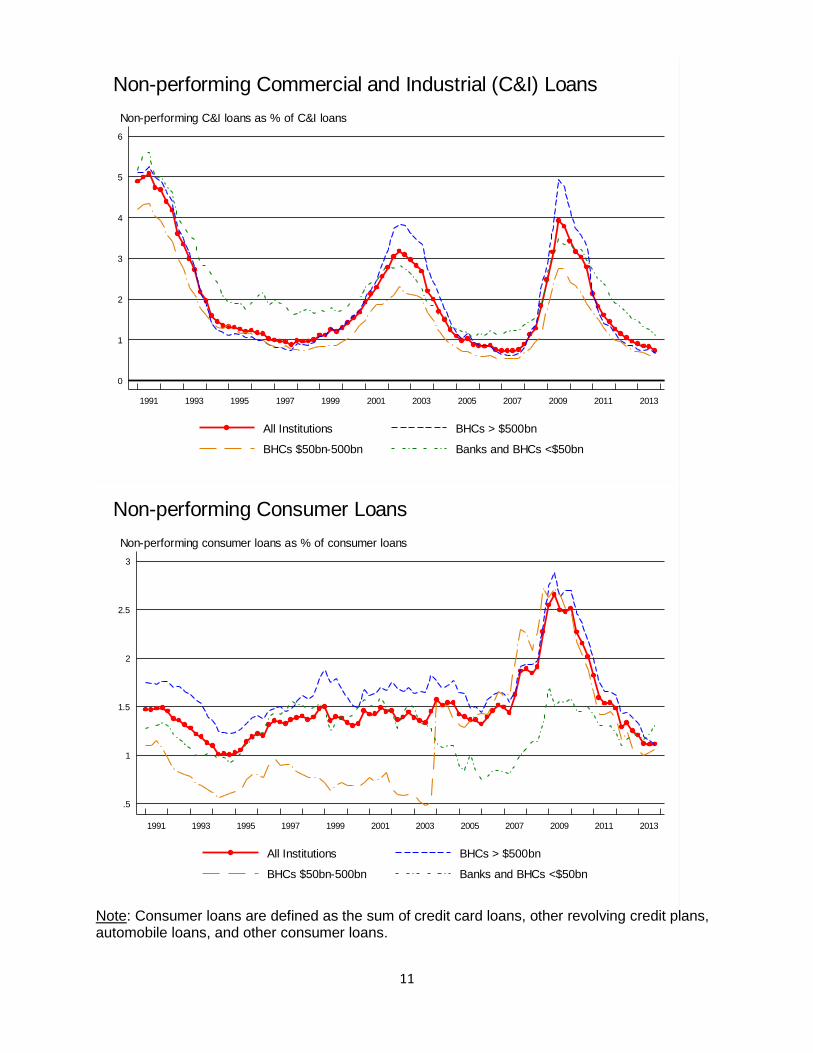
Non-performing commercial and industrial loans 11
Non-performing consumer loans 11
Net charge-offs 12
Loan loss provisions 12
Loan loss reserves 13
4. Capital adequacy and asset growth
Tier 1 common equity ratio 14
Tier 1 capital ratio 14
Total capital ratio 15
Leverage ratio 15
Asset growth rates 16
Loan growth rates 16
Domestic deposit growth rates 17
Risk-weighted assets 17
5. Consolidated financial statistics for the Fifty Largest BHCs 18
Notes and caveats
Methodology 19
Caveats and limitations 20
Data notes 21
3
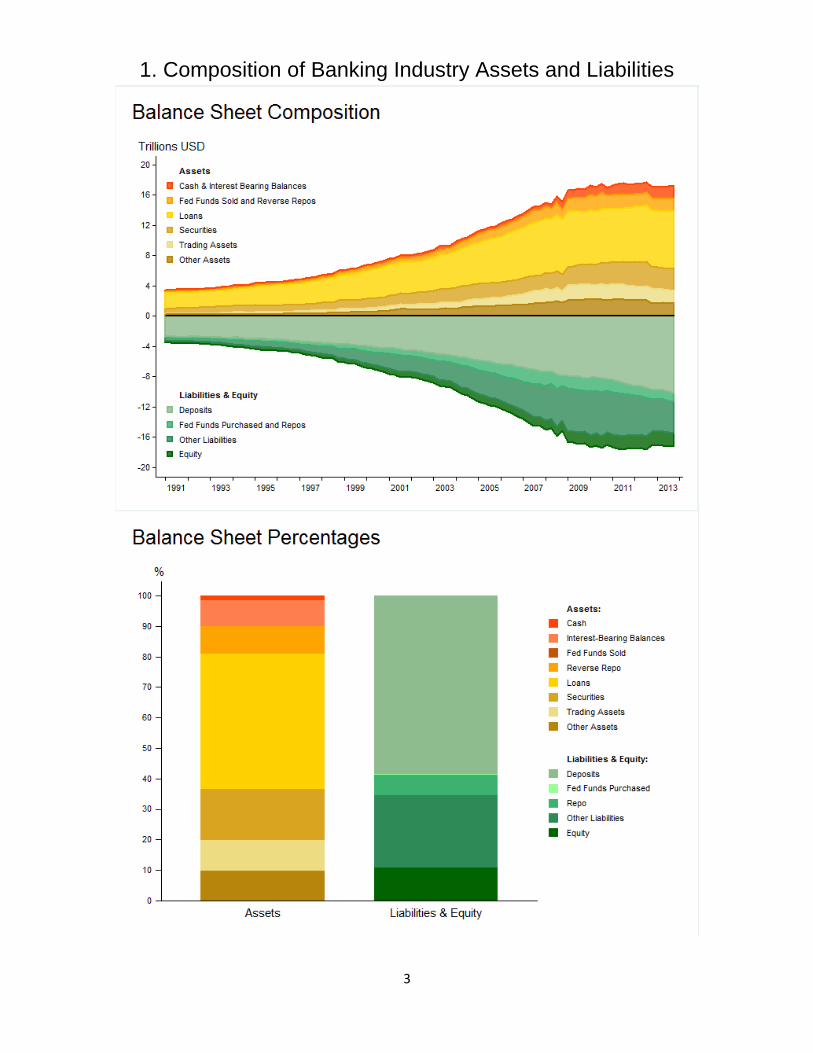
1. Composition of Banking Industry Assets and Liabilities

4
Note: These charts begin in 2002q1 because data for repurchase agreements and federal funds
are not consistently reported separately prior to that date.
0
.2
.4
.6
.8
1
1.2
1.4
1.6
1991 1993 1995 1997 1999 2001 2003 2005 2007 2009 2011 2013
Federal Funds Sold Federal Funds Purchased
Federal funds sold and purchased in domestic offices as % of total assets
Federal Funds Sold and Purchased
0
2
4
6
8
10
12
14
1991 1993 1995 1997 1999 2001 2003 2005 2007 2009 2011 2013
Reverse Repo Repo
Repurchase agreements as % of total assets
Repurchase Agreements

5
2. Earnings and Pre-Provision Net Revenue
-2
-1.5
-1
-.5
0
.5
1
1.5
1991 1993 1995 1997 1999 2001 2003 2005 2007 2009 2011 2013
All Institutions BHCs > $500bn
BHCs $50bn-500bn Banks and BHCs <$50bn
Annualized net income as % of total assets
Return on Assets
-20
-10
0
10
20
1991 1993 1995 1997 1999 2001 2003 2005 2007 2009 2011 2013
All Institutions BHCs > $500bn
BHCs $50bn-500bn Banks and BHCs <$50bn
Annualized net income as % of equity
Return on Equity

6
Note: Net operating revenue is defined as net interest income plus noninterest income.
2
2.5
3
3.5
4
4.5
5
1991 1993 1995 1997 1999 2001 2003 2005 2007 2009 2011 2013
All Institutions BHCs > $500bn
BHCs $50bn-500bn Banks and BHCs <$50bn
Annualized net interest income as % of interest-earning assets
Net Interest Margin
0
10
20
30
40
50
60
1991 1993 1995 1997 1999 2001 2003 2005 2007 2009 2011 2013
All Institutions BHCs > $500bn
BHCs $50bn-500bn Banks and BHCs <$50bn
Noninterest income as % of net operating revenue
Noninterest Income Share

7
-8
-4
0
4
8
12
16
1991 1993 1995 1997 1999 2001 2003 2005 2007 2009 2011 2013
All Institutions BHCs > $500bn
BHCs $50bn-500bn Banks and BHCs <$50bn
Annualized trading income as % of trading assets
Return on Trading Assets
1
1.5
2
2.5
3
3.5
1991 1993 1995 1997 1999 2001 2003 2005 2007 2009 2011 2013
All Institutions BHCs > $500bn
BHCs $50bn-500bn Banks and BHCs <$50bn
Annualized non-trading non-interest income as % of total assets
Non-Trading Non-Interest Income Ratio
8
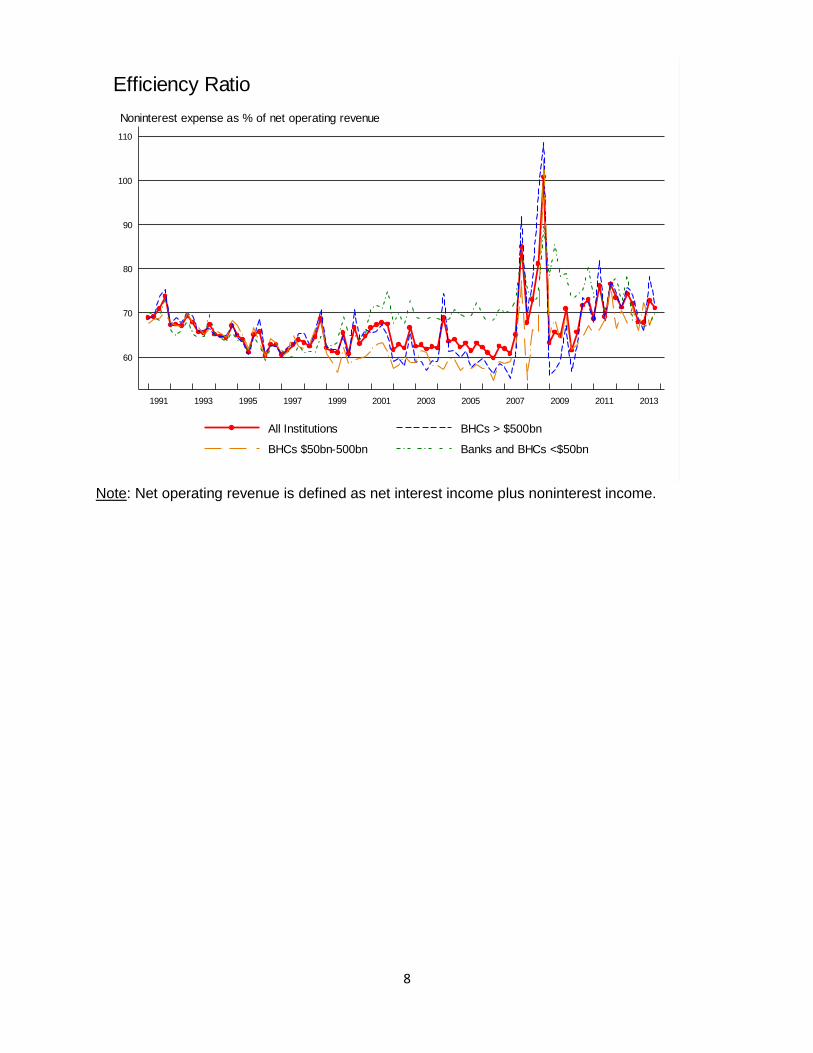
Note: Net operating revenue is defined as net interest income plus noninterest income.
60
70
80
90
100
110
1991 1993 1995 1997 1999 2001 2003 2005 2007 2009 2011 2013
All Institutions BHCs > $500bn
BHCs $50bn-500bn Banks and BHCs <$50bn
Noninterest expense as % of net operating revenue
Efficiency Ratio

9
3. Asset Quality
Note: Non-performing loans include loans that are (1) 90 days or more past due and still accruing or (2) non-accrual.
1
2
3
4
5
6
7
8
1991 1993 1995 1997 1999 2001 2003 2005 2007 2009 2011 2013
All Institutions BHCs > $500bn
BHCs $50bn-500bn Banks and BHCs <$50bn
Total non-performing loans as % of total loans
Non-performing Loans
0
2
4
6
8
10
12
1991 1993 1995 1997 1999 2001 2003 2005 2007 2009 2011 2013
All Institutions BHCs > $500bn
BHCs $50bn-500bn Banks and BHCs <$50bn
Non-performing real estate loans as % of real estate loans
Non-performing Real Estate Loans
10
0
2
4
6
8
10
12
14
1991 1993 1995 1997 1999 2001 2003 2005 2007 2009 2011 2013
All Institutions BHCs > $500bn
BHCs $50bn-500bn Banks and BHCs <$50bn
Non-performing residential real estate loans as % of residential real estate loans
Non-performing Residential Real Estate Loans
0
2
4
6
8
10
12
1991 1993 1995 1997 1999 2001 2003 2005 2007 2009 2011 2013
All Institutions BHCs > $500bn
BHCs $50bn-500bn Banks and BHCs <$50bn
Non-performing commercial real estate loans as % of commercial real estate loans
Non-performing Commercial Real Estate Loans
11
Note: Consumer loans are defined as the sum of credit card loans, other revolving credit plans, automobile loans, and other consumer loans.
0
1
2
3
4
5
6
1991 1993 1995 1997 1999 2001 2003 2005 2007 2009 2011 2013
All Institutions BHCs > $500bn
BHCs $50bn-500bn Banks and BHCs <$50bn
Non-performing C&I loans as % of C&I loans
Non-performing Commercial and Industrial (C&I) Loans
.5
1
1.5
2
2.5
3
1991 1993 1995 1997 1999 2001 2003 2005 2007 2009 2011 2013
All Institutions BHCs > $500bn
BHCs $50bn-500bn Banks and BHCs <$50bn
Non-performing consumer loans as % of consumer loans
Non-performing Consumer Loans

12
0
1
2
3
4
5
1991 1993 1995 1997 1999 2001 2003 2005 2007 2009 2011 2013
All Institutions BHCs > $500bn
BHCs $50bn-500bn Banks and BHCs <$50bn
Annualized net charge-offs as % of total loans
Net Charge-offs
0
1
2
3
4
5
6
1991 1993 1995 1997 1999 2001 2003 2005 2007 2009 2011 2013
All Institutions BHCs > $500bn
BHCs $50bn-500bn Banks and BHCs <$50bn
Annualized loan loss provisions as % of total loans
Loan Loss Provisions

13
50
75
100
125
150
175
200
225
1991 1993 1995 1997 1999 2001 2003 2005 2007 2009 2011 2013
All Institutions BHCs > $500bn
BHCs $50bn-500bn Banks and BHCs <$50bn
Loan loss reserves as % of non-performing loans
Loan Loss Reserves

14
4. Capital Adequacy and Asset Growth
Note: See data notes for the definition of tier 1 common equity. This chart begins in 2001q1
because data for tier 1 common equity are not available prior to this date
Note: This chart starts in 1996q1 because data for the components of this ratio are not available
prior to that date.
4
6
8
10
12
14
16
1991 1993 1995 1997 1999 2001 2003 2005 2007 2009 2011 2013
All Institutions BHCs > $500bn
BHCs $50bn-500bn Banks and BHCs <$50bn
Tier 1 common equity as % of risk-weighted assets
Tier 1 Common Equity Ratio
7
8
9
10
11
12
13
14
15
1991 1993 1995 1997 1999 2001 2003 2005 2007 2009 2011 2013
All Institutions BHCs > $500bn
BHCs $50bn-500bn Banks and BHCs <$50bn
Tier 1 risk-based capital as % of risk-weighted assets
Tier 1 Capital Ratio

15
Note: This chart starts in 1996q1 because data for the components of this ratio are not available
prior to that date.
Note: This chart starts in 1996q1 because data for the components of this ratio are not available
prior to that date.
11
12
13
14
15
16
17
1991 1993 1995 1997 1999 2001 2003 2005 2007 2009 2011 2013
All Institutions BHCs > $500bn
BHCs $50bn-500bn Banks and BHCs <$50bn
Total risk-based capital as % of risk-weighted assets
Total Capital Ratio
5
6
7
8
9
10
11
1991 1993 1995 1997 1999 2001 2003 2005 2007 2009 2011 2013
All Institutions BHCs > $500bn
BHCs $50bn-500bn Banks and BHCs <$50bn
Tier 1 risk-based capital as % of average total assets
Leverage Ratio

16
Note: Asset, loan and deposit growth rates presented below are affected by mergers with
nonbanking firms, and conversions to and from a BHC charter during the sample period. This
particularly affects the year-over-year growth rate for assets between 2009:Q1 and 2009:Q4,
due to the entry of several new firms in 2009:Q1. See “Caveats and Limitations” for details.
-20
-15
-10
-5
0
5
10
15
20
25
30
1991 1993 1995 1997 1999 2001 2003 2005 2007 2009 2011 2013
All Institutions BHCs > $500bn
BHCs $50bn-500bn Banks and BHCs <$50bn
Year-over-year % change in total assets
Asset Growth Rates
-10
-5
0
5
10
15
20
25
30
1991 1993 1995 1997 1999 2001 2003 2005 2007 2009 2011 2013
All Institutions BHCs > $500bn
BHCs $50bn-500bn Banks and BHCs <$50bn
Year-over-year % change in total loans
Loan Growth Rates

17
Note: This chart starts in 1996q1 because data for the risk-weighted assets component of this
ratio are not reported prior to that date.
-5
0
5
10
15
20
25
1991 1993 1995 1997 1999 2001 2003 2005 2007 2009 2011 2013
All Institutions BHCs > $500bn
BHCs $50bn-500bn Banks and BHCs <$50bn
Year-over-year % change in domestic deposits
Domestic Deposit Growth Rates
50
55
60
65
70
75
80
85
1991 1993 1995 1997 1999 2001 2003 2005 2007 2009 2011 2013
All Institutions BHCs > $500bn
BHCs $50bn-500bn Banks and BHCs <$50bn
Risk-weighted assets as % of total assets
Risk-Weighted Assets Ratio

18
5. Consolidated Financial Statistics for the Fifty Largest BHCs
Annualized
Return on
Assets
Annualized
Return on
Equity
Tier 1
Common
Ratio
Tier 1
Capital Ratio
Total Capital
Ratio
1 JPMORGAN CHASE & CO 2,415.7 5,278.0 0.87 10.00 10.73 11.94 14.36
2 BANK OF AMER CORP 2,105.0 3,439.0 0.65 5.91 11.19 12.44 15.44
3 CITIGROUP 1,880.4 2,456.0 0.52 4.81 12.64 13.68 16.65
4 WELLS FARGO & CO 1,527.0 5,610.0 1.47 13.19 10.82 12.33 15.43
5 GOLDMAN SACHS GROUP THE 911.6 2,332.0 1.02 11.89 14.59 16.73 19.87
6 MORGAN STANLEY 832.7 84.0 0.04 0.51 12.81 15.66 16.94
7 BANK OF NY MELLON CORP 374.3 539.0 0.58 5.75 14.51 16.18 16.97
8 U S BC 364.0 1,456.0 1.60 14.17 9.38 11.21 13.20
9 PNC FNCL SVC GROUP 320.6 1,047.8 1.31 9.88 10.47 12.35 15.78
10 CAPITAL ONE FC 297.3 858.8 1.16 8.23 12.23 12.61 14.73
11 HSBC NORTH AMER HOLD 290.0 -888.5 -1.23 -11.64 14.55 17.03 26.66
12 STATE STREET CORP 243.0 552.5 0.91 10.85 15.54 17.34 19.70
13 TD BK US HC 234.6 216.8 0.37 3.54 7.13 7.51 8.79
14 BB&T CORP 183.0 574.7 1.26 10.10 9.87 11.78 14.30
15 SUNTRUST BK 175.4 426.0 0.97 8.00 9.82 10.81 12.81
16 AMERICAN EXPRESS CO 153.4 1,308.0 3.41 26.84 12.49 12.49 14.35
17 ALLY FNCL 151.2 104.0 0.28 2.93 8.84 11.79 12.76
18 FIFTH THIRD BC 130.4 402.2 1.23 11.03 9.39 10.36 14.08
19 RBS CITIZENS FNCL GRP 122.3 152.2 0.50 3.17 13.49 13.49 16.11
20 REGIONS FC 117.7 226.8 0.77 5.75 11.21 11.68 14.73
21 BMO FNCL CORP 111.1 221.6 0.80 6.38 11.41 11.41 15.66
22 UNIONBANCAL CORP 105.9 178.2 0.67 5.02 12.34 12.41 14.61
23 NORTHERN TR CORP 102.9 169.8 0.66 8.58 12.90 13.36 15.81
24 KEYCORP 93.0 230.1 0.99 8.93 11.22 11.96 14.33
25 M&T BK CORP 85.2 221.4 1.04 7.83 9.22 12.00 15.07
26 BANCWEST CORP 83.5 150.5 0.72 5.08 10.65 10.83 12.10
27 DISCOVER FS 79.3 602.1 3.04 22.28 14.35 15.16 17.44
28 SANTANDER HOLDS USA 77.1 78.0 0.40 2.30 14.01 14.67 16.81
29 BBVA COMPASS BSHRS 72.0 68.8 0.38 2.40 11.39 11.62 13.74
30 DEUTSCHE BK TR CORP 67.0 151.0 0.90 8.66 20.61 20.61 21.12
31 COMERICA 65.4 116.6 0.71 6.52 10.64 10.64 13.10
32 HUNTINGTON BSHRS 59.5 157.8 1.06 10.35 10.90 12.28 14.57
33 ZIONS BC 56.0 -41.5 -0.30 -2.57 10.18 12.77 14.67
34 CIT GROUP 47.1 129.8 1.10 5.87 16.69 16.69 17.38
35 NEW YORK CMNTY BC 46.7 120.2 1.03 8.38 11.61 12.84 13.56
36 FIRST NIAGARA FNCL GROUP 37.6 77.7 0.83 6.22 7.85 9.56 11.53
37 UTRECHT-AMERICA HOLDS 36.0 -10.9 -0.12 -6.87 -1.75 -1.75 -1.75
38 POPULAR 35.7 163.0 1.82 14.09 14.83 19.15 20.42
39 CITY NAT CORP 29.7 55.1 0.74 8.04 8.78 10.09 13.00
40 BOK FC 27.0 73.0 1.08 9.67 13.59 13.77 15.56
41 SVB FNCL GRP 26.4 58.8 0.89 11.95 11.65 11.94 13.13
42 SYNOVUS FC 26.2 38.6 0.59 5.23 9.93 10.54 13.00
43 EAST W BC 24.7 75.8 1.23 12.82 11.36 11.88 13.53
44 CULLEN/FROST BKR 24.4 62.6 1.03 9.95 12.45 14.39 15.52
45 ASSOCIATED BANC-CORP 24.2 47.8 0.79 6.61 11.46 11.83 13.09
46 FIRSTMERIT CORP 23.9 57.2 0.96 8.46 10.47 11.54 13.98
47 FIRST HORIZON NAT CORP 23.8 51.0 0.86 9.24 10.75 13.87 16.23
48 COMMERCE BSHRS 23.1 65.9 1.14 11.93 14.06 14.06 15.28
49 RAYMOND JAMES FNCL 21.9 116.6 2.13 12.34 19.44 19.52 20.41
50 FIRST CITIZENS BSHRS 21.2 27.2 0.51 5.24 14.26 14.92 16.42
TOP 50 14,387.4 29,689.0 0.83 7.83 11.55 12.88 15.56
ALL INSTITUTIONS (BHCS AND BANKS) 17,255.4 37,409.9 0.87 8.15 11.94 13.25 15.68
*For the industry net income and capital adequacy ratios, we sum the numerator and denominator across individual firms and then compute ratios.
Bank Profitability Capital Adequacy Ratios (%)
TOTALS*
Rank Name of InstitutionTotal Assets
(Bil USD)
Quarterly
Net Income
(Mil USD)

19
Notes and caveats
Methodology
The data used to construct the statistics in this report are drawn from the quarterly
Consolidated Financial Statements for bank holding companies (FR Y-9C), and
Consolidated Reports of Condition and Income for commercial banks (FFIEC 031 and
041). Reported statistics are defined in a time-consistent way across reporting form
vintages.
To calculate the “all institutions” quarterly series, we aggregate the data for top-tier bank
holding companies (BHCs), including US BHCs and bank subsidiaries of foreign
banking organizations,3 as well as commercial banks owned by BHCs that are too small
to file Y-9C reports (the current reporting threshold is $500m of total assets), and
unaffiliated (stand-alone) commercial banks. We identify “top-tier” BHCs (i.e. the U.S.
parent entity) via the National Information Center (NIC,
http://www.ffiec.gov/nicpubweb/nicweb/nichome.aspx), which provides data on firm
attributes and structure. We identify commercial banks that are standalone firms or are
owned by small BHCs by identifying all banks whose high holder does not submit a FR
Y-9C report.
Separate statistics are also reported for the subset of BHCs with greater than $500
billion in total assets, for the subset of BHCs with $50 - $500 billion in total assets, and
for the remainder of the industry. In 2013:Q4, 33 BHCs exceed $50 billion in total
assets, 6 of which exceeded the $500 billion threshold: JPMorgan Chase, Bank of
America, Citigroup, Wells Fargo, Goldman Sachs, and Morgan Stanley. For
consistency, time-series graphs for the “> $500bn” and $50-$500bn” groups represent
available historical values for this same subset of firms. Statistics for most firms with
more than $50 billion in total assets are prepared on a pro forma (merger-adjusted)
basis; specifically, on the basis that all BHCs acquired by each of these firms over the
sample period with US regulatory filings are part of the consolidated BHC from the start
of the historical time period. Data values of acquired BHCs are then summed with
acquirer data in the period before the acquisition. Merger events are identified using the
NIC transformations table maintained by the Federal Reserve Board of Governors. Note
that three BHCs with more than $50 billion in total assets are not adjusted using the pro
forma methodology: TD Bank, Bancwest, and Deutsche Bank. After constructing the pro
forma series for each firm, we aggregate the data to create the “BHCs > $500bn” and
the “BHCs $50-$500bn” series. Finally, the “all other banks and BHCs” quarterly series
is constructed by subtracting the “BHCs > $500bn” and “BHCs $50-$500bn” series from
the “all institutions” series.
3 The term “foreign-banking organization” generally refers to a foreign bank that (1) operates a branch, agency, or
commercial lending company subsidiary in the United States; (2) controls a bank in the United States; or (3) controls an Edge corporation acquired after March 5, 1987. The term also includes any company of which such a foreign bank is a subsidiary. See 12 C.F.R. § 211.11(o).
20
The charts and tables presented in this report are grouped into the following five
categories: composition of banking industry assets and liabilities, earnings and pre-
provision net revenue, asset quality, capital adequacy and asset growth, and
consolidated financial statistics for the fifty largest BHCs. Definitions of each plotted
variable are presented on each chart.
Caveats and limitations
Statistics in this report are presented “as is”, based on calculations conducted by
Federal Reserve Bank of New York research staff. While significant efforts have been
made to ensure accuracy, the statistics presented here may be subject to future
revision, for example because of changes or improvements in the “pro forma”
methodology used to calculate statistics for industry subgroups.
We highlight a number of important limitations of the statistics presented here:
Statistics exclude financial firms that are not either commercial banks or part of a
commercial bank holding company. This creates discontinuities in the time-series
graphs when nonbanking firms are acquired or sold by banks or BHCs, or when
firms switch to or from a bank or BHC charter. For example, in 2009:Q1,
Goldman Sachs, Morgan Stanley, Ally Financial, and American Express each
began filing a FR Y-9C due to the conversion of each of these firms to a
commercial banking holding company charter. This largely accounts for the sharp
13% increase in total measured industry assets in 2009:Q1, and a corresponding
discontinuous upward shift in the industry asset growth rate during 2009.
For the same reason, only 4 of the 6 BHCs in the BHCs > $500bn group
(described in the methodology section on the previous page) exist in the data for
the entire sample period (1991:Q1 to 2013:Q4). These 4 BHCs are JPMorgan
Chase, Bank of America, Wells Fargo, and Citigroup. Goldman Sachs and
Morgan Stanley entered the sample in 2009:Q1.
Flow variables in bank and BHC regulatory filings are reported on a year-to-date
basis. Quarterly flow variables are derived by “quarterizing” the data, that is, by
subtracting the variable at time t-1 from the variable at time t for Q2, Q3, and Q4
of each calendar year. This quarterization procedure can create discontinuities
when a bank or BHC enters the sample any time other than in Q1. To account for
this, we drop the firm’s quarter of entry observation from the sample. This
adjusted data is used to calculate all ratios in this report that are based on flow
variables. However, to retain as much of the data as possible, unadjusted data is
used to calculate ratios based only on stock variables, since stock variables do
not need to be quarterized.

21
Due to data limitations, industry statistics exclude nonbank subsidiaries of small
BHCs that do not file a FR Y-9C (currently the FR Y-9C is filed only by firms with
$500m in total assets). The effect of this exclusion on industry statistics is
expected to be minor, however, since small BHCs generally do not have large
nonbank subsidiaries.
Data notes 1. The definition of tier 1 common equity for BHCs used for this report is: tier 1
common equity = tier 1 capital – perpetual preferred stock and related surplus + nonqualifying perpetual preferred stock – qualifying Class A noncontrolling (minority) interests in consolidated subsidiaries – qualifying restricted core capital elements (other than cumulative perpetual preferred stock) – qualifying mandatory convertible preferred securities of internationally active bank holding companies. The definition of tier 1 common equity for banks is: tier 1 common equity = tier 1 capital – perpetual preferred stock and related surplus + nonqualifying perpetual preferred stock – qualifying noncontrolling (minority) interests in consolidated subsidiaries.
2. In the first quarter of 2010, banking organizations were required to transfer
certain off-balance sheet items onto their balance sheets under FASB 166 and 167. These guidelines substantially affected loan balances, as large amounts of securitized loans were transferred onto bank balance sheets. This accounting change was likely a major factor influencing year-over-year growth rates of loans and total assets during this period, potentially causing these growth rates to appear larger than they would have otherwise been.