Embed Size (px)
Citation preview

Quaternary Science Reviews Volume 24, Issues 5-6 , March 2005, Pages 681-708
Copyright © 2004 Elsevier Ltd All rights reserved.
Basal Ice Facies and Supraglacial Melt-Out Till of the Laurentide Ice Sheet, Tuktoyaktuk Coastlands, Western Arctic Canada
J.B. Murtona, , , C.A. Whitemanb, R.I. Wallerc, W.H. Pollardd, I.D. Clarke and S.R. Dallimoref
aDepartment of Geography, University of Sussex, Brighton BN1 9QJ, UK bSchool of the Environment, University of Brighton, Brighton BN2 4GJ, UK cSchool of Earth Sciences and Geography, Keele University, Keele, Staffs ST5 5BG, UK dDepartment of Geography, McGill University, 805 Sherbrooke Street West, Montreal, Québec H3A 2K6, Canada eDepartment of Earth Sciences, University of Ottawa, 140 Louis Pasteur, Ottawa, Ontario K1N 6N5, Canada fTerrain Sciences Division, Geological Survey of Canada, 9860 West Saanich Road, Sidney, British Columbia V8L 4B2, Canada Received 18 December 2002; accepted 6 June 2004. Available online 12 August 2004. Abstract
Glacially-deformed massive ice and icy sediments (MI–IS) in the Eskimo Lakes Fingerlands and Summer Island area of the Tuktoyaktuk Coastlands, western Arctic Canada, show, in the same stratigraphic sequences, features characteristic of both basal glacier ice and intrasedimental ice. Basal-ice features comprise (1) ice facies and facies groupings similar to those from the basal ice layers of contemporary glaciers and ice sheets in Alaska, Greenland and Iceland; (2) ice crystal fabrics similar to those from basal ice in Antarctica and ice-cored moraines on Axel Heiberg Island, Canada; and (3) a thaw or erosional unconformity along the top of the MI–IS, buried by glacigenic or aeolian sediments. Intrasedimental ice consists of pore ice and segregated ice formed within Pleistocene sands deposited before glacial overriding. The co-existence of basal and intrasedimental ice within the MI–IS records their occurrence within the basal ice layer of the Laurentide Ice Sheet. Stagnation of the ice sheet and melt-out of till from the ice surface allowed burial and preservation of the basal ice layer on a regional scale. The widespread occurrence of supraglacial melt-out till with clast fabrics similar to those in the underlying ice suggests that such till can be well preserved during partial thaw of a continental ice sheet in lowlands underlain by continuous permafrost.
Article Outline
1. Introduction 2. The study area 2.1. Quaternary history 2.2. Massive ice and icy sediments 2.3. Eskimo Lakes Fingerlands and Kittigazuit Low Hills 3. Methods 4. Observations 4.1. Description of MI–IS facies 4.1.1. Pure ice facies (PI) 4.1.2. Aggregate-poor ice facies (API)

4.1.3. Aggregate-rich ice facies (ARI) 4.1.4. Ice-rich diamicton facies (IRDF) 4.1.5. Sand-poor ice facies (SPI) 4.1.6. Sand-rich ice facies (SRI) 4.1.7. Ice-rich sand and gravel facies (IRSG) 4.2. Cryostratigraphy 4.3. Petrography of MI–IS 4.3.1. Mason Bay 4.3.2. Crumbling Point 4.3.3. `Wayne Island' 4.4. Heavy minerals 4.5. Clast fabrics 4.6. Stable isotopes in ground ice 5. Interpretation 5.1. Melt-out till 5.2. Massive ice-icy sediments 5.2.1. Basal ice 5.2.2. Intrasedimental ice 6. Discussion 6.1. Basal ice layer 6.2. Preservation of supraglacial melt-out till 7. Conclusions Acknowledgements References 1. Introduction
Glaciated lowlands in western Arctic Canada and northwestern Siberia contain many bodies of massive ice and icy sediments. Icy sediments contain excess ice, usually in the form of multiple ice lenses (Rampton and Mackay, 1971), and have a gravimetric ice content of less than 250%, whereas massive ice usually forms large, tabular bodies and has an ice content exceeding 250% (Harris et al., 1988). The distinction between massive ice and icy sediments, however, can be difficult to apply to complex stratigraphic sequences whose ice contents vary greatly over horizontal and vertical distances of a few metres or less as a result of glacial disturbance. Such glacially-deformed sequences can be described generally as massive ice and icy sediments (MI–IS) and specifically in terms of ice facies (cryofacies), as outlined in this paper.
MI–IS within glacial limits in Canada and Siberia have usually been interpreted either as buried glacier ice or as intrasedimental ice (ice formed within pre-existing sediment; Mackay and Dallimore, 1992). Distinguishing between them is fundamental to understanding the origin of massive ice, the interactions between glaciers and permafrost, and the history of Pleistocene ice sheets. However, interpretation of MI–IS is often problematic (Vtyurin and Glazovskiy, 1986 and French and Harry, 1990), because intrasedimental ice may be difficult to distinguish from basal glacier ice, since both ice types can form by the same freezing processes (cf. Mackay, 1989). Thus the extent and relative importance of buried ice and intrasedimental ice remain uncertain. In addition, the possibility of widespread preservation of basal ice from the Laurentide Ice Sheet (LIS) merits scrutiny given (1) the growing consensus, albeit based on limited ice exposures, that buried Laurentide ice is widespread within large moraine belts, hummocky till and glaciofluvial deposits in western Arctic Canada (Sharpe, 1992, Dredge et al., 1999, St-Onge and McMartin, 1999 and Dyke and Savelle, 2000) and (2) the suggestions that buried ice from the Barents-Kara Ice Sheet has been widely preserved for c. 80–90 ka in northwestern Siberia (Kaplyanskaya and Tarnogradskiy, 1986, Astakhov and Isayeva, 1988 and Svendsen et al., 2004) and that buried ice of Miocene age has been preserved in southern Victoria Land, Antarctica (Marchant et al., 2002).
A new approach to describing MI–IS and interpreting their origin is to distinguish individual ice facies, based on the physical characteristics of the ice and sediment, and compare them with facies from intrasedimental massive ice and contemporary basal glacier ice. Hubbard and Sharp (1995), for example, have proposed a genetic classification for the basal ice facies of Alpine glaciers, each facies being attributed to distinctive basal conditions and processes. In contrast, classification and genetic interpretation of MI–IS facies have not yet been attempted.
This paper discusses glacially-deformed MI–IS inside the limit of the LIS in the Tuktoyaktuk Coastlands of western Arctic Canada (Fig. 1). The objectives are (1) to distinguish the individual ice facies of MI–IS; (2) to compare them with contemporary basal ice and englacial ice from Greenland, Alaska and Iceland, and with intrasedimental massive ice from Canada, in order to interpret their origin; and (3) to examine the
cryostratigraphic, sedimentological and genetic relationships between MI–IS and overlying till. We conclude that basal Laurentide ice buried by supraglacial melt-out till is widely preserved in the Tuktoyaktuk Coastlands.
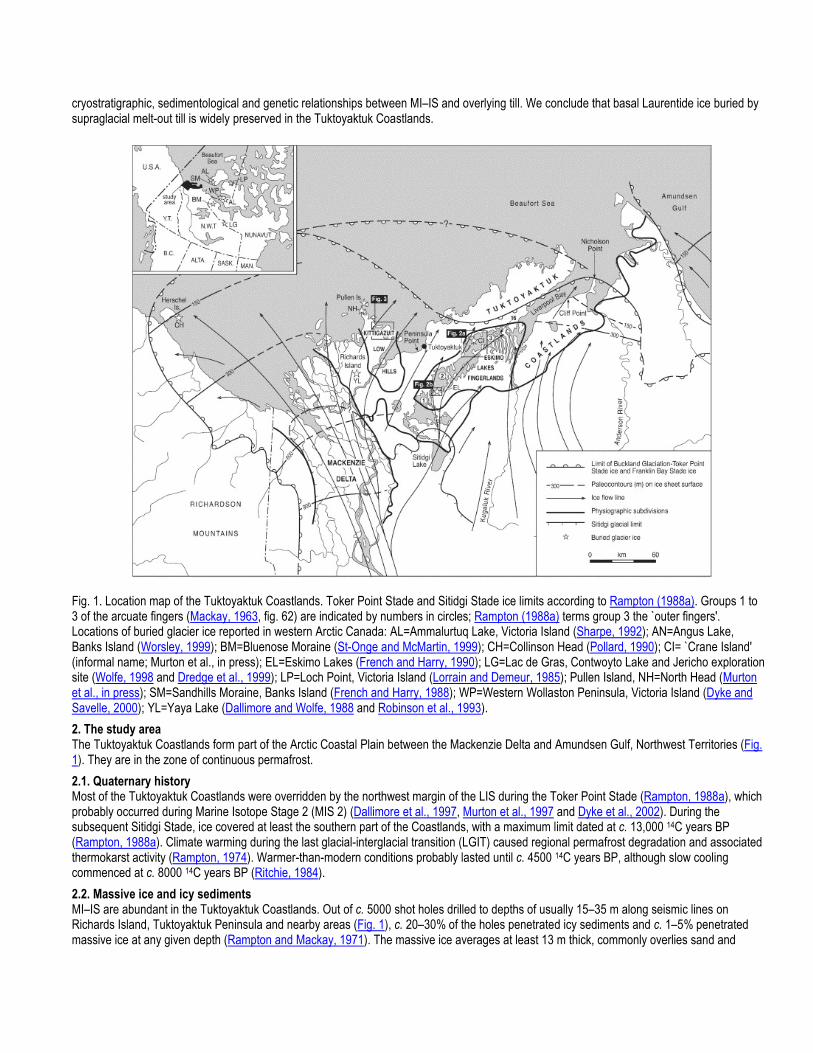
Fig. 1. Location map of the Tuktoyaktuk Coastlands. Toker Point Stade and Sitidgi Stade ice limits according to Rampton (1988a). Groups 1 to 3 of the arcuate fingers (Mackay, 1963, fig. 62) are indicated by numbers in circles; Rampton (1988a) terms group 3 the `outer fingers'. Locations of buried glacier ice reported in western Arctic Canada: AL=Ammalurtuq Lake, Victoria Island (Sharpe, 1992); AN=Angus Lake, Banks Island (Worsley, 1999); BM=Bluenose Moraine (St-Onge and McMartin, 1999); CH=Collinson Head (Pollard, 1990); CI= `Crane Island' (informal name; Murton et al., in press); EL=Eskimo Lakes (French and Harry, 1990); LG=Lac de Gras, Contwoyto Lake and Jericho exploration site (Wolfe, 1998 and Dredge et al., 1999); LP=Loch Point, Victoria Island (Lorrain and Demeur, 1985); Pullen Island, NH=North Head (Murton et al., in press); SM=Sandhills Moraine, Banks Island (French and Harry, 1988); WP=Western Wollaston Peninsula, Victoria Island (Dyke and Savelle, 2000); YL=Yaya Lake (Dallimore and Wolfe, 1988 and Robinson et al., 1993).
2. The study area The Tuktoyaktuk Coastlands form part of the Arctic Coastal Plain between the Mackenzie Delta and Amundsen Gulf, Northwest Territories (Fig. 1). They are in the zone of continuous permafrost.
2.1. Quaternary history Most of the Tuktoyaktuk Coastlands were overridden by the northwest margin of the LIS during the Toker Point Stade (Rampton, 1988a), which probably occurred during Marine Isotope Stage 2 (MIS 2) (Dallimore et al., 1997, Murton et al., 1997 and Dyke et al., 2002). During the subsequent Sitidgi Stade, ice covered at least the southern part of the Coastlands, with a maximum limit dated at c. 13,000 14C years BP (Rampton, 1988a). Climate warming during the last glacial-interglacial transition (LGIT) caused regional permafrost degradation and associated thermokarst activity (Rampton, 1974). Warmer-than-modern conditions probably lasted until c. 4500 14C years BP, although slow cooling commenced at c. 8000 14C years BP (Ritchie, 1984).
2.2. Massive ice and icy sediments MI–IS are abundant in the Tuktoyaktuk Coastlands. Out of c. 5000 shot holes drilled to depths of usually 15–35 m along seismic lines on Richards Island, Tuktoyaktuk Peninsula and nearby areas (Fig. 1), c. 20–30% of the holes penetrated icy sediments and c. 1–5% penetrated massive ice at any given depth (Rampton and Mackay, 1971). The massive ice averages at least 13 m thick, commonly overlies sand and
gravel and underlies clay or pebbly clay (till) (Mackay, 1971). Mackay (1971) attributed most of the massive ice to ice segregation, and Rampton, 1974, Rampton, 1988a and Rampton, 1988b developed this idea into a regional model in which massive ice formed in front of the retreating ice sheet. Rampton (1991) later revised his model to avoid the necessity for water under high pressure to move large distances under thin, aggrading permafrost without rupturing it. In the revised model, the upper c. 50–100 m of permafrost degraded beneath the terminus of the ice sheet (cf. French and Harry, 1990). Then stagnation and thinning of the LIS allowed permafrost to aggrade beneath it and form subglacial massive ice, with water supplied from glacial meltwater. Mackay and Dallimore (1992), however, questioned whether this combination of ice-sheet stagnation, subglacier water flow and subglacial massive-ice growth occurred contiguously in view of the cold ground temperature (MAGT of perhaps -8C or colder) and time required to grow tens of metres of massive ice (c. 100–500 years). They suggested (p. 1245) other possibilities for the origin of the massive ice, such as “subglacier massive-ice growth beneath stagnant glacier ice of limited areal extent together with pore-water expulsion from permafrost growth in subaerial areas.”
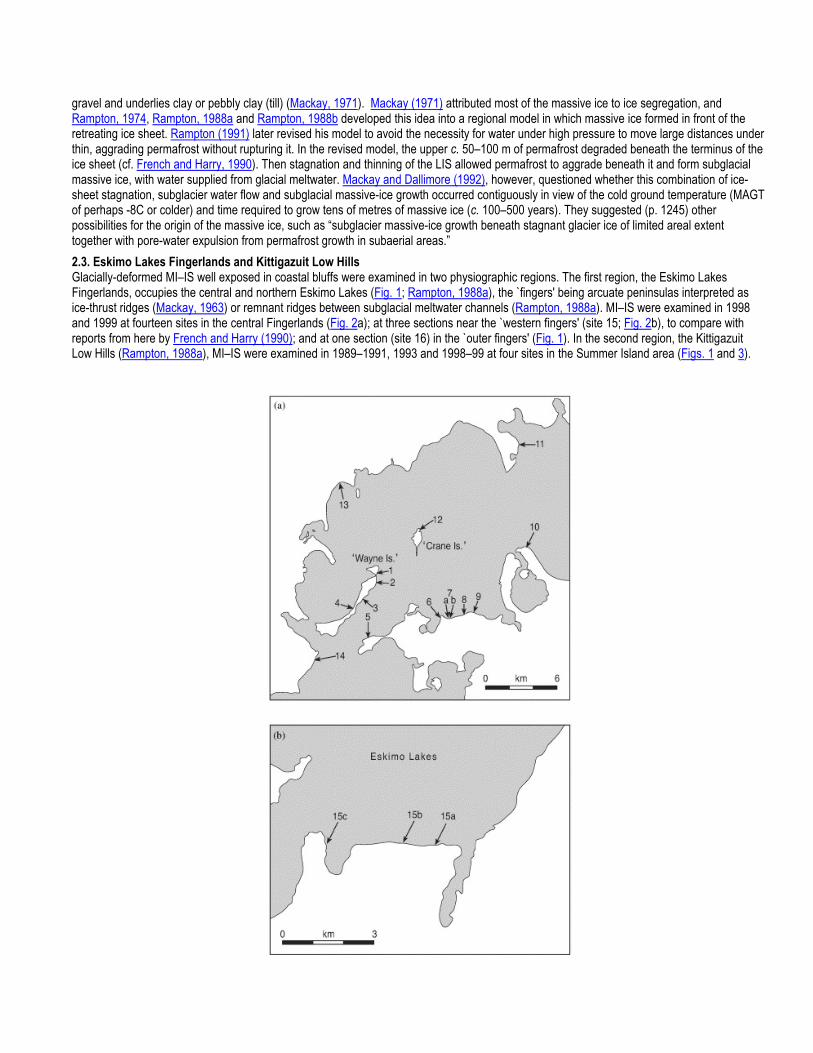
2.3. Eskimo Lakes Fingerlands and Kittigazuit Low Hills Glacially-deformed MI–IS well exposed in coastal bluffs were examined in two physiographic regions. The first region, the Eskimo Lakes Fingerlands, occupies the central and northern Eskimo Lakes (Fig. 1; Rampton, 1988a), the `fingers' being arcuate peninsulas interpreted as ice-thrust ridges (Mackay, 1963) or remnant ridges between subglacial meltwater channels (Rampton, 1988a). MI–IS were examined in 1998 and 1999 at fourteen sites in the central Fingerlands (Fig. 2a); at three sections near the `western fingers' (site 15; Fig. 2b), to compare with reports from here by French and Harry (1990); and at one section (site 16) in the `outer fingers' (Fig. 1). In the second region, the Kittigazuit Low Hills (Rampton, 1988a), MI–IS were examined in 1989–1991, 1993 and 1998–99 at four sites in the Summer Island area (Figs. 1 and 3).

Fig. 2. Field sites in central Eskimo Lakes region (a), and adjacent to inner fingers (b).
Fig. 3. Field sites in Summer Island area.
3. Methods
Sedimentological logging and sketching of large stratigraphic sections were carried out to determine the cryostratigraphic setting of the MI–IS. Particular attention was given to establishing (1) the cryostructures and cryofacies (Murton and French, 1994), (2) the nature and origin of the upper and lower contacts of the MI–IS, and (3) the stratigraphic and sedimentological relationships between diamicton dispersed within the MI–IS and the diamicton above it. Volumetric ice contents were measured in MI–IS and diamicton at Crumbling Point, Summer Island (Fig. 3), in order to quantify visual estimates of ice content.
Clast fabrics were measured in 19 samples of MI–IS and 13 samples of till in order to (1) determine if they had similar fabrics to each other and (2) compare them with fabrics reported from basal ice and melt-out till. Each fabric involved measuring the orientation and dip of 25–50 clasts with a:b axis ratios of 3:2. From these data were calculated the three principal eigenvalues (S1,S2 and S3; Mark, 1973) and indices of fabric isotropy (I=S3/S1) and fabric elongation (E=1-(S2/S1)). The fabrics were plotted on a ternary diagram to show their position relative to the isotropic, girdle and cluster end members (Benn, 1994).
Heavy minerals were analysed from twelve sediment samples of MI–IS and overlying diamicton at Crumbling Point to determine if the mineral assemblages indicated (1) a single provenance for the sediment, and (2) preferential weathering of labile minerals during deposition of the diamicton. The samples were sieved at 63 and intervals and heavy minerals (>3.3 s.g.) separated using methylene iodide. Magnetic minerals were removed with an automagnet and 300 grains mounted in araldite for point counting (Paré, 1983). The percentages were calculated according to the frequency of heavy-mineral occurrences. Mineral tarnishing and morphological variation were recorded qualitatively.
Petrographic analysis of three oriented block samples of MI–IS was carried out to provide information about the origin of ground ice and about its temperature and stress history (Gell, 1978, Pollard and Dallimore, 1988 and Pollard, 1990). The blocks were analysed in the McGill University Geocryology Laboratory, following methods described by Langway (1958). The blocks were trimmed and cut into thick slices to examine cryostructure and inclusion patterns. Vertical thin-sections were prepared from sub-samples and examined under cross-polarized light to determine crystal size and shape, and under plane light to examine structural characteristics. Crystal c-axis orientations were measured using a standard Rigsby stage. The high sediment content and occasional pebble made sample and thin-section preparation problematic. Measurements of crystal size and orientations were mostly obtained from partial thin sections and by physically picking apart ice layers and ice matrix; hence the number of crystal orientations for each sample is small. Fabric diagrams are plotted as lower hemisphere projections on a Schmidt equal area net.
Oxygen and deuterium isotopic analysis of 65 samples of MI–IS, 15 samples of segregated ice in overlying diamicton and eight samples of reticulate ice in glaciolacustrine silt and clay above the diamicton was undertaken in order to compare with existing isotopic data from massive
ice and to establish if isotopic trends or discontinuities occurred in the stratigraphic sequence. Isotopic analyses were carried out to an analytical precision of ±1‰ for δD and ±0.1‰ for δ18O at the G.G. Hatch Stable Isotope Laboratories, University of Ottawa.
Particle-size analysis of the fraction of sediment from within MI–IS and diamicton was carried out using a CILAS 940 particle-sizer in order to compare their textural characteristics.
4. Observations
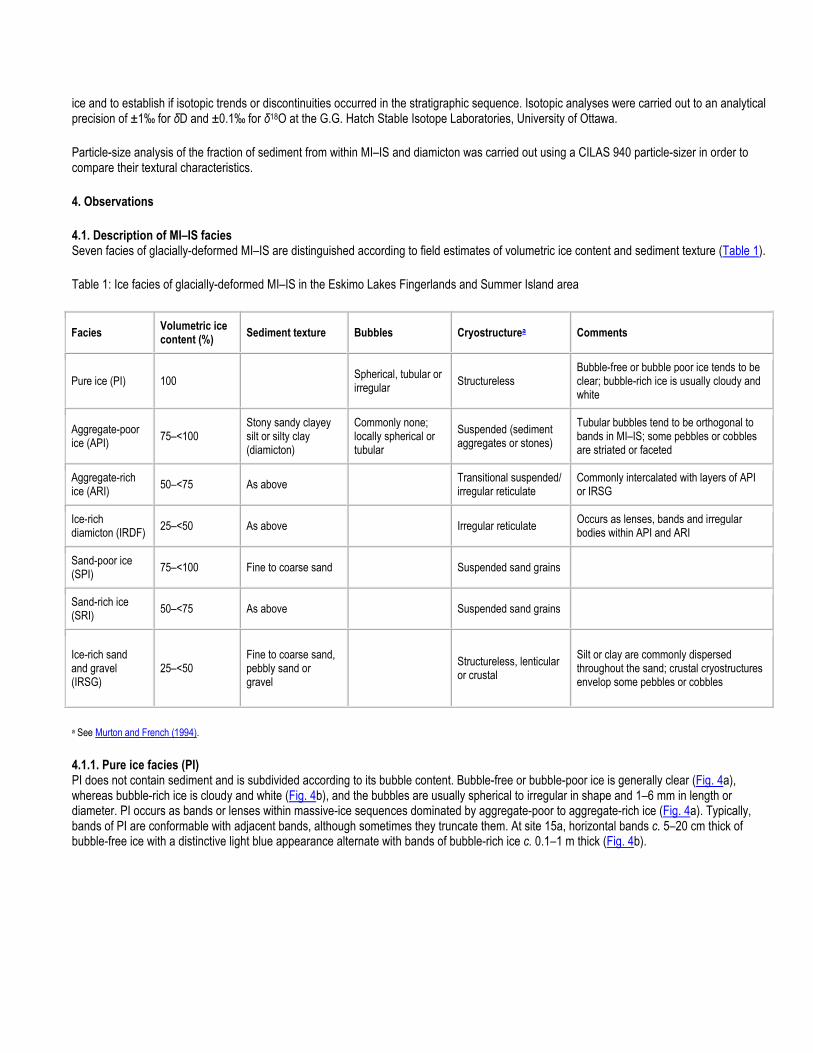
4.1. Description of MI–IS facies Seven facies of glacially-deformed MI–IS are distinguished according to field estimates of volumetric ice content and sediment texture (Table 1).
Table 1: Ice facies of glacially-deformed MI–IS in the Eskimo Lakes Fingerlands and Summer Island area
Facies Volumetric ice content (%)
Sediment texture Bubbles Cryostructurea Comments
Pure ice (PI) 100
Spherical, tubular or irregular
Structureless Bubble-free or bubble poor ice tends to be clear; bubble-rich ice is usually cloudy and white
Aggregate-poor ice (API)
75–<100 Stony sandy clayey silt or silty clay (diamicton)
Commonly none; locally spherical or tubular
Suspended (sediment aggregates or stones)
Tubular bubbles tend to be orthogonal to bands in MI–IS; some pebbles or cobbles are striated or faceted
Aggregate-rich ice (ARI)
50–<75 As above
Transitional suspended/ irregular reticulate
Commonly intercalated with layers of API or IRSG
Ice-rich diamicton (IRDF)
25–<50 As above
Irregular reticulate Occurs as lenses, bands and irregular bodies within API and ARI
Sand-poor ice (SPI)
75–<100 Fine to coarse sand
Suspended sand grains
Sand-rich ice (SRI)
50–<75 As above
Suspended sand grains
Ice-rich sand and gravel (IRSG)
25–<50 Fine to coarse sand, pebbly sand or gravel
Structureless, lenticular or crustal
Silt or clay are commonly dispersed throughout the sand; crustal cryostructures envelop some pebbles or cobbles
a See Murton and French (1994).
4.1.1. Pure ice facies (PI) PI does not contain sediment and is subdivided according to its bubble content. Bubble-free or bubble-poor ice is generally clear (Fig. 4a), whereas bubble-rich ice is cloudy and white (Fig. 4b), and the bubbles are usually spherical to irregular in shape and 1–6 mm in length or diameter. PI occurs as bands or lenses within massive-ice sequences dominated by aggregate-poor to aggregate-rich ice (Fig. 4a). Typically, bands of PI are conformable with adjacent bands, although sometimes they truncate them. At site 15a, horizontal bands c. 5–20 cm thick of bubble-free ice with a distinctive light blue appearance alternate with bands of bubble-rich ice c. 0.1–1 m thick (Fig. 4b).

Fig. 4. MI–IS facies. (a) Pure ice (PI) layers within aggregate-poor ice (API), Mason Bay. Vertical tubular bubbles (arrows) in PI indicate ice segregation. Hand for scale. (b) API and PI beneath Portage Point Sands, site 15a, Eskimo Lakes Fingerlands. PI consists of alternating layers of bubble-rich (white) and bubble-poor (grey in photograph) ice. Angular unconformity along the top of PI has a relief of c. 1 m. Person for scale. (c) Pebble-rich API with intercalated layers of PI, Mason Bay. Notebook for scale. (d) Intercalated layers of aggregate-rich ice (ARI) and ice-rich sand (IRSG), truncated along a thaw unconformity (dashed line) marking base of Early Holocene active layer, Crumbling Point, Summer Island. (e) Bands of ice-rich diamicton (IRDF) within PI, API and ARI, site 13. A prominent angular unconformity (dashed line) truncates bands in the MI–IS and underlies melt-out till. Section is c. 4 m high. (f) Folded icy sediments comprising intercalated sand-poor ice (SPI) and ice-rich sand (IRSG), site 1, `Wayne Island'. Section is c. 2 m high.
4.1.2. Aggregate-poor ice facies (API) API has a volumetric ice content above 75% and below 100%. Sediment within the ice occurs mainly as suspended aggregates of sandy clayey silt or silty clay (Fig. 5). The aggregates are typically equant, rounded to subangular and 0.5–8 mm in diameter (Fig. 4a); occasionally they are angular to subangular and in length or diameter. Also suspended within API are rock granules to cobbles ( long), rounded to subangular (Fig. 4c); some clasts are striated or facetted. The ice itself is bubble-free to bubble-poor (Fig. 4a). Any bubbles are usually spherical (1–2 mm in diameter) or tubular (0.5–1 mm diameter and long), the latter often vertical and orthogonal to the host ice layers. API is typically layered, with individual layers or lenses c. 5–300 mm thick (Figs. 4b and c) and marked by changing concentrations of aggregates. It frequently has

gradational contacts with intercalated layers of PI and ARI. API is often the dominant facies exposed in sequences of glacially-deformed massive ice.
Fig. 5. Particle-size data for MI–IS, diamicton (melt-out till) and Toker Point till.
4.1.3. Aggregate-rich ice facies (ARI) ARI is very similar to API (Fig. 4d), apart from its lower volumetric ice content (50–<75%) and the cryostructure, which is commonly transitional between irregular reticulate and suspended. 4.1.4. Ice-rich diamicton facies (IRDF) IRDF has a volumetric ice content of 25–<50%. It is generally very dark grey (5Y 3/1), massive and matrix-supported, containing rounded to subrounded pebbles and cobbles. The cryostructure is irregular reticulate, the blocks between ice veins being angular and wide and high. IRDF forms lenses and layers (c. 1–70 cm thick) and irregular bodies within API or ARI (Fig. 4e). The diamicton resembles in particle size and colour sediment dispersed in API and ARI, and diamicton which overlies massive ice (Fig. 5). Occasionally, where pebbles are rare or absent this facies is better termed ice-rich silt or clay. 4.1.5. Sand-poor ice facies (SPI) SPI has volumetric ice content above 75% and below 100%, although it usually exceeds c. 85%. This facies comprises c. 1–7 mm thick laminae that are marked by changing concentrations of sand grains suspended in ice. It sometimes contains a few aggregates of sandy silty clay. In places, SPI forms alternating bands (1–2 mm thick) with PI, sand-rich ice or ice-rich sand (Fig. 4f). 4.1.6. Sand-rich ice facies (SRI) SRI is distinguished from the SPI by volumetric ice contents of between 50% and 75%. SRI has been observed as laminae c. 3–10 mm thick within API. 4.1.7. Ice-rich sand and gravel facies (IRSG) IRSG is pore-ice cemented sand or gravel with a volumetric ice content of between 25% and 50% (Fig. 4d). The sand commonly contains pebbles, cobbles and very dark grey (5Y 3/1) silt and clay. Cryostructures within IRSG comprise structureless, lenticular and crustal types. IRSG forms alternating layers (c. 10–100 mm thick) with ARI (Fig. 4d), API or PI, and elongate clasts may be aligned parallel with the layers. IRSG also occurs as streamlined pods and lenses intercalated with SPI (Fig. 4f). 4.2. Cryostratigraphy The cryostratigraphic setting of MI–IS is illustrated from `Wayne Island' (informal name) and Crumbling Point, supplemented by observations from adjacent localities (Figs. 2, 3). The cryostratigraphy common to both areas comprises, in ascending order, (1) sand or gravel, (2) MI–IS and (3) diamicton (Tables 2 and 3; Figs. 6, 7 and 9). The lowest stratigraphic unit observed at Crumbling Point is aeolian sand of the pre-glacial Kittigazuit Formation, and at site 1 on `Wayne Island' it consists of glaciofluvial sand and gravel of the Toker Point Member.

Table 2: Cryostratigraphy of site 1, `Wayne Island', Eskimo Lakes Fingerlands
Stratigraphic Unit
Description Comments Interpretation
Laminated silt and clay (3 m thick)
Horizontal, planar parallel strata with sharp contacts between very dark greyish brown (2.5Y 3/2) clayey silt laminae typically 20–30 mm thick and very dark grey (2.5Y 3/0) silty clay laminae typically 5–10 mm thick; contains reticulate ice
Penetrated by two horizons of ice wedges (Fig. 7b), the upper truncated at c. 0.5 m depth (base of modern active layer), the lower at c. 1.5–2.0 m
Glaciolacustrine sediments. Base of Early Holocene active layer truncates lower horizon of ice wedges (cf. Burn, 1997), and so thaw or erosion of underlying MI–IS pre-dates Early Holocene
Pebbly sand Silty fine sand to gritty coarse sand with abundant granules and pebbles; massive; discontinuous; occurs in depressions in diamicton surface (Fig. 6)
Pebbly sand sharply overlies diamicton and, in places, rests directly on MI–IS. At site 14 (Fig. 2a), this unit varies laterally from sandy gravel ( thick) with clasts long to a discontinuous pebble-cobble layer only one clast thick (Fig. 8)
Water-sorted lag deposit, with clasts reworked from underlying diamicton
Ice-rich diamicton )
Very dark grey (5Y 3/1), massive; silty clay to clayey silt matrix; clasts long, mostly rounded to subangular, matrix-supported; discontinuous unit
At site 4 (Fig. 2a), unit forms irregular bodies above MI–IS and is commonly absent. At site 13 (Fig. 2a), unit is present above MI–IS with bands of IRDF (Fig. 4e), but absent where MI–IS comprises PI
Supraglacial melt-out till
MI–IS a ( at least13 m)
Upper unit dominated by massive ice: bubble-free to bubble-rich PI, API, subsidiary ARI and IRDF; upper contact planar to undulating angular unconformity (Fig. 6a)
Basal ice layer of LIS: Upper unit is dominated by basal ice
Lower unit dominated by icy sediments: IRSG, SPI, API and PI; contains sand pods and lenses, folds and thrusts (Figs. 4f, 6 and 7); sand pods (n=4) 0.6–1.6 m thick, 3.2–6.0 m long (Fig. 7a), streamlined, taper into elongate sand lenses; tight to isoclinal folds, many highly attenuated, some within sand pods; fold axes aligned more or less parallel to adjacent sand lenses, sand pods and layering in icy sediments (Fig. 7a); lower contact sharp, planar to curved
General alignment of structures in icy sediments curves smoothly around upstanding body of underlying sand and gravel to northeast of icy sediments (Figs. 6 and 7). Deformation structures are of similar type and size to those in frozen glacitectonite at Liverpool Bay, `Crane Island', Pullen Island and North Head (Figs. 1 and 2a; Murton et al., in press)
Lower unit comprises basal ice developed within a glacitectonite derived from underlying sand and gravel. Ice flow towards northeast or north-northeast
Sand and gravel
Light grey, medium- to fine-grained sand with many faults and shear planes; massive to crudely stratified gravel contains generally rounded to subrounded clasts long; crops out c. 1–7 m above sea level
Similar colour, texture and deformation structures to sand and gravel 8–9 km southeast of `Wayne Island', mapped by Rampton (1988a) as ice-contact deposits of the Toker Point Member
Glaciofluvial deposits that pre-date glacial overriding
a At site 4 on `Wayne Island' (Fig. 2a), MI–IS is in places overlain by dark olive grey (5Y 3/2), silty fine sand thick containing abundant climbing ripples. Rampton (1988a) designates this stratigraphic unit the Portage Point Sands and interprets it as a glaciofluvial valley train or outwash plain deposited during the Sitidgi Stade.
Table 3: Cryostratigraphy at Crumbling Point, Summer Island
Stratigraphic unit
Descriptiona Comments Interpretation
Sand ( c. 2 m thick)
Fine-grained sand within involutions, sand wedges (Figs. 10 and 11) and discontinuous sand sheet
Aeolian sand deposited before till
Diamicton (c. 0.5–
Massive, matrix-supported; rounded to subrounded granule to cobbles; matrix of sandy clayey silt texturally similar to that
Diamicton mapped as Toker Point till at Crumbling Point and
Supraglacial melt-out till formed when active-layer deepened during

Stratigraphic unit
Descriptiona Comments Interpretation
2 m) dispersed within underlying MI–IS (Fig. 11); IRDF, ARI, API and IRSG; sediment aggregates in ARI and API are c. 8 cm long, platy and angular (Fig. 4d), those in ARI being separated by ice lenses
beside Mason Bayb Stratified sand and gravel interpreted as a glaciofluvial deposit overlies MI–IS beneath a meltwater channelc
LGIT. Soft-sediment deformation formed thermokarst involutions a
MI–IS
Upper unit dominated by massive ice; API with subsidiary amounts of ARI, IRSG and bubble-rich PI; average vol. ice content c. 84% (s=8%; n=10); layers c. 0.01–0.4 m thick, c. 2–60 m long, horizontal to moderately inclined, parallel to subparallel; suspended rock clasts c. 1 m diameter, some striated; tight to isoclinal recumbent folds (Fig. 12); upper contact sharp, generally planar, horizontal, angular unconformity at c. 2.0 m depth beneath flat ground (Fig. 10, Fig. 11 and Fig. 12)
Upper unit (`layered cryofacies assemblage' of Murton and French, 1994) is sometimes absent
Basal ice layer of LIS: Upper unit isdominated by basal ice
Lower unit dominated by icy sediments; bubble-rich PI, SPI, SRI, API, ice-rich clay and IRSG; fine- to medium grained grey sand, locally pebbly, silty or organic-rich; parallel to subparallel lamination, planar to wavy; some cross stratification; numerous tight to isoclinal folds, thrusts, sand pods, pinch-and-swell structures; ice lenses c. 0.1–80 cm thick, c. 0.03–4.0 m long, some folded; ice veins truncate lamination and deformation structures; ice crusts
Deformation structures are of similar type and size to those in frozen glacitectonite at Liverpool Bay, `Crane Island', Pullen Island and North Head (Figs. 1 and 2a; Murton et al., in press)
Lower unit comprises basal ice developed within a glacitectonite derived in part from the pre-glacial Kidluit or Kittigazuit Formationsd. Folded ice lenses pre-date glacial deformation; ice veins post-date it
+ Kittigazuit Fm. d
Brown, fine-grained sand crops out c. 1–2 m above sea level
Pre-glacial aeolian sand (Dallimore et al., 1997)
a Description of sand, diamicton and upper unit of MI–IS is summarised from Murton and French, 1993 and Murton and French, 1994, Murton (1999), Murton et al., 1995 and Murton et al., 1997. b Terrain Analysis and Mapping Services Limited (1993, fig. 8). c Murton et al. (1997). d Defined by Rampton (1988a).
The MI–IS are at least 13 m thick and often comprise a lower unit dominated by icy sediments (IRSG, SRI, SPI, API and PI) and an upper unit dominated by massive ice (principally API or PI). Sediment within the lower unit is mainly sand or pebbly sand similar to that in the underlying or local Pleistocene stratigraphy. Deformation structures consist of thrusts, sand pods and lenses, pinch-and-swell structures and tight to isoclinal folds (Figs. 4f, 6, 7 and 9). Sediment within the upper unit is mainly a sandy clayey silt diamicton dispersed throughout the ice (API; Figs. 4a–c) or concentrated in layers or lenses (IRDF; Fig. 4e). Deformation structures comprise tight folds (Figs. 10 and 12) and tilted layers and lenses (Figs. 4d and e). The upper contact of the MI–IS is an angular unconformity.

Fig. 6. (a) Schematic log showing stratigraphic context of MI–IS at site 1, `Wayne Island', Eskimo Lakes Fingerlands. (b) Detailed log through the lower unit of icy sediments.

Fig. 7. MI–IS at site 1, `Wayne Island'. Glacially deformed icy sediments (a) underlie massive ice (b). The top of the massive ice is an angular uniformity that is overlain by diamicton (melt-out till) and glaciolacustrine silt and clay. Two horizons of ice wedges penetrate the silt and clay: Holocene wedges are truncated at a depth of c. 0.5 m (base of modern active layer), and pre-Holocene wedges are truncated at c. 1.5–2.0 m depth (base of Early Holocene active layer). Person for scale. Stratigraphic position of (a) and (b) is shown on Fig. 6a, and stratigraphic details are given in Table 2.
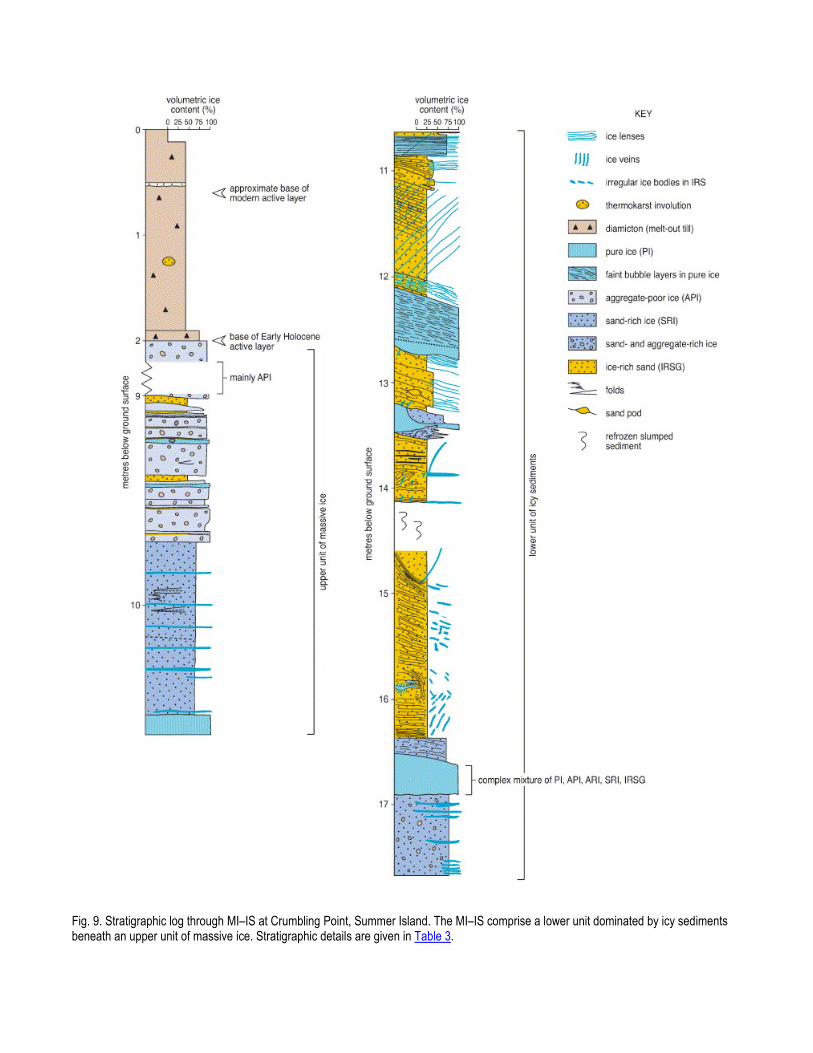
Fig. 9. Stratigraphic log through MI–IS at Crumbling Point, Summer Island. The MI–IS comprise a lower unit dominated by icy sediments beneath an upper unit of massive ice. Stratigraphic details are given in Table 3.

Fig. 10. Glacially-deformed MI–IS penetrated by sand wedges and overlain by diamicton (melt-out till), Crumbling Point. The top of the MI–IS, at a depth of c. 2 m, is a thaw unconformity that marks the base of the Early Holocene active layer. The base of the modern active layer, at a depth of c. 0.5 m, is indicated by tops of two Holocene ice wedges. Person for scale.
Fig. 12. Folds in MI–IS, Crumbling Point. Person for scale. The diamicton is up to 2 m thick. It is massive and contains rounded to subangular pebbles and cobbles supported within a matrix of sandy clayey silt or silty clay that is texturally similar to the sediment dispersed in the underlying MI–IS (Fig. 5). Where the MI–IS locally comprises PI and therefore lacks dispersed sediment, diamicton has not been observed above the ice. At Crumbling Point and beside Mason Bay (Fig. 3) the diamicton is mapped by Rampton as Toker Point till (Terrain Analysis and Mapping Services Limited, 1993, fig. 8).

Fig. 8. Discontinuous pebble-cobble layer one clast thick above Toker Point till and beneath rippled silty sand (Portage Point Sands), site 14, Eskimo Lakes Fingerlands. The clasts are interpreted as a lag deposit reworked by meltwater erosion of the till. Base of pencil marks an erosion surface beneath the pebble-cobble layer. The till is in places overlain by pebbly sand up to 25 cm thick. At `Wayne Island', the sequences are capped by laminated silt and clay or by silty fine sand. Two horizons of ice wedges are often present here, the lower with the tops of the wedges at a depth of c. 1–2 m and overlain by silt or sand, and the upper horizon overlain by the modern active layer (Figs. 6 and 7). At Crumbling Point fine sand occurs as sand wedges that penetrate the till and underlying MI–IS (Fig. 10), as involutions within the till (Fig. 11), or as a discontinuous sand sheet above it.
Fig. 11. MI–IS (dominantly API) containing numerous suspended pebbles and cobbles, Crumbling Point. Diamicton (melt-out till) above the thaw unconformity contains irregular shaped bodies of sand (thermokarst involutions). Person for scale. 4.3. Petrography of MI–IS 4.3.1. Mason Bay The upper 3–7 cm of MI–IS sample 99-26, from Mason Bay, contains faintly-laminated IRSG, ARI and ice-rich sandy clayey silt. The laminae are gently dipping (11–14), thin (1.0–1.2 mm) and some are discontinuous. Small lenses of ice-rich sandy clayey silt are suspended in a dirty ice matrix. Ice crystals are small (0.4–1.2 mm long), anhedral and have random c-axis orientations. This zone grades into a series of thicker (5–50 mm), gently dipping layers of PI, API, ARI and IRSG (Fig. 13), which are the most prominent structures in this sample. The ice layers are

irregular in shape, contain thin, discontinuous laminae of fine sandy silt suspended as faint parallel sediment bands 1–2 grains wide and grade both upward and downward into ARI and API. The ice layers comprise medium to small (5–17 mm long) anhedral and subhedral crystals oriented roughly parallel to the layer. Grain boundaries display minor dislocation. Crystal c-axes dip steeply, with a weak maximum oriented approximately normal to the internal structure (Fig. 14).
Fig. 13. Photograph of MI–IS sample 99-26 from Mason Bay, showing a thick section of clear ice layers under partially cross-polarized light.

Fig. 14. Lower hemisphere projections of c-axis orientations on Schmidt nets of vertical thin sections of MI–IS samples from Mason Bay, Crumbling Point and `Wayne Island'. The lower part of the sample contains massive to faintly laminated IRSG and sandy ARI. The ice content is slightly lower than the upper part of the sample, and occurs as ice films, pore ice and thin discontinuous gently dipping lenses. Ice crystals are anhedral and average c. 1 mm in diameter. Gas inclusions are limited to a few small () flattened bubbles in the ice layers and small bubbles along ice-sediment contacts. Sediment inclusions within the ice layer consist of individual grains and small clumps of flattened and smeared sandy silt or clay. 4.3.2. Crumbling Point Sample 99-27, from Crumbling Point, comprises gently-dipping lenses and layers of PI, API, ARI and IRSG. Ice layers and lenses are 2–9 mm thick and highly irregular. They contain thin sediment laminae and grade into enclosing materials. The thicker ice lenses contain tubular gas bubbles that are up to 10 mm long, less than 0.5 mm in diameter and vertically aligned. The thinner lenses of ice and icy sediment display small, spherical inter-crystalline gas bubbles, most of which enclose or are attached to small sediment grains or larger aggregates. The ice crystals that form the clear ice layers are 0.4–4.0 mm in diameter (mean = 1.7 mm), anhedral and randomly oriented. C-axes are gently dipping and form a loose sub-horizontal girdle (Fig. 14). 4.3.3. `Wayne Island' Sample 98-102, from site 1 on `Wayne Island', consists of weakly-layered PI, SPI and IRSG (Fig. 6a). Horizontal to subhorizontal layers of fine sand are separated by undulating ice layers and lenses 1.5–10.0 mm thick that contain suspended sand grains and spherical gas bubbles. The ice in these layers consists of small, anhedral crystals 1.3–8.0 mm long (mean = 4.2 mm). Very small () anhedral crystals occur along the ice-sediment contacts, and larger crystals occur in the middle of the ice layers. Crystal c-axes dip steeply, approximately normal to the layering (Fig. 14). Crystals from the same ice layer form series of weak maxima. The ice lenses and layers grade into adjacent sediment bands, within which ice occurs mainly as thin laminae, pore ice and ice matrix. Bands of small, spherical gas bubbles occur close to sediment grains. 4.4. Heavy minerals The heavy-mineral assemblages from the fine-sand fraction of the till and underlying MI–IS at Crumbling Point have the same average ratios of the non-labile minerals garnet to ilmenite (2.9%; Table 4). By contrast, the proportions of labile minerals in the MI–IS and in the middle to upper part of the till differ substantially. The MI–IS contain abundant pyrite (30.4–50.4%) and moderate amounts of siderite (5.7–23.7%) (Table 4). The pyrite is generally untarnished or only slightly tarnished, and the morphology of pyrite and siderite crystals varies considerably and includes some delicate forms. Goethite-covered pyrite and leucoxene are rare to absent (0.0–1.3% and 0.0–2.7%, respectively). The mineralogy of the MI–IS resembles that in the lowest 20 cm of the overlying till, where pyrite comprises 44.6–68.4%, and siderite comprises 13.3–17.3% of the assemblage (Table 4). Table 4: Frequency percentagesa of heavy minerals from the fine-sand fraction of till and underlying MI–IS at Crumbling Point
Material Sample Depth (cm) Px Hb Gn Ep Hm Go Py G-P TP Sd Cl Il Le Ot Gn/Il
Till 4 115–125+ 1.0 0.0 8.7 0.3 7.7 22.6 0.7 42.6 43.3 0.7 0.3 9.6 3.3 2.3 0.9
Till 3 60–70+ 0.3 0.3 8.6 0.7 6.0 26.0 0.3 46.7 47.0 0.3 0.3 7.0 3.0 0.3 1.2
Till 2 0–15+ 0.3 0.7 1.3 0.3 1.7 9.7 68.4 0.0 68.4 17.3 0.0 0.3 0.0 0.0 4.3
MI–IS 1 10–30− 0.3 0.0 2.7 0.3 6.7 33.0 47.0 0.0 47.0 6.3 1.0 0.7 0.7 1.6 3.9
Till vi 120–130+ 2.7 1.3 17.0 2.3 6.0 44.0 0.3 10.0 10.3 0.0 0.0 7.4 6.7 2.3 2.3
Till v 75–90+ 3.7 0.3 24.0 2.7 13.3 32.0 3.7 7.3 11.0 3.7 0.3 3.3 3.3 2.4 7.3
Till iv 40–60+ 1.0 0.0 20.6 2.0 5.7 26.4 15.7 5.3 21.0 6.7 0.3 8.6 4.7 2.9 2.4
Till iii 10–20+ 1.0 0.3 11.3 3.3 3.3 11.4 44.6 0.0 44.6 13.3 0.0 6.0 3.7 1.9 1.9
MI–IS ii 30–50− 1.3 0.3 10.0 1.0 6.0 30.7 38.0 1.0 39.0 5.7 0.3 2.3 2.3 1.0 4.3
MI–IS i 100–120− 0.3 0.0 5.0 3.3 7.0 28.4 40.0 1.3 41.3 8.3 1.0 1.7 2.3 1.3 2.9

Material Sample Depth (cm) Px Hb Gn Ep Hm Go Py G-P TP Sd Cl Il Le Ot Gn/Il
MI–IS X 15–35− 3.0 2.0 3.0 2.7 7.3 27.7 30.4 0.0 30.4 17.3 1.3 3.3 0.0 2.0 0.9
MI–IS A 105–115− 0.3 0.3 4.0 0.7 1.0 16.1 50.4 0.7 51.1 23.7 0.3 1.7 0.7 0.3 2.4
a Based on 300-grain counts. Samples 1–4 and i–vi represent two vertical sequences; X and A are from adjacent locations. Depths are measured relative to the thaw unconformity at the top of the MI–IS: `+' signifies above, `-' signifies below. Px=pyroxene; Hb=hornblende; Gn=garnet; Ep=epidote; Hm=hematite; Go=goethite; Py=pyrite; G-P=goethite-covered pyrite; TP=total pyrite (pyrite+goethite-covered pyrite); Sd=siderite; Cl=chloritoid; Il=ilmenite; Le=leucoxene; Ot=others (including staurolite, kyanite, rutile, zircon and unknown minerals).
The central and upper parts of the till contain at most only small amounts of pyrite (0.3–15.7%) and siderite (0.0–6.7%), and small to large amounts of goethite-covered pyrite (5.3–46.7%; Table 4). Most pyrite crystals are well tarnished and, like siderite, display little morphologic variability; delicate forms of pyrite and siderite are rare to absent. Twinned octahedrons of goethite, morphologically identical to those of pyrite in the MI–IS, represent either pseudomorphs of goethite after pyrite or pyrite completely covered by goethite. Leucoxene occurs in small amounts (3.0–6.7%), some of it partially covering crystals of ilmenite and sphene. 4.5. Clast fabrics Clast fabrics from MI–IS generally have strong preferred orientations, as indicated by their high indices of elongation (mean=0.772) and low indices of isotropy (mean=0.082; Table 5). The fabrics therefore tend to plot close to the `cluster' apex of the ternary diagram (Fig. 15a). Samples 7, 20 and 22, however, have relatively low elongation values, indicating greater variation in the V1/V2 plane and hence weaker orientations. The overall mean dip of clasts in the MI–IS is 15 (Table 5).
Table 5: Clast fabric parameters derived from MI–IS and till in the Eskimo Lakes Fingerlands and Summer Island area
Material Location Sample no. S1 S2 S3 Isotropy Elongation
Mean lineation Vector ()
MI–IS Hadwen Island 3 0.769 0.166 0.075 0.098 0.784 18 263
Crumbling Point 4 0.715 0.214 0.070 0.098 0.701 25 92
Mason Bay 5 0.776 0.160 0.065 0.084 0.794 24 74
Site 2, `Wayne Island' 6 0.776 0.158 0.067 0.086 0.796 13 181
Site 2, `Wayne Island' 7 0.685 0.274 0.040 0.058 0.600 10 124
Site 12, Eskimo Lakes 9 0.854 0.083 0.063 0.074 0.903 12 39
Site 14, Eskimo Lakes 12 0.754 0.172 0.074 0.098 0.772 14 252
Site 8, Eskimo Lakes 14 0.891 0.079 0.030 0.034 0.911 10 50
Site 8, Eskimo Lakes 15 0.918 0.066 0.016 0.017 0.928 12 50
Site 16, `Outer Fingers' 16 0.876 0.085 0.040 0.046 0.903 10 233
Site 13, Eskimo Lakes 17 0.802 0.129 0.069 0.086 0.839 12 172
Site 11, Eskimo Lakes 18 0.867 0.074 0.059 0.068 0.915 12 219
Site 1, `Wayne Island' 20 0.599 0.346 0.055 0.092 0.422 12 234
Site 10, Eskimo Lakes 21 0.778 0.174 0.047 0.060 0.776 13 232

Material Location Sample no. S1 S2 S3 Isotropy Elongation
Mean lineation Vector ()
Site 1, `Wayne Island' 22 0.570 0.320 0.110 0.193 0.439 17 218
Site 3, `Wayne Island' 23 0.678 0.178 0.144 0.212 0.737 22 252
Mason Bay 25 0.895 0.066 0.039 0.044 0.926 14
Mason Bay 26 0.795 0.160 0.045 0.057 0.799 21
Site 1, `Wayne Island' 27 0.752 0.202 0.046 0.061 0.731 23
Overall mean 0.776 0.163 0.061 0.082 0.772 15
Till Mason Bay 1 0.516 0.377 0.107 0.207 0.269 22 316
Mason Bay 2 0.742 0.169 0.089 0.120 0.772 16 281
Site 14, Eskimo Lakes 11 0.828 0.123 0.048 0.058 0.851 13 246
Site 1, `Wayne Island' 19 0.672 0.260 0.068 0.101 0.613 15 94
Crumbling Point 30 0.595 0.249 0.156 0.262 0.582 18
Crumbling Point 31 0.605 0.243 0.152 0.251 0.598 15
Crumbling Point 32 0.621 0.313 0.066 0.106 0.496 25
Crumbling Point 33 0.649 0.260 0.090 0.139 0.599 15
Crumbling Point 34 0.642 0.272 0.086 0.134 0.576 23
Crumbling Point 35 0.552 0.326 0.122 0.221 0.409 18
Crumbling Point 36 0.588 0.329 0.082 0.139 0.440 19
Hadwen Island 37 0.524 0.364 0.112 0.214 0.305 19
Hadwen Island 38 0.590 0.317 0.093 0.158 0.463 25
Overall mean 0.625 0.277 0.098 0.162 0.537 19

Fig. 15. Ternary diagrams showing clast fabrics of debris in MI–IS and melt-out till from this study (a) compared with fabrics from published data on basal ice and melt-out till (b). Isotropy values above 0.8 and elongation values below 0.2, which do not occur in the data, are omitted. The till generally has clast fabrics with weaker preferred orientations than fabrics from the MI–IS. This is shown by a lower mean index of elongation (0.537) and a higher mean index of isotropy (0.162) than the MI–IS fabrics (Table 5), and by data points plotting further from the `cluster' apex of Fig. 15a. Samples 2 and 11, however, have high elongation indices similar to the MI–IS fabrics (Fig. 15a). The overall mean dip of clasts in the till is 19. Paired clast fabrics at sites 1 and 14 show slightly stronger preferred orientations in till than in underlying MI–IS (Table 5). Mean dips are similar in each pair. The mean lineation vectors are similar in the site 14 pair but different in the site 1 pair (Table 5). 4.6. Stable isotopes in ground ice Oxygen isotope values from ground ice within MI–IS, till and glaciolacustrine silt and clay are summarised in Table 6 and illustrated in Fig. 16. MI–IS have δ18O values ranging from -25.6 to -35.7‰, with an overall mean of -29.6‰, similar to other studies of massive ice in the Tuktoyaktuk Coastlands (e.g. Mackay, 1983) Co-isotope values of the MI–IS have regression lines with highly variable slopes (Table 6; Fig. 16a). Those slopes with correlation coefficients significant at the 5% level vary from 5.4 to 8.9.
Table 6: Stable isotope values of ground ice in MI–IS and overlying sediments
Location Stratigraphy (lowest unit at base)
Number of analyses
Average Std dev.
Slope of δ18O vs. δD
Correlation coefficient (r)
Site 1, `Wayne Island'
Reticulate ice in glaciolacustrine silt and clay
3 −32.1 0.6 7.6 0.95
Till N/A
Upper unit of massive ice 10 −32.6 2.7 7.0 0.98a
Lower unit of icy sediments 5 −28.1 0.3 7.7 0.79
Site 5, Eskimo Lakes
Reticulate ice in glaciolacustrine silt and clay
5 −29.5 1.5 10.3 0.99a
Till N/A

Location Stratigraphy (lowest unit at base)
Number of analyses
Average Std dev.
Slope of δ18O vs. δD
Correlation coefficient (r)
MI–IS 5 −32.2 1.4 7.2 0.96b
Site 8, Eskimo Lakes
Ice-rich diamicton (glacitectonite) N/A
Upper unit of massive ice 12 −28.8 1.0 8.0 0.95a
Lower unit of icy sediments 3 −29.0 0.4 9.8 0.83
Site 9, Eskimo Lakes
Peaty silty clay diamicton (colluvium)
MI–IS 4 −28.9 0.4 5.7 0.92
Site 12, Eskimo Lakesc
Ice-rich diamicton (glacitectonite) 3 −31.0 0.3
MI–IS 2 −29.6 0.4
Site 14, Eskimo Lakes
Silty sand (glaciofluvial Portage Point Sands)
N/A
Segregated ice in till 2 −30.1 0.0
MI–IS 3 −28.1 0.6 9.3 0.88
Mason Bay Aeolian sand N/A
Till N/A
MI–IS 6 −28.4 0.3 8.9 0.87b
Crumbling Point Aeolian sand N/A
Segregated ice in till 13 −23.6 1.7
MI–IS 15 −29.2 1.6 5.4d 0.90a
Overall means: Reticulate ice in glaciolacustrine silt and clay
8 −30.5 1.8
Segregated ice in till 15 −24.5 2.7
MI–IS 65 −29.6 2.1
a Significant at 1% level. b Significant at 5% level. c Stratigraphy at site 12 is described and interpreted by Murton et al. (in press). d Co-isotope data available for 9 samples.

Fig. 16. Stable isotope values for MI–IS. (a) Comparison of δD vs. δ18O values of MI–IS from this study with Laurentide ice from the Barnes Ice Cap, Baffin Island, Canada. (b-c) Vertical δ18O profiles in ground ice from MI–IS and overlying sediments at Crumbling Point and sites 1 and 5 in the Eskimo Lakes.

The till contains segregated ice with δ18O values between -19.9 and -30.1‰. These values fall into two distinct groups. The first group, which occurs where the till underlies aeolian sand at Crumbling Point, has a mean δ18O value of -23.6‰ and is distinctly heavier than the underlying MI–IS (mean δ18O=-29.2‰). The contact between the MI–IS and the till in some places coincides with an isotopic discontinuity (Fig. 16b: profiles 1 and 2) and in other places shows a continuous isotopic trend across it (Fig. 16b: profile 3). The δ18O values in the till become progressively heavier towards the ground surface. The second group of δ18O values in the till, which occurs where the till underlies glaciolacustrine silt and clay at site 14 in the Eskimo Lakes, has a mean δ18O value of -30.1‰ and is isotopically slightly than the underlying MI–IS (mean δ18O=-28.1‰; Table 6).
Glaciolacustrine silt and clay above the till at sites 1 and 5 in the Eskimo Lakes contains reticulate ice with δ18O values ranging from -27.7 to -32.5‰, with an overall mean of -30.5‰ (Table 6). The slope of the co-isotope regression line for reticulate ice above till at site 5 is 10.3, with a correlation coefficient significant at the 1% level (Table 6; Fig. 16a).
5. Interpretation
5.1. Melt-out till Several lines of evidence indicate that the Toker Point till above MI–IS in the study area formed by melt-out at the ice surface, and therefore is a supraglacial melt-out till. First, the till overlies an angular unconformity formed by thaw or erosion (Murton and French, 1993 and Murton and French, 1994), as discussed below. Second, the till is present above MI–IS containing dispersed diamicton, but it is absent above massive ice that is debris-free.
Third, the till has a similar texture (Fig. 5), colour and garnet-to-ilmenite ratio to diamicton within the underlying MI–IS (Table 4), suggesting that diamicton in both stratigraphic units shares a common source. The smaller amounts of pyrite or siderite in the central and upper parts of the till are attributed to chemical weathering during thaw. Pyrite oxidation accounts for (i) the tarnished pyrite, (ii) the smaller variation in pyrite crystal forms and the paucity of delicate forms, (iii) the abundance of goethite covering pyrite (alteration rims), and (iv) the pseudomorphs of goethite after pyrite. The goethite formed by alteration of pyrite, similar to the alteration reported in weathered till in Finland (Peuraniemi, 1984). The higher percentages of leucoxene, a titanium-rich alteration product, and its occurrence as a coating on sphene and ilmenite suggest weathering of these titanium-bearing minerals (Gribble, 1988). Enrichment of leucoxene and goethite, and depletion of pyrite have also been observed in oxidized, unfrozen till in Québec (Shilts and Kettles, 1990). The mineralogical similarity between the basal 20 cm of till and diamicton in the MI–IS is attributed to little if any mineral alteration beneath the weathering zone. Former reducing conditions near the saturated base of the previously deeper active layer during till melt-out would permit good preservation of pyrite in seasonally unfrozen, saturated sediment, as observed by Peuraniemi (1984) in till beneath the groundwater table in Finland.
Fourth, the weaker preferred orientations (lower elongation indices) of clasts from the till compared to the MI–IS (Fig. 15a) are consistent with thaw-related disturbance as till melts out from debris-rich ice (Lawson, 1979b, Fitzsimons, 1990 and Ham and Mickelson, 1994). For the two paired fabrics, however, the slightly stronger preferred orientations in the till may reflect melt-out from a layer of ice with a weaker fabric than the MI–IS currently exposed in the sections given the variable fabric strength of the MI–IS (Table 5). Another apparent inconsistency is the slightly steeper mean dip of clasts in the till compared to clasts in the MI–IS, given that one might expect dips to diminish because of settling during melt-out (Lawson, 1979b). But the steeper dips in the till may reflect the rotation of elongate clasts towards vertical during frost heave (Washburn, 1979, pp. 88–89), when the till later re-froze.
Finally, segregated ice within the till at Crumbling Point is isotopically heavier than the underlying MI–IS (Table 6; Fig. 16b) because, with little doubt, it incorporates isotopically heavier surface water formed during the warm postglacial period (Mackay and Dallimore, 1992). As the active layer deepened subaerially during the LGIT and till melted out from the underlying ice, surface water derived from Holocene precipitation mixed with 18O-depleted Wisconsinan meltwater from the MI–IS (Murton and French, 1994 and Lacelle et al., 2004). Lacelle et al. (2004) estimate that the δ18O value of Early Holocene precipitation in this region was as high as c. -21‰. By contrast, the δ18O values from segregated ice in till at site 14 in the Eskimo Lakes and from reticulate ice in overlying glaciolacustrine clayey silt at sites 1 and 5 are similar to the values from the MI–IS (Table 6; Fig. 16c) because, in all probability, their water source was dominated by meltwater from the LIS ponding within an ice-marginal lake or flowing across an outwash plain (Portage Point Sands). At these sites, till melted out beneath the lake bottom or outwash plain and was buried by glaciolacustrine or glaciofluvial deposits, prior to refreezing with an isotopic enrichment of up to 3‰ (Fig. 16c).
5.2. Massive ice-icy sediments Two interpretations of the MI–IS are considered, basal glacier ice and intrasedimental ice. We discount buried lake, river, sea, snowbank and icing ice because they explain neither the great thickness and widespread occurrence of the MI–IS (cf. Moorman and Michel, 2000), nor the till and pre-glacial Quaternary deposits within them. We also discount a firn-derived origin for the icy sediments because firn-derived glacier ice

typically contains very low concentrations of debris and is bubble-foliated at a decimetre scale (Knight and Hubbard, 1999). Only at site 15a (Fig. 2b) was such ice observed, in the form of horizontally stratified bubble-free and bubble-rich PI (Fig. 4b). The site is within c. 1 km of French and Harry's (1990) site, where they interpret debris-rich massive ice as buried glacier ice. The massive ice they describe is similar to that in the lower half of Fig. 4b and to that we have observed at sites 15b and 15c (Fig. 2b) and interpret as basal ice. 5.2.1. Basal ice Evidence supporting an interpretation of the MI–IS as basal ice comprises (1) ice facies and facies groupings, (2) ice petrography and (3) a thaw or erosional upper contact of the MI–IS that is overlain by glacigenic sediments.
First, many of the ice facies and facies groupings in the MI–IS resemble those reported from the basal ice layers of contemporary glaciers and ice sheets. The characteristics of these basal ice facies, their interpretations and suggested correlation with the Pleistocene MI–IS facies observed in the present study are summarised in Table 7, and they are compared visually in Figs. 4, 17 and 18.
Table 7: Comparison of contemporary basal ice facies and Pleistocene MI–IS facies
Basal ice faciesa
Physical characteristics
Ice Sediment Interpretations
Equivalent MI–IS facies
Basal dispersed
Homogeneous appearance; intermediate bubble content relative to englacial and basal stratified ice; ice crystals 10–40 mm diameter
Debris content <1–10% by volume; occurs as highly dispersed sediment `clots'; well-sorted sediment dominated by silt-sized material
• Closed-system regelation in interior region of ice masses (Sugden et al., 1987)
• Deposition of fine-grained sediment at triple junctions due to intercrystalline water flow (Knight, 1997)
• Attenuation of stratified facies basal ice by tectonic deformation (Hart, 1995)
API with very low volumetric sediment contents
Basal stratified discontinuous
Stratification, often showing internal deformation; bubble-poor; irregular, sharp upper contact; sub-facies interlayered; ice crystals diameter
Debris content c. 10–20% by volume occurs as distinct laminae orientated sub-parallel to the general stratification; produces alternating layers of debris-rich and debris-poor ice
• Small-scale regelation around rigid obstacles (e.g. Sharp et al., 1994)
• Attenuated from blocks of solid sub-facies ice by tectonic deformation (Waller et al., 2000)
• Ice accretion associated with the glaciohydraulic supercooling of subglacial drainage (Lawson et al., 1998)
Layered SPI and SRI
Basal stratified suspended
Debris content c. 0.4–20% by volume; occurs as suspended particles and aggregates without orientation
• Basal adfreezing of water in debris-poor regions of the glacier bed (Sharp et al., 1994)
• Attenuated from blocks of cohesive solid sub-facies ice by tectonic deformation (Waller et al.,
Layered API of variable sediment content

Basal ice faciesa
Physical characteristics
Ice Sediment Interpretations
Equivalent MI–IS facies
2000)
• Ice accretion associated with the glaciohydraulic supercooling of subglacial drainage (Lawson et al., 1998)
Basal stratified solid
Occurs as interstitial ice and occasional segregated ice lenses
Debris content >30% by volume; sediment character depends on nature of the substrate
• Accreted en masse to the glacier sole by basal adfreezing where the bed is composed of unconsolidated sediment (Sharp et al., 1994 and Waller et al., 2000)
IRDF, ARI and IRS
• Ice accretion associated with the glaciohydraulic supercooling of subglacial drainage (Lawson et al., 1998)
a Classification devised by Lawson (1979a) and recommended by Knight (1994).

Fig. 17. Contemporary basal ice facies from the Russell Glacier, southwest Greenland (a, b and d) and Eystri Hagafellsjökull, Iceland (c). (a) Basal stratified solid sub-facies ice; ice-axe for scale. (b) Basal stratified discontinuous sub-facies ice. (c) Basal stratified suspended sub-facies ice showing sediment aggregates and pebbles suspended in ice. Image is c. 10 cm wide. (d) Basal dispersed facies ice. Image is c. 15 cm wide.
Fig. 18. Comparison of basal ice (stratified solid and discontinuous sub-facies ice) at the Russell Glacier, southwest Greenland (a) with folded massive ice comprising API with subsidiary PI (Fig. 4a, c) at Mason Bay (b). Ice-axe for scale in (a), person in (b).
Basal stratified solid sub-facies ice (Lawson, 1979a and Knight and Hubbard, 1999, table 9.6), which is common in the basal ice layers of sub-polar ice margins (Fig. 17a; Waller et al., 2000), resembles the IRDF, ARI and IRSG facies of MI–IS. In all four facies, much of the ice is interstitial, although occasional lenses of segregated ice can occur in IRDF, and ice within ARI completely surrounds muddy aggregates in a similar manner, but on a larger scale, to basal ice cement, where ice forms the main mass of the frozen ground and divides the grains (Yershov, 1998, p. 270). Stratified solid sub-facies ice is primarily attributed to bulk entrainment of unconsolidated sediment (Table 7) and often dominates the basal ice layer where cold-based ice overrides permafrost (e.g. Waller et al., 2000). Although most reports of this facies infer entrainment of diamicton, sorted sediment such as IRSG can also be entrained (e.g. Harris and Bothamley, 1984). Inclined bands of IRDF within mainly PI and API at site 13 (Fig. 4e) resemble the `banded' family of the Russell Glacier, southwest Greenland (Knight et al., 1994). Intercalated bands of
debris-rich and debris-poor ice here results from folding and thrusting of stratified facies ice into overlying dispersed facies ice due to longitudinal compression (Knight, 1989).
Basal stratified discontinuous sub-facies ice (Fig. 17b) has a similar millimetre-scale lamination to that often found with SPI and SRI in the present study. This sub-facies is often exposed within the basal ice layers of alpine valley glaciers and sub-polar ice-sheet margins (Hubbard and Sharp, 1995 and Waller et al., 2000). In addition, icy sediments containing pods and lenses of IRSG (Fig. 7a) resemble stratified facies ice sequences in southwest Greenland, which frequently have intercalated units of solid and discontinuous sub-facies ice (Waller et al., 2000).
Basal stratified suspended sub-facies ice (Fig. 17c) resembles layered sequences of API with variable sediment content. Both facies comprise sediment aggregates and rock clasts suspended in ice. Basal stratified facies ice is broadly attributed to glacier-bed interaction and associated processes of ice accretion and sediment entrainment (Table 7; Hubbard and Sharp, 1989, Knight, 1997 and Lawson et al., 1998). Observations of similar aggregates suspended in lenses of segregated ice in the Tuktoyaktuk Coastlands (Murton and French, 1994) indicate that `suspension' of the aggregates can result from ice segregation.
The basal dispersed facies ice (`clotted ice' of Sugden et al., 1987) (Fig. 17d) resembles the API facies with very low volumetric sediment contents. Both facies are characterised by (1) sediment aggregates with a suspended cryostructure and (2) a paucity of gas inclusions relative to firnified glacier ice. The formation of basal dispersed facies ice is poorly understood, although small-scale, closed-system regelation in the interior of an ice sheet remains the foremost hypothesis (Sugden et al., 1987).
In summary, much of the deformed MI–IS in the present study resembles the basal stratified facies ice and structurally-related banded sequences of contemporary ice margins in general, and southwest Greenland in particular (Knight, 1997 and Waller et al., 2000). A small part of the massive ice, usually stratigraphically high in the MI–IS sequence, resembles dispersed facies ice, which also occurs high within basal ice sequences (Hubbard and Sharp, 1989 and Knight et al., 1994).
Second, the MI–IS shows petrographic similarities with basal ice. Petrographically, most of the MI–IS is characterized by small anhedral crystals and fabrics ranging from steeply dipping with weak near-vertical maxima (Mason Bay and `Wayne Island') to a horizontal girdle (Crumbling Point; Fig. 14). The ice layering is similar in all cases but varies in thickness and sediment content; ice layers tend to contain thin discontinuous sediment laminae and grade into enclosing icy sediment. This pattern is consistent with in situ freezing. But the MI–IS appear quite different from thick, very pure massive-ice bodies on Herschel Island and along the Yukon Coastal Plain (Pollard and Dallimore, 1988 and Pollard, 1990). The MI–IS are much dirtier than basal ice near the Hamna icefall, East Antarctica (Iizuka and Watanabe, 2002), but they do have similar ice fabrics. The MI–IS resemble in both appearance and fabric ice from ice-cored moraines on Axel Heiberg Island, Canada (Pollard, unpublished data).
Third, the top of the MI–IS is marked by a thaw or erosional contact that is overlain by glacigenic or aeolian sediments. Thaw or erosion of ice is inevitable during burial of basal ice because most of the glacier ablates away. The ice may be buried by supraglacial melt-out till (Figs. 6a–7, Fig. 9, Fig. 10 and Fig. 11), aeolian sand (Murton et al., 1997, Fig. 3e), flow till, glaciofluvial (Fig. 6a) or glaciolacustrine sediments. Conversely, intrasedimental massive ice typically has gradational freezing contacts (Mackay, 1989), unless later subject to partial thaw. We discount thaw by Early Holocene active-layer deepening at `Wayne Island' because the top of the MI–IS is stratigraphically below the thaw unconformity that truncates the lower horizon of ice wedges (Figs. 6a and 7) and probably correlates with the regional unconformity of Early Holocene age (Burn, 1997). Instead, we infer subaerial or subaqueous exposure of the MI–IS where glaciofluvial or aeolian sand unconformably overlies MI–IS in the Eskimo Lakes Fingerlands and at Crumbling Point (Murton et al., 1997, figs. 3e–f). We conclude that meltwater erosion, probably during deglaciation, exposed the MI–IS and reworked the overlying melt-out till, leaving a pebbly sand, gravel or clast lag above the remaining till (Fig. 8) or directly above the massive ice (Fig. 6a). At Crumbling Point, wind locally buried the ice beneath aeolian sand (Murton et al., 1997).
Other lines of evidence are consistent with a basal-ice origin, but do not preclude intrasedimental ice that formed in front of the LIS and was later glacially deformed. First, the folds, sediment pods and lenses within the MI–IS resemble those reported from contemporary basal ice in Antarctica (Shaw, 1977, fig. 1); Bylot Island, Canada (Klassen, 1993); Ellesmere Island, Canada (Lorrain et al., 1981); Worthington Glacier, Alaska (Hart and Waller, 1999); and western Greenland (Knight, 1995, fig. 1, 1997, figs. 5 and 6). But tight, often isoclinal recumbent folds attributed to glacial overriding have also been reported in icy sediments containing Pleistocene sand at an ice cellar in Tuktoyaktuk (Rampton and Mackay, 1971, fig. 6), and clay pods similar to augen structures in basal ice occur in massive ice of inferred segregated origin to the southeast of Tuktoyaktuk (Mackay, 1989, fig. 6).
Second, the clast fabrics from MI–IS generally have a strong preferred orientation, with low isotropy and high elongation indices similar to those from basal ice (Table 8). The MI–IS fabrics do not group so strongly around the `cluster' apex of Fig. 15a as do the basal-ice clast fabrics

reported by Lawson (1979b) and those by Ham and Mickelson (1994) (Fig. 15b), but the ice in these Alaskan studies is in more confined locations than that in the Tuktoyaktuk Coastlands and so could be expected to display stronger grouping. Indeed the range of basal-ice clast fabrics reviewed by Bennett et al. (1999) is greater than the Alaskan examples and encompasses the fabrics from the MI–IS (Table 8). Unfortunately we are not aware of any clast fabrics measured from bona fide intrasedimental ice with which to compare the MI–IS fabrics.
Table 8: Summary fabric data for MI–IS, contemporary basal ice and melt-out till
Fabric source
Author Number of fabrics
Mean isotropy
Maximum isotropy
Minimum isotropy
Mean elongation
Maximum elongation
Minimum elongation
MI–IS This study 19 0.082 0.212 0.017 0.772 0.928 0.439
Basal ice Lawson (1979b)
38 0.047 0.133 0.002 0.903 0.99 0.761
Ham and Mickelson (1994)
9 0.038 0.103 0 0.795 0.941 0.623
Bennett et al. (1999)
24 0.097 0.24 0.016 0.597 0.836 0.169
Melt-out till
This study 13 0.162 0.262 0.058 0.537 0.851 0.269
Lawson (1979b)
8 0.037 0.074 0.013 0.82 0.908 0.687
Ham and Mickelson (1994)
27 0.161 0.39 0.046 0.652 0.835 0.227
Bennett et al. (1999)
3 0.209 0.379 0.073 0.428 0.534 0.336
Finally, the light oxygen isotope ratios from the MI–IS are similar to the average of -33‰ measured for Laurentide ice at the base of the Barnes Ice Cap, Baffin Island, Canada (Fig. 16a; Zdanowicz et al., 2002). In addition, the statistically significant regression-line slopes from MI–IS at site 1 (S=7.0), site 5 (S=7.2) and Crumbling Point (S=5.4; Table 6) plot below the global meteoric water line (S=c. 8.0) and so are consistent with an origin as regelation ice at the base of a glacier. A slope of c. 7.5 has been obtained from buried glacier ice on Victoria Island (Lorrain and Demeur, 1985) and slopes of 4.4–6.5 from contemporary basal glacier ice on Bylot Island and Greenland (summarised in Lacelle et al., 2004, table 4). However, slopes of <8 and oxygen isotope values of c. -30‰ do not exclude an interpretation as intrasedimental massive ice formed by freezing of groundwater from a very cold water source such as Laurentide glacial meltwater. Indeed, slopes of 6.4 and 6.8 have been obtained from intrasedimental massive ice at Peninsula Point and in the Richardson Mountains, respectively (Fig. 1; Mackay and Dallimore, 1992 and Lacelle et al., 2004). Tentatively, we attribute the large variation of the slopes of the statistically significant co-isotope regression lines in the MI–IS (5.4–8.9; Table 6) to a series of samples that has been glaciotectonically mixed, with no sense to the pattern. If the MI–IS are folded and tectonically stratified, then their isotopic values can be expected to be highly variable.
5.2.2. Intrasedimental ice Certain features of the glacially-deformed MI–IS indicate that some of the ice formed intrasedimentally. Pore and segregated ice within MI–IS clearly formed in pre-existing sediment. Interstitial ice and ice lenses occur within (a) glaciofluvial sand that pre-dates glacial overriding and is incorporated in the icy sediments on `Wayne Island' (Table 2) and (b) pre-glacial Kidluit or Kittigazuit Formation sand incorporated in icy sediments at Crumbling Point (Table 3). Further evidence for ice segregation comprises (i) ice crusts around rock clasts, and (ii) tubular bubbles orthogonal to bands within MI–IS (Mackay, 1971).

Pore and segregated ice also occur in basal stratified solid sub-facies ice. Crusts of clear ice (c. 3–50 mm thick) surrounding pebbles and boulders have been observed by RIW within a debris-band of IRDF in basal ice at Skeiðarárjökull, Iceland; the ice crusts probably formed by localised ice segregation around frost-susceptible clasts (cf. Mackay, 1984). Jansson et al. (1996) compared streamlined ice crusts (`clear-ice augens') around large clasts within the basal ice layer at Engabreen, Norway, with phenocrysts in sheared rocks, as they appear to represent pressure shadows with orientations consistent with the flow direction and the sense of basal shear.
Despite the evidence for intrasedimental ice, the glacially-deformed MI–IS differ significantly from massive intrasedimental ice at the `type locality', Peninsula Point, near Tuktoyaktuk (Fig. 1; Mackay, 1971, Mackay and Dallimore, 1992 and Moorman et al., 1998). The latter comprises alternating layers of ice, stratified icy sand and icy clay, and contains scattered boulders just below the upper ice-diamicton contact; most of the sediment in the ice is disseminated within individual crystals or occurs as distinct clumps of sand (Mackay and Dallimore, 1992). Our own observations of the massive ice at Peninsula Point in 1989, 1990, 1991 and 1999 identified PI (bubble-free to bubble-rich), API and laminae of icy clay and icy sand. The dominant facies exposed was bubble-rich PI. The main differences between the massive ice at Peninsula Point and the MI–IS described in this paper are that the former (1) is much more bubble-rich, (2) contains much less sediment (particularly diamicton), (3) lacks pebble- to boulder-size clasts dispersed throughout the massive ice, (4) shows no evidence of glacial deformation, and (5) has a gradational upper contact. There are no clear similarities between the Peninsula Point massive ice and contemporary basal or firnified glacier ice.
Finally, the occurrence of pre-glacial sand beneath the MI–IS in the study area may have facilitated lateral and vertical movements of water towards freezing fronts (cf. Mackay, 1971). But it does not help to discriminate the origin of the MI–IS, because sand may underlie both non-glacial intrasedimental massive ice (e.g. Mackay and Dallimore, 1992) and melt-out till derived from stagnant basal ice (e.g. Shaw, 1982, figs. 2 and 10).
6. Discussion
6.1. Basal ice layer The widespread MI–IS in the study area show, in the same stratigraphic sequences, features common to both basal and intrasedimental ice, but differ significantly from the massive intrasedimental ice at Peninsula Point. Any explanation of these facts must therefore accommodate both ice types and apply to a regional scale.
We interpret the glacially-deformed MI–IS as remnants of the basal ice layer of the LIS. This interpretation resolves the apparent paradox of co-existing basal and intrasedimental ice, because pore ice and segregated ice can form subglacially by freezing of water onto the base of a glacier. Such ice forms intrasedimentally (e.g. within pre-existing Pleistocene sand) but constitutes part of the basal ice layer. Alternatively, pore and segregated ice could have formed subaerially, prior to glacial overriding and incorporation within the basal ice layer. By analogy with basal ice at the margin of contemporary, sub-polar ice sheets such as western Greenland, the northwest margin of the LIS probably had a thick basal ice layer formed by accretion of both new and existing ice. New ice includes that formed by regelation and congelation, and existing ice includes proglacial ground ice and snow, and subglacial cavity-floor ice (Knight, 1997). In addition, sub-aerially permafrozen sediments can be mobilised when overridden by cold-based ice and incorporated within a basal ice layer (Kaplanskaya and Tarnogradskiy, 1986; Astakhov et al., 1996).
We suggest that a variety of mechanisms formed basal ice at different times and at different places beneath the northwest margin of the LIS. By analogy with contemporary basal ice, these mechanisms probably included (1) large-scale freeze-on of meltwater and sediment at the transition from warm- to cold-based ice (Boulton, 1972); (2) permafrost aggradation beneath thinning, stagnant basal ice (Rampton, 1991); and (3) pore-water expulsion in ice-free areas prior to glacial overriding (Mackay, 1971 and Mackay and Dallimore, 1992).
6.2. Preservation of supraglacial melt-out till Supraglacial melt-out till of the LIS is widespread in the study area, forming a distinctive stratigraphic unit above buried basal ice. We attribute this long-term preservation to (1) the low profile of the northwest LIS (Beget, 1987), (2) the relatively flat terrain of the Tuktoyaktuk Coastlands and (3) stabilisation of till by subsequent permafrost aggradation. Till preservation suggests that Paul and Eyles' (1990) conclusion that supraglacial melt-out till has a very low preservation potential (due to low hydraulic and shear instability) is sometimes unduly pessimistic.
7. Conclusions
1. Complex sequences of glacially-deformed massive ice and icy sediments in the study area can be described systematically in terms of cryofacies (Table 1). This description facilitates comparison with other ice-rich sequences in permafrost and glacial environments and so assists with interpreting the origin of the ice.

2. A basal-ice origin for the MI–IS in this study is indicated by (a) ice facies and facies groupings similar to those from the basal ice layers of contemporary glaciers and ice sheets in Alaska, Greenland and Iceland (Table 7); (b) ice crystal fabrics similar to those from basal ice in Antarctica and from ice-cored moraines on Axel Heiberg Island, Canada; and (c) a thaw or erosional unconformity along the top of the MI–IS, buried by glacigenic or aeolian sediments.
3. An intrasedimental origin for some ice within the MI–IS is indicated by pore and segregated ice within Pleistocene sands deposited prior to glacial overriding.
4. The co-existence of basal and intrasedimental ice within the MI–IS results from their occurrence within the basal ice layer at the northwest margin of the Laurentide Ice Sheet.
5. The basal ice layer formed by accretion of new and existing ice. The formative mechanisms probably included (a) large-scale freeze-on of meltwater and sediment at the transition from warm- to cold-based ice; (b) permafrost aggradation beneath thinning, stagnant basal ice; and (c) pore-water expulsion in ice-free areas prior to glacial overriding.
6. Stagnation of the LIS in the study area was accompanied by melt-out of glacigenic debris from the higher portions of the basal ice layer, resulting in the widespread formation of supraglacial melt-out till and burial of basal ice. Some till formed subaerially (Figs. 9 and 10) and some formed beneath an ice-marginal lake (Figs. 6 and 7) or outwash plain. Meltwater activity interrupted these processes, reworking some of the till to leave a lag or gravelly deposit (Fig. 8). Locally the basal ice was buried by aeolian sand.
7. The widespread occurrence of supraglacial melt-out till from the LIS suggests that such till can be well preserved in stratigraphic sequences where a continental ice sheet stagnates in lowlands underlain by continuous permafrost.
Acknowledgements
The Natural Sciences and Engineering Research Council of Canada and the Geological Survey of Canada (GSC) supported JBM's fieldwork between 1989 and 1993 by grants to Professor H.M. French. The Leverhulme Trust and the Tyrell Fund of the Geological Society supported the project between 1998 and 2000. CW is grateful to the University of Brighton Research Support Fund, and RIW's participation was supported by the University of Greenwich. The Polar Continental Shelf Project, Natural Resources Canada; the GSC; and the Inuvik Research Centre, Aurora College, provided logistical support. F. Wolki, B.P. Lowe and A.D. Green assisted with fieldwork. Consorminex Inc. separated and counted the heavy minerals. Tim Cane and Matt Telfer prepared and carried out the particle-size analyses. S. Rowland and H. Lintott assisted with the cartography. Professors J. van der Meer and J. Rose provided constructive comments on the paper.
References
Astakhov and Isayeva, 1988 V.I. Astakhov and L.L. Isayeva, The “Ice Hill”; an example of “retarded deglaciation” in Siberia, Quaternary Science Reviews 7 (1988), pp. 29–40.
Astakhov et al., 1996 V.I. Astakhov, F.A. Kaplyanskaya and V.D. Tarnogradsky, Pleistocene permafrost of West Siberia as a deformable glacier bed, Permafrost and Periglacial Processes 7 (1996), pp. 165–191.
Beget, 1987 J. Beget, Low profile of the northwest Laurentide Ice Sheet, Arctic and Alpine Research 19 (1987), pp. 81–88.
Benn, 1994 D.I. Benn, Fabric shape and the interpretation of sedimentary fabric data, Journal of Sedimentary Research A64 (1994), pp. 910–915.
Bennett et al., 1999 M.R. Bennett, R.I. Waller, N.F. Glasser, M.J. Hambrey and D. Huddart, Glacigenic clast fabrics genetic fingerprint or wishful thinking?, Journal of Quaternary Science 14 (1999), pp. 125–136.
Boulton, 1972 G.S. Boulton, The role of thermal regime in glacial sedimentation. In: R.J. Price and D.E. Sugden, Editors, Polar Geomorphology. Institute of British Geographers, Special Publication 4 (1972), pp. 1–19.

Burn, 1997 C.R. Burn, Cryostratigraphy, paleogeography, and climate change during the early Holocene warm interval, western Arctic coast, Canada, Canadian Journal of Earth Sciences 34 (1997), pp. 912–935.
Dallimore and Wolfe, 1988 S.A. Dallimore and S.A. Wolfe, Massive ground ice associated with glaciofluvial sediments, Richards Islands, N.W.T., Canada, Permafrost, Fifth International Conference, Proceedings vol. 1, Tapir, Trondheim (1988), pp. 132–137.
Dallimore et al., 1997 S.R. Dallimore, S.A. Wolfe, J.V. Matthews Jr. and J.-S. Vincent, Mid-Wisconsinan eolian deposits of the Kittigazuit Formation, Tuktoyaktuk Coastlands, Northwest Territories, Canada, Canadian Journal of Earth Sciences 34 (1997), pp. 1421–1441.
Dredge et al., 1999 L.A. Dredge, D.E. Kerr and S.A. Wolfe, Surficial materials and related ground ice conditions Slave Province, N.W.T., Canada, Canadian Journal of Earth Sciences 36 (1999), pp. 1227–1238.
Dyke and Savelle, 2000 A.S. Dyke and J.M. Savelle, Major end moraines of Younger Dryas age on Wollaston Peninsula, Victoria Island, Canadian Arctic implications for paleoclimate and for formation of hummocky moraine, Canadian Journal of Earth Sciences 37 (2000), pp. 601–619.
Dyke et al., 2002 A.S. Dyke, J.T. Andrews, P.U. Clark, J.H. England, G.H. Miller, J. Shaw and J.J. Veillette, The Laurentide and Innuitian ice sheets during the Last Glacial Maximum, Quaternary Science Reviews 21 (2002), pp. 9–31.
Fitzsimons, 1990 S.J. Fitzsimons, Ice-marginal depositional processes in a polar maritime environment, Vestfold Hills, Antarctica, Journal of Glaciology 36 (1990), pp. 279–286.
French and Harry, 1988 H.M. French and D.G. Harry, Nature and origin of ground ice, Sandhills Moraine, southwest Banks Island, Western Canadian Arctic, Journal of Quaternary Science 3 (1988), pp. 19–30.
French and Harry, 1990 H.M. French and D.G. Harry, Observations on buried glacier ice and massive segregated ice, western Arctic coast, Canada, Permafrost and Periglacial Processes 1 (1990), pp. 31–43.
Gell, 1978 W.A. Gell, Ice-wedge ice, Mackenzie Delta-Tuktoyaktuk Peninsula area, N.W.T., Canada, Journal of Glaciology 20 (1978), pp. 555–569.
Gribble, 1988 C.D. Gribble, Rutley's Elements of Mineralogy (27th ed), Unwin Hyman, London (1988).
Ham and Mickelson, 1994 N.R. Ham and D.M. Mickelson, Basal till fabric and deposition at Burroughs Glacier, Glacier Bay, Alaska, Geological Society of America Bulletin 106 (1994), pp. 1552–1559.
Harris and Bothamley, 1984 C. Harris and K. Bothamley, Englacial deltaic sediments as evidence for basal freezing and marginal shearing, Leirbreen, southern Norway, Journal of Glaciology 30 (1984), pp. 30–34.
Harris et al., 1988 Harris, S.A., French, H.M., Heginbottom, J.A., Johnston, G.H., Ladanyi, B., Sego, D.A., van Everdingen, R.O., 1988. Glossary of permafrost and related ground-ice terms. Permafrost Subcommittee Associate Committee on Geotechnical Research, National Research Council of Canada, Ottawa, Technical Memorandum, 142, 156pp.
Hart, 1995 J.K. Hart, An investigation of the deforming layer/debris-rich basal ice continuum, illustrated from three Alaskan Glaciers, Journal of Glaciology 41 (1995), pp. 619–633.
Hart and Waller, 1999 J.K. Hart and R.I. Waller, An investigation of debris-rich basal ice from Worthington Glacier, Alaska, Journal of Glaciology 45 (1999), pp. 54–62.
Hubbard and Sharp, 1989 B. Hubbard and M.J. Sharp, Basal ice formation and deformation a review, Progress in Physical Geography 13 (1989), pp. 529–558.
Hubbard and Sharp, 1995 B. Hubbard and M.J. Sharp, Basal ice facies and their formation in the western Alps, Arctic and Alpine Research 4 (1995), pp. 301–310.
Iizuka and Watanabe, 2002 Y. Iizuka and O. Watanabe, Crystal fabrics of basal ice near Hamna Icefall, East Antarctica, Bulletin of Glaciological Research 19 (2002), pp. 59–63.
Jansson et al., 1996 P. Jansson, J. Kohler and V.A. Pohjola, Characteristics of basal ice at Engabreen, northern Norway, Annals of Glaciology 22 (1996), pp. 114–120.
Kaplyanskaya and Tarnogradskiy, 1986 F.A. Kaplyanskaya and V.D. Tarnogradskiy, Remnants of the Pleistocene ice sheets in the permafrost zone as an object for paleoglaciological research, Polar Geography and Geology 10 (1986), pp. 257–266.
Klassen, 1993 Klassen, R.A. 1993. Quaternary geology and glacial history of Bylot Island, Northwest Territories. Geological Survey of Canada, Memoir 429, 93pp.
Knight, 1989 P.G. Knight, Stacking of basal debris layers without bulk freezing-on isotopic evidence from West Greenland, Journal of Glaciology 35 (1989), pp. 214–216.
Knight, 1994 P.G. Knight, Two-facies interpretation of the basal layer of the Greenland ice sheet contributes to a unified model of basal ice formation, Geology 22 (1994), pp. 971–974.
Knight, 1995 P.G. Knight, Debris structures in basal ice exposed at the margin of the Greenland ice sheet, Boreas 24 (1995), pp. 11–12.
Knight, 1997 P.G. Knight, The basal ice layer of glaciers and ice sheets, Quaternary Science Reviews 16 (1997), pp. 975–993.
Knight and Hubbard, 1999 P.G. Knight and B.P. Hubbard, Ice facies a case study from the basal ice facies of the Russell Glacier, Greenland Ice Sheet. In: A.P. Jones, M.E. Tucker and J.K. Hart, Editors, The Description and Analysis of Quaternary Stratigraphic Field Sections Technical Guide 7, Quaternary Research Association, London (1999), pp. 235–266.
Knight et al., 1994 P.G. Knight, D.E. Sugden and C.D. Minty, Ice flow around large obstacles as indicated by basal ice exposed at the margin of the Greenland ice sheet, Journal of Glaciology 40 (1994), pp. 359–367.
Lacelle et al., 2004 D. Lacelle, J. Bjornson, B. Lauriol, I.D. Clark and Y. Troutet, Segregated-intrusive ice of subglacial meltwater origin in retrogressive thaw flow headwalls, Richardson Mountains, NWT, Canada, Quaternary Science Reviews 23 (2004), pp. 681–696.
Langway, 1958 Langway, C.C., 1958. Ice fabrics and the universal stage. U.S. Army Snow and Ice Research Establishment, Technical Report 62, 15pp.
Lawson, 1979a Lawson, D.E., 1979a. Sedimentological analysis of the western terminus region of the Matanuska Glacier, Alaska. CRREL Report 72-9, 122pp.
Lawson, 1979b D.E. Lawson, A comparison of the pebble orientations in ice and deposits of the Matanuska Glacier, Alaska, Journal of Geology 87 (1979), pp. 629–645.
Lawson et al., 1998 D.E. Lawson, J.C. Strasser, E.B. Evenson, R.B. Alley, G.J. Larson and S.A. Arcone, Glaciohydraulic supercooling: a freeze-on mechanism to create stratified debris-rich basal ice I. Field evidence, Journal of Glaciology 44 (1998), pp. 547–562.
Lorrain and Demeur, 1985 R.D. Lorrain and P. Demeur, Isotopic evidence for relic Pleistocene glacier ice on Victoria Island, Canadian Arctic Archipelago, Arctic and Alpine Research 17 (1985), pp. 89–98.
Lorrain et al., 1981 Lorrain, R.D., Souchez, R.A., Tison, J.L., 1981. Characteristics of basal ice from two outlet glaciers in the Canadian Arctic—implications for glacier erosion. In: Current Research, Part B, Geological Survey of Canada, Paper 81-1B, pp. 137-144.

Mackay, 1963 Mackay, J.R., 1963. The Mackenzie Delta area, N.W.T. Geographical Branch, Department of Mines and Technical Surveys, Canada, Memoir 8, 202pp.
Mackay, 1971 J.R. Mackay, The origin of massive icy beds in permafrost, western Arctic coast, Canada, Canadian Journal of Earth Sciences 8 (1971), pp. 397–422.
Mackay, 1983 Mackay, J.R., 1983. Oxygen isotope variations in permafrost, Tuktoyaktuk Peninsula area, Northwest Territories. In: Current Research, Part B, Geological Survey of Canada, Paper 83-1B, pp. 67–74.
Mackay, 1984 J.R. Mackay, The frost heave of stones in the active layer above permafrost, with downward and upward freezing, Arctic and Alpine Research 16 (1984), pp. 439–446.
Mackay, 1989 Mackay, J.R., 1989. Massive ice: some field criteria for the identification of ice types. In: Current Research, Part G, Geological Survey of Canada, Paper 89-1G, pp. 5–11.
Mackay and Dallimore, 1992 J.R. Mackay and S.R. Dallimore, Massive ice of the Tuktoyaktuk area, western Arctic coast, Canada, Canadian Journal of Earth Sciences 29 (1992), pp. 1235–1249.
Marchant et al., 2002 D.R. Marchant, A.R. Lewis, W.M. Phillips, E.J. Moore, R.A. Souchez, G.H. Denton, D.E. Sugden, N. Potter Jr. and G.P. Landis, Formation of patterned ground and sublimation till over Miocene glacier ice in Beacon Valley, southern Victoria Land, Antarctica, Bulletin of the Geological Society of America 114 (2002), pp. 718–730.
Mark, 1973 D.M. Mark, Analysis of axial orientation data, including till fabrics, Bulletin of the Geological Society of America 84 (1973), pp. 1369–1374.
Moorman and Michel, 2000 B.J. Moorman and F.A. Michel, The burial of ice in the proglacial environment on Bylot Island, Arctic Canada, Permafrost and Periglacial Processes 11 (2000), pp. 161–175.
Moorman et al., 1998 B. Moorman, F.A. Michel and A.T. Wilson, The development of tabular massive ground ice at Peninsula Point, N.W.T., Canada, Proceedings of the Seventh International Conference on Permafrost, Yellowknife, Canada, 23–27 June 1998. Collection Nordicana, Centre d'études nordiques, Université Laval (1998), pp. 757–762.
Murton, 1999 J.B. Murton, Permafrost a case study in cryostratigraphy, Mackenzie Delta area, Western Canadian Arctic. In: A.P. Jones, M.E. Tucker and J.K. Hart, Editors, The Description and Analysis of Quaternary Stratigraphic Field Sections Technical Guide 7, Quaternary Research Association, London (1999), pp. 249–266.
Murton and French, 1993 J.B. Murton and H.M. French, Thermokarst involutions, Summer Island, Pleistocene Mackenzie Delta, western Canadian Arctic, Permafrost and Periglacial Processes 4 (1993), pp. 217–229.
Murton and French, 1994 J.B. Murton and H.M. French, Cryostructures in permafrost, Tuktoyaktuk Coastlands, Western Arctic Canada, Canadian Journal of Earth Sciences 31 (1994), pp. 737–747.
Murton et al., 1995 J.B. Murton, C.A. Whiteman and P. Allen, Involutions in the Middle Pleistocene (Anglian) Barham Soil, Eastern England a comparison with thermokarst involutions from arctic Canada, Boreas 24 (1995), pp. 269–280.
Murton et al., 1997 J.B. Murton, H.M. French and M. Lamothe, Late Wisconsinan erosion and aeolian deposition, Summer and Hadwen Islands, Mackenzie Delta area, western Canadian Arctic optical dating and implications for glacial chronology, Canadian Journal of Earth Sciences 34 (1997), pp. 190–199.
Murton et al., in press Murton, J.B., Waller, R.I., Hart, J.K., Whiteman, C.A, Pollard, W.H., Clark, I.D., in press. Stratigraphy and glaciotectonic structures of permafrost deformed beneath the northwest margin of the Laurentide Ice Sheet, Tuktoyaktuk Coastlands, Canada. Journal of Glaciology.
Paré, 1983 Paré, D.G., 1983. Application of heavy-mineral analysis to problems of till provenance along a transect from Longlac, Ontario, to Somerset Island. MA thesis, Carleton University, Ottawa, Ontario.
Paul and Eyles, 1990 M.A. Paul and N. Eyles, Constraints on the preservation of diamict facies (melt-out tills) at the margins of stagnant glaciers, Quaternary Science Reviews 9 (1990), pp. 51–69.
Peuraniemi, 1984 V. Peuraniemi, Weathering of sulphide minerals in till in some mineralized areas in Finland, Prospecting in Areas of Glaciated Terrain, Institution of Mining and Metallurgy, London (1984), pp. 127–135.
Pollard, 1990 Pollard, W., 1990. The nature and origin of ground ice in the Herschel Island area, Yukon Territory. In: Permafrost-Canada, Proceedings of the 5th Canadian Permafrost Conference. Université Laval, Centre d'études nordiques, Québec and National Research Council of Canada, Ottawa, Collection Nordicana, vol. 54, pp. 23–30.
Pollard and Dallimore, 1988 W.H. Pollard and S.R. Dallimore, Petrographic characteristics of massive ground ice, Yukon Coastal Plain, Canada, Permafrost, Fifth International Conference, Proceedings vol. 1, Tapir, Trondheim (1988), pp. 224–229.
Rampton, 1974 V.N. Rampton, The influence of ground ice and thermokarst upon the geomorphology of the Mackenzie-Beaufort region. In: B.D. Fahey and R.D. Thompson, Editors, Research in Polar and Alpine Geomorphology, Proceedings of the Third Guelph Symposium on Geomorphology, Geo-Abstracts, Norwich (1974), pp. 43–59.
Rampton, 1988a V.N. Rampton, Quaternary geology of the Tuktoyaktuk Coastlands, Northwest Territories, Geological Survey of Canada, Memoir 423 (1988) 98pp.
Rampton, 1988b V.N. Rampton, Origin of massive ground ice on Tuktoyaktuk Peninsula, Northwest Territories, Canada a review of stratigraphic and geomorphic evidence, Permafrost, Fifth International Conference, Proceedings vol. 1, Tapir, Trondheim (1988), pp. 850–855.
Rampton, 1991 V.N. Rampton, Observations on buried glacier ice and massive segregated ice, western Arctic coast, Canada discussion, Permafrost and Periglacial Processes 2 (1991), pp. 163–165.
Rampton and Mackay, 1971 V.N. Rampton and J.R. Mackay, Massive ice and icy sediments throughout the Tuktoyaktuk Peninsula, Richards Island, and nearby areas, District of Mackenzie, Geological Survey of Canada, Paper 71-21 (1971) 16pp.
Ritchie, 1984 Ritchie, J.C., 1984. Past and Present Vegetation of the Far Northwest of Canada. University of Toronto Press, Toronto, 251pp.
Robinson et al., 1993 Robinson, S.D., Moorman, B.J., Judge, A.S., Dallimore, S.R., 1993. The characterization of massive ground ice at Yaya Lake, Northwest Territories using radar stratigraphy techniques. In: Current Research, Part B, Geological Survey of Canada, Paper 93-1B, pp. 23–32.
Sharp et al., 1994 M. Sharp, J. Jouzel, B. Hubbard and W. Lawson, The character, structure and origin of the basal ice layer of a surge-type glacier, Journal of Glaciology 40 (1994), pp. 327–340.
Sharpe, 1992 Sharpe, D.R., 1992. Quaternary geology of Wollaston Peninsula, Victoria Island, Northwest territories. Geological Survey of Canada, Memoir 434, 84pp.
Shaw, 1977 J. Shaw, Till body morphology and structure related to glacier flow, Boreas 6 (1977), pp. 189–201.
Shaw, 1982 J. Shaw, Melt-out till in the Edmonton area, Alberta, Canada, Canadian Journal of Earth Sciences 19 (1982), pp. 1548–1569.
Shilts and Kettles, 1990 W.W. Shilts and I.M. Kettles, Geochemical/mineralogical profiles through fresh and weathered till. In: R. Kujansuu and M. Saarnisto, Editors, Handbook of Glacial Indicator Tracing, Balkema, Rotterdam (1990), pp. 187–216.

St-Onge and McMartin, 1999 D.A. St-Onge and I. McMartin, The Bluenose Lake Moraine, a moraine with a glacier core, Géographie Physique et Quaternaire 53 (1999), pp. 287–295.
Sugden et al., 1987 D.E. Sugden, P.G. Knight, N. Livesey, R.D. Lorrain, R.A. Souchez, J.-L. Tison and J. Jouzel, Evidence for two zones of debris entrainment beneath the Greenland ice sheet, Nature 328 (1987), pp. 238–241.
Svendsen et al., 2004 Svendsen, J.I., Alexanderson, H., Astakhov, V.I., Demidov, I., Dowdeswell, J.A., Funder, J.A.V., Gataullin, V., Henriksen, M., Hjort, C., Houmark-Nielsen, M., Hubberten, H.W., Ingólfsson, O., Jakobsson, M., Kjær, K.H., Larsen, E., Lokrantz, H., Lunkka, J.P., LysÅ, A., Mangerud, J., Matiouchkov, A., Murray, A., Möller, P., Niessen, F., Nikolskaya, O., Polyak, L., Saarnisto, M., Siegert, C., Siegert, M.J., Spielhagen, R.F., Stein, R., 2004. Late Quaternary ice sheet history of northern Eurasia. Quaternary Science Reviews, 23, 1229–1271.
Terrain Analysis and Mapping Services Limited, 1993 Terrain Analysis and Mapping Services Limited, 1993. Potential Granular Resources and their Geological Constraints, Northern Richards Island. Report for the Department of Indian and Northern Affairs.
Vtyurin and Glazovskiy, 1986 B.I. Vtyurin and A.F. Glazovskiy, Composition and structure of the Ledyanaya Gora tabular ground ice body on the Yenisey, Polar Geography and Geology 10 (1986), pp. 273–285.
Waller et al., 2000 R.I. Waller, J.K. Hart and P.G. Knight, The influence of tectonic deformation on facies variability in stratified debris-rich basal ice, Quaternary Science Reviews 19 (2000), pp. 775–786.
Washburn, 1979 Washburn, A.L., 1979. Geocryology: A Survey of Periglacial Processes and Environments. Arnold, London, 406 pp.
Wolfe, 1998 S.A. Wolfe, Massive ice associated with glaciolacustrine delta sediments, Slave Geological Province, N.W.T. Canada, Proceedings of the Seventh International Conference on Permafrost, Yellowknife, Canada, 23–27 June 1998. Collection Nordicana, Centre d'études nordiques, Université Laval (1998), pp. 1133–1139.
Worsley, 1999 P. Worsley, Context of relict Wisconsinan glacial ice at Angus Lake, SW Banks Island, western Canadian Arctic and stratigraphic implications, Boreas 28 (1999), pp. 543–550.
Yershov, 1998 Yershov, E.D., 1998. General Geocryology. Cambridge University Press, Cambridge, 580pp.
Zdanowicz et al., 2002 C. Zdanowicz, D. Fisher, I. Clark and D. Lacelle, An ice-marginal δ18O record from Barnes Ice Cap, Baffin Island, Canada, Annals of Glaciology 35 (2002), pp. 145–149.
Polar Continental Shelf Contribution Number 00904 Corresponding author. Tel.: +44-01273 678293; fax +44-01273 677196.