Embed Size (px)
Citation preview

Waters MicromassQuattro Premier XEMass Spectrometer
Operator’s Guide
34 Maple StreetMilford, MA 01757
71500104102 Revision B
NOTICE
The information in this document is subject to change without notice and should not be construed as a commitment by Waters Corporation. Waters Corporation assumes no responsibility for any errors that may appear in this document. This document is believed to be complete and accurate at the time of publication. In no event shall Waters Corporation be liable for incidental or consequential damages in connection with, or arising from, the use of this document.
© 2005 WATERS CORPORATION. PRINTED IN THE UNITED STATES OF AMERICA AND IRELAND. ALL RIGHTS RESERVED. THIS DOCUMENT OR PARTS THEREOF MAY NOT BE REPRODUCED IN ANY FORM WITHOUT THE WRITTEN PERMISSION OF THE PUBLISHER.
Micromass and Waters are registered trademarks, and ESCi, MassLynx, MaxEnt, MUX-technology, Quattro Premier, T-Wave, and ZSpray are trademarks of Waters Corporation.
PEEK is a trademark of Victrex Corporation.
Rheodyne is a registered trademark of Rheodyne, L.P.
Snoop is registered trademark of Sigma-Aldrich Co.
Upchurch is a registered trademark of Scivex, Inc.
Viton is a registered trademark of DuPont Dow Elastomers.
Windows is a registered trademark of Microsoft Corporation.
All other trademarks or registered trademarks are the sole property of their respective owners.

Safety Information
GeneralThe Waters® Micromass® Quattro Premier™ XE Mass Spectrometer is designed solely for use as a mass spectrometer; any attempt to use it for any other purpose can damage the instrument, and will invalidate its warranty.
The Waters Micromass Quattro Premier XE Mass Spectrometer conforms to European standard EN61010-1:2001, Safety requirements for electrical equipment for measurement, control, and laboratory use - Part 1: General requirements.
The instrument has been designed and tested according to recognized safety standards. If the instrument is used in a manner not specified by the manufacturer, the protection provided to the user may be impaired.
Whenever the safety protection of the instrument has been compromised, disconnect the instrument from all power sources, and secure the instrument against unintended operation.
The instrument must be installed so that the operator can easily isolate the instrument from the mains power supply at all times.
Biological HazardWhen you analyze physiological fluids, take all necessary precautions, and treat all specimens as potentially infectious. Precautions are outlined in “CDC Guidelines on Specimen Handling,” CDC – NIH Manual, 1984.
Suitable protection against biohazards must be taken during maintenance procedures and cleaning, as parts of the instrument are exposed to potentially infectious samples.
Chemical HazardGood Laboratory Practice should be adhered to when using potentially toxic, caustic, or flammable solvents and analytes.

Solvent Leakage Hazard
To avoid possible excessive leakage of solvent into the laboratory atmosphere, the items identified in Section 7.3 must be renewed at intervals of no greater than one year.
The system has been designed to be robust and leak-tight. Waters recommends that you perform a hazard analysis, assuming a maximum leak into the laboratory atmosphere of 10% LC eluent.
The items identified in Appendix G may be exposed to solvent; you must evaluate the safety issues involved if the solvents used in your application differ from the solvents normally used with these items.
Flammable Solvents Operation Hazard
If flammable solvents are used, ensure that the nitrogen supply pressure does not fall below 4 bar (58 psi) during the analysis. Also ensure that the Gas Fail connection (see Section 1.6.3) is connected to the HPLC system to ensure that the LC flow is stopped on nitrogen supply failure.
High Voltage Hazard
Certain areas of the instrument may have high voltages present when the instrument is in Operate. These areas are shown in Figure 1, showing the instrument configured for ESI operation, and Figure 2, showing the instrument configured for APcI operation.
Warning: To avoid possible excessive leakage of solvent into the laboratory atmosphere, the items identified in Section 7.3 must be renewed at intervals of no greater than one year.
Caution: If the nitrogen supply pressure falls below 4 bar (58 psi), the instrument stops the nitrogen flow and admits air into the source. If flammable solvents are used, an ignition hazard exists under these conditions.
Warning: Certain areas of the instrument may have high voltages present when the instrument is in Operate. To avoid non-lethal electric shock, make sure the instrument is in Standby before touching these areas.

Waters recommends that any equipment connected to the ESI probe or optional MUX-technology interface be earthed.
High Temperature Hazard
The source enclosure assembly may be at high temperature, as shown in Figure 3, showing the instrument configured for ESI operation, and Figure 4, showing the instrument configured for APcI operation.
Warning: To avoid electric shock (non-lethal), any equipment connected to the ESI probe or optional MUX-technology interface should be earthed.
Warning: To avoid burns, take care when working with the instrument as the source enclosure assembly may be at high temperature.
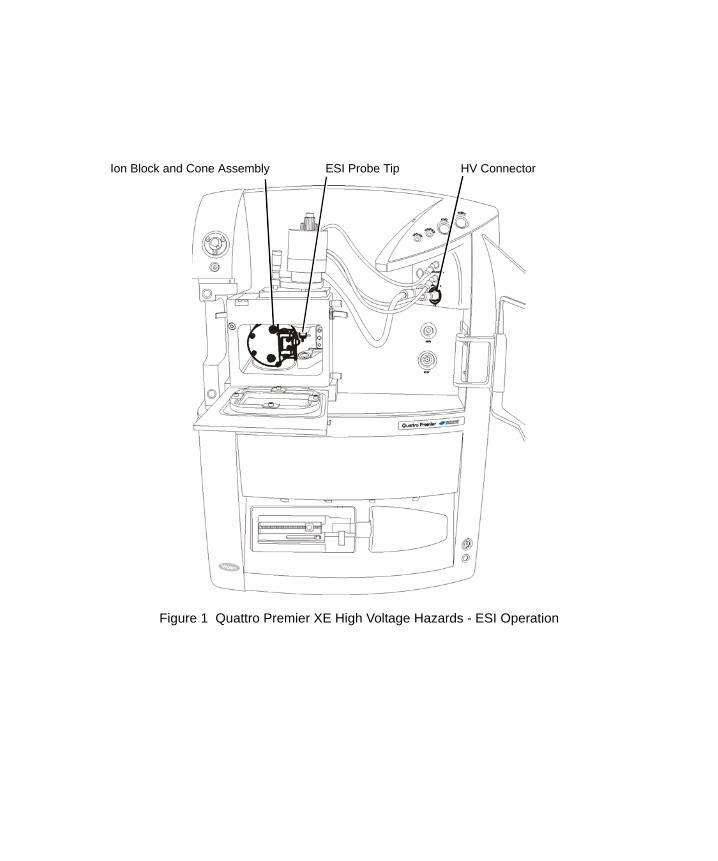
Figure 1 Quattro Premier XE High Voltage Hazards - ESI Operation
ESI Probe TipIon Block and Cone Assembly HV Connector

Figure 2 Quattro Premier XE High Voltage Hazards - APcI Operation
Corona Discharge PinIon Block and Cone Assembly HV Connector
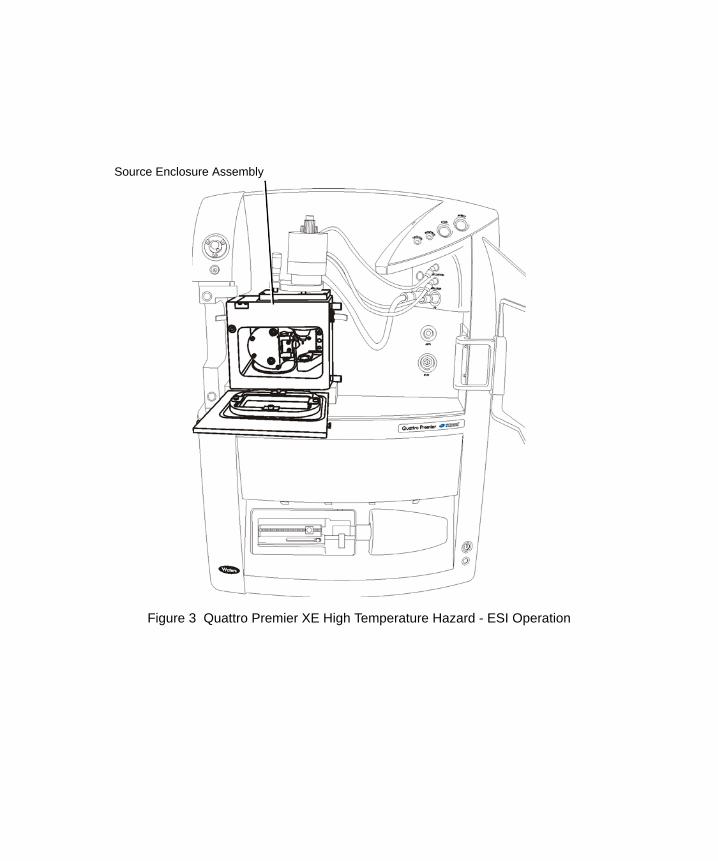
Figure 3 Quattro Premier XE High Temperature Hazard - ESI Operation
Source Enclosure Assembly
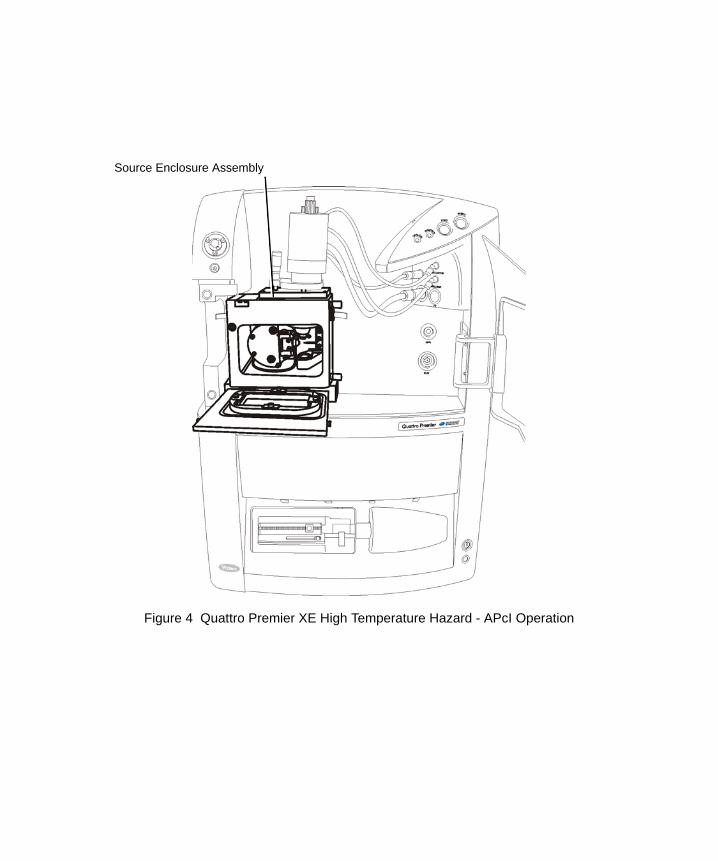
Figure 4 Quattro Premier XE High Temperature Hazard - APcI Operation
Source Enclosure Assembly
Safety SymbolsWarnings in this guide or on the instrument must be observed during all phases of service, repair, installation, and operation of the instrument. Failure to comply with these precautions violates the safety standards of the design and intended use of the instrument.
Waters Corporation assumes no liability for the user’s failure to comply with these requirements.
Safety symbols are used in this guide and on the instrument. A Warning is an instruction that draws the user’s attention to the risk of injury or death; a Caution is an instruction that draws attention to the risk of damage to the instrument.
Consignes de sécurité
GénéralitésLe Quattro Premier™ XE de Waters® Micromass® est destiné exclusivement à être utilisé comme spectromètre de masse. Tout usage détourné du Quattro Premier XE risquerait d’endommager l’instrument et invaliderait sa garantie.
Le spectromètre de masse Quattro Premier XE de Waters Micromass est conforme à la norme européenne EN61010-1:2001, Règles de sécurité pour appareils électriques de mesurage, de régulation et de laboratoire - Partie 1: Prescriptions générales.
Cet instrument a été conçu et testé conformément aux dispositions des normes de sécurité les plus reconnues. Toute utilisation de l’équipement non conforme aux instructions du fabricant risque de rendre défectueuse la protection assurée par l’instrument.
Dans le cas où la sécurité de l’utilisateur se trouverait compromise, débranchez le cordon d’alimentation de l'instrument et assurez-vous qu’il ne pourra être mis en marche par mégarde.
L’instrument doit être installé de façon à faciliter l’accès de l’utilisateur au bloc d’alimentation électrique.
Risques biologiquesLorsque vous analysez des fluides physiologiques, faîtes preuve d’une extrême prudence et considérez tous les spécimens comme potentiellement infectieux. Une liste des précautions à prendre figure dans le « CDC Guidelines on Specimen Handling », CDC - NIH Manual, 1984.
Portez des vêtements de protection adéquats lorsque vous procédez à une opération de maintenance ou de nettoyage, car les pièces de l’instrument peuvent comporter des traces des substances infectieuses auxquelles elles ont été exposées.
Risques chimiquesL’usage des solvants et analytes potentiellement toxiques, caustiques ou inflammables doit s’effectuer dans le respect des bonnes pratiques de laboratoire.
Risque de fuite de solvant
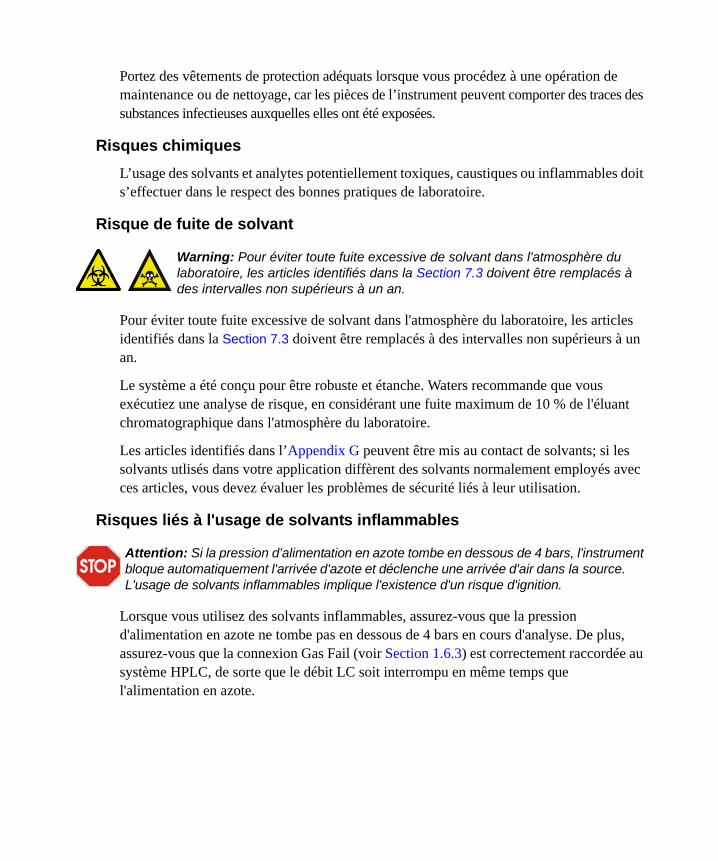
Pour éviter toute fuite excessive de solvant dans l'atmosphère du laboratoire, les articles identifiés dans la Section 7.3 doivent être remplacés à des intervalles non supérieurs à un an.
Le système a été conçu pour être robuste et étanche. Waters recommande que vous exécutiez une analyse de risque, en considérant une fuite maximum de 10 % de l'éluant chromatographique dans l'atmosphère du laboratoire.
Les articles identifiés dans l’Appendix G peuvent être mis au contact de solvants; si les solvants utlisés dans votre application diffèrent des solvants normalement employés avec ces articles, vous devez évaluer les problèmes de sécurité liés à leur utilisation.
Risques liés à l'usage de solvants inflammables
Lorsque vous utilisez des solvants inflammables, assurez-vous que la pression d'alimentation en azote ne tombe pas en dessous de 4 bars en cours d'analyse. De plus, assurez-vous que la connexion Gas Fail (voir Section 1.6.3) est correctement raccordée au système HPLC, de sorte que le débit LC soit interrompu en même temps que l'alimentation en azote.
Warning: Pour éviter toute fuite excessive de solvant dans l'atmosphère du laboratoire, les articles identifiés dans la Section 7.3 doivent être remplacés à des intervalles non supérieurs à un an.
Attention: Si la pression d’alimentation en azote tombe en dessous de 4 bars, l'instrument bloque automatiquement l'arrivée d'azote et déclenche une arrivée d'air dans la source. L'usage de solvants inflammables implique l'existence d'un risque d'ignition.
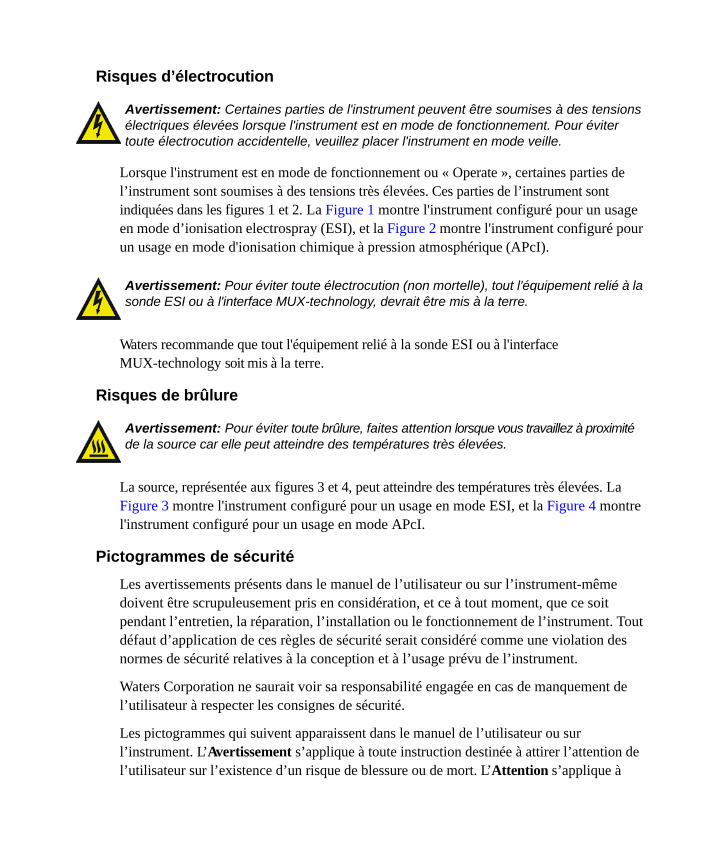
Risques d’électrocution
Lorsque l'instrument est en mode de fonctionnement ou « Operate », certaines parties de l’instrument sont soumises à des tensions très élevées. Ces parties de l’instrument sont indiquées dans les figures 1 et 2. La Figure 1 montre l'instrument configuré pour un usage en mode d’ionisation electrospray (ESI), et la Figure 2 montre l'instrument configuré pour un usage en mode d'ionisation chimique à pression atmosphérique (APcI).
Waters recommande que tout l'équipement relié à la sonde ESI ou à l'interface MUX-technology soit mis à la terre.
Risques de brûlure
La source, représentée aux figures 3 et 4, peut atteindre des températures très élevées. La Figure 3 montre l'instrument configuré pour un usage en mode ESI, et la Figure 4 montre l'instrument configuré pour un usage en mode APcI.
Pictogrammes de sécuritéLes avertissements présents dans le manuel de l’utilisateur ou sur l’instrument-même doivent être scrupuleusement pris en considération, et ce à tout moment, que ce soit pendant l’entretien, la réparation, l’installation ou le fonctionnement de l’instrument. Tout défaut d’application de ces règles de sécurité serait considéré comme une violation des normes de sécurité relatives à la conception et à l’usage prévu de l’instrument.
Waters Corporation ne saurait voir sa responsabilité engagée en cas de manquement de l’utilisateur à respecter les consignes de sécurité.
Les pictogrammes qui suivent apparaissent dans le manuel de l’utilisateur ou sur l’instrument. L’Avertissement s’applique à toute instruction destinée à attirer l’attention de l’utilisateur sur l’existence d’un risque de blessure ou de mort. L’Attention s’applique à
Avertissement: Certaines parties de l'instrument peuvent être soumises à des tensions électriques élevées lorsque l'instrument est en mode de fonctionnement. Pour éviter toute électrocution accidentelle, veuillez placer l'instrument en mode veille.
Avertissement: Pour éviter toute électrocution (non mortelle), tout l'équipement relié à la sonde ESI ou à l'interface MUX-technology, devrait être mis à la terre.
Avertissement: Pour éviter toute brûlure, faites attention lorsque vous travaillez à proximité de la source car elle peut atteindre des températures très élevées.
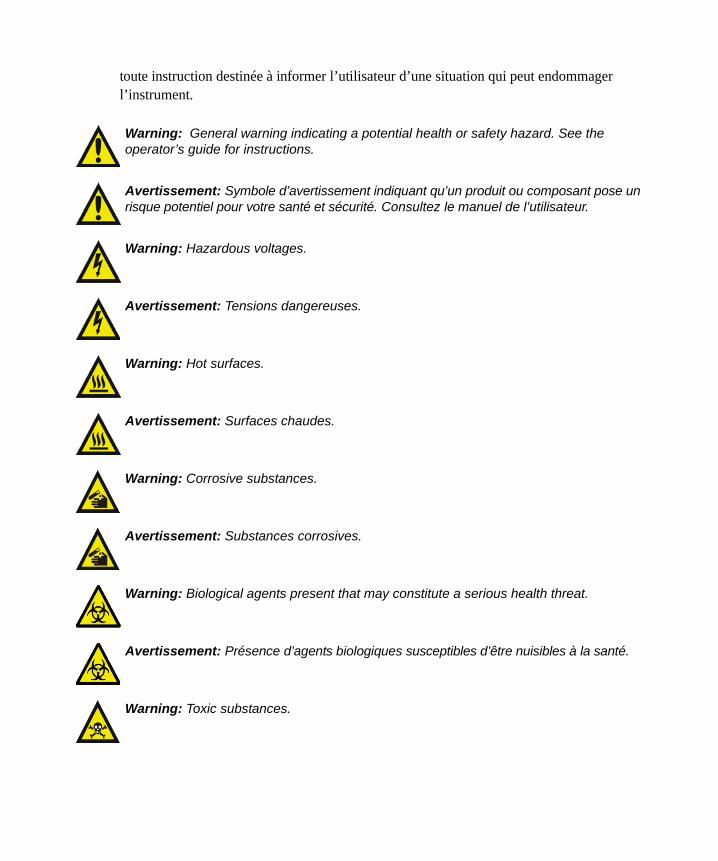
toute instruction destinée à informer l’utilisateur d’une situation qui peut endommager l’instrument.
Warning: General warning indicating a potential health or safety hazard. See the operator’s guide for instructions.
Avertissement: Symbole d’avertissement indiquant qu’un produit ou composant pose un risque potentiel pour votre santé et sécurité. Consultez le manuel de l’utilisateur.
Warning: Hazardous voltages.
Avertissement: Tensions dangereuses.
Warning: Hot surfaces.
Avertissement: Surfaces chaudes.
Warning: Corrosive substances.
Avertissement: Substances corrosives.
Warning: Biological agents present that may constitute a serious health threat.
Avertissement: Présence d’agents biologiques susceptibles d’être nuisibles à la santé.
Warning: Toxic substances.

Quattro Premier XE Mass Spectrometer Information
Intended UseThe Waters Micromass Quattro Premier XE Mass Spectrometer can be used as a research tool to deliver authenticated mass measurement in both MS and MS/MS modes.
The Quattro Premier XE is considered a General in vitro Diagnostic Device according to European Union Directive 98/79/EC.
Avertissement: Substances toxiques.
Warning: Flammable substances.
Avertissement: Substances inflammables.
Warning: Laser radiation.
Avertissement: Rayonnements laser.
Warning: UV radiation.
Avertissement: Rayonnements UV.
Caution: Care must be taken to avoid the possibility of damaging the instrument, or affecting its operation.
Attention: Utilisez l’instrument en faisant preuve de beaucoup de précaution pour éviter de l’endommager et ainsi nuire à son fonctionnement.
CalibrationFollow acceptable methods of calibration with pure standards to calibrate methods. Use a minimum of five standards to generate a standard curve. The concentration range should cover the entire range of quality-control samples, typical specimens, and atypical specimens.
Quality ControlRoutinely run three quality-control samples. Quality-control samples should represent subnormal, normal, and above-normal levels of a compound. Ensure that quality-control sample results are within an acceptable range, and evaluate precision from day to day, and run to run. Data collected when quality-control samples are out of range may not be valid. Do not report this data until you ensure that system performance is acceptable.


Table of Contents
Safety Information..................................................................................................... iii
Consignes de sécurité.................................................................................................. x
Quattro Premier XE Mass Spectrometer Information .............................. xiv
Chapter 1 Instrument Description ............................................................................................ 1
1.1 Overview ........................................................................................................... 11.2 Sample Inlet....................................................................................................... 31.3 Vacuum System................................................................................................. 31.4 MassLynx Control System ................................................................................ 31.5 Front Panel Controls, Indicators, and Connections........................................... 4
1.5.1 Power Switch ...................................................................................... 41.5.2 Embedded PC Reset Switch ............................................................... 41.5.3 Cone Gas, Desolvation Gas, and Nebulizer Gas Connections ........... 61.5.4 Electrical Connections ........................................................................ 71.5.5 Status Display ..................................................................................... 71.5.6 Divert/Injection Valve ......................................................................... 8
1.6 Rear Panel Connections .................................................................................. 101.6.1 Analog Channels ............................................................................... 101.6.2 Contact Closure ................................................................................. 111.6.3 Gas Fail ............................................................................................. 111.6.4 CE Int (Capillary Electrophoresis Interlock) .................................... 121.6.5 Comm For EPC ................................................................................. 121.6.6 Com1 ................................................................................................. 121.6.7 Aux O/P ............................................................................................ 121.6.8 Pump Relay ....................................................................................... 121.6.9 GAS IN ............................................................................................. 13
Table of Contents xvii

1.6.10 Collision Gas In ................................................................................ 141.6.11 Exhaust .............................................................................................. 141.6.12 Waste ................................................................................................. 151.6.13 Mains Power Connection .................................................................. 151.6.14 Mains Power Fuses ........................................................................... 151.6.15 Vacuum Connections ........................................................................ 15
1.7 Top Panel......................................................................................................... 151.8 Mass Flow Controllers .................................................................................... 16
Chapter 2 Setting-Up and Tuning for ESI ........................................................................... 17
2.1 Setting-Up ....................................................................................................... 172.1.1 Removing the APCI Probe ............................................................... 172.1.2 Removing the APCI Corona Discharge Pin ...................................... 192.1.3 Installing the ESI (Electrospray) Probe ............................................ 20
2.2 Tuning via Sample Infusion ............................................................................ 222.2.1 Tuning for MS Operation .................................................................. 222.2.2 Tuning for MS/MS (Daughter Ion) Operation .................................. 292.2.3 Creating the MRM MS Method File ................................................. 30
2.3 Preparing the Instrument for Data Acquisition ............................................... 322.3.1 Reconfiguring the Connection to the Probe ...................................... 322.3.2 Configuring the Inlet for LC Operation ............................................ 332.3.3 Creating a Sample List and Starting Data Acquisition ..................... 332.3.4 Viewing and Printing the Tuning Parameters Associated with
a Data File ......................................................................................... 34
Chapter 3 Setting-Up and Tuning for APCI ....................................................................... 35
3.1 Setting-Up ....................................................................................................... 353.1.1 Removing the ESI Probe ................................................................... 353.1.2 Installing the APCI Corona Discharge Pin ....................................... 36
xviii Table of Contents

3.1.3 Installing the APCI Probe ................................................................. 383.2 Tuning via Sample Infusion ............................................................................ 40
3.2.1 Tuning for MS Operation .................................................................. 403.2.2 Tuning for MS/MS (Daughter Ion) Operation .................................. 463.2.3 Creating the MRM MS Method File ................................................. 48
3.3 Preparing the Instrument for Data Acquisition ............................................... 503.3.1 Reconfiguring the Connection to the Probe ...................................... 503.3.2 Configuring the Inlet for LC Operation ............................................ 513.3.3 Creating a Sample List and Starting Data Acquisition ..................... 513.3.4 Viewing and Printing the Tuning Parameters Associated with
a Data File .......................................................................................... 52
Chapter 4 ESCi Multi-Mode Operation ............................................................................... 53
4.1 Preparing the Instrument ................................................................................. 534.2 Tuning the Instrument ..................................................................................... 544.3 Data Acquisition.............................................................................................. 55
Chapter 5 Acquiring Data ......................................................................................................... 57
5.1 Starting an Acquisition.................................................................................... 575.1.1 Starting an Acquisition from the Tune Window ............................... 575.1.2 Starting Multiple-Sample Acquisition from the MassLynx Window 605.1.3 Automatic Quantification of the Sample List ................................... 63
5.2 Monitoring an Acquisition .............................................................................. 655.2.1 Viewing the Status of an Acquisition ................................................ 655.2.2 Viewing a Chromatogram in Real-Time ........................................... 655.2.3 Viewing a Spectrum in Real-Time .................................................... 65
5.3 Selecting Instrument Data Thresholds ............................................................ 665.3.1 Profile Data ....................................................................................... 675.3.2 Centroid Data .................................................................................... 68
Table of Contents xix

5.3.3 SIR Data ............................................................................................ 685.3.4 Ion Counting Threshold .................................................................... 685.3.5 Profile Data – Spike Removal .......................................................... 695.3.6 Analog Data ...................................................................................... 69
5.4 Checking the Status of the Communications Link.......................................... 705.5 Stopping an Acquisition .................................................................................. 705.6 Pausing an Acquisition.................................................................................... 705.7 Setting-Up Scanning Functions....................................................................... 71
5.7.1 Creating a Function List ................................................................... 715.7.2 Setting-Up a Full Scan Function ....................................................... 775.7.3 Setting-Up an SIR Function .............................................................. 815.7.4 Setting-Up MS/MS Scanning Functions ........................................... 845.7.5 Setting-Up an MRM Function .......................................................... 885.7.6 Setting-Up a Survey Function ........................................................... 885.7.7 Monitoring Acquisitions ................................................................. 111
Chapter 6 Setting-Up Mass Calibration ............................................................................. 113
6.1 Overview ....................................................................................................... 1136.1.1 Types of Calibration ........................................................................ 1136.1.2 Calibration Process ......................................................................... 114
6.2 Calibrating for Electrospray Operation ......................................................... 1146.2.1 Preparing for Calibration ................................................................ 1146.2.2 Selecting the Calibration Options ................................................... 1186.2.3 Setting the Calibration Parameters ................................................. 1196.2.4 Performing a Calibration ................................................................ 1236.2.5 Calibration Failure .......................................................................... 1276.2.6 Incorrect Calibration ....................................................................... 1286.2.7 Manually Checking the Calibration ................................................ 1296.2.8 Manually Editing the Peak Matching ............................................. 131
xx Table of Contents
6.2.9 Saving the Calibration .................................................................... 1326.2.10 Verifying the Calibration ................................................................ 132
Chapter 7 Maintenance Procedures ..................................................................................... 133
7.1 Maintenance Schedule................................................................................... 1337.2 Safety and Handling ...................................................................................... 1347.3 Replacing the Source Enclosure and Probe O-rings ..................................... 1357.4 Emptying the Nitrogen Exhaust Waste Bottle............................................... 1407.5 Gas-Ballasting the Rotary Pump (E2M28) ................................................... 1417.6 Checking the Rotary Pump Oil ..................................................................... 1437.7 Changing the Rotary Pump Oil ..................................................................... 144
7.7.1 Required Materials .......................................................................... 1447.7.2 Procedure ........................................................................................ 144
7.8 Replacing the Oil Mist and Odor Filter Elements......................................... 1457.8.1 Required Materials .......................................................................... 1457.8.2 Procedure ........................................................................................ 145
7.9 Cleaning the Source Components ................................................................. 1487.9.1 Overview ......................................................................................... 1487.9.2 Required Materials .......................................................................... 1497.9.3 Removing the Probe from the Source ............................................. 1497.9.4 Removing the Sample Cone ........................................................... 1517.9.5 Removing the Gas Exhaust Port ..................................................... 1567.9.6 Removing the Ion Source Enclosure and Ion Block ....................... 1577.9.7 Removing the Source T-Wave Assembly from the Instrument ...... 1607.9.8 Disassembling the Source T-Wave Assembly ................................. 1627.9.9 Disassembling the Source Ion Block .............................................. 1647.9.10 Cleaning the Sample Cone and Cone Gas Cone ............................. 1727.9.11 Cleaning the Gas Exhaust Port ....................................................... 1727.9.12 Cleaning the Source T-Wave Components ..................................... 173
Table of Contents xxi

7.9.13 Cleaning the Ion Block and Extraction Cone ................................. 1747.9.14 Cleaning the Isolation Valve Stem .................................................. 1757.9.15 Reassembling the Source Ion Block ............................................... 1757.9.16 Reassembling the Source T-Wave Assembly .................................. 1767.9.17 Fitting the Source T-Wave Assembly to the Instrument ................. 1767.9.18 Fitting the Ion Block and Ion Source Enclosure ............................. 1777.9.19 Fitting the Gas Exhaust Port ........................................................... 1787.9.20 Fitting the Sample Cone ................................................................. 178
7.10 Cleaning or Replacing the ESI Probe Tip ..................................................... 1787.10.1 Required Materials .......................................................................... 1797.10.2 Procedure ........................................................................................ 179
7.11 Cleaning or Replacing the Corona Discharge Pin......................................... 1807.11.1 Required Materials .......................................................................... 1807.11.2 Procedure ........................................................................................ 180
7.12 Cleaning the APCI Probe Tip........................................................................ 1817.13 Replacing the Ion Block Cartridge Heater .................................................... 182
7.13.1 Required Materials .......................................................................... 1827.13.2 Procedure ........................................................................................ 182
7.14 Replacing the ESI Probe Sample Capillary................................................... 1877.14.1 Required Materials .......................................................................... 1877.14.2 Removing the Existing Capillary .................................................... 1887.14.3 Installing the New Capillary ........................................................... 192
7.15 Replacing the APCI Probe Sample Capillary ............................................... 1967.15.1 Required Materials .......................................................................... 1967.15.2 Removing the Existing Capillary .................................................... 1977.15.3 Installing the New Capillary ........................................................... 201
7.16 Replacing the APCI Probe Heater................................................................. 2067.16.1 Required Materials .......................................................................... 2067.16.2 Procedure ........................................................................................ 207
xxii Table of Contents

Chapter 8 Troubleshooting ...................................................................................................... 211
8.1 Spare Parts..................................................................................................... 2118.2 Safety and Handling ...................................................................................... 2118.3 System Troubleshooting................................................................................ 2118.4 Component Hardware Troubleshooting ........................................................ 213
8.4.1 Power Switch Fails to Power-up the Instrument ............................. 2138.4.2 No Peaks in the Tune Window (No Ion Beam) .............................. 2138.4.3 Unsteady or Low Intensity Peaks (Ion Beam) ................................ 2158.4.4 Unusually High LC Backpressure .................................................. 2168.4.5 Unusually Low LC Backpressure ................................................... 2178.4.6 Insufficient Vacuum ........................................................................ 2178.4.7 Leaking Nitrogen ............................................................................ 2188.4.8 Rotary Pump Oil Accumulated in the Exhaust Tubing ................... 2188.4.9 Ion Source Heater and Desolvation Heater are Not Working ......... 2198.4.10 APCI Probe Heater Not Working ................................................... 2198.4.11 Failure of the Fuse Supplying the Rotary Pump ............................. 2198.4.12 Ion Mode Fault ................................................................................ 2208.4.13 Failure to Recognize a Particular Probe Type ................................. 2208.4.14 Ripple .............................................................................................. 2218.4.15 Loss of Communication with the Instrument ................................. 2218.4.16 IEEE Communication Errors .......................................................... 222
8.5 High Noise Levels in MRM Analyses .......................................................... 2228.5.1 Chemical Noise ............................................................................... 2238.5.2 Electronic Noise .............................................................................. 223
8.6 Contacting Waters ......................................................................................... 224
Appendix A Starting Up and Shutting Down the Instrument ........................................ 225
A.1 Starting Up the Instrument ............................................................................ 225
Table of Contents xxiii

A.2 Shutting Down the Instrument ...................................................................... 228A.2.1 Emergency Shutdown ..................................................................... 228A.2.2 Overnight Instrument Shutdown ..................................................... 228A.2.3 Complete Instrument Shutdown ..................................................... 228
Appendix B Setting-Up the Syringe Pump ............................................................................ 231
Appendix C The MassLynx Tune Window ............................................................................ 233
C.1 Opening the MassLynx Tune Window.......................................................... 233C.2 Selecting the Ionization Mode....................................................................... 233C.3 Controlling Gas Flows .................................................................................. 235
C.3.1 Controlling the Nebulizer, Desolvation, and Cone Gas Flows ....... 235C.3.2 Controlling the Collision Gas Flow ................................................ 235
C.4 Controlling the Syringe Pump....................................................................... 235C.5 Selecting the Syringe Type............................................................................ 235C.6 Selecting the Scan Time and Inter Scan Delay ............................................. 236C.7 Setting the Ramp Controls ............................................................................ 236
C.7.1 Creating a Cone Voltage Ramp ....................................................... 236C.7.2 Controlling the Cone Voltage Ramp ............................................... 237C.7.3 Creating a Collision Energy Ramp ................................................. 237C.7.4 Controlling the Collision Energy Ramp ......................................... 238
C.8 Resetting the Zero Level ............................................................................... 238C.9 Controlling the Display of Readback Windows............................................ 238C.10 Changing Tune Parameter Settings ............................................................... 239C.11 Saving Instrument Tune Parameters.............................................................. 239
C.11.1 Creating a New Instrument Parameter File ..................................... 240C.11.2 Saving Tune Parameters in an Instrument Parameter File .............. 240C.11.3 Opening an Existing Instrument Parameter File ............................. 240
C.12 Printing Tune Information............................................................................. 240
xxiv Table of Contents
C.13 Using the EasyTune Source Page.................................................................. 241C.14 Changing Between the Peak and Vacuum Displays...................................... 241C.15 Setting-Up Peaks for Tuning......................................................................... 241
C.15.1 Selecting Peaks for Tuning ............................................................. 241C.15.2 Selecting the Operating Mode for a Peak ....................................... 242C.15.3 Selecting the Tune Mass for a Peak ................................................ 242C.15.4 Selecting the Span of a Displayed Peak .......................................... 243C.15.5 Changing the Gain of a Displayed Peak ......................................... 244
C.16 Customizing the Peak Display ...................................................................... 244C.16.1 Opening the Peak Display Menu .................................................... 244C.16.2 Customizing the Colors and Numbers of Displayed Traces ........... 245C.16.3 Customizing the Peak Trace Line Appearance ............................... 246C.16.4 Customizing the Peak Intensity Display ......................................... 246C.16.5 Customizing the Peak Display Grid ................................................ 246
C.17 Selecting the Instrument Name ..................................................................... 247C.18 The Diagnostics Page .................................................................................... 247C.19 Manually Controlling the T-Wave Optics ..................................................... 247
Appendix D Calibration Reference Information ................................................................. 251
D.1 Overview ...................................................................................................... 251D.2 Editing a Calibration Reference File ............................................................ 251D.3 Positive Ion Calibration Reference Files ...................................................... 252
D.3.1 Polyethylene Glycol ........................................................................ 253D.3.2 Sodium Iodide and Cesium Iodide Mixture .................................... 253D.3.3 Sodium Iodide and Rubidium Iodide Mixture ................................ 254
D.4 Negative Ion Calibration Reference Files .................................................... 254D.5 Preparing Reference Sample Solutions ......................................................... 255
D.5.1 Preparing the PEGNH4 Reference Sample Solution ...................... 255
Table of Contents xxv

D.5.2 Preparing the Sodium Iodide and Cesium Iodide Mixture Sample Solution .............................................................................. 255
Appendix E Performance Specifications ................................................................................ 257
E.1 Electrospray Positive Ion ............................................................................. 257E.2 Electrospray Negative Ion ............................................................................ 257E.3 MS Resolution .............................................................................................. 257E.4 Mass Measurement Accuracy ....................................................................... 258E.5 APCI Positive Ion ......................................................................................... 258
Appendix F Theory and Principles of Operation ............................................................... 259
F.1 Ionization Techniques.................................................................................... 259F.1.1 Electrospray Ionization (ESI) ......................................................... 259F.1.2 Atmospheric Pressure Chemical Ionization (APCI) ....................... 260
F.2 Ion Optics ...................................................................................................... 260F.3 MS Operating Modes .................................................................................... 261F.4 MS/MS Operating Modes ............................................................................. 262
F.4.1 Daughter (Product) Ion Mode ......................................................... 262F.4.2 Parent (Precursor) Ion Mode .......................................................... 264F.4.3 Multiple Reaction Monitoring (MRM) Mode ................................ 265F.4.4 Constant Neutral Loss Mode .......................................................... 266F.4.5 Source and Collision Cell T-Wave Devices .................................... 267
Appendix G Materials of Construction and Compliant Solvents .................................. 269
G.1 Items Exposed to Solvent .............................................................................. 269G.2 Common Ingredients Used to Prepare Mobile Phases .................................. 270
Index ........................................................................................................................... 271
xxvi Table of Contents
Chapter 1Instrument Description
1.1 Overview
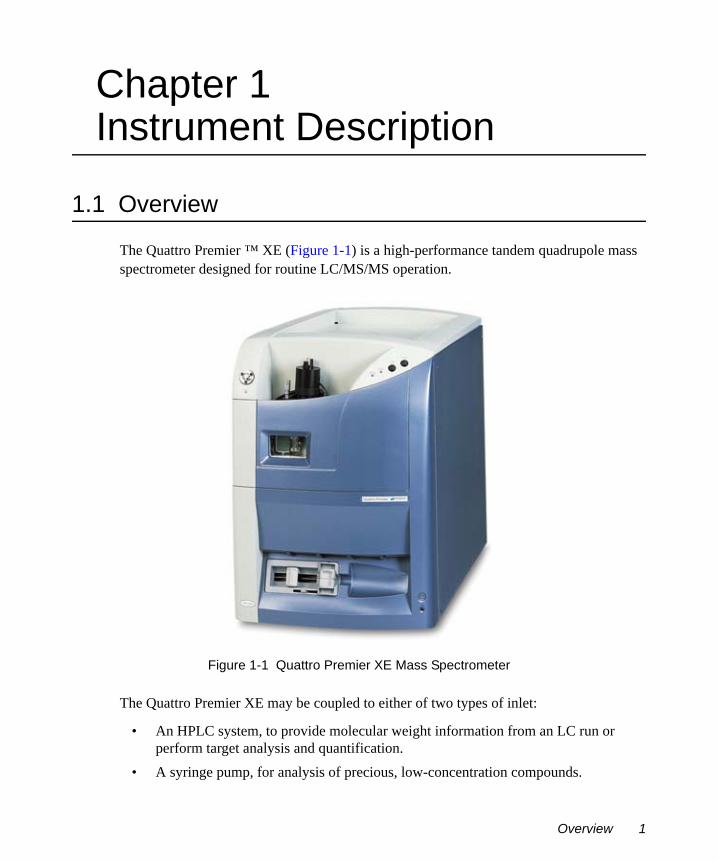
The Quattro Premier ™ XE (Figure 1-1) is a high-performance tandem quadrupole mass spectrometer designed for routine LC/MS/MS operation.
Figure 1-1 Quattro Premier XE Mass Spectrometer
The Quattro Premier XE may be coupled to either of two types of inlet:
• An HPLC system, to provide molecular weight information from an LC run or perform target analysis and quantification.
• A syringe pump, for analysis of precious, low-concentration compounds.
Overview 1

The sample is ionized at atmospheric pressure in the source. The ions enter the vacuum system through a sampling cone, then pass through the source travelling-wave (T-Wave™) ion guide into the first quadrupole, where they are filtered according to their mass-to-charge ratio (m/z) (Figure 1-2). The mass-separated ions pass into the T-Wave collision cell where they either undergo collision-induced decomposition (CID) or pass to the second quadrupole. Any fragment ions are then mass-analyzed by the second quadrupole. The transmitted ions are detected by a conversion dynode, phosphor, and photomultiplier detection system. The output signal is then amplified, digitized, and passed to the control system.
Figure 1-2 Quattro Premier XE Schematic
2 Instrument Description
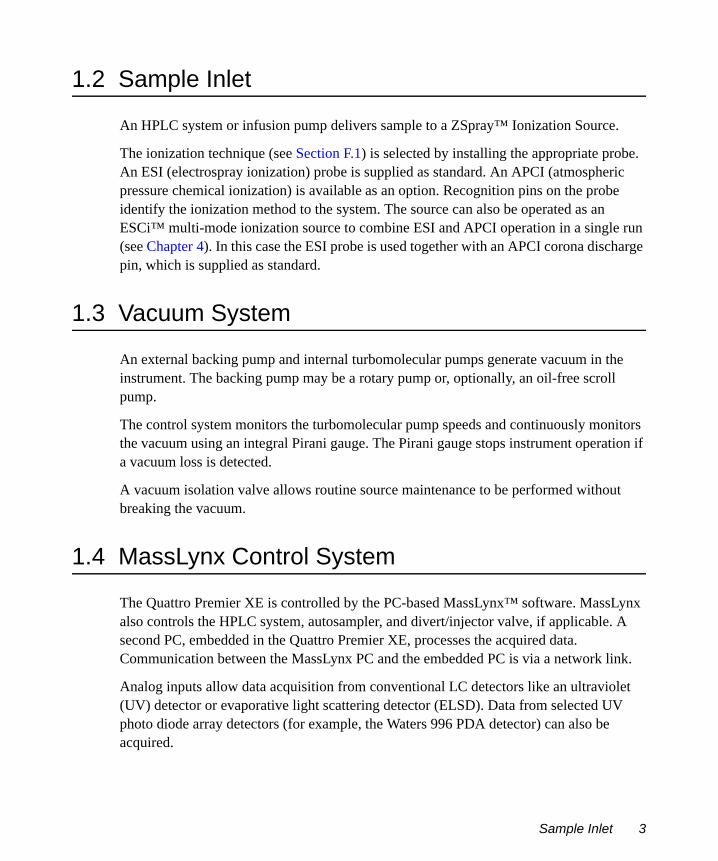
1.2 Sample Inlet
An HPLC system or infusion pump delivers sample to a ZSpray™ Ionization Source.
The ionization technique (see Section F.1) is selected by installing the appropriate probe. An ESI (electrospray ionization) probe is supplied as standard. An APCI (atmospheric pressure chemical ionization) is available as an option. Recognition pins on the probe identify the ionization method to the system. The source can also be operated as an ESCi™ multi-mode ionization source to combine ESI and APCI operation in a single run (see Chapter 4). In this case the ESI probe is used together with an APCI corona discharge pin, which is supplied as standard.
1.3 Vacuum System
An external backing pump and internal turbomolecular pumps generate vacuum in the instrument. The backing pump may be a rotary pump or, optionally, an oil-free scroll pump.
The control system monitors the turbomolecular pump speeds and continuously monitors the vacuum using an integral Pirani gauge. The Pirani gauge stops instrument operation if a vacuum loss is detected.
A vacuum isolation valve allows routine source maintenance to be performed without breaking the vacuum.
1.4 MassLynx Control System
The Quattro Premier XE is controlled by the PC-based MassLynx™ software. MassLynx also controls the HPLC system, autosampler, and divert/injector valve, if applicable. A second PC, embedded in the Quattro Premier XE, processes the acquired data. Communication between the MassLynx PC and the embedded PC is via a network link.
Analog inputs allow data acquisition from conventional LC detectors like an ultraviolet (UV) detector or evaporative light scattering detector (ELSD). Data from selected UV photo diode array detectors (for example, the Waters 996 PDA detector) can also be acquired.
Sample Inlet 3
The MassLynx software allows the following processes:
• Configuring the Quattro Premier XE.• Creating inlet and MS methods that define operating parameters for a run.• Tuning and calibrating the Quattro Premier XE.• Running samples.• Monitoring the run.• Acquiring data.
See the MassLynx User’s Guide and MassLynx Help for more information on installing and using the MassLynx software.
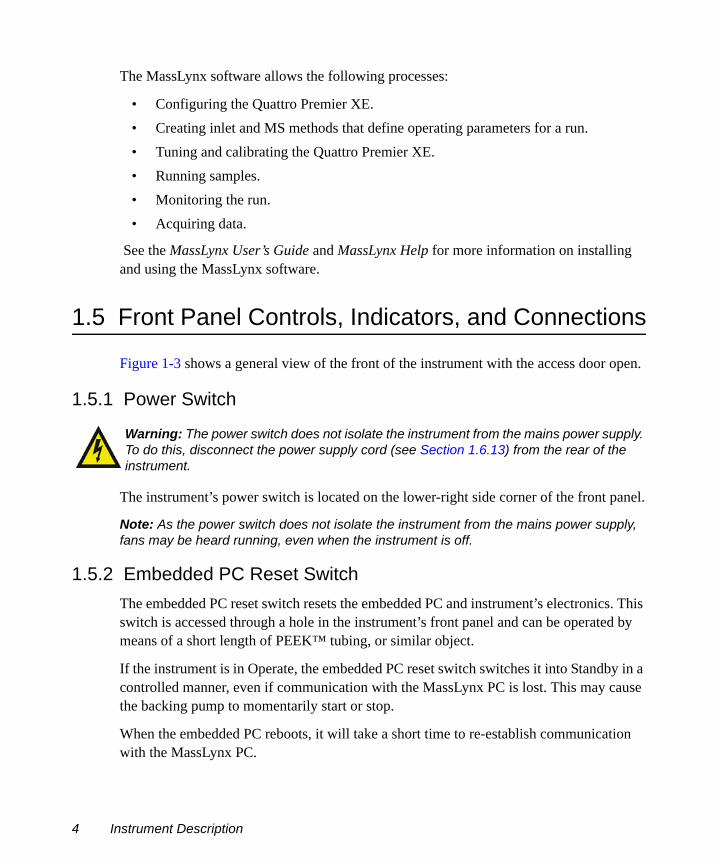
1.5 Front Panel Controls, Indicators, and Connections
Figure 1-3 shows a general view of the front of the instrument with the access door open.
1.5.1 Power Switch
The instrument’s power switch is located on the lower-right side corner of the front panel.
Note: As the power switch does not isolate the instrument from the mains power supply, fans may be heard running, even when the instrument is off.
1.5.2 Embedded PC Reset SwitchThe embedded PC reset switch resets the embedded PC and instrument’s electronics. This switch is accessed through a hole in the instrument’s front panel and can be operated by means of a short length of PEEK™ tubing, or similar object.
If the instrument is in Operate, the embedded PC reset switch switches it into Standby in a controlled manner, even if communication with the MassLynx PC is lost. This may cause the backing pump to momentarily start or stop.
When the embedded PC reboots, it will take a short time to re-establish communication with the MassLynx PC.
Warning: The power switch does not isolate the instrument from the mains power supply. To do this, disconnect the power supply cord (see Section 1.6.13) from the rear of the instrument.
4 Instrument Description

Figure 1-3 Front View with the Access Door Open
After the switch is operated, the high voltages will be switched off and the turbomolecular pumps will gradually slow down.
If the reset switch is operated when the MassLynx PC is offline, and the turbomolecular pump speed falls below 50% of full speed, the vent solenoid will open and admit air into the analyzer. The backing pump will be switched off a few seconds later.
If the instrument is vented fully, it must be evacuated again by selecting Options > Pump in the MassLynx Tune window (see Appendix C).
Vernier Probe Adjuster Probe Nebulization Adjuster Syringe Capillary Port
Divert/InjectionValve
Waste Port
Source EnclosureDoor Securing Clip
Source Enclosure
Syringe Pump
Controls and Indicators
Syringe Capillary Port
Power Switch
Embedded PC Reset Switch
Front Panel Controls, Indicators, and Connections 5

If the turbomolecular pump speed is above 50% of full speed when the embedded PC has booted-up, the embedded PC cancels the vent sequence, and the instrument evacuates again.
Note: On certain early instruments, the embedded PC will not cancel the vent sequence after it has booted-up. You must select Options > Pump on the Tune window to stop the instrument being vented.
1.5.3 Cone Gas, Desolvation Gas, and Nebulizer Gas ConnectionsThe PTFE gas lines for the probe desolvation gas and nebulizer gas are connected to the front of the instrument by push-in fittings (Figure 1-4). The connection for the cone gas is inside the source; it also uses PTFE tubing.
Figure 1-4 Front Panel Connections, Controls, and Indicators
Inject Switch
Load Switch
Operate LED
Vacuum LED
Probe Connection
APPI Connection
MUX Connection
Desolvation Gas Connection
Nebulizer Gas Connection
HV Connection
6 Instrument Description
1.5.4 Electrical ConnectionsThe electrical connection for the ESI desolvation heater or APCI probe heater is via the Probe multi-way connector.
The high voltage connection for the ESI probe is via the front panel HV connection.
The APPI connection is used by the optional Combined APPI and APCI Source (see the Waters Micromass Quattro Premier XE Combined APPI and APCI Source Operator’s Guide for details).
The MUX connection is used by the optional MUX-technology™ Interface (see the Waters Micromass Quattro Premier XE MUX-technology Interface Operator’s Guide for details).
The high voltage connection for the corona discharge pin is inside the source.
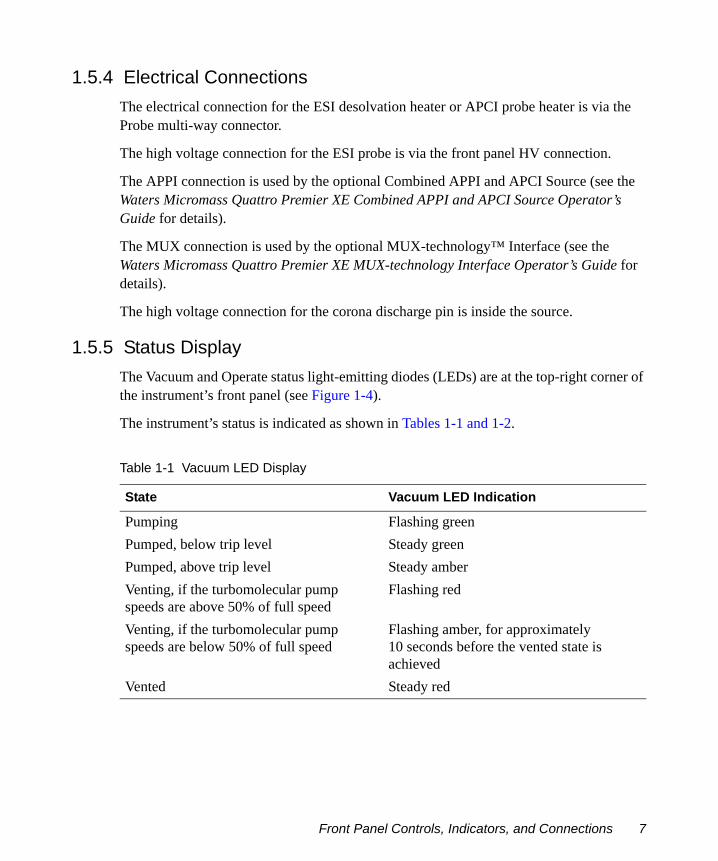
1.5.5 Status DisplayThe Vacuum and Operate status light-emitting diodes (LEDs) are at the top-right corner of the instrument’s front panel (see Figure 1-4).
The instrument’s status is indicated as shown in Tables 1-1 and 1-2.
Table 1-1 Vacuum LED Display
State Vacuum LED Indication
Pumping Flashing greenPumped, below trip level Steady greenPumped, above trip level Steady amberVenting, if the turbomolecular pump speeds are above 50% of full speed
Flashing red
Venting, if the turbomolecular pump speeds are below 50% of full speed
Flashing amber, for approximately 10 seconds before the vented state is achieved
Vented Steady red
Front Panel Controls, Indicators, and Connections 7
Note: Any combination of LED indications not covered by Tables 1-1 and 1-2 indicates an instrument fault. Contact Waters for advice (see Section 8.6).
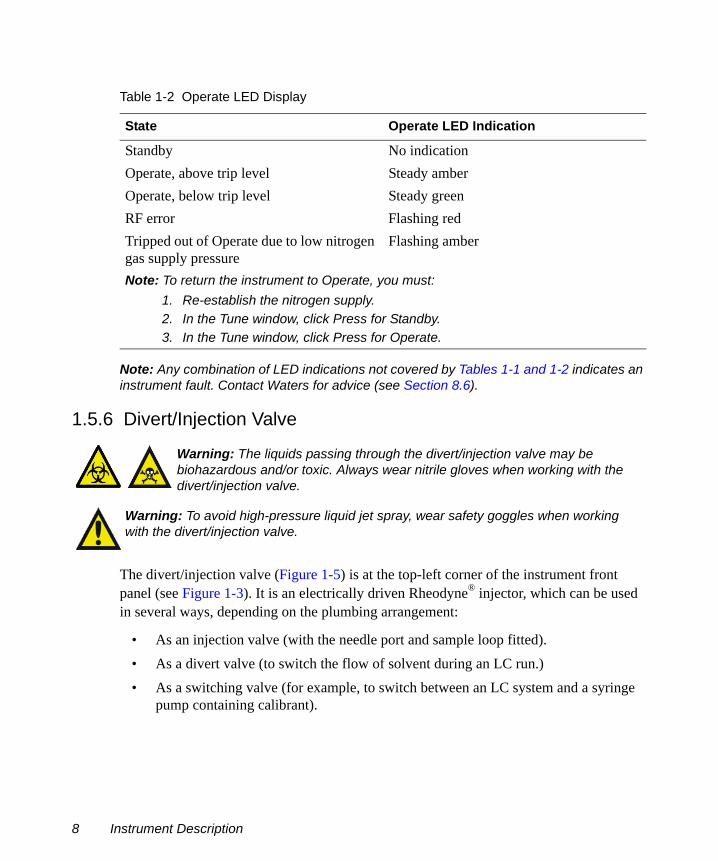
1.5.6 Divert/Injection Valve
The divert/injection valve (Figure 1-5) is at the top-left corner of the instrument front panel (see Figure 1-3). It is an electrically driven Rheodyne® injector, which can be used in several ways, depending on the plumbing arrangement:
• As an injection valve (with the needle port and sample loop fitted).• As a divert valve (to switch the flow of solvent during an LC run.)• As a switching valve (for example, to switch between an LC system and a syringe
pump containing calibrant).
Table 1-2 Operate LED Display
State Operate LED Indication
Standby No indicationOperate, above trip level Steady amberOperate, below trip level Steady greenRF error Flashing redTripped out of Operate due to low nitrogen gas supply pressure
Flashing amber
Note: To return the instrument to Operate, you must:1. Re-establish the nitrogen supply.2. In the Tune window, click Press for Standby.3. In the Tune window, click Press for Operate.
Warning: The liquids passing through the divert/injection valve may be biohazardous and/or toxic. Always wear nitrile gloves when working with the divert/injection valve.
Warning: To avoid high-pressure liquid jet spray, wear safety goggles when working with the divert/injection valve.
8 Instrument Description
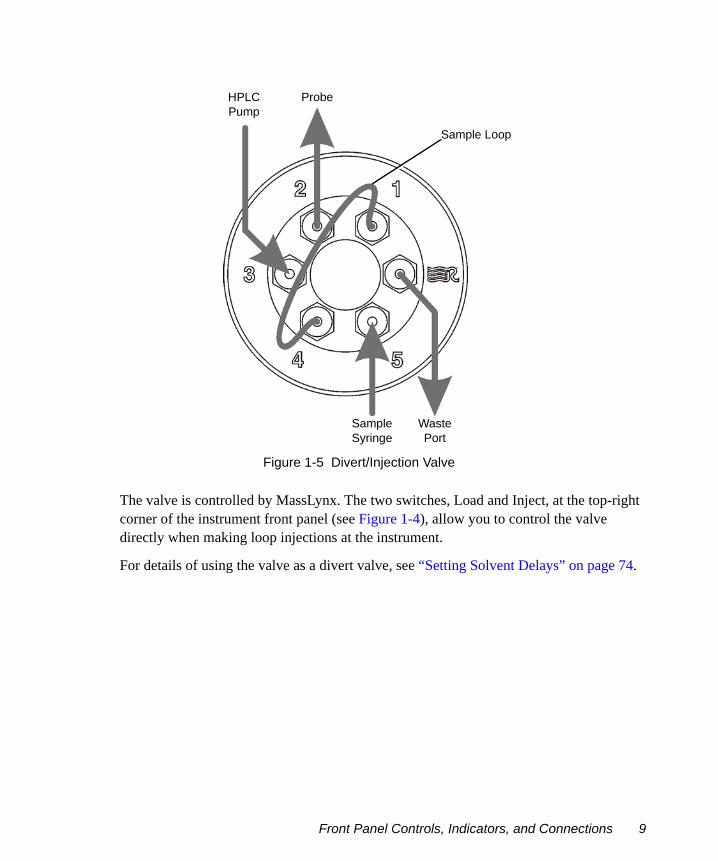
Figure 1-5 Divert/Injection Valve
The valve is controlled by MassLynx. The two switches, Load and Inject, at the top-right corner of the instrument front panel (see Figure 1-4), allow you to control the valve directly when making loop injections at the instrument.
For details of using the valve as a divert valve, see “Setting Solvent Delays” on page 74.
HPLC Pump
Probe
Sample Loop
Sample Syringe
Waste Port
Front Panel Controls, Indicators, and Connections 9

1.6 Rear Panel Connections
The rear panel connections are shown in Figure 1-6.
Figure 1-6 Rear Panel Connections
1.6.1 Analog Channels
Eight Analogue Channels inputs (CH1 to CH8) are available for acquiring simultaneous data such as a UV detector output (see “Acquiring Analog Data” on page 75 for further details).
Warning: To avoid electric shock and damage to the instrument, do not apply more than 16 V to any of the Analogue Channels connections.
Collision Gas Input Connection
Vacuum Connections to Backing Pump
Mains Power FusesMains Power Connection
10 Instrument Description

Note: Although eight inputs are available, the MassLynx software can only control four of the channels.
Signals up to 2.5 V may be input. Analog data is processed by a 20-bit analog-to-digital converter. The maximum (overload) input is ±16 V.
If the input cable is a two-wire assembly, the negative pole of each channel may need to be grounded (earthed).
1.6.2 Contact Closure
Two types of contact closure are available:
• In – Four inputs, Events I/P CC1 to CC4, allow external devices to start acquisition. Each event input signal can be transistor-transistor logic or contact closure. The maximum voltage is 5 V.
• Out – Two outputs, Events O/P 1 and 2, allow the mass spectrometer to trigger an external event. The maximum rating is 25 V, 0.5 A.
1.6.3 Gas Fail
If the nitrogen supply pressure falls below 4 bar (58 psi), or the instrument’s power supply fails, a contact closure signal is generated. This signal can be used to stop solvent flowing into the source by connecting this Gas Fail connection to the Stop Flow of the HPLC system. If the nitrogen supply fails, any solvent from the LC will be automatically drained from the source enclosure. The maximum rating is 25 V, 0.5 A.
Warning: To avoid electric shock and damage to the instrument, do not apply more than 5 V to any of the Events I/P connections.
Warning: To avoid electric shock and damage to the instrument, do not apply more than 25 V to either of the Events O/P connections.
Warning: To avoid electric shock and damage to the instrument, do not apply more than 25 V to the Gas Fail connection.
Rear Panel Connections 11
1.6.4 CE Int (Capillary Electrophoresis Interlock)
This connector interfaces with a capillary electrophoresis power supply so that the instrument is safely interlocked against high voltages. The maximum rating is 25 V, 0.5 A.
1.6.5 Comm For EPCThis RJ45 connector links the instrument’s embedded PC to the MassLynx PC using the network cable supplied.
1.6.6 Com1This connection can be used by a Waters field service engineer to communicate with the embedded PC.
1.6.7 Aux O/P
This connection is used for connecting to auxiliary equipment.
1.6.8 Pump RelayThis connects to a backing pump interlock box, which allows the instrument to remotely control the backing pump (Figure 1-7).
Note: If the optional scroll pump is used, it may be supplied with a backing pump interlock box, or, alternatively, it may be supplied with a cable that directly connects the Quattro Premier XE to the scroll pump (Figure 1-8); this allows the Quattro Premier XE to control the scroll pump directly.
The scroll pump’s on/off switch must be set to “on” if it is connected to a backing pump interlock box.
The scroll pump’s on/off switch must be set to “off” if it is directly connected to, and controlled by, the Quattro Premier XE.
Warning: To avoid electric shock and damage to the instrument, do not apply more than 25 V to the CE Int connection.
Caution: The Aux O/P connection must not be used, unless permitted by Waters.
12 Instrument Description
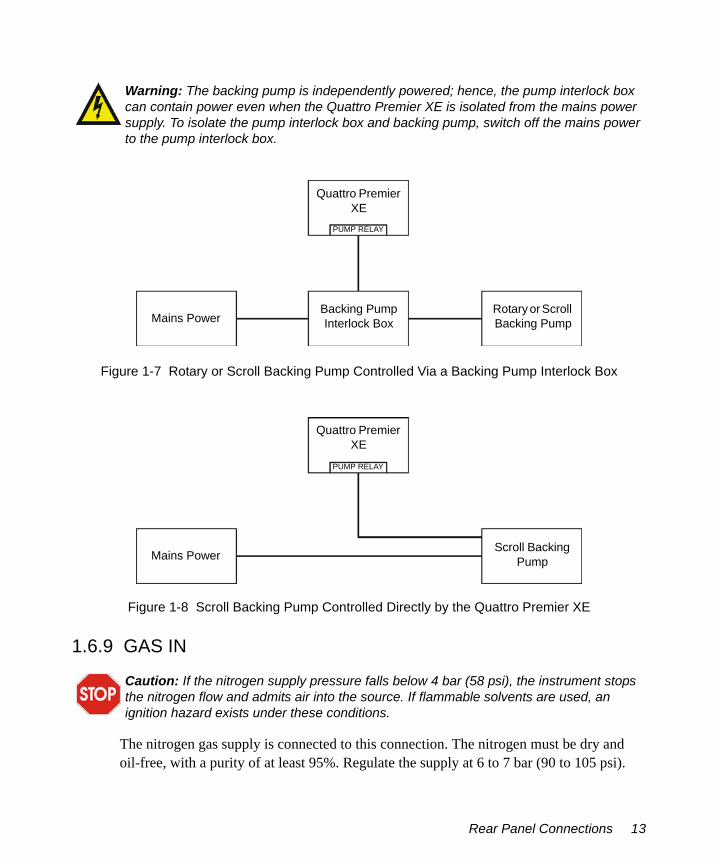
Figure 1-7 Rotary or Scroll Backing Pump Controlled Via a Backing Pump Interlock Box
Figure 1-8 Scroll Backing Pump Controlled Directly by the Quattro Premier XE
1.6.9 GAS IN
The nitrogen gas supply is connected to this connection. The nitrogen must be dry and oil-free, with a purity of at least 95%. Regulate the supply at 6 to 7 bar (90 to 105 psi).
Warning: The backing pump is independently powered; hence, the pump interlock box can contain power even when the Quattro Premier XE is isolated from the mains power supply. To isolate the pump interlock box and backing pump, switch off the mains power to the pump interlock box.
Caution: If the nitrogen supply pressure falls below 4 bar (58 psi), the instrument stops the nitrogen flow and admits air into the source. If flammable solvents are used, an ignition hazard exists under these conditions.
Quattro Premier XE
PUMP RELAY
Backing Pump Interlock BoxMains Power
Rotary or Scroll Backing Pump
Quattro Premier XE
PUMP RELAY
Scroll Backing PumpMains Power
Rear Panel Connections 13

1.6.10 Collision Gas InThe collision gas supply is connected to this connection. The collision gas is argon; it must be dry and of high purity (99.9%). Regulate the supply at 0.5 bar (7 psi).
1.6.11 Exhaust
This is the nitrogen gas exhaust connection, which is connected to a nitrogen exhaust waste bottle (see Figure 1-9), which, in turn, is connected to the laboratory exhaust system. The nitrogen exhaust waste bottle must be located in an area where it is visible, so that you can monitor and empty it, and then perform a leak test on it, at regular intervals, as described in Section 7.4.
Figure 1-9 Nitrogen Exhaust Waste Bottle
Warning: LC solvents and analytes may be carried in the nitrogen exhaust, which must be vented via the nitrogen exhaust waste bottle and laboratory exhaust system, which must provide a minimum vacuum of 2 millibar below atmospheric pressure (negative pressure).
Warning: To avoid the build-up of hazardous gases, do not place the nitrogen exhaust waste bottle in an enclosed cabinet.
To laboratory exhaust portFrom instrument
exhaust connection
14 Instrument Description

1.6.12 Waste
Waste liquid from the top of the instrument, the source enclosure, and the divert/injection valve is drained from the instrument via this connection. The liquid passes into a drain bottle. This must be located in an area where it is visible, so that you can monitor and empty it at regular intervals.
1.6.13 Mains Power ConnectionThis is the mains power connection for the instrument.
1.6.14 Mains Power Fuses
Two mains power fuses are located adjacent to the mains power connection. The fuses are rated at T10 AH 250 V.
If a one fuse fails, replace both fuses.
1.6.15 Vacuum ConnectionsTwo vacuum connections are provided for connection to the backing pump.
1.7 Top Panel
The instrument’s top panel may be used for storing small items, for example, small solvent bottles.
Warning: The waste liquid from the source enclosure and the divert/injection valve comprises LC solvents and analytes. Always wear nitrile gloves while handling the drain bottle, and ensure that the waste liquid is correctly disposed of according to local environmental regulations.
Warning: Parts of the instrument may be electrically live even when a mains fuse has failed. To avoid electrical shock, isolate the instrument from the mains supply before replacing the mains fuses.
Caution: To avoid accidental spillage damaging the instrument, the instrument’s top panel must not be used for storing large volume solvent reservoirs.
Top Panel 15
1.8 Mass Flow Controllers
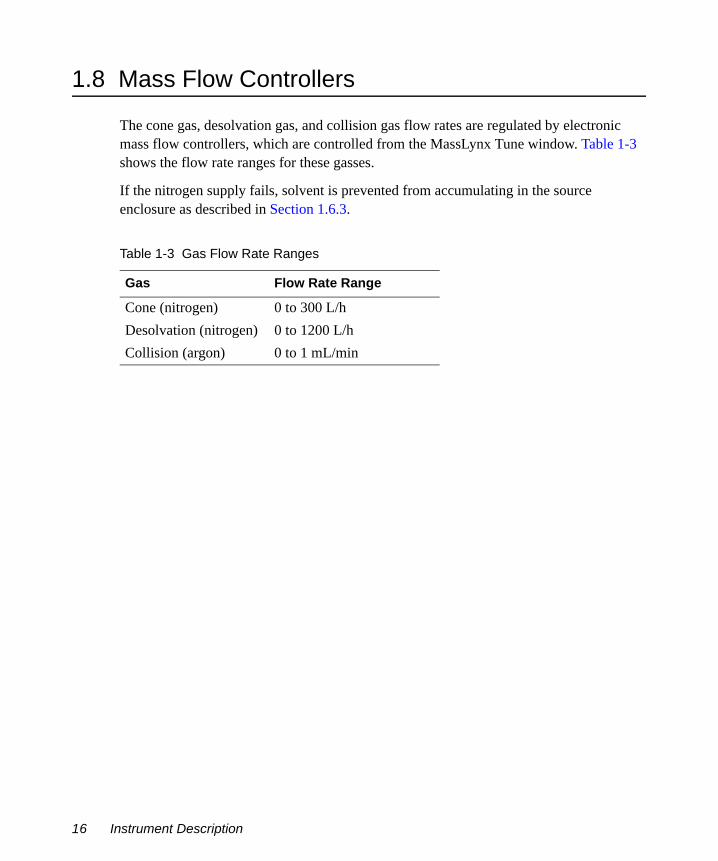
The cone gas, desolvation gas, and collision gas flow rates are regulated by electronic mass flow controllers, which are controlled from the MassLynx Tune window. Table 1-3 shows the flow rate ranges for these gasses.
If the nitrogen supply fails, solvent is prevented from accumulating in the source enclosure as described in Section 1.6.3.
Table 1-3 Gas Flow Rate Ranges
Gas Flow Rate Range
Cone (nitrogen) 0 to 300 L/hDesolvation (nitrogen) 0 to 1200 L/hCollision (argon) 0 to 1 mL/min
16 Instrument Description
Chapter 2Setting-Up and Tuning for ESI
Note: For full details of the Tune window, see Appendix C.
2.1 Setting-Up
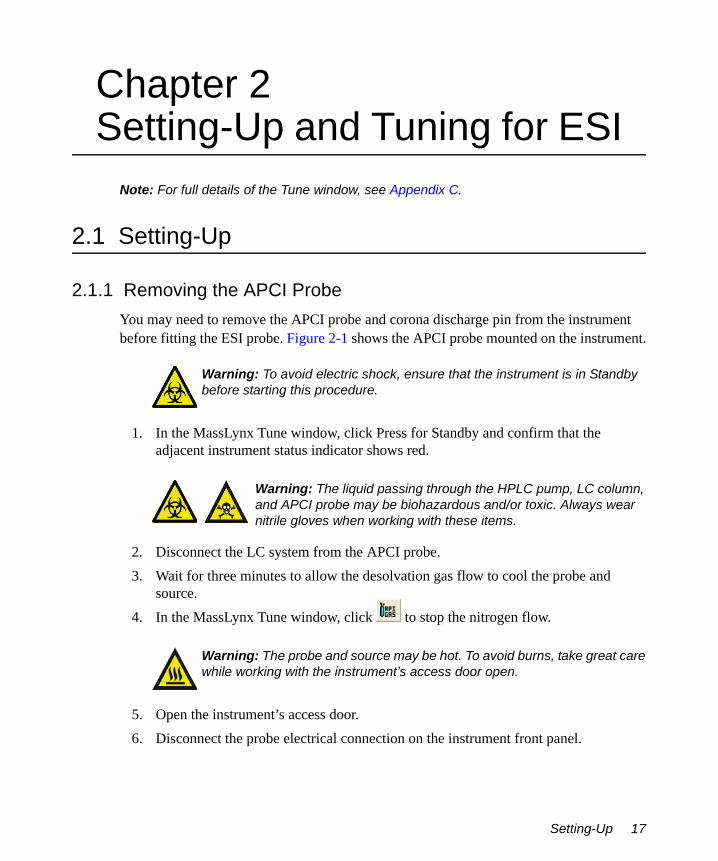
2.1.1 Removing the APCI ProbeYou may need to remove the APCI probe and corona discharge pin from the instrument before fitting the ESI probe. Figure 2-1 shows the APCI probe mounted on the instrument.
1. In the MassLynx Tune window, click Press for Standby and confirm that the adjacent instrument status indicator shows red.
2. Disconnect the LC system from the APCI probe.3. Wait for three minutes to allow the desolvation gas flow to cool the probe and
source.4. In the MassLynx Tune window, click to stop the nitrogen flow.
5. Open the instrument’s access door.6. Disconnect the probe electrical connection on the instrument front panel.
Warning: To avoid electric shock, ensure that the instrument is in Standby before starting this procedure.
Warning: The liquid passing through the HPLC pump, LC column, and APCI probe may be biohazardous and/or toxic. Always wear nitrile gloves when working with these items.
Warning: The probe and source may be hot. To avoid burns, take great care while working with the instrument’s access door open.
Setting-Up 17

Figure 2-1 APCI Probe Mounted on the Source Enclosure
7. Disconnect the PTFE tubes at the nebulizer and desolvation gas connections on the front panel.
8. Undo the two thumbscrews securing the probe to the probe adjustment flange.9. Carefully remove the probe from the probe adjustment flange.
Thumbscrew APCI ProbeNebulizer Gas Connection
Desolvation Gas Connection
Probe Adjustment Flange
Probe Electrical ConnectionHV Electrical Connection (not connected when using the APCI Probe)
18 Setting-Up and Tuning for ESI

2.1.2 Removing the APCI Corona Discharge Pin
1. In the MassLynx Tune window, click Press for Standby and confirm that the adjacent instrument status indicator shows red.
2. Unfasten the source enclosure door’s securing clips and open the door.3. Use needle-nose pliers to remove the corona discharge pin from its mounting
contact. Store the corona discharge pin in a safe location.
4. Use the needle-nose pliers to fit the blanking plug to the corona discharge pin mounting contact.
Warning: To avoid electric shock, ensure that the instrument is in Standby when installing the corona discharge pin.
Corona Discharge Pin
Corona Discharge Pin Mounting Contact
Corona Discharge Pin Mounting Contact Blanking Plug
Setting-Up 19
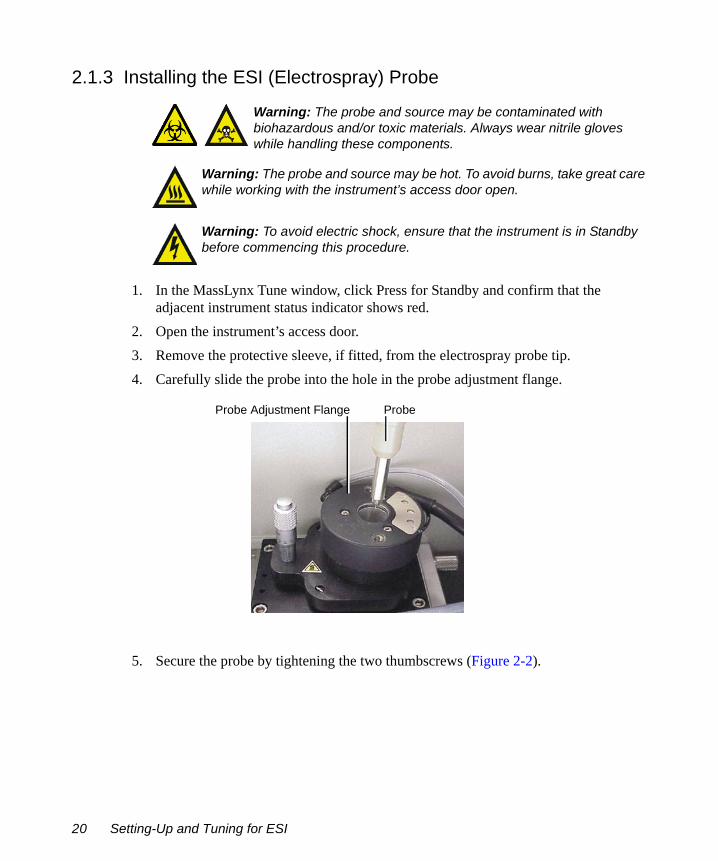
2.1.3 Installing the ESI (Electrospray) Probe
1. In the MassLynx Tune window, click Press for Standby and confirm that the adjacent instrument status indicator shows red.
2. Open the instrument’s access door.3. Remove the protective sleeve, if fitted, from the electrospray probe tip.4. Carefully slide the probe into the hole in the probe adjustment flange.
5. Secure the probe by tightening the two thumbscrews (Figure 2-2).
Warning: The probe and source may be contaminated with biohazardous and/or toxic materials. Always wear nitrile gloves while handling these components.
Warning: The probe and source may be hot. To avoid burns, take great care while working with the instrument’s access door open.
Warning: To avoid electric shock, ensure that the instrument is in Standby before commencing this procedure.
ProbeProbe Adjustment Flange
20 Setting-Up and Tuning for ESI
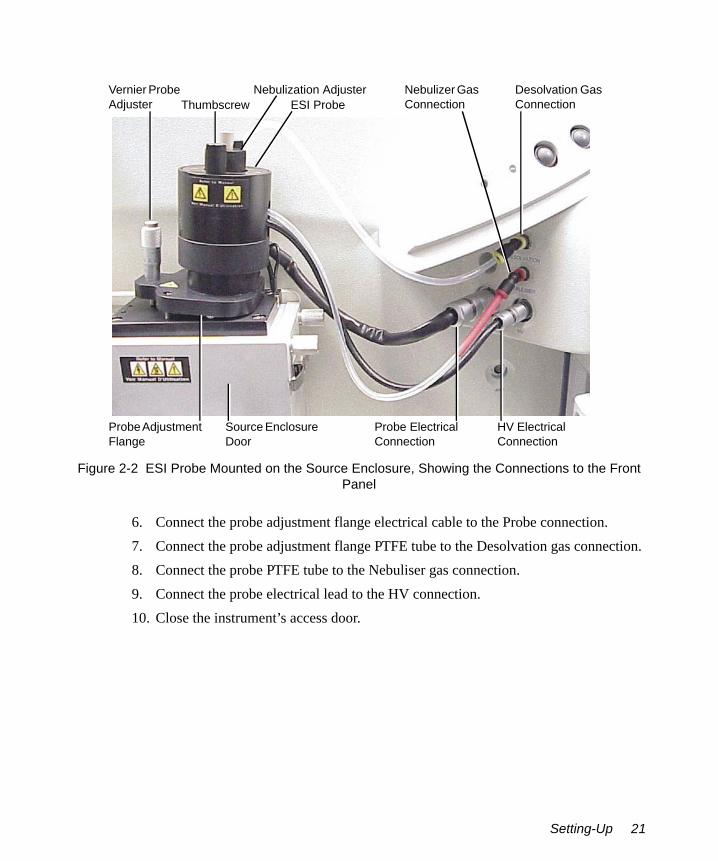
Figure 2-2 ESI Probe Mounted on the Source Enclosure, Showing the Connections to the Front Panel
6. Connect the probe adjustment flange electrical cable to the Probe connection.7. Connect the probe adjustment flange PTFE tube to the Desolvation gas connection.8. Connect the probe PTFE tube to the Nebuliser gas connection.9. Connect the probe electrical lead to the HV connection.10. Close the instrument’s access door.
Vernier Probe Adjuster Thumbscrew
Nebulization AdjusterESI Probe
Nebulizer Gas Connection
Desolvation Gas Connection
Probe Adjustment Flange
Source Enclosure Door
Probe Electrical Connection
HV Electrical Connection
Setting-Up 21
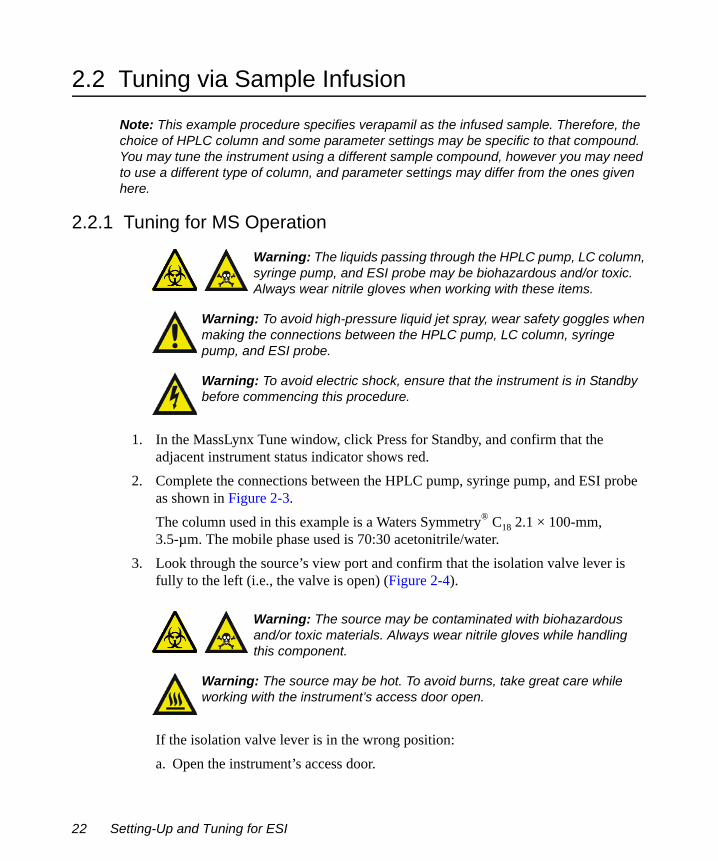
2.2 Tuning via Sample Infusion
Note: This example procedure specifies verapamil as the infused sample. Therefore, the choice of HPLC column and some parameter settings may be specific to that compound. You may tune the instrument using a different sample compound, however you may need to use a different type of column, and parameter settings may differ from the ones given here.
2.2.1 Tuning for MS Operation
1. In the MassLynx Tune window, click Press for Standby, and confirm that the adjacent instrument status indicator shows red.
2. Complete the connections between the HPLC pump, syringe pump, and ESI probe as shown in Figure 2-3.The column used in this example is a Waters Symmetry® C18 2.1 × 100-mm, 3.5-µm. The mobile phase used is 70:30 acetonitrile/water.
3. Look through the source’s view port and confirm that the isolation valve lever is fully to the left (i.e., the valve is open) (Figure 2-4).
If the isolation valve lever is in the wrong position:a. Open the instrument’s access door.
Warning: The liquids passing through the HPLC pump, LC column, syringe pump, and ESI probe may be biohazardous and/or toxic. Always wear nitrile gloves when working with these items.
Warning: To avoid high-pressure liquid jet spray, wear safety goggles when making the connections between the HPLC pump, LC column, syringe pump, and ESI probe.
Warning: To avoid electric shock, ensure that the instrument is in Standby before commencing this procedure.
Warning: The source may be contaminated with biohazardous and/or toxic materials. Always wear nitrile gloves while handling this component.
Warning: The source may be hot. To avoid burns, take great care while working with the instrument’s access door open.
22 Setting-Up and Tuning for ESI

Figure 2-3 Syringe and Column Connections to the ESI Probe
Figure 2-4 Isolation Valve in the Open Position (Source Enclosure Door Shown Open for Clarity)
Zero-Dead-Volume T-Piece
LC Column
ESI Probe
HPLC Pump
Syringe Pump
Column: Waters Symmetry C18 2.1 × 100-mm, 3.5-µmMobile Phase: 70:30 acetonitrile/waterFlow Rate: 300 µL/min
Isolation Valve Lever in Open Position
Tuning via Sample Infusion 23
b. Unfasten the source enclosure door’s securing clips, and open the door. c. Move the lever to the open position.d. Close the source enclosure door, and fasten the securing clips.e. Close the instrument’s access door.
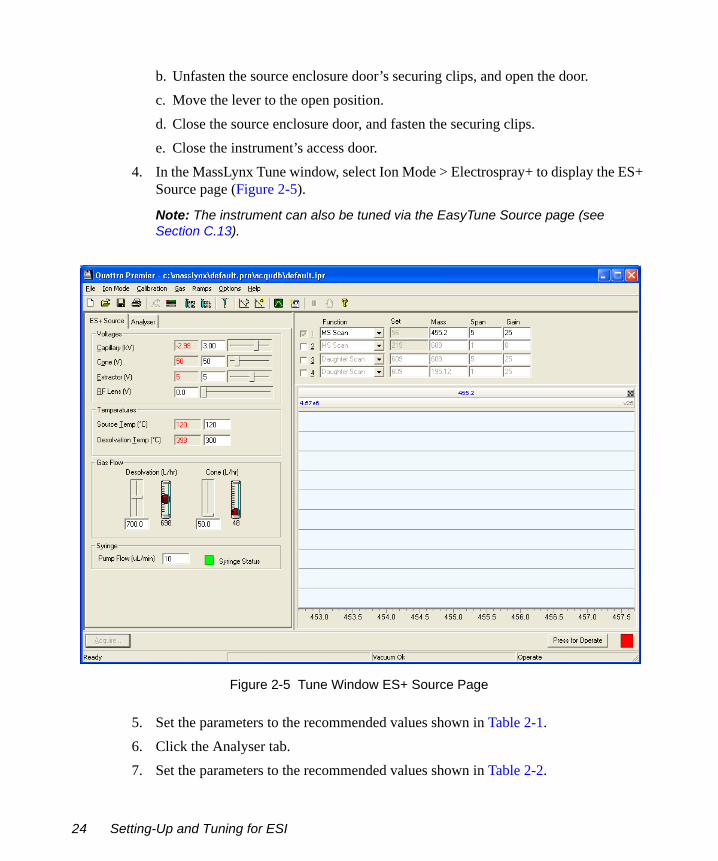
4. In the MassLynx Tune window, select Ion Mode > Electrospray+ to display the ES+ Source page (Figure 2-5).
Note: The instrument can also be tuned via the EasyTune Source page (see Section C.13).
Figure 2-5 Tune Window ES+ Source Page
5. Set the parameters to the recommended values shown in Table 2-1.6. Click the Analyser tab.7. Set the parameters to the recommended values shown in Table 2-2.
24 Setting-Up and Tuning for ESI

* The value stated for Multiplier is typical; in practice, you should use the value determined by the Waters Field Service Engineer during installation of the instrument.
Table 2-1 Recommended ES+ Source Page Parameter Values
Parameter Recommended Value
VoltagesCapillary (kV) 3.00Cone (V) 50Extractor (V) 5RF Lens (V) 0.0
TemperaturesSource Temp (°C) 120Desolvation Temp (°C) 300
Gas FlowDesolvation (L/hr) 700.0Cone (L/hr) 50.0
Table 2-2 Recommended Analyser Page Parameter Values
Parameter Recommended Value
AnalyserLM Resolution 1 15.0HM Resolution 1 15.0Ion Energy 1 0.5Entrance 50Collision 2Exit 50.0LM Resolution 2 15.0HM Resolution 2 15.0Ion Energy 2 3.0Multiplier* 550
Tuning via Sample Infusion 25
8. Click to start the nitrogen flow.9. On the ES+ Source page, observe the Desolvation and Cone gas flows; confirm they
are stabilized and correct.10. Click Press for Operate, and confirm that the adjacent instrument status indicator
shows green.11. Turn on the LC system at a flow rate of 300 µL/min, and confirm that its pressure is
stable.12. Allow 15 minutes for the LC column to equilibrate.13. Load the sample syringe with sample. In this example, verapamil (concentration
50 pg/µL, in 70:30 acetonitrile/water) is used.14. Select the correct syringe type using this procedure:
a. Select Options > Syringe Type to open the Syringe Selection dialog box.b. Choose the required syringe type from the drop-down list.
Note: If the syringe type is not listed, click Edit, and add the relevant details.
c. Click OK.15. On the ES+ Source page, set Syringe, Pump Flow (µL/min) to 10.
16. Click to start the syringe pump.17. In the Tune window, select the Function 1 box.18. Choose MS Scan from the adjacent drop-down list.19. Enter Mass 455.2, Span 5, and Gain 25.
Note: The above are recommended values and can vary from instrument to instrument.
20. Observe the verapamil peak at m/z 455.2 (M+H+) in the Tune window (see Figure 2-6).
21. Use the vernier probe adjuster, on the probe mounting flange (see Figure 2-2), to maximize the displayed peak intensity.
26 Setting-Up and Tuning for ESI
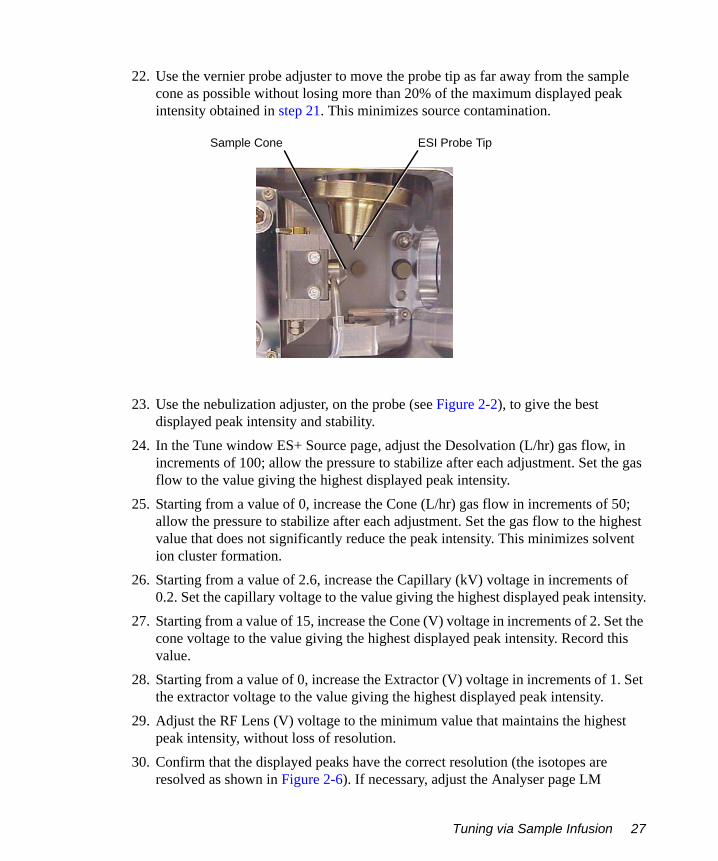
22. Use the vernier probe adjuster to move the probe tip as far away from the sample cone as possible without losing more than 20% of the maximum displayed peak intensity obtained in step 21. This minimizes source contamination.
23. Use the nebulization adjuster, on the probe (see Figure 2-2), to give the best displayed peak intensity and stability.
24. In the Tune window ES+ Source page, adjust the Desolvation (L/hr) gas flow, in increments of 100; allow the pressure to stabilize after each adjustment. Set the gas flow to the value giving the highest displayed peak intensity.
25. Starting from a value of 0, increase the Cone (L/hr) gas flow in increments of 50; allow the pressure to stabilize after each adjustment. Set the gas flow to the highest value that does not significantly reduce the peak intensity. This minimizes solvent ion cluster formation.
26. Starting from a value of 2.6, increase the Capillary (kV) voltage in increments of 0.2. Set the capillary voltage to the value giving the highest displayed peak intensity.
27. Starting from a value of 15, increase the Cone (V) voltage in increments of 2. Set the cone voltage to the value giving the highest displayed peak intensity. Record this value.
28. Starting from a value of 0, increase the Extractor (V) voltage in increments of 1. Set the extractor voltage to the value giving the highest displayed peak intensity.
29. Adjust the RF Lens (V) voltage to the minimum value that maintains the highest peak intensity, without loss of resolution.
30. Confirm that the displayed peaks have the correct resolution (the isotopes are resolved as shown in Figure 2-6). If necessary, adjust the Analyser page LM
Sample Cone ESI Probe Tip
Tuning via Sample Infusion 27
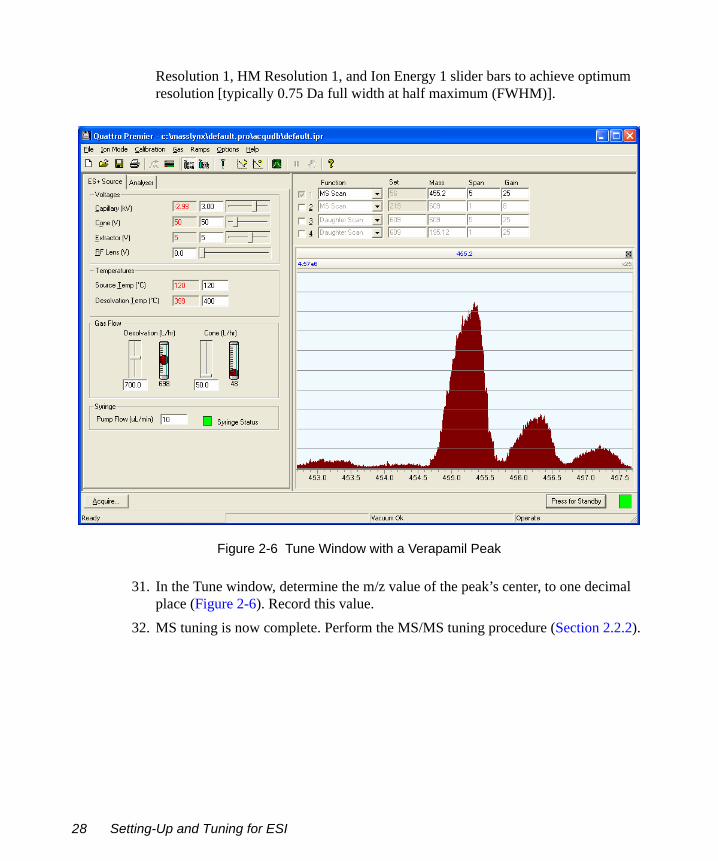
Resolution 1, HM Resolution 1, and Ion Energy 1 slider bars to achieve optimum resolution [typically 0.75 Da full width at half maximum (FWHM)].
Figure 2-6 Tune Window with a Verapamil Peak
31. In the Tune window, determine the m/z value of the peak’s center, to one decimal place (Figure 2-6). Record this value.
32. MS tuning is now complete. Perform the MS/MS tuning procedure (Section 2.2.2).
28 Setting-Up and Tuning for ESI

2.2.2 Tuning for MS/MS (Daughter Ion) Operation1. In the Tune window, select the Function 2 box. The Function 1 box may now be
cleared (Figure 2-7).
Figure 2-7 Tune Window with a Daughter Ion Peak
2. Select Daughter Scan from the adjacent drop-down list.3. Enter Set 455.2 (i.e. the verapamil peak), Mass 165.2 (daughter ion), Span 5, and
Gain 150.4. Set Entrance to 0, Collision to 30, and Exit to 1.0.5. On the Analyser page, set Ion Energy 2 to 1.0.
Note: Do not change the optimal Ion Energy 1 value obtained in Section 2.2.1.
6. Click to turn on the collision gas flow.
Tuning via Sample Infusion 29

7. On the Analyser page, set the Collision Gas Flow (mL/min) to 0.3. This sets the Collision Cell Pressure to approximately 3 to 4 × 10⁻³ mbar.
8. Observe the daughter ion peak, at m/z 165.2, displayed in the Tune window.9. If necessary, adjust the LM Resolution 2, HM Resolution 2, and Ion Energy 2 slider
bars to achieve optimum resolution (typically <1 Da FWHM).10. Starting at a value of 10, increase Collision (i.e., collision energy) in increments of
2. Set Collision to the value giving the highest displayed peak intensity. Record this value.
11. Optimize the Collision Gas Flow (mL/min) using increments of 0.05. Allow the Collision Cell Pressure readback to stabilize after each adjustment. Set the gas flow to the value giving the highest displayed peak intensity.
12. In the Tune window, determine the m/z value of the daughter ion peak’s center to one decimal place (see Figure 2-7). Record this value.
13. MS/MS tuning is now complete. Create a Multiple Reaction Monitoring (MRM) MS method file (see Section 2.2.3).
2.2.3 Creating the MRM MS Method FileAn MRM MS method file, containing the information obtained during the instrument tuning process, must now be created.
1. In the MassLynx window, click the MS Method icon to open the MS Method Editor (Figure 2-8).
Figure 2-8 MS Method Editor
30 Setting-Up and Tuning for ESI
2. Click to delete the current entry from the MS Method Editor.
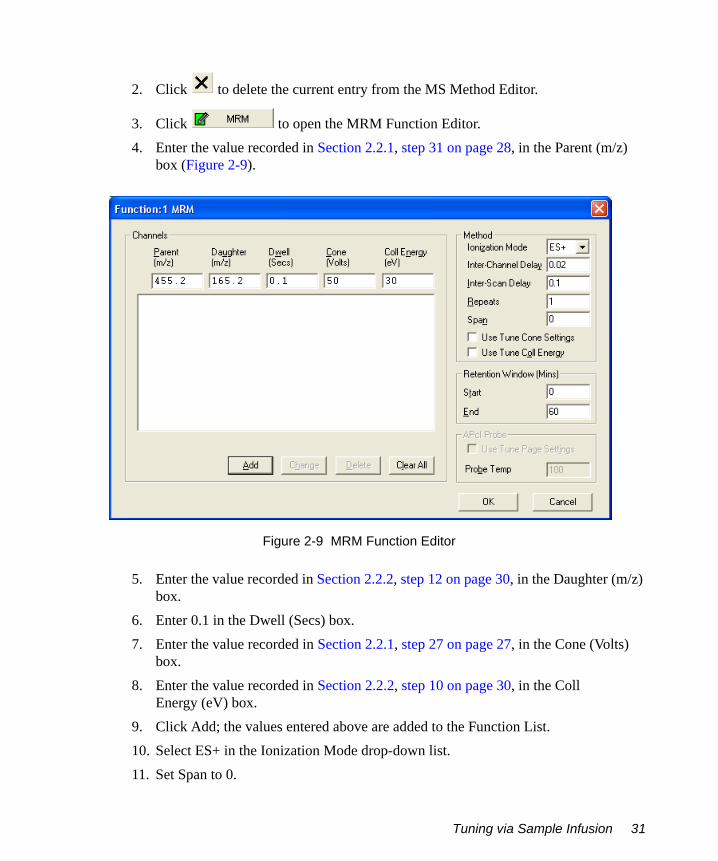
3. Click to open the MRM Function Editor.4. Enter the value recorded in Section 2.2.1, step 31 on page 28, in the Parent (m/z)
box (Figure 2-9).
Figure 2-9 MRM Function Editor
5. Enter the value recorded in Section 2.2.2, step 12 on page 30, in the Daughter (m/z) box.
6. Enter 0.1 in the Dwell (Secs) box.7. Enter the value recorded in Section 2.2.1, step 27 on page 27, in the Cone (Volts)
box.
8. Enter the value recorded in Section 2.2.2, step 10 on page 30, in the Coll Energy (eV) box.
9. Click Add; the values entered above are added to the Function List.10. Select ES+ in the Ionization Mode drop-down list.11. Set Span to 0.
Tuning via Sample Infusion 31
12. Enter a correct LC run time in the Retention Window (Mins), End text box.13. Click OK. The MRM Function Editor is closed and the values are included in the
MS Method Editor.
14. Click to open the Save As dialog box.15. Save the experiment file as verapamil_1.exp.
The instrument is now ready for data acquisition in ESI mode (see Section 2.3).
2.3 Preparing the Instrument for Data Acquisition
2.3.1 Reconfiguring the Connection to the Probe
1. Click to stop the syringe pump.2. Reconfigure the connections to the ESI probe, so that the LC column is connected
directly to the probe; i.e., remove the zero-dead-volume T-piece and syringe pump connection (Figure 2-10).
3. In the Tune window, confirm that the daughter ion peak of interest has disappeared.If the peak does not disappear, consider two possible causes:• You tuned the instrument using a large background ion peak. Repeat the tuning
procedure using a more suitable sample.• The source is contaminated with the sample compound. This may occur if the
tuning standard sample concentration is too high. Clean the source (see Section 7.9), then repeat the tuning procedures, using a suitable sample concentration.
Warning: The liquid passing through the HPLC pump, LC column, and ESI probe may be biohazardous and/or toxic. Always wear nitrile gloves when working with these items.
Warning: To avoid high-pressure liquid jet spray, wear safety goggles when making the connections between the HPLC pump, LC column, and ESI probe.
Warning: To avoid electric shock, ensure that the instrument is in Standby before commencing this procedure.
32 Setting-Up and Tuning for ESI

Figure 2-10 Column Connection to the ESI Probe
2.3.2 Configuring the Inlet for LC Operation1. Click the MassLynx window Instrument shortcut bar Inlet Method icon to open the
Inlet Method dialog box.2. Select Tools > Instrument Configuration to open the Inlet Configuration dialog box.3. Click Configure to open the Inlet Configuration Wizard.4. Click Next.5. Follow the on-screen instructions.6. When the Inlet Configuration Wizard has finished, click Finish, Finish, and then
close the Inlet Configuration dialog box.
2.3.3 Creating a Sample List and Starting Data AcquisitionNote: For comprehensive information on creating a MassLynx Sample List and starting data acquisition, see the MassLynx User’s Guide.
1. In the MassLynx window, insert the required number of samples in the Sample List.2. Enter the required file name(s) in the File Name column.3. Enter the required text in the File Text column.
LC Column
ESI Probe
HPLC Pump
Preparing the Instrument for Data Acquisition 33

4. In the MS File column, select verapamil_1.exp.5. Create a suitable inlet method file (see the MassLynx NT Inlet Control Guide).6. Enter the inlet method file name in the Sample List Inlet File column.7. Enter the bottle number(s) in the Bottle column.8. Enter the injection volume(s) in the Inject Volume column.9. Save the Sample List.10. To start data acquisition, click (see Chapter 5 for details).
2.3.4 Viewing and Printing the Tuning Parameters Associated with a Data File
The tuning parameters associated with a data file are stored with the file as part of the experimental record. You can view or print these tuning parameters from the MassLynx Data Browser dialog box. See the MassLynx User’s Guide for more information.
Note: The readbacks incorporated in the experimental record are for indication purposes only. They are not true (calibrated) records of the actual voltages that were on the instrument during data acquisition.
34 Setting-Up and Tuning for ESI
Chapter 3Setting-Up and Tuning for APCI
Note: For full details of the Tune window, see Appendix C.
3.1 Setting-Up
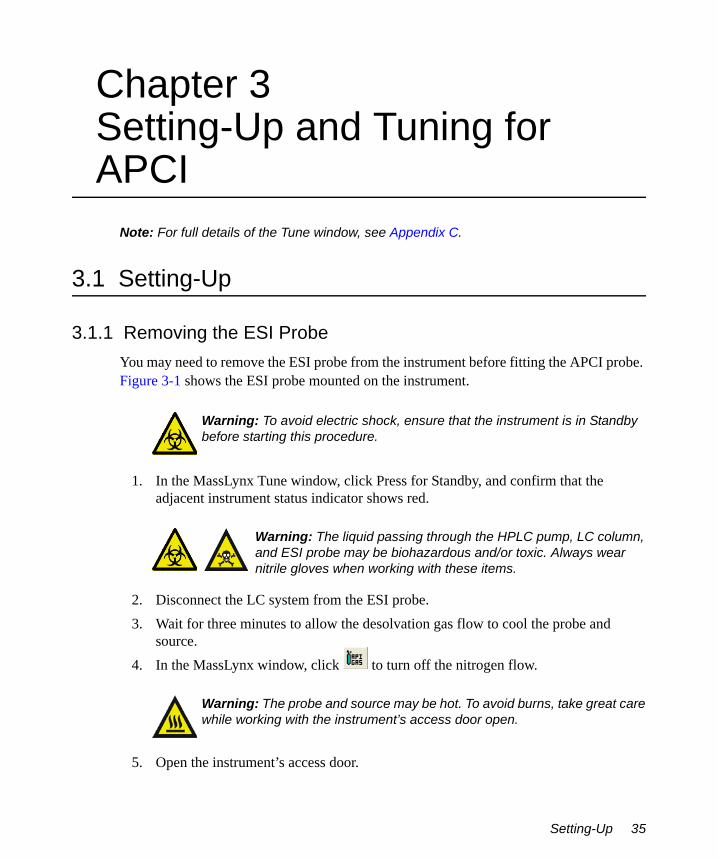
3.1.1 Removing the ESI ProbeYou may need to remove the ESI probe from the instrument before fitting the APCI probe. Figure 3-1 shows the ESI probe mounted on the instrument.
1. In the MassLynx Tune window, click Press for Standby, and confirm that the adjacent instrument status indicator shows red.
2. Disconnect the LC system from the ESI probe.3. Wait for three minutes to allow the desolvation gas flow to cool the probe and
source.4. In the MassLynx window, click to turn off the nitrogen flow.
5. Open the instrument’s access door.
Warning: To avoid electric shock, ensure that the instrument is in Standby before starting this procedure.
Warning: The liquid passing through the HPLC pump, LC column, and ESI probe may be biohazardous and/or toxic. Always wear nitrile gloves when working with these items.
Warning: The probe and source may be hot. To avoid burns, take great care while working with the instrument’s access door open.
Setting-Up 35
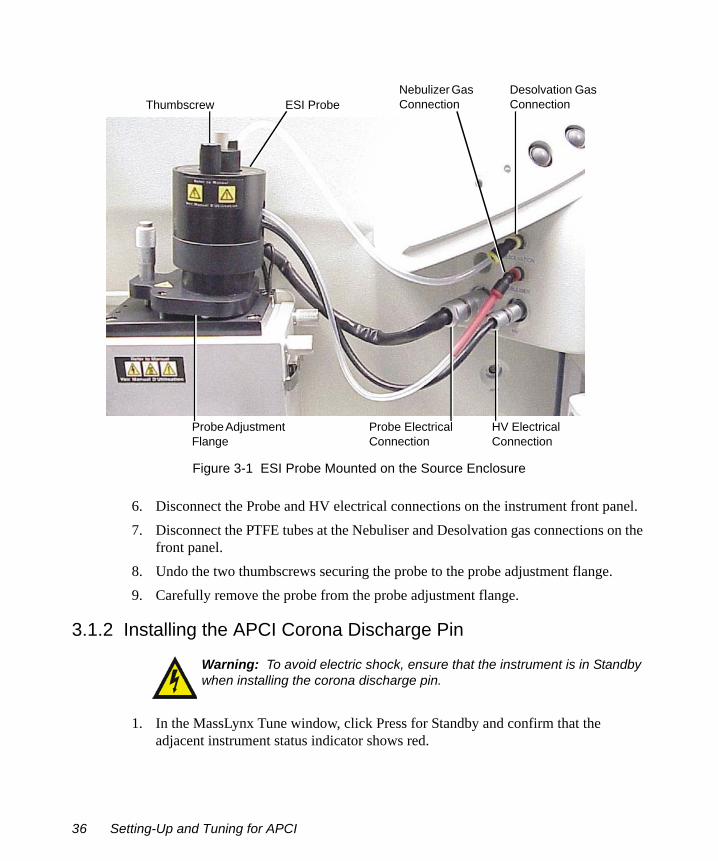
Figure 3-1 ESI Probe Mounted on the Source Enclosure
6. Disconnect the Probe and HV electrical connections on the instrument front panel.
7. Disconnect the PTFE tubes at the Nebuliser and Desolvation gas connections on the front panel.
8. Undo the two thumbscrews securing the probe to the probe adjustment flange.9. Carefully remove the probe from the probe adjustment flange.
3.1.2 Installing the APCI Corona Discharge Pin
1. In the MassLynx Tune window, click Press for Standby and confirm that the adjacent instrument status indicator shows red.
Warning: To avoid electric shock, ensure that the instrument is in Standby when installing the corona discharge pin.
Thumbscrew ESI ProbeNebulizer Gas Connection
Desolvation Gas Connection
Probe Adjustment Flange
Probe Electrical Connection
HV Electrical Connection
36 Setting-Up and Tuning for APCI

2. Unfasten the source enclosure door’s securing clips and open the door.3. Use needle-nose pliers to remove the blanking plug from the corona discharge pin
mounting contact. Store the blanking plug in a safe location.
4. Use the needle-nose pliers to fit the corona discharge pin to the mounting contact. Ensure that the corona discharge pin tip aligns with the sample cone tip.
5. Close the source enclosure door and fasten the securing clips.
Warning: The source components may be contaminated with biohazardous and/or toxic materials. Always wear nitrile gloves while performing this procedure.
Corona Discharge Pin Mounting Contact Blanking Plug
Corona Discharge Pin
Sample Cone Tip
Setting-Up 37
3.1.3 Installing the APCI Probe
1. In the MassLynx Tune window, click Press for Standby and confirm that the adjacent instrument status indicator shows red.
2. Carefully slide the APCI probe into the hole in the probe adjustment flange.3. Secure the probe by tightening the two thumbscrews (Figure 3-2).4. Connect the probe PTFE tubes to the nebulizer and desolvation gas connections on
the front panel.5. Connect the APCI probe electrical lead to the Probe connection on the front panel.
Note: The probe adjustment flange electrical lead is not connected when the APCI probe is fitted.
6. Close the instrument’s access door.
Warning: To avoid electric shock, ensure that the instrument is in Standby when installing the APCI probe.
Warning: The probe may be contaminated with biohazardous and/or toxic materials. Always wear nitrile gloves while performing this procedure.
38 Setting-Up and Tuning for APCI
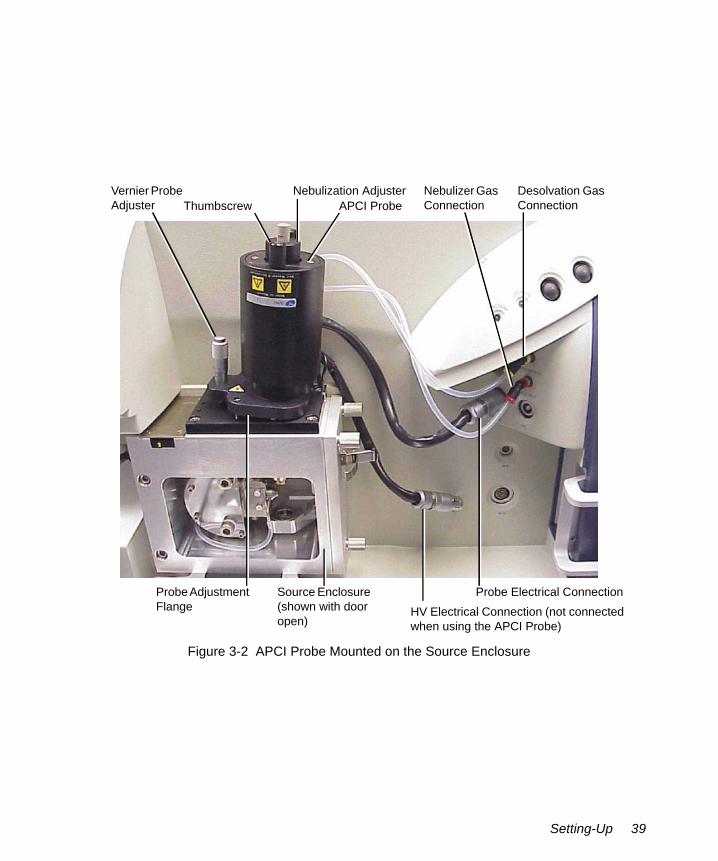
Figure 3-2 APCI Probe Mounted on the Source Enclosure
Vernier Probe Adjuster Thumbscrew
Nebulization AdjusterAPCI Probe
Nebulizer Gas Connection
Desolvation Gas Connection
Probe Adjustment Flange
Source Enclosure (shown with door open)
Probe Electrical ConnectionHV Electrical Connection (not connected when using the APCI Probe)
Setting-Up 39

3.2 Tuning via Sample Infusion
Note: This example procedure specifies 17-α-hydroxyprogesterone as the infused sample. Therefore, the choice of HPLC column and some parameter settings may be specific to that compound. You may tune the instrument using a different sample compound, however you may need to use a different type of column, and parameter settings may differ from the ones given here.
3.2.1 Tuning for MS Operation
1. In the MassLynx Tune window, click Press for Standby, and confirm that the adjacent instrument status indicator shows red.
2. Complete the connections between HPLC pump, LC column, syringe pump, and APCI probe as shown in Figure 3-3.The column used in this example is a Waters Symmetry C18 2.1 × 100 mm, 3.5 µm. The mobile phase is 70:30 acetonitrile/water.
Warning: The liquid passing through the HPLC pump, LC column, syringe pump, and APCI probe may be biohazardous and/or toxic. Always wear nitrile gloves when working with these items.
Warning: To avoid high-pressure liquid jet spray, wear safety goggles when making the connections between the HPLC pump, LC column, syringe pump, and APCI probe.
Warning: To avoid electric shock, ensure that the instrument is in Standby before commencing this procedure.
40 Setting-Up and Tuning for APCI
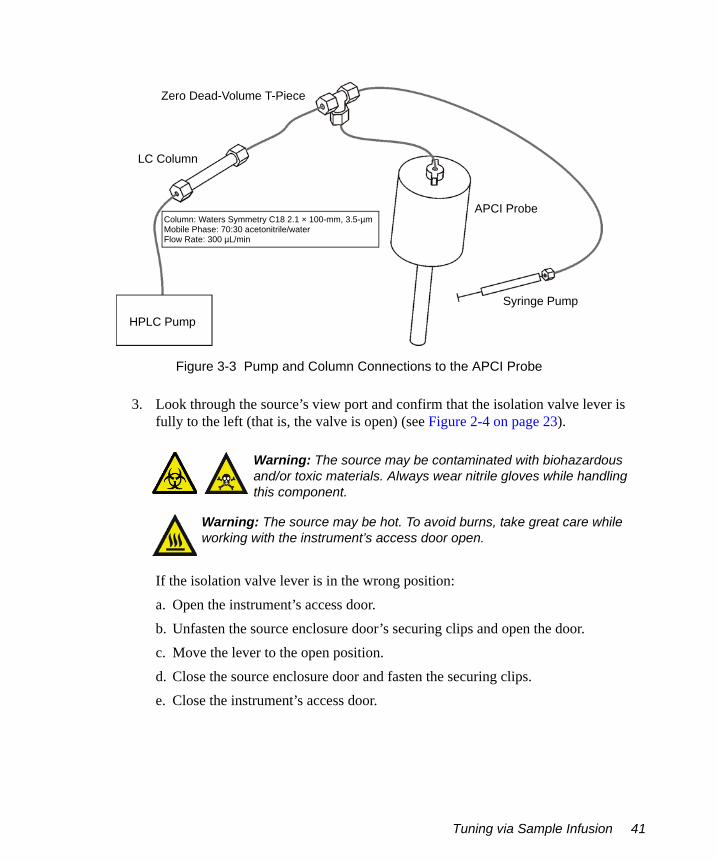
Figure 3-3 Pump and Column Connections to the APCI Probe
3. Look through the source’s view port and confirm that the isolation valve lever is fully to the left (that is, the valve is open) (see Figure 2-4 on page 23).
If the isolation valve lever is in the wrong position:a. Open the instrument’s access door.b. Unfasten the source enclosure door’s securing clips and open the door.c. Move the lever to the open position.d. Close the source enclosure door and fasten the securing clips.e. Close the instrument’s access door.
Warning: The source may be contaminated with biohazardous and/or toxic materials. Always wear nitrile gloves while handling this component.
Warning: The source may be hot. To avoid burns, take great care while working with the instrument’s access door open.
Zero Dead-Volume T-Piece
LC Column
APCI Probe
HPLC Pump
Syringe Pump
Column: Waters Symmetry C18 2.1 × 100-mm, 3.5-µmMobile Phase: 70:30 acetonitrile/waterFlow Rate: 300 µL/min
Tuning via Sample Infusion 41

4. In the MassLynx Tune window, select Ion Mode > APcI+ to display the APCI+ Source page (Figure 3-4).
Note: The instrument can also be tuned using the EasyTune Source page (see Section C.13).
Figure 3-4 Tune Window APCI+ Source Page
5. Set the parameters to the recommended values shown in Table 3-1.6. Click the Analyser tab.7. Set the parameters to the recommended values shown in Table 3-2.
42 Setting-Up and Tuning for APCI
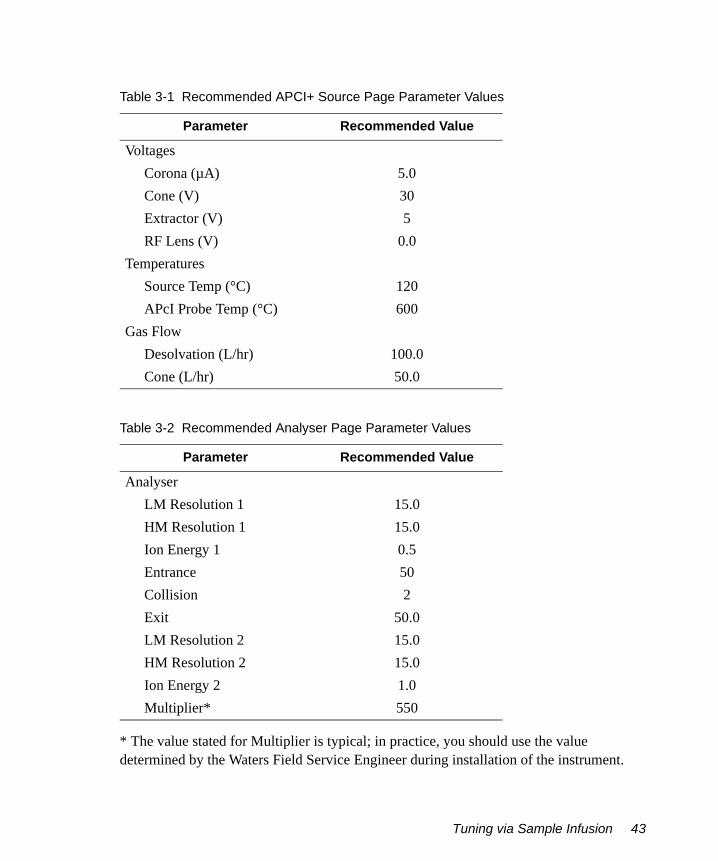
* The value stated for Multiplier is typical; in practice, you should use the value determined by the Waters Field Service Engineer during installation of the instrument.
Table 3-1 Recommended APCI+ Source Page Parameter Values
Parameter Recommended Value
VoltagesCorona (µA) 5.0Cone (V) 30Extractor (V) 5RF Lens (V) 0.0
TemperaturesSource Temp (°C) 120APcI Probe Temp (°C) 600
Gas FlowDesolvation (L/hr) 100.0Cone (L/hr) 50.0
Table 3-2 Recommended Analyser Page Parameter Values
Parameter Recommended Value
AnalyserLM Resolution 1 15.0HM Resolution 1 15.0Ion Energy 1 0.5Entrance 50Collision 2Exit 50.0LM Resolution 2 15.0HM Resolution 2 15.0Ion Energy 2 1.0Multiplier* 550
Tuning via Sample Infusion 43
8. Click to start the nitrogen flow.9. On the APCI+ Source page, observe the Desolvation and Cone gas flows; confirm
they are stabilized and correct.10. Confirm that the APcI Probe Temp (°C) readback shows approximately room
temperature.11. Click Press for Operate and confirm that the adjacent instrument status indicator
shows green.12. Confirm that the APcI Probe Temp (°C) readback reaches and stabilizes at the
temperature set in step 5 on page 42.13. Turn on the LC system at a flow rate of 300 µL/min and confirm that its pressure is
stable.14. Allow 15 minutes for the LC column to equilibrate.15. Load the syringe pump with sample. In this example, 17-α-hydroxyprogesterone
(concentration 1 ng/µL, in 70:30 acetonitrile/water) is used.16. Select the correct syringe type, using this procedure:
a. Select Options > Syringe Type to open the Syringe Selection dialog box.b. Choose the required syringe type from the drop-down list.
Note: If the syringe type is not listed, click Edit and add the relevant details.
c. Click OK.17. On the APCI+ Source page, set Syringe, Pump Flow (µL/min) to 10.18. In the Tune window, select the Function 1 box.19. Select MS Scan from the adjacent drop-down list.20. Enter Mass 331.2, Span 3, and Gain 150.
Note: The above are recommended values and can vary from instrument to instrument.
21. Observe the 17-α-hydroxyprogesterone peak at m/z 331.2 (M+H+) in the Tune window (see Figure 3-5).
22. Starting with the probe tip midway between the cone and the end of the corona pin, use the vernier probe adjuster (see Figure 3-2) to maximize the displayed peak intensity.
44 Setting-Up and Tuning for APCI
23. Use the vernier probe adjuster to move the probe tip as far away from the cone as possible, without losing more than 20% of the maximum displayed peak intensity obtained in step 22 on page 44. This minimizes source contamination.
24. Use the nebulization adjuster on the probe (see Figure 3-2) to give the best displayed peak intensity and stability.
25. On the Tune window’s APCI+ Source page, optimize the Corona (µA) current to give the maximum displayed peak intensity. Do this by looking for the maximum peak intensity while performing the following steps:a. Starting with a value of 5, decrease the value to 1, in decrements of 1.b. Decrease the value to 0, in decrements of 0.1.c. Reset the value to 5, and then increase the value in increments of 5.d. Set the Corona (µA) current to the value giving the maximum displayed peak
intensity.26. Starting from a value of 0, increase the Cone (L/hr) gas flow in increments of 50.
Allow the pressure to stabilize after each adjustment. Set the gas flow to the highest value that does not significantly reduce the peak intensity. This minimizes solvent ion cluster formation.
27. Starting from a value of 15, increase the Cone (V) voltage in increments of 5. Set the cone voltage to the value giving the highest displayed peak intensity. Record this value.
28. Starting from a value of 0, increase the Extractor (V) voltage in increments of 1. Set the extractor voltage to the value giving the highest displayed peak intensity.
29. Adjust the RF Lens (V) voltage to the minimum value that maintains the highest peak intensity, without loss of resolution.
30. Reduce the APcI Probe Temp (°C) to 300, and then increase its value in increments of 50. Allow the temperature readback to stabilize after each adjustment. Set the temperature to the highest value that does not reduce the displayed peak intensity.If the probe temperature is too low, the mobile phase may not be efficiently desolvated. This can result in chromatographic peak tailing.
31. Confirm that the displayed peaks have the correct resolution and the isotopes are resolved as shown in Figure 3-5. If necessary, adjust the Analyser page LM Resolution 1, HM Resolution 1, and Ion Energy 1 slider bars to achieve optimum resolution.
32. In the Tune window, determine the m/z value of the peak’s center to one decimal place (Figure 3-5). Record this value.
Tuning via Sample Infusion 45

33. MS tuning is now complete, Perform the MS/MS tuning procedure (see Section 3.2.2).
Figure 3-5 Tune Window with a 17-α-Hydroxyprogesterone Peak
3.2.2 Tuning for MS/MS (Daughter Ion) Operation1. In the Tune window, select the Function 2 box. (The Function 1 box may be cleared,
as shown in Figure 3-6.)2. Select Daughter Scan in the adjacent drop-down list box.3. Enter Set 331.2 (i.e., the 17-α-hydroxyprogesterone peak), Mass 109.1 (daughter
ion), Span 5, and Gain 600.4. Set Entrance to 0, Collision to 30, and Exit to 1.0. Leave the other parameters at
their current settings.5. On the Analyser page, set Ion Energy 2 to 1.0.
Note: Do not change the optimal Ion Energy 1 value obtained in Section 3.2.1.
46 Setting-Up and Tuning for APCI

6. Click to start the collision gas flow.7. On the Analyser page, set the Collision Gas Flow (mL/min) to 0.3. This sets the
Collision Cell Pressure to approximately 3 to 4 × 10⁻³ mbar.8. Observe the daughter ion peak, at m/z 109.1, displayed in the Tune window.9. If necessary, adjust the LM Resolution 2, HM Resolution 2, and Ion Energy 2 slider
bars to achieve optimum resolution (typically <1 Da FWHM).10. Starting at a value of 10, increase the Collision (i.e., collision energy) in increments
of 2. Set the collision energy to the value giving the highest displayed peak intensity. Record this value.
11. Optimize the Collision Gas Flow (mL/min), using increments of 0.05. Allow the Collision Cell Pressure readback to stabilize after each adjustment. Set the gas flow to the value giving the highest displayed peak intensity.
12. In the Tune window, determine the m/z value of the daughter ion peak’s center to one decimal place (Figure 3-6). Record this value.
Figure 3-6 Tune Window with a Daughter Ion Peak
Tuning via Sample Infusion 47

13. MS/MS tuning is now complete. Create an MRM MS method file (see Section 3.2.3).
3.2.3 Creating the MRM MS Method FileAn MRM MS method file must now be created, containing the information obtained during the instrument tuning process.
1. In the MassLynx window, click the MS Method icon to open the MS Method Editor (Figure 3-7).
Figure 3-7 MS Method Editor
2. Click to delete the current entry from the MS Method Editor.
3. Click to open the MRM Function Editor (Figure 3-8).4. Enter the value recorded in Section 3.2.1, step 32 on page 45, in the Parent (m/z)
box.5. Enter the value recorded in Section 3.2.2, step 12 on page 47, in the Daughter m/z)
box.6. Enter 0.1 in the Dwell (Secs) box.7. Enter the value recorded in Section 3.2.1, step 27 on page 45, in the Cone (Volts)
box.8. Enter the value recorded in Section 3.2.2, step 10 on page 47, in the Coll
Energy (eV) box.
48 Setting-Up and Tuning for APCI
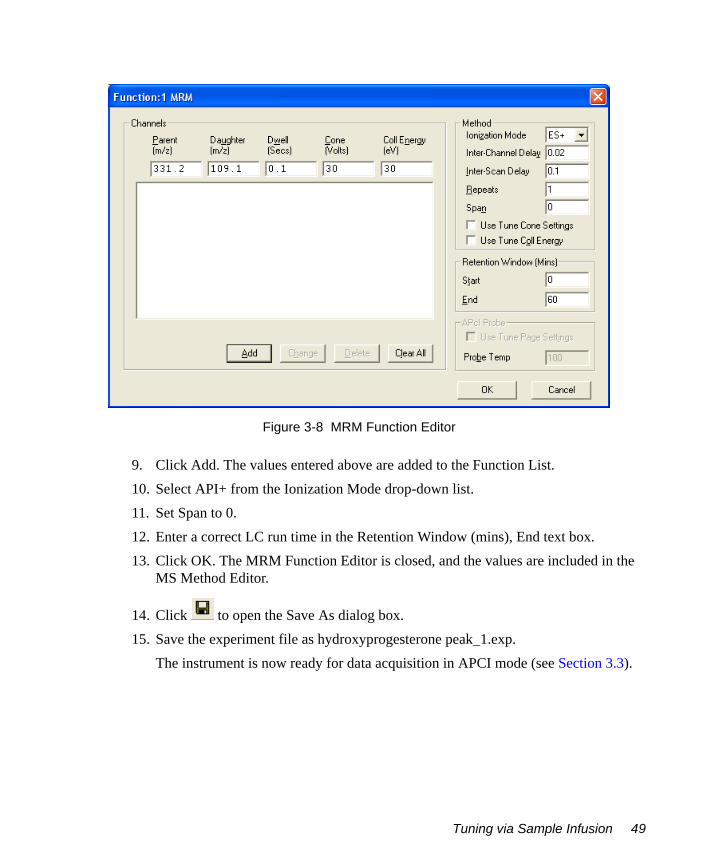
Figure 3-8 MRM Function Editor
9. Click Add. The values entered above are added to the Function List.10. Select API+ from the Ionization Mode drop-down list.11. Set Span to 0.12. Enter a correct LC run time in the Retention Window (mins), End text box.13. Click OK. The MRM Function Editor is closed, and the values are included in the
MS Method Editor.
14. Click to open the Save As dialog box.15. Save the experiment file as hydroxyprogesterone peak_1.exp.
The instrument is now ready for data acquisition in APCI mode (see Section 3.3).
Tuning via Sample Infusion 49
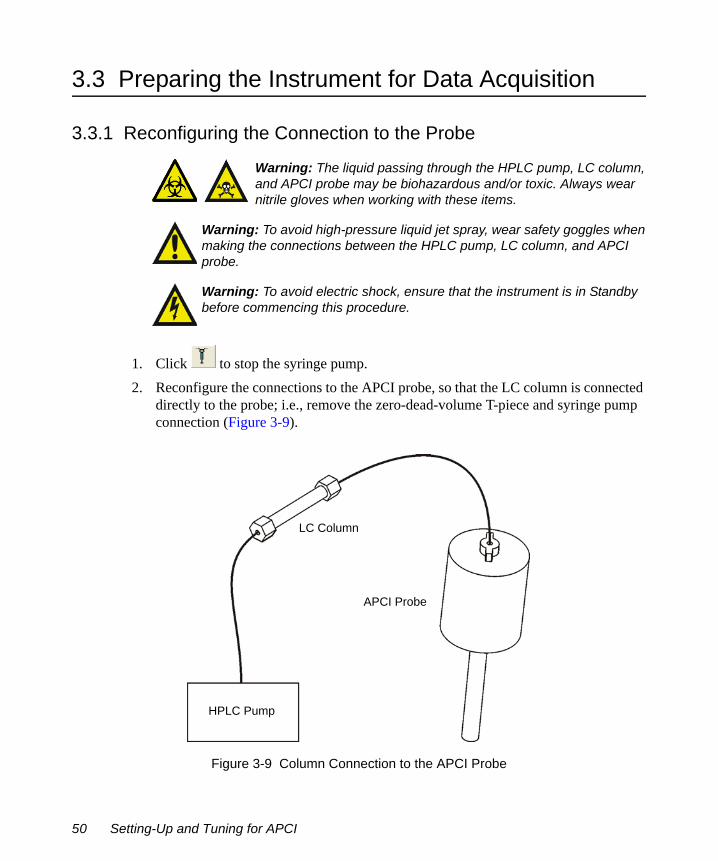
3.3 Preparing the Instrument for Data Acquisition
3.3.1 Reconfiguring the Connection to the Probe
1. Click to stop the syringe pump.2. Reconfigure the connections to the APCI probe, so that the LC column is connected
directly to the probe; i.e., remove the zero-dead-volume T-piece and syringe pump connection (Figure 3-9).
Figure 3-9 Column Connection to the APCI Probe
Warning: The liquid passing through the HPLC pump, LC column, and APCI probe may be biohazardous and/or toxic. Always wear nitrile gloves when working with these items.
Warning: To avoid high-pressure liquid jet spray, wear safety goggles when making the connections between the HPLC pump, LC column, and APCI probe.
Warning: To avoid electric shock, ensure that the instrument is in Standby before commencing this procedure.
LC Column
APCI Probe
HPLC Pump
50 Setting-Up and Tuning for APCI
3. In the Tune window, confirm that the daughter ion peak of interest has disappeared.If the peak does not disappear, consider two possible causes:• You tuned the instrument using a large background ion peak. Repeat the tuning
procedure using a more suitable sample.• The source is contaminated with the sample compound. This may occur if the
tuning standard sample concentration was too high. Clean the source (see Section 7.9), then repeat the tuning procedures, using a suitable sample concentration.
3.3.2 Configuring the Inlet for LC Operation1. Click the MassLynx window Instrument shortcut bar Inlet Method icon to open the
Inlet Method dialog box.2. Select Tools > Instrument Configuration to open the Inlet Configuration dialog box.
3. Click Configure to open the Inlet Configuration Wizard.4. Click Next>.5. Follow the on-screen instructions.6. When the Inlet Configuration Wizard has finished, click Finish, Finish, and then
close the Inlet Configuration dialog box.
3.3.3 Creating a Sample List and Starting Data AcquisitionNote: For comprehensive information on creating a MassLynx Sample List and starting data acquisition, see the MassLynx User’s Guide.
1. In the MassLynx window, insert the required number of samples in the Sample List.2. Enter the required file name(s) in the File Name column.3. Enter the required text in the File Text column.4. In the MS File column, select hydroxyprogesterone peak_1.exp.5. Create a suitable inlet method file (see the MassLynx NT Inlet Control Guide).6. Enter the inlet method file name in the Sample List Inlet File column.7. Enter the bottle number(s) in the Bottle column.8. Enter the injection volume(s) in the Inject Volume column.9. Save the Sample List.10. To start data acquisition, click (see Chapter 5 for further details).
Preparing the Instrument for Data Acquisition 51
3.3.4 Viewing and Printing the Tuning Parameters Associated with a Data File
The tuning parameters associated with a data file are stored with the file as part of the experimental record. You can view or print these tuning parameters from the MassLynx Data Browser dialog box (see the MassLynx User’s Guide for more information).
Note: The readbacks incorporated in the experimental record are for indication purposes only. They are not true (calibrated) records of the actual voltages that were on the instrument during data acquisition.
52 Setting-Up and Tuning for APCI

Chapter 4ESCi Multi-Mode Operation
For ESCi operation, the instrument source is fitted with both the ESI probe and the APCI corona discharge pin. When acquiring data, the instrument alternates between ESI and APCI operation in a single run by switching between the electrospray capillary voltage and the APCI corona discharge pin current under the control of MassLynx.
4.1 Preparing the Instrument
1. In the MassLynx Tune window, click Press for Standby, and confirm that the adjacent instrument status indicator shows red.
2. If the APCI probe is fitted to the probe adjustment flange, remove it (see Section 2.1.1), and fit the ESI probe (see Section 2.1.3).
3. If the APCI corona discharge pin is not fitted to the source, fit it (see Section 3.1.2).4. If the ESCi multi-mode operation option has not been previously installed on the
instrument, use the ESCi option key disk to upgrade MassLynx on the MassLynx PC; follow the on-screen instructions.
Note: If this software upgrade has not been installed, the ESCi option will not be available in the MassLynx Tune window.
Warning: To avoid electric shock, ensure that the instrument is in Standby before starting this procedure.
Preparing the Instrument 53

4.2 Tuning the Instrument
1. In the MassLynx Tune window, select Options > Multiple ion modes > Dual ES/APcI, to display the ESCi Source page (Figure 4-1).
Figure 4-1 Tune Window ESCi Source Page
2. On the menu bar, select Ion Mode > ESCi+ to enable the positive ESCi ionization mode.
3. To tune the instrument for ESI mode:a. Select ES in the Ion Mode drop-down list for Function 1.b. Tune the instrument for ESI MS operation (see Section 2.2.1).
54 ESCi Multi-Mode Operation
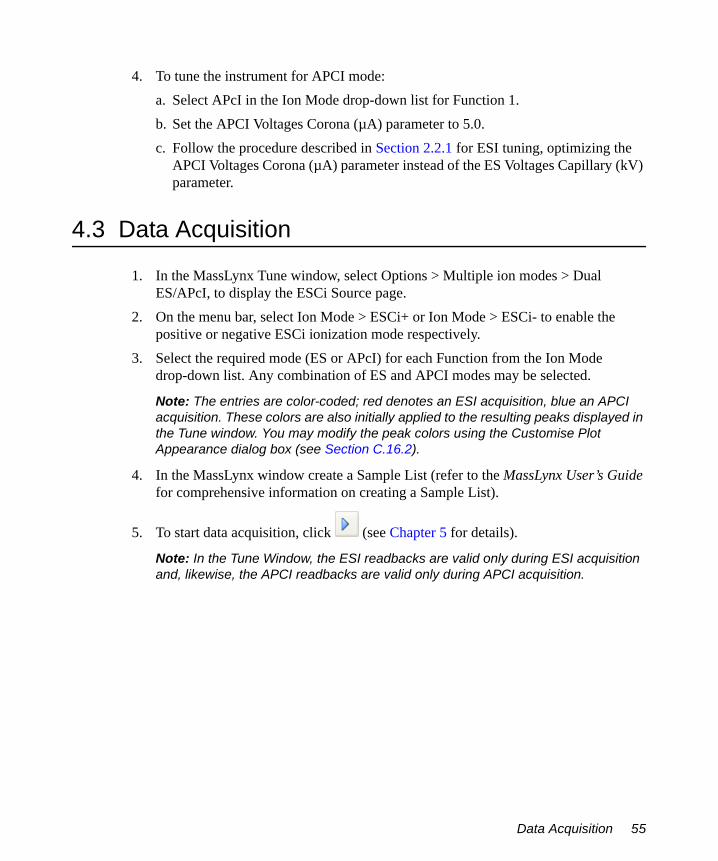
4. To tune the instrument for APCI mode:a. Select APcI in the Ion Mode drop-down list for Function 1.b. Set the APCI Voltages Corona (µA) parameter to 5.0.c. Follow the procedure described in Section 2.2.1 for ESI tuning, optimizing the
APCI Voltages Corona (µA) parameter instead of the ES Voltages Capillary (kV) parameter.
4.3 Data Acquisition
1. In the MassLynx Tune window, select Options > Multiple ion modes > Dual ES/APcI, to display the ESCi Source page.
2. On the menu bar, select Ion Mode > ESCi+ or Ion Mode > ESCi- to enable the positive or negative ESCi ionization mode respectively.
3. Select the required mode (ES or APcI) for each Function from the Ion Mode drop-down list. Any combination of ES and APCI modes may be selected.
Note: The entries are color-coded; red denotes an ESI acquisition, blue an APCI acquisition. These colors are also initially applied to the resulting peaks displayed in the Tune window. You may modify the peak colors using the Customise Plot Appearance dialog box (see Section C.16.2).
4. In the MassLynx window create a Sample List (refer to the MassLynx User’s Guide for comprehensive information on creating a Sample List).
5. To start data acquisition, click (see Chapter 5 for details).
Note: In the Tune Window, the ESI readbacks are valid only during ESI acquisition and, likewise, the APCI readbacks are valid only during APCI acquisition.
Data Acquisition 55

56 ESCi Multi-Mode Operation
Chapter 5Acquiring Data
5.1 Starting an Acquisition
There are two ways of starting an acquisition:
• A single sample acquisition from the Tune window (Section 5.1.1).• A multiple sample acquisition from the MassLynx window (Section 5.1.2).
5.1.1 Starting an Acquisition from the Tune WindowThe easiest way to acquire data is directly from the Tune window:
• Acquisitions can be started and stopped.• Most of the scanning parameters can be controlled.
However, when using this method:
• Inlet programs cannot be used.• SIR and MRM data cannot be acquired.• Analog data cannot be acquired.• Multiple sample sequences cannot be acquired.
To start a single sample acquisition:
1. In the Tune window, click Acquire, or select Window > Acquire to open the Acquisition Setup dialog box (Figure 5-1).
2. Enter the parameters required to accommodate the required mass range and scan times (see Table 5-1 for details).
3. Click Start.
Starting an Acquisition 57
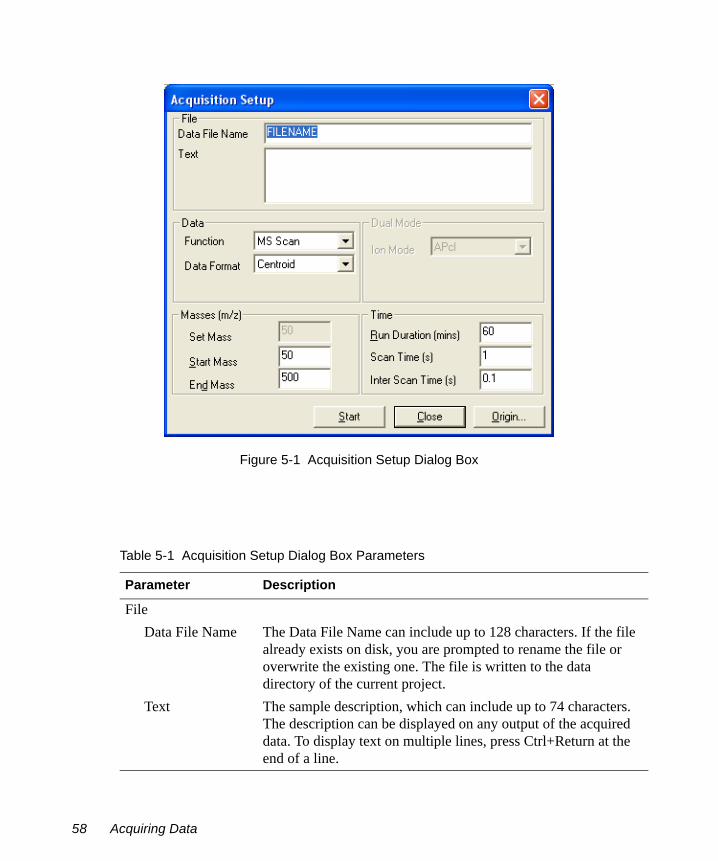
Figure 5-1 Acquisition Setup Dialog Box
Table 5-1 Acquisition Setup Dialog Box Parameters
Parameter Description
FileData File Name The Data File Name can include up to 128 characters. If the file
already exists on disk, you are prompted to rename the file or overwrite the existing one. The file is written to the data directory of the current project.
Text The sample description, which can include up to 74 characters. The description can be displayed on any output of the acquired data. To display text on multiple lines, press Ctrl+Return at the end of a line.
58 Acquiring Data
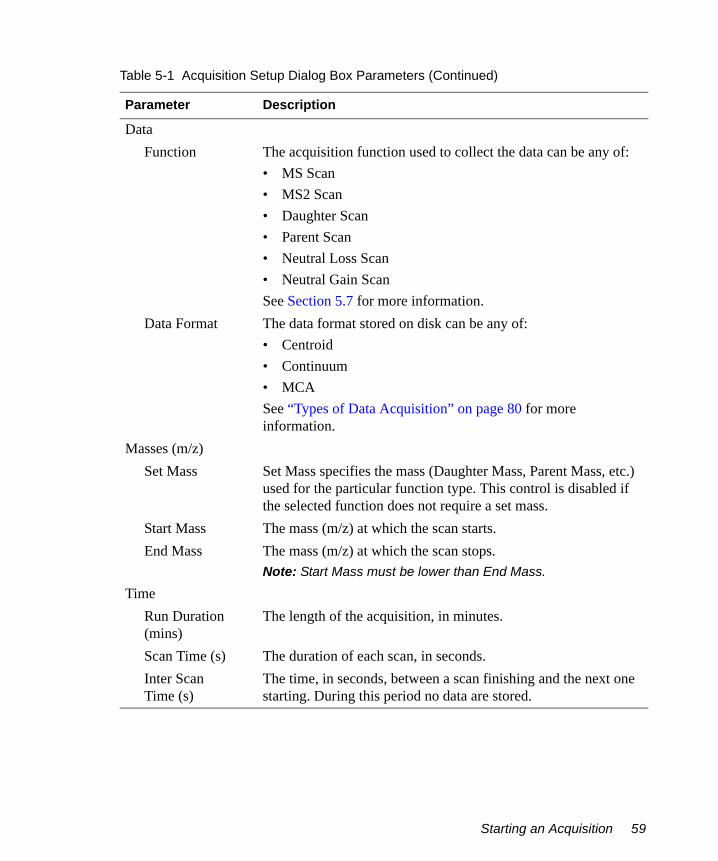
DataFunction The acquisition function used to collect the data can be any of:
• MS Scan• MS2 Scan• Daughter Scan• Parent Scan• Neutral Loss Scan• Neutral Gain ScanSee Section 5.7 for more information.
Data Format The data format stored on disk can be any of:• Centroid• Continuum• MCASee “Types of Data Acquisition” on page 80 for more information.
Masses (m/z)Set Mass Set Mass specifies the mass (Daughter Mass, Parent Mass, etc.)
used for the particular function type. This control is disabled if the selected function does not require a set mass.
Start Mass The mass (m/z) at which the scan starts.End Mass The mass (m/z) at which the scan stops.
Note: Start Mass must be lower than End Mass.
TimeRun Duration (mins)
The length of the acquisition, in minutes.
Scan Time (s) The duration of each scan, in seconds.Inter Scan Time (s)
The time, in seconds, between a scan finishing and the next one starting. During this period no data are stored.
Table 5-1 Acquisition Setup Dialog Box Parameters (Continued)
Parameter Description
Starting an Acquisition 59
To change the project into which data are saved:
1. Cancel the acquisition.2. In the MassLynx window, select File > Open Project to open an existing project, or
File > Project Wizard to create a new project.
5.1.2 Starting Multiple-Sample Acquisition from the MassLynx WindowThe MassLynx window contains a Sample List for defining multiple samples which may be used together to perform a quantitative analysis. The list of samples is created using a spreadsheet style editor, which you can tailor to suit individual requirements. See the MassLynx User’s Guide for more detailed information about multiple-sample Sample List analysis.
Procedure1. Create a Sample List in the MassLynx window.
2. Select Run > Start, or click to open the Start Sample List Run dialog box (Figure 5-2).
3. Enter the appropriate parameters (see Table 5-2 for details).4. Click OK.5. Repeat steps 1 to 4 as required.
Sample Lists are added to a queue and run sequentially unless Priority or Night Time Process has been selected.
Note: in the Sample List denotes the sample currently being acquired.
Origin Opens the Sample Origin dialog box. This allows you to specify additional information about the sample in the following fields:• Submitter• Job• Task• Conditions
Table 5-1 Acquisition Setup Dialog Box Parameters (Continued)
Parameter Description
60 Acquiring Data

Figure 5-2 Start Sample List Run Dialog Box
Starting an Acquisition 61

Table 5-2 Start Sample List Run Dialog Box Parameters
Parameter Description
Project The name of the current project. To send acquired data to a different project, exit this dialog box, open the other project, and restart the acquisition.
Acquire Sample Data Acquires data from all the samples in the list.Auto Process Samples
Processes acquired data as specified in the Sample List Process column. This may be existing data, or data newly acquired when the Acquire Sample Data option has been selected (see the MassLynx User’s Guide for further details).
Auto Quantify Samples
Quantifies the acquired data using the method specified in the Quantify Samples dialog box (see Section 5.1.3). The current method will be used if a method is not specified in the Quantify Samples dialog box. If this option is selected, the Quantify Samples dialog box will open when the Start Sample List Run dialog OK button is clicked (see the MassLynx User’s Guide for further details).
Note: The above three actions can run together or independently; i.e., the User can acquire, process, and quantify data simultaneously, or acquire data in one run and process or quantify it later.
RunFrom Sample The sample number of the first sample to be acquired.To Sample The sample number of the last sample to be acquired.Priority Marks a job as a priority process; it will be placed at the top of
the queue, to run after a currently running job.Night Time Process
Marks this entry as a night-time process. This option is useful for time-consuming acquisitions that would interrupt work on smaller acquisitions during the day.
ProcessPre-Run Runs the external executable process specified in the adjacent
text box, which performs pre-processing on the samples.Post-Run Runs the external executable process specified in the adjacent
text box, which performs post-processing on the samples.
62 Acquiring Data

5.1.3 Automatic Quantification of the Sample ListThe Quantify Samples dialog box (Figure 5-3) allows automatic processing of data files following acquisition. See the MassLynx User’s Guide for more detailed information about using automated Sample List analysis.
Figure 5-3 Quantify Samples Dialog Box
Procedure1. Click Process Samples on the MassLynx Quantify shortcut bar, to open the Quantify
Samples dialog box.2. Enter the appropriate parameters (see Table 5-3 for details).3. Click OK.
Starting an Acquisition 63

Table 5-3 Quantify Samples Dialog Box Parameters
Parameter Description
Integrate Samples Integrates all the sample data files named in the Sample List.Calibrate Standards Uses integration results to create and quantify calibration curves.
Note: Do not select this option if an existing calibration is to be used; instead, use the Curve Browse button to select the required calibration file.
Quantify Samples Uses integration results and quantify calibration curves to calculate compound concentrations.
Print Quantify Reports
Prints the results of integration and quantitation.
Export Results to LIMS
Produces a text file containing the quantitation results for use with a Laboratory Information Management System (LIMS). This option enables the LIMS Export pane File Browse button. Click Browse and select a file, or enter the name of a new one, then click Save.
Project Displays the name of the current project.Quantify
From Sample: The sample number of the first sample to be acquired.To Sample: The sample number of the last sample to be acquired.Method Displays the name of the current method file. To change the file,
click the appropriate Browse button, and select a new file.
Curve Displays the name of the current curve file. To change the file, click the appropriate Browse button and select a new file.
64 Acquiring Data

5.2 Monitoring an Acquisition
5.2.1 Viewing the Status of an AcquisitionAcquisition status is shown in the MassLynx window. The run time is shown on the MS Status shortcut bar. The scan status, sample number, and scan number are shown on the status bar at the bottom of the window.
To view a scan-by-scan statistical report of the progress of an acquisition, select Options > Acquisition Status in the Tune window. This opens the Scan Report window, which displays details of the scan currently being acquired.
5.2.2 Viewing a Chromatogram in Real-Time1. In the MassLynx window Sample List menu bar, click Chromatogram to open the
Chromatogram window.
2. Click or select Display > Real-Time Update. The chromatogram display is updated as the acquisition proceeds.
5.2.3 Viewing a Spectrum in Real-Time1. In the MassLynx window Sample List menu bar, click Spectrum to open the
Spectrum window.2. Select Display > Real-Time Update to open the Spectrum Real-Time Update dialog
box (Figure 5-4).
Figure 5-4 Spectrum Real-Time Update Dialog Box
Monitoring an Acquisition 65

3. Select Enable Real-Time update.4. Select the required Update option (see the details below).5. Click OK.
Note: Real-time updating can also be turned on and off by clicking .
When real-time update is enabled, the display is continually updated with spectra from the current acquisition. The actual information displayed is determined by clicking the appropriate update option:
• Latest scan displays the last acquired scan (the default option).• Average all scans updates the display with spectra formed by averaging all the
spectra acquired so far.• Average latest scans updates the display with spectra formed by averaging the last n
scans acquired, where n is specified in the associated text box.
5.3 Selecting Instrument Data Thresholds
Instrument data thresholding allows you to specify which data to acquire and store, and which to discard. Limiting the amount of data stored on disk can be useful when acquiring continuum data and performing long LC runs.
Instrument data threshold settings are specified in the Instrument Threshold Settings dialog box (Figure 5-5).
Changing Data Thresholding1. In the Tune window, select Options > Set Instrument Threshold to open the
Instrument Threshold Settings dialog box.2. Make the required changes to the information. (The parameters are fully described
in Sections 5.3.1 to 5.3.6.)3. Click OK.
The new parameters are downloaded at the start of the next acquisition scan.
66 Acquiring Data

Figure 5-5 Instrument Threshold Settings Dialog Box
5.3.1 Profile DataThe Profile Data parameters control the amount of data collected during a continuum data acquisition.
Baseline Level changes the baseline position with respect to zero and is typically set to zero. A positive value increases the amount of noise seen. A negative value reduces the noise seen and acts as a form of thresholding applied to 1/16 Dalton-type samples.
The Baseline Level adjustment takes place after ion counting and, therefore, has a less significant effect than Ion Counting Threshold (see Section 5.3.4).
Points per Dalton can have one of three values: 4, 8, or 16:
• Acquiring data at 16 points per Dalton gives the greatest possible resolution.
• Selecting 8 points per Dalton instead of 16 produces data files approximately half as big.
• Acquiring data at 4 points per Dalton gives data with a smoothed appearance.
Selecting Instrument Data Thresholds 67
5.3.2 Centroid DataMinimum centroid height sets a height below which detected peaks are ignored. This reduces the size of acquired data files and is useful when concentrating on larger peaks of interest. A suitable value can be deduced by evaluating spectral noise levels, and should be evaluated for each system.
The Minimum points per peak value specifies the minimum number of points that a continuum peak must comprise to initiate centroid processing. A typical value is 10.
5.3.3 SIR DataThe SIR Baseline Level value specifies the position of the SIR baseline above zero; it is typically set to zero. Increasing the value causes the baseline to appear higher in the spectrum.
5.3.4 Ion Counting ThresholdIon Counting Threshold sets the intensity level below which a data point is ignored. This threshold is applied to all acquisitions, regardless of scanning mode. It is also the most significant data thresholding parameter, as it is the first to be applied to raw data.
When an acquisition is started, the instrument performs a prescan with the ion beam switched off. This allows measuring of the acquisition system electronic noise level and its standard deviation. Ion Counting Threshold affects only the system electronic noise level.
The specified Ion Counting Threshold level is multiplied by 1/10 of the standard deviation of the noise to determine the suitable intensity level. Hence a value of 10 equates to one standard deviation of the electronic noise level.
• Values can be set between 0 and 1000; the higher the number, the more data is discarded.
• If a value of 0 is entered, the intensity level is set so that it sits in the middle of the noise. This means that roughly half the noise data is acquired.
• A value of 10 places the threshold just above the noise, so almost all the noise data is acquired.
• If a value of 200 is specified, the threshold sits well above the noise level, so little noise data is acquired.
• A value of 30 is suitable for most data.
68 Acquiring Data
Note: Ion Counting Threshold should be set to 0 when acquiring data to be analyzed using MaxEnt™, as the MaxEnt algorithm needs to measure noise accurately within a data file (see the MassLynx User’s Guide for full details).
Set Ion Counting Threshold so that background noise is removed without significantly reducing the intensity of the smallest peaks of interest.
5.3.5 Profile Data – Spike RemovalSpikes can be distinguished from real data because the peaks are very narrow and, when compared to their immediate neighbors, very intense. A data point determined to be a spike is removed by setting the value of the data point to the average of its immediate neighbors.
Spike removal involves additional processing during data acquisition and so reduces the maximum achievable acquisition rates by approximately 30%.
Performing Spike Removal During an Acquisition1. In the Instrument Threshold Settings dialog box Profile Data - Spike Removal pane,
select Use Spike Removal.2. Examine the peak intensities displayed in the Tune window to deduce a suitable
value for the intensity threshold below which spikes are ignored. Set Minimum Spike Intensity to this value.A very low intensity signal may include single ion events that can be combined to produce significant peaks. For this type of data, set Minimum Spike Intensity to a suitable value such that these single ion events are not discarded as spikes.
3. Set a suitable value for Spike Percentage Ratio.This ratio determines whether a data point is a spike by comparing the data point to its immediate neighbors. For example, with Spike Percentage Ratio set to 33%, a data point is regarded as a spike if its intensity is three times (or more) greater than both its immediate neighbors. A setting of 20% requires an intensity ratio of 5:1 to identify a spike.
4. Click OK to accept any changes.
5.3.6 Analog DataSelect the number of samples to acquire, per second, from the Analog samples/sec drop-down list.
Selecting Instrument Data Thresholds 69
5.4 Checking the Status of the Communications Link
To check the status of the communications link between the MassLynx PC and embedded PC, select Options > Communications Status, in the Tune window, to open the System Manager window. This displays details of the embedded system’s status.
5.5 Stopping an Acquisition
You can stop an acquisition from either the Tune window or the MassLynx window. Data already acquired are saved.
• In the Tune window, click .
Note: Stopping an acquisition from the Tune window will stop only the current acquisition in the Sample List; data acquisition for the next entry in the Sample List will then start.
• In the MassLynx window, select Run > Stop, or click .
Note: Stopping an acquisition from the MassLynx window will pause the Sample List.
5.6 Pausing an Acquisition
You can pause an acquisition from either the Tune window or the MassLynx window:
• In the Tune window, click .
• In the MassLynx window, select Run > Pause or click .
Click the appropriate pause button again to restart the acquisition.
70 Acquiring Data
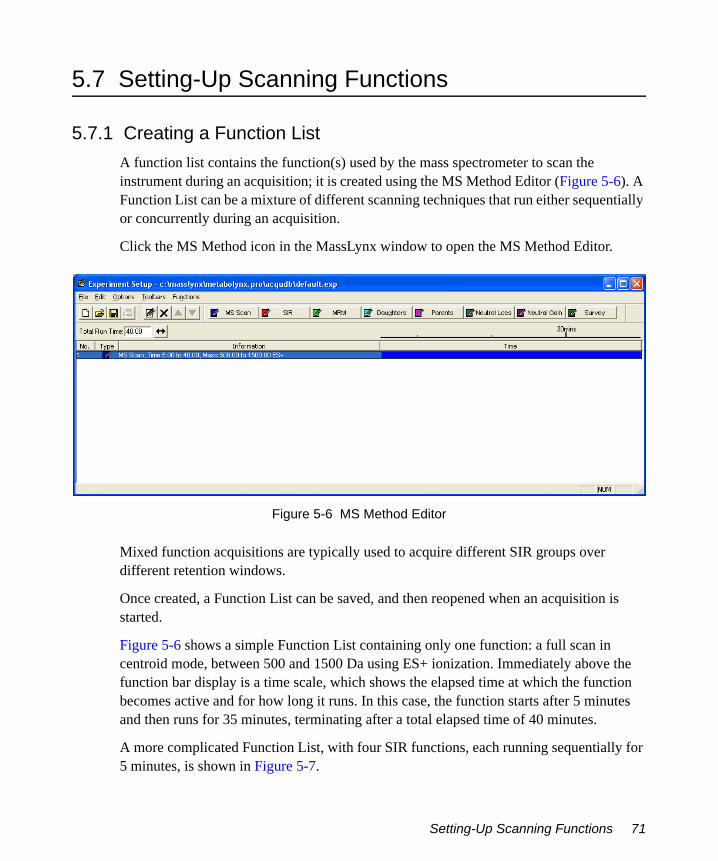
5.7 Setting-Up Scanning Functions
5.7.1 Creating a Function ListA function list contains the function(s) used by the mass spectrometer to scan the instrument during an acquisition; it is created using the MS Method Editor (Figure 5-6). A Function List can be a mixture of different scanning techniques that run either sequentially or concurrently during an acquisition.
Click the MS Method icon in the MassLynx window to open the MS Method Editor.
Figure 5-6 MS Method Editor
Mixed function acquisitions are typically used to acquire different SIR groups over different retention windows.
Once created, a Function List can be saved, and then reopened when an acquisition is started.
Figure 5-6 shows a simple Function List containing only one function: a full scan in centroid mode, between 500 and 1500 Da using ES+ ionization. Immediately above the function bar display is a time scale, which shows the elapsed time at which the function becomes active and for how long it runs. In this case, the function starts after 5 minutes and then runs for 35 minutes, terminating after a total elapsed time of 40 minutes.
A more complicated Function List, with four SIR functions, each running sequentially for 5 minutes, is shown in Figure 5-7.
Setting-Up Scanning Functions 71
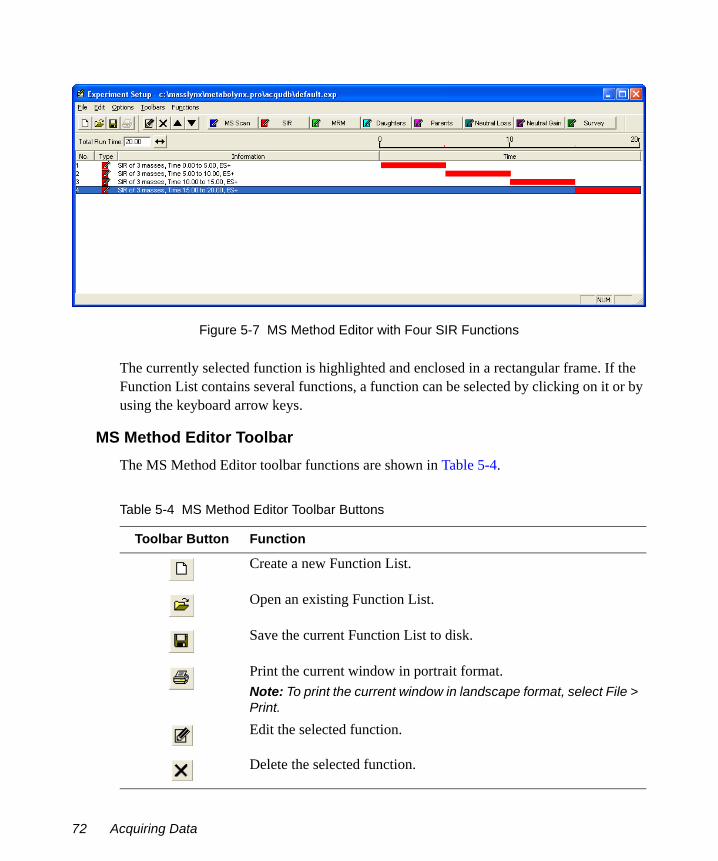
Figure 5-7 MS Method Editor with Four SIR Functions
The currently selected function is highlighted and enclosed in a rectangular frame. If the Function List contains several functions, a function can be selected by clicking on it or by using the keyboard arrow keys.
MS Method Editor ToolbarThe MS Method Editor toolbar functions are shown in Table 5-4.
Table 5-4 MS Method Editor Toolbar Buttons
Toolbar Button Function
Create a new Function List.
Open an existing Function List.
Save the current Function List to disk.
Print the current window in portrait format.Note: To print the current window in landscape format, select File > Print.
Edit the selected function.
Delete the selected function.
72 Acquiring Data
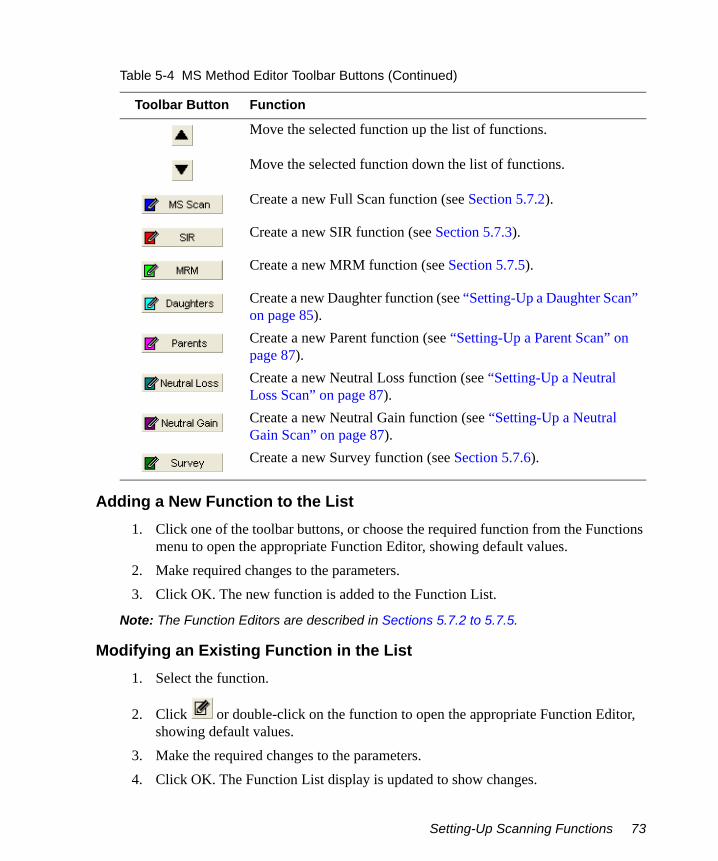
Adding a New Function to the List1. Click one of the toolbar buttons, or choose the required function from the Functions
menu to open the appropriate Function Editor, showing default values.2. Make required changes to the parameters.3. Click OK. The new function is added to the Function List.
Note: The Function Editors are described in Sections 5.7.2 to 5.7.5.
Modifying an Existing Function in the List1. Select the function.
2. Click or double-click on the function to open the appropriate Function Editor, showing default values.
3. Make the required changes to the parameters.4. Click OK. The Function List display is updated to show changes.
Move the selected function up the list of functions.
Move the selected function down the list of functions.
Create a new Full Scan function (see Section 5.7.2).
Create a new SIR function (see Section 5.7.3).
Create a new MRM function (see Section 5.7.5).
Create a new Daughter function (see “Setting-Up a Daughter Scan” on page 85).Create a new Parent function (see “Setting-Up a Parent Scan” on page 87).Create a new Neutral Loss function (see “Setting-Up a Neutral Loss Scan” on page 87).Create a new Neutral Gain function (see “Setting-Up a Neutral Gain Scan” on page 87).Create a new Survey function (see Section 5.7.6).
Table 5-4 MS Method Editor Toolbar Buttons (Continued)
Toolbar Button Function
Setting-Up Scanning Functions 73

Note: The Function Editors are described in Sections 5.7.2 to 5.7.5.
Copying an Existing Function in the List1. Select the function.2. Select Edit > Copy.3. Select Edit > Paste. A copy of the function appears in the Function List.4. Modify the parameters (see above).
Removing a Function from the List1. Select the function.
2. Click , select Edit > Delete, or press the Del key.
Changing the Order of Functions in the ListFunctions are displayed in ascending start and end time order; this order cannot be changed. For functions with identical start and end times, you can change the order in which they are performed:
1. Select the required function.
2. Repeatedly click or until the function is in the required position.
Setting the Maximum Retention Time1. Enter the required value in the Total Run Time: text box.
2. Click . The ratio of the defined functions is maintained. For example, if two functions are defined, one from 0 to 5 minutes, and the other 5 to 10 minutes, then a Total Run Time of 10 minutes is displayed. If this value is changed to 20, the first function now runs from 0 to 10 minutes, and the second from 10 to 20 minutes.
Setting Solvent DelaysNo data is stored during a solvent delay period, which means that solvent peaks that would normally be seen eluting on the Total Ion Current (TIC) chromatogram are not seen.
Select Options > Solvent Delay on the MS Method Editor to open the Solvent Delay dialog box (Figure 5-8). Up to four solvent delay periods can be entered in the dialog box.
74 Acquiring Data
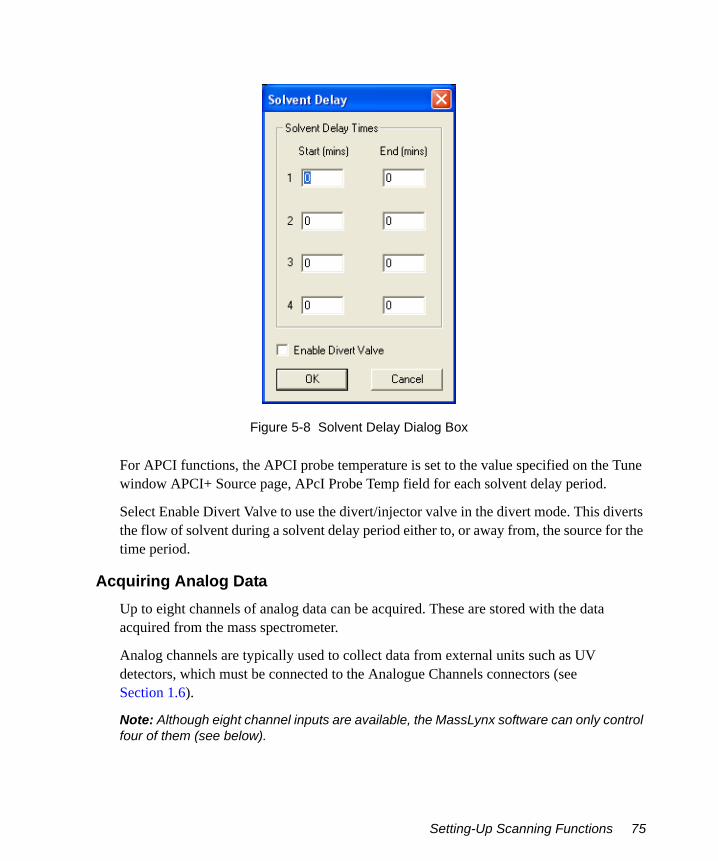
Figure 5-8 Solvent Delay Dialog Box
For APCI functions, the APCI probe temperature is set to the value specified on the Tune window APCI+ Source page, APcI Probe Temp field for each solvent delay period.
Select Enable Divert Valve to use the divert/injector valve in the divert mode. This diverts the flow of solvent during a solvent delay period either to, or away from, the source for the time period.
Acquiring Analog DataUp to eight channels of analog data can be acquired. These are stored with the data acquired from the mass spectrometer.
Analog channels are typically used to collect data from external units such as UV detectors, which must be connected to the Analogue Channels connectors (see Section 1.6).
Note: Although eight channel inputs are available, the MassLynx software can only control four of them (see below).
Setting-Up Scanning Functions 75

A reading is made from the external channel at the end of each scan and stored with the data for that scan. The resolution of the chromatography for an analog channel therefore depends on the scan speed used to acquire the mass spectrometry data.
To store data for an analog channel:
1. On the MS Method Editor, select Options > Analog Data to open the Analog Data dialog box (Figure 5-9).
Figure 5-9 Analog Data Dialog Box
2. Select the box(es) for the required analog channel(s).3. Enter a textual description for each selected channel.
This description is used on the analog Chromatogram dialog box as the channel description (see the MassLynx User’s Guide).
4. Enter an Offset (mins) to align the external unit with the mass spectrometer.5. Click OK.
Saving a Function List1. On the MS Method Editor, select File > Save As to open a standard Save As dialog
box.2. Enter a new file name, or select an existing file from the displayed list.3. Click Save.
76 Acquiring Data
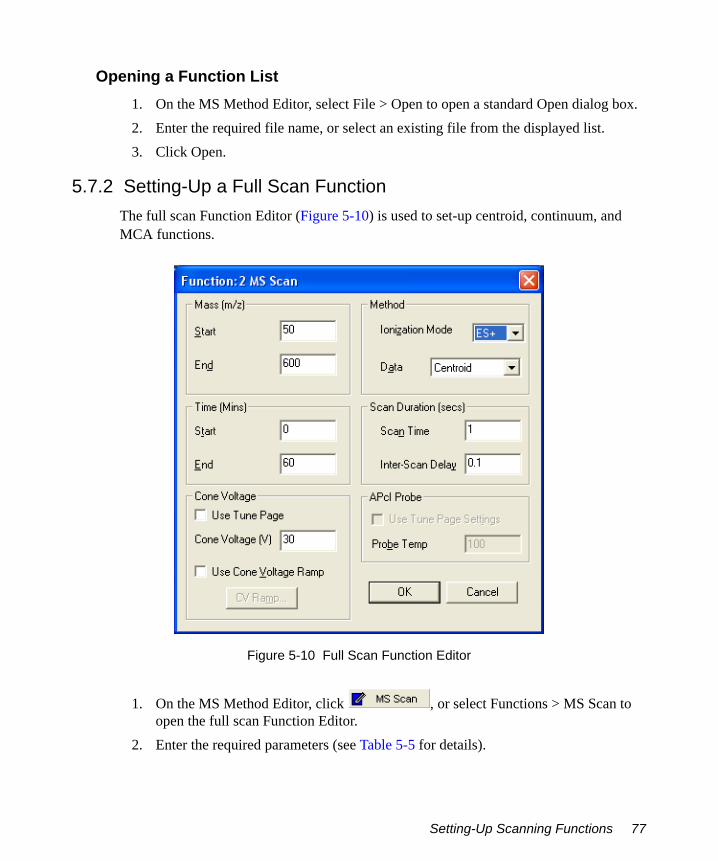
Opening a Function List1. On the MS Method Editor, select File > Open to open a standard Open dialog box.2. Enter the required file name, or select an existing file from the displayed list.3. Click Open.
5.7.2 Setting-Up a Full Scan FunctionThe full scan Function Editor (Figure 5-10) is used to set-up centroid, continuum, and MCA functions.
Figure 5-10 Full Scan Function Editor
1. On the MS Method Editor, click , or select Functions > MS Scan to open the full scan Function Editor.
2. Enter the required parameters (see Table 5-5 for details).
Setting-Up Scanning Functions 77

Table 5-5 Full Scan Function Editor Parameters
Parameter Description
Mass (m/z) Start The mass (m/z) at which the scan starts.End The mass (m/z) at which the scan stops.
Note: The Start mass must be less than the End mass.
Time (Mins)Start The retention time (in minutes) at which the scan starts.End The retention time (in minutes) at which the scan stops.
Cone VoltageUse Tune Page When selected, the cone voltage set in the Tune window at the
start of the acquisition is used.Note: The cone voltage value cannot be altered during acquisition by typing new values into the Tune window, since the new values are not downloaded during acquisition.
Cone Voltage (V) The cone voltage.Use Cone Voltage Ramp
When selected, applies a ramp to linearly increase the cone voltage (see “Applying a Linear Ramp to the Cone Voltage” on page 79).
CV Ramp Opens the Cone Ramp dialog box (see “Applying a Linear Ramp to the Cone Voltage” on page 79).Note: CV Ramp is available only when Use Cone Voltage Ramp is selected.
MethodIonization Mode Specifies the ionization mode and polarity applied during data
acquisition.Data Specifies the type of data collected and stored on disk (see
“Types of Data Acquisition” on page 80).Scan Duration (secs)
Scan Time The duration of each scan in seconds.Inter-Scan Delay The time between a scan’s end and the next one’s start, in
seconds. No data are stored during this period.
78 Acquiring Data

Applying a Linear Ramp to the Cone Voltage1. On the Full Scan Function Editor, select Use Cone Voltage Ramp.2. Click CV Ramp to open the Cone Ramp dialog box (Figure 5-11).
Figure 5-11 Cone Ramp Dialog Box
3. Enter the required parameters (see Table 5-6 for details).
APcI Probe Note: The parameters in this pane are enabled when Ionization Mode is set to API.
Use Tune Page Settings
When selected, the APcI probe temperature set in the Tune window at the start of the acquisition is used.Note: The APcI probe temperature value cannot be altered by typing new values into the Tune window during the acquisition, since the new values are not downloaded during the acquisition.
Probe Temp The probe temperature, in degrees centigrade.
Table 5-6 Cone Ramp Dialog Box Parameters
Parameter Description
Ramp GradientStart Mass The mass (m/z) at which the lower cone voltage is specified.
Table 5-5 Full Scan Function Editor Parameters (Continued)
Parameter Description
Setting-Up Scanning Functions 79

Note: The two values of cone voltage specify a cone voltage gradient that is then extrapolated to cover the full mass range.
Types of Data AcquisitionIn the Full Scan Function Editor (see Figure 5-10), the Data parameter specifies the type of data to be collected and stored on disk:
• Centroid – Stores data as centroid, intensity, and mass-assigned peaks. Data are stored for every scan.
• Continuum – The signal received by the interface electronics is stored regularly to give an analog intensity picture of the data being acquired. Data are not processed into centroid peaks, but are stored for every scan.As data are always acquired and stored, even when no peaks are acquired, data files tend to be significantly larger than those for centroid data. It is possible, however, to set a threshold below which the data are not stored. Depending on the nature of the data acquired, this can greatly reduce these effects. The threshold can be set so that data considered to be “noise” can be discarded, thus improving data acquisition speed and reducing data file sizes. For more information about setting data thresholds, see Section 5.3.
• MCA (Multi Channel Analysis) – MCA data can be thought of as “summed continuum”, with only one intensity-accumulated scan stored for a given experiment. As each scan is acquired, its intensity data is added to the accumulated, summed data of previous scans.An advantage of MCA is that random noise does not accumulate as rapidly as real data and therefore effectively averages out over a number of scans. This emphasizes the real data and improves the signal-to-noise ratio.Another advantage of MCA is that scanning speeds can be increased and significantly less storage space is required, because data is stored only at the end of an experiment.The disadvantage of MCA is that, because there is only one scan, it cannot be used for time-resolved data.
End Mass The mass (m/z) at which the upper cone voltage is specified.Cone Start Volts The lower cone voltage.Cone End Volts The upper cone voltage.
Table 5-6 Cone Ramp Dialog Box Parameters (Continued)
Parameter Description
80 Acquiring Data

5.7.3 Setting-Up an SIR FunctionThe SIR (Selected Ion Recording) technique is typically used when only a few specific masses are to be monitored. Since most of the data acquisition time is spent on these masses, the technique is far more sensitive than full scanning.
The SIR Function Editor (Figure 5-12) is used to specify the masses to be monitored, along with their dwell times, spans, and inter-channel delay times.
Figure 5-12 SIR Function Editor
Procedure
1. On the MS Method Editor, click , or select Functions > MS SIR to open the SIR Function Editor.
2. Enter the required parameters (see Table 5-7 for details).
Setting-Up Scanning Functions 81

Table 5-7 SIR Function Editor Parameters
Parameter Description
Channels Mass (m/z) The mass (m/z) to be scanned.Dwell (Secs) The length of time, in seconds, for which the highlighted mass is
monitored.Cone (Volts) The cone voltage.Add Adds the current values in the Mass, Dwell, and Cone boxes to
the Function List (see “Adding a Function to the SIR Function List” on page 83).
Change Replaces the values in the selected function by the values currently in the Mass, Dwell, and Cone boxes (see “Modifying a Function in the SIR Function List” on page 83).
Delete Deletes the selected function from the list (see “Deleting a Function from the SIR Function List” on page 83).
Clear All Deletes all the functions from the list (see “Deleting All Functions from the SIR Function List” on page 83).
MethodIonization Mode The ionization mode and polarity used during data acquisition.Inter-Channel Delay
The time, in seconds, between finishing monitoring the current mass and starting monitoring the next mass in the Function List.
Inter-Scan Delay The time, in seconds, between finishing one scan and starting the next scan.
Repeats The number of repeats of the function. Repeats is only relevant for experiments having more than one function.
Span Specifies a small mass window applied centrally about the current mass. During acquisition, this range is scanned over the specified Dwell time. A span of zero can be set to scan the specified mass without a mass window.
Use Tune Cone Settings
When selected, the cone voltage set in the Tune window at the start of the acquisition is used.Note: The cone voltage value cannot be altered during acquisition by typing new values into the Tune window, since the new values are not downloaded during acquisition.
82 Acquiring Data

Adding a Function to the SIR Function ListUp to 32 functions can be entered in the Function List.
1. Enter the required values into the Mass, Dwell, and Cone boxes.2. Click Add.
Modifying a Function in the SIR Function List1. Click on the function to select it.
The values for the selected function are displayed in the Mass, Dwell, and Cone boxes.
2. Change the values in the Mass, Dwell, or Cone boxes as required.3. Click Change to update the values in the Function List.
Deleting a Function from the SIR Function List1. Click on the function to select it.2. Click Delete.
Deleting All Functions from the SIR Function ListTo delete all the functions from the Function List, click Clear All.
Retention Window (Mins)
Start The start of the retention time, in minutes, during which the current function is active.
End The end of the retention time, in minutes, during which the current function is active.
APcI Probe Note: The parameters in this frame are enabled when Ionization Mode is set to API.
Use Tune Page Settings
When selected, the APcI probe temperature set in the Tune window at the start of the acquisition is used.Note: The APcI probe temperature value cannot be altered by typing new values into the Tune window during the acquisition, since the new values are not downloaded during the acquisition.
Probe Temp The probe temperature, in degrees centigrade.
Table 5-7 SIR Function Editor Parameters (Continued)
Parameter Description
Setting-Up Scanning Functions 83

5.7.4 Setting-Up MS/MS Scanning Functions1. On the MS Method Editor (see Figure 5-6), click the appropriate toolbar function
button to open the appropriate Function Editor. The MS/MS scanning Function Editors are shown in Figure 5-13.
Note: No toolbar button exists for the MS2 scan function. Select Functions > MS2 Scan to open the MS2 Function Editor.
2. Enter the required parameters (see the following sections).
Note: Many of the fields in the MS/MS editors are similar to those in the Full Scan Function Editor. Only fields that differ significantly are described.
Figure 5-13 MS/MS Scanning Function Editors
84 Acquiring Data
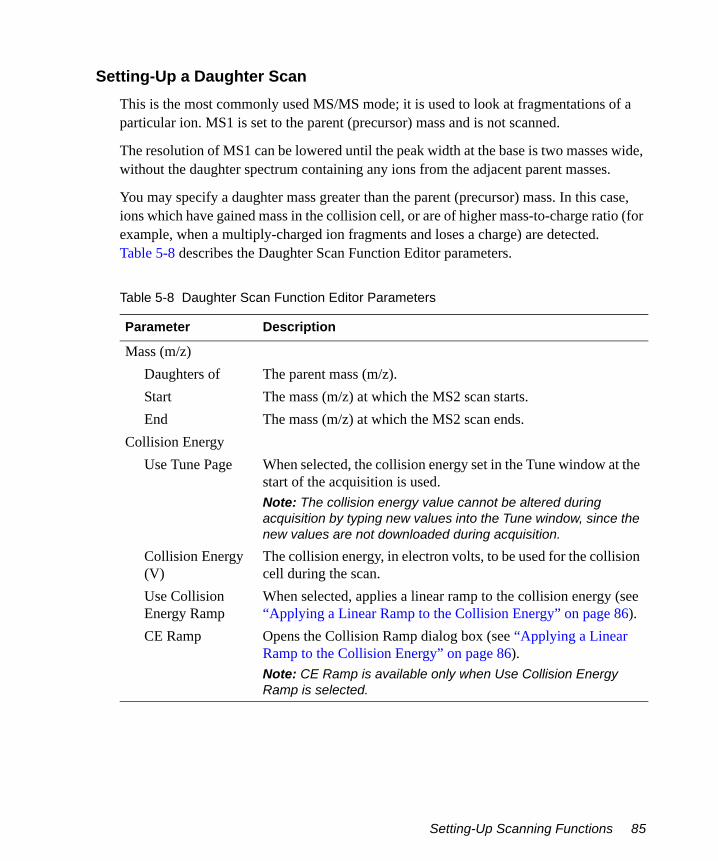
Setting-Up a Daughter ScanThis is the most commonly used MS/MS mode; it is used to look at fragmentations of a particular ion. MS1 is set to the parent (precursor) mass and is not scanned.
The resolution of MS1 can be lowered until the peak width at the base is two masses wide, without the daughter spectrum containing any ions from the adjacent parent masses.
You may specify a daughter mass greater than the parent (precursor) mass. In this case, ions which have gained mass in the collision cell, or are of higher mass-to-charge ratio (for example, when a multiply-charged ion fragments and loses a charge) are detected. Table 5-8 describes the Daughter Scan Function Editor parameters.
Table 5-8 Daughter Scan Function Editor Parameters
Parameter Description
Mass (m/z)Daughters of The parent mass (m/z).Start The mass (m/z) at which the MS2 scan starts.End The mass (m/z) at which the MS2 scan ends.
Collision EnergyUse Tune Page When selected, the collision energy set in the Tune window at the
start of the acquisition is used.Note: The collision energy value cannot be altered during acquisition by typing new values into the Tune window, since the new values are not downloaded during acquisition.
Collision Energy (V)
The collision energy, in electron volts, to be used for the collision cell during the scan.
Use Collision Energy Ramp
When selected, applies a linear ramp to the collision energy (see “Applying a Linear Ramp to the Collision Energy” on page 86).
CE Ramp Opens the Collision Ramp dialog box (see “Applying a Linear Ramp to the Collision Energy” on page 86).Note: CE Ramp is available only when Use Collision Energy Ramp is selected.
Setting-Up Scanning Functions 85

Applying a Linear Ramp to the Collision Energy1. On the Function Editor, select Use Collision Energy Ramp.2. Click CE Ramp to open the Collision Ramp dialog box (Figure 5-14).
Figure 5-14 Collision Ramp Dialog Box
3. Enter the required parameters (see Table 5-9 for details).
Note: The two values of collision energy specify a collision energy gradient that is then extrapolated to cover the full mass range.
Table 5-9 Collision Ramp Dialog Box Parameters
Parameter Description
Ramp GradientStart Mass The mass (m/z) at which the lower collision energy is specified.End Mass The mass (m/z) at which the upper collision energy is specified.CE Start The lower collision energy.CE End The upper collision energy.
86 Acquiring Data
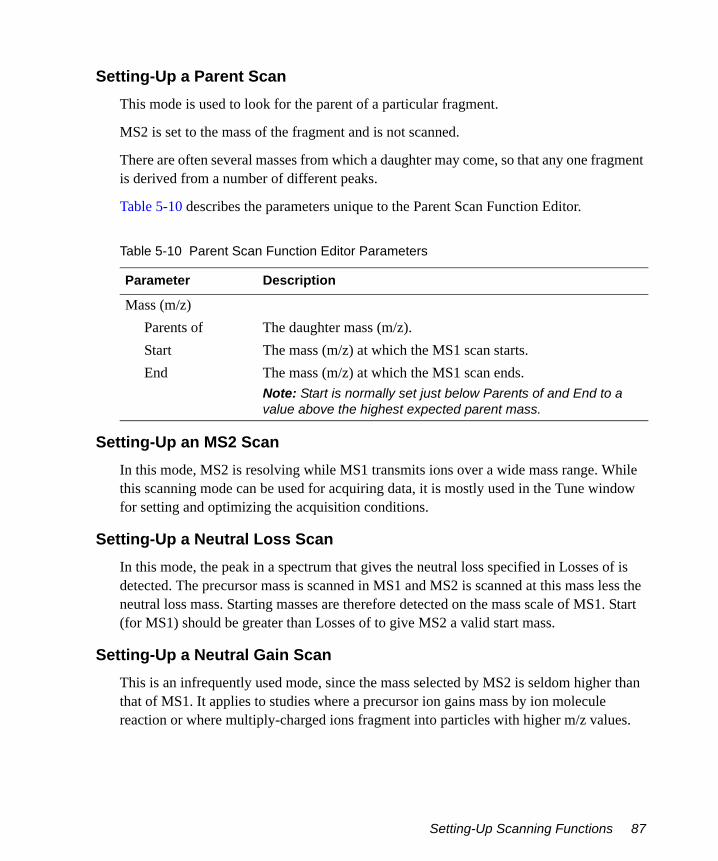
Setting-Up a Parent ScanThis mode is used to look for the parent of a particular fragment.
MS2 is set to the mass of the fragment and is not scanned.
There are often several masses from which a daughter may come, so that any one fragment is derived from a number of different peaks.
Table 5-10 describes the parameters unique to the Parent Scan Function Editor.
Setting-Up an MS2 ScanIn this mode, MS2 is resolving while MS1 transmits ions over a wide mass range. While this scanning mode can be used for acquiring data, it is mostly used in the Tune window for setting and optimizing the acquisition conditions.
Setting-Up a Neutral Loss ScanIn this mode, the peak in a spectrum that gives the neutral loss specified in Losses of is detected. The precursor mass is scanned in MS1 and MS2 is scanned at this mass less the neutral loss mass. Starting masses are therefore detected on the mass scale of MS1. Start (for MS1) should be greater than Losses of to give MS2 a valid start mass.
Setting-Up a Neutral Gain ScanThis is an infrequently used mode, since the mass selected by MS2 is seldom higher than that of MS1. It applies to studies where a precursor ion gains mass by ion molecule reaction or where multiply-charged ions fragment into particles with higher m/z values.
Table 5-10 Parent Scan Function Editor Parameters
Parameter Description
Mass (m/z)Parents of The daughter mass (m/z).Start The mass (m/z) at which the MS1 scan starts.End The mass (m/z) at which the MS1 scan ends.
Note: Start is normally set just below Parents of and End to a value above the highest expected parent mass.
Setting-Up Scanning Functions 87

5.7.5 Setting-Up an MRM FunctionMultiple reaction monitoring (MRM) functions are set-up in a similar way to SIR functions (see Section 5.7.3) but allow a number of MS/MS transitions (fragmentations) between MS1 and MS2 to be monitored.
All fields in the MRM Function Editor (Figure 5-15) are similar to those described in Section 5.7.3.
Figure 5-15 MRM Function Editor
5.7.6 Setting-Up a Survey FunctionSurvey scans are used to search for precursor ions.
1. In the MS Method Editor (see Figure 5-6), delete any existing functions from the Function List.
2. Click or select Functions > Survey Scan to open the Survey Scan Function Editor.
Note: The MS Method Editor does not add survey functions to the list if non-survey functions are present.
3. Select the required tab and specify the appropriate parameters (see below).
88 Acquiring Data

Setting-Up the Parameters for MS and MS/MS ScanningThe Survey and MSMS Template pages (Figure 5-16) allow you to specify the parameters for MS and MS/MS scanning during the survey; they are similar to the MS/MS scanning Function Editor pages (see Section 5.7.4). The MSMS Template page also allows you to select the required Instrument Parameter file (.ipr).
Figure 5-16 Survey Scan Function Editor: Survey and MSMS Template Pages
Setting-Up Scanning Functions 89

Setting-Up MS to MS/MS SwitchingThe MS to MSMS page (Figure 5-17) allows MS to MS/MS switching to be set-up.
Figure 5-17 Survey Scan Function Editor: MS to MSMS Page
Table 5-11 describes the MS to MSMS page parameters.
90 Acquiring Data

Table 5-11 Survey Scan Function Editor: MS to MSMS Page Parameters
Parameter Description
MS to MSMS Switch Criteria
TIC When selected, the switch from MS to MS/MS scanning occurs when the TIC of the spectrum rises above the specified Threshold value.
Intensity When selected, the switch from MS to MS/MS scanning occurs when the intensity of the largest peak rises above the specified Threshold value.
Threshold The value at which the switch from MS to MS/MS scanning occurs (TIC or Intensity).
Detection Window (Da)
When a peak is detected, no other peaks are sought within the mass range specified by plus or minus this value, centered about the detected peak.
Number of Components
Selects the maximum number of peaks of interest to detect from an MS scan. The software will attempt to find the Number of Components from an MS spectrum. Once the maximum number of components in the spectrum for the specified criteria is found, new MS/MS functions are generated automatically and a switch to MS/MS scanning performed.
Retention Time Window (s)
The Retention Time Window is used by the Include and Exclude lists. A mass will be included or excluded if it appears at the specified retention time plus or minus this value.
Charge StateTolerance Window +/- (Da)
If a peak is detected, but it is outside the Tolerance Window of where it should be, it is ignored by the Charge State Recognition routines.
Extraction Window (Da)
The window around the base peak for data to be extracted, in Da. For example, if the Extraction Window is 1 Da, the window will extend 0.5 Da either side of the base peak. The extracted data is then used to calculate the charge state.
Precursor SelectionEverything Monitors all the valid masses satisfying the selection criteria.
Setting-Up Scanning Functions 91
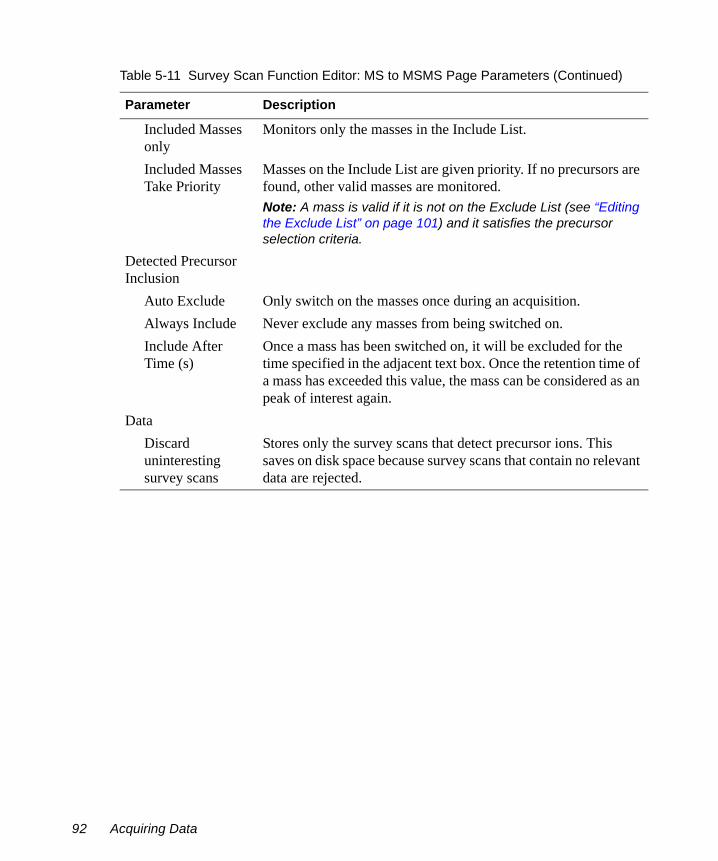
Included Masses only
Monitors only the masses in the Include List.
Included Masses Take Priority
Masses on the Include List are given priority. If no precursors are found, other valid masses are monitored.Note: A mass is valid if it is not on the Exclude List (see “Editing the Exclude List” on page 101) and it satisfies the precursor selection criteria.
Detected Precursor Inclusion
Auto Exclude Only switch on the masses once during an acquisition.Always Include Never exclude any masses from being switched on.Include After Time (s)
Once a mass has been switched on, it will be excluded for the time specified in the adjacent text box. Once the retention time of a mass has exceeded this value, the mass can be considered as an peak of interest again.
DataDiscard uninteresting survey scans
Stores only the survey scans that detect precursor ions. This saves on disk space because survey scans that contain no relevant data are rejected.
Table 5-11 Survey Scan Function Editor: MS to MSMS Page Parameters (Continued)
Parameter Description
92 Acquiring Data

Setting-Up MS/MS to MS SwitchingThe MSMS to MS page (Figure 5-18) allows MS/MS to MS switching to be set-up.
Figure 5-18 Survey Scan Function Editor: MSMS to MS Page
When MS/MS functions have been generated, they are carried out in parallel until the conditions for switching to MS are satisfied. When all MS/MS functions have stopped, the MS survey function is again carried out.
Table 5-12 describes the MSMS to MS page parameters.
Setting-Up Scanning Functions 93

Table 5-12 Survey Scan Function Editor: MSMS to MS Page Parameters
Parameter Description
MSMS to MS Switch Criteria
TIC falling below threshold
When selected, the switch from MS/MS to MS scanning occurs when the TIC of the spectrum falls below the specified Threshold value.
TIC rising above threshold
When selected, the switch from MS/MS to MS scanning occurs when the TIC of the spectrum rises above the specified Threshold value.
Intensity falling below threshold
When selected, the switch from MS/MS to MS scanning occurs when the intensity of the largest peak falls below the specified Threshold value.
Threshold (Counts/s)
The value at which the switch from MS/MS to MS scanning occurs.
MSMS to MS Switch Method
Default When selected, the MS/MS function stops when the MS/MS to MS switch criteria are met.
After time (s) When selected, the MS/MS function stops when the MS/MS to MS switch criteria are met, or otherwise when the specified time has elapsed.
94 Acquiring Data

Including MassesThe Include page (Figure 5-19) allows masses (m/z) that are of interest, and prompt a switch to MS/MS operation, to be set-up.
Figure 5-19 Survey Scan Function Editor: Include Page
These masses are listed in the Include List. It is normally used when the Survey Scan Function Editor MS to MSMS page Included Masses only option, or Included Masses Take Priority option is selected.
Table 5-13 describes the Include page parameters.
Setting-Up Scanning Functions 95
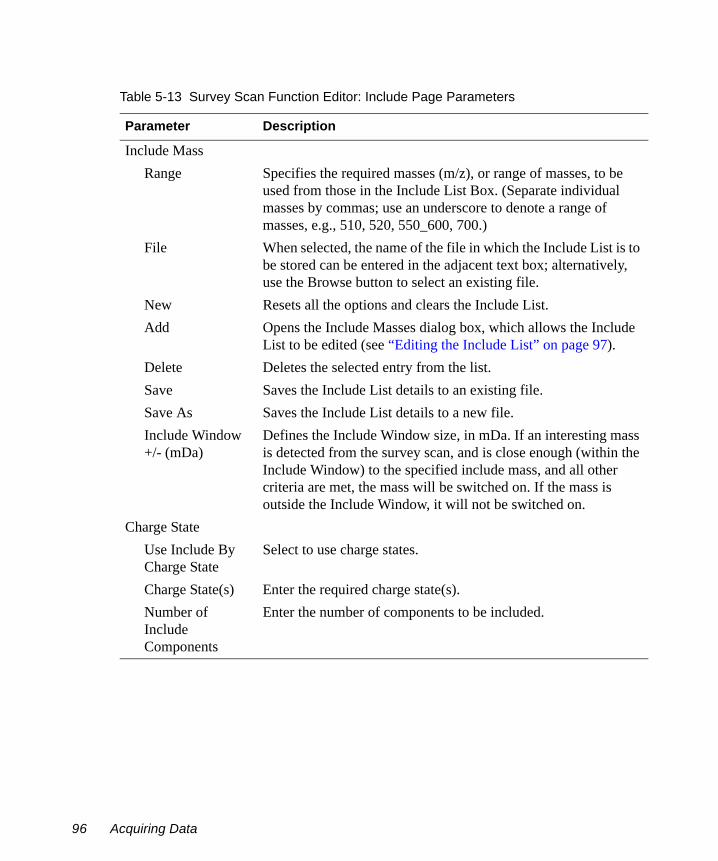
Table 5-13 Survey Scan Function Editor: Include Page Parameters
Parameter Description
Include MassRange Specifies the required masses (m/z), or range of masses, to be
used from those in the Include List Box. (Separate individual masses by commas; use an underscore to denote a range of masses, e.g., 510, 520, 550_600, 700.)
File When selected, the name of the file in which the Include List is to be stored can be entered in the adjacent text box; alternatively, use the Browse button to select an existing file.
New Resets all the options and clears the Include List.Add Opens the Include Masses dialog box, which allows the Include
List to be edited (see “Editing the Include List” on page 97).Delete Deletes the selected entry from the list.Save Saves the Include List details to an existing file.Save As Saves the Include List details to a new file.Include Window +/- (mDa)
Defines the Include Window size, in mDa. If an interesting mass is detected from the survey scan, and is close enough (within the Include Window) to the specified include mass, and all other criteria are met, the mass will be switched on. If the mass is outside the Include Window, it will not be switched on.
Charge StateUse Include By Charge State
Select to use charge states.
Charge State(s) Enter the required charge state(s).Number of Include Components
Enter the number of components to be included.
96 Acquiring Data

Editing the Include List
1. On the Survey Scan Function Editor’s Include page, click Add to open the Include Masses dialog box (Figure 5-20).
Note: To edit an existing entry in the Include List, double-click it.
Figure 5-20 Include Masses Dialog Box
2. To enter a value, select the check box for the required option and enter the value in the adjacent text box.
Note: The text box becomes available only when you select an option.
Table 5-14 describes the Include Masses dialog box parameters.
Setting-Up Scanning Functions 97

Table 5-14 Include Masses Dialog Box Parameters
Parameter Description
Add/ModifyInclude Mass (m/z)
The specified mass (m/z) to include in the Function Switching process.
Retention Time (min)
If the specified mass elutes at the specified Retention Time and is within the MS to MSMS page Retention Time Window (s) value, the mass is considered to be on the Include List. This allows masses eluting from a column to be included as a mass of interest.
Collision Energy The collision energy used to split the detected mass for the MS/MS scans.
Cone Voltage The Cone Voltage value applied during the MS/MS scans.Charge State Include the mass by its charge state. Scan Time (min) The Scan Time, in minutes, used during MS/MS scans for the
detected mass.Inter-Scan Time (sec)
The Inter-Scan Time used during MS/MS scans for the detected mass.
98 Acquiring Data
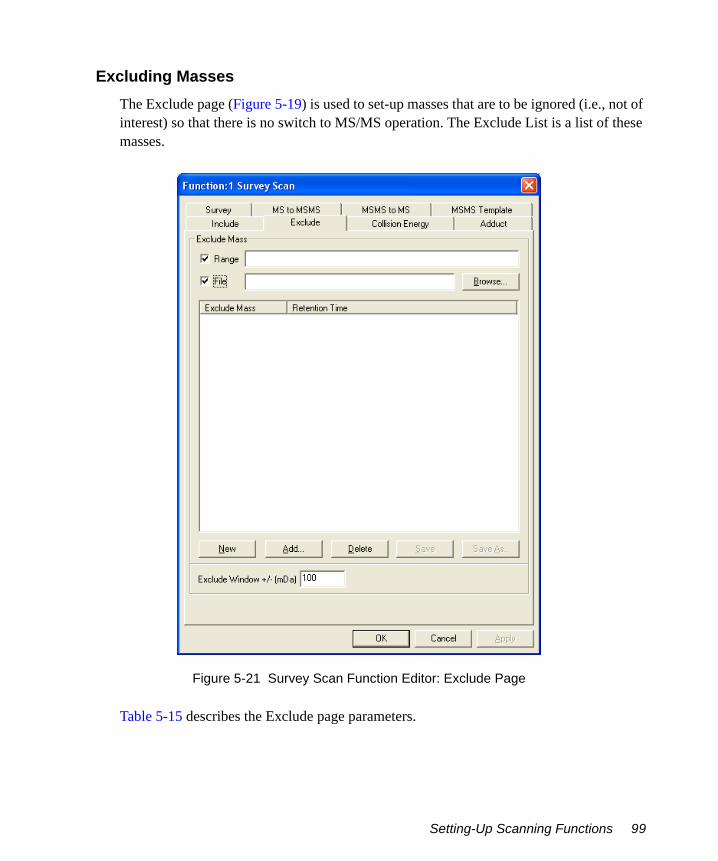
Excluding MassesThe Exclude page (Figure 5-19) is used to set-up masses that are to be ignored (i.e., not of interest) so that there is no switch to MS/MS operation. The Exclude List is a list of these masses.
Figure 5-21 Survey Scan Function Editor: Exclude Page
Table 5-15 describes the Exclude page parameters.
Setting-Up Scanning Functions 99
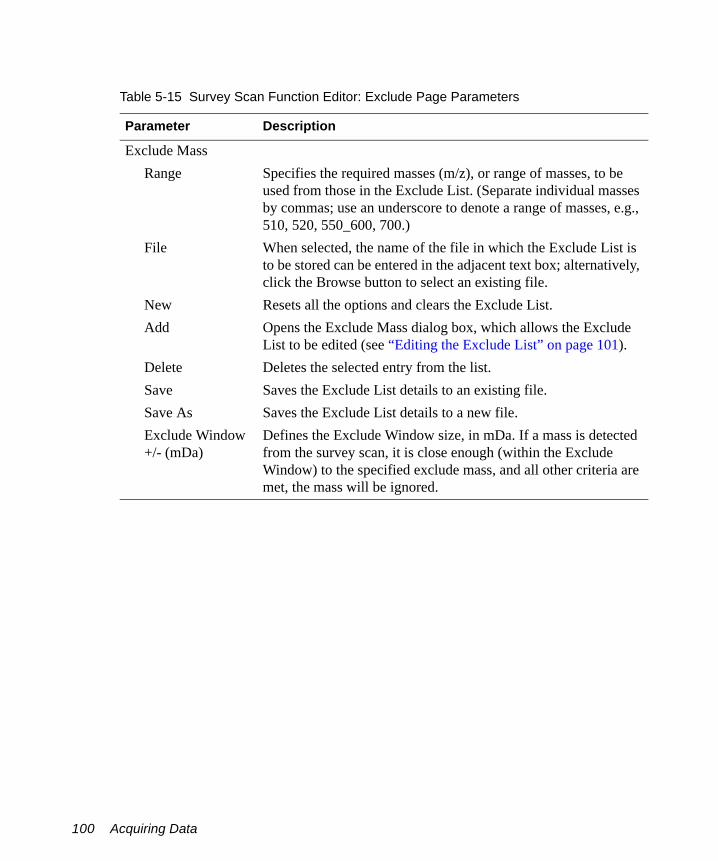
Table 5-15 Survey Scan Function Editor: Exclude Page Parameters
Parameter Description
Exclude MassRange Specifies the required masses (m/z), or range of masses, to be
used from those in the Exclude List. (Separate individual masses by commas; use an underscore to denote a range of masses, e.g., 510, 520, 550_600, 700.)
File When selected, the name of the file in which the Exclude List is to be stored can be entered in the adjacent text box; alternatively, click the Browse button to select an existing file.
New Resets all the options and clears the Exclude List.Add Opens the Exclude Mass dialog box, which allows the Exclude
List to be edited (see “Editing the Exclude List” on page 101).Delete Deletes the selected entry from the list.Save Saves the Exclude List details to an existing file.Save As Saves the Exclude List details to a new file.Exclude Window +/- (mDa)
Defines the Exclude Window size, in mDa. If a mass is detected from the survey scan, it is close enough (within the Exclude Window) to the specified exclude mass, and all other criteria are met, the mass will be ignored.
100 Acquiring Data
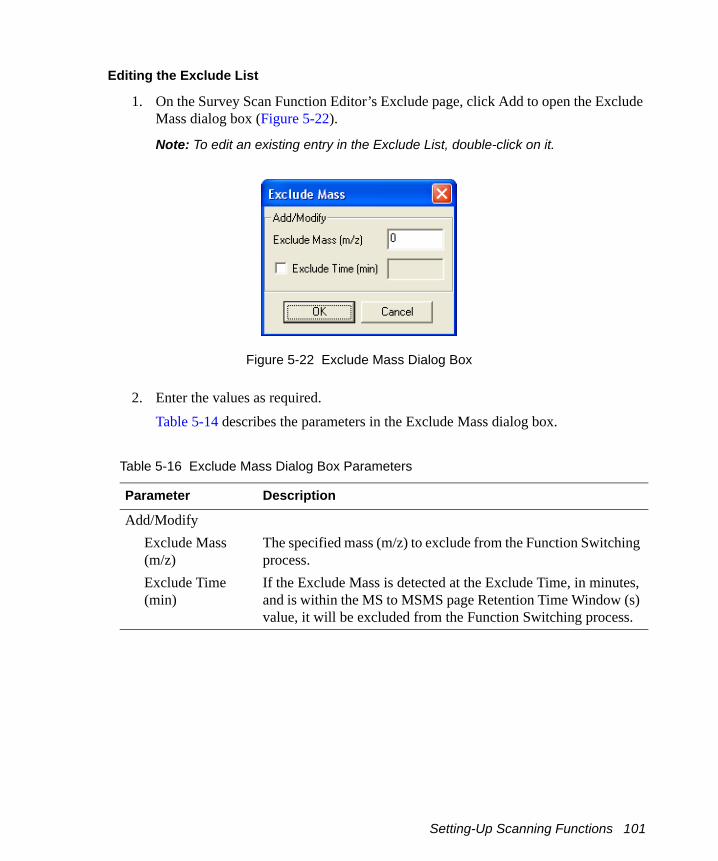
Editing the Exclude List
1. On the Survey Scan Function Editor’s Exclude page, click Add to open the Exclude Mass dialog box (Figure 5-22).
Note: To edit an existing entry in the Exclude List, double-click on it.
Figure 5-22 Exclude Mass Dialog Box
2. Enter the values as required.Table 5-14 describes the parameters in the Exclude Mass dialog box.
Table 5-16 Exclude Mass Dialog Box Parameters
Parameter Description
Add/ModifyExclude Mass (m/z)
The specified mass (m/z) to exclude from the Function Switching process.
Exclude Time (min)
If the Exclude Mass is detected at the Exclude Time, in minutes, and is within the MS to MSMS page Retention Time Window (s) value, it will be excluded from the Function Switching process.
Setting-Up Scanning Functions 101
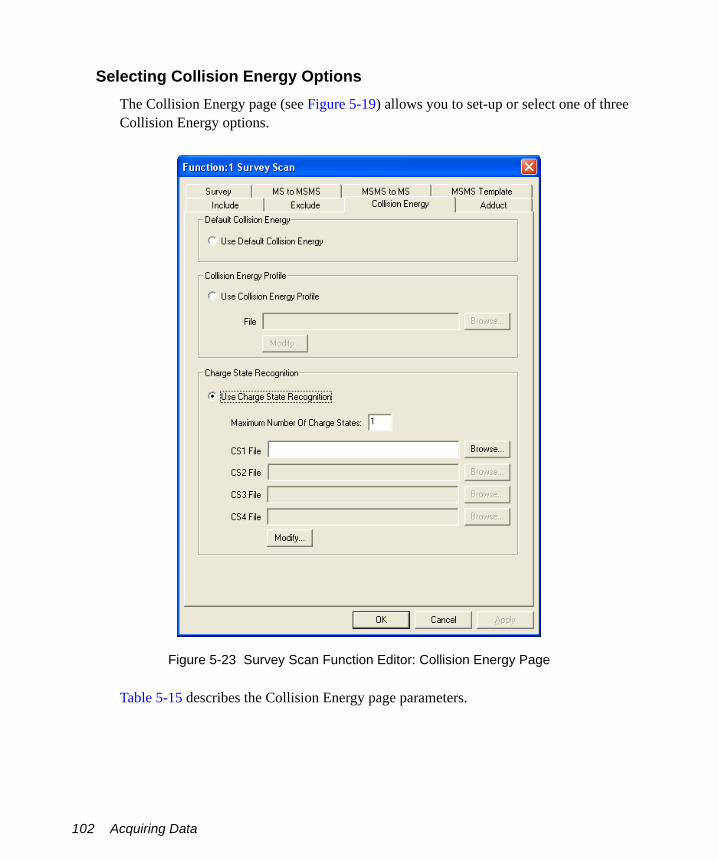
Selecting Collision Energy OptionsThe Collision Energy page (see Figure 5-19) allows you to set-up or select one of three Collision Energy options.
Figure 5-23 Survey Scan Function Editor: Collision Energy Page
Table 5-15 describes the Collision Energy page parameters.
102 Acquiring Data

Table 5-17 Survey Scan Function Editor: Collision Energy Page Parameters
Parameter Description
Default Collision Energy
Use Default Collision Energy
Uses a single default value, which is configured on the MSMS Template page (see Figure 5-16). This allows either the Tune window value or the value specified on the MSMS Template page to be used. If the Tune window value is to be used, the value can be changed during the scan, but it only becomes effective on the next switch from MS to MS/MS.
Collision Energy Profile
Use Collision Energy Profile
Selecting this option enables the controls in the Collision Energy Profile frame.The Collision Energy Profile is a range of Collision Energy values, which are associated with a specified mass. You can enter up to five different Collision Energy values.When an interesting mass is detected in an MS scan, and the mass is on the Collision Energy Profile list, these Collision Energy values are used during the MS/MS scans for the mass.
File The file name of the Collision Energy Profile file.Browse Allows you to browse for the required Collision Energy Profile
file.Modify Opens the CE Profile dialog box, which allows a table of
collision energy profiles to be created for masses that are being switched on (see “Creating a Table of Collision Energy Profiles” on page 105).
Setting-Up Scanning Functions 103

Charge State Recognition
Use Charge State Recognition
Selecting this option enables the controls in the Charge State Recognition frame.When a mass of interest is detected in an MS scan, its charge state is calculated. Using the mass and its charge state, a Collision Energy value can be obtained from the entered charge state table. This value is then used during MS/MS scanning.The Include page’s Include by Charge State and the Collision Energy page’s Use Charge State Recognition functionalities can be used independently, or both can be configured to combine their individual functionalities (see “Charge State Recognition Functionality” on page 108, for further details).
Maximum Number Of Charge States
Enter the number of charge states to be considered (maximum four) in this text box; the following CSx File text boxes are enabled, as appropriate, by this action.
CS1 File, etc. Enter the file name of the required charge state file, or use the adjacent Browse button to search for a file.
Modify Opens the Modify Charge State dialog box; this is used to create, or modify charge state files (see “Creating or Modifying Charge State Files” on page 106, for details).
Table 5-17 Survey Scan Function Editor: Collision Energy Page Parameters (Continued)
Parameter Description
104 Acquiring Data
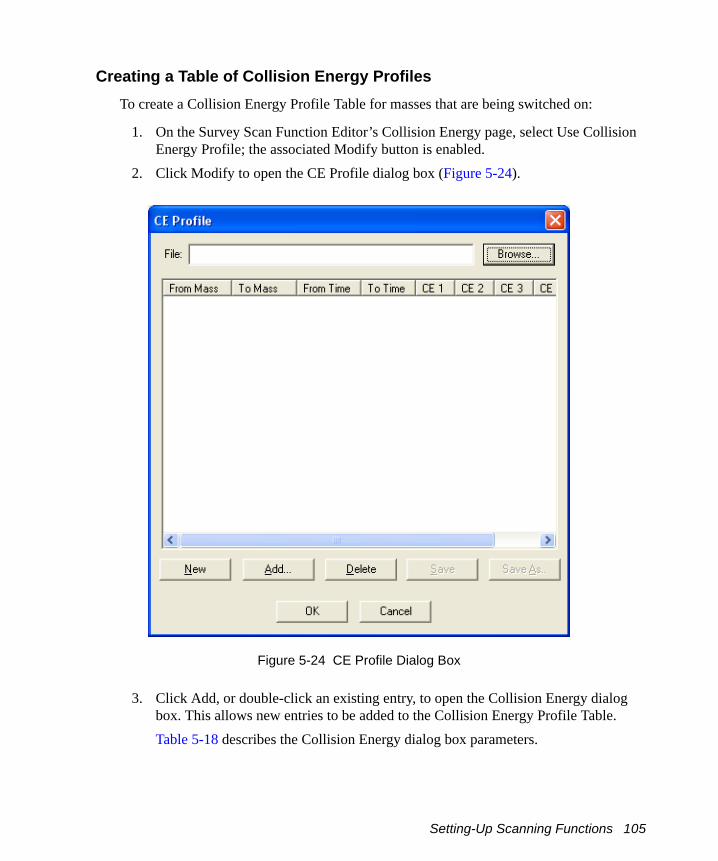
Creating a Table of Collision Energy ProfilesTo create a Collision Energy Profile Table for masses that are being switched on:
1. On the Survey Scan Function Editor’s Collision Energy page, select Use Collision Energy Profile; the associated Modify button is enabled.
2. Click Modify to open the CE Profile dialog box (Figure 5-24).
Figure 5-24 CE Profile Dialog Box
3. Click Add, or double-click an existing entry, to open the Collision Energy dialog box. This allows new entries to be added to the Collision Energy Profile Table.Table 5-18 describes the Collision Energy dialog box parameters.
Setting-Up Scanning Functions 105

Creating or Modifying Charge State Files
Use the Modify Charge State dialog box (Figure 5-25) to create or modify charge state files.
1. On the Survey Scan Function Editor’s Collision Energy page (see Figure 5-23), select Use Charge State Recognition.
2. Enter the required Maximum Number of Charge States.3. Click Modify to open the Modify Charge State dialog box.
Note: The number of Modify CS tabs displayed in this dialog box corresponds with the Maximum Number of Charge States selected in step 2.
Table 5-18 Collision Energy Dialog Box Parameters
Parameter Description
Add/ModifyFrom Mass (m/z) Start mass (m/z) for the mass range in which the collision energy
profile is to be used.To Mass (m/z) End mass (m/z) for the mass range in which the collision energy
profile is to be used.From Time (min) Start time for the time range in which the collision energy profile
is to be used.To Time (min) End time for the time range in which the collision energy profile
is to be used.CE1, etc. The five allowed collision energy values, which will be applied
to a relevant mass at a relevant time during MS/MS scanning. Selecting the check box for one value enables the check box for the following value.
OK Closes the Collision Energy dialog box and enters the selected values in the CE Profile dialog box Collision Energy Profile Table.
106 Acquiring Data

Figure 5-25 Modify Charge State Dialog Box
Adding New Entries to the Collision Energy Profile Table
1. Click the appropriate Modify CS tab.2. Click Add or double-click an existing entry to open the Charge State Mass dialog
box.3. Enter the required values. Table 5-19 describes the parameters in the Charge State
Mass dialog box.
Setting-Up Scanning Functions 107

Saving a Collision Energy Profile Table
Click Save to save the collision energy profile table to a text file. If the collision energy profile table has not been saved previously, a standard Windows dialog box is opened, allowing you to specify the file name and path. Click Save As to save an existing list to a new filename.
Opening a Collision Energy Profile Table
Click Browse to navigate to the collision energy profile table text file, or enter the filename and path in the File text box.
Charge State Recognition FunctionalityYou can apply charge state recognition functionalities from the Survey Scan Function Editor Include (see Figure 5-19) and Collision Energy (see Figure 5-23) pages. The functionalities, Include by Charge State and Use Charge State Recognition, can operate independently or together.
Using Charge State Recognition with Include by Charge State Disabled
This allows the software to switch on any peak of interest, but a collision energy value will be calculated only for those masses with a charge state that matches those set up in the Charge State Recognition frame. For all other masses, the default collision energy will be applied; this is either the Tune window value, or the value specified in the Survey Scan dialog box MSMS Template page.
For example, if the Include by Charge State option is disabled, and the Charge State Recognition has been configured for Charge States 1 and 2, any detected mass of interest switches on in the normal way. Masses switched on with a charge state of 1 or 2 will have
Table 5-19 Charge State Mass Dialog Box Parameters
Parameter Description
Add/ModifyCS Mass (m/z) Specifies the mass (m/z) of interest.Collision Energy Sets the correct collision energy value to break up the mass of
interest.OK Closes the Charge State Mass dialog box and enters the selected
values in the Modify Charge State dialog box Mass List.
108 Acquiring Data
a collision energy value calculated from the Charge State Recognition table. All other masses use the specified default collision energy value.
Using Charge State Recognition with Include by Charge State Enabled
This restricts the masses that are switched on to those with the correct charge state. A collision energy value will be calculated for those masses with a charge state that is configured in both Include by Charge State and Charge State Recognition. For masses with a charge state which is only on the Include by Charge State list, a default collision energy value will be used.
For example, if the Include by Charge State section is configured to allow charge states of 2 and 3, and the Charge State Recognition section is configured for Charge States 1 and 2, only masses with a charge state of 2 or 3 are switched on. Masses switched on with a charge state of 2 will have a collision energy value calculated from the Charge State Recognition table. Masses with a charge state of 3 will use the specified default collision energy value.
Creating an Adduct ListIn MassLynx, an adduct is the mass of an ion added to an original mass.
The Adduct page (Figure 5-26) allows you to create a list of such masses.
If a mass of interest (target mass) on the Include List is detected, the mass spectrometer is switched to MS/MS operation and that mass is added to the Exclude List, so that it is ignored if detected again. Also, when the target mass is detected, any mass in the Adduct page adduct list is added to that target mass, and the resulting mass added to the Exclude List so that the adduct is also ignored if it is detected.
For example, for positive ion operation:
If the molecular target mass (M) is 200, the target mass (m/z) on the Include List is 201 (M + H+). When detected, a switch to MS/MS operation is triggered and the mass is added to the Exclude List.
A typical adduct is sodium (Na, mass 23), for which the target adduct mass is 223 (M + Na+). Hence the value to be added to the Adduct page adduct list is (M + Na+) - (M + H+) = (223 - 201) = 22.
Similarly, if the adduct is ammonium (NH4, mass 18), the target adduct mass is 218 (M + NH4
+). Hence the value to be added to the Adduct page adduct list is (M + NH4
+) - (M + H+) = (218 - 201) = 17.
Setting-Up Scanning Functions 109

Figure 5-26 Survey Scan Function Editor: Adduct Page
Adding an Adduct Mass to the Adduct List
1. Click Add, or double-click an existing mass in the adduct list to open the Adduct Mass dialog box.
2. Enter the required value in the Add/Modify, Step Size (m/z) text box.3. Click OK to add the value to the adduct list.
Saving an Adduct List
Click Save to save the adduct list to a text file. If the adduct list has not been saved previously, a standard Windows dialog box is opened, allowing you to specify the file name and path. Click Save As to save an existing list to a new filename.
110 Acquiring Data

Opening an Existing Adduct List
Click Browse to navigate to the adduct list text file, or enter the filename and path in the File text box.
5.7.7 Monitoring AcquisitionsWhen an acquisition is started, the Function Switching Status dialog box opens, showing the precursors currently running.
Setting-Up Scanning Functions 111

112 Acquiring Data
Chapter 6Setting-Up Mass Calibration
6.1 Overview
MassLynx can perform a fully automated instrument mass calibration. This calibrates the instrument for static and scanning modes of acquisition over a variety of mass ranges and scanning speeds.
A mass spectrum of a reference sample (a calibration file) is acquired and is compared with the expected masses of the peaks in the sample (stored as a reference file). The mass differences between the reference peaks and calibration peaks are calculated; these are the calibration points. A calibration curve is then fitted through the calibration points.
Each calibration point’s vertical distance from the curve is calculated. This represents the remaining (or residual) mass difference after calibration.
The standard deviation of the residual masses is also calculated. This value is the best single indication of the calibration’s accuracy.
6.1.1 Types of CalibrationEach quadrupole analyzer requires up to three calibration curves:
• A static calibration is used to “park” the analyzer accurately on a specific mass of interest (for example, in tuning, SIR and MRM).
• A scanning calibration enables peaks acquired in a scanning acquisition to be mass measured accurately.
• A scan speed compensation calibration compensates for lag time in the system when the instrument is scanned rapidly.
A separate mass spectrum of the reference sample is acquired for each selected calibration type (see the MassLynx User’s Guide for details).
Overview 113
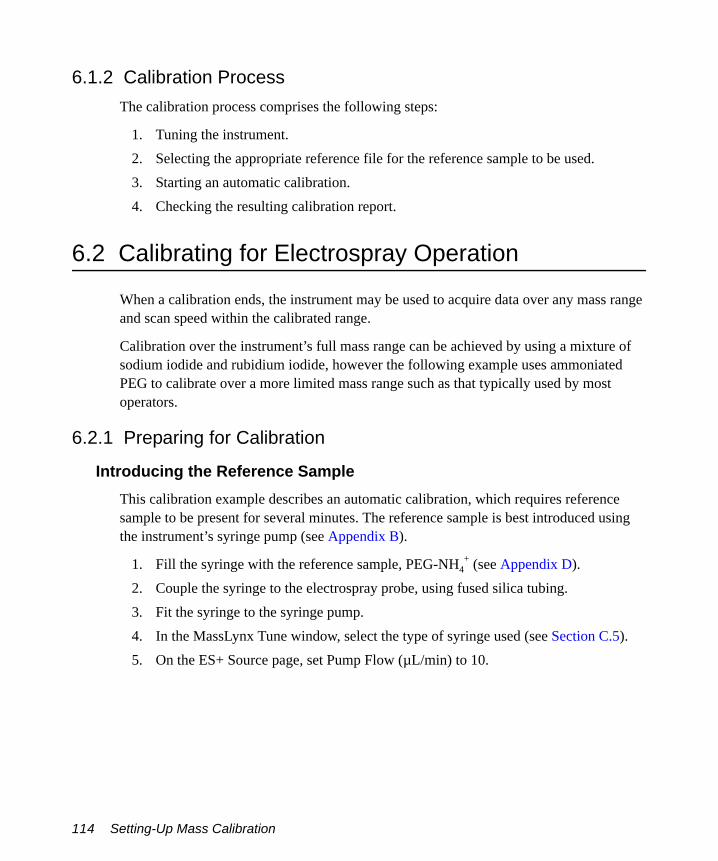
6.1.2 Calibration ProcessThe calibration process comprises the following steps:
1. Tuning the instrument.2. Selecting the appropriate reference file for the reference sample to be used.3. Starting an automatic calibration.4. Checking the resulting calibration report.
6.2 Calibrating for Electrospray Operation
When a calibration ends, the instrument may be used to acquire data over any mass range and scan speed within the calibrated range.
Calibration over the instrument’s full mass range can be achieved by using a mixture of sodium iodide and rubidium iodide, however the following example uses ammoniated PEG to calibrate over a more limited mass range such as that typically used by most operators.
6.2.1 Preparing for Calibration
Introducing the Reference SampleThis calibration example describes an automatic calibration, which requires reference sample to be present for several minutes. The reference sample is best introduced using the instrument’s syringe pump (see Appendix B).
1. Fill the syringe with the reference sample, PEG-NH4+ (see Appendix D).
2. Couple the syringe to the electrospray probe, using fused silica tubing.3. Fit the syringe to the syringe pump.4. In the MassLynx Tune window, select the type of syringe used (see Section C.5).5. On the ES+ Source page, set Pump Flow (µL/min) to 10.
114 Setting-Up Mass Calibration
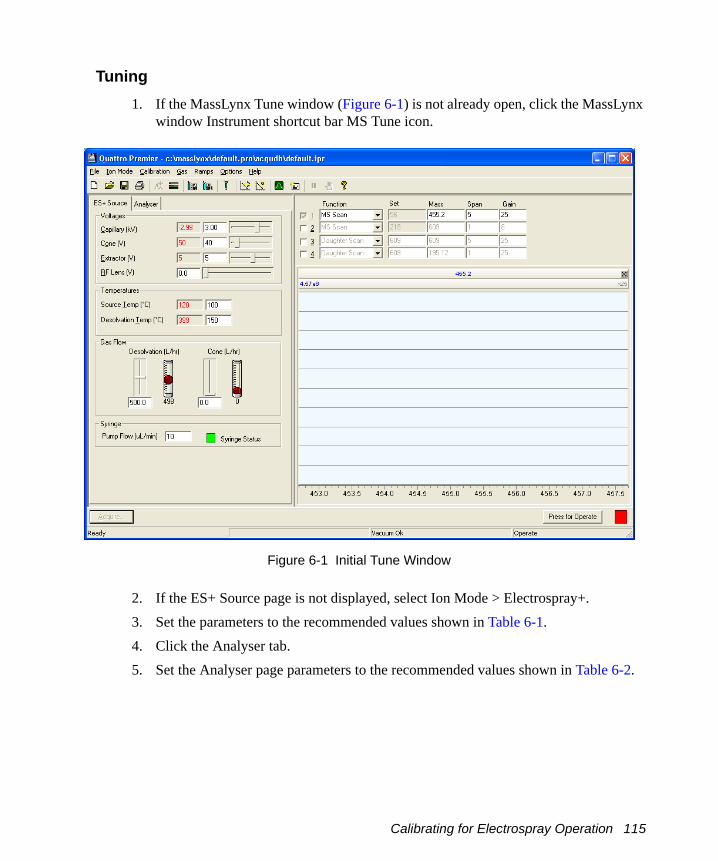
Tuning1. If the MassLynx Tune window (Figure 6-1) is not already open, click the MassLynx
window Instrument shortcut bar MS Tune icon.
Figure 6-1 Initial Tune Window
2. If the ES+ Source page is not displayed, select Ion Mode > Electrospray+.3. Set the parameters to the recommended values shown in Table 6-1.4. Click the Analyser tab.5. Set the Analyser page parameters to the recommended values shown in Table 6-2.
Calibrating for Electrospray Operation 115
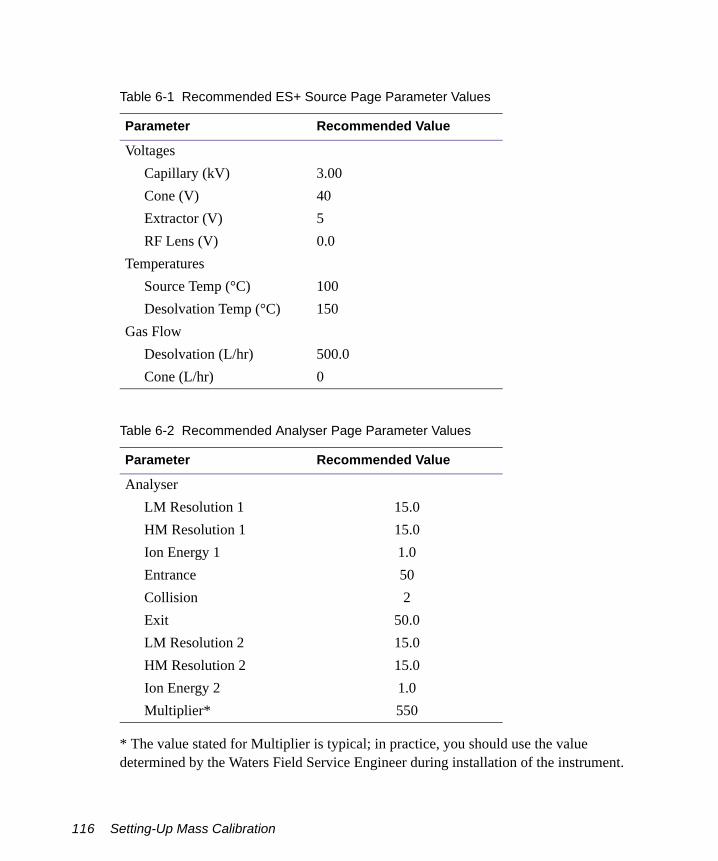
* The value stated for Multiplier is typical; in practice, you should use the value determined by the Waters Field Service Engineer during installation of the instrument.
Table 6-1 Recommended ES+ Source Page Parameter Values
Parameter Recommended Value
VoltagesCapillary (kV) 3.00Cone (V) 40Extractor (V) 5RF Lens (V) 0.0
TemperaturesSource Temp (°C) 100Desolvation Temp (°C) 150
Gas FlowDesolvation (L/hr) 500.0Cone (L/hr) 0
Table 6-2 Recommended Analyser Page Parameter Values
Parameter Recommended Value
AnalyserLM Resolution 1 15.0HM Resolution 1 15.0Ion Energy 1 1.0Entrance 50Collision 2Exit 50.0LM Resolution 2 15.0HM Resolution 2 15.0Ion Energy 2 1.0Multiplier* 550
116 Setting-Up Mass Calibration

6. Click to start the nitrogen flow.7. On the ES+ Source page, observe the Desolvation and Cone gas flows; confirm they
are stable and are correct.8. Click Press for Operate, and confirm that the adjacent instrument status indicator
shows green.
9. Click to start the syringe pump.10. In the Tune window, observe the displayed PEG masses (Figure 6-2).
Figure 6-2 Tune Window with PEG Peaks
11. On the Analyser page, set LM Resolution 1, HM Resolution 1 and Ion Energy 1 to give unit mass resolution for all the displayed peaks (the isotopes should be resolved).
12. Confirm that no ions are saturated. (If a peak is at full screen and at a gain of 1, it is saturated; adjust the value of Multiplier, or dilute the sample.)
Calibrating for Electrospray Operation 117
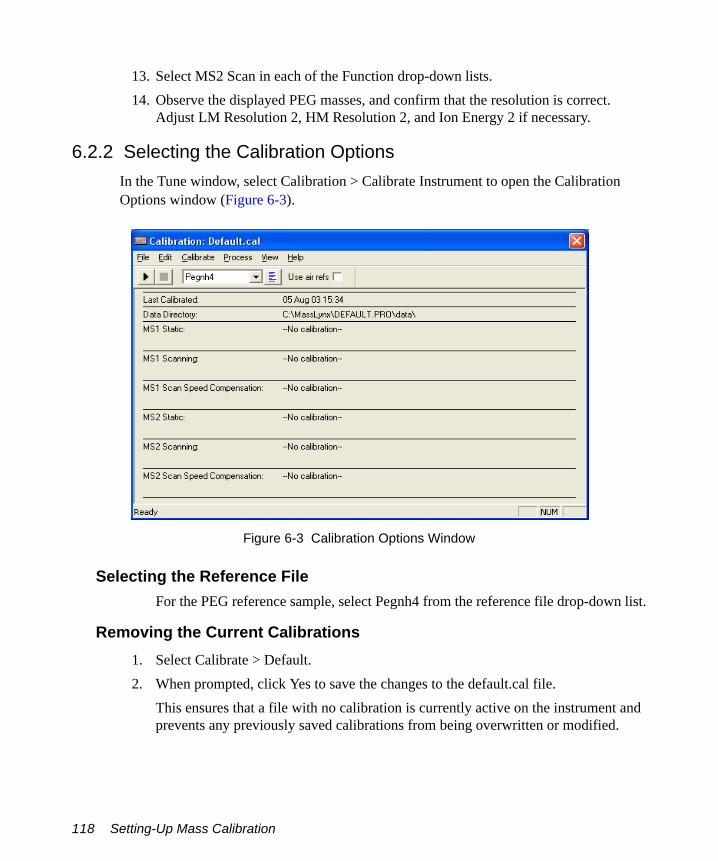
13. Select MS2 Scan in each of the Function drop-down lists.14. Observe the displayed PEG masses, and confirm that the resolution is correct.
Adjust LM Resolution 2, HM Resolution 2, and Ion Energy 2 if necessary.
6.2.2 Selecting the Calibration OptionsIn the Tune window, select Calibration > Calibrate Instrument to open the Calibration Options window (Figure 6-3).
Figure 6-3 Calibration Options Window
Selecting the Reference FileFor the PEG reference sample, select Pegnh4 from the reference file drop-down list.
Removing the Current Calibrations1. Select Calibrate > Default.2. When prompted, click Yes to save the changes to the default.cal file.
This ensures that a file with no calibration is currently active on the instrument and prevents any previously saved calibrations from being overwritten or modified.
118 Setting-Up Mass Calibration
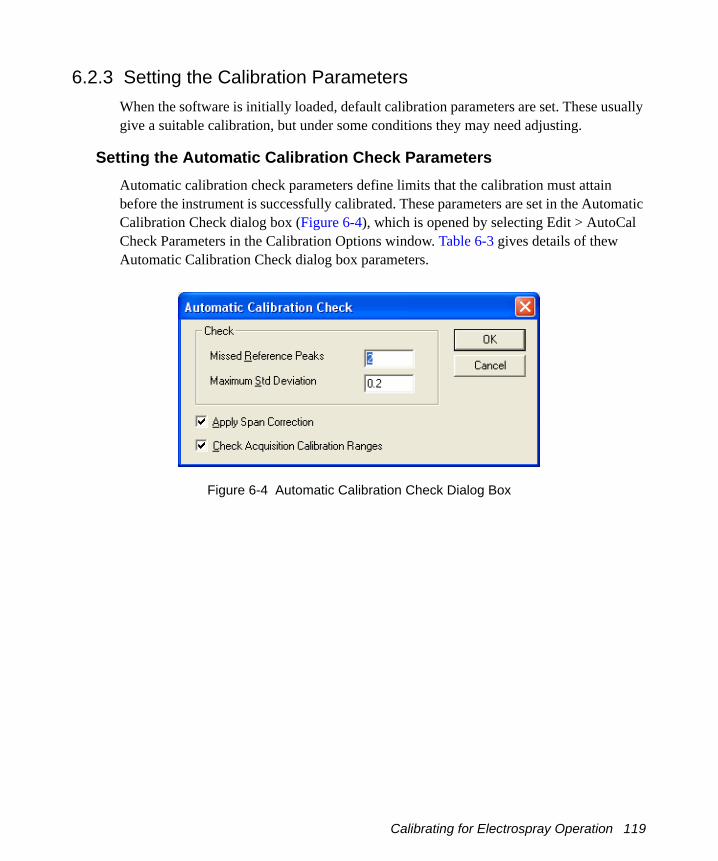
6.2.3 Setting the Calibration ParametersWhen the software is initially loaded, default calibration parameters are set. These usually give a suitable calibration, but under some conditions they may need adjusting.
Setting the Automatic Calibration Check ParametersAutomatic calibration check parameters define limits that the calibration must attain before the instrument is successfully calibrated. These parameters are set in the Automatic Calibration Check dialog box (Figure 6-4), which is opened by selecting Edit > AutoCal Check Parameters in the Calibration Options window. Table 6-3 gives details of thew Automatic Calibration Check dialog box parameters.
Figure 6-4 Automatic Calibration Check Dialog Box
Calibrating for Electrospray Operation 119

Setting General Calibration ParametersSet the calibration parameters in the Calibration Parameters dialog box (Figure 6-5), which is opened by selecting Edit > Calibration Parameters in the Calibration Options window.
The Peak Match parameters determine the limits within which the acquired data must lie for the software to recognize the calibration masses and result in a successful calibration. The default values are shown in Figure 6-5.
Note: For low scan speeds (up to 1000 Da/s), set Initial error (Da) to 2. For higher scan speeds (up to 4000 Da/s), increase this value to 4.
Table 6-3 Automatic Calibration Check Dialog Box Parameters
Parameter Description
CheckMissed Reference Peaks
Specifies the maximum number of consecutive peaks that may not be matched when comparing the reference spectrum and the acquired calibration spectrum. The calibration fails if this number is exceeded. The default value for this parameter, 2, is suitable in most cases.
Maximum Std Deviation
This parameter is set to a default value of 0.2. During calibration, the difference between the measured mass in the acquired calibration file and the true mass in the reference file is determined for each pair of matched peaks. If the standard deviation of the resulting set of mass differences exceeds the specified value, the calibration fails. Reducing the value of Maximum Std Deviation gives a more stringent limit. Increasing the value of Maximum Std Deviation means that the requirement is easier to meet but may allow incorrect peak matching. Values greater than 0.2 should not be used except under unusual conditions.
Apply Span Correction
This option should always be selected; it allows different mass ranges to be scanned, within the calibrated range, without affecting mass assignment
Check Acquisition Calibration Ranges
This option allows warning messages to be displayed if an attempt is made to acquire data from outside the calibrated range for mass and scan speed. You should leave this option selected.
120 Setting-Up Mass Calibration

Figure 6-5 Calibration Parameters Dialog Box
Increasing the Peak window and Initial error values gives a greater chance of incorrect peak matching. All peaks in the acquired spectrum below the Intensity threshold value (measured as a percentage of the most intense peak in the spectrum) are not used in the calibration procedure.
The Polynomial order of the curve has values from 1 to 5 as the available options. You should only use values 2 and 4:
• An order of 2 is suitable for wide mass ranges (e.g., 2 to 3000 Da), or for calibrating with widely spaced reference peaks. Sodium iodide, in particular, has widely spaced peaks (150 Da apart), and horse heart myoglobin is used to calibrate higher up the mass scale, hence this is the recommended polynomial order for these calibrations.
• An order of 4 is typically used for calibrations which include the lower end of the mass scale, and have closely-spaced reference peaks. This is suitable for calibrations using PEG (e.g., 50 to 1050 Da), however it is not suitable for calibrations with widely-spaced reference peaks.
6.2.3.1 Selecting Mass Measure ParametersSpecify the mass measure parameters and parameter values in the Mass Measure Parameters dialog box (Figure 6-6), which is opened by selecting Edit > Quad Mass Measure Parameters in the Calibration Options window.
Calibrating for Electrospray Operation 121
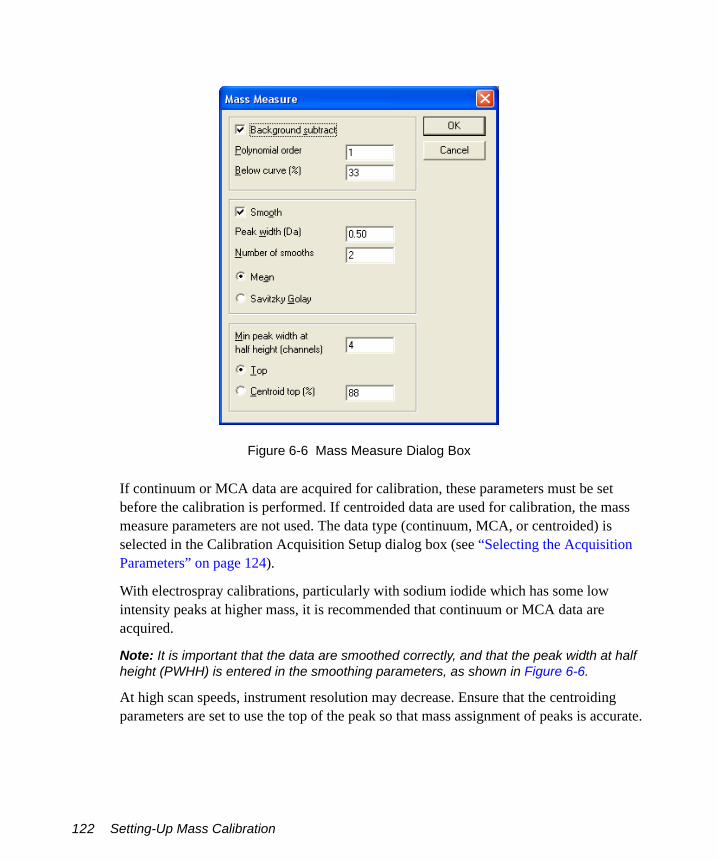
Figure 6-6 Mass Measure Dialog Box
If continuum or MCA data are acquired for calibration, these parameters must be set before the calibration is performed. If centroided data are used for calibration, the mass measure parameters are not used. The data type (continuum, MCA, or centroided) is selected in the Calibration Acquisition Setup dialog box (see “Selecting the Acquisition Parameters” on page 124).
With electrospray calibrations, particularly with sodium iodide which has some low intensity peaks at higher mass, it is recommended that continuum or MCA data are acquired.
Note: It is important that the data are smoothed correctly, and that the peak width at half height (PWHH) is entered in the smoothing parameters, as shown in Figure 6-6.
At high scan speeds, instrument resolution may decrease. Ensure that the centroiding parameters are set to use the top of the peak so that mass assignment of peaks is accurate.
122 Setting-Up Mass Calibration

6.2.4 Performing a CalibrationThree types of calibration are available with MassLynx:
• Static• Scanning• Scan speed compensation
It is recommended that all three types of calibration are performed, so that mass ranges and scan speeds can be changed while maintaining correct mass assignment. However, it is possible to have any combination of these calibrations:
• If only a static calibration is present, the instrument is calibrated for acquisitions where the quadrupoles are held at a single mass, as in SIR or MRM.
• If only a scanning calibration is present, the instrument is only correctly calibrated for scanning acquisitions over the same mass range, and at the same scan speed, as those used for the calibration.
• For the scan speed compensation to be used correctly, a scanning calibration should also be performed.
• If static and scanning calibrations are both present, the instrument is calibrated for acquisitions where the quadrupole is held at a single mass, and for scanning acquisitions with a mass range which lies within the mass range of the scanning calibration, providing that the same scan speed is used.For example, if the instrument is calibrated from m/z 100 to 900 with a 2 s scan (400 Da/s), data can be acquired from 100 to 500 Da with a 1 s scan time (also 400 Da/s) whilst maintaining correct mass assignment. In this case, the static calibration would be used to determine the start mass of the acquisition, and the scanning calibration would be used for mass assignment and scan range.
• If scanning calibration and scan speed compensation are present, the instrument is only calibrated for scanning acquisitions over the same mass range as that used for the calibration, but the scan speed can be changed, provided that it remains within the scan speeds used for the two calibrations. The mass range should not be changed, as there is no static calibration to locate the start mass.
Select the calibration types in the Automatic Calibration dialog box (Figure 6-7), which is
opened by clicking , or by selecting Calibrate > Start from the Calibration Options window.
Note: Data acquisition will not start at this point.
Calibrating for Electrospray Operation 123
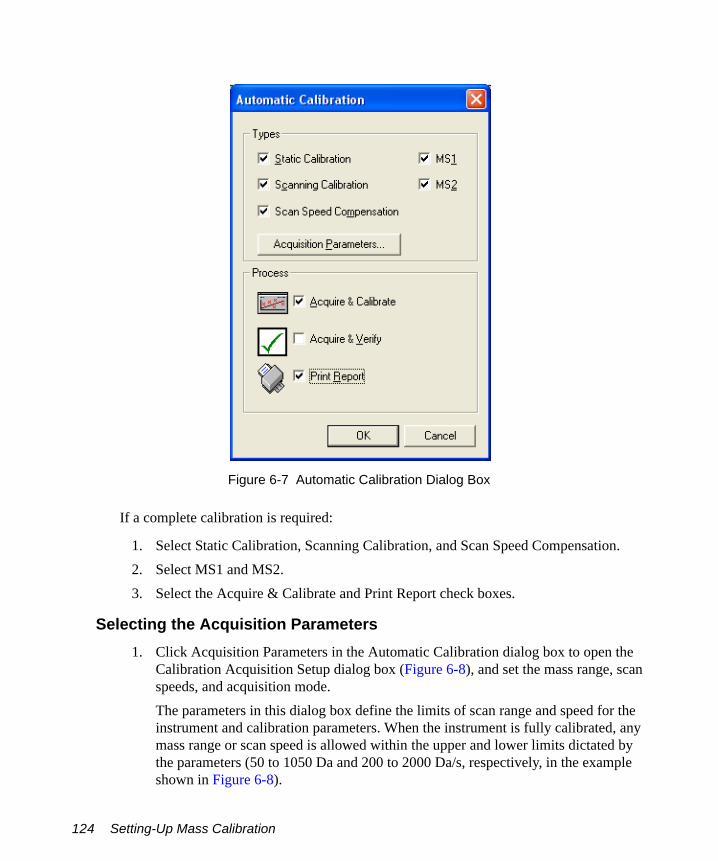
Figure 6-7 Automatic Calibration Dialog Box
If a complete calibration is required:
1. Select Static Calibration, Scanning Calibration, and Scan Speed Compensation.2. Select MS1 and MS2.3. Select the Acquire & Calibrate and Print Report check boxes.
Selecting the Acquisition Parameters1. Click Acquisition Parameters in the Automatic Calibration dialog box to open the
Calibration Acquisition Setup dialog box (Figure 6-8), and set the mass range, scan speeds, and acquisition mode.The parameters in this dialog box define the limits of scan range and speed for the instrument and calibration parameters. When the instrument is fully calibrated, any mass range or scan speed is allowed within the upper and lower limits dictated by the parameters (50 to 1050 Da and 200 to 2000 Da/s, respectively, in the example shown in Figure 6-8).
124 Setting-Up Mass Calibration

Figure 6-8 Calibration Acquisition Setup Dialog Box
2. When the required parameters have been set, click OK to return to the Automatic Calibration dialog box.
Starting the Calibration Process1. Ensure that the syringe contains sufficient reference sample to complete the
calibration (enough for 3 minutes in this example, i.e., 30 µL minimum).
2. In the Tune window, click to start the syringe pump.3. Click OK on the Automatic Calibration dialog box (see Figure 6-7).
The instrument acquires all of the calibration files in the order shown in Table 6-4.
Once all of the data have been acquired, the functions in each data file are combined to give a single spectrum which is then compared against the reference spectrum to form a calibration. This process takes place in the same order as shown in Table 6-4. If the Calibration Options dialog box is open, a constantly updated status message for the calibration is displayed.
Calibrating for Electrospray Operation 125
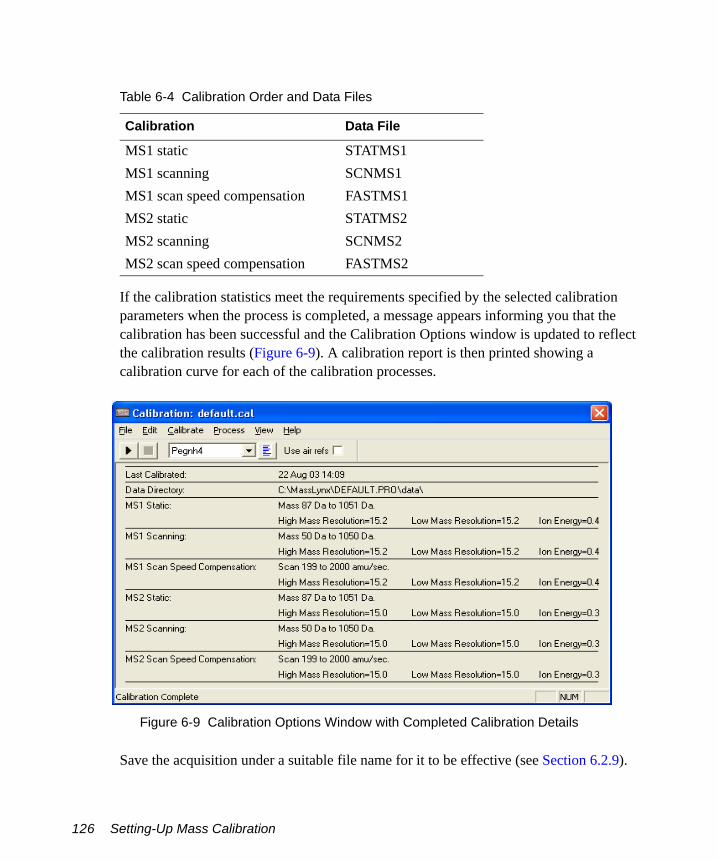
If the calibration statistics meet the requirements specified by the selected calibration parameters when the process is completed, a message appears informing you that the calibration has been successful and the Calibration Options window is updated to reflect the calibration results (Figure 6-9). A calibration report is then printed showing a calibration curve for each of the calibration processes.
Figure 6-9 Calibration Options Window with Completed Calibration Details
Save the acquisition under a suitable file name for it to be effective (see Section 6.2.9).
Table 6-4 Calibration Order and Data Files
Calibration Data File
MS1 static STATMS1MS1 scanning SCNMS1MS1 scan speed compensation FASTMS1MS2 static STATMS2MS2 scanning SCNMS2MS2 scan speed compensation FASTMS2
126 Setting-Up Mass Calibration

6.2.5 Calibration FailureIf the calibration statistics do not meet the requirements, a message describes at what point, and why, the calibration failed. This message also states where the attempted calibration’s data can be viewed so that the exact cause of failure can be determined.
A calibration fails under these conditions:
• No peaks are detected.• Too many consecutive peaks are missed.
The Calibration Fails Because No Peaks Are DetectedThe calibration fails if the acquired calibration data file contains no peaks. This may be due to:
• Lack of reference sample.• Wrong scans or wrong data file being used for the calibration.• No flow of solvent into the source.• Multiplier (on the Tune window Analyser page) set too low.
The Calibration Fails Because Too Many Consecutive Peaks Are MissedThe calibration fails if the number of consecutive peaks not found exceeds the value in the Missed Reference Peaks parameter, which you specify in the Automatic Calibration Check dialog box (see Figure 6-4). Peaks may be missed for the following reasons:
• The reference sample supply is nearly depleted, so the less intense peaks are not detected.
• The Multiplier value, specified on the Tune window Analyser page, is too small, so the less intense peaks are not detected.
• An incorrect ionization mode is selected. Ensure that the data have been acquired with Ion Mode set to ES+ in the Tune window.
Note: It is possible to calibrate in negative ion mode electrospray, using the naineg.ref reference file with a suitable reference sample.
• The Intensity threshold value, specified in the Calibration Parameters dialog box (see Figure 6-5), is too high. Peaks appear in the acquired calibration file but are ignored because they fall below this threshold level.
Calibrating for Electrospray Operation 127
• The value for the Initial error (Da), or Peak window (Da) parameter, specified in the Calibration Parameters dialog box (see Figure 6-5), is too small. Hence, the calibration peaks lie outside the limits set by these parameters.
• The Maximum Std Deviation, specified in the Automatic Calibration Check dialog box (see Figure 6-4), has been exceeded.
• The wrong reference file has been selected. Ensure that the correct file (nairb.ref in this case) is selected in the Calibration Options window (see Figure 6-3).
If too many consecutive peaks have been missed, view the data in the on-screen calibration report to see whether the missed peaks are present in the acquired calibration file.
Correcting the Calibration Failure1. Determine the failure’s cause, as explained above, and rectify it.2. Repeat the calibration.3. If the Intensity threshold, Initial error (Da) and Peak window (Da) have been
adjusted to obtain a successful calibration, view the on-screen calibration report to confirm that the correct peaks have been matched.
Note: With a low threshold, and wide ranges set for the Initial error (Da) and Peak window (Da), it may be possible to select the wrong peaks and still get a “successful” calibration. This is particularly relevant for calibrations using PEG, where there may be peaks from PEG+H+, PEG+NH4+, PEG+Na+, and doubly-charged species.
4. Click OK in the calibration report window to accept the new calibration, or select Cancel to retain the previous calibration.
6.2.6 Incorrect CalibrationIf the suggested calibration parameters have been used and, providing that good calibration data have been acquired, then the instrument should be calibrated correctly, that is, the acquired spectrum looks like the reference spectrum and all of the expected peaks are highlighted.
However, in some circumstances it is possible to meet the calibration criteria without matching the correct peaks. This situation is unusual, but the on-screen calibration report should always be checked to verify that the correct peaks have been matched.
Peak matching errors may occur under the following conditions:
• In the Calibration Parameters dialog box (see Figure 6-5):
128 Setting-Up Mass Calibration

– The Peak window (Da) value is too high (>1.5).– The Initial error (Da) value is too high (>2.0).– The Intensity threshold is set to 0.
• In the Automatic Calibration Check dialog box (see Figure 6-4):– The Maximum Std Deviation value is too high (>0.2).
An alternative cause of incorrect calibration is from contamination or background peaks. If a contamination or background peak lies within one of the peak matching windows and is more intense than the reference peak in that window, then the wrong peak is selected. Under some conditions this may happen with PEG. There are two ways to counter this:
1. If the reference peak is closer to the center of the peak window, the peak window can be narrowed until the contamination peak is excluded. Take care to ensure that no other reference peak is excluded.
2. If the reference peak is not closer to the centre of the peak window, or if by reducing the window other reference peaks are excluded, then the calibration can be edited manually (see Section 6.2.8).
6.2.7 Manually Checking the Calibration1. View the calibration (whether successful or failed) in more detail by selecting
Calibrate > From File in the Calibration Options window (see Figure 6-3) to open the Display Calibration Graphs dialog box (Figure 6-10). With the required calibration selected, the correct calibration file is automatically opened.The Browse button allows you to select a file for use by the calibration. The selected file must be from the appropriate project.
2. Click OK to repeat the calibration procedure for that particular file and display a calibration report (see Figure 6-11).
Calibrating for Electrospray Operation 129

Figure 6-10 Display Calibration Graphs Dialog Box
The calibration report contains four displays:
• The acquired spectrum• The reference spectrum• A plot of mass difference against mass (the calibration curve)• A plot of residual against mass
Display an expanded region by clicking and dragging with the mouse button. This allows the less intense peaks in the spectrum to be examined to verify that the correct peaks have been matched. The peaks in the acquired spectrum that have been matched with a peak in the reference spectrum are highlighted in a different color.
Calibration has been successful if the acquired spectrum looks like the reference spectrum and all of the expected peaks are highlighted.
130 Setting-Up Mass Calibration
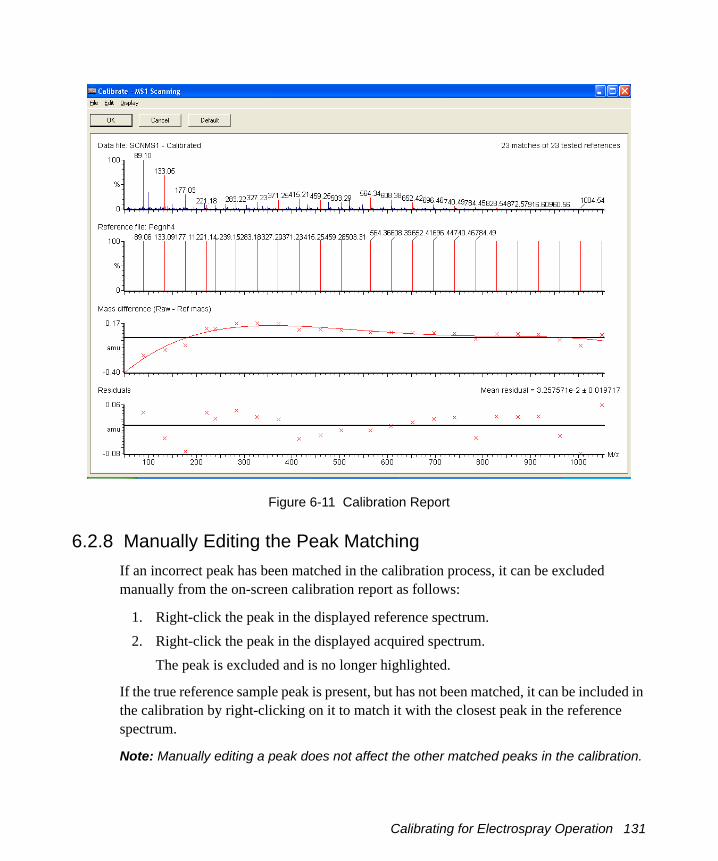
Figure 6-11 Calibration Report
6.2.8 Manually Editing the Peak MatchingIf an incorrect peak has been matched in the calibration process, it can be excluded manually from the on-screen calibration report as follows:
1. Right-click the peak in the displayed reference spectrum.2. Right-click the peak in the displayed acquired spectrum.
The peak is excluded and is no longer highlighted.
If the true reference sample peak is present, but has not been matched, it can be included in the calibration by right-clicking on it to match it with the closest peak in the reference spectrum.
Note: Manually editing a peak does not affect the other matched peaks in the calibration.
Calibrating for Electrospray Operation 131
6.2.9 Saving the Calibration1. If the displayed calibration is acceptable, click OK in the Calibration Report (see
Figure 6-11). The Calibration Options window (see Figure 6-3) is reopened and updated to display the current calibration.
2. Select File > Save As to save this calibration file using the Save As dialog box.
When recalled, the calibration has the same constraints of mass range and scan speed. The ion energy and resolution settings used for the calibration acquisition are also recorded, as these can affect the mass assignment.
6.2.10 Verifying the CalibrationOnce a full instrument calibration is in place, it is not always necessary to repeat the full calibration procedure when the instrument is next used. Instead a calibration verification can be performed. (There is no benefit in verifying each calibration individually, recalibration is just as quick.)
1. In the Tune window, select Calibration > Calibrate Instrument to open the Calibration Options window (see Figure 6-3). Confirm that the current calibration is correctly displayed.
2. Open the Automatic Calibration dialog box by clicking or selecting Calibrate > Start.
3. Clear the Acquire & Calibrate check box, and select Acquire & Verify.4. Ensure that the syringe contains sufficient reference sample to complete the
calibration (enough for 3 minutes in this example, i.e., 30 µL minimum).5. Click OK to start the verification procedure.
When the acquisition ends, the data are combined into single spectrum which is compared against the reference file. A calibration curve is drawn and a report printed in a similar way to when the original calibration was performed.
Unlike the original calibration procedure, the instrument calibration is not changed and the a verification report is printed.
132 Setting-Up Mass Calibration

Chapter 7Maintenance Procedures
7.1 Maintenance Schedule
Table 7-1 lists periodic maintenance schedules that ensure optimum instrument performance.
The maintenance frequencies shown apply to instruments that normally receive moderate use.
Table 7-1 Maintenance Schedule
Maintenance Procedure Frequency
Replace the source enclosure and probe O-rings (see Section 7.3).
Annually.
Empty the nitrogen exhaust bottle (see Section 7.4).
As required.
Gas-ballast the rotary pump (see Section 7.5).
Weekly (ESI).Daily (APCI).
Inspect and adjust the rotary pump oil level (see Section 7.6).
Weekly.
Change the rotary pump oil (see Section 7.7).
Every 3000 hours of pump operation.
Replace the rotary pump oil mist filter element (see Section 7.8).
Six-monthly.Note: For applications that contaminate the rotary pump oil, this period will be reduced and must be determined from experience.
Replace the rotary pump odor filter element (see Section 7.8).
Monthly, or whenever the rotary pump emits an oily odor.
Replace the scroll pump seals. Annually (see the Edwards document XDS 35i Instruction Manual A730-01-880, supplied with the instrument).
Maintenance Schedule 133

7.2 Safety and Handling
Bear in mind the following safety considerations when performing maintenance procedures.
Clean the source assembly (see Section 7.9).
When sensitivity decreases to unacceptable levels.
Clean the ESI probe tip (see Section 7.10). When sensitivity decreases to unacceptable levels.
Clean the APCI probe tip (see Section 7.12).
When sensitivity decreases to unacceptable levels.
Clean the corona discharge pin (APCI mode) (see Section 7.11).
When sensitivity decreases to unacceptable levels.
Clean the ion block assembly (see Section 7.9).
When it is visibly fouled.When background or high peak contaminants are unacceptably high.
Clean all source components (see Section 7.9).
When sensitivity decreases to unacceptable levels.When cleaning the cone gas cone, sample cone, and gas exhaust port fails to improve analytical results.
Replace the ESI probe capillary (see Section 7.14).
When sensitivity decreases to unacceptable levels.
Perform ZSpray APCI probe maintenance (see Section 7.15).
When sensitivity decreases to unacceptable levels.
Warning: The instrument components may be contaminated with biologically hazardous materials. Always wear nitrile gloves while handling the components.
Warning: To prevent injury, always observe good laboratory practices when handling solvents, changing tubing, or operating the instrument. Know the physical and chemical properties of the solvents used (see the Material Safety Data Sheets for the solvents in use).
Table 7-1 Maintenance Schedule (Continued)
Maintenance Procedure Frequency
134 Maintenance Procedures
7.3 Replacing the Source Enclosure and Probe O-rings
To avoid possible excessive leakage of solvent into the laboratory atmosphere, the following O-rings must be renewed at intervals of no greater than one year:
• Source enclosure door O-ring• Source enclosure door glass O-ring• Source enclosure housing O-ring• Source enclosure side flange O-ring• Probe adjustment flange O-ring
Note: To complete this procedure, you will be required to perform a pressure test on the source, as described in the Waters Micromass Source Pressure Test Unit Operator’s Guide.
Procedure1. Remove the probe from the source (see Section 7.9.3).2. Disconnect the Probe electrical connection at the instrument front panel (see
Figure 7-5).3. Disconnect the PTFE tubing at the Desolvation gas connection on the front panel.
Warning: To avoid electric shock, do not remove the instrument’s panels. There are no user-serviceable items inside the instrument.
Warning: To avoid electric shock, ensure that the instrument is in Standby before commencing any maintenance.
Warning: The probe and source may be hot. To avoid burns, take great care while working with these components.
Warning: To avoid possible excessive leakage of solvent into the laboratory atmosphere, the O-rings listed below must be renewed at intervals of no greater than one year, exactly as described in this section.
Replacing the Source Enclosure and Probe O-rings 135
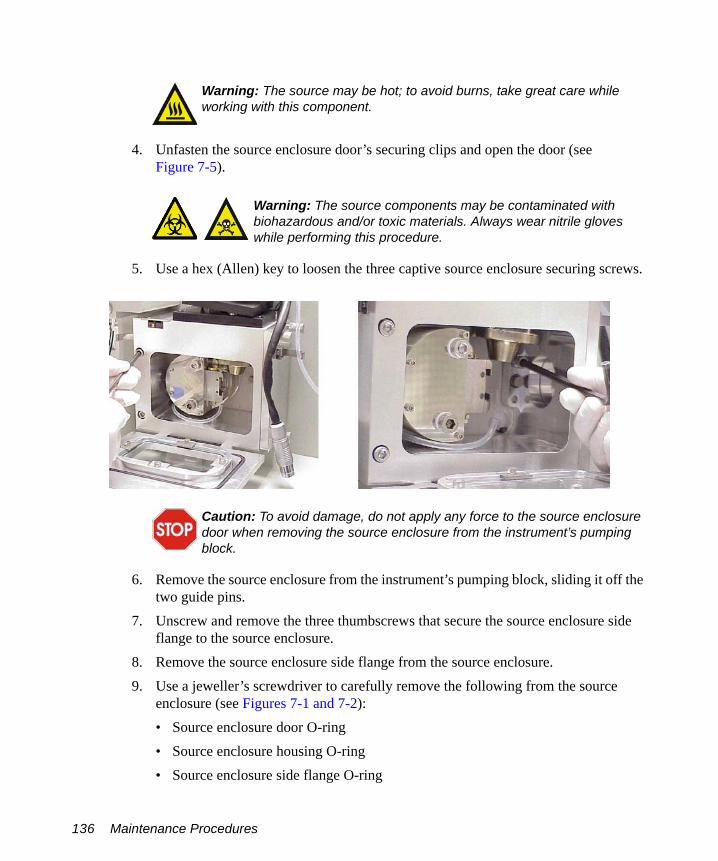
4. Unfasten the source enclosure door’s securing clips and open the door (see Figure 7-5).
5. Use a hex (Allen) key to loosen the three captive source enclosure securing screws.
6. Remove the source enclosure from the instrument’s pumping block, sliding it off the two guide pins.
7. Unscrew and remove the three thumbscrews that secure the source enclosure side flange to the source enclosure.
8. Remove the source enclosure side flange from the source enclosure.9. Use a jeweller’s screwdriver to carefully remove the following from the source
enclosure (see Figures 7-1 and 7-2):• Source enclosure door O-ring• Source enclosure housing O-ring• Source enclosure side flange O-ring
Warning: The source may be hot; to avoid burns, take great care while working with this component.
Warning: The source components may be contaminated with biohazardous and/or toxic materials. Always wear nitrile gloves while performing this procedure.
Caution: To avoid damage, do not apply any force to the source enclosure door when removing the source enclosure from the instrument’s pumping block.
136 Maintenance Procedures
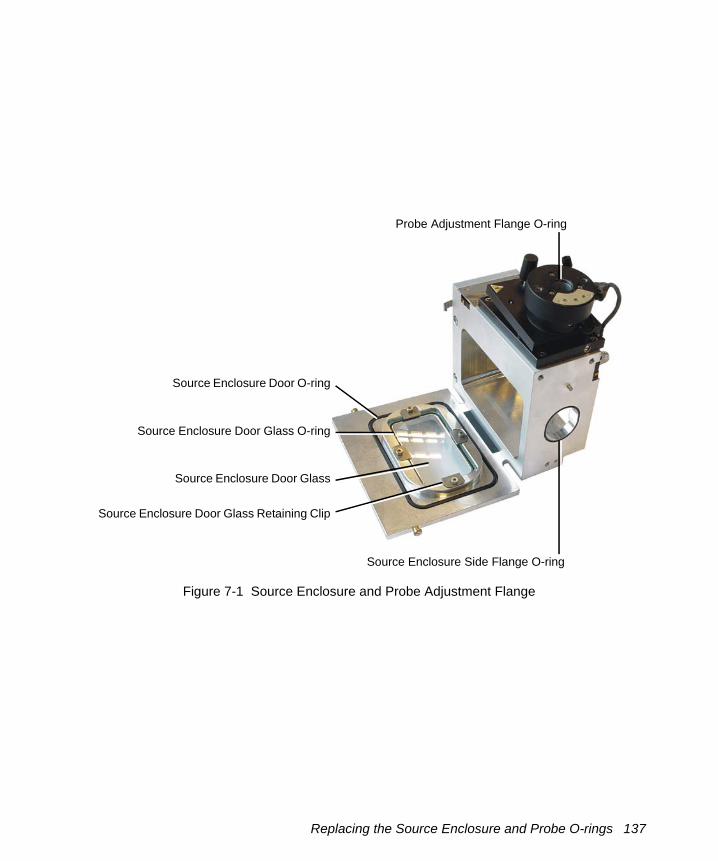
Figure 7-1 Source Enclosure and Probe Adjustment Flange
Source Enclosure Door O-ring
Source Enclosure Side Flange O-ring
Probe Adjustment Flange O-ring
Source Enclosure Door Glass O-ring
Source Enclosure Door Glass Retaining Clip
Source Enclosure Door Glass
Replacing the Source Enclosure and Probe O-rings 137

Figure 7-2 Source Enclosure Rear View
10. Use a hex (Allen) key to remove the four bolts securing the source enclosure door glass retaining clips to the source enclosure door (see Figure 7-1).
11. Remove the four source enclosure door glass retaining clips from the source enclosure door.
12. Remove the source enclosure door glass from the source enclosure door.13. Use a jeweller’s screwdriver to carefully remove the source enclosure door glass
O-ring from the source enclosure door.14. Use a jeweller’s screwdriver to carefully remove the probe adjustment flange O-ring
from the probe adjustment flange (see Figure 7-1).
15. Dispose of the O-rings in accordance with local environmental regulations.16. Ensure that all the grooves for O-rings are free from dirt and hairs.17. Fit the new probe adjustment flange O-ring to the probe adjustment flange.18. Fit the new source enclosure door glass O-ring to the source enclosure door.
Warning: The O-rings may be contaminated with biohazardous and/or toxic materials. Ensure that they are correctly disposed of according to local environmental regulations.
Source Enclosure Housing O-ring
Wires to microswitch
138 Maintenance Procedures

19. Fit the source enclosure door glass to the source enclosure door.20. Fit the four source enclosure door glass retaining clips to the source enclosure door.21. Use a hex (Allen) key to fit and tighten the four bolts securing the source enclosure
door glass retaining clips to the source enclosure door.22. Fit the following to the source enclosure:
• New source enclosure door O-ring• New source enclosure housing O-ring• New source enclosure side flange O-ring
23. Fit the side panel to the source enclosure.24. Fit and tighten the three thumbscrews that secure the side panel to the source
enclosure.25. Ensure that each of the two source enclosure guide pins is fully tightened into the
instrument’s pumping block; a suitable lever can be inserted into the hole in each guide pin to achieve this.
26. Ensuring that the wires to the microswitch do not become trapped between the source enclosure and the pumping block (see Figure 7-2), fit the source enclosure to the pumping block.
27. Fit and tighten the three source enclosure securing bolts.
Note: The securing bolts must each be sequentially tightened a small amount until they are all fully tight; this ensures that the source enclosure is uniformly seated on the pumping block.
28. Close the source enclosure door and fasten the securing clips (see Figure 7-5).29. Connect the Probe electrical connection at the instrument’s front panel (see
Figure 7-5).30. Connect the PTFE tubing to the Desolvation gas connection at the instrument’s front
panel (see Figure 7-5).31. If using an APCI probe, carefully fit the corona discharge pin (see Section 3.1.2).32. Install the ESI or APCI probe, as required (see Sections 2.1.3 and 3.1.3).33. Start up the instrument (see Section A.1).
Replacing the Source Enclosure and Probe O-rings 139

34. Perform a source pressure test as described in the Waters Micromass Source Pressure Test Unit Operator’s Guide.
7.4 Emptying the Nitrogen Exhaust Waste Bottle
The nitrogen exhaust waste bottle in the nitrogen exhaust line (see Section 1.6.11) must be emptied before it is completely full.
Figure 7-3 Nitrogen Exhaust Waste Bottle
Warning: To avoid possible excessive leakage of solvent into the laboratory atmosphere, a source pressure test must be performed.
Warning: The waste liquid in the nitrogen exhaust waste bottle comprises LC solvents and analytes. Always wear nitrile gloves while handling the nitrogen exhaust waste bottle, and ensure that the waste liquid is correctly disposed of according to local environmental regulations.
To laboratory exhaust portFrom instrument
exhaust connection
140 Maintenance Procedures
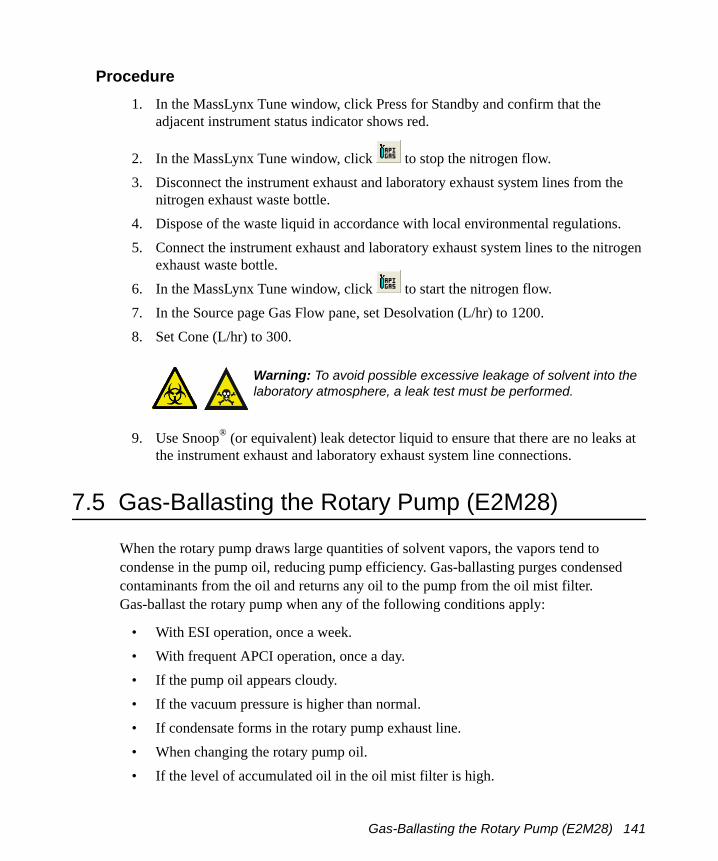
Procedure1. In the MassLynx Tune window, click Press for Standby and confirm that the
adjacent instrument status indicator shows red.
2. In the MassLynx Tune window, click to stop the nitrogen flow.3. Disconnect the instrument exhaust and laboratory exhaust system lines from the
nitrogen exhaust waste bottle.4. Dispose of the waste liquid in accordance with local environmental regulations.5. Connect the instrument exhaust and laboratory exhaust system lines to the nitrogen
exhaust waste bottle.6. In the MassLynx Tune window, click to start the nitrogen flow.7. In the Source page Gas Flow pane, set Desolvation (L/hr) to 1200.8. Set Cone (L/hr) to 300.
9. Use Snoop® (or equivalent) leak detector liquid to ensure that there are no leaks at the instrument exhaust and laboratory exhaust system line connections.
7.5 Gas-Ballasting the Rotary Pump (E2M28)
When the rotary pump draws large quantities of solvent vapors, the vapors tend to condense in the pump oil, reducing pump efficiency. Gas-ballasting purges condensed contaminants from the oil and returns any oil to the pump from the oil mist filter. Gas-ballast the rotary pump when any of the following conditions apply:
• With ESI operation, once a week.• With frequent APCI operation, once a day.• If the pump oil appears cloudy.• If the vacuum pressure is higher than normal.• If condensate forms in the rotary pump exhaust line.• When changing the rotary pump oil.• If the level of accumulated oil in the oil mist filter is high.
Warning: To avoid possible excessive leakage of solvent into the laboratory atmosphere, a leak test must be performed.
Gas-Ballasting the Rotary Pump (E2M28) 141
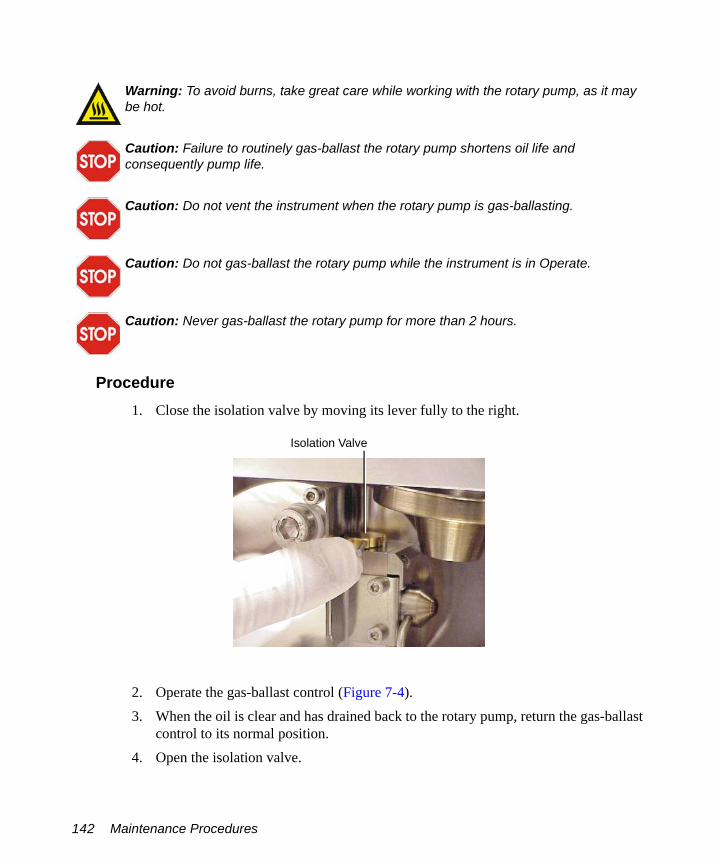
Procedure1. Close the isolation valve by moving its lever fully to the right.
2. Operate the gas-ballast control (Figure 7-4).3. When the oil is clear and has drained back to the rotary pump, return the gas-ballast
control to its normal position.4. Open the isolation valve.
Warning: To avoid burns, take great care while working with the rotary pump, as it may be hot.
Caution: Failure to routinely gas-ballast the rotary pump shortens oil life and consequently pump life.
Caution: Do not vent the instrument when the rotary pump is gas-ballasting.
Caution: Do not gas-ballast the rotary pump while the instrument is in Operate.
Caution: Never gas-ballast the rotary pump for more than 2 hours.
Isolation Valve
142 Maintenance Procedures

Figure 7-4 Rotary Pump
7.6 Checking the Rotary Pump Oil
The oil level can be checked while the pump is operating. However, the instrument must be vented and shut down before adding oil.
The rotary pump oil level appears in the oil level sight glass on the pump (see Figure 7-4).
Check the oil level at weekly intervals; at all times it should be at, or near, the MAX level indicated by the markings beside the sight glass. If oil must be added, vent and shut down the instrument before removing the oil filler plug (see Section A.2.3).
Examine the oil each time the its level is checked. It should be colorless and free of visible contaminants. If the oil is discolored, change it (see Section 7.7).
Warning: To avoid burns, take great care while working with the rotary pump, as it may be hot.
Power Switch
Inlet PortGas-Ballast Control
Outlet Nozzle
Oil Filler Plug
Oil Sight Glass
Oil Drain Plug
Checking the Rotary Pump Oil 143
7.7 Changing the Rotary Pump Oil
Change the rotary pump oil every 3 to 4 months, or whenever it becomes noticeably discolored.
7.7.1 Required Materials• Nitrile gloves• Flat-blade screwdriver• Container for used oil• Funnel• Vacuum oil – use only Ultragrade 19 or Inland Q45 (Edwards 45) vacuum pump oil
7.7.2 Procedure
1. Operate the pump to warm the oil before draining it.2. Gas-ballast the rotary pump (see Section 7.5).3. Vent and shut down the instrument (see Section A.2.3).4. Power-off the power supply to the backing pump interlock box.
5. Raise the pump 6 to 8 inches (150 to 200 mm) above the floor, if necessary.6. Place an object under the motor to tilt the pump toward the side on which the oil
drain plug is located (see Figure 7-4).7. Remove the oil filler plug.8. Use the flat-blade screwdriver to remove the oil drain plug.9. Let the oil drain completely.10. Fit the oil drain plug.
Warning: The rotary pump oil may be contaminated with biohazardous and/or toxic materials. Always wear nitrile gloves while handling the oil and ensure that the waste oil is correctly disposed of according to local environmental regulations.
Warning: To avoid burns, take great care while working with the rotary pump and pump oil, as they may be hot.
144 Maintenance Procedures
11. Remove the object used to tilt the pump.12. Fill the pump until the oil in the sight glass reaches the MAX level.13. Allow a few minutes for the oil to drain into the pump.14. Recheck the oil level and, if necessary, add more oil.15. Fit the oil filler plug and, if applicable, lower the pump to the floor.16. Switch on the pump, by operating the power switch.17. Switch on the power supply to the backing pump interlock box.
7.8 Replacing the Oil Mist and Odor Filter Elements
7.8.1 Required Materials• Nitrile gloves• 4-mm hex (Allen) key• Lint-free cloth
7.8.2 Procedure
1. Gas-ballast the rotary pump to drain the oil from the oil mist filter (see Section 7.5).2. Turn off the power supply to the rotary pump interlock box.3. Wipe clean the outside of the oil mist filter body.
Warning: The rotary pump oil may be contaminated with biohazardous and/or toxic materials. Always wear nitrile gloves while handling the oil mist filter assembly.
Warning: To avoid burns, take great care while working with the rotary pump and oil mist filter assembly, as they may be hot.
Replacing the Oil Mist and Odor Filter Elements 145
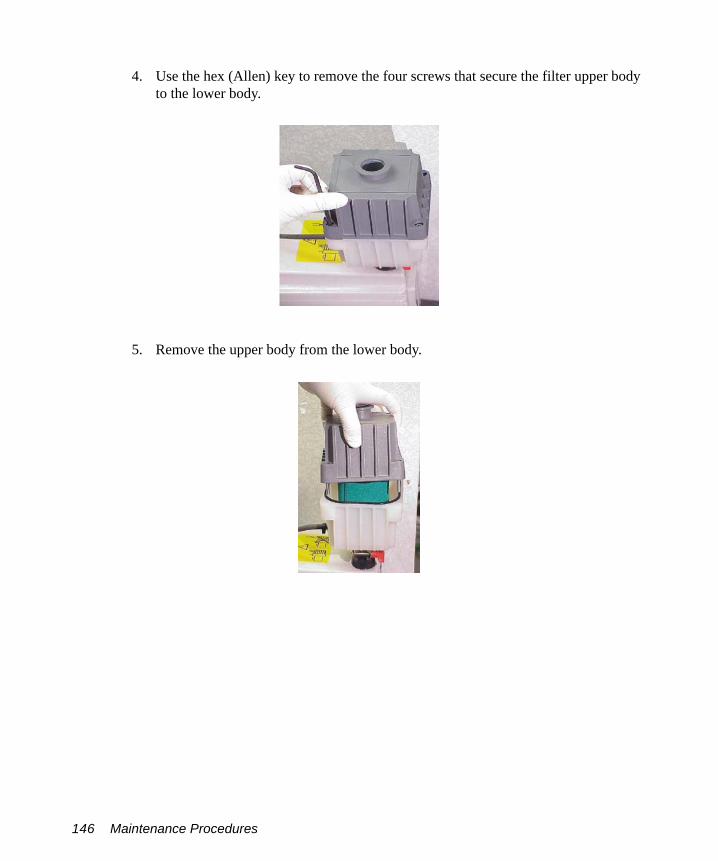
4. Use the hex (Allen) key to remove the four screws that secure the filter upper body to the lower body.
5. Remove the upper body from the lower body.
146 Maintenance Procedures

This exposes the oil filter element and odor filter element.
6. Lift out the element(s) that are to be replaced.
7. Wipe clean the insides of the upper and lower body assemblies.
Odor Filter Element
Oil Filter Element
Replacing the Oil Mist and Odor Filter Elements 147
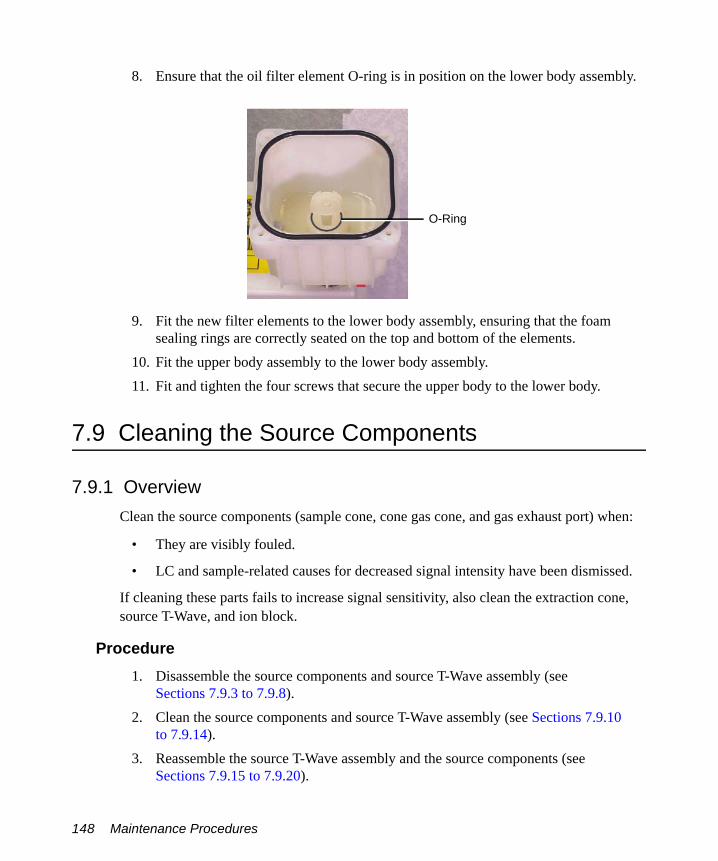
8. Ensure that the oil filter element O-ring is in position on the lower body assembly.
9. Fit the new filter elements to the lower body assembly, ensuring that the foam sealing rings are correctly seated on the top and bottom of the elements.
10. Fit the upper body assembly to the lower body assembly.11. Fit and tighten the four screws that secure the upper body to the lower body.
7.9 Cleaning the Source Components
7.9.1 OverviewClean the source components (sample cone, cone gas cone, and gas exhaust port) when:
• They are visibly fouled.
• LC and sample-related causes for decreased signal intensity have been dismissed.
If cleaning these parts fails to increase signal sensitivity, also clean the extraction cone, source T-Wave, and ion block.
Procedure1. Disassemble the source components and source T-Wave assembly (see
Sections 7.9.3 to 7.9.8).2. Clean the source components and source T-Wave assembly (see Sections 7.9.10
to 7.9.14).3. Reassemble the source T-Wave assembly and the source components (see
Sections 7.9.15 to 7.9.20).
O-Ring
148 Maintenance Procedures

7.9.2 Required Materials• Nitrile gloves• Needle-nose pliers• Two wrenches• Hex (Allen) keys• Jeweller’s screwdriver• Large, flat-blade screwdriver• Glass-fiber pen• Appropriately sized glass vessels in which to completely immerse components
when cleaning. Use only glassware not previously cleaned with surfactants.• HPLC-grade methanol• HPLC-grade water• Formic acid• Ultrasonic bath• Source of oil-free, inert gas (nitrogen or helium) for drying (air-drying optional).• Lint-free paper towels
7.9.3 Removing the Probe from the Source1. Disconnect the LC system from the probe.2. In the MassLynx window, click Press for Standby and confirm that the adjacent
instrument status indicator shows red.3. Wait for 3 minutes to allow the desolvation gas flow to cool the probe and source.
4. Click to turn off the nitrogen flow.
5. Open the instrument’s access door.6. Disconnect the electrical connection(s) at the instrument front panel (Figure 7-5).
Note: The probe electrical connection will not be connected if the APCI probe is being used.
Warning: The probe and source may be hot. To avoid burns, take great care while working with the instrument’s access door open.
Cleaning the Source Components 149

Figure 7-5 Probe Connections (ESI Probe Shown as an Example)
7. Disconnect the PTFE tubing at the Nebulizer gas connection on the front panel.8. Undo the two thumbscrews securing the probe to the probe adjustment flange.
9. Carefully remove the probe from the probe adjustment flange.
Warning: The probe may be contaminated with biohazardous and/or toxic materials. Always wear nitrile gloves while performing this procedure.
Caution: To avoid damaging the probe seals when removing an APCI probe, confirm that the probe temperature is less than 150 °C, as displayed on the Tune window APcI Probe Temp (°C) readback, before removing the probe.
ProbeNebulizer Gas Connection
Desolvation Gas Connection
Probe Adjustment Flange
Source Enclosure Door
Probe Electrical Connection (not used by the APCI Probe)
HV Electrical Connection
Thumbscrew
150 Maintenance Procedures
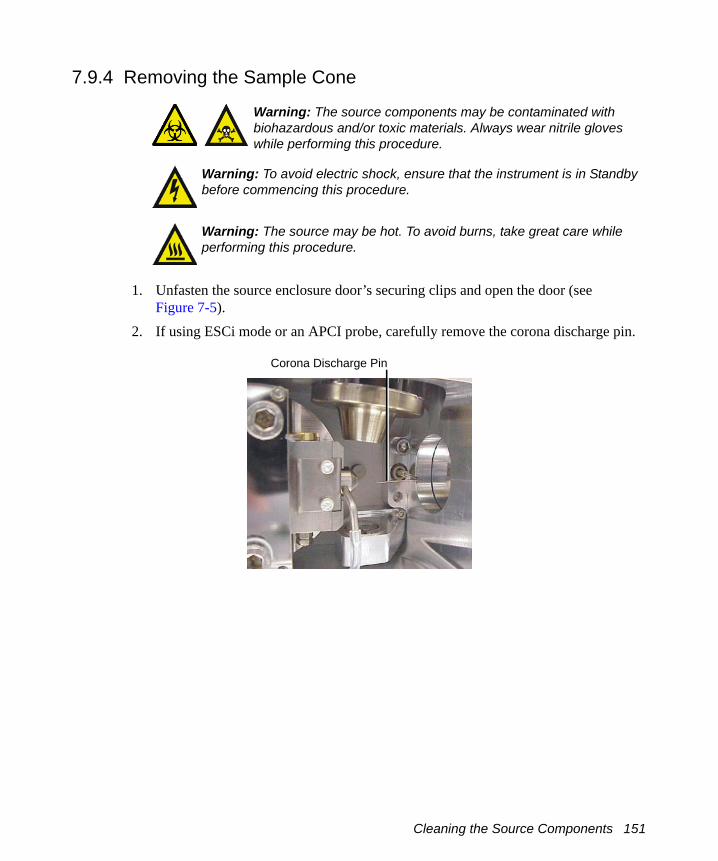
7.9.4 Removing the Sample Cone
1. Unfasten the source enclosure door’s securing clips and open the door (see Figure 7-5).
2. If using ESCi mode or an APCI probe, carefully remove the corona discharge pin.
Warning: The source components may be contaminated with biohazardous and/or toxic materials. Always wear nitrile gloves while performing this procedure.
Warning: To avoid electric shock, ensure that the instrument is in Standby before commencing this procedure.
Warning: The source may be hot. To avoid burns, take great care while performing this procedure.
Corona Discharge Pin
Cleaning the Source Components 151
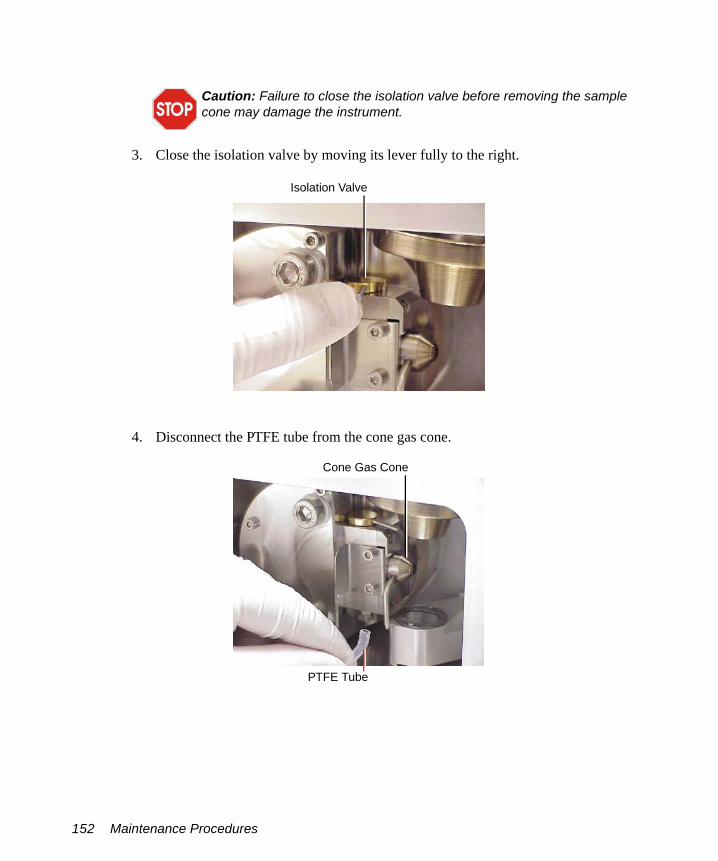
3. Close the isolation valve by moving its lever fully to the right.
4. Disconnect the PTFE tube from the cone gas cone.
Caution: Failure to close the isolation valve before removing the sample cone may damage the instrument.
Isolation Valve
Cone Gas Cone
PTFE Tube
152 Maintenance Procedures

5. Use a hex (Allen) key to remove the two cone retaining plate securing screws.
6. Remove the cone retaining plate.
Cone Retaining Plate
Cleaning the Source Components 153

7. Carefully remove the sample cone/cone gas cone assembly from the isolation valve body.
8. Use a jeweller’s screwdriver to carefully remove the O-ring from the sample cone/cone gas cone assembly.
Sample Cone/Cone Gas Cone Assembly
154 Maintenance Procedures
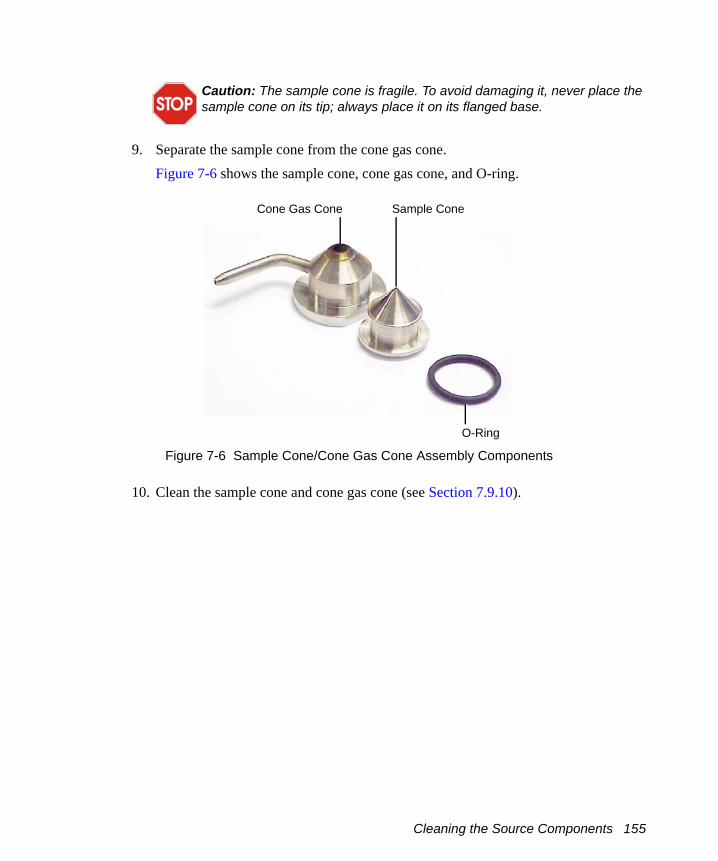
9. Separate the sample cone from the cone gas cone.Figure 7-6 shows the sample cone, cone gas cone, and O-ring.
Figure 7-6 Sample Cone/Cone Gas Cone Assembly Components
10. Clean the sample cone and cone gas cone (see Section 7.9.10).
Caution: The sample cone is fragile. To avoid damaging it, never place the sample cone on its tip; always place it on its flanged base.
Cone Gas Cone Sample Cone
O-Ring
Cleaning the Source Components 155
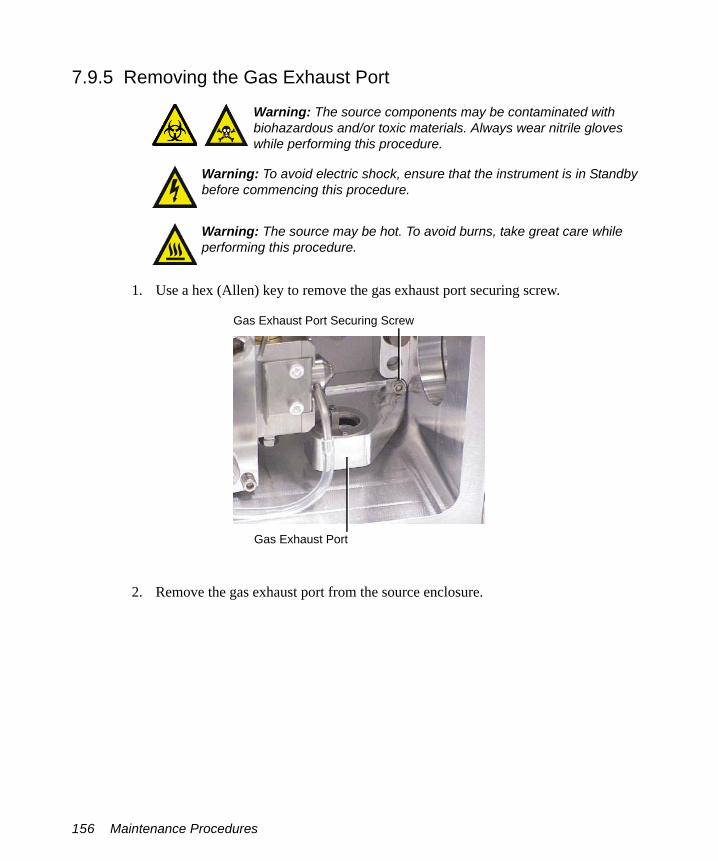
7.9.5 Removing the Gas Exhaust Port
1. Use a hex (Allen) key to remove the gas exhaust port securing screw.
2. Remove the gas exhaust port from the source enclosure.
Warning: The source components may be contaminated with biohazardous and/or toxic materials. Always wear nitrile gloves while performing this procedure.
Warning: To avoid electric shock, ensure that the instrument is in Standby before commencing this procedure.
Warning: The source may be hot. To avoid burns, take great care while performing this procedure.
Gas Exhaust Port Securing Screw
Gas Exhaust Port
156 Maintenance Procedures

3. Remove the two screws securing the aperture to the gas exhaust port.
4. Remove the aperture from the gas exhaust port.5. Clean the gas exhaust port (see Section 7.9.11).
7.9.6 Removing the Ion Source Enclosure and Ion Block1. Shut down the instrument (see Section A.2).
2. Disconnect the Probe electrical connection at the instrument front panel (see Figure 7-5).
3. Disconnect the PTFE tubing at the Desolvation gas connection on the front panel (see Figure 7-5).
Warning: The source may be hot; to avoid burns, allow it to cool down for at least 30 minutes before proceeding.
Aperture
Securing Screw
Cleaning the Source Components 157

4. Use a hex (Allen) key to loosen the three captive source enclosure securing screws.
5. Remove the source enclosure from the instrument.
Warning: The source components may be contaminated with biohazardous and/or toxic materials. Always wear nitrile gloves while performing this procedure.
Caution: To avoid damage, do not apply any force to the source enclosure door when removing the source enclosure from the instrument’s pumping block.
158 Maintenance Procedures

6. Use the 6-mm hex (Allen) key to remove the two ion block securing screws.
7. Remove the ion block from the PEEK ion block support.
Ion Block
Securing Screws
PEEK Ion Block Support
Ion Block
Cleaning the Source Components 159

7.9.7 Removing the Source T-Wave Assembly from the Instrument
1. Use a hex (Allen) key to remove the three PEEK ion block support securing screws.
2. Remove the PEEK ion block support from the pumping block.
Warning: The source components may be contaminated with biohazardous and/or toxic materials. Always wear nitrile gloves while performing this procedure.
Securing Screws
PEEK Ion Block Support
Pumping Block
160 Maintenance Procedures
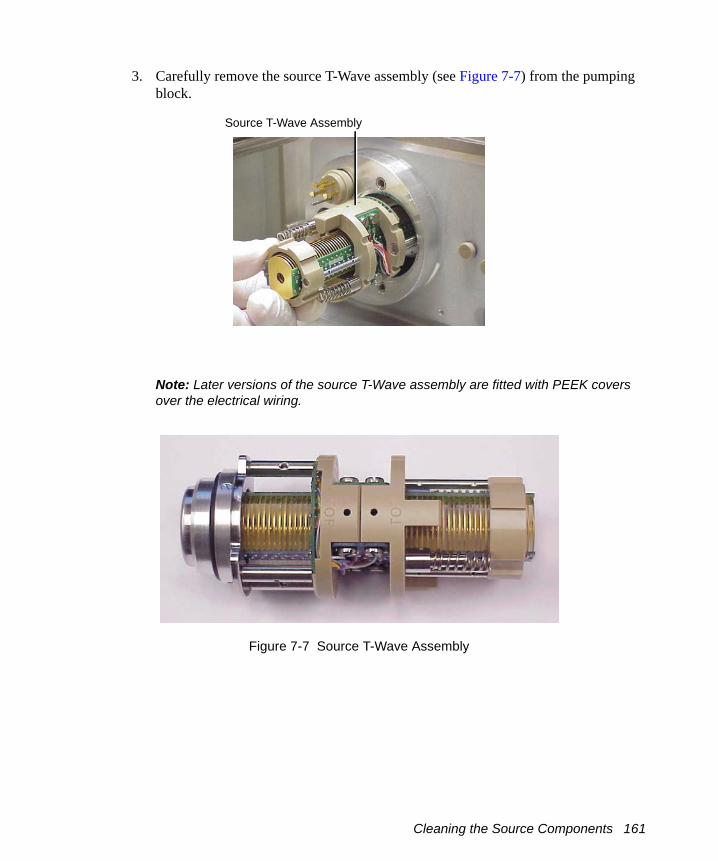
3. Carefully remove the source T-Wave assembly (see Figure 7-7) from the pumping block.
Note: Later versions of the source T-Wave assembly are fitted with PEEK covers over the electrical wiring.
Figure 7-7 Source T-Wave Assembly
Source T-Wave Assembly
Cleaning the Source Components 161

7.9.8 Disassembling the Source T-Wave Assembly
1. On later versions of the source T-Wave assembly only, remove the PEEK covers after removing the two screws securing the covers to the assembly.
2. Use the jeweller’s screwdriver to remove the three screws securing the retaining ring to the source T-Wave assembly.
3. Remove the metallized O-ring and retaining ring from the assembly.
Warning: The source T-Wave components may be contaminated with biohazardous and/or toxic materials. Always wear nitrile gloves while performing this procedure.
Securing Screw Retaining Ring
Metallized O-Ring
162 Maintenance Procedures
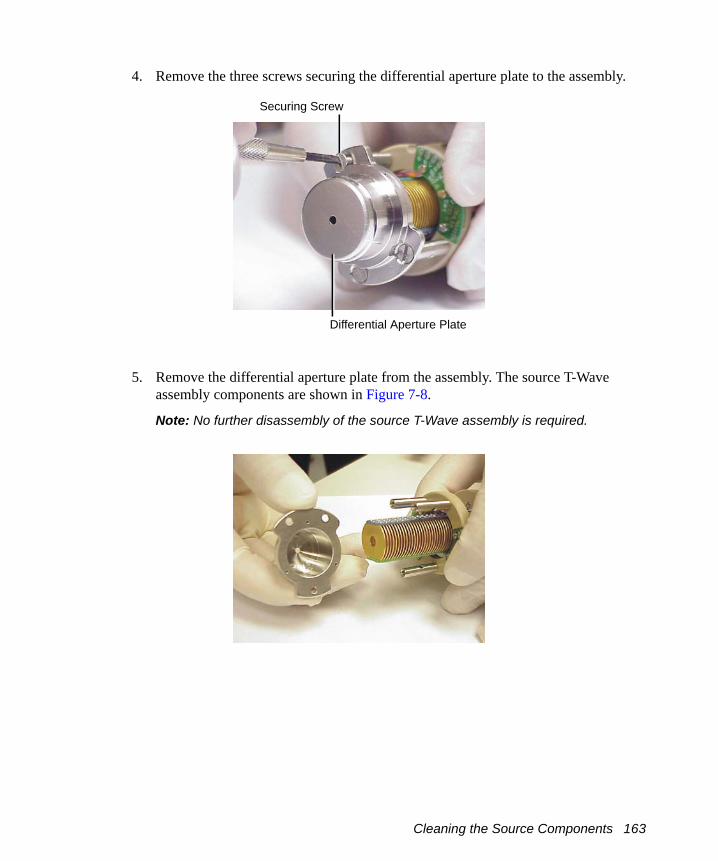
4. Remove the three screws securing the differential aperture plate to the assembly.
5. Remove the differential aperture plate from the assembly. The source T-Wave assembly components are shown in Figure 7-8.
Note: No further disassembly of the source T-Wave assembly is required.
Securing Screw
Differential Aperture Plate
Cleaning the Source Components 163
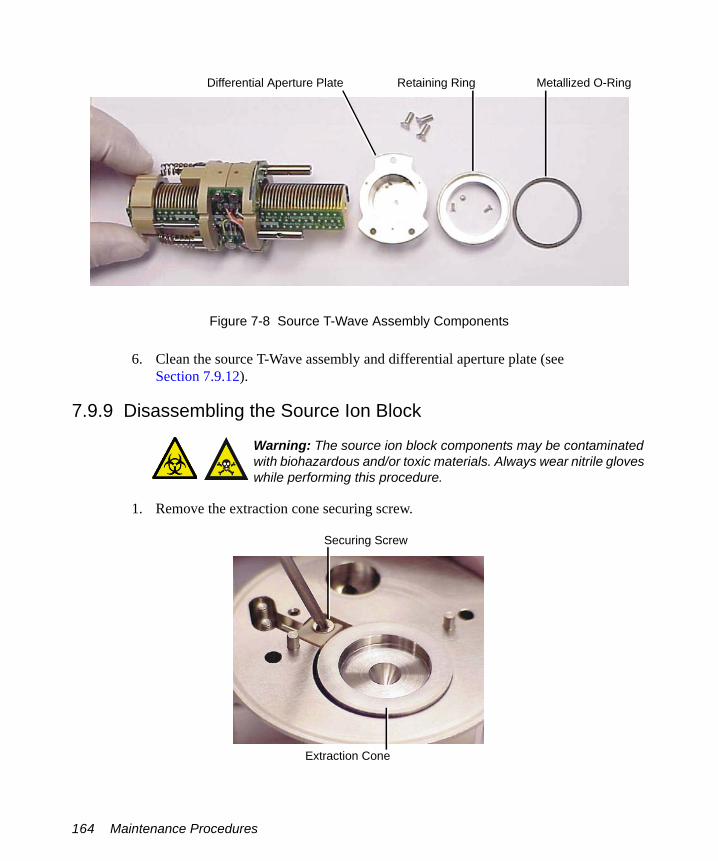
Figure 7-8 Source T-Wave Assembly Components
6. Clean the source T-Wave assembly and differential aperture plate (see Section 7.9.12).
7.9.9 Disassembling the Source Ion Block
1. Remove the extraction cone securing screw.
Warning: The source ion block components may be contaminated with biohazardous and/or toxic materials. Always wear nitrile gloves while performing this procedure.
Differential Aperture Plate Retaining Ring Metallized O-Ring
Securing Screw
Extraction Cone
164 Maintenance Procedures

2. Remove the extraction cone from the ion block.
3. Clean the extraction cone (see Section 7.9.13).4. Remove the extraction cone seal from the ion block.
Caution: Take great care not to damage the extraction cone aperture when removing the extraction cone from the ion block.
Caution: The extraction cone is fragile. To avoid damaging it, never place the extraction cone on its tip, always place it on its flanged base.
Extraction Cone Aperture
Extraction Cone Seal
Cleaning the Source Components 165

5. Remove the two locknuts from the bottom of the isolation valve body.
6. Remove the washer and retaining ring from the isolation valve stem.
7. Remove the isolation valve stem from the isolation valve body (gently push the stem while repeatedly opening and closing the isolation valve).The isolation valve stem components are shown in Figure 7-9.
Isolation Valve Assembly
Locknuts
Isolation Valve Stem
Washer Retaining Ring
166 Maintenance Procedures

Figure 7-9 Isolation Valve Stem Components
8. Clean the isolation valve stem as described in Section 7.9.14.9. Use a hex (Allen) key to remove the four ion block cover plate securing screws.
10. Remove the ion block cover plate.
Ion Block Cover Plate
Cleaning the Source Components 167

11. Use a hex (Allen) key to remove the two screws securing the heater cartridge wires to the PEEK terminal block.
12. Use the needle-nose pliers to carefully swing the ring terminal tags out of the terminal block.
Cartridge Heater Wire Securing Screws
PEEK Terminal Block
Ring Terminal Tag
168 Maintenance Procedures
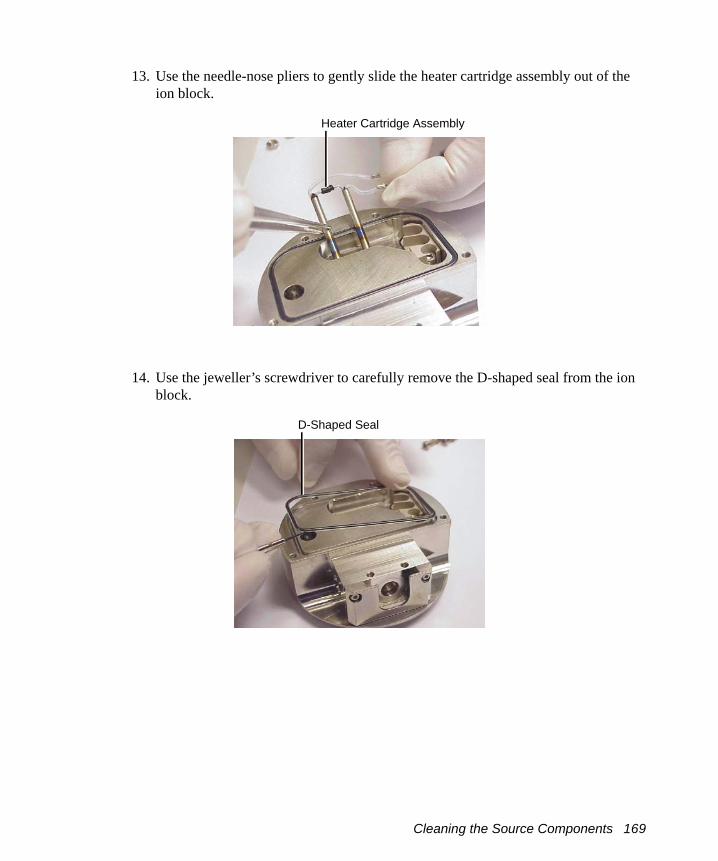
13. Use the needle-nose pliers to gently slide the heater cartridge assembly out of the ion block.
14. Use the jeweller’s screwdriver to carefully remove the D-shaped seal from the ion block.
Heater Cartridge Assembly
D-Shaped Seal
D-Shaped Seal
Cleaning the Source Components 169

15. Use a hex (Allen) key to remove the PEEK terminal block securing screw.
16. Use the needle-nose pliers to remove the PEEK terminal block from the ion block.
PEEK Terminal Block Securing Screw
170 Maintenance Procedures
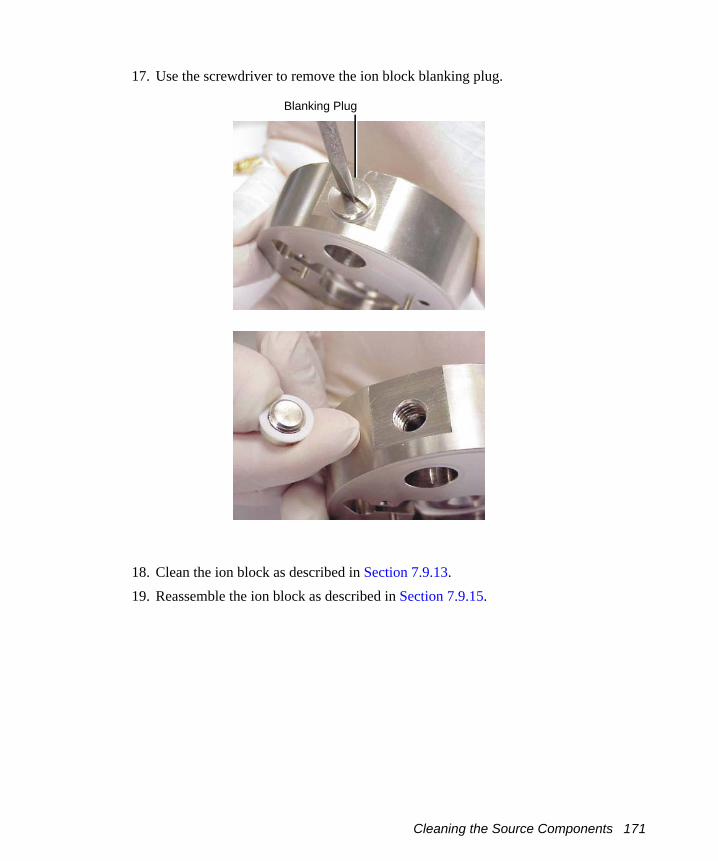
17. Use the screwdriver to remove the ion block blanking plug.
18. Clean the ion block as described in Section 7.9.13.19. Reassemble the ion block as described in Section 7.9.15.
Blanking Plug
Cleaning the Source Components 171

7.9.10 Cleaning the Sample Cone and Cone Gas Cone
1. Use a glass-fiber pen to remove gross contamination from the cone gas cone surface by gentle abrasion.
2. If the sample cone contains debris, place a drop of formic acid on its orifice.3. Immerse the sample cone and cone gas cone separately in glass vessels containing
1:1 methanol/water.
Note: If the parts are obviously contaminated, use 45:45:10 methanol/water/formic acid.
4. Place the vessels in the ultrasonic bath for 30 minutes.5. If formic acid was used in the cleaning solution:
a. Rinse the parts by immersing them separately in glass vessels containing water, and placing the vessels in the ultrasonic bath for 20 minutes.
b. Displace the water by immersing the parts in separate glass vessels containing methanol, and placing the vessels in the ultrasonic bath for 10 minutes.
6. Carefully remove the parts from the vessels, and blow-dry them with inert, oil-free gas. Alternatively, place the components on lint-free towels, and allow them to air dry. Wipe off any water spots with a lint-free cloth.
7.9.11 Cleaning the Gas Exhaust Port
1. Remove gross contamination from the gas exhaust port and aperture by rinsing them in water.
Warning: The sample cone and cone gas cone may be contaminated with biohazardous and/or toxic materials. Always wear nitrile gloves while performing this procedure.
Caution: The sample cone is fragile. To avoid damaging it, never place the sample cone on its tip; always place it on its flanged base.
Warning: Use extreme care when working with formic acid. Use a fume hood and appropriate protective equipment.
Warning: The gas exhaust port may be contaminated with biohazardous and/or toxic materials. Always wear nitrile gloves while performing this procedure.
172 Maintenance Procedures

Note: Gentle abrasion, using a glass-fiber pen, may be required to remove solid deposits.
2. Immerse the gas exhaust port and aperture in a glass vessel containing 1:1 methanol/water.
3. Place the vessel in the ultrasonic bath for 30 minutes.4. Carefully remove the components from the vessel, and blow-dry them using inert,
oil-free gas. Alternatively, place the components on lint-free towels, and allow them to air dry. Wipe off any water spots with a lint-free cloth.
7.9.12 Cleaning the Source T-Wave Components
Cleaning the Source T-Wave Differential Aperture Plate1. Use a glass-fiber pen to gently remove ion burn marks, paying particular attention to
the inner surfaces of the differential aperture plate.2. Immerse the differential aperture plate in a glass vessel containing 1:1
methanol/water.3. Place the vessel in the ultrasonic bath for 30 minutes.4. Carefully remove the differential aperture plate from the vessel, and blow-dry it
using inert, oil-free gas. Alternatively, place the differential aperture plate on lint-free towels, and allow it to air dry. Wipe off any water spots with a lint-free cloth.
Cleaning the Source T-Wave Assembly
1. Gently insert the wire brush (provided) into the T-Wave assembly’s aperture, and use a rotary motion to clean the plates along the length of the device.
Warning: The source T-Wave components may be contaminated with biohazardous and/or toxic materials. Always wear nitrile gloves while performing this procedure.
Caution: Use of acetone, chlorinated solvents, or acid as solvents when cleaning the source T-Wave assembly will damage the assembly. Use only methanol or water.
Caution: Take great care not to damage the T-Wave assembly’s plates when using the wire brush for cleaning.
Cleaning the Source Components 173

2. Use a glass-fiber pen to remove any burn marks on the assembly’s entrance and exit plates.
3. Flush-out the assembly, using methanol from a wash-bottle.4. Immerse the assembly in a glass vessel containing 1:1 methanol/water.5. Place the vessel in the ultrasonic bath for 30 minutes.
6. Carefully remove the assembly from the vessel, and blow-dry it using inert, oil-free gas.
7. Visually inspect the assembly to confirm that no fibers from the wire brush are lodged in it. If fibers are present, repeat the procedure from step 3 onwards.
7.9.13 Cleaning the Ion Block and Extraction Cone
1. Immerse the ion block and extraction cone separately in glass vessels containing 1:1 methanol/water.
Note: If the components are obviously contaminated, use 45:45:10 methanol/water/formic acid.
2. Place the vessels in the ultrasonic bath for 30 minutes.3. If formic acid was used in the cleaning solution:
a. Rinse the ion block and extraction cone by immersing them separately in glass vessels containing water, and placing the vessels in the ultrasonic bath for 20 minutes.
Caution: Do not dry the source T-Wave assembly by any method other than blow drying, otherwise reintroduced contamination may lead to difficulty in pumping down the instrument.
Warning: The ion block and extraction cone may be contaminated with biohazardous and/or toxic materials. Always wear nitrile gloves while performing this procedure.
Warning: Use extreme care when working with formic acid. Use a fume hood and appropriate protective equipment.
Caution: The extraction cone is fragile. To avoid damaging it, never place the extraction cone on its tip.
174 Maintenance Procedures
b. Displace the water by immersing the ion block and extraction cone separately in glass vessels containing methanol, and placing the vessels in the ultrasonic bath for 10 minutes.
4. Carefully remove the ion block and extraction cone from the vessels, and blow-dry them using inert, oil-free gas. Alternatively, place the components on lint-free towels, and allow them to air dry. Wipe off any water spots with a lint-free cloth.
7.9.14 Cleaning the Isolation Valve Stem
1. Use a glass-fiber pen to remove carbon deposits by gentle abrasion.2. Rinse the valve stem by placing it in a vessel containing 1:1 methanol/water, and
placing the vessel in an ultrasonic bath for 20 minutes.
7.9.15 Reassembling the Source Ion BlockNote: Use clean nitrile gloves when reassembling the source components to avoid re-contaminating them.
1. Examine the condition of all O-rings and seals; replace any that are damaged.2. Fit the ion block blanking plug to the ion block and tighten.3. Fit the PEEK terminal block to the ion block.4. Fit and tighten the PEEK terminal block securing screw.5. Fit the D-shaped seal to the ion block, ensuring that it is correctly seated.6. Use the needle-nose pliers to slide the new heater cartridges into the ion block.7. Position the two heater cartridge ring tags onto the PEEK block terminals.8. Use a hex (Allen) key to fit and tighten the two screws securing the heater cartridge
wires to the PEEK terminal block.9. Fit the ion block cover plate.10. Fit and tighten the four ion block cover plate securing screws.11. Fit the isolation valve stem to the isolation valve body.12. Fit the washer and retaining ring to the bottom of the isolation valve stem.13. Fit and tighten the two lock nuts to the bottom of the isolation valve stem.14. Fit the extraction cone seal to the ion block.
Warning: The isolation valve components may be contaminated with biohazardous and/or toxic materials. Always wear nitrile gloves while performing this procedure.
Cleaning the Source Components 175

15. Fit the extraction cone to the ion block.16. Fit and tighten the extraction cone securing screw.
7.9.16 Reassembling the Source T-Wave Assembly1. Fit the differential aperture plate to the source T-Wave assembly.2. Fit and tighten the three screws that secure the differential aperture plate to the
source T-Wave assembly.3. Fit the retaining ring to the assembly.4. Check the condition of the metallized O-ring; if it is damaged, replace it.5. Fit the metallized O-ring to the assembly.6. Fit and tighten the three screws that secure the retaining ring to the source T-Wave
assembly.
7. On later versions of the source T-Wave assembly, fit the PEEK covers to the assembly, then fit and tighten the two screws securing the covers to the assembly.
7.9.17 Fitting the Source T-Wave Assembly to the Instrument1. Ensuring that the “TOP” labels (stamped on the assembly’s PEEK supports) are
uppermost, carefully slide the source T-Wave assembly into the pumping block.
2. Fit the PEEK ion block support to the pumping block.3. Fit and tighten the two PEEK ion block support securing screws.
“TOP” Labels
176 Maintenance Procedures

7.9.18 Fitting the Ion Block and Ion Source Enclosure
1. Check the condition of all O-rings; replace any that are damaged.2. Ensure that all the O-rings are in position on the ion block.3. Fit the ion block to the PEEK ion block support.4. Fit and tighten the two ion block securing screws.5. Ensure that each of the two source enclosure guide pins is fully tightened into the
instrument’s pumping block; a suitable lever can be inserted into the hole in each guide pin to achieve this.
6. Ensuring that the wires to the microswitch do not become trapped between the source enclosure and the pumping block (see Figure 7-2), fit the source enclosure to the pumping block.
7. Fit and tighten the three source enclosure securing bolts.
Note: The securing bolts must each be sequentially tightened a small amount until they are all fully tight; this ensures that the source enclosure is uniformly seated on the pumping block.
8. Close the source enclosure door and fasten the securing clips (see Figure 7-5).9. Connect the Probe electrical connection at the instrument’s front panel (see
Figure 7-5).10. Connect the PTFE tubing to the Desolvation gas connection at the instrument’s front
panel (see Figure 7-5).
11. If any of the O-rings detailed in Section 7.3 has been replaced, perform a pressure test on the source, as described in the Waters Micromass Source Pressure Test Unit Operator’s Guide.
Warning: To avoid possible excessive leakage of solvent into the laboratory atmosphere, perform the procedure exactly as described in this section.
Warning: To avoid possible excessive leakage of solvent into the laboratory atmosphere, if any of the O-rings detailed in Section 7.3 has been replaced, you must perform a pressure test on the source, as described in the Waters Micromass Source Pressure Test Unit Operator’s Guide.
Cleaning the Source Components 177
7.9.19 Fitting the Gas Exhaust Port1. Fit the aperture to the gas exhaust port.2. Fit and tighten the two aperture retaining screws.3. Fit the gas exhaust port into the source enclosure.4. Fit and tighten the gas exhaust port securing screw.
7.9.20 Fitting the Sample Cone
1. Fit the sample cone into the cone gas cone.2. Check the condition of the sample cone/cone gas cone assembly O-ring; replace it,
if it is damaged.3. Fit the O-ring to the sample cone/cone gas cone assembly.4. Fit the sample cone/cone gas cone assembly to the side of the isolation valve body.5. Fit the cone retaining plate.6. Fit and tighten the two cone retaining plate securing screws.
7. Connect the PTFE tube to the cone gas cone.8. Open the isolation valve by moving its lever fully to the left.9. If an APCI probe is to be used, fit the corona discharge pin.10. Close the source enclosure door and fasten the clips.
7.10 Cleaning or Replacing the ESI Probe Tip
Clean the ESI probe tip if a blockage occurs in the internal metal sheathing through which the stainless steel capillary passes.
Replace the ESI probe tip if the threads are damaged.
Replace the O-ring if gas leaks from the O-ring.
Caution: The sample cone is very fragile. To avoid damage, never place the sample cone on its tip; always place it on its flanged base.
178 Maintenance Procedures

7.10.1 Required Materials• Nitrile gloves.
• ¼-inch (6-mm) wrench.• Appropriately-sized glass vessels, in which to completely immerse components
when cleaning. Use only glassware not previously cleaned with surfactants.• HPLC-grade methanol.• HPLC-grade water.• Ultrasonic bath.• Source of oil-free, inert gas (nitrogen or helium) for drying (air-drying optional).
7.10.2 Procedure
1. Remove the probe from the source (see Section 7.9.3).2. Use the ¼-inch (6-mm) wrench to unscrew and remove the probe tip.3. If the probe tip is damaged, replace it; alternatively, clean the probe tip as follows:
a. Immerse the probe tip in a glass vessel containing1:1 methanol/water.b. Place the vessel in the ultrasonic bath for 20 minutes.c. Carefully remove the probe tip from the vessel, and blow-dry it using inert,
oil-free gas.4. If necessary, remove the O-ring and fit a new one.5. Fit and tighten the probe tip to the probe.6. Adjust the probe tip so that the fully extended capillary (when the probe nebulizer
adjuster knob is fully screwed down) protrudes by approximately 1 to 1.5 mm.7. Fit the probe to the source.
Warning: The probe and source components may be contaminated with biohazardous and/or toxic materials. Always wear nitrile gloves while performing this procedure.
Cleaning or Replacing the ESI Probe Tip 179
7.11 Cleaning or Replacing the Corona Discharge Pin
Clean the corona discharge pin if it appears to be corroded or black, or when the signal intensity weakens.
7.11.1 Required Materials• Nitrile gloves• Needle-nose pliers• Lapping film• HPLC-grade methanol• Lint-free tissue
7.11.2 Procedure
1. Remove the probe from the source, as shown in Section 7.9.3.2. Unfasten the source enclosure door’s securing clips, and open the door (see
Figure 7-5).3. Use the needle-nose pliers to remove the corona discharge pin from the source,
pulling it straight out.4. Clean and sharpen the tip of the pin with the lapping film, then wipe it clean with a
methanol-saturated tissue. Replace the pin if it is deformed or otherwise damaged.
Warning: The probe and source components may be contaminated with biohazardous and/or toxic materials. Always wear nitrile gloves while performing this procedure.
Warning: To avoid electric shock, ensure that the instrument is in Standby before commencing this procedure.
Warning: The probe and source may be hot. To avoid burns, take great care while performing this procedure.
180 Maintenance Procedures
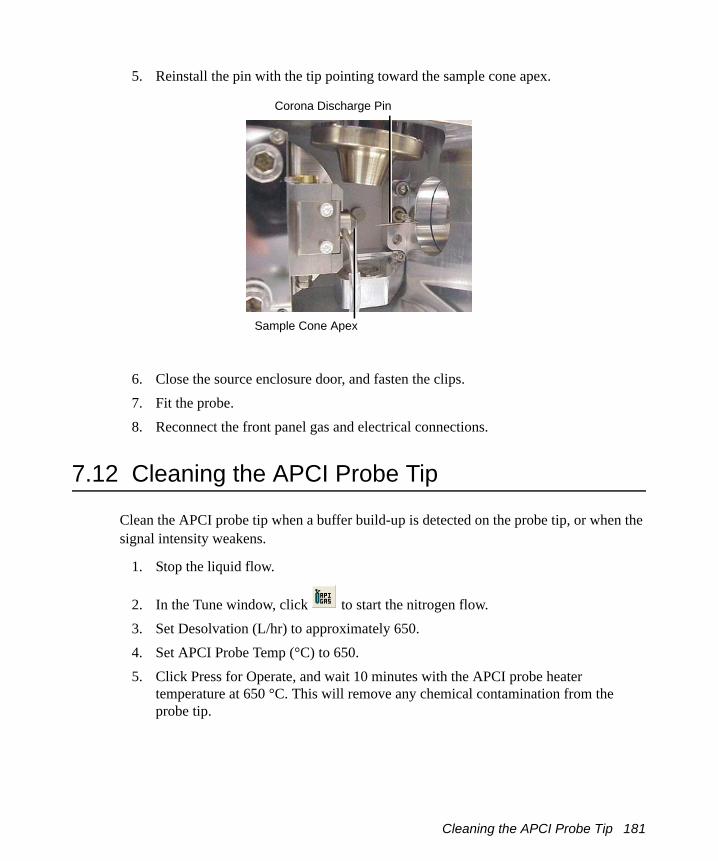
5. Reinstall the pin with the tip pointing toward the sample cone apex.
6. Close the source enclosure door, and fasten the clips.7. Fit the probe.8. Reconnect the front panel gas and electrical connections.
7.12 Cleaning the APCI Probe Tip
Clean the APCI probe tip when a buffer build-up is detected on the probe tip, or when the signal intensity weakens.
1. Stop the liquid flow.
2. In the Tune window, click to start the nitrogen flow.3. Set Desolvation (L/hr) to approximately 650.4. Set APCI Probe Temp (°C) to 650.5. Click Press for Operate, and wait 10 minutes with the APCI probe heater
temperature at 650 °C. This will remove any chemical contamination from the probe tip.
Corona Discharge Pin
Sample Cone Apex
Cleaning the APCI Probe Tip 181
7.13 Replacing the Ion Block Cartridge Heater
Replace the cartridge heater if it fails to heat.
7.13.1 Required Materials• Nitrile gloves• Flat-blade screwdriver• Needle-nose pliers• Hex (Allen) keys
7.13.2 Procedure
1. Follow the procedure for venting the instrument (see Section A.2.3).2. Remove the probe from the source (see Section 7.9.3).3. If using an APCI probe, carefully remove the corona discharge pin.
Warning: The probe and source components may be contaminated with biohazardous and/or toxic materials. Always wear nitrile gloves while performing this procedure.
Warning: The probe and source may be hot. To avoid burns, take great care while performing this procedure.
182 Maintenance Procedures

4. Disconnect the PTFE tube from the cone gas cone.
5. Disconnect the Probe electrical connection from the instrument’s front panel (see Figure 7-5).
6. Disconnect the PTFE tubing at the Desolvation gas connection from the instrument’s front panel (see Figure 7-5).
7. Use a hex (Allen) key to remove the three source enclosure securing bolts.
Cone Gas Cone
PTFE Tube
Replacing the Ion Block Cartridge Heater 183

8. Remove the source enclosure from the instrument.9. Use the 6-mm hex (Allen) key to remove the two ion block securing screws.
10. Remove the ion block from the PEEK ion block support.11. Use a hex (Allen) key to remove the four ion block cover plate securing screws.12. Remove the ion block cover plate.
Caution: To avoid damage, do not apply any force to the source enclosure door when removing the source enclosure from the instrument’s pumping block.
Ion Block
Securing Screws
184 Maintenance Procedures
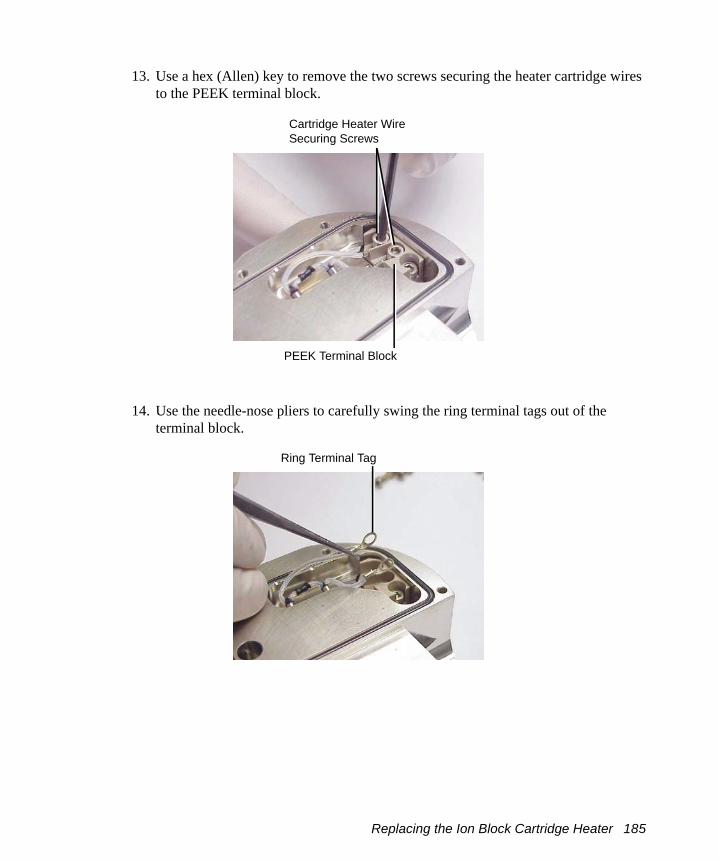
13. Use a hex (Allen) key to remove the two screws securing the heater cartridge wires to the PEEK terminal block.
14. Use the needle-nose pliers to carefully swing the ring terminal tags out of the terminal block.
Cartridge Heater Wire Securing Screws
PEEK Terminal Block
Ring Terminal Tag
Replacing the Ion Block Cartridge Heater 185

15. Use the needle-nose pliers to gently slide the heater cartridge assembly out of the ion block.
16. Use the needle-nose pliers to slide the new heater cartridges into the ion block.17. Position the two heater cartridge ring tags onto the PEEK block terminals.18. Use a hex (Allen) key to fit and tighten the two screws securing the heater cartridge
wires to the PEEK terminal block.19. Fit the ion block cover plate.20. Fit and tighten the four ion block cover plate securing screws.21. Check the condition of all O-rings; if any are damaged, replace them.22. If any of the O-rings detailed in Section 7.3 has been replaced, you must perform a
pressure test on the source, as described in the Waters Micromass Source Pressure Test Unit Operator’s Guide
23. Ensure that all the O-rings are in position on the ion block.24. Fit the ion block to the PEEK ion block support.25. Fit and tighten the two ion block securing screws.26. Ensure that each of the two source enclosure guide pins is fully tightened into the
instrument’s pumping block; a suitable lever can be inserted into the hole in each guide pin to achieve this.
27. Ensuring that the wires to the microswitch do not become trapped between the source enclosure and the pumping block (see Figure 7-2), fit the source enclosure to the pumping block.
Heater Cartridge Assembly
186 Maintenance Procedures
28. Fit and tighten the three source enclosure securing bolts.
Note: The securing bolts must each be sequentially tightened a small amount until they are all fully tight; this ensures that the source enclosure is uniformly seated on the pumping block.
29. Close the source enclosure door and fasten the securing clips (see Figure 7-5).30. Connect the Probe electrical connection at the instrument’s front panel (see
Figure 7-5).31. Connect the PTFE tubing to the Desolvation gas connection at the instrument’s front
panel (see Figure 7-5).
32. If any of the O-rings detailed in Section 7.3 has been replaced, perform a pressure test on the source, as described in the Waters Micromass Source Pressure Test Unit Operator’s Guide.
7.14 Replacing the ESI Probe Sample Capillary
The stainless steel sample capillary in the ESI probe must be replaced if it becomes blocked and cannot be cleared, or if it becomes contaminated or damaged.
7.14.1 Required Materials• 7-mm wrench• ¼-inch (6-mm) wrench• 5/16-inch wrench• Needle-nose pliers• Hex (Allen) key
Warning: To avoid possible excessive leakage of solvent into the laboratory atmosphere, if any of the O-rings detailed in Section 7.3 has been replaced, you must perform a pressure test on the source, as described in the Waters Micromass Source Pressure Test Unit Operator’s Guide.
Replacing the ESI Probe Sample Capillary 187
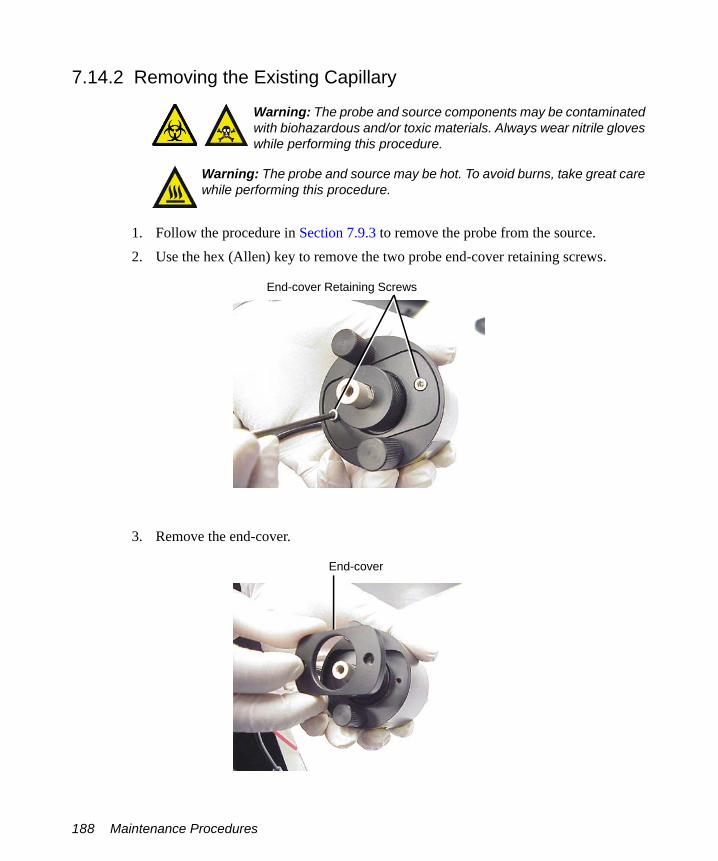
7.14.2 Removing the Existing Capillary
1. Follow the procedure in Section 7.9.3 to remove the probe from the source.2. Use the hex (Allen) key to remove the two probe end-cover retaining screws.
3. Remove the end-cover.
Warning: The probe and source components may be contaminated with biohazardous and/or toxic materials. Always wear nitrile gloves while performing this procedure.
Warning: The probe and source may be hot. To avoid burns, take great care while performing this procedure.
End-cover Retaining Screws
End-cover
188 Maintenance Procedures
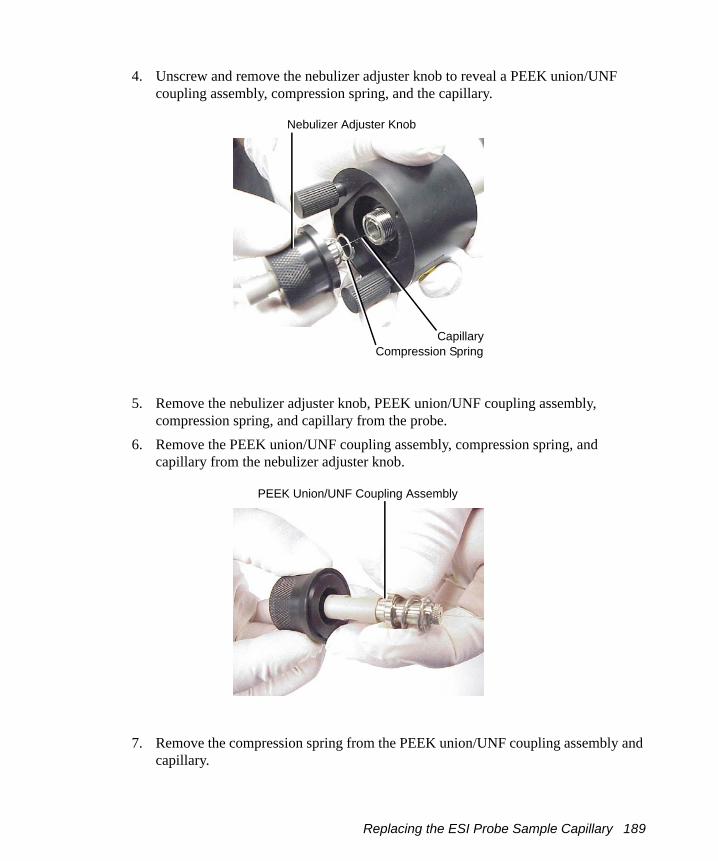
4. Unscrew and remove the nebulizer adjuster knob to reveal a PEEK union/UNF coupling assembly, compression spring, and the capillary.
5. Remove the nebulizer adjuster knob, PEEK union/UNF coupling assembly, compression spring, and capillary from the probe.
6. Remove the PEEK union/UNF coupling assembly, compression spring, and capillary from the nebulizer adjuster knob.
7. Remove the compression spring from the PEEK union/UNF coupling assembly and capillary.
Nebulizer Adjuster Knob
CapillaryCompression Spring
PEEK Union/UNF Coupling Assembly
Replacing the ESI Probe Sample Capillary 189
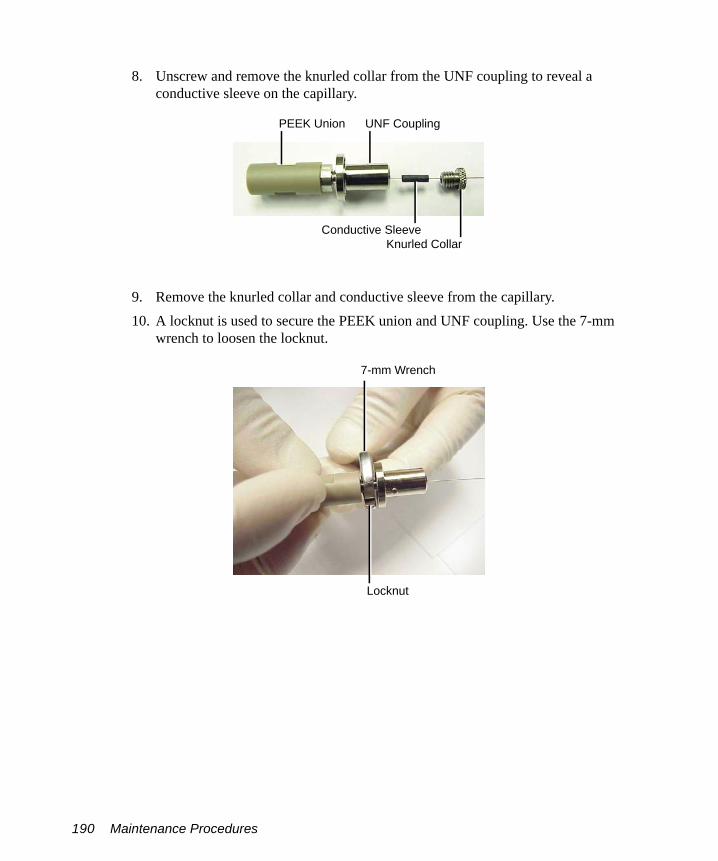
8. Unscrew and remove the knurled collar from the UNF coupling to reveal a conductive sleeve on the capillary.
9. Remove the knurled collar and conductive sleeve from the capillary.10. A locknut is used to secure the PEEK union and UNF coupling. Use the 7-mm
wrench to loosen the locknut.
UNF CouplingPEEK Union
Conductive SleeveKnurled Collar
7-mm Wrench
Locknut
190 Maintenance Procedures

11. Unscrew the PEEK union from the UNF coupling (this connection is finger-tight only).
This reveals a ferrule and liner sleeve:
12. Remove the ferrule and liner sleeve from the capillary.13. Remove the capillary from the UNF coupling.
Ferrule
Liner Sleeve
Replacing the ESI Probe Sample Capillary 191
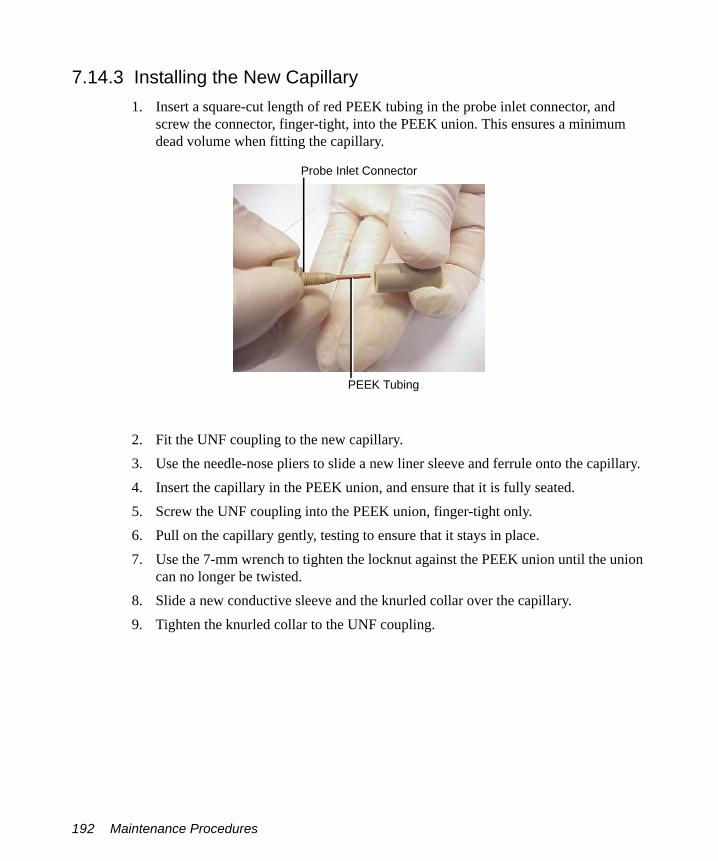
7.14.3 Installing the New Capillary1. Insert a square-cut length of red PEEK tubing in the probe inlet connector, and
screw the connector, finger-tight, into the PEEK union. This ensures a minimum dead volume when fitting the capillary.
2. Fit the UNF coupling to the new capillary.3. Use the needle-nose pliers to slide a new liner sleeve and ferrule onto the capillary.4. Insert the capillary in the PEEK union, and ensure that it is fully seated.5. Screw the UNF coupling into the PEEK union, finger-tight only.6. Pull on the capillary gently, testing to ensure that it stays in place.7. Use the 7-mm wrench to tighten the locknut against the PEEK union until the union
can no longer be twisted.8. Slide a new conductive sleeve and the knurled collar over the capillary.9. Tighten the knurled collar to the UNF coupling.
Probe Inlet Connector
PEEK Tubing
192 Maintenance Procedures
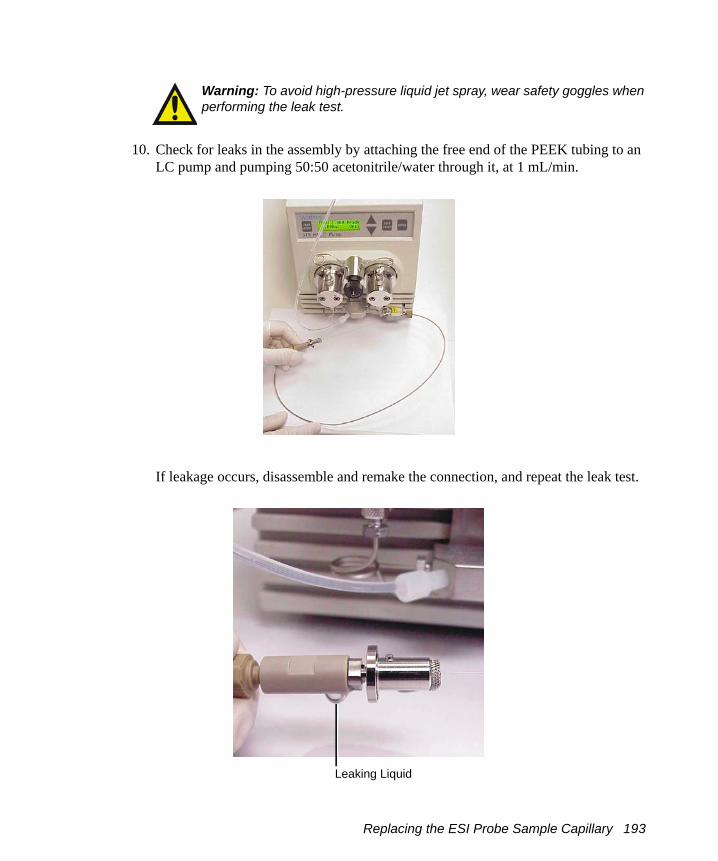
10. Check for leaks in the assembly by attaching the free end of the PEEK tubing to an LC pump and pumping 50:50 acetonitrile/water through it, at 1 mL/min.
If leakage occurs, disassemble and remake the connection, and repeat the leak test.
Warning: To avoid high-pressure liquid jet spray, wear safety goggles when performing the leak test.
Leaking Liquid
Replacing the ESI Probe Sample Capillary 193

11. When performing the leak test, check the backpressure on the LC pump, which will be high if the capillary is blocked. If this is the case, replace the capillary.
12. When the leak test has been performed successfully, disconnect the PEEK tubing from the LC pump.
13. Remove the probe inlet connector and PEEK tubing from the PEEK union.14. Fit the PEEK union/UNF coupling assembly to the nebulizer adjuster knob.15. Fit the compression spring to the capillary and PEEK union/UNF coupling
assembly.
16. Use the ¼-inch (6-mm) wrench to remove the probe tip from the probe.
17. Carefully thread the capillary through the probe assembly.
Compression Spring
Ferrule
194 Maintenance Procedures

18. Depress the PEEK union so that the locating pin on the UNF coupling is fully engaged in the locating slot at the head of the probe assembly. When the union is fully depressed, tighten the nebulizer adjuster knob. Do not tighten the knob fully.
19. Fit the probe end-cover to the probe assembly.20. Fit and tighten the two end-cover securing screws.
Locating Pin(compression spring removed for clarity) Locating Slot
Locating SlotLocating Pin
Replacing the ESI Probe Sample Capillary 195
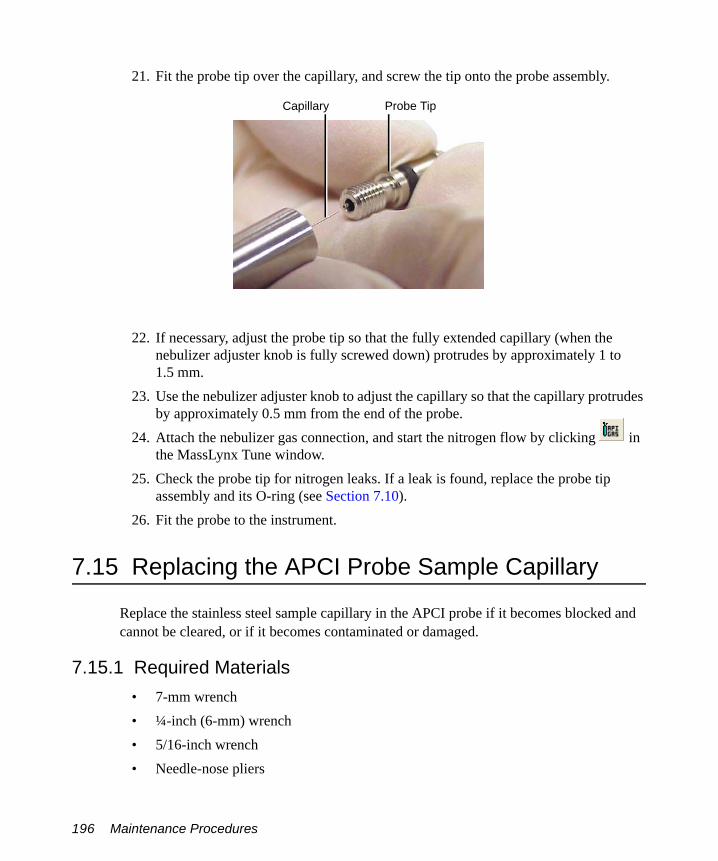
21. Fit the probe tip over the capillary, and screw the tip onto the probe assembly.
22. If necessary, adjust the probe tip so that the fully extended capillary (when the nebulizer adjuster knob is fully screwed down) protrudes by approximately 1 to 1.5 mm.
23. Use the nebulizer adjuster knob to adjust the capillary so that the capillary protrudes by approximately 0.5 mm from the end of the probe.
24. Attach the nebulizer gas connection, and start the nitrogen flow by clicking in the MassLynx Tune window.
25. Check the probe tip for nitrogen leaks. If a leak is found, replace the probe tip assembly and its O-ring (see Section 7.10).
26. Fit the probe to the instrument.
7.15 Replacing the APCI Probe Sample Capillary
Replace the stainless steel sample capillary in the APCI probe if it becomes blocked and cannot be cleared, or if it becomes contaminated or damaged.
7.15.1 Required Materials• 7-mm wrench• ¼-inch (6-mm) wrench• 5/16-inch wrench• Needle-nose pliers
Capillary Probe Tip
196 Maintenance Procedures

• Jeweller’s screwdriver• Hex (Allen) key
7.15.2 Removing the Existing Capillary
1. Follow the procedure detailed in Section 7.9.3, to remove the probe from the source.2. Use the hex (Allen) key to remove the two probe end-cover retaining screws.
Warning: The probe and source components may be contaminated with biohazardous and/or toxic materials. Always wear nitrile gloves while performing this procedure.
Warning: The probe and source may be hot. To avoid burns, take great care while performing this procedure.
End-cover Retaining Screws
Replacing the APCI Probe Sample Capillary 197

3. Remove the end-cover.
4. Unscrew and remove the nebulizer adjuster knob to reveal a PEEK union/UNF coupling assembly, compression spring, and the capillary.
5. Remove the nebulizer adjuster knob, PEEK union/UNF coupling assembly, compression spring, and capillary from the probe.
End-cover
Nebulizer Adjuster Knob
Capillary Compression Spring
198 Maintenance Procedures
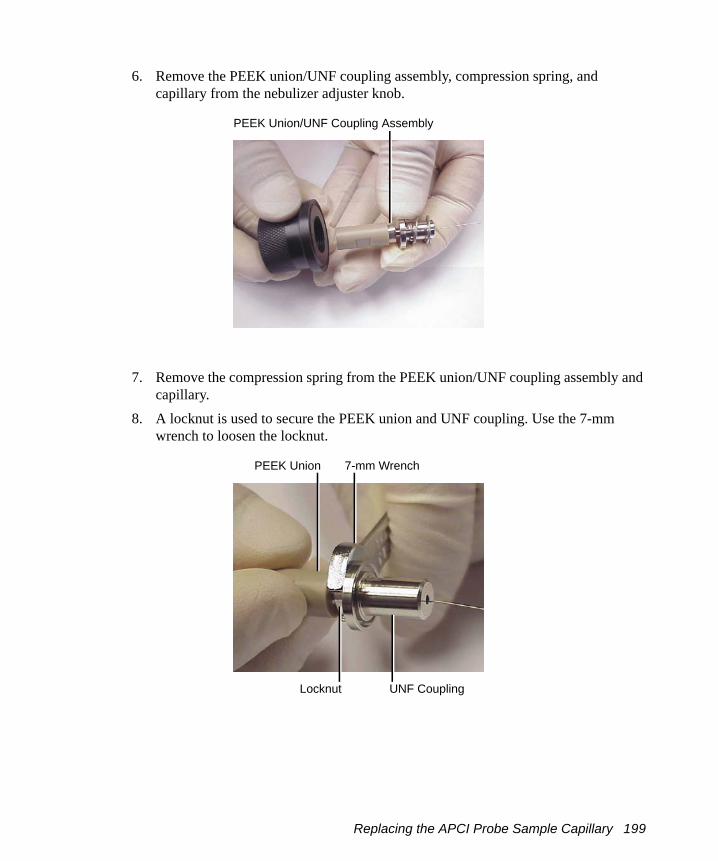
6. Remove the PEEK union/UNF coupling assembly, compression spring, and capillary from the nebulizer adjuster knob.
7. Remove the compression spring from the PEEK union/UNF coupling assembly and capillary.
8. A locknut is used to secure the PEEK union and UNF coupling. Use the 7-mm wrench to loosen the locknut.
PEEK Union/UNF Coupling Assembly
PEEK Union 7-mm Wrench
Locknut UNF Coupling
Replacing the APCI Probe Sample Capillary 199

9. Unscrew the PEEK union from the UNF coupling (this connection is finger-tight only).
This reveals a ferrule.
10. Remove the ferrule from the capillary.11. Remove the capillary from the UNF coupling.
Ferrule
200 Maintenance Procedures
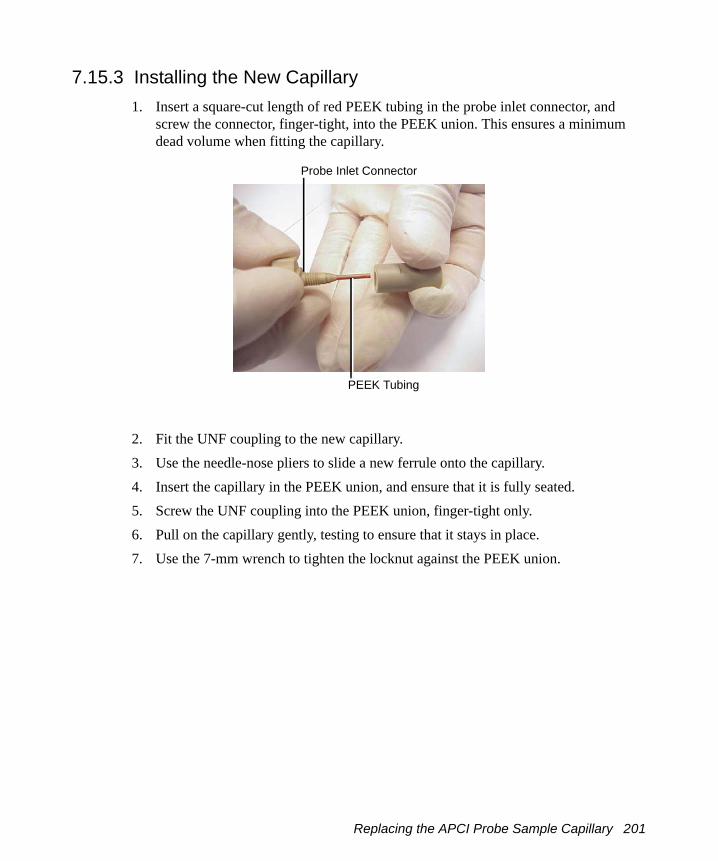
7.15.3 Installing the New Capillary1. Insert a square-cut length of red PEEK tubing in the probe inlet connector, and
screw the connector, finger-tight, into the PEEK union. This ensures a minimum dead volume when fitting the capillary.
2. Fit the UNF coupling to the new capillary.
3. Use the needle-nose pliers to slide a new ferrule onto the capillary.4. Insert the capillary in the PEEK union, and ensure that it is fully seated.5. Screw the UNF coupling into the PEEK union, finger-tight only.6. Pull on the capillary gently, testing to ensure that it stays in place.7. Use the 7-mm wrench to tighten the locknut against the PEEK union.
Probe Inlet Connector
PEEK Tubing
Replacing the APCI Probe Sample Capillary 201
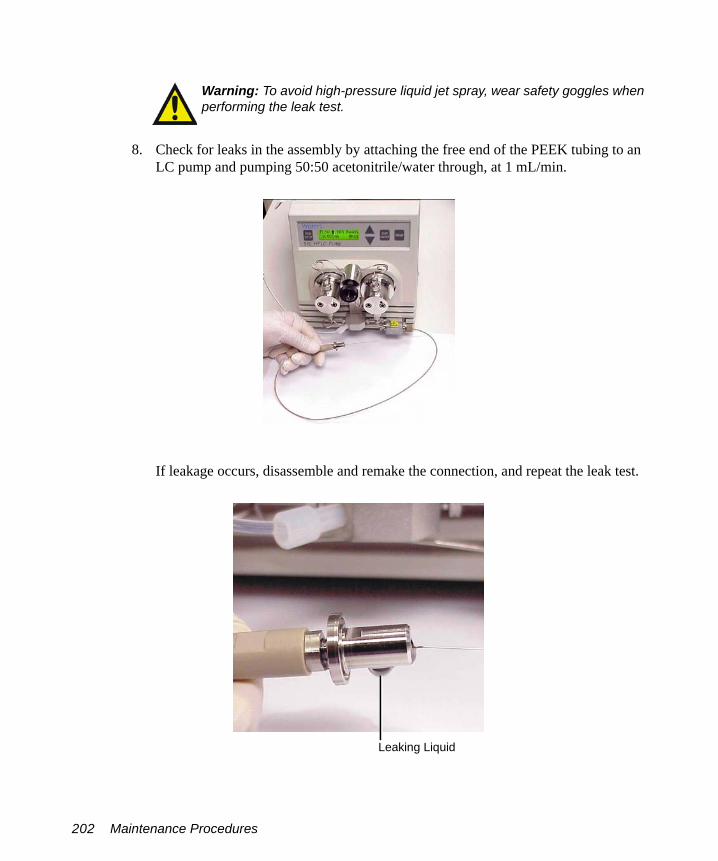
8. Check for leaks in the assembly by attaching the free end of the PEEK tubing to an LC pump and pumping 50:50 acetonitrile/water through, at 1 mL/min.
If leakage occurs, disassemble and remake the connection, and repeat the leak test.
Warning: To avoid high-pressure liquid jet spray, wear safety goggles when performing the leak test.
Leaking Liquid
202 Maintenance Procedures
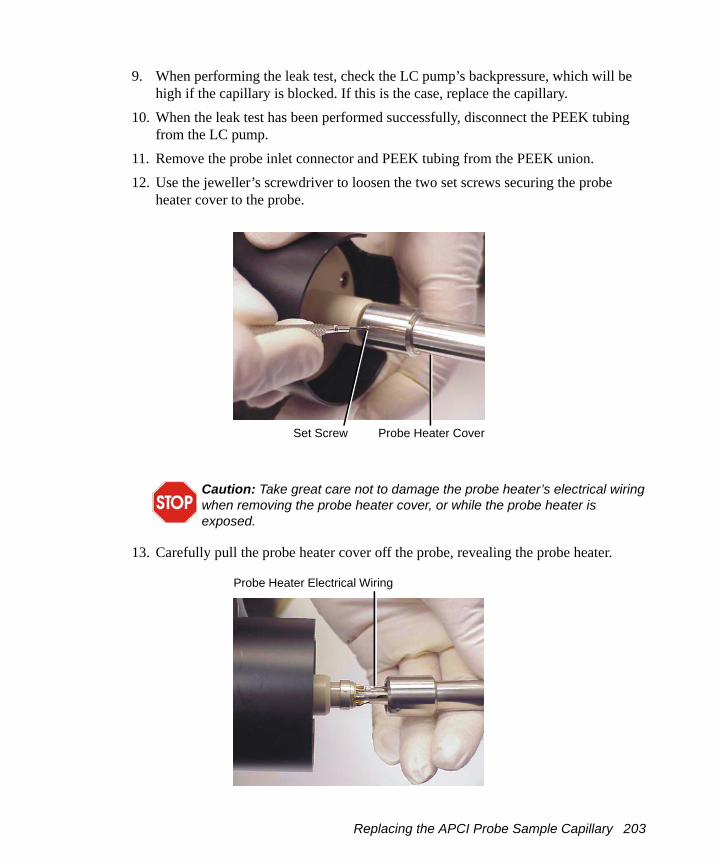
9. When performing the leak test, check the LC pump’s backpressure, which will be high if the capillary is blocked. If this is the case, replace the capillary.
10. When the leak test has been performed successfully, disconnect the PEEK tubing from the LC pump.
11. Remove the probe inlet connector and PEEK tubing from the PEEK union.12. Use the jeweller’s screwdriver to loosen the two set screws securing the probe
heater cover to the probe.
13. Carefully pull the probe heater cover off the probe, revealing the probe heater.
Caution: Take great care not to damage the probe heater’s electrical wiring when removing the probe heater cover, or while the probe heater is exposed.
Probe Heater CoverSet Screw
Probe Heater Electrical Wiring
Replacing the APCI Probe Sample Capillary 203

14. Gripping the probe heater as shown, carefully pull it off the probe assembly.
15. Fit the PEEK union/UNF coupling assembly to the nebulizer adjuster knob.16. Fit the compression spring to the capillary and PEEK union/UNF coupling
assembly.17. Carefully thread the capillary through the probe assembly.
Caution: When handling the probe heater, take great care to grip the heater so as not to damage its electrical wiring.
Caution: To avoid damaging the electrical connections to the probe heater, do not twist the heater when removing it from the probe assembly.
Probe Heater
204 Maintenance Procedures

18. Depress the PEEK union so that the locating pin on the UNF coupling is fully engaged in the locating slot at the head of the probe assembly. When the union is fully depressed, tighten the nebulizer adjuster knob. Do not tighten the knob fully.
19. Fit the probe end-cover to the probe assembly.20. Fit and tighten the two end-cover securing screws.
21. Carefully slide the probe heater over the capillary sleeve on the probe assembly.
Caution: When handling the probe heater, take great care to grip the heater so as not to damage its electrical wiring.
Caution: Take great care not to damage the probe heater’s electrical connections, capillary sleeve, or capillary when fitting the heater over the capillary sleeve.
Locating SlotLocating Pin
Probe Heater Connections
Capillary SleeveCapillary
Replacing the APCI Probe Sample Capillary 205
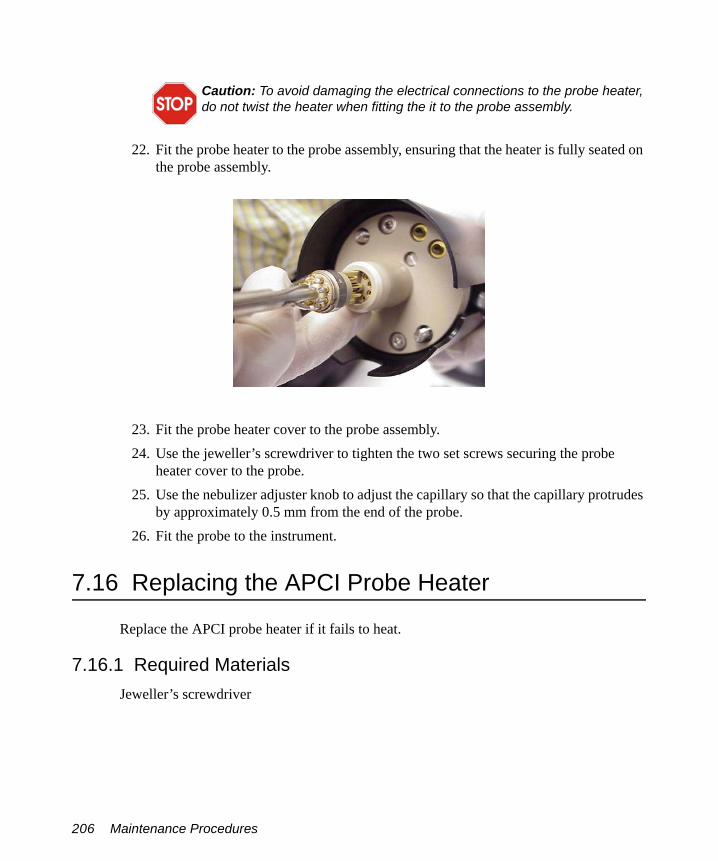
22. Fit the probe heater to the probe assembly, ensuring that the heater is fully seated on the probe assembly.
23. Fit the probe heater cover to the probe assembly.24. Use the jeweller’s screwdriver to tighten the two set screws securing the probe
heater cover to the probe.25. Use the nebulizer adjuster knob to adjust the capillary so that the capillary protrudes
by approximately 0.5 mm from the end of the probe.26. Fit the probe to the instrument.
7.16 Replacing the APCI Probe Heater
Replace the APCI probe heater if it fails to heat.
7.16.1 Required MaterialsJeweller’s screwdriver
Caution: To avoid damaging the electrical connections to the probe heater, do not twist the heater when fitting the it to the probe assembly.
206 Maintenance Procedures
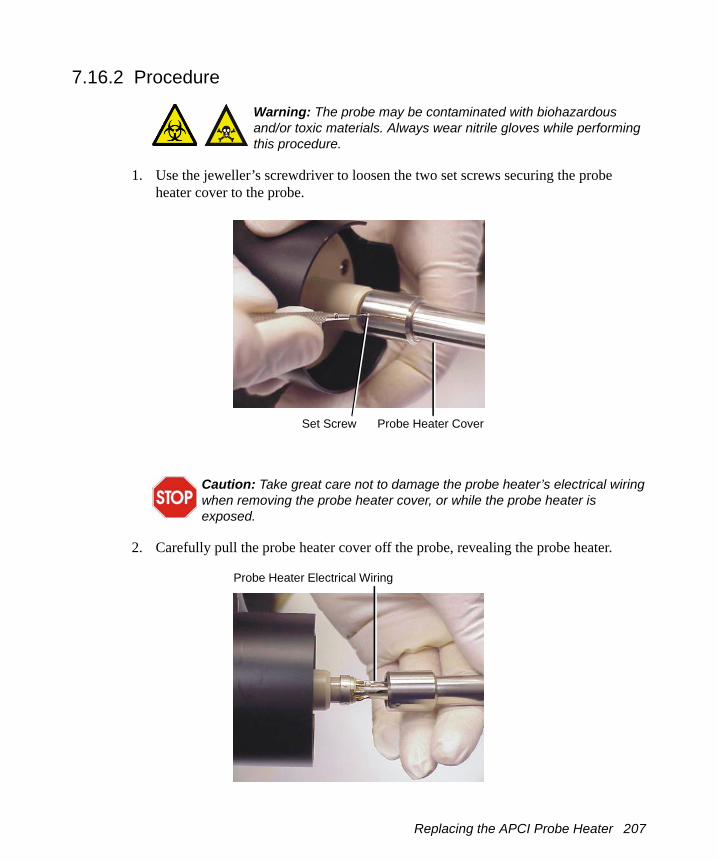
7.16.2 Procedure
1. Use the jeweller’s screwdriver to loosen the two set screws securing the probe heater cover to the probe.
2. Carefully pull the probe heater cover off the probe, revealing the probe heater.
Warning: The probe may be contaminated with biohazardous and/or toxic materials. Always wear nitrile gloves while performing this procedure.
Caution: Take great care not to damage the probe heater’s electrical wiring when removing the probe heater cover, or while the probe heater is exposed.
Probe Heater CoverSet Screw
Probe Heater Electrical Wiring
Replacing the APCI Probe Heater 207

3. Gripping the heater as shown, carefully pull the probe heater off the probe assembly.
4. Carefully slide the new probe heater over the capillary sleeve on the probe assembly.
Caution: When handling the probe heater, take great care to grip the heater so as not to damage its electrical wiring.
Caution: To avoid damaging the electrical connections to the probe heater, do not twist the heater when removing it from the probe assembly.
Caution: Take great care not to damage the probe heater’s electrical connections, capillary sleeve, or capillary when fitting the heater over the capillary sleeve.
Probe Heater
Probe Heater Connections
Capillary SleeveCapillary
208 Maintenance Procedures
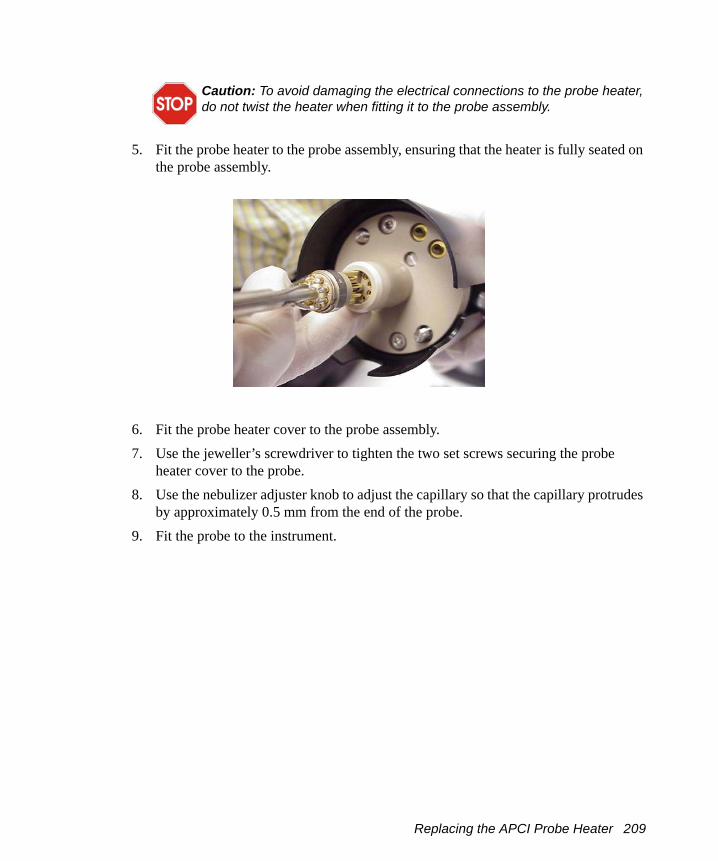
5. Fit the probe heater to the probe assembly, ensuring that the heater is fully seated on the probe assembly.
6. Fit the probe heater cover to the probe assembly.7. Use the jeweller’s screwdriver to tighten the two set screws securing the probe
heater cover to the probe.8. Use the nebulizer adjuster knob to adjust the capillary so that the capillary protrudes
by approximately 0.5 mm from the end of the probe.9. Fit the probe to the instrument.
Caution: To avoid damaging the electrical connections to the probe heater, do not twist the heater when fitting it to the probe assembly.
Replacing the APCI Probe Heater 209

210 Maintenance Procedures

Chapter 8Troubleshooting
This chapter describes how to troubleshoot the Quattro Premier XE Mass Spectrometer with the help of recommended troubleshooting procedures. This chapter covers:
• Safety and handling• General troubleshooting• Component hardware troubleshooting
8.1 Spare Parts
Waters recommends that the customer only replace parts mentioned in this document.
8.2 Safety and Handling
When troubleshooting the Quattro Premier XE, keep the following safety considerations in mind.
8.3 System Troubleshooting
Examine the system, checking the simple things first. Is something obvious causing the problem, for example, are the instrument and its cables improperly connected, or is there any leakage of fluid, vacuum, or gas?
Warning: To avoid electric shock, do not remove the instrument’s panels. There are no user-serviceable items inside the instrument.
Warning: To prevent injury, always observe good laboratory practices when handling solvents, changing tubing, or operating the Quattro Premier XE. Know the physical and chemical properties of the solvents used (see the Material Safety Data Sheets for the solvents in use).
Spare Parts 211

Compare current system operation with the way the system operated before the problem appeared. To help identify normal operating conditions:
• Make a note of the LC system (tubing and electrical connections).• Keep a daily log.• Run test samples regularly. Check the instrument performance with known samples,
preferably the ones used for instrument qualification.This illustrates the importance of keeping track of system parameters and performance during normal operation. Troubleshooting is easier when typical operating conditions are known. For example, are the system tuning parameters values similar to those when a test sample was run previously? Are the lens settings required for optimum sensitivity higher than those obtained previously? If extreme values have to be used to achieve good results, some part of the system is likely to require attention.
Methodically check and eliminate possible causes to identify the system parameter that is atypical.
See the troubleshooting information in the following sections to identify possible causes of symptoms and suggest corrective actions.
If you determine that a problem relates to another system component (for example, HPLC, autosampler, UV detector), see the appropriate operator’s guide.
212 Troubleshooting

8.4 Component Hardware Troubleshooting
The following sections provide suggestions for resolving hardware problems.
8.4.1 Power Switch Fails to Power-up the Instrument
8.4.2 No Peaks in the Tune Window (No Ion Beam)
Warning: Parts of the instrument may be electrically live even when a mains power fuse has failed. To avoid electric shock, isolate the instrument from the mains supply before replacing the mains power fuses.
Possible Cause Corrective Action
Mains power fuse failure. Replace both mains power fuses (see Section 1.6.14).
Possible Cause Corrective Action
The Tune window parameters are improperly set.
Optimize the parameters (see Sections 2.2.1 and 3.2.1).Once a beam has been obtained, ensure that all lenses affect the beam as expected.
Cables are not properly connected. Ensure that all the cables have been correctly attached to the source and probe.
The instrument is not in Operate. Put the instrument into Operate by clicking Press for Operate in the Tune window.(When in Operate, the adjacent icon and the Operate LED on the instrument’s front panel are both green.)
Communication failure. Reinitialize the instrument by selecting Options > Reinitialize in the Tune window. Reboot the embedded PC using the embedded PC reset switch (see Section 1.5.2).
No sample is present. Ensure that sample is loaded correctly in the autosampler or syringe pump syringe.
Component Hardware Troubleshooting 213
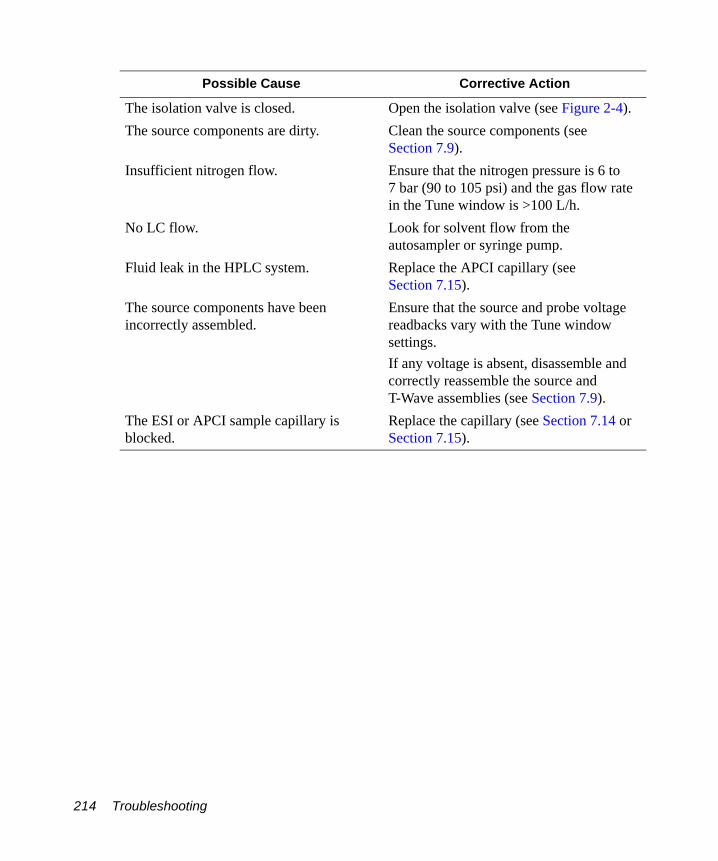
The isolation valve is closed. Open the isolation valve (see Figure 2-4).The source components are dirty. Clean the source components (see
Section 7.9).Insufficient nitrogen flow. Ensure that the nitrogen pressure is 6 to
7 bar (90 to 105 psi) and the gas flow rate in the Tune window is >100 L/h.
No LC flow. Look for solvent flow from the autosampler or syringe pump.
Fluid leak in the HPLC system. Replace the APCI capillary (see Section 7.15).
The source components have been incorrectly assembled.
Ensure that the source and probe voltage readbacks vary with the Tune window settings.If any voltage is absent, disassemble and correctly reassemble the source and T-Wave assemblies (see Section 7.9).
The ESI or APCI sample capillary is blocked.
Replace the capillary (see Section 7.14 or Section 7.15).
Possible Cause Corrective Action
214 Troubleshooting
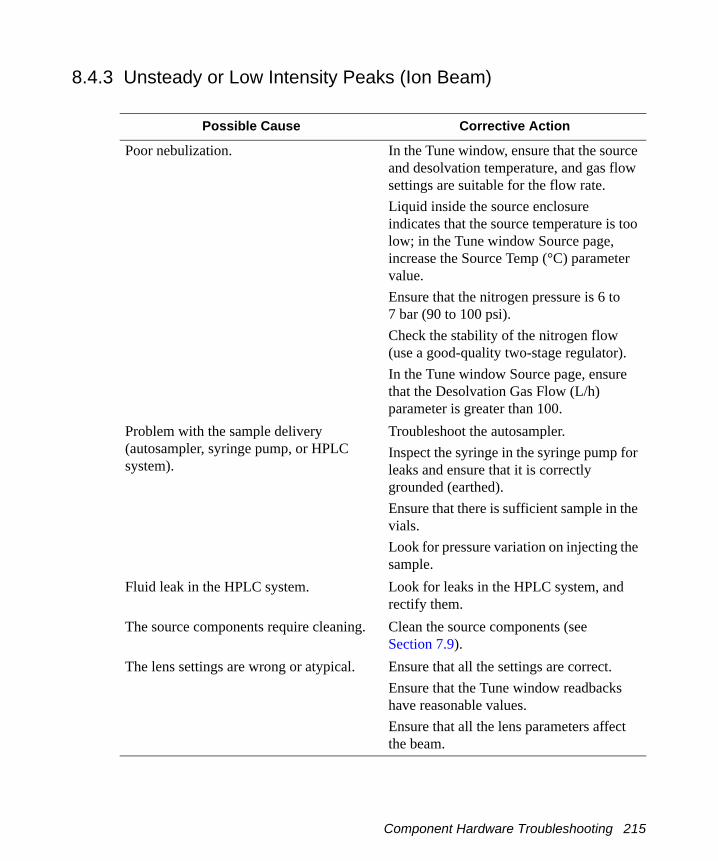
8.4.3 Unsteady or Low Intensity Peaks (Ion Beam)
Possible Cause Corrective Action
Poor nebulization. In the Tune window, ensure that the source and desolvation temperature, and gas flow settings are suitable for the flow rate.Liquid inside the source enclosure indicates that the source temperature is too low; in the Tune window Source page, increase the Source Temp (°C) parameter value.Ensure that the nitrogen pressure is 6 to 7 bar (90 to 100 psi).Check the stability of the nitrogen flow (use a good-quality two-stage regulator).In the Tune window Source page, ensure that the Desolvation Gas Flow (L/h) parameter is greater than 100.
Problem with the sample delivery (autosampler, syringe pump, or HPLC system).
Troubleshoot the autosampler.Inspect the syringe in the syringe pump for leaks and ensure that it is correctly grounded (earthed).Ensure that there is sufficient sample in the vials.Look for pressure variation on injecting the sample.
Fluid leak in the HPLC system. Look for leaks in the HPLC system, and rectify them.
The source components require cleaning. Clean the source components (see Section 7.9).
The lens settings are wrong or atypical. Ensure that all the settings are correct.Ensure that the Tune window readbacks have reasonable values.Ensure that all the lens parameters affect the beam.
Component Hardware Troubleshooting 215
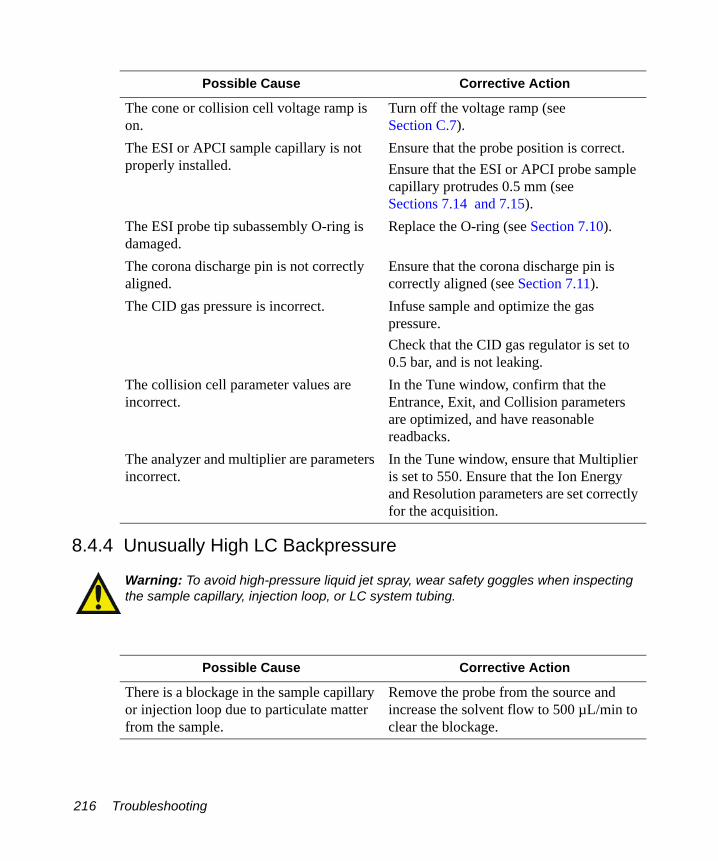
8.4.4 Unusually High LC Backpressure
The cone or collision cell voltage ramp is on.
Turn off the voltage ramp (see Section C.7).
The ESI or APCI sample capillary is not properly installed.
Ensure that the probe position is correct.Ensure that the ESI or APCI probe sample capillary protrudes 0.5 mm (see Sections 7.14 and 7.15).
The ESI probe tip subassembly O-ring is damaged.
Replace the O-ring (see Section 7.10).
The corona discharge pin is not correctly aligned.
Ensure that the corona discharge pin is correctly aligned (see Section 7.11).
The CID gas pressure is incorrect. Infuse sample and optimize the gas pressure.Check that the CID gas regulator is set to 0.5 bar, and is not leaking.
The collision cell parameter values are incorrect.
In the Tune window, confirm that the Entrance, Exit, and Collision parameters are optimized, and have reasonable readbacks.
The analyzer and multiplier are parameters incorrect.
In the Tune window, ensure that Multiplier is set to 550. Ensure that the Ion Energy and Resolution parameters are set correctly for the acquisition.
Warning: To avoid high-pressure liquid jet spray, wear safety goggles when inspecting the sample capillary, injection loop, or LC system tubing.
Possible Cause Corrective Action
There is a blockage in the sample capillary or injection loop due to particulate matter from the sample.
Remove the probe from the source and increase the solvent flow to 500 µL/min to clear the blockage.
Possible Cause Corrective Action
216 Troubleshooting

8.4.5 Unusually Low LC Backpressure
8.4.6 Insufficient Vacuum
There is insufficient vacuum when the Pirani gauge is reading greater than 5 × 10⁻⁴ mbar, when the CID gas is off.
The tubing from LC system is blocked. Remove the finger-tight nut and tubing from the back of the probe.If the backpressure remains high, replace the tubing.
The ESI probe sample capillary is blocked. Replace the sample capillary (see Section 7.14).
The ESI or APCI probe sample capillary is not fully seated in the LC union.
Remove and disassemble the probe, and reseat the sample capillary correctly in the union (see Section 7.14 or Section 7.15).
Possible Cause Corrective Action
Leaking connector. Inspect all the fittings and tighten them if necessary.
Problem with the LC solvent delivery. Troubleshoot the LC system.
Possible Cause Corrective Action
The ion block O-rings are leaking. Disassemble the source and check the condition of the ion block O-rings (see Section 7.9).
Possible Cause Corrective Action
Component Hardware Troubleshooting 217
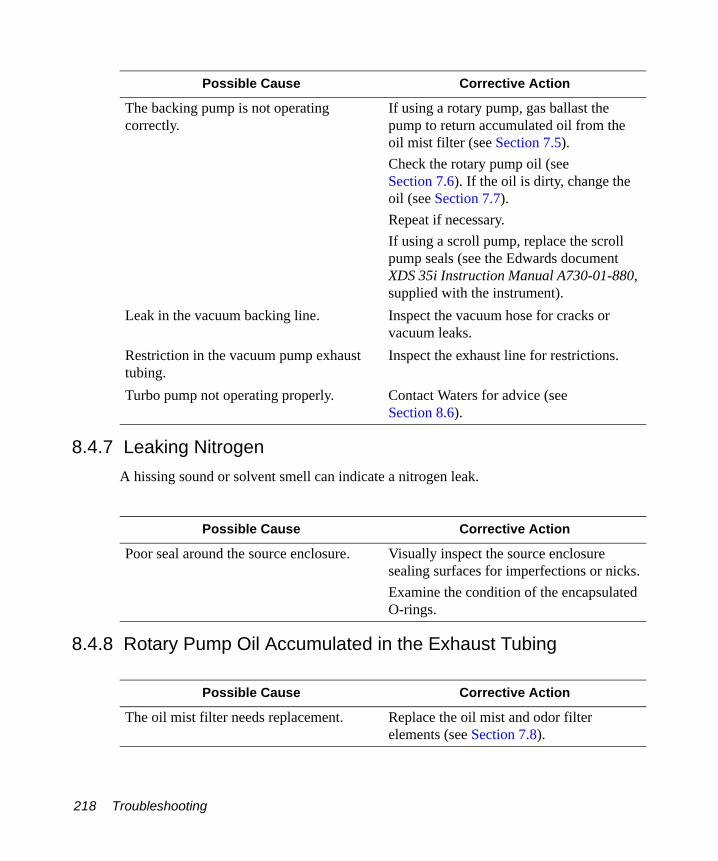
8.4.7 Leaking NitrogenA hissing sound or solvent smell can indicate a nitrogen leak.
8.4.8 Rotary Pump Oil Accumulated in the Exhaust Tubing
The backing pump is not operating correctly.
If using a rotary pump, gas ballast the pump to return accumulated oil from the oil mist filter (see Section 7.5).Check the rotary pump oil (see Section 7.6). If the oil is dirty, change the oil (see Section 7.7).Repeat if necessary.If using a scroll pump, replace the scroll pump seals (see the Edwards document XDS 35i Instruction Manual A730-01-880, supplied with the instrument).
Leak in the vacuum backing line. Inspect the vacuum hose for cracks or vacuum leaks.
Restriction in the vacuum pump exhaust tubing.
Inspect the exhaust line for restrictions.
Turbo pump not operating properly. Contact Waters for advice (see Section 8.6).
Possible Cause Corrective Action
Poor seal around the source enclosure. Visually inspect the source enclosure sealing surfaces for imperfections or nicks.Examine the condition of the encapsulated O-rings.
Possible Cause Corrective Action
The oil mist filter needs replacement. Replace the oil mist and odor filter elements (see Section 7.8).
Possible Cause Corrective Action
218 Troubleshooting

8.4.9 Ion Source Heater and Desolvation Heater are Not Working
8.4.10 APCI Probe Heater Not Working
8.4.11 Failure of the Fuse Supplying the Rotary PumpNote: This fuse is not supplied by Waters – it is in the user’s power supply.
Possible Cause Corrective Action
The ion source heater has failed. Check the Source Temp (°C) readback on the Tune window Source page. Replace the heater if necessary (see Section 7.13).
The main system printed circuit board fuse has failed.
Check the Desolvation Temp (°C) readback on the Tune window Source page. Contact Waters if the readback is incorrect (see Section 8.6).
Possible Cause Corrective Action
If the desolvation heater is working in ESI mode, the APCI probe heater may need replacing.
Replace the APCI probe heater (see Section 7.16).
Possible Cause Corrective Action
The oil mist filter element is saturated.Vacuum oil may also be accumulating in the exhaust tubing.
Replace the oil mist and odor filter elements (see Section 7.8).
The system needs to be ballasted. Ballast the pump for 20 to 30 minutes (see Section 7.5).
The mains supply voltage is less than 208 V a.c.
The mains supply voltage to the instrument must be measured by a qualified electrician.
The rotary pump oil is very dirty. Change the rotary pump oil (see Section 7.7).
Component Hardware Troubleshooting 219

8.4.12 Ion Mode FaultThe Tune window drop-down menu options are unavailable, or the instrument spontaneously switches probe type.
8.4.13 Failure to Recognize a Particular Probe Type
Possible Cause Corrective Action
One, or both, of the probe contact pins are jammed inside the probe and are not making contact with probe support plate.
Remove the probe cover, free the contact pin, and ensure that both the pins and their associated springs move freely within the bushing.
Possible Cause Corrective Action
A problem with the probe. Remove the probe, and try another probe of the same type.On the Tune window Diagnostics page, ensure that the Source ID (V) value is 1.5 to 2.5 V for ESI and 2.5 to 3.5 V for APCI.
220 Troubleshooting
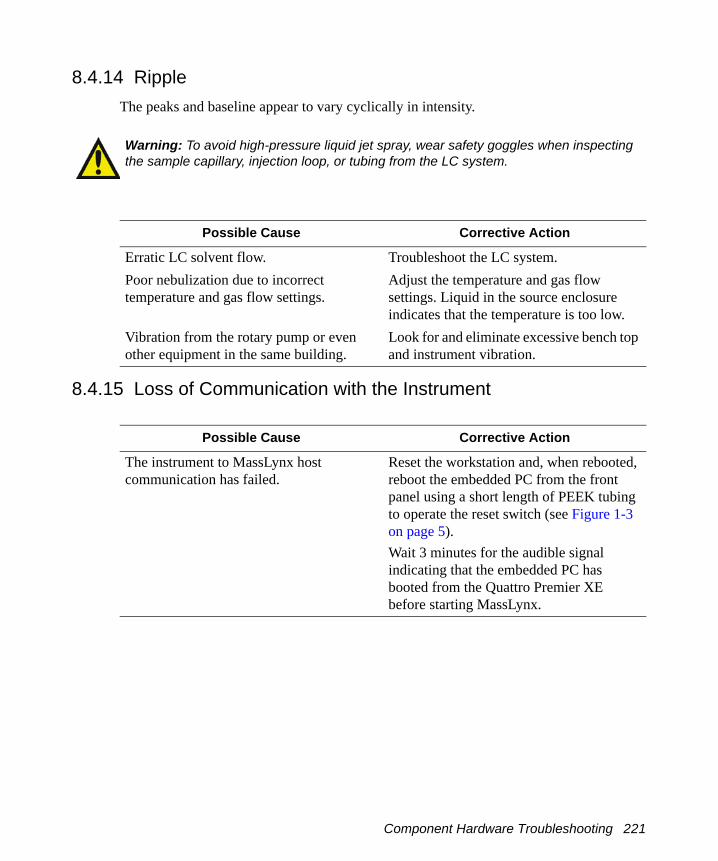
8.4.14 RippleThe peaks and baseline appear to vary cyclically in intensity.
8.4.15 Loss of Communication with the Instrument
Warning: To avoid high-pressure liquid jet spray, wear safety goggles when inspecting the sample capillary, injection loop, or tubing from the LC system.
Possible Cause Corrective Action
Erratic LC solvent flow. Troubleshoot the LC system.Poor nebulization due to incorrect temperature and gas flow settings.
Adjust the temperature and gas flow settings. Liquid in the source enclosure indicates that the temperature is too low.
Vibration from the rotary pump or even other equipment in the same building.
Look for and eliminate excessive bench top and instrument vibration.
Possible Cause Corrective Action
The instrument to MassLynx host communication has failed.
Reset the workstation and, when rebooted, reboot the embedded PC from the front panel using a short length of PEEK tubing to operate the reset switch (see Figure 1-3 on page 5).Wait 3 minutes for the audible signal indicating that the embedded PC has booted from the Quattro Premier XE before starting MassLynx.
Component Hardware Troubleshooting 221

8.4.16 IEEE Communication Errors
8.5 High Noise Levels in MRM Analyses
The background noise in MRM analysis can be either electronic or chemical. To distinguish between the two:
1. Start an acquisition.2. During the acquisition, set Ion Energy 1, and Ion Energy 2 fully negative in the Tune
window Analyser page.
A significant decrease in signal when the ion energies are set negative implies that the major contribution to the overall noise is chemical.
Any residual noise is electronic.
Possible Cause Corrective Action
The instrument’s components have powered up in the wrong sequence.
Power down the system components and start up the system components in the correct order:1. Workstation2. Quattro Premier XE3. Inlet modulesWait 3 minutes for the audible signal indicating that the embedded PC has booted from the Quattro Premier XE before starting MassLynx.
There is a wrong or conflicting IEEE address.
Check the system’s IEEE settings and enter the correct addresses.
There is a faulty IEEE cable in the IEEE chain.
Systematically replace the IEEE cables until the problem cable is located.
Network cables are confused with the site network.
Ensure that the network cable for the instrument is connected to the correct network card in the PC.Ensure that the network card with the BNC connector is configured to the site network.
222 Troubleshooting
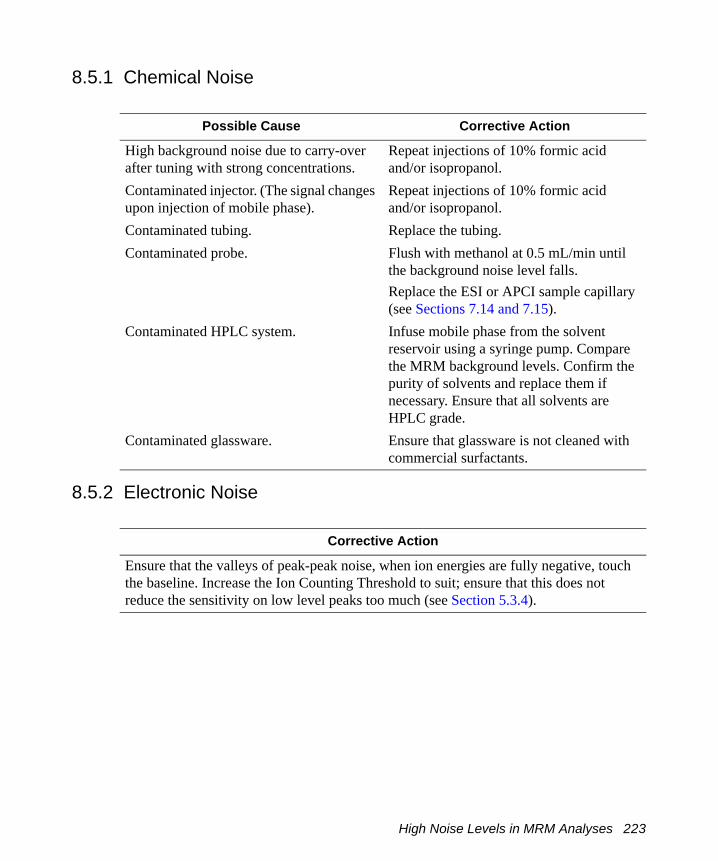
8.5.1 Chemical Noise
8.5.2 Electronic Noise
Possible Cause Corrective Action
High background noise due to carry-over after tuning with strong concentrations.
Repeat injections of 10% formic acid and/or isopropanol.
Contaminated injector. (The signal changes upon injection of mobile phase).
Repeat injections of 10% formic acid and/or isopropanol.
Contaminated tubing. Replace the tubing.Contaminated probe. Flush with methanol at 0.5 mL/min until
the background noise level falls.Replace the ESI or APCI sample capillary (see Sections 7.14 and 7.15).
Contaminated HPLC system. Infuse mobile phase from the solvent reservoir using a syringe pump. Compare the MRM background levels. Confirm the purity of solvents and replace them if necessary. Ensure that all solvents are HPLC grade.
Contaminated glassware. Ensure that glassware is not cleaned with commercial surfactants.
Corrective Action
Ensure that the valleys of peak-peak noise, when ion energies are fully negative, touch the baseline. Increase the Ion Counting Threshold to suit; ensure that this does not reduce the sensitivity on low level peaks too much (see Section 5.3.4).
High Noise Levels in MRM Analyses 223

8.6 Contacting Waters
You can easily correct many problems with the Quattro Premier XE. However, if this is not the case, you must contact Waters.
Customers in the USA and Canada should report maintenance problems they cannot resolve to Waters Technical Service (800 252-4752). All others should visit http://www.waters.com and click Offices, or phone their local Waters subsidiary or Waters corporate headquarters at 34 Maple Street, Milford, MA 01757, USA.
When contacting Waters, have the following information available:
• The nature of the symptom• The Quattro Premier XE serial number
Depending on the nature of the fault, it may also be useful to have the following information available:
• Details of the flow rate, mobile phases, and sample concentrations• Details of the gas cell operating pressure• The Tune window settings• The software version update reference
224 Troubleshooting
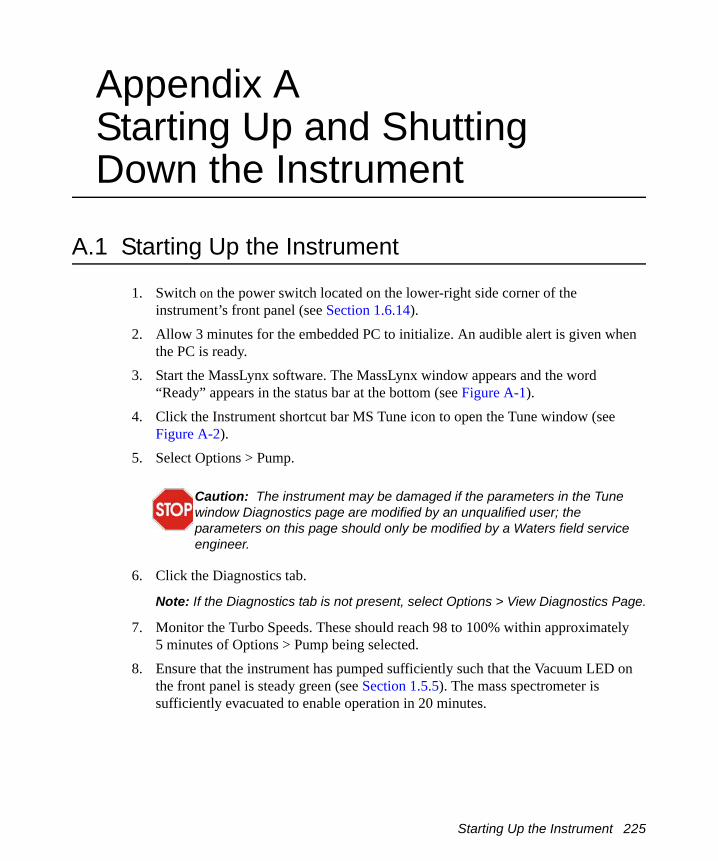
Appendix AStarting Up and Shutting Down the Instrument
A.1 Starting Up the Instrument
1. Switch on the power switch located on the lower-right side corner of the instrument’s front panel (see Section 1.6.14).
2. Allow 3 minutes for the embedded PC to initialize. An audible alert is given when the PC is ready.
3. Start the MassLynx software. The MassLynx window appears and the word “Ready” appears in the status bar at the bottom (see Figure A-1).
4. Click the Instrument shortcut bar MS Tune icon to open the Tune window (see Figure A-2).
5. Select Options > Pump.
6. Click the Diagnostics tab.
Note: If the Diagnostics tab is not present, select Options > View Diagnostics Page.
7. Monitor the Turbo Speeds. These should reach 98 to 100% within approximately 5 minutes of Options > Pump being selected.
8. Ensure that the instrument has pumped sufficiently such that the Vacuum LED on the front panel is steady green (see Section 1.5.5). The mass spectrometer is sufficiently evacuated to enable operation in 20 minutes.
Caution: The instrument may be damaged if the parameters in the Tune window Diagnostics page are modified by an unqualified user; the parameters on this page should only be modified by a Waters field service engineer.
Starting Up the Instrument 225

Figure A-1 MassLynx Window
226 Starting Up and Shutting Down the Instrument

Figure A-2 Tune Window
Starting Up the Instrument 227

A.2 Shutting Down the Instrument
A.2.1 Emergency Shutdown
If you must shut down the instrument in an emergency, switch off the power at the wall mounted isolation switch(es), if fitted. If not, switch off the power switch located on the lower-right side corner of the instrument front panel (see Section 1.5.1), and turn off all peripherals.
Note: Data may be lost.
A.2.2 Overnight Instrument ShutdownWhen the instrument is to be left unattended for a long time, for example, overnight or at weekends, proceed as follows:
1. On the MassLynx Tune window Source page, set the Voltages, Temperatures, Gas Flow, and Syringe parameters to zero.
2. If required, click Press for Standby to switch the instrument out of Operate.
Note: It is not necessary to switch the instrument out of Operate. However, this is acceptable provided that the instrument warm-up time is considered when restarting analysis.
A.2.3 Complete Instrument Shutdown1. In the Tune window, click Press for Standby.2. Select Options > Vacuum.3. Select Vent Instrument.
A message confirms the vent command.4. Click OK. The turbomolecular pumps are switched off. When the turbomolecular
pumps have run down to half their normal operating speed, the vent valves are opened and the instrument is automatically vented. The Vacuum LED will switch off after changing from green to amber.
5. Exit MassLynx.
Warning: The power switch does not isolate the instrument from the mains power supply. Unplug the mains power from the rear of the instrument to isolate the instrument from the mains power supply.
228 Starting Up and Shutting Down the Instrument

6. Shut down the PC.7. Switch off all peripherals.8. Switch off the power switch located on the lower-right side corner of the instrument
front panel (see Section 1.5.1).
Note: The power switch does not isolate the instrument; fans may be heard running, even when the instrument is “off”.
Shutting Down the Instrument 229

230 Starting Up and Shutting Down the Instrument
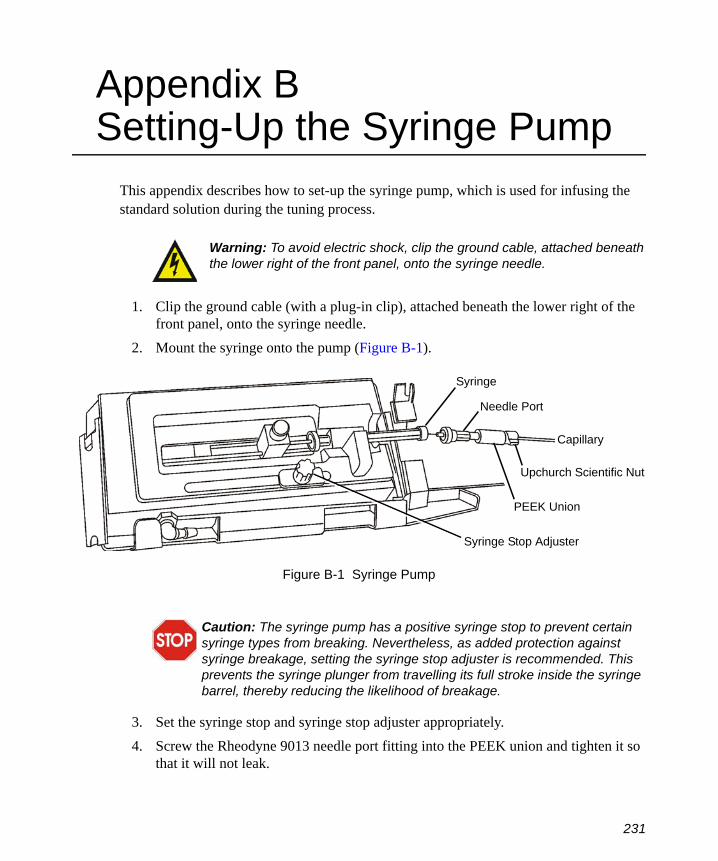
Appendix BSetting-Up the Syringe Pump
This appendix describes how to set-up the syringe pump, which is used for infusing the standard solution during the tuning process.
1. Clip the ground cable (with a plug-in clip), attached beneath the lower right of the front panel, onto the syringe needle.
2. Mount the syringe onto the pump (Figure B-1).
Figure B-1 Syringe Pump
3. Set the syringe stop and syringe stop adjuster appropriately.4. Screw the Rheodyne 9013 needle port fitting into the PEEK union and tighten it so
that it will not leak.
Warning: To avoid electric shock, clip the ground cable, attached beneath the lower right of the front panel, onto the syringe needle.
Caution: The syringe pump has a positive syringe stop to prevent certain syringe types from breaking. Nevertheless, as added protection against syringe breakage, setting the syringe stop adjuster is recommended. This prevents the syringe plunger from travelling its full stroke inside the syringe barrel, thereby reducing the likelihood of breakage.
Syringe
Needle Port
Capillary
Upchurch Scientific Nut
PEEK Union
Syringe Stop Adjuster
231

5. Use a ceramic silica cutter to make a square, even cut on both ends of the sample capillary (supplied in the ESI probe installation kit) before installing. Examine new cuts for squareness using an eye glass. When cutting the capillary, allow enough length to form loops at angles and corners.
6. Feed the capillary through the hole at the top of the molding, the capillary will emerge from a hole at the top right side of the syringe pump area (see Figure 1-3 on page 5).
7. Connect the capillary to the PEEK union, using an Upchurch® Scientific nut, ferrule, and PTFE tubing.
8. Before using the syringe pump, ensure that the type of syringe used is selected in the MassLynx software (see Appendix C, The MassLynx Tune Window).
Caution: The sample capillary is fragile. Take great care to avoid damaging it while performing this procedure.
232 Setting-Up the Syringe Pump

Appendix CThe MassLynx Tune Window
Note: For the highest mass accuracy, tune and calibrate the instrument using a suitable reference compound before sample data are acquired (see Chapter 2, Chapter 3 and Chapter 6.)
C.1 Opening the MassLynx Tune Window
Click the MassLynx window Instrument shortcut bar MS Tune icon to open the Tune window. Figure C-2 summarizes the Tune window layout.
C.2 Selecting the Ionization Mode
Select the required ionization mode from the Ion Mode menu (Figure C-1). The current mode has a check mark next to it.
Figure C-1 Ion Mode Menu
Opening the MassLynx Tune Window 233
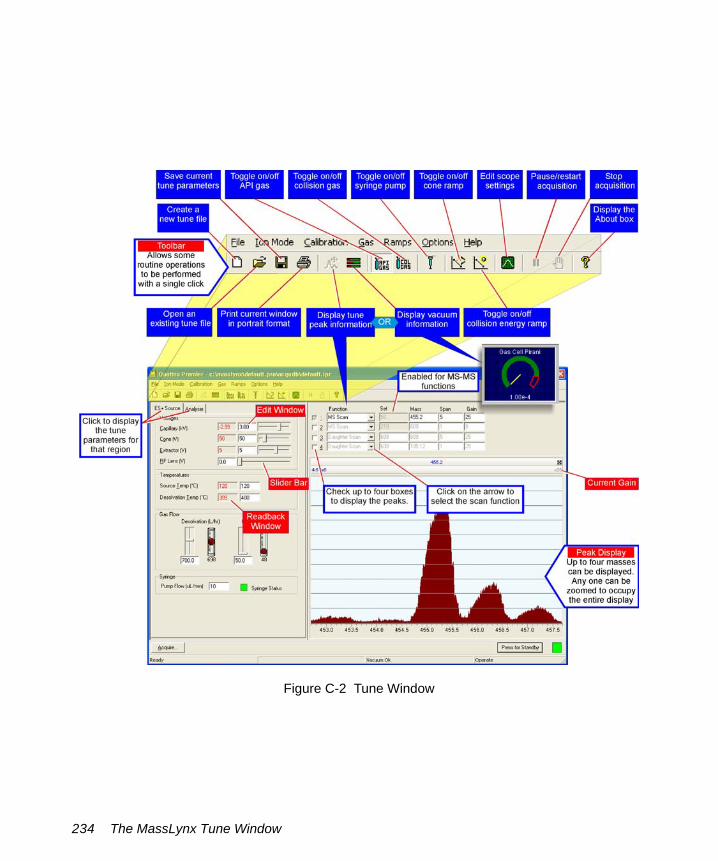
Figure C-2 Tune Window
234 The MassLynx Tune Window
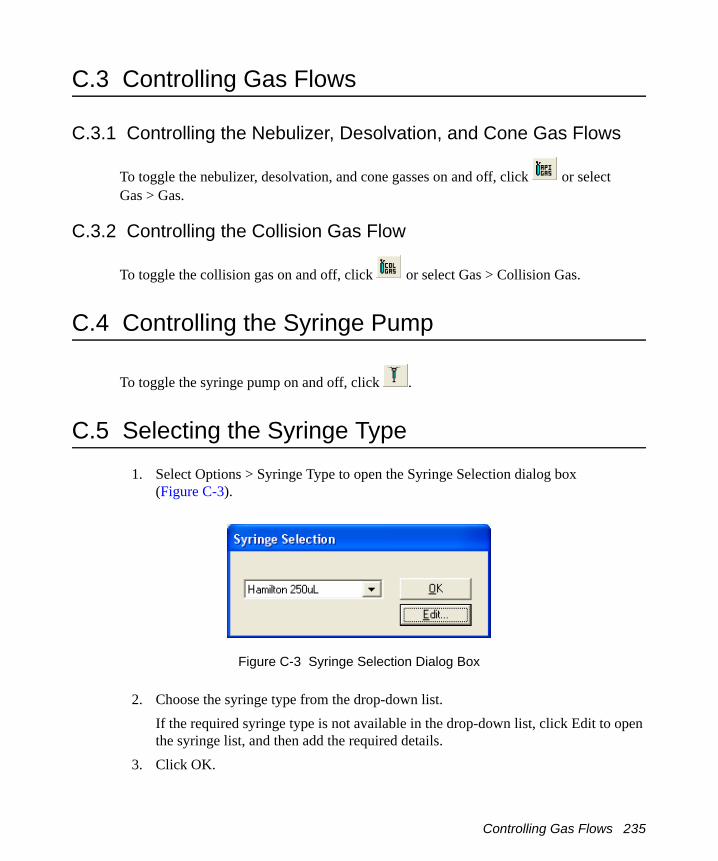
C.3 Controlling Gas Flows
C.3.1 Controlling the Nebulizer, Desolvation, and Cone Gas Flows
To toggle the nebulizer, desolvation, and cone gasses on and off, click or select Gas > Gas.
C.3.2 Controlling the Collision Gas Flow
To toggle the collision gas on and off, click or select Gas > Collision Gas.
C.4 Controlling the Syringe Pump
To toggle the syringe pump on and off, click .
C.5 Selecting the Syringe Type
1. Select Options > Syringe Type to open the Syringe Selection dialog box (Figure C-3).
Figure C-3 Syringe Selection Dialog Box
2. Choose the syringe type from the drop-down list.If the required syringe type is not available in the drop-down list, click Edit to open the syringe list, and then add the required details.
3. Click OK.
Controlling Gas Flows 235

C.6 Selecting the Scan Time and Inter Scan Delay
Enter the Scan Time and Inter Scan Delay in the Scope Setup dialog box (Figure C-4).
This is opened by clicking or selecting Options > Scope Parameters.
Figure C-4 Scope Setup Dialog Box
The Scan Time(s) and Inter Scan Delay (s) parameter values control the speed with which the tune peak display is updated.
Tuning is more responsive when these parameters are set to low values.
C.7 Setting the Ramp Controls
C.7.1 Creating a Cone Voltage Ramp1. Select Ramps > Cone Ramp Gradient to open the Cone Ramp dialog box
(Figure C-5).Two values of cone voltage (Cone Start Volts and Cone End Volts) are defined at two particular masses (Start Mass and End Mass). These values define a gradient for the cone voltage, which is then extrapolated to cover the full mass range.
2. Make any changes required, and click OK to exit.
236 The MassLynx Tune Window
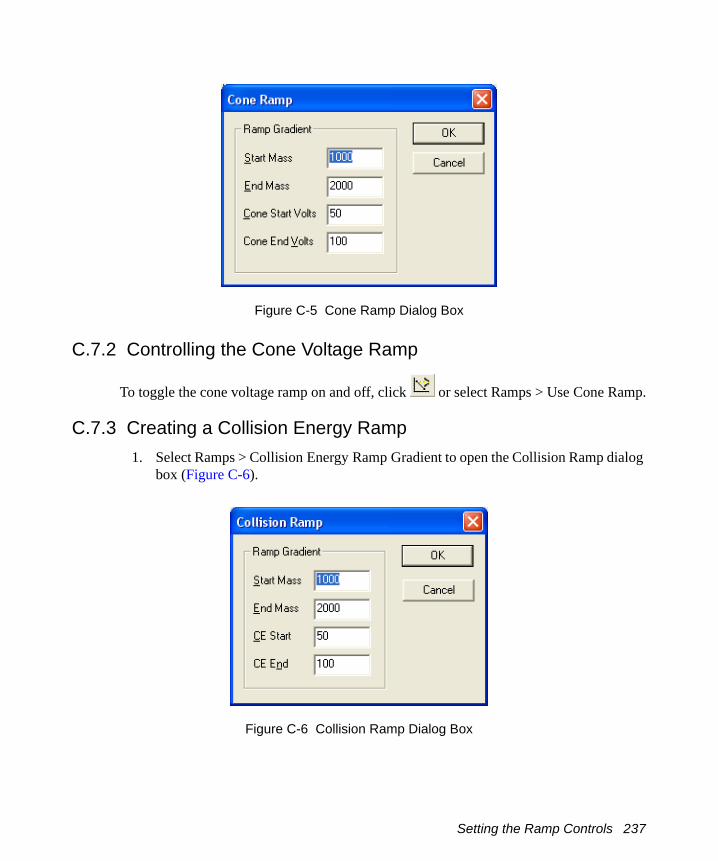
Figure C-5 Cone Ramp Dialog Box
C.7.2 Controlling the Cone Voltage Ramp
To toggle the cone voltage ramp on and off, click or select Ramps > Use Cone Ramp.
C.7.3 Creating a Collision Energy Ramp1. Select Ramps > Collision Energy Ramp Gradient to open the Collision Ramp dialog
box (Figure C-6).
Figure C-6 Collision Ramp Dialog Box
Setting the Ramp Controls 237

Two values of collision energy (CE Start and CE End) are defined at two particular masses (Start Mass and End Mass). These values define a gradient for the collision energy voltage, which is then extrapolated to cover the full mass range.
2. Make any changes required, and click OK to exit.
C.7.4 Controlling the Collision Energy Ramp
To toggle the collision energy ramp on and off, click or select Ramps > Use Collision Energy Ramp.
C.8 Resetting the Zero Level
The zero level (or baseline) can be repositioned by clicking or by selecting Options > Reinitialize.
This command causes the instrument control system to measure the position of the noise signal so that any baseline offset caused by the electronics or instrumentation can be compensated for.
You should reset the zero level whenever the multiplier voltage is changed.
C.9 Controlling the Display of Readback Windows
The Readbacks dialog box (Figure C-7) is opened by selecting Options > Readbacks.
Figure C-7 Readbacks Dialog Box
238 The MassLynx Tune Window

There are three options for displaying system readbacks in the Tune window:
• Readbacks displayed continuously (Always On).• Readbacks hidden (Always Off).• Readbacks displayed only when differing from their defined values by more than
10% (On out of range).
A number of the readbacks are for indication purposes only and are not true (calibrated) records of the actual voltages on the instrument. The acceptable variation between the set value and the readback value varies depending on the particular tune parameter. If you are concerned about any reading, contact Waters for advice (see Section 8.6).
C.10 Changing Tune Parameter Settings
You can modify most parameters in the following ways:
• Use the mouse to drag the slider bar.• Click the slider bar and use the left and right arrow keys to change the value by one
increment.The edit window is updated as the slider bar is activated.• Type a new value into the edit window, then press the Enter key.
Other parameters have only an edit window and are changed by direct typing.
The speed with which the system responds to changes depends on the speed with which the peak display is refreshed. For the fastest response, set the Scope Setup dialog box’s Scan Time (s) and Inter Scan Delay (s) values as short as possible (see Figure C-4).
C.11 Saving Instrument Tune Parameters
Instrument tuning parameters can be saved in an instrument parameter file (.ipr), which can be recalled later.
An instrument parameter file contains all the parameters for all supported ionization modes, not just the ionization mode currently selected. Instrument parameter files also contain settings for the analyzer, inlet set points, and peak display.
Changing Tune Parameter Settings 239

C.11.1 Creating a New Instrument Parameter File
To create a new instrument parameter file, click or select File > New.
C.11.2 Saving Tune Parameters in an Instrument Parameter FileTo save the current tune parameters with the existing instrument parameter file name, click
or select File > Save.
To save the current tune parameters with a new file name:
1. Select File > Save As to open the Save As dialog box.2. Enter a new file name or select an existing file from the displayed list.3. Click Save.4. If the selected file already exists on disk, a warning is displayed. Click Yes to
overwrite the existing information, or No to enter a different file name.
C.11.3 Opening an Existing Instrument Parameter FileTo open an existing instrument parameter file, i.e., restore a saved set of tune parameters:
1. Click or select File > Open to open the Open dialog box.2. Select the required instrument parameter file, either by typing its name or selecting
one from the list.3. Click Open.
C.12 Printing Tune Information
To print a report containing a copy of the on-screen tune peak information and a record of
each parameter setting, click or select File > Print.
This report is not configurable by the user.
240 The MassLynx Tune Window

C.13 Using the EasyTune Source Page
The Tune window EasyTune Source page replaces the Source and Analyser pages. It displays the tune parameters commonly used during instrument tuning, while the more rarely used parameters are hidden.
By default, the MassLynx Tune window opens showing the Source and Analyser pages.To open the Tune Window EasyTune Source page (Figure C-8), select Options > EasyTune.
Using the EasyTune Source page, the instrument is tuned in a similar manner to that described in Chapters 2 and 3.
To close the EasyTune Source page and return to the Source and Analyser pages, select Options > Advanced.
C.14 Changing Between the Peak and Vacuum Displays
Peak information, or vacuum gauge readbacks, can be displayed in the top-right corner of the Tune window.
• To display the vacuum information, select or select Options > Vacuum Monitor.
• To display the peak information, select or Options > Peak Editor.
C.15 Setting-Up Peaks for Tuning
C.15.1 Selecting Peaks for Tuning1. With the Tune window set to display peak information (see Section C.14), select the
peaks to be displayed by selecting the appropriate numbered box(es) in the top-right of the Tune window.
2. For each active peak, enter the required values for the Mass, Span, and Gain.
Note: For MS/MS functions, Set is also enabled, allowing the mass of the parent, daughter, neutral loss, or neutral gain ion (as appropriate) to be entered.
Using the EasyTune Source Page 241
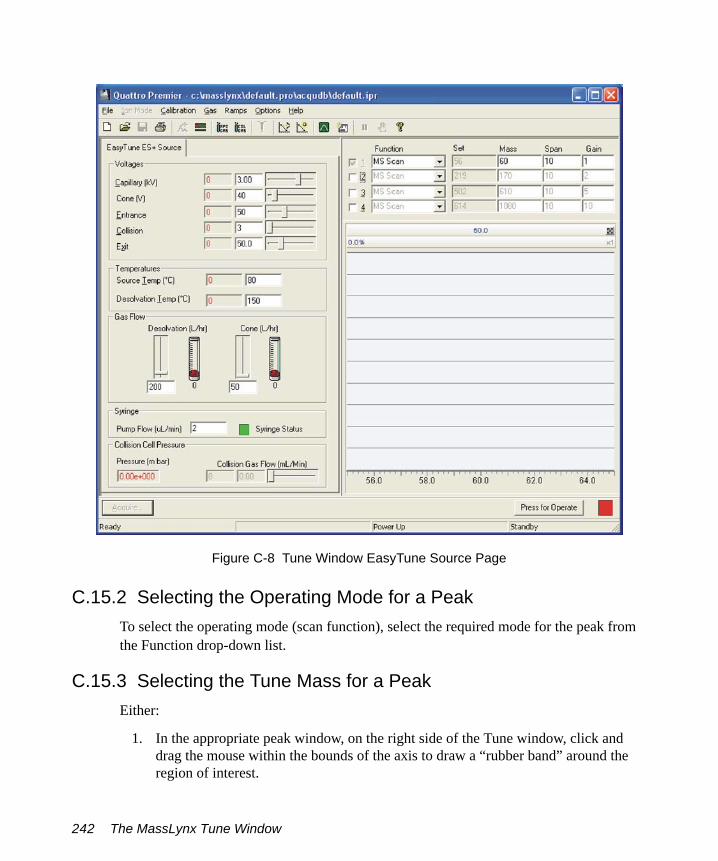
Figure C-8 Tune Window EasyTune Source Page
C.15.2 Selecting the Operating Mode for a PeakTo select the operating mode (scan function), select the required mode for the peak from the Function drop-down list.
C.15.3 Selecting the Tune Mass for a PeakEither:
1. In the appropriate peak window, on the right side of the Tune window, click and drag the mouse within the bounds of the axis to draw a “rubber band” around the region of interest.
242 The MassLynx Tune Window

2. Release the mouse button. This range is redisplayed to fill the window. The value displayed in the Mass box is the mass at the center of the window. This operation can be repeated as often as required.
3. Clicking once displays the previous magnification range and mass; clicking it again returns to the default settings.
Or:
1. Enter a value in the Mass box for the required peak.2. Click Return.
This becomes the default, so if the range is then altered using the mouse and you click
twice, Mass returns to this value.
Or:
1. Position the cursor at the top of the peak window, just below the line displaying the gain value (e.g., 2×).
2. When appears, click and drag the mouse until the required mass is displayed in the Mass box and at the top of the window.This becomes the default, so if the range is altered using the mouse and you click
twice, Mass returns to this value.
C.15.4 Selecting the Span of a Displayed PeakEither:
1. Click and drag the mouse, horizontally, from one end to the other of the region of interest. As the mouse is dragged, a “rubber band” indicates the selected range. Do not go beyond the bounds of the axis.
2. Release the mouse button to redisplay the selected range so that it fills the current window. This operation can be repeated as often as required.
Clicking once displays the previous magnification range, clicking it again returns to the default settings.
Or:
1. Enter a value in the Span box for the required peak.
Setting-Up Peaks for Tuning 243

2. Click Return.
This becomes the default, so if the range is altered with the mouse and you click twice, Span returns to this value.
C.15.5 Changing the Gain of a Displayed PeakEither:
1. Double-click the line displaying the gain value (e.g., 2×) above the peak, to double the gain applied to that peak.
2. Double-click below the peak display to halve the gain.
Or:
1. Click and drag the left mouse button, vertically, from one end to the other of the region of interest.As the mouse is dragged, a marquee indicates the selected range.Do not go beyond the bounds of the axis.
2. Release the mouse button to redisplay the selected range so that it fills the current window.
Or:
1. Enter a value in the Gain box for the required peak.2. Click Return.
C.16 Customizing the Peak Display
C.16.1 Opening the Peak Display MenuUse the Peak Display menu (Figure C-9) to customize the Peak Display. Open it by right-clicking in the appropriate peak display window in the Tune window.
Note: The display window for each peak can be individually customized, e.g., the peak color for peak 1 can be red, for peak 2 green, etc.
244 The MassLynx Tune Window
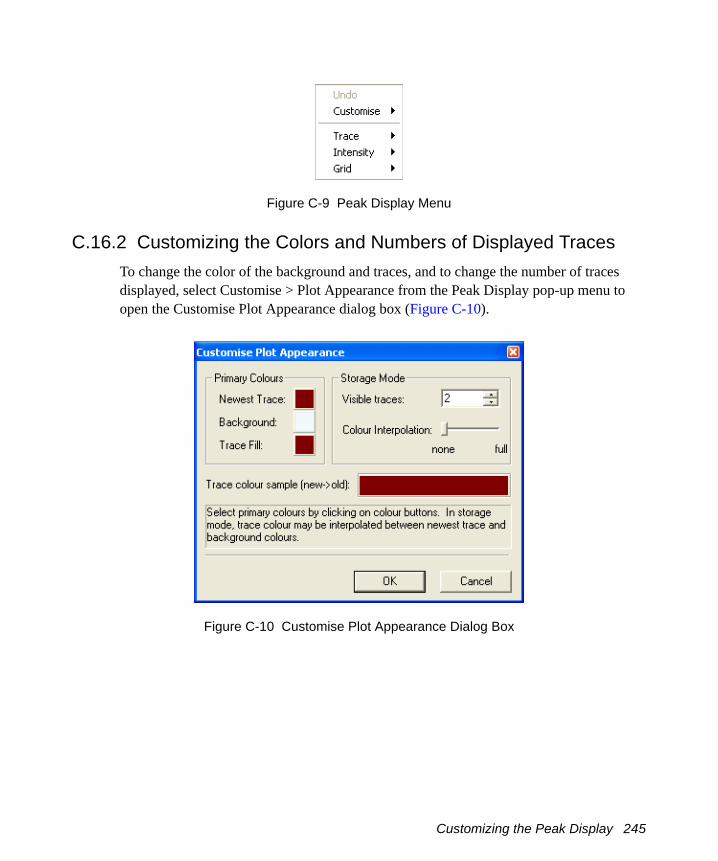
Figure C-9 Peak Display Menu
C.16.2 Customizing the Colors and Numbers of Displayed TracesTo change the color of the background and traces, and to change the number of traces displayed, select Customise > Plot Appearance from the Peak Display pop-up menu to open the Customise Plot Appearance dialog box (Figure C-10).
Figure C-10 Customise Plot Appearance Dialog Box
Customizing the Peak Display 245

To change the colors on the display, click the color box adjacent to Newest Trace, Background, or Trace Fill as required, and select a new color from the Color dialog box.
To change the number of displayed traces, enter the required value in the Visible traces box, within the range 2 to 20.
If more than one trace is displayed, the older traces can be displayed in different color shades to the newer ones. Drag the Colour Interpolation slider toward the full position. The colors of the older traces appear in the Trace colour sample (new->old) field.
C.16.3 Customizing the Peak Trace Line AppearanceEach trace may be displayed as:
• Outline only – select Trace > Outline from the Peak Display pop-up menu.• With the area below the line filled – select Trace > Fill from the Peak Display
pop-up menu.• Maximum and minimum points only – select Trace > Min/Max from the Peak
Display pop-up menu.
The selected option displays a check mark in the Peak Display pop-up menu.
C.16.4 Customizing the Peak Intensity DisplayTo display the peak intensities as absolute values (counts/second), select Intensity > Absolute Intensity from the Peak Display pop-up menu.
To display the peak intensities as percentage values relative to the intensity of the highest peak, select Intensity > Relative Intensity from the Peak Display pop-up menu.
The Peak Display pop-up menu Intensity > Normalise Data option can be selected in conjunction with either of the above options. It controls the way in which the peak display is scaled. When enabled, the display scales to the value of the intensity of the highest peak; when disabled, the display scales to the default value set in the MassLynx software. It is recommended that the Intensity > Normalise Data option is normally enabled.
The selected options display a check mark in the Peak Display pop-up menu.
C.16.5 Customizing the Peak Display GridThe Peak Display vertical and horizontal grid lines may be independently displayed or hidden.
246 The MassLynx Tune Window
To display the horizontal grid lines, select Grid > Horizontal from the Peak Display pop-up menu.
To display the vertical grid lines, select Grid > Vertical from the Peak Display pop-up menu.
The selected options display a check mark in the Peak Display pop-up menu.
C.17 Selecting the Instrument Name
1. Select Options > Instrument Name to open the Instrument Name dialog box.2. Enter the required name in the ID text box.3. Click OK.
C.18 The Diagnostics Page
The Tune window Diagnostics page, opened by selecting Options > View Diagnostics Page, is intended for use by Waters field service engineers only.
C.19 Manually Controlling the T-Wave Optics
The T-Wave devices have been optimized for use under normal operating conditions and their control should normally be left to MassLynx. Nevertheless, manual control of the optics may be desirable under certain conditions, for example, at high gas cell pressures (>7 × 10⁻³ mbar).
Note: Inappropriate settings will result in poor performance in terms of sensitivity and/or high levels of cross-talk.
The source T-Wave is only applied when using the optional MUX-technology interface (see the Waters Micromass Quattro Premier XE MUX-technology Interface Operator’s Guide for details). The collision cell T-Wave is applied for MS methods that require collision gas in the cell.
Caution: The instrument may be damaged if the parameters in the Tune window Diagnostics page are modified by an unqualified user. The parameters on this page should only be modified by a Waters field service engineer.
Selecting the Instrument Name 247
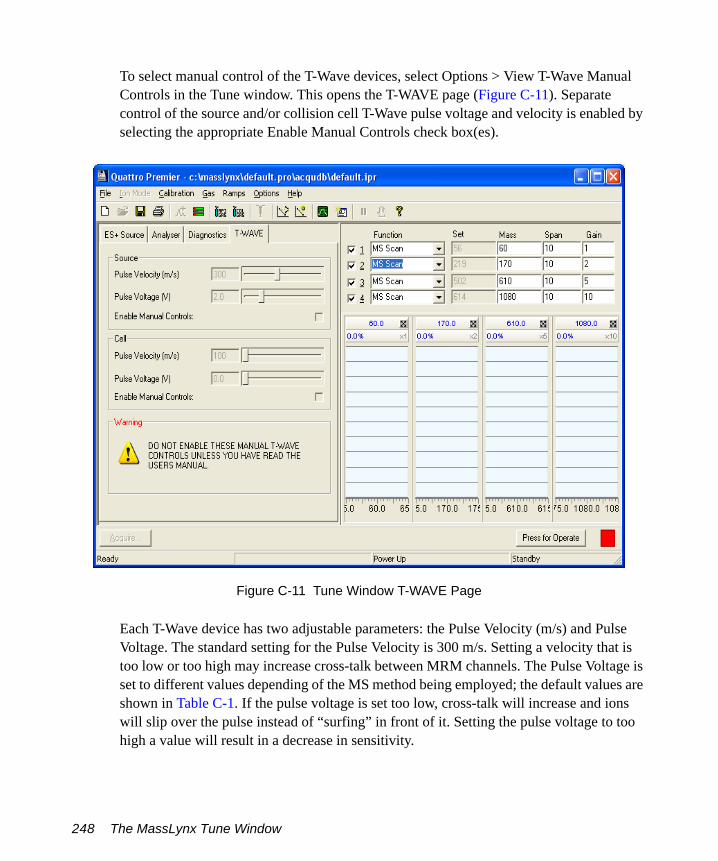
To select manual control of the T-Wave devices, select Options > View T-Wave Manual Controls in the Tune window. This opens the T-WAVE page (Figure C-11). Separate control of the source and/or collision cell T-Wave pulse voltage and velocity is enabled by selecting the appropriate Enable Manual Controls check box(es).
Figure C-11 Tune Window T-WAVE Page
Each T-Wave device has two adjustable parameters: the Pulse Velocity (m/s) and Pulse Voltage. The standard setting for the Pulse Velocity is 300 m/s. Setting a velocity that is too low or too high may increase cross-talk between MRM channels. The Pulse Voltage is set to different values depending of the MS method being employed; the default values are shown in Table C-1. If the pulse voltage is set too low, cross-talk will increase and ions will slip over the pulse instead of “surfing” in front of it. Setting the pulse voltage to too high a value will result in a decrease in sensitivity.
248 The MassLynx Tune Window
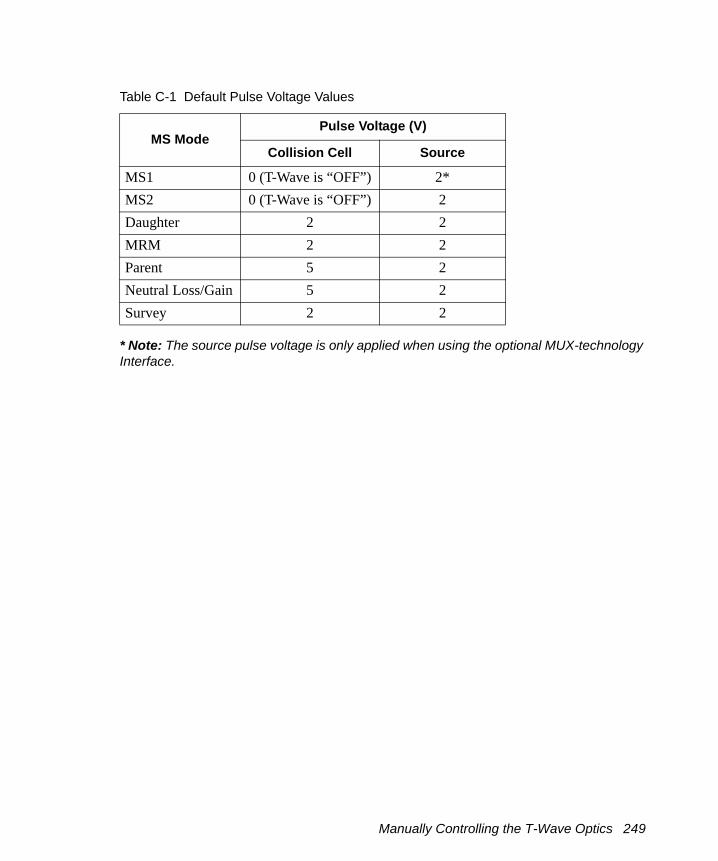
* Note: The source pulse voltage is only applied when using the optional MUX-technology Interface.
Table C-1 Default Pulse Voltage Values
MS ModePulse Voltage (V)
Collision Cell Source
MS1 0 (T-Wave is “OFF”) 2*MS2 0 (T-Wave is “OFF”) 2Daughter 2 2MRM 2 2Parent 5 2Neutral Loss/Gain 5 2Survey 2 2
Manually Controlling the T-Wave Optics 249

250 The MassLynx Tune Window
Appendix DCalibration Reference Information
D.1 Overview
Calibration reference files consist of two columns of numbers separated by any number of spaces or tab characters. The first column contains the reference peak masses, and the second column contains the reference peak intensities.
The reference files listed in this appendix have all ion intensities set to 100%. Actual ion intensities are not, in fact, all 100%, but the calibration software does not take account of the ion intensities and this is therefore a convenient way of storing the reference files in the required format. However, if required, realistic intensity values can be entered to improve the appearance of the reference spectra.
Most samples can be purchased from the Sigma chemical company. To order, contact Sigma at http://www.sigma.sial.com. This site contains a list of worldwide Sigma offices, many with local toll-free numbers.
D.2 Editing a Calibration Reference File
Calibration reference files can be created or edited using any Windows text editor. To read a reference file into the Notepad text editor:
1. In the Tune window, select Calibration > Calibrate Instrument to open the Calibration dialog box.
2. Select the required reference file from the drop-down list box.
3. Click or select Edit > Reference File to open the reference file in Notepad.
Overview 251

To save the reference file after editing, select File > Save to save the file under the current name, or select File > Save As to save as a new reference file with a new name.
Textual information or comments can be stored in the reference file. Lines that are textual information or comments must start with the semicolon (;) character.
D.3 Positive Ion Calibration Reference Files
The following table lists typical reference files that can be used for positive ion calibration.
Ref. File Name
Chemical Name [Sigma Code #]
Molecular Mass m/z Uses
PEGNH4 Ammoniated polyethylene glycol 50 to 2000 General calibration
NAICS Sodium iodide/cesium iodide mixture
20 to 4000 General, ES+ calibration
UBQ Bovine ubiquitin [U6253] 8564.85 650 to 1500 GeneralHBA Human α globin [H753] 15126.36 700 to 1500 Hb analysisSOD Superoxide dismutase [S2515] 15591.35 900 to 1500 Hb (internal
calibration)HBB Human β globin [H7379] 15867.22 800 to 1500 Hb analysisMYO Horse heart myoglobin [M1882] 16951.48 700 to 1600 GeneralPEGH1000 Polyethylene glycol + ammonium
acetate mixturePEG 200+400+600+1000
80 to 1000 ES+ and APCI+ calibration
PEGH2000 Polyethylene glycol + ammonium acetate mixturePEG 200+400+600+1000+1450
80 to 2000 ES+ calibration
NAIRB Sodium iodide/rubidium iodide mixture
20 to 4000 ES+ calibration
252 Calibration Reference Information
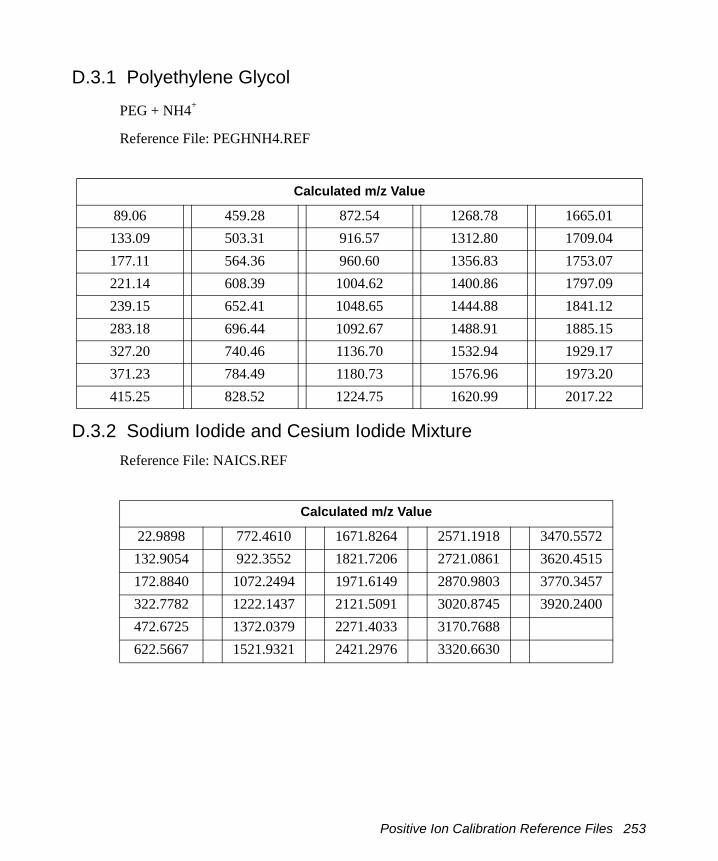
D.3.1 Polyethylene Glycol
PEG + NH4+
Reference File: PEGHNH4.REF
D.3.2 Sodium Iodide and Cesium Iodide MixtureReference File: NAICS.REF
Calculated m/z Value
89.06 459.28 872.54 1268.78 1665.01133.09 503.31 916.57 1312.80 1709.04177.11 564.36 960.60 1356.83 1753.07221.14 608.39 1004.62 1400.86 1797.09239.15 652.41 1048.65 1444.88 1841.12283.18 696.44 1092.67 1488.91 1885.15327.20 740.46 1136.70 1532.94 1929.17371.23 784.49 1180.73 1576.96 1973.20415.25 828.52 1224.75 1620.99 2017.22
Calculated m/z Value
22.9898 772.4610 1671.8264 2571.1918 3470.5572132.9054 922.3552 1821.7206 2721.0861 3620.4515172.8840 1072.2494 1971.6149 2870.9803 3770.3457322.7782 1222.1437 2121.5091 3020.8745 3920.2400472.6725 1372.0379 2271.4033 3170.7688622.5667 1521.9321 2421.2976 3320.6630
Positive Ion Calibration Reference Files 253

D.3.3 Sodium Iodide and Rubidium Iodide MixtureReference File: NAIRB.REF
D.4 Negative Ion Calibration Reference Files
Note: A positive ion calibration is sufficient for most applications. A specific negative ion calibration is not required when using the Quattro Premier XE.
You can use rubidium iodide to obtain a peak at m/z 85 (85Rb+) with an intensity of about 10% of the base peak at m/z 173. Rubidium iodide has the advantage that no rubidium clusters that can complicate the spectrum are formed. Note that rubidium has two isotopes (85Rb and 87Rb) in the ratio 2.59:1, giving peaks at m/z 85 and 87.
Use reference file NAIRB.REF.
Calculated m/z Value
22.9898 772.4610 1671.8264 2571.1918 3470.557284.9118 922.3552 1821.7206 2721.0861 3620.4515
172.8840 1072.2494 1971.6149 2870.9803 3770.3457322.7782 1222.1437 2121.5091 3020.8745 3920.2400472.6725 1372.0379 2271.4033 3170.7688622.5667 1521.9321 2421.2976 3320.6630
Ref. File Name
Chemical Name[Sigma Code #]
Molecular Mass m/z Uses
NAINEG Sodium iodide/cesium iodide (or rubidium iodide) mixture
200 to 3900 ES- calibration
SUGNEG Sugar mixture of maltose [M5885], raffinose [R0250], maltotetraose [M8253], and corn syrup [M3639]
100 to 1500 Low mass range
MYONEG Horse heart myoglobin [M1882]
16951.48 700 to 2400 General
254 Calibration Reference Information
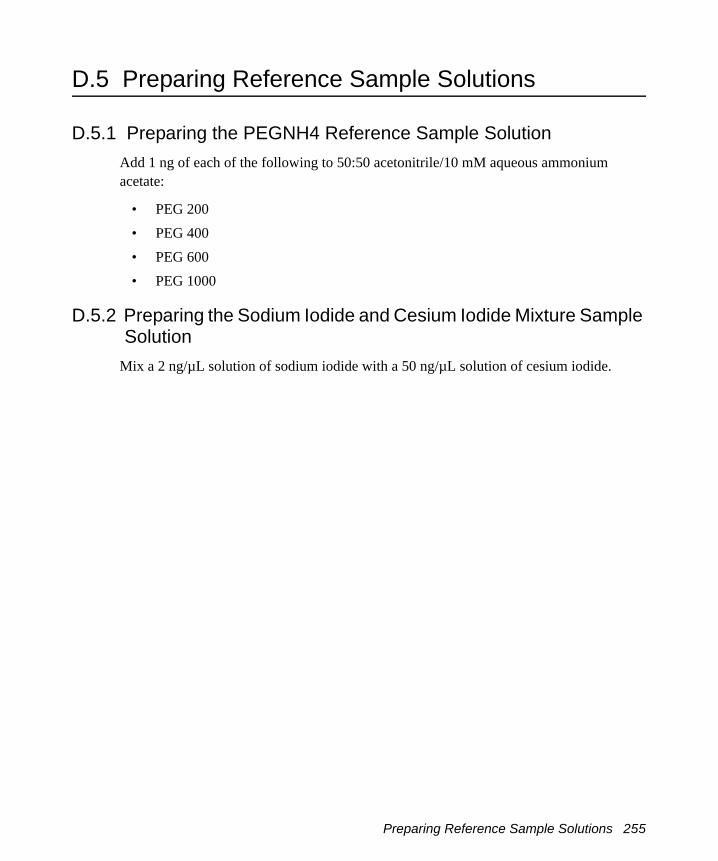
D.5 Preparing Reference Sample Solutions
D.5.1 Preparing the PEGNH4 Reference Sample SolutionAdd 1 ng of each of the following to 50:50 acetonitrile/10 mM aqueous ammonium acetate:
• PEG 200• PEG 400• PEG 600• PEG 1000
D.5.2 Preparing the Sodium Iodide and Cesium Iodide Mixture Sample Solution
Mix a 2 ng/µL solution of sodium iodide with a 50 ng/µL solution of cesium iodide.
Preparing Reference Sample Solutions 255

256 Calibration Reference Information

Appendix EPerformance Specifications
Note: For the purpose of the following specifications, signal-to-noise is calculated as the ratio of the chromatographic peak height to twice the standard deviation of the noise.
E.1 Electrospray Positive Ion
The measured signal-to-noise ratio obtained from the chromatogram monitoring the transition m/z 609 to m/z 195 on injection of 5 pg of reserpine is ≥500:1. This is based on a 5-µL injection of a 1 pg/µL reserpine solution in 70:30 acetonitrile/water (no additives) at a flow rate of 200 µL/min in MRM mode, 0.5 second dwell, span 0 Da.
The resolution of the precursor and product ions is <1 Da peak width at half-height.
E.2 Electrospray Negative Ion
The measured signal-to-noise ratio obtained from the chromatogram monitoring the transition m/z 503 to m/z 179 on injection of 25 pg of raffinose is ≥50:1. This is based on a 5-µL injection of a 5 pg/µL raffinose solution in 70:30 acetonitrile/water (no additives) at a flow rate of 200 µL/min in MRM mode, 0.5 second dwell, span 0 Da.
The resolution of the precursor and product ions is <1 Da peak width at half-height.
E.3 MS Resolution
The resolution is demonstrated using a 1 µg/µL solution of PPG 2000 in 50:50 acetonitrile/water containing 1-mM ammonium acetate. The peaks at m/z 2009.5 and 2010.5 should be resolved with a valley between them of no more than 15% of the height of the 2010.5 peak. It is recommended that fifteen 1-second scans are summed and the resulting spectrum smoothed (two passes, 0.5 Da SG).
Electrospray Positive Ion 257
E.4 Mass Measurement Accuracy
The mass measurement accuracy is measured from the mean of five repeat analyses of the [M+NH4]
+ peak at m/z 1004.622 from 1 µg/µL PEG 1000 in 50:50 acetonitrile/water containing 2 mM ammonium acetate. The mean measured mass will be 1004.622 +0.05 Da. The standard deviation of the mean will be <0.05 Da.
A mass calibration will be performed using the [M+H]+ peaks from a separate analysis over the mass range m/z 700 to 1300 and the resolution on the [M+H]+ peak at m/z 1031.62 must be between 0.3 and 0.4 Da wide at half height after smoothing.
E.5 APCI Positive Ion
Measured signal-to-noise ratio obtained from the chromatogram monitoring the transition m/z 331.2 to m/z 109.1 on injection of 50 pg of 17-α-hydroxyprogesterone will be ≥70:1, using a 5 µl injection of a 10 pg/µl 17-α-hydroxyprogesterone solution in 70:30 acetonitrile/water (no additives) at a flow rate of 1 mL/min in MRM mode, 0.2 second dwell, span 0 Da.
The resolution of the precursor and product ions will be <1 Da peak width at half height.
258 Performance Specifications

Appendix FTheory and Principles of Operation
F.1 Ionization Techniques
Two atmospheric pressure ionization techniques are available:
• Electrospray ionization (see Section F.1.1).• Atmospheric pressure chemical ionization (see Section F.1.2).
F.1.1 Electrospray Ionization (ESI)Electrospray ionization takes place as a result of imparting a strong electrical field to the eluent flow as it emerges from the nebulizer, producing an aerosol of charged droplets. These undergo a reduction in size by solvent evaporation until they have reached a charge density sufficient to allow sample ions to be ejected from the droplet’s surface (“ion evaporation”).
A characteristic of ESI spectra is that ions may be singly- or multiply-charged. Since the mass spectrometer filters ions according to their mass-to-charge ratio, compounds of high molecular weight can be determined if multiply-charged ions are formed.
Eluent flows up to 1 mL/min can be accommodated, although it is often preferable to split the flow such that 100 to 200 µL/min of eluent enters the mass spectrometer.
Ionization Techniques 259

F.1.2 Atmospheric Pressure Chemical Ionization (APCI)Atmospheric pressure chemical ionization generally produces protonated or deprotonated molecular ions from the sample via a proton transfer (positive ions) or proton abstraction (negative ions) mechanism. The sample is vaporized in a heated nebulizer before emerging into a cloud of solvent ions formed within the atmospheric source by a corona discharge. Proton transfer, or abstraction, then takes place between the solvent ions and the sample.
F.2 Ion Optics
Figure F-1 shows the Quattro Premier XE ion optics.
Figure F-1 Ion Optics
MS1Source Collision Cell MS2 Detector
260 Theory and Principles of Operation
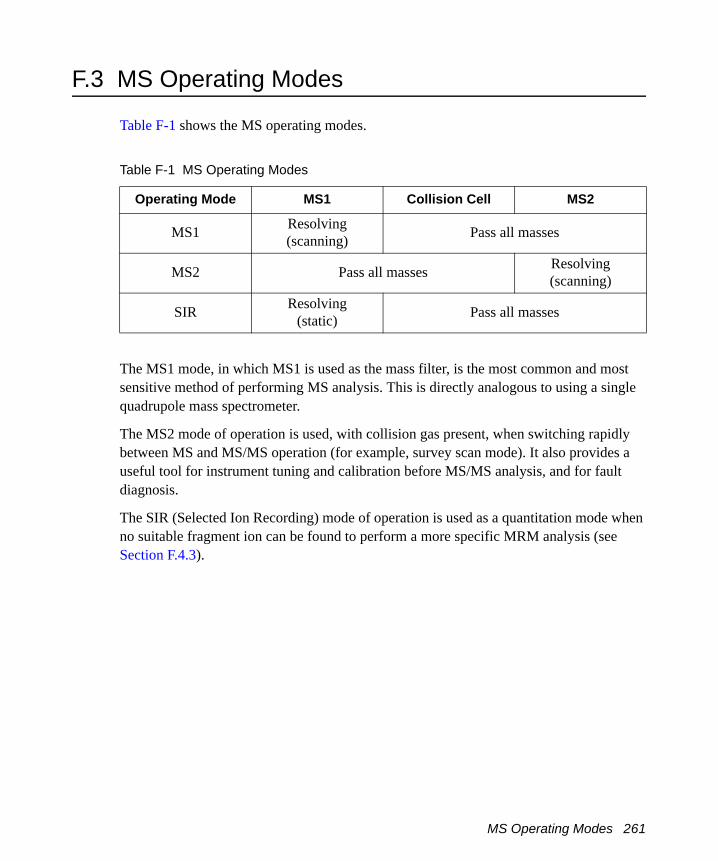
F.3 MS Operating Modes
Table F-1 shows the MS operating modes.
The MS1 mode, in which MS1 is used as the mass filter, is the most common and most sensitive method of performing MS analysis. This is directly analogous to using a single quadrupole mass spectrometer.
The MS2 mode of operation is used, with collision gas present, when switching rapidly between MS and MS/MS operation (for example, survey scan mode). It also provides a useful tool for instrument tuning and calibration before MS/MS analysis, and for fault diagnosis.
The SIR (Selected Ion Recording) mode of operation is used as a quantitation mode when no suitable fragment ion can be found to perform a more specific MRM analysis (see Section F.4.3).
Table F-1 MS Operating Modes
Operating Mode MS1 Collision Cell MS2
MS1 Resolving(scanning) Pass all masses
MS2 Pass all masses Resolving(scanning)
SIR Resolving(static) Pass all masses
MS Operating Modes 261

F.4 MS/MS Operating Modes
The four common MS/MS operating modes are summarized in Table F-2.
F.4.1 Daughter (Product) Ion ModeThe daughter (product) ion mode is shown in Figure F-2. It is the most commonly used MS/MS operating mode.
Figure F-2 Daughter (Product) Ion Mode
Typical Applications• Structural elucidation (for example, peptide sequencing)• Method development for MRM screening studies:
– Identification of daughter ions for use in MRM transitions.
Table F-2 MS/MS Operating Modes
Operating Mode MS1 Collision Cell MS2
Daughter (Product) Ion Spectrum
Static(at parent mass)
Pass all masses
Scanning
Parent (Precursor) Ion Spectrum Scanning Static
(at daughter mass)Multiple Reaction
Monitoring (MRM)Static
(at parent mass)Static
(at daughter mass)Constant Neutral Loss
SpectrumScanning
(synchronized with MS2)
Scanning(synchronized with
MS1)
MS1Static (at parent mass)
MS2Scanning
Collision CellPass all masses
262 Theory and Principles of Operation

– Optimization of CID tuning conditions to maximize the yield of a specific daughter ion to be used in MRM analysis.
Figure F-3 shows an example of daughters of the specific parent at m/z 609 from reserpine in Electrospray positive ion mode.
Figure F-3 Daughters of the Specific Parent at m/z 609 from Reserpine in Electrospray Positive Ion Mode
MS/MS Operating Modes 263

F.4.2 Parent (Precursor) Ion ModeThe parent (precursor) ion mode is shown in Figure F-4.
Figure F-4 Parent (Precursor) Ion Mode
A typical application is for structural elucidation, that is, complementary or confirmatory information (for daughter scan data).
Figure F-5 shows an example of parents of the specific daughter ion at m/z 195 from reserpine in electrospray positive ion mode.
Figure F-5 Parents of the Specific Daughter Ion at m/z 195 from Reserpine in Electrospray Positive Ion Mode
MS1Scanning
MS2Static (at daughter mass)
Collision CellPass all masses
264 Theory and Principles of Operation

F.4.3 Multiple Reaction Monitoring (MRM) ModeThe MRM mode (Figure F-6) is a highly selective MS/MS equivalent of SIR. As both MS1 and MS2 are static, greater dwell time on the ions of interest is allowed, and therefore better sensitivity compared to scanning MS/MS.
Figure F-6 MRM Mode
A typical application is for quantification of known analytes in complex samples:
• Drug metabolite and pharmacokinetic studies.• Environmental, for example, pesticide and herbicide analysis.• Forensic or toxicology, for example, screening for target drugs in sport.• MRM does not produce a spectrum as only one transition is monitored. As in SIR, a
chromatogram is produced.
MS1Static (at parent mass)
MS2Static (at daughter mass)
Collision CellPass all masses
MS/MS Operating Modes 265

F.4.4 Constant Neutral Loss ModeThe constant neutral loss mode is shown in Figure F-7. It detects the loss of a specific neutral fragment or functional group from an unspecified parent or parents.
Figure F-7 Constant Neutral Loss Mode
A typical application is for screening mixtures for a specific class of compound that is characterized by a common fragmentation pathway, indicating the presence of compounds containing a common functional group.
The scans of MS1 and MS2 are synchronized. When MS1 transmits a specific parent ion, MS2 “looks” to see if that parent loses a fragment of a certain mass. If it does, it registers at the detector.
The result is that the spectrum shows the masses of all parents that actually lost a fragment of a certain mass.
MS1Scanning
(Synchronized with MS2)
Collision CellPass all masses
MS2Scanning
(Synchronized with MS1)
266 Theory and Principles of Operation

F.4.5 Source and Collision Cell T-Wave DevicesThe T-Wave devices are stacked ring electrode ion guides with opposite phases of radio frequency voltage applied to adjacent plates to confine ions radially (Figure F-8).
Figure F-8 T-Wave Schematic Diagram
The presence of gas in these devices causes an axial slowing of ions, which can have adverse effects for fast acquisitions such as reduced sensitivity resolution and increased cross-talk. To reduce the residence time of ions in these optics, a travelling voltage wave (T-Wave) moves along the device by application of a transient d.c. voltage to successive ring electrodes. Through appropriate choice of wave amplitude and velocity, ions “surf” on the front of this wave, reducing their transit time (Figure F-9).
Ion Entry
Ion Exit
Ring Electrode
MS/MS Operating Modes 267
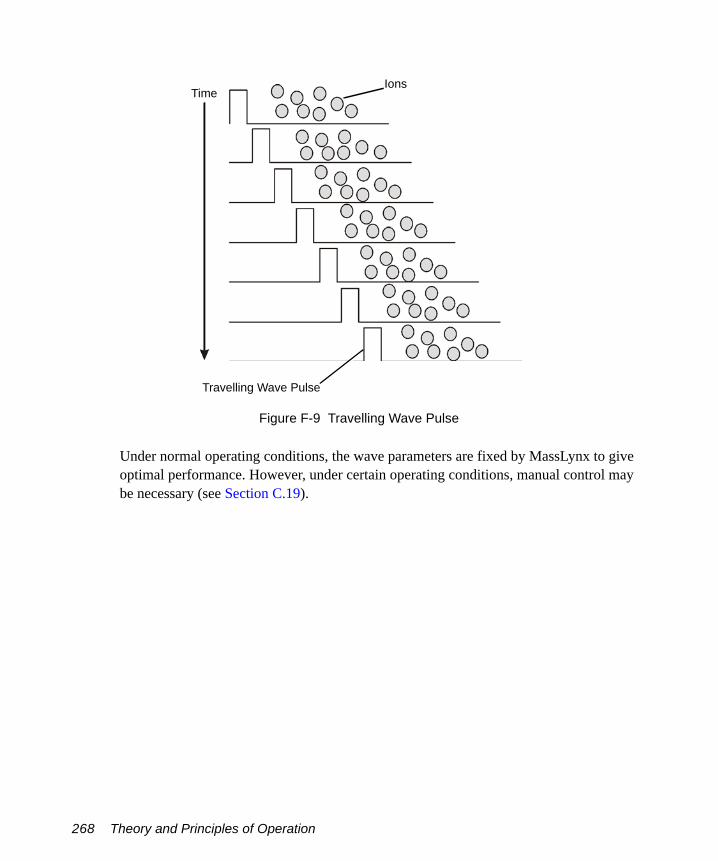
Figure F-9 Travelling Wave Pulse
Under normal operating conditions, the wave parameters are fixed by MassLynx to give optimal performance. However, under certain operating conditions, manual control may be necessary (see Section C.19).
Travelling Wave Pulse
TimeIons
268 Theory and Principles of Operation
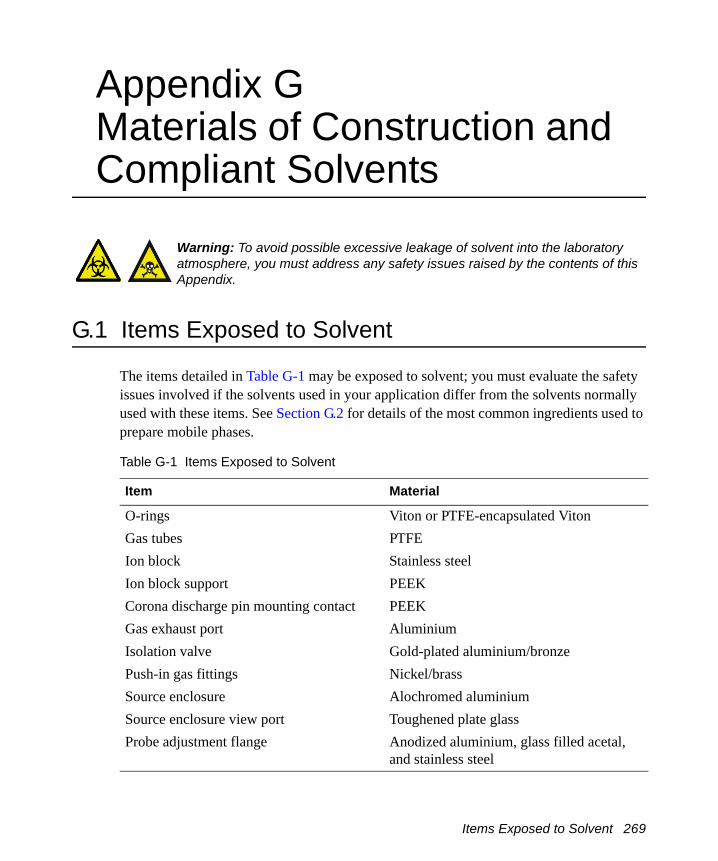
Appendix GMaterials of Construction and Compliant Solvents
G.1 Items Exposed to Solvent
The items detailed in Table G-1 may be exposed to solvent; you must evaluate the safety issues involved if the solvents used in your application differ from the solvents normally used with these items. See Section G.2 for details of the most common ingredients used to prepare mobile phases.
Warning: To avoid possible excessive leakage of solvent into the laboratory atmosphere, you must address any safety issues raised by the contents of this Appendix.
Table G-1 Items Exposed to Solvent
Item Material
O-rings Viton or PTFE-encapsulated VitonGas tubes PTFEIon block Stainless steelIon block support PEEKCorona discharge pin mounting contact PEEKGas exhaust port AluminiumIsolation valve Gold-plated aluminium/bronzePush-in gas fittings Nickel/brassSource enclosure Alochromed aluminiumSource enclosure view port Toughened plate glassProbe adjustment flange Anodized aluminium, glass filled acetal,
and stainless steel
Items Exposed to Solvent 269
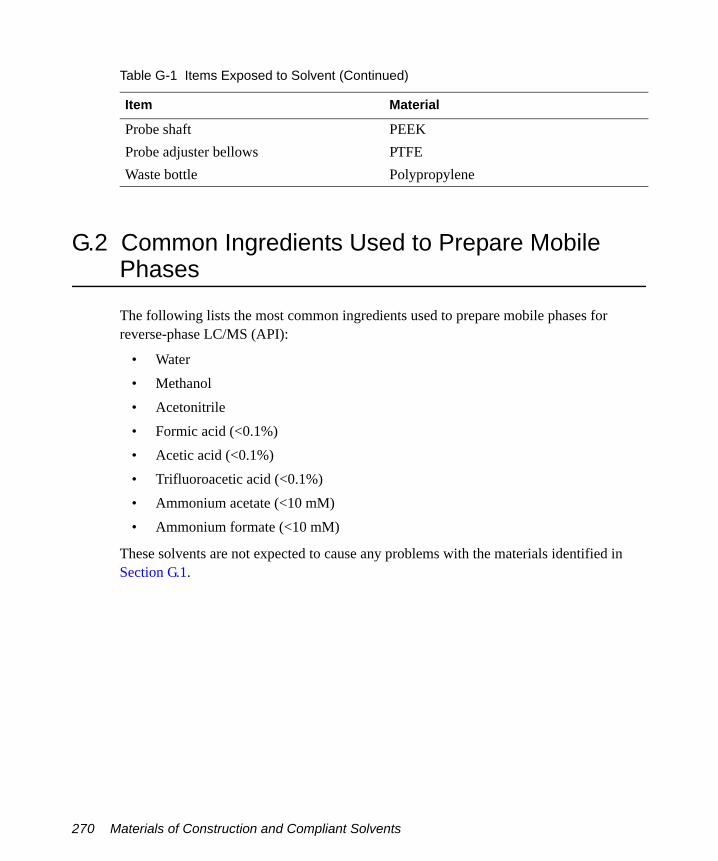
G.2 Common Ingredients Used to Prepare Mobile Phases
The following lists the most common ingredients used to prepare mobile phases for reverse-phase LC/MS (API):
• Water• Methanol• Acetonitrile• Formic acid (<0.1%)• Acetic acid (<0.1%)• Trifluoroacetic acid (<0.1%)• Ammonium acetate (<10 mM)• Ammonium formate (<10 mM)
These solvents are not expected to cause any problems with the materials identified in Section G.1.
Probe shaft PEEKProbe adjuster bellows PTFEWaste bottle Polypropylene
Table G-1 Items Exposed to Solvent (Continued)
Item Material
270 Materials of Construction and Compliant Solvents
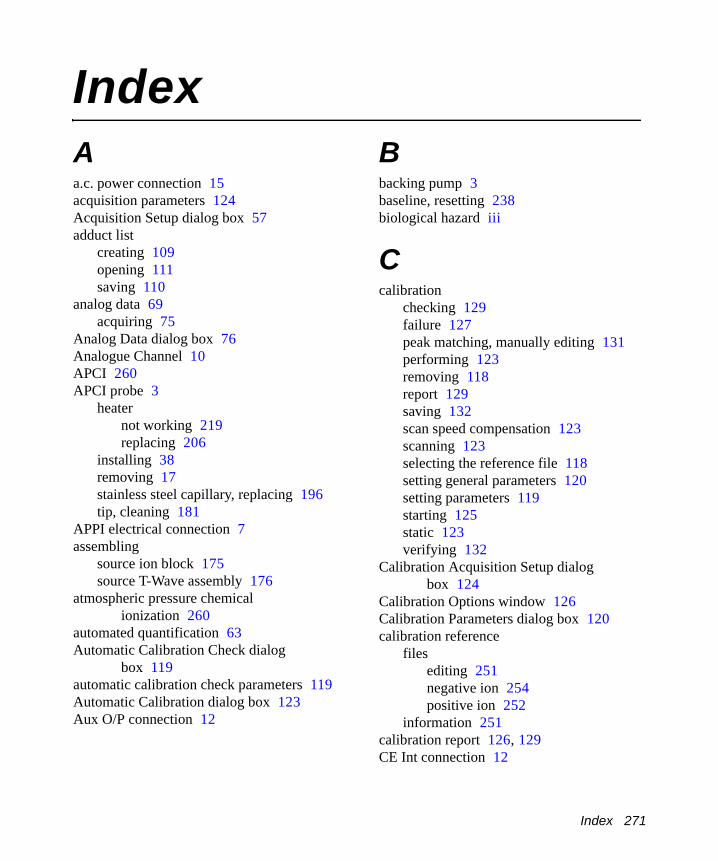
Index
Aa.c. power connection 15acquisition parameters 124Acquisition Setup dialog box 57adduct listcreating 109opening 111saving 110
analog data 69acquiring 75
Analog Data dialog box 76Analogue Channel 10APCI 260APCI probe 3
heaternot working 219replacing 206
installing 38removing 17stainless steel capillary, replacing 196tip, cleaning 181
APPI electrical connection 7assembling
source ion block 175source T-Wave assembly 176
atmospheric pressure chemical ionization 260
automated quantification 63Automatic Calibration Check dialog
box 119automatic calibration check parameters 119Automatic Calibration dialog box 123Aux O/P connection 12
Bbacking pump 3baseline, resetting 238biological hazard iii
Ccalibration
checking 129failure 127peak matching, manually editing 131performing 123removing 118report 129saving 132scan speed compensation 123scanning 123selecting the reference file 118setting general parameters 120setting parameters 119starting 125static 123verifying 132
Calibration Acquisition Setup dialog box 124
Calibration Options window 126Calibration Parameters dialog box 120calibration reference
filesediting 251negative ion 254positive ion 252
information 251calibration report 126, 129CE Int connection 12
Index 271
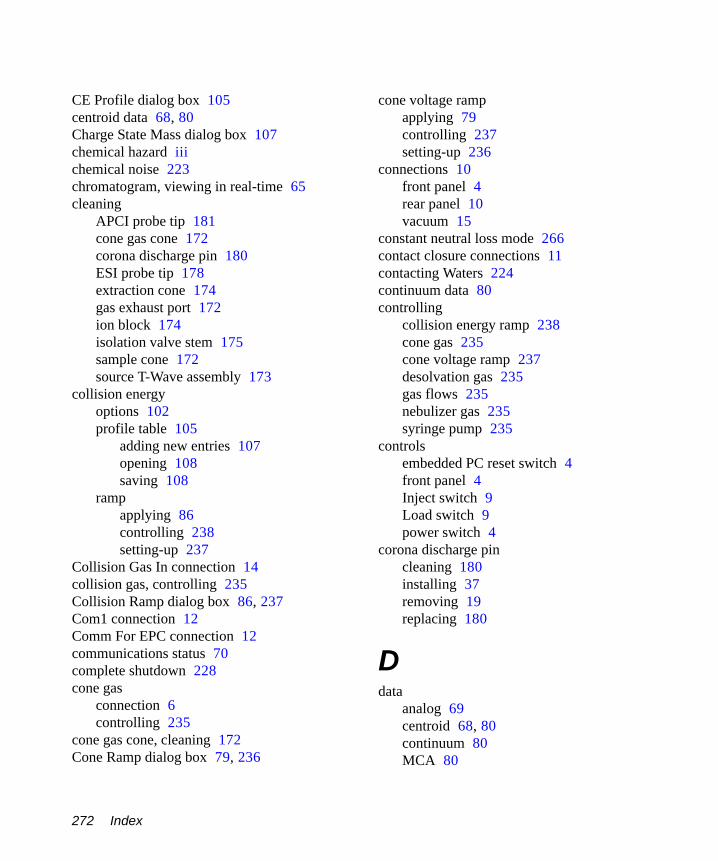
CE Profile dialog box 105centroid data 68, 80Charge State Mass dialog box 107chemical hazard iiichemical noise 223chromatogram, viewing in real-time 65cleaning
APCI probe tip 181cone gas cone 172corona discharge pin 180ESI probe tip 178extraction cone 174gas exhaust port 172ion block 174isolation valve stem 175sample cone 172source T-Wave assembly 173
collision energyoptions 102profile table 105
adding new entries 107opening 108saving 108
rampapplying 86controlling 238setting-up 237
Collision Gas In connection 14collision gas, controlling 235Collision Ramp dialog box 86, 237Com1 connection 12Comm For EPC connection 12communications status 70complete shutdown 228cone gas
connection 6controlling 235
cone gas cone, cleaning 172Cone Ramp dialog box 79, 236
cone voltage rampapplying 79controlling 237setting-up 236
connections 10front panel 4rear panel 10vacuum 15
constant neutral loss mode 266contact closure connections 11contacting Waters 224continuum data 80controlling
collision energy ramp 238cone gas 235cone voltage ramp 237desolvation gas 235gas flows 235nebulizer gas 235syringe pump 235
controlsembedded PC reset switch 4front panel 4Inject switch 9Load switch 9power switch 4
corona discharge pincleaning 180installing 37removing 19replacing 180
Ddata
analog 69centroid 68, 80continuum 80MCA 80
272 Index

profile 67SIR 68
data acquisitionmonitoring 65pausing 70starting 57stopping 70
daughter (product) ion mode 262Daughter Scan Function Editor 85desolvation gas
connection 6controlling 235
desolvation heater not working 219dialog boxes
Acquisition Setup 57Analog Data 76Automatic Calibration 123Automatic Calibration Check 119Calibration Acquisition Setup 124Calibration Parameters 120CE Profile 105Charge State Mass 107Collision Ramp 86, 237Cone Ramp 79, 236Display Calibration Graphs 129Exclude Mass 101Include Masses 97Instrument Threshold Settings 66Mass Measure Parameters 121Modify Charge State 106Quantify Samples 63Readbacks 238Scope Setup 236Solvent Delay 74Spectrum Real-Time Update 65Start Sample List Run 60Syringe Selection 235
disassemblingsource ion block 164
I
source T-Wave assembly 162Display Calibration Graphs dialog box 129divert/injection valve 8
Eelectrical connections
a.c. power 15Analogue Channel 10APPI 7Aux O/P 12CE Int 12Com1 12Comm For EPC 12contact closure 11Events I/P 11Events O/P 11Gas Fail 11HV 7mains power 15MUX 7Probe 7Pump Relay 12
electronic noise 223electrospray ionization 259embedded PC reset switch 4emergency shutdown 228ESCi multi-mode operation 3, 53
data acquisition 55option key disk 53preparing the instrument 53tuning the instrument 54
ESI 259ESI probe 3
installing 20removing 35stainless steel capillary, replacing 187tip
cleaning 178
Index 273

replacing 178Events I/P connections 11Events O/P connections 11Exclude List 99
editing 101Exclude Mass dialog box 101Exhaust connection 14extraction cone, cleaning 174
Ffilter elements
changing 145fitting
gas exhaust port 178ion block 177ion source enclosure 177source T-Wave assembly 176
flammable solvents operation hazard ivfront panel
connections 4controls 4
Function EditorsDaughter Scan 85Full Scan 77MRM 88Parent Scan 87SIR 81Survey Scan 88
function listadding a new function 73changing the order of functions in 74copying an existing function 74modifying an existing function 73opening a saved list 77removing a function 74saving 76setting a solvent delay 74setting the maximum retention time 74
setting-up 71functions
MRM 88SIR 81survey 88
fusesmain system printed circuit board 219mains power 15
Ggas connections
Collision Gas In 14cone gas 6desolvation gas 6Exhaust 14Gas In 13nebulizer gas 6
gas exhaust portcleaning 172fitting 178removing 156
Gas Fail connection 11gas flow rates 16gas flows, controlling 235Gas In connection 13gas-ballasting, rotary pump 141
Hhazards
biological iiichemical iiiflammable solvents operation ivhigh temperature vhigh voltage ivsolvent leakage iv
high LC backpressure 216high noise levels 222
274 Index

high temperature hazard vhigh voltage hazard ivHV electrical connection 7
IIEEE communication errors 222Include List 95
editing 97Include Masses dialog box 97Inject switch 9Inlet Configuration Wizard 33installing
APCI probe 38corona discharge pin 37ESI probe 20
instrument data thresholds 66instrument name, selecting 247instrument parameter files 239
creating new 240opening 240
Instrument Threshold Settings dialog box 66insufficient vacuum 217intended use xivinter scan delay, selecting 236ion block
cartridge heater, replacing 182cleaning 174fitting 177removing 157
ion counting threshold 68Ion Mode menu 233ion modes
daughter 262parent 264precursor 264product 262
ion optics 260ion source enclosure
I
fitting 177removing 157
ion source heater, not working 219ionization mode, selecting 233isolation valve 3, 23, 41, 152
stem, cleaning 175items exposed to solvent 269
Kkey disk, ESCi option 53
LLEDs
Operate 7Vacuum 7
Load switch 9loss of communication with instrument 221low intensity peaks 215low LC backpressure 217
Mmains power
connection 15fuses 15
maintenanceprocedures 133safety 134schedule 133
mass calibration 113for electrospray 114scan speed 113scanning 113static 113
mass flow controllers 16mass measure parameters 121Mass Measure Parameters dialog box 121
Index 275

MassLynxESCi option key disk 53software 4Tune window, opening 233
MassLynx control system 3materials of construction 269maximum retention time 74MCA data 80mobile phases, common ingredients 270Modify Charge State dialog box 106monitoring acquisitions 111MRM function 88MRM Function Editor 88MS Method Editor 71
toolbar 72MS operating modes 261MS to MS/MS switching 90MS/MS operating modes 262MS/MS scanning functions 84MS/MS to MS switching 93MS2 scan 87Multi Channel Analysis data 80multiple reaction monitoring mode 265multiple-sample acquisition 60MUX electrical connection 7
Nnebulizer gas
connection 6controlling 235
neutral gain scan 87neutral loss scan 87no ion beam 213no peaks in the Tune window 213noise
chemical 222electronic 222
Oodor filter element, changing 145oil mist filter element, changing 145Operate LED 7operating modes
MS 261MS/MS 262
overnight shutdown 228
Pparameters
acquisition 124mass measure 121setting calibration 119setting general calibration 120
parameters automatic calibration check 119parent (precursor) ion mode 264Parent Scan Function Editor 87Peak Display menu 244peak display, customizing
colors 245display grid 246intensity display 246numbers 245trace line appearance 246
peakschanging gain 244low intensity 215selecting
for tuning 241operating mode 242span 243tune mass 242
unsteady 215performance specifications 257Pirani gauge 3power switch 4
276 Index
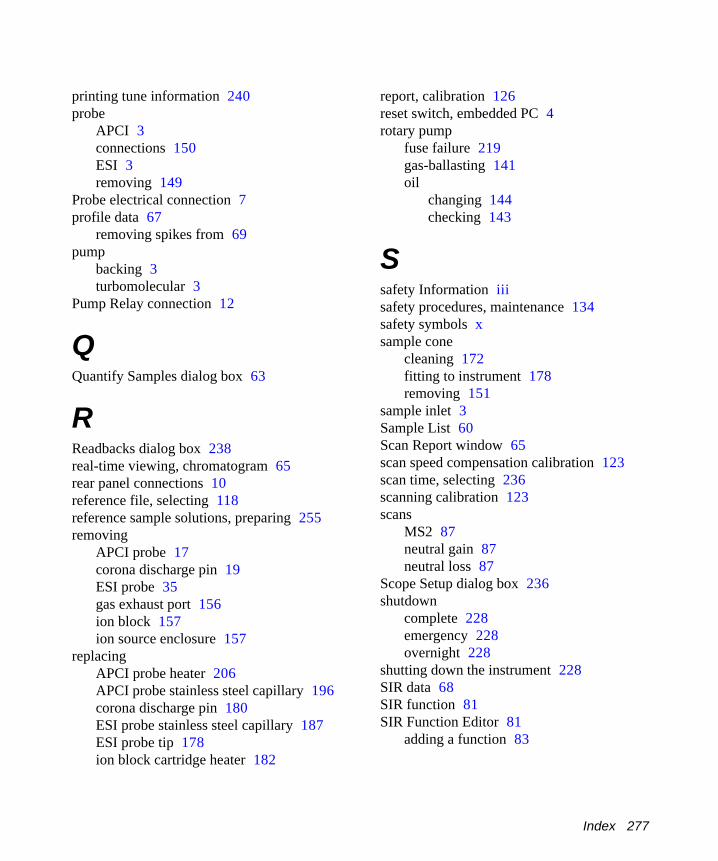
printing tune information 240probe
APCI 3connections 150ESI 3removing 149
Probe electrical connection 7profile data 67
removing spikes from 69pump
backing 3turbomolecular 3
Pump Relay connection 12
QQuantify Samples dialog box 63
RReadbacks dialog box 238real-time viewing, chromatogram 65rear panel connections 10reference file, selecting 118reference sample solutions, preparing 255removing
APCI probe 17corona discharge pin 19ESI probe 35gas exhaust port 156ion block 157ion source enclosure 157
replacingAPCI probe heater 206APCI probe stainless steel capillary 196corona discharge pin 180ESI probe stainless steel capillary 187ESI probe tip 178ion block cartridge heater 182
I
report, calibration 126reset switch, embedded PC 4rotary pump
fuse failure 219gas-ballasting 141oil
changing 144checking 143
Ssafety Information iiisafety procedures, maintenance 134safety symbols xsample cone
cleaning 172fitting to instrument 178removing 151
sample inlet 3Sample List 60Scan Report window 65scan speed compensation calibration 123scan time, selecting 236scanning calibration 123scans
MS2 87neutral gain 87neutral loss 87
Scope Setup dialog box 236shutdown
complete 228emergency 228overnight 228
shutting down the instrument 228SIR data 68SIR function 81SIR Function Editor 81
adding a function 83
Index 277

solventflammable hazard ivitems exposed to 269leakage hazard iv
Solvent Delay dialog box 74source ion block
assembling 175disassembling 164
source T-Wave assemblyassembling 176cleaning 173disassembling 162fitting 176removing 160
source, cleaning 148Spectrum Real-Time Update dialog box 65spectrum, viewing in real-time 65Start Sample List Run dialog box 60starting up the instrument 225static calibration 123status display LEDs 7survey function 88Survey Scan Function Editor 88
Adduct page 109Collision Energy page 102Exclude page 99Include page 95MS to MSMS page 90MSMS Template page 89Survey page 89
switchesInject 9Load 9
switchingMS to MS/MS 90MS/MS to MS 93
syringe pumpcontrolling 235setting-up 231
Syringe Selection dialog box 235syringe type, selecting 235System Manager window 70
Tthresholds
instrument data 66ion counting 68
troubleshooting 211APCI probe heater not working 219chemical noise 223desolvation heater not working 219electronic noise 223failure to recognize a probe 220hardware 213high LC backpressure 216high noise levels 222IEEE communication errors 222instrument will not turn on 213insufficient vacuum 217ion mode fault 220ion source heater not working 219isolation valve 214leaking nitrogen 218loss of communication with
instrument 221low LC backpressure 217no ion beam 213no peaks in the Tune window 213ripple 221rotary pump fuse failure 219rotary pump oil in exhaust tubing 218safety 211system 211unsteady or low intensity peaks 215
tune information, printing 240tune parameters
changing 239
278 Index

saving 239Tune window
Diagnostics page 247EasyTune Source page 241ESCi source page 54T-WAVE page 248
turbomolecular pump 3T-Wave
optics, manually controlling 247theory 267
Uunsteady peaks 215
Vvacuum
connections 15system 3
Vacuum LED 7
WWaste connection 15Waters, contacting 224
Zzero level, resetting 238ZSpray ionization source 3
I
Index 279

280 Index