Embed Size (px)
Citation preview
Queensland air monitoring 2016 National Environment Protection (Ambient Air Quality) Measure
Department of Science, Information Technology and Innovation
Prepared by
Rhiannon Tooker, Don Neale Air Quality Monitoring Science Delivery Division Department of Science, Information Technology and Innovation PO Box 5078 Brisbane QLD 4001
© The State of Queensland (Department of Science, Information Technology and Innovation) 2017
The Queensland Government supports and encourages the dissemination and exchange of its information. The copyright in this publication is licensed under a Creative Commons Attribution 3.0 Australia (CC BY) licence
Under this licence you are free, without having to seek permission from DSITI, to use this publication in accordance with the licence terms. You must keep intact the copyright notice and attribute the State of Queensland, Department of Science, Information Technology and Innovation as the source of the publication.
For more information on this licence visit http://creativecommons.org/licenses/by/3.0/au/deed.en
Disclaimer
This document has been prepared with all due diligence and care, based on the best available information at the time of publication. The department holds no responsibility for any errors or omissions within this document. Any decisions made by other parties based on this document are solely the responsibility of those parties. Information contained in this document is from a number of sources and, as such, does not necessarily represent government or departmental policy.
If you need to access this document in a language other than English, please call the Translating and Interpreting Service (TIS National) on 131 450 and ask them to telephone Library Services on +61 7 3170 5725
May 2017
Queensland air monitoring 2016 – National Environment Protection (Ambient Air Quality) Measure
i
Summary
This document fulfils annual reporting requirements for Queensland under clause 18 of the National Environment Protection (Ambient Air Quality) Measure (AAQ NEPM).
Ambient air quality monitoring at AAQ NEPM sites in Queensland from January to December 2016 showed no exceedances of the AAQ NEPM standards for carbon monoxide, nitrogen dioxide, ozone, PM2.5 (particles less than 2.5 micrometres in diameter) and lead at any Queensland monitoring station. Exceedances of the AAQ NEPM standards occurred for:
one-hour average sulfur dioxide concentrations at the Menzies and The Gap monitoring sites in Mount Isa due to industrial emissions;
24-hour average sulfur dioxide concentrations at the Menzies monitoring site in Mount Isa due to industrial emissions; and
24-hour average PM10 (particles less than 10 micrometres in diameter) concentrations at The Gap monitoring site in Mount Isa due to a dust storm.
AAQ NEPM goals were met in all regions except:
one-hour average sulfur dioxide concentrations at the Menzies and The Gap monitoring sites in Mount Isa due to industrial emissions.
The Woolloongabba monitoring site in South East Queensland was temporarily closed on 17 June 2016 due to construction works at the monitoring site location. The Pimlico monitoring site in Townsville was decommissioned on 29 February 2016 at the request of the property owners due to planned redevelopment of the site. As a result, compliance with AAQ NEPM standards and goals was not demonstrated for carbon monoxide at Woolloongabba, and nitrogen dioxide, ozone, sulfur dioxide and PM10 at Pimlico because data availability was below the level required to make a valid assessment.
Low data availability in Quarter 4 as a result of equipment failure meant that a valid assessment of compliance with the AAQ NEPM annual standard for lead at The Gap monitoring site in Mount Isa could not be made, however it is considered highly probably that compliance with the annual standard would have been achieved.
Department of Science, Information Technology and Innovation
ii
Contents
Summary ............................................................................................................................................ i
Introduction ...................................................................................................................................... 1
Section A – Monitoring summary ................................................................................................... 2
Current AAQ NEPM monitoring stations 2
Variations to the approved monitoring plan for Queensland 7
Section B – Assessment of compliance with standards and goals ............................................ 8
Carbon monoxide 8
Nitrogen dioxide 9
Ozone 11
Sulfur dioxide 12
PM10 14
PM2.5 15
Lead 16
Section C – Analysis of monitoring data against standards ..................................................... 17
Exceedance summary 17
Summaries of maximum and second-highest pollutant concentrations 20
Section D – Pollutant distribution and trends ............................................................................. 24
Carbon monoxide 24
Nitrogen dioxide 26
Ozone 33
Sulfur dioxide 44
PM10 54
PM2.5 62
Lead 66
Queensland air monitoring 2016 – National Environment Protection (Ambient Air Quality) Measure
iii
List of tables
Table 1. Summary information for 2016 Queensland AAQ NEPM monitoring sites .......................... 3
Table 2. Regions that satisfy screening procedures and do not require campaign monitoring.......... 7
Table 3. 2016 CO compliance summary ............................................................................................ 8
Table 4. 2016 NO2 compliance summary .......................................................................................... 9
Table 5. 2016 O3 compliance summary ........................................................................................... 11
Table 6. 2016 SO2 compliance summary ......................................................................................... 12
Table 7. 2016 PM10 compliance summary ....................................................................................... 14
Table 8. 2016 PM2.5 compliance summary ...................................................................................... 15
Table 9. 2016 lead compliance summary ........................................................................................ 16
Table 10. 2016 SO2 exceedances ................................................................................................... 18
Table 11. 2016 PM10 exceedances .................................................................................................. 19
Table 12. 2016 summary statistics for daily peak 8-hour average CO concentrations .................... 20
Table 13. 2016 summary statistics for daily peak 1-hour average NO2 concentrations ................... 20
Table 14. 2016 summary statistics for daily peak 1-hour average O3 concentrations ..................... 20
Table 15. 2016 summary statistics for daily peak 4-hour average O3 concentrations ..................... 21
Table 16. 2016 summary statistics for daily peak 1-hour average SO2 concentrations ................... 21
Table 17. 2016 summary statistics for daily 24-hour average SO2 concentrations .......................... 22
Table 18. 2016 summary statistics for daily 24-hour average PM10 concentrations ........................ 23
Table 19. 2016 summary statistics for daily 24-hour average PM2.5 concentrations ........................ 23
Table 20. 2016 percentiles of daily peak 8-hour average CO concentrations ................................. 24
Table 21. Percentiles of daily peak 8-hour average CO concentrations at Woolloongabba (1998–2016) ................................................................................................................................................ 25
Table 22. Percentiles of daily peak 8-hour average CO concentrations at North Toowoomba (2003–2010) ..................................................................................................................................... 26
Table 23. 2016 percentiles of daily peak 1-hour average NO2 concentrations ................................ 26
Table 24. Percentiles of daily peak 1-hour average NO2 concentrations at Mountain Creek (2002–2016) ................................................................................................................................................ 27
Table 25. Percentiles of daily peak 1-hour average NO2 concentrations at Deception Bay (1995–2016) ................................................................................................................................................ 28
Table 26. Percentiles of daily peak 1-hour average NO2 concentrations at Rocklea (1982–2016) . 29
Table 27. Percentiles of daily peak 1-hour average NO2 concentrations at Flinders View (1995–2016) ................................................................................................................................................ 30
Department of Science, Information Technology and Innovation
iv
Table 28. Percentiles of daily peak 1-hour average NO2 concentrations at North Toowoomba (2003–2010) ..................................................................................................................................... 31
Table 29. Percentiles of daily peak 1-hour average NO2 concentrations at South Gladstone (1994–2016) ................................................................................................................................................ 32
Table 30. Percentiles of daily peak 1-hour average NO2 concentrations at Pimlico (2004–2016) ... 33
Table 31. 2016 percentiles of daily peak 1-hour average O3 concentrations ................................... 33
Table 32. 2016 percentiles of daily peak 4-hour average O3 concentrations ................................... 34
Table 33. Percentiles of daily peak 1-hour average O3 concentrations at Mountain Creek (2002–2016) ................................................................................................................................................ 34
Table 34. Percentiles of daily peak 1-hour average O3 concentrations at Deception Bay (1995–2016) ................................................................................................................................................ 35
Table 35. Percentiles of daily peak 1-hour average O3 concentrations at Rocklea (1982–2016) .... 36
Table 36. Percentiles of daily peak 1-hour average O3 concentrations at Flinders View (1994–2016) ................................................................................................................................................ 37
Table 37. Percentiles of daily peak 1-hour average O3 concentrations at North Toowoomba (2003–2010) ................................................................................................................................................ 38
Table 38. Percentiles of daily peak 1-hour average O3 concentrations at Targinie (2001–2006) .... 38
Table 39. Percentiles of daily peak 1-hour average O3 concentrations at Pimlico (2004–2016) ..... 39
Table 40. Percentiles of daily peak 4-hour average O3 concentrations at Mountain Creek (2002–2016) ................................................................................................................................................ 39
Table 41. Percentiles of daily peak 4-hour average O3 concentrations at Deception Bay (1995–2016) ................................................................................................................................................ 40
Table 42. Percentiles of daily peak 4-hour average O3 concentrations at Rocklea (1982–2016) .... 41
Table 43. Percentiles of daily peak 4-hour average O3 concentrations at Flinders View (1994–2016) ................................................................................................................................................ 42
Table 44. Percentiles of daily peak 4-hour average O3 concentrations at North Toowoomba (2003–2010) ................................................................................................................................................ 43
Table 45. Percentiles of daily peak 4-hour average O3 concentrations at Targinie (2001–2006) .... 43
Table 46. Percentiles of daily peak 4-hour average O3 concentrations at Pimlico (2004–2016) ..... 44
Table 47. 2016 percentiles of daily peak 1-hour average SO2 concentrations ................................ 44
Table 48. 2016 percentiles of daily 24-hour average SO2 concentrations ....................................... 45
Table 49. Percentiles of daily peak 1-hour average SO2 concentrations at Flinders View (1993–2016) ................................................................................................................................................ 46
Table 50. Percentiles of daily peak 1-hour average SO2 concentrations at South Gladstone (1991–2016) ................................................................................................................................................ 47
Table 51. Percentiles of daily peak 1-hour average SO2 concentrations at Pimlico (2005–2016) ... 48
Table 52. Percentiles of daily peak 1-hour average SO2 concentrations at Menzies (1983–2016) . 49
Queensland air monitoring 2016 – National Environment Protection (Ambient Air Quality) Measure
v
Table 53. Percentiles of daily 24-hour average SO2 concentrations at Flinders View (1993– 2016) ................................................................................................................................................ 50
Table 54. Percentiles of daily 24-hour average SO2 concentrations at South Gladstone (1991–2016) ................................................................................................................................................ 51
Table 55. Percentiles of daily 24-hour average SO2 concentrations at Pimlico (2005–2016) .......... 52
Table 56. Percentiles of daily 24-hour average SO2 concentrations at Menzies (1984–2016) ........ 53
Table 57. 2016 percentiles of daily 24-hour average PM10 concentrations ...................................... 54
Table 58. Percentiles of daily 24-hour average PM10 concentrations at Mountain Creek (2001–2016) ................................................................................................................................................ 55
Table 59. Percentiles of daily 24-hour average PM10 concentrations at Rocklea (1996–2016) ....... 56
Table 60. Percentiles of daily 24-hour average PM10 concentrations at Flinders View (1998– 2016) ................................................................................................................................................ 57
Table 61. Percentiles of daily 24-hour average PM10 concentrations at North Toowoomba (2003–2010) ................................................................................................................................................ 58
Table 62. Percentiles of daily 24-hour average PM10 concentrations at South Gladstone (2000–2016) ................................................................................................................................................ 59
Table 63. Percentiles of daily 24-hour average PM10 concentrations at West Mackay (1998– 2016) ................................................................................................................................................ 60
Table 64. Percentiles of daily 24-hour average PM10 concentrations at Pimlico (2004–2016) ........ 61
Table 65. Percentiles of daily 24-hour average PM10 concentrations at The Gap (2009–2016) ...... 61
Table 66. 2016 percentiles of daily 24-hour average PM2.5 concentrations ..................................... 62
Table 67. Percentiles of daily 24-hour average PM2.5 concentrations at Rocklea (1998–2016) ...... 63
Table 68. Percentiles of daily 24-hour average PM2.5 concentrations at Springwood (1999–2016) 64
Table 69. Percentiles of daily 24-hour average PM2.5 concentrations at North Toowoomba (2003–2007) ................................................................................................................................................ 65
Table 70. Percentiles of daily 24-hour average PM2.5 concentrations at South Gladstone (2008–2016) ................................................................................................................................................ 65
Table 71. Annual average lead concentrations at Woolloongabba (1980–2002) ............................ 66
Table 72. Annual average lead concentrations at Townsville Coast Guard (2011–2016) ............... 67
Table 73. Annual average lead concentrations at The Gap (2009–2016) ....................................... 67
List of figures
Figure 1. 2016 AAQ NEPM monitoring site locations ........................................................................ 6

Department of Science, Information Technology and Innovation
vi
Queensland air monitoring 2016 – National Environment Protection (Ambient Air Quality) Measure
1
Introduction
Clause 18 of the National Environment Protection (Ambient Air Quality) Measure (AAQ NEPM) 1 requires all jurisdictions to submit an annual report on their compliance with the Measure. The required content of these reports are specified in the National Environment Protection (Ambient Air Quality) Measure Technical Paper No. 8, Annual Reports2 (AAQ NEPM Technical Paper No. 8).
The Department of Science, Information Technology and Innovation (DSITI) operates the Queensland ambient air quality monitoring network. This network includes air monitoring to assess compliance with the standards and goals of the AAQ NEPM, as detailed in the Ambient air quality monitoring plan for Queensland3, together with additional ambient and investigative air monitoring for other purposes.
This report documents Queensland’s compliance with the standards and goals of the AAQ NEPM in accordance with the AAQ NEPM Technical Paper No. 8.
1 available from www.legislation.gov.au/Details/F2016C00215 2 available from www.nepc.gov.au/resource/ephc-archive-ambient-air-quality-nepm 3 available from www.qld.gov.au/environment/pollution/monitoring/air-reports/
Department of Science, Information Technology and Innovation
2
Section A – Monitoring summary
Current AAQ NEPM monitoring stations
DSITI monitored air quality in 2016 in five of the ten regions identified in the Queensland monitoring plan:
South East Queensland (made up of three sub-regions: North Coast, Brisbane and Ipswich)
Gladstone
Mackay
Townsville
Mount Isa.
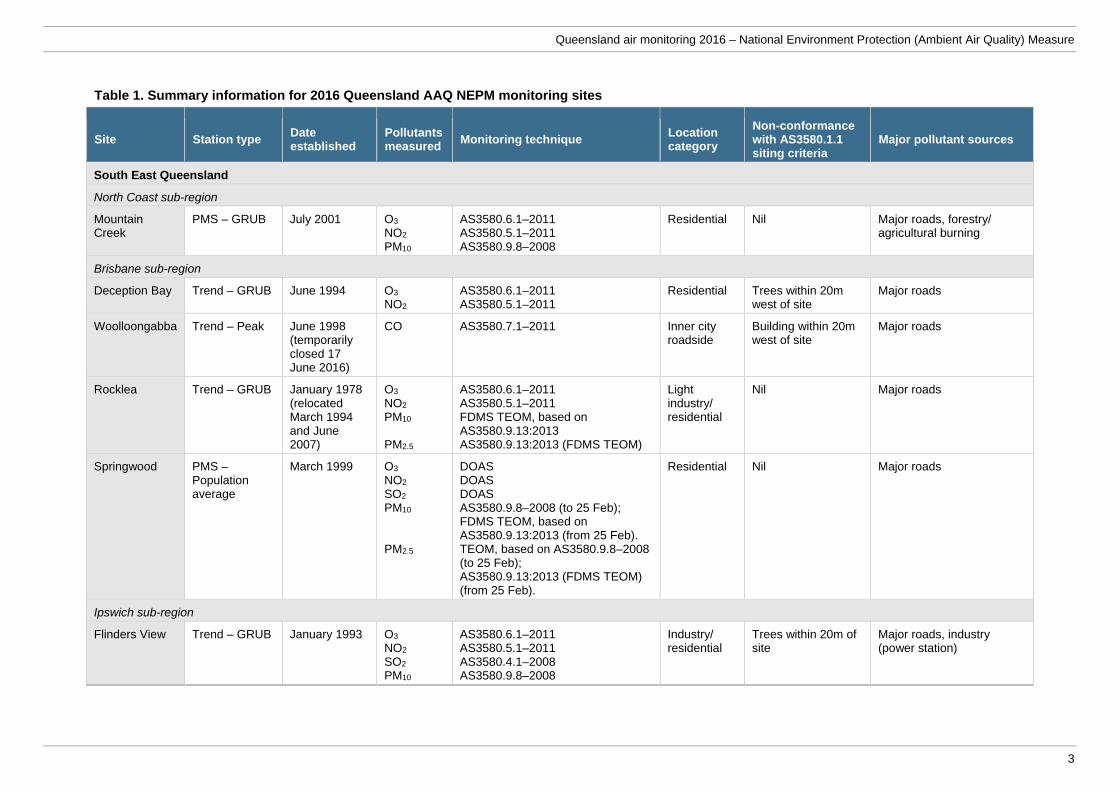
Table 1 presents summary information for all AAQ NEPM compliance monitoring stations in Queensland in 2016. Each monitoring station is categorised as one of the following:
performance monitoring station (PMS) – nominated to measure air quality to assess achievement of the AAQ NEPM goal
trend station – nominated to measure air quality to identify long-term changes and assess achievement of the AAQ NEPM goal
campaign station – short-term investigation station, operated for at least one calendar year, to assess the need for ongoing monitoring in the region to assess achievement of the AAQ NEPM goal.
The location category in Table 1 provides a qualitative description of the exposed population at each monitoring station.
Table 1 also describes monitoring stations using population coverage descriptors in the National Environment Protection (Ambient Air Quality) Measure Technical Paper No. 3, Monitoring Strategy4:
generally representative upper bound (GRUB) – indicative of pollutant concentrations in the upper range occurring in populated areas in the region
population-average – indicative of air quality experienced by most of the population.
DSITI generally monitors air quality in compliance with the Australian Standards (AS) specified in the AAQ NEPM. Exceptions to these standards are:
differential optical absorption spectroscopy (DOAS) technique used to measure ozone, nitrogen dioxide and sulfur dioxide at Springwood in South East Queensland
tapered element oscillating microbalance (TEOM) instruments fitted with Filter Dynamics Measurement Systems (FDMS) to account for possible losses of semi-volatile compounds present in particles caused by heating the air stream, at Rocklea and Springwood in South East Queensland and at South Gladstone.
Monitoring techniques used at each AAQ NEPM compliance monitoring site are listed in Table 1.
.
4 available from www.nepc.gov.au/resource/ephc-archive-ambient-air-quality-nepm
Queensland air monitoring 2016 – National Environment Protection (Ambient Air Quality) Measure
3
Table 1. Summary information for 2016 Queensland AAQ NEPM monitoring sites
Site Station type Date established
Pollutants measured
Monitoring technique Location category
Non-conformance with AS3580.1.1 siting criteria
Major pollutant sources
South East Queensland
North Coast sub-region
Mountain Creek
PMS – GRUB July 2001 O3 NO2 PM10
AS3580.6.1–2011 AS3580.5.1–2011 AS3580.9.8–2008
Residential Nil Major roads, forestry/ agricultural burning
Brisbane sub-region
Deception Bay Trend – GRUB June 1994 O3 NO2
AS3580.6.1–2011 AS3580.5.1–2011
Residential Trees within 20m west of site
Major roads
Woolloongabba Trend – Peak June 1998 (temporarily closed 17 June 2016)
CO AS3580.7.1–2011 Inner city roadside
Building within 20m west of site
Major roads
Rocklea Trend – GRUB January 1978 (relocated March 1994 and June 2007)
O3 NO2 PM10
PM2.5
AS3580.6.1–2011 AS3580.5.1–2011 FDMS TEOM, based on AS3580.9.13:2013 AS3580.9.13:2013 (FDMS TEOM)
Light industry/ residential
Nil Major roads
Springwood PMS – Population average
March 1999 O3 NO2 SO2 PM10 PM2.5
DOAS DOAS DOAS AS3580.9.8–2008 (to 25 Feb); FDMS TEOM, based on AS3580.9.13:2013 (from 25 Feb). TEOM, based on AS3580.9.8–2008 (to 25 Feb); AS3580.9.13:2013 (FDMS TEOM) (from 25 Feb).
Residential Nil Major roads
Ipswich sub-region
Flinders View Trend – GRUB January 1993 O3 NO2 SO2
PM10
AS3580.6.1–2011 AS3580.5.1–2011 AS3580.4.1–2008 AS3580.9.8–2008
Industry/ residential
Trees within 20m of site
Major roads, industry (power station)
Department of Science, Information Technology and Innovation
4
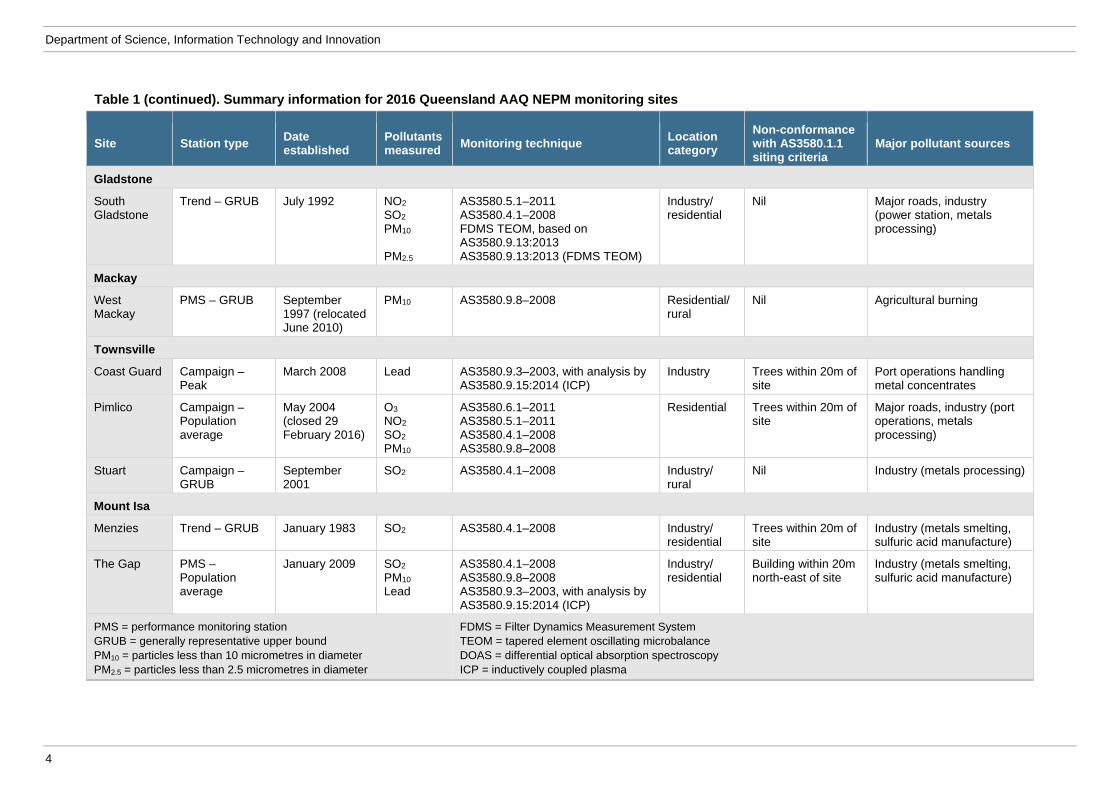
Table 1 (continued). Summary information for 2016 Queensland AAQ NEPM monitoring sites
Site Station type Date established
Pollutants measured
Monitoring technique Location category
Non-conformance with AS3580.1.1 siting criteria
Major pollutant sources
Gladstone
South Gladstone
Trend – GRUB July 1992 NO2 SO2
PM10 PM2.5
AS3580.5.1–2011 AS3580.4.1–2008 FDMS TEOM, based on AS3580.9.13:2013 AS3580.9.13:2013 (FDMS TEOM)
Industry/ residential
Nil Major roads, industry (power station, metals processing)
Mackay
West Mackay
PMS – GRUB September 1997 (relocated June 2010)
PM10 AS3580.9.8–2008 Residential/ rural
Nil Agricultural burning
Townsville
Coast Guard Campaign – Peak
March 2008 Lead AS3580.9.3–2003, with analysis by AS3580.9.15:2014 (ICP)
Industry Trees within 20m of site
Port operations handling metal concentrates
Pimlico Campaign – Population average
May 2004 (closed 29 February 2016)
O3 NO2 SO2
PM10
AS3580.6.1–2011 AS3580.5.1–2011 AS3580.4.1–2008 AS3580.9.8–2008
Residential Trees within 20m of site
Major roads, industry (port operations, metals processing)
Stuart Campaign – GRUB
September 2001
SO2 AS3580.4.1–2008
Industry/ rural
Nil Industry (metals processing)
Mount Isa
Menzies Trend – GRUB January 1983 SO2 AS3580.4.1–2008
Industry/ residential
Trees within 20m of site
Industry (metals smelting, sulfuric acid manufacture)
The Gap PMS – Population average
January 2009 SO2
PM10 Lead
AS3580.4.1–2008 AS3580.9.8–2008 AS3580.9.3–2003, with analysis by AS3580.9.15:2014 (ICP)
Industry/ residential
Building within 20m north-east of site
Industry (metals smelting, sulfuric acid manufacture)
PMS = performance monitoring station GRUB = generally representative upper bound PM10 = particles less than 10 micrometres in diameter PM2.5 = particles less than 2.5 micrometres in diameter
FDMS = Filter Dynamics Measurement System TEOM = tapered element oscillating microbalance DOAS = differential optical absorption spectroscopy ICP = inductively coupled plasma
Queensland air monitoring 2016 – National Environment Protection (Ambient Air Quality) Measure
5
PM10 data collected using TEOM units not fitted with FDMS units were adjusted using a temperature-dependent factor described in Option 2 in the National Environment Protection (Ambient Air Quality) Measure Technical Paper No. 10, Collection and Reporting of TEOM PM10 data5. These adjusted PM10 concentrations vary linearly from no change at daily average temperatures at or above 15 degrees Celsius to an increase of 40 per cent at or below a temperature of five degrees Celsius.
PM2.5 data presented in this report was collected using TEOM PM2.5 instruments that operated continuously. Where not fitted with FDMS units, the TEOM instruments were operated in accordance with the National Environment Protection (Ambient Air Quality) Measure Technical Paper on Monitoring for Particles as PM2.5
6.
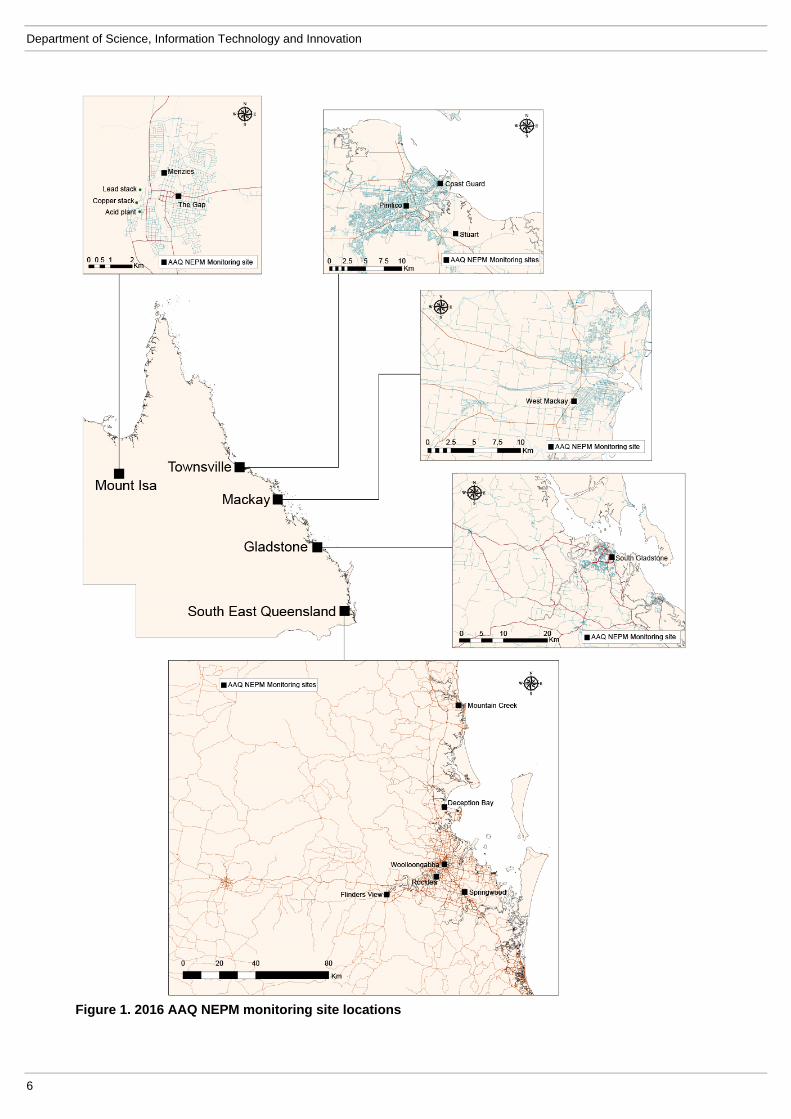
Figure 1 shows the location of all 2016 Queensland AAQ NEPM monitoring stations.
5 available from www.nepc.gov.au/resource/ephc-archive-ambient-air-quality-nepm 6 available from www.nepc.gov.au/resource/ephc-archive-ambient-air-quality-nepm
Department of Science, Information Technology and Innovation
6
Figure 1. 2016 AAQ NEPM monitoring site locations
Queensland air monitoring 2016 – National Environment Protection (Ambient Air Quality) Measure
7
Variations to the approved monitoring plan for Queensland
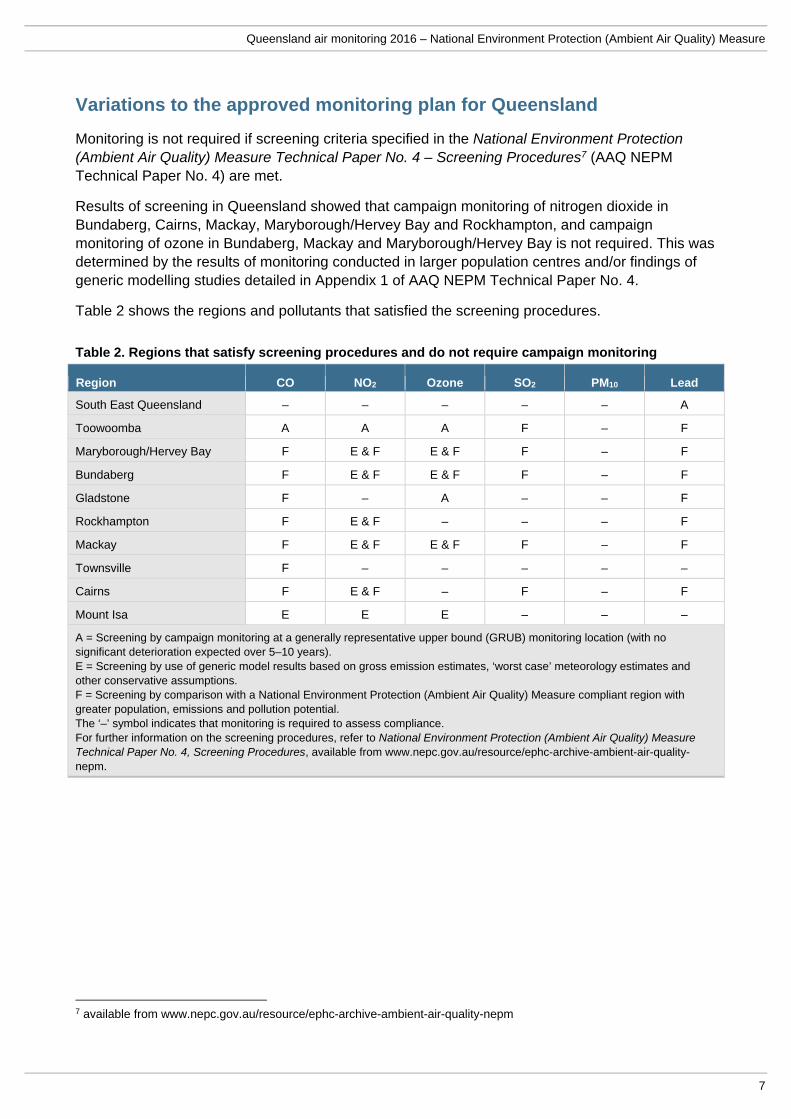
Monitoring is not required if screening criteria specified in the National Environment Protection (Ambient Air Quality) Measure Technical Paper No. 4 – Screening Procedures7 (AAQ NEPM Technical Paper No. 4) are met.
Results of screening in Queensland showed that campaign monitoring of nitrogen dioxide in Bundaberg, Cairns, Mackay, Maryborough/Hervey Bay and Rockhampton, and campaign monitoring of ozone in Bundaberg, Mackay and Maryborough/Hervey Bay is not required. This was determined by the results of monitoring conducted in larger population centres and/or findings of generic modelling studies detailed in Appendix 1 of AAQ NEPM Technical Paper No. 4.
Table 2 shows the regions and pollutants that satisfied the screening procedures.
Table 2. Regions that satisfy screening procedures and do not require campaign monitoring
Region CO NO2 Ozone SO2 PM10 Lead
South East Queensland – – – – – A
Toowoomba A A A F – F
Maryborough/Hervey Bay F E & F E & F F – F
Bundaberg F E & F E & F F – F
Gladstone F – A – – F
Rockhampton F E & F – – – F
Mackay F E & F E & F F – F
Townsville F – – – – –
Cairns F E & F – F – F
Mount Isa E E E – – –
A = Screening by campaign monitoring at a generally representative upper bound (GRUB) monitoring location (with no significant deterioration expected over 5–10 years). E = Screening by use of generic model results based on gross emission estimates, ‘worst case’ meteorology estimates and other conservative assumptions. F = Screening by comparison with a National Environment Protection (Ambient Air Quality) Measure compliant region with greater population, emissions and pollution potential. The ‘–’ symbol indicates that monitoring is required to assess compliance. For further information on the screening procedures, refer to National Environment Protection (Ambient Air Quality) Measure Technical Paper No. 4, Screening Procedures, available from www.nepc.gov.au/resource/ephc-archive-ambient-air-quality-nepm.
7 available from www.nepc.gov.au/resource/ephc-archive-ambient-air-quality-nepm

Department of Science, Information Technology and Innovation
8
Section B – Assessment of compliance with standards and goals
This section presents details of the 2016 compliance assessment for Queensland. Compliance criteria are applied at each performance monitoring station in the state.
Compliance is achieved if approved screening procedures are satisfied or:
the number of exceedances of the relevant standard was no more than the number specified in Schedule 2 of the AAQ NEPM, and
data availability was at least 75 per cent in each calendar quarter.
In 2016 the AAQ NEPM was amended to include a PM10 annual average standard (25 µg/m3) and replacement of the previous five-day exceedance form of the 24-hour particle standards with an exception event rule. Compliance with the AAQ NEPM goal for 24-hour PM2.5 and PM10 concentrations now excludes exceptional events such as bushfires, hazard reduction burning and dust storms. These events are still included in determination of compliance with the AAQ NEPM goal for annual PM2.5 and PM10 concentrations.
AAQ NEPM Technical Paper No. 8 states that a data availability rate of at least 75 per cent in each calendar quarter is required to make a valid assessment of compliance. Compliance with the relevant standards and goals could not be demonstrated for carbon monoxide at Woolloongabba in South East Queensland; nitrogen dioxide, ozone, sulfur dioxide and PM10 at Pimlico in Townsville; and lead at The Gap in Mount Isa for this reason.
Compliance summaries for AAQ NEPM pollutants in 2016 are presented from Table 3 to Table 9.
Carbon monoxide
Table 3. 2016 CO compliance summary
Region/performance monitoring station
Data availability rates (% of hours) Number of exceedances
(days)
Performance against the standard and goal Q1 Q2 Q3 Q4 Annual
South East Queensland Brisbane sub-region Woolloongabba 95.8 80.4 0.0 0.0 43.8 0 ND
ND = “not demonstrated” due to insufficient data in one or more quarters.
AAQ NEPM standard for CO: 9.0 ppm (8-hour average). AAQ NEPM goal for CO: standard exceeded on no more than 1 day per year.
Regions which do not require monitoring on the basis of screening arguments that carbon monoxide levels are reasonably expected to be consistently below the NEPM standard are:
Bundaberg
Cairns
Gladstone
Mackay
Maryborough/Hervey Bay
Mount Isa
Queensland air monitoring 2016 – National Environment Protection (Ambient Air Quality) Measure
9
Rockhampton
Toowoomba
Townsville.
Motor vehicles are the main contributor to ambient carbon monoxide concentrations in urban areas. Combustion stoves and wood heaters can also contribute, but their use in most monitored areas in Queensland is minimal.
Carbon monoxide concentrations at performance monitoring stations in South East Queensland (at Brisbane CBD from 2000 to 2004 and Woolloongabba from 2007 to 2016) were consistently less than 40 per cent of the AAQ NEPM standard (see Section D – Pollutant distribution and trends). Therefore, under screening procedure F in Table 1 of the AAQ NEPM Technical Paper No. 4, carbon monoxide monitoring is not required in coastal Queensland population centres with lower traffic density and warmer winter temperatures than South East Queensland.
Carbon monoxide concentrations at North Toowoomba were consistently less than 30 per cent of the AAQ NEPM standard during campaign monitoring from July 2003 to December 2010. This satisfies the 60 per cent acceptance limit specified in screening procedure A in Table 1 of the AAQ NEPM Technical Paper No. 4.
Mount Isa satisfies screening criteria for carbon monoxide by generic modelling alone (screening procedure E in Table 1 of the AAQ NEPM Technical Paper No. 4) and therefore is considered to comply with the AAQ NEPM carbon monoxide standard.
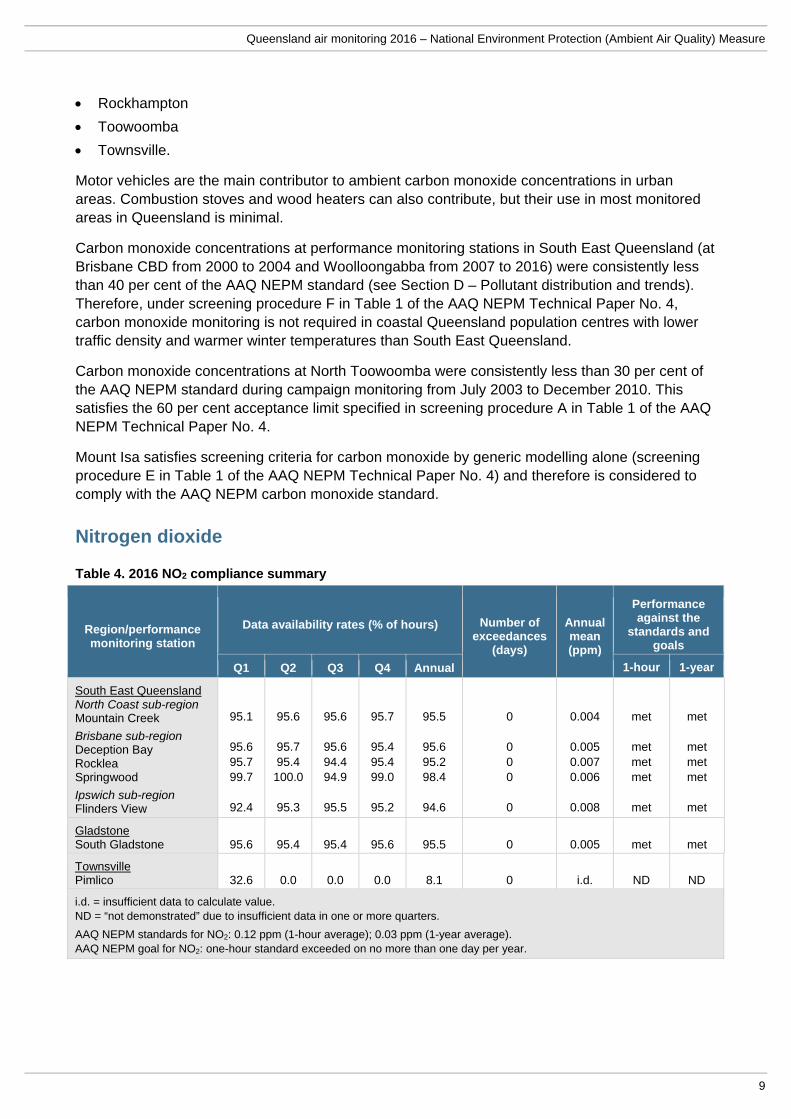
Nitrogen dioxide
Table 4. 2016 NO2 compliance summary
Region/performance monitoring station
Data availability rates (% of hours) Number of exceedances
(days)
Annual mean (ppm)
Performance against the
standards and goals
Q1 Q2 Q3 Q4 Annual 1-hour 1-year
South East Queensland North Coast sub-region Mountain Creek
Brisbane sub-region Deception Bay Rocklea Springwood
Ipswich sub-region Flinders View
95.1
95.6 95.7 99.7
92.4
95.6
95.7 95.4 100.0
95.3
95.6
95.6 94.4 94.9
95.5
95.7
95.4 95.4 99.0
95.2
95.5
95.6 95.2 98.4
94.6
0
0 0 0
0
0.004
0.005 0.007 0.006
0.008
met
met met met
met
met
met met met
met
Gladstone South Gladstone 95.6 95.4 95.4 95.6 95.5 0 0.005 met met
Townsville Pimlico 32.6 0.0 0.0 0.0 8.1 0 i.d. ND ND
i.d. = insufficient data to calculate value. ND = “not demonstrated” due to insufficient data in one or more quarters.
AAQ NEPM standards for NO2: 0.12 ppm (1-hour average); 0.03 ppm (1-year average). AAQ NEPM goal for NO2: one-hour standard exceeded on no more than one day per year.

Department of Science, Information Technology and Innovation
10
Regions which do not require monitoring on the basis of screening arguments that nitrogen dioxide levels are reasonably expected to be consistently below the NEPM standards are:
Bundaberg
Cairns
Mackay
Maryborough/Hervey Bay
Mount Isa
Rockhampton
Toowoomba
Townsville.
Appendix 1 of the AAQ NEPM Technical Paper No. 4 states that nitrogen dioxide monitoring is not required in coastal and inland centres with populations below 250,000 on the bases of generic modelling conducted by CSIRO (screening procedure E in Table 1) and data from an AAQ NEPM compliant region with greater population, emissions and pollution potential showing nitrogen dioxide concentrations below 40 per cent of the NEPM standards (screening procedure F in Table 1).
Nitrogen dioxide monitoring at Pimlico in Townsville from 2004 to 2016 showed concentrations were consistently less than 40 per cent of the AAQ NEPM standards. The maximum one-hour average concentration during this period was 0.042 ppm (35 per cent of the standard). The highest annual average nitrogen dioxide concentration was 0.006 ppm (20 per cent of the standard). On this basis, nitrogen dioxide monitoring is not required at the coastal Queensland centres of Bundaberg, Cairns, Mackay, Maryborough/Hervey Bay and Rockhampton, which are considered to comply with the AAQ NEPM standards.
During campaign monitoring from July 2003 to December 2010, nitrogen dioxide concentrations at North Toowoomba were consistently less than 50 per cent of the AAQ NEPM standard. This satisfies the 60 per cent acceptance limit specified in screening procedure A in Table 1 of the AAQ NEPM Technical Paper No. 4.
Mount Isa satisfies screening criteria for nitrogen dioxide by generic modelling alone (screening procedure E in Table 1 of the AAQ NEPM Technical Paper No. 4) and therefore is considered to comply with the AAQ NEPM nitrogen dioxide standards.
Queensland air monitoring 2016 – National Environment Protection (Ambient Air Quality) Measure
11
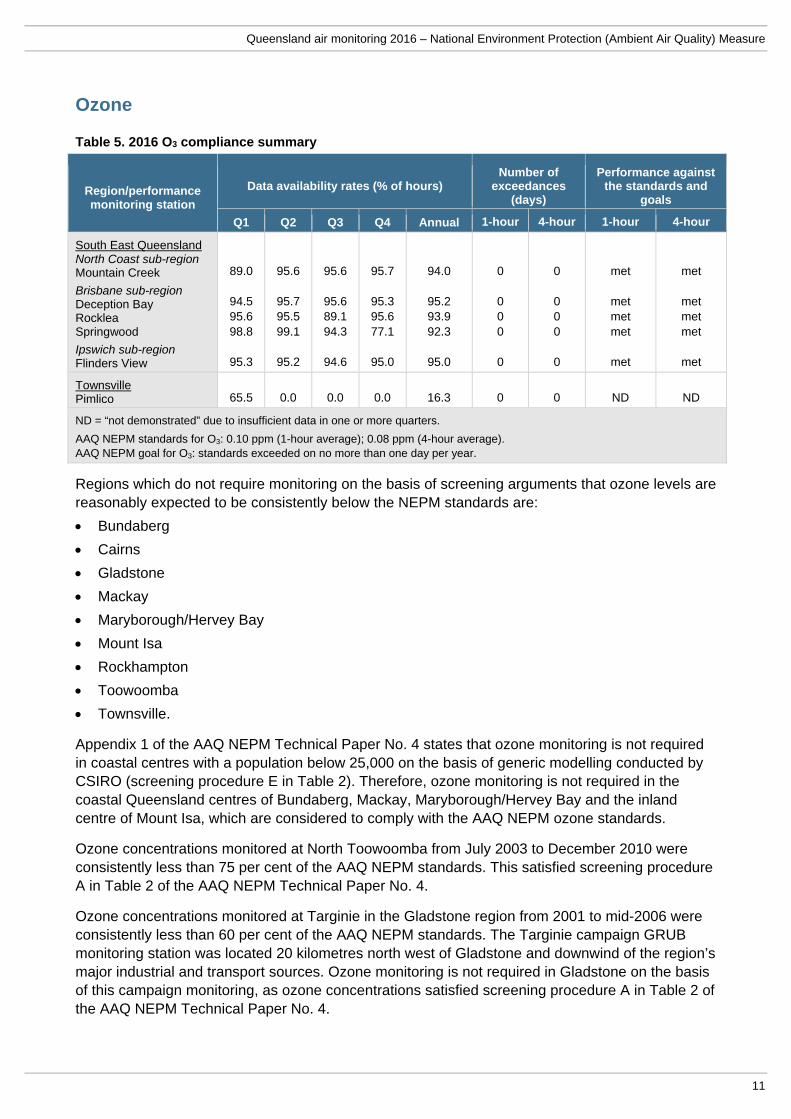
Ozone
Table 5. 2016 O3 compliance summary
Region/performance monitoring station
Data availability rates (% of hours) Number of
exceedances (days)
Performance against the standards and
goals
Q1 Q2 Q3 Q4 Annual 1-hour 4-hour 1-hour 4-hour
South East Queensland North Coast sub-region Mountain Creek
Brisbane sub-region Deception Bay Rocklea Springwood
Ipswich sub-region Flinders View
89.0
94.5 95.6 98.8
95.3
95.6
95.7 95.5 99.1
95.2
95.6
95.6 89.1 94.3
94.6
95.7
95.3 95.6 77.1
95.0
94.0
95.2 93.9 92.3
95.0
0
0 0 0
0
0 0 0 0 0
met
met met met
met
met
met met met
met
Townsville Pimlico 65.5 0.0 0.0 0.0 16.3 0 0 ND ND
ND = “not demonstrated” due to insufficient data in one or more quarters.
AAQ NEPM standards for O3: 0.10 ppm (1-hour average); 0.08 ppm (4-hour average). AAQ NEPM goal for O3: standards exceeded on no more than one day per year.
Regions which do not require monitoring on the basis of screening arguments that ozone levels are reasonably expected to be consistently below the NEPM standards are:
Bundaberg
Cairns
Gladstone
Mackay
Maryborough/Hervey Bay
Mount Isa
Rockhampton
Toowoomba
Townsville.
Appendix 1 of the AAQ NEPM Technical Paper No. 4 states that ozone monitoring is not required in coastal centres with a population below 25,000 on the basis of generic modelling conducted by CSIRO (screening procedure E in Table 2). Therefore, ozone monitoring is not required in the coastal Queensland centres of Bundaberg, Mackay, Maryborough/Hervey Bay and the inland centre of Mount Isa, which are considered to comply with the AAQ NEPM ozone standards.
Ozone concentrations monitored at North Toowoomba from July 2003 to December 2010 were consistently less than 75 per cent of the AAQ NEPM standards. This satisfied screening procedure A in Table 2 of the AAQ NEPM Technical Paper No. 4.
Ozone concentrations monitored at Targinie in the Gladstone region from 2001 to mid-2006 were consistently less than 60 per cent of the AAQ NEPM standards. The Targinie campaign GRUB monitoring station was located 20 kilometres north west of Gladstone and downwind of the region’s major industrial and transport sources. Ozone monitoring is not required in Gladstone on the basis of this campaign monitoring, as ozone concentrations satisfied screening procedure A in Table 2 of the AAQ NEPM Technical Paper No. 4.
Department of Science, Information Technology and Innovation
12
Under screening procedure F in Table 2 of AAQ NEPM Technical Paper No. 4, ozone monitoring is not required in Rockhampton based on ozone concentrations measured in the Gladstone region meeting the 60 per cent acceptance limit and emissions of precursor ozone pollutants being lower in Rockhampton than in the Gladstone airshed8.
Ozone concentrations at the Pimlico campaign monitoring site in Townsville, have been consistently less than 75 per cent of the AAQ NEPM 1-hour and 4-hour standards between 2004 and 2016. This indicates that, in the absence of a significant increase in ozone precursor pollutant emissions, ongoing ozone monitoring is not required in Townsville as ozone concentrations satisfy screening procedure A in Table 2 of the AAQ NEPM Technical Paper No. 4.
Under screening procedure F in Table 2 of the AAQ NEPM Technical Paper No. 4, ozone monitoring is not required in Cairns where population and emissions of precursor ozone pollutants are lower than in Townsville9.
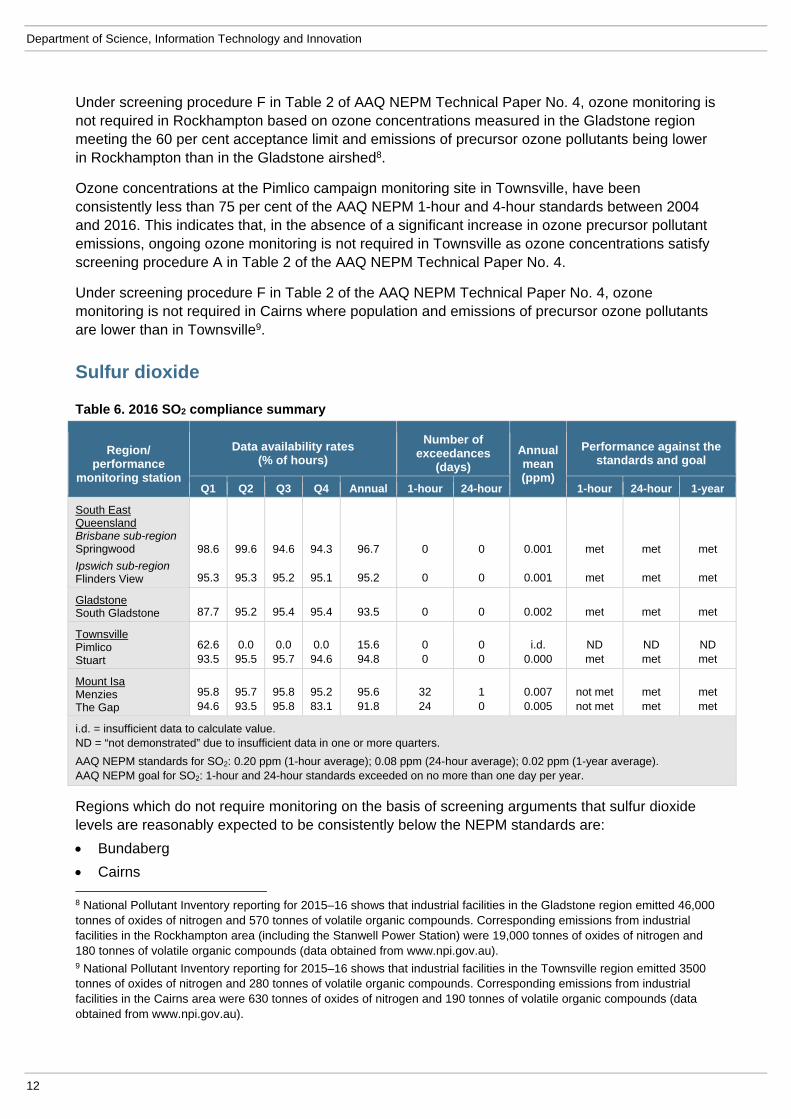
Sulfur dioxide
Table 6. 2016 SO2 compliance summary
Region/ performance
monitoring station
Data availability rates (% of hours)
Number of exceedances
(days)
Annual mean (ppm)
Performance against the standards and goal
Q1 Q2 Q3 Q4 Annual 1-hour 24-hour 1-hour 24-hour 1-year
South East Queensland Brisbane sub-region Springwood
Ipswich sub-region Flinders View
98.6
95.3
99.6
95.3
94.6
95.2
94.3
95.1
96.7
95.2
0 0
0
0
0.001
0.001
met
met
met
met
met
met
Gladstone South Gladstone 87.7 95.2 95.4 95.4 93.5 0 0 0.002 met met met
Townsville Pimlico Stuart
62.6 93.5
0.0 95.5
0.0 95.7
0.0 94.6
15.6 94.8
0 0
0 0
i.d. 0.000
ND met
ND met
ND met
Mount Isa Menzies The Gap
95.8 94.6
95.7 93.5
95.8 95.8
95.2 83.1
95.6 91.8
32 24
1 0
0.007 0.005
not met not met
met met
met met
i.d. = insufficient data to calculate value. ND = “not demonstrated” due to insufficient data in one or more quarters.
AAQ NEPM standards for SO2: 0.20 ppm (1-hour average); 0.08 ppm (24-hour average); 0.02 ppm (1-year average). AAQ NEPM goal for SO2: 1-hour and 24-hour standards exceeded on no more than one day per year.
Regions which do not require monitoring on the basis of screening arguments that sulfur dioxide levels are reasonably expected to be consistently below the NEPM standards are:
Bundaberg
Cairns 8 National Pollutant Inventory reporting for 2015–16 shows that industrial facilities in the Gladstone region emitted 46,000 tonnes of oxides of nitrogen and 570 tonnes of volatile organic compounds. Corresponding emissions from industrial facilities in the Rockhampton area (including the Stanwell Power Station) were 19,000 tonnes of oxides of nitrogen and 180 tonnes of volatile organic compounds (data obtained from www.npi.gov.au). 9 National Pollutant Inventory reporting for 2015–16 shows that industrial facilities in the Townsville region emitted 3500 tonnes of oxides of nitrogen and 280 tonnes of volatile organic compounds. Corresponding emissions from industrial facilities in the Cairns area were 630 tonnes of oxides of nitrogen and 190 tonnes of volatile organic compounds (data obtained from www.npi.gov.au).
Queensland air monitoring 2016 – National Environment Protection (Ambient Air Quality) Measure
13
Mackay
Maryborough/Hervey Bay
Rockhampton
Toowoomba.
Concentrations of sulfur dioxide are typically low unless significant industrial sources of sulfur dioxide are present (e.g. coal-fired power stations or metals smelting). Peak sulfur dioxide concentrations in the Brisbane sub-region in South East Queensland are below 40 per cent of the AAQ NEPM standard (see Section D – Pollutant distribution and trends). On this basis, sulfur dioxide monitoring is not required in other Queensland centres with lower populations and no significant sulfur dioxide point sources under screening procedure F in Table 1 of the AAQ NEPM Technical Paper No. 4.
Sulfur dioxide concentrations at the South Gladstone monitoring site have been regularly below 40 per cent of the AAQ NEPM standards from 2009 to 2016. Therefore, under screening procedure F in Table 1 of the AAQ NEPM Technical Paper No. 4, sulfur dioxide monitoring is not required in Rockhampton based on the lower level of industrial emissions in Rockhampton10.
10 National Pollutant Inventory reporting for 2015–16 shows that sulfur dioxide emissions from industrial facilities in the Gladstone region totalled 42,000 tonnes, compared with 34,000 tonnes from industrial facilities (including the Stanwell Power Station) in Rockhampton over the same period (data obtained from www.npi.gov.au/).
Department of Science, Information Technology and Innovation
14
PM10
Table 7. 2016 PM10 compliance summary
Region/performance monitoring station
Data availability rates (% of days) Number of exceedances
(days)
Annual mean
(µg/m3)
Performance against the
standards and goals
Q1 Q2 Q3 Q4 Annual 24-hour 1-year
South East Queensland North Coast sub-region Mountain Creek
Brisbane sub-region Rocklea Springwood
Ipswich sub-region Flinders View
97.7
95.8 86.4
96.8
95.4
86.3 99.7
98.3
96.6
90.9 99.2
98.2
96.1
90.4 99.3
97.3
96.4
90.9 96.2
97.6
0 0 0 0
16.0
15.1 12.4
13.1
met
met met
met
met
met met
met
Gladstone South Gladstone 98.7 94.5 98.6 95.9 96.9 0 14.5 met met
Mackay West Mackay 92.0 91.3 96.3 95.6 93.8 0 19.8 met met
Townsville Pimlico 52.3 0.0 0.0 0.0 13.0 0 i.d. ND ND
Mount Isa The Gap 96.7 92.9 97.0 94.3 95.2 1* 16.8 met met
* Exceedance due to a dust storm. Excluded from determination of compliance with the 24-hour goal under the exceptional event rule. i.d. = insufficient data to calculate value. ND = “not demonstrated” due to insufficient data in one or more quarters.
AAQ NEPM standards for PM10: 50 µg/m3 (24-hour average); 25 µg/m3 (1-year average). PM10 monitoring data determined as being directly associated with an exceptional event (e.g. dust storm) is excluded from reporting compliance with the PM10 24-hour goal.
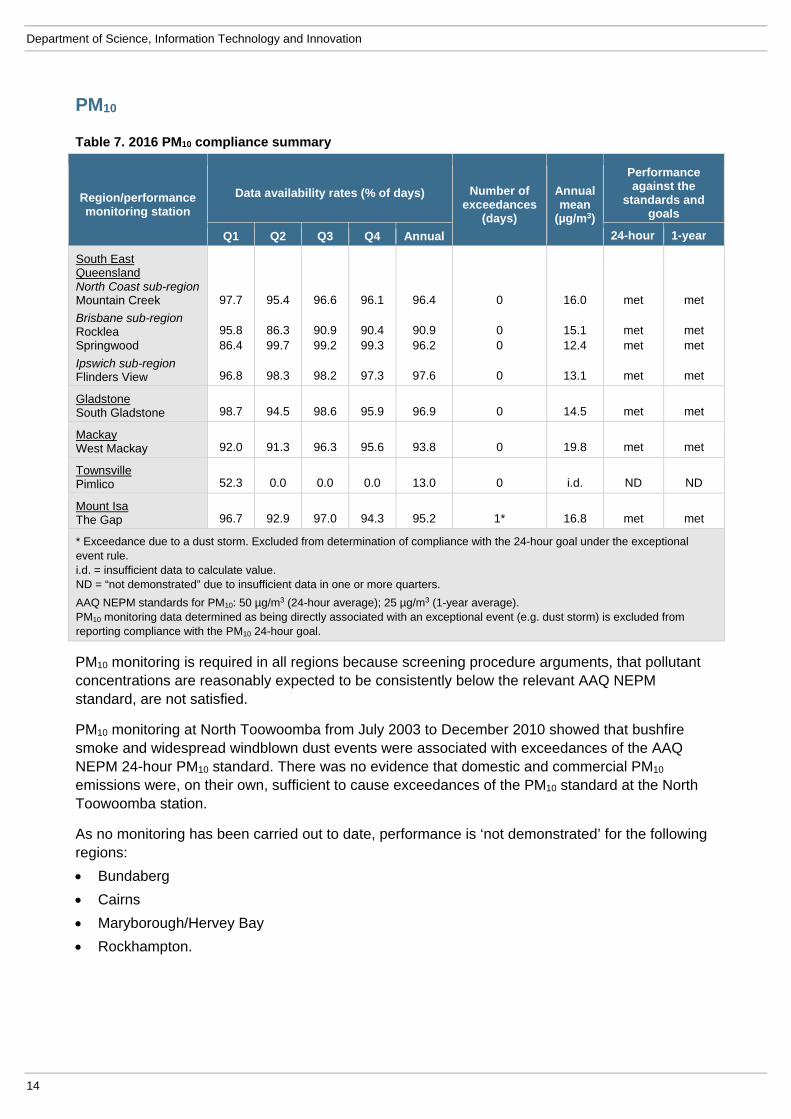
PM10 monitoring is required in all regions because screening procedure arguments, that pollutant concentrations are reasonably expected to be consistently below the relevant AAQ NEPM standard, are not satisfied.
PM10 monitoring at North Toowoomba from July 2003 to December 2010 showed that bushfire smoke and widespread windblown dust events were associated with exceedances of the AAQ NEPM 24-hour PM10 standard. There was no evidence that domestic and commercial PM10 emissions were, on their own, sufficient to cause exceedances of the PM10 standard at the North Toowoomba station.
As no monitoring has been carried out to date, performance is ‘not demonstrated’ for the following regions:
Bundaberg
Cairns
Maryborough/Hervey Bay
Rockhampton.

Queensland air monitoring 2016 – National Environment Protection (Ambient Air Quality) Measure
15
PM2.5
Table 8. 2016 PM2.5 compliance summary
Region/performance monitoring station
Data availability rates (% of days) Number of exceedances
(days)
Annual mean
(µg/m3)
Performance against the
standards and goals
Q1 Q2 Q3 Q4 Annual 24-hour 1-year
South East Queensland Brisbane sub-region Rocklea+ Springwood‡
95.8 83.5
86.3 99.7
90.9 99.2
90.4 99.3
90.9 95.4
0 0
6.5 5.7
met met
met met
Gladstone South Gladstone+ 98.7 94.5 98.6 95.9 96.9 0 5.7 met met
+ Monitoring by TEOM Model 1405 instrumentation fitted with FDMS. ‡ Monitoring by TEOM Model 1400 instrumentation in accordance with Technical Paper on Monitoring for Particles as PM2.5 (to 25 February 2016). From 25 February, monitoring by TEOM Model 1405 instrumentation fitted with FDMS.
AAQ NEPM standards for PM2.5: 25 µg/m3 (24-hour average); 8 µg/m3 (1-year average). PM2.5 monitoring data determined as being directly associated with an exceptional event (e.g. bushfire) is excluded from reporting compliance with the PM2.5 24-hour goal.
PM2.5 monitoring is required in all regions because screening procedure arguments, that pollutant concentrations are reasonably expected to be consistently below the relevant AAQ NEPM advisory standard, are not satisfied.
PM2.5 monitoring at North Toowoomba from July 2003 to December 2010 showed that bushfire smoke and widespread windblown dust events were associated with exceedances of the (then advisory) AAQ NEPM 24-hour PM2.5 standard. There was no evidence that domestic and commercial PM2.5 emissions were, on their own, sufficient to cause exceedances of the PM2.5 standard at the North Toowoomba station.
As no monitoring has been carried out to date, performance is ‘not demonstrated’ for the following regions:
Bundaberg
Cairns
Mackay
Maryborough/Hervey Bay
Mount Isa
Rockhampton
Townsville.

Department of Science, Information Technology and Innovation
16
Lead
Table 9. 2016 lead compliance summary
Region/ performance monitoring station
Data availability rates (% of days) Annual mean (µg/m3)
Performance against the standards and goal Q1 Q2 Q3 Q4 Annual
Townsville Coast Guard 100.0 100.0 100.0 100.0 100.0 0.05 met
Mount Isa The Gap 86.7 80.0 86.7 68.8 80.3 0.06 ND
ND = “not demonstrated” due to insufficient data in one or more quarters.
AAQ NEPM standard for lead: 0.5 µg/m3 (1-year average).
Regions which do not require monitoring on the basis of screening arguments that lead levels are reasonably expected to be consistently below the NEPM standard are:
Bundaberg
Cairns
Gladstone
Mackay
Maryborough/Hervey Bay
Rockhampton
South East Queensland
Toowoomba.
The phase-out of leaded motor vehicle fuel from March 2001 means that no significant sources of lead now exist in most Queensland regions. The exceptions to this are non-vehicle sources of lead such as metals smelting and handling of metal ore concentrates. Lead concentrations measured at the Woolloongabba performance monitoring station in South East Queensland were less than ten per cent of the AAQ NEPM standard for both 2001 (0.03 µg/m3) and 2002 (0.02 µg/m3). These measurements demonstrated that compliance with the AAQ NEPM standard and goal has been achieved in South East Queensland, in accordance with the National Environment Protection (Ambient Air Quality) Measure Technical Paper No. 9, Lead Monitoring11. Lead monitoring in South East Queensland ceased in 2002.
Peak lead concentrations in South East Queensland were less than 40 per cent of the AAQ NEPM standard between 1999 and 2002 (see Section D – Pollutant distribution and trends). This means that, under screening procedure F in Table 1 of the AAQ NEPM Technical Paper No. 4, lead monitoring is not required in other Queensland centres with lower population and traffic density (except for Townsville and Mount Isa where other non-vehicle lead emission sources exist).
11 available from www.nepc.gov.au/resource/ephc-archive-ambient-air-quality-nepm
Queensland air monitoring 2016 – National Environment Protection (Ambient Air Quality) Measure
17
Section C – Analysis of monitoring data against standards
This section presents time, date and location information for the following annual summary statistics for 2016:
exceedances of AAQ NEPM standards and circumstances under which they occurred
annual maximum and second-highest daily concentrations for carbon monoxide, nitrogen dioxide, ozone and sulfur dioxide, for which the AAQ NEPM allows one exceedance day per year.
Exceedance details are presented in Table 10 and Table 11, and summary statistics are presented from Table 12 to Table 19. Concentrations exceeding AAQ NEPM standards are shown in bold text in the summary tables.
Exceedance summary
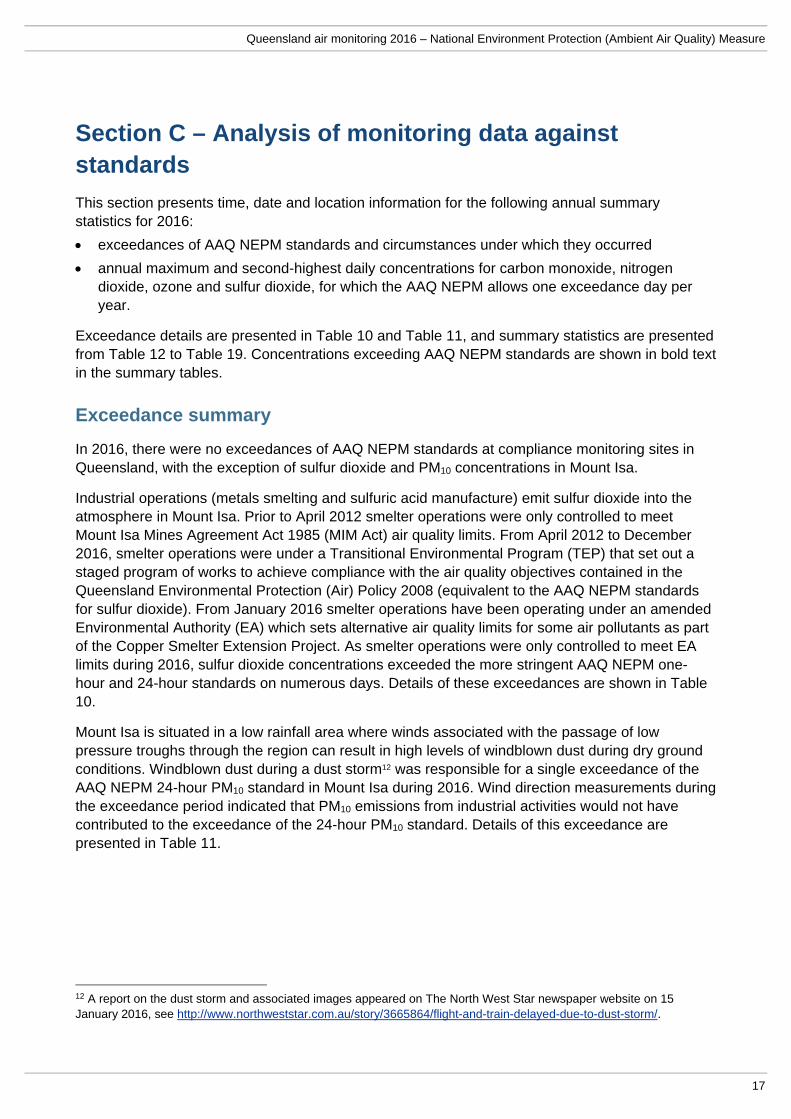
In 2016, there were no exceedances of AAQ NEPM standards at compliance monitoring sites in Queensland, with the exception of sulfur dioxide and PM10 concentrations in Mount Isa.
Industrial operations (metals smelting and sulfuric acid manufacture) emit sulfur dioxide into the atmosphere in Mount Isa. Prior to April 2012 smelter operations were only controlled to meet Mount Isa Mines Agreement Act 1985 (MIM Act) air quality limits. From April 2012 to December 2016, smelter operations were under a Transitional Environmental Program (TEP) that set out a staged program of works to achieve compliance with the air quality objectives contained in the Queensland Environmental Protection (Air) Policy 2008 (equivalent to the AAQ NEPM standards for sulfur dioxide). From January 2016 smelter operations have been operating under an amended Environmental Authority (EA) which sets alternative air quality limits for some air pollutants as part of the Copper Smelter Extension Project. As smelter operations were only controlled to meet EA limits during 2016, sulfur dioxide concentrations exceeded the more stringent AAQ NEPM one-hour and 24-hour standards on numerous days. Details of these exceedances are shown in Table 10.
Mount Isa is situated in a low rainfall area where winds associated with the passage of low pressure troughs through the region can result in high levels of windblown dust during dry ground conditions. Windblown dust during a dust storm12 was responsible for a single exceedance of the AAQ NEPM 24-hour PM10 standard in Mount Isa during 2016. Wind direction measurements during the exceedance period indicated that PM10 emissions from industrial activities would not have contributed to the exceedance of the 24-hour PM10 standard. Details of this exceedance are presented in Table 11.
12 A report on the dust storm and associated images appeared on The North West Star newspaper website on 15 January 2016, see http://www.northweststar.com.au/story/3665864/flight-and-train-delayed-due-to-dust-storm/.

Department of Science, Information Technology and Innovation
18
Table 10. 2016 SO2 exceedances
Region/performance monitoring station
Standard Concentration
(ppm) Date Time Circumstances
Mount Isa Menzies
1-hour
0.717 0.576 0.487 0.481 0.478 0.465 0.452 0.438 0.432 0.426 0.400 0.396 0.392 0.387 0.377 0.366 0.356 0.347 0.345 0.327 0.323 0.291 0.286 0.277 0.277 0.270 0.264 0.263 0.251 0.251 0.249 0.247 0.230 0.226 0.224 0.219 0.216 0.214 0.213 0.210 0.209 0.208 0.207 0.206 0.205 0.205 0.204 0.203 0.201
Dec 5 Dec 5 Oct 25 Sep 23 Oct 21 Jan 10 Jun 5
Feb 29 Jun 21 Apr 2
Nov 29 Jun 5 Jan 2 Jul 3
Jun 21 Jun 3 Jul 4
Feb 29 Feb 5 Jun 6
Nov 29 Feb 9 Oct 3 Feb 5 Jun 18 Feb 18 Feb 25 Jul 22 Feb 29 Jun 30 Oct 26 Dec 31 Feb 29 Nov 22 Mar 1 Jan 6 Jun 6
Mar 29 Jan 2
Feb 29 Feb 19 Jan 5 Jan 10 Jun 6 Jul 22 Sep 23 Sep 9 Oct 26 Feb 29
9
10 18 15 22 12 14 19 15 16 17 17 16 16 16 15 12 18 22 16 16 18 9
21 14 14 14 17 24 15 16 10 14 20 14 17 11 17 17 20 18 18 17 12 15 16 17 12 17
All exceedances at the Menzies monitoring site were due to industry emissions.

Queensland air monitoring 2016 – National Environment Protection (Ambient Air Quality) Measure
19
Table 10. 2016 SO2 exceedances (continued)
Region/performance monitoring station
Standard Concentration
(ppm) Date Time Circumstances
Mount Isa The Gap
1-hour
0.504 0.366 0.328 0.292 0.284 0.284 0.278 0.275 0.274 0.272 0.271 0.260 0.244 0.237 0.234 0.232 0.231 0.228 0.228 0.222 0.221 0.220 0.218 0.216 0.215 0.213 0.210 0.206 0.206 0.202
Jul 4 Apr 5
Jan 10 Aug 1 Jun 23 Jan 1 Jun 6
May 27 Jul 4 Jul 3
Oct 25 Dec 8 Dec 5 Jun 21 Jun 30 Nov 11 Jan 2
Dec 31 May 27 Sep 24 Jan 22 Apr 5 Oct 2
Dec 17 Sep 24 Feb 3
Sep 23 Jun 5 Jun 5 Jul 4
12 10 10 15 15 21 11 14 17 16 18 14 10 15 12 14 16 10 13 20 10 11 15 23 15 13 15 17 16 16
All exceedances at The Gap monitoring site were due to industry emissions.
Mount Isa Menzies
24-hour
0.111
Feb 29
24
Exceedance due to industry emissions.
AAQ NEPM standards for SO2: 0.20 ppm (1-hour average); 0.08 ppm (24-hour average); 0.02 ppm (1-year average). AAQ NEPM goals for SO2: 1-hour average and 24-hour average standards exceeded on no more than one day per year.
Table 11. 2016 PM10 exceedances
Region/performance monitoring station
Standard Concentration
(µg/m3) Date Time Circumstances
Mount Isa The Gap
24-hour
350.8
Jan 15
24
Dust storm.
AAQ NEPM standard for PM10: 50 µg/m3 (24-hour average); 25 µg/m3 (1-year average). PM10 monitoring data determined as being directly associated with an exceptional event (e.g. dust storm) is excluded from reporting compliance with the PM10 24-hour goal.
Department of Science, Information Technology and Innovation
20
Summaries of maximum and second-highest pollutant concentrations
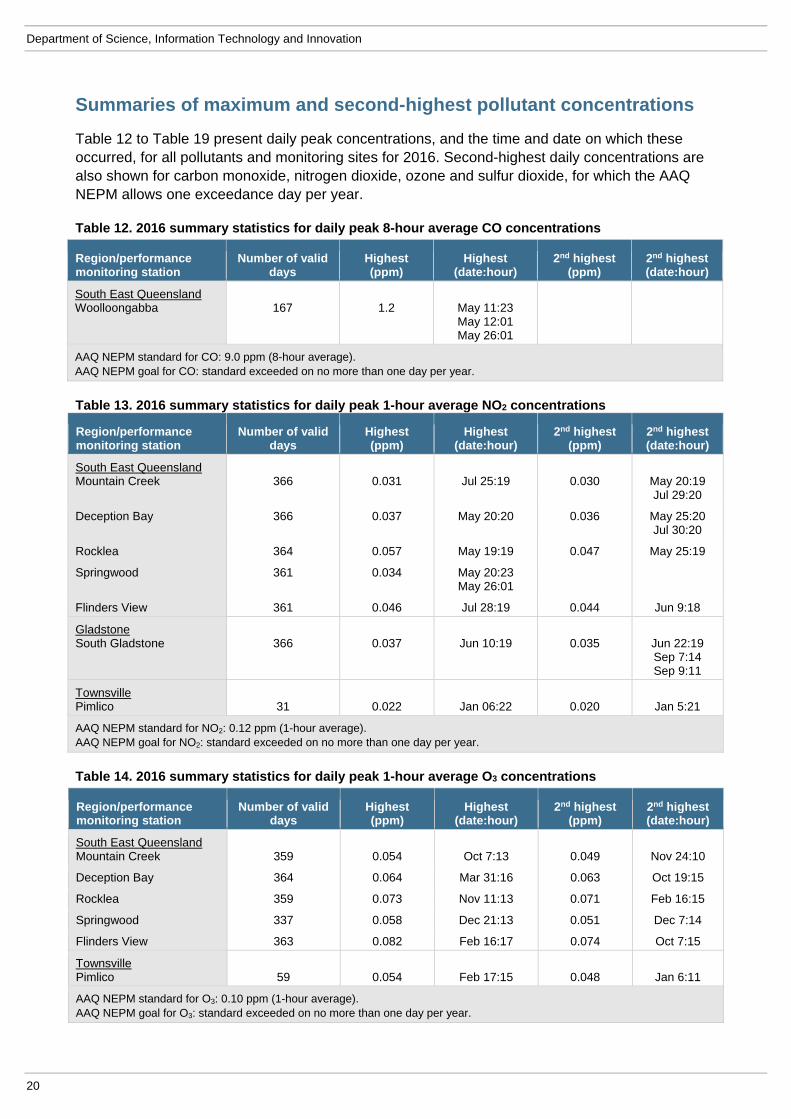
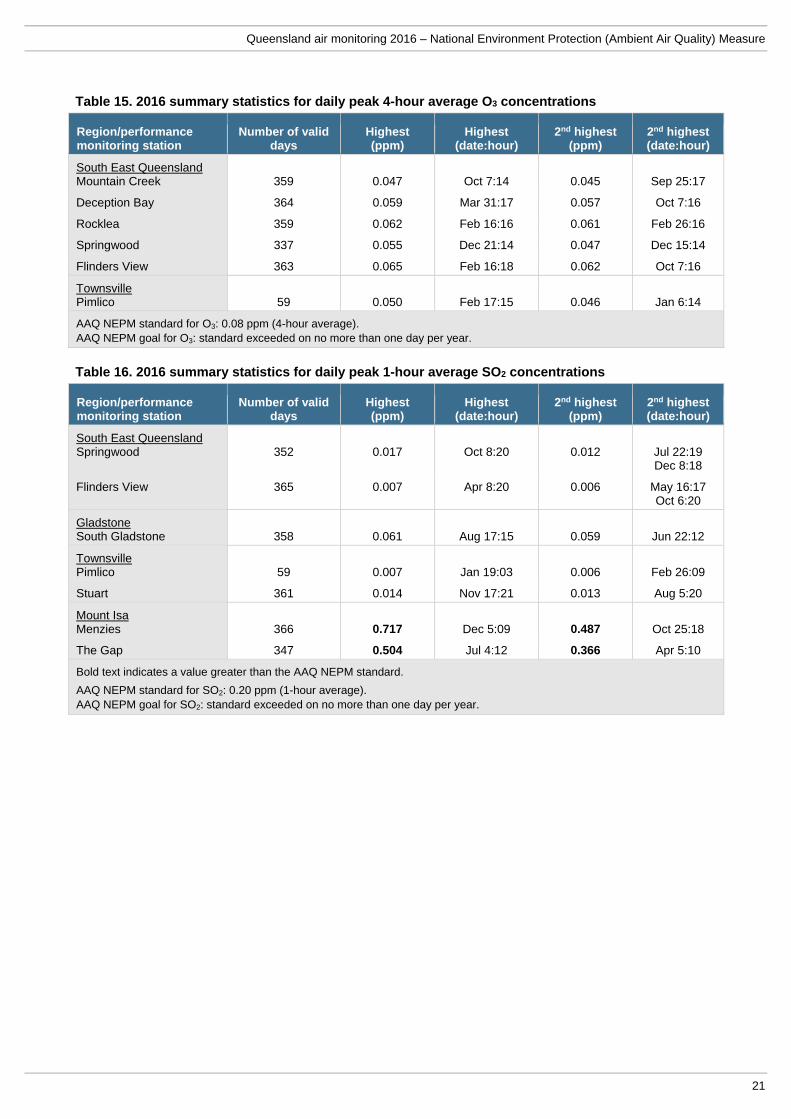
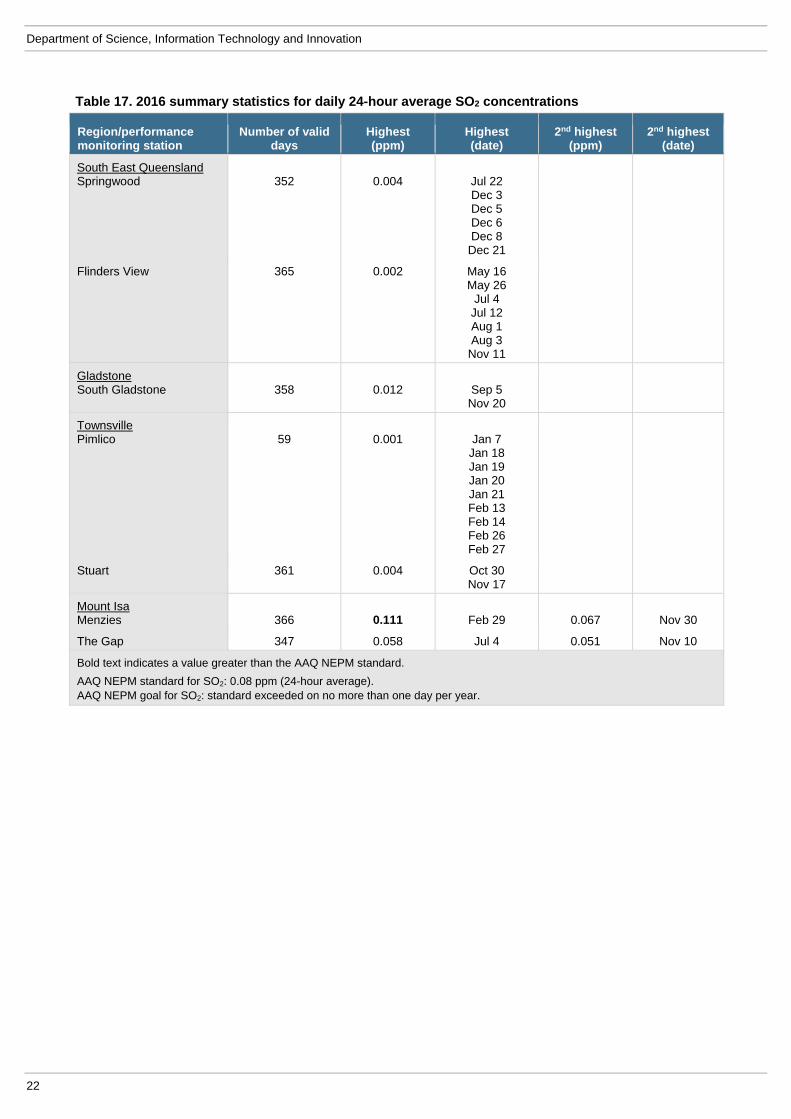
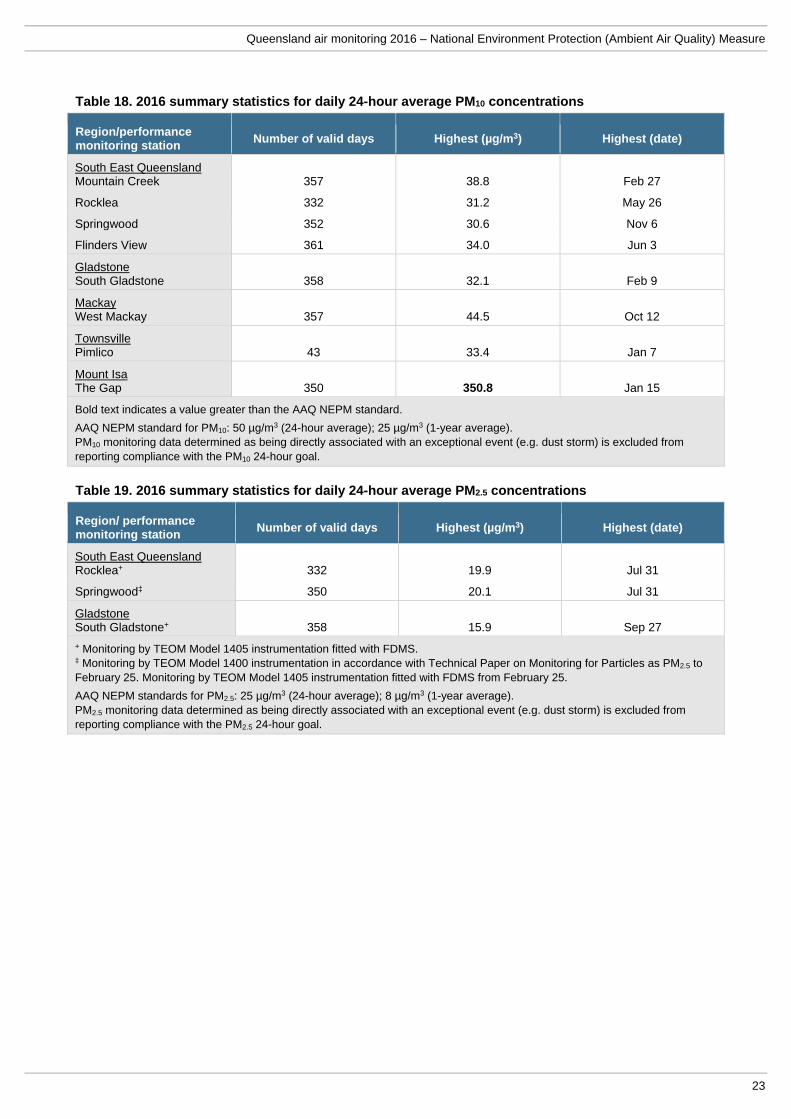
Table 12 to Table 19 present daily peak concentrations, and the time and date on which these occurred, for all pollutants and monitoring sites for 2016. Second-highest daily concentrations are also shown for carbon monoxide, nitrogen dioxide, ozone and sulfur dioxide, for which the AAQ NEPM allows one exceedance day per year.
Table 12. 2016 summary statistics for daily peak 8-hour average CO concentrations
Region/performance monitoring station
Number of valid days
Highest (ppm)
Highest (date:hour)
2nd highest (ppm)
2nd highest (date:hour)
South East Queensland Woolloongabba
167
1.2
May 11:23 May 12:01 May 26:01
AAQ NEPM standard for CO: 9.0 ppm (8-hour average). AAQ NEPM goal for CO: standard exceeded on no more than one day per year.
Table 13. 2016 summary statistics for daily peak 1-hour average NO2 concentrations
Region/performance monitoring station
Number of valid days
Highest (ppm)
Highest (date:hour)
2nd highest (ppm)
2nd highest (date:hour)
South East Queensland Mountain Creek
366
0.031
Jul 25:19
0.030
May 20:19 Jul 29:20
Deception Bay 366 0.037 May 20:20 0.036 May 25:20 Jul 30:20
Rocklea 364 0.057 May 19:19 0.047 May 25:19
Springwood 361 0.034 May 20:23 May 26:01
Flinders View 361 0.046 Jul 28:19 0.044 Jun 9:18
Gladstone South Gladstone
366
0.037
Jun 10:19
0.035
Jun 22:19 Sep 7:14 Sep 9:11
Townsville Pimlico 31 0.022 Jan 06:22 0.020 Jan 5:21
AAQ NEPM standard for NO2: 0.12 ppm (1-hour average). AAQ NEPM goal for NO2: standard exceeded on no more than one day per year.
Table 14. 2016 summary statistics for daily peak 1-hour average O3 concentrations
Region/performance monitoring station
Number of valid days
Highest (ppm)
Highest (date:hour)
2nd highest (ppm)
2nd highest (date:hour)
South East Queensland Mountain Creek
359
0.054
Oct 7:13
0.049
Nov 24:10
Deception Bay 364 0.064 Mar 31:16 0.063 Oct 19:15
Rocklea 359 0.073 Nov 11:13 0.071 Feb 16:15
Springwood 337 0.058 Dec 21:13 0.051 Dec 7:14
Flinders View 363 0.082 Feb 16:17 0.074 Oct 7:15
Townsville Pimlico 59 0.054 Feb 17:15 0.048 Jan 6:11
AAQ NEPM standard for O3: 0.10 ppm (1-hour average). AAQ NEPM goal for O3: standard exceeded on no more than one day per year.
Queensland air monitoring 2016 – National Environment Protection (Ambient Air Quality) Measure
21
Table 15. 2016 summary statistics for daily peak 4-hour average O3 concentrations
Region/performance monitoring station
Number of valid days
Highest (ppm)
Highest (date:hour)
2nd highest (ppm)
2nd highest (date:hour)
South East Queensland Mountain Creek 359 0.047 Oct 7:14 0.045 Sep 25:17
Deception Bay 364 0.059 Mar 31:17 0.057 Oct 7:16
Rocklea 359 0.062 Feb 16:16 0.061 Feb 26:16
Springwood 337 0.055 Dec 21:14 0.047 Dec 15:14
Flinders View 363 0.065 Feb 16:18 0.062 Oct 7:16
Townsville Pimlico 59 0.050 Feb 17:15 0.046 Jan 6:14
AAQ NEPM standard for O3: 0.08 ppm (4-hour average). AAQ NEPM goal for O3: standard exceeded on no more than one day per year.
Table 16. 2016 summary statistics for daily peak 1-hour average SO2 concentrations
Region/performance monitoring station
Number of valid days
Highest (ppm)
Highest (date:hour)
2nd highest (ppm)
2nd highest (date:hour)
South East Queensland Springwood
352
0.017
Oct 8:20
0.012
Jul 22:19 Dec 8:18
Flinders View 365 0.007 Apr 8:20 0.006 May 16:17 Oct 6:20
Gladstone South Gladstone 358 0.061 Aug 17:15 0.059 Jun 22:12
Townsville Pimlico
59
0.007
Jan 19:03
0.006
Feb 26:09
Stuart 361 0.014 Nov 17:21 0.013 Aug 5:20
Mount Isa Menzies 366 0.717 Dec 5:09 0.487 Oct 25:18
The Gap 347 0.504 Jul 4:12 0.366 Apr 5:10
Bold text indicates a value greater than the AAQ NEPM standard.
AAQ NEPM standard for SO2: 0.20 ppm (1-hour average). AAQ NEPM goal for SO2: standard exceeded on no more than one day per year.
Department of Science, Information Technology and Innovation
22
Table 17. 2016 summary statistics for daily 24-hour average SO2 concentrations
Region/performance monitoring station
Number of valid days
Highest (ppm)
Highest(date)
2nd highest (ppm)
2nd highest (date)
South East Queensland Springwood
352
0.004
Jul 22 Dec 3 Dec 5 Dec 6 Dec 8 Dec 21
Flinders View 365 0.002 May 16 May 26
Jul 4 Jul 12 Aug 1 Aug 3 Nov 11
Gladstone South Gladstone
358
0.012
Sep 5 Nov 20
Townsville Pimlico
59
0.001
Jan 7
Jan 18 Jan 19 Jan 20 Jan 21 Feb 13 Feb 14 Feb 26 Feb 27
Stuart 361 0.004 Oct 30 Nov 17
Mount Isa Menzies 366 0.111 Feb 29 0.067 Nov 30
The Gap 347 0.058 Jul 4 0.051 Nov 10
Bold text indicates a value greater than the AAQ NEPM standard.
AAQ NEPM standard for SO2: 0.08 ppm (24-hour average). AAQ NEPM goal for SO2: standard exceeded on no more than one day per year.
Queensland air monitoring 2016 – National Environment Protection (Ambient Air Quality) Measure
23
Table 18. 2016 summary statistics for daily 24-hour average PM10 concentrations
Region/performance monitoring station
Number of valid days Highest (µg/m3) Highest (date)
South East Queensland Mountain Creek 357 38.8 Feb 27
Rocklea 332 31.2 May 26
Springwood 352 30.6 Nov 6
Flinders View 361 34.0 Jun 3
Gladstone South Gladstone 358 32.1 Feb 9
Mackay West Mackay 357 44.5 Oct 12
Townsville Pimlico 43 33.4 Jan 7
Mount Isa The Gap 350 350.8 Jan 15
Bold text indicates a value greater than the AAQ NEPM standard.
AAQ NEPM standard for PM10: 50 µg/m3 (24-hour average); 25 µg/m3 (1-year average). PM10 monitoring data determined as being directly associated with an exceptional event (e.g. dust storm) is excluded from reporting compliance with the PM10 24-hour goal.
Table 19. 2016 summary statistics for daily 24-hour average PM2.5 concentrations
Region/ performance monitoring station
Number of valid days Highest (µg/m3) Highest (date)
South East Queensland Rocklea+ 332 19.9 Jul 31
Springwood‡ 350 20.1 Jul 31
Gladstone South Gladstone+ 358 15.9 Sep 27
+ Monitoring by TEOM Model 1405 instrumentation fitted with FDMS. ‡ Monitoring by TEOM Model 1400 instrumentation in accordance with Technical Paper on Monitoring for Particles as PM2.5 to February 25. Monitoring by TEOM Model 1405 instrumentation fitted with FDMS from February 25.
AAQ NEPM standards for PM2.5: 25 µg/m3 (24-hour average); 8 µg/m3 (1-year average). PM2.5 monitoring data determined as being directly associated with an exceptional event (e.g. dust storm) is excluded from reporting compliance with the PM2.5 24-hour goal.
Department of Science, Information Technology and Innovation
24
Section D – Pollutant distribution and trends
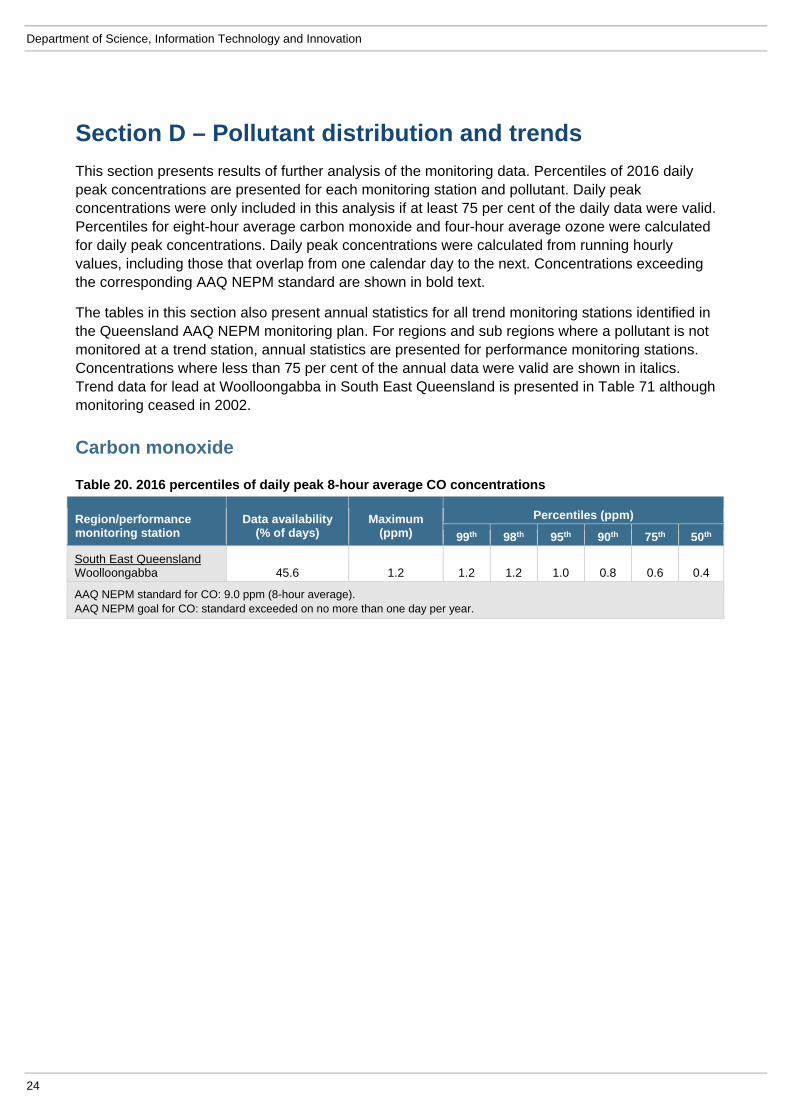
This section presents results of further analysis of the monitoring data. Percentiles of 2016 daily peak concentrations are presented for each monitoring station and pollutant. Daily peak concentrations were only included in this analysis if at least 75 per cent of the daily data were valid. Percentiles for eight-hour average carbon monoxide and four-hour average ozone were calculated for daily peak concentrations. Daily peak concentrations were calculated from running hourly values, including those that overlap from one calendar day to the next. Concentrations exceeding the corresponding AAQ NEPM standard are shown in bold text.
The tables in this section also present annual statistics for all trend monitoring stations identified in the Queensland AAQ NEPM monitoring plan. For regions and sub regions where a pollutant is not monitored at a trend station, annual statistics are presented for performance monitoring stations. Concentrations where less than 75 per cent of the annual data were valid are shown in italics. Trend data for lead at Woolloongabba in South East Queensland is presented in Table 71 although monitoring ceased in 2002.
Carbon monoxide
Table 20. 2016 percentiles of daily peak 8-hour average CO concentrations
Region/performance monitoring station
Data availability (% of days)
Maximum (ppm)
Percentiles (ppm)
99th 98th 95th 90th 75th 50th
South East Queensland Woolloongabba 45.6 1.2 1.2 1.2 1.0 0.8 0.6 0.4
AAQ NEPM standard for CO: 9.0 ppm (8-hour average). AAQ NEPM goal for CO: standard exceeded on no more than one day per year.
Queensland air monitoring 2016 – National Environment Protection (Ambient Air Quality) Measure
25
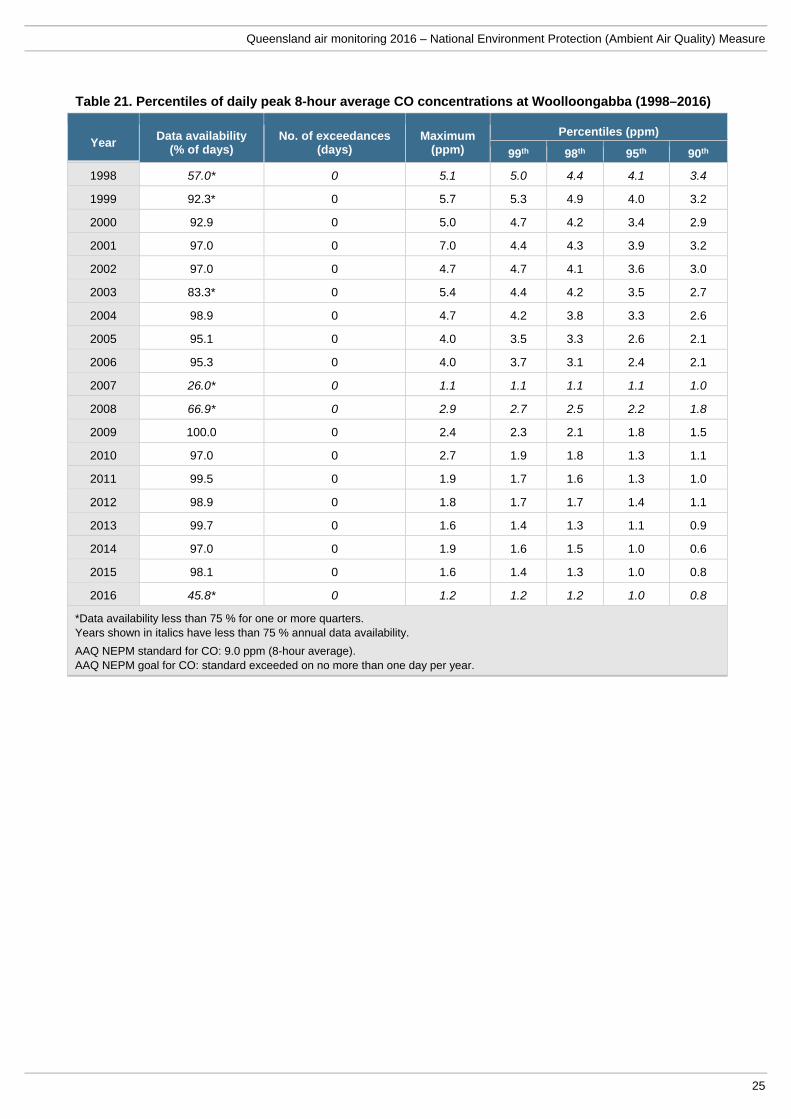
Table 21. Percentiles of daily peak 8-hour average CO concentrations at Woolloongabba (1998–2016)
Year Data availability
(% of days) No. of exceedances
(days) Maximum
(ppm)
Percentiles (ppm)
99th 98th 95th 90th
1998 57.0* 0 5.1 5.0 4.4 4.1 3.4
1999 92.3* 0 5.7 5.3 4.9 4.0 3.2
2000 92.9 0 5.0 4.7 4.2 3.4 2.9
2001 97.0 0 7.0 4.4 4.3 3.9 3.2
2002 97.0 0 4.7 4.7 4.1 3.6 3.0
2003 83.3* 0 5.4 4.4 4.2 3.5 2.7
2004 98.9 0 4.7 4.2 3.8 3.3 2.6
2005 95.1 0 4.0 3.5 3.3 2.6 2.1
2006 95.3 0 4.0 3.7 3.1 2.4 2.1
2007 26.0* 0 1.1 1.1 1.1 1.1 1.0
2008 66.9* 0 2.9 2.7 2.5 2.2 1.8
2009 100.0 0 2.4 2.3 2.1 1.8 1.5
2010 97.0 0 2.7 1.9 1.8 1.3 1.1
2011 99.5 0 1.9 1.7 1.6 1.3 1.0
2012 98.9 0 1.8 1.7 1.7 1.4 1.1
2013 99.7 0 1.6 1.4 1.3 1.1 0.9
2014 97.0 0 1.9 1.6 1.5 1.0 0.6
2015 98.1 0 1.6 1.4 1.3 1.0 0.8
2016 45.8* 0 1.2 1.2 1.2 1.0 0.8
*Data availability less than 75 % for one or more quarters. Years shown in italics have less than 75 % annual data availability.
AAQ NEPM standard for CO: 9.0 ppm (8-hour average). AAQ NEPM goal for CO: standard exceeded on no more than one day per year.

Department of Science, Information Technology and Innovation
26
Table 22. Percentiles of daily peak 8-hour average CO concentrations at North Toowoomba (2003–2010)
Year Data availability
(% of days) No. of exceedances
(days) Maximum
(ppm)
Percentiles (ppm)
99th 98th 95th 90th
2003 42.4* 0 2.6 2.5 2.3 2.2 1.9
2004 97.0 0 3.4 2.8 2.5 2.0 1.5
2005 99.5 0 2.3 1.8 1.7 1.1 0.7
2006 95.3 0 1.9 1.8 1.7 1.3 1.1
2007 97.5 0 2.2 1.8 1.6 1.0 0.4
2008 98.4 0 1.9 1.7 1.5 1.1 0.8
2009 100.0 0 1.8 1.4 1.2 1.0 0.7
2010 92.6* 0 1.7 1.5 1.3 0.9 0.5
*Data availability less than 75 % for one or more quarters. Years shown in italics have less than 75 % annual data availability.
AAQ NEPM standard for CO: 9.0 ppm (8-hour average). AAQ NEPM goal for CO: standard exceeded on no more than one day per year.
Nitrogen dioxide
Table 23. 2016 percentiles of daily peak 1-hour average NO2 concentrations
Region/performance monitoring station
Data availability (% of days)
Maximum (ppm)
Percentiles (ppm)
99th 98th 95th 90th 75th 50th
South East Queensland Mountain Creek 100.0 0.031 0.029 0.026 0.023 0.021 0.015 0.008
Deception Bay 100.0 0.037 0.035 0.034 0.030 0.026 0.019 0.013
Rocklea 99.5 0.057 0.037 0.034 0.028 0.025 0.019 0.014
Springwood 98.6 0.034 0.032 0.031 0.028 0.027 0.022 0.015
Flinders View 98.6 0.046 0.040 0.038 0.033 0.029 0.023 0.016
Gladstone South Gladstone 100.0 0.037 0.035 0.032 0.029 0.026 0.019 0.013
Townsville Pimlico 8.5 0.022 0.022 0.022 0.020 0.015 0.008 0.006
AAQ NEPM standard for NO2: 0.12 ppm (1-hour average). AAQ NEPM goal for NO2: standard exceeded on no more than one day per year.
Queensland air monitoring 2016 – National Environment Protection (Ambient Air Quality) Measure
27
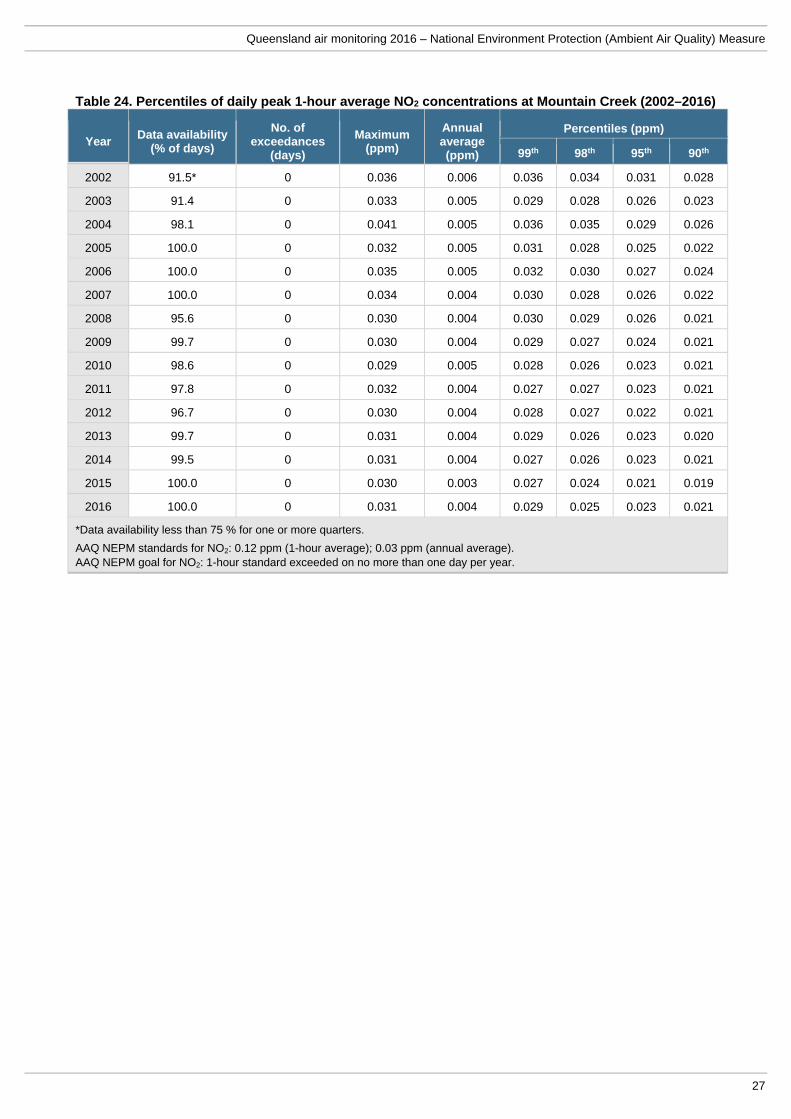
Table 24. Percentiles of daily peak 1-hour average NO2 concentrations at Mountain Creek (2002–2016)
Year Data availability
(% of days)
No. of exceedances
(days)
Maximum (ppm)
Annual average (ppm)
Percentiles (ppm)
99th 98th 95th 90th
2002 91.5* 0 0.036 0.006 0.036 0.034 0.031 0.028
2003 91.4 0 0.033 0.005 0.029 0.028 0.026 0.023
2004 98.1 0 0.041 0.005 0.036 0.035 0.029 0.026
2005 100.0 0 0.032 0.005 0.031 0.028 0.025 0.022
2006 100.0 0 0.035 0.005 0.032 0.030 0.027 0.024
2007 100.0 0 0.034 0.004 0.030 0.028 0.026 0.022
2008 95.6 0 0.030 0.004 0.030 0.029 0.026 0.021
2009 99.7 0 0.030 0.004 0.029 0.027 0.024 0.021
2010 98.6 0 0.029 0.005 0.028 0.026 0.023 0.021
2011 97.8 0 0.032 0.004 0.027 0.027 0.023 0.021
2012 96.7 0 0.030 0.004 0.028 0.027 0.022 0.021
2013 99.7 0 0.031 0.004 0.029 0.026 0.023 0.020
2014 99.5 0 0.031 0.004 0.027 0.026 0.023 0.021
2015 100.0 0 0.030 0.003 0.027 0.024 0.021 0.019
2016 100.0 0 0.031 0.004 0.029 0.025 0.023 0.021
*Data availability less than 75 % for one or more quarters.
AAQ NEPM standards for NO2: 0.12 ppm (1-hour average); 0.03 ppm (annual average). AAQ NEPM goal for NO2: 1-hour standard exceeded on no more than one day per year.
Department of Science, Information Technology and Innovation
28
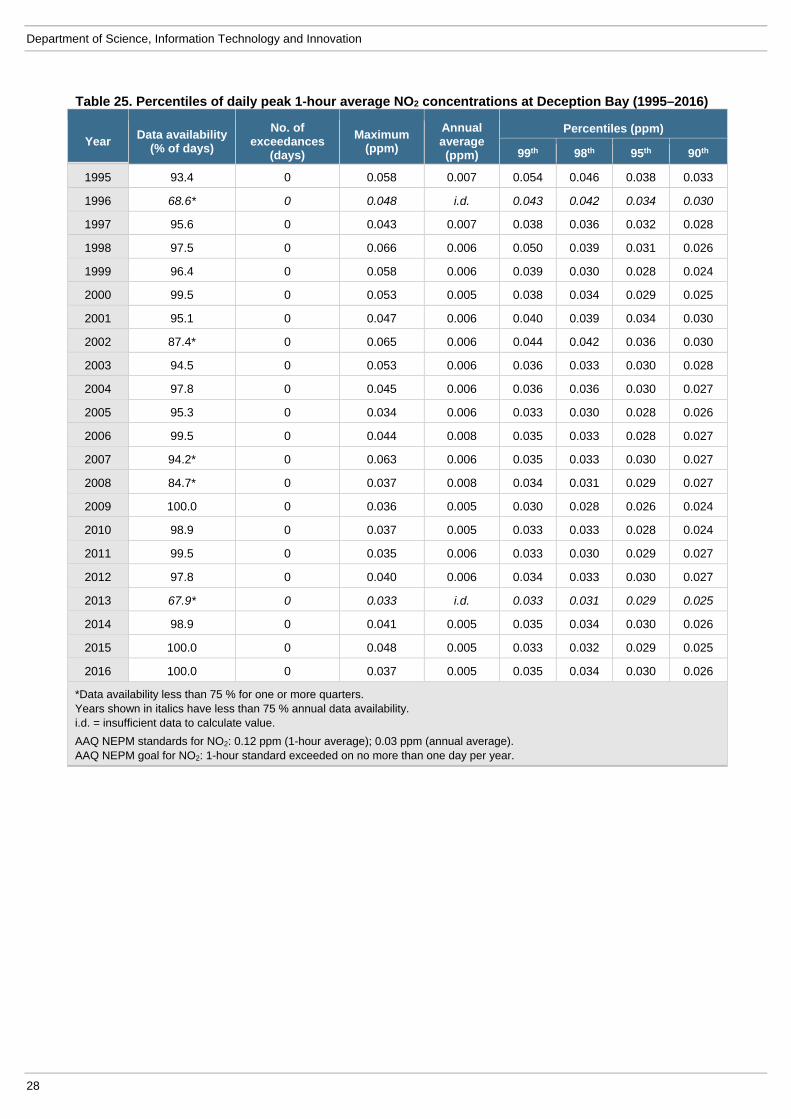
Table 25. Percentiles of daily peak 1-hour average NO2 concentrations at Deception Bay (1995–2016)
Year Data availability
(% of days)
No. of exceedances
(days)
Maximum (ppm)
Annual average (ppm)
Percentiles (ppm)
99th 98th 95th 90th
1995 93.4 0 0.058 0.007 0.054 0.046 0.038 0.033
1996 68.6* 0 0.048 i.d. 0.043 0.042 0.034 0.030
1997 95.6 0 0.043 0.007 0.038 0.036 0.032 0.028
1998 97.5 0 0.066 0.006 0.050 0.039 0.031 0.026
1999 96.4 0 0.058 0.006 0.039 0.030 0.028 0.024
2000 99.5 0 0.053 0.005 0.038 0.034 0.029 0.025
2001 95.1 0 0.047 0.006 0.040 0.039 0.034 0.030
2002 87.4* 0 0.065 0.006 0.044 0.042 0.036 0.030
2003 94.5 0 0.053 0.006 0.036 0.033 0.030 0.028
2004 97.8 0 0.045 0.006 0.036 0.036 0.030 0.027
2005 95.3 0 0.034 0.006 0.033 0.030 0.028 0.026
2006 99.5 0 0.044 0.008 0.035 0.033 0.028 0.027
2007 94.2* 0 0.063 0.006 0.035 0.033 0.030 0.027
2008 84.7* 0 0.037 0.008 0.034 0.031 0.029 0.027
2009 100.0 0 0.036 0.005 0.030 0.028 0.026 0.024
2010 98.9 0 0.037 0.005 0.033 0.033 0.028 0.024
2011 99.5 0 0.035 0.006 0.033 0.030 0.029 0.027
2012 97.8 0 0.040 0.006 0.034 0.033 0.030 0.027
2013 67.9* 0 0.033 i.d. 0.033 0.031 0.029 0.025
2014 98.9 0 0.041 0.005 0.035 0.034 0.030 0.026
2015 100.0 0 0.048 0.005 0.033 0.032 0.029 0.025
2016 100.0 0 0.037 0.005 0.035 0.034 0.030 0.026
*Data availability less than 75 % for one or more quarters. Years shown in italics have less than 75 % annual data availability. i.d. = insufficient data to calculate value.
AAQ NEPM standards for NO2: 0.12 ppm (1-hour average); 0.03 ppm (annual average). AAQ NEPM goal for NO2: 1-hour standard exceeded on no more than one day per year.
Queensland air monitoring 2016 – National Environment Protection (Ambient Air Quality) Measure
29
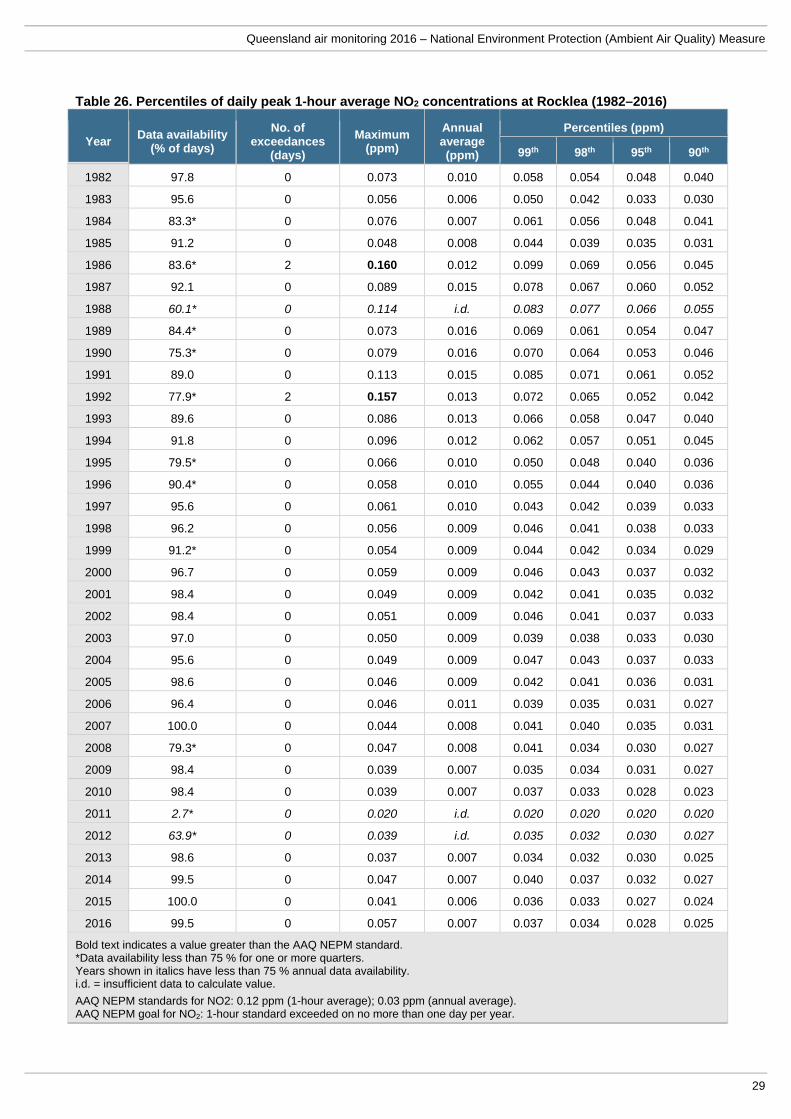
Table 26. Percentiles of daily peak 1-hour average NO2 concentrations at Rocklea (1982–2016)
Year Data availability
(% of days)
No. of exceedances
(days)
Maximum (ppm)
Annual average (ppm)
Percentiles (ppm)
99th 98th 95th 90th
1982 97.8 0 0.073 0.010 0.058 0.054 0.048 0.040
1983 95.6 0 0.056 0.006 0.050 0.042 0.033 0.030
1984 83.3* 0 0.076 0.007 0.061 0.056 0.048 0.041
1985 91.2 0 0.048 0.008 0.044 0.039 0.035 0.031
1986 83.6* 2 0.160 0.012 0.099 0.069 0.056 0.045
1987 92.1 0 0.089 0.015 0.078 0.067 0.060 0.052
1988 60.1* 0 0.114 i.d. 0.083 0.077 0.066 0.055
1989 84.4* 0 0.073 0.016 0.069 0.061 0.054 0.047
1990 75.3* 0 0.079 0.016 0.070 0.064 0.053 0.046
1991 89.0 0 0.113 0.015 0.085 0.071 0.061 0.052
1992 77.9* 2 0.157 0.013 0.072 0.065 0.052 0.042
1993 89.6 0 0.086 0.013 0.066 0.058 0.047 0.040
1994 91.8 0 0.096 0.012 0.062 0.057 0.051 0.045
1995 79.5* 0 0.066 0.010 0.050 0.048 0.040 0.036
1996 90.4* 0 0.058 0.010 0.055 0.044 0.040 0.036
1997 95.6 0 0.061 0.010 0.043 0.042 0.039 0.033
1998 96.2 0 0.056 0.009 0.046 0.041 0.038 0.033
1999 91.2* 0 0.054 0.009 0.044 0.042 0.034 0.029
2000 96.7 0 0.059 0.009 0.046 0.043 0.037 0.032
2001 98.4 0 0.049 0.009 0.042 0.041 0.035 0.032
2002 98.4 0 0.051 0.009 0.046 0.041 0.037 0.033
2003 97.0 0 0.050 0.009 0.039 0.038 0.033 0.030
2004 95.6 0 0.049 0.009 0.047 0.043 0.037 0.033
2005 98.6 0 0.046 0.009 0.042 0.041 0.036 0.031
2006 96.4 0 0.046 0.011 0.039 0.035 0.031 0.027
2007 100.0 0 0.044 0.008 0.041 0.040 0.035 0.031
2008 79.3* 0 0.047 0.008 0.041 0.034 0.030 0.027
2009 98.4 0 0.039 0.007 0.035 0.034 0.031 0.027
2010 98.4 0 0.039 0.007 0.037 0.033 0.028 0.023
2011 2.7* 0 0.020 i.d. 0.020 0.020 0.020 0.020
2012 63.9* 0 0.039 i.d. 0.035 0.032 0.030 0.027
2013 98.6 0 0.037 0.007 0.034 0.032 0.030 0.025
2014 99.5 0 0.047 0.007 0.040 0.037 0.032 0.027
2015 100.0 0 0.041 0.006 0.036 0.033 0.027 0.024
2016 99.5 0 0.057 0.007 0.037 0.034 0.028 0.025
Bold text indicates a value greater than the AAQ NEPM standard. *Data availability less than 75 % for one or more quarters. Years shown in italics have less than 75 % annual data availability. i.d. = insufficient data to calculate value.
AAQ NEPM standards for NO2: 0.12 ppm (1-hour average); 0.03 ppm (annual average). AAQ NEPM goal for NO2: 1-hour standard exceeded on no more than one day per year.
Department of Science, Information Technology and Innovation
30
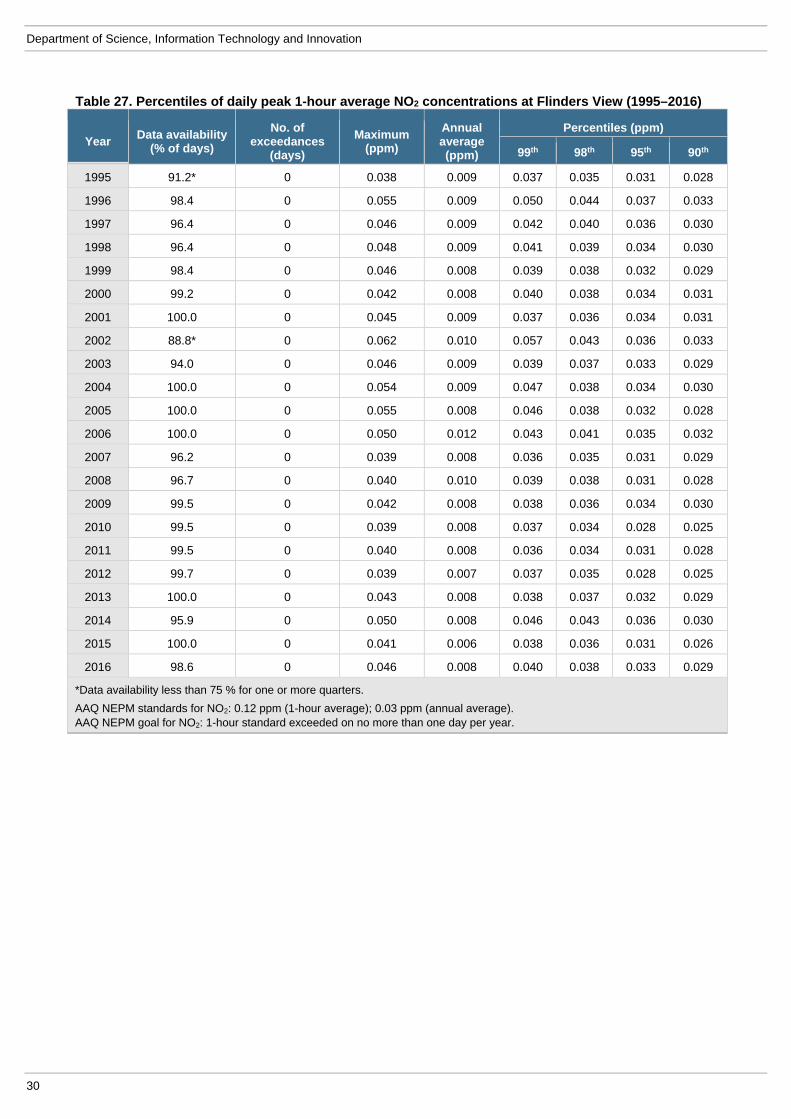
Table 27. Percentiles of daily peak 1-hour average NO2 concentrations at Flinders View (1995–2016)
Year Data availability
(% of days)
No. of exceedances
(days)
Maximum (ppm)
Annual average (ppm)
Percentiles (ppm)
99th 98th 95th 90th
1995 91.2* 0 0.038 0.009 0.037 0.035 0.031 0.028
1996 98.4 0 0.055 0.009 0.050 0.044 0.037 0.033
1997 96.4 0 0.046 0.009 0.042 0.040 0.036 0.030
1998 96.4 0 0.048 0.009 0.041 0.039 0.034 0.030
1999 98.4 0 0.046 0.008 0.039 0.038 0.032 0.029
2000 99.2 0 0.042 0.008 0.040 0.038 0.034 0.031
2001 100.0 0 0.045 0.009 0.037 0.036 0.034 0.031
2002 88.8* 0 0.062 0.010 0.057 0.043 0.036 0.033
2003 94.0 0 0.046 0.009 0.039 0.037 0.033 0.029
2004 100.0 0 0.054 0.009 0.047 0.038 0.034 0.030
2005 100.0 0 0.055 0.008 0.046 0.038 0.032 0.028
2006 100.0 0 0.050 0.012 0.043 0.041 0.035 0.032
2007 96.2 0 0.039 0.008 0.036 0.035 0.031 0.029
2008 96.7 0 0.040 0.010 0.039 0.038 0.031 0.028
2009 99.5 0 0.042 0.008 0.038 0.036 0.034 0.030
2010 99.5 0 0.039 0.008 0.037 0.034 0.028 0.025
2011 99.5 0 0.040 0.008 0.036 0.034 0.031 0.028
2012 99.7 0 0.039 0.007 0.037 0.035 0.028 0.025
2013 100.0 0 0.043 0.008 0.038 0.037 0.032 0.029
2014 95.9 0 0.050 0.008 0.046 0.043 0.036 0.030
2015 100.0 0 0.041 0.006 0.038 0.036 0.031 0.026
2016 98.6 0 0.046 0.008 0.040 0.038 0.033 0.029
*Data availability less than 75 % for one or more quarters.
AAQ NEPM standards for NO2: 0.12 ppm (1-hour average); 0.03 ppm (annual average). AAQ NEPM goal for NO2: 1-hour standard exceeded on no more than one day per year.
Queensland air monitoring 2016 – National Environment Protection (Ambient Air Quality) Measure
31
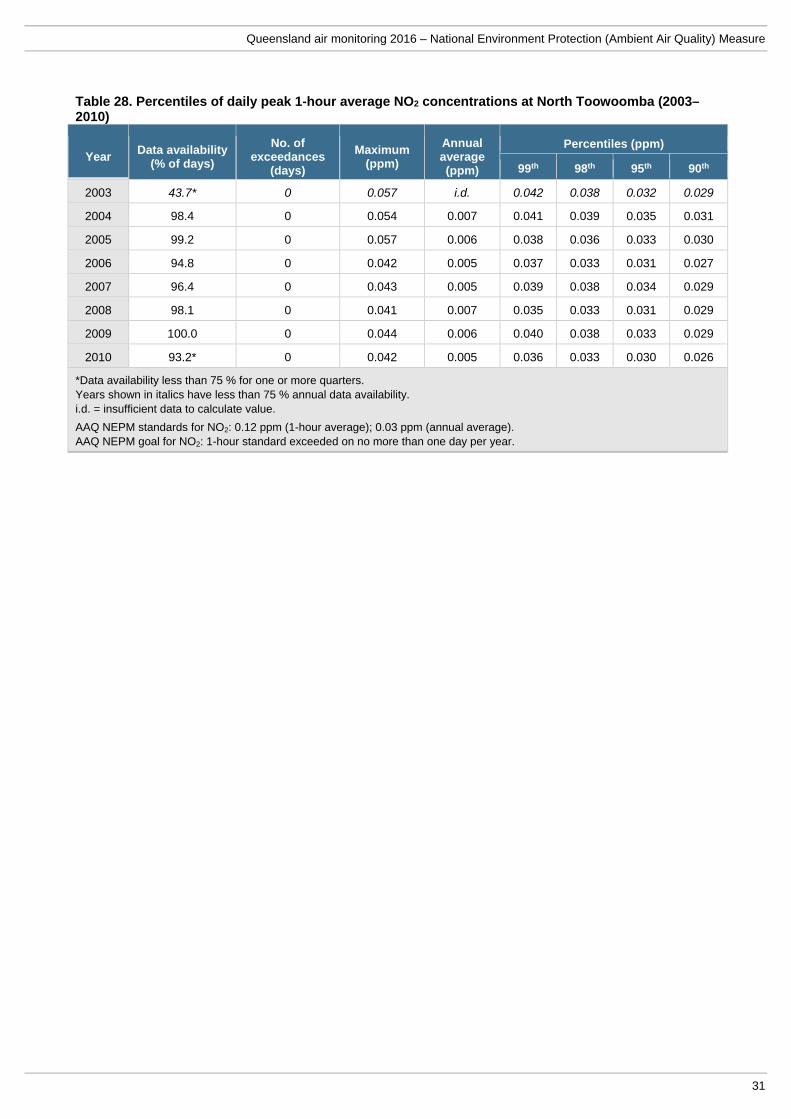
Table 28. Percentiles of daily peak 1-hour average NO2 concentrations at North Toowoomba (2003–2010)
Year Data availability
(% of days)
No. of exceedances
(days)
Maximum (ppm)
Annual average (ppm)
Percentiles (ppm)
99th 98th 95th 90th
2003 43.7* 0 0.057 i.d. 0.042 0.038 0.032 0.029
2004 98.4 0 0.054 0.007 0.041 0.039 0.035 0.031
2005 99.2 0 0.057 0.006 0.038 0.036 0.033 0.030
2006 94.8 0 0.042 0.005 0.037 0.033 0.031 0.027
2007 96.4 0 0.043 0.005 0.039 0.038 0.034 0.029
2008 98.1 0 0.041 0.007 0.035 0.033 0.031 0.029
2009 100.0 0 0.044 0.006 0.040 0.038 0.033 0.029
2010 93.2* 0 0.042 0.005 0.036 0.033 0.030 0.026
*Data availability less than 75 % for one or more quarters. Years shown in italics have less than 75 % annual data availability. i.d. = insufficient data to calculate value.
AAQ NEPM standards for NO2: 0.12 ppm (1-hour average); 0.03 ppm (annual average). AAQ NEPM goal for NO2: 1-hour standard exceeded on no more than one day per year.

Department of Science, Information Technology and Innovation
32
Table 29. Percentiles of daily peak 1-hour average NO2 concentrations at South Gladstone (1994–2016)
Year Data availability
(% of days)
No. of exceedances
(days)
Maximum (ppm)
Annual average (ppm)
Percentiles (ppm)
99th 98th 95th 90th
1994 81.6* 0 0.049 0.005 0.047 0.044 0.038 0.028
1995 91.8 0 0.038 0.005 0.030 0.028 0.025 0.022
1996 84.2* 0 0.045 0.006 0.039 0.035 0.032 0.029
1997 65.8* 0 0.031 i.d. 0.030 0.029 0.022 0.017
1998 72.9* 0 0.022 i.d. 0.020 0.018 0.015 0.012
1999 88.8* 0 0.034 0.003 0.029 0.029 0.025 0.021
2000 97.8 0 0.031 0.003 0.025 0.024 0.022 0.019
2001 96.4 0 0.048 0.004 0.033 0.031 0.026 0.023
2002 98.4 0 0.036 0.004 0.031 0.029 0.026 0.021
2003 95.3 0 0.035 0.004 0.030 0.027 0.024 0.022
2004 100.0 0 0.042 0.004 0.030 0.029 0.026 0.023
2005 99.7 0 0.035 0.004 0.030 0.028 0.024 0.022
2006 100.0 0 0.034 0.003 0.027 0.027 0.024 0.021
2007 98.4 0 0.035 0.005 0.030 0.029 0.027 0.024
2008 98.6 0 0.033 0.003 0.030 0.026 0.023 0.020
2009 97.5 0 0.033 0.006 0.029 0.028 0.025 0.022
2010 98.4 0 0.033 0.006 0.031 0.029 0.026 0.023
2011 96.7 0 0.035 0.006 0.034 0.032 0.029 0.026
2012 94.0* 0 0.042 0.007 0.037 0.035 0.032 0.029
2013 95.3 0 0.042 0.007 0.037 0.035 0.032 0.027
2014 99.7 0 0.046 0.005 0.033 0.032 0.029 0.025
2015 99.7 0 0.043 0.005 0.036 0.032 0.028 0.025
2016 100.0 0 0.037 0.005 0.035 0.032 0.029 0.026
*Data availability less than 75 % for one or more quarters. Years shown in italics have less than 75 % annual data availability. i.d. = insufficient data to calculate value.
AAQ NEPM standards for NO2: 0.12 ppm (1-hour average); 0.03 ppm (annual average). AAQ NEPM goal for NO2: 1-hour standard exceeded on no more than one day per year.

Queensland air monitoring 2016 – National Environment Protection (Ambient Air Quality) Measure
33
Table 30. Percentiles of daily peak 1-hour average NO2 concentrations at Pimlico (2004–2016)
Year Data availability
(% of days)
No. of exceedances
(days)
Maximum (ppm)
Annual average (ppm)
Percentiles (ppm)
99th 98th 95th 90th
2004 59.0* 0 0.034 i.d. 0.032 0.031 0.030 0.027
2005 100.0 0 0.034 0.005 0.032 0.031 0.028 0.024
2006 98.6 0 0.034 0.006 0.032 0.029 0.025 0.022
2007 99.2 0 0.035 0.004 0.027 0.024 0.023 0.020
2008 100.0 0 0.030 0.006 0.028 0.027 0.025 0.023
2009 97.0 0 0.035 0.005 0.030 0.028 0.025 0.023
2010 99.5 0 0.032 0.005 0.028 0.026 0.023 0.020
2011 98.9 0 0.042 0.006 0.038 0.036 0.031 0.027
2012 99.5 0 0.034 0.005 0.031 0.028 0.026 0.022
2013 98.9 0 0.033 0.004 0.029 0.027 0.023 0.018
2014 99.7 0 0.031 0.004 0.030 0.029 0.026 0.020
2015 97.8 0 0.039 0.004 0.030 0.028 0.025 0.021
2016 8.5* 0 0.022 i.d. 0.022 0.022 0.020 0.015
*Data availability less than 75 % for one or more quarters. Years shown in italics have less than 75 % annual data availability. i.d. = insufficient data to calculate value.
AAQ NEPM standards for NO2: 0.12 ppm (1-hour average); 0.03 ppm (annual average). AAQ NEPM goal for NO2: 1-hour standard exceeded on no more than one day per year.
Ozone
Table 31. 2016 percentiles of daily peak 1-hour average O3 concentrations
Region/performance monitoring station
Data availability (% of days)
Maximum (ppm)
Percentiles (ppm)
99th 98th 95th 90th 75th 50th
South East Queensland Mountain Creek 98.1 0.054 0.045 0.042 0.040 0.036 0.032 0.028
Deception Bay 99.5 0.064 0.061 0.053 0.045 0.041 0.036 0.031
Rocklea 98.1 0.073 0.064 0.058 0.053 0.047 0.039 0.032
Springwood 92.1 0.058 0.049 0.043 0.041 0.037 0.030 0.026
Flinders View 99.2 0.082 0.066 0.062 0.056 0.050 0.042 0.034
Townsville Pimlico 16.1 0.054 0.054 0.054 0.045 0.040 0.029 0.021
AAQ NEPM standard for O3: 0.10 ppm (1-hour average). AAQ NEPM goal for O3: standard exceeded on no more than one day per year.
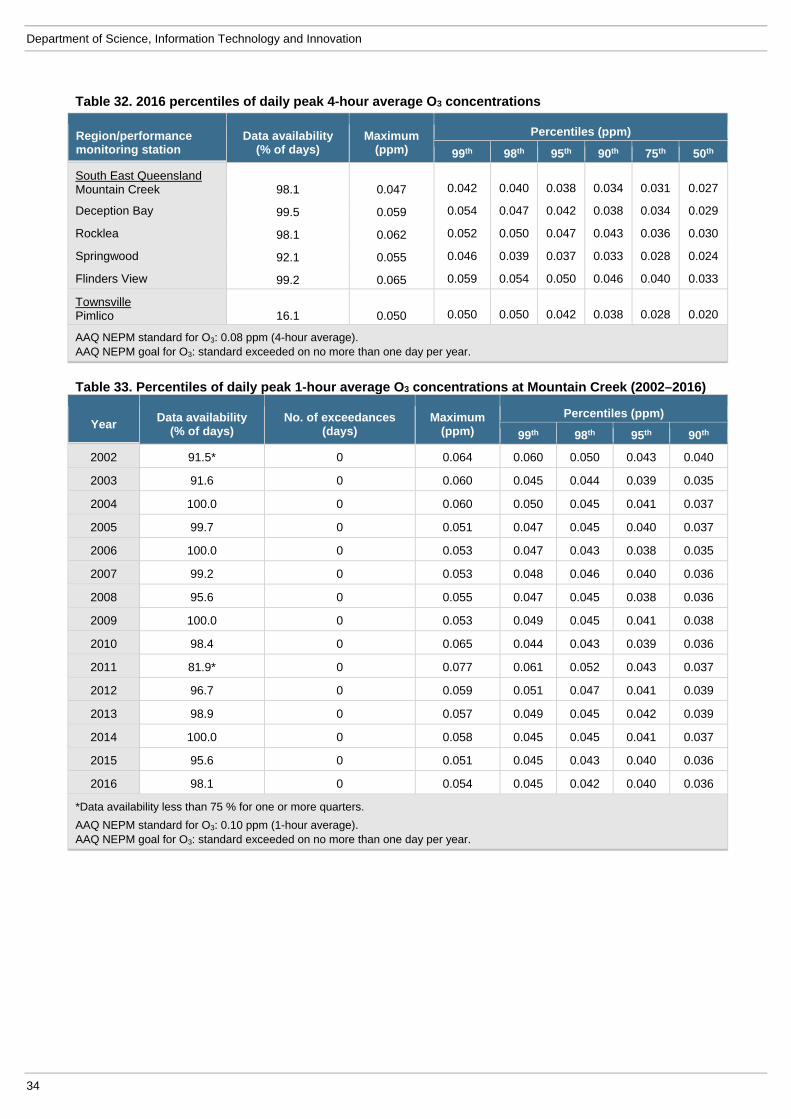
Department of Science, Information Technology and Innovation
34
Table 32. 2016 percentiles of daily peak 4-hour average O3 concentrations
Region/performance monitoring station
Data availability (% of days)
Maximum (ppm)
Percentiles (ppm)
99th 98th 95th 90th 75th 50th
South East Queensland Mountain Creek 98.1 0.047 0.042 0.040 0.038 0.034 0.031 0.027
Deception Bay 99.5 0.059 0.054 0.047 0.042 0.038 0.034 0.029
Rocklea 98.1 0.062 0.052 0.050 0.047 0.043 0.036 0.030
Springwood 92.1 0.055 0.046 0.039 0.037 0.033 0.028 0.024
Flinders View 99.2 0.065 0.059 0.054 0.050 0.046 0.040 0.033
Townsville Pimlico 16.1 0.050 0.050 0.050 0.042 0.038 0.028 0.020
AAQ NEPM standard for O3: 0.08 ppm (4-hour average). AAQ NEPM goal for O3: standard exceeded on no more than one day per year.
Table 33. Percentiles of daily peak 1-hour average O3 concentrations at Mountain Creek (2002–2016)
Year Data availability
(% of days) No. of exceedances
(days) Maximum
(ppm)
Percentiles (ppm)
99th 98th 95th 90th
2002 91.5* 0 0.064 0.060 0.050 0.043 0.040
2003 91.6 0 0.060 0.045 0.044 0.039 0.035
2004 100.0 0 0.060 0.050 0.045 0.041 0.037
2005 99.7 0 0.051 0.047 0.045 0.040 0.037
2006 100.0 0 0.053 0.047 0.043 0.038 0.035
2007 99.2 0 0.053 0.048 0.046 0.040 0.036
2008 95.6 0 0.055 0.047 0.045 0.038 0.036
2009 100.0 0 0.053 0.049 0.045 0.041 0.038
2010 98.4 0 0.065 0.044 0.043 0.039 0.036
2011 81.9* 0 0.077 0.061 0.052 0.043 0.037
2012 96.7 0 0.059 0.051 0.047 0.041 0.039
2013 98.9 0 0.057 0.049 0.045 0.042 0.039
2014 100.0 0 0.058 0.045 0.045 0.041 0.037
2015 95.6 0 0.051 0.045 0.043 0.040 0.036
2016 98.1 0 0.054 0.045 0.042 0.040 0.036
*Data availability less than 75 % for one or more quarters.
AAQ NEPM standard for O3: 0.10 ppm (1-hour average). AAQ NEPM goal for O3: standard exceeded on no more than one day per year.
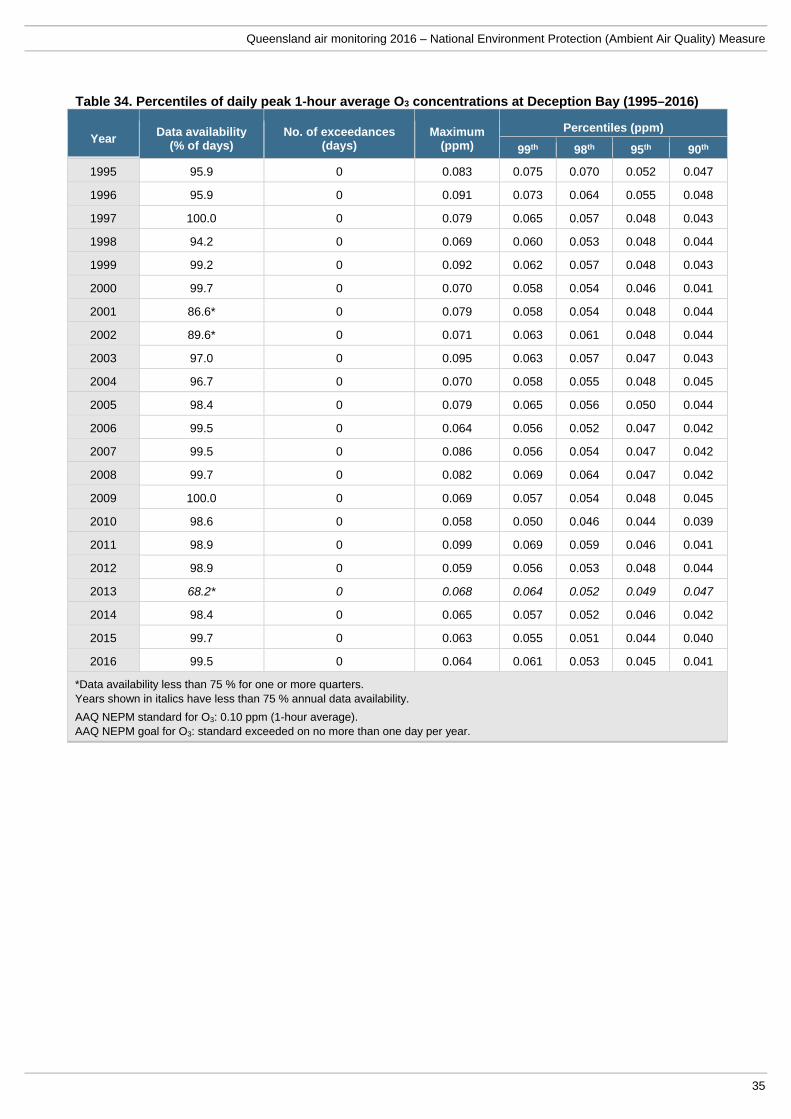
Queensland air monitoring 2016 – National Environment Protection (Ambient Air Quality) Measure
35
Table 34. Percentiles of daily peak 1-hour average O3 concentrations at Deception Bay (1995–2016)
Year Data availability
(% of days) No. of exceedances
(days) Maximum
(ppm)
Percentiles (ppm)
99th 98th 95th 90th
1995 95.9 0 0.083 0.075 0.070 0.052 0.047
1996 95.9 0 0.091 0.073 0.064 0.055 0.048
1997 100.0 0 0.079 0.065 0.057 0.048 0.043
1998 94.2 0 0.069 0.060 0.053 0.048 0.044
1999 99.2 0 0.092 0.062 0.057 0.048 0.043
2000 99.7 0 0.070 0.058 0.054 0.046 0.041
2001 86.6* 0 0.079 0.058 0.054 0.048 0.044
2002 89.6* 0 0.071 0.063 0.061 0.048 0.044
2003 97.0 0 0.095 0.063 0.057 0.047 0.043
2004 96.7 0 0.070 0.058 0.055 0.048 0.045
2005 98.4 0 0.079 0.065 0.056 0.050 0.044
2006 99.5 0 0.064 0.056 0.052 0.047 0.042
2007 99.5 0 0.086 0.056 0.054 0.047 0.042
2008 99.7 0 0.082 0.069 0.064 0.047 0.042
2009 100.0 0 0.069 0.057 0.054 0.048 0.045
2010 98.6 0 0.058 0.050 0.046 0.044 0.039
2011 98.9 0 0.099 0.069 0.059 0.046 0.041
2012 98.9 0 0.059 0.056 0.053 0.048 0.044
2013 68.2* 0 0.068 0.064 0.052 0.049 0.047
2014 98.4 0 0.065 0.057 0.052 0.046 0.042
2015 99.7 0 0.063 0.055 0.051 0.044 0.040
2016 99.5 0 0.064 0.061 0.053 0.045 0.041
*Data availability less than 75 % for one or more quarters. Years shown in italics have less than 75 % annual data availability.
AAQ NEPM standard for O3: 0.10 ppm (1-hour average). AAQ NEPM goal for O3: standard exceeded on no more than one day per year.
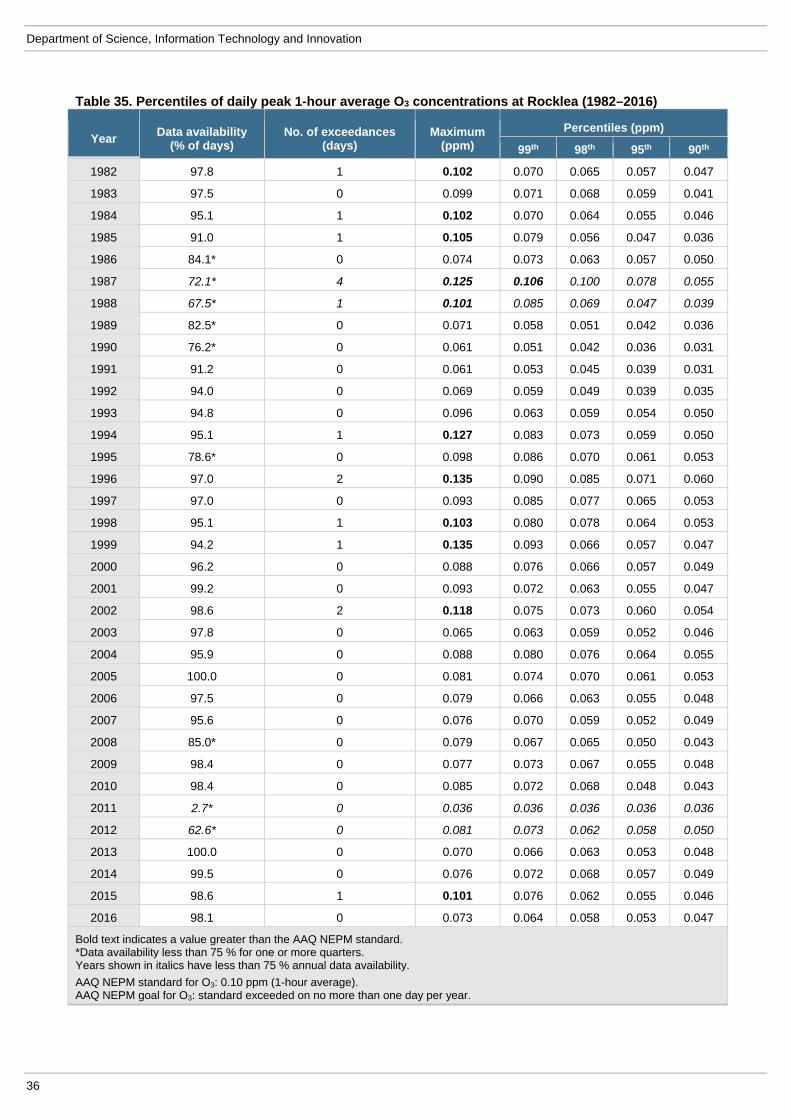
Department of Science, Information Technology and Innovation
36
Table 35. Percentiles of daily peak 1-hour average O3 concentrations at Rocklea (1982–2016)
Year Data availability
(% of days) No. of exceedances
(days) Maximum
(ppm)
Percentiles (ppm)
99th 98th 95th 90th
1982 97.8 1 0.102 0.070 0.065 0.057 0.047
1983 97.5 0 0.099 0.071 0.068 0.059 0.041
1984 95.1 1 0.102 0.070 0.064 0.055 0.046
1985 91.0 1 0.105 0.079 0.056 0.047 0.036
1986 84.1* 0 0.074 0.073 0.063 0.057 0.050
1987 72.1* 4 0.125 0.106 0.100 0.078 0.055
1988 67.5* 1 0.101 0.085 0.069 0.047 0.039
1989 82.5* 0 0.071 0.058 0.051 0.042 0.036
1990 76.2* 0 0.061 0.051 0.042 0.036 0.031
1991 91.2 0 0.061 0.053 0.045 0.039 0.031
1992 94.0 0 0.069 0.059 0.049 0.039 0.035
1993 94.8 0 0.096 0.063 0.059 0.054 0.050
1994 95.1 1 0.127 0.083 0.073 0.059 0.050
1995 78.6* 0 0.098 0.086 0.070 0.061 0.053
1996 97.0 2 0.135 0.090 0.085 0.071 0.060
1997 97.0 0 0.093 0.085 0.077 0.065 0.053
1998 95.1 1 0.103 0.080 0.078 0.064 0.053
1999 94.2 1 0.135 0.093 0.066 0.057 0.047
2000 96.2 0 0.088 0.076 0.066 0.057 0.049
2001 99.2 0 0.093 0.072 0.063 0.055 0.047
2002 98.6 2 0.118 0.075 0.073 0.060 0.054
2003 97.8 0 0.065 0.063 0.059 0.052 0.046
2004 95.9 0 0.088 0.080 0.076 0.064 0.055
2005 100.0 0 0.081 0.074 0.070 0.061 0.053
2006 97.5 0 0.079 0.066 0.063 0.055 0.048
2007 95.6 0 0.076 0.070 0.059 0.052 0.049
2008 85.0* 0 0.079 0.067 0.065 0.050 0.043
2009 98.4 0 0.077 0.073 0.067 0.055 0.048
2010 98.4 0 0.085 0.072 0.068 0.048 0.043
2011 2.7* 0 0.036 0.036 0.036 0.036 0.036
2012 62.6* 0 0.081 0.073 0.062 0.058 0.050
2013 100.0 0 0.070 0.066 0.063 0.053 0.048
2014 99.5 0 0.076 0.072 0.068 0.057 0.049
2015 98.6 1 0.101 0.076 0.062 0.055 0.046
2016 98.1 0 0.073 0.064 0.058 0.053 0.047
Bold text indicates a value greater than the AAQ NEPM standard. *Data availability less than 75 % for one or more quarters. Years shown in italics have less than 75 % annual data availability.
AAQ NEPM standard for O3: 0.10 ppm (1-hour average). AAQ NEPM goal for O3: standard exceeded on no more than one day per year.
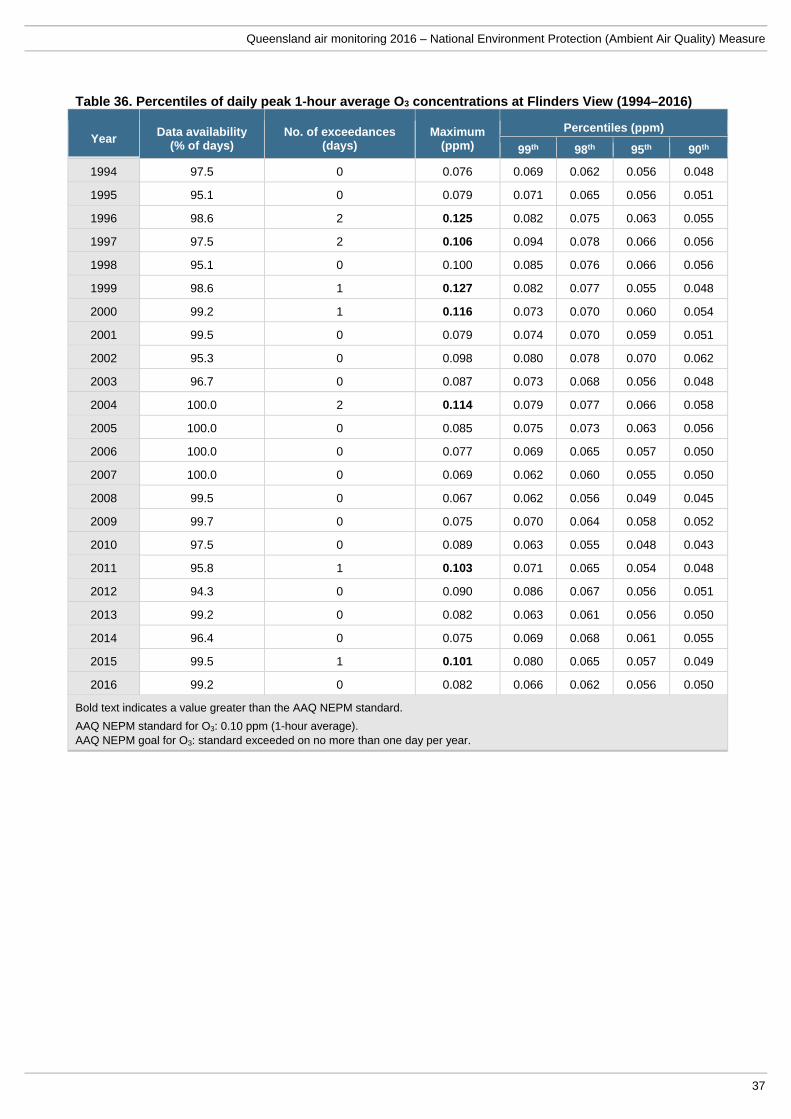
Queensland air monitoring 2016 – National Environment Protection (Ambient Air Quality) Measure
37
Table 36. Percentiles of daily peak 1-hour average O3 concentrations at Flinders View (1994–2016)
Year Data availability
(% of days) No. of exceedances
(days) Maximum
(ppm)
Percentiles (ppm)
99th 98th 95th 90th
1994 97.5 0 0.076 0.069 0.062 0.056 0.048
1995 95.1 0 0.079 0.071 0.065 0.056 0.051
1996 98.6 2 0.125 0.082 0.075 0.063 0.055
1997 97.5 2 0.106 0.094 0.078 0.066 0.056
1998 95.1 0 0.100 0.085 0.076 0.066 0.056
1999 98.6 1 0.127 0.082 0.077 0.055 0.048
2000 99.2 1 0.116 0.073 0.070 0.060 0.054
2001 99.5 0 0.079 0.074 0.070 0.059 0.051
2002 95.3 0 0.098 0.080 0.078 0.070 0.062
2003 96.7 0 0.087 0.073 0.068 0.056 0.048
2004 100.0 2 0.114 0.079 0.077 0.066 0.058
2005 100.0 0 0.085 0.075 0.073 0.063 0.056
2006 100.0 0 0.077 0.069 0.065 0.057 0.050
2007 100.0 0 0.069 0.062 0.060 0.055 0.050
2008 99.5 0 0.067 0.062 0.056 0.049 0.045
2009 99.7 0 0.075 0.070 0.064 0.058 0.052
2010 97.5 0 0.089 0.063 0.055 0.048 0.043
2011 95.8 1 0.103 0.071 0.065 0.054 0.048
2012 94.3 0 0.090 0.086 0.067 0.056 0.051
2013 99.2 0 0.082 0.063 0.061 0.056 0.050
2014 96.4 0 0.075 0.069 0.068 0.061 0.055
2015 99.5 1 0.101 0.080 0.065 0.057 0.049
2016 99.2 0 0.082 0.066 0.062 0.056 0.050
Bold text indicates a value greater than the AAQ NEPM standard.
AAQ NEPM standard for O3: 0.10 ppm (1-hour average). AAQ NEPM goal for O3: standard exceeded on no more than one day per year.
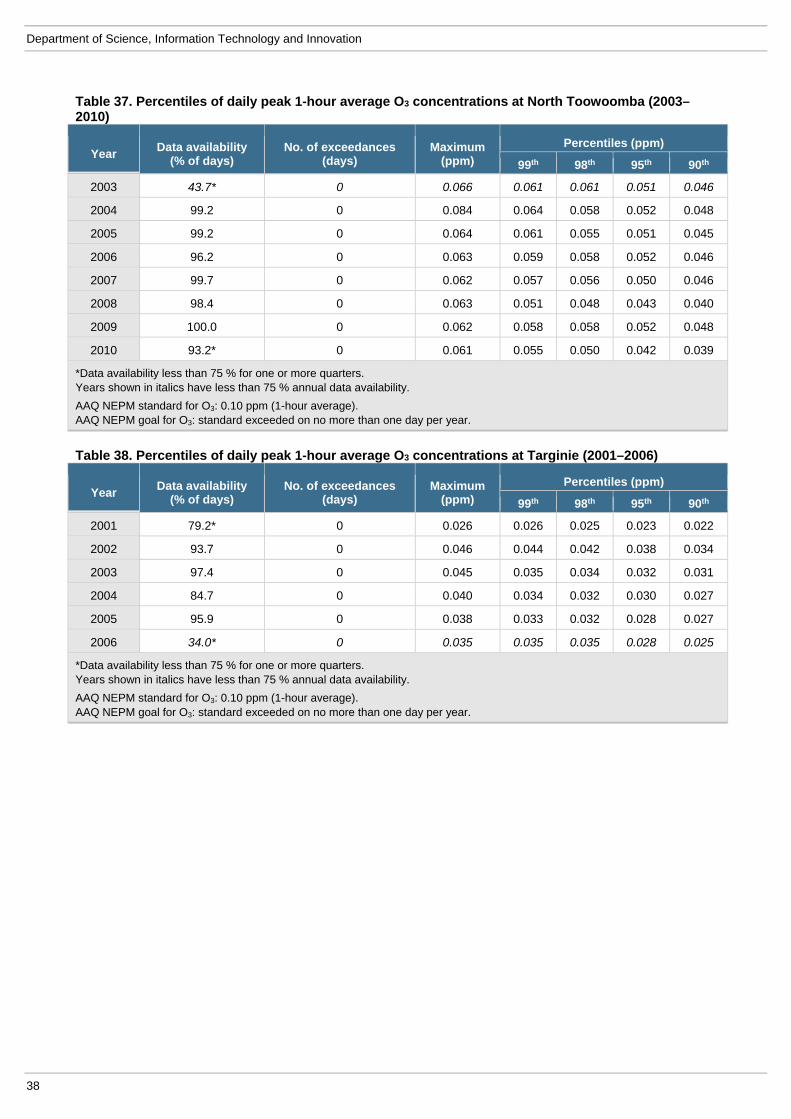
Department of Science, Information Technology and Innovation
38
Table 37. Percentiles of daily peak 1-hour average O3 concentrations at North Toowoomba (2003–2010)
Year Data availability
(% of days) No. of exceedances
(days) Maximum
(ppm)
Percentiles (ppm)
99th 98th 95th 90th
2003 43.7* 0 0.066 0.061 0.061 0.051 0.046
2004 99.2 0 0.084 0.064 0.058 0.052 0.048
2005 99.2 0 0.064 0.061 0.055 0.051 0.045
2006 96.2 0 0.063 0.059 0.058 0.052 0.046
2007 99.7 0 0.062 0.057 0.056 0.050 0.046
2008 98.4 0 0.063 0.051 0.048 0.043 0.040
2009 100.0 0 0.062 0.058 0.058 0.052 0.048
2010 93.2* 0 0.061 0.055 0.050 0.042 0.039
*Data availability less than 75 % for one or more quarters. Years shown in italics have less than 75 % annual data availability.
AAQ NEPM standard for O3: 0.10 ppm (1-hour average). AAQ NEPM goal for O3: standard exceeded on no more than one day per year.
Table 38. Percentiles of daily peak 1-hour average O3 concentrations at Targinie (2001–2006)
Year Data availability
(% of days) No. of exceedances
(days) Maximum
(ppm)
Percentiles (ppm)
99th 98th 95th 90th
2001 79.2* 0 0.026 0.026 0.025 0.023 0.022
2002 93.7 0 0.046 0.044 0.042 0.038 0.034
2003 97.4 0 0.045 0.035 0.034 0.032 0.031
2004 84.7 0 0.040 0.034 0.032 0.030 0.027
2005 95.9 0 0.038 0.033 0.032 0.028 0.027
2006 34.0* 0 0.035 0.035 0.035 0.028 0.025
*Data availability less than 75 % for one or more quarters. Years shown in italics have less than 75 % annual data availability.
AAQ NEPM standard for O3: 0.10 ppm (1-hour average). AAQ NEPM goal for O3: standard exceeded on no more than one day per year.
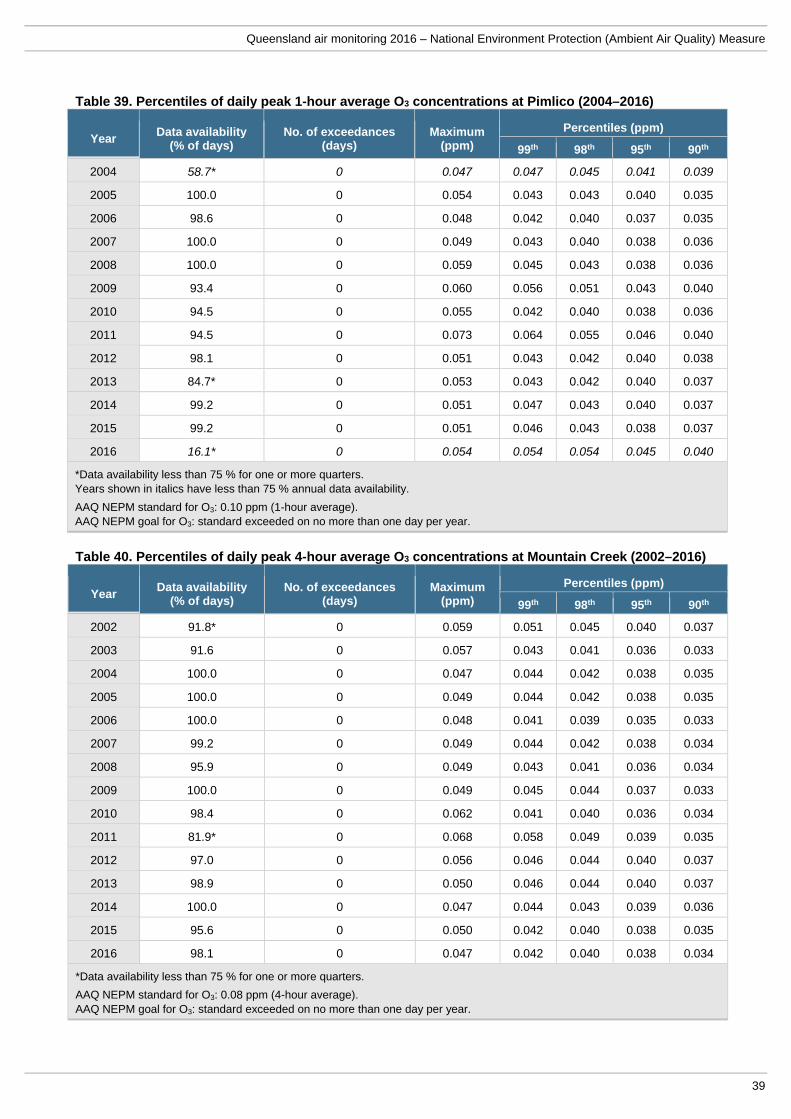
Queensland air monitoring 2016 – National Environment Protection (Ambient Air Quality) Measure
39
Table 39. Percentiles of daily peak 1-hour average O3 concentrations at Pimlico (2004–2016)
Year Data availability
(% of days) No. of exceedances
(days) Maximum
(ppm)
Percentiles (ppm)
99th 98th 95th 90th
2004 58.7* 0 0.047 0.047 0.045 0.041 0.039
2005 100.0 0 0.054 0.043 0.043 0.040 0.035
2006 98.6 0 0.048 0.042 0.040 0.037 0.035
2007 100.0 0 0.049 0.043 0.040 0.038 0.036
2008 100.0 0 0.059 0.045 0.043 0.038 0.036
2009 93.4 0 0.060 0.056 0.051 0.043 0.040
2010 94.5 0 0.055 0.042 0.040 0.038 0.036
2011 94.5 0 0.073 0.064 0.055 0.046 0.040
2012 98.1 0 0.051 0.043 0.042 0.040 0.038
2013 84.7* 0 0.053 0.043 0.042 0.040 0.037
2014 99.2 0 0.051 0.047 0.043 0.040 0.037
2015 99.2 0 0.051 0.046 0.043 0.038 0.037
2016 16.1* 0 0.054 0.054 0.054 0.045 0.040
*Data availability less than 75 % for one or more quarters. Years shown in italics have less than 75 % annual data availability.
AAQ NEPM standard for O3: 0.10 ppm (1-hour average). AAQ NEPM goal for O3: standard exceeded on no more than one day per year.
Table 40. Percentiles of daily peak 4-hour average O3 concentrations at Mountain Creek (2002–2016)
Year Data availability
(% of days) No. of exceedances
(days) Maximum
(ppm)
Percentiles (ppm)
99th 98th 95th 90th
2002 91.8* 0 0.059 0.051 0.045 0.040 0.037
2003 91.6 0 0.057 0.043 0.041 0.036 0.033
2004 100.0 0 0.047 0.044 0.042 0.038 0.035
2005 100.0 0 0.049 0.044 0.042 0.038 0.035
2006 100.0 0 0.048 0.041 0.039 0.035 0.033
2007 99.2 0 0.049 0.044 0.042 0.038 0.034
2008 95.9 0 0.049 0.043 0.041 0.036 0.034
2009 100.0 0 0.049 0.045 0.044 0.037 0.033
2010 98.4 0 0.062 0.041 0.040 0.036 0.034
2011 81.9* 0 0.068 0.058 0.049 0.039 0.035
2012 97.0 0 0.056 0.046 0.044 0.040 0.037
2013 98.9 0 0.050 0.046 0.044 0.040 0.037
2014 100.0 0 0.047 0.044 0.043 0.039 0.036
2015 95.6 0 0.050 0.042 0.040 0.038 0.035
2016 98.1 0 0.047 0.042 0.040 0.038 0.034
*Data availability less than 75 % for one or more quarters.
AAQ NEPM standard for O3: 0.08 ppm (4-hour average). AAQ NEPM goal for O3: standard exceeded on no more than one day per year.
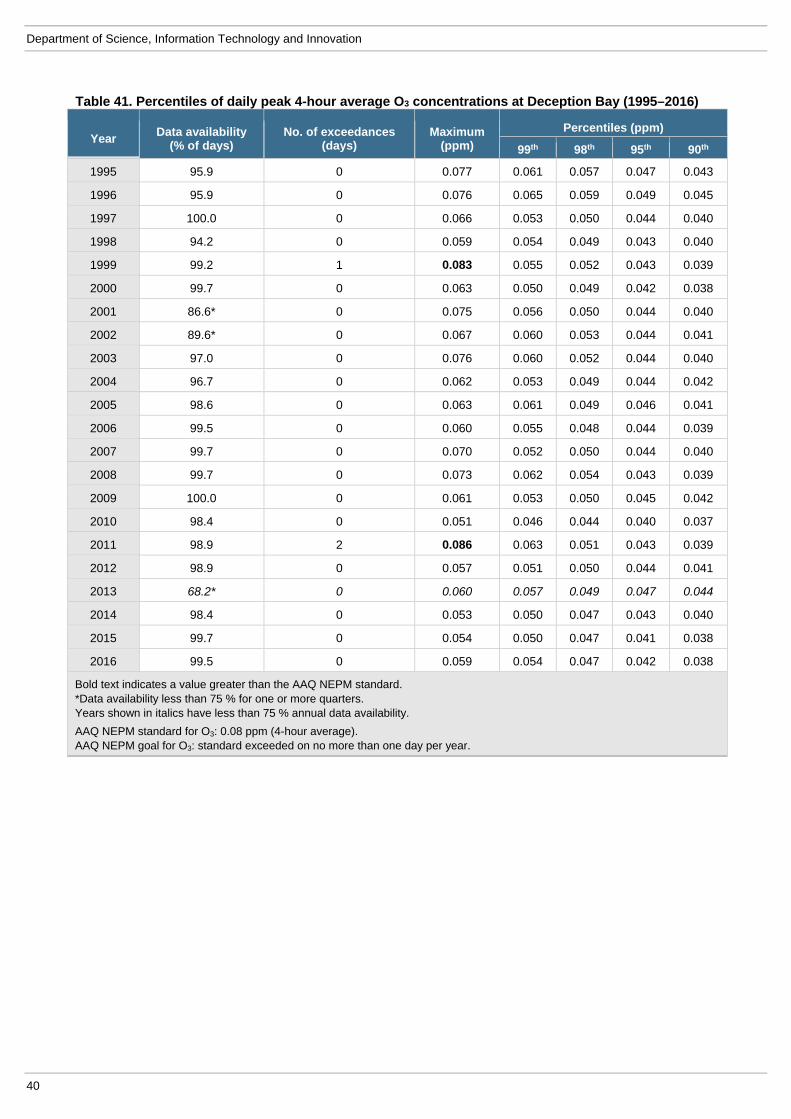
Department of Science, Information Technology and Innovation
40
Table 41. Percentiles of daily peak 4-hour average O3 concentrations at Deception Bay (1995–2016)
Year Data availability
(% of days) No. of exceedances
(days) Maximum
(ppm)
Percentiles (ppm)
99th 98th 95th 90th
1995 95.9 0 0.077 0.061 0.057 0.047 0.043
1996 95.9 0 0.076 0.065 0.059 0.049 0.045
1997 100.0 0 0.066 0.053 0.050 0.044 0.040
1998 94.2 0 0.059 0.054 0.049 0.043 0.040
1999 99.2 1 0.083 0.055 0.052 0.043 0.039
2000 99.7 0 0.063 0.050 0.049 0.042 0.038
2001 86.6* 0 0.075 0.056 0.050 0.044 0.040
2002 89.6* 0 0.067 0.060 0.053 0.044 0.041
2003 97.0 0 0.076 0.060 0.052 0.044 0.040
2004 96.7 0 0.062 0.053 0.049 0.044 0.042
2005 98.6 0 0.063 0.061 0.049 0.046 0.041
2006 99.5 0 0.060 0.055 0.048 0.044 0.039
2007 99.7 0 0.070 0.052 0.050 0.044 0.040
2008 99.7 0 0.073 0.062 0.054 0.043 0.039
2009 100.0 0 0.061 0.053 0.050 0.045 0.042
2010 98.4 0 0.051 0.046 0.044 0.040 0.037
2011 98.9 2 0.086 0.063 0.051 0.043 0.039
2012 98.9 0 0.057 0.051 0.050 0.044 0.041
2013 68.2* 0 0.060 0.057 0.049 0.047 0.044
2014 98.4 0 0.053 0.050 0.047 0.043 0.040
2015 99.7 0 0.054 0.050 0.047 0.041 0.038
2016 99.5 0 0.059 0.054 0.047 0.042 0.038
Bold text indicates a value greater than the AAQ NEPM standard. *Data availability less than 75 % for one or more quarters. Years shown in italics have less than 75 % annual data availability.
AAQ NEPM standard for O3: 0.08 ppm (4-hour average). AAQ NEPM goal for O3: standard exceeded on no more than one day per year.
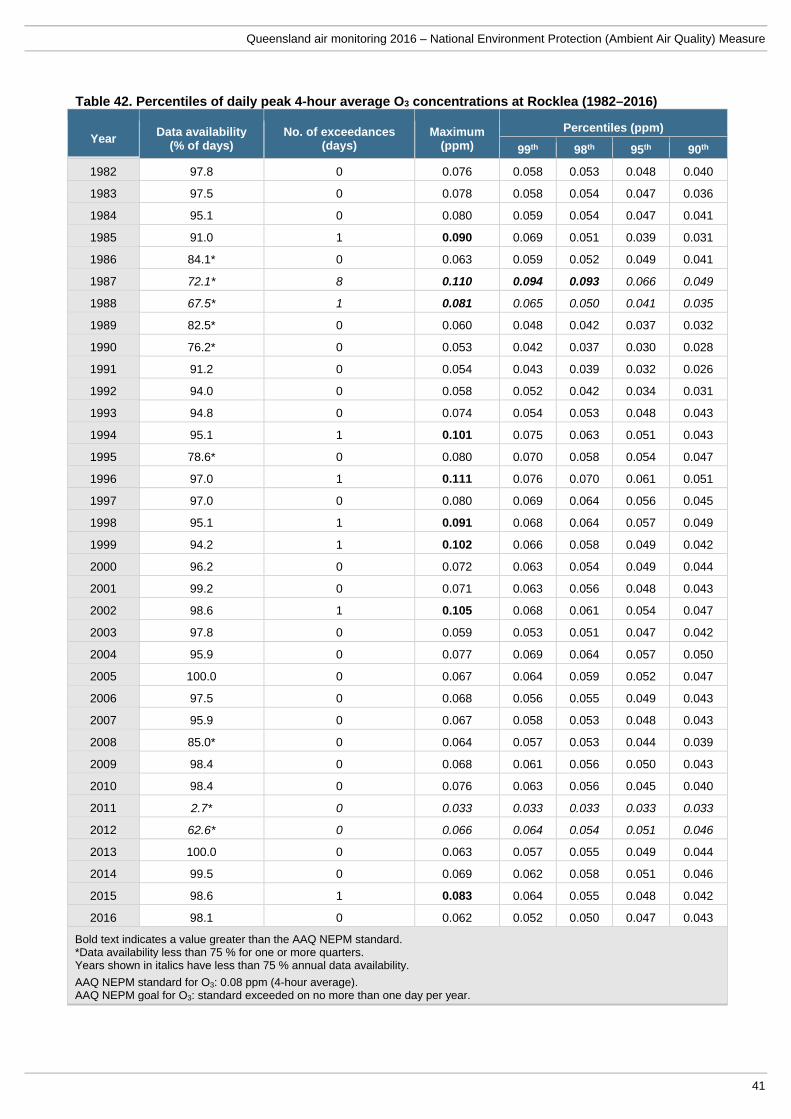
Queensland air monitoring 2016 – National Environment Protection (Ambient Air Quality) Measure
41
Table 42. Percentiles of daily peak 4-hour average O3 concentrations at Rocklea (1982–2016)
Year Data availability
(% of days) No. of exceedances
(days) Maximum
(ppm)
Percentiles (ppm)
99th 98th 95th 90th
1982 97.8 0 0.076 0.058 0.053 0.048 0.040
1983 97.5 0 0.078 0.058 0.054 0.047 0.036
1984 95.1 0 0.080 0.059 0.054 0.047 0.041
1985 91.0 1 0.090 0.069 0.051 0.039 0.031
1986 84.1* 0 0.063 0.059 0.052 0.049 0.041
1987 72.1* 8 0.110 0.094 0.093 0.066 0.049
1988 67.5* 1 0.081 0.065 0.050 0.041 0.035
1989 82.5* 0 0.060 0.048 0.042 0.037 0.032
1990 76.2* 0 0.053 0.042 0.037 0.030 0.028
1991 91.2 0 0.054 0.043 0.039 0.032 0.026
1992 94.0 0 0.058 0.052 0.042 0.034 0.031
1993 94.8 0 0.074 0.054 0.053 0.048 0.043
1994 95.1 1 0.101 0.075 0.063 0.051 0.043
1995 78.6* 0 0.080 0.070 0.058 0.054 0.047
1996 97.0 1 0.111 0.076 0.070 0.061 0.051
1997 97.0 0 0.080 0.069 0.064 0.056 0.045
1998 95.1 1 0.091 0.068 0.064 0.057 0.049
1999 94.2 1 0.102 0.066 0.058 0.049 0.042
2000 96.2 0 0.072 0.063 0.054 0.049 0.044
2001 99.2 0 0.071 0.063 0.056 0.048 0.043
2002 98.6 1 0.105 0.068 0.061 0.054 0.047
2003 97.8 0 0.059 0.053 0.051 0.047 0.042
2004 95.9 0 0.077 0.069 0.064 0.057 0.050
2005 100.0 0 0.067 0.064 0.059 0.052 0.047
2006 97.5 0 0.068 0.056 0.055 0.049 0.043
2007 95.9 0 0.067 0.058 0.053 0.048 0.043
2008 85.0* 0 0.064 0.057 0.053 0.044 0.039
2009 98.4 0 0.068 0.061 0.056 0.050 0.043
2010 98.4 0 0.076 0.063 0.056 0.045 0.040
2011 2.7* 0 0.033 0.033 0.033 0.033 0.033
2012 62.6* 0 0.066 0.064 0.054 0.051 0.046
2013 100.0 0 0.063 0.057 0.055 0.049 0.044
2014 99.5 0 0.069 0.062 0.058 0.051 0.046
2015 98.6 1 0.083 0.064 0.055 0.048 0.042
2016 98.1 0 0.062 0.052 0.050 0.047 0.043
Bold text indicates a value greater than the AAQ NEPM standard. *Data availability less than 75 % for one or more quarters. Years shown in italics have less than 75 % annual data availability.
AAQ NEPM standard for O3: 0.08 ppm (4-hour average). AAQ NEPM goal for O3: standard exceeded on no more than one day per year.

Department of Science, Information Technology and Innovation
42
Table 43. Percentiles of daily peak 4-hour average O3 concentrations at Flinders View (1994–2016)
Year Data availability
(% of days) No. of exceedances
(days) Maximum
(ppm)
Percentiles (ppm)
99th 98th 95th 90th
1994 97.5 0 0.072 0.058 0.056 0.047 0.043
1995 95.1 0 0.066 0.062 0.060 0.050 0.044
1996 98.6 2 0.091 0.068 0.065 0.058 0.049
1997 97.5 2 0.090 0.073 0.067 0.056 0.049
1998 95.1 0 0.069 0.065 0.064 0.057 0.049
1999 98.6 1 0.101 0.067 0.064 0.049 0.043
2000 99.2 1 0.089 0.064 0.061 0.052 0.048
2001 99.5 0 0.072 0.066 0.058 0.052 0.047
2002 95.3 1 0.083 0.070 0.066 0.061 0.055
2003 96.7 0 0.080 0.067 0.059 0.049 0.044
2004 100.0 1 0.100 0.071 0.067 0.057 0.050
2005 100.0 0 0.067 0.066 0.062 0.057 0.050
2006 100.0 0 0.070 0.059 0.056 0.050 0.044
2007 100.0 0 0.062 0.056 0.054 0.049 0.045
2008 99.5 0 0.058 0.055 0.052 0.045 0.041
2009 99.7 0 0.066 0.062 0.059 0.051 0.046
2010 97.5 0 0.072 0.055 0.050 0.043 0.040
2011 96.2 1 0.088 0.061 0.059 0.049 0.045
2012 94.3 0 0.080 0.079 0.062 0.052 0.046
2013 99.2 0 0.070 0.057 0.054 0.051 0.047
2014 96.4 0 0.067 0.063 0.062 0.055 0.049
2015 99.5 1 0.081 0.067 0.058 0.052 0.046
2016 99.2 0 0.065 0.059 0.054 0.050 0.046
Bold text indicates a value greater than the AAQ NEPM standard.
AAQ NEPM standard for O3: 0.08 ppm (4-hour average). AAQ NEPM goal for O3: standard exceeded on no more than one day per year.
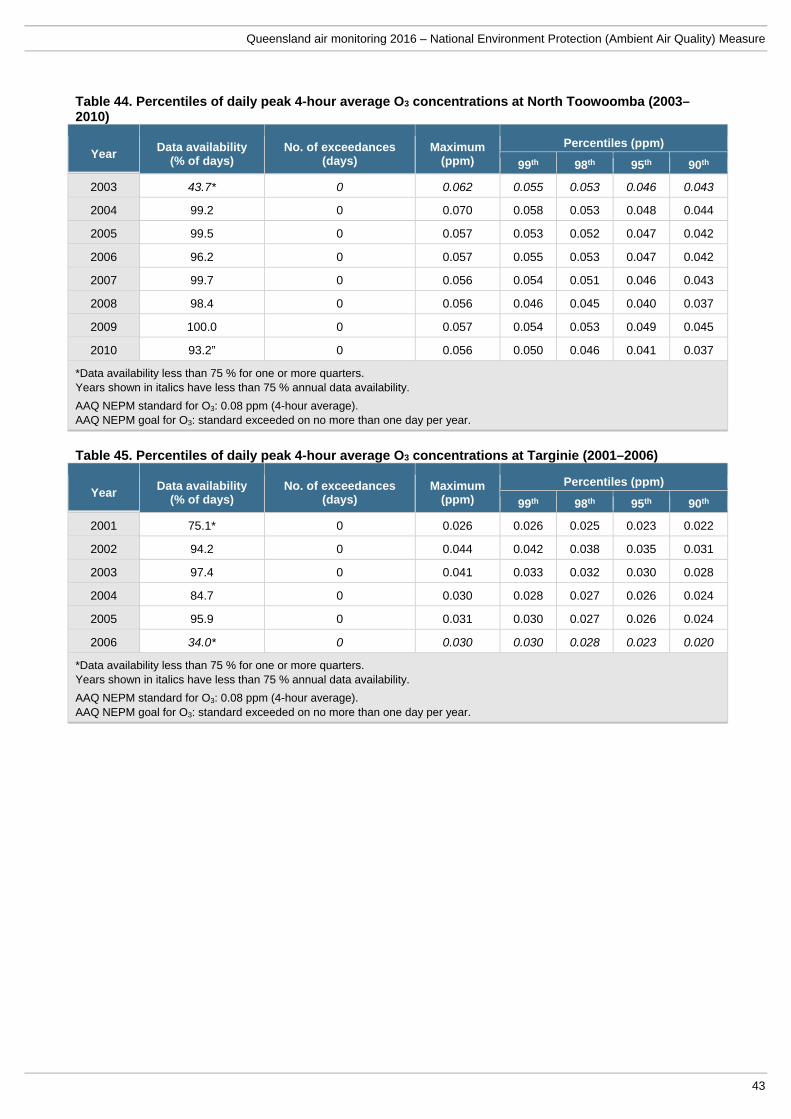
Queensland air monitoring 2016 – National Environment Protection (Ambient Air Quality) Measure
43
Table 44. Percentiles of daily peak 4-hour average O3 concentrations at North Toowoomba (2003–2010)
Year Data availability
(% of days) No. of exceedances
(days) Maximum
(ppm)
Percentiles (ppm)
99th 98th 95th 90th
2003 43.7* 0 0.062 0.055 0.053 0.046 0.043
2004 99.2 0 0.070 0.058 0.053 0.048 0.044
2005 99.5 0 0.057 0.053 0.052 0.047 0.042
2006 96.2 0 0.057 0.055 0.053 0.047 0.042
2007 99.7 0 0.056 0.054 0.051 0.046 0.043
2008 98.4 0 0.056 0.046 0.045 0.040 0.037
2009 100.0 0 0.057 0.054 0.053 0.049 0.045
2010 93.2” 0 0.056 0.050 0.046 0.041 0.037
*Data availability less than 75 % for one or more quarters. Years shown in italics have less than 75 % annual data availability.
AAQ NEPM standard for O3: 0.08 ppm (4-hour average). AAQ NEPM goal for O3: standard exceeded on no more than one day per year.
Table 45. Percentiles of daily peak 4-hour average O3 concentrations at Targinie (2001–2006)
Year Data availability
(% of days) No. of exceedances
(days) Maximum
(ppm)
Percentiles (ppm)
99th 98th 95th 90th
2001 75.1* 0 0.026 0.026 0.025 0.023 0.022
2002 94.2 0 0.044 0.042 0.038 0.035 0.031
2003 97.4 0 0.041 0.033 0.032 0.030 0.028
2004 84.7 0 0.030 0.028 0.027 0.026 0.024
2005 95.9 0 0.031 0.030 0.027 0.026 0.024
2006 34.0* 0 0.030 0.030 0.028 0.023 0.020
*Data availability less than 75 % for one or more quarters. Years shown in italics have less than 75 % annual data availability.
AAQ NEPM standard for O3: 0.08 ppm (4-hour average). AAQ NEPM goal for O3: standard exceeded on no more than one day per year.
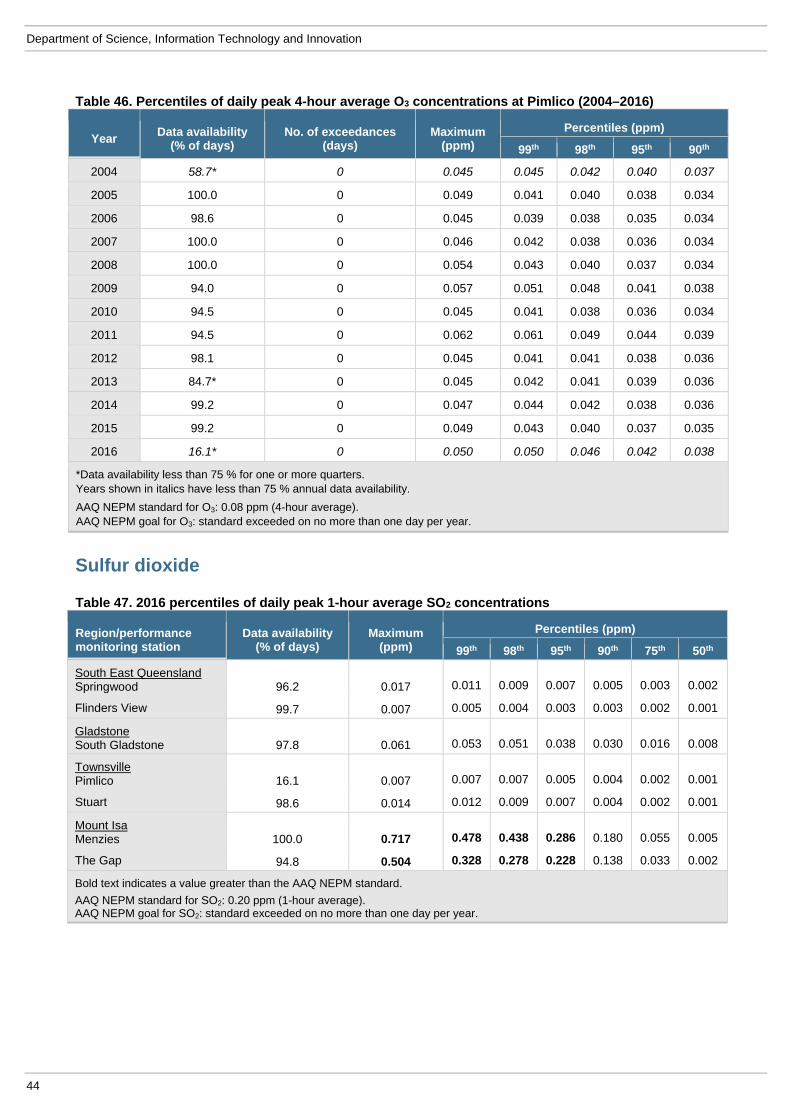
Department of Science, Information Technology and Innovation
44
Table 46. Percentiles of daily peak 4-hour average O3 concentrations at Pimlico (2004–2016)
Year Data availability
(% of days) No. of exceedances
(days) Maximum
(ppm)
Percentiles (ppm)
99th 98th 95th 90th
2004 58.7* 0 0.045 0.045 0.042 0.040 0.037
2005 100.0 0 0.049 0.041 0.040 0.038 0.034
2006 98.6 0 0.045 0.039 0.038 0.035 0.034
2007 100.0 0 0.046 0.042 0.038 0.036 0.034
2008 100.0 0 0.054 0.043 0.040 0.037 0.034
2009 94.0 0 0.057 0.051 0.048 0.041 0.038
2010 94.5 0 0.045 0.041 0.038 0.036 0.034
2011 94.5 0 0.062 0.061 0.049 0.044 0.039
2012 98.1 0 0.045 0.041 0.041 0.038 0.036
2013 84.7* 0 0.045 0.042 0.041 0.039 0.036
2014 99.2 0 0.047 0.044 0.042 0.038 0.036
2015 99.2 0 0.049 0.043 0.040 0.037 0.035
2016 16.1* 0 0.050 0.050 0.046 0.042 0.038
*Data availability less than 75 % for one or more quarters. Years shown in italics have less than 75 % annual data availability.
AAQ NEPM standard for O3: 0.08 ppm (4-hour average). AAQ NEPM goal for O3: standard exceeded on no more than one day per year.
Sulfur dioxide
Table 47. 2016 percentiles of daily peak 1-hour average SO2 concentrations
Region/performance monitoring station
Data availability (% of days)
Maximum (ppm)
Percentiles (ppm)
99th 98th 95th 90th 75th 50th
South East Queensland Springwood 96.2 0.017 0.011 0.009 0.007 0.005 0.003 0.002
Flinders View 99.7 0.007 0.005 0.004 0.003 0.003 0.002 0.001
Gladstone South Gladstone 97.8 0.061 0.053 0.051 0.038 0.030 0.016 0.008
Townsville Pimlico 16.1 0.007 0.007 0.007 0.005 0.004 0.002 0.001
Stuart 98.6 0.014 0.012 0.009 0.007 0.004 0.002 0.001
Mount Isa Menzies 100.0 0.717 0.478 0.438 0.286 0.180 0.055 0.005
The Gap 94.8 0.504 0.328 0.278 0.228 0.138 0.033 0.002
Bold text indicates a value greater than the AAQ NEPM standard.
AAQ NEPM standard for SO2: 0.20 ppm (1-hour average). AAQ NEPM goal for SO2: standard exceeded on no more than one day per year.
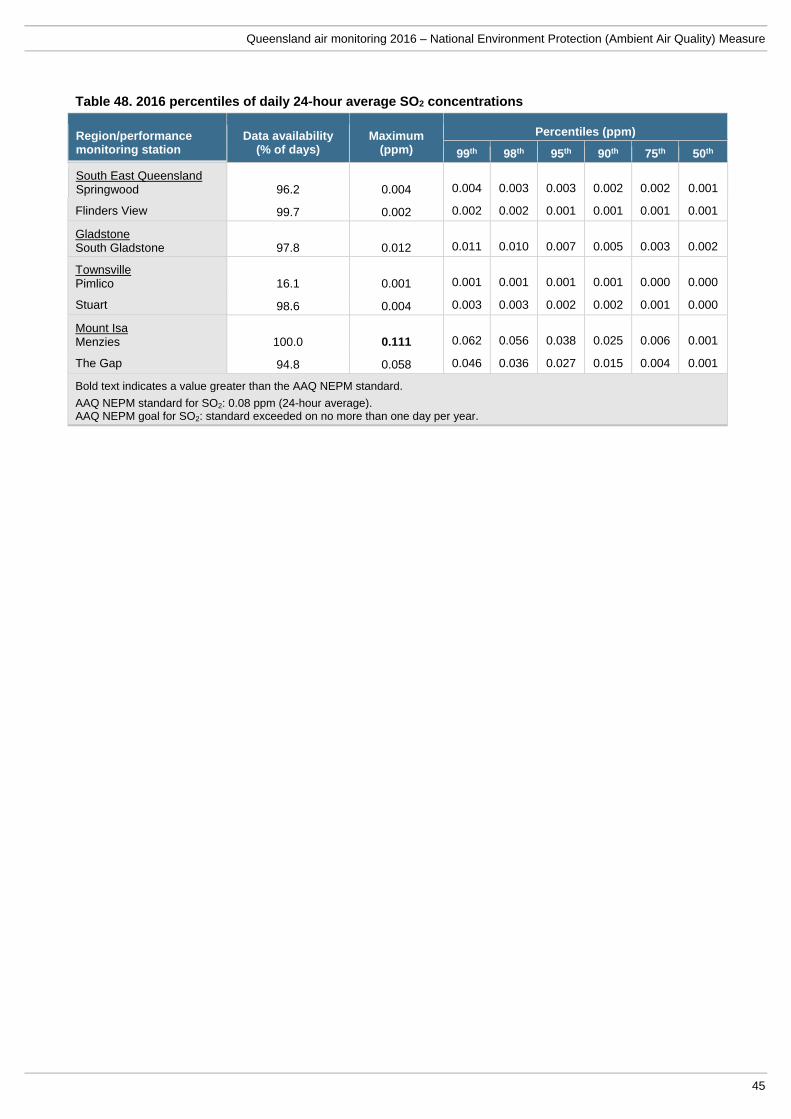
Queensland air monitoring 2016 – National Environment Protection (Ambient Air Quality) Measure
45
Table 48. 2016 percentiles of daily 24-hour average SO2 concentrations
Region/performance monitoring station
Data availability (% of days)
Maximum (ppm)
Percentiles (ppm)
99th 98th 95th 90th 75th 50th
South East Queensland Springwood 96.2 0.004 0.004 0.003 0.003 0.002 0.002 0.001
Flinders View 99.7 0.002 0.002 0.002 0.001 0.001 0.001 0.001
Gladstone South Gladstone 97.8 0.012 0.011 0.010 0.007 0.005 0.003 0.002
Townsville Pimlico 16.1 0.001 0.001 0.001 0.001 0.001 0.000 0.000
Stuart 98.6 0.004 0.003 0.003 0.002 0.002 0.001 0.000
Mount Isa Menzies 100.0 0.111 0.062 0.056 0.038 0.025 0.006 0.001
The Gap 94.8 0.058 0.046 0.036 0.027 0.015 0.004 0.001
Bold text indicates a value greater than the AAQ NEPM standard.
AAQ NEPM standard for SO2: 0.08 ppm (24-hour average). AAQ NEPM goal for SO2: standard exceeded on no more than one day per year.
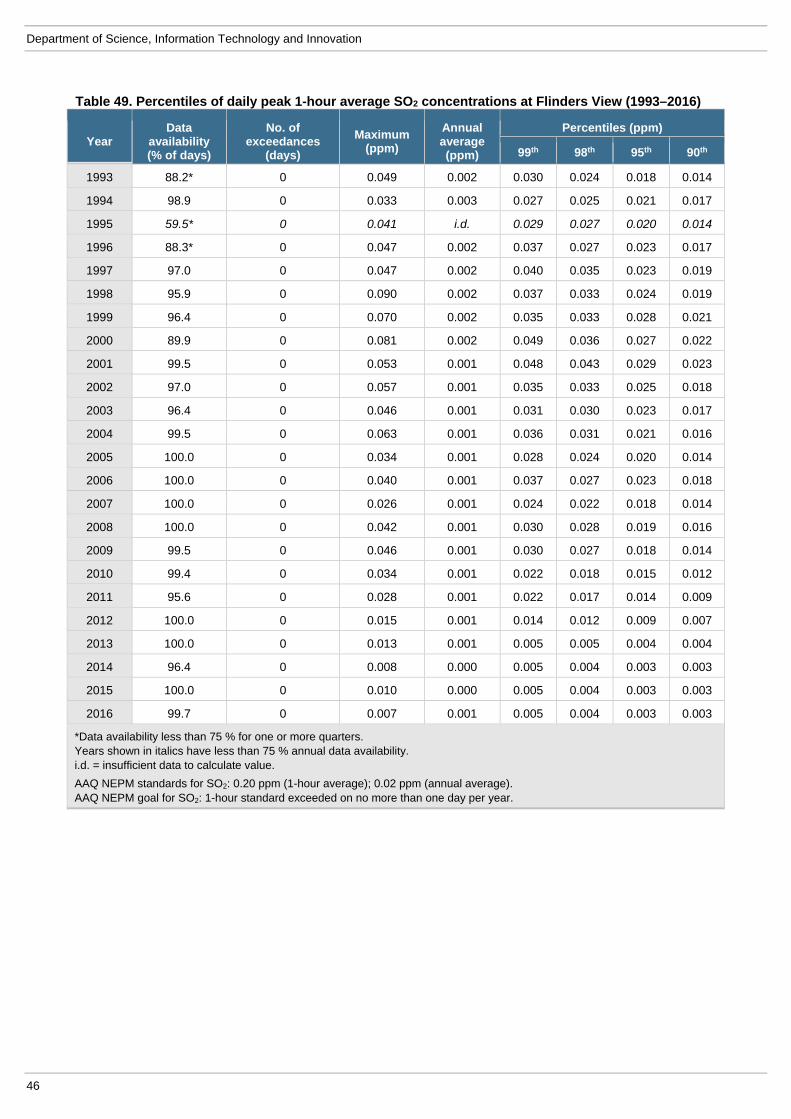
Department of Science, Information Technology and Innovation
46
Table 49. Percentiles of daily peak 1-hour average SO2 concentrations at Flinders View (1993–2016)
Year Data
availability (% of days)
No. of exceedances
(days)
Maximum (ppm)
Annual average (ppm)
Percentiles (ppm)
99th 98th 95th 90th
1993 88.2* 0 0.049 0.002 0.030 0.024 0.018 0.014
1994 98.9 0 0.033 0.003 0.027 0.025 0.021 0.017
1995 59.5* 0 0.041 i.d. 0.029 0.027 0.020 0.014
1996 88.3* 0 0.047 0.002 0.037 0.027 0.023 0.017
1997 97.0 0 0.047 0.002 0.040 0.035 0.023 0.019
1998 95.9 0 0.090 0.002 0.037 0.033 0.024 0.019
1999 96.4 0 0.070 0.002 0.035 0.033 0.028 0.021
2000 89.9 0 0.081 0.002 0.049 0.036 0.027 0.022
2001 99.5 0 0.053 0.001 0.048 0.043 0.029 0.023
2002 97.0 0 0.057 0.001 0.035 0.033 0.025 0.018
2003 96.4 0 0.046 0.001 0.031 0.030 0.023 0.017
2004 99.5 0 0.063 0.001 0.036 0.031 0.021 0.016
2005 100.0 0 0.034 0.001 0.028 0.024 0.020 0.014
2006 100.0 0 0.040 0.001 0.037 0.027 0.023 0.018
2007 100.0 0 0.026 0.001 0.024 0.022 0.018 0.014
2008 100.0 0 0.042 0.001 0.030 0.028 0.019 0.016
2009 99.5 0 0.046 0.001 0.030 0.027 0.018 0.014
2010 99.4 0 0.034 0.001 0.022 0.018 0.015 0.012
2011 95.6 0 0.028 0.001 0.022 0.017 0.014 0.009
2012 100.0 0 0.015 0.001 0.014 0.012 0.009 0.007
2013 100.0 0 0.013 0.001 0.005 0.005 0.004 0.004
2014 96.4 0 0.008 0.000 0.005 0.004 0.003 0.003
2015 100.0 0 0.010 0.000 0.005 0.004 0.003 0.003
2016 99.7 0 0.007 0.001 0.005 0.004 0.003 0.003
*Data availability less than 75 % for one or more quarters. Years shown in italics have less than 75 % annual data availability. i.d. = insufficient data to calculate value.
AAQ NEPM standards for SO2: 0.20 ppm (1-hour average); 0.02 ppm (annual average). AAQ NEPM goal for SO2: 1-hour standard exceeded on no more than one day per year.
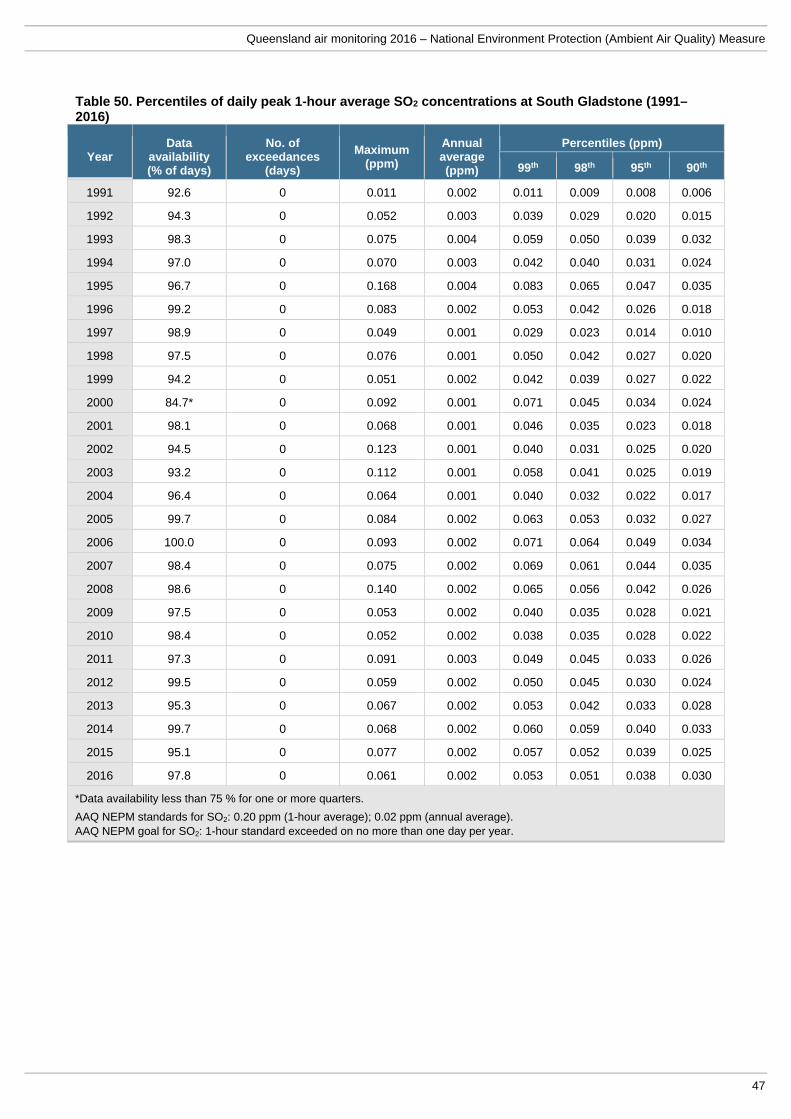
Queensland air monitoring 2016 – National Environment Protection (Ambient Air Quality) Measure
47
Table 50. Percentiles of daily peak 1-hour average SO2 concentrations at South Gladstone (1991–2016)
Year Data
availability (% of days)
No. of exceedances
(days)
Maximum (ppm)
Annual average (ppm)
Percentiles (ppm)
99th 98th 95th 90th
1991 92.6 0 0.011 0.002 0.011 0.009 0.008 0.006
1992 94.3 0 0.052 0.003 0.039 0.029 0.020 0.015
1993 98.3 0 0.075 0.004 0.059 0.050 0.039 0.032
1994 97.0 0 0.070 0.003 0.042 0.040 0.031 0.024
1995 96.7 0 0.168 0.004 0.083 0.065 0.047 0.035
1996 99.2 0 0.083 0.002 0.053 0.042 0.026 0.018
1997 98.9 0 0.049 0.001 0.029 0.023 0.014 0.010
1998 97.5 0 0.076 0.001 0.050 0.042 0.027 0.020
1999 94.2 0 0.051 0.002 0.042 0.039 0.027 0.022
2000 84.7* 0 0.092 0.001 0.071 0.045 0.034 0.024
2001 98.1 0 0.068 0.001 0.046 0.035 0.023 0.018
2002 94.5 0 0.123 0.001 0.040 0.031 0.025 0.020
2003 93.2 0 0.112 0.001 0.058 0.041 0.025 0.019
2004 96.4 0 0.064 0.001 0.040 0.032 0.022 0.017
2005 99.7 0 0.084 0.002 0.063 0.053 0.032 0.027
2006 100.0 0 0.093 0.002 0.071 0.064 0.049 0.034
2007 98.4 0 0.075 0.002 0.069 0.061 0.044 0.035
2008 98.6 0 0.140 0.002 0.065 0.056 0.042 0.026
2009 97.5 0 0.053 0.002 0.040 0.035 0.028 0.021
2010 98.4 0 0.052 0.002 0.038 0.035 0.028 0.022
2011 97.3 0 0.091 0.003 0.049 0.045 0.033 0.026
2012 99.5 0 0.059 0.002 0.050 0.045 0.030 0.024
2013 95.3 0 0.067 0.002 0.053 0.042 0.033 0.028
2014 99.7 0 0.068 0.002 0.060 0.059 0.040 0.033
2015 95.1 0 0.077 0.002 0.057 0.052 0.039 0.025
2016 97.8 0 0.061 0.002 0.053 0.051 0.038 0.030
*Data availability less than 75 % for one or more quarters.
AAQ NEPM standards for SO2: 0.20 ppm (1-hour average); 0.02 ppm (annual average). AAQ NEPM goal for SO2: 1-hour standard exceeded on no more than one day per year.
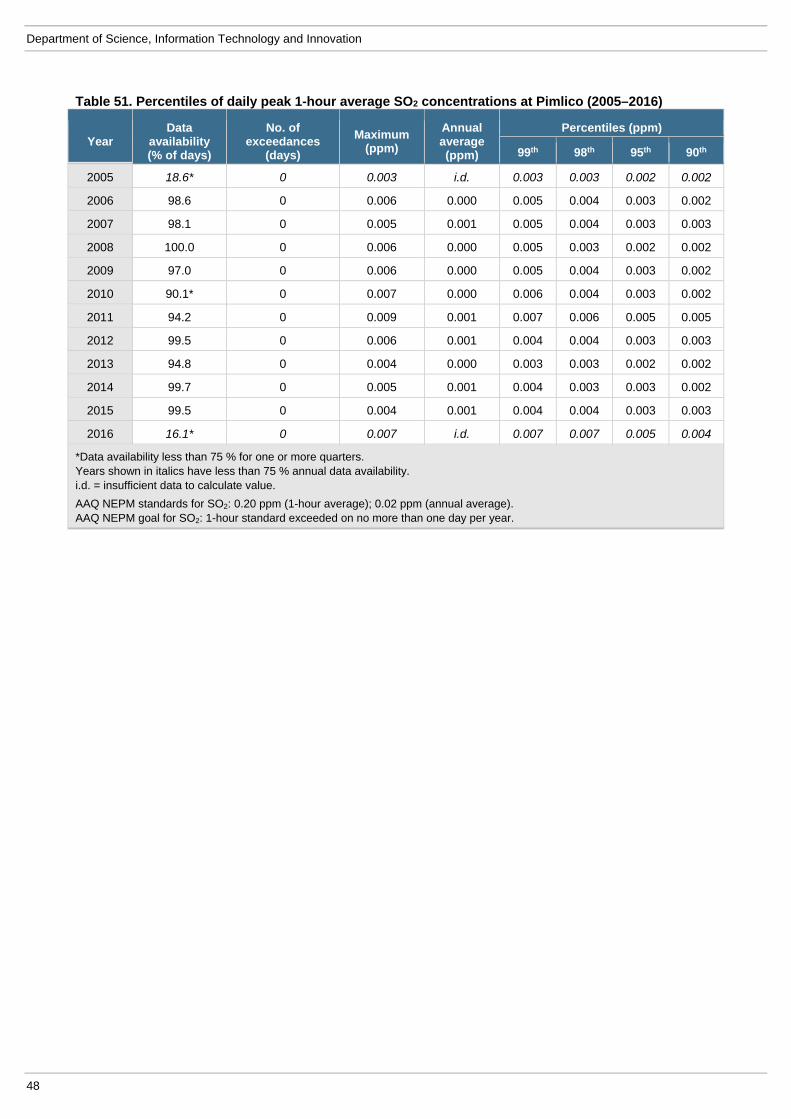
Department of Science, Information Technology and Innovation
48
Table 51. Percentiles of daily peak 1-hour average SO2 concentrations at Pimlico (2005–2016)
Year Data
availability (% of days)
No. of exceedances
(days)
Maximum (ppm)
Annual average (ppm)
Percentiles (ppm)
99th 98th 95th 90th
2005 18.6* 0 0.003 i.d. 0.003 0.003 0.002 0.002
2006 98.6 0 0.006 0.000 0.005 0.004 0.003 0.002
2007 98.1 0 0.005 0.001 0.005 0.004 0.003 0.003
2008 100.0 0 0.006 0.000 0.005 0.003 0.002 0.002
2009 97.0 0 0.006 0.000 0.005 0.004 0.003 0.002
2010 90.1* 0 0.007 0.000 0.006 0.004 0.003 0.002
2011 94.2 0 0.009 0.001 0.007 0.006 0.005 0.005
2012 99.5 0 0.006 0.001 0.004 0.004 0.003 0.003
2013 94.8 0 0.004 0.000 0.003 0.003 0.002 0.002
2014 99.7 0 0.005 0.001 0.004 0.003 0.003 0.002
2015 99.5 0 0.004 0.001 0.004 0.004 0.003 0.003
2016 16.1* 0 0.007 i.d. 0.007 0.007 0.005 0.004
*Data availability less than 75 % for one or more quarters. Years shown in italics have less than 75 % annual data availability. i.d. = insufficient data to calculate value.
AAQ NEPM standards for SO2: 0.20 ppm (1-hour average); 0.02 ppm (annual average). AAQ NEPM goal for SO2: 1-hour standard exceeded on no more than one day per year.
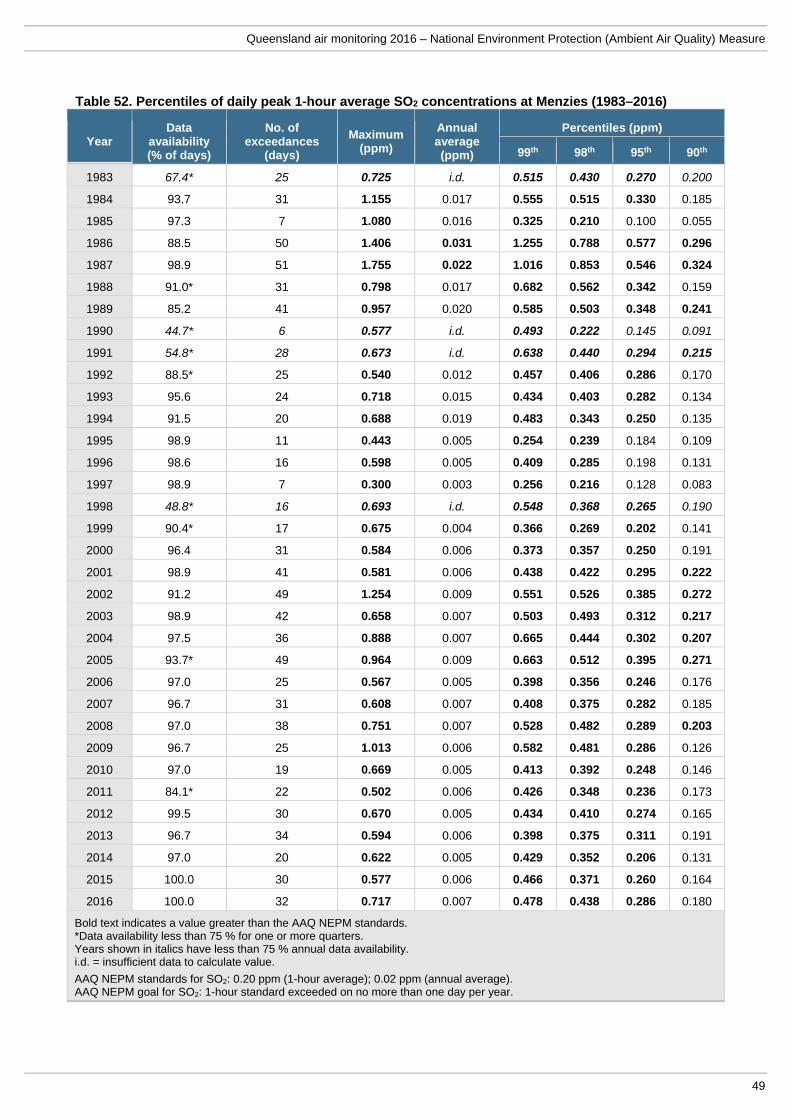
Queensland air monitoring 2016 – National Environment Protection (Ambient Air Quality) Measure
49
Table 52. Percentiles of daily peak 1-hour average SO2 concentrations at Menzies (1983–2016)
Year Data
availability (% of days)
No. of exceedances
(days)
Maximum(ppm)
Annual average (ppm)
Percentiles (ppm)
99th 98th 95th 90th
1983 67.4* 25 0.725 i.d. 0.515 0.430 0.270 0.200
1984 93.7 31 1.155 0.017 0.555 0.515 0.330 0.185
1985 97.3 7 1.080 0.016 0.325 0.210 0.100 0.055
1986 88.5 50 1.406 0.031 1.255 0.788 0.577 0.296
1987 98.9 51 1.755 0.022 1.016 0.853 0.546 0.324
1988 91.0* 31 0.798 0.017 0.682 0.562 0.342 0.159
1989 85.2 41 0.957 0.020 0.585 0.503 0.348 0.241
1990 44.7* 6 0.577 i.d. 0.493 0.222 0.145 0.091
1991 54.8* 28 0.673 i.d. 0.638 0.440 0.294 0.215
1992 88.5* 25 0.540 0.012 0.457 0.406 0.286 0.170
1993 95.6 24 0.718 0.015 0.434 0.403 0.282 0.134
1994 91.5 20 0.688 0.019 0.483 0.343 0.250 0.135
1995 98.9 11 0.443 0.005 0.254 0.239 0.184 0.109
1996 98.6 16 0.598 0.005 0.409 0.285 0.198 0.131
1997 98.9 7 0.300 0.003 0.256 0.216 0.128 0.083
1998 48.8* 16 0.693 i.d. 0.548 0.368 0.265 0.190
1999 90.4* 17 0.675 0.004 0.366 0.269 0.202 0.141
2000 96.4 31 0.584 0.006 0.373 0.357 0.250 0.191
2001 98.9 41 0.581 0.006 0.438 0.422 0.295 0.222
2002 91.2 49 1.254 0.009 0.551 0.526 0.385 0.272
2003 98.9 42 0.658 0.007 0.503 0.493 0.312 0.217
2004 97.5 36 0.888 0.007 0.665 0.444 0.302 0.207
2005 93.7* 49 0.964 0.009 0.663 0.512 0.395 0.271
2006 97.0 25 0.567 0.005 0.398 0.356 0.246 0.176
2007 96.7 31 0.608 0.007 0.408 0.375 0.282 0.185
2008 97.0 38 0.751 0.007 0.528 0.482 0.289 0.203
2009 96.7 25 1.013 0.006 0.582 0.481 0.286 0.126
2010 97.0 19 0.669 0.005 0.413 0.392 0.248 0.146
2011 84.1* 22 0.502 0.006 0.426 0.348 0.236 0.173
2012 99.5 30 0.670 0.005 0.434 0.410 0.274 0.165
2013 96.7 34 0.594 0.006 0.398 0.375 0.311 0.191
2014 97.0 20 0.622 0.005 0.429 0.352 0.206 0.131
2015 100.0 30 0.577 0.006 0.466 0.371 0.260 0.164
2016 100.0 32 0.717 0.007 0.478 0.438 0.286 0.180
Bold text indicates a value greater than the AAQ NEPM standards. *Data availability less than 75 % for one or more quarters. Years shown in italics have less than 75 % annual data availability. i.d. = insufficient data to calculate value.
AAQ NEPM standards for SO2: 0.20 ppm (1-hour average); 0.02 ppm (annual average). AAQ NEPM goal for SO2: 1-hour standard exceeded on no more than one day per year.
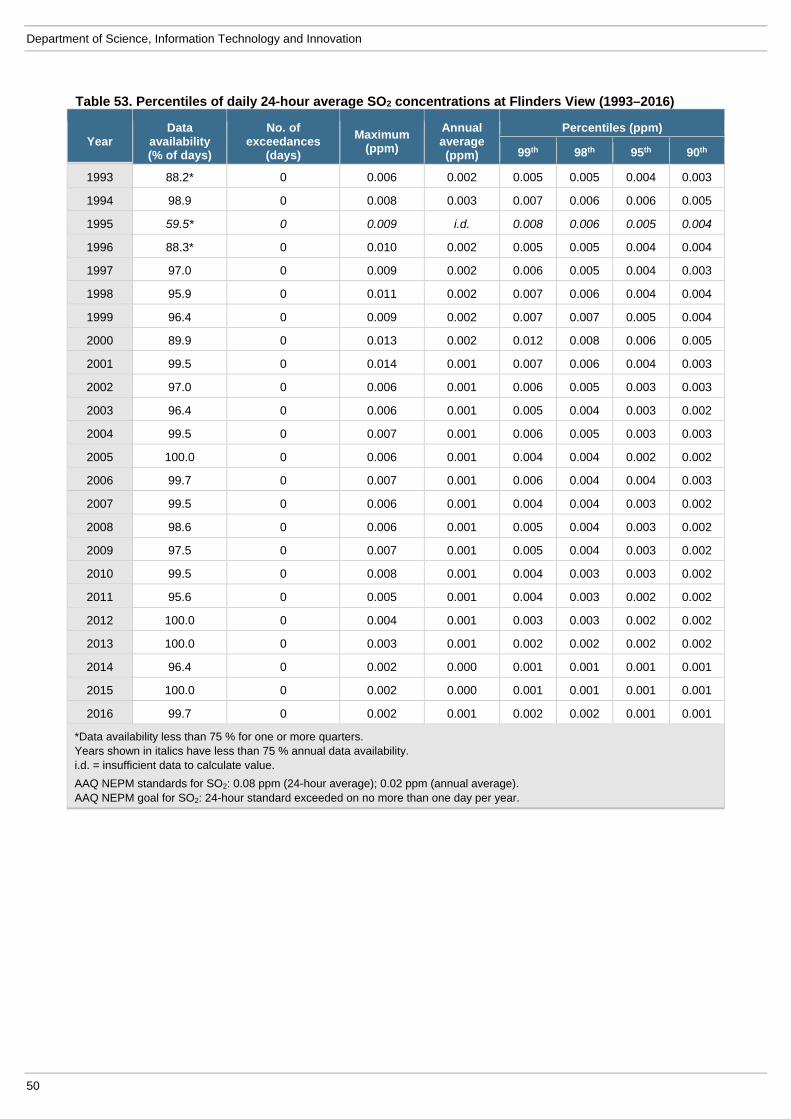
Department of Science, Information Technology and Innovation
50
Table 53. Percentiles of daily 24-hour average SO2 concentrations at Flinders View (1993–2016)
Year Data
availability (% of days)
No. of exceedances
(days)
Maximum (ppm)
Annual average (ppm)
Percentiles (ppm)
99th 98th 95th 90th
1993 88.2* 0 0.006 0.002 0.005 0.005 0.004 0.003
1994 98.9 0 0.008 0.003 0.007 0.006 0.006 0.005
1995 59.5* 0 0.009 i.d. 0.008 0.006 0.005 0.004
1996 88.3* 0 0.010 0.002 0.005 0.005 0.004 0.004
1997 97.0 0 0.009 0.002 0.006 0.005 0.004 0.003
1998 95.9 0 0.011 0.002 0.007 0.006 0.004 0.004
1999 96.4 0 0.009 0.002 0.007 0.007 0.005 0.004
2000 89.9 0 0.013 0.002 0.012 0.008 0.006 0.005
2001 99.5 0 0.014 0.001 0.007 0.006 0.004 0.003
2002 97.0 0 0.006 0.001 0.006 0.005 0.003 0.003
2003 96.4 0 0.006 0.001 0.005 0.004 0.003 0.002
2004 99.5 0 0.007 0.001 0.006 0.005 0.003 0.003
2005 100.0 0 0.006 0.001 0.004 0.004 0.002 0.002
2006 99.7 0 0.007 0.001 0.006 0.004 0.004 0.003
2007 99.5 0 0.006 0.001 0.004 0.004 0.003 0.002
2008 98.6 0 0.006 0.001 0.005 0.004 0.003 0.002
2009 97.5 0 0.007 0.001 0.005 0.004 0.003 0.002
2010 99.5 0 0.008 0.001 0.004 0.003 0.003 0.002
2011 95.6 0 0.005 0.001 0.004 0.003 0.002 0.002
2012 100.0 0 0.004 0.001 0.003 0.003 0.002 0.002
2013 100.0 0 0.003 0.001 0.002 0.002 0.002 0.002
2014 96.4 0 0.002 0.000 0.001 0.001 0.001 0.001
2015 100.0 0 0.002 0.000 0.001 0.001 0.001 0.001
2016 99.7 0 0.002 0.001 0.002 0.002 0.001 0.001
*Data availability less than 75 % for one or more quarters. Years shown in italics have less than 75 % annual data availability. i.d. = insufficient data to calculate value.
AAQ NEPM standards for SO2: 0.08 ppm (24-hour average); 0.02 ppm (annual average). AAQ NEPM goal for SO2: 24-hour standard exceeded on no more than one day per year.
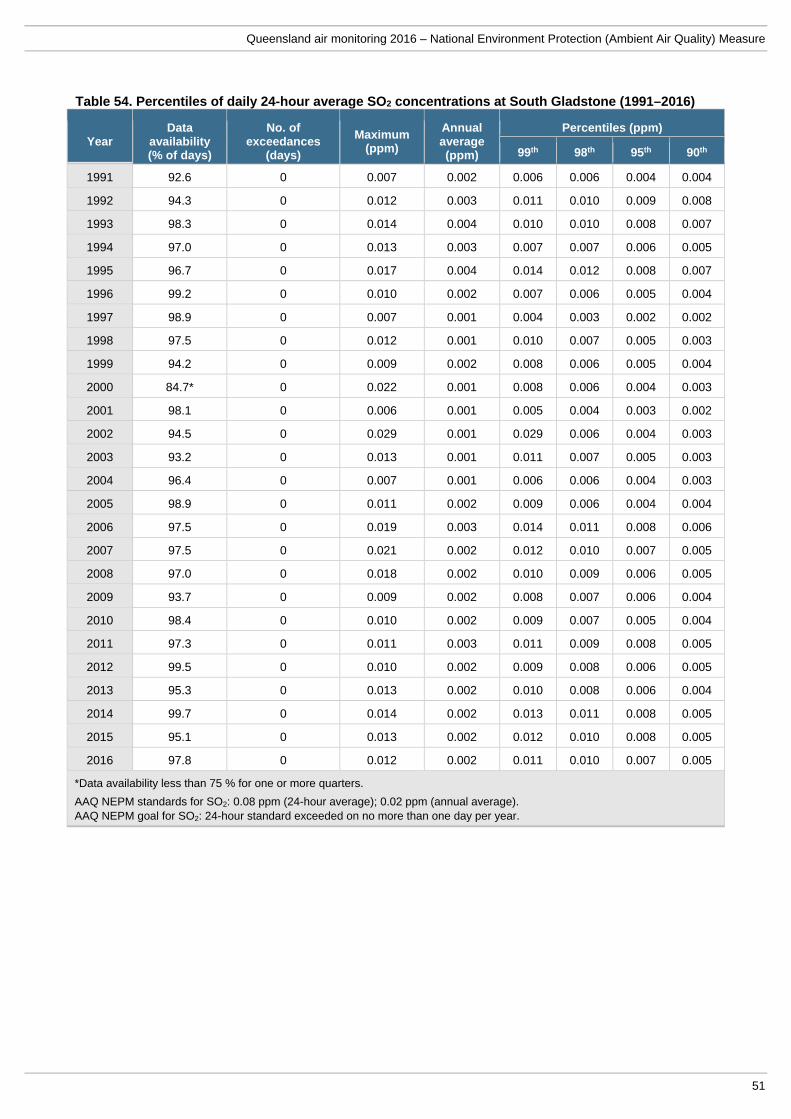
Queensland air monitoring 2016 – National Environment Protection (Ambient Air Quality) Measure
51
Table 54. Percentiles of daily 24-hour average SO2 concentrations at South Gladstone (1991–2016)
Year Data
availability (% of days)
No. of exceedances
(days)
Maximum (ppm)
Annual average (ppm)
Percentiles (ppm)
99th 98th 95th 90th
1991 92.6 0 0.007 0.002 0.006 0.006 0.004 0.004
1992 94.3 0 0.012 0.003 0.011 0.010 0.009 0.008
1993 98.3 0 0.014 0.004 0.010 0.010 0.008 0.007
1994 97.0 0 0.013 0.003 0.007 0.007 0.006 0.005
1995 96.7 0 0.017 0.004 0.014 0.012 0.008 0.007
1996 99.2 0 0.010 0.002 0.007 0.006 0.005 0.004
1997 98.9 0 0.007 0.001 0.004 0.003 0.002 0.002
1998 97.5 0 0.012 0.001 0.010 0.007 0.005 0.003
1999 94.2 0 0.009 0.002 0.008 0.006 0.005 0.004
2000 84.7* 0 0.022 0.001 0.008 0.006 0.004 0.003
2001 98.1 0 0.006 0.001 0.005 0.004 0.003 0.002
2002 94.5 0 0.029 0.001 0.029 0.006 0.004 0.003
2003 93.2 0 0.013 0.001 0.011 0.007 0.005 0.003
2004 96.4 0 0.007 0.001 0.006 0.006 0.004 0.003
2005 98.9 0 0.011 0.002 0.009 0.006 0.004 0.004
2006 97.5 0 0.019 0.003 0.014 0.011 0.008 0.006
2007 97.5 0 0.021 0.002 0.012 0.010 0.007 0.005
2008 97.0 0 0.018 0.002 0.010 0.009 0.006 0.005
2009 93.7 0 0.009 0.002 0.008 0.007 0.006 0.004
2010 98.4 0 0.010 0.002 0.009 0.007 0.005 0.004
2011 97.3 0 0.011 0.003 0.011 0.009 0.008 0.005
2012 99.5 0 0.010 0.002 0.009 0.008 0.006 0.005
2013 95.3 0 0.013 0.002 0.010 0.008 0.006 0.004
2014 99.7 0 0.014 0.002 0.013 0.011 0.008 0.005
2015 95.1 0 0.013 0.002 0.012 0.010 0.008 0.005
2016 97.8 0 0.012 0.002 0.011 0.010 0.007 0.005
*Data availability less than 75 % for one or more quarters.
AAQ NEPM standards for SO2: 0.08 ppm (24-hour average); 0.02 ppm (annual average). AAQ NEPM goal for SO2: 24-hour standard exceeded on no more than one day per year.

Department of Science, Information Technology and Innovation
52
Table 55. Percentiles of daily 24-hour average SO2 concentrations at Pimlico (2005–2016)
Year Data
availability (% of days)
No. of exceedances
(days)
Maximum (ppm)
Annual average (ppm)
Percentiles (ppm)
99th 98th 95th 90th
2005 18.1* 0 0.001 i.d. 0.001 0.001 0.001 0.000
2006 96.2 0 0.003 0.000 0.002 0.002 0.002 0.001
2007 97.0 0 0.003 0.001 0.003 0.002 0.002 0.001
2008 98.9 0 0.001 0.000 0.001 0.001 0.001 0.000
2009 95.1 0 0.003 0.000 0.002 0.001 0.001 0.001
2010 90.1* 0 0.003 0.000 0.003 0.003 0.002 0.001
2011 94.2 0 0.006 0.001 0.006 0.005 0.004 0.003
2012 99.5 0 0.003 0.001 0.002 0.002 0.002 0.001
2013 94.8 0 0.002 0.000 0.001 0.001 0.001 0.001
2014 99.7 0 0.002 0.001 0.002 0.002 0.001 0.001
2015 99.5 0 0.003 0.001 0.003 0.002 0.001 0.001
2016 16.1 0 0.001 i.d. 0.001 0.001 0.001 0.001
*Data availability less than 75 % for one or more quarters. Years shown in italics have less than 75 % annual data availability. i.d. = insufficient data to calculate value.
AAQ NEPM standards for SO2: 0.08 ppm (24-hour average); 0.02 ppm (annual average). AAQ NEPM goal for SO2: 1-hour standard exceeded on no more than one day per year.
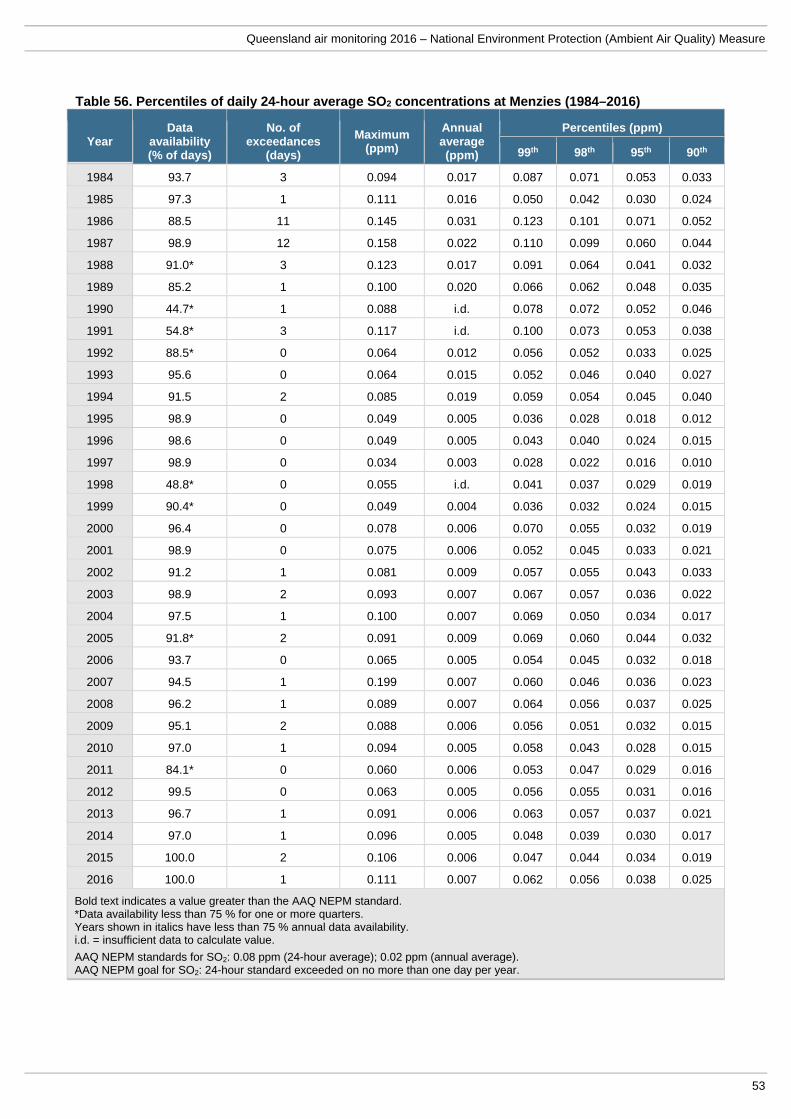
Queensland air monitoring 2016 – National Environment Protection (Ambient Air Quality) Measure
53
Table 56. Percentiles of daily 24-hour average SO2 concentrations at Menzies (1984–2016)
Year Data
availability (% of days)
No. of exceedances
(days)
Maximum (ppm)
Annual average (ppm)
Percentiles (ppm)
99th 98th 95th 90th
1984 93.7 3 0.094 0.017 0.087 0.071 0.053 0.033
1985 97.3 1 0.111 0.016 0.050 0.042 0.030 0.024
1986 88.5 11 0.145 0.031 0.123 0.101 0.071 0.052
1987 98.9 12 0.158 0.022 0.110 0.099 0.060 0.044
1988 91.0* 3 0.123 0.017 0.091 0.064 0.041 0.032
1989 85.2 1 0.100 0.020 0.066 0.062 0.048 0.035
1990 44.7* 1 0.088 i.d. 0.078 0.072 0.052 0.046
1991 54.8* 3 0.117 i.d. 0.100 0.073 0.053 0.038
1992 88.5* 0 0.064 0.012 0.056 0.052 0.033 0.025
1993 95.6 0 0.064 0.015 0.052 0.046 0.040 0.027
1994 91.5 2 0.085 0.019 0.059 0.054 0.045 0.040
1995 98.9 0 0.049 0.005 0.036 0.028 0.018 0.012
1996 98.6 0 0.049 0.005 0.043 0.040 0.024 0.015
1997 98.9 0 0.034 0.003 0.028 0.022 0.016 0.010
1998 48.8* 0 0.055 i.d. 0.041 0.037 0.029 0.019
1999 90.4* 0 0.049 0.004 0.036 0.032 0.024 0.015
2000 96.4 0 0.078 0.006 0.070 0.055 0.032 0.019
2001 98.9 0 0.075 0.006 0.052 0.045 0.033 0.021
2002 91.2 1 0.081 0.009 0.057 0.055 0.043 0.033
2003 98.9 2 0.093 0.007 0.067 0.057 0.036 0.022
2004 97.5 1 0.100 0.007 0.069 0.050 0.034 0.017
2005 91.8* 2 0.091 0.009 0.069 0.060 0.044 0.032
2006 93.7 0 0.065 0.005 0.054 0.045 0.032 0.018
2007 94.5 1 0.199 0.007 0.060 0.046 0.036 0.023
2008 96.2 1 0.089 0.007 0.064 0.056 0.037 0.025
2009 95.1 2 0.088 0.006 0.056 0.051 0.032 0.015
2010 97.0 1 0.094 0.005 0.058 0.043 0.028 0.015
2011 84.1* 0 0.060 0.006 0.053 0.047 0.029 0.016
2012 99.5 0 0.063 0.005 0.056 0.055 0.031 0.016
2013 96.7 1 0.091 0.006 0.063 0.057 0.037 0.021
2014 97.0 1 0.096 0.005 0.048 0.039 0.030 0.017
2015 100.0 2 0.106 0.006 0.047 0.044 0.034 0.019
2016 100.0 1 0.111 0.007 0.062 0.056 0.038 0.025
Bold text indicates a value greater than the AAQ NEPM standard. *Data availability less than 75 % for one or more quarters. Years shown in italics have less than 75 % annual data availability. i.d. = insufficient data to calculate value.
AAQ NEPM standards for SO2: 0.08 ppm (24-hour average); 0.02 ppm (annual average). AAQ NEPM goal for SO2: 24-hour standard exceeded on no more than one day per year.
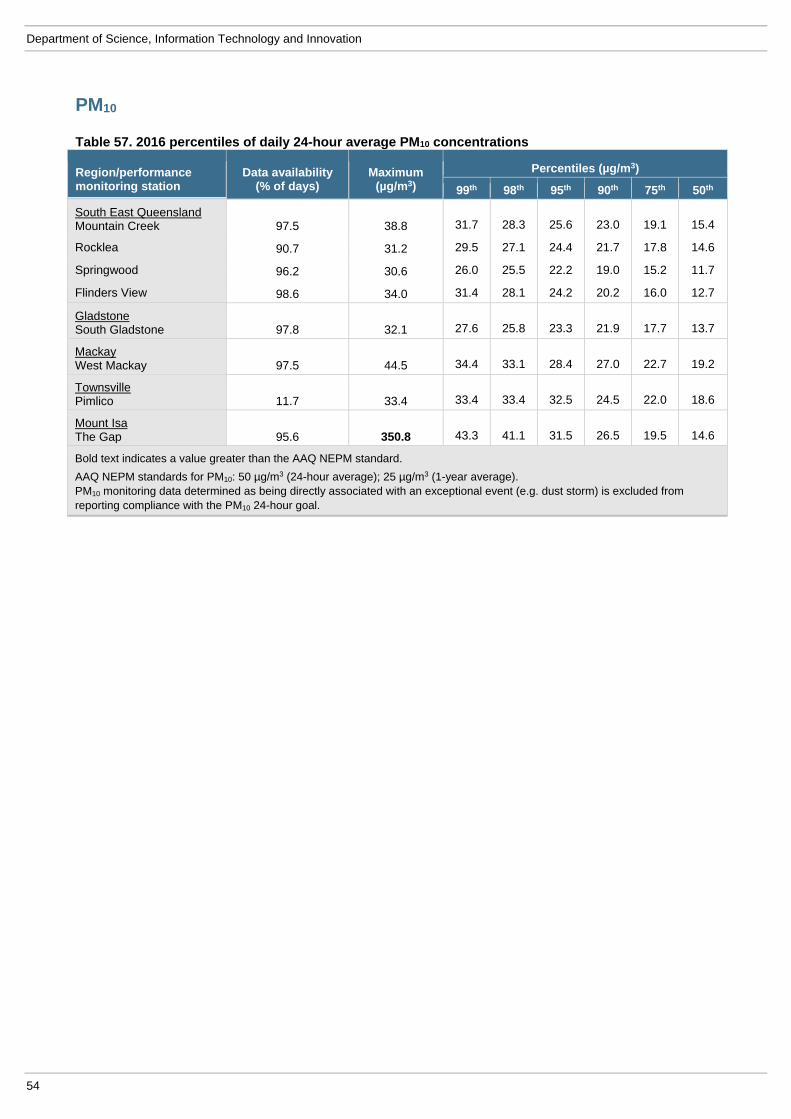
Department of Science, Information Technology and Innovation
54
PM10
Table 57. 2016 percentiles of daily 24-hour average PM10 concentrations
Region/performance monitoring station
Data availability (% of days)
Maximum (µg/m3)
Percentiles (µg/m3)
99th 98th 95th 90th 75th 50th
South East Queensland Mountain Creek 97.5 38.8 31.7 28.3 25.6 23.0 19.1 15.4
Rocklea 90.7 31.2 29.5 27.1 24.4 21.7 17.8 14.6
Springwood 96.2 30.6 26.0 25.5 22.2 19.0 15.2 11.7
Flinders View 98.6 34.0 31.4 28.1 24.2 20.2 16.0 12.7
Gladstone South Gladstone 97.8 32.1 27.6 25.8 23.3 21.9 17.7 13.7
Mackay West Mackay 97.5 44.5 34.4 33.1 28.4 27.0 22.7 19.2
Townsville Pimlico 11.7 33.4 33.4 33.4 32.5 24.5 22.0 18.6
Mount Isa The Gap 95.6 350.8 43.3 41.1 31.5 26.5 19.5 14.6
Bold text indicates a value greater than the AAQ NEPM standard.
AAQ NEPM standards for PM10: 50 µg/m3 (24-hour average); 25 µg/m3 (1-year average). PM10 monitoring data determined as being directly associated with an exceptional event (e.g. dust storm) is excluded from reporting compliance with the PM10 24-hour goal.
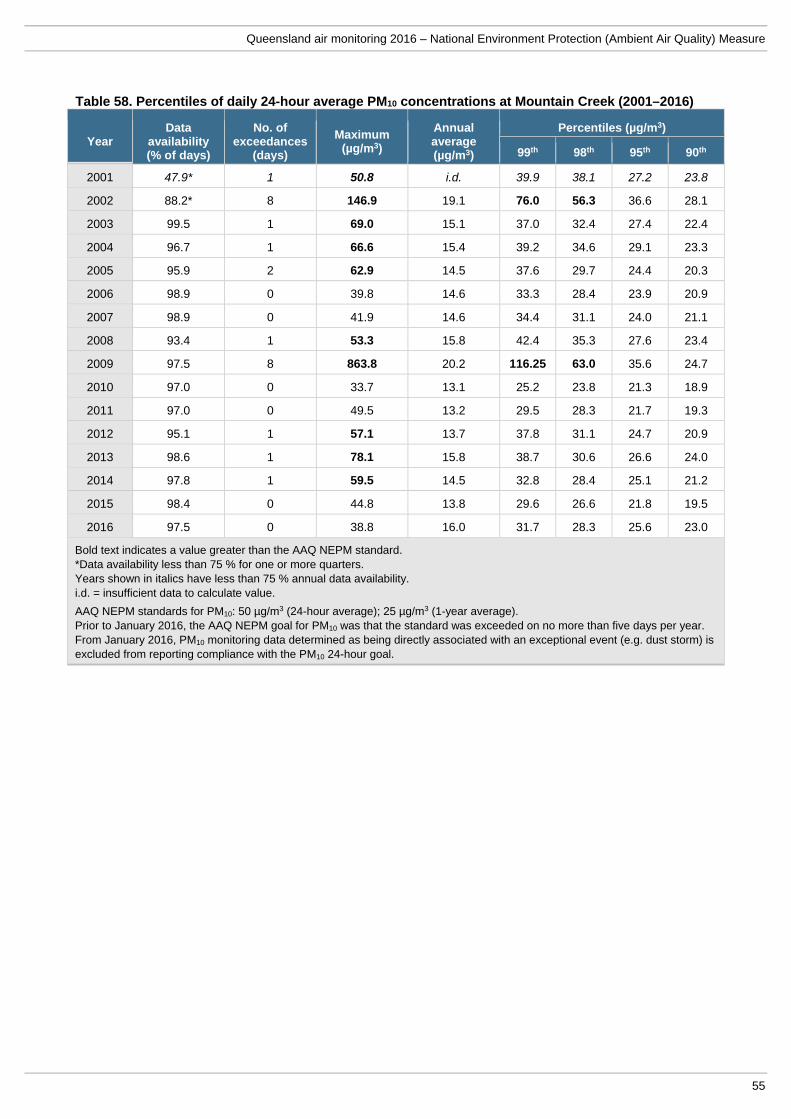
Queensland air monitoring 2016 – National Environment Protection (Ambient Air Quality) Measure
55
Table 58. Percentiles of daily 24-hour average PM10 concentrations at Mountain Creek (2001–2016)
Year Data
availability (% of days)
No. of exceedances
(days)
Maximum (µg/m3)
Annual average (µg/m3)
Percentiles (µg/m3)
99th 98th 95th 90th
2001 47.9* 1 50.8 i.d. 39.9 38.1 27.2 23.8
2002 88.2* 8 146.9 19.1 76.0 56.3 36.6 28.1
2003 99.5 1 69.0 15.1 37.0 32.4 27.4 22.4
2004 96.7 1 66.6 15.4 39.2 34.6 29.1 23.3
2005 95.9 2 62.9 14.5 37.6 29.7 24.4 20.3
2006 98.9 0 39.8 14.6 33.3 28.4 23.9 20.9
2007 98.9 0 41.9 14.6 34.4 31.1 24.0 21.1
2008 93.4 1 53.3 15.8 42.4 35.3 27.6 23.4
2009 97.5 8 863.8 20.2 116.25 63.0 35.6 24.7
2010 97.0 0 33.7 13.1 25.2 23.8 21.3 18.9
2011 97.0 0 49.5 13.2 29.5 28.3 21.7 19.3
2012 95.1 1 57.1 13.7 37.8 31.1 24.7 20.9
2013 98.6 1 78.1 15.8 38.7 30.6 26.6 24.0
2014 97.8 1 59.5 14.5 32.8 28.4 25.1 21.2
2015 98.4 0 44.8 13.8 29.6 26.6 21.8 19.5
2016 97.5 0 38.8 16.0 31.7 28.3 25.6 23.0
Bold text indicates a value greater than the AAQ NEPM standard. *Data availability less than 75 % for one or more quarters. Years shown in italics have less than 75 % annual data availability. i.d. = insufficient data to calculate value.
AAQ NEPM standards for PM10: 50 µg/m3 (24-hour average); 25 µg/m3 (1-year average). Prior to January 2016, the AAQ NEPM goal for PM10 was that the standard was exceeded on no more than five days per year. From January 2016, PM10 monitoring data determined as being directly associated with an exceptional event (e.g. dust storm) is excluded from reporting compliance with the PM10 24-hour goal.
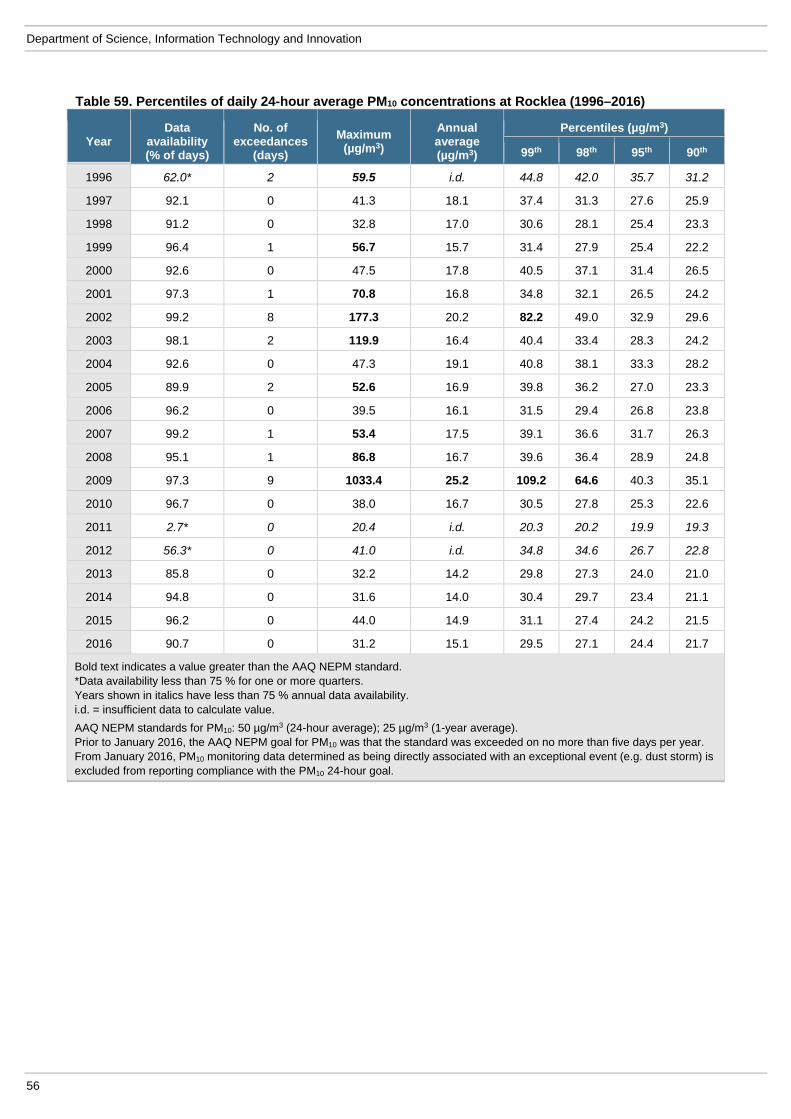
Department of Science, Information Technology and Innovation
56
Table 59. Percentiles of daily 24-hour average PM10 concentrations at Rocklea (1996–2016)
Year Data
availability (% of days)
No. of exceedances
(days)
Maximum (µg/m3)
Annual average (µg/m3)
Percentiles (µg/m3)
99th 98th 95th 90th
1996 62.0* 2 59.5 i.d. 44.8 42.0 35.7 31.2
1997 92.1 0 41.3 18.1 37.4 31.3 27.6 25.9
1998 91.2 0 32.8 17.0 30.6 28.1 25.4 23.3
1999 96.4 1 56.7 15.7 31.4 27.9 25.4 22.2
2000 92.6 0 47.5 17.8 40.5 37.1 31.4 26.5
2001 97.3 1 70.8 16.8 34.8 32.1 26.5 24.2
2002 99.2 8 177.3 20.2 82.2 49.0 32.9 29.6
2003 98.1 2 119.9 16.4 40.4 33.4 28.3 24.2
2004 92.6 0 47.3 19.1 40.8 38.1 33.3 28.2
2005 89.9 2 52.6 16.9 39.8 36.2 27.0 23.3
2006 96.2 0 39.5 16.1 31.5 29.4 26.8 23.8
2007 99.2 1 53.4 17.5 39.1 36.6 31.7 26.3
2008 95.1 1 86.8 16.7 39.6 36.4 28.9 24.8
2009 97.3 9 1033.4 25.2 109.2 64.6 40.3 35.1
2010 96.7 0 38.0 16.7 30.5 27.8 25.3 22.6
2011 2.7* 0 20.4 i.d. 20.3 20.2 19.9 19.3
2012 56.3* 0 41.0 i.d. 34.8 34.6 26.7 22.8
2013 85.8 0 32.2 14.2 29.8 27.3 24.0 21.0
2014 94.8 0 31.6 14.0 30.4 29.7 23.4 21.1
2015 96.2 0 44.0 14.9 31.1 27.4 24.2 21.5
2016 90.7 0 31.2 15.1 29.5 27.1 24.4 21.7
Bold text indicates a value greater than the AAQ NEPM standard. *Data availability less than 75 % for one or more quarters. Years shown in italics have less than 75 % annual data availability. i.d. = insufficient data to calculate value.
AAQ NEPM standards for PM10: 50 µg/m3 (24-hour average); 25 µg/m3 (1-year average). Prior to January 2016, the AAQ NEPM goal for PM10 was that the standard was exceeded on no more than five days per year. From January 2016, PM10 monitoring data determined as being directly associated with an exceptional event (e.g. dust storm) is excluded from reporting compliance with the PM10 24-hour goal.
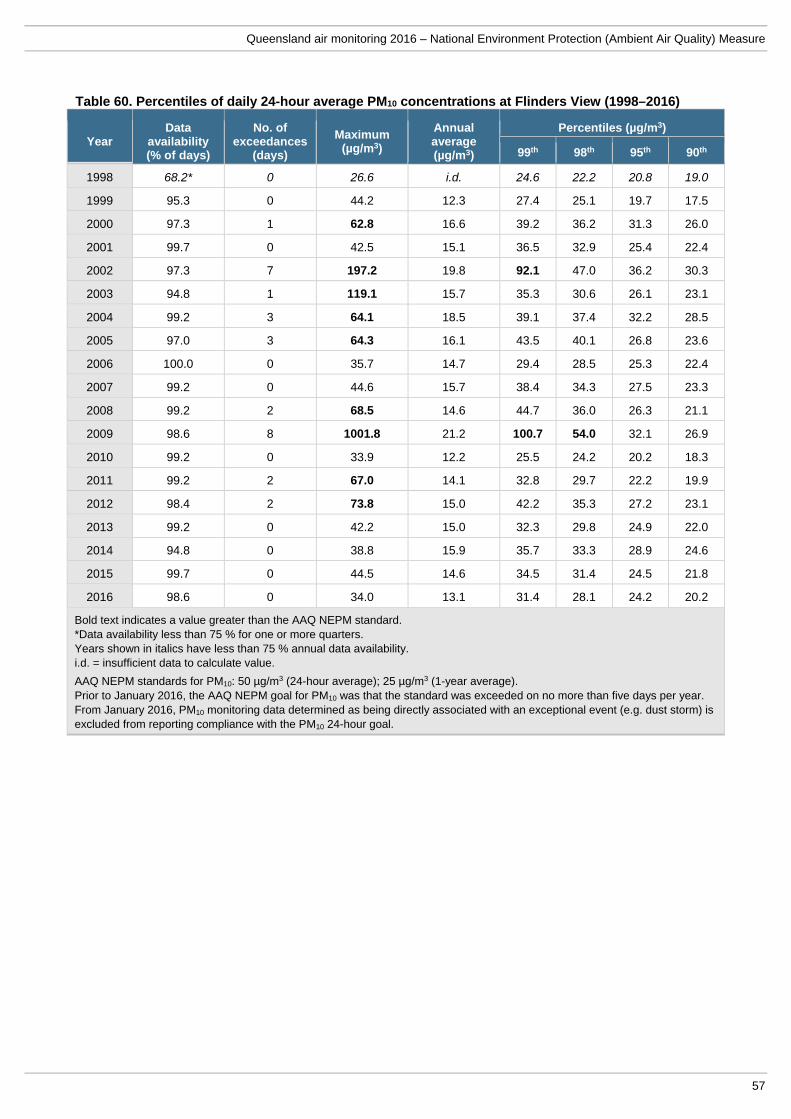
Queensland air monitoring 2016 – National Environment Protection (Ambient Air Quality) Measure
57
Table 60. Percentiles of daily 24-hour average PM10 concentrations at Flinders View (1998–2016)
Year Data
availability (% of days)
No. of exceedances
(days)
Maximum (µg/m3)
Annual average (µg/m3)
Percentiles (µg/m3)
99th 98th 95th 90th
1998 68.2* 0 26.6 i.d. 24.6 22.2 20.8 19.0
1999 95.3 0 44.2 12.3 27.4 25.1 19.7 17.5
2000 97.3 1 62.8 16.6 39.2 36.2 31.3 26.0
2001 99.7 0 42.5 15.1 36.5 32.9 25.4 22.4
2002 97.3 7 197.2 19.8 92.1 47.0 36.2 30.3
2003 94.8 1 119.1 15.7 35.3 30.6 26.1 23.1
2004 99.2 3 64.1 18.5 39.1 37.4 32.2 28.5
2005 97.0 3 64.3 16.1 43.5 40.1 26.8 23.6
2006 100.0 0 35.7 14.7 29.4 28.5 25.3 22.4
2007 99.2 0 44.6 15.7 38.4 34.3 27.5 23.3
2008 99.2 2 68.5 14.6 44.7 36.0 26.3 21.1
2009 98.6 8 1001.8 21.2 100.7 54.0 32.1 26.9
2010 99.2 0 33.9 12.2 25.5 24.2 20.2 18.3
2011 99.2 2 67.0 14.1 32.8 29.7 22.2 19.9
2012 98.4 2 73.8 15.0 42.2 35.3 27.2 23.1
2013 99.2 0 42.2 15.0 32.3 29.8 24.9 22.0
2014 94.8 0 38.8 15.9 35.7 33.3 28.9 24.6
2015 99.7 0 44.5 14.6 34.5 31.4 24.5 21.8
2016 98.6 0 34.0 13.1 31.4 28.1 24.2 20.2
Bold text indicates a value greater than the AAQ NEPM standard. *Data availability less than 75 % for one or more quarters. Years shown in italics have less than 75 % annual data availability. i.d. = insufficient data to calculate value.
AAQ NEPM standards for PM10: 50 µg/m3 (24-hour average); 25 µg/m3 (1-year average). Prior to January 2016, the AAQ NEPM goal for PM10 was that the standard was exceeded on no more than five days per year. From January 2016, PM10 monitoring data determined as being directly associated with an exceptional event (e.g. dust storm) is excluded from reporting compliance with the PM10 24-hour goal.
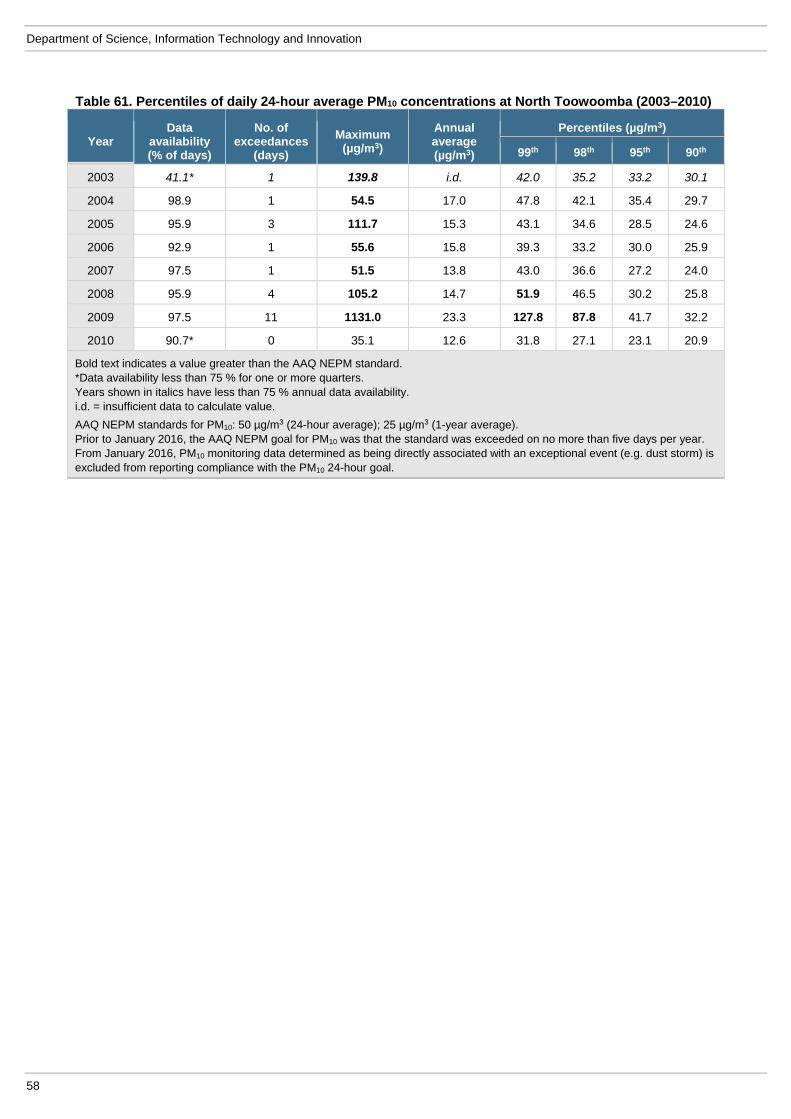
Department of Science, Information Technology and Innovation
58
Table 61. Percentiles of daily 24-hour average PM10 concentrations at North Toowoomba (2003–2010)
Year Data
availability (% of days)
No. of exceedances
(days)
Maximum (µg/m3)
Annual average (µg/m3)
Percentiles (µg/m3)
99th 98th 95th 90th
2003 41.1* 1 139.8 i.d. 42.0 35.2 33.2 30.1
2004 98.9 1 54.5 17.0 47.8 42.1 35.4 29.7
2005 95.9 3 111.7 15.3 43.1 34.6 28.5 24.6
2006 92.9 1 55.6 15.8 39.3 33.2 30.0 25.9
2007 97.5 1 51.5 13.8 43.0 36.6 27.2 24.0
2008 95.9 4 105.2 14.7 51.9 46.5 30.2 25.8
2009 97.5 11 1131.0 23.3 127.8 87.8 41.7 32.2
2010 90.7* 0 35.1 12.6 31.8 27.1 23.1 20.9
Bold text indicates a value greater than the AAQ NEPM standard. *Data availability less than 75 % for one or more quarters. Years shown in italics have less than 75 % annual data availability. i.d. = insufficient data to calculate value.
AAQ NEPM standards for PM10: 50 µg/m3 (24-hour average); 25 µg/m3 (1-year average). Prior to January 2016, the AAQ NEPM goal for PM10 was that the standard was exceeded on no more than five days per year. From January 2016, PM10 monitoring data determined as being directly associated with an exceptional event (e.g. dust storm) is excluded from reporting compliance with the PM10 24-hour goal.
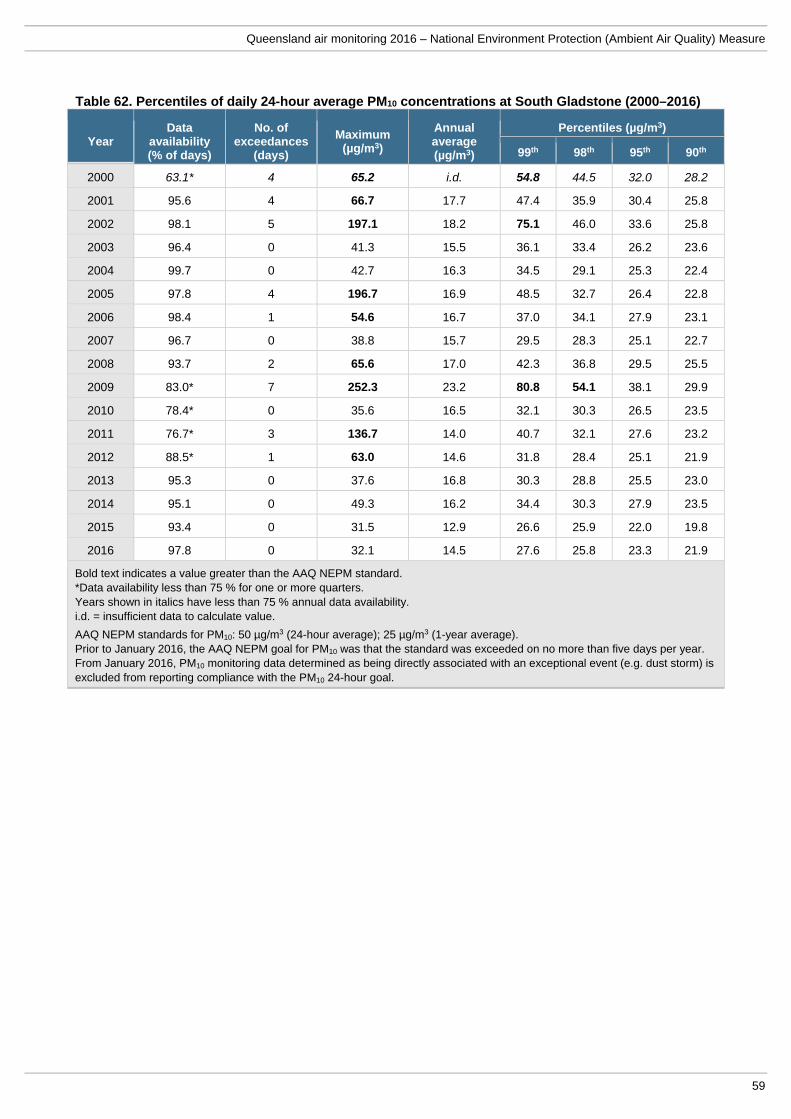
Queensland air monitoring 2016 – National Environment Protection (Ambient Air Quality) Measure
59
Table 62. Percentiles of daily 24-hour average PM10 concentrations at South Gladstone (2000–2016)
Year Data
availability (% of days)
No. of exceedances
(days)
Maximum (µg/m3)
Annual average (µg/m3)
Percentiles (µg/m3)
99th 98th 95th 90th
2000 63.1* 4 65.2 i.d. 54.8 44.5 32.0 28.2
2001 95.6 4 66.7 17.7 47.4 35.9 30.4 25.8
2002 98.1 5 197.1 18.2 75.1 46.0 33.6 25.8
2003 96.4 0 41.3 15.5 36.1 33.4 26.2 23.6
2004 99.7 0 42.7 16.3 34.5 29.1 25.3 22.4
2005 97.8 4 196.7 16.9 48.5 32.7 26.4 22.8
2006 98.4 1 54.6 16.7 37.0 34.1 27.9 23.1
2007 96.7 0 38.8 15.7 29.5 28.3 25.1 22.7
2008 93.7 2 65.6 17.0 42.3 36.8 29.5 25.5
2009 83.0* 7 252.3 23.2 80.8 54.1 38.1 29.9
2010 78.4* 0 35.6 16.5 32.1 30.3 26.5 23.5
2011 76.7* 3 136.7 14.0 40.7 32.1 27.6 23.2
2012 88.5* 1 63.0 14.6 31.8 28.4 25.1 21.9
2013 95.3 0 37.6 16.8 30.3 28.8 25.5 23.0
2014 95.1 0 49.3 16.2 34.4 30.3 27.9 23.5
2015 93.4 0 31.5 12.9 26.6 25.9 22.0 19.8
2016 97.8 0 32.1 14.5 27.6 25.8 23.3 21.9
Bold text indicates a value greater than the AAQ NEPM standard. *Data availability less than 75 % for one or more quarters. Years shown in italics have less than 75 % annual data availability. i.d. = insufficient data to calculate value.
AAQ NEPM standards for PM10: 50 µg/m3 (24-hour average); 25 µg/m3 (1-year average). Prior to January 2016, the AAQ NEPM goal for PM10 was that the standard was exceeded on no more than five days per year. From January 2016, PM10 monitoring data determined as being directly associated with an exceptional event (e.g. dust storm) is excluded from reporting compliance with the PM10 24-hour goal.

Department of Science, Information Technology and Innovation
60
Table 63. Percentiles of daily 24-hour average PM10 concentrations at West Mackay (1998–2016)
Year Data
availability (% of days)
No. of exceedances
(days)
Maximum (µg/m3)
Annual average (µg/m3)
Percentiles (µg/m3)
99th 98th 95th 90th
1998 39.5* 0 28.9 i.d. 28.8 28.7 22.3 20.7
1999 93.2 1 50.4 17.3 37.6 32.2 27.7 25.6
2000 98.9 2 51.6 18.9 48.4 43.0 34.0 29.9
2001 98.6 2 52.6 22.0 48.5 42.8 37.9 33.5
2002 98.6 5 475.4 24.6 51.2 46.4 37.4 33.1
2003 92.3 7 85.0 21.5 53.2 49.1 38.9 32.2
2004 97.3 0 45.3 20.7 39.6 37.7 33.6 29.6
2005 97.0 7 146.0 22.0 105.1 52.6 36.3 31.1
2006 95.6 1 106.0 19.8 41.5 36.2 31.7 28.4
2007 95.6 2 61.1 21.6 49.1 46.1 38.5 33.1
2008 98.4 9 94.0 23.6 61.4 53.1 43.9 36.4
2009 97.5 18 514.8 28.6 202.6 89.8 50.9 40.8
2010 83.0* 0 44.0 18.5 41.4 35.8 30.7 27.1
2011 92.9 1 65.8 19.9 41.8 39.4 36.2 30.2
2012 98.9 1 64.9 17.8 40.0 37.4 27.6 24.3
2013 96.4 0 42.4 18.5 36.4 30.1 26.4 24.5
2014 91.2 0 34.3 18.2 29.0 27.9 25.2 24.0
2015 91.8 0 46.5 22.0 41.9 37.8 34.1 29.5
2016 97.5 0 44.5 19.8 34.4 33.1 28.4 27.0
Bold text indicates a value greater than the AAQ NEPM standard. *Data availability less than 75 % for one or more quarters. Years shown in italics have less than 75 % annual data availability. i.d. = insufficient data to calculate value.
AAQ NEPM standards for PM10: 50 µg/m3 (24-hour average); 25 µg/m3 (1-year average). Prior to January 2016, the AAQ NEPM goal for PM10 was that the standard was exceeded on no more than five days per year. From January 2016, PM10 monitoring data determined as being directly associated with an exceptional event (e.g. dust storm) is excluded from reporting compliance with the PM10 24-hour goal.
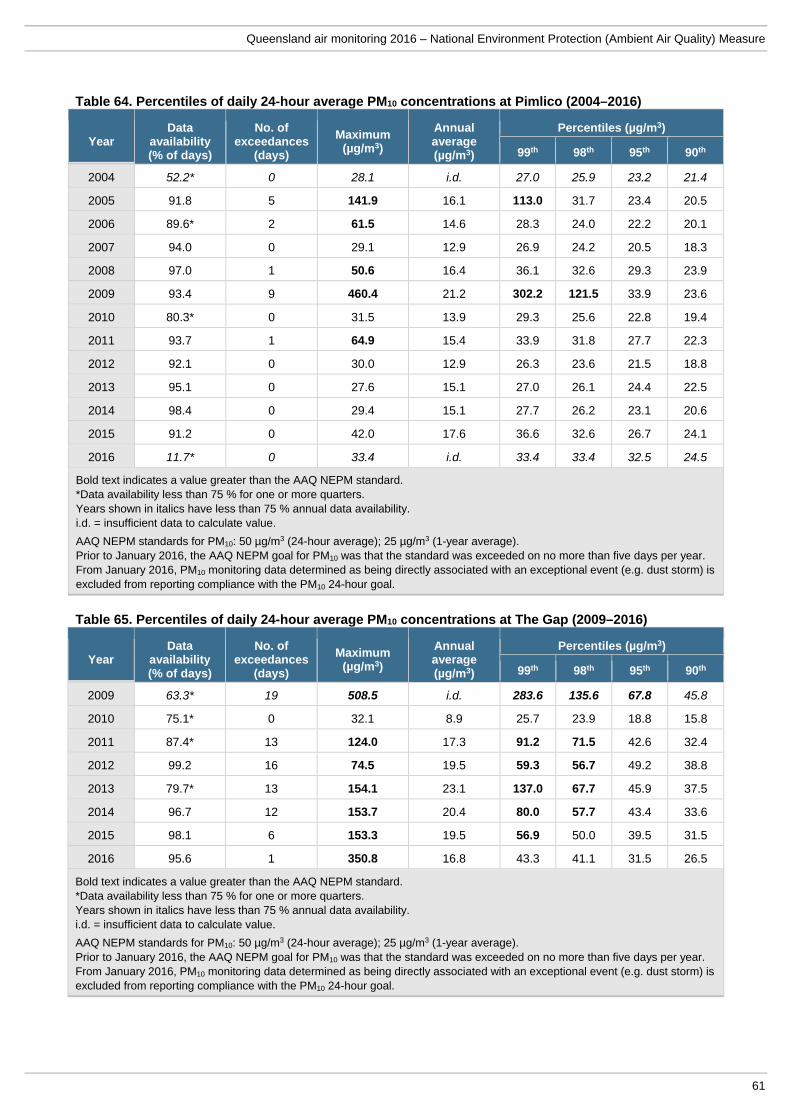
Queensland air monitoring 2016 – National Environment Protection (Ambient Air Quality) Measure
61
Table 64. Percentiles of daily 24-hour average PM10 concentrations at Pimlico (2004–2016)
Year Data
availability (% of days)
No. of exceedances
(days)
Maximum (µg/m3)
Annual average (µg/m3)
Percentiles (µg/m3)
99th 98th 95th 90th
2004 52.2* 0 28.1 i.d. 27.0 25.9 23.2 21.4
2005 91.8 5 141.9 16.1 113.0 31.7 23.4 20.5
2006 89.6* 2 61.5 14.6 28.3 24.0 22.2 20.1
2007 94.0 0 29.1 12.9 26.9 24.2 20.5 18.3
2008 97.0 1 50.6 16.4 36.1 32.6 29.3 23.9
2009 93.4 9 460.4 21.2 302.2 121.5 33.9 23.6
2010 80.3* 0 31.5 13.9 29.3 25.6 22.8 19.4
2011 93.7 1 64.9 15.4 33.9 31.8 27.7 22.3
2012 92.1 0 30.0 12.9 26.3 23.6 21.5 18.8
2013 95.1 0 27.6 15.1 27.0 26.1 24.4 22.5
2014 98.4 0 29.4 15.1 27.7 26.2 23.1 20.6
2015 91.2 0 42.0 17.6 36.6 32.6 26.7 24.1
2016 11.7* 0 33.4 i.d. 33.4 33.4 32.5 24.5
Bold text indicates a value greater than the AAQ NEPM standard. *Data availability less than 75 % for one or more quarters. Years shown in italics have less than 75 % annual data availability. i.d. = insufficient data to calculate value.
AAQ NEPM standards for PM10: 50 µg/m3 (24-hour average); 25 µg/m3 (1-year average). Prior to January 2016, the AAQ NEPM goal for PM10 was that the standard was exceeded on no more than five days per year. From January 2016, PM10 monitoring data determined as being directly associated with an exceptional event (e.g. dust storm) is excluded from reporting compliance with the PM10 24-hour goal.
Table 65. Percentiles of daily 24-hour average PM10 concentrations at The Gap (2009–2016)
Year Data
availability (% of days)
No. of exceedances
(days)
Maximum (µg/m3)
Annual average (µg/m3)
Percentiles (µg/m3)
99th 98th 95th 90th
2009 63.3* 19 508.5 i.d. 283.6 135.6 67.8 45.8
2010 75.1* 0 32.1 8.9 25.7 23.9 18.8 15.8
2011 87.4* 13 124.0 17.3 91.2 71.5 42.6 32.4
2012 99.2 16 74.5 19.5 59.3 56.7 49.2 38.8
2013 79.7* 13 154.1 23.1 137.0 67.7 45.9 37.5
2014 96.7 12 153.7 20.4 80.0 57.7 43.4 33.6
2015 98.1 6 153.3 19.5 56.9 50.0 39.5 31.5
2016 95.6 1 350.8 16.8 43.3 41.1 31.5 26.5
Bold text indicates a value greater than the AAQ NEPM standard. *Data availability less than 75 % for one or more quarters. Years shown in italics have less than 75 % annual data availability. i.d. = insufficient data to calculate value.
AAQ NEPM standards for PM10: 50 µg/m3 (24-hour average); 25 µg/m3 (1-year average). Prior to January 2016, the AAQ NEPM goal for PM10 was that the standard was exceeded on no more than five days per year. From January 2016, PM10 monitoring data determined as being directly associated with an exceptional event (e.g. dust storm) is excluded from reporting compliance with the PM10 24-hour goal.
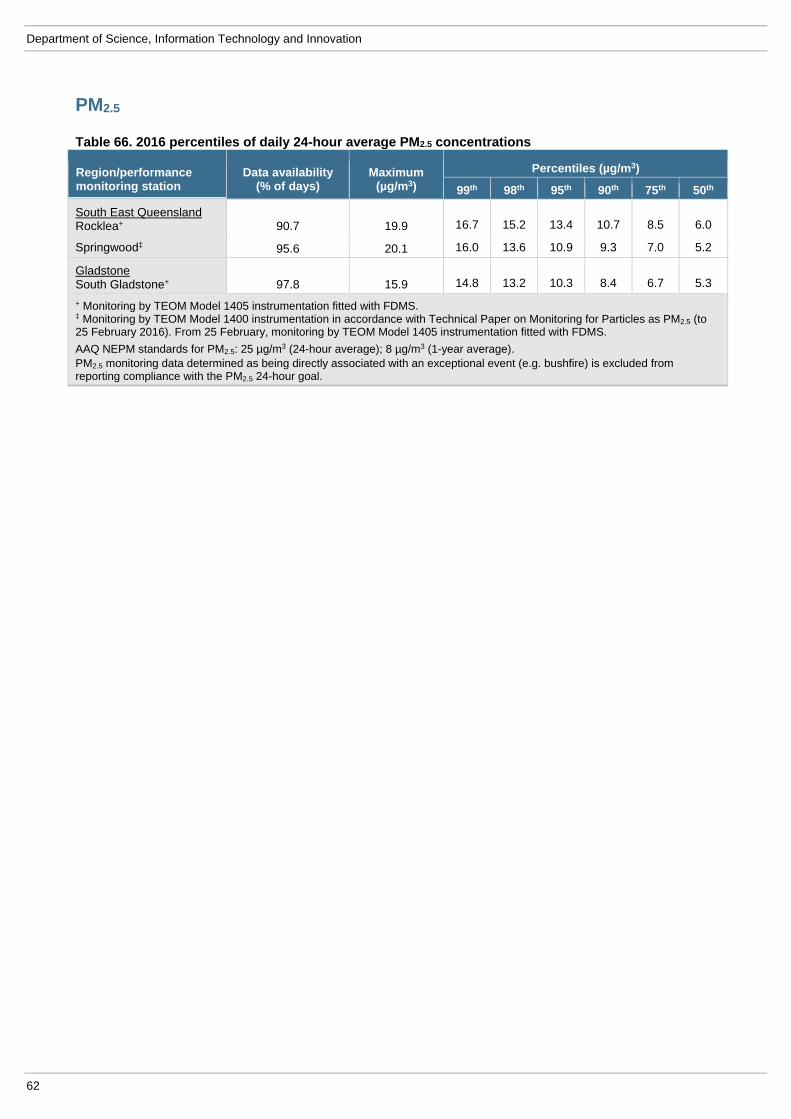
Department of Science, Information Technology and Innovation
62
PM2.5
Table 66. 2016 percentiles of daily 24-hour average PM2.5 concentrations
Region/performance monitoring station
Data availability (% of days)
Maximum (µg/m3)
Percentiles (µg/m3)
99th 98th 95th 90th 75th 50th
South East Queensland Rocklea+ 90.7 19.9 16.7 15.2 13.4 10.7 8.5 6.0
Springwood‡ 95.6 20.1 16.0 13.6 10.9 9.3 7.0 5.2
Gladstone South Gladstone+ 97.8 15.9 14.8 13.2 10.3 8.4 6.7 5.3
+ Monitoring by TEOM Model 1405 instrumentation fitted with FDMS. ‡ Monitoring by TEOM Model 1400 instrumentation in accordance with Technical Paper on Monitoring for Particles as PM2.5 (to 25 February 2016). From 25 February, monitoring by TEOM Model 1405 instrumentation fitted with FDMS. AAQ NEPM standards for PM2.5: 25 µg/m3 (24-hour average); 8 µg/m3 (1-year average). PM2.5 monitoring data determined as being directly associated with an exceptional event (e.g. bushfire) is excluded from reporting compliance with the PM2.5 24-hour goal.
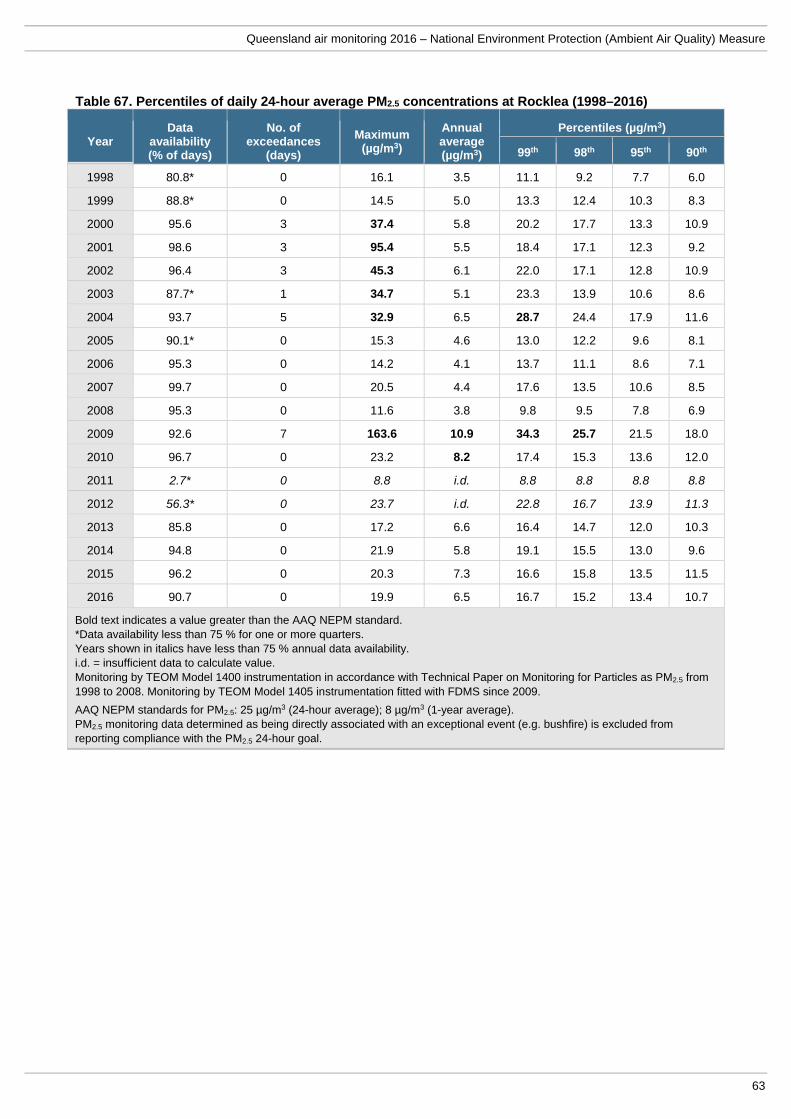
Queensland air monitoring 2016 – National Environment Protection (Ambient Air Quality) Measure
63
Table 67. Percentiles of daily 24-hour average PM2.5 concentrations at Rocklea (1998–2016)
Year Data
availability (% of days)
No. of exceedances
(days)
Maximum (µg/m3)
Annual average (µg/m3)
Percentiles (µg/m3)
99th 98th 95th 90th
1998 80.8* 0 16.1 3.5 11.1 9.2 7.7 6.0
1999 88.8* 0 14.5 5.0 13.3 12.4 10.3 8.3
2000 95.6 3 37.4 5.8 20.2 17.7 13.3 10.9
2001 98.6 3 95.4 5.5 18.4 17.1 12.3 9.2
2002 96.4 3 45.3 6.1 22.0 17.1 12.8 10.9
2003 87.7* 1 34.7 5.1 23.3 13.9 10.6 8.6
2004 93.7 5 32.9 6.5 28.7 24.4 17.9 11.6
2005 90.1* 0 15.3 4.6 13.0 12.2 9.6 8.1
2006 95.3 0 14.2 4.1 13.7 11.1 8.6 7.1
2007 99.7 0 20.5 4.4 17.6 13.5 10.6 8.5
2008 95.3 0 11.6 3.8 9.8 9.5 7.8 6.9
2009 92.6 7 163.6 10.9 34.3 25.7 21.5 18.0
2010 96.7 0 23.2 8.2 17.4 15.3 13.6 12.0
2011 2.7* 0 8.8 i.d. 8.8 8.8 8.8 8.8
2012 56.3* 0 23.7 i.d. 22.8 16.7 13.9 11.3
2013 85.8 0 17.2 6.6 16.4 14.7 12.0 10.3
2014 94.8 0 21.9 5.8 19.1 15.5 13.0 9.6
2015 96.2 0 20.3 7.3 16.6 15.8 13.5 11.5
2016 90.7 0 19.9 6.5 16.7 15.2 13.4 10.7
Bold text indicates a value greater than the AAQ NEPM standard. *Data availability less than 75 % for one or more quarters. Years shown in italics have less than 75 % annual data availability. i.d. = insufficient data to calculate value. Monitoring by TEOM Model 1400 instrumentation in accordance with Technical Paper on Monitoring for Particles as PM2.5 from 1998 to 2008. Monitoring by TEOM Model 1405 instrumentation fitted with FDMS since 2009.
AAQ NEPM standards for PM2.5: 25 µg/m3 (24-hour average); 8 µg/m3 (1-year average). PM2.5 monitoring data determined as being directly associated with an exceptional event (e.g. bushfire) is excluded from reporting compliance with the PM2.5 24-hour goal.
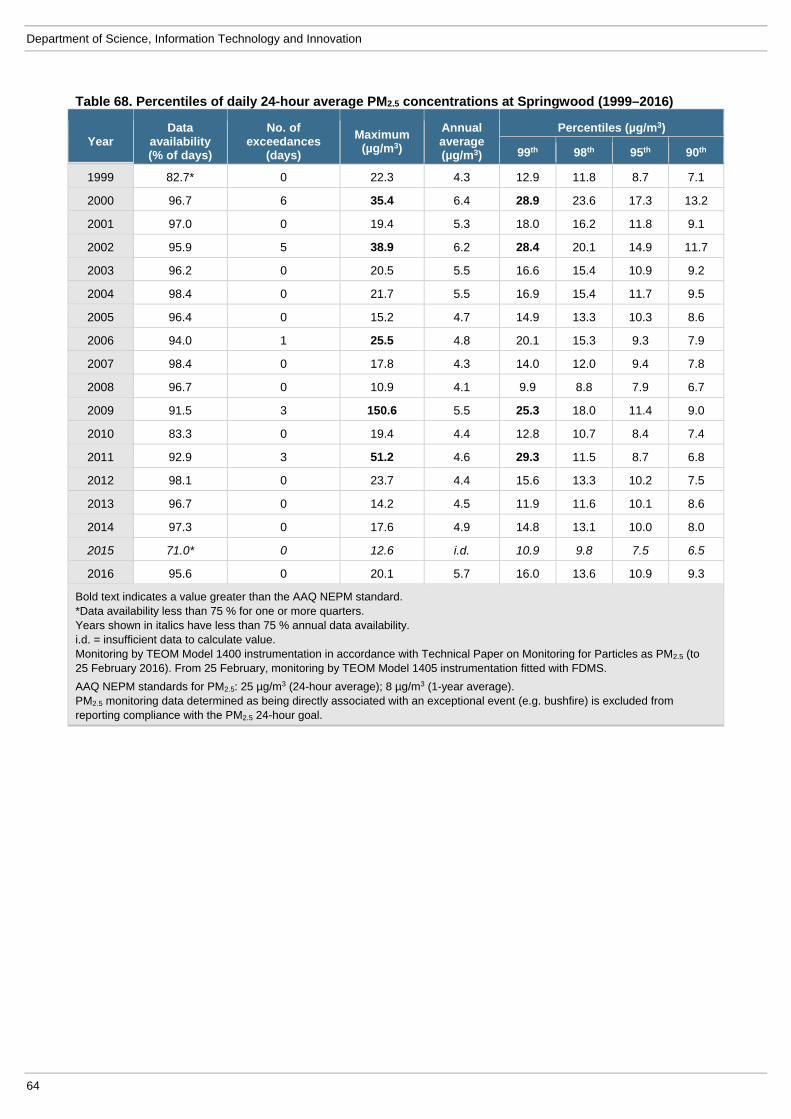
Department of Science, Information Technology and Innovation
64
Table 68. Percentiles of daily 24-hour average PM2.5 concentrations at Springwood (1999–2016)
Year Data
availability (% of days)
No. of exceedances
(days)
Maximum (µg/m3)
Annual average (µg/m3)
Percentiles (µg/m3)
99th 98th 95th 90th
1999 82.7* 0 22.3 4.3 12.9 11.8 8.7 7.1
2000 96.7 6 35.4 6.4 28.9 23.6 17.3 13.2
2001 97.0 0 19.4 5.3 18.0 16.2 11.8 9.1
2002 95.9 5 38.9 6.2 28.4 20.1 14.9 11.7
2003 96.2 0 20.5 5.5 16.6 15.4 10.9 9.2
2004 98.4 0 21.7 5.5 16.9 15.4 11.7 9.5
2005 96.4 0 15.2 4.7 14.9 13.3 10.3 8.6
2006 94.0 1 25.5 4.8 20.1 15.3 9.3 7.9
2007 98.4 0 17.8 4.3 14.0 12.0 9.4 7.8
2008 96.7 0 10.9 4.1 9.9 8.8 7.9 6.7
2009 91.5 3 150.6 5.5 25.3 18.0 11.4 9.0
2010 83.3 0 19.4 4.4 12.8 10.7 8.4 7.4
2011 92.9 3 51.2 4.6 29.3 11.5 8.7 6.8
2012 98.1 0 23.7 4.4 15.6 13.3 10.2 7.5
2013 96.7 0 14.2 4.5 11.9 11.6 10.1 8.6
2014 97.3 0 17.6 4.9 14.8 13.1 10.0 8.0
2015 71.0* 0 12.6 i.d. 10.9 9.8 7.5 6.5
2016 95.6 0 20.1 5.7 16.0 13.6 10.9 9.3
Bold text indicates a value greater than the AAQ NEPM standard. *Data availability less than 75 % for one or more quarters. Years shown in italics have less than 75 % annual data availability. i.d. = insufficient data to calculate value. Monitoring by TEOM Model 1400 instrumentation in accordance with Technical Paper on Monitoring for Particles as PM2.5 (to 25 February 2016). From 25 February, monitoring by TEOM Model 1405 instrumentation fitted with FDMS.
AAQ NEPM standards for PM2.5: 25 µg/m3 (24-hour average); 8 µg/m3 (1-year average). PM2.5 monitoring data determined as being directly associated with an exceptional event (e.g. bushfire) is excluded from reporting compliance with the PM2.5 24-hour goal.
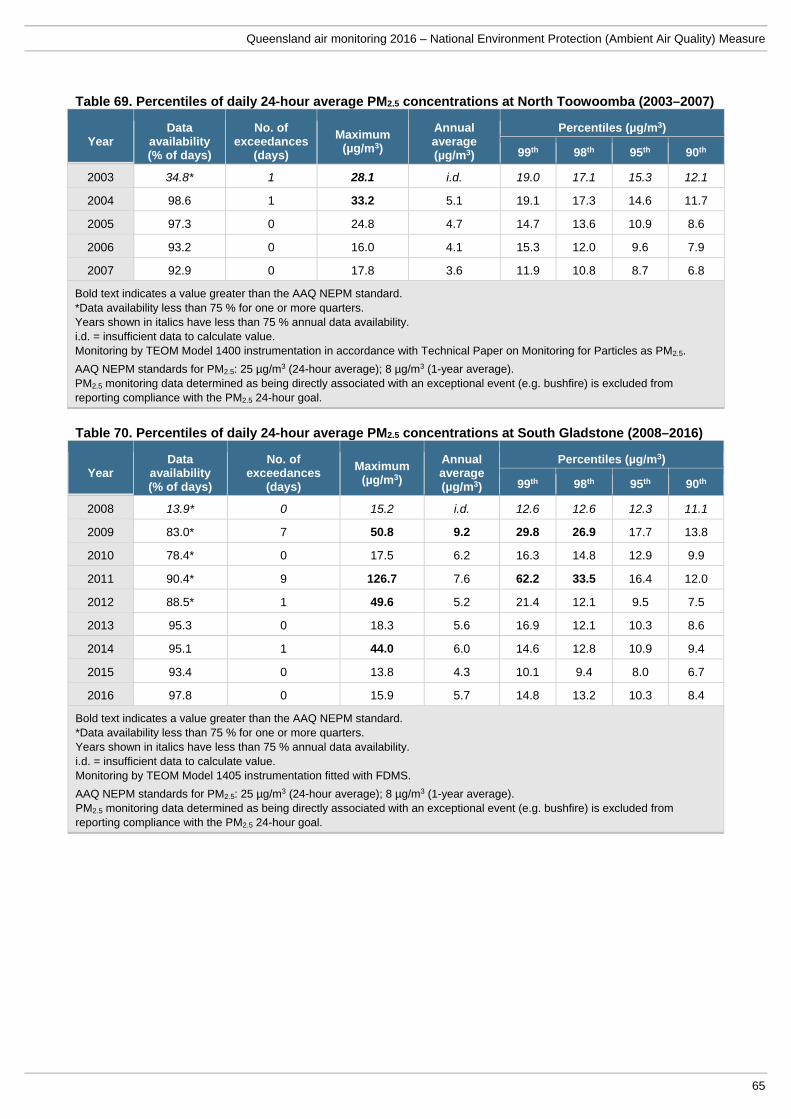
Queensland air monitoring 2016 – National Environment Protection (Ambient Air Quality) Measure
65
Table 69. Percentiles of daily 24-hour average PM2.5 concentrations at North Toowoomba (2003–2007)
Year Data
availability (% of days)
No. of exceedances
(days)
Maximum (µg/m3)
Annual average (µg/m3)
Percentiles (µg/m3)
99th 98th 95th 90th
2003 34.8* 1 28.1 i.d. 19.0 17.1 15.3 12.1
2004 98.6 1 33.2 5.1 19.1 17.3 14.6 11.7
2005 97.3 0 24.8 4.7 14.7 13.6 10.9 8.6
2006 93.2 0 16.0 4.1 15.3 12.0 9.6 7.9
2007 92.9 0 17.8 3.6 11.9 10.8 8.7 6.8
Bold text indicates a value greater than the AAQ NEPM standard. *Data availability less than 75 % for one or more quarters. Years shown in italics have less than 75 % annual data availability. i.d. = insufficient data to calculate value. Monitoring by TEOM Model 1400 instrumentation in accordance with Technical Paper on Monitoring for Particles as PM2.5.
AAQ NEPM standards for PM2.5: 25 µg/m3 (24-hour average); 8 µg/m3 (1-year average). PM2.5 monitoring data determined as being directly associated with an exceptional event (e.g. bushfire) is excluded from reporting compliance with the PM2.5 24-hour goal.
Table 70. Percentiles of daily 24-hour average PM2.5 concentrations at South Gladstone (2008–2016)
Year Data
availability (% of days)
No. of exceedances
(days)
Maximum (µg/m3)
Annual average (µg/m3)
Percentiles (µg/m3)
99th 98th 95th 90th
2008 13.9* 0 15.2 i.d. 12.6 12.6 12.3 11.1
2009 83.0* 7 50.8 9.2 29.8 26.9 17.7 13.8
2010 78.4* 0 17.5 6.2 16.3 14.8 12.9 9.9
2011 90.4* 9 126.7 7.6 62.2 33.5 16.4 12.0
2012 88.5* 1 49.6 5.2 21.4 12.1 9.5 7.5
2013 95.3 0 18.3 5.6 16.9 12.1 10.3 8.6
2014 95.1 1 44.0 6.0 14.6 12.8 10.9 9.4
2015 93.4 0 13.8 4.3 10.1 9.4 8.0 6.7
2016 97.8 0 15.9 5.7 14.8 13.2 10.3 8.4
Bold text indicates a value greater than the AAQ NEPM standard. *Data availability less than 75 % for one or more quarters. Years shown in italics have less than 75 % annual data availability. i.d. = insufficient data to calculate value. Monitoring by TEOM Model 1405 instrumentation fitted with FDMS.
AAQ NEPM standards for PM2.5: 25 µg/m3 (24-hour average); 8 µg/m3 (1-year average). PM2.5 monitoring data determined as being directly associated with an exceptional event (e.g. bushfire) is excluded from reporting compliance with the PM2.5 24-hour goal.
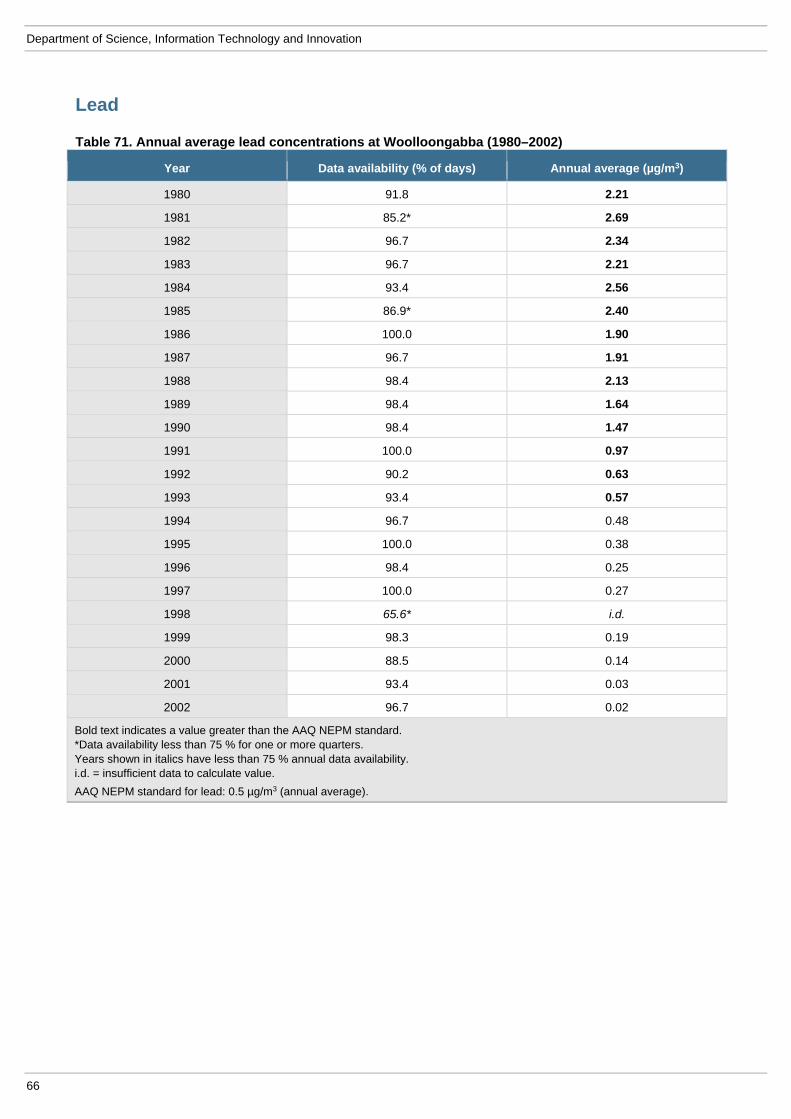
Department of Science, Information Technology and Innovation
66
Lead
Table 71. Annual average lead concentrations at Woolloongabba (1980–2002)
Year Data availability (% of days) Annual average (µg/m3)
1980 91.8 2.21
1981 85.2* 2.69
1982 96.7 2.34
1983 96.7 2.21
1984 93.4 2.56
1985 86.9* 2.40
1986 100.0 1.90
1987 96.7 1.91
1988 98.4 2.13
1989 98.4 1.64
1990 98.4 1.47
1991 100.0 0.97
1992 90.2 0.63
1993 93.4 0.57
1994 96.7 0.48
1995 100.0 0.38
1996 98.4 0.25
1997 100.0 0.27
1998 65.6* i.d.
1999 98.3 0.19
2000 88.5 0.14
2001 93.4 0.03
2002 96.7 0.02
Bold text indicates a value greater than the AAQ NEPM standard. *Data availability less than 75 % for one or more quarters. Years shown in italics have less than 75 % annual data availability. i.d. = insufficient data to calculate value.
AAQ NEPM standard for lead: 0.5 µg/m3 (annual average).
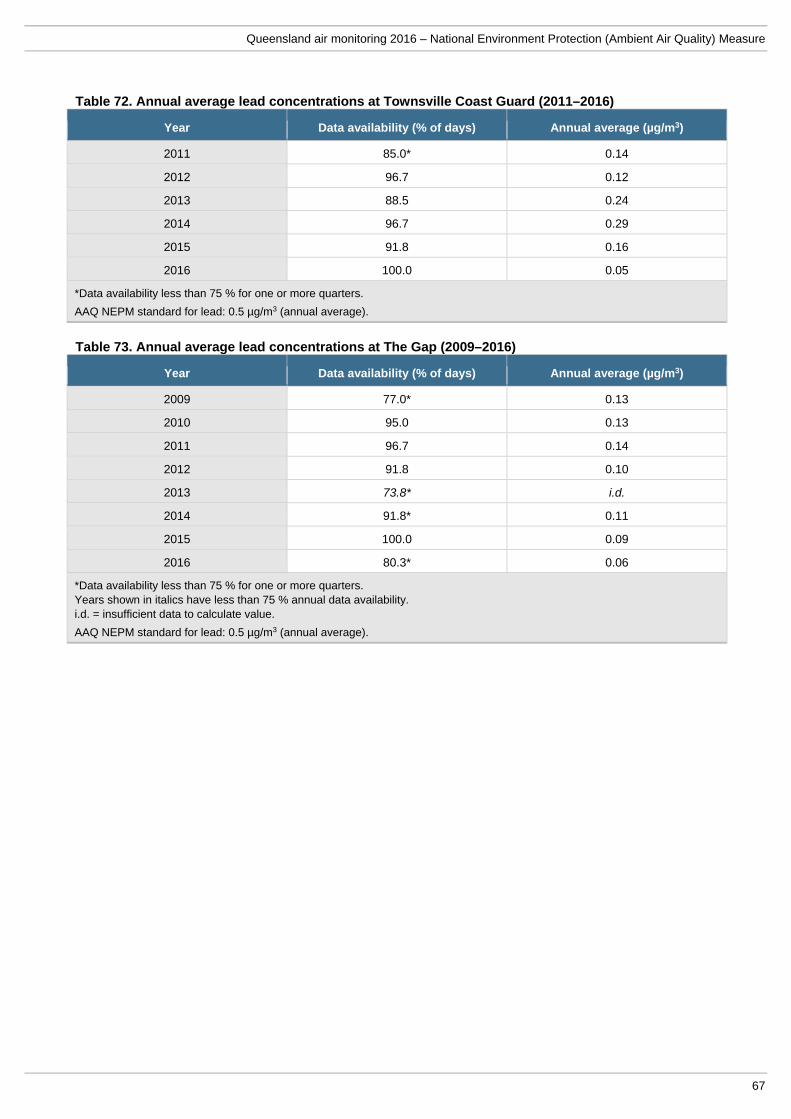
Queensland air monitoring 2016 – National Environment Protection (Ambient Air Quality) Measure
67
Table 72. Annual average lead concentrations at Townsville Coast Guard (2011–2016)
Year Data availability (% of days) Annual average (µg/m3)
2011 85.0* 0.14
2012 96.7 0.12
2013 88.5 0.24
2014 96.7 0.29
2015 91.8 0.16
2016 100.0 0.05
*Data availability less than 75 % for one or more quarters.
AAQ NEPM standard for lead: 0.5 µg/m3 (annual average).
Table 73. Annual average lead concentrations at The Gap (2009–2016)
Year Data availability (% of days) Annual average (µg/m3)
2009 77.0* 0.13
2010 95.0 0.13
2011 96.7 0.14
2012 91.8 0.10
2013 73.8* i.d.
2014 91.8* 0.11
2015 100.0 0.09
2016 80.3* 0.06
*Data availability less than 75 % for one or more quarters. Years shown in italics have less than 75 % annual data availability. i.d. = insufficient data to calculate value.
AAQ NEPM standard for lead: 0.5 µg/m3 (annual average).