Embed Size (px)
Citation preview
Queensland energy and TelecommunicaTions indusTrySkills and Workforce Development Report
2013


Queensland energy and TelecommunicaTions indusTrySkills and Workforce Development Report
energy skills Queensland 2013

Queensland energy and TelecommunicaTions indusTry SkillS and Workforce development report 2013
Energy Skills Queensland (ESQ) is the Industry Skills Body leading energy industry and government engagement on education and training, skills development and labour market issues. Energy Skills Queensland is at the forefront of developing solutions to help industry plan and develop their workforce, and providing opportunities for organisations and individuals to improve workforce skills by brokering training funding.
No part of this report may be reproduced by any means, or transmitted or translated into a machine language without the permission of Energy Skills Queensland. For more information, contact Anthea Middleton, Workforce Planning Manager – Energy Skills Queensland or email [email protected]
Energy Skills Queensland 70 Sylvan Road, Toowong Qld 4066 Phone: 07 3721 8800 www.energyskillsqld.com.au
Disclaimer:
Whilst all care and diligence has been exercised in the preparation of this report, Energy Skills Queensland does not warrant the accuracy of the
information contained within and accepts no liability for any loss or damage that may be suffered as a result of reliance on this information, whether or
not there has been any error, omission or negligence on the part of Energy Skills Queensland or their employees. Any projections used in the analysis
can be affected by a number of unforeseen variables, and as such no warranty is given that a particular set of results will be achieved.

1
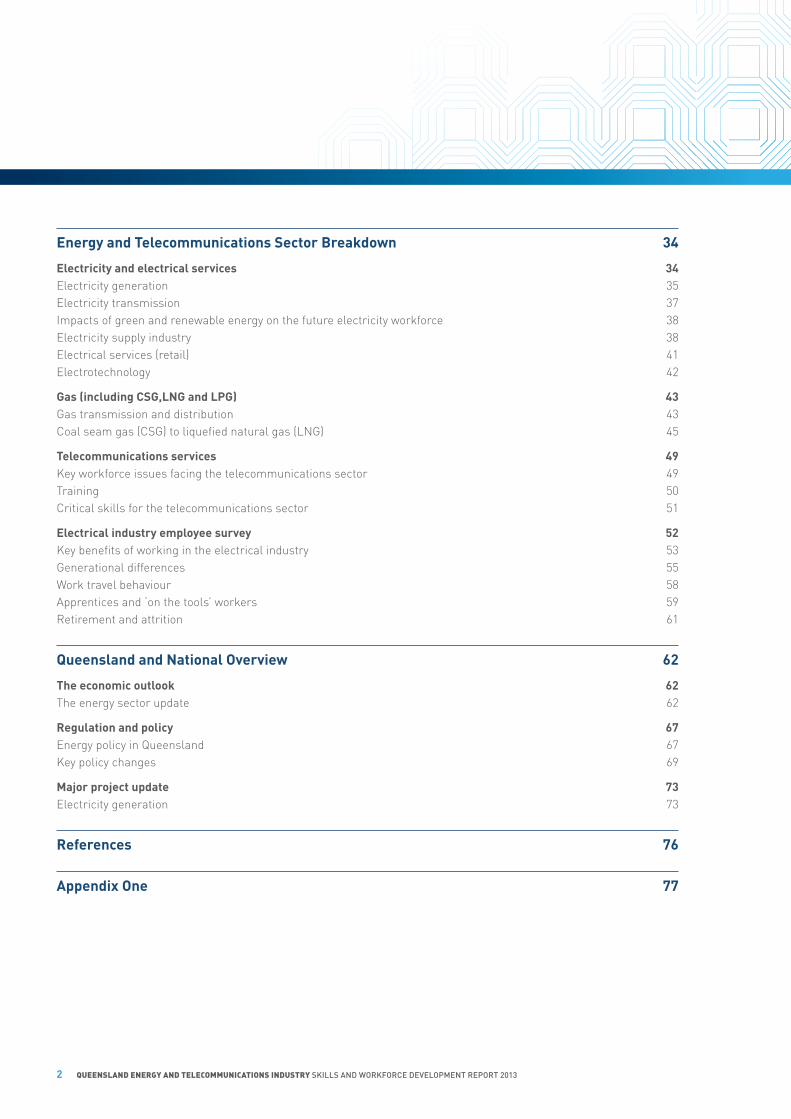
conTenTs
energy and Telecommunications 3
ceo address 3
executive summary 4
industry skills report 5
Workforce impacts and challenges 5
industry economic and labour market outlook 6
Queensland industry training profile 7
critical workforce issues facing the energy and telecommunications industries 2013 - 2018 8Critical Issue One: Regional workforce requirements and labour mobility 8Critical Issue Two: Training and education – Length and cost of training and education for critical job roles 8Critical Issue Three: Training and education – Low completion rates for trade roles and low enrolment rates for professional roles 9 Critical Issue Four: Training and education – Capability and capacity 10
critical occupations and skills in demand 11
Key recommendations 15Regional workforce requirements and labour mobility 15Training and education – Length and cost of training and education for critical job roles 16Training and education – Low completion rates for trade roles and low enrolment rates for professional roles 16Training and education – Capability and capacity 17
energy skills Queensland key achievements and 2013/14 action plan 18Industry based workforce planning 18Industry engagement 19Industry partnerships 20Queensland Workforce Skilling Strategy 20Strategies to increase apprenticeships 20Strategies to up-skill existing workers 21Electronic Skills Passport – Electricity Supply Industry (ESI) 21Generic Safety Induction (GI) 21Careers in Energy and Careers in Gas Websites 22ApprenticeConnect Australia Advisors (ACAA) project 22
Workforce Profile 23
industry workforce outlook 2012/13 23Changing workforce profiles 23VET trainers 24Apprenticeships and traineeships 25Ageing population 30Migration 31
2 Queensland energy and TelecommunicaTions indusTry SkillS and Workforce development report 2013
energy and Telecommunications sector Breakdown 34
electricity and electrical services 34Electricity generation 35Electricity transmission 37Impacts of green and renewable energy on the future electricity workforce 38Electricity supply industry 38Electrical services (retail) 41Electrotechnology 42
gas (including csg,lng and lPg) 43Gas transmission and distribution 43Coal seam gas (CSG) to liquefied natural gas (LNG) 45
Telecommunications services 49Key workforce issues facing the telecommunications sector 49Training 50Critical skills for the telecommunications sector 51
electrical industry employee survey 52Key benefits of working in the electrical industry 53Generational differences 55Work travel behaviour 58Apprentices and ‘on the tools’ workers 59Retirement and attrition 61
Queensland and national overview 62
The economic outlook 62The energy sector update 62
regulation and policy 67Energy policy in Queensland 67Key policy changes 69
major project update 73Electricity generation 73
references 76
appendix one 77

3
EnErgy and TElEcommunicaTions
cEo addrEss
The energy and telecommunications industry in Queensland is experiencing a challenging period. Queensland’s patchwork economy with regions of skill surpluses such as south east Queensland and many coastal cities, contrasting with skill shortage regions such as central Queensland and the surat Basin region, further highlights the need for investment and initiatives that encourage worker mobility.
The downturn in the south east corner is driven by the domestic and commercial construction sector performing poorly, impacting a number of industry sectors and in particular the electrical contracting industry. The mining sector has also downsized, driving cost efficiencies and reducing demand for skilled workers in some areas across Queensland. The National Broadband
Network (NBN) roll out continues to stall, however our industry intelligence indicates that this sector will ramp up across Queensland in 2014, creating a greater demand for skilled workers in the telecommunications sector.
The main sector experiencing growth in Queensland will continue to be the coal seam gas (CSG) to liquefied natural gas (LNG) sector. Energy Skills Queensland’s updated CSG to LNG Workforce Plan indicates that there will be approximately 9,000 operations and maintenance workers required for this important sector. However, as construction phases of the four projects begin to taper off post 2015, large numbers of construction workers will need to move onto other projects.
The majority of the operations and maintenance workers will be involved in field development activities such as drilling and well work over. Energy Skills Queensland believes this will be one of the highest risk subsectors from a workforce perspective within the CSG/LNG industry.
Feedback from the CSG/LNG industry suggests that attracting skilled workers in key occupations is becoming less challenging. However, these workers need to be further skilled to safely undertake work in this high risk and technically diverse industry. The training sectors capability to train these workers for these highly specialised roles continues to be a major risk to the industry and further investment is required to mitigate this risk.
Shortages of key trades continues across Queensland e.g. electricians, instrumentations technicians, fitters, welders, etc. These shortages can partly be attributed to a trade training system that suffers from market failure.The apprenticeship system continues to be the only way to train a tradesperson. However, the number of apprentices in training is solely determined by the economic capacity or willingness of an employer to employ them. The result is inevitably a mismatch between supply and demand.
The introduction of Great Skills. Real Opportunities. reform of training and education by the Queensland Government, will move the vocational education and training (VET) sector to a demand driven system with greater contestability for funding. With the aim of enabling the training sector to better respond to the emerging needs of industry, these policy reforms will significantly help build capability and capacity within the training market to more effectively respond to the emerging demand. Industry will have greater choice as all training organisations will be operating on a “level playing field” being able to access government funding for certificate III qualifications.
On behalf of Energy Skills Queensland, we hope you find the 2013 Annual Skills Report for the Energy and Telecommunications industries informative and insightful.

4 Queensland energy and TelecommunicaTions indusTry SkillS and Workforce development report 2013
execuTive summary
energy skills Queensland is pleased to submit the annual skills report for the energy and telecommunications industries in Queensland. The report highlights the key findings of research and statistics on the workforce development needs during the next five years, and is a culmination of information gathered during the last 12 months.
Queensland has experienced a changing environment among a number of sectors in energy and telecommunications driven by a downturn in the construction and mining sectors. With a number of major resource projects deferred, there has been an easing of workforce skill shortages in the south east corner.
The employment outlook however is still positive with investment made in Queensland in the last 24 months continuing to grow employment opportunities across the State. Remote and regional project developments will further exacerbate skills shortages in regional centres, with labour mobility a key issue to counter a potential over-supply of key skills in urban centres such as Brisbane, Gold Coast, and the Sunshine Coast. Shortages in critical job roles continue to be driven by growth in sectors such as telecommunications (via the National Broadband Network (NBN)) and CSG/LNG industry, and this further highlights the need for a more mobile Queensland workforce.
The five year outlook continues to forecast a shortage of qualified electrical workers of around 5,000 people across Queensland. The report findings show a continued need for electricians with experience working in the industrial and infrastructure sectors, with specialised skills in instrumentation, estimation, and working with high voltage. These skill sets are needed across a number of industries including electricity supply industry (ESI), mining, and CSG/LNG.
The 2011/12 Energy Skills Queensland Annual Skills Report highlighted an ongoing decline in training numbers for electrical apprenticeships, which is still a major concern for the development of a sustainable workforce. Major projects coming online, for example the CSG/LNG operations phase and the NBN rollout will continue to increase the competition for skilled labour.
There are a number of critical occupations and skills sets, across the energy and telecommunications sectors that continue to be in shortage. The shortages highlighted in the report are the result of a number of underlying factors including labour mobility across Queensland, the length and cost of training, and low completion and study rates.
Occupations and skills in shortage in the energy and telecommunications sectors are:
Electrical Fitter/Mechanics Doggers and Riggers
Instrumentation Control and Automation Specialists Assistant Drillers and Drillers
High Voltage Switching Well Servicing Operators
Lineworkers, including Live Lineworkers Geologists
Cable Jointers Health, Safety and Environment Officers
Energy Auditors SCADA Professionals
Electrical Lead Hand/Supervisor Skills NBN Splicers
Estimators NBN Installers (Fibre)
Electrical Engineering Para-Professionals NBN Lineworkers
Electrical Engineers Automation Specialists
Specialised VET Trainers and RTO Capacity
This report aims to highlight how industry, government and training organisations can make training, education and employment decisions based on sound industry workforce planning and development research.
EnErgy and TElEcommunicaTions
5
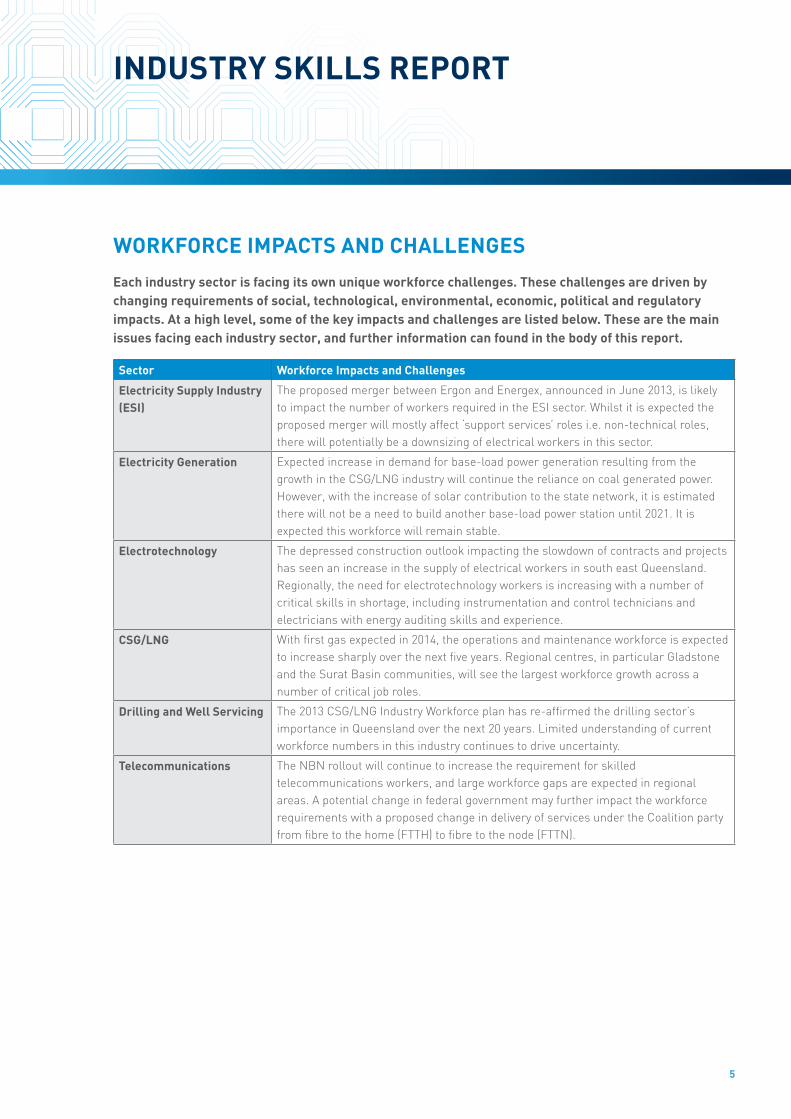
indusTry skills rEporT
WorKforce imPacTs and challenges
each industry sector is facing its own unique workforce challenges. These challenges are driven by changing requirements of social, technological, environmental, economic, political and regulatory impacts. at a high level, some of the key impacts and challenges are listed below. These are the main issues facing each industry sector, and further information can found in the body of this report.
sector Workforce impacts and challenges
electricity supply industry (esi)
The proposed merger between Ergon and Energex, announced in June 2013, is likely to impact the number of workers required in the ESI sector. Whilst it is expected the proposed merger will mostly affect ‘support services’ roles i.e. non-technical roles, there will potentially be a downsizing of electrical workers in this sector.
electricity generation Expected increase in demand for base-load power generation resulting from the growth in the CSG/LNG industry will continue the reliance on coal generated power. However, with the increase of solar contribution to the state network, it is estimated there will not be a need to build another base-load power station until 2021. It is expected this workforce will remain stable.
electrotechnology The depressed construction outlook impacting the slowdown of contracts and projects has seen an increase in the supply of electrical workers in south east Queensland. Regionally, the need for electrotechnology workers is increasing with a number of critical skills in shortage, including instrumentation and control technicians and electricians with energy auditing skills and experience.
csg/lng With first gas expected in 2014, the operations and maintenance workforce is expected to increase sharply over the next five years. Regional centres, in particular Gladstone and the Surat Basin communities, will see the largest workforce growth across a number of critical job roles.
drilling and Well servicing The 2013 CSG/LNG Industry Workforce plan has re-affirmed the drilling sector’s importance in Queensland over the next 20 years. Limited understanding of current workforce numbers in this industry continues to drive uncertainty.
Telecommunications The NBN rollout will continue to increase the requirement for skilled telecommunications workers, and large workforce gaps are expected in regional areas. A potential change in federal government may further impact the workforce requirements with a proposed change in delivery of services under the Coalition party from fibre to the home (FTTH) to fibre to the node (FTTN).

6 Queensland energy and TelecommunicaTions indusTry SkillS and Workforce development report 2013
indusTry skills rEporT
indusTry economic and laBour marKeT ouTlooK
nationally, the energy and telecommunications sectors contribute around 4% to australia’s gdP, represented by $155 billion in revenue for 2012/13. Based on oesr data, Queensland currently represents around 20% of australia’s gdP. Key economic and labour market statistics for the energy and telecommunications sectors include:
• In the May quarter of 2013, an estimated 136,000 people were employed in the Queensland energy and telecommunications industries.
• It is estimated that Queensland employment in these sectors will grow to approximately 137,300 people over the next 12 months and 160,000 people by 2018 if current trends continue.
• As of April 2013, 40,500 licensed electricians were registered with the Electrical Safety Office (ESO), of which 7,100 hold a restricted license (ESO, 2013). At the same time, 8,600 licensed electrical contractors were registered, of which 700 hold a restricted electrical contractors license (ESO, 2013).
• CSG/LNG projects are expected to stimulate an increase in Queensland’s economy by $3 billion annually once the projects are fully operational.
• At the start of 2013, 20 electricity generation projects ranged from proposed stage (18) to final investment decision (2) in Queensland (of which 11 use renewable sources), generating 6,000MW with projected future employment for 4,600 people.
• At the start of 2013, 118 resources mining projects ranged from proposed stage to final investment decision in Queensland, with projected construction employment for 72,600 people, and 25,600 places for operational employment.
• The Australian fossil fuel electricity generation sector is expected to generate revenue of $17.1 billion in 2012/13, about 0.4% of Australia’s GDP. The annual revenue growth over the past five years was 4.1%, and is expected to be 2.3% for the coming five years.
• The Australian hydro-electricity generation sector is expected to generate revenue of $2.1 billion in 2012/13. The annual revenue growth over the past five years was 3.8%, and is expected to be 3.9% for the coming five years.
• Australian wind and other electricity generation sectors are expected to generate revenue of $1.5 billion in 2012/13. The annual revenue growth over the past five years was 15.0%, and is expected to be 10.7% for the coming five years.
• The Australian electricity transmission sector is expected to generate revenue of $4.0 billion in 2012/13, about 0.2% of Australia’s GDP. The annual revenue growth over the past five years was 5.5%, and is expected to be 2.7% for the coming five years.
• The Australian electricity distribution sector is expected to generate revenue of $25.7 billion in 2012/13, about 1.1% of Australia’s GDP. The annual revenue growth over the past five years was 5.8%, and is expected to be 5.7% for the coming five years.
• The Australian on-selling electricity and electricity market operation sector is expected to generate revenue of $31.8 billion in 2012/13. The annual revenue growth over the past five years was 9.3%, and is expected to be 5.7% for the coming five years.
• The Australian electrical services sector is expected to generate revenue of $19.9 billion in 2012/13, about 0.5% of Australia’s GDP. The annual revenue growth over the past five years was 2.6%, and is expected to be 4.0% for the coming five years.
• The Australian combined gas and CSG/LNG sectors are expected to generate revenue of $10.6 billion in 2012/13, about 0.2% of Australia’s GDP. The annual revenue growth over the past five years was 6.5%, and is expected to be 4.6% for the coming five years.
• The Australian telecommunications services sector is expected to generate revenue of $43.1 billion in 2012/13, about 0.7% of Australia’s GDP. The annual revenue growth over the past five years was -0.2%, and is expected to be 0.5% for the coming five years.

7
Queensland indusTry Training Profile• Overall commencements in trainee and apprenticeships
for the total energy and telecommunications industries in the first three quarters of 2012/13, has decreased by 48.6% compared to the first three quarters of 2011/12 (see table 2), with currently 8,000 apprentices and trainees in-training.
• In the past five years, approximately 7,500 people a year applied for fee-for-service training in the energy and telecommunications industries.
• The apprentice and trainee contract completion rate in 2010 for the electrotechnology and telecommunications industries for students commenced in 2005 and 2006 was on average 55%, whereas individual completion rates averaged at 67%1.
• The average apprenticeship and traineeships contract termination rate in 2010 for all training packages in the energy and telecommunications industries, for students commenced in 2005 and 2006, was 39%.
• During the past five years, approximately 16,000 students’ commenced apprenticeships or traineeships in the energy and telecommunications industries, and approximately 10,000 completed their training.
• There is a critical shortage of technical trainers for the industry as training organisations are unable to compete with industry to recruit skilled tradespeople into training roles.
1 The 2005 and 2006 cohorts are used as they are the latest cohorts available with a full completion of apprenticeship and traineeship as these
cohorts have completed in 2009 and 2010.
Table 1: apprenticeship and trainee data by region for the Queensland energy and telecommunications industries (based on skills Queensland data)
apprenticeship and trainee data Queensland for the energy and telecommunication industries by region
2007/2008 2008/2009 2009/2010 2010/2011 2011/2012 2012/2013*
commencements
central Queensland 500 400 400 500 600 300
darling downs south West 200 200 200 200 200 100
far north Queensland 300 200 200 200 200 100
metropolitan 1,400 900 900 1,100 1,200 600
north coast 600 500 400 500 400 200
north Queensland 400 300 200 300 300 200
south east 1,100 700 500 700 700 400
Total 4,400 3,100 2,800 3,500 3,700 1,900
* Numbers for 2012/2013 are as at March 2013

indusTry skills rEporT
8 Queensland energy and TelecommunicaTions indusTry SkillS and Workforce development report 2013
criTical WorKforce issues facing The energy and TelecommunicaTions indusTries 2013 – 2018
There are a number of critical issues common across multiple industry sectors. The workforce issues can be categorised as:
1. Regional workforce requirements and labour mobility
2. Training and education – length and cost of training and education for critical job roles
3. Training and education – low completion rates for trade roles and low enrolment rates for professional roles
4. Training and education – capability and capacity
critical issue one: regional workforce requirements and labour mobility
As reported in last year’s annual skills report, the impact of investment and major project delivery e.g. the National Broadband Network will be most keenly felt by regional areas such as the Bowen Basin, Surat Basin, Galilee Basin, Gladstone and Mackay. Growth in these areas continues to provide great employment opportunities. It is important to continue initiatives to ensure there are positive outcomes for local people and businesses need to continue.
The transition from a construction to an operational phase in the CSG/LNG industry will continue to increase the demand for a skilled and mobile workforce. Increasing employment opportunities in rural centres such as Miles, Chinchilla, Dalby, Wandoan and across to Gladstone, need to be a key area of focus for training and development initiatives.
Impacts of increasing populations, fly-in, fly-out (FIFO) and drive-in, drive-out (DIDO) workers, reduced access to skilled labour, and under-developed infrastructure require forward planning and investment by regional councils, local businesses, and energy and resources organisations operating in regional centres.
critical issue Two: Training and education – length and cost of training and education for critical job roles
There are shortages driven by long training and education requirements, most commonly trade and professional roles. A number of critical job roles require four or more years training and/or education in order to be competent to work in those roles. For example, the education pathway to become a geologist is around five years, and there are multiple pathways into geology, geosciences and geophysics. To become a geologist a degree is required in science or applied science, with a major in geology, geological science, applied geology or earth sciences. A bachelor’s degree is adequate for some entry-level positions, but most geoscientists require a master’s degree in general geology or earth science for employment. In addition, usually at least three to five years of experience is desired for most roles.
The cost of training continues to be one of the biggest barriers cited by employers for not employing new apprentices. This is contributing to critical issue three in this report, where numbers of new commencements are declining.
The cost of training to up-skill existing workers for individuals and organisations has been cited as a barrier to ongoing career development. With changes to Queensland Government funding arrangements, and the removal of the Strategic Investment Fund (SIF) and the Productivity Places Program (PPP), training enrolments for advanced diplomas in electrical and other occupational areas have declined.

9
critical issue Three: Training and education – low completion rates for trade roles and low enrolment rates for professional roles
In previous reports, Energy Skills Queensland has highlighted the ongoing concern of low apprenticeship completion rates for trades’ roles, and low enrolment rates for professional roles. A strong pipeline of new workers is the foundation for building a sustainable workforce in the energy and telecommunications sectors.
The electrical industry can be split between three key industries; residential/domestic, commercial/construction and infrastructure/industrial. These industries are driven by separate factors, for instance the downturn in the property market limits the demand for residential and commercial electricians, whereas a downturn in the resource sector limits the demand for heavy industrial electricians. As many of the resource driven projects and the majority of residential and commercial driven projects occur through geographic separation, the trends could be affected by these influences.
The number of electrical apprentices who commenced in 2012/13 (FYQ1 – Q3) has decreased significantly from previous years (see Figure 1). The commencement figures reported by month to March 2013 (cumulative) are approximately 1,000 below the figure reported in March 2012. In addition, the overall commencements in the second half of 2012 have followed the historic low of 2009/10. This indicates that 2012/13 will result in significantly fewer commencements than the last two years, and could potentially be lower than the global financial crisis years of 2008/09.
Typically, the residential/domestic industry employs the greatest number of electrical apprentices. The downturn in this sector is likely to be contributing to the low apprenticeship commencement numbers seen in the last 18 months. This is likely to cause longer term impacts i.e. five+ years, to the ongoing shortage of qualified electrical workers.
There is a lag in commencement data provided formally by RTOs to the Department of Education, Training and Employment (DETE) and full numbers are reported to the department on a six monthly basis (December and June). Therefore, all commencements reported in April for January to March are not final commencement figures. However, when Energy Skills Queensland compared the2012/13 Q3 results to commencement numbers reported in previous years, it is clear there has been significantly lower numbers of electrical apprentice commencements reported under the same conditions.
With lower numbers of apprentices commencing an electrical career, combined with an existing workforce population that has 45% of workers over the age of 45, Queensland faces a severe shortage of electrical workers over the coming decade if serious intervention is not initiated.
As well as the trade roles, there are a number of university courses that have low study rates and completion rates. The ongoing demand for specialised engineering workers who are not only qualified, but also have experience in their field, will continue to impact the workforce costs associated with requirements of specialised labour. Reliance on an external workforce from interstate and overseas is likely to continue as global shortages in key professional roles such as supervisory control and data acquisition (SCADA) professionals, sub-surface engineers, geologists and surveyors.
The concerns facing industry and government alike in training enough skilled workers are further exacerbated by the lack of data on training and education numbers (see critical issue four).
Figure 1: Electrical apprenticeship commencements (cumulative by month) 2007/08 – 2012/13 (based on dETE data, 2013)
Electrical apprenticeship commencements (cumulative)
0
500
1,000
1,500
2,000
2,500
3,000
3,500
4,000
Jul Aug Sep Oct Nov Dec Jan Feb Mar Apr May Jun
?!@A?!B"
?!BA?!C"
?!CA?$!"
?$!A?$$"
?$$A?$&"
?$&A?$'"
–– ‘07/’08
–– ‘08/’09
–– ‘09/’10
–– ‘10/’11
–– ‘11/’12
–– ‘12/’13
indusTry skills rEporT
10 Queensland energy and TelecommunicaTions indusTry SkillS and Workforce development report 2013
critical issue four: Training and education – capability and capacity
There are a number of RTOs and universities across Queensland and Australia that are registered to deliver formal training and education across the critical job roles identified in this report. The collective lack of information on the numbers of students who are enrolled and completing qualifications hinders decision making by both industry and governments on where investment should be focused.
Currently, RTOs are only required to provide enrolment and completion data to DETE if they are using a proportion of State Government funding to supplement the cost of training. This results in a lack of a full understanding of potential workforce supply in critical roles, and often leads to industry forecasting based on demand numbers only as current. As a result future workforce supply is difficult to determine.
Discipline specific mapping of Queensland university enrolments through to completions are also very difficult to locate. In general, total attrition figures are available with a significant time lag at the sector or university level. When decision makers from industry and government are seeking to plan for critical skill issues the availability of accurate and timely information is imperative. The attrition levels available only account for students leaving the sector, rather than the course and discipline movements that will have an effect on future industry supply forecasts.
Another key issue is the capacity of TAFEs and private RTOs to delivery training that is aligned to industry needs. This has been driven by TAFE and RTO capability (staff, resources – physical and learning, equipment) to respond to new industry sectors. There has been industry feedback that indicates that limited availability and suitability of training programs for skilling an NBN ready workforce is not meeting telecommunications sector requirements. Capability to deliver training in the CSG/LNG sector has also been highlighted as a key concern, due to the scarcity of training providers who are able to deliver appropriate training.
New technology also impacts the delivery capability and capacity of RTO’s and TAFE. From the feedback provided by industry this is topical issue, with most of the current training on new technologies being filled by equipment manufacturers and/or learning on the job. One of the barriers of implementing new technology into the VET sector is the lack of teaching staff to deliver and understand the content when new competencies are released. An example of this is the SCADA unit of competency in the UEE training package. It has been available for over six years, with only one RTO currently delivering it in Queensland due to RTO/TAFE capabilities.

11
criTical occuPaTions and sKills in demand
There are number of critical occupations and skills identified in the 2012 report that continue to be in demand for the energy and telecommunications industries. criticality is determined by the four key issues identified in the previous section. energy skills Queensland has identified the following qualifications and skill sets, shown in Table 2, to be critical during the next five years:
Table 2: critical occupations in demand and their barriers
critical skills skill or Job Type criticality and current Barriers
electrical fitter/mechanics
Installs, tests, connects, commissions, maintains and modifies electrical equipment, wiring and control systems.
High risk due to gap created from low supply and high demand across a number of industries in Queensland, the eastern seaboard and Western Australia.
instrumentation control and automation Technicians
Installs, sets up, tests, fault finds, repairs and maintains systems and devices for measurement and recording of physical/chemical phenomenon and related process control.
Defined as critical due to the shortfall in the number of electricians required who have these skills and the inadequate numbers currently in training.
Currently there is a lack of upskilling initiatives being marketed to businesses.
high voltage switching electricians
Electrical workers with skills to switch high voltage networks.
Defined as critical due to the shortfall in numbers of trained workers required to meet the demands of the resources boom, particularly in the construction phase of many projects.
Must be on-the-job training which makes it difficult for contractors who are trying to move into this area to obtain experience. The lack of on-the-job experience effects a company’s capability to successfully tender for work.
lineworkers, including live lineworkers
Installs, maintains, repairs and patrols electrical sub-transmission and distribution systems.
Over the next five years there is an expected shortfall of approximately 3,000 lineworkers in Queensland. In the longer term to 2021, it is likely this trade will be affected by changes in control technology, and therefore it can be assumed that lineworkers will need additional skills to perform their duties.
cable Jointers Makes and repairs joins in insulated power supply and control cables installed in underground pipes, trenches and overhead systems. Also prepares cable terminations for electrical equipment and overhead lines, and installs and maintains underground electrical cables used to transmit and distribute electricity in city and country areas, new housing estates and industrial centres.
High risk due to the decreasing numbers of workers holding a cable jointing licence as well as the lack of available training in Queensland. Currently, there are no training organisations offering a Certificate III in Cable Jointing to the public in Queensland.
indusTry skills rEporT
12 Queensland energy and TelecommunicaTions indusTry SkillS and Workforce development report 2013
critical skills skill or Job Type criticality and current Barriers
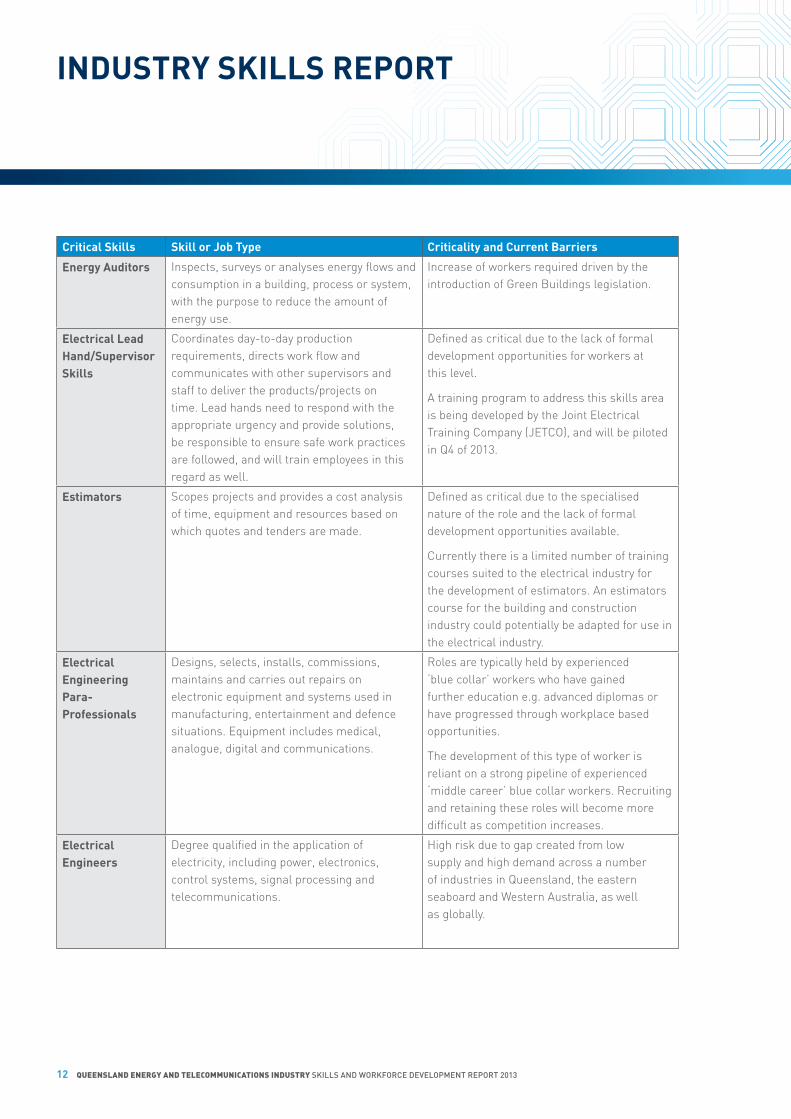
energy auditors Inspects, surveys or analyses energy flows and consumption in a building, process or system, with the purpose to reduce the amount of energy use.
Increase of workers required driven by the introduction of Green Buildings legislation.
electrical lead hand/supervisor skills
Coordinates day-to-day production requirements, directs work flow and communicates with other supervisors and staff to deliver the products/projects on time. Lead hands need to respond with the appropriate urgency and provide solutions, be responsible to ensure safe work practices are followed, and will train employees in this regard as well.
Defined as critical due to the lack of formal development opportunities for workers at this level.
A training program to address this skills area is being developed by the Joint Electrical Training Company (JETCO), and will be piloted in Q4 of 2013.
estimators Scopes projects and provides a cost analysis of time, equipment and resources based on which quotes and tenders are made.
Defined as critical due to the specialised nature of the role and the lack of formal development opportunities available.
Currently there is a limited number of training courses suited to the electrical industry for the development of estimators. An estimators course for the building and construction industry could potentially be adapted for use in the electrical industry.
electrical engineering Para-Professionals
Designs, selects, installs, commissions, maintains and carries out repairs on electronic equipment and systems used in manufacturing, entertainment and defence situations. Equipment includes medical, analogue, digital and communications.
Roles are typically held by experienced ‘blue collar’ workers who have gained further education e.g. advanced diplomas or have progressed through workplace based opportunities.
The development of this type of worker is reliant on a strong pipeline of experienced ‘middle career’ blue collar workers. Recruiting and retaining these roles will become more difficult as competition increases.
electrical engineers
Degree qualified in the application of electricity, including power, electronics, control systems, signal processing and telecommunications.
High risk due to gap created from low supply and high demand across a number of industries in Queensland, the eastern seaboard and Western Australia, as well as globally.
13
critical skills skill or Job Type criticality and current Barriers
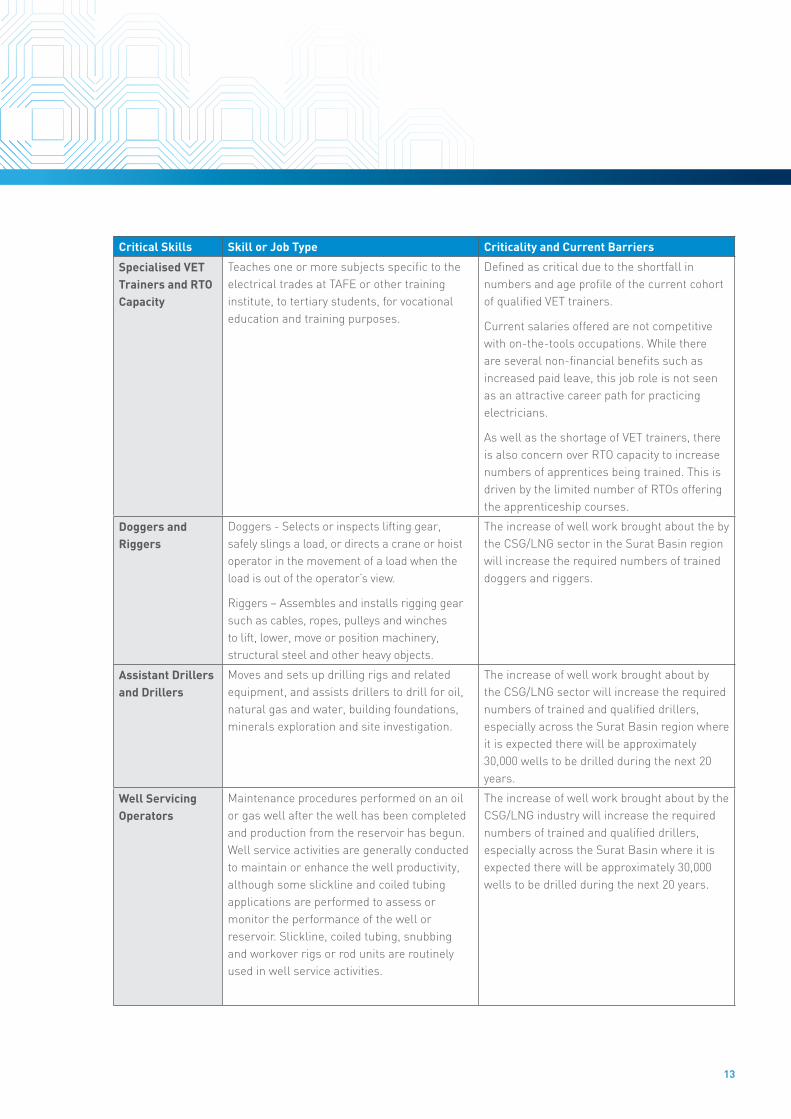
specialised veT Trainers and rTo capacity
Teaches one or more subjects specific to the electrical trades at TAFE or other training institute, to tertiary students, for vocational education and training purposes.
Defined as critical due to the shortfall in numbers and age profile of the current cohort of qualified VET trainers.
Current salaries offered are not competitive with on-the-tools occupations. While there are several non-financial benefits such as increased paid leave, this job role is not seen as an attractive career path for practicing electricians.
As well as the shortage of VET trainers, there is also concern over RTO capacity to increase numbers of apprentices being trained. This is driven by the limited number of RTOs offering the apprenticeship courses.
doggers and riggers
Doggers - Selects or inspects lifting gear, safely slings a load, or directs a crane or hoist operator in the movement of a load when the load is out of the operator’s view.
Riggers – Assembles and installs rigging gear such as cables, ropes, pulleys and winches to lift, lower, move or position machinery, structural steel and other heavy objects.
The increase of well work brought about the by the CSG/LNG sector in the Surat Basin region will increase the required numbers of trained doggers and riggers.
assistant drillers and drillers
Moves and sets up drilling rigs and related equipment, and assists drillers to drill for oil, natural gas and water, building foundations, minerals exploration and site investigation.
The increase of well work brought about by the CSG/LNG sector will increase the required numbers of trained and qualified drillers, especially across the Surat Basin region where it is expected there will be approximately 30,000 wells to be drilled during the next 20 years.
Well servicing operators
Maintenance procedures performed on an oil or gas well after the well has been completed and production from the reservoir has begun. Well service activities are generally conducted to maintain or enhance the well productivity, although some slickline and coiled tubing applications are performed to assess or monitor the performance of the well or reservoir. Slickline, coiled tubing, snubbing and workover rigs or rod units are routinely used in well service activities.
The increase of well work brought about by the CSG/LNG industry will increase the required numbers of trained and qualified drillers, especially across the Surat Basin where it is expected there will be approximately 30,000 wells to be drilled during the next 20 years.

14 Queensland energy and TelecommunicaTions indusTry SkillS and Workforce development report 2013
indusTry skills rEporT
critical skills skill or Job Type criticality and current Barriers
geologists Studies solid and liquid matter, requires global information system (GIS) and other mapping skills.
Global competition, combined with low study rates is increasing the criticality of this role.
health, safety and environment officers
Responsible for occupational health, safety and environmental management of an organisation.
Whilst numbers of required health, safety and environment officers are expected to increase slightly, the regional demand of these types of roles has the greatest impact in determining criticality.
supervisory control and data acquisition (scada) Professionals
Responsible for project engineering, installation, commissioning, service, maintenance and system support.
SCADA is an additional skill set for engineers and IT professionals, as well as a fee-for- service post trade qualification. High competition from a number of sectors including telecommunications, CSG/LNG and electricity supply industry, as well as the high cost of training are causing shortages in this critical skill area.
nBn splicers Undertakes splicing, testing and commissioning activities on fibre optic cable.
This is a preferred NBN qualification. Criticality due to workforce numbers required in regional and remote areas.
nBn installers (fibre)
Installs NBN equipment in homes and businesses.
This is a preferred NBN qualification. Criticality due to workforce numbers required in regional and remote areas.
nBn lineworkers Undertakes a range of activities in the field including hauling cable, constructing pits and ductwork, undertaking rod and roping.
This is a preferred NBN qualification. Criticality due to workforce numbers required in regional and remote areas.
automation specialists
Maintains Autonomous Guided Vehicle Systems (AGVS).
Demand driven by the uptake of AGVS technology by a number of industry sectors due to safety and economic factors.

15
Key recommendaTions
The culmination of energy skills Queensland’s research and industry engagement during the last 12 months has produced the following recommendations:
regional workforce requirements and labour mobility
• Prioritise workforce planning initiatives across a number of industry sectors to improve training and employment investment decisions. There is reported to be a misalignment between long term forecasting and the number of highly-skilled workers required at any given time during the rollout of major projects. This is most urgent within industry sectors that rely heavily on a contracted and specialised workforce. Long term planning becomes difficult to deliver due to the often competitive and diverse nature of organisations involved in major projects.
• Introduction of a mandatory electronic skills database, similar to that introduced in the electricity supply industry, to make it easier for organisations working in or supporting the energy and telecommunications sectors to transition their workforce with greater ease and reliability.
• Greater focus on employment and training programs that train new workers from skill surplus regions, and place them into jobs in skill shortage regions e.g. Queensland Workforce Skilling Strategy.
• Further investment in creating opportunities for unskilled workers is required through investment in programs which deliver job ready people with entry level skill sets, to reduce the initial burden on employers.
• Support employment and training programs for Aboriginal and Torres Strait Islander people and Traditional Owner groups in regional Queensland so they can take advantage of local employment opportunities and reduce industry’s reliance on non-resident workers.
• Employment and training programs that target skilled workers from skill surplus regions and augment their skills so that they can take advantage of skilled roles within skill shortage regions. For example, targeting electrical workers from south east Queensland and up-skilling in areas such as instrumentation, hazardous areas, automation, high voltage to secure employment in the energy and resources industry.
• The increasing reliance on a contracted workforce requires the implementation of improved systems at industry level to manage and assure the competence of a flexible and dynamic workforce. Mandated competency assurance management systems need to be put in place to gain efficiencies across industries with uniform requirements for contractors.
• Develop strategies to reduce the turnover and attrition of FIFO and DIDO workers as attrition rates are more than double when compared to resident workers. This may involve developing tools that can be used in induction on-boarding programs to assist non-resident workers cope with the family and associated pressures of living and working away from home.

indusTry skills rEporT
16 Queensland energy and TelecommunicaTions indusTry SkillS and Workforce development report 2013
Training and education – length and cost of training and education for critical job roles
• Additional funding is required to incentivise small to medium enterprises to train more apprentices. The aim would be to increase the pipeline of trade qualified people entering the resources sector to assist in both the construction and operation phases of development. It is clear that there has been under-investment in apprenticeships during the last five years, and more involvement from all parties is needed to address this critical need.
• Greater access to State Government training funding is needed to help offset the high cost of training, especially in enabling workers to obtain formal skill sets. This will directly impact the ability to gain employment in the telecommunications (NBN) and CSG/LNG sectors. The proposed funding model does not fully meet industry needs, as only funding for qualifications to Certificate III level are covered by the new systems and not the obtainment of skill sets or Certificate IV and above qualifications.
• Funding such as Skills Queensland’s Strategic Investment Fund (SIF) should be re-introduced as it is critical to encouraging organisations to develop the specific critical skills needed in the energy and telecommunications sectors.
• Greater funding, both public and private, needs to be invested in cross-skilling electrical workers with industrial skills to meet the demand in of the resources sector. New programs need to be introduced which cross-skill workers with residential skills and experience to work in the industrial/infrastructure sectors to help address skills surplus/shortage mismatch.
• Appropriate training pathways to skill CSG well workover and well servicing tradespeople and technicians need to be established, which could include traineeships, apprenticeships, technician and para-professional pathways.
Training and education – low completion rates for trade roles and low enrolment rates for professional roles
• Similar to the recommendation made by Energy Skills Queensland in the 2012 report, a ‘big picture’ approach to apprenticeship training and upskilling of current electricians is required. The Queensland Government reform action plan for further education and employment has provided additional funding aimed at increasing the number of apprentices entering trade roles. Energy Skills Queensland urgently recommends a task force be established with representation from industry, industry stakeholders, State Government and Energy Skills Queensland, with the primary objective of increasing electrical apprentice commencement and completion numbers.
• Upskilling existing workers and maintaining a competent workforce needs to be made a priority. Industry needs to continue to upskill its workforce to improve productivity, safety, environmental and regulatory compliance, and adoption of new technologies.
• Seek to develop innovative trade and technician training pathways to better skill workers in areas such as CSG drilling, well workover, NBN construction, etc.
17
Training and education - capability and capacity
• Greater support is needed from government to build TAFE capability, including flexibility in industrial relations laws to enable TAFEs and other RTOs to attract and retain highly skilled staff. It is anticipated the new TAFE reforms will help this process, however the CSG/LNG sector needs to be prioritised. The CSG/LNG sector has faced difficulty finding training providers who are able to deliver appropriate training which is driven by RTO capability (staff, resources – physical and learning, equipment) to respond to a new industry sector.
• Energy Skills Queensland recommends that a new model be introduced for the delivery of competencies which incorporate new technologies. Addressing the gap between competency updates and creation, and RTO and TAFE capability and capacity to deliver training in new technologies, will better service a demand driven training model. A practical approach is needed in order for training organisations to effectively deliver these high demand skills. As an example, a new model could include:
• Research industry demand for new technologies.• Develop specific content.• Seek industry feedback.• Design new competencies.• Seek industry and training organisation feedback.• Develop example delivery resources, activities and
assessment materials through a central body.• Provide state-wide professional development
workshops targeting training organisations.
• The Vocational Education and Training (VET) system performs an important role in enhancing Australia’s productivity by delivering skills and knowledge through a rigorous, industry driven competency framework. The Australian Government has embarked on a series of reforms to transform skills development in Australia. The Standing Council on Tertiary Education, Skills and Employment (SCOTESE) recently agreed to the mandatory collection and reporting of total VET activity data from 1 January 2014. The collection of detailed and comprehensive data on training by RTOs will better inform tertiary policy making and planning. Together with the Unique Student Identifier (USI), this will enable students to have their record of vocational education achievements across Australia brought together in the one place and online. Advice on the impact on smaller RTOs is being sought, recognising an associated administrative burden and potentially leading to a broader review of data collection. It is recommended that a similar model be introduced into the university system to enable stronger reporting and funding decision making.
• Facilitate industry and RTO partnerships to further develop capacity and capability of the Queensland training industry to respond to specialist skills training. For example, there are still major gaps in specialist skills training available for the gas and resources industry putting increasing pressure on industry to effectively skill their workforce.

indusTry skills rEporT
18 Queensland energy and TelecommunicaTions indusTry SkillS and Workforce development report 2013
energy sKills Queensland Key achievemenTs and 2013/14 acTion Plan
industry based workforce planning
Energy Skills Queensland will release the 2013 CSG/LNG Industry Plan for the Operations and Maintenance workforces in August 2013. This research is the result of industry and government collaboration, and will detail the workforce needs in the CSG/LNG industry for the next 20 years. This is an important piece of research that will inform all stakeholders of the ongoing skills requirements across Queensland to service a flexible and prosperous CSG/LNG industry.
The Energy Skills Queensland Workforce Planning team has also been working with a number of the gas companies to deliver workforce planning initiatives to Traditional Owner groups across Queensland. These projects are:
• Whanu Binal, Arrow Energy – Community Workforce Planning Project for the Western Downs Traditional Owner Groups.
• QGC and Bechtel – Delivery of a comprehensive skills survey to Aboriginal and Torres Strait Islander people living in Bundaberg, Gladstone, Rockhampton and surrounding areas.
Energy Skills Queensland has been continuing to work with the Joint Electrical Training Company (JETCO) to develop specialised training for lead hands, foremans and supervisors in the electrical sector. This is the first public training program of its kind, and will enable electrical workers to gain formal training for early managerial roles. The ongoing support provided by Energy Skills Queensland is an example of the value in developing an industry workforce plan that provides actionable outcomes that will benefit industry as a whole.
Energy Skills Queensland’s commitment to helping industry build a greater understanding of strategic workforce planning continued in 2012/13 with the delivery of a number of workshops to help educate other businesses in workforce planning methodology and practice. The workforce planning team also facilitated a number of working groups with other Queensland Industry Skills Bodies, to ensure there was unity of thought and delivery of workforce planning to the State Government.
Ongoing stakeholder engagement with all of the sectors in Energy Skills Queensland scope has continued throughout 2012/13 and has formed the basis of research used in this report.
In 2013/14, Energy Skills Queensland will work with the industry and government to provide workforce planning to a broad range of industry sectors and regional areas. Some of the recommended projects for 2013/14 are:
• Drilling Industry Workforce Plan and Benchmarking project.
• Heartbeat Report – Mining Industry Benchmarking Report.
• Community Skills Survey and Jobs Plans for regional Queensland.
• Workforce planning training for regional and small businesses.
• Continuation of the Whanu Binal Program, working with Traditional Owners in Queensland to build long term workforce plans.

19
industry engagement
Energy Skills Queensland engages with industry through Industry Leaders Groups to improve skilling and workforce development outcomes for their industry. The groups are supported by other committees such as project teams and training committees. These well-established committees engage with industry to determine workforce development needs and then collaborate with companies, training organisations and government agencies to implement projects that build a stronger and more productive workforce.
During 2012/13, Energy Skills Queensland convened 20 meetings which were attended by more than 220 members and observers, comprising of industry, respective associations and unions, government and regulatory bodies.
Some key events in 2012/13 included:
• honourable John-Paul langbroek, Minister for Education, Training and Employment, met with Energy Skills Queensland and representatives from four CSG/LNG companies on 12 March 2013 to discuss Indigenous workforce development initiatives across the energy industry.
• energy industry chairs lunch: (8 February 2013) was attended by Assistant Minister for Technical and Further Education Saxon Rice MP, Chair of Energy Skills Queensland Board Peter Price and Chairs of the Industry Leaders Groups and Training Committees. Presentations included an overview of the energy and telecommunications industry, achievements for 2012 and action plans moving forward for 2013.
• drilling industry leaders group (dilg): The DILG has had five meetings, attended by in excess of 20 representatives from industry, regulatory body and respective associations. Guest speakers have included David Sharp, Petroleum and Gas Inspectorate, Department of Natural Resources and Mines, on an analysis of recent incidents in the CSG drilling industry and implications for improving training. Projects include Workforce Planning and Benchmarking Project, SkillPASS and the development of Well Servicing qualifications.
• camp operations industry indigenous employment strategy: (22 April 2013) This forum was supported by QGC and attended by ten of the major camp operators to recruit, train and retain Indigenous workers for camp management for the CSG industry. The forum enabled the camp operators to develop a strategy that assists each company meet their Indigenous employment targets.
• electrotechnology industry leaders group and Training committee: This group has had five meetings and attended by in excess of 20 representatives from industry and respective associations. Guest speakers have included Noelani Magnus, Energex on the Industry Skills Passport concept and Luke Menzell, Energy Efficiency Council on Energy Efficiency Accreditation Schemes. Projects include continuing development of training package competencies, research into new apprenticeships, Certificate IV Electrotechnology special class, Automation – Certificate II for senior years of schooling, HVAC Dual Trade and Declarations of apprenticeships and traineeships.
• Telecommunications industry leaders group and Training committee: This group has met twice in 2012/13. On 30 May 2013, Gabriele Giofre, on behalf of David Auld from NBN Co, presented on workforce development opportunities for the NBN. Projects include NBN Co accreditation scheme and modification of skills sets required for the alternative fibre to node module.
In 2013/14, Energy Skills Queensland will continue to engage directly with industry and government on critical workforce planning and development initiatives for the energy industry. Key topics will include Queensland’s new vocational education and training (VET) plan and issues in moving from construction to operations in the CSG/LNG sector.

indusTry skills rEporT
20 Queensland energy and TelecommunicaTions indusTry SkillS and Workforce development report 2013
industry partnerships
Energy Skills Queensland is supported by major energy companies to facilitate workforce planning and development projects on behalf of the company, industry and community. Projects include:
• Qgc provided funding to develop training, employment and business opportunities for Indigenous communities within their CSG/LNG footprint. Projects range from a skills audit in conjunction with Bechtel in Gladstone to an electrical pre-apprenticeship program for Indigenous participants in the Surat Basin.
• australia Pacific lng (aPlng) provided funding to deliver the Queensland Workforce Skilling Strategy in Gladstone, Bundaberg and Rockhampton for the next three years.
• arrow energy partnered with Energy Skills Queensland to deliver the innovative Whanu Binal Program to improve employment outcomes and long term investment for the Aboriginal communities in Arrow’s footprint. The projects include employment and training and the creation of a community workforce plan, while developing the capability of the Traditional Owner groups to continue to deliver long term planning.
• santos glng provided funding to deliver the Keys to Careers program which assists 10 Indigenous students from Gladstone to obtain driving skills and accredited training leading to employment in the energy industry.
• Other energy companies including Energex, Ergon, and EIM training have provided corporate sponsorships and/or support for the Energy Skills Queensland Annual Conference.
In 2013/14, Energy Skills Queensland will build on the relationships with its industry partners to deliver more services for the energy industry. A key focus will be employment, training and capacity building for Indigenous communities within the CSG/LNG footprint as the construction phase starts to decline and LNG shipments begin in 2014.
Queensland Workforce skilling strategy
The Queensland Workforce Skilling Strategy (QWSS) was created by Energy Skills Queensland to address skill shortages in the Gladstone and Surat Basin regions, and to assist people in high unemployment regions to access emerging opportunities created by the CSG/LNG industry. The QWSS has trained and skilled more than 471 people across Queensland (153 being Indigenous) of which 333 people have gained employment (71% employment).
The QWSS operates across Ipswich, Logan, Toowoomba, Southern Wide Bay Burnett, Sunshine Coast, Caboolture, Fraser Coast, Bundaberg, Gladstone, Rockhampton and Mackay.
In 2013/14, the QWSS will focus on employment and training for Indigenous people within the CSG/LNG industry, to assist companies meet their community obligations and to provide Indigenous people with sustainable economic benefits from projects across Queensland.
strategies to increase apprenticeships
Energy Skills Queensland’s research has identified a shortage of electricians in the energy industry, particularly in regional areas, due to low numbers of electrical apprentices and high attrition rates. Energy Skills Queensland’s Electrotechnology Pre-Apprenticeship Program provides training in Certificate II in Electrotechnology and works with employers to place participants into electrotechnology apprenticeships. In 2012, 245 people from across Queensland enrolled into the program, of which 211 participants completed the training and 137 gained apprenticeship employment outcomes. In 2013, there are 70 training places available with 42 participants enrolled to date.
Energy Skills Queensland developed the Energy Skills Test to enhance the apprentice and employee recruitment processes through standardised testing of mechanical reasoning, numerical reasoning and situational safety assessment. A consolidated report is available to employers who test multiple applicants. The tests have been used by industry employers.

21
In 2013/14, Energy Skills Queensland will work with the industry and the Department of Education, Training and Employment (DETE) to address skill shortages within the sector, particularly in regional areas and backfill positions as qualified workers upskill themselves to fill roles within the energy industry.
strategies to up-skill existing workers
Several years ago, Energy Skills Queensland identified shortages of instrumentation technicians which has impacted productivity in the energy industry. The Electrician to Electrical and Instrumentation Technician Program upskilled 145 licensed electricians in Certificate IV in Instrumentation. This training enabled participants to become dual trade qualified. All training was required to be completed by 30 June 2013.
In 2013/14, Energy Skills Queensland will continue to work with industry and the Department of Education, Training and Employment (DETE) to address skill shortages across the energy and telecommunications sectors.
electronic skills Passport – electricity supply industry (esi)
Energy Skills Queensland played a leading role in the development of a national skills passport for the electricity supply industry. All 19 contracting network operators across Australia have agreed to use the passport which is a database accessed by a card with a QR code. Energy Skills Queensland will facilitate a pilot group of operators to progress stage two. The pilot group consists of:
• Energex• Western Power (Western Australia)• Power and Water (Northern Territory)• Electranet (South Australia)• SA Power Networks (South Australia)• United Energy (Victoria)• Energy Skills Queensland
In 2013/14, Energy Skills Queensland will complete the pilot and rollout the card to all employees and will be working with the CSG/LNG industry to expand the card application across the energy industry. Titled SkillPASS, the card will include all skills and qualifications held by the employee. SkillPASS will assist clients to manage and monitor the competency assurance requirements for their contractors and also assist contractors to transfer staff between clients.
generic safety induction (gi)
In early 2013, Energy Skills Queensland acquired the Generic Induction (GI), a safety induction designed for the mining industry to standardise the training of non-permanent mine-site workers and provide workers with core skills before undertaking a specific site induction.
Energy Skills Queensland is updating the product with the assistance and constant feedback of industry, RTOs, resource RTOs, the Mining Inspectorate, CFMEU and contractors. The aim of this is to create a quality product that will reduce repetitive induction training within the resources industry.
The GI is currently delivered across Queensland and consists of a range of GI or GIQ induction programs. All GIQ courses meet the requirements of Standard 11 and have been specifically designed for the Queensland coal mining industry.

22 Queensland energy and TelecommunicaTions indusTry SkillS and Workforce development report 2013
indusTry skills rEporT
careers in energy and careers in gas websites
The Careers in Energy and Careers in Gas websites have been developed to provide a range of career information to people seeking to enter the energy industry or existing workers seeking to further develop their careers. The Careers in Energy brand provides secondary school careers advisors, industry employers, employment and training services with career path information distributed widely through social media channels, as well as print and online resources. The Careers in Gas website is a regional-based web portal with job board functionality and links to employers with career opportunities in Queensland’s CSG industry and regional businesses.
apprenticeconnect australia advisors (acaa) project
In 2012/13, Energy Skills Queensland partnered with Master Electricians Australia to deliver the ApprenticeConnect Australia Apprentice Advisors project to provide career advice to people seeking to gain an apprenticeship in the energy and telecommunications industries. Energy Skills Queensland’s established Careers in Energy website and brand formed the basis of this strategy, with a range of promotional and social media components targeting young people seeking to enter the industry. Master Electricians Australia’s Apprentice Advisors based in Queensland, New South Wales, Victoria and South Australia have successfully exhibited at 47 careers expos, facilitated over 800 school events and small group information sessions and distributed an estimated 25,000 career guides to thousands of secondary school students.

23
WorkForcE proFilE
indusTry WorKforce ouTlooK 2012/13
changing workforce profiles
The Australian Bureau of Statistics Labour Market Survey (February quarter 2013) shows the energy and telecommunications industries in Queensland currently employ 136,000 people, on par with the workforce of 2011. Analysis of the latest four quarters indicates that this number is expected to grow by 1% during the next 12 months (see Figure 2). A similar pattern has been identified on the national level of employment, as shown in Figure 3.
The energy and telecommunications industries in Queensland are experiencing high replacement demand. Australia has an ageing workforce and with the current pension age of 65 years and increasing life expectancy, the Federal Government has already implemented a structure for increasing the pension age to 67 years by July 2023. However, many of the more physical jobs, particularly in the technical and trades profession, will experience lower retirement ages. Occupational detachment through the loss of skilled workers, particularly tradespersons to other occupations, together with the ageing demographic are the significant contributors to the high level of replacement demand seen across the energy and telecommunications industries.
Queensland employment – energy and Telecommunications
figure 2: employed persons for the energy and Telecommunications industry for Queensland
australia employment – energy and Telecommunications
figure 3: employed persons for the energy and Telecommunications industry for australia
-20,00040,00060,00080,000
100,000120,000140,000160,000180,000
1997 1998 1999 2000 2001 2002 2003 2004 2005 2006 2007 2008 2009 2010 2011 2012 2013 2014 2015 2016 2017 2018
Telecommunications Sector Energy Sector Total Forecasted
Telecommunications Sector Energy Sector Total Forecasted
-100,000200,000300,000400,000500,000600,000700,000800,000
1997 1998 1999 2000 2001 2002 2003 2004 2005 2006 2007 2008 2009 2010 2011 2012 2013 2014 2015 2016 2017 2018

24 Queensland energy and TelecommunicaTions indusTry SkillS and Workforce development report 2013
WorkForcE proFilE
veT trainers
The need to upskill existing trades and technicians into trainers to deliver and assess qualifications is critical to ensuring students complete with contemporary skills and knowledge in technologies and applications, and to ensure the industry that quality training is being delivered. Strong competition amongst employers for energy sector skills is preventing RTOs from recruiting experienced practitioners into technical training roles. This is affecting the ability of training organisations to increase capacity in key qualifications for which skills shortages have been identified and in areas of emerging skill demand.
Publicly funded training organisations in particular, report that pay scales which do not distinguish between the technical skills of trainers, fail to acknowledge the reality that VET trainers operate as dual professionals who are required to maintain both technical and pedagogical skills. While RTO trainer remuneration fails to keep pace with the market demand for technical skills, RTOs will be unable to selectively recruit. This negatively affects the perception of training roles, the quality of new entrants into the field and outcomes for students.
Technical trainers within RTOs also advise that there is a huge learning curve from full-time technical work to full-time teaching, which discourages industry practitioners from pursuing training roles. Many advise that a lack of support at this time is a cause of discomfort, which drives many new trainers back into technical roles. Given the difficulty in recruiting new entrants and the demonstrable advantages in terms of training outcomes of establishing higher level teaching skills, this is a problem that has to be addressed.
A survey of electrical workers undertaken by Energy Skills Queensland in 2013 has given some insight into the reasons why current tradespersons are, and are not interested in becoming a VET trainer. In 2011, only 2% of respondents who were leaving their current role intended on becoming a trainer, with this figure remaining the same in 2013. This critical skill pipeline is one that needs further investigation to fully understand the training skills shortages in the electrical industry. A shortage in this area could severely impact the number of new apprentices that can be trained to enter the electrical industry both in Queensland and across Australia.
The survey also addressed the question whether or not respondents had ever considered becoming a trainer. The response in 2009 was 43% for ‘yes’, while in 2013 this reduced to 40% responding ‘yes’. The overwhelming reason given by respondents who do not want to become a trainer was that they would not like the job, or believed the job would not suit them (46%). The second and third reasons were that respondents believed they did not possess the required knowledge to become a trainer (20%) and that the wages were too low (18%).
As a recommendation to address the difficulty in attracting more technical trainers, Energy Skills Queensland suggests looking at the option to provide more information and training to tradespeople between the ages of 40 and 55, as well as critically reviewing the remuneration options for technical trainers.
Greater flexibility of employment arrangements are also recommended, particularly using the option of employing trainers under external contractor agreements. This would encourage more technical practitioners into part-time training roles while still working in their technical profession.

25
apprenticeships and traineeshipsCompletions, for both traineeships and apprenticeships, are used as a performance indicator for the national VET system, and low completion rates have been of concern for many years. In 2011, the National Centre for Vocational Education Research (NCVER) examined the impact of wages on the probability of completion. The report found that differences between the training wage, the wage in alternative employment and the wage on completion had a limited effect on completion (Karmel & Mlotkowski, 2011). For apprentices, it was the premium attached to becoming a qualified tradesperson upon completion that mattered. The NCVER 2011 Annual Report2 (NCVER, 2011) on apprentices and traineeships shows the comparison between 2010 and 2011. The results include:
• Overall commencements increased from 2010 to 2011 by only 1.4% (compared 15.7% between 2009 and 2010), with trade commencements down by 5.9%, compared to up 21.9% between 2009 and 2010.
• The completion rate for contracts of training commenced in 2006 was 57.3%, better than 2005 which was 46.2% for trade apprentices and trainees.
• The individual completion rate for electrotechnology and telecommunications trades workers commencing in 2006 was 69.3%, and 67.5% for students commencing in 2007.
• 36.4% of trade apprentices and trainees completing at certificate III and above in 2011 finished their training in two years or less, compared with 30.1% in 2010.
There are a large number of significant projects simultaneously occurring both in Australia and overseas which is increasing both national and international competition for skilled workers with many overseas projects reporting the same skills shortages as those demanded in Australia. Where demand is allowed to outstrip supply, labour costs will increase as will the incidence of poaching key personnel, eventually resulting in projects performing poorly beyond planned budgets and timescales, or failing to be realised at all.
The reduction of the available workforce due to retirement has been further exacerbated by the increasing cancellation and withdrawal numbers of apprenticeships and high cancellation numbers. For example, there has been a steady decline of electrotechnology apprentices over the past three years. Apprentice commencements in 2011/12, were approximately 16% lower than 2007/08. The impact of this will be that 16% less apprentice completions will occur during 2015/16. This will also coincide with the peak workforce demand from the energy and resources boom, creating a significant shortfall between the demand and supply of tradespeople.
apprentices and Trainees in-Training Queensland energy and Telecommunications industries
2 The NCVER 2012 Annual Report has not been released yet, however Energy Skills Queensland analysis shows no significant change for these
numbers over 2012.
3,500
No. o
f stu
dent
s
0
500
1,000
1,500
2,000
2,500
3,000
Central Queensland Darling Downs South West Far North Queensland MetropolitanNorth Coast North Queensland South East
1-Jul-07 1-Jan-08 1-Jul-08 1-Jan-09 1-Jul-09 1-Jan-10 1-Jul-10 1-Jan-11 1-Jul-11 1-Jan-12 1-Jul-12 1-Jan-13
figure 4: apprentices and trainees in training in Queensland by region (based on skills Queensland data)

26 Queensland energy and TelecommunicaTions indusTry SkillS and Workforce development report 2013
Table 3: apprenticeship and trainee data by industry for the Queensland energy and telecommunications industries (based on skills Queensland data)
apprenticeship and trainee data Queensland for energy and telecommunication industries by industry sector
2007/2008 2008/2009 2009/2010 2010/2011 2011/2012 2012/2013*
commencements
communications - general 900 600 100 100 200 200
utilities - electrotechnology 3,400 2,400 2,600 3,300 3,400 1,600
utilities – gas** 0 0 20 0 20 0
utilities - general 200 100 100 100 100 100
Total 4,400 3,100 2,800 3,500 3,700 1,900
cancellation/Withdrawal/contract expiry
communications - general 500 400 50 20 30 30
utilities - electrotechnology 1,200 1,200 1,100 1,200 1,300 700
utilities - gas** 0 0 0 5 2 0
utilities - general 20 20 20 20 20 10
Total 1,700 1,700 1,200 1,200 1,300 800
completions
communications - general 500 400 200 100 100 0
utilities - electrotechnology 1,200 1,700 1,800 1,900 2,100 1,000
utilities - gas** 0 0 2 3 10 4
utilities - general 100 100 100 100 100 100
Total 1,700 2,200 2,200 2,100 2,300 1,200
in-Training
as at 1-Jul-08 1-Jul-09 1-Jul-10 1-Jul-11 1-Jul-12 1- Mar-13
communications - general 600 300 100 100 200 300
utilities - electrotechnology 8,100 7,600 7,300 7,500 7,500 7,300
utilities - gas** 0 0 20 20 30 20
utilities - general 500 500 500 500 500 400
Total 9,200 8,400 7,900 8,100 8,200 8,000
* Numbers for 2012/2013 are as at March 2013** Gas numbers are traditionally low in publicly funded training and are not rounded like the other sectors.
Double digits are rounded to the nearest 10, single digits are not rounded.
WorkForcE proFilE

27
The number of electrical apprentices who commenced in 2012/13 (FYQ1 – Q3) has decreased significantly from previous years (see Table 4). The commencement figures reported by month to March 2013 (cumulative) are approximately 1,000 below the figure reported in March 2012. In addition, the overall commencements in the second half of 2012 have followed the historic low of 2009/10. This indicates that 2012/13 will result in significantly fewer commencements than the last two years, and could potentially be lower than the global financial crisis years of 2008/09.
Typically, the residential/domestic industry employs the greatest number of electrical apprentices. The downturn in this sector is likely to be contributing to the low apprenticeship commencement numbers seen in the last 18 months. This is likely to cause longer term impacts i.e. 5+ years, to the ongoing shortage of qualified electrical workers.
There is a lag in commencement data provided formally by RTOs to the Department of Education, Training and Employment (DETE) and full numbers are reported to the department on a six monthly basis (December and June). Therefore, all commencements reported for January/February/March in April, are not final commencement figures. However, when Energy Skills Queensland compared the 2012/13 Q3 results to commencement numbers reported in previous years, it is clear that there has been significantly lower electrical apprentice commencements reported under the same conditions.

28 Queensland energy and TelecommunicaTions indusTry SkillS and Workforce development report 2013
Table 4: apprenticeship and trainee data by region for the Queensland energy and telecommunications industries (based on skills Queensland data)
apprenticeship and trainee data Queensland for energy and telecommunication industries by region**
2007/2008 2008/2009 2009/2010 2010/2011 2011/2012 2012/2013*
commencements central Queensland 500 400 400 500 600 300
darling downs south West 200 200 200 200 200 100
far north Queensland 300 200 200 200 200 100
metropolitan 1,400 900 900 1,100 1,200 600
north coast 600 500 400 500 400 200
north Queensland 400 300 200 300 300 200
south east 1,100 700 500 700 700 400
Total 4,400 3,100 2,800 3,500 3,700 1,900cancellation/Withdrawal/contract expiry central Queensland 200 200 100 100 200 100
darling downs south West 0 100 100 100 100 -
far north Queensland 100 100 100 100 100 -
metropolitan 500 500 300 400 400 200
north coast 300 300 200 200 200 100
north Queensland 100 100 100 100 100 100
south east 500 500 300 300 300 200
Total 1,700 1,700 1,200 1,200 1,300 800completions central Queensland 200 300 300 300 300 200
darling downs south West 100 100 100 100 100 100
far north Queensland 100 100 100 100 100 100
metropolitan 600 700 700 700 800 400
north coast 200 300 200 200 300 100
north Queensland 100 200 200 200 200 100
south east 400 500 400 400 400 200
Total 1,700 2,200 2,200 2,100 2,300 1,200in-Training as at: 1-Jul-08 1-Jul-09 1-Jul-10 1-Jul-11 1-Jul-12 1- Mar-13
central Queensland 1,300 1,300 1,200 1,200 1,300 1,300
darling downs south West 500 400 500 400 500 500
far north Queensland 500 500 500 400 500 500
metropolitan 3,000 2,800 2,600 2,700 2,700 2,600
north coast 1,100 1,000 1,000 1,000 1,000 1,000
north Queensland 800 800 800 800 800 700
south east 1,900 1,600 1,400 1,500 1,500 1,500
Total 9,200 8,400 7,900 8,100 8,200 8,000
* Numbers for 2012/2013 are as at March 2013** For regions see Figure 5
WorkForcE proFilE

29
figure 5: department of education and Training regions as referred to in table 4 and 5 (deTe, 2011)
Note: The metropolitan region only has one institute delivering technician and trade related programs. There are a number of private training organisations delivering programs within the energy and telecommunications industries.
Figure 6 represents the age distribution of apprentices in Queensland, for all of the trade job roles in this report. Although the majority of apprentices falls in the ‹25 age grouping (65%), there has been a noticeable increase in the number of apprentices entering as mature age (35%). These figures indicate that mature age apprenticeship pathways are a viable option for employees wanting to make a career change into electrotechnology and related industries. A qualitative assessment has been that most mature age apprentices enter into lineworker and cablejointer trades.
apprentice age profile (age at time of commencement)
figure 6: Queensland apprentice age profile
60%
0%
45%
40%
35%
30%
25%
0%
5%
10%
15%
20%
10%
20%
30%
40%
50%
<20 20-<25 25-<35 35-<45 45-<55 55+
14 14.5 15 15.5 16 16.5 17 17.5 18 18.5 19
2007 2009 2011 2013
2007 2009 2011 2013

30 Queensland energy and TelecommunicaTions indusTry SkillS and Workforce development report 2013
age breakdown <20 (as % of total)
figure 7: Queensland apprentice age profile <20
ageing populationQueensland’s population is projected to age caused by longer life expectancy and low birth rates. Under the medium series projections, the median age of the population is expected to increase from the current 36 years to 38 years by 2021, reaching 43 years by 2056 (OESR, 2011). All local government areas in Queensland can expect an increase in their population’s median age.
Almost one-third (32%) of the projected increase in population from 2006 to 2031 will be in the age group 65 years or more. Part of this increase in the numbers in this age group is a result of the proportionately large ‘baby boomers’ generation moving into retirement. In 1981, the baby boomer generation were young adults aged 16-35 years; in 2006 they were aged 41-60 years; and in 2031 they will be aged 66-85 years.
In the main working ages of 20-64 years, the future growth is expected to remain the same as the past. However, the big difference is the much larger increase projected in the number of people aged 65 years and older - the projected increase in the 25 years to 2031 of 796,000 is almost three times that recorded in the past 25 years. As the population ages, people in the older age groups will represent a much larger share of the total population. By 2031, it is projected that approximately one in every five Queenslanders (20%) will be aged 65 years or older.
Figure 8 illustrates the ageing profile of electrical workers in Australia (ESO, 2013). A large proportion of this workforce is nearing retirement age. It is highly likely that many of these older workers will choose to withdraw from the industry over the next five years. Therefore, it is vital that we develop strategies to attract and retain apprentices in order to address future skills shortages. It is also important that the industry retains as many older workers by upskilling them into training/mentoring roles.
WorkForcE proFilE
60%
0%
45%
40%
35%
30%
25%
0%
5%
10%
15%
20%
10%
20%
30%
40%
50%
<20 20-<25 25-<35 35-<45 45-<55 55+
14 14.5 15 15.5 16 16.5 17 17.5 18 18.5 19
2007 2009 2011 2013
2007 2009 2011 2013

31
Workforce age profiles
figure 8: The Queensland age profile, comparison between Queensland working average and the Queensland electrical worker, february 2013
migration
annual update of skilled occupation listThe Skilled Occupation List (SOL) has changed from 1 July 2013, with five occupations removed. The SOL determines which occupations are eligible for independent and family sponsored skilled migration.
The updated SOL is based on expert advice from the Australian Workforce Productivity Agency (previously known as Skills Australia). The list of occupations reflects the Australian Government’s commitment to a skilled migration program that delivers skills in need in Australia. The SOL will continue to deliver a skilled migration program focused on high value skills that will help to address Australia’s future skill needs. The trades relevant to the energy and telecommunications industries on the SOL list are (DIAC 2013):
• Electrical Engineer• Electronics Engineer• Telecommunications Engineer• Telecommunications Network Engineer• Electrical Engineering Draftsperson• Electrical Engineering Technician• Telecommunications Field Engineer• Telecommunications Network Planner• Telecommunications Technical Officer or Technologist• Electrician (General)• Electrician (Special Class)• Lift Mechanic• Air-conditioning and Refrigeration Mechanic• Electrical Lineworker• Technical Cable Jointer• Electronic Equipment Trades Worker• Electronic Instrument Trades Worker (General)• Electronic Instrument Trades Worker (Special Class)
There is also an opportunity for partners of skilled migrants to be placed into employment. The Gladstone region has shown that many partners of skilled migrants are highly-qualified but have not undertaken the ‘skills recognition’ process.
<25 25-<35 35-<45 45-<55 55-<65 65+
The Queensland average (ABS) The Queensland electrical worker
35%
30%
25%
20%
15%
10%
5%
0%

32 Queensland energy and TelecommunicaTions indusTry SkillS and Workforce development report 2013
strengthening the integrity of the 457 visa programThe purpose of the 457 visa program is to enable employers to fill skill shortages by recruiting qualified overseas workers where they cannot find appropriately skilled Australians. The 457 visa is a temporary visa, intended for filling short to medium term skill shortages, in a quick, flexible way to meet business needs. The program contains a number of in-built protections to prevent local workers’ conditions from being undercut and overseas workers from being exploited.
On 23 February 2013, the Minister for Immigration and Citizenship announced a number of reforms to the subclass 457 program. These reforms are aimed at strengthening the Department of Immigration and Citizenship’s capacity to identify and prevent employer practices that are not in keeping with the criteria of the subclass 457 program.
The measures being brought forward include (DIAC 2013):
• Introducing a requirement for the nominated position to be a genuine vacancy within the business. Discretion will be introduced to allow the department to consider further information if there are concerns the position may have been created specifically to secure a 457 visa without consideration of whether there is an appropriately skilled Australian worker available.
• Introducing a provision to allow the department to take action against sponsors who engage in discriminatory recruitment practices.
• Strengthening the market salary rate requirements to provide discretion to consider comparative salary data for the local labour market when deciding whether a nominated position provides equitable remuneration arrangements. Additionally, the market salary exemption threshold will be increased from $180,000 to $250,000 to ensure that higher paid salary workers are not able to be undercut through the employment of overseas labour at a cheaper rate.
• Strengthening the English language requirements by removing exemptions for applicants from non-English speaking backgrounds who are nominated with a salary less than $92,000 and requiring applicants who were exempt from the English language requirement when granted a visa to continue to be exempt from, or to meet the English language requirement when changing employers. Additionally, the definition of English language will be better aligned with the permanent Employer Sponsored.
• Strengthening the requirement for sponsors to train Australians by introducing an ongoing and binding requirement to meet training requirements for the duration of their approved sponsorship.
• Clarifying a requirement that 457 workers may not be engaged in unintended employment relationships by requiring workers to be engaged on an employment contract (as opposed to a business contract for services) and not on-hired to an unrelated entity unless they are sponsored under a labour agreement, or in an exempt occupation.
• Strengthening the existing obligation regarding recovery of costs to ensure that sponsors are solely responsible for certain costs.
The changes will not adversely affect the vast majority of employers who are using the program appropriately. However, the changes will strengthen the government’s capacity to identify and prevent employer practices that are not in keeping with the purpose of the 457 visa program.
If the department is not satisfied that, based on the information provided, a nominated position is genuine, the market salary rate is equitable, or that an employer has considered whether there is an appropriately skilled Australian available to fill the vacancy, then the employer may be requested to provide additional justification before a nomination can be approved (DIAC 2013).
WorkForcE proFilE

33
Queensland 457 visa trends to march 2012Changes to the 457 visa scheme to expedite the hiring of overseas workers into Australia have been welcomed by industry. The Department of Immigration and Citizenship Report 2012/13, indicates the number of 457 visas granted for skilled workers in Queensland.
Table 5: number of primary applications granted in 2012-13 to 31 march 2013 by electricity, gas, Water and Waste services industry, Queensland (diac, 2013)
2011-12 to 31/03/2012
2012-13 to 31/03/2013
% change from 2011-12
2012-13 as % of Total
electricity, gas, Water and Waste services
190 210 9.3% 2.5
Table 6: Top 15 nominated occupations for primary applications granted in 2012-13 to 31 march 2013, Queensland (diac, 2013)
anZsco description2011-12 to 31/03/2011
2012-13 to 31/03/2012
% change from 2011-12
2012-13 as % of Total
351411 Cook 200 470 135.8% 5.6%
Skilled Meat Worker 130 350 166.7% 4.1%
141111 Cafe or Restaurant Manager 70 270 309.2% 3.1%
511112 Program or Project Administrator 240 240 2.5% 2.8%
253111 General Medical Practitioner 250 240 -4.8% 2.8%
253112 Resident Medical Officer 190 200 5.2% 2.4%
139999 Specialist Managers nec 260 190 -24.6% 2.3%
242111 University Lecturer 220 190 -13.4% 2.2%
312512 Mechanical Engineering Technician 140 180 26.2% 2.1%
149212 Customer Service Manager 30 170 385.3% 1.9%
233211 Civil Engineer 220 150 -34.4% 1.7%
351311 Chef 140 140 0.0% 1.6%
321211 Motor Mechanic (General) 80 140 65.9% 1.6%
133111 Construction Project Manager 140 110 -16.2% 1.3%
221111 Accountant (General) 90 110 30.2% 1.3%
other 6,070 5,390 -11.2% 63.2%
Total 8,460 8,540 90.0% 100.0%
Despite the introduction of the Enterprise Migration Agreements (EMA’s), the overall migration in the 2011 census shows that people reported in the workforce (15 years and over) equalled just under 2.2 million people. This would mean that 457 migration contribution to the workforce was approximately 0.4%.

34 Queensland energy and TelecommunicaTions indusTry SkillS and Workforce development report 2013
EnErgy and TElEcommunicaTions sEcTor brEakdoWn
electricity generation
The electricity generation industry is expected to generate revenue of $20.7 billion in 2012/13, an average annual growth of 7.3% from $14.64 billion in 2007/08 (IBISWorld, 2013a). The generation sector is divided in three sub-sectors; fossil fuel, hydro, and wind and other electricity generation. The Australian fossil fuel electricity generation sector is expected to generate revenue of $17.1 billion in 2012/13, about 0.4% of Australia’s GDP. The annual revenue growth over the past five years was 4.1%, and is expected to be 2.3% for the coming five years. The Australian hydro-electricity generation sector is expected to generate revenue of $2.1 billion in 2012/13.
The annual revenue growth over the past five years was 3.8%, and is expected to be 3.9% for the coming five years. Australian wind and other electricity generation sectors are expected to generate revenue of $1.5 billion in 2012/13. The annual revenue growth over the past five years was 15.0%, and is expected to be 10.7% for the coming five years.
Energy Skills Queensland is an Industry Skills Body promoting career pathways, jobs and training for the energy and telecommunications industry in Queensland. Energy Skills Queensland leads energy industry and government engagement on education and training, skills development and labour market issues.
As Energy Skills Queensland is responsible for a number of sectors, the following section of the report provides a breakdown of each of the following industry sectors:
electricity and electrical services
• Electricity Generation• Electricity Transmission• Sustainable and Renewable Energy• Electricity Supply Industry• Electrical Services (Retail)• Electrotechnology
gas
• Gas Transmission and Distribution• Coal Seam Gas (CSG) to Liquefied Natural Gas (LNG)
Telecommunications
elecTriciTy and elecTrical services
The electricity industry is made up of four distinct yet interconnected sectors involved in producing electricity and delivering it to homes and businesses i.e. electricity generation, electricity transmission, electricity distribution, and retail (see figure 9). The Queensland electricity generation sector has a mixture of public and private ownership. The monopoly transmission and distribution assets are owned and operated by government-owned corporations, while the retail sector is entirely privately owned. The Queensland government owns electricity assets worth about $8 billion in generation, more than $3.9 billion in transmission and more than $13 billion in distribution (deedi, 2013). in addition, significant capital investment is being committed to transmission infrastructure (Powerlink) and distribution networks (energex and ergon energy) during the next five years.

35
5POWERLINKANNUAL REPORT 2011/12
CO
RPO
RA
TE
PRO
FILE
DISTRIBUTORSDeliver electricity to consumer premises
ENERGEX ERGON ENERGY
ELECTRICITY RETAILERSSell electricity to consumers and issue
electricity accounts
SOUTH EAST QUEENSLAND
Homes and businesses
REGIONAL QUEENSLAND
Homes and businesses
POWER GENERATORS including:
■ coal-fired ■ gas-fired ■ renewable (hydro, wind, biomass)
HIGH VOLTAGE TRANSMISSION GRIDBulk transport of electricity
POWERLINK
LARGE INDUSTRIAL CUSTOMERS including:
■ aluminium smelters ■ coal mines ■ rail
AUSTRALIAN ENERGY MARKET COMMISSION (AEMC)A statutory commission responsible
for developing the rules for the National Electricity Market and
for market development
AUSTRALIAN ENERGY MARKET OPERATOR (AEMO)Operates the National Electricity
Market and manages power system security
AUSTRALIAN ENERGY REGULATOR (AER)
Administers the National Electricity Rules and makes regulated revenue
determinations for monopoly networks
NA
TIO
NA
L T
RA
NSM
ISSI
ON
GR
ID (Q
ld, N
SW, V
ic, S
A, T
as)
Queensland’s power supply industryOur high voltage transmission network is just one link in the chain supplying electricity to Queenslanders. This diagram illustrates Powerlink’s role within the supply chain.
figure 9: The four electricity industry sectors (Powerlink Queensland, 2012)
Although electricity generation is a capital-intensive activity, the industry nonetheless employs about 8,000 people and is expected to pay approximately $1.0 billion in wages in 2012/13 (IBISWorld, 2013a). There are about 30 large firms involved in electricity generation, and numerous smaller ones that generate electricity for their own use and may also sell power into the public grid.

36 Queensland energy and TelecommunicaTions indusTry SkillS and Workforce development report 2013
Total installed fossil fuel generating capacity is about 49,500MW, of which about 45,500 MW is located in major power generating plants. Smaller generators provided a further 3,700 MW of capacity, including about 2,700MW of co-generation (where electricity is a by-product of other processes). Total renewable electricity generating capacity amounted to about 9,900MW (300MW up from last year), the majority of which consists of hydro-electric plants (IBISWorld).
Growth in the demand for electricity is expected to firm in 2012/13, as economic activity strengthens. Industry revenue is expected to expand by 10.3% in 2012/13, as higher prices (due to the introduction of carbon pricing) more than offset a fall in the amount of electricity generated from fossil fuels. Demand for electricity is expected to return to growth over the five years through 2017/18, reflecting ongoing economic growth and Australia’s increasing population. This is expected to support production growth over the five years through 2017/18. Some caveats remain, not least the political uncertainty around carbon pricing with an election due in September 2013, which could shape policy in this area.
Other issues affecting the industry are growing end user electricity prices, as distribution and transmission costs increase the average electricity bill. The rollout of small-scale solar generation among Australian households is another factor likely to limit demand growth, as are ongoing energy efficiency initiatives. Taking these challenges into account, industry revenue is expected to expand by an annualised 2.3% in the next five years, with revenue expected to reach $19.2 billion in 2017/18. Net profit is expected to grow slower than revenue due to cost pressures.
QueenslandQueensland currently has a generation capacity of more than 14,500MW (1,000MW up from 2012). Since 1998, $4.7 billion or 75% of new generation investment in the National Electricity Market (NEM) has occurred in Queensland. By 2015, about $12 billion more will be invested in over 10,000MW of new generation capacity across the NEM. Given the high quality and low cost of Queensland fuel sources, and their proximity to load growth, a large proportion of this investment is expected to occur in this state (DEEDI, 2013).
Government-owned corporations have a stake in about 65% of the state’s generation capacity, but the numbers of partially or fully privately owned power stations are increasing. The Queensland Government plans to reduce the share of the aggregate capacity the State owns or operates in Queensland to around 50%, primarily as a result of new capacity requirements being met by the private sector.
The government maintains outright ownership of power stations operated by Stanwell Corporation and CS Energy. It has undertaken joint ventures with private power generation companies (Callide C) and maintains power purchase agreements with privately owned power stations (such as Gladstone and Collinsville).
In 2009, the Queensland Government reviewed the structure and preparedness of the Government-owned corporation generators (Gencos) to meet the new challenges facing these businesses, particularly in respect of climate change policy responses and competition from large vertically integrated retailers. The review identified a number of benefits associated with moving from a three Genco structure (Tarong Energy, Stanwell Corporation and CS Energy) and on 1 July 2011, restructured into a two Genco structure (CS Energy and Stanwell).
EnErgy and TElEcommunicaTions sEcTor brEakdoWn

37
electricity transmission
The electricity transmission industry operates the high-voltage electricity network, linking electricity generators to the distributors that operate the low-voltage electricity supply system. The industry operates 14,000 kilometres of high-voltage electricity transmission network, transporting electricity from the generators to the distribution networks, and directly to large customers such as aluminium smelters. The transmission network is continuing to develop in response to demand growth. Powerlink Queensland is expected to invest more than $3.5 billion in capital projects over the five year period to 2016/17.
Most of the Queensland power stations in the east coast network are directly connected to the Queensland transmission system. Electricity also flows between Queensland and New South Wales via the large-capacity Queensland/New South Wales Interconnector (QNI) and the smaller Terranora interconnector (DEEDI 2013).
The industry is expected to generate revenue of $4.0 billion in 2012/13, up from $3.2 billion in 2011/12. The industry has achieved an average annual increase of 5. 5% over the past five years, and is mainly due to increased transmission volumes. Industry revenue is forecast to grow by 2.7% over the 2013/18 period. The industry’s net profit is estimated to be $2.0 billion in 2012/13 (IBISWorld, 2013b).
Electricity transmission is a capital-intensive activity and the industry employs only 3,700 (up from 3,000 in 2012) people, paying $395.1 million in wages in 2012/13 (IBISWorld, 2013b). Only a small number of firms are involved in electricity transmission, and they have an average of two establishments each. The number of firms involved in the industry has remained static since 2007/08, and is expected to be unchanged through to 2017/18 (IBISWorld, 2013b).
During the next five years, industry revenue is expected to grow by 2.7% per year, to reach $4.56 billion in 2017/18. However, transmission volumes are forecast to increase only 1.0% per year, as higher electricity prices dampen growth in the demand for electricity and hence in the volume of power transmitted. Nonetheless, electricity transmitters will need to increase their charges in order to cover higher spending on infrastructure.
QueenslandPowerlink Queensland, a government-owned corporation, manages the transmission of electricity in Queensland. Powerlink employs around 1,000 people and is licensed to operate more than 14,000 kilometres of Queensland’s high-voltage transmission network, transporting electricity from the generators to the distribution networks, and directly to large customers such as aluminium smelters (Powerlink Queensland, 2012).
Powerlink Queensland efficiently transports about 50,000 gig watt hours of energy per year throughout Queensland. Powerlink also transports electricity to New South Wales via the Queensland/New South Wales Interconnector (QNI) transmission line. Electricity distributors Energex, Ergon Energy and Essential Energy take the high voltage electricity from Powerlink’s substations and distribute it to more than two million residential and commercial customers throughout Queensland and parts of northern New South Wales.
In 2011/12, Powerlink Queensland invested $752.9 million in capital works to replace and extend the life of ageing assets to maintain reliability of electricity supply and meet electricity demand. They also invested $94.3 million in maintaining the network with emphasis on efficiencies in work programs and techniques to minimise network outages.
38 Queensland energy and TelecommunicaTions indusTry SkillS and Workforce development report 2013
impacts of green and renewable energy on the future electricity workforce
The Clean Energy Council has undertaken a comprehensive survey of renewable energy industries and system installers to ascertain the current skills base and the future training requirements of an expanding renewable energy industry. The main findings of their report were as follows:
• Too few undergraduate courses that cover renewable energy technologies are currently available.
• There is a specific need for flexible or e-delivery of accredited courses through universities, such as distance education where course units can be used toward a diploma or masters degree.
• Too few local TAFE colleges are currently offering courses on renewable energy.
• There is no management training for technical staff.
• More qualified trainers are needed.
There are currently an estimated 10,400 employees in the renewable energy industry. Conservative projections show that these employment numbers need to more than double over the next decade. If the growth experienced by the industry over the last few years continues, the total number of people estimated to be employed by the industry in 2020 could be over 30,000.
To meet the requirements for skilled staffing across all sections of the renewable energy industry, consistent and accessible training at all levels is needed. This will require investment into:
• More courses at undergraduate and higher levels in a geographic spread of universities.
• Access to other delivery models such as distance learning and short-form/bridging courses to allow existing graduate level staff, in such disciplines as engineering and science to specialise in renewable energy.
A significant increase in the number of TAFE-level institutions offering renewable energy training is essential if Australia is to meet the needs of the expanding sector.
electricity supply industry
The electricity supply industry is expected to generate revenue of about $25.7 billion in 2012/13, representing average annual growth of 5.8% (IBISWorld, 2013c). The industry revenue is expected to grow at a similar rate of 5.7% over the coming five years, mainly due to higher prices.
Electricity generation is changing, and this is affecting the electricity distribution. An array of policy incentives, most notably renewable energy at a federal level and support for solar panel installation at a state level have led to increases in the share of energy generated using renewable technology. Such generation has a very different profile to the current dominant fossil fuel technologies. Solar photovoltaic technology (solar panels) has the most disruptive potential. Solar panels can be installed close to where electricity users live and work and they produce energy during the hours of peak demand. The kind of transport network that can carry and distribute electricity from such generation is very different from the current infrastructure. Current systems are designed to transport electricity from generators to end users, with no duplication in the role of generator and user. Renewables are becoming increasing cost competitive with retail energy prices, even as the subsidies present in the past five years are wound back. The growth in this form of generation may challenge industry operators in the five years through 2017/18. So far the state with the highest penetration of installed small scale solar generation is South Australia, where one in five homes have solar panels installed. The Melbourne Energy Institute recently published an analysis of the effect on energy markets. The result of the uptake of solar panels has been a decline in peak daily demand for electricity and a change to when it occurs. Peak daily demand has moved to later in the day when solar panels are less efficient.
EnErgy and TElEcommunicaTions sEcTor brEakdoWn
39
Queensland’s electricity distribution systemElectricity is supplied to most Queensland customers via an electricity distribution system, which connects the high-voltage transmission system to individual premises. Queensland has over 1.9 million industrial, commercial and domestic consumers of electricity. These consumers are serviced by ENERGEX (supplies customers in South East Queensland), Ergon Energy (supplies rural and regional Queensland) and Essential Energy (a New South Wales distributor, formerly known as Country Energy, whose supply area extends over the border near Goondiwindi).
Queensland’s electricity distribution networks are extensive, with a total line length of about 200,000 kilometres. ENERGEX has a distribution area of 25,000 square kilometres, which includes:
• More than 50,000 kilometres of power lines
• Over 600,000 power poles
• 43,000 transformers
• Almost 300,000 streetlights
Ergon Energy’s network consists of more than 150,000 kilometres of power lines and 1 million power poles and covers an area six times the size of Victoria (DEEDI, 2013).
demand management skillsTo ensure that distribution capacity is available to meet Queensland’s peak electricity demand each year, there is not only a need to increase the distribution capacity, but there is an additional necessity for ongoing and increased investment in demand management skills. Demand management is a complex area as it relates to technology, technology introduction, and to its availability i.e. it must be available at the time of need, and willingness from the community.
Initiatives such as embedded generation, fuel switching, energy efficient appliances and alternative network options (e.g. new transmission support) are all part of demand management. The ability for network operators to turn-off non-essential appliance, such as pool pumps and air-conditioning units is an often talked about part of peak demand management. Demand management is going to be an essential skill for the energy sector in the future.
electricity supply industry (esi) passport description of workforceIn September 2010, the Electricity Supply Industry (ESI) Passport was launched with the aim to allow ESI workers to move between the Australian states. The passport provides evidence of a person’s currency of refresher training and authorisations and encourages standardisation of training in the ESI. So far over 34,200 licenses have been issued (up 54% from 2012) and this document falls in line with the National Occupational Licencing Scheme (NOLS) framework. A description of the workforce registered by worker category is listed in Table 7.
Table 8 shows the distribution of persons who have signed up to the ESI passport by state. Victoria has the greatest number of participants, accounting for roughly a third of all registrations. In the last year the Northern Territory (from 0 to 300), New South Wales (from 10 to 8,300) and Western Australia (from 1,300 to 4,400) were the largest contributors to the increase in numbers.
As the passport is more widely used across Australia, it is expected that this will lead to an easier path for internal migration of skilled labour. Although this is not expected to be a real pathway in the near term, it is important to mention that as ease of internal migration increases due to greater alignment of training and legislation across the Australian states, this in turn will make it easier for poaching across state borders to occur.

40 Queensland energy and TelecommunicaTions indusTry SkillS and Workforce development report 2013
Table 7: The esi Worker Profile
Worker category name description % of total
lineworker distributionLineworker engaged in working on distribution and sub-transmission assets up to 66kV.
17%
support Worker OHS coordinator, trainer, managers, auditor. 17%
Technical WorkerIncludes all types of design, SCADA technician, telecommunications technician.
10%
electricianElectricians working on ESI network infrastructure, including work in distribution, transmission, zone substation or terminal stations, and a generation environment.
9%
Team leader / supervisor Team leader/supervisor not actively engaged in field work. 6%
apprentice A person in training to become a qualified tradesperson in the ESI sector. 6%
electricity supply Worker - non Trade
A person with no electrical qualification working on ESI infrastructure e.g. cable layer, plant operator, meter reader, rigger, civil workers.
5%
vegetation WorkerEngaged in vegetation control work for ESI network infrastructure – elevated or on ground.
5%
engineer All streams i.e. civil, electrical working in the ESI. 5%
non electrical WorkerA person with no electrical qualifications who works in an ESI environment, e.g. cleaner, maintenance workers, fire services technician, labourer, gardener, stores person, and driver.
5%
live lineMaintenance of electrical equipment, often operating at high voltage, while the equipment is energised.
4%
Trade WorkerTradespersons working in a non-electrical area, e.g. painter, plumber, concreters, carpenter, mechanic etc.
3%
meter TechnicianEngaged in the installation of direct, C/T and/or high voltage metering installations.
2%
Tester, Protection, control and cables
Includes testing protection and control circuits associated with transmission and distribution and stations. Includes field protection devices and cables.
2%
cable Jointer Jointing and laying high voltage and/or low voltage cables. 2%
asset inspector Engaged in asset inspection, pole testing and data capture. 1%
lineworker Transmission Lineworker engaged in working on transmission assets above 66kV. 1%
electrical inspectorEngaged in compliance inspections of customers high voltage and/or low voltage installations.
1%
switching operator
Describes a person whose duties are primarily operating networks even though they may be qualified in other areas. Includes all operating to be defined by the authority in the passport, transmission, distribution, stations.
1%
Total 100%
(Source Energy Skills Queensland - ESI Passport database)
EnErgy and TElEcommunicaTions sEcTor brEakdoWn

41
Table 8: Persons signed up to esi Passport as of 2013
Vic nsW Wa Tas Qld sa acT nT Total
2013 11,100 8,300 4,400 4,400 4,000 1,300 500 300 34,200
2012 7,200 10 1,300 2,100 3,600 1,000 400 - 15,500
(Source: Energy Skills Queensland - ESI Passport database)
esi Passport users
figure 10: Persons signed up the esi Passport by state
(Source Energy Skills Queensland - ESI Passport database)
electrical services (retail)
The electrical services industry is the largest of the building and construction contracting trades, accounting for about one-seventh of the gross product, revenue and employment in the construction trade services sector. Industry activities span across all building, infrastructure and industrial markets. Services provided include the installation of new electrical, electronic, communications and industrial equipment; the installation of wiring and cabling and the repair and maintenance of existing electrical equipment and fixtures (IBISWorld).
The industry currently generates revenue totalling $19.9 billion. Revenue is expected to grow by an annualised 2.6% per annum over the five years through 2012/13. The industry’s medium to long term performance has been boosted by work resulting from the emergence of new technologies, particularly broadband communications cabling. Electrical contracting activity in Queensland is currently subject to the one-off stimulus resulting from the devastating floods in January 2011. Initially, this boosted demand for electrical inspections and reconnections in the short term, and also supports demand for rewiring on existing buildings and infrastructure, and installation work on new replacement buildings and structures in the long term.
ESI Passport users
VIC NSW WA TAS QLD SA ACT NT
15,000
10,000
5,000
0

42 Queensland energy and TelecommunicaTions indusTry SkillS and Workforce development report 2013
Queensland accounts 19% to 20% of industry establishments, roughly corresponding with the state’s share of the National economy. Queensland’s share of industry contractors will be boosted in the short term by the influx of workers to meet the demand for reconstruction activity in the aftermath of the devastating floods of January 2011. Queensland, just like Western Australia and the Northern Territory, has greater demand for specialised electrical services dispersed across wide regional markets servicing the mining and energy industries.
The Queensland Government has progressively introduced retail competition into the state’s electricity market since 1998. Large commercial and industrial customers have been able to choose their energy retailer for some time, with many customers entering into negotiated contracts with their retailer of choice. In July 2007, Full Retail Contestability (FRC) commenced in Queensland’s electricity and gas markets, giving all Queensland customers connected to the national electricity grid and major gas networks the right to choose their energy retailer - including some 1.8 million small business and residential customers. With the introduction of FRC, a new distinction between ‘large’ and ‘small’ electricity customers has been made (DEEDI, 2013). Large customers are those that consume more than 100 megawatt-hours (MWh) of electricity each year. Small customers are those that consume up to 100MWh of electricity each year, which includes many small businesses.
electrotechnology
industry sector coverageThe Queensland electrical contractors’ workforce covers the domestic, commercial and industrial sectors of the industry. Seventy-eight per cent (78%) of the Queensland contractors operate in at least more than one of these sectors, with 39% of contractors operating in all three sectors.
The Queensland electrotechnology sector is still responding to the devastating weather events through 2011 and 2012, which has seen an increase in demand for electrical inspections, reconnections and rewiring on existing buildings and infrastructure, and will boost installation work on new replacement buildings and structures. Within the construction market, the demand for electrical contracting services has reduced with the slowdown in new construction in the south east Queensland.
A catalyst for industry expansion over the past decade has been the surge in the demand for the installation of technologically advanced products such as electronic communication equipment, data cabling and fibre optics. The industry has also derived substantial impetus from the accelerated growth in infrastructure construction over the past decade and the restructuring of this market through privatisation and corporatisation, which has generated new opportunities for the outsourcing of services to private electrical contractors. The industry has also trended towards energy conservation in the household market combined with moves by government authorities and building owners and developers to improve the green rating of commercial properties.
skills requirements
energy auditing skills
The electrotechnology sector and electrical contractors in particular are reporting a continued slowdown in the volume of available work. This is more prevalent in urban centres such as Brisbane and the Gold and Sunshine Coasts, where a continued depressed construction sector is impacting the reduced employment opportunities. An area of growth in this sector is the energy auditing function, where it is expected that an increase of opportunities will be driven by the introduction of Green Buildings legislation. An energy audit is an inspection, survey or analysis of energy flows and consumption in a building, process or system, with the purpose to reduce the amount of energy use. Energy audits are an excellent way to evaluate the impact a system (for example a business or domestic property) has on the environment, by examining energy consumption. Energy audits commence the process of establishing environmental consciousness, as well as providing an opportunity to save money.
EnErgy and TElEcommunicaTions sEcTor brEakdoWn

43
electrical skills transition from residential to heavy industrial
As mentioned previously in the report, there is a skills mismatch for those electrical workers in demand and those working in sectors that are in downturn. Although all electricians are trained through a common qualification framework, the chosen industry pathway will emphasise certain knowledge and skills required for that industry sector. An example of this is the traditional role of a residential and commercial construction electrician compared with a heavy industrial electrician. Both share core or generic skills but require specific knowledge and skills not found in both pathways.
Refresher training would be required for residential and commercial electricians who have had minimal exposure to heavy industrial electrical applications, especially within the oil, gas and mining industries. A list of areas where there would be a requirement for refresher training includes installation/commissioning/problem solving the following:
• Localised industrial standards and work practices• Motor control including variable speed drive • Problem solving complex control and protection systems• Programmable logic controllers• Documentation and numbering• High voltage sub-systems• Process instrumentation• Hazardous area equipment• Low voltage installation compliance• Applying environmental and sustainable procedures• Problem solving DC circuits• Working with SIL and TÜV safety standards• Pipeline cathodic protection
Further investment is needed to assist electrical workers who want to transition to the industrial/infrastructure industry sectors, to increase the available workforce both from a skills and regional mobility perspective.
gas (including csg, lng and lPg)
gas transmission and distribution
gas is a vital energy source for Queensland’s industrial and manufacturing sectors. it is also increasingly used in electricity generation throughout Queensland, and is a major new export industry, based on the production of liquefied natural gas (lng) from Queensland’s gas resources. The term ‘gas’ is used to describe natural gas, which is predominantly methane, a naturally occurring gas. conventional natural gas is often found and produced with other petroleum products such as oil. coal seam gas (csg) is found and produced from the cleats and fractures of coal seams. While the location and production method is different, natural gas produced from conventional gas fields and csg gas fields is the same product. commercial quantities of natural gas are produced from both conventional and csg fields in Queensland.
Another form of gas used in households and industry is liquefied petroleum gas (LPG). LPG is a mix of the gases propane and butane and is stored and transported in metal canisters (gas bottles) as a liquid. LPG is produced by collection of butane and propane produced with conventional natural gas, and also as a by-product from the oil refining process. Its most common use in Queensland is as a fuel for barbeques and stoves.

44 Queensland energy and TelecommunicaTions indusTry SkillS and Workforce development report 2013
The Australian gas supply industry sector consists of gas retailers, who buy and sell gas, and gas distributors, who operate the distribution networks that carry gas to end users. The industry is expected to generate revenue of $10.6 billion in 2012/13, up from $7.73 billion in 2007/08, equating to growth of about 6.5% per year over that five-year period. Industry revenue is expected to increase by 13% in 2012/13, reflecting higher gas prices (due partly to the introduction of the carbon tax) and a moderate increase in the volume of gas consumed. Employment numbers are relatively modest, at 2,100 people in 2012/13. The domestic price of natural gas is influenced by world prices (since gas is traded internationally in the form of LNG and LPG). This connection is expected to become stronger once the construction of export-oriented liquefied natural gas (LNG) projects in Queensland is complete.
Queensland gas schemeInitiatives such as the Queensland Gas Scheme have boosted the Queensland gas market and development and expansion of gas reserves and infrastructure. The Queensland Gas Scheme began in 2005 and was established to boost the State’s gas industry and reduce greenhouse gas emissions. The scheme is regulated under Chapter 5A of the Electricity Act 1994. Under the scheme, Queensland electricity retailers and other liable parties are required to source a prescribed percentage (currently 15%) of their electricity from gas-fired generation.
closure of the Queensland gas schemeWhen the Australian Government’s carbon pricing mechanism (CPM) was introduced in July 2012, the Queensland Government reviewed the Queensland Gas Scheme and identified that it would provide an advantage to gas-fired generators and likely duplicates the expected impacts of the CPM. The review also identified the scheme had met its key objective to establish a mature gas industry in the State.
On 8 March 2013, the Queensland Government announced that the scheme would close on 31 December 2013. There will be no further Gas Electricity Certificate (GEC) creation or liability after 31 December 2013, however, administration of the scheme and the registry will continue until the penalty imposition day of 30 June 2014.
The Queensland Government’s decision to close the scheme at the end of 2013 gives the gas industry time to:
• Renegotiate any relevant contracts in place.
• Calculate the amount of GECs currently in the market.
• Calculate the number of GECs required to meet retailers’ liability for the 2013 calendar year.
Closing the scheme is also expected to cut red tape for business and lower the cost of living for Queenslanders by placing downward pressure on electricity prices (Queensland Government, 2013).
The gas market reviewThe Queensland Gas Market Advisor (QGMA) is responsible for leading the Gas Market Review (GMR) process and advising the government on review outcomes. The QGMA is also accountable for progressing government actions in response to the reviews. The 2012 GMR has a strong upstream focus aimed at establishing reserves allocations and development rates, and identifying and quantifying any constraints on reserves that may impact on gas supply availability, gas market development, security of supply, and likely wholesale gas price outcomes in Queensland and in the broader eastern Australian gas market.
The QGMA has investigated the condition of the Queensland’s gas market, and has highlighted that the Queensland gas market lacks liquidity, with gas in short supply for new contracts both before and after 2015 (with 2015 marked as the year most of the new LNG plants to be operational). This contributes to a high level of uncertainty in the market, which is also impacted by the uncertainties of domestic and international LNG and future gas prices.
EnErgy and TElEcommunicaTions sEcTor brEakdoWn

45
In the 12 months to June 2012, customers seeking new domestic supply contract for gas after 2015 reported a continued lack of access to basic market information (forward prices, volumes available and potential delivery timeframes) for forward contracting. No customers seeking domestic supply of gas reported achieving a term sheet (binding or non-binding) for a large volume of gas. A small number of customers report offers of small volumes of gas for short term supply.
A feature of market activity in the past 12 months has been the entrance of LNG proponents as customers of other producers. In contrast to customers seeking domestic supply of gas, LNG proponents have been able to access the required information and contract for gas.
From these conditions, the QGMA has extracted a list of pressing issues. First, access to gas reserves for domestic contracting is particularly sensitive to the development of the LNG trains prior to 2020. For the current level of six committed LNG trains and a further potential two trains (eight in total), the QGMA has found that there are enough available reserves throughout a 20-year period, and subsequently sufficient gas to supply all demand including LNG trains. Under this scenario (up to eight trains), gas would be expected to become available to the domestic market. Beyond the development of eight LNG trains prior to 2020, reserves shortfalls would occur with the level of shortfall proportional to the number of additional trains developed. The QGMA has modelled future gas prices in a wide range of $6 to $12/GJ, depending on the submarket demand and oil prices, and believes that regardless of demand, market expectation of future gas prices continues to remain at the higher end of the range.
The QGMA recommends that government consider the security of domestic gas supply and market liquidity in the planning and approval process for development of future new LNG trains. There are a range of potential options, ranging from regulatory intervention to market facilitation, that could encourage market participants to achieve balanced export/domestic market outcomes, and a wider, more informed debate is desirable.
coal seam gas (csg) to liquefied natural gas (lng)
Liquefied natural gas (LNG) production in Australia is set to rival that of major international producers. Combined with export volumes from the west coast, Australia will emerge as one of the largest worldwide exporters of LNG second only to Qatar.
Construction on Curtis Island in Gladstone has ramped and currently three LNG trains are under construction. Combined with the development of the coal and gas reserves of the Surat Basin region, this will result in substantial growth in the Darling Downs southwest region, providing significant economic benefits to Queensland over the next decade. An AEC group report (2008), commissioned by the Department of Employment, Economic Development and Innovation (DEEDI), examined the high, medium and low scenarios for potential resource development in the Surat Basin. Growth projections based on a medium-level scenario include (DEEDI, 2010):
• Production of CSG is expected to increase ten-fold by 2031.
• As a result of this activity, Gross Regional Product will double by 2031 to approximately $9.3 billion, with the most rapid increase occurring between 2014 and 2018.
• Employment in the coal, CSG and LNG sectors in the Surat Basin region is projected to increase by 12,500 in the same time frame, with additional job growth in other sectors.
Energy Skills Queensland has been commissioned to undertake the CSG/LNG Operations and Maintenance Workforce Plan and has reported similar numbers to the AEC report. Some of the findings of the CSG/LNG Operations and Maintenance Workforce Plan are detailed over the page.

46 Queensland energy and TelecommunicaTions indusTry SkillS and Workforce development report 2013
number of lng trainsTo ensure the LNG train component (downstream) of the workforce was not being understated, the impact of increasing the number of trains was considered. The number of workers needed for each additional train increases only slightly as economies of scale are found. Table 9 shows an example increase of one LNG train to two LNG trains.
Table 9: example workforce numbers for one and two lng trains
lng trains
1 2
maintenance 30 40
operations 20 30
administration 30 35
Total on site 80 105
Total employed 140 195
Because the impact on the operations workforce of building additional trains is minimal, forecasting a six and eight train scenario builds an accurate picture of the current and projected workforce needs for the CSG/LNG industry in Queensland. These six train and eight train scenarios were used for the overall workforce requirements, as well as the downstream component of the project. Table 10 shows the four main projects by estimated year of first gas production, as well as the expected capacity (PJ) each company expects to produce.
Table 10: The four main csg/lng projects
Project companyestimated year of
gas productionestimated new
capacity (PJ)
Queensland curtis lng project
BG Group 2014 450
gladstone lngSantos / Petronas / Total /
Kogas2015 410
australia Pacific lngOrigin / ConocoPhillips /
Sinopec2015 480
sub-total 1,340
arrow lng Plant Shell / PetroChina 2017+ 420
Total 1,760
EnErgy and TElEcommunicaTions sEcTor brEakdoWn

47
number of wellsThe second driver for the workforce forecasts was the variability in the number of wells that will be drilled throughout Queensland over the life of the current projects. The number of wells that will be drilled is determined by the volume of gas each well produces, and is not dependent on the number of LNG trains that will be constructed. The gas field and pipeline component of the project (upstream) is broken into three scenarios:
• Base level: 28,200 wells• A 10% increase: 30,800 wells• A 30% increase: 40,300 wells
Figure 11 shows the projected total workforce for six LNG trains for each of the well scenarios. Using these projections, the operations and maintenance workforce is expected to peak in 2024, at 9,110, 9,600, and 11,300 workers for each well scenario. The workforce will be a mix of direct employees of each gas company and contractors, with the contractor workforce forming the majority of workers.
Projected Total Workforce scenario one (6 trains)
figure 11: Projected Total Workforce for the csg/lng industry in Qld 2014 – 2034 (6 lng Trains)
40,300 Wells 30,800 Wells 28,200 Wells
13,00012,00011,00010,0009,0008,0007,0006,0005,0004,0003,0002,0001,000
-2014 2015 2016 2017 2018 2019 2020 2021 2022 2023 2024 2025 2026 2027 2028 2029 2030 2031 2032 2033 2034

48 Queensland energy and TelecommunicaTions indusTry SkillS and Workforce development report 2013
critical job rolesThe job roles have been grouped by ‘upstream’ and ‘downstream’ to determine what actions need to be put in place at a regional level to address any potential skills gap. The list contains a number of qualifications, as well as skill sets required for workers who hold ‘generic’ qualification. For example, well work over skills are currently part of a drilling qualification but are not yet formal qualifications on their own. Energy Skills Queensland’s Drilling Industry Leaders Group, in collaboration with SkillsDMC, has been working with the drilling industry to build four new qualifications to support well servicing. These new qualifications are expected to be available in early 2014.
There are also similar electrical and operator roles where specific skills and experience is required which are not directly linked to formal qualifications. The qualification for operators is a certificate III in process plant operations, however these workers are recruited from a variety of backgrounds that have existing trade or professional qualifications and are unlikely to be ‘green hand’ workers. The critical job roles for the CSG/LNG operations and maintenance phase are identified in Table 11.
Table 11: critical job roles for the csg/lng operations and maintenance phase
upstream downstream
Assistant Drillers Electrical Fitter/Mechanics
Cable Jointers Engineers
Derrick hands Health, Safety and Environment Officers
Drillers Higher level Operators
Electrical Fitter/Mechanics Instrumentation and Control Technicians
Engineers Procurement Officers
Floor hands Project Managers
Geologists Telecommunication Technicians
Geophysicists
Health, Safety and Environment Officers
High Voltage Switching Electricians
Lease hands
Motorman
Project Managers
Rig Managers
Telecommunication Technicians
Tool pushers
EnErgy and TElEcommunicaTions sEcTor brEakdoWn

49
TelecommunicaTions services
a rapid increase in connectivity has entrenched telecommunications as a vital part of day-to-day functioning of australian businesses and has changed the way australians interact, with social networking moving online. despite the increased demand to communicate over these networks, revenue for the telecommunications services sector will rise by only 0.8% to $43.1 billion in 2012/13 (iBisWorld, 2013). industries within the telecommunications services sector have experienced contrasting results. overall sector revenue has remained stable, and is expected to record an annualised decline of 0.2% in the five years through 2012/13. however, over the past five years there has been an increased demand and use of telecommunications services. despite the increased demand, intense intra-industry and intra-sector competition has created a fiercely competitive environment. This has meant that growth in demand has been achieved at the expense of other more profitable telecommunications services.
The appetite for constant connectivity and the blossoming of data are the two major stories of the past five years. Mobile network infrastructure in Australia advanced with third generation (3G) networks assuming dominance. The next generation of mobile technology enabled significant enhancements to the quality of service offered and, when combined with increased affordability, resulted in extra push behind the fixed-to-mobile substitution trend. This trend has resulted in mobile service revenue surpassing all fixed-line revenue for the first time ever in 2007/08, with mobile revenue now worth over $20 billion.
Key workforce issues facing the telecommunications sector
The NBN continues to impact the skills requirements in the telecommunications sector in Queensland and across Australia. There a number of workforce related issues that will determine the level of criticality of skills shortages faced by this industry. In particular, the difficulty contractors are experiencing in accessing the required NBN training is a critical issue. There is also a disconnect reported between industry needs and the capacity and capability of TAFE and RTOs to meet those needs. For example, competency requirements in ‘ribbon fibre’, a new technology required for the NBN rollout has seen a three year delay in a training competency to be developed. Endorsement processes for new qualifications, and the length of time endorsement takes, has further compounded the lack of skills development for the NBN. The ‘ribbon fibre competency is currently still in the process of endorsement by the National Skills Standards Council (NSSC).
In addition to the slow development and approval of courses, the NBN Accreditation does not link to the Australian Qualifications Framework (AQF). Accreditations are targeted at workers that perform specific tasks and may have some components which potentially relate to units of competency, however formal qualifications will not be issued. This will have long term impacts for workers post NBN rollout, as their skills gained during employment will not have formal transferrable qualifications assigned. An example of a workforce that has been affected by this approach are ex-Telstra workers, who were highly trained but were not issued with any formal qualifications or skill sets. This has led to difficulty in getting their skills recognised. The complex recognition of prior learning (RPL) processes and requirements have in many cases led to workers being required to unnecessarily complete formal qualifications. This has increased the cost for both individuals and organisations.
There is a misalignment between long term forecasting and the number of highly-skilled workers required at any given time during the rollout. This has impacted staff planning for a number of contractors participating in the project. To compound this, pricing pressures placed by NBN Co have resulted in increased pressure on contractors to attract highly skilled staff at uncompetitive wages. Workers with engineering, IT and electrical backgrounds, especially in regional Queensland, have wider employment options in higher paying industries making the NBN rollout in regional areas a concern.
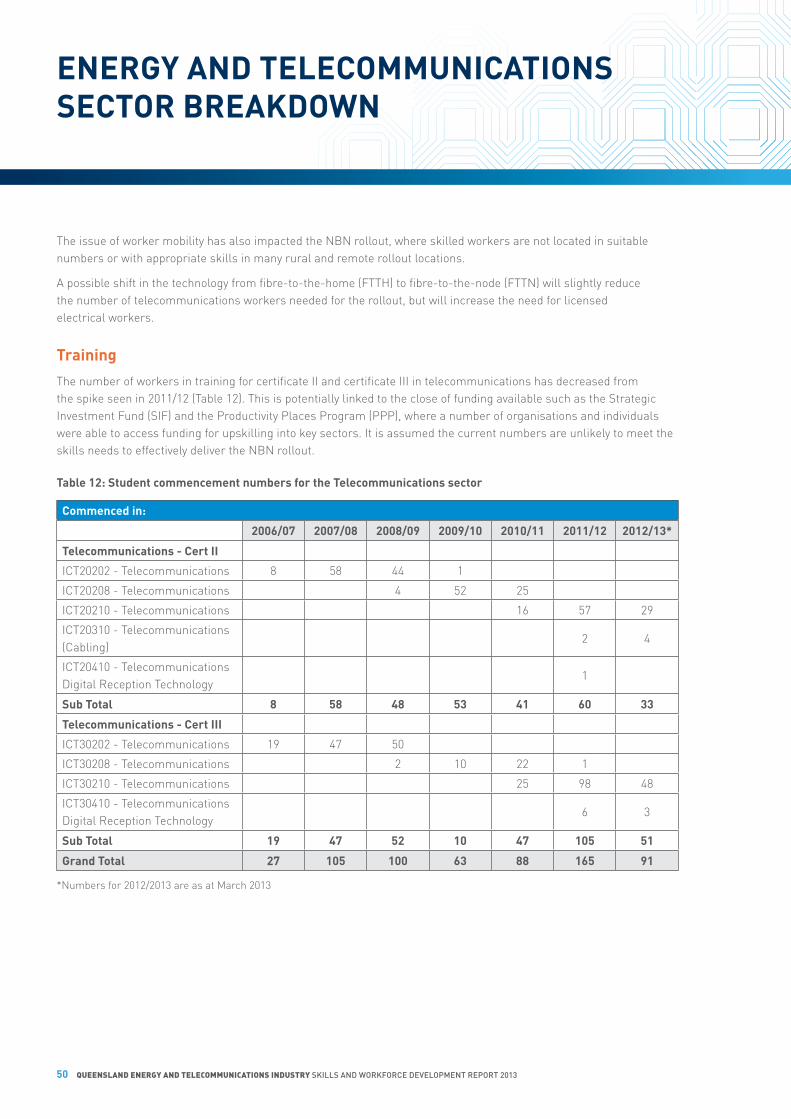
50 Queensland energy and TelecommunicaTions indusTry SkillS and Workforce development report 2013
The issue of worker mobility has also impacted the NBN rollout, where skilled workers are not located in suitable numbers or with appropriate skills in many rural and remote rollout locations.
A possible shift in the technology from fibre-to-the-home (FTTH) to fibre-to-the-node (FTTN) will slightly reduce the number of telecommunications workers needed for the rollout, but will increase the need for licensed electrical workers.
Training
The number of workers in training for certificate II and certificate III in telecommunications has decreased from the spike seen in 2011/12 (Table 12). This is potentially linked to the close of funding available such as the Strategic Investment Fund (SIF) and the Productivity Places Program (PPP), where a number of organisations and individuals were able to access funding for upskilling into key sectors. It is assumed the current numbers are unlikely to meet the skills needs to effectively deliver the NBN rollout.
Table 12: student commencement numbers for the Telecommunications sector
commenced in:
2006/07 2007/08 2008/09 2009/10 2010/11 2011/12 2012/13*
Telecommunications - cert ii
ICT20202 - Telecommunications 8 58 44 1
ICT20208 - Telecommunications 4 52 25
ICT20210 - Telecommunications 16 57 29
ICT20310 - Telecommunications (Cabling)
2 4
ICT20410 - Telecommunications Digital Reception Technology
1
sub Total 8 58 48 53 41 60 33
Telecommunications - cert iii
ICT30202 - Telecommunications 19 47 50
ICT30208 - Telecommunications 2 10 22 1
ICT30210 - Telecommunications 25 98 48
ICT30410 - Telecommunications Digital Reception Technology
6 3
sub Total 19 47 52 10 47 105 51
grand Total 27 105 100 63 88 165 91
*Numbers for 2012/2013 are as at March 2013
EnErgy and TElEcommunicaTions sEcTor brEakdoWn

51
critical skills for the telecommunications sector
There are a number of job roles that are critical to a flexible and high functioning telecommunications sector in Queensland and across Australia. Table 13 highlights the critical skills and occupations in demand, as well as their barriers.
Table 13: critical occupations in demand and their barriers
critical skills skill or Job Type criticality and current Barrierssupervisory control and data acquisition Professionals
Project engineering, installation, commissioning, service, maintenance and system support.
SCADA is an additional skill set for engineers and IT professionals, as well as a Fee-For-Service post trade qualification. High competition from a number of sectors including telecommunications, CSG/LNG and electricity supply industry, as well as the high cost of training are causing shortages in this critical skill area.
fibre network designers
Designs telecommunications networks using fibre optic cables.
High risk due to lack of available resources to the increased need driven by the NBN rollout. This role will remain critical over the next 18 months.
nBn splicers Splices, tests and commissions fibre optic cable.
This is a preferred NBN qualification – Certificate III in Telecommunications. Criticality due to workforce numbers required in regional and remote areas.
nBn installers (fibre)
Installs NBN equipment in homes and businesses.
This is a preferred NBN qualification – Certificate III in Telecommunications. Criticality due to workforce numbers required in regional and remote areas.
nBn lineworkers
Hauls cable, constructs pits and ductwork and undertakes rod and roping.
This is a preferred NBN qualification – Certificate III in Telecommunications. Criticality due to workforce numbers required in regional and remote areas.
electrical engineering Para-Professional
Designs, selects, installs, commissions, maintains and carries out repairs on electronic equipment and systems used in manufacturing, entertainment and defence situations. Equipment includes medical, analogue, digital and communications.
Roles are typically held by experienced ‘blue collar’ workers who have gained further education e.g. Advanced Diplomas or have progressed through workplace based opportunities. The development of this type of worker is reliant on a strong pipeline of experienced ‘middle career’ blue collar workers. Recruiting and retaining these roles will become more difficult as competition increases.
A reduction in funding for these qualifications will also impact the number of workers training for Advanced Diplomas.
cable Jointers Makes and repairs joins in insulated power supply and control cables installed in underground pipes, trenches and overhead systems. Also prepares cable terminations for electrical equipment and overhead lines, and installs and maintains underground electrical cables used to transmit and distribute electricity in city and country areas, new housing estates and industrial centres.
High risk due to the decreasing numbers of workers holding a cable jointing licence as well as the lack of available training in Queensland. Currently, there are no training organisations offering a Certificate III in Cable Jointing to the public in Queensland.
electricians Installs, tests, connects, commissions, maintains and modifies electrical equipment, wiring and control systems.
High risk due to gap created from low supply in high demand geographical locations, across a number of industries in Queensland, the eastern seaboard and Western Australia.

52 Queensland energy and TelecommunicaTions indusTry SkillS and Workforce development report 2013
elecTrical indusTry emPloyee surveyin april 2013, energy skills Queensland, in coordination with the electrical Trades union, conducted a survey to better understand and anticipate the future needs for electrical employees operating in the electrical industry in Queensland. This chapter details the responses from 543 employees in the electrical industry, and includes feedback on respondent demographics, training needs, skills shortages, retirement and attrition. Where possible, these responses will be compared to similar survey results conducted in 2009 and 2011.
Some of the key findings of the survey are:
• 84% of electrical workers live within 100kms of their home.
• 16% of electrical workers work more than 100kms from their home.
• The majority of electricians who travel more than 100kms for work were in the construction and industrial/engineering sectors, where only 37% and 34% respectively live and work in the same postcodes.
• 75% of workers indicated they are currently ‘on the tools’ using their trade.
• Respondents showed high employer loyalty with 69% indicating they have been with the same employer since commencing work as an electrician.
• Employer loyalty varies across sectors, with the electricity supply sector showing the highest loyalty. 87% of ESI workers have stayed with the same employer since commencing work as electricians, compared to the construction and industrial/engineering sectors with only 28% and 39% respectively.
• Nearly half the respondents (41%) have not moved positions i.e. promotions or transfers, since commencing with their current employer.
• 65% of the respondents who are planning to retire indicated they would prefer greater flexibility of working options leading up to retirement.
• The top 3 advantages cited for working as an electrician were:• Benefits and conditions (70%).• Sense of pride and achievement in work (57%).• People I work with (55%).
• The top 3 disadvantages cited for working as an electrician were:• Lack of recognition for the occupation or skills (31%).• Limited training and development opportunities (29%).• Limited or no employment security (22%).
• Most preferred areas of training:• Business and management courses (19%).• Occupational Health and Safety (14%).• Instrumentation (13%).
• The top 3 barriers to becoming a vocational trainer:• Do not have appropriate certification.• Do not have access to financial support to get certified.• Do not have any information or understanding on how to make the transition into becoming a trainer.
• The top 3 current skills shortages listed:• High voltage (10%).• Instrumentation and control (9.5%).• Vocational education teachers (9.5%).
EnErgy and TElEcommunicaTions sEcTor brEakdoWn

53
Key benefits of working in the electrical industry
Understanding what employees perceive to be the greatest benefits of working in a particular industry enables employers to build a better value proposition for attracting and retaining critical skills. When the respondents of the Electrical Industry survey were asked what they perceived the top benefits of working in an electrical trade the responses were consistent.
advantages of the electrical industry*
* Multiple answers were allowed, hence totals will not equal to 100%
figure 12: advantages of the electrical industry
31%
29%
22%
22%
19%
17%
12%
11%
11%
10%
10%
10%
7%
5%
34%
24%
15%
20%
18%
15%
14%
9%
9%
12%
11%
11%
5%
7%
39%
27%
12%
16%
16%
19%
18%
11%
12%
15%
11%
9%
8%
8%
Lack of recognition for my occupation / skills
Limited training and development opportunities
Limited / No employment security
Working hours
Environment (harsh)
Career opportunities / pathways
Industry safety standards and processes
Lack of innovation and technologicaladvancements
Employment flexibility
Remuneration
Lack of challenge and variety in my work
No community spirit
People I work with
Benefits / Conditions
Benefits/conditions
Personal sense of pride andachievement in work
People I work with
Remuneration
Employment security
Work hours
Career opportunities/pathways
Safe industry to work in
Training and development opportunities
Technologically advanced
Industry is valued by friends and family
Environment
Community spirit
70%
57%
55%
52%
47%
41%
38%
34%
24%
23%
20%
14%
12%
67%
60%
53%
48%
56%
39%
32%
31%
26%
20%
19%
16%
7%
65%
60%
52%
49%
42%
39%
37%
30%
25%
20%
17%
13%
10%
2013
2011
2009
2013
2011
2009

54 Queensland energy and TelecommunicaTions indusTry SkillS and Workforce development report 2013
The findings in Figure 12 indicate that benefits and conditions have been strengthened in their top position at 70%, followed by a sense of pride and achievement in work (57%), although it has dropped slightly compared to previous years. A large difference is observed around the employment security. It was lowest in 2009 (42%) and had increased in 2011 (56%), but this year has dropped again to 47%. A number of reasons for the drop in employment security, as mentioned by respondents is the perceived insecurity around the future of a publicly owned electricity supply industry.
With considerable fewer responses3, the question of what electrical workers disliked about the electrical industry, the main response was the lack of recognition for the occupation or skills (31%), which is on a downward trend considering the past years. The second disadvantage given was the limited training and development opportunities available (29%), which has risen sharply compared to previous years. The other significant increase is limited or no employment security (as discussed in the advantages as a decrease). The current political climate was the top complaint that was supplemented to this answer.
Responses in relation to safety were interesting, and have increased both as an advantage (from 30% to 34%) and a disadvantage (from 12% to 18%), as can be seen in Figure 13. By analysing the comments that supplemented the issue of safety, a divergent response has been identified to increased safety standards in the industry. There are those who highly commend the increase in safety and safety procedures, yet at the same time, there are those who perceive this increase in procedures as an infringement on their time and ability to perform their job efficiently.
3 The average number of multiple responses to the advantages (since multiple selections were allowed) is 5, compared to an average of
1.5 responses to the disadvantages.
EnErgy and TElEcommunicaTions sEcTor brEakdoWn
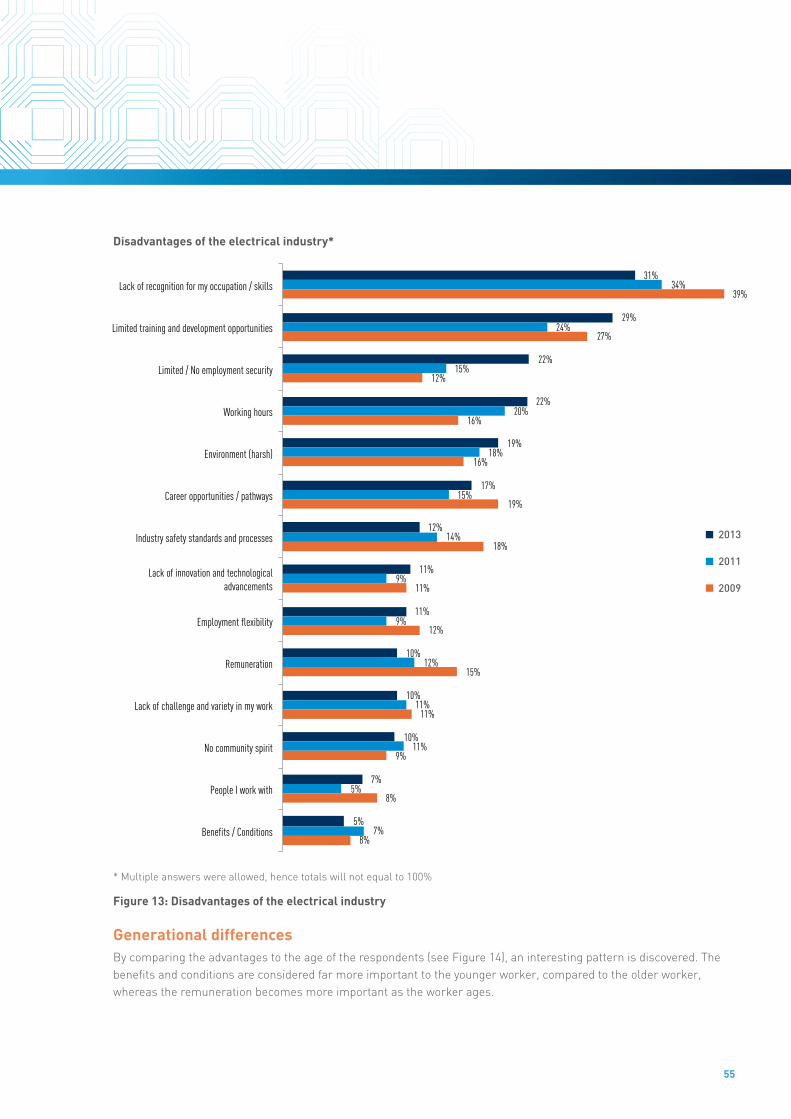
55
disadvantages of the electrical industry*
* Multiple answers were allowed, hence totals will not equal to 100%
figure 13: disadvantages of the electrical industry
generational differencesBy comparing the advantages to the age of the respondents (see Figure 14), an interesting pattern is discovered. The benefits and conditions are considered far more important to the younger worker, compared to the older worker, whereas the remuneration becomes more important as the worker ages.
31%
29%
22%
22%
19%
17%
12%
11%
11%
10%
10%
10%
7%
5%
34%
24%
15%
20%
18%
15%
14%
9%
9%
12%
11%
11%
5%
7%
39%
27%
12%
16%
16%
19%
18%
11%
12%
15%
11%
9%
8%
8%
Lack of recognition for my occupation / skills
Limited training and development opportunities
Limited / No employment security
Working hours
Environment (harsh)
Career opportunities / pathways
Industry safety standards and processes
Lack of innovation and technologicaladvancements
Employment flexibility
Remuneration
Lack of challenge and variety in my work
No community spirit
People I work with
Benefits / Conditions
Benefits/conditions
Personal sense of pride andachievement in work
People I work with
Remuneration
Employment security
Work hours
Career opportunities/pathways
Safe industry to work in
Training and development opportunities
Technologically advanced
Industry is valued by friends and family
Environment
Community spirit
70%
57%
55%
52%
47%
41%
38%
34%
24%
23%
20%
14%
12%
67%
60%
53%
48%
56%
39%
32%
31%
26%
20%
19%
16%
7%
65%
60%
52%
49%
42%
39%
37%
30%
25%
20%
17%
13%
10%
2013
2011
2009
2013
2011
2009

56 Queensland energy and TelecommunicaTions indusTry SkillS and Workforce development report 2013
figure 14: eight advantages of the electrical industry, represented by age
The figures above use indexed values to represent relative importance by age group. The actual percentage representation of each advantage can be found in Figure 12.
eight advantages of the electrical industry, represented by age
EnErgy and TElEcommunicaTions sEcTor brEakdoWn
0.00
0.10
0.20
0.30
0.40
0.50
0.60
<25 25-<35 35-<45 45-<55 55-<65 65+0.00
0.05
0.10
0.15
0.20
0.25
0.30
0.00
0.05
0.10
0.15
0.20
0.25
0.30
0.00
0.05
0.10
0.15
0.20
0.25
0.30
0.00
0.05
0.10
0.15
0.20
0.25
0.30
0.00
0.05
0.10
0.15
0.20
0.25
0.00
0.05
0.10
0.15
0.20
0.25
0.30
0.35
Benefits / Conditions
<25 25-<35 35-<45 45-<55 55-<65 65+
<25 25-<35 35-<45 45-<55 55-<65 65+<25 25-<35 35-<45 45-<55 55-<65 65+
<25 25-<35 35-<45 45-<55 55-<65 65+ <25 25-<35 35-<45 45-<55 55-<65 65+
<25 25-<35 35-<45 45-<55 55-<65 65+
People I work with
Employment security
Safe industry to work in
Personal sense of pride and achievement in work
Remuneration
Career opportunities / pathways
0.00
0.05
0.10
0.15
0.20
0.25
<25 25-<35 35-<45 45-<55 55-<65 65+
Training and development opportunities

57
The ‘people they work with’ reaches highest importance within the 55-‹65 age group. The personal sense of pride and achievement appears to be most important to the middle-aged worker, yet less important to the younger and older worker. Similarly, employment security is most important in the 35-45 age group, which likely represents the section of the workforce with school aged children. Career opportunities and training and development opportunities are most important to the 25-35 age group. The aspect of safety is by far most important to the ‹25 age group, which indicates that safety might be a key selling point for entrants to the industry.
Figure 15 and Figure 16 give a clear indication of how the opinions from the survey respondents differ by industry sector. With 70% of the respondents related to the electrical supply industry mentioning safety standards and procedures as an advantage to the industry, safety is clearly high on the agenda for this industry sector. This is in contrast to responses coming from the construction industry, where only 41% of the respondents mention safety standards and procedures as an advantage to the industry. Thirteen per cent (the highest among the four) mention the safety standards and procedures as a disadvantage to the industry. When analysing the qualitative remarks, it is strongly believed the current procedures are ‘over-the-top’ and negatively affect their ability to perform jobs efficiently.
figure 15: The perceived advantage of safety to the four sectors
figure 16: The perceived disadvantage of safety to the four sectors
0%
10%
20%
30%
40%
50%
60%
70%
80%
Industry safety standards and procedures are an advantage of the industry
Construction
Electricity supply
Industrial / Engineering
Mining
Construction
Electricity supply
Industrial / Engineering
Mining
0%
2%
4%
6%
8%
10%
12%
14%
Industry safety standards and procedures are an disadvantage of the industry
0%
10%
20%
30%
40%
50%
60%
70%
80%
Industry safety standards and procedures are an advantage of the industry
Construction
Electricity supply
Industrial / Engineering
Mining
Construction
Electricity supply
Industrial / Engineering
Mining
0%
2%
4%
6%
8%
10%
12%
14%
Industry safety standards and procedures are an disadvantage of the industry

58 Queensland energy and TelecommunicaTions indusTry SkillS and Workforce development report 2013
Work travel behaviour
Non-resident workers including both fly-in, fly-out (FIFO) or drive-in, drive-out (DIDO) have become a household phenomenon across Australia and specifically in Queensland, as various industry sectors, try to find new ways of supplying skills to meet productivity requirements. Figures vary around the percentage of workers who do not live where they work. For example KPMG has estimated around 25% of Australia’s resources workforce are non-resident. The Queensland Resources Council has stated that the figure could reach as high as 75% as new projects come online. One thing that most commentators agree on is that FIFO is here to stay.
The recent Federal Parliamentary Inquiry into FIFO/DIDO work practices highlighted research published in the 2012 Heartbeat Report which identified links between industry turnover and FIFO/DIDO work practices in Queensland. For non-resident workers, there are high levels of first year attrition. For workers who live more than 300 kilometres away from their workplace, workers left their employers at a rate more than double the industry average at 50.4%. The steady increase in the use of FIFO work practices over the past three years indicates significant costs to industry. This result can be applied to the emerging non-resident worker trend in Queensland including the CSG/LNG sector. There is no doubt there is intense competition for skilled workers, combined with the lack of capacity of local mining regions to accommodate forecasted population growth continues to drive and increase in FIFO arrangements across the state.
The Parliamentary Inquiry used Energy Skills Queensland’s Heartbeat Report to highlight a number of factors which may be exacerbating the high level of turnover for FIFO workers including “cookie cutter” recruitment practices. The inquiry reported that “…regardless of the mode of work (non-resident or resident), anecdotally, the selection and screening process for potential employees across industry is the same. This means there is no variance in the selection criteria to specifically address candidate suitability for a FIFO/DIDO work practice,” (Australian Parliament, 2013).
Reducing the high separation rate for non-resident workers is imperative if the resources sector is to reduce the costs associated with turnover. Evidence around the effect of a FIFO lifestyle on turnover needs to be used to help adjust screening, recruitment and management practices for non-resident workers. Two recent Queensland reports, the Surat Basin Population Report 2012 and Gladstone Region non-resident population projections for 2012/13 completed by the Government Statistician have also flagged this as major issues. In the Surat Basin report a snapshot of the region is provided. It is estimated that almost 6,500 non-resident workers are employed on-shift as at June 2012. This figure had doubled from the previous year, and 78% of the non-resident workers lived in worker accommodation villages while on-shift. This trend is anticipated to continue in the Surat Basin region for the next 20 years.
In comparison, the Gladstone report identified just over 3,600 non-resident workers, a figure that had tripled in only one year (as at June 2012). This workforce is then predicted to peak at 4,500 during 2013 with construction work and then decline as the commissioning and operational work begins in 2014 and beyond for the LNG plants.
Research completed recently for the Electrical Skills Employee Survey 2013, has also included a section on work travel behaviour for the first time. In stark contrast to the results above the vast majority of electrical workers (84%) live within 100 km of their work and would be considered resident workers. The remainder of workers live further afield, with only 8% more than 300 km away and considered as FIFO workers (see Figure 17). When the same work travel information is analysed by industry sectors; construction, electricity supply, industrial/engineering and mining are the main industries emerging from the sample. The survey results show that electrical, supply and construction workers are predominantly resident workers with 87% and 83% living with a 100km radius of their work.
EnErgy and TElEcommunicaTions sEcTor brEakdoWn

59
distance to work
figure 17: Work travel behaviour for the electrical employee
In contrast the electrical, industrial/engineering and mining workers are the more likely to be non-resident workers with 24% and 29% traveling more than 300km to work (see Figure 18).
The research above also shows the non-resident work phenomenon continues to grow in Queensland and more broadly in Australia. It brings with it new challenges both social and economic but provides the skills provision solution to the re-emergence of large scale development and investment in regional Queensland. The challenge is to integrate non-resident work into the planning and provision that underpins the state’s growth. High rates of attrition and associated continuous recruitment only adds to the “bottom line cost” where no single model fits all. Regional and industry variations and timelines must be considered.
distance to work
figure 18: Work travel behaviour for the electrical employee
apprentices and ‘on the tools’ workers
For the most recent survey, Energy Skills Queensland added two questions to determine how many of the respondents were apprentices, and how many of the respondents had moved from working ‘on the tools’ to other positions within the industry that are considered ‘off the tools’.
The number of respondents who reported to be an apprentice was only 5%, whereas the average number of apprentices in Queensland, as indicated by the Electrical Safety Office (ESO) is approximately 20%. This low representation of apprentice responses to survey questions is more indicative of limited industry experience.
Training and development opportunities
Construction Electricity supply Industrial / Engineering Mining
40%44%
8% 8%
Samepostcode
between 1 and100 km
between 100 and300 km
over 300 km
Samepostcode
between 1 and100 km
between 100 and300 km
over 300 km
37%
46%
7%10%
41%
46%
8%5%
34%
42%
12% 12%
42%
29%
11%
18%

60 Queensland energy and TelecommunicaTions indusTry SkillS and Workforce development report 2013
Percentage of workers ‘on the tools’ by industry sector, 2013
figure 19: ‘on the tools’ percentage of the electrical employees by industry sector
The percentage of electrical workers that are currently working ‘on the tools’, i.e. who are actively practicing their profession as a licensed electrician, varies across the industry sectors. Figure 19 indicates that 75% of workers are currently ‘on the tools’. The survey identifies that the number of workers currently ‘on the tools’ is considerably higher within the construction sector (89%) and lower in the electricity supply sector (68%). This is indicative of a larger percentage of workers who move into managerial roles throughout their careers within the electricity supply sector.
Age is a factor for moving ‘off the tools’ as shown in Figure 20. Most workers that begin to move ‘off the tools’, appear to do this between the ages of 35 and 45, where there is a significant decrease of workers ‘on the tools’ (shift of 9%).
Percentage of workers ‘on the tools’ by age, 2013
figure 20: ‘on the tools’ percentage of the electrical employees by age
It is interesting to note that the age group 65+ represents a higher percentage than average (80% vs. 75%) of workers still ‘on the tools’. It is possible that those workers who have reached retirement age and yet enjoy aspects of their job (for example training and educating others, or remain active on a part time basis), are more likely to keep active in the industry ‘on the tools’ rather than ‘off the tools’. The age trends for workers ‘on the tools’ was similar across all industry sectors surveyed.
‘On the tools’
100%
83%74%
69% 70%80%
<25 25-<35 35-<45 45-<55 55-<65 65+
Average 2013 Construction Electricitysupply
Industrial / engineering
Mining
75%
89%
68%
81%78%
‘On the tools’
‘On the tools’
100%
83%74%
69% 70%80%
<25 25-<35 35-<45 45-<55 55-<65 65+
Average 2013 Construction Electricitysupply
Industrial / engineering
Mining
75%
89%
68%
81%78%
‘On the tools’
EnErgy and TElEcommunicaTions sEcTor brEakdoWn

61
Within 1 yr
1%
1 to 3 yr 3 to 5 yr 5 to 10 yr > 10 yr
Retire Leave the industry
33%
7%
18%
40%
8%
5%
10%
14%4%
5%3%4%3%
No particulararrangements
Part timearrangements
Flexibleworking hours
Flexibility to work forparts of the year
retirement and attrition
Two of the most important metrics used in workforce planning and workforce forecasting are retirement and attrition rates. Several questions were asked of the respondents to gauge these metrics for the electrical worker.
Industry attrition outlines how many workers are planning to find a job outside the electrical industry, or intend to retire. The 2013 survey data indicates that 56% of workers are not thinking at all about leaving the industry. The remaining 44% were asked whether they were planning to retire or were planning to leave the industry and 31% of workers indicated that they were thinking about retirement. A further 8% indicated they were thinking of leaving the industry i.e. no longer working as an electrician, and 5% indicated that they would remain active as an electrical worker, but outside Queensland.
Figure 21 provides a complete overview of how many workers intend to leave the industry and the timeframe.
intention to leave industry 2013
figure 21: industry attrition and retirement rates (percentages are of the total responses)
When comparing the responses for intention to leave within the ‘one year’ and ‘one to three year’ groups, to the respondent age, it shows that 46% of the workers who intend to leave are above 50 years of age. This would indicate there are a large proportion of workers getting ready to retire in a short period of time, raising concerns about knowledge loss and the impact this could have on the ability to train new entrants into the electrical contracting industry.
In the time leading up to retirement, 66% of the respondents indicated they prefer some sort of flexibility. The majority prefers flexible arrangements, with 40% preferring to work for part of the year (see Figure 22). Of the responses only 1% (not shown in the figure due to low response rate) indicated other preferences, of which the majority consisted of doing volunteer work.
support desired for time leading up to retirement 2013
figure 22: desired support in the time leading up to retirement
Within 1 yr
1%
1 to 3 yr 3 to 5 yr 5 to 10 yr > 10 yr
Retire Leave the industry
33%
7%
18%
40%
8%
5%
10%
14%4%
5%3%4%3%
No particulararrangements
Part timearrangements
Flexibleworking hours
Flexibility to work forparts of the year

62 Queensland energy and TelecommunicaTions indusTry SkillS and Workforce development report 2013
QuEEnsland and naTional oVErViEW
ThE Economic ouTlook
The mid-year fiscal and economic review (myfer) downgraded the economic growth outlook for Queensland’s major trading partners (oesr, 2013). The softening global conditions had resulted in weaker demand for exports like coal. as a result of strong financial management, the Queensland government was able to wear this write-down in revenue without having to raise fees, taxes and charges. The severe weather events of January 2013 have made the fiscal repair task an even greater challenge. despite the many difficult factors outside our control, Queensland has plenty to be positive about in 2013. economic data released early 2013 shows the Queensland government’s policies are having a positive impact on the economy. more than 30,000 jobs were created in Queensland in January. Trend unemployment fell from 6.1% in october 2012 to 5.9% in January 2013. surveys conducted by leading economists, financial institutions and industry groups indicate Queensland businesses entered 2013 with hope and optimism.
Queensland has recorded below average economic growth over the four years since 2007/08. This reflects the impact of the global financial crisis in 2008/09 together with the impacts of widespread flooding and Cyclone Yasi in 2010/11. Over the period 2007/08 to 2011/12, Queensland has recorded average annual growth in capital services of 6.9% per annum. Mining investment is at record levels in Queensland with a substantial proportion relating to liquefied natural gas projects with the corresponding output growth not expected before 2014.
The energy sector update
future outlook of energy in australiaThe information below is produced by the Bureau of Resources and Energy Economics (BREE), and delivers BREE’s inaugural long term projections of Australian energy consumption, production and trade over the period to 2034/35. These projections are not intended as predictions or forecasts, but as indicators of potential changes in Australian energy consumption, production and trade patterns given the assumptions used in by BREE (BREE 2013).
Energy consumption
• Total primary energy consumption is projected to grow by around 29% (1% a year) over the projection period (2008/09 to 2034/35). This moderate growth reflects a long-term decline in the energy intensity of the Australian economy which has been accelerated by a number of policy drivers.
• The share of coal in total primary energy consumption is projected to decline, with oil and gas projected to be the dominant energy sources used.
• Gas is expected to exhibit the fastest growth among non-renewable energy sources, increasing by an average 3% a year to 2611 PJ in 2034/35.
• The share of renewable energy is projected to increase from 5% of total primary energy consumption in 2008/09 to 9% of total primary energy consumption in 2034/35. This implies an average annual growth rate of 3.4%, with the most significant growth occurring in wind energy.
• Western Australia, the Northern Territory and Queensland are expected to exhibit the highest growth in primary energy consumption. These regions are expected to achieve higher economic growth relative to other states, based on the large contribution of the mining sector and the high degree of export orientation.
• The electricity generation and transport sectors will remain the two main users of primary energy, together accounting for 63% of projected primary energy consumption in 2034/35.

63
• The share of primary energy consumed by the electricity generation sector is expected to decline over the projection period as the effects of the RET and the implementation of carbon pricing are expected to encourage a change in the energy mix.
• The transport sector accounts for around one quarter of primary energy consumption, and this share is projected to remain relatively constant out to 2034/35. Growth in transport is coupled with improving end-use efficiency, which is expected to have a moderating effect on energy consumption.
• The fastest growing consumer of primary energy will be the mining sector, with average growth of 5.2% a year expected over the projection period.
electricity generation
• Gross electricity generation is projected to grow by around 42% (1.4% a year) from 245 terawatt hours in 2008/09 to 348 terawatt hours in 2034/35. This growth is expected to come from expansion of gas-fired electricity generation and renewable sources.
• A key change over the projection period is the expected shift from coal-fired to gas-fired generation. As the proportion of coal-fired generation declines from 74% to 38% of electricity generation over the projection period, the share of gas-fired generation is expected to more than double from 16% to 36%.
• The use of renewable energy resources in electricity generation is expected to grow considerably at 6% a year over the projection period. Wind energy is projected to account for the majority of this growth, representing 14% of total electricity generation in 2034/35. Strong growth is also expected in other renewable energy sources, including solar energy, geothermal energy and bioenergy, although from a lower base.
• Under assumed higher gas prices, total electricity generation is projected to grow at a slower rate of 1.3% a year to 340 terawatt hours in 2034/35. The share of gas in the generation mix is projected to be lower under this scenario (22%), accompanied by a relatively smaller fall in the share of coal, and a slightly increased share for renewables (25%).
energy production and trade
• Australian energy production (excluding uranium) is projected to grow at an average annual rate of 3% over the projection period. At this rate, total production of energy is projected to more than double to 28,401 PJ in 2034/35.
• Coal and gas are projected to account for 96% of Australia’s energy production in 2034/35. Coal production is projected to increase by 96% to 18,956 PJ (632 million tonnes), while gas is projected to increase fourfold to 8274 PJ (330,960 gigalitres).
• Production of black coal, which includes thermal and metallurgical coal, is projected to grow at 2.8% a year to 18,676 PJ (623 million tonnes) in 2034/35. Despite this growth, the share of black and brown coal in total energy production is projected to decline from 74% in 2008/09 to 67% in 2034/35.
• Strong growth in domestic and global demand for gas has been driving the development of new gas fields and LNG capacity in Australia. Gas production in the western market is projected to grow at an average annual rate of 5.5% to 4771 PJ in 2034/35. In the eastern market, production is projected to grow at 5.0% a year to 2492 PJ.
• Production of coal seam gas (CSG) is expected to maintain its strong growth trajectory over the projection period, supported by the development of new projects and demand for CSG-fired electricity generation.
• The exportable surplus of Australia’s energy production is expected to increase over the projection period, rising by approximately 4.1% a year. The fastest growth is expected in LNG exports, growing at 7.6% a year.
• Projections of declining oil production and constraints around petroleum refining suggest Australia’s net trade position for crude oil and refined petroleum products will weaken over the projection period, with net imports projected to increase at an average rate of 3.1% a year.

64 Queensland energy and TelecommunicaTions indusTry SkillS and Workforce development report 2013
renewable energy Renewable energy accounts for around 5% of Australia’s energy consumption (BREE, 2013). Renewable energy sources comprise a small, although growing share of Australia’s electricity generation. Energy sources used in electricity generation include wind, hydro, solar energy and bio-energy, and make up around 11% of the electricity generation mix (BREE, 2013). Wind-powered electricity and solar electricity have exhibited strong growth since 2004–05, albeit from a low base, increasing at an average annual rate of 23% and 21%, respectively (BREE, 2013).
Australia has abundant and diverse clean energy resources with significant potential for future development. Currently, renewable energy resources are used for heating and cooling, electricity generation, and as transportation fuels (BREE, 2013). Renewable resources currently utilised on a commercial scale include hydro and wind energy for electricity generation, and bio-energy and solar energy for both heating and cooling and electricity generation. Other renewable resources are mostly undeveloped at present and involve technologies still at the proof of concept stage or early stages of commercialisation.
A number of significant barriers still face the large-scale utilisation of Australia’s clean energy resources. Changed regulatory and approval processes are affecting well-established technologies like wind farms in some locations. Relatively high upfront capital costs, lack of familiarity with renewable energy technologies and the nature of Australia’s capital markets can make it difficult to secure project financing. For some technologies, such as geothermal, energy conversion resources can be located long distances from transmission and distribution infrastructure and markets, and the technologies to utilise these resources are, in some cases, immature (BREE, 2013). Despite these challenges, the deployment of renewable energy technologies is gathering pace, and is expected to play a critical role in moving to a low emissions future while meeting Australia’s continued demand for energy.
renewable energy development
The Australian Government has implemented a number of measures to increase the uptake of renewable energy in Australia. Key amongst these is the Renewable Energy Target (RET), carbon pricing, the Australian Renewable Energy Agency (ARENA), and the Clean Energy Finance Corporation (CEFC) (BREE, 2013).
The Renewable Energy Target (RET) is a legislative scheme that aims to:
• Encourage the additional generation of electricity from renewable sources.
• Reduce emissions of greenhouse gases in the electricity sector.
• Ensure that renewable energy sources are ecologically sustainable.
The RET achieves this by creating a guaranteed market for renewable energy deployment, using a mechanism of tradable certificates created by large-scale renewable energy generators and owners of small-scale solar, wind, and hydro systems. Demand for these certificates is created by placing a legal obligation on entities that buy wholesale electricity (mainly electricity retailers), to source and surrender certificates to the Government’s independent market operator - the Clean Energy Regulator (BREE, 2013).
Certificates can be created by:
• The installation of solar water heaters and small-scale solar PV, wind or hydro systems under the Small-scale Renewable Energy Scheme (SRES). These are known as Small-scale Technology Certificates (STCs).
• Renewable energy power stations under the Large-scale Renewable Energy Target (LRET). These are known as Large-scale Generation Certificates (LGCs).
The RET will ensure that at least 20% of Australia’s electricity generation comes from renewables in 2020 by requiring 41,850 GWh worth of certificates be surrendered in that year. In 2013, 19,088 GWh of certificates are legally required to be surrendered.
QuEEnsland and naTional oVErViEW

65
Operating in tandem with the RET is the Australian Government’s Clean Energy Future Plan. The plan consists of a raft of measures introduced under the Clean Energy Future Legislative Package that aims to cut pollution and increase investment. The package (together with the RET) specifically targets the reduction of Australia’s carbon emissions to 5% below 2000 levels by 2020, and up to 80% below 2000 levels by 2050. This target is to be achieved through carbon pricing, the RET, and a package of complementary measures. The carbon price, which commenced on 1 July 2012, makes large emitters of carbon financially liable for their emissions. The price will be fixed for three years before transitioning to an emissions trading scheme. The complementary measures include household and industry assistance and funding directed towards the development of renewable energy, energy efficiency and low emissions technologies.
Two new agencies created by the Clean Energy Future Package will specifically drive renewable energy growth in Australia over the coming years. These are the Australian Renewable Energy Agency (ARENA, in operation from 1 July 2012) and the Clean Energy Finance Corporation (CEFC, in operation from 1 July 2013).
ARENA’s legislative mandate is to improve the competitiveness and increase the supply of renewable energy in Australia. ARENA will achieve this by providing financial assistance, from a $3.1 billion fund, for:
• The research, development, demonstration, deployment and commercialisation of renewable energy and related technologies.
• The storage and sharing of knowledge and information about renewable energy technologies.
ARENA will also collect, analyse and share information and knowledge about renewable energy and related technologies and provide advice to the Minister for Resources and Energy regarding renewable energy and related technologies.
The objective of the commercially oriented Clean Energy Finance Corporation is to overcome capital market barriers that hinder the financing, commercialisation and deployment of renewable energy, energy efficiency and low emissions technologies.
The CEFC has $10 billion to invest in firms and projects utilising these technologies as well as manufacturing businesses that focus on producing the inputs required. It is intended to be commercially oriented and to make a positive return on its investments. Capital that is returned from investments will be retained for reinvestment by the CEFC, with the Board to determine the quantum of any dividends payable to the Australian Renewable Energy Agency.
solar energy in australia
Solar energy is generated when energy from the sun is converted into electricity or used to heat air, water or other fluids. There are two main types of solar energy technologies in Australia – solar thermal and solar photovoltaic (PV).
Solar thermal covers technologies that convert sunlight into heat – thermal energy. This heat is typically used directly for space heating (as in solar hot water systems) or to generate electricity (using steam and turbines). Solar PV technologies convert sunlight into electricity through photovoltaic cells. These cells have traditionally been used on rooftops or at smaller scale, but are beginning to be expanded to larger scale grid connected systems.
Australia’s primary solar energy consumption accounted for 4.2% of all renewable energy use and around 0.2% of total primary energy consumption in 2010/11. Primary solar consumption has increased significantly since 2006/07 at an average growth rate of 22% per year. The bulk of the growth over this period has been from installations of domestic solar hot water systems. Solar PV systems made a smaller contribution, but installations have been growing more rapidly in recent years. In total, Australia’s solar energy consumption in 2010/11 was 14 PJ, of which more than 90% was used in the residential sector.

66 Queensland energy and TelecommunicaTions indusTry SkillS and Workforce development report 2013
On behalf of the Australian Government, the Department of Resources, Energy and Tourism (RET) is delivering a number of programs and initiatives that support a Clean Energy Future for Australia:
australian renewable energy agency (arena)
The Australian Renewable Energy Agency (ARENA) is a new independent statutory authority established on 1 July 2012 that consolidated the administration of $3.2 billion in government support for renewable energy technology innovation, and incorporated measures previously managed by the Australian Solar Institute (ASI), the Australian Centre for Renewable Energy (ACRE), and the Department of Resources, Energy and Tourism.
coal sector assistance Package
The Coal Sector Assistance Package and was developed by the Australian Government to support the small number of existing coal mines that are facing significant costs with the implementation of the carbon price. The package is comprised of the Coal Sector Jobs Package (CSJP) and the Coal Mining Abatement Technology Support Package (CMATSP).
contract for closure
The Contract for Closure Program seeks to support the closure of around 2000 megawatts of highly emissions intensive generation capacity in Australia by 2020, subject to negotiation with eligible generators.
carbon capture and storage (ccs)
Carbon capture and storage (CCS), also known as carbon dioxide geosequestration, is a way of reducing the contribution of fossil fuel emissions to global warming. The Australian Government supports a range of initiatives and policies to accelerate the development and deployment of CCS in Australia, including the National Low Emissions Coal Initiative, the CCS Flagships program and the National CO2 Infrastructure Plan.
low emissions Technology demonstration fund
The Low Emissions Technology Demonstration Fund (LETDF) was a past Australian Government funding program that provided funding to help Australian firms commercialise world-leading low emissions technologies.
other australian government clean energy initiatives
In August 2009, the Australian Government implemented the Renewable Energy Target scheme, designed to deliver on the government’s commitment to ensure that 20% of Australia’s electricity supply will come from renewable sources by 2020.
The government will establish a $10 billion commercially oriented Clean Energy Finance Corporation to invest in businesses seeking funds to get innovating clean energy proposals and technologies off the ground. A variety of funding tools will be used to support projects, including loans on commercial or concessional terms and equity investments.
QuEEnsland and naTional oVErViEW

67
energy programsManaging energy use is a critical issue Australian companies and individuals face in the years ahead, as the world responds to the challenges of climate change, energy security and economic competitiveness. The Australian Government has introduced a series of programs aimed at managing energy use and driving large-scale uptake of clean energy technologies. The following energy programs and initiatives are delivered by the Department of Resources, Energy and Tourism (RET) and represent an important part of the Australian Government’s energy strategy.
ethanol Production grants program
The Ethanol Production Grants (EPG) program seeks to support production and deployment of ethanol as a sustainable alternative transport fuel in Australia.
smart grid, smart city
The Smart Grid, Smart City project is part of the Australian Government’s National Energy Efficiency Initiative and will deliver Australia’s first commercial-scale smart grid.
regulaTion and PolicyThe energy and telecommunication industries have a high degree of regulation relative to most special construction trade industries. it is subject to stringent registration and licensing controls enforced at the state and territory level, which restricts entrance into this industry to suitably qualified practitioners. further, quality standards set out by standards australia in the national Wiring rules govern the methods of installation, testing techniques and product attributes, and there are regulatory controls and monitoring of compliance by local electricity authorities. generally, compliance with the strict regulatory environment increases the cost of doing business in this industry, but also directly benefits industry participants by restricting access to the industry and ensuring product standards.
Electrical contractors are required to be licensed by the appropriate State based authority. To obtain licenses, contractors must have a technical nominee qualified as a licensed tradesperson. The licensing requirement protects this industry from unlicensed competitors, including home handymen, as all electrical installation and repair work must be done through a licensed contractor. Licensing authorities and electricity-generating authorities regularly undertake random inspections of electrical wiring and installations on new building and industrial sites to ensure the work meets standard specifications. Failure to meet required specifications can lead to the contractor incurring penalties (e.g. demerit points) and the potential loss of licence.
The relevant state and territory licensing authority for Queensland is the Department of Justice and Attorney-General (Electrical Safety Office). The February 2006 Council of Australian Governments (COAG) meeting laid the foundations for the national recognition of licensing for electrical contractors and a range of other construction trades. COAG’s Licence Recognition website, which was launched in February 2007, sets out the arrangements for mutual recognition of licences issued to electricians, electrical fitters, lineworkers, cable jointers, tradespeople with restricted electrical licences, plumbers and gas-fitters, carpenters and joiners, bricklayers and builders, refrigeration and air-conditioning mechanics, and auto-gas installers. These trades were identified as the initial priority areas (skills shortage trades), with national recognition across all trades the ultimate target. This mutual recognition requires increased engagement on a national basis of the industry and the licensing and regulatory bodies to ensure quality assurance arrangements for the vocational education and training sector.
energy policy in Queensland
30-year electricity strategyIn December 2012 the Queensland government released the Directions Paper for the 30-year electricity strategy. The Queensland government is committed to combat rising electricity costs, and is looking to develop a proactive plan that will help ensure electricity supply systems remain secure, reliable and cost-effective.

68 Queensland energy and TelecommunicaTions indusTry SkillS and Workforce development report 2013
Given the importance of electricity sector reform, the government is committed to implementing a range of immediate reform priorities while it develops the medium term and long term policy agenda.
Accordingly, the 30-year electricity strategy will be structured in line with the implementation timeframes of three plans:
• Plan 1: Immediate action plan (2012/13 to 2013/14 financial year).
• Plan 2: Medium term action plan (2014/15 to 2018/19 financial year).
• Plan 3: Long term action plan (2019/20 to 2041/42 financial year).
Plan 1—immediate action plan (2012/13 to 2013/14)
action taken to date
• Froze the domestic electricity tariff for 2012/13 to immediately reduce the cost pressure on households while the government prepares a viable long-term strategy to control electricity costs.
• Lowered feed-in tariff subsidies for solar power to avoid the future cost burden shared by Queensland electricity customers.
• Directed the Queensland Competition Authority to develop a methodology for determining notified electricity prices for the next three years to provide certainty for industry regarding the price-setting framework.
short term review of the electricity sector
• Established an interdepartmental committee to analyse drivers of electricity prices over the short term, medium term and long term, and recommend policies and strategies to manage electricity supply-chain costs.
• Established a panel of electricity experts to make recommendations to the interdepartmental committee on ways that network costs can be reduced by making Ergon Energy, Energex and Powerlink more efficient.
long term strategy
• A 30-year electricity strategy will be developed, and released in the second half of 2013.
Plan 2—medium term action plan (2014/15 to 2018/19)
implement reforms and medium term priorities
• Continue the medium term reform agenda stemming from the interdepartmental committee and independent review panel reviews.
• Respond to recommendations of the Commission of Audit review of state finances relating to the electricity sector.
• Implement medium term reforms identified in the 30-year electricity strategy, including opportunities for structural reform of the electricity sector.
Plan 3—long term action plan (2019/20 to 2041/42)
develop a long term vision and reform agenda
• Build on the medium term action plan and implement long-term reforms identified in the 30-year electricity strategy to deliver on the government’s commitment to help ensure a better electricity future for Queensland.
• Formally review the progress of the 30-year electricity strategy to build on and measure the success of the reform agenda. This will include examination of emerging challenges and new opportunities to help ensure the ongoing resilience of Queensland’s electricity supply system.
QuEEnsland and naTional oVErViEW

69
objectives
short term reform objectives
The first stage of the reform process is being developed through the work of the interdepartmental committee. The objectives of the committee are to ensure:
• Electricity in Queensland is delivered in a cost-effective manner for customers.
• Queensland has a viable, sustainable and competitive electricity industry.
• Electricity is delivered in a financially sustainable manner (from the Queensland Government’s perspective).
The committee objectives were developed as part of a short term review program, focused on addressing immediate cost pressures on electricity prices.
medium term and long term reform objectives
In developing the 30-year electricity strategy, the government will be considering whether the interdepartmental committee’s objectives remain appropriate for a medium term and long term strategic reform agenda. Early engagement with consumer and industry groups suggests that there may be benefits in adopting broader objectives. The medium term and long term objectives may require a focus on different ambitions that are more strategically aligned to achieving a secure, reliable and cost-effective sector over the long term.
Plan for the electricity strategy:
• Directions paper (released 17 December 2012).
• Discussion paper (to be released in mid-2013).
• 30-year electricity strategy (to be released by end of 2013).
Key policy changes
There have been a number of key policy changes over the last 12 months affecting the energy and telecommunications industries including:
• Queensland ISB and VET Policy 2012/2013.
• Proposed environmental policy change for the Environment Protection and Biodiversity Conservation Act.
• The Great Barrier Reef.
• Planned reforms to Queensland’s electricity sector – Ergon and Energex.
• Changes to Skills Queensland and the Industry Skills Bodies.
Queensland industry skills Bodies (isB) and veT policy 2012/2013As the result of the 2012 Queensland election, The Queensland Skills and Training Taskforce was established by the Queensland Government on 19 June 2012 in recognition that strengthening Queensland’s vocational education and training (VET) sector is fundamental to growing the state’s four pillar economy and reducing unemployment to 4% in six years.
The Taskforce report was delivered in November 2012 and outlined a broad change agenda for vocational education in Queensland. The Government’s response followed in late November 2012 and set out the agenda for change. At the highest level changes included the re-examination of the states existing Industry Skills Bodies (ISB) as well as reforms to contestability, location and the structure of the public provision of vocational education and funding in Queensland.

70 Queensland energy and TelecommunicaTions indusTry SkillS and Workforce development report 2013
A raft of policy decisions were released and this area of reform will have significant ramification for industry, training providers and the broader community. These will include a clear alignment of Queensland’s ISB structure with the Government’s identified four pillars – construction, resources, agriculture and tourism.
Legislation to establish TAFE Queensland, as an independent statutory body from 1 July 2013, has now been finalised in The TAFE Queensland Act 2013. This allows for the creation of seven amalgamated TAFE institutes supported by the formation of a single commercially focused TAFE Queensland board as an independent statutory body.
There will also be a new Ministerial Industry Commission created to establish a genuine partnership between industry, employers and government to ensure that training investment matches skill needs. Key reforms include:
• Giving every year 12 graduate an extra incentive to enrol in high priority qualifications by offering fee-free training if they start training with a preferred training provider within a year of leaving school.
• Making $42 million in new government funding available contestably from 1 July 2013 to selected high quality providers to deliver priority certificate III level qualifications under the Certificate III Guarantee.
• Delivery of foundation skills including language, literacy and numeracy and other workplace preparation skills.
• Providing additional support for Queenslanders with diverse needs to gain a qualification through a new five-year $47 million Community Learning Program.
• Introducing a new investment framework to provide clear information to the market on priority skills and funding arrangements.
• Investing an additional $86 million over six years to create an extra 10,000 apprentice and trainee commencements, and improving apprenticeship and traineeship arrangements to make it easier to change employer or move interstate.
Collectively, the evolving reforms represent significant structural change and direction to the training and vocational education sector in Queensland and their continued release and implementation will have ramifications for the economy, industry and skills identification and delivery. The development of this new framework will have on-going ramifications for our sector into the future.
national occupational licensingThe National Occupational Licensing System (NOLS) is being developed to remove licensing differences across State and Territory borders and provide for a more mobile workforce. Organisations utilising licensed personnel will be able to improve business efficiency and the competitiveness and productivity of the national economy. Initially, four occupational areas will be covered by the NOLS: electrical, plumbing and gas fitting, refrigeration and air conditioning mechanics, and property occupations.
Interim Advisory Committees (IACs) have been established to provide policy advice to the Council of Australian Governments (COAG) National Licensing Steering Committee in the development of national licensing for each occupational area. The Electrical Occupations IAC (EOIAC) and Refrigeration and Air Conditioning Mechanics IAC (RACMIAC) met on a number of occasions since 2010 to develop a series of proposals in relation to:
• License categories, scopes of work and licence types.
• Eligibility requirements, both skills based and non-skill based.
The NOLS program is scheduled for implementation in 2014, and will have a number of impacts on electrical workers in Queensland. One of the biggest impacts will be to the role of Lineworker. The Lineworker licence type will not be a separate licence but will be licenced as an electrical/fitter mechanic. The impacts of this change are yet to be determined for both current electricians holding this licence type, or for future electrical workers who wish to specialise in line work.
For further information on the full changes to be made through the National Occupational Licensing System, please go to: www.coagnl.govspace.gov.au/files/2012/11/Electrical-Occupations-Regulation-Impact-Statement.pdf
QuEEnsland and naTional oVErViEW

71
Proposed environmental policy change for the environment Protection and Biodiversity conservation actThe Federal Government has proposed a ‘water trigger’, requiring federal approval of large coalmines and coal seam gas projects that could affect water resources. But the proposed amendment to the Environment Protection and Biodiversity Conservation Act, relying on the federal government’s constitutional power over corporations, triggered a backlash from some state governments and from industry, which accused the government of reneging on its promise to reduce green tape. Farmers fear that mining and coal seam gas extraction could contaminate water or lead to excessive draw-down on underground aquifers.
The great Barrier reefThe Great Barrier Reef of Australia has been listed as a UNESCO heritage site. The United Nations Educational, Scientific and Cultural Organisation convened in June 2013 for its annual gathering to decide which cultural treasure around the world deserves to be recognised as an endangered World Heritage site. This year the Great Barrier Reef has not yet been classified as endangered, yet the Australian Government has been warned to take better care of the reef in light of industrialisation of the region. This action has potential influence on proposed projects for new ports on the east coast of Australia.
The ecological integrity of the Great Barrier Reef is enhanced by the unparalleled size and current good state of conservation across the property. At the time of inscription it was felt that to include virtually the entire Great Barrier Reef within the property was the only way to ensure the integrity of the coral reef ecosystems in all their diversity.
A number of natural pressures occur, including cyclones, crown-of-thorns starfish outbreaks, and sudden large influxes of freshwater from extreme weather events. As well there is a range of human uses such as tourism, shipping and coastal developments including ports. There are also some disturbances facing the Great Barrier Reef that are legacies of past actions prior to the inscription of the property on the World Heritage list.
At the scale of the Great Barrier Reef ecosystem, most habitats or species groups have the capacity to recover from disturbance or withstand on-going pressures. The property is largely intact and includes the fullest possible representation of marine ecological, physical and chemical processes from the coast to the deep abyssal waters enabling the key interdependent elements to exist in their natural relationships.
Some of the key ecological, physical and chemical processes that are essential for the long-term conservation of the marine and island ecosystems and their associated biodiversity occur outside the boundaries of the property and thus effective conservation programs are essential across the adjoining catchments, marine and coastal zones.
Planned reforms to Queensland’s electricity sector – ergon and energexMajor changes to Queensland’s electricity sector that aim to save billions in network costs and revenues are the focus of reforms announced in June 2013 by the Queensland Government. The proposal, subject to consultation with employees, is to bring Ergon and Energex under a single company to reduce duplication and improve the efficiency of network businesses. The proposed merger is reported to lead to savings of more than $580 million during seven years.
The Queensland Government established an Interdepartmental Committee on Electricity Sector Reform (IDC) on 30 May 2012 to examine cost pressures on electricity prices. The IDC was asked to make recommendations to ensure:
• Electricity in Queensland is delivered in a cost-effective manner for consumers.
• Queensland has a viable, sustainable and competitive electricity industry.
• Electricity is delivered in a financially sustainable manner from the Queensland Government’s perspective.

72 Queensland energy and TelecommunicaTions indusTry SkillS and Workforce development report 2013
The IDC identified two main cost drivers:
1. Network costs and revenue – These grew by more than 100% between 2007/08 and 2012/13.
2. Climate change policies – The costs of these policies are expected to add around 11% to standard residential bills in 2013/14, or around 15% if solar costs are included.
The proposed reform strategies are designed to address cost pressures, build a more competitive market and reduce risks to customers, industry and government.
national skills standards council The National Skills Standards Council (NSSC) commenced operations on 1 July 2011 as a committee of the Standing Council on Tertiary Education, Skills and Employment (SCOTESE). As one of several Standing Councils that report to the Council of Australian Governments (COAG), SCOTESE is the successor of the Ministerial Council for Tertiary Education and Employment. This change in structure reflects COAG’s goal to strengthen Australia’s vocational education and training sector.
The NSSC met in June 2013 to discuss a range of matters, including the review of the standards for the regulation of VET, work to implement quality measures in training packages to support effective VET regulation, amendments to the determination for trainer and assessor competencies, and training package cases for endorsement. They announced four key outcomes:
review of the standards for the regulation of veT
The NSSC agreed to the governance and engagement arrangements for drafting regulatory standards based on the Standards Policy Framework, Improving Vocational Education and Training: the Australian Vocational Qualification System. The standards will be drafted by a joint taskforce of the NSSC and representatives from Commonwealth, State and Territory governments. The NSSC will continue to consult with key stakeholders throughout the drafting process on specific legislative and regulatory issues.
implementing quality measures in Training Packages
In partnership with ISCs and the Commonwealth, the NSSC will engage in discussions with key stakeholders to inform its consideration of the quality measures identified in the VET Quality Report with a view to developing draft amendments to the Standards for Training Packages for endorsement by Ministers later this year. The work will look to further support quality outcomes in VET by providing more effective regulation of delivery against requirements specified in training packages.
amendment to the nssc determination for Trainer and assessor competencies
The NSSC agreed to a minor amendment to the Determination for Trainer and Assessor Competencies to reflect Innovation and Business Skills Australia’s superseded TAE10 Enterprise Trainer Skill Set and new coding of the TAE Assessor Skill Set.
new Training Package Quality assurance Panel
The new NSSC Training Package Quality Assurance Panel (the Panel) has been established and will become operational from 1 July 2013. The Panel will provide a source of expertise to ISCs in the quality assurance of Training Packages that have been developed to meet the new Standards for Training Packages. Further information about Panel members, and their roles and responsibilities, is available on the NSSC website.
QuEEnsland and naTional oVErViEW

73
maJor ProJecT uPdaTe
electricity generation
Projects committed in the past 12 months
figure 23 provides a nationwide overview of the advanced electricity generation Projects as reported by Bree (nov 2012). Two projects in Queensland have been committed to and/or are under construction, the diamantina Power station near mt isa (242mW) and the Kogan creek solar Boost Project (44mW) near chinchilla.
A further 18 projects are at a less advanced state of development in Queensland, one black coal, seven gas, one biomass, one hydro, one solar and seven wind powered plants are proposed.
Table 14: overview of the less advanced energy projects planned in Queensland (Bree, 2012)
Project company location statusexpected start-up
new capacity (mW)
capital expend. (mil) employment
galilee Power Project Waratah Coal300 km W of Rockhampton, Qld
New project 2017 400 1250 1000
aldoga Power station EnergyAustralia Gladstone, Qld New project 2013-14 500 1800 400
Blackstone Power station
EnergyAustralia Ipswich, Qld New project 2013-14 500 1800 400
Braemar 3 ERM Power 40 km SW of Dalby, Qld Expansion 2015 550 550 400
Braemar 4 ERM Power 40 km SW of Dalby, Qld Expansion na 500
darling downs Power station 2
Origin Energy 250 km W of Brisbane, QldExpansion; On hold
na 500
seQ1 AGL Energy Ipswich, Qld New project post 2016 500 350 250
Westlink Power Project
Westlink 2 km N of Gatton, Qld New project2015 (Stage 1)
250 250 200
archer Point Wind farm
Archer Point Wind Park Pty Ltd
12 km S of Cooktown, Qld New project na 110 na 40
cooper’s gap Wind farm
AGL Energy180km NW of Brisbane, Qld
New project 2016 350 800 200
crows nest Wind farm AGL Energy43 km N of Toowoomba, Qld
New project na 150 350 150
forsayth Wind farm (previously Qld Wind)
Infigen Energy100 km SW of Townsville, Qld
New project na 75
high road Ratch Australia 70 km SW of Cairns, Qld New project 2016 40 90 100
Kennedy Wind farm Windlab 290 km SW Townsville, Qld New project 2014 750 1500 240
mount emerald Ratch Australia Mt Emerald, Qld New project 2015 200 500 150
Burdekin hydro Power station
Stanwell Corporation
100 km SW of Charters Towers, Qld
New project na 37
north Queensland Bio-energy Plant
North Queensland Bio-Energy Corporation Limited (NQBE)
4 km S of Ingham, Qld New project 2015 82.5 450 350
solar dawn (hybrid solar-gas power plant)
Solar Dawn near Kogan Creek, Qld New project 2015 250 1200 300

74 Queensland energy and TelecommunicaTions indusTry SkillS and Workforce development report 2013
figure 23: advanced electricity generation Projects: november 2012 (Bree, 2012)
Table 15: Proposed electricity generation projects 2013/2018+
Proposed electricity generation projects 2013/2018+:
New Capacity (MW) Employment
Capital Expenditure (Bn)
Number of projects
Queensland 6,000 4,600 11.5 20
australia 53,500 32,300 77 170
Queensland as % of aus
11% 14% 15% 12%
TransmissionThe NEM is connected by six major transmission interconnectors. These interconnectors link the electricity networks in New South Wales, Queensland, South Australia, Tasmania and Victoria (Table 10). The NEM electricity transmission and distribution networks consist of around 785 000 kilometres of overhead transmission and distribution lines and around 124,000kms of underground cables. Maintaining and improving system reliability is a key priority for the market operator and requires significant long term investment in both transmission and distribution infrastructure. AEMO’s National Transmission Network Development Plan lists 15 committed projects scheduled to be completed by 2016 (see Table 16).
QuEEnsland and naTional oVErViEW
Map 1: Advanced electricity generation projects, October 2012
DarwinWeddell Stage 3
(natural gas) McArthur River Mine (Phase 3 expansion) (natural gas)
Northern Territory Queensland
Yarnima Power Station (natural gas) Diamantia Power Station (two stages)
(natural gas)
Western Australia Kogan Creek Solar Boost (solar)
BrisbaneSouth Australia
New South Wales Mumbida Wind Farm (wind)
Crookwell 2 Wind Farm (wind) Eraring (black coal)
Snowtown Stage 2 (wind) Gullen Range Wind FarmSydneyPerthPerth (wind)AdelaidAdelaidee
CanberraVictoria Upper Tumut
Mount Mercer Wind Farm (wind) expansion (hydro)MelbourneMelbourneMuja Power Station (black coal) Macarthur Wind Farm (wind) Ararat Wind Farm (wind)
LEGEND Mount GellibrandWind Farm (wind)Hawkesdale Wind Farm (wind) 0–100 MW Woolsthorpe Wind Farm (wind)
Ryan Corner Wind Farm (wind)101–300 MW Musselroe Bay Wind Farm (wind)
TaTasmanismaniaa301–500 MW Hobart
>500 MW
capital city
15 Major electricity generation projects • November 2012

75
Table 16: major committed transmission projects for australia’s national electricity market a (aemo, 2013)
region Project details anticipated timingQueensland The Calvale-Stanwell 275 kV double circuit line. Summer 2013/14
QueenslandThe Columboola-Wandoan South 275 kV line (operating at 132 kV).
Winter 2013
Queensland The Columboola-Wandoan South 275 kV line. Winter 2014new south Wales An Armidale SVC power oscilation damper. 2012
new south WalesEstablishment and connection of the Holroyd and Rookwood Road Substations.
2013/14
new south Wales A 200 MVAr capacitor at Armidale. 2013
new south WalesEstablishment of the Wallaroo Substation and Yass/Canberra line rearrangements.
2018
new south WalesBeaconsfield West-Haymarket 330 kB cable (operated at 132 kV).
2012/13
new south WalesEstablishment and connection of a new Tomerong 330/132 kV substation to supply the Nowra area.
2015
new south WalesLine ratings increased on the Marulan-Avon, Marulan-Dapto and Kangaroo Valley-Dapto 330 kV lines.
2015
victoriaMacarthur Wind Farm connection, involving 420 MW at the 500 kV Tarrone Terminal Station.
December 2012
victoriaTarrone Terminal Station cut into the existing Moorabool-Heywood 500 kV No. 1 line.
Completed
south australia A Tungkillo 275 kV 100 MVAr capacitor bank. 2012south australia A Cultana 275 kV augmentation. 2014victoria and south australia
The incremental augmentation of the Victoria to South Australia interconnector (Heywood).
2016

76 Queensland energy and TelecommunicaTions indusTry SkillS and Workforce development report 2013
rEFErEncEs
ABS (2013) 2011 Census QuickStats, All people - usual residents, Queensland
AEMO (2013). Australian Energy Market Operator
BREE (2012). Resources and Energy Quarterly, Nov Quarter 2012. Canberra: Bureau of Resources and Energy Economics
BREE (2013). Energy in Australia 2013. Canberra: Bureau of Resources and Energy Economics
DEEDI. (2010). Centres of Enterprise: action plan - Coal, CSG and LNG: Regional supply chain opportunities in the Surat Basin and Gladstone: Department of Employment, Economic Development and Innovation.
DEEDI (2013). Energy, Queensland Government: Department of Employment, Economic Development and Innovations
DETE (2011). Region Maps, DET Brisbane, Queensland Government: Department of Education and Training
DETE (2013). Department of Education, Training and Employment - Queensland Government - Unpublished Data
DIAC (2013). Subclass 457 State/Territory Summary Report 2012-13 to 31 March 2013: Department of Immigration and Citizenship
ESO (2013). Electrical Safety Office - Queensland Department of Justice and Attorney - Unpublished Data
IBISWorld (2013a). IBISWorld Industry Report D2611/D2612/D2619, Electricity Generation in Australia: IBISWorld
IBISWorld (2013b). IBISWorld Industry Report D2620, Electricity Transmission in Australia: IBISWorld
IBISWorld (2013c). IBISWorld Industry Report D2630, Electricity Distribution in Australia: IBISWorld
IBISWorld (2013d). IBISWorld Industry Report D2640, On Selling Electricity and Electricity Market Operation in Australia: IBISWorld
IBISWorld (2013e). IBISWorld Industry Report D2700, Gas Supply in Australia: IBISWorld
IBISWorld (2013f). IBISWorld Industry Report E3232, Electrical Services in Australia: IBISWorld
IBISWorld (2013g). IBISWorld Industry Report J5800, Telecommunications Services in Australia: IBISWorld
Karmel, T., & Mlotkowski, P. (2011). The impact of wages and the likelihood of employment on the probability of completing an apprenticeship or traineeship: National Centre for Vocational Education Research
NCVER (2011). 2011 Annual: Apprentices & Trainees
OESR (2011). Queensland Government population projections to 2031: Local government areas 2011 edition: Office of Economic and Statistical Research (OESR), Queensland Government
OESR (2013). Queensland Economic Review: January 2013. Brisbane: Office of Economic and Statistical Research
Powerlink Queensland (2012). Annual Report 2011/2012, Brisbane: Powerlink Queensland
Queensland Government (2013). Queensland Government Business and Industry Portal (website): Queensland Gas Scheme

77
appEndix onE
Technical notes
This publication was prepared by Energy Skills Queensland – as a continuance in the series of annual reports produced by Energy Skills Queensland. Data used in this report is based on various sources, as referenced where appropriate. Caution should be applied when comparing output data to that contained in previous editions of Energy Skills Queensland’s annual reports and other sources. Historic data, for example apprentice and traineeship data always experience lag, and as such when new data is acquired from sources such as NCVER and DET, historical numbers are possible to change. For further information, refer to the notes on Australian Bureau of Statistics and National Centre for Vocational Education Research data below.
Figures and tables included in text and commentary throughout this publication have been rounded unless stated otherwise.
assumptions and limitations around australian Bureau of statistics (aBs) and national centre for vocational education research (ncver) data
Every month, the ABS runs a Labour Force Survey across Australia covering almost 30,000 homes as well as a selection of hotels, hospitals, boarding schools, colleges, prisons and Indigenous communities. Apart from the Census, the Labour Force Survey is the largest household collection undertaken by the ABS. Data are collected for about 60,000 people and these people live in a broad range of areas and have diverse backgrounds - they are a very good representation of the Australian population. From this information, the ABS produces a wide variety of statistics that paint a picture of the labour market. Most statistics are produced using established international standards, to ensure they can be easily compared with the rest of the world. The ABS has also introduced new statistics in recent years that bring to light further aspects of the labour market. It can be informative to look at all of these indicators to get a grasp of what is happening, particularly when the economy is changing quickly.
It is important to note that ABS labour force figures are when a publication states that, for example, 11.4 million Australians are employed, the ABS has not actually checked with each and every one of these people. The ABS, similar to most statistics produced, surveys a sample of people across Australia and then scales up the results – based on the latest population figures - to give a total for the whole country. Because the figures are from a sample, they are subject to possible error. The Labour Force Survey is large, so the error is minimised. The ABS provides information about the possible size of the error to help users understand how reliable the estimates are. It is important to note that using detailed occupational data (i.e., ANZSCO – 6 digit) must be approached with caution due to statistical reliability and sampling errors.
NCVER VOCSTATS is a SuperWEB product which allows users to construct their own tables via an interactive web interface, using databases containing data from various NCVER collections. The data selected is loaded as a SuperWEB table allowing the user to manipulate the table and customise it for their own use. Tables can then be printed or exported in a variety of formats. Data presented in the NCVER VOCSTATS database include the following:
• Apprentices and trainees• Students and courses• Student outcomes
These databases are based on the NCVER collections; Apprentice and Trainee Collection, VET Provider Collection, Student Outcome Survey. There are some limitations with VOCSTATS mainly due to timeliness. In some instances, there are delays in receiving apprentice and trainee data from each State and Territory which occasionally have an impact on NCVER data processing timetable and hence updating VOCSTATS.


energy skills Queensland
70 Sylvan Road, Toowong Queensland 4066PO Box 607, Toowong Queensland 4066Phone 07 3721 8800fax 07 3870 9291 email [email protected]
gladstone office
Level 3, 72 Goondoon Street, Gladstone Queensland 4680Phone 07 4972 5977
Toowoomba office
Suite 8A, 566 Ruthven Street, Toowoomba Queensland 4350Phone 07 4632 7034
Bundaberg office
106-108 Bargara Road, Bundaberg East Queensland 4670
Representatives in Rockhampton and Gympie
www.energyskillsqld.com.au