Embed Size (px)
Citation preview

Queensland Fisheries Summary
October 2018

This publication has been compiled Carlie Heaven of Fisheries Queensland, Department of Agriculture and Fisheries. © State of Queensland, 2018 The Queensland Government supports and encourages the dissemination and exchange of its information. The copyright in this publication is licensed under a Creative Commons Attribution 4.0 International (CC BY 4.0) licence. Under this licence you are free, without having to seek our permission, to use this publication in accordance with the licence terms.
You must keep intact the copyright notice and attribute the State of Queensland as the source of the publication. Note: Some content in this publication may have different licence terms as indicated. For more information on this licence, visit https://creativecommons.org/licenses/by/4.0/. The information contained herein is subject to change without notice. The Queensland Government shall not be liable for technical or other errors or omissions contained herein. The reader/user accepts all risks and responsibility for losses, damages, costs and other consequences resulting directly or indirectly from using this information.
Queensland Fisheries Summary Report , Department of Agriculture and Fisheries, 2018 3
Table of contents
Overview ................................................................................................................................................ 4
Appropriate Use of Data Limitations ..................................................................................................... 4
Introduction ........................................................................................................................................... 6
Harvest fisheries ................................................................................................................................... 9
Coral Fishery ....................................................................................................................................... 11
Crayfish and Rocklobster Fishery ....................................................................................................... 14
East Coast Pearl Fishery .................................................................................................................... 16
Marine Aquarium Fish Fishery ............................................................................................................ 18
Queensland Eel Fishery ...................................................................................................................... 20
East Coast Sea Cucumber (beche-de-mer) Fishery ........................................................................... 22
Trochus Fishery .................................................................................................................................. 24
Line fisheries ....................................................................................................................................... 26
Coral Reef Fin Fish Fishery ................................................................................................................ 26
Deep Water (multiple-hook) Fin Fishery ............................................................................................. 29
East Coast Spanish Mackerel Fishery ................................................................................................ 32
Gulf of Carpentaria Line Fishery ......................................................................................................... 34
Rocky Reef Fin Fish Fishery ............................................................................................................... 36
Net fisheries ........................................................................................................................................... 1
East Coast Inshore Fin Fishery ............................................................................................................. 1
Gulf of Carpentaria Inshore Fin Fish Fishery ........................................................................................ 5
Pot fisheries ........................................................................................................................................... 8
Blue Swimmer Crab Fishery ................................................................................................................. 8
Mud Crab Fishery ................................................................................................................................ 11
Spanner Crab Fishery ......................................................................................................................... 13
Trawl fisheries ..................................................................................................................................... 16
East Coast Otter Trawl Fishery ........................................................................................................... 16
Fin Fish (Stout Whiting) Trawl Fishery ................................................................................................ 19
Gulf of Carpentaria Developmental Fin Fish Trawl Fishery ................................................................ 21
River and Inshore Beam Trawl Fishery ............................................................................................... 23
Additional data .................................................................................................................................... 25
Queensland Fisheries Summary Report , Department of Agriculture and Fisheries, 2018 4
Overview
The Department of Agriculture and Fisheries (DAF) provides catch and effort information for commercial
fisheries in Queensland biannually (April and October). The following report provides a series of figures and
tables displaying a summary of the most recent (2017/2018 financial year) catch, effort and Gross Value of
Product (GVP) data for commercial fisheries in Queensland. Queensland’s Fisheries are defined by a variety
of characteristics, predominantly by species, fishing method (gear), and region. Summarised annual catch
and effort data are reported by either calendar year or financial year which is dependent upon when the
fishery operates seasonally. Table 1 displays a list of each commercial fishery in Queensland and an
indication of when updated annual data is summarised and published.
Appropriate Use of Data Limitations
The catch weight data in logbooks are estimates only which have been recorded by fishers while at sea.
Estimated weights may be based on volume, for example, the size and number of containers or boxes of fish
caught.
It is important to remain cautious when interpreting trends in this data as there are a number of factors that
can affect catches each year. Any recent management measures that are likely to have had an impact on the
data are detailed for each fishery. Examples of management changes that potentially affect catch and effort
data include; reductions or increases in quota or Total Allowable Commercial Catch (TACC), fishing area
restrictions or closures that are not standard seasonal closures (e.g. whitespot disease containment area),
reducing boat numbers or restricting the catch of a particular species. Market demand can also drive a
particular species or a particular size range of a species to be targeted (e.g. smaller plate sized fish as
opposed to larger specimens of the same species may be driven by market).
Effort figures (licence numbers and number of days fished) in this report are not designed to be summed
across species or fisheries as this will result in overinflating the number of effort days. Queensland’s fish
price series data has not been updated since 2012 and prior to this date, prices were updated sporadically.
Fisheries Queensland does not have current (2018) data on the market value of individual species.
Therefore, the figures in this report which relate to GVP should be taken as estimates and may not represent
the current market value of the species.
These data may differ from other summations over the same period (such as stock assessment reports, or
QFish data) due to differences in data handling procedures over time. The business rules that are applied to
fisheries data are constantly evolving and as they are refined, the same data set may vary through time.
Therefore the data contained within the most recent Queensland Fisheries Summary supersedes data in
previous reports. There may be differences between logbook catch and effort figures presented in this report
and the associated QFish pivot table link due to differences in the way the data has been extracted. For any
further information on data extraction rules, or the Queensland Fisheries Summary Report, contact
Queensland Fisheries Summary Report , Department of Agriculture and Fisheries, 2018 5
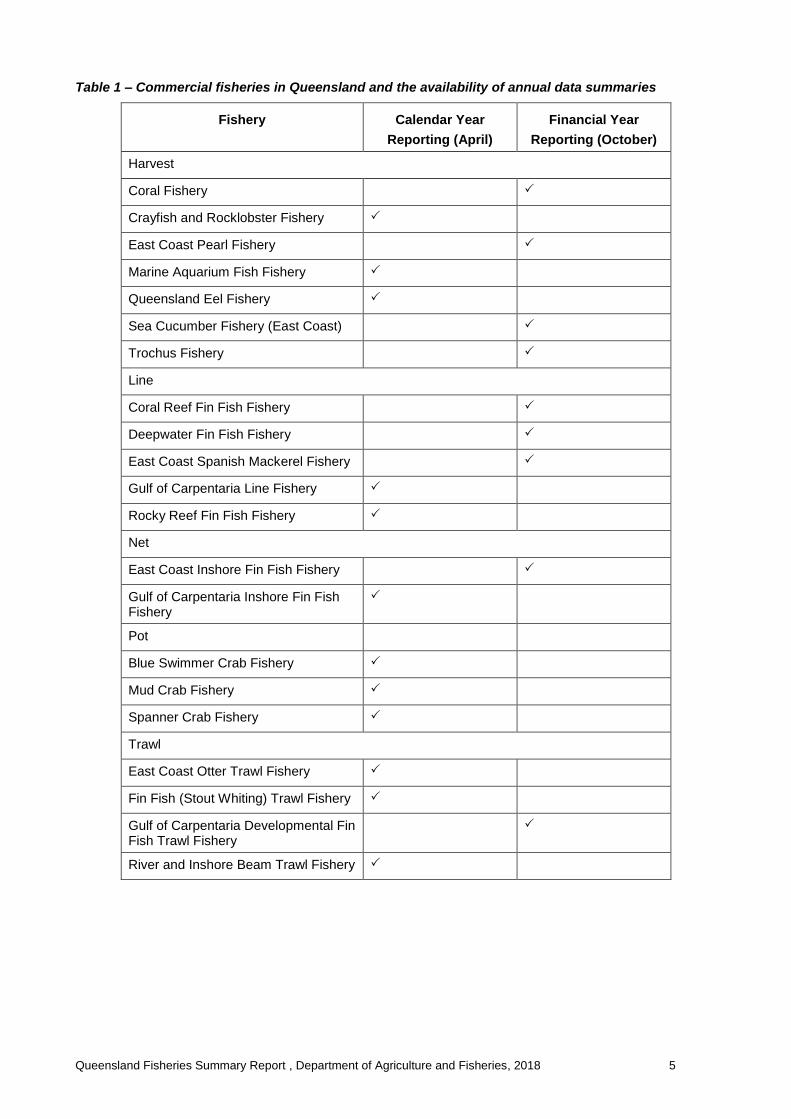
Table 1 – Commercial fisheries in Queensland and the availability of annual data summaries
Fishery Calendar Year
Reporting (April)
Financial Year
Reporting (October)
Harvest
Coral Fishery
Crayfish and Rocklobster Fishery
East Coast Pearl Fishery
Marine Aquarium Fish Fishery
Queensland Eel Fishery
Sea Cucumber Fishery (East Coast)
Trochus Fishery
Line
Coral Reef Fin Fish Fishery
Deepwater Fin Fish Fishery
East Coast Spanish Mackerel Fishery
Gulf of Carpentaria Line Fishery
Rocky Reef Fin Fish Fishery
Net
East Coast Inshore Fin Fish Fishery
Gulf of Carpentaria Inshore Fin Fish Fishery
Pot
Blue Swimmer Crab Fishery
Mud Crab Fishery
Spanner Crab Fishery
Trawl
East Coast Otter Trawl Fishery
Fin Fish (Stout Whiting) Trawl Fishery
Gulf of Carpentaria Developmental Fin Fish Trawl Fishery
River and Inshore Beam Trawl Fishery
Queensland Fisheries Summary Report , Department of Agriculture and Fisheries, 2018 6
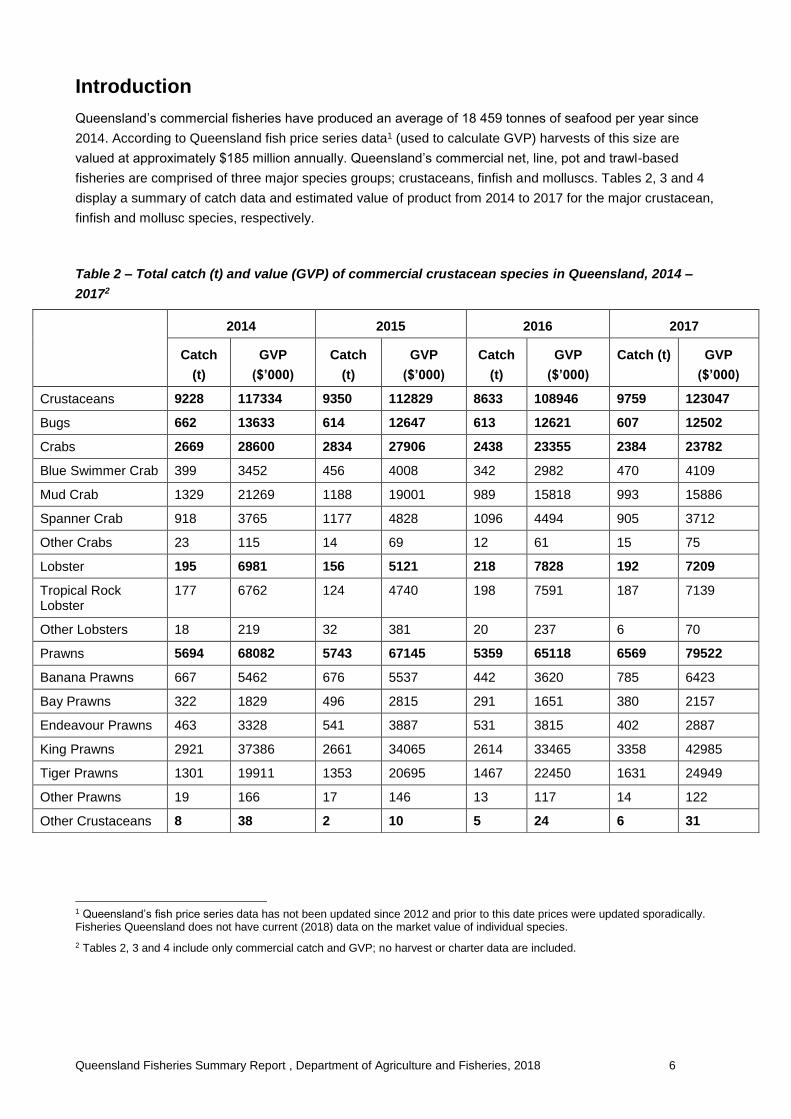
Introduction
Queensland’s commercial fisheries have produced an average of 18 459 tonnes of seafood per year since
2014. According to Queensland fish price series data1 (used to calculate GVP) harvests of this size are
valued at approximately $185 million annually. Queensland’s commercial net, line, pot and trawl-based
fisheries are comprised of three major species groups; crustaceans, finfish and molluscs. Tables 2, 3 and 4
display a summary of catch data and estimated value of product from 2014 to 2017 for the major crustacean,
finfish and mollusc species, respectively.
Table 2 – Total catch (t) and value (GVP) of commercial crustacean species in Queensland, 2014 –
20172
1 Queensland’s fish price series data has not been updated since 2012 and prior to this date prices were updated sporadically. Fisheries Queensland does not have current (2018) data on the market value of individual species.
2 Tables 2, 3 and 4 include only commercial catch and GVP; no harvest or charter data are included.
2014 2015 2016 2017
Catch
(t)
GVP
($’000)
Catch
(t)
GVP
($’000)
Catch
(t)
GVP
($’000)
Catch (t) GVP
($’000)
Crustaceans 9228 117334 9350 112829 8633 108946 9759 123047
Bugs 662 13633 614 12647 613 12621 607 12502
Crabs 2669 28600 2834 27906 2438 23355 2384 23782
Blue Swimmer Crab 399 3452 456 4008 342 2982 470 4109
Mud Crab 1329 21269 1188 19001 989 15818 993 15886
Spanner Crab 918 3765 1177 4828 1096 4494 905 3712
Other Crabs 23 115 14 69 12 61 15 75
Lobster 195 6981 156 5121 218 7828 192 7209
Tropical Rock Lobster
177 6762 124 4740 198 7591 187 7139
Other Lobsters 18 219 32 381 20 237 6 70
Prawns 5694 68082 5743 67145 5359 65118 6569 79522
Banana Prawns 667 5462 676 5537 442 3620 785 6423
Bay Prawns 322 1829 496 2815 291 1651 380 2157
Endeavour Prawns 463 3328 541 3887 531 3815 402 2887
King Prawns 2921 37386 2661 34065 2614 33465 3358 42985
Tiger Prawns 1301 19911 1353 20695 1467 22450 1631 24949
Other Prawns 19 166 17 146 13 117 14 122
Other Crustaceans 8 38 2 10 5 24 6 31
Queensland Fisheries Summary Report , Department of Agriculture and Fisheries, 2018 7
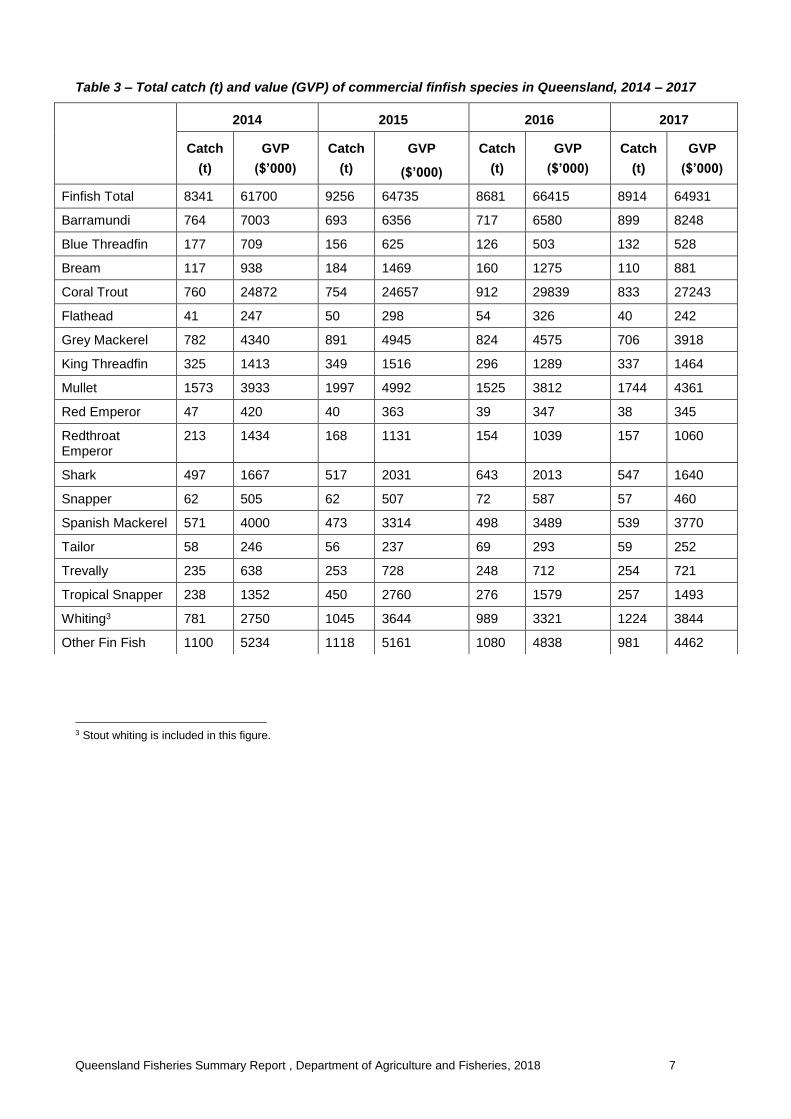
Table 3 – Total catch (t) and value (GVP) of commercial finfish species in Queensland, 2014 – 2017
3 Stout whiting is included in this figure.
2014 2015 2016 2017
Catch
(t)
GVP
($’000)
Catch
(t)
GVP
($’000)
Catch
(t)
GVP
($’000)
Catch
(t)
GVP
($’000)
Finfish Total 8341 61700 9256 64735 8681 66415 8914 64931
Barramundi 764 7003 693 6356 717 6580 899 8248
Blue Threadfin 177 709 156 625 126 503 132 528
Bream 117 938 184 1469 160 1275 110 881
Coral Trout 760 24872 754 24657 912 29839 833 27243
Flathead 41 247 50 298 54 326 40 242
Grey Mackerel 782 4340 891 4945 824 4575 706 3918
King Threadfin 325 1413 349 1516 296 1289 337 1464
Mullet 1573 3933 1997 4992 1525 3812 1744 4361
Red Emperor 47 420 40 363 39 347 38 345
Redthroat Emperor
213 1434 168 1131 154 1039 157 1060
Shark 497 1667 517 2031 643 2013 547 1640
Snapper 62 505 62 507 72 587 57 460
Spanish Mackerel 571 4000 473 3314 498 3489 539 3770
Tailor 58 246 56 237 69 293 59 252
Trevally 235 638 253 728 248 712 254 721
Tropical Snapper 238 1352 450 2760 276 1579 257 1493
Whiting3 781 2750 1045 3644 989 3321 1224 3844
Other Fin Fish 1100 5234 1118 5161 1080 4838 981 4462
Queensland Fisheries Summary Report , Department of Agriculture and Fisheries, 2018 8
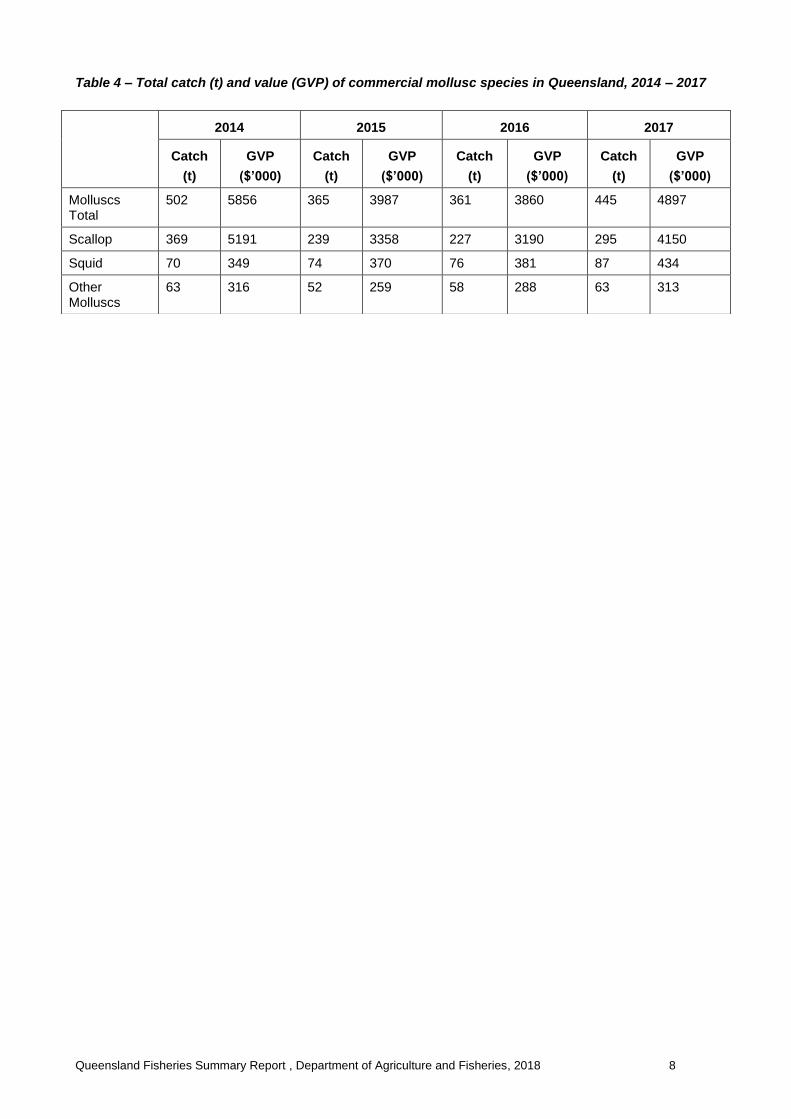
Table 4 – Total catch (t) and value (GVP) of commercial mollusc species in Queensland, 2014 – 2017
2014 2015 2016 2017
Catch
(t)
GVP
($’000)
Catch
(t)
GVP
($’000)
Catch
(t)
GVP
($’000)
Catch
(t)
GVP
($’000)
Molluscs Total
502 5856 365 3987 361 3860 445 4897
Scallop 369 5191 239 3358 227 3190 295 4150
Squid 70 349 74 370 76 381 87 434
Other Molluscs
63 316 52 259 58 288 63 313
Queensland Fisheries Summary Report , Department of Agriculture and Fisheries, 2018 9
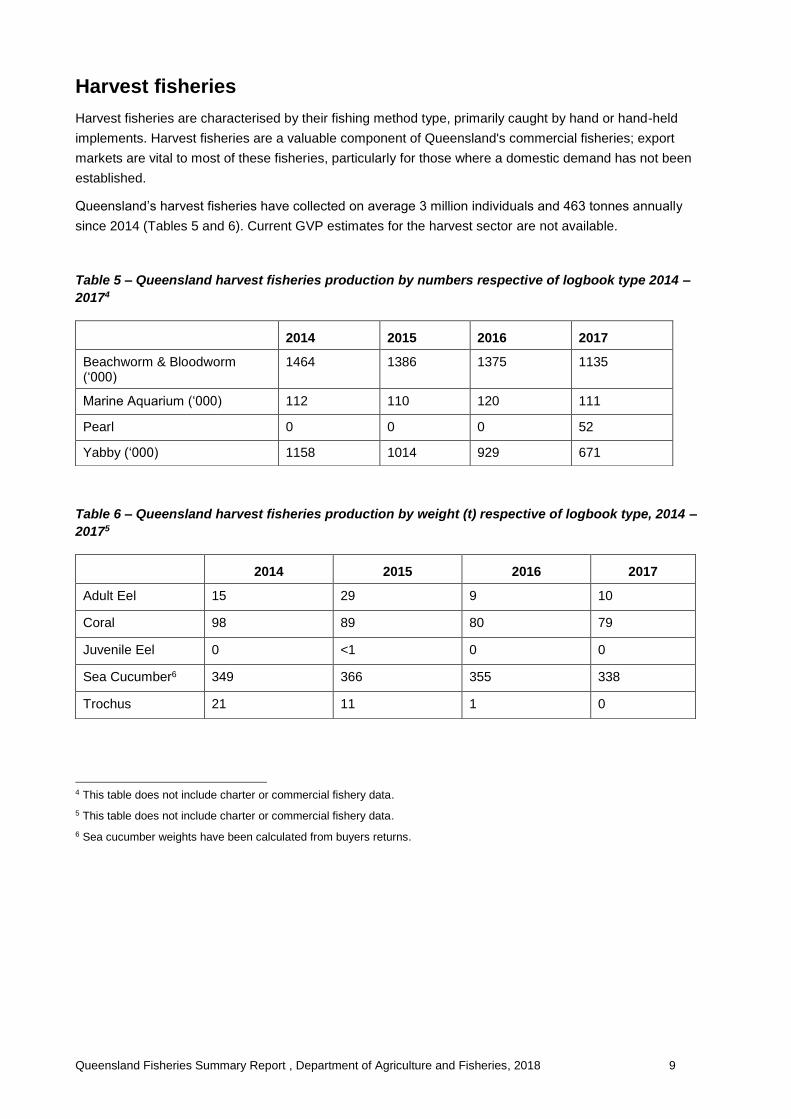
Harvest fisheries
Harvest fisheries are characterised by their fishing method type, primarily caught by hand or hand-held
implements. Harvest fisheries are a valuable component of Queensland's commercial fisheries; export
markets are vital to most of these fisheries, particularly for those where a domestic demand has not been
established.
Queensland’s harvest fisheries have collected on average 3 million individuals and 463 tonnes annually
since 2014 (Tables 5 and 6). Current GVP estimates for the harvest sector are not available.
Table 5 – Queensland harvest fisheries production by numbers respective of logbook type 2014 –
20174
Table 6 – Queensland harvest fisheries production by weight (t) respective of logbook type, 2014 –
20175
4 This table does not include charter or commercial fishery data.
5 This table does not include charter or commercial fishery data.
6 Sea cucumber weights have been calculated from buyers returns.
2014 2015 2016 2017
Beachworm & Bloodworm (‘000)
1464 1386 1375 1135
Marine Aquarium (‘000) 112 110 120 111
Pearl 0 0 0 52
Yabby (‘000) 1158 1014 929 671
2014 2015 2016 2017
Adult Eel 15 29 9 10
Coral 98 89 80 79
Juvenile Eel 0 <1 0 0
Sea Cucumber6 349 366 355 338
Trochus 21 11 1 0

Queensland Fisheries Summary Report , Department of Agriculture and Fisheries, 2018 10
Queensland’s aquaculture production figures for the 2017/18 financial year are not yet available.
In the 2016/17 financial year, aquaculture production in Queensland was valued at $120 million7,
equating to 38.4% of Queensland’s total commercial fisheries production8.
A total of 7869 tonnes was produced, with prawns and barramundi accounting for 54.2 % and 38 % of
the production, respectively.
For more information on Queensland’s aquaculture production please visit
http://www.daf.qld.gov.au/fisheries/aquaculture/investment/industry-performance
7 This figure does not include hatchery estimates.
8 Not including harvest or charter data.
Queensland Fisheries Summary Report , Department of Agriculture and Fisheries, 2018 11
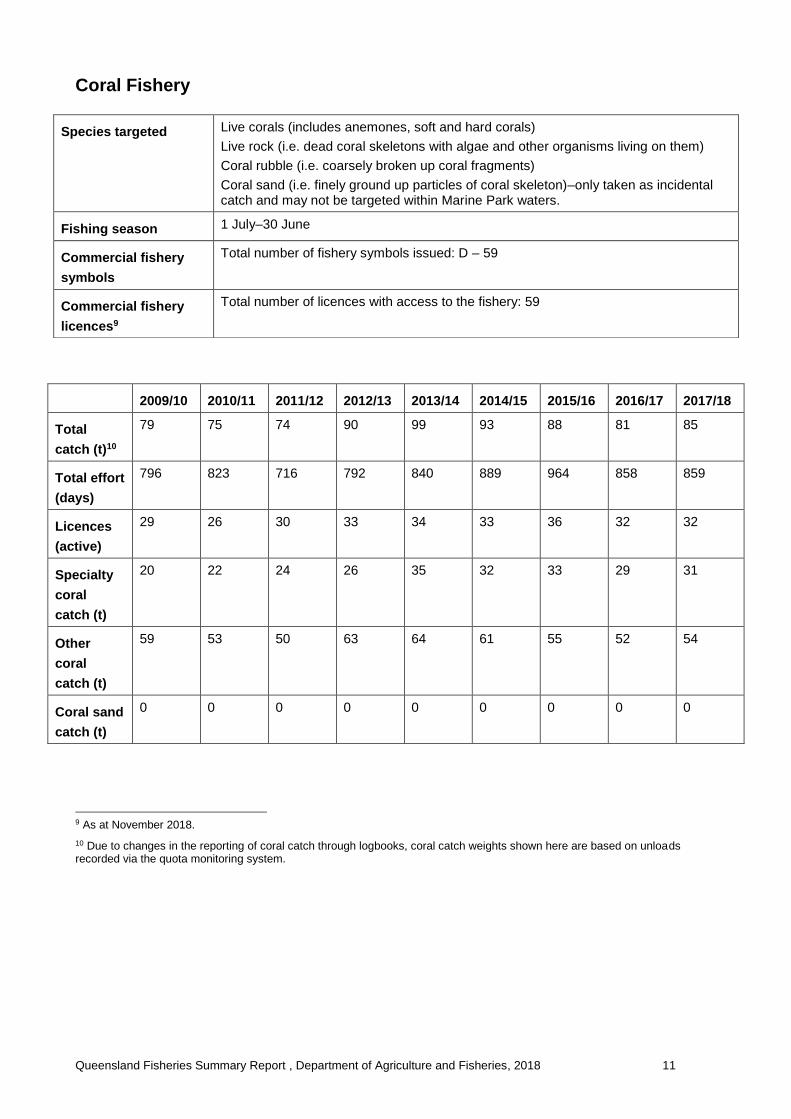
Coral Fishery
9 As at November 2018.
10 Due to changes in the reporting of coral catch through logbooks, coral catch weights shown here are based on unloads recorded via the quota monitoring system.
Species targeted Live corals (includes anemones, soft and hard corals)
Live rock (i.e. dead coral skeletons with algae and other organisms living on them)
Coral rubble (i.e. coarsely broken up coral fragments)
Coral sand (i.e. finely ground up particles of coral skeleton)–only taken as incidental catch and may not be targeted within Marine Park waters.
Fishing season 1 July–30 June
Commercial fishery
symbols
Total number of fishery symbols issued: D – 59
Commercial fishery
licences9
Total number of licences with access to the fishery: 59
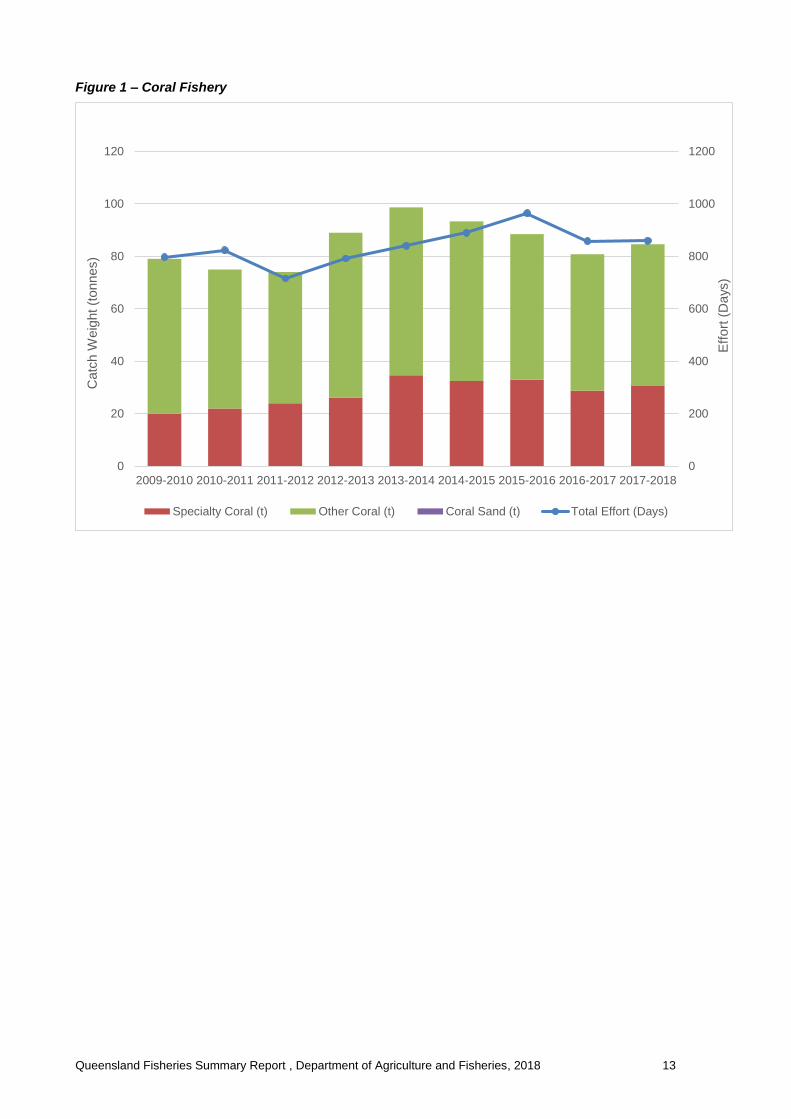
2009/10 2010/11 2011/12 2012/13 2013/14 2014/15 2015/16 2016/17 2017/18
Total
catch (t)10
79 75 74 90 99 93 88 81 85
Total effort
(days)
796 823 716 792 840 889 964 858 859
Licences
(active)
29 26 30 33 34 33 36 32 32
Specialty
coral
catch (t)
20 22 24 26 35 32 33 29 31
Other
coral
catch (t)
59 53 50 63 64 61 55 52 54
Coral sand
catch (t)
0 0 0 0 0 0 0 0 0
Queensland Fisheries Summary Report , Department of Agriculture and Fisheries, 2018 12
The Coral Fishery commenced as a licensed fishery in July 2006 and is one of a range of harvest fisheries
(hand collection) managed by Fisheries Queensland.
Changes in management arrangements for the 2009/10 financial year saw the introduction of the
new Queensland Coral, Shell Grit and Star Sand Fisheries Logbook (CS04) in mid-2009.
The reporting requirements in the current logbook reflect changes to some definitions, species
and certain categories of corals in line with the updated Policy for the Management of the Coral
Fishery January 2009 and the Environmental Risk Assessment for coral.
The changes include:
‘Live’ Coral is now defined as ‘Specialty’ coral.
The LC1 category no longer exists and has been replaced by the LC6 (>1kg) category. Operators
must report number and estimated weight for LC6.
Certain species on the logbook form have changed as well as certain species listed in the
instructions within the logbook.
Due to the changes in reporting requirements for the coral fishery, the data displayed in this report
are based on unloads recorded by the quota monitoring system as opposed to logbook data.
The coral fishery has a Total Allowable Commercial Catch (TACC) of 200 tonnes which is split
between specialty coral (30%) and other coral (70%). In the 2017/18 financial year, 54 tonnes
(38.4%) of other coral and 31 tonnes (51.3 %) of specialty coral quotas were utilised by the Coral
Fishery11.
Quota allocations and usage , licence numbers, and symbols currently endorsed in the Coral Fishery
can be viewed on FishNet
For further analysis of the Coral Fishery please visit QFish
Fisheries symbols provide an endorsement to fish within Queensland waters, to view the fishery
symbol maps associated with this fishery view Fishery Symbols.
11 Fishery quota and logbook figures listed in this report may differ; logbooks are designed to collect an estimated daily weight retained at sea, while quota figures are based on weights that are accurately measured upon landing. Moving forward, logbook figures within this report will be adjusted to reflect quota data.
Queensland Fisheries Summary Report , Department of Agriculture and Fisheries, 2018 13
Figure 1 – Coral Fishery
0
200
400
600
800
1000
1200
0
20
40
60
80
100
120
2009-2010 2010-2011 2011-2012 2012-2013 2013-2014 2014-2015 2015-2016 2016-2017 2017-2018
Eff
ort
(D
ays
)
Catc
h W
eig
ht (t
onnes)
Specialty Coral (t) Other Coral (t) Coral Sand (t) Total Effort (Days)
Queensland Fisheries Summary Report , Department of Agriculture and Fisheries, 2018 14
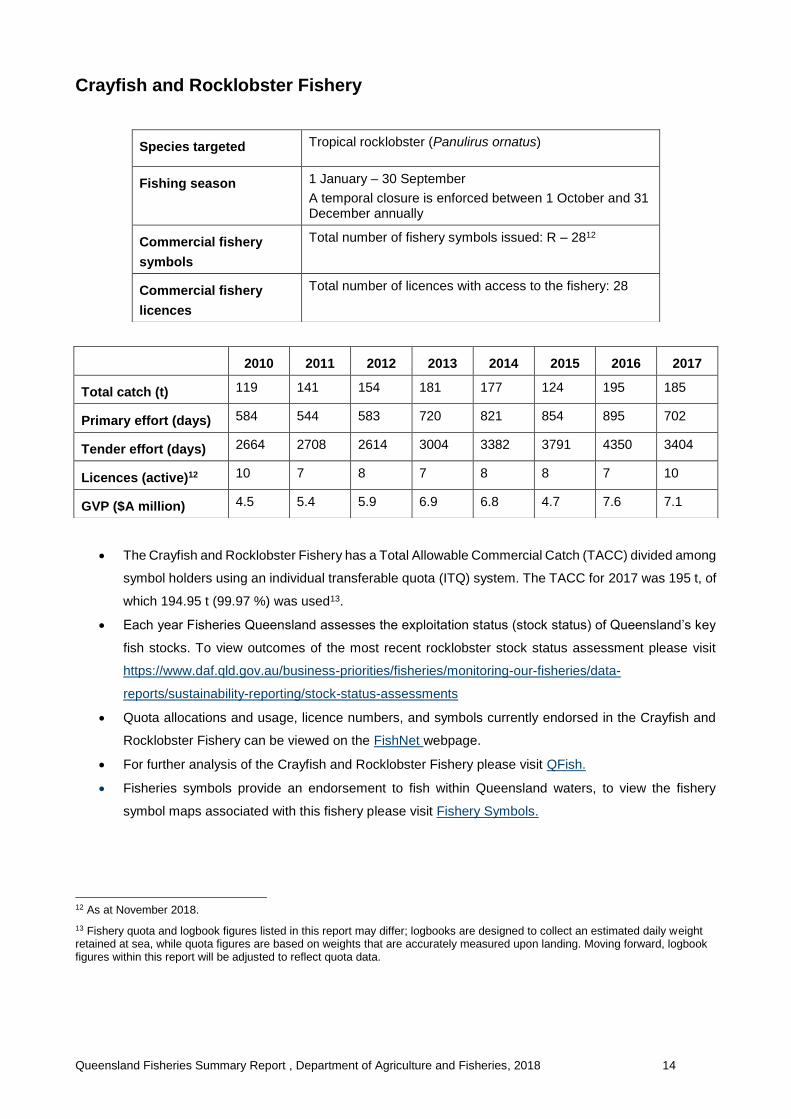
Crayfish and Rocklobster Fishery
The Crayfish and Rocklobster Fishery has a Total Allowable Commercial Catch (TACC) divided among
symbol holders using an individual transferable quota (ITQ) system. The TACC for 2017 was 195 t, of
which 194.95 t (99.97 %) was used13.
Each year Fisheries Queensland assesses the exploitation status (stock status) of Queensland’s key
fish stocks. To view outcomes of the most recent rocklobster stock status assessment please visit
https://www.daf.qld.gov.au/business-priorities/fisheries/monitoring-our-fisheries/data-
reports/sustainability-reporting/stock-status-assessments
Quota allocations and usage, licence numbers, and symbols currently endorsed in the Crayfish and
Rocklobster Fishery can be viewed on the FishNet webpage.
For further analysis of the Crayfish and Rocklobster Fishery please visit QFish.
Fisheries symbols provide an endorsement to fish within Queensland waters, to view the fishery
symbol maps associated with this fishery please visit Fishery Symbols.
12 As at November 2018.
13 Fishery quota and logbook figures listed in this report may differ; logbooks are designed to collect an estimated daily weight retained at sea, while quota figures are based on weights that are accurately measured upon landing. Moving forward, logbook figures within this report will be adjusted to reflect quota data.
Species targeted Tropical rocklobster (Panulirus ornatus)
Fishing season 1 January – 30 September
A temporal closure is enforced between 1 October and 31 December annually
Commercial fishery
symbols
Total number of fishery symbols issued: R – 2812
Commercial fishery
licences
Total number of licences with access to the fishery: 28
2010 2011 2012 2013 2014 2015 2016 2017
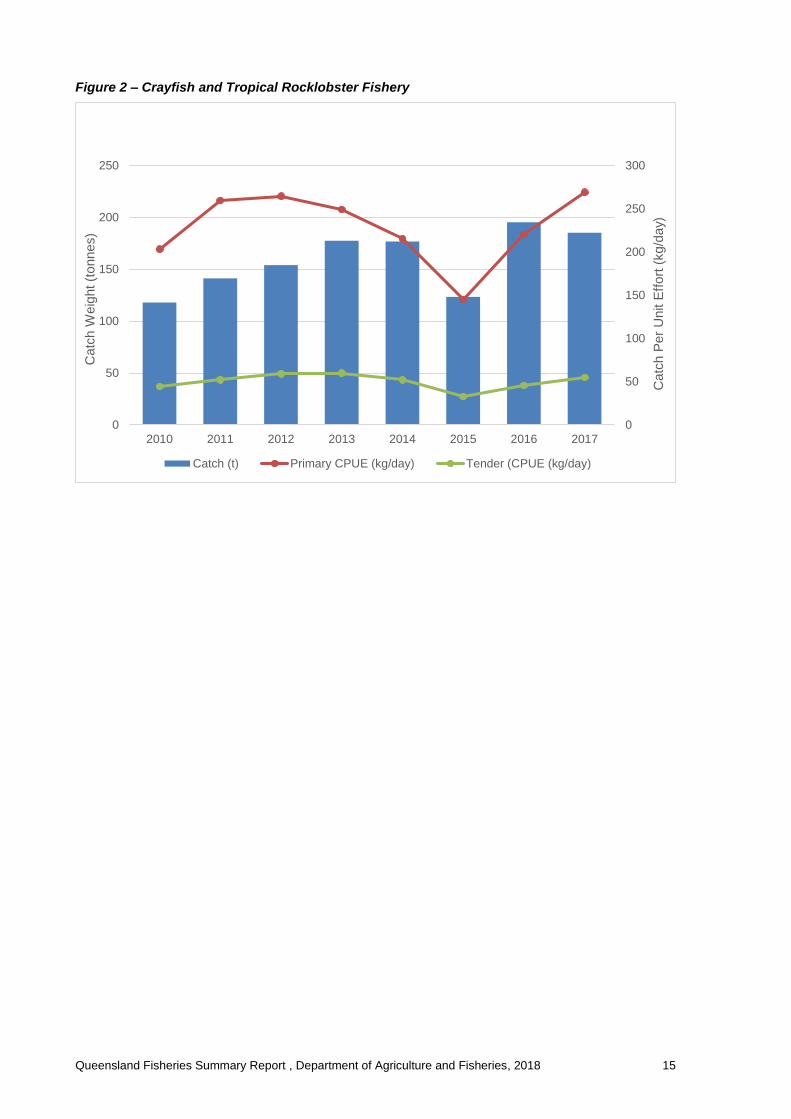
Total catch (t) 119 141 154 181 177 124 195 185
Primary effort (days) 584 544 583 720 821 854 895 702
Tender effort (days) 2664 2708 2614 3004 3382 3791 4350 3404
Licences (active)12 10 7 8 7 8 8 7 10
GVP ($A million) 4.5 5.4 5.9 6.9 6.8 4.7 7.6 7.1
Queensland Fisheries Summary Report , Department of Agriculture and Fisheries, 2018 15
Figure 2 – Crayfish and Tropical Rocklobster Fishery
0
50
100
150
200
250
300
0
50
100
150
200
250
2010 2011 2012 2013 2014 2015 2016 2017
Catc
h P
er
Unit E
ffort
(kg/d
ay)
Catc
h W
eig
ht (t
onnes)
Catch (t) Primary CPUE (kg/day) Tender (CPUE (kg/day)
Queensland Fisheries Summary Report , Department of Agriculture and Fisheries, 2018 16
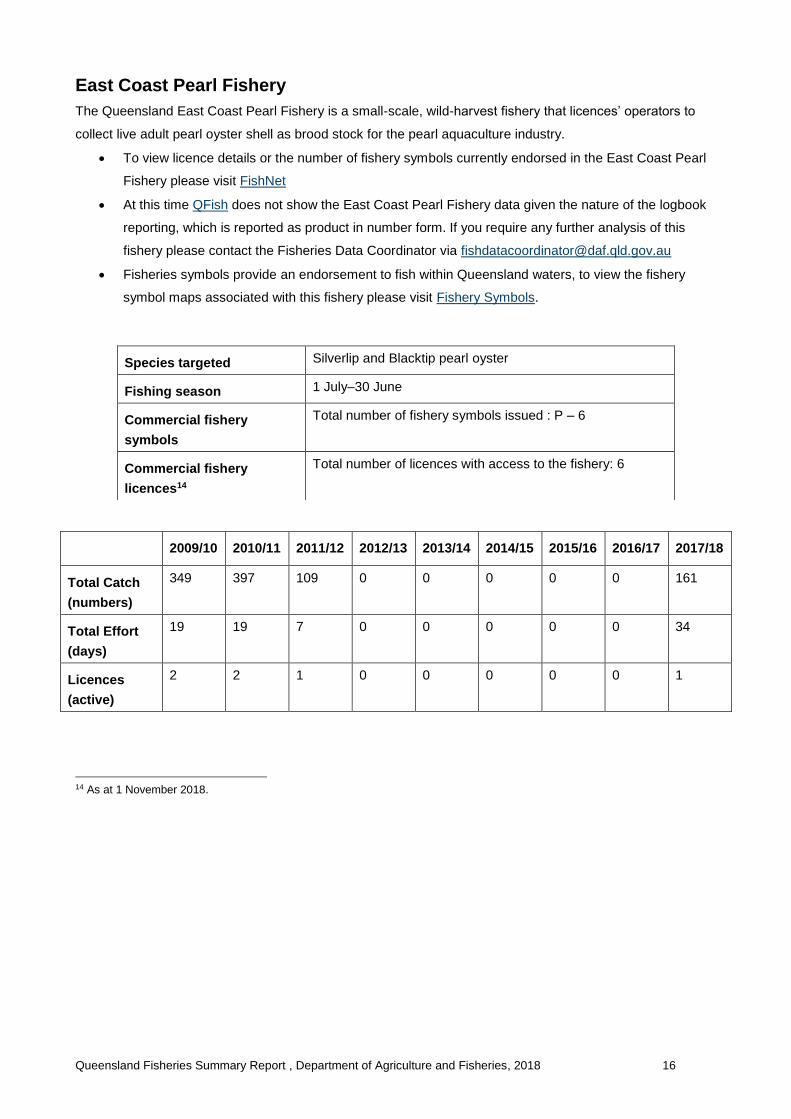
East Coast Pearl Fishery
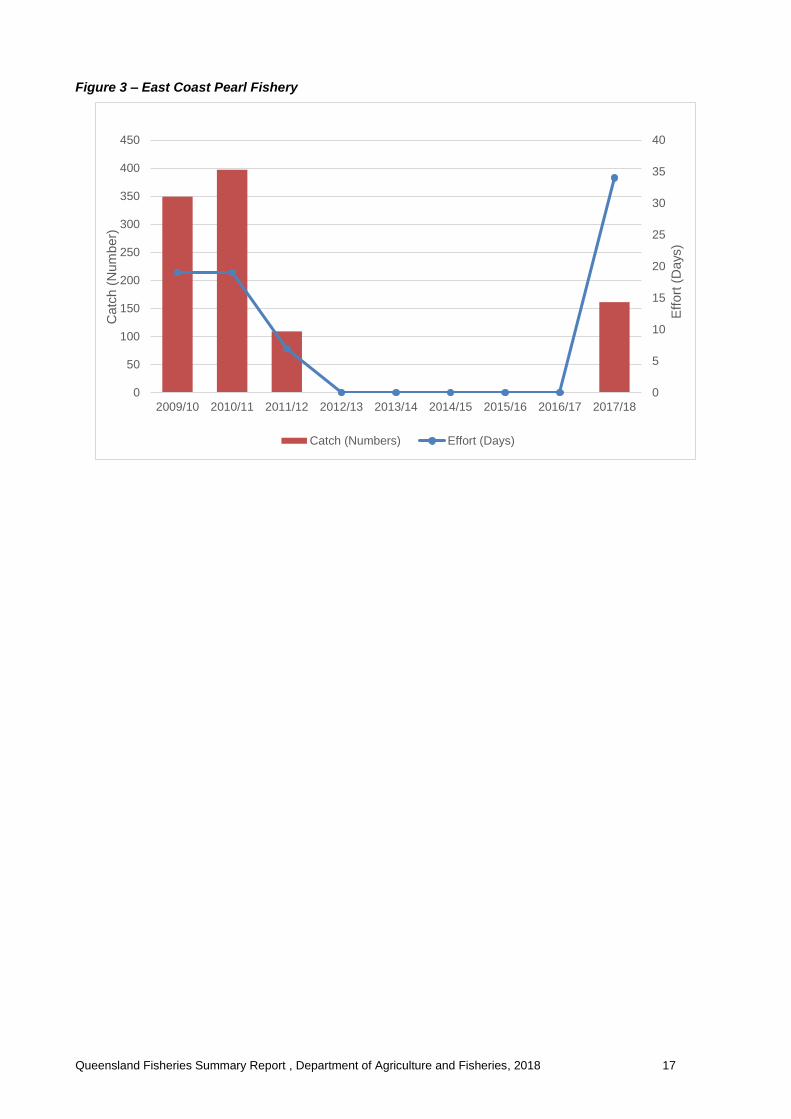
The Queensland East Coast Pearl Fishery is a small-scale, wild-harvest fishery that licences’ operators to
collect live adult pearl oyster shell as brood stock for the pearl aquaculture industry.
To view licence details or the number of fishery symbols currently endorsed in the East Coast Pearl
Fishery please visit FishNet
At this time QFish does not show the East Coast Pearl Fishery data given the nature of the logbook
reporting, which is reported as product in number form. If you require any further analysis of this
fishery please contact the Fisheries Data Coordinator via [email protected]
Fisheries symbols provide an endorsement to fish within Queensland waters, to view the fishery
symbol maps associated with this fishery please visit Fishery Symbols.
2009/10 2010/11 2011/12 2012/13 2013/14 2014/15 2015/16 2016/17 2017/18
Total Catch
(numbers)
349 397 109 0 0 0 0 0 161
Total Effort
(days)
19 19 7 0 0 0 0 0 34
Licences
(active)
2 2 1 0 0 0 0 0 1
14 As at 1 November 2018.
Species targeted Silverlip and Blacktip pearl oyster
Fishing season 1 July–30 June
Commercial fishery
symbols
Total number of fishery symbols issued : P – 6
Commercial fishery
licences14
Total number of licences with access to the fishery: 6
Queensland Fisheries Summary Report , Department of Agriculture and Fisheries, 2018 17
Figure 3 – East Coast Pearl Fishery
0
5
10
15
20
25
30
35
40
0
50
100
150
200
250
300
350
400
450
2009/10 2010/11 2011/12 2012/13 2013/14 2014/15 2015/16 2016/17 2017/18
Eff
ort
(D
ays
)
Catc
h (
Num
ber)
Catch (Numbers) Effort (Days)

Queensland Fisheries Summary Report , Department of Agriculture and Fisheries, 2018 18
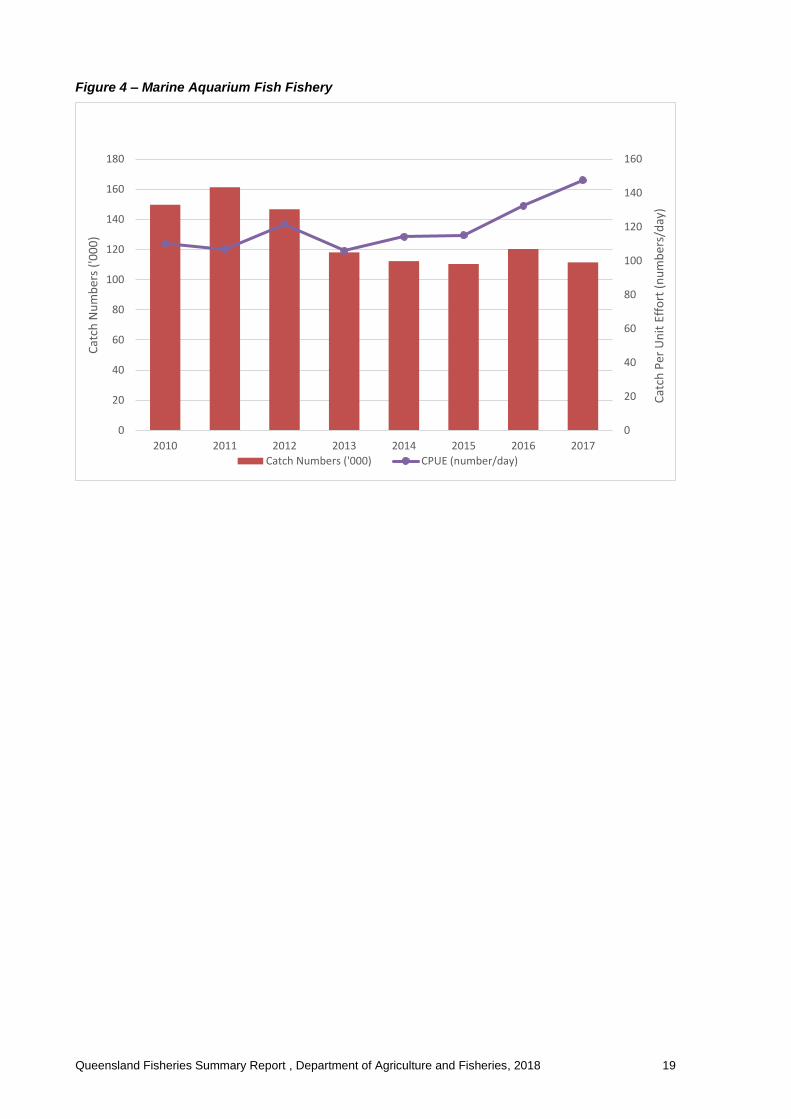
Marine Aquarium Fish Fishery
The Marine Aquarium Fish Fishery is one of a range of harvest (hand collection) fisheries managed by
Fisheries Queensland. The commercial fishery is focused on the collection of marine aquarium fish and
invertebrates that are marketed both domestically and internationally. Specimens can also be collected
recreationally for display in home aquariums.
To view licence details or the number of fishery symbols currently endorsed in the Marine Aquarium
Fish Fishery please visit FishNet
At this time QFish does not show the Marine Aquarium Fish Fishery data given the nature of the
logbook reporting, which is reported as product in number form. If you require any further analysis of
this fishery please contact the Fisheries Data Coordinator via [email protected]
Fisheries symbols provide an endorsement to fish within Queensland waters, to view the fishery
symbol maps associated with this fishery please visit Fishery Symbols.
15 As at 1 November 2018
Species targeted Damselfish and anemone fish (Family Pomacentridae)
Butterflyfish and bannerfish (Family Chaetodontidae)
Angelfish (Family Pomacanthidae)
Wrasses (Family Labridae)
Gobies (Family Gobiidae)
Fishing season 1 January – 31 December
Commercial fishery
symbols
Total number of fishery symbols issued: A1 – 42; A2 – 215
Commercial fishery
licences
Total number of licences with access to the fishery: 44
2010 2011 2012 2013 2014 2015 2016 2017
Total numbers (‘000) 150 161 147 118 112 110 120 111
Total effort (days) 1361 1509 1206 1116 984 959 909 755
Licences (active) 35 29 29 27 26 30 28 26
Cairns region (‘000) 44 53 50 42 38 40 36 32
Moreton Bay region
(‘000)
9 8 2 5 15 8 14 4
Sunshine coast region
(‘000)
28 29 17 9 10 10 7 7
Queensland Fisheries Summary Report , Department of Agriculture and Fisheries, 2018 19
Figure 4 – Marine Aquarium Fish Fishery
0
20
40
60
80
100
120
140
160
0
20
40
60
80
100
120
140
160
180
2010 2011 2012 2013 2014 2015 2016 2017
Cat
ch P
er U
nit
Eff
ort
(n
um
ber
s/d
ay)
Cat
ch N
um
ber
s ('
00
0)
Catch Numbers ('000) CPUE (number/day)
Queensland Fisheries Summary Report , Department of Agriculture and Fisheries, 2018 20
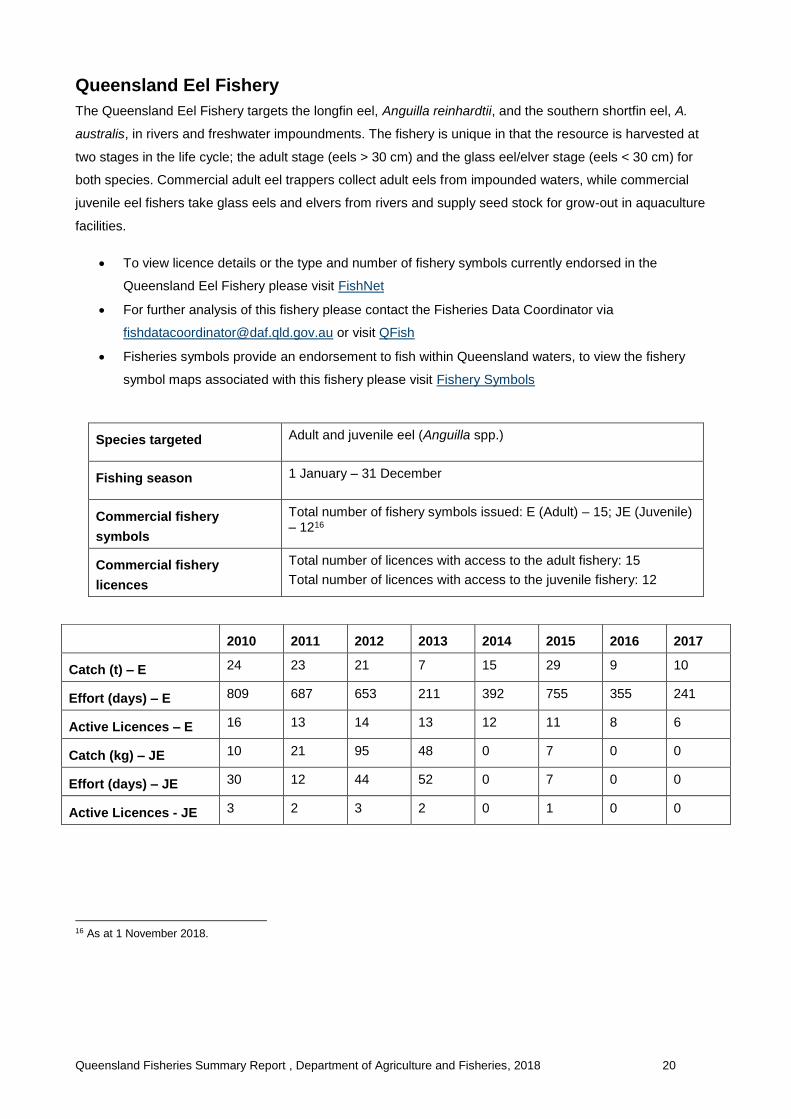
Queensland Eel Fishery
The Queensland Eel Fishery targets the longfin eel, Anguilla reinhardtii, and the southern shortfin eel, A.
australis, in rivers and freshwater impoundments. The fishery is unique in that the resource is harvested at
two stages in the life cycle; the adult stage (eels > 30 cm) and the glass eel/elver stage (eels < 30 cm) for
both species. Commercial adult eel trappers collect adult eels from impounded waters, while commercial
juvenile eel fishers take glass eels and elvers from rivers and supply seed stock for grow-out in aquaculture
facilities.
To view licence details or the type and number of fishery symbols currently endorsed in the
Queensland Eel Fishery please visit FishNet
For further analysis of this fishery please contact the Fisheries Data Coordinator via
[email protected] or visit QFish
Fisheries symbols provide an endorsement to fish within Queensland waters, to view the fishery
symbol maps associated with this fishery please visit Fishery Symbols
16 As at 1 November 2018.
Species targeted Adult and juvenile eel (Anguilla spp.)
Fishing season 1 January – 31 December
Commercial fishery
symbols
Total number of fishery symbols issued: E (Adult) – 15; JE (Juvenile) – 1216
Commercial fishery
licences
Total number of licences with access to the adult fishery: 15
Total number of licences with access to the juvenile fishery: 12
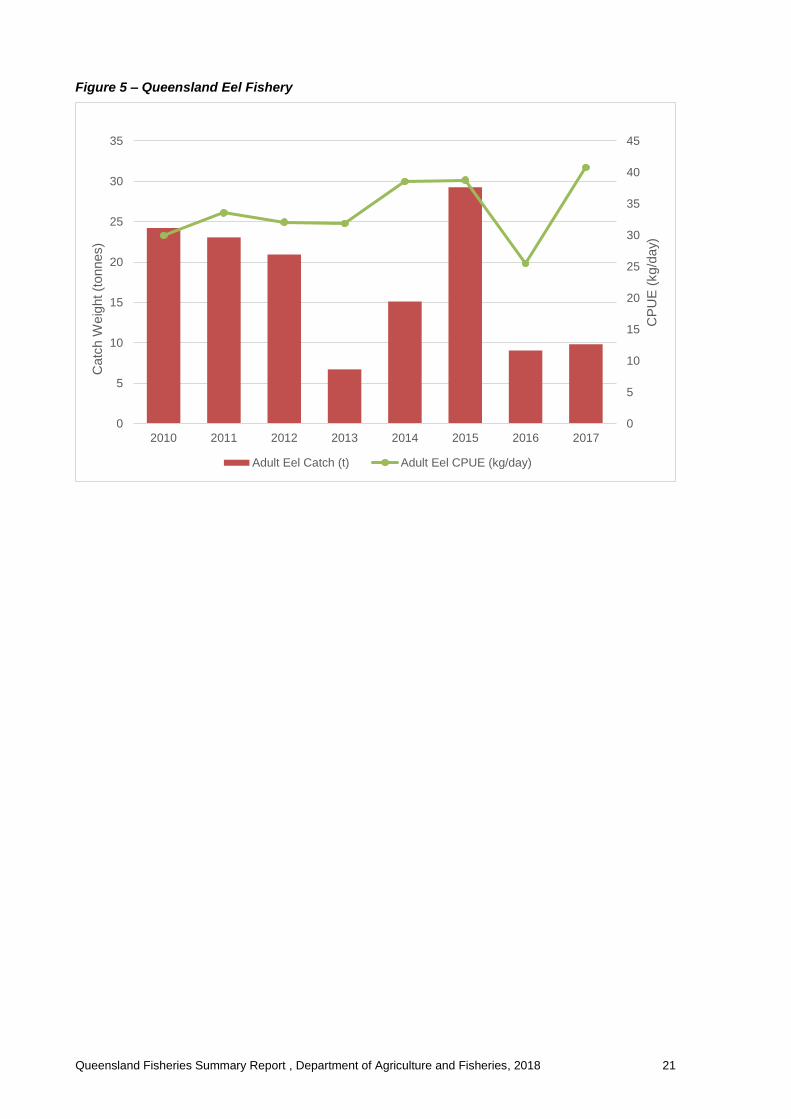
2010 2011 2012 2013 2014 2015 2016 2017
Catch (t) – E 24 23 21 7 15 29 9 10
Effort (days) – E 809 687 653 211 392 755 355 241
Active Licences – E 16 13 14 13 12 11 8 6
Catch (kg) – JE 10 21 95 48 0 7 0 0
Effort (days) – JE 30 12 44 52 0 7 0 0
Active Licences - JE 3 2 3 2 0 1 0 0
Queensland Fisheries Summary Report , Department of Agriculture and Fisheries, 2018 21
Figure 5 – Queensland Eel Fishery
0
5
10
15
20
25
30
35
40
45
0
5
10
15
20
25
30
35
2010 2011 2012 2013 2014 2015 2016 2017
CP
UE
(kg/d
ay)
Catc
h W
eig
ht (t
onnes)
Adult Eel Catch (t) Adult Eel CPUE (kg/day)
Queensland Fisheries Summary Report , Department of Agriculture and Fisheries, 2018 22
East Coast Sea Cucumber (beche-de-mer) Fishery
The East Coast Sea Cucumber Fishery has Total Allowable Commercial Catch (TACC) divided among symbol
holders using an individual transferable quota (ITQ) system.
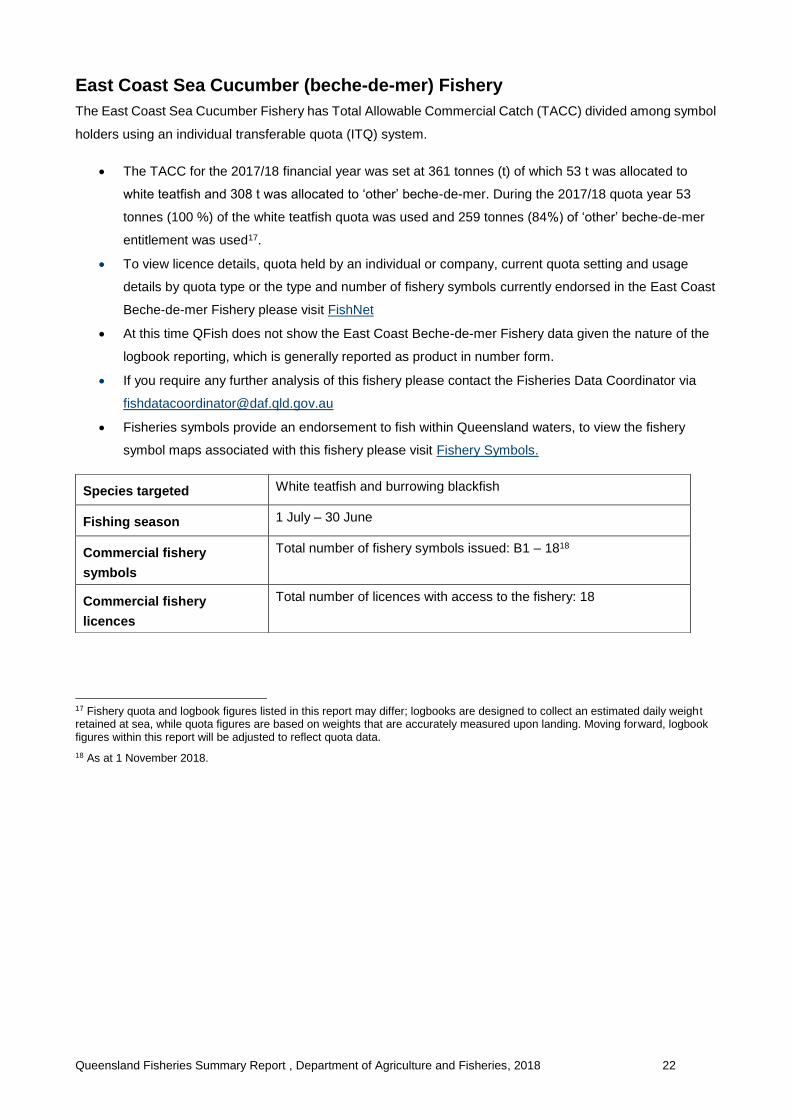
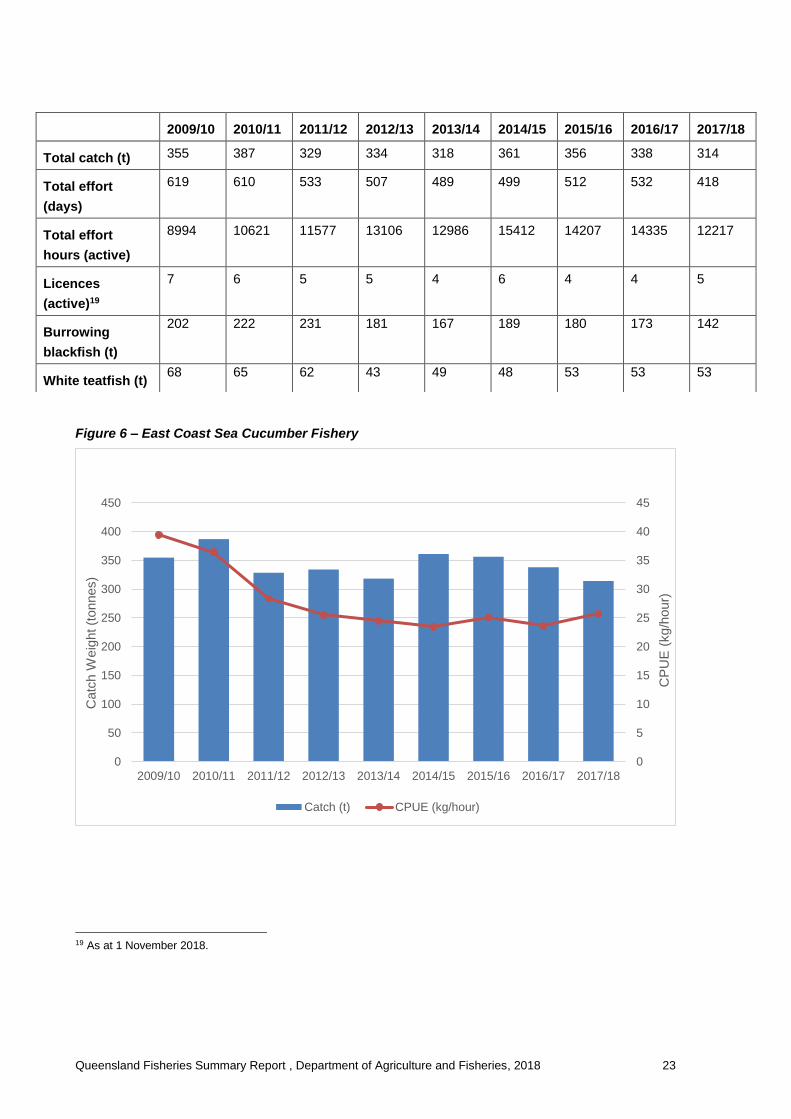
The TACC for the 2017/18 financial year was set at 361 tonnes (t) of which 53 t was allocated to
white teatfish and 308 t was allocated to ‘other’ beche-de-mer. During the 2017/18 quota year 53
tonnes (100 %) of the white teatfish quota was used and 259 tonnes (84%) of ‘other’ beche-de-mer
entitlement was used17.
To view licence details, quota held by an individual or company, current quota setting and usage
details by quota type or the type and number of fishery symbols currently endorsed in the East Coast
Beche-de-mer Fishery please visit FishNet
At this time QFish does not show the East Coast Beche-de-mer Fishery data given the nature of the
logbook reporting, which is generally reported as product in number form.
If you require any further analysis of this fishery please contact the Fisheries Data Coordinator via
Fisheries symbols provide an endorsement to fish within Queensland waters, to view the fishery
symbol maps associated with this fishery please visit Fishery Symbols.
17 Fishery quota and logbook figures listed in this report may differ; logbooks are designed to collect an estimated daily weight retained at sea, while quota figures are based on weights that are accurately measured upon landing. Moving forward, logbook figures within this report will be adjusted to reflect quota data.
18 As at 1 November 2018.
Species targeted White teatfish and burrowing blackfish
Fishing season 1 July – 30 June
Commercial fishery
symbols
Total number of fishery symbols issued: B1 – 1818
Commercial fishery
licences
Total number of licences with access to the fishery: 18
Queensland Fisheries Summary Report , Department of Agriculture and Fisheries, 2018 23
Figure 6 – East Coast Sea Cucumber Fishery
19 As at 1 November 2018.
0
5
10
15
20
25
30
35
40
45
0
50
100
150
200
250
300
350
400
450
2009/10 2010/11 2011/12 2012/13 2013/14 2014/15 2015/16 2016/17 2017/18
CP
UE
(kg/h
our)
Catc
h W
eig
ht (t
onnes)
Catch (t) CPUE (kg/hour)
2009/10 2010/11 2011/12 2012/13 2013/14 2014/15 2015/16 2016/17 2017/18
Total catch (t) 355 387 329 334 318 361 356 338 314
Total effort
(days)
619 610 533 507 489 499 512 532 418
Total effort
hours (active)
8994 10621 11577 13106 12986 15412 14207 14335 12217
Licences
(active)19
7 6 5 5 4 6 4 4 5
Burrowing
blackfish (t)
202 222 231 181 167 189 180 173 142
White teatfish (t) 68 65 62 43 49 48 53 53 53

Queensland Fisheries Summary Report , Department of Agriculture and Fisheries, 2018 24
Trochus Fishery
The commercial Trochus Fishery is based on the collection of one species of trochus - Trochus niloticus.
Trochus; also known as topshells or topsnails, are targeted for their shells, which contain a layer of mother-
of-pearl. The shell is used both domestically and internationally in the manufacture of jewellery, buttons,
ornaments and cosmetics. Trochus meat is of secondary value to the shell. There has been no activity in this
fishery for the previous two financial years; harvest trends have historically been driven by price fluctuations
and market demand.
20 As at 1 November 2018.
Species targeted Trochus (Trochus niloticus)
Fishing season 1 January – 31 December (collection effort concentrated August–February)
Commercial fishery
symbols
Total number of fishery symbols issued : J1 – 620
Commercial fishery
licences
Total number of licences with access to the fishery : 6
2009/10 2010/11 2011/12 2012/13 2013/14 2014/15 2015/16 2016/17 2017/18
Total
catch (t)
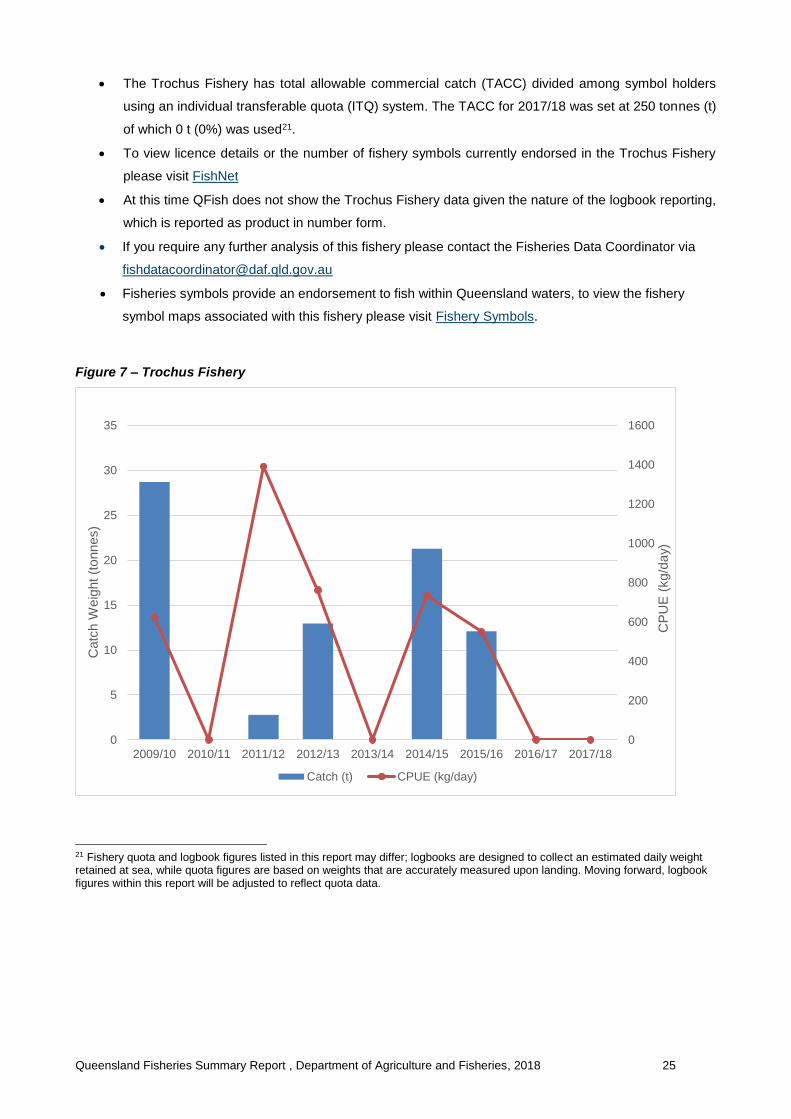
29 0 3 13 0 21 12 0 0
Total
effort
(days)
46 0 2 17 0 29 22 0 0
Licences
(active)
1 0 1 1 0 1 1 0 0
Queensland Fisheries Summary Report , Department of Agriculture and Fisheries, 2018 25
The Trochus Fishery has total allowable commercial catch (TACC) divided among symbol holders
using an individual transferable quota (ITQ) system. The TACC for 2017/18 was set at 250 tonnes (t)
of which 0 t (0%) was used21.
To view licence details or the number of fishery symbols currently endorsed in the Trochus Fishery
please visit FishNet
At this time QFish does not show the Trochus Fishery data given the nature of the logbook reporting,
which is reported as product in number form.
If you require any further analysis of this fishery please contact the Fisheries Data Coordinator via
Fisheries symbols provide an endorsement to fish within Queensland waters, to view the fishery
symbol maps associated with this fishery please visit Fishery Symbols.
Figure 7 – Trochus Fishery
21 Fishery quota and logbook figures listed in this report may differ; logbooks are designed to collect an estimated daily weight retained at sea, while quota figures are based on weights that are accurately measured upon landing. Moving forward, logbook figures within this report will be adjusted to reflect quota data.
0
200
400
600
800
1000
1200
1400
1600
0
5
10
15
20
25
30
35
2009/10 2010/11 2011/12 2012/13 2013/14 2014/15 2015/16 2016/17 2017/18
CP
UE
(kg/d
ay)
Catc
h W
eig
ht (t
onnes)
Catch (t) CPUE (kg/day)
Queensland Fisheries Summary Report , Department of Agriculture and Fisheries, 2018 26
Line fisheries
Coral Reef Fin Fish Fishery
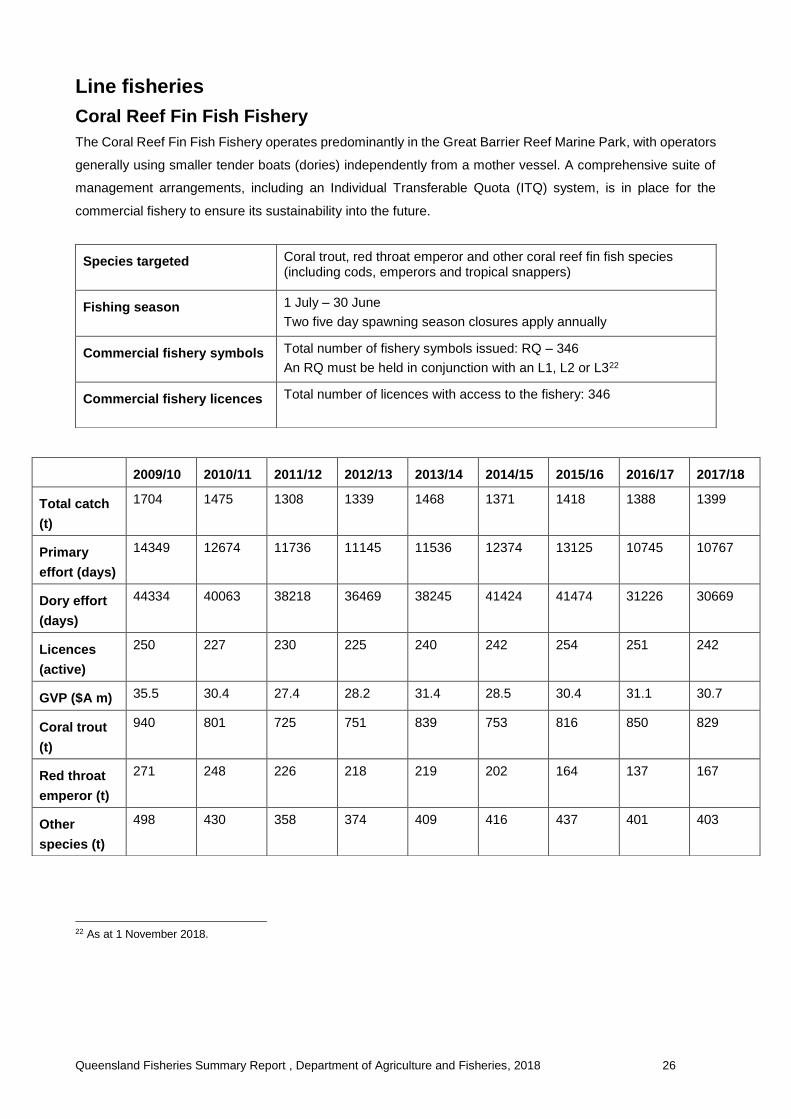
The Coral Reef Fin Fish Fishery operates predominantly in the Great Barrier Reef Marine Park, with operators
generally using smaller tender boats (dories) independently from a mother vessel. A comprehensive suite of
management arrangements, including an Individual Transferable Quota (ITQ) system, is in place for the
commercial fishery to ensure its sustainability into the future.
22 As at 1 November 2018.
Species targeted Coral trout, red throat emperor and other coral reef fin fish species (including cods, emperors and tropical snappers)
Fishing season 1 July – 30 June
Two five day spawning season closures apply annually
Commercial fishery symbols Total number of fishery symbols issued: RQ – 346
An RQ must be held in conjunction with an L1, L2 or L322
Commercial fishery licences Total number of licences with access to the fishery: 346
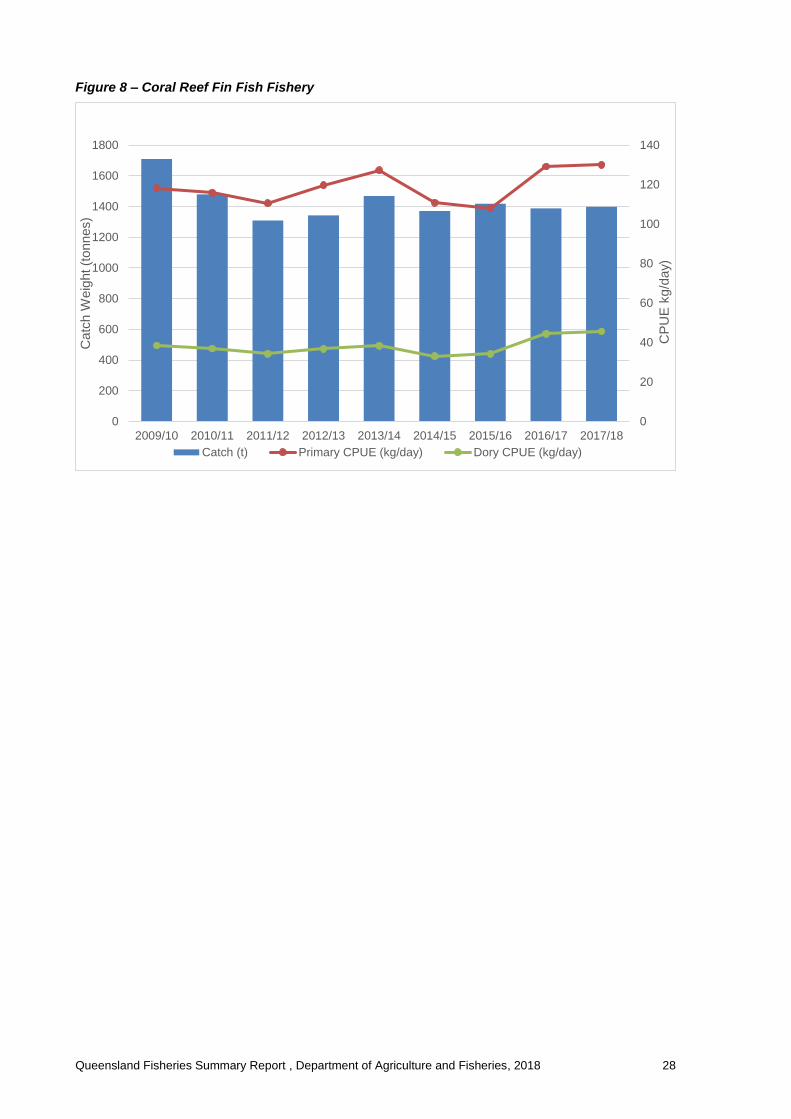
2009/10 2010/11 2011/12 2012/13 2013/14 2014/15 2015/16 2016/17 2017/18
Total catch
(t)
1704 1475 1308 1339 1468 1371 1418 1388 1399
Primary
effort (days)
14349 12674 11736 11145 11536 12374 13125 10745 10767
Dory effort
(days)
44334 40063 38218 36469 38245 41424 41474 31226 30669
Licences
(active)
250 227 230 225 240 242 254 251 242
GVP ($A m) 35.5 30.4 27.4 28.2 31.4 28.5 30.4 31.1 30.7
Coral trout
(t)
940 801 725 751 839 753 816 850 829
Red throat
emperor (t)
271 248 226 218 219 202 164 137 167
Other
species (t)
498 430 358 374 409 416 437 401 403

Queensland Fisheries Summary Report , Department of Agriculture and Fisheries, 2018 27
The Coral Reef Fin Fish Fishery has a total allowable commercial catch (TACC) divided among symbol
holders using an individual transferable quota (ITQ) system.
Annual commercial catch and effort information for the CRFFF has historically been variable in
response to changes in management arrangements.
Since the introduction of the Coral Reef Finfish Fishery Management Plan 2003, catch and nominal
catch per unit effort (CPUE) of Coral Trout increased steadily until 2009/10 when the first decline since
the introduction of quota was recorded. This decline is likely related to delayed effects of Tropical
Cyclone Hamish which traversed offshore reefs between Bowen and the Swains reefs region in March
2009.
The 2017/18 TACC was set at 963 tonnes for coral trout, 611 tonnes for red throat emperor and 956
tonnes for other coral reef fin fish species.
Of the 2017/18 quota entitlements 889 tonnes (92.5 %), 150 tonnes (24.5 %) and 434 tonnes (45.5
%) of the coral trout, red throat emperor and other species quotas were utilised respectively23.
It should be noted that the quota arrangements for Coral Trout have changed over the past few years,
which is indicative in the catches of this species recorded in the data displayed above.
Coral Trout quota was set at 1350 tonnes in 2004 – 2012 and was then reduced to 1088 tonnes from
2013 – 2014. Further reductions in quota occurred in 2015 – 2016 (917 tonnes). The quota for the
recently completed quota season (2017–2018) increased to 963 tonnes and again to 1163 tonnes for
the current (2018-2019) quota season.
Each year Fisheries Queensland assesses the exploitation status (stock status) of Queensland’s key
fish stocks. To view outcomes of the most recent stock status assessment of key species like coral
trout and red throat emperor please visit http://www.daf.qld.gov.au/fisheries/monitoring-our-
fisheries/data-reports/sustainability-reporting/stock-status-assessments
To view licence details, quota held by an individual or company, current quota setting and usage details
by quota type or the type and number of fishery symbols currently endorsed in the Coral Reef Fin Fish
Fishery please visit FishNet
For further analysis of the Coral Reef Fin Fish Fishery please visit QFish
Please note that this query has selected for line catch and effort within the GBRMPA which may not
include all RQ species and alternatively may include some non-RQ species.
Fisheries symbols provide an endorsement to fish within Queensland waters, to view the fishery
symbol maps associated with this fishery please visit Fishery Symbols.
23 Fishery quota and logbook figures listed in this report may differ; logbooks are designed to collect an estimated daily weight retained at sea, while quota figures are based on weights that are accurately measured upon landing. Moving forward, logbook figures within this report will be adjusted to reflect quota data.
Queensland Fisheries Summary Report , Department of Agriculture and Fisheries, 2018 28
Figure 8 – Coral Reef Fin Fish Fishery
0
20
40
60
80
100
120
140
0
200
400
600
800
1000
1200
1400
1600
1800
2009/10 2010/11 2011/12 2012/13 2013/14 2014/15 2015/16 2016/17 2017/18
CP
UE
kg/d
ay)
Catc
h W
eig
ht (t
onnes)
Catch (t) Primary CPUE (kg/day) Dory CPUE (kg/day)
Queensland Fisheries Summary Report , Department of Agriculture and Fisheries, 2018 29
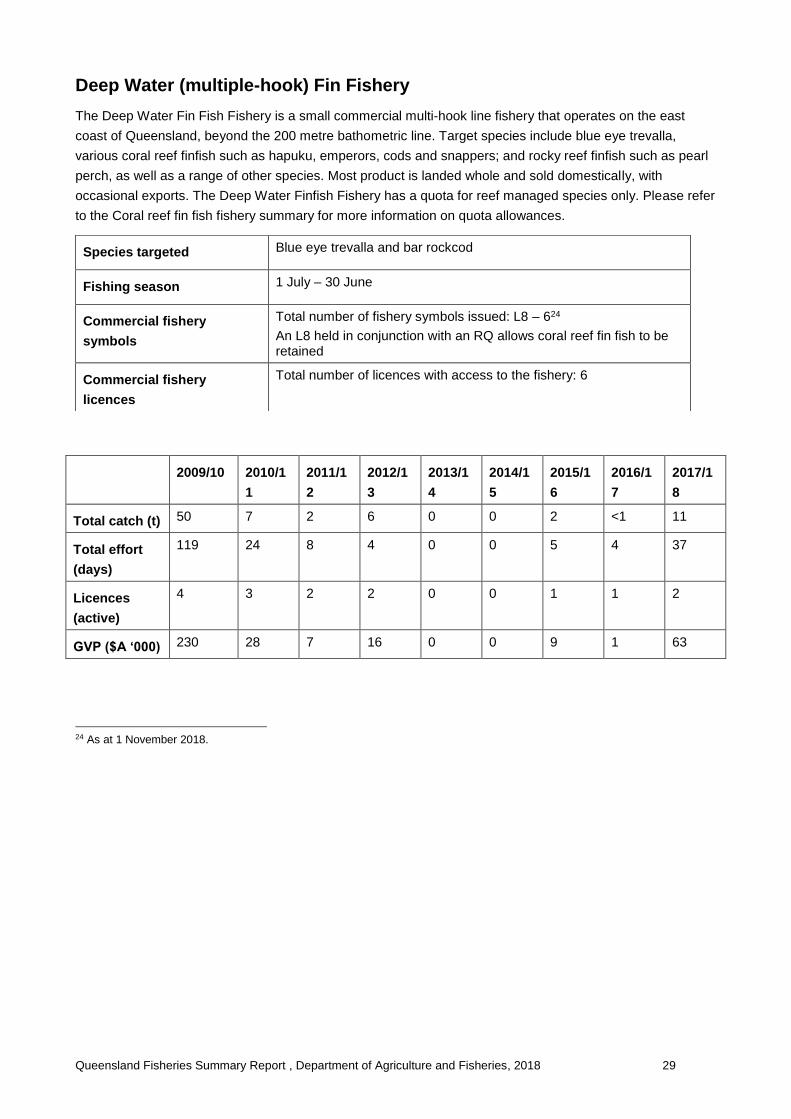
Deep Water (multiple-hook) Fin Fishery
The Deep Water Fin Fish Fishery is a small commercial multi-hook line fishery that operates on the east
coast of Queensland, beyond the 200 metre bathometric line. Target species include blue eye trevalla,
various coral reef finfish such as hapuku, emperors, cods and snappers; and rocky reef finfish such as pearl
perch, as well as a range of other species. Most product is landed whole and sold domestically, with
occasional exports. The Deep Water Finfish Fishery has a quota for reef managed species only. Please refer
to the Coral reef fin fish fishery summary for more information on quota allowances.
24 As at 1 November 2018.
Species targeted Blue eye trevalla and bar rockcod
Fishing season 1 July – 30 June
Commercial fishery
symbols
Total number of fishery symbols issued: L8 – 624
An L8 held in conjunction with an RQ allows coral reef fin fish to be retained
Commercial fishery
licences
Total number of licences with access to the fishery: 6
2009/10 2010/1
1
2011/1
2
2012/1
3
2013/1
4
2014/1
5
2015/1
6
2016/1
7
2017/1
8
Total catch (t) 50 7 2 6 0 0 2 <1 11
Total effort
(days)
119 24 8 4 0 0 5 4 37
Licences
(active)
4 3 2 2 0 0 1 1 2
GVP ($A ‘000) 230 28 7 16 0 0 9 1 63
Queensland Fisheries Summary Report , Department of Agriculture and Fisheries, 2018 30
Please note the following:
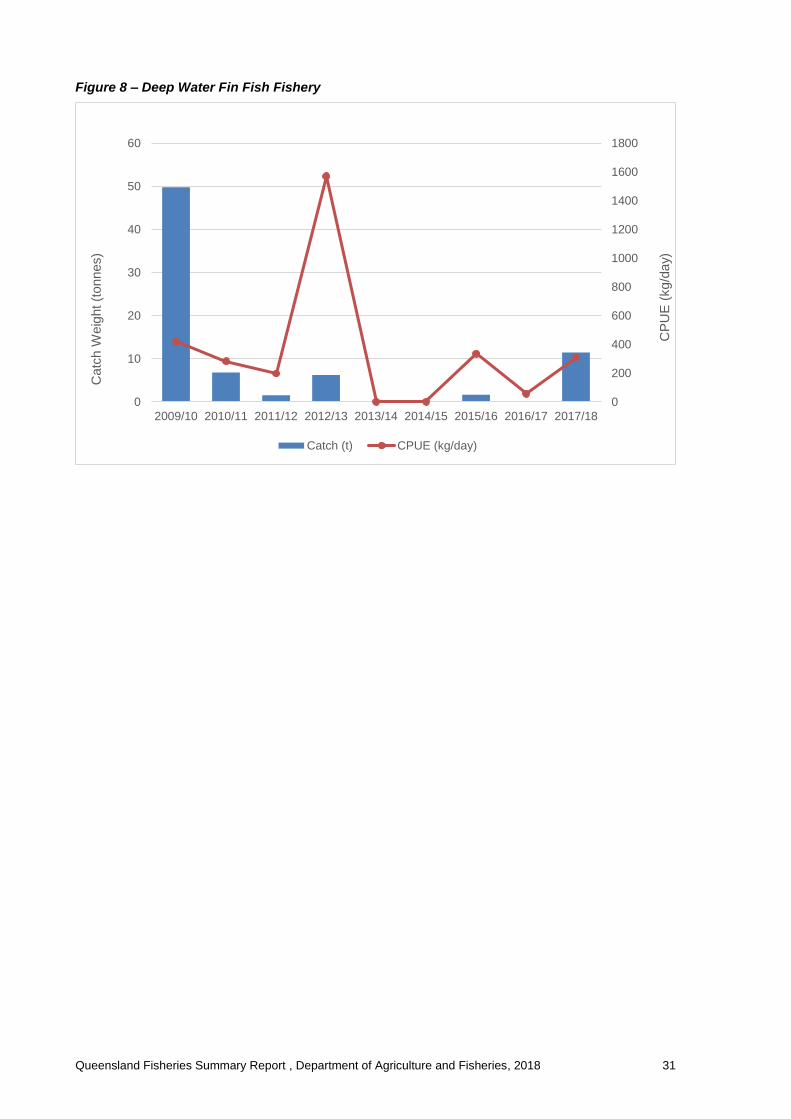
Prior to 2009/10 data extraction for the Deep Water Finfish Fishery was extremely difficult due to the
nature of reporting by fishers. This has since been remedied through the introduction of a multi-hook
(MH) logbook; all logbook catch and effort pertaining to the Deep Water Finfish Fishery is now reported
through this single logbook.
During the 2013/14 and 2014/15 financial years, no fishing activity was reported by licences operating
in the Deep Water Finfish Fishery.
At this time, through QFish it is not possible to accurately represent catch and effort data for the Deep
Water Finfish Fishery; a higher level of specificity is required to accurately reflect the fisheries
characteristics.
If you require any further analysis of this fishery please contact the Fisheries Data Coordinator via
To view licence details or the number of fishery symbols currently endorsed in Deep Water Finfish
Fishery please visit FishNet
Each year Fisheries Queensland assesses the exploitation status (stock status) of Queensland’s key
fish stocks. To view outcomes of the most recent stock status assessment for species which are caught
in the Deep Water Finfish Fishery please visit
http://www.daf.qld.gov.au/fisheries/monitoring-our-fisheries/data-reports/sustainability-
reporting/stock-status-assessments
Fisheries symbols provide an endorsement to fish within Queensland waters, to view the fishery
symbol maps associated with this fishery please visit Fishery Symbols.
Queensland Fisheries Summary Report , Department of Agriculture and Fisheries, 2018 31
Figure 8 – Deep Water Fin Fish Fishery
0
200
400
600
800
1000
1200
1400
1600
1800
0
10
20
30
40
50
60
2009/10 2010/11 2011/12 2012/13 2013/14 2014/15 2015/16 2016/17 2017/18
CP
UE
(kg/d
ay)
Catc
h W
eig
ht (t
onnes)
Catch (t) CPUE (kg/day)
Queensland Fisheries Summary Report , Department of Agriculture and Fisheries, 2018 32
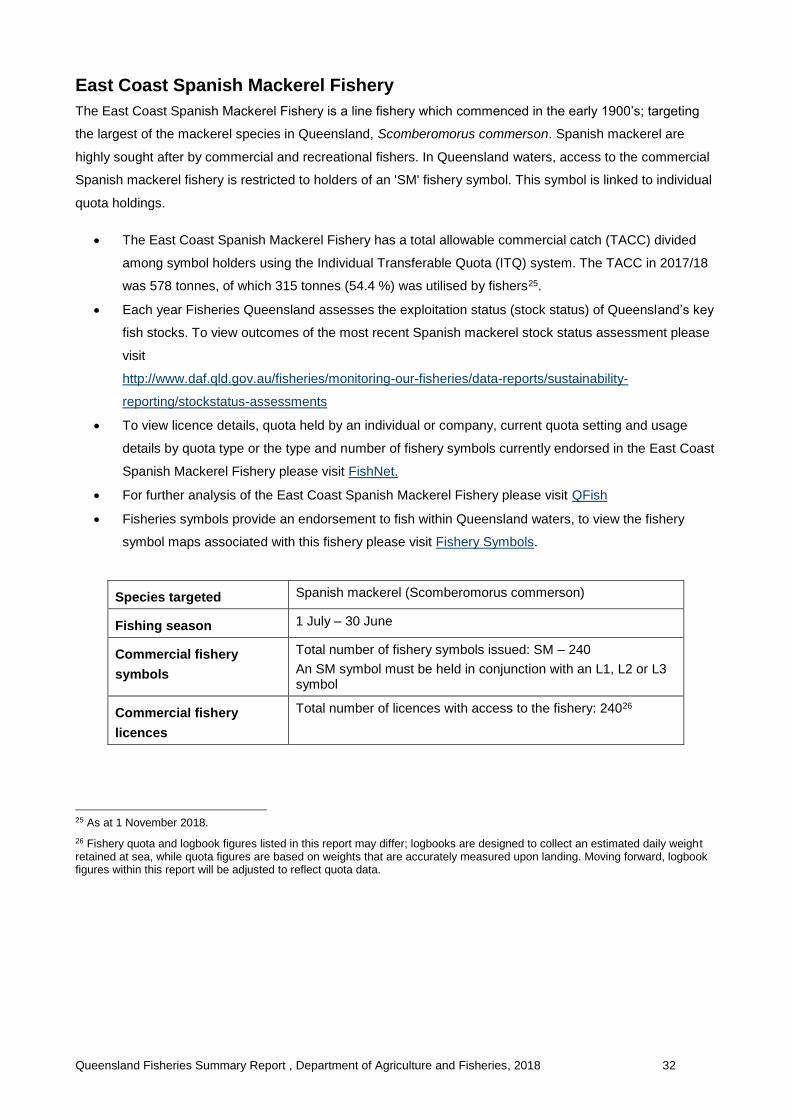
East Coast Spanish Mackerel Fishery
The East Coast Spanish Mackerel Fishery is a line fishery which commenced in the early 1900’s; targeting
the largest of the mackerel species in Queensland, Scomberomorus commerson. Spanish mackerel are
highly sought after by commercial and recreational fishers. In Queensland waters, access to the commercial
Spanish mackerel fishery is restricted to holders of an 'SM' fishery symbol. This symbol is linked to individual
quota holdings.
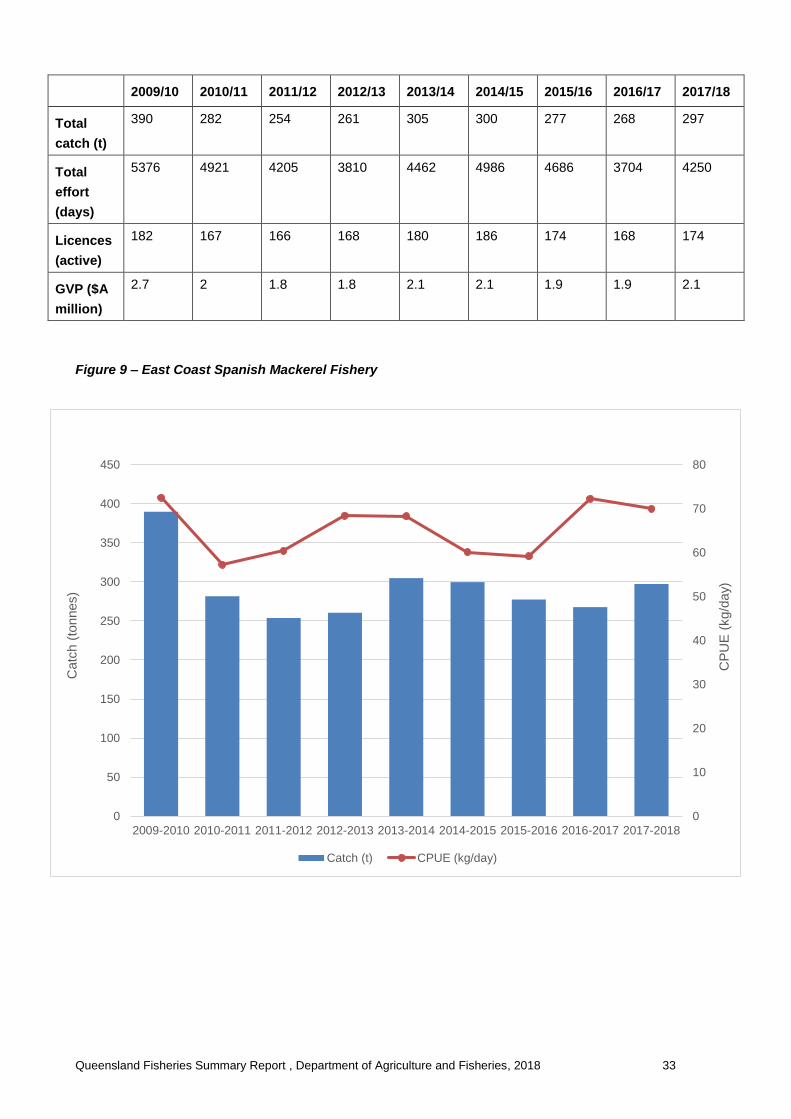
The East Coast Spanish Mackerel Fishery has a total allowable commercial catch (TACC) divided
among symbol holders using the Individual Transferable Quota (ITQ) system. The TACC in 2017/18
was 578 tonnes, of which 315 tonnes (54.4 %) was utilised by fishers25.
Each year Fisheries Queensland assesses the exploitation status (stock status) of Queensland’s key
fish stocks. To view outcomes of the most recent Spanish mackerel stock status assessment please
visit
http://www.daf.qld.gov.au/fisheries/monitoring-our-fisheries/data-reports/sustainability-
reporting/stockstatus-assessments
To view licence details, quota held by an individual or company, current quota setting and usage
details by quota type or the type and number of fishery symbols currently endorsed in the East Coast
Spanish Mackerel Fishery please visit FishNet.
For further analysis of the East Coast Spanish Mackerel Fishery please visit QFish
Fisheries symbols provide an endorsement to fish within Queensland waters, to view the fishery
symbol maps associated with this fishery please visit Fishery Symbols.
25 As at 1 November 2018.
26 Fishery quota and logbook figures listed in this report may differ; logbooks are designed to collect an estimated daily weight retained at sea, while quota figures are based on weights that are accurately measured upon landing. Moving forward, logbook figures within this report will be adjusted to reflect quota data.
Species targeted Spanish mackerel (Scomberomorus commerson)
Fishing season 1 July – 30 June
Commercial fishery
symbols
Total number of fishery symbols issued: SM – 240
An SM symbol must be held in conjunction with an L1, L2 or L3 symbol
Commercial fishery
licences
Total number of licences with access to the fishery: 24026
Queensland Fisheries Summary Report , Department of Agriculture and Fisheries, 2018 33
2009/10 2010/11 2011/12 2012/13 2013/14 2014/15 2015/16 2016/17 2017/18
Total
catch (t)
390 282 254 261 305 300 277 268 297
Total
effort
(days)
5376 4921 4205 3810 4462 4986 4686 3704 4250
Licences
(active)
182 167 166 168 180 186 174 168 174
GVP ($A
million)
2.7 2 1.8 1.8 2.1 2.1 1.9 1.9 2.1
Figure 9 – East Coast Spanish Mackerel Fishery
0
10
20
30
40
50
60
70
80
0
50
100
150
200
250
300
350
400
450
2009-2010 2010-2011 2011-2012 2012-2013 2013-2014 2014-2015 2015-2016 2016-2017 2017-2018
CP
UE
(kg/d
ay)
Catc
h (
tonnes)
Catch (t) CPUE (kg/day)
Queensland Fisheries Summary Report , Department of Agriculture and Fisheries, 2018 34
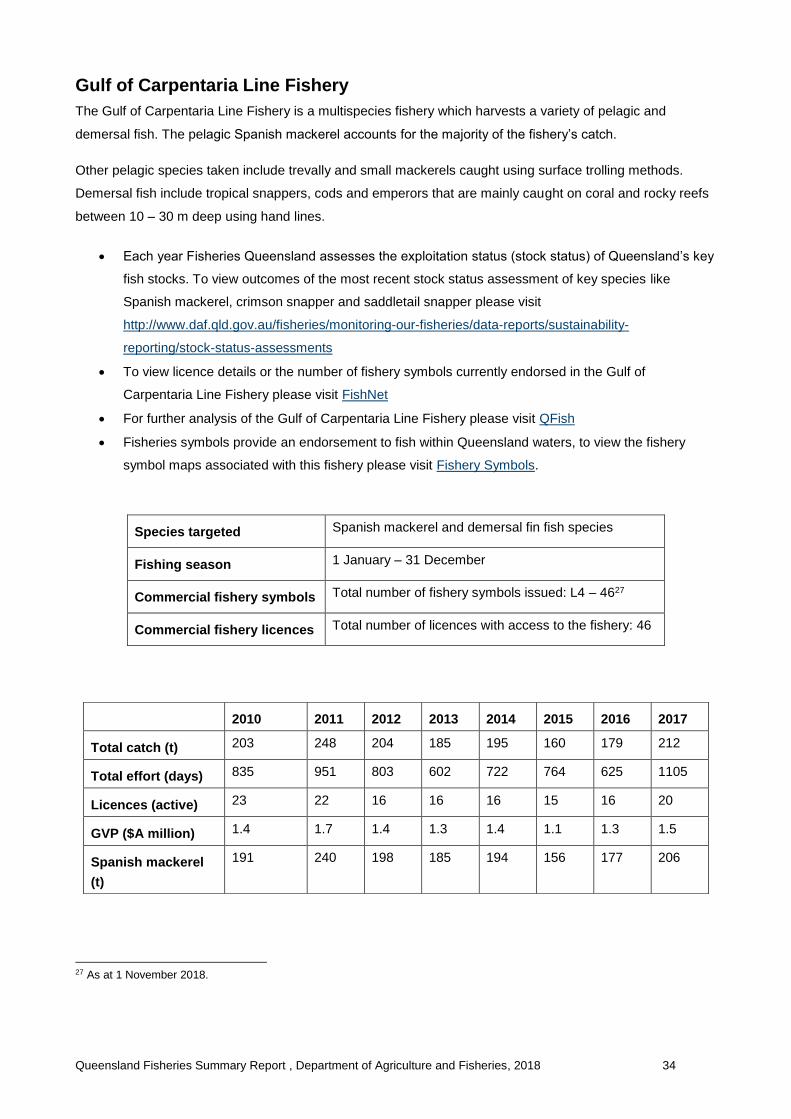
Gulf of Carpentaria Line Fishery
The Gulf of Carpentaria Line Fishery is a multispecies fishery which harvests a variety of pelagic and
demersal fish. The pelagic Spanish mackerel accounts for the majority of the fishery’s catch.
Other pelagic species taken include trevally and small mackerels caught using surface trolling methods.
Demersal fish include tropical snappers, cods and emperors that are mainly caught on coral and rocky reefs
between 10 – 30 m deep using hand lines.
Each year Fisheries Queensland assesses the exploitation status (stock status) of Queensland’s key
fish stocks. To view outcomes of the most recent stock status assessment of key species like
Spanish mackerel, crimson snapper and saddletail snapper please visit
http://www.daf.qld.gov.au/fisheries/monitoring-our-fisheries/data-reports/sustainability-
reporting/stock-status-assessments
To view licence details or the number of fishery symbols currently endorsed in the Gulf of
Carpentaria Line Fishery please visit FishNet
For further analysis of the Gulf of Carpentaria Line Fishery please visit QFish
Fisheries symbols provide an endorsement to fish within Queensland waters, to view the fishery
symbol maps associated with this fishery please visit Fishery Symbols.
27 As at 1 November 2018.
Species targeted Spanish mackerel and demersal fin fish species
Fishing season 1 January – 31 December
Commercial fishery symbols Total number of fishery symbols issued: L4 – 4627
Commercial fishery licences Total number of licences with access to the fishery: 46
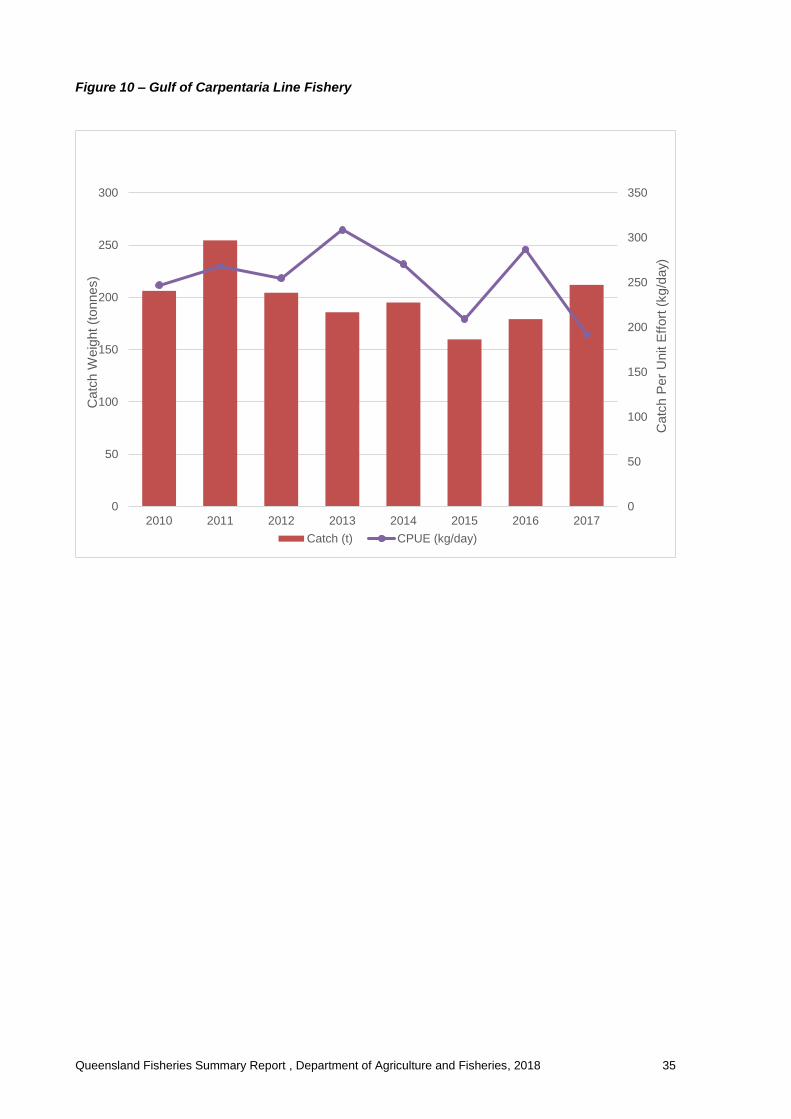
2010 2011 2012 2013 2014 2015 2016 2017
Total catch (t) 203 248 204 185 195 160 179 212
Total effort (days) 835 951 803 602 722 764 625 1105
Licences (active) 23 22 16 16 16 15 16 20
GVP ($A million) 1.4 1.7 1.4 1.3 1.4 1.1 1.3 1.5
Spanish mackerel
(t)
191 240 198 185 194 156 177 206
Queensland Fisheries Summary Report , Department of Agriculture and Fisheries, 2018 35
Figure 10 – Gulf of Carpentaria Line Fishery
0
50
100
150
200
250
300
350
0
50
100
150
200
250
300
2010 2011 2012 2013 2014 2015 2016 2017
Catc
h P
er
Unit E
ffort
(kg/d
ay)
Catc
h W
eig
ht (t
onnes)
Catch (t) CPUE (kg/day)

Queensland Fisheries Summary Report , Department of Agriculture and Fisheries, 2018 36
Rocky Reef Fin Fish Fishery
The Rocky Reef Finfish Fishery mainly targets snapper (Pagrus auratus). Other key secondary species include
pearl perch (Glaucosoma scapulare) and teraglin (Atractoscion aequidens). Most rocky reef fin fish are taken
in south east Queensland, which can be fished by commercial operators in possession of an L1 fishery symbol.
Effort is concentrated in waters from Baffle Creek (24.5°S) south to the New South Wales border. However,
fishers are permitted to harvest rocky reef finfish species throughout Queensland waters provided they have
the appropriate L2 or L3 endorsement.
28 As at 1 November 2018.
Species targeted Snapper and pearl perch
Fishing season 1 January – 31 December (peak during winter months)
Commercial fishery
symbols
Total number of fishery symbols issued : L1 – 225; L2 – 190; L3 – 93128
Commercial fishery
licences
Total number of licences with access to the fishery: 1135
2010 2011 2012 2013 2014 2015 2016 2017
Total catch (t) 217 174 144 121 133 140 139 132
Total effort (days) 5007 4247 3790 3521 3994 4119 4426 4127
Licences (active) 283 286 256 270 285 286 273 274
GVP ($A million) 1.3 1.1 0.9 0.8 0.8 0.9 0.9 0.8
Snapper (t) 77 66 60 55 57 61 66 55
Pearl perch (t) 33 25 24 18 19 20 20 17

Queensland Fisheries Summary Report , Department of Agriculture and Fisheries, 2018 37
Figure 11 – Rocky Reef Fin Fish Fishery
Each year Fisheries Queensland assesses the exploitation status (stock status) of Queensland’s key
fish stocks.
To view outcomes of the most recent stock status assessments for key species like snapper and pearl
perch please visit
http://www.daf.qld.gov.au/fisheries/monitoringourfisheries/datareports/sustainabilityreporting/stock-
status-assessments
To view licence details or the number of fishery symbols currently endorsed in the Rocky Reef Fin
Fish Fishery please visit FishNet
For further analysis of the Rocky Reef Fin Fish Fishery please visit QFish
Fisheries symbols provide an endorsement to fish within Queensland waters, to view the fishery
symbol maps associated with this fishery please visit Fishery Symbols.
0
5
10
15
20
25
30
35
40
45
50
0
50
100
150
200
250
2010 2011 2012 2013 2014 2015 2016 2017
CP
UE
(kg/d
ay)
Catc
h W
eig
ht (t
onnes)
Catch (t) CPUE (kg/day)
Net fisheries
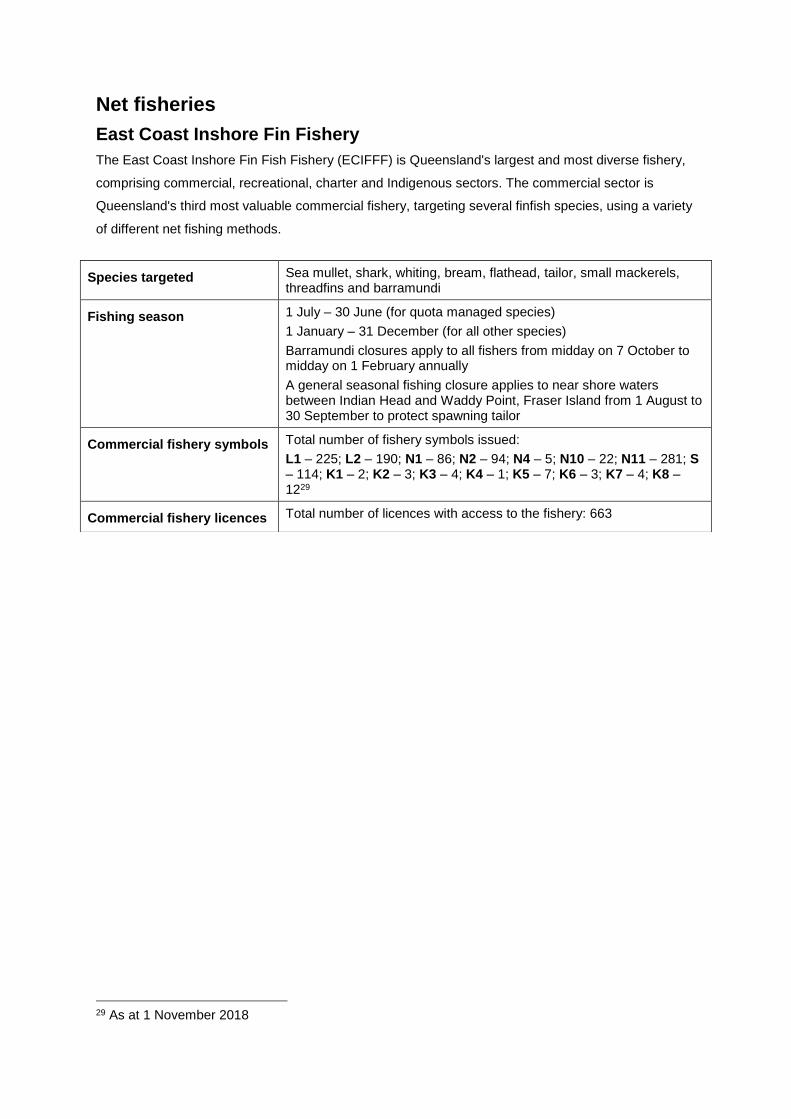
East Coast Inshore Fin Fishery
The East Coast Inshore Fin Fish Fishery (ECIFFF) is Queensland's largest and most diverse fishery,
comprising commercial, recreational, charter and Indigenous sectors. The commercial sector is
Queensland's third most valuable commercial fishery, targeting several finfish species, using a variety
of different net fishing methods.
29 As at 1 November 2018
Species targeted Sea mullet, shark, whiting, bream, flathead, tailor, small mackerels, threadfins and barramundi
Fishing season 1 July – 30 June (for quota managed species)
1 January – 31 December (for all other species)
Barramundi closures apply to all fishers from midday on 7 October to midday on 1 February annually
A general seasonal fishing closure applies to near shore waters between Indian Head and Waddy Point, Fraser Island from 1 August to 30 September to protect spawning tailor
Commercial fishery symbols Total number of fishery symbols issued:
L1 – 225; L2 – 190; N1 – 86; N2 – 94; N4 – 5; N10 – 22; N11 – 281; S – 114; K1 – 2; K2 – 3; K3 – 4; K4 – 1; K5 – 7; K6 – 3; K7 – 4; K8 – 1229
Commercial fishery licences Total number of licences with access to the fishery: 663
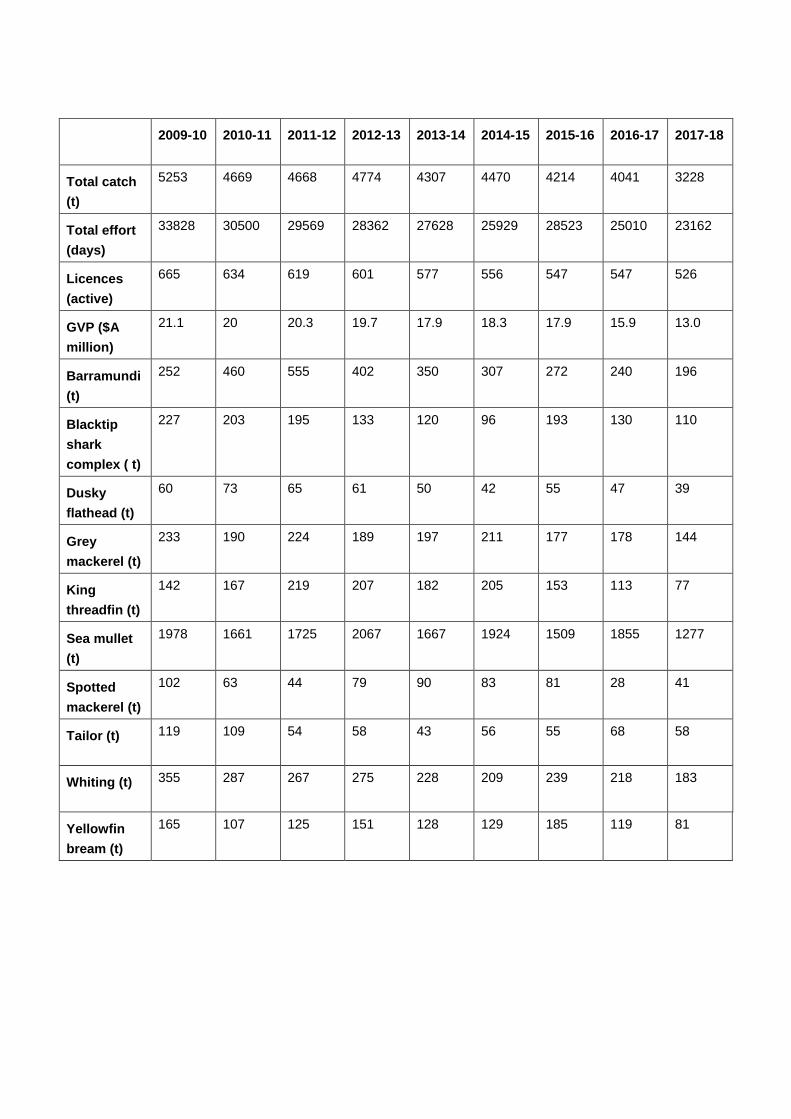
2009-10 2010-11 2011-12 2012-13 2013-14 2014-15 2015-16 2016-17 2017-18
Total catch
(t)
5253 4669 4668 4774 4307 4470 4214 4041 3228
Total effort
(days)
33828 30500 29569 28362 27628 25929 28523 25010 23162
Licences
(active)
665 634 619 601 577 556 547 547 526
GVP ($A
million)
21.1 20 20.3 19.7 17.9 18.3 17.9 15.9 13.0
Barramundi
(t)
252 460 555 402 350 307 272 240 196
Blacktip
shark
complex ( t)
227 203 195 133 120 96 193 130 110
Dusky
flathead (t)
60 73 65 61 50 42 55 47 39
Grey
mackerel (t)
233 190 224 189 197 211 177 178 144
King
threadfin (t)
142 167 219 207 182 205 153 113 77
Sea mullet
(t)
1978 1661 1725 2067 1667 1924 1509 1855 1277
Spotted
mackerel (t)
102 63 44 79 90 83 81 28 41
Tailor (t) 119 109 54 58 43 56 55 68 58
Whiting (t) 355 287 267 275 228 209 239 218 183
Yellowfin
bream (t)
165 107 125 151 128 129 185 119 81
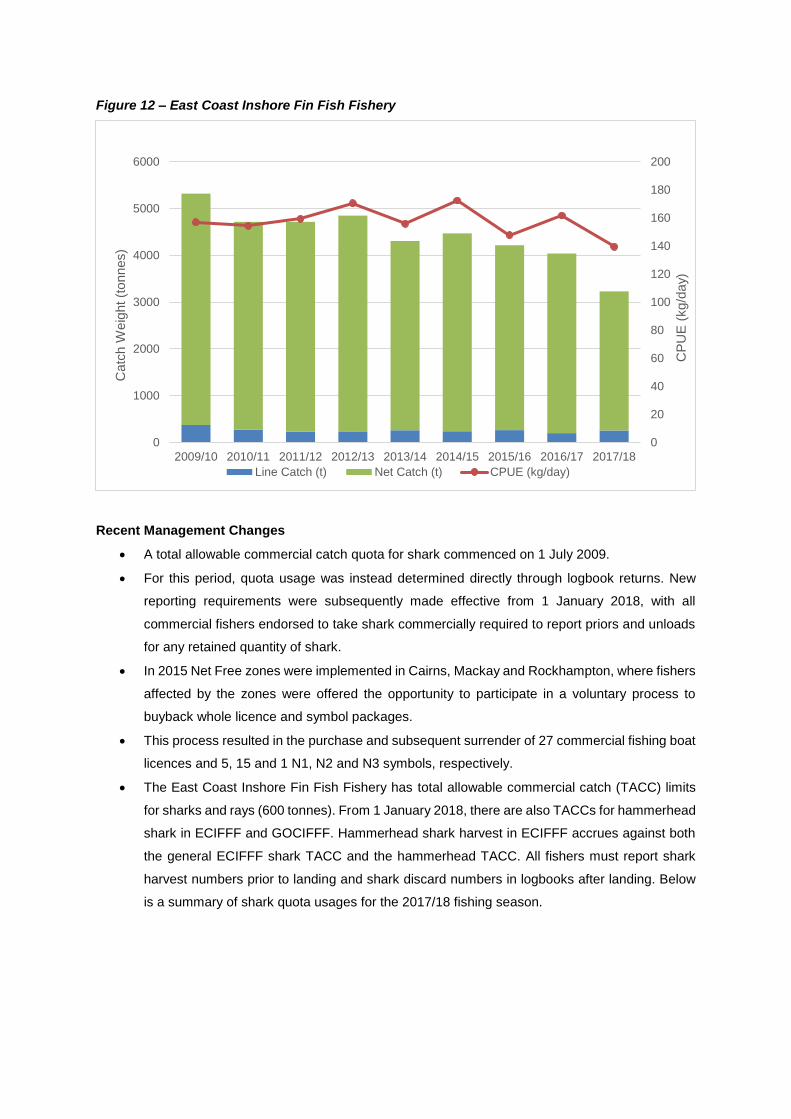
Figure 12 – East Coast Inshore Fin Fish Fishery
Recent Management Changes
A total allowable commercial catch quota for shark commenced on 1 July 2009.
For this period, quota usage was instead determined directly through logbook returns. New
reporting requirements were subsequently made effective from 1 January 2018, with all
commercial fishers endorsed to take shark commercially required to report priors and unloads
for any retained quantity of shark.
In 2015 Net Free zones were implemented in Cairns, Mackay and Rockhampton, where fishers
affected by the zones were offered the opportunity to participate in a voluntary process to
buyback whole licence and symbol packages.
This process resulted in the purchase and subsequent surrender of 27 commercial fishing boat
licences and 5, 15 and 1 N1, N2 and N3 symbols, respectively.
The East Coast Inshore Fin Fish Fishery has total allowable commercial catch (TACC) limits
for sharks and rays (600 tonnes). From 1 January 2018, there are also TACCs for hammerhead
shark in ECIFFF and GOCIFFF. Hammerhead shark harvest in ECIFFF accrues against both
the general ECIFFF shark TACC and the hammerhead TACC. All fishers must report shark
harvest numbers prior to landing and shark discard numbers in logbooks after landing. Below
is a summary of shark quota usages for the 2017/18 fishing season.
0
20
40
60
80
100
120
140
160
180
200
0
1000
2000
3000
4000
5000
6000
2009/10 2010/11 2011/12 2012/13 2013/14 2014/15 2015/16 2016/17 2017/18
CP
UE
(kg/d
ay)
Catc
h W
eig
ht (t
onnes)
Line Catch (t) Net Catch (t) CPUE (kg/day)

Shark Quota Type 2017/18 TAC Tonnes Used % of TAC Used
Southern other shark 120 103 85
Southern Hammerhead 22 9 41
Northern Other Shark 480 114 24
Northern Hammerhead 78 20 26
Gulf Hammerhead 50 6 11
TACC’s for grey mackerel (250 t), spotted mackerel (140 t) and tailor (120 t) are divided among
symbol holders using an individual transferable quota (ITQ) system.
During the 2017/18 catch period; 144 t (57.7 %) of grey mackerel, 41 t (29.7 %) of spotted
mackerel and 61 t (51.4 %) of tailor were used30.
New requirements for hammerhead sharks commenced on 1 January 2018, under the
Commonwealth Environment Protection and Biodiversity Conservation Act 1999 (EPBC Act).
Sharks and rays are now listed in a separate logbook.
For the 2017/18 financial year, data on shark catches will be representative of data collected in
ECIFFF net and line logbooks (from July to December 2017) and from new shark and ray
logbooks (from January to June 2018).
New shark and ray logbooks require hammerhead shark species to be reported to the species
level, and all discards of sharks and rays are reported to Fisheries Queensland.
Each year Fisheries Queensland assesses the exploitation status (stock status) of
Queensland’s key fish stocks. To view outcomes of the most recent stock status assessments
for key species like mullet and whiting please visit
https://www.daf.qld.gov.au/businesspriorities/fisheries/monitoringourfisheries/commercialfisheri
es/data-reports/sustainability-reporting/stock-status-assessments
To view licence details, quota held by an individual or company, current quota setting and
usage details by quota type or the type and number of fishery symbols currently endorsed in
the East Coast Inshore Finfish Fishery please visit FishNet
For further analysis of the East Coast Inshore Fin Fish Fishery please visit QFish
Fisheries symbols provide an endorsement to fish within Queensland waters, to view the
fishery symbol maps associated with this fishery please visit Fishery Symbols.
30 Fishery quota and logbook figures listed in this report may differ; logbooks are designed to collect an estimated daily weight retained at sea, while quota figures are based on weights that are accurately measured upon landing. Moving forward, logbook figures within this report will be adjusted to reflect quota data.

Gulf of Carpentaria Inshore Fin Fish Fishery
The Gulf of Carpentaria Inshore Fin Fish Fishery (GOCIFFF) is a multi-species fishery comprising a
commercial inshore (N3) net fishery, a commercial offshore (N12 and N13) net fishery, commercial bait
netting (N11), recreational fishing, Indigenous fishing and charter boat fishing of species related to the
GOCIFFF within the Queensland jurisdiction of the Gulf of Carpentaria.
31 As at 1 November 2018
Species targeted Barramundi, king and blue threadfins, tropical shark and grey mackerel
Fishing season 1 January – 31 December
Barramundi closures apply to all fishers from midday on 7 October to midday on 1 February every year
Commercial fishery
symbols
Total number of fishery symbols issued: N3 – 85; N12 – 3; N13 – 131
Commercial fishery
licences
Total number of licences with access to the fishery: 81
2010 2011 2012 2013 2014 2015 2016 2017
Total catch (t) 2622 2601 2364 1622 1623 1560 1759 1938
Total effort
(days)
9987 9443 8962 7528 7974 6901 7144 8262
Licences
(active)
87 81 87 83 74 71 77 81
GVP ($A
million)
15.6 16.7 15.5 9.8 9.7 9.2 10.2 11.9
Barramundi (t) 763 966 929 505 457 367 468 668
Blacktip shark
(t)
216 190 133 184 154 122 234 200
Blue threadfin
(t)
63 49 39 40 49 41 54 74
Grey mackerel
(t)
897 853 767 486 562 718 645 552
King threadfin
(t)
378 325 313 176 142 138 169 236
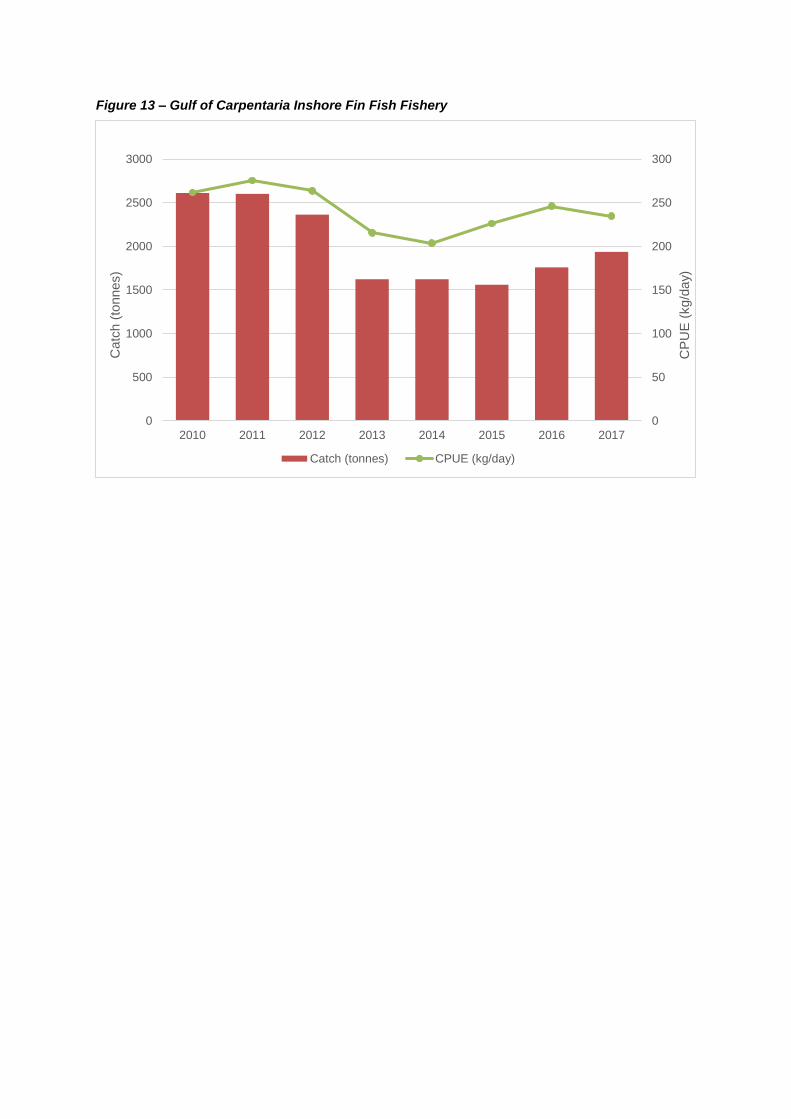
Figure 13 – Gulf of Carpentaria Inshore Fin Fish Fishery
0
50
100
150
200
250
300
0
500
1000
1500
2000
2500
3000
2010 2011 2012 2013 2014 2015 2016 2017
CP
UE
(kg/d
ay)
Catc
h (
tonnes)
Catch (tonnes) CPUE (kg/day)

The Queensland Government approved management arrangements for the offshore
component of the Gulf of Carpentaria Inshore Fin Fish Fishery; restructuring involved
transitioning from the N9 and QFJA mesh net authorisations to offshore N12 and N13 fishery
symbols.
During 2012, three N12 fishery symbols were issued and most recently in 2014 a N13 symbol
was issued.
New requirements for hammerhead sharks commenced on 1 January 2018, under the
Commonwealth Environment Protection and Biodiversity Conservation Act 1999. Sharks and
rays are now listed in a separate logbook.
For the 2017/2018 financial year, data on shark catches will be representative of data collected
in GOCIFF net and line logbooks (from July to December 2017) and from new shark and ray
logbooks (from January to June 2018).
New shark and ray logbooks require hammerhead shark species to be reported to the species
level, and all discards of sharks and rays are reported to Fisheries Queensland.
For further information on the new shark reporting requirements please visit
https://www.daf.qld.gov.au/our-organisation/news-and-updates/fisheries/news/new-rules-
commence-for-hammerhead-sharks, or for information on shark and hammerhead quotas and
how they are allocated amongst the Gulf of Carpentaria and the East Coast please visit FishNet
Each year Fisheries Queensland assesses the exploitation status (stock status) of
Queensland’s key fish stocks. To view outcomes of the most recent stock status assessments
for key species like barramundi and grey mackerel please visit
http://www.daf.qld.gov.au/fisheries/monitoring-our-fisheries/data-reports/sustainability-
reporting/stock-status-assessments
To view licence details or the number of fishery symbols currently endorsed in the Gulf of
Carpentaria Inshore Fin Fish Fishery visit FishNet
For further analysis of the Gulf of Carpentaria Inshore Fin Fish Fishery please visit QFish
Fisheries symbols provide an endorsement to fish within Queensland waters, to view the fishery
symbol maps associated with this fishery please visit Fishery Symbols.
Pot fisheries
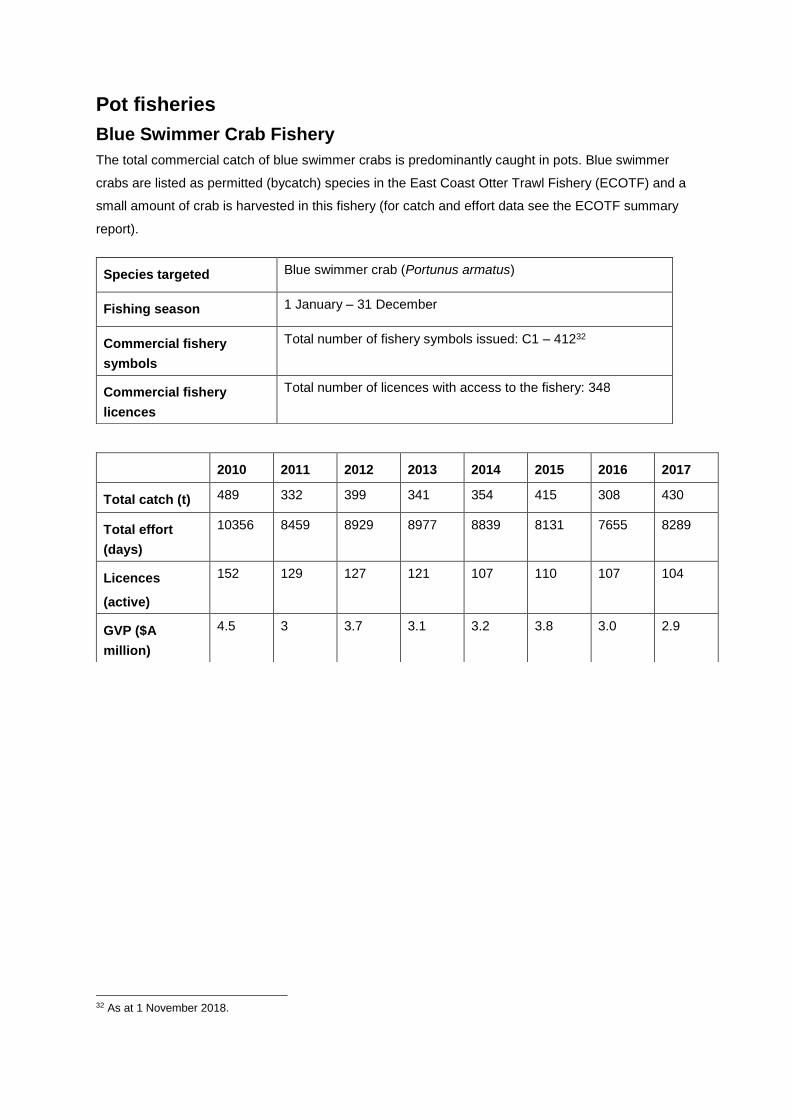
Blue Swimmer Crab Fishery
The total commercial catch of blue swimmer crabs is predominantly caught in pots. Blue swimmer
crabs are listed as permitted (bycatch) species in the East Coast Otter Trawl Fishery (ECOTF) and a
small amount of crab is harvested in this fishery (for catch and effort data see the ECOTF summary
report).
32 As at 1 November 2018.
Species targeted Blue swimmer crab (Portunus armatus)
Fishing season 1 January – 31 December
Commercial fishery
symbols
Total number of fishery symbols issued: C1 – 41232
Commercial fishery
licences
Total number of licences with access to the fishery: 348
2010 2011 2012 2013 2014 2015 2016 2017
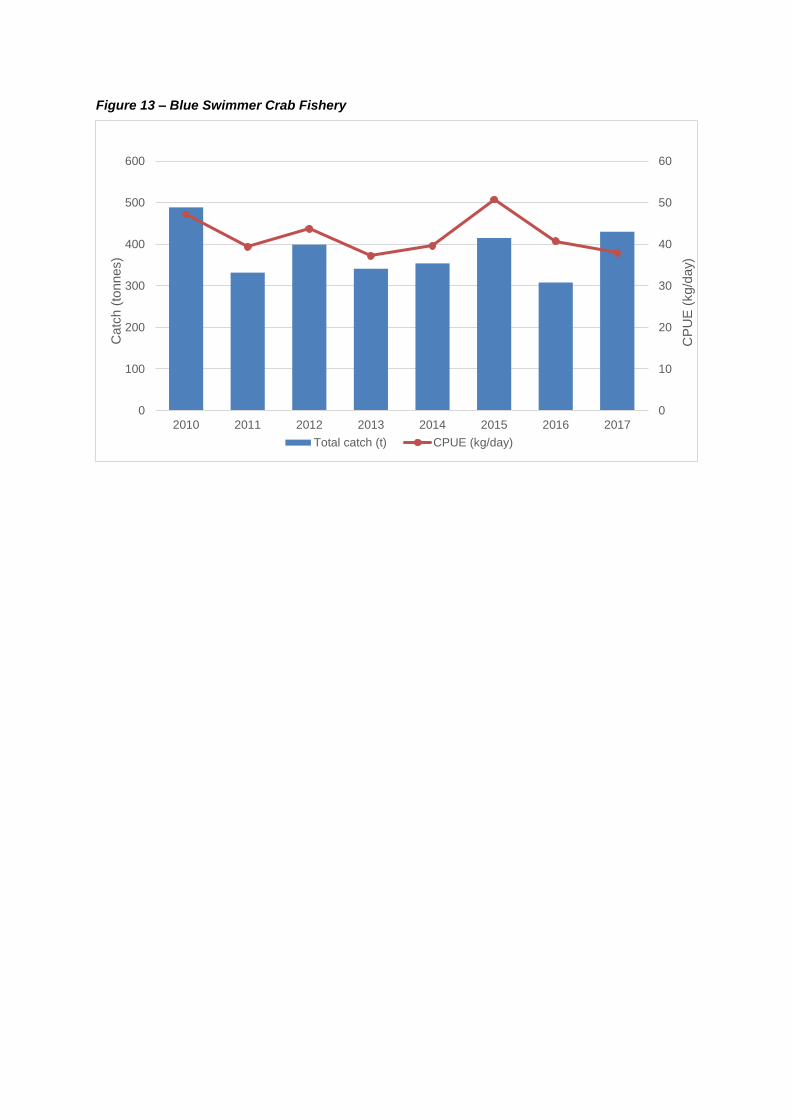
Total catch (t) 489 332 399 341 354 415 308 430
Total effort
(days)
10356 8459 8929 8977 8839 8131 7655 8289
Licences
(active)
152 129 127 121 107 110 107 104
GVP ($A
million)
4.5 3 3.7 3.1 3.2 3.8 3.0 2.9
0
10
20
30
40
50
60
0
100
200
300
400
500
600
2010 2011 2012 2013 2014 2015 2016 2017
CP
UE
(kg/d
ay)
Catc
h (
tonnes)
Total catch (t) CPUE (kg/day)
Figure 13 – Blue Swimmer Crab Fishery
Recent Management Changes:
In 2014 fisheries legislation was revised to allow multiple ‘C1’ fishery symbols to be written on
a single commercial fishing licence. Commercial crab fishers with two or more ‘C1’ fishery
symbols written upon their licence will be able to use a maximum of 100 pots to take mud or
blue swimmer crab while licences with one ‘C1’ will continue to use a maximum of 50 pots.
Commercial crab fishers may also apply for a General Fisheries Permit to use 150 pots but
are restricted to blue swimmer crabs, coral crabs, or three spot crabs, and cannot retain mud
crabs while the permit is in place. General Fisheries Permits are issued for 12 months.
The trawl sector is limited to catch limits of 100 blue swimmer crabs per trip in Moreton Bay
and 500 blue swimmer crabs per 7 days in areas outside Moreton Bay, and generally
represents 10% of the total commercial catch.
In 2016, a record high amount of blue swimmer crab (11.5 tonnes) was caught in the Gulf of
Carpentaria. This is a substantial harvest compared to previous years, with the nearest record
set at 3 tonnes in 2007.
Each year Fisheries Queensland assesses the exploitation status (stock status) of
Queensland’s key fish stocks. To view outcomes of the most recent blue swimmer crab stock
status assessment please visit http://www.daf.qld.gov.au/fisheries/monitoring-our-
fisheries/data-reports/sustainability-reporting/stock-status-assessments
To view licence details or the number of fishery symbols currently endorsed in the Blue
Swimmer Crab Fishery please visit FishNet
For further analysis of the Blue Swimmer Crab Fishery please visit QFish
Fisheries symbols provide an endorsement to fish within Queensland waters, to view the
fishery symbol maps associated with this fishery please visit Fishery Symbols.
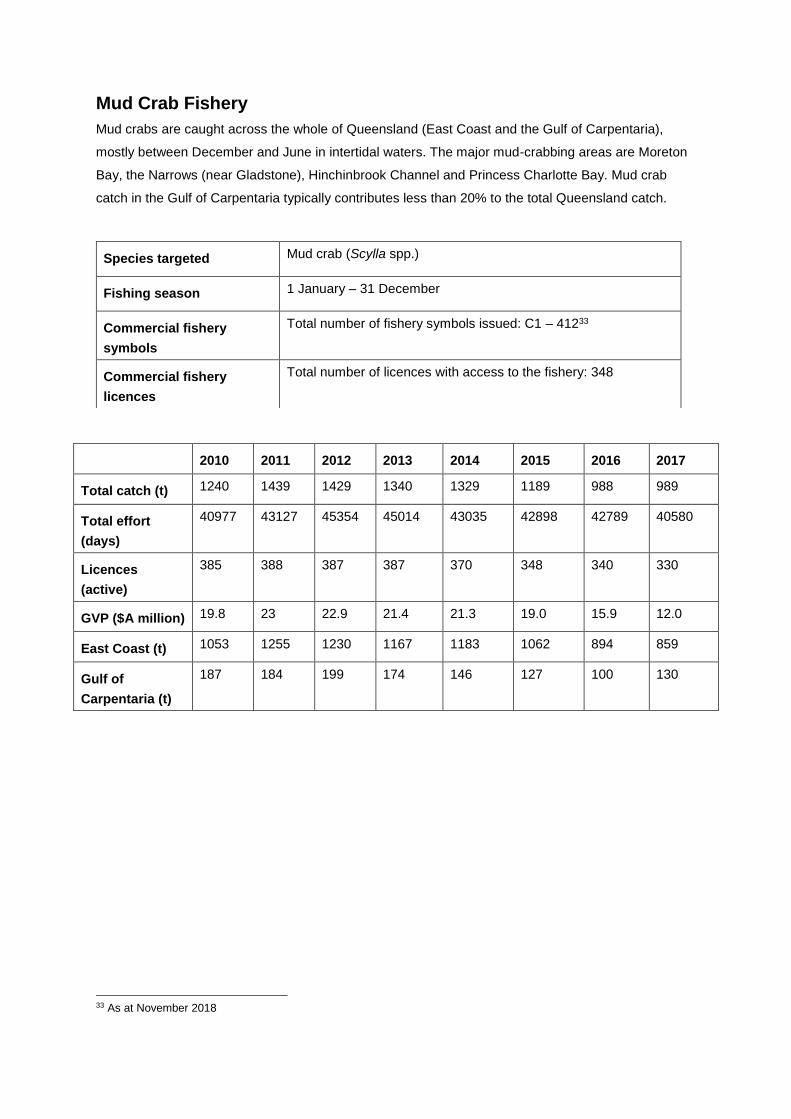
Mud Crab Fishery
Mud crabs are caught across the whole of Queensland (East Coast and the Gulf of Carpentaria),
mostly between December and June in intertidal waters. The major mud-crabbing areas are Moreton
Bay, the Narrows (near Gladstone), Hinchinbrook Channel and Princess Charlotte Bay. Mud crab
catch in the Gulf of Carpentaria typically contributes less than 20% to the total Queensland catch.
33 As at November 2018
Species targeted Mud crab (Scylla spp.)
Fishing season 1 January – 31 December
Commercial fishery
symbols
Total number of fishery symbols issued: C1 – 41233
Commercial fishery
licences
Total number of licences with access to the fishery: 348
2010 2011 2012 2013 2014 2015 2016 2017
Total catch (t) 1240 1439 1429 1340 1329 1189 988 989
Total effort
(days)
40977 43127 45354 45014 43035 42898 42789 40580
Licences
(active)
385 388 387 387 370 348 340 330
GVP ($A million) 19.8 23 22.9 21.4 21.3 19.0 15.9 12.0
East Coast (t) 1053 1255 1230 1167 1183 1062 894 859
Gulf of
Carpentaria (t)
187 184 199 174 146 127 100 130
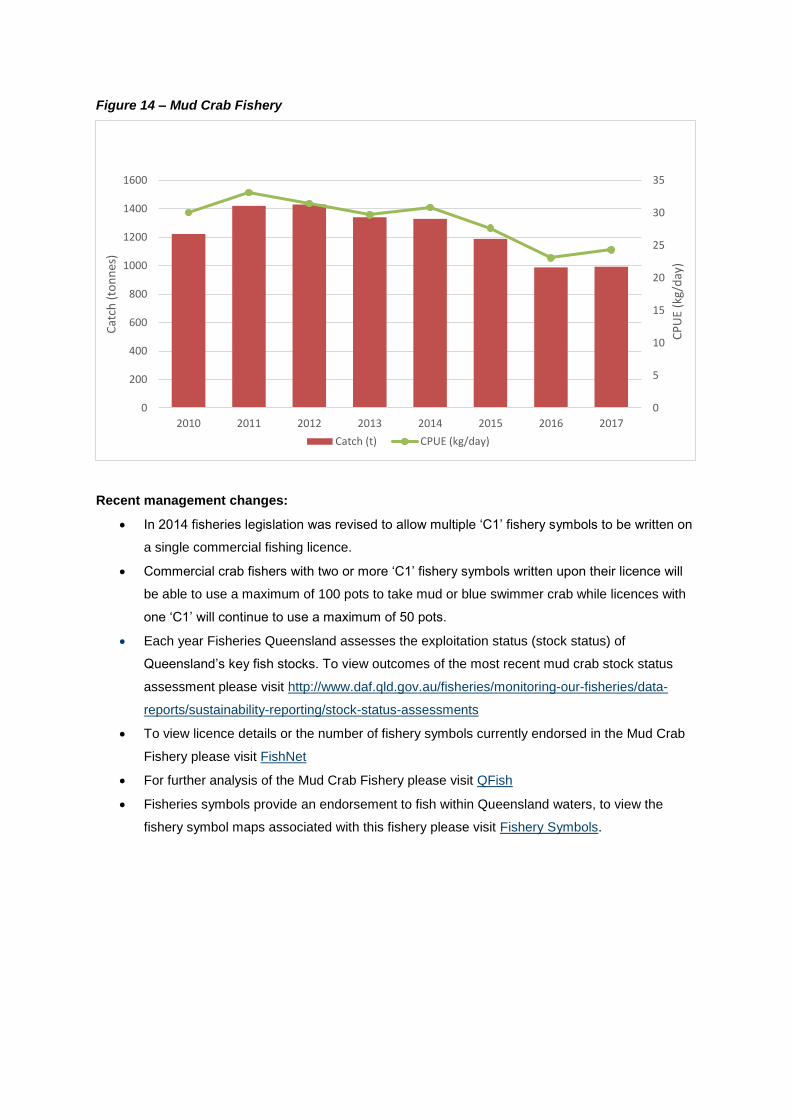
Figure 14 – Mud Crab Fishery
Recent management changes:
In 2014 fisheries legislation was revised to allow multiple ‘C1’ fishery symbols to be written on
a single commercial fishing licence.
Commercial crab fishers with two or more ‘C1’ fishery symbols written upon their licence will
be able to use a maximum of 100 pots to take mud or blue swimmer crab while licences with
one ‘C1’ will continue to use a maximum of 50 pots.
Each year Fisheries Queensland assesses the exploitation status (stock status) of
Queensland’s key fish stocks. To view outcomes of the most recent mud crab stock status
assessment please visit http://www.daf.qld.gov.au/fisheries/monitoring-our-fisheries/data-
reports/sustainability-reporting/stock-status-assessments
To view licence details or the number of fishery symbols currently endorsed in the Mud Crab
Fishery please visit FishNet
For further analysis of the Mud Crab Fishery please visit QFish
Fisheries symbols provide an endorsement to fish within Queensland waters, to view the
fishery symbol maps associated with this fishery please visit Fishery Symbols.
0
5
10
15
20
25
30
35
0
200
400
600
800
1000
1200
1400
1600
2010 2011 2012 2013 2014 2015 2016 2017
CP
UE
(kg/
day
)
Cat
ch (
ton
nes
)
Catch (t) CPUE (kg/day)
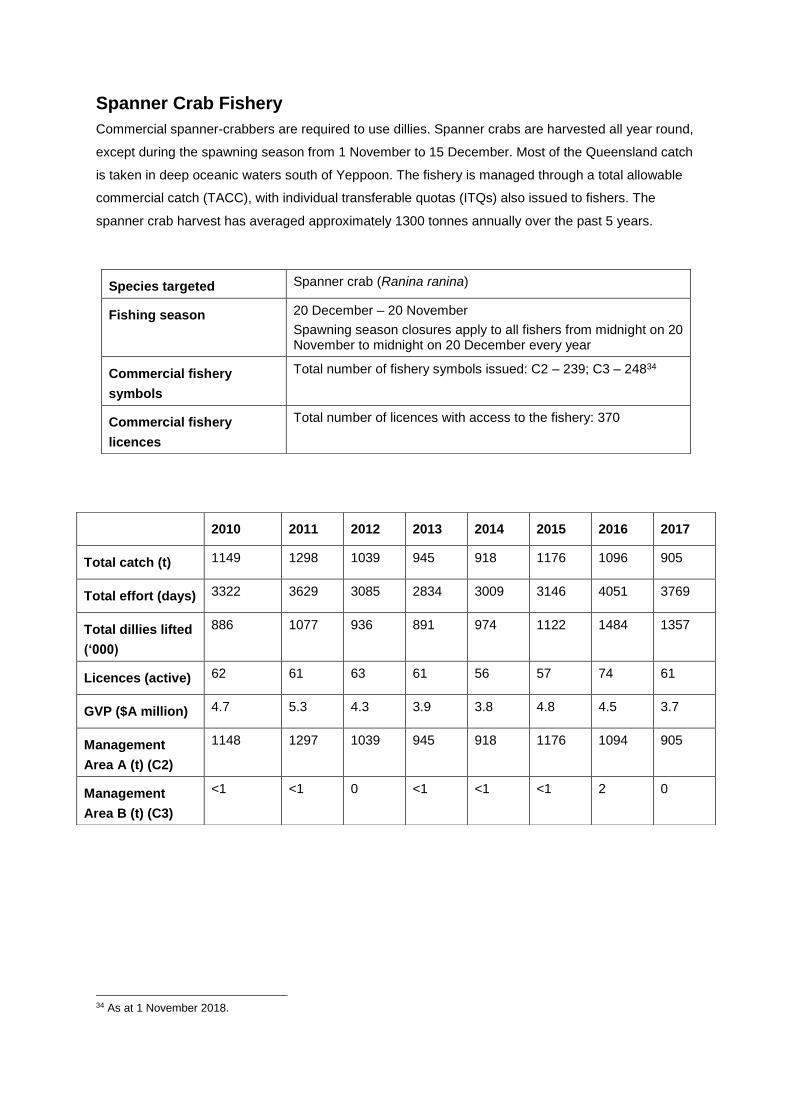
Spanner Crab Fishery
Commercial spanner-crabbers are required to use dillies. Spanner crabs are harvested all year round,
except during the spawning season from 1 November to 15 December. Most of the Queensland catch
is taken in deep oceanic waters south of Yeppoon. The fishery is managed through a total allowable
commercial catch (TACC), with individual transferable quotas (ITQs) also issued to fishers. The
spanner crab harvest has averaged approximately 1300 tonnes annually over the past 5 years.
34 As at 1 November 2018.
Species targeted Spanner crab (Ranina ranina)
Fishing season 20 December – 20 November
Spawning season closures apply to all fishers from midnight on 20 November to midnight on 20 December every year
Commercial fishery
symbols
Total number of fishery symbols issued: C2 – 239; C3 – 24834
Commercial fishery
licences
Total number of licences with access to the fishery: 370
2010 2011 2012 2013 2014 2015 2016 2017
Total catch (t) 1149 1298 1039 945 918 1176 1096 905
Total effort (days) 3322 3629 3085 2834 3009 3146 4051 3769
Total dillies lifted
(‘000)
886 1077 936 891 974 1122 1484 1357
Licences (active) 62 61 63 61 56 57 74 61
GVP ($A million) 4.7 5.3 4.3 3.9 3.8 4.8 4.5 3.7
Management
Area A (t) (C2)
1148 1297 1039 945 918 1176 1094 905
Management
Area B (t) (C3)
<1 <1 0 <1 <1 <1 2 0

The Spanner Crab Fishery Managed Area A commercial total allowable catch (TACC) is divided
among licence holders using an individual transferable quota (ITQ) system. The 2016–1735 TACC
was set at 1631 tonnes (t) of which 810 tonnes (49.7%) was utilised by fishers36.
Recent management changes:
Amendments have been made which requires the Chief Executive to declare quota in the
Spanner Crab Fishery. As quota in this fishery has up until now been stated in legislation, the
ability to declare this quota in the future will significantly streamline the process. Following this
amendment, the annual quota for Managed Area A was declared to be 1631 tonnes for the
2017–18 quota year.
The CPUE is incomplete for 2017; the current CPUE shown is unstandardized and therefore
varies from that used during the quota setting process.
Spanner Crab quota is deducted from the fisheries TACC in alignment with the spanner crab
financial year (June to May); conversely, logbook catch and effort is reported and presented
by calendar year.
Each year Fisheries Queensland assesses the exploitation status (stock status) of
Queensland’s key fish stocks. To view outcomes of the most recent spanner crab stock status
assessment please visit http://www.daf.qld.gov.au/fisheries/monitoring-our-fisheries/data-
reports/sustainability-reporting/stock-status-assessments
To view licence details, quota held by an individual or company, current quota setting and
usage details by quota type or the type and number of fishery symbols currently endorsed in
the Spanner Crab Fishery please visit FishNet
For further analysis of the Spanner Crab Fishery please visit QFish
Fisheries symbols provide an endorsement to fish within Queensland waters, to view the
fishery symbol maps associated with this fishery please visit Fishery Symbols
35 Spanner crab quota is deducted from the fisheries TACC in alignment with the spanner crab financial year (June to May); conversely logbook catch and effort is reported and presented by calendar year.
36 Fishery quota and logbook figures listed in this report may differ; logbooks are designed to collect an estimated daily weight retained at sea, while quota figures are based on weights that are accurately measured upon landing. Moving forward, logbook figures within this report will be adjusted to reflect quota data.

Figure 15 – Spanner Crab Fishery
0.0
0.2
0.4
0.6
0.8
1.0
1.2
1.4
0
200
400
600
800
1000
1200
1400
2010 2011 2012 2013 2014 2015 2016 2017
CP
UE
(kg/d
illy lifts
)
Catc
h W
eig
ht (t
onnes)
Catch (t) CPUE (kg/dilly lifts)
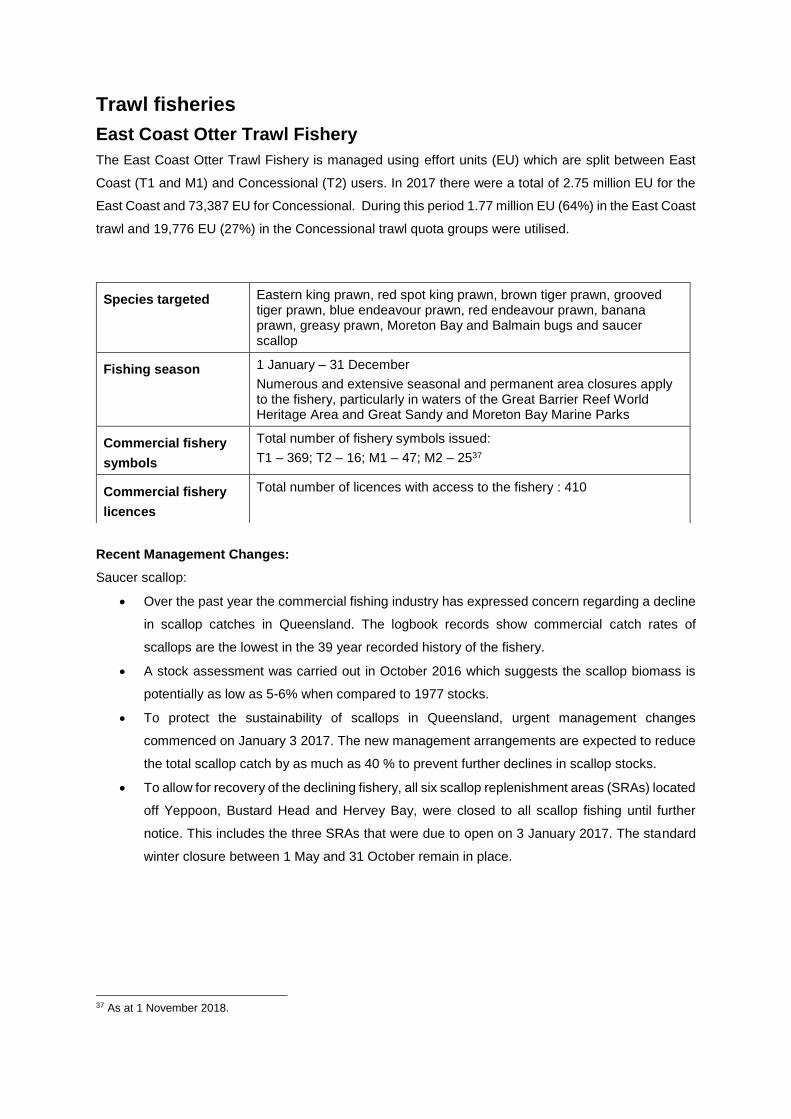
Trawl fisheries
East Coast Otter Trawl Fishery
The East Coast Otter Trawl Fishery is managed using effort units (EU) which are split between East
Coast (T1 and M1) and Concessional (T2) users. In 2017 there were a total of 2.75 million EU for the
East Coast and 73,387 EU for Concessional. During this period 1.77 million EU (64%) in the East Coast
trawl and 19,776 EU (27%) in the Concessional trawl quota groups were utilised.
Recent Management Changes:
Saucer scallop:
Over the past year the commercial fishing industry has expressed concern regarding a decline
in scallop catches in Queensland. The logbook records show commercial catch rates of
scallops are the lowest in the 39 year recorded history of the fishery.
A stock assessment was carried out in October 2016 which suggests the scallop biomass is
potentially as low as 5-6% when compared to 1977 stocks.
To protect the sustainability of scallops in Queensland, urgent management changes
commenced on January 3 2017. The new management arrangements are expected to reduce
the total scallop catch by as much as 40 % to prevent further declines in scallop stocks.
To allow for recovery of the declining fishery, all six scallop replenishment areas (SRAs) located
off Yeppoon, Bustard Head and Hervey Bay, were closed to all scallop fishing until further
notice. This includes the three SRAs that were due to open on 3 January 2017. The standard
winter closure between 1 May and 31 October remain in place.
37 As at 1 November 2018.
Species targeted Eastern king prawn, red spot king prawn, brown tiger prawn, grooved tiger prawn, blue endeavour prawn, red endeavour prawn, banana prawn, greasy prawn, Moreton Bay and Balmain bugs and saucer scallop
Fishing season 1 January – 31 December
Numerous and extensive seasonal and permanent area closures apply to the fishery, particularly in waters of the Great Barrier Reef World Heritage Area and Great Sandy and Moreton Bay Marine Parks
Commercial fishery
symbols
Total number of fishery symbols issued:
T1 – 369; T2 – 16; M1 – 47; M2 – 2537
Commercial fishery
licences
Total number of licences with access to the fishery : 410
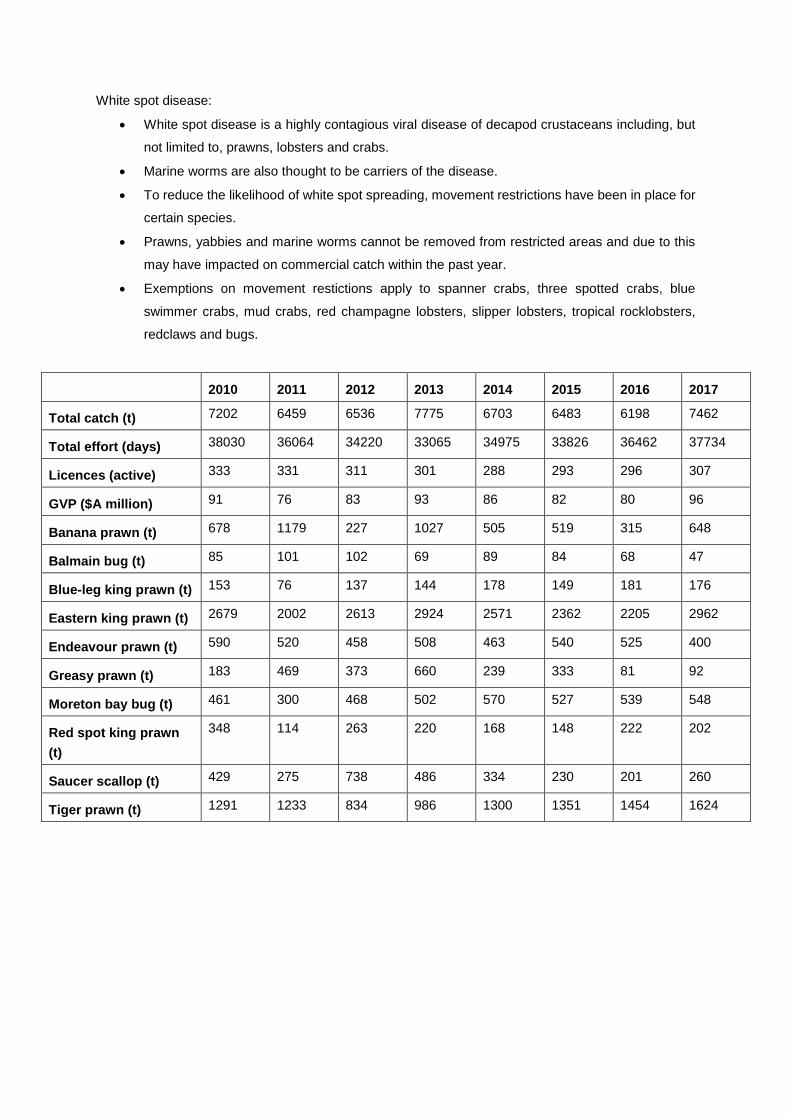
White spot disease:
White spot disease is a highly contagious viral disease of decapod crustaceans including, but
not limited to, prawns, lobsters and crabs.
Marine worms are also thought to be carriers of the disease.
To reduce the likelihood of white spot spreading, movement restrictions have been in place for
certain species.
Prawns, yabbies and marine worms cannot be removed from restricted areas and due to this
may have impacted on commercial catch within the past year.
Exemptions on movement restictions apply to spanner crabs, three spotted crabs, blue
swimmer crabs, mud crabs, red champagne lobsters, slipper lobsters, tropical rocklobsters,
redclaws and bugs.
2010 2011 2012 2013 2014 2015 2016 2017
Total catch (t) 7202 6459 6536 7775 6703 6483 6198 7462
Total effort (days) 38030 36064 34220 33065 34975 33826 36462 37734
Licences (active) 333 331 311 301 288 293 296 307
GVP ($A million) 91 76 83 93 86 82 80 96
Banana prawn (t) 678 1179 227 1027 505 519 315 648
Balmain bug (t) 85 101 102 69 89 84 68 47
Blue-leg king prawn (t) 153 76 137 144 178 149 181 176
Eastern king prawn (t) 2679 2002 2613 2924 2571 2362 2205 2962
Endeavour prawn (t) 590 520 458 508 463 540 525 400
Greasy prawn (t) 183 469 373 660 239 333 81 92
Moreton bay bug (t) 461 300 468 502 570 527 539 548
Red spot king prawn
(t)
348 114 263 220 168 148 222 202
Saucer scallop (t) 429 275 738 486 334 230 201 260
Tiger prawn (t) 1291 1233 834 986 1300 1351 1454 1624
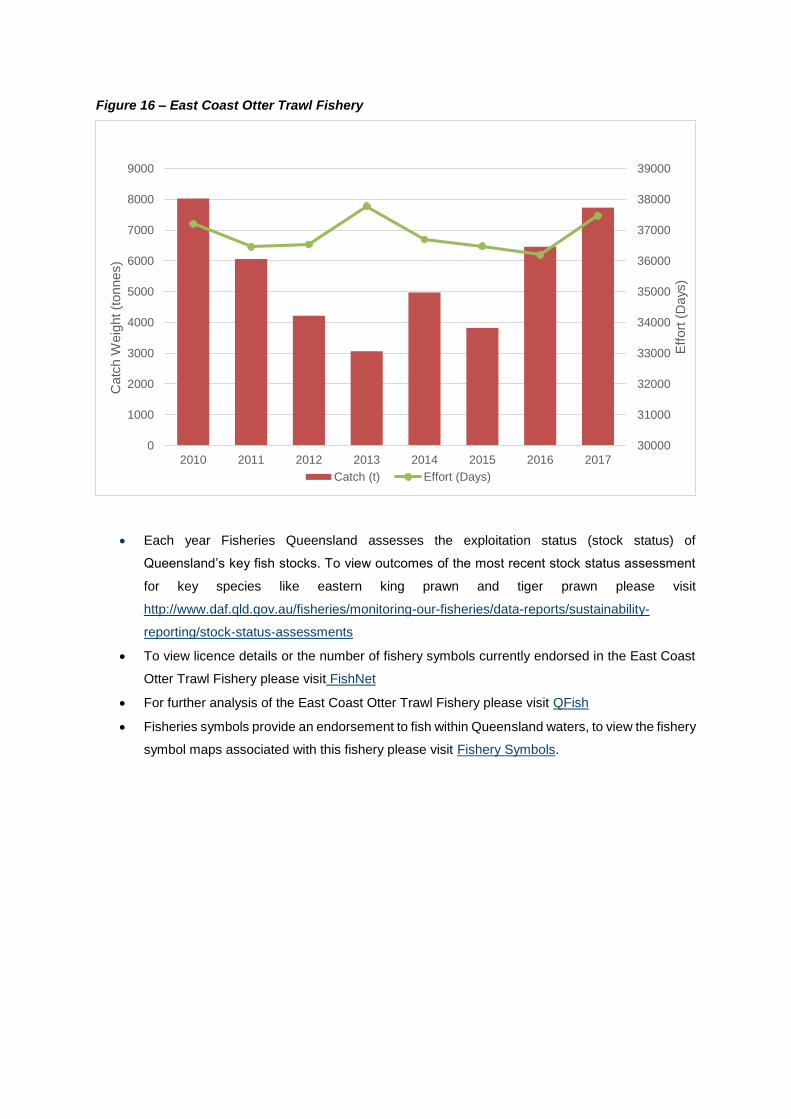
Figure 16 – East Coast Otter Trawl Fishery
Each year Fisheries Queensland assesses the exploitation status (stock status) of
Queensland’s key fish stocks. To view outcomes of the most recent stock status assessment
for key species like eastern king prawn and tiger prawn please visit
http://www.daf.qld.gov.au/fisheries/monitoring-our-fisheries/data-reports/sustainability-
reporting/stock-status-assessments
To view licence details or the number of fishery symbols currently endorsed in the East Coast
Otter Trawl Fishery please visit FishNet
For further analysis of the East Coast Otter Trawl Fishery please visit QFish
Fisheries symbols provide an endorsement to fish within Queensland waters, to view the fishery
symbol maps associated with this fishery please visit Fishery Symbols.
30000
31000
32000
33000
34000
35000
36000
37000
38000
39000
2010 2011 2012 2013 2014 2015 2016 2017
0
1000
2000
3000
4000
5000
6000
7000
8000
9000
Eff
ort
(D
ays
)
Catc
h W
eig
ht (t
onn
es)
Catch (t) Effort (Days)

Fin Fish (Stout Whiting) Trawl Fishery
The Queensland Fin Fish (Stout Whiting) Trawl Fishery (FFTF) is a demersal otter trawl and Danish
seine fishery. The FFTF is permitted to target stout whiting (Sillago robusta) and retain other permitted
by-product species such as Yellowtail scad (Trachurus novaezelandiae) and Goatfish (Mullidae family).
The FFTF has a Total Allowable Catch (TAC) for stout whiting divided among licence holders
using an Individual Transferable Quota (ITQ) system.
The 2017 TAC was set at 1105 tonnes where 1028 tonnes (93%) was utilised by fishers.
The Yellowtail Scad quota for 2017 was 100 tonnes, of which 8.3 tonnes was used leaving
91.7% of the allocation unused38.
To view licence details or the number of fishery symbols currently endorsed in the Fin Fish
(Stout Whiting) Trawl Fishery please visit FishNet
For further analysis of the Fin Fish (Stout Whiting) Trawl Fishery please visit QFish
Fisheries symbols provide an endorsement to fish within Queensland waters, to view the fishery
symbol maps associated with this fishery please visit Fishery Symbols.
38 Fishery quota and logbook figures listed in this report may differ; logbooks are designed to collect an estimated daily weight retained at sea, while quota figures are based on weights that are accurately measured upon landing. Moving forward, logbook figures within this report will be adjusted to reflect quota data.
39 As at 1 November 2018.
Species targeted Stout whiting (Sillago robusta)
Fishing season 1 January – 31 December
Commercial fishery
symbols
Total number of fishery symbols issued: T4 – 539
Commercial fishery
licences
Total number of licences with access to the fishery: 3
2010 2011 2012 2013 2014 2015 2016 2017
Total catch (t) 1197 683 791 713 583 790 792 1041
Total effort (days) 380 337 276 269 266 272 298 267
Licences (active) 3 4 2 2 2 2 2 2
GVP ($A million) 3.0 1.7 2.0 1.8 1.5 2.0 2.0 2.6
Stout whiting (t) 1170 665 784 704 581 787 776 1028
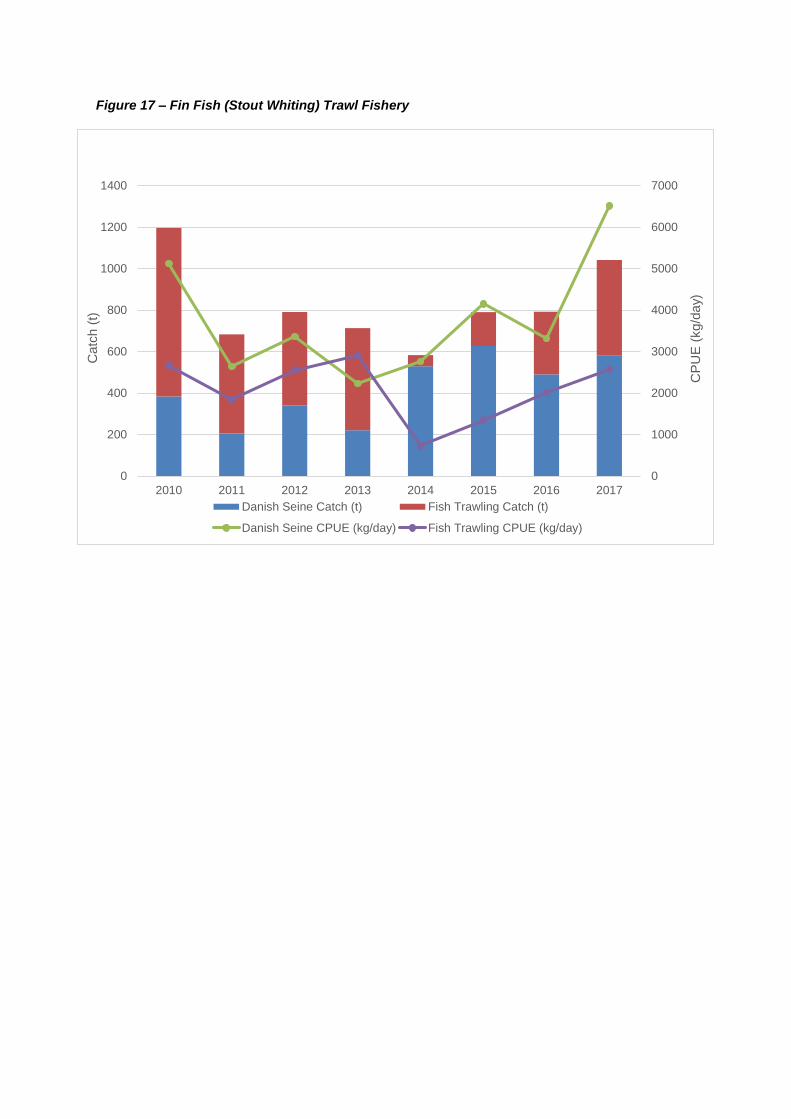
Figure 17 – Fin Fish (Stout Whiting) Trawl Fishery
0
1000
2000
3000
4000
5000
6000
7000
0
200
400
600
800
1000
1200
1400
2010 2011 2012 2013 2014 2015 2016 2017
CP
UE
(kg/d
ay)
Catc
h (
t)
Danish Seine Catch (t) Fish Trawling Catch (t)
Danish Seine CPUE (kg/day) Fish Trawling CPUE (kg/day)
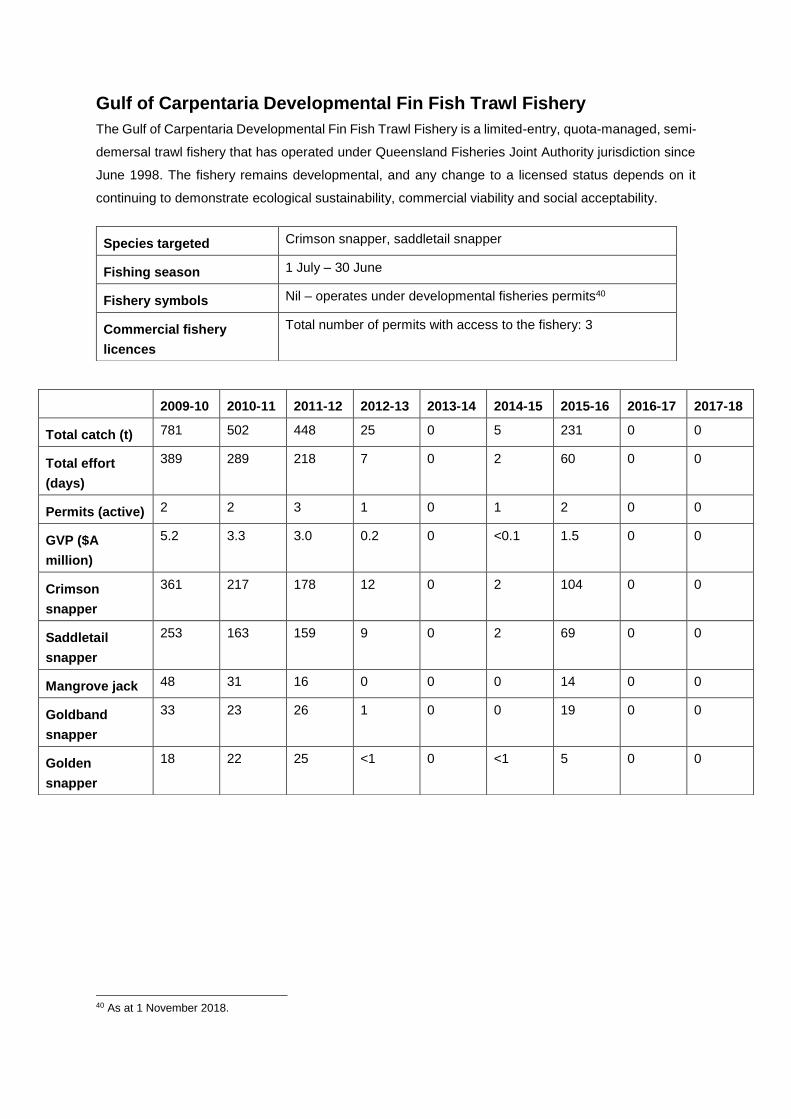
Gulf of Carpentaria Developmental Fin Fish Trawl Fishery
The Gulf of Carpentaria Developmental Fin Fish Trawl Fishery is a limited-entry, quota-managed, semi-
demersal trawl fishery that has operated under Queensland Fisheries Joint Authority jurisdiction since
June 1998. The fishery remains developmental, and any change to a licensed status depends on it
continuing to demonstrate ecological sustainability, commercial viability and social acceptability.
40 As at 1 November 2018.
Species targeted Crimson snapper, saddletail snapper
Fishing season 1 July – 30 June
Fishery symbols Nil – operates under developmental fisheries permits40
Commercial fishery
licences
Total number of permits with access to the fishery: 3
2009-10 2010-11 2011-12 2012-13 2013-14 2014-15 2015-16 2016-17 2017-18
Total catch (t) 781 502 448 25 0 5 231 0 0
Total effort
(days)
389 289 218 7 0 2 60 0 0
Permits (active) 2 2 3 1 0 1 2 0 0
GVP ($A
million)
5.2 3.3 3.0 0.2 0 <0.1 1.5 0 0
Crimson
snapper
361 217 178 12 0 2 104 0 0
Saddletail
snapper
253 163 159 9 0 2 69 0 0
Mangrove jack 48 31 16 0 0 0 14 0 0
Goldband
snapper
33 23 26 1 0 0 19 0 0
Golden
snapper
18 22 25 <1 0 <1 5 0 0
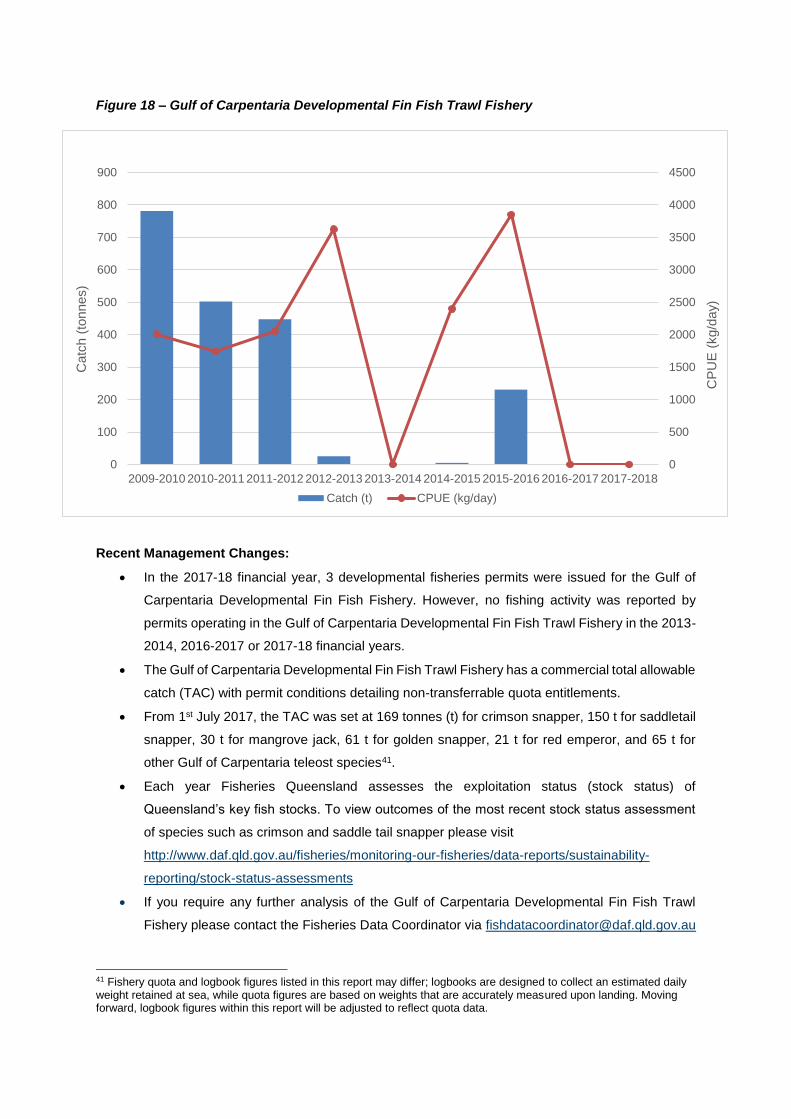
Figure 18 – Gulf of Carpentaria Developmental Fin Fish Trawl Fishery
Recent Management Changes:
In the 2017-18 financial year, 3 developmental fisheries permits were issued for the Gulf of
Carpentaria Developmental Fin Fish Fishery. However, no fishing activity was reported by
permits operating in the Gulf of Carpentaria Developmental Fin Fish Trawl Fishery in the 2013-
2014, 2016-2017 or 2017-18 financial years.
The Gulf of Carpentaria Developmental Fin Fish Trawl Fishery has a commercial total allowable
catch (TAC) with permit conditions detailing non-transferrable quota entitlements.
From 1st July 2017, the TAC was set at 169 tonnes (t) for crimson snapper, 150 t for saddletail
snapper, 30 t for mangrove jack, 61 t for golden snapper, 21 t for red emperor, and 65 t for
other Gulf of Carpentaria teleost species41.
Each year Fisheries Queensland assesses the exploitation status (stock status) of
Queensland’s key fish stocks. To view outcomes of the most recent stock status assessment
of species such as crimson and saddle tail snapper please visit
http://www.daf.qld.gov.au/fisheries/monitoring-our-fisheries/data-reports/sustainability-
reporting/stock-status-assessments
If you require any further analysis of the Gulf of Carpentaria Developmental Fin Fish Trawl
Fishery please contact the Fisheries Data Coordinator via [email protected]
41 Fishery quota and logbook figures listed in this report may differ; logbooks are designed to collect an estimated daily weight retained at sea, while quota figures are based on weights that are accurately measured upon landing. Moving forward, logbook figures within this report will be adjusted to reflect quota data.
0
500
1000
1500
2000
2500
3000
3500
4000
4500
0
100
200
300
400
500
600
700
800
900
2009-2010 2010-2011 2011-2012 2012-2013 2013-2014 2014-2015 2015-2016 2016-2017 2017-2018
CP
UE
(kg/d
ay)
Catc
h (
tonnes)
Catch (t) CPUE (kg/day)
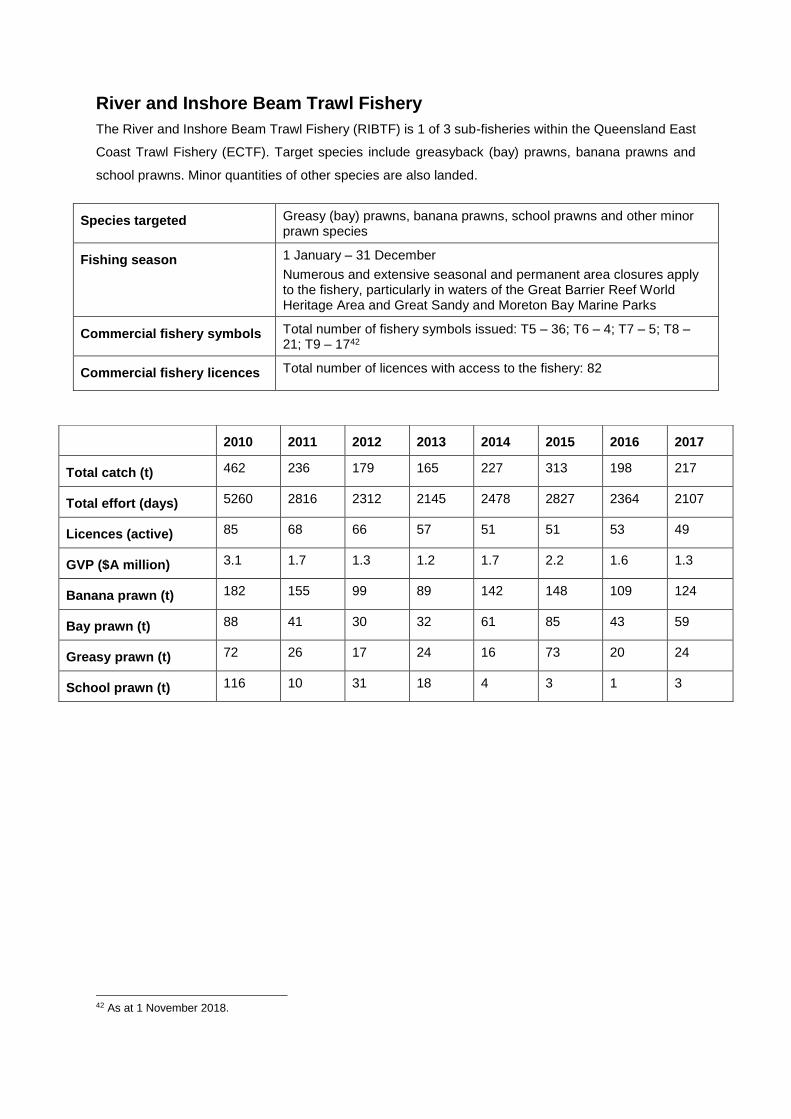
River and Inshore Beam Trawl Fishery
The River and Inshore Beam Trawl Fishery (RIBTF) is 1 of 3 sub-fisheries within the Queensland East
Coast Trawl Fishery (ECTF). Target species include greasyback (bay) prawns, banana prawns and
school prawns. Minor quantities of other species are also landed.
42 As at 1 November 2018.
Species targeted Greasy (bay) prawns, banana prawns, school prawns and other minor prawn species
Fishing season 1 January – 31 December
Numerous and extensive seasonal and permanent area closures apply to the fishery, particularly in waters of the Great Barrier Reef World Heritage Area and Great Sandy and Moreton Bay Marine Parks
Commercial fishery symbols Total number of fishery symbols issued: T5 – 36; T6 – 4; T7 – 5; T8 – 21; T9 – 1742
Commercial fishery licences Total number of licences with access to the fishery: 82
2010 2011 2012 2013 2014 2015 2016 2017
Total catch (t) 462 236 179 165 227 313 198 217
Total effort (days) 5260 2816 2312 2145 2478 2827 2364 2107
Licences (active) 85 68 66 57 51 51 53 49
GVP ($A million) 3.1 1.7 1.3 1.2 1.7 2.2 1.6 1.3
Banana prawn (t) 182 155 99 89 142 148 109 124
Bay prawn (t) 88 41 30 32 61 85 43 59
Greasy prawn (t) 72 26 17 24 16 73 20 24
School prawn (t) 116 10 31 18 4 3 1 3
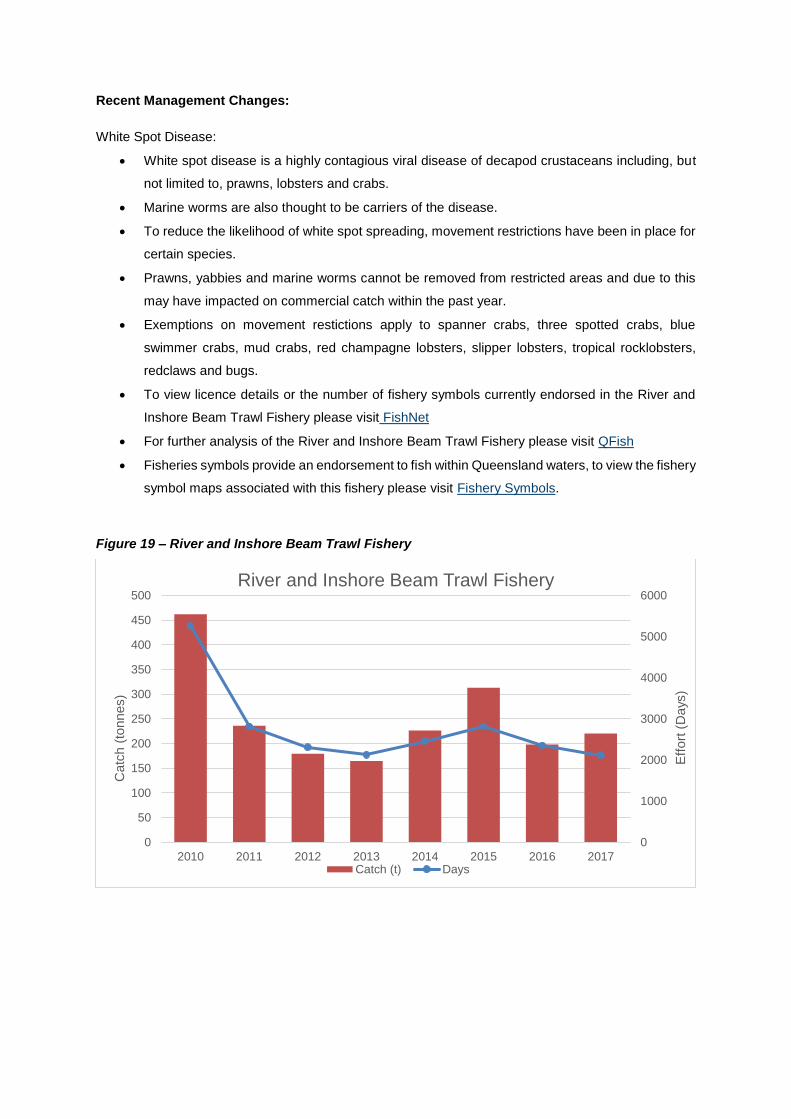
Recent Management Changes:
White Spot Disease:
White spot disease is a highly contagious viral disease of decapod crustaceans including, but
not limited to, prawns, lobsters and crabs.
Marine worms are also thought to be carriers of the disease.
To reduce the likelihood of white spot spreading, movement restrictions have been in place for
certain species.
Prawns, yabbies and marine worms cannot be removed from restricted areas and due to this
may have impacted on commercial catch within the past year.
Exemptions on movement restictions apply to spanner crabs, three spotted crabs, blue
swimmer crabs, mud crabs, red champagne lobsters, slipper lobsters, tropical rocklobsters,
redclaws and bugs.
To view licence details or the number of fishery symbols currently endorsed in the River and
Inshore Beam Trawl Fishery please visit FishNet
For further analysis of the River and Inshore Beam Trawl Fishery please visit QFish
Fisheries symbols provide an endorsement to fish within Queensland waters, to view the fishery
symbol maps associated with this fishery please visit Fishery Symbols.
Figure 19 – River and Inshore Beam Trawl Fishery
0
1000
2000
3000
4000
5000
6000
0
50
100
150
200
250
300
350
400
450
500
2010 2011 2012 2013 2014 2015 2016 2017
Eff
ort
(D
ays
)
Catc
h (
tonnes)
River and Inshore Beam Trawl Fishery
Catch (t) Days

Additional data
Fisheries catch and effort data is also available by fishing method type. Please see below for predefined
queries available on the QFish website:
Otter Trawl
For catch and effort data and maps for otter trawl please visit QFish
Beam Trawl
For catch and effort data and maps for beam trawl please visit QFish
Pot
For catch and effort data and maps for pot please visit QFish
Net
For catch and effort data and maps for net please visit QFish
Line
For catch and effort data and maps for line please visit QFish
Harvest
For catch and effort data and maps for harvest please visit QFish
Charter
For catch and effort data and maps for charter please visit QFish