Embed Size (px)
Citation preview


ii
Queensland Government ICT Audit 2012
Disclaimer
The materials presented in this publication are distributed by the Queensland Government as an information source only.
The State of Queensland, acting through the Department of Science, Information Technology, Innovation and the Arts, makes no statement, representation or warranty about the accuracy, completeness, or suitability for any purpose of this publication, and any use of this publication is at the user‘s own risk.
The State of Queensland disclaims all responsibility and all liability (including, without limitation, liability in negligence) for all expenses, losses, damages and costs anyone may incur as a result of reliance upon the information contained in this publication for any reason or as a result of the information being inaccurate, incomplete or unsuitable for any purpose.
The public release version of this point in time document contains limited amendments which are required to make corrections, clarify potential inaccuracies, and/or protect the confidentiality of commercial arrangements.
Licence
© The State of Queensland (Department of Science, Information Technology, Innovation and the Arts) (DSITIA) 2013.
The Queensland Government supports and encourages the dissemination and exchange of its information. The copyright in this publication is licensed under a Creative Commons Attribution No Derivatives (BY-ND) 3.0 Australia licence. To view this licence visit http://creativecommons.org/licenses/by-nd/3.0/au/deed.en
Under this licence you are free, without having to seek permission from DSITIA, to use this publication in accordance with the licence terms.
You must keep intact the copyright notice and attribute the State of Queensland, Department of Science, Information Technology, Innovation and the Arts as the source of the publication.

iii
Queensland Government ICT Audit 2012
Contents
Executive summary ....................................................................................................... 1
Recommendations......................................................................................................... 7
1 Introduction ................................................................................................... 22
1.1 Purpose .......................................................................................................................... 22
1.2 Background .................................................................................................................... 22
1.3 Scope ............................................................................................................................. 22
1.4 Limitations ...................................................................................................................... 25
1.5 Size and scale of the Audit............................................................................................. 25
1.6 Agency consultation ....................................................................................................... 26
1.7 Navigating this report ..................................................................................................... 27
2 Savings and waste ........................................................................................ 30
2.1 Introduction..................................................................................................................... 30
2.2 Savings summary ........................................................................................................... 30
2.3 Methodology ................................................................................................................... 33
2.4 Opportunity overview ..................................................................................................... 37
2.5 Applications rationalisation............................................................................................. 38
2.6 Business service delivery ............................................................................................... 39
2.7 ICT efficiency ................................................................................................................. 41
2.8 ICT vendor management ............................................................................................... 43
2.9 Print services .................................................................................................................. 45
2.10 Telecommunications ...................................................................................................... 47
3 Total ICT replacement cost ........................................................................... 52
3.1 Introduction..................................................................................................................... 52
3.2 Quantifying the cost ....................................................................................................... 52
3.3 Causes ........................................................................................................................... 54
3.4 Replacement cost for applications ................................................................................. 55
3.5 Addressing replacement cost ......................................................................................... 56
4 Reduce complexity ....................................................................................... 58
Introduction..................................................................................................................... 58 1.1
Principles for reducing complexity ................................................................................. 59 1.2
What does this mean in practice .................................................................................... 62 1.3
5 Applications .................................................................................................. 66
5.1 Introduction..................................................................................................................... 66
5.2 Current state of application portfolio .............................................................................. 67
5.3 Commodity applications ................................................................................................. 75
5.4 Payroll systems .............................................................................................................. 77
5.5 Human resource systems .............................................................................................. 79
5.6 Finance systems ............................................................................................................ 81
5.7 Legacy systems ............................................................................................................. 83
5.8 Dust gathering systems .................................................................................................. 84
5.9 High risk applications ..................................................................................................... 85
5.10 Business-specific applications ....................................................................................... 88

iv
Queensland Government ICT Audit 2012
6 Infrastructure ................................................................................................. 92
6.1 Introduction..................................................................................................................... 93
6.2 Data centres ................................................................................................................. 101
6.3 The government‘s cloud strategy ................................................................................. 105
6.4 Hardware and software technology platforms.............................................................. 108
6.5 The desktop platform – a major upgrade challenge .................................................... 113
6.6 Security ........................................................................................................................ 114
6.7 Telecommunications .................................................................................................... 119
7 Organisational ............................................................................................. 126
7.1 Introduction................................................................................................................... 126
7.2 Shared Service providers ............................................................................................. 127
7.3 CITEC ........................................................................................................................... 128
7.4 Queensland Shared Service (QSS) ............................................................................. 131
7.5 Smart Service Queensland (SSQ) ............................................................................... 135
7.6 Agency ICT units .......................................................................................................... 137
7.7 Workforce capability ..................................................................................................... 140
7.8 Procurement ................................................................................................................. 143
8 Initiatives ..................................................................................................... 148
8.1 Introduction................................................................................................................... 148
8.2 Funding ........................................................................................................................ 149
8.3 Portfolio management .................................................................................................. 150
8.4 Business cases ............................................................................................................ 151
8.5 Benefits management .................................................................................................. 151
8.6 Program and project management .............................................................................. 152
8.7 At risk initiatives ........................................................................................................... 154
8.8 Summary ...................................................................................................................... 155
9 Relationship with Industry .......................................................................... 158
9.1 Introduction................................................................................................................... 158
9.2 Why is the ICT industry important ................................................................................ 159
9.3 The requirement for a close working relationship ........................................................ 159
9.4 Procurement is transactional........................................................................................ 159
9.5 Early engagement ........................................................................................................ 161
9.6 GITC – A barrier or an enabler .................................................................................... 162
9.7 Responsibilities ............................................................................................................ 163
9.8 Accreditation ................................................................................................................ 165
10 Constraints .................................................................................................. 168
10.1 Introduction................................................................................................................... 168
10.2 Governance – agency approval processes .................................................................. 168
10.3 Flow on impacts of government policy ......................................................................... 169
10.4 People - capability and capacity .................................................................................. 169
10.5 Dependency management of initiatives ....................................................................... 172
10.6 Other jurisdictions ........................................................................................................ 172
10.7 Industry capability ........................................................................................................ 173
10.8 Agency support for a One Government agenda .......................................................... 176

v
Queensland Government ICT Audit 2012
Appendix A – Definitions and acronyms ................................................................. 181
Appendix B – Savings and waste reduction opportunities .................................... 199
Appendix C – Analysis of Travel Management System savings ............................ 213
Appendix D – Analysis of Adobe and Microsoft procurement savings ................. 219
Appendix E – Analysis of Telstra services savings ................................................ 221
Appendix F – Savings realisation framework with labels ....................................... 229
Appendix G – High risk systems .............................................................................. 231
Appendix H – Agency initiative portfolio snapshots ............................................... 247
Appendix I – Top agency initiatives ......................................................................... 265

vi
Queensland Government ICT Audit 2012
Figures
Figure 1 - ICT management areas ................................................................................................. 24
Figure 2 - Savings / waste reduction opportunity realisation framework ........................................ 34
Figure 3 - Gartner Four Levels of Cost Optimisation Framework4 ................................................. 35
Figure 4 - Savings opportunities ..................................................................................................... 37
Figure 5 - Total replacement cost ................................................................................................... 53
Figure 6 - Replacement cost for applications by priority ................................................................ 55
Figure 7 - Modelled applications expenditure profile ...................................................................... 56
Figure 8 - Proportion of significant applications by number ........................................................... 67
Figure 9 - Proportion of significant applications by spend ............................................................. 67
Figure 10 - Percentage of total applications reaching end of life by year ...................................... 68
Figure 11 - Application acquisition strategies ................................................................................. 69
Figure 12 - Evolution of application architecture ............................................................................ 71
Figure 13 - Application platform software complexity by agency ................................................... 72
Figure 14 - Application software engine complexity by agency ..................................................... 72
Figure 15 - Commodity domains .................................................................................................... 76
Figure 16 - Count of payroll systems by agency ............................................................................ 77
Figure 17 - Payroll systems mapped to business area for DSITIA ................................................ 77
Figure 18 - Diversity of HR products reported across government ................................................ 80
Figure 19 - Industry and agency comparison for a three year infrastructure investment bundle ... 94
Figure 20 - Operating systems and utilities by agency .................................................................. 96
Figure 21 - Database management systems by agency ................................................................ 96
Figure 22 - Application development environments by agency ..................................................... 97
Figure 23 - Technology annual cost and support staff by technology domains ............................. 98
Figure 24 - Platform investment model ........................................................................................ 109
Figure 25 - Technology support status, by agency ...................................................................... 111
Figure 26 - Support status and AETCO of key technologies ....................................................... 112
Figure 27 - Information security specialists .................................................................................. 117
Figure 28 – Industry and agency comparison for a three year infrastructure investment bundle.130
Figure 29 - ICT staff under CIO control by agency ...................................................................... 140
Figure 30 - Cost of flights for major points of departure - per service provider ............................ 216
Figure 31 - Cost of flights for major destinations - per service provider ....................................... 217
Figure 32 - Adobe purchase order and invoice processing costs for fiscal year 2011-2012 ....... 219
Figure 33 - Microsoft purchase order and invoice processing costs Dec 2009 – Jul 2012 .......... 220
Figure 34 - Monthly savings opportunities from optimising Telstra mobile services .................... 222
Figure 35 - Count of Telstra mobile services ............................................................................... 222
Figure 36 - Maximum monthly savings available from cancelling idle mobile services ............... 223
Figure 37 - Savings obtained by entering a contract variation for the EMB plan with Telstra ..... 224

vii
Queensland Government ICT Audit 2012
Figure 38 - Count of Telstra fixed voice services ......................................................................... 225
Figure 39 - Maximum monthly savings available from cancelling idle fixed voice services ......... 225
Figure 40 - Unique count of Telstra accounts .............................................................................. 228
Tables Table 1 - Summary of the amount of information processed by the Audit ..................................... 25
Table 2 - Agency consultation ........................................................................................................ 26
Table 3 - Navigating the report ....................................................................................................... 27
Table 4 - Quick wins (probable realisation within 6 months) .......................................................... 31
Table 5 – Medium term savings (expected realisation between 6-24 months) .............................. 32
Table 6 - Additional savings (further investigation required) .......................................................... 33
Table 7 - Application system duplication ........................................................................................ 74
Table 8 - End of support dates for payroll products ....................................................................... 78
Table 9 - End of support dates for finance products ...................................................................... 81
Table 10 - High risk applications .................................................................................................... 87
Table 11 - As-a-Service versus traditional delivery models for ICT Infrastructure ....................... 100
Table 12 - Status of Windows XP to Windows 7 migration .......................................................... 113
Table 13 - QSS benchmark service areas with high costs........................................................... 134
Table 14 - SSQ benchmark service areas with high costs........................................................... 137
Table 15 - Aggregated initiative investment information .............................................................. 149
Table 16 - Initiative funding by agency showing forecast expenditure......................................... 150
Table 17 - Initiatives with cost overruns greater than 75% .......................................................... 153
Table 18 – Initiatives at risk .......................................................................................................... 154
Table 19 - High business impact initiatives with potential performance issues ........................... 154
Table 20 - 2011 expenditure recorded within the Travel Management System (TMS) ............... 213
Table 21 - Savings opportunities from Telstra mobile services ................................................... 221
Table 22 - Summary of mobile data plan optimisation savings .................................................... 223

viii
Queensland Government ICT Audit 2012
Annexes This report has a number of supporting annexes:
Application and technology duplication
Application sourcing approaches
Business case assessment
Total ICT replacement cost
Demand, cost and service performance of ICT
Initiatives
Legacy ICT
Procurement
Security
Significant and high risk systems
Strategy, governance and service delivery
Strategy, governance and service delivery – Agency profiles
Workforce capability

ix
Queensland Government ICT Audit 2012
This page has been intentionally left blank.

Queensland Government ICT Audit 2012: Executive summary
1
Queensland Government ICT Audit 2012
Executive summary
The Queensland Government has conducted an extensive audit of ICT across all core
departments (the Audit). The Audit reviewed all aspects of ICT including:
strategy and governance
initiatives
procurement
assets and services
service delivery models.
The Audit comprised the following activities involving all agencies, including: extensive
data collection and data quality improvement; analysis of the data; extensive consultation
to validate the data and the analysis findings; and, multiple reports to the Minister
culminating in this final report.
A focus was placed on identifying:
savings and waste
risks and issues
performance and accountability.
Savings and waste
The Audit identified significant annual savings available to the government of between
$98 million and $185 million per annum across a number of different opportunity areas.
The analysis attached a high degree of confidence to the delivery of at least $106 million
per annum in savings.
The opportunities were progressively investigated throughout the Audit to confirm their
viability, the quantum of savings, and to identify appropriate accountability for
achievement. Several of these opportunities have already been actioned.
Quick win savings with a probable realisation within six months have been identified to
deliver between $18 million and $25 million per annum with a high degree of confidence
associated with the delivery of at least $20 million.
Medium-term savings opportunities with a probable realisation within 6 to 24 months are
estimated at between $17 million and $21 million per annum.
A number of other savings opportunities requiring further investigation are estimated to
deliver between $63 million and $138 million per annum.
Queensland Government ICT Audit 2012: Executive summary
2
Queensland Government ICT Audit 2012
The savings opportunities identified in the Audit have been detailed in terms of what is
required to deliver them as well as which government entity should be responsible for
delivery.
Risks and issues
The visibility achieved in the Audit provided a unique view of the current state of ICT
across the government. It has revealed a portfolio of ICT systems in a state of decline as
a result of a long period of fragmented and minimally constrained growth, combined with
chronic underfunding.
Underfunding has translated into minimal maintenance and upgrades of existing ICT
platforms, resulting in ICT environments which are ageing and difficult to maintain. The
fragmentation and lack of constraints has resulted in an eclectic mix of technologies and
systems that complicate the management and upgrade of the total ICT portfolio.
The complex, under-maintained and ageing environment has collectively reached a state
of decline, where 90% of the current ICT portfolio requires replacement within five years -
leaving the government with a total replacement cost of at least $7.4 billion. The task of
addressing this issue is complex and expensive and has created a systemic business risk
for government.
Lack of Transparency
Lack of transparency is the single biggest cause of the poor state of government ICT.
Without appropriate levels of transparency, it has been near impossible to identify what
high risk and ageing systems exist, where they are, what has or hasn‘t been done to
address them, and what their impact is to government. Lack of transparency also
prevents government from understanding the range of initiatives underway – their
performance, priority, risk profile and business rationale.
Poor visibility of the shape and size of the ICT workforce has inhibited the ability to
ensure we have the correct skills and capacity profile needed to transform front line
services through innovation, deliver successful projects and business outcomes, and
ensure procured services are always delivering the best value for money.
This lack of transparency significantly inhibits the government‘s ability to make informed
decisions.
The Audit revealed a number of systems that present a critical risk to government. These
systems are typically long overdue for replacement, large and complex, and underpin
critical activities. These systems will require urgent attention to avoid rendering key parts
of government inoperable.

Queensland Government ICT Audit 2012: Executive summary
3
Queensland Government ICT Audit 2012
ICT-enabled initiatives
The government‘s ICT portfolio is not static. Over 1,100 initiatives were reported by
agencies as they actively work to manage and maintain the systems under their control.
The initiatives range from business transformation through to the upgrade and
replacement of existing systems and infrastructure.
While agencies are maturing in their ability to successfully manage initiatives, the Audit
found that many projects are still showing poor project outcomes with cost and
scheduling overuns. In addition, business case development expertise is varied, and
benefits management maturity across the government is low.
There is a lack of transparency of the progress of high risk initiatives at the executive
level of government. The existing lack of transparency has implications in how well the
government can make informed decisions to ensure the right initiatives are being done at
the right time, and how effectively the available resources are allocated and utilised.
Ongoing transparency of initiatives is critical – the government needs to remain fully
informed of its current and planned initiative portfolio, including their condition and
performance – especially for high risk initiatives.
The Audit recommends a significant change
Government must find ways to reduce the complexity of its business and the complexity
of the ICT systems and technologies that underpin it. The Audit recommends a review of
the business services of government be undertaken across all departments - looking for
alternative business models of delivery, and for reductions in business size and
complexity. Along with a reduction in business complexity, an alignment of the related
ICT systems, both within the agency and across government, will deliver significant
reductions in the level of ICT complexity that is required to service the business.
The future for ICT is firmly headed toward consumption of commodity ICT as a service in
a pay-for-what-you-use utility model. The government needs a mechanism to transition to
make maximum use of this model. However, this has a significant impact on the delivery
of ICT within government and the internal-to-government ICT service providers.
In line with the above objectives (reduction in complexity of the business and its systems,
and a move to commodity ICT as a service), the Audit recommends an integrated set of
initiatives be undertaken to deal with the parlous state of the existing ICT portfolio.
Conduct a government wide review of services aimed at redefining the business
of government. This process will identify the ICT requirements for the future.
After the above review, make the necessary changes to the ICT applications
portfolio to support the new way government will operate.

Queensland Government ICT Audit 2012: Executive summary
4
Queensland Government ICT Audit 2012
In parallel with the above initiatives move the government‘s infrastructure to an
‗as-a-Service‘ model – essentially moving the government out of the business of
owning and running commodity ICT infrastructure.
Begin the process to exit CITEC from the business of owning and running
commodity infrastructure.
Begin the process to exit Queensland Shared Services from the business of
owning and running commodity applications.
Completing the above steps in a sequential manner will not allow the government time to
deal with the ageing ICT portfolio. The above parallel process is absolutely mandatory as
is the urgency. Debating subtle nuances of the approach will waste precious time that the
government simply does not have.
The Audit recommends that government begin transitioning to a commodity model. This
will remove the need to retain both CITEC and Queensland Shared Services within three
years. This requires a fairly aggressive agenda to transform the way the government
currently procures its commodity ICT services.
In addition to impacts on the internal-to-government ICT service providers, the proposed
approach will also transform ICT delivery within agencies. Agencies will no longer be
engaged in owning, operating or managing commodity ICT.
To ensure that the ICT service delivery reform agenda is delivered, the Audit proposes
the appointment of two new CEO-level Service Executives with the responsibility and
authority to drive the necessary change agenda both across agencies and internal-to-
government service providers. One Service Executive will be responsible for commodity
ICT infrastructure transition and the other for commodity ICT applications transition.
Successful transition will also require contribution from the ICT industry. This presents a
significant opportunity to industry. In consultation with the Audit, representatives from
leading industry organisations gave a commitment to work with the Queensland
Government to achieve the kinds of transformational outcomes proposed in this report.
The ICT industry will now have to position itself to deliver on this commitment.
The Audit proposes to meet the challenges of the current ICT landscape in the
Queensland Government through significant reform of its delivery both internally and from
industry.
Governance and visibility
The Audit has provided incredible visibility of ICT across the Queensland Government.
This would not have been possible without the commitment and support of a large
number of people across all agencies, especially the Chief Information Officers (CIOs).
The visibility has revealed for the first time the true nature of the problems faced.

Queensland Government ICT Audit 2012: Executive summary
5
Queensland Government ICT Audit 2012
Instead of being defensive, CIOs have shown leadership throughout this exercise by
accepting their part and looking for a collective solution.
The role of the CIO now becomes even more critical. CIOs are the vital link to ensure
continued visibility of the state of ICT assets and initiatives, and to partner with the
business areas of government to deliver ICT capability appropriate for the business.
It is vital that CIOs are elevated to provide input to, and be a part of, the executive
decision-making process in agencies.
On the whole, governance arrangements were found to be less effective than they should
be both within agencies and at the whole-of-government level.
Challenges of the Audit
It is important to keep the Audit in context. To deliver against the timeline set by Cabinet it
was necessary to balance three factors: time, coverage and quality. The Audit therefore
took a pragmatic approach to quality, and carefully limited the coverage of the Audit to
bring focus to those elements of government ICT that are of prime importance in the
current environment.
Based on the assumption that time was of the essence, the Audit, with assistance from
agencies, sought to deliver a timely assessment of the current state of government ICT –
one which would allow for any remedial actions to be started sooner rather than later.
In formulating the findings and recommendations of the Audit, an enormous amount of
information was processed, analysed and synthesised. As an example, over 19,000
documents were reviewed, 1,100 initiatives were assessed, 1,730 existing applications
were reviewed along with 4,848 infrastructure technologies, 7,160 ICT-related staff
positions were identified and analysed, 296 agency contracts were examined, and
140,881 chargeable items were evaluated across 1,303 Telstra mobile and voice
telecommunications accounts.
Post-Audit Challenges
The Audit is recommending some substantial changes to the way government procures
and uses ICT services. Existing models that perpetuate government owning and running
non-core, or commodity ICT services, and where industry assume year on year revenue
growth are simply not sustainable.
Change of this nature will mean that not every vendor will be better off. Some vendors will
seek to continue to play to their current strengths and commercial imperatives. The
Queensland Government must be prepared to resist a degree of industry pressure to
maintain the status quo.
Queensland Government ICT Audit 2012: Executive summary
6
Queensland Government ICT Audit 2012
New ICT as-a-Service models will take advantage of current market capabilities and
commercial opportunities. This will present a huge opportunity to industry which has
previously stated they are able to meet the challenge. The government will now need
industry to step up and deliver.
Under these new models there are ample opportunities for Small to Medium Enterprises
to make meaningful contributions. It will be up to these businesses to identify the areas
where they believe they can make a real contribution.
It is imperative that the newfound level of transparency over government ICT is not lost.
As stated earlier, lack of transparency is the single biggest cause of the current situation.
There is value in conducting future audits of a similar type, across other government
entities, and in operationalising and embedding improved transparency across agencies.
In addition, the Audit also makes a number of recommendations and findings which will
require some level of resourcing for the Queensland Government Chief Information Office
(QGCIO) to provide oversight, plus agency resourcing to implement – in addition to
existing QGCIO and agency capacity and priorities.
Queensland Government ICT Audit 2012: Recommendations
7
Queensland Government ICT Audit 2012
Recommendations
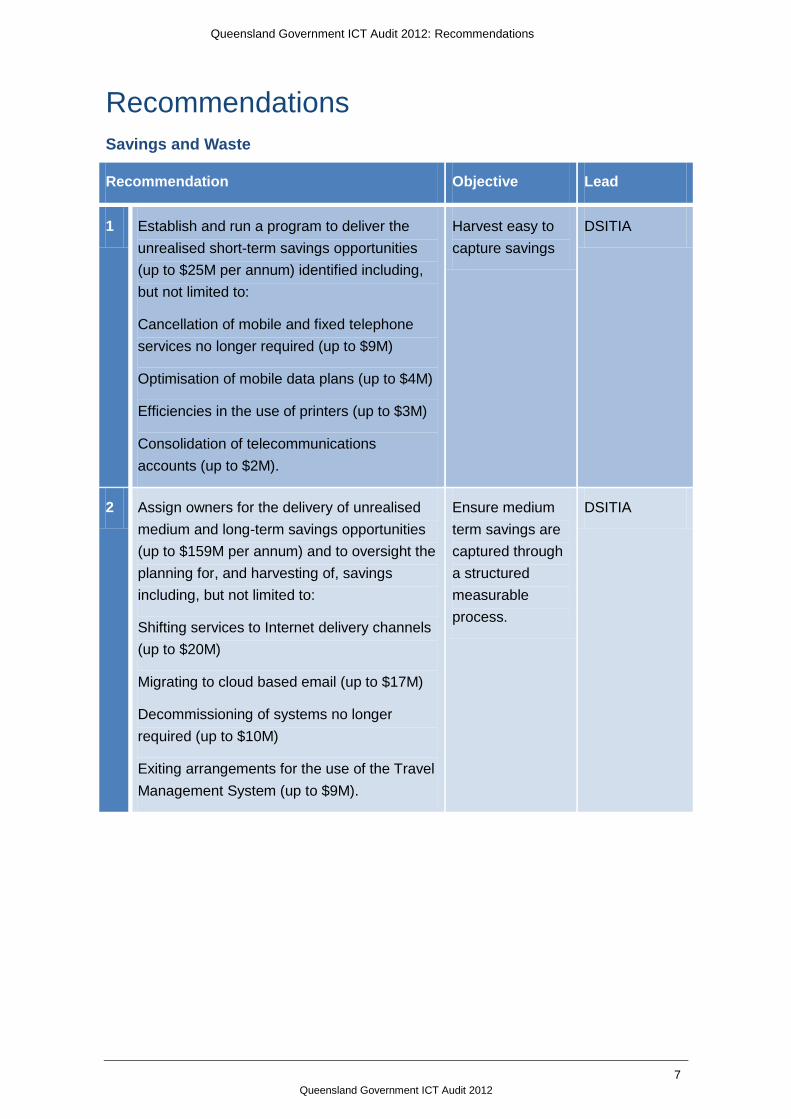
Savings and Waste
Recommendation Objective Lead
1 Establish and run a program to deliver the
unrealised short-term savings opportunities
(up to $25M per annum) identified including,
but not limited to:
Cancellation of mobile and fixed telephone
services no longer required (up to $9M)
Optimisation of mobile data plans (up to $4M)
Efficiencies in the use of printers (up to $3M)
Consolidation of telecommunications
accounts (up to $2M).
Harvest easy to
capture savings
DSITIA
2 Assign owners for the delivery of unrealised
medium and long-term savings opportunities
(up to $159M per annum) and to oversight the
planning for, and harvesting of, savings
including, but not limited to:
Shifting services to Internet delivery channels
(up to $20M)
Migrating to cloud based email (up to $17M)
Decommissioning of systems no longer
required (up to $10M)
Exiting arrangements for the use of the Travel
Management System (up to $9M).
Ensure medium
term savings are
captured through
a structured
measurable
process.
DSITIA

Queensland Government ICT Audit 2012: Recommendations
8
Queensland Government ICT Audit 2012
Critical Business Systems
Recommendation Objective Lead
3 Establish and run projects to perform minimal
necessary upgrades on essential business
systems and technologies for which time
remaining to upgrade or replace is now critical.
Reduce the risk
profile for critical
high risk systems.
Enable suitable
timeframes to
develop longer-
term strategies.
Agencies and
QSS
4 Conduct a review of government services
across every agency to identify services that
must continue to be delivered and services
that can be discontinued or scaled back.
Identify options for improving service delivery
and the business of government.
Simplify the
business of
Government
before fixing
ageing ICT
systems.
Public Service
Commissioner
5 In conjunction with the review of business
services across government, determine the
ICT solution options to underpin those
business services required to be delivered by
government.
Take advantage
of emerging ICT
delivery options.
QGCIO
6 In conjunction with the review of services and
supporting ICT solutions, perform financial
modelling to understand the funding
requirements for alternate delivery approaches
identified.
Ensure initiatives
can be paid for.
Treasury with
QGCIO
7 Prioritise the implementation of service and
ICT reform programs taking into account
business priority, risk, dependencies, capacity
to fund and capacity to deliver.
Ensure initiatives
can be delivered.
Public Service
Commissioner
with QGCIO
8 Prepare a submission for funding of the
resultant program for business transformation
and ICT systems.
Obtain approval
from government.
Public Service
Commissioner
with QGCIO

Queensland Government ICT Audit 2012: Recommendations
9
Queensland Government ICT Audit 2012
Recommendation Objective Lead
9 Establish and run the resultant business
transformation and associated ICT programs.
Implement
necessary
changes.
Agencies with
governance
oversight by
QGCIO
High Risk Systems
Recommendation Objective Lead
10 Initiate and maintain a program of rigorous
application of business continuity planning for
all business critical systems. The programs
must include all parts of the service provider
chain, documented in service level
agreements and contracts, and must be
regularly tested.
Ensure critical
systems have
robust failsafe
mechanisms.
Agencies

Queensland Government ICT Audit 2012: Recommendations
10
Queensland Government ICT Audit 2012
High Risk Initiatives
Recommendation Objective Lead
11 Ensure high risk ICT-enabled projects engage
project management personnel of the highest
calibre, including the replacement of less
capable personnel for projects that have
become high risk during their execution.
Ensure projects
do not fail
because of
inappropriate
staffing.
Agencies
12 Mandate the rigorous application of the
Queensland Government Project and
Program Assurance Methodology for all ICT-
enabled initiatives.
Ensure projects
do not fail
because of poor
hygiene.
QGCIO
13 Obtain independent project assurance for all
high risk ICT-enabled initiatives. Assurance
reports for all high risk initiatives to be
endorsed by the QGCIO and submitted to the
CEO Leadership Team for approval before
projects proceed beyond predetermined
gates. Monthly summaries of approvals and
risk profiles to be provided to the Premier.
Ensure a ‗One
Government‘
approach to ALL
high risk agency
ICT initiatives.
Agencies with
QGCIO and
CEO
Leadership
Team
14 Establish and operate a reporting regime to
provide visibility and transparency of all
initiatives with a total expenditure over $1
million.
Bring
transparency to
the progress of all
ICT initiatives.
QGCIO with
agencies

Queensland Government ICT Audit 2012: Recommendations
11
Queensland Government ICT Audit 2012
Commodity Applications
Recommendation Objective Lead
15 Appoint a CEO level Service Executive for
commodity applications with responsibility
and authority to drive the forward agenda
across government. The Service Executive
for Commodity Applications will be
responsible for the delivery of outcomes in
the transition of government to derive
maximum value from its approach and
investment in commodity applications.
Ensure dedicated
CEO level
accountability to
get the job done.
(Note: This is a
full time role and
not a background
job for an existing
ICT executive.)
DPC
16 Establish technical roadmaps for applications
in each of the commodity domains that
include implementation patterns, and product
and sourcing preferences.
Limit tightly coupled integration of
applications.
Provide direction
to government
and industry.
QGCIO
17 Establish mandates to constrain agency
sourcing activity in commodity application
domains including constraining the platforms
on which they may be deployed.
Reduce
unnecessary
diversity and
complexity.
QGCIO
18 When implementing commodity applications,
agencies must change business processes to
meet the default processes inherent in the
packaged software.
NEVER modify commercially provided
commodity applications to meet unique
business requirements.
Align commodity
business process
to low cost off-
the-shelf
systems.1
Agencies
1 Highly modified commodity applications do not provide any (competitive) advantage for government. All they do is drive
up diversity and costs.

Queensland Government ICT Audit 2012: Recommendations
12
Queensland Government ICT Audit 2012
Payroll Systems
Recommendation Objective Lead
19 Conduct basic technical upgrades for high
risk payroll systems in accordance with
recommendations on critical business
systems with the exception of the DCS
Lattice-based payroll system. Consider using
external organisations to perform some of the
technical upgrades to reduce risk.
Eliminate the risk
of systems that
will not be
supported post
2015.
QSS
20 As an immediate priority, examine external
provision of payroll systems and services for
the replacement of current government
hosted payroll systems. Test the market for
provision of payroll as an externally managed
service - through the conduct of a pilot for a
lower complexity business group within DCS.
For example, employees covered under the
core EBA.
Reduce the
immediate risk
facing the DCS
payroll system
AND understand
alternative
sourcing options.
DCS with QSS
21 When implementing or sourcing payroll
solutions agencies must seek to remove
complexity from awards and where possible
remove regulatory and legislative barriers to
the use of standard UNMODIFIED payroll
products.
Reduce the costs
and risks
associated with
complex payroll
systems.
Agencies
22 Conduct analysis and preparation for
implementation of a payroll managed service
for the remainder of DCS. Consider
opportunities to simplify awards and eliminate
complexity as part of the preparation
activities.
Simplify
requirements as
much as possible.
DCS
23 Develop a business case for the transition of
all government payroll systems to externally
managed services subject to evaluation of
pilots.
Be prepared to
take advantage of
viable sourcing
alternatives.
Service
Executive for
Commodity
Applications

Queensland Government ICT Audit 2012: Recommendations
13
Queensland Government ICT Audit 2012
Finance Systems
Recommendation Objective Lead
24 Conduct basic technical upgrades for high
risk finance systems in accordance with
recommendations on critical business
systems. Consider using external
organisations to perform some of the
technical upgrades to reduce risk.
Eliminate the risk
of systems that
will not be
supported post
2015.
QSS
25 Test the market for provision of finance as an
externally provisioned managed service
through the conduct of a pilot for a selected
government agency or part thereof.
Understand
alternative
sourcing options.
Agency with
QSS
26 Conduct additional analysis on the Health
finance system replacement initiative to
determine the impact of and opportunities
from government adopting an externally
sourced managed services approach to
finance systems.
Understand
alternative
sourcing options.
QH with
QGCIO
27 Develop a business case for the transition of
all government finance systems to externally
managed services subject to evaluation of
pilots.
Be prepared to
take advantage of
viable sourcing
alternatives.
Service
Executive for
Commodity
Applications

Queensland Government ICT Audit 2012: Recommendations
14
Queensland Government ICT Audit 2012
QSS
Recommendation Objectives Lead
28 Conduct internal preparations for transition of
all QSS provided services to external service
provision.
Baseline the QSS
business and
classify service
offerings.
QSS
29 Conduct market engagement to refine models
and options for externally sourced services
for payroll and finance systems and
associated transaction processing services.
This will include consideration of the results of
pilot activities in the external service provision
for payroll and finance.
Understand
alternative
sourcing options
for each service
offering.
QGCPO with
QGCIO
30 Prepare request documents for release to the
market for the provision of payroll and finance
systems and the associated transaction
processing services as an externally provided
managed service.
Provide a
coherent offering
to industry.
QGCPO
31 Execute request to market and manage the
transition to the successful providers.
Select
commercial
providers allowing
time for effective
due diligence
processes.
Service
Executive for
Commodity
Applications
with QGCPO,
QGCIO, QSS
and agencies.

Queensland Government ICT Audit 2012: Recommendations
15
Queensland Government ICT Audit 2012
Commodity Infrastructure
Recommendation Objective Lead
32 Appoint a CEO level Service Executive for
Commodity Infrastructure with responsibility
and authority to drive the forward agenda
across government. The Service Executive
for Commodity Infrastructure will be
responsible for the delivery of outcomes in
the transition of government to derive
maximum value from its approach and
investment in commodity infrastructure.
Ensure dedicated
CEO level
accountability to
get the job done.
(Note: This is a
full time role and
not a background
job for an existing
ICT executive.)
DPC
33 Prepare request documents for release to the
market for the provision of cloud-based email
services in line with the cloud email strategy.
Select core
provider(s).2
QGCPO with
QGCIO
34 Execute request to market (for provision of
cloud based email services) and validate
responses with pilot implementations.
Reduce risk
through local
pilots.
QGCPO with
QGCIO and
pilot agencies
35 Subject to the success of the market
engagement and pilots, manage the transition
of all agencies to cloud-based email services.
Roll out to all
agencies when
production ready.
Service
Executive for
Commodity
Infrastructure
36 Undertake further analysis of the
opportunities to provision desktop services to
government through an externally managed
desktop arrangement, including market
engagement to understand the nature of
current market capability. This analysis must
include consideration of enablement of Bring
Your Own Device (BYOD) opportunities.
Evaluate options
for reducing
desktop costs
AND improving
the capability of
the wider
government
workforce.
Service
Executive for
Commodity
Infrastructure
with QGCIO
37 Subject to the analysis, develop a business
case for the establishment of an externally
managed desktop arrangement.
Seek Go-No-Go decision.
Service
Executive for
Commodity
Infrastructure
with QGCIO
2 Based on the Cloud e-Mail Strategy (2012)

Queensland Government ICT Audit 2012: Recommendations
16
Queensland Government ICT Audit 2012
Recommendation Objective Lead
38 Undertake market engagement activities to
establish a trusted cloud provider for the
Queensland Government.
Establish trusted
arrangements.
Service
Executive for
Commodity
Infrastructure
with QGCPO
and QGCIO
39 Undertake market engagement activities to
establish a panel of providers of cloud
infrastructure services for agency
consumption.
Select a panel of
providers.
Service
Executive for
Commodity
Infrastructure
with QGCPO
and QGCIO
40 Undertake market engagement to determine
the options for transition to a single
government data network for all agencies.
Include consideration of an externally
provided fixed price unlimited consumption
model.
Simplify data
network
architecture and
vendor
management.
QGCIO
41 Develop a business case for transition to a
single government data network
forconsideration.
Service
Executive for
Commodity
Infrastructure
with QGCIO
42 Subject to the successful engagement of
providers for trusted cloud and associated
infrastructure services, establish a program to
actively transition suitable agency workloads
onto cloud-based infrastructure.
Ensure that
transition to the
cloud happens in
a timely manner.
Service
Executive for
Commodity
Infrastructure

Queensland Government ICT Audit 2012: Recommendations
17
Queensland Government ICT Audit 2012
Recommendation Objective Lead
43 Undertake market engagement to determine
options for providing services to deliver
operational management and support for
legacy ICT systems in government data
centres.
Provide a
mechanism for
legacy systems to
be gracefully
exited through a
hospice
environment.
Service
Executive for
Commodity
Infrastructure
with QGCIO
44 Develop a business case for the transition of
legacy ICT systems to externally managed
and supported arrangements, and
seekconsideration.
Service
Executive for
Commodity
Infrastructure
with QGCIO
CITEC
Recommendation Objective Lead
45 Disconnect the entire Confirm business and
operations from CITEC. Commence an
activity to determine the long term future for
Confirm. Find a long term
home for residual
CITEC functions.
DSITIA
46 Undertake analysis to determine options for
delivery of COAG regulatory reform services
(Access Gateway) without Confirm
transactions supporting the cost of the
infrastructure.
QGCIO with
CITEC
47 CITEC to exit all remaining commercial
arrangements. CITEC exits the
ICT infrastructure
delivery supply
chain.
DSITIA
48 Prepare remainder of CITEC for inclusion in
market bid for transition to a Queensland
Government trusted cloud provider.
QGCPO with
DSITIA
Queensland Government ICT Audit 2012: Recommendations
18
Queensland Government ICT Audit 2012
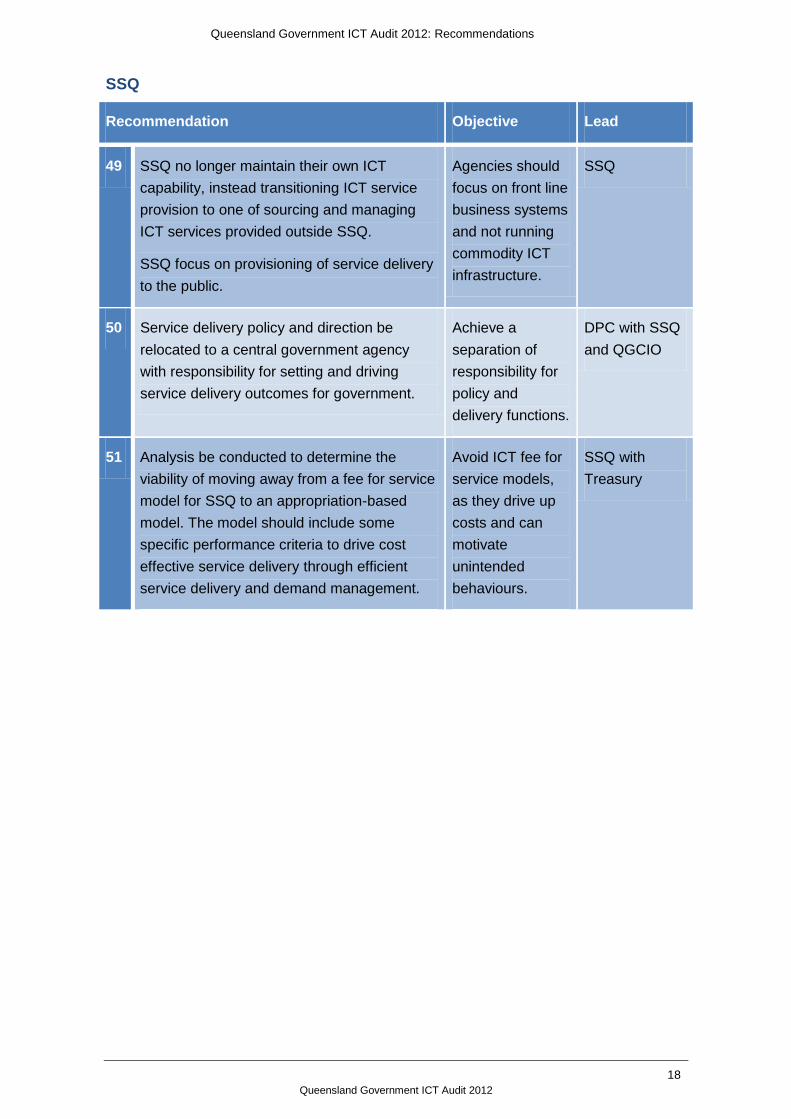
SSQ
Recommendation Objective Lead
49 SSQ no longer maintain their own ICT
capability, instead transitioning ICT service
provision to one of sourcing and managing
ICT services provided outside SSQ.
SSQ focus on provisioning of service delivery
to the public.
Agencies should
focus on front line
business systems
and not running
commodity ICT
infrastructure.
SSQ
50 Service delivery policy and direction be
relocated to a central government agency
with responsibility for setting and driving
service delivery outcomes for government.
Achieve a
separation of
responsibility for
policy and
delivery functions.
DPC with SSQ
and QGCIO
51 Analysis be conducted to determine the
viability of moving away from a fee for service
model for SSQ to an appropriation-based
model. The model should include some
specific performance criteria to drive cost
effective service delivery through efficient
service delivery and demand management.
Avoid ICT fee for
service models,
as they drive up
costs and can
motivate
unintended
behaviours.
SSQ with
Treasury
Queensland Government ICT Audit 2012: Recommendations
19
Queensland Government ICT Audit 2012
Governance and Leadership
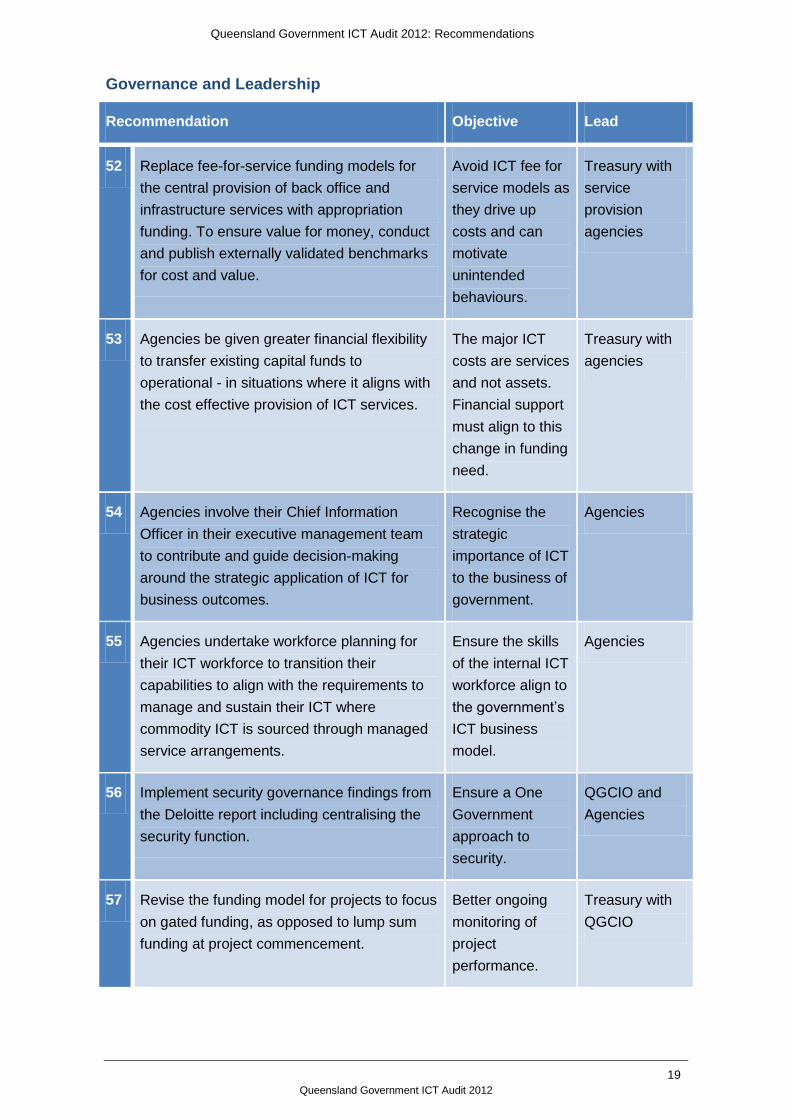
Recommendation Objective Lead
52 Replace fee-for-service funding models for
the central provision of back office and
infrastructure services with appropriation
funding. To ensure value for money, conduct
and publish externally validated benchmarks
for cost and value.
Avoid ICT fee for
service models as
they drive up
costs and can
motivate
unintended
behaviours.
Treasury with
service
provision
agencies
53 Agencies be given greater financial flexibility
to transfer existing capital funds to
operational - in situations where it aligns with
the cost effective provision of ICT services.
The major ICT
costs are services
and not assets.
Financial support
must align to this
change in funding
need.
Treasury with
agencies
54 Agencies involve their Chief Information
Officer in their executive management team
to contribute and guide decision-making
around the strategic application of ICT for
business outcomes.
Recognise the
strategic
importance of ICT
to the business of
government.
Agencies
55 Agencies undertake workforce planning for
their ICT workforce to transition their
capabilities to align with the requirements to
manage and sustain their ICT where
commodity ICT is sourced through managed
service arrangements.
Ensure the skills
of the internal ICT
workforce align to
the government‘s
ICT business
model.
Agencies
56 Implement security governance findings from
the Deloitte report including centralising the
security function.
Ensure a One
Government
approach to
security.
QGCIO and
Agencies
57 Revise the funding model for projects to focus
on gated funding, as opposed to lump sum
funding at project commencement.
Better ongoing
monitoring of
project
performance.
Treasury with
QGCIO

Queensland Government ICT Audit 2012: Recommendations
20
Queensland Government ICT Audit 2012
Maintaining Momentum
Recommendation Objective Lead
58 Establish a program of ongoing reporting
against key ICT management areas. Ensure
QGCIO and agencies are well funded and
resourced to continue this work.
Maintain high
levels of
transparency in
the performance
of the ICT
function across
government.
QGCIO,
Treasury and
Agencies
59 Make the necessary changes to legislation to
allow QGCIO to perform ICT audits of the
remaining areas of government including
government owned corporations.
Look for savings,
risks and benefits
in areas that were
out of scope for
the ICT Audit.
DPC
60 Ensure implementation of approved Audit
recommendations are appropriately funded
and prioritised.
Implement all
recommendations
of the Audit.
Treasury and
CEOs

Queensland Government ICT Audit 2012: Introduction
21
Queensland Government ICT Audit 2012
Introduction

Queensland Government ICT Audit 2012: Introduction
22
Queensland Government ICT Audit 2012
1 Introduction
1.1 Purpose
This report is the final deliverable of the Queensland Government ICT Audit (the Audit),
and includes a detailed assessment of the strengths and weaknesses of the Queensland
Government‘s ICT delivery capability, at both whole-of-government and agency levels
including recommendations for addressing waste, risk, outcomes alignment, resource
impacts and business models.
1.2 Background
On 8 May 2012, Cabinet decided that the Queensland Government Chief Information
Office (QGCIO) lead an audit of ICT management practices and prepare a report for
Cabinet – with the report considering current operations, systems and initiatives across
government, highlighting any high risk projects including cost effective risk management
strategies.
At the same time, Cabinet noted that the QGCIO will report to and provide the Minister for
Science, Information Technology, Innovation and the Arts all deliverables for
endorsement.
1.3 Scope
1.3.1 Organisations
The Audit focused on gathering fully detailed data against all departments of government.
For each of these departments, there may have been specific exclusions against some of
the ICT management areas due to visibility and availability of data. In these cases, a
reduced set of high level information was requested.
Due to the significant and prolonged set of structural changes which took place (during
the Audit) across the sector in response to machinery of government (MoG) changes, it
was generally not possible for agencies to provide meaningful information in a post-MOG
context.
Pre-MoG information has been used where necessary, with additional post-MoG context
provided where agencies have been able to supply it, such as staffing profiles and
structures.
It is important to note that the use of pre-MoG information does not overly inhibit the
accuracy of the Audit‘s findings for a number of reasons:

Queensland Government ICT Audit 2012: Introduction
23
Queensland Government ICT Audit 2012
For the majority of departments, the internal ICT function remained in situ, albeit
needing to accommodate varying levels of adjustment to the department‘s overall ICT
profile.
With regards to the former departments of DERM and DEEDI, the majority of the
resulting post-MoG departments still receive ICT services from (a merger of) the
previous two ICT functions.
The general demographics of the government‘s existing ICT fleet remains the same in
terms of size, shape, condition, risk profile and opportunities.
1.3.2 In-scope
All budget funded departments and their respective central ICT office were in scope for
the Audit, including related out-reach functions and staff that are dispatched into areas
and regions of the department, and which remain under the control of the central ICT
office.
For areas where there was an overlap with other government audits and/or reviews, only
a high level set of information was required.
1.3.3 Out-of-scope
In approving the Audit, Cabinet noted that the scope of the Audit was not to include the
initiation of a full audit of the health payroll system as this was being undertaken through
Queensland Health under the auspices of the Minister for Health.
Subsequent to Cabinet‘s decision to implement the Audit, the Minister for Science,
Information Technology, Innovation and the Arts approved the following scope
exclusions:
Organisations wholly out of scope due to their sheer diversity and number, the Audit
timeframe, relative immaturity with regard to existing data collection mechanisms, and
lack of QGCIO jurisdiction:
government owned corporations
statutory authorities / government commissions / government boards
Queensland Government bodies
All areas of departments where the respective central ICT office does not have
control.
Implementation of recommendations throughout the Audit (including realising savings)
within the current Audit time frame is out of scope for the QGCIO. It is envisaged that this
responsibility will be assigned on a case-by-case basis to subsequent project(s) and/or
relevant government entities where relevant functional control and expertise exists.

Queensland Government ICT Audit 2012: Introduction
24
Queensland Government ICT Audit 2012
1.3.4 ICT management areas
The Audit covered a wide range of interconnected parts, all of which cumulatively provide
the ICT ecosystem that, when optimised and in balance, is cost effective, agile and
innovative - providing efficient government services to front line customers and back
office government functions.
In summary, the analytical framework used in analysing these interconnected parts within
and across agencies, covers five management areas, namely:
ICT strategy and governance – agency and whole-of-government ICT strategies and
governance processes to ascertain their effectiveness in ensuring ICT investments
and strategies are strategically aligned to the business of the government
ICT initiatives – ICT enabled business change activities, projects or programs
identified by government to extend, enhance, replace or transform current ICT-
enabled capabilities, optimise business return and contribute to government priorities
ICT procurement – internal and external sourcing arrangements for ICT goods and
services, the effectiveness of existing models, and general procurement capability
ICT assets and services – existing ICT applications (systems), technologies and
services to assess and compare service performance, understand risk profiles, and
identify opportunities for improvement
ICT service delivery models - organisational structure and staffing profiles, service
delivery models, and performance metrics.
In effect, these five areas comprise a lifecycle view of ICT and address management
capabilities essential to operating a functional ICT organisation. Strategy is formulated
before initiatives, which in turn drive procurement, and result in assets and services.
Subsequent iterations of the ICT management lifecycle form the Service Delivery Model
of an ICT organisation.
Figure 1 - ICT management areas

Queensland Government ICT Audit 2012: Introduction
25
Queensland Government ICT Audit 2012
1.4 Limitations
In approving the Audit, Cabinet authorised that agencies were required to provide the
QGCIO with detailed information as requested and within specified timeframes, on ICT
operations, initiatives, systems, emerging issues and financial resourcing and
procurement arrangements. Information was to be provided as part of the Audit and in an
ongoing capacity to enable independent assurance of ICT investments across
government.
Whilst the responsiveness of departments in providing such information was generally
good, a substantial amount of effort was required within the Audit team and with
departments to address completeness and accuracy aspects across the multiple sets of
information.
The Audit has strongly focused on an evidence based approach to its findings and as
such, is reliant on departments‘ full and timely disclosure in the spirit of the Audit. Where
practical within the time constraints of the Audit, the QGCIO has engaged with
departments in specific discussions to provide the opportunity to better understand
departmental context and to seek further clarification.
1.5 Size and scale of the Audit
In formulating the findings and recommendations of the Audit, an enormous amount of
information was processed, analysed and synthesised as shown in Table 1.
Table 1 - Summary of the amount of information processed by the Audit
Aspect Information processed
Strategy, governance and service delivery
Over 19,000 agency documents were individually reviewed covering areas as diverse as strategies and plans, business cases, governance frameworks, Information Steering Committee minutes, costing models, and risk frameworks.
Across these documents (and numerous CIO interviews), agencies were assessed for performance against 264 attributes, spanning five key disciplines:
management; and service delivery.
Business Cases Documentation relating to 450 initiatives was initially assessed to determine 126 formal or draft business cases. A review of these 126 business cases identified 63 for in-depth analysis. These 63 formed a representative sample for all agencies.
Initiatives 1,100 ICT-enabled initiatives were reviewed, with 50 significant initiatives each receiving a detailed desktop review, and fourteen also receiving an even more detailed drill-down including extensive agency interviews.
Existing applications and infrastructure
In assessing the technical and financial condition of the government‘s existing ICT application fleet and associated technologies, the Audit assessed 1,730 applications and 4,848 infrastructure technologies.
ICT service performance
To assess agency performance and improvement opportunities in key operational ICT areas, the Audit collected and analysed in depth, over 46,000 data elements spanning eight key ICT service areas: voice and mobile telecommunications; print; data network; data centre, storage; hosting; database management software (DBMS); and desktop.
Queensland Government ICT Audit 2012: Introduction
26
Queensland Government ICT Audit 2012
Aspect Information processed
Procurement 140,881 unique chargeable items were reviewed, across 1,303 Telstra mobile and voice telecommunications accounts, with billing data that spanned a six month time period.
84,124 unique agency purchase orders and direct invoices were assessed.
296 agency contracts (awarded during the 2011-2012 financial year), were examined.
ICT Workforce 7,160 staff positions distributed across 60 roles were analysed.
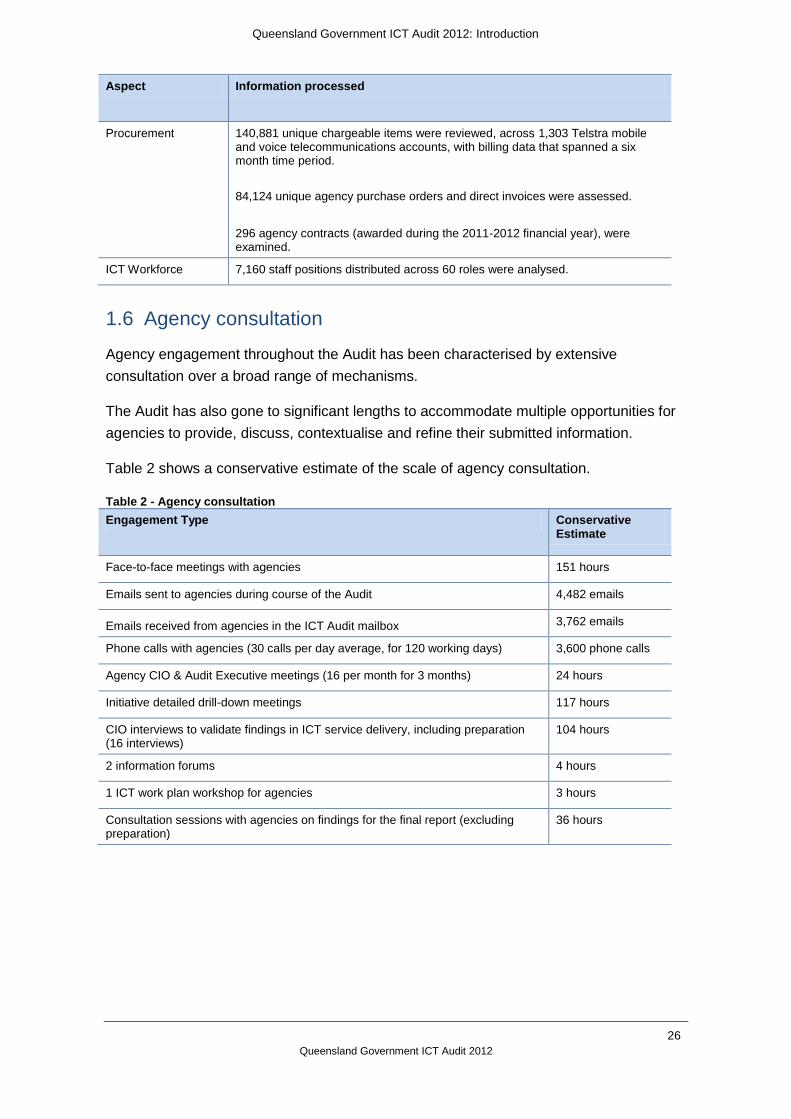
1.6 Agency consultation
Agency engagement throughout the Audit has been characterised by extensive
consultation over a broad range of mechanisms.
The Audit has also gone to significant lengths to accommodate multiple opportunities for
agencies to provide, discuss, contextualise and refine their submitted information.
Table 2 shows a conservative estimate of the scale of agency consultation.
Table 2 - Agency consultation
Engagement Type Conservative Estimate
Face-to-face meetings with agencies 151 hours
Emails sent to agencies during course of the Audit 4,482 emails
Emails received from agencies in the ICT Audit mailbox 3,762 emails
Phone calls with agencies (30 calls per day average, for 120 working days) 3,600 phone calls
Agency CIO & Audit Executive meetings (16 per month for 3 months) 24 hours
Initiative detailed drill-down meetings 117 hours
CIO interviews to validate findings in ICT service delivery, including preparation (16 interviews)
104 hours
2 information forums 4 hours
1 ICT work plan workshop for agencies 3 hours
Consultation sessions with agencies on findings for the final report (excluding preparation)
36 hours

Queensland Government ICT Audit 2012: Introduction
27
Queensland Government ICT Audit 2012
1.7 Navigating this report
The Audit report is structured to allow readers to access those aspects of particular
interest to them without having to work through the entire document. Table 3 shows the
structure of the report as an aid to navigation.
Table 3 - Navigating the report
Report element Purpose
Executive summary High level overview of the report findings and recommendations.
Recommendations All recommendations appear in this section.
Body of the report Discussion of analysis findings and related research.
Appendices Detailed information from analysis to support the discussion in the body.
Annexes Detailed discussion of in depth analysis in each of the key analysis areas. Each annex is a self-contained document with its own summary and table of contents.
Appendix A provides a detailed list of definitions and acronyms used throughout the report.
Queensland Government ICT Audit 2012: Introduction
28
Queensland Government ICT Audit 2012
This page has been intentionally left blank.

Queensland Government ICT Audit 2012: Savings and waste
29
Queensland Government ICT Audit 2012
Savings & waste

Queensland Government ICT Audit 2012: Savings and waste
30
Queensland Government ICT Audit 2012
2 Savings and waste
Findings
Significant annual savings of between $98 million and $185 million can be realised in
the areas of applications rationalisation, business service delivery, ICT efficiency, ICT
vendor management, print services and telecommunications.
Quick win savings opportunities are estimated at between $18 million and $25 million.
There is a high confidence of realising savings of at least $20 million.
Medium term savings opportunities are estimated at between $17 million and $21
million.
A number of other savings opportunities require further investigation estimated to
deliver between $63 million and $138 million.
Savings need to be tracked and measured to ensure the savings continue to be viable
and are realised.
2.1 Introduction
The Audit, through a process of improving visibility of Queensland Government ICT, has
identified significant savings available to the Queensland Government of between $98
million to $185 million per annum. Further analysis indicates a high degree of confidence
that at least $106 million per annum of savings can be realised. Over a three year period
these savings equate to between $294 million and $555 million with a high confidence in
delivery of $318 million.
The opportunities were progressively investigated throughout the Audit to confirm their
viability, the quantum of savings, and to identify appropriate accountability for
achievement. As well as identifying savings, the Audit team progressively and proactively
actioned and realised savings in a number of areas.
2.2 Savings summary
Some of the identified savings could be achieved with minimal effort as the underlying
wastage was due to inadequate cost management. These represent quick wins. For
example, a relatively simple action such as querying a telecommunications bill resulted in
the identification of service provider overcharging of more than $140,000 per annum.
Engagement with the vendor resulted in a refund to the Queensland Government of more
than $400,000.

Queensland Government ICT Audit 2012: Savings and waste
31
Queensland Government ICT Audit 2012
A summary of savings opportunities identified as quick wins is shown in Table 4. Quick
wins are estimated to deliver between $18 million and $25 million. There is a high
confidence of realising at least $20 million.
Table 4 - Quick wins (probable realisation within 6 months)
Savings category Savings sub-category Annual savings
(lower limit)
Annual savings
(upper limit)
ICT Efficiency QGCPO administration charges $1,764,000 $1,800,000
ICT Efficiency Optimise ISP bandwidth costs $1,200,000 $1,400,000
Print services Colour print reduction $600,000 $1,800,000
Print services Print invoice management $100,000 $500,000
Print services Print volume reduction3 $100,000 $1,100,000
Telecommunications Cancel idle fixed line telecommunications services
$4,897,449 $6,529,932
Telecommunications Optimise mobile data plans $3,778,118 $4,722,648
Telecommunications Cancel idle mobile telecommunications services
$2,128,005 $2,837,340
Telecommunications Consolidate telecommunications accounts
$1,548,565 $2,382,408
Telecommunications Reduce fixed voice call costs $587,700 $653,000
Telecommunications Reduce mobile voice costs $457,833 $508,704
Telecommunications Telco service provider billing anomalies
$146,035 $149,015
Vendor management Microsoft true-up cost avoidance $980,000 $1,000,000
Vendor management Microsoft purchase order consolidation
$168,000 $210,000
Vendor management Adobe invoice consolidation $88,000 $110,000
3 Highly dependent on agency commitment to manage printing processes to reduce print volume.

Queensland Government ICT Audit 2012: Savings and waste
32
Queensland Government ICT Audit 2012
Medium term savings are those that are expected to be realised between 6 and 24
months. A summary of these opportunities estimated to deliver between $17 million and
$21 million is shown in Table 5.
Table 5 – Medium term savings (expected realisation between 6-24 months)
Savings category Savings sub-category Annual savings
(lower limit)
Annual savings
(upper limit)
Applications rationalisation Remove dust gathering systems $8,000,000 $10,000,000
Business service delivery Travel Management System (TMS)
$8,800,000 $9,800,000
ICT Efficiency ICT service costing model consolidation
$200,000 $1,000,000
ICT Efficiency Reduce security software licensing $20,000 $100,000
Telecommunications Minimise fixed line fax costs $10,000 $100,000
These quick win and medium term savings must be tracked and measured to ensure the
savings continue to be viable and are realised.
Some of the identified savings require additional investigation to clarify their business
viability. Key dependencies may need to be dealt with and risk mitigation strategies may
need to be put in place before these savings can be realised. In addition, the extent of
change required to realise savings may be more complex and wide-spread. For example,
the transition costs required to migrate to cloud service providers need to be considered
with respect to any savings that may be generated from as-a-service approaches. Based
on analysis to date, savings from cloud infrastructure are estimated to be between $5
million and $12 million.

Queensland Government ICT Audit 2012: Savings and waste
33
Queensland Government ICT Audit 2012
Details of savings opportunties that require further investigation and analysis are shown
in Table 6.
Table 6 - Additional savings (further investigation required)
Savings category Savings sub-category Annual savings
(lower limit)
Annual savings
(upper limit)
Applications rationalisation Decommission CITEC SAP into DSITIA SAP
$300,000 $1,000,000
Business service delivery Services migration to online (internet) channels
$4,000,000 $20,000,000
Business service delivery Vehicle Registration Stickers
$100,000 $3,000,000
Business service delivery Agency library consolidation $100,000 $1,000,000
Business service delivery Optimise websites and website redevelopments
$20,000 $500,000
ICT Efficiency Desktop consolidation and outsourcing
$34,572,000 $40,200,000
ICT Efficiency Data storage consolidation and outsourcing
$10,000,000 $20,000,000
ICT Efficiency Cloud Email $3,770,919 $17,082,582
ICT Efficiency Cloud provisioning of hosting infrastructure
$5,000,000 $12,000,000
ICT Efficiency Minimise transaction costs relating to delivering ICT services
$3,000,000 $10,000,000
ICT Efficiency Optimise ICT asset management $20,000 $500,000
Telecommunications Optimise WAN costs To be quantified To be quantified
Vendor management Right size SAP licences $700,000 $5,500,000
Vendor management Right size software application licenses
$1,400,000 $5,000,000
Vendor management Reduce vendor costs via whole-of-government approach
$50,000 $3,000,000
2.3 Methodology
Given the time and resource constraints of the Audit and the magnitude of savings
opportunities, it was not possible to undertake a full options analysis using a total cost of
ownership (TCO) approach as typically prepared for business cases. Agile approaches
including the relative cost of ownership (RCO) were used in most cases.
Some savings could be measured directly from existing data analysis. Most opportunities
required the collection of new agency or industry information to model the current state of
affairs or trends in both short and long term business expectations.
During the course of the Audit, savings opportunities were tracked against a realisation
framework, shown in Figure 2.

Queensland Government ICT Audit 2012: Savings and waste
34
Queensland Government ICT Audit 2012
The level of confidence for each opportunity naturally increases as it is investigated in
greater depth and moves closer towards the final stage of ‗Realisation‘.
Figure 2 - Savings / waste reduction opportunity realisation framework
Each stage within the framework provides a platform for specific analysis and builds on
the expectation that progressing through to the next stage will ensure savings
opportunities can be harvested. It is also recognised that, during the analysis and
consultation stages, savings opportunities may be deemed no longer viable and will be
subsequently removed from further investigation.
The stages of the realisation framework are defined below:
Idea: Identify a potential savings/waste reduction opportunity and high level options.
Gather data: Collect information to measure a baseline ‗starting point‘ and future options, including raw quantitative and qualitative data.
Analysis: Determine the magnitude of estimated savings for various options, recurrence, and the process (what is) required to harvest the savings.
Consultation: Validate data analysis with key stakeholders.
Decision: Confirm the savings/waste reduction opportunity and establish ownership and accountability for its achievement.
Action: Drive the savings potential and undertake actions required to achieve it.
Realisation: Savings/waste reduction opportunity is achieved.

Queensland Government ICT Audit 2012: Savings and waste
35
Queensland Government ICT Audit 2012
2.3.1 Savings opportunity areas
The Audit further utilised the Gartner Four Levels of Cost Optimisation framework4 to
ensure the coverage of savings opportunities was balanced across IT procurement, cost
savings within IT, joint business and IT cost savings, and business enablement.
Opportunities on the higher levels are more difficult to achieve due to greater change
management impact and lower reliability of information.
Figure 3 - Gartner Four Levels of Cost Optimisation Framework4
4 Gartner, The Four Levels of Cost Optimization, Barbara Gomolski, Kurt Potter, Mark Raskino, 20
January 2009.
Enable Innovation and Business RestructuringImplement process improvement, business restructuring and innovation
Joint Business and IT Cost SavingsImplement cost-saving technologies in conjunction with the business
Cost Savings Within ITIdentify opportunities to reduce IT costs
IT ProcurementGet the best pricing and terms for your IT purchases
Le
ve
l o
f D
ifficu
lty

Queensland Government ICT Audit 2012: Savings and waste
36
Queensland Government ICT Audit 2012
The savings opportunities were subsequently classified to a number of areas that were
both representative of the Gartner framework and regarded as well understood key ICT
service areas and management practices including:
Applications rationalisation
Includes activities that will realise savings by reducing the
level of duplication and complexity in business systems, as
well as retire and decommission legacy and other systems
with low levels of usage.
[Joint business and IT Cost Savings]
Business service delivery
Includes activities that will realise savings by streamlining front
line service delivery and access to Queensland Government
services and information.
[Enable innovation and business restructuring]
ICT efficiency Includes the realisation of savings by changing internal ICT
management practices or adopting alternative service
provision approaches that will lower the per unit cost of key
technologies.
[Cost savings within IT]
ICT vendor management
Includes activities to improve the management of external ICT
vendors and contract arrangements including increased
compliance with current contract and vendor panel
arrangements.
[IT procurement]
Print services Includes the realisation of savings by changing mindsets and
adopting whole-of-government approaches relating to the use
of printers and printer management services.
[Joint business and IT Cost Savings]
Telecommunications Includes the realisation of savings by streamlining and
standardising telecommunications arrangements with vendors
and negotiating value for money services across the sector.
[Joint business and IT Cost Savings]

Queensland Government ICT Audit 2012: Savings and waste
37
Queensland Government ICT Audit 2012
2.4 Opportunity overview
The savings opportunities identified to date are shown in Figure 4 against the backdrop of
the opportunities realisation framework. Opportunities as represented by the circles, are
located in relation to their level of confidence and their stage of analysis. The size of each
circle represents the magnitude of savings in dollar terms with the outer light green circle
indicating the high estimate and the inner dark green circle indicating the low estimate.
This provides a range of potential savings for each opportunity. Appendix B provides
detail of each identified savings opportunity against this framework.
Figure 4 - Savings opportunities
The successful implementation of activities and initiatives in these areas will achieve
savings by streamlining the level of investment in ICT infrastructure and applications as
well as refining ICT management practices. Appendix B outlines the specific activities
required to achieve the savings in each area and which area of government should be
responsible for the realisation of savings.
The following sections provide a detailed description of the dependencies, issues and
risks that may impact the volume of savings achieved along with guidance as to what is
needed to realise the opportunity.

Queensland Government ICT Audit 2012: Savings and waste
38
Queensland Government ICT Audit 2012
2.5 Applications rationalisation
2.5.1 Identification of savings opportunities
Applications rationalisation opportunities were identified through structured analysis of the
reported Queensland Government application portfolio. For analysis purposes, all
reported applications were grouped according to the business functions they support. In
line with the Queensland Government Enterprise Architecture (QGEA), these groups are
known as domains.5 Domains with high numbers of applications indicate a higher
probability of application duplication. Streamlining the number of applications in these
domains by moving business dependencies to more cost effective and technically sound
applications may deliver savings.
The frequency of use, number of users, technical condition, estimated end of life and
annual cost of operating applications were also analysed as part of the Audit. The
analysis identified a number of legacy and dust gathering systems across the sector.
Because of their age and low business importance, these systems are potential
candidates for decommissioning. This will further rationalise the number of applications
and reduce any associated costs across the application portfolio. Applications can be
reduced both within an individual agency and across government.
2.5.2 Dependencies
Realisation of further savings in applications rationalisation is dependent on:
the ability to successfully archive data and records or migrate data and records to
other applications
the ability to successfully subsume the functions of duplicated systems into other
systems in the current portfolio.
2.5.3 Issues and risks
Risks and issues that may impact the realisation of savings in the area of applications
rationalisation include:
agencies that are unable to effectively decommission systems due to records
management legislation implications
the low level of business support for, or resistance to, applications rationalisation
situations where the resources required to rationalise applications outweigh the
efficiencies and savings delivered.
5 The categories used as part of the Queensland Government Enterprise Architecture (QGEA) to provide a consistent and
convenient method of logically grouping business processes, information assets, applications and technologies and ICT initiatives into meaningful and manageable areas for analysis.

Queensland Government ICT Audit 2012: Savings and waste
39
Queensland Government ICT Audit 2012
2.5.4 Looking forward – guidance
In order to remove dust gathering systems, reduce duplication and achieve savings
through applications rationalisation, the following activities should be undertaken:
Continue collaboration with Queensland State Archives to develop and implement an
effective archival strategy for these systems.
Ensure application archival strategies are implemented as part of each agency‘s
application decommissioning activity.
Further investigate the decommissioning of the CITEC SAP system, subsuming the
CITEC instance into the DSITIA SAP instance.
2.6 Business service delivery
2.6.1 Identification of savings opportunities
These savings opportunities were identified through a variety of means including agency
consultation in the early stages of the Audit. Details of the analysis regarding savings
resulting from the decommissioing of the Travel Management System (TMS) are provided
in Appendix C.
While the rationale for savings in these areas is sound and logical, the Audit did
encounter substantial difficulties in collecting reliable evidence to measure the current
state of these business service areas.
For example, full and complete information about the TMS was difficult to obtain from the
Queensland Government Chief Procurement Office (QGCPO), even though QGCIO
asked for specific information and reports which were known to exist and had been
previously sighted. This information was eventually provided to the Audit after multiple
delays and repeated requests.
Measuring the current state of website redevelopments and the benefits of online service
delivery channels also proved difficult as current information about government websites
and online channels across government is out of date and incomplete.
Importantly, the Audit understands the above savings estimates are conservative and
savings are likely to be higher. The analysis of savings opportunities in this area was
impeded by a lack of data quality. To understand the true savings potential, the Audit
recommends further analysis be undertaken in these areas.
2.6.2 Dependencies
Realisation of further savings is dependent on the development of viable business cases
that support the rationalisation of business services to online channels and external
service providers.

Queensland Government ICT Audit 2012: Savings and waste
40
Queensland Government ICT Audit 2012
2.6.3 Issues and risks
There are a number of risks and issues that may impact the realisation of savings though
the rationalisation of business service delivery:
The potential lack of business or ICT support for the adoption of natural systems and
alternative methods for provisioning ICT business service support.
The resources required to rationalise business service delivery may outweigh the
business efficiencies and savings delivered.
The centralisation of services to entities such as Smart Service Queensland may not
be cost effective at the agency level.
The provision of services by external service providers may not be cost effective.
2.6.4 Looking forward - guidance
These savings will be delivered through considered strategies involving rationalisation of
business services and service channels, as well as the adoption of alternative ICT service
options such as natural systems6 (e.g. Webjet.com.au for online flight booking). To realise
these savings, the following activities should be undertaken:
Continue with the current TMS licensing arrangement until end of contract life to
ensure penalties for early exit are minimised.
Negotiate with other service providers to obtain a value-for-money discounted cost,
including:
requesting priority booking during state declared natural disasters
requesting a quarterly spend report, broken up by agencies, to retain a
consolidated view of government travel expenditure.
Benchmark other service providers to ensure on par pricing with tickets purchased
direct from airlines.
Ensure agencies have migrated their processes away from TMS by the end of
contract life.
Undertake a full comprehensive audit of all Queensland Government websites and
associated costs to ascertain where efficiencies and cost savings can be made.
Undertake an audit of current library facilities, costs and capacity to determine if
additional efficiencies can be obtained.
Continue to explore the potential opportunity for savings from the discontinuation of
vehicle registration stickers. 6 ICT solutions that negate the need for an organisation to source their own unique service, whether through buy and run,
build and run, or even outsourced fee for service.

Queensland Government ICT Audit 2012: Savings and waste
41
Queensland Government ICT Audit 2012
2.7 ICT efficiency
2.7.1 Identification of savings opportunities
All Queensland Government agencies were requested to provide information regarding
costs to provide specific ICT services. Agencies were also requested to provide details of
service characteristics, including the units of demand which are primary cost drivers for
each service. The QGCIO subsequently requested price submissions from a
representative group a vendors in order to compare agency and industry prices.
This information was analysed to identify the per unit cost and price for agencies and
industry to provide similar ICT services. Analysing the costs of desktop, data storage and
hosting infrastructure bundles, in particular, highlighted that Queensland has a vibrant
and competitive ICT industry.
The following areas of ICT efficiency were explored: optimise ISP bandwidth costs,
QGCPO administration charges, reduce security software licensing, desktop
consolidation and outsourcing, data storage consolidation and outsourcing, ICT service
costing models consolidating, cloud email, cloud provisioning of hosting infrastructure,
minimising transaction costs and optimising ICT asset management.
2.7.2 Dependencies
Realisation of these savings is dependent on the development of viable business cases
supporting the consolidation and outsourcing of the government desktop computer fleet;
consolidation and outsourcing of data storage, and the industry provisioning of both
cloud-based email and ICT hosting infrastructure services. As with any cloud based
solution, the underlying capability of the network is fundamental to operational
effectiveness.
2.7.3 Risks and issues
There are a number of risks and issues that may impact the realisation of savings in the
area of ICT efficiency:
Identified strategies may conflict with the current business and service delivery
models of both CITEC and QGCPO.
The resources required to migrate to cloud based solutions may outweigh the
business efficiencies and savings delivered.
The consolidation and centralisation of services may not be cost effective at the
agency level.
The provision of services by external service providers may not be cost effective.
The capability of the existing Queensland Government network to support cloud-
based offerings may be inadequate.

Queensland Government ICT Audit 2012: Savings and waste
42
Queensland Government ICT Audit 2012
2.7.4 Looking forward – guidance
Savings can be realised through improved management strategies to increase
performance, cost and demand management of business as usual (BAU) ICT delivery. In
order to realise these savings, the following activities should be undertaken:
Continue to analyse savings opportunities related to minimising transaction costs, to
enable more definitive conclusions post the Audit, including the monitoring of agency
uptake of panel arrangements and report annual savings as part of the ICT Baseline.
CITEC to revise the pricing model for the Queensland Government Internet Service
Provider (QGISP) service to ensure agencies are paying for minimal overheads.
Remove the 2% administration and management fee on whole-of-government
standing offer arrangements.
Queensland Government agencies to adopt a standard costing model developed by
the QGCIO as part the BAU Review.
Establish a panel of security software industry providers for the Queensland
Government.
Implement the recommendations of the cloud email strategy.
Continue to collect data to determine the extent of underutilisation of assets.
Progress the analysis and implmentation of cloud provisioning for ICT hosting
services.
Engage industry providers to ascertain more cost effective solutions for provision of
government data storage.
Consolidate agency data storage services and outsource where cost effective to do
so.
Engage industry providers to ascertain more cost effective solutions for provision of
the government desktop fleet.
Consolidate agency desktop fleets and outsource where cost effective to do so.

Queensland Government ICT Audit 2012: Savings and waste
43
Queensland Government ICT Audit 2012
2.8 ICT vendor management
2.8.1 Identification of savings opportunities
A number of vendors were requested to provide information regarding sales of ICT
products and service to agencies over the past few years. Agencies were also requested
to provide details of significant contract arrangements with significant vendors. QGCPO
also participated in the Audit by providing information regarding agency spend and the
level of agency adoption of whole-of-government procurement agreements in the form of
Standing Offer Arrangements.
The following savings opportunities were explored:
Adobe invoice consolidation
Microsoft true-up cost avoidance
Microsoft purchase order consolidation
right sizing of SAP licenses
ICT license management (minimising unplanned expenditure, right sizing software
application licenses and reducing vendor costs via a whole-of-government approach).
This information was analysed to identify the volume and value of transactions with
significant ICT vendors. In particular, analysing the frequency of purchases of software
licences, highlighted unnecessary management overheads resulting from the purchase
and payment of software licenses more frequently than required. An analysis of Adobe
and Microsoft purchasing behaviour is provided in Appendix D.
The analysis of the software audit reports provided by agencies highlighted further
opportunities to achieve savings through more effective management of software licenses
to reduce the level of true-up7 discrepancy and subsequent liability to additional license
costs.
2.8.2 Dependencies
Realisation of further savings in ICT vendor management are dependent on:
the establishment of up to date agency software registers, including standard
processes to periodically update software configuration information
the establishment of centralised visibility of software deployed by agencies and
agency license entitlements based on up to date software configuration information
central participation in agency negotiations to ensure value for money software
license arrangements, as well consistent terms and conditions across agencies
7 A process initiated by Microsoft to see if you have deployed more software licenses than what your company has licensed
under an agreement or if you have licenses that are currently unallocated.

Queensland Government ICT Audit 2012: Savings and waste
44
Queensland Government ICT Audit 2012
industry accepting the Queensland Government as a single entity
industry licensing arrangements only billing for allocated licenses.
2.8.3 Risks and issues
There are a number of risks and issues that may impact the realisation of savings in the
area of ICT vendor management:
Agencies may not be willing to delegate the negotiation of software license
arrangements to a central authority.
The time taken to process requests through a central authority and governance could
be prohibitive.
Instances may arise where an agency can negotiate a better specific software license
arrangement than a central authority.
Agencies fail to maintain an accurate inventory of software licenses deployed and
total software license holdings.
Agencies fail to comply with software license obligations with vendors.
The complexity involved in the management of whole-of-government licensing and
agency allocations.
2.8.4 Looking forward – guidance
Savings can be realised through improved vendor and licence management. In order to
realise these savings, the following activities should be undertaken:
Establish a current baseline of all software licenses deployed.
Establish a mechanism to enable whole-of-government visibility and management of
all software deployed by agencies, including software licence entitlements.
Identify unutilised licenses and agree with vendors to avoid maintenance changes for
surplus licenses.
Reduce the frequency of raising Adobe invoices to a single quarterly transaction per
agency for licenses purchased and deployed.
Reduce the frequency of raising Microsoft purchase orders and associated invoices to
a single monthly transaction per agency for licenses purchased and deployed.
A central agency procurement group to participate in the negotiation of agency
software licensing agreements with vendors.

Queensland Government ICT Audit 2012: Savings and waste
45
Queensland Government ICT Audit 2012
Potential savings may be realised by engaging with SAP to reduce expenditure on
maintenance of SAP ERP licences to more closely reflect the value of licences in use
by the Queensland Government.
2.9 Print services
2.9.1 Identification of savings opportunities
The savings opportunities in print services were identified by comparing print volumes
and associated print unit costs provided by agencies. The savings identified were
calculated by modelling the total print volumes and colour printing ratios of agencies.
The following assumptions were applied to the calculation of savings in the area of print
services:
Any agency currently below the maximum percentage limit for colour printing will
maintain its existing percentage.
No changes to click charge costs for both colour and black/white will occur. The
simulation maintains current agency negotiated price points.
The following areas of print reduction were explored: colour print reduction, print volume
reduction and print invoice management.The potential savings resulting from a reduction
in the volume of printing is estimated at between $100,000 to $1.1 million per annum.
This estimate is based on the analysis of annual print volumes and modelled to include a
reduction in print volumes of approximately 10%. The potential savings resulting from a
reduction in colour printing is estimated between $600,000 to $1.8 million per annum.
This estimate is based on the analysis of annual print volumes and modelled to include a
reduction in colour printing by approximately 10%.
It is expected these savings will continue to be realised on a recurrent basis. Methods for
achieving a reduction in the volume of printing include but are not limited to:
assigning responsibility for the management and coordination of print services to a
senior level officer
centralising the print service budget, consolidating print related purchases across the
agency as well as tracking print service costs
optimising settings on all print devices. At a minimum, agencies must default all print
devices to monochrome, double-sided, draft print quality with toner saving settings
enabled
actively monitoring printing volumes and ensure colour printing is minimised
developing agency guidelines to raise user awareness regarding print volumes and
how individuals can contribute to a reduction in the level of printing in their day-to-day
work.

Queensland Government ICT Audit 2012: Savings and waste
46
Queensland Government ICT Audit 2012
Importantly, there are greater intangible benefits to this print strategy. The focus on cost
management of the print service, which applies broadly to all government staff, will
stimulate far-reaching cultural change and further innovation on how to improve efficiency
and reduce wastage in other areas of government.
2.9.2 Dependencies
Realisation of further savings in print services is dependent on:
the implementation of whole-of-government policy and guidelines regarding colour
printing and reducing print volumes
implementation of whole-of-government configuration settings on printers
decommissioning of end of life devices
vendors supporting Queensland Government consolidation of print invoicing.
2.9.3 Risks and issues
There are a number of risks and issues that may impact the realisation of savings in the
area of print services:
Agencies may not be able to successfully facilitate a change in user behaviour with
respect to reducing the level of printing.
Agencies may fail to adopt and comply with the whole-of-government policy regarding
colour printing.
2.9.4 Looking forward – guidance
The realisation of savings in print services requires the cooperation of all agencies to
adopt new policy concerning the use of printer services and printer infrastructure. It
involves a change in mindset for all staff to reduce the level of print consumables required
through the use of double sided outputs as well as reducing the level of colour printing in
day-to-day use. Agencies and staff will need to be proactive in identifying practical
strategies to reduce the unnecessary printing of documents. In addition, savings can be
found by taking advantage of industry ‗health checks‘ which model the outcome of
optimising the print fleet and subsequently moving to an outsourced managed service.
The following activities are proposed in order to realise savings in the area of print
services:
Finalise the QGEA policy to reduce the percentage of printouts using colour.
Finalise and distribute the QGEA guideline to accompany the QGEA policy.
Monitor alignment to the policy through the annual QGEA self-assessment process.
Consolidate vendor invoice processing.

Queensland Government ICT Audit 2012: Savings and waste
47
Queensland Government ICT Audit 2012
2.10 Telecommunications
2.10.1 Identification of savings opportunities
A third party, Fastlane Software, was engaged by the Audit to investigate, in detail,
government telecommunications accounts, active telecommunications services including
billing frequency and billing costs. Fastlane Software was engaged to review Telstra‘s
billing data for Queensland Government agencies, to determine what savings might be
available if inactive mobile and voice services were cancelled, mobile voice plans were
optimised, mobile data plans were optimised, fixed voice plans were optimised, and
billing accounts were rationalised.
Fastlane Software provided a report that detailed anomalies in Queensland Government
telecommunication charges against negotiated charge rates, and areas where the
Queensland Government could optimise or eliminate expenditure. Details of this analysis
are provided in Appendix E.
As a result of the telecommunications analysis a number of savings opportunities were
identified, including:
reduced billing charges resulting from anomalies in telecommunications vendor billing
processes
rationalisation of telecommunications services and accounts to minimise invoicing
costs and reduce the service charges for unused telephone numbers and mobile
accounts
maintaining current and accurate inventories of telecommunications services.
2.10.2 Dependencies
Realisation of further savings in telecommunications is dependent on the continued
monitoring of vendor call costs and services charges in an environment that encourages:
centralised oversight of telecommunications, including participation in contract
management negotiations with agencies to ensure that agencies receive consistent
value for money
central visibility of all carrier billing information
redeployment of telecommunications services and equipment from one agency to
another, where early termination of the service is not cost effective or permitted under
contract arrangements.
2.10.3 Risks and issues
There are a number of risks and issues that may impact the realisation of savings in the
area of telecommunication services:
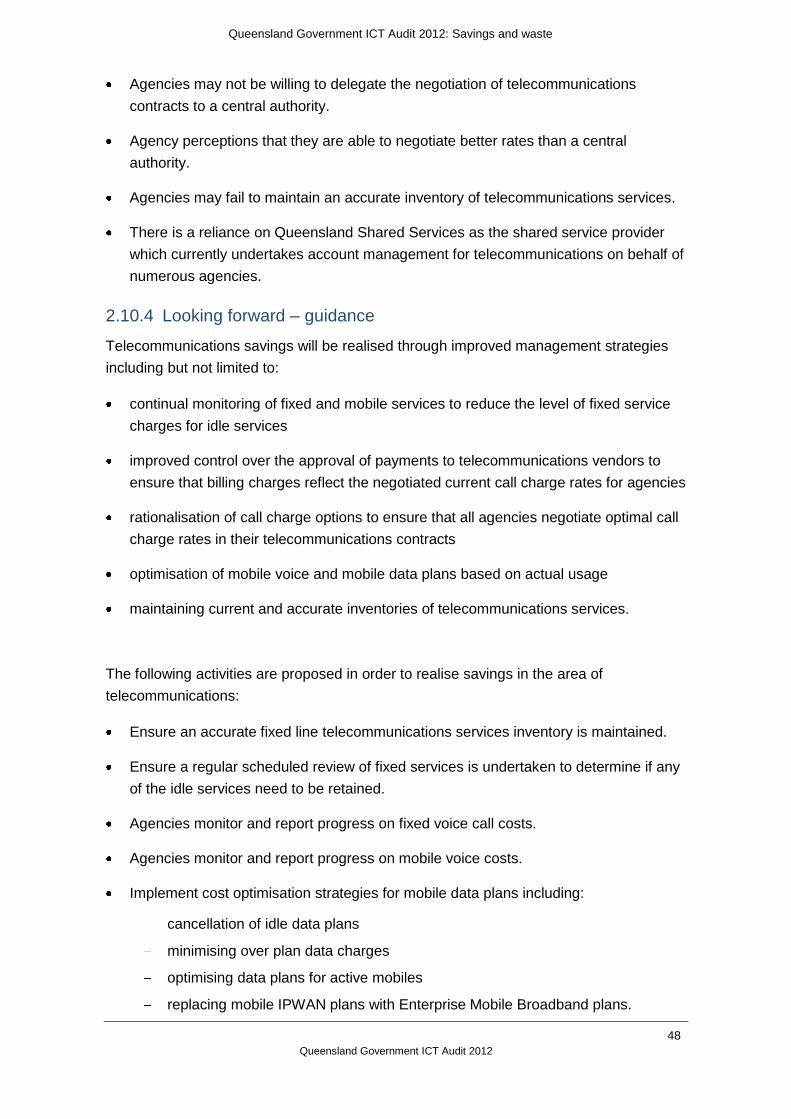
Queensland Government ICT Audit 2012: Savings and waste
48
Queensland Government ICT Audit 2012
Agencies may not be willing to delegate the negotiation of telecommunications
contracts to a central authority.
Agency perceptions that they are able to negotiate better rates than a central
authority.
Agencies may fail to maintain an accurate inventory of telecommunications services.
There is a reliance on Queensland Shared Services as the shared service provider
which currently undertakes account management for telecommunications on behalf of
numerous agencies.
2.10.4 Looking forward – guidance
Telecommunications savings will be realised through improved management strategies
including but not limited to:
continual monitoring of fixed and mobile services to reduce the level of fixed service
charges for idle services
improved control over the approval of payments to telecommunications vendors to
ensure that billing charges reflect the negotiated current call charge rates for agencies
rationalisation of call charge options to ensure that all agencies negotiate optimal call
charge rates in their telecommunications contracts
optimisation of mobile voice and mobile data plans based on actual usage
maintaining current and accurate inventories of telecommunications services.
The following activities are proposed in order to realise savings in the area of
telecommunications:
Ensure an accurate fixed line telecommunications services inventory is maintained.
Ensure a regular scheduled review of fixed services is undertaken to determine if any
of the idle services need to be retained.
Agencies monitor and report progress on fixed voice call costs.
Agencies monitor and report progress on mobile voice costs.
Implement cost optimisation strategies for mobile data plans including:
cancellation of idle data plans
minimising over plan data charges
optimising data plans for active mobiles
replacing mobile IPWAN plans with Enterprise Mobile Broadband plans.

Queensland Government ICT Audit 2012: Savings and waste
49
Queensland Government ICT Audit 2012
Ensure an accurate mobile telecommunications services inventory is maintained.
Ensure a regular scheduled review of mobile services is undertaken to determine if
any of the idle services need to be retained.
Consolidate telecommunications accounts to minimise invoice processing costs and
enable savings from service provider discounts relating to intra-account billing.
Ensure agency telecommunications service provider invoicing is validated.
Agencies review their use of dedicated fax machines and retire or substitute these
with multi-function devices at end of life. Incorporate guidance strategies into agency
ICT asset management plans and strategies.
Conduct activities post the Audit to continue to analyse savings opportunities related
to optimising wide area network (WAN) costs.

Queensland Government ICT Audit 2012: Savings and waste
50
Queensland Government ICT Audit 2012
This page has been intentionally left blank.
Queensland Government ICT Audit 2012: Total ICT replacement cost
51
Queensland Government ICT Audit 2012
Total ICT replacement cost

Queensland Government ICT Audit 2012: Total ICT replacement cost
52
Queensland Government ICT Audit 2012
3 Total ICT replacement cost
Findings
The total ICT replacement cost has been calculated to be at least $7.4 billion.
Using the current funding approach, the Queensland Government is unable to service
the existing level of ICT replacement cost required to replace and maintain existing
systems.
A new approach is required including targeted investment in upgrades and
replacements as well as a shift to alternative methods of providing business and ICT
services.
3.1 Introduction
Total replacement cost is an estimate of the budget that is likely to be needed to maintain
the integrity of the ICT portfolio at an acceptable level for the needs of the business. Total
replacement cost accrues normally as part of an ageing system or technology platform.
Unless an organisation makes adequate annual financial allowances to service the total
replacement cost, system maintenance and replacement can suffer impacting on critical
frontline services that rely upon ICT.
Where total replacement cost is not sufficiently addressed over a prolonged period, the
scale and complexity of aged end-of-life systems and technologies requiring replacement
can create systemic business risk, particularly for large organisations.
The Audit has identified total replacement cost, and lack of adequate measures to
address it, as a major systemic issue within the Queensland Government‘s ICT portfolio.
3.2 Quantifying the cost
The total ICT replacement cost has been calculated to be at least $7.4 billion.
3.2.1 Components of the total ICT replacement cost
Year-on-year cumulative funding restrictions have resulted in core systems and
infrastructure being used beyond expected lifespans. They are in poor technical
condition, lack vendor support and there is an inability to absorb and accommodate
changed business requirements. Ultimately this has led to an increased total replacement
cost and higher risk to the government.
The total replacement cost is made up of various components of the ICT stack, as shown
in Figure 5. As we move up the stack, there are reported technology replacement costs,
projected application replacement costs and estimated business process and service
delivery costs required to implement any replacement.
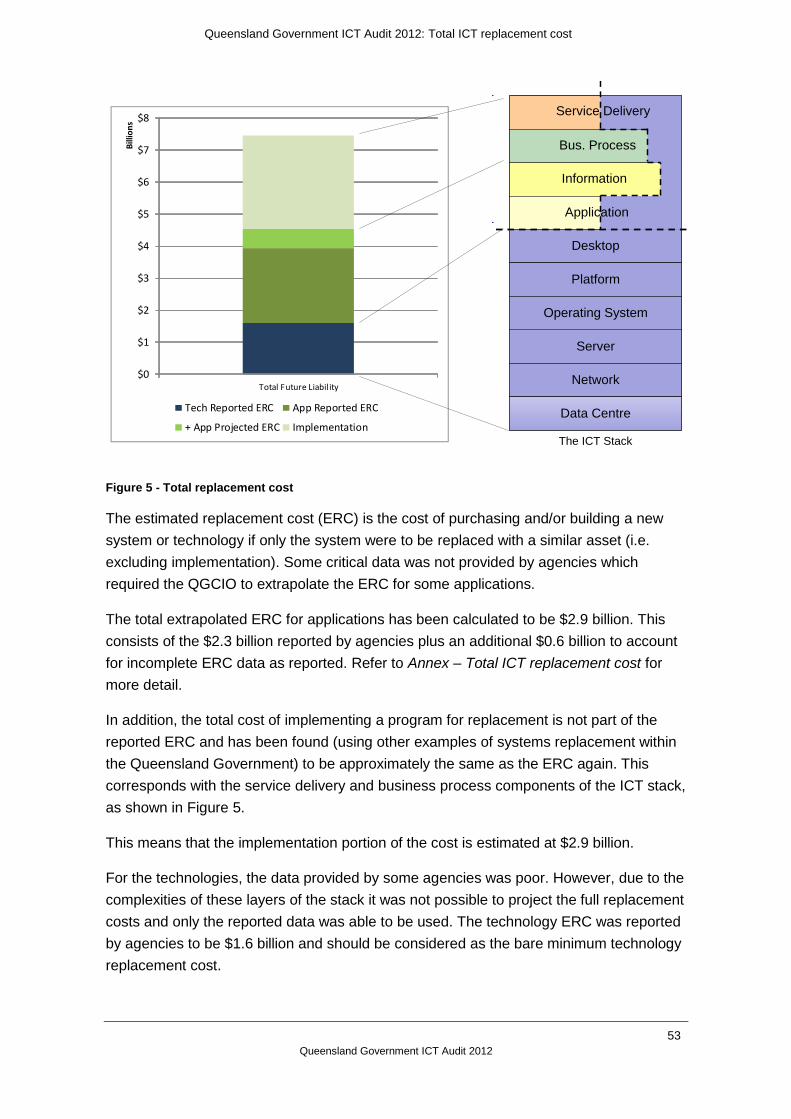
Queensland Government ICT Audit 2012: Total ICT replacement cost
53
Queensland Government ICT Audit 2012
$0
$1
$2
$3
$4
$5
$6
$7
$8
Total Future Liabil ity
Bill
ion
s
Tech Reported ERC App Reported ERC
+ App Projected ERC Implementation
Desktop
Network
Server
Operating System
Platform
Data Centre
Commodity
CommodityCore
Information
Bus. Process
Application
Service Delivery
The ICT Stack
Figure 5 - Total replacement cost
The estimated replacement cost (ERC) is the cost of purchasing and/or building a new
system or technology if only the system were to be replaced with a similar asset (i.e.
excluding implementation). Some critical data was not provided by agencies which
required the QGCIO to extrapolate the ERC for some applications.
The total extrapolated ERC for applications has been calculated to be $2.9 billion. This
consists of the $2.3 billion reported by agencies plus an additional $0.6 billion to account
for incomplete ERC data as reported. Refer to Annex – Total ICT replacement cost for
more detail.
In addition, the total cost of implementing a program for replacement is not part of the
reported ERC and has been found (using other examples of systems replacement within
the Queensland Government) to be approximately the same as the ERC again. This
corresponds with the service delivery and business process components of the ICT stack,
as shown in Figure 5.
This means that the implementation portion of the cost is estimated at $2.9 billion.
For the technologies, the data provided by some agencies was poor. However, due to the
complexities of these layers of the stack it was not possible to project the full replacement
costs and only the reported data was able to be used. The technology ERC was reported
by agencies to be $1.6 billion and should be considered as the bare minimum technology
replacement cost.

Queensland Government ICT Audit 2012: Total ICT replacement cost
54
Queensland Government ICT Audit 2012
The ICT replacement cost is therefore a sum of these three component parts.
Implementation: $2.9B
Application projected ERC: $2.9B
Reported technology ERC: $1.6B
Total replacement cost: $7.4B
3.3 Causes
The relative independence of agencies has fostered the build-up over time of a high
degree of unnecessary diversity, complexity and waste in ICT systems and underpinning
infrastructure.
Added to this multiplicity of systems are years and layers of over-customisation of
systems – effectively tying the business very tightly to specific vendor products and
software versions.
It should be noted that often this over-customisation is a result of poor business
processes and archaic industrial rules or legislation which transfer the problem to the ICT
platform, instead of tackling the true problem itself – re-engineering/simplifying the
business rules, applying more standardised processes and revisiting legislation which
have been layered upon layer over the years.
This tight coupling reduces the government‘s options for making step-change
transformations, and makes it very expensive, time consuming and difficult to move away
from a vendor product or even to upgrade (with all the complex customisations) to a
newer version.
A prominent example of the difficulty the government currently faces is in upgrading
finance or payroll systems.
As a result of this complexity, combined with ageing platforms, agencies are struggling to
maintain currency with vendor versions, manage operational costs, actively manage
security risks and source the wide range of skills required to support these systems. This
complexity is further compounded by machinery of government changes affecting
ownership of assets and associated funding. Differences in business priorities between
current and receiving agencies often lead to diminished use and functionality of some
systems or additional customisation to align with new priorities.
Agencies have become locked into costly extended vendor support arrangements over
and above the funding of upgrade and replacement initiatives. Approximately 14% of
technologies are subject to extended support arrangements.
Projects to deal with the individual issues become hard to fund and establish, let alone
deliver successfully due to compressed timeframes, resource shortages, and complex,
dynamic business requirements.

Queensland Government ICT Audit 2012: Total ICT replacement cost
55
Queensland Government ICT Audit 2012
Queensland Government ICT capital spend on ICT projects is approximately 12% of the
ICT budget, compared to other state and local government metrics of around 20%.8 This
demonstrates a comparative underspend on systems replacement, limiting growth and
transformation in ICT enabled services.
There is a lack of forward planning and funding for the replacement of major systems and
technologies. In some instances agencies have not considered appropriate lead times, or
budgeted sufficiently for asset replacement initiatives.
3.4 Replacement cost for applications
The Queensland Government has a significant portfolio of software supporting the
business of government. Based on agency provided information on 1730 applications
across all departments the associated replacement cost totals approximately $5.9 billion
with a like-for-like replacement strategy.
Figure 6 - Replacement cost for applications by priority
ICT expenditure year on year has been maintained at around $1.6 billion per year in
recent years. This expenditure has been applied to all aspects of ICT including day-to-
day operations, and projects for changes and additions to the ICT portfolio. Current
funding levels are inadequate to cater for the required replacement program using a like-
for-like replacement strategy. Figure 7 shows the projected expenditure required if all
reported applications were to be replaced no later than 5 years past their current reported
end of life date.
8 ICT Key Metrics Data 2012: Key Industry Measures: Government: State and Local Analysis: Multiyear, Gartner,
December 2011.

Queensland Government ICT Audit 2012: Total ICT replacement cost
56
Queensland Government ICT Audit 2012
Figure 7 - Modelled applications expenditure profile
The model assumes that each project will conform to a profile based on its size that
includes a level of lead time to prepare for the replacement as well as an implementation
period. It also assumes that all of the applications will be replaced and that they will be
replaced with an equivalent application. The model schedules all priority one applications
before scheduling all priority two and so on. It also includes an annual inflation figure of
2.5% on the costs. The primary constraints the model was driven to achieve were to
minimise the amount of time that applications remain in production beyond their reported
end of life date, and to keep total annual expenditure below a cap.
While the assumptions in the model are not a perfect reflection of reality, it does provide a
reasonable approximation of the forward expenditure required to support the current
approach. It is estimated that $200 million of the $1.6 billion currently spent annually on
ICT could be applied to the replacement of existing systems. This implies that continuing
the current approach will require an additional $600 million - $700 million in years 2 to 6.
It is clear that alternate strategies are needed to address the provision of ICT support for
the business processes that are currently underpinned by the applications reaching end
of life.
3.5 Addressing replacement cost
Injecting funds to immediately stabilise core government systems is imperative to
maintain current service delivery. However, continuing to inject large amounts of
investment in the context of the current ICT environment would only add to an inherent
ongoing and long term problem with the maintenance of systems, and it would not be
long before the same replacement cost problem would occur.
Addressing the current backlog of application upgrades and replacements requires
government-wide formal prioritisation. Implementation for high risk applications must be
commenced while alternate business models and delivery strategies are determined for
the remainder.

Queensland Government ICT Audit 2012: Reduce complexity
57
Queensland Government ICT Audit 2012
Reduce complexity
Queensland Government ICT Audit 2012: Reduce complexity
58
Queensland Government ICT Audit 2012
4 Reduce complexity
Findings
Reduce the size of the problem
Value the right things – Don‘t have complex solutions and processes for things that
are low value
Understand the broader impacts of seemingly small and straight forward decisions
The whole is greater than the sum of the parts
Leverage new industry capabilities to deliver ICT services in different ways
Change the funding model to encourage innovation and remove limitations on
performance.
Introduction 1.1
It is clear from the Audit that the government‘s ICT portfolio is approaching an
unsustainable state. A large proportion of the government‘s ICT is in need of replacement
or upgrade. The asset base is a fragmented, disconnected collection of a wide variety of
software and technology. The level of specialisation is very high to the point where
generic products are almost never used without modification. The ICT workforce is
heavily concentrated on keeping everything running. The strong preference is for in-
house delivery and for build rather than buy off-the-shelf. ICT management has become
about managing the risk associated with the asset base rather than driving increased
business value.
The solution to reach a sustainable state is to reduce the complexity of the ICT asset
base and how it is managed.
Unlimited power
Consider for a moment the way we consume electricity. Power is provided to our homes
and businesses in a reliable manner by a third party. The third party is responsible for
worrying about all of the issues associated with power generation and delivery. Everyone
else simply consumes it without a second thought on how it got there. No-one except for
people in power generation has to ensure that the coal hopper at the power station is full
and ready to use.
In ICT, government has taken responsibility for more of the supply chain than necessary
or even optimal. In essence, government is worrying about ICT‘s coal hopper equivalent.

Queensland Government ICT Audit 2012: Reduce complexity
59
Queensland Government ICT Audit 2012
Principles for reducing complexity 1.2
4.1.1 Reduce the size of the problem
Reducing complexity in a large complex organisation is a difficult problem because it‘s
simply too big to deal with. The best approach to this issue is to have a smaller problem.
There are a number of ways the government can reduce the problem in ICT complexity:
Get out of the business of building and running commodity systems.
Turn off unwanted systems.
Leverage Natural Systems.
Only manage commodity arrangements once.
Eliminate internal charging models.
Commodity systems
Commodity systems are those systems that are readily available from the market as
packaged solutions. For example, there are standard software solutions for things like
customer relationship management, financial management, etc. The government spends
53% of its application spend on applications in commodity domains, and 41% of its (ICT)
people resource running commodity infrastructure. These numbers don‘t include the
number of senior executives whose capacity is consumed overseeing activities that are
simply not core government business.
New models are available for procuring commodity applications (for example, software-
as-a-service) and commodity infrastructure (cloud-based infrastructure-as-a-service).
There is a significant opportunity for government to reduce cost and remove the
distraction of having to manage commodity environments. However, if real value is to be
delivered adoption must be accompanied by a fierce determination to adopt without
customisation whenever possible.
Unwanted systems
Approximately 9% of the government‘s application portfolio can be turned off without any
impact on the business of government. All that is required is a process to decommission
them and a location to store or dispose of information in line with legal disposal
schedules. The Queensland State Archives has been championing for a digital repository
for almost 10 years without any support from government. This facility would allow for 160
applications to be decommissioned. In addition to reducing complexity, decommissioning
these applications would save $8 million per annum.
Queensland Government ICT Audit 2012: Reduce complexity
60
Queensland Government ICT Audit 2012
Leverage Natural Systems
The Audit found cases where systems were built or acquired to fill a business need that
could have easily been served through the use of Natural Systems. Natural Systems are
ICT systems that exist commercially providing better practice and fit for purpose solutions
that negate the need to have an in-house system at all. For example, every airline has an
extremely capable, publicly accessible Natural System for booking flights.
Accommodation can be booked through Wotif.com with minimal cost overheads.
Compare that to the high cost to acquire and operate the Travel Management System
currently in use and the government stands to save $8 million to $10 million per annum.
Natural Systems should be used as a first preference, where they exist, thereby avoiding
the costs and management overheads associated with government sourced solutions.
Only manage commodity arrangements once
Today there are 19 Agencies and with the exception of six which are serviced by
Information and Technology Partners, each one manages the supply of commodity
services (examples include: telecommunications, e-mail, calendaring, document
management, and so on). These services should all be delivered in the same way by a
limited set of vendors with central administration of the arrangement. Importantly this
does not mean that a new system is required when Natural Systems offered by vendors
can be leveraged. Even when Natural Systems are not available, they can be requested
as part of negotiating the vendor arrangements.
Eliminate internal charging models
The Audit does not support charge back models or models that involve internal fees.
These simply create more complexity and overheads. Their purpose is often to limit
demand – an outcome that is rarely achieved. If services are to be provided centrally they
should be free for agency use. Any demand management initiatives should be carefully
considered and monitored over time to ensure they are driving the desired behaviours.
Eliminate unwanted processes
Travel management is an example where an initially sound business objective (reduce /
manage government spending) actually increased costs and failed to achieve best price
arrangements. When government invests in processes designed to reduce costs there is
always a commensurate increase in costs – cost to implement and manage the new
processes.
Red tape reduction is about reducing processes and process complexity – reducing
steps. Whenever new processes are proposed (generally to increase governance
controls) it is critical that these processes are clinically reviewed to ensure the net effect
is a benefit to government.

Queensland Government ICT Audit 2012: Reduce complexity
61
Queensland Government ICT Audit 2012
Conclusion
If the government no longer owns or manages commodity systems, turns off unwanted
systems, consolidates the management of commodity arrangements, eliminates internal
charging models, removes unnecessary processes and improves remaining process, the
size and complexity of ICT in government will be heavily reduced.
4.1.2 Value the right things
The business of government needs a good base. ICT is the fundamental infrastructure of
a modern government. Core to that infrastructure is the ability to communicate and work
together through one network underpinned by robust identity management, good security,
good communications, and quality collaboration tools (e-mail, messaging, video
conferencing and so on). If these are effective and cost free for agencies then innovation
will no longer be constrained by internal funding models or switching costs from
inappropriate channels.
4.1.3 Understand impacts of seemingly harmless decisions
Over the past 12 years agencies have acquired or built ICT infrastructure and systems
with varying degrees of constraint. Often new systems were acquired primarily for their
ability to meet the unique business requirements of a part of the agency. Each acquisition
has contributed to the complexity and duplication within the total ICT asset base. New
systems often depended on technical components that were not part of the agency‘s
current ICT architecture, so these were also added. Machinery of government changes
often meant those new systems and technologies were subsequently transferred to a
new host agency with a different diverse portfolio of ICT.
Every small decision has the potential to complicate the operation, licensing and
management of the government‘s ICT portfolio. The more complex the portfolio, the more
difficult it is to manage and change - increasing the cost incurred in doing so.
4.1.4 Don‘t be captured by vendors
Vendors look to establish long term relationships with clients. Some do this through
contractual arrangements (for example, committed spend arrangements, multi-year
enterprise licensing arrangements), some do this through good service / customer
relationships, and others look to lock the government in as long term customers through
integration and complexity.
Vendors that are driven and measured by quarterly sales targets have a focus on making
their numbers each quarter. The most effective way to achieve this is to create a critical
dependency that prevents the customer from moving away. One prominent example in
the Queensland Government is the use of the Microsoft desktop.

Queensland Government ICT Audit 2012: Reduce complexity
62
Queensland Government ICT Audit 2012
Much of the government‘s application access is dependent on a Microsoft Windows
access device. As a result, when the desktop products become unsupported the
government has no choice except to continually perform expensive and resource
intensive upgrades, for as long as the dependency remains.
This report recommends ways to identify and resist vendor lock-in. Vendor lock-in is
never good for government. Vendors who practice this believe that it‘s good for their
business. The Queensland Government intends to change this position.
4.1.5 The whole is greater than the sum of the parts
Sometimes local sub-optimisation can lead to whole of organisation optimisation. Parts of
government must be prepared to be adequate or even slightly sub-optimal so the whole
organisation can excel.
However, this must not be translated to mean one size always fits all. The Audit found
that some of the failings of the ICT-related shared service providers have been a result of
trying to ‗shoehorn‘ all parts of government into one type of solution. In doing so, they
were then forced to make the solution overly complex to cater for the differing business
needs of the different agencies resulting in unnecessary expense.
4.1.6 Don‘t sweat the little things
The Audit found that agencies sometimes focus on the wrong things in an attempt to
comply with government policy and as a result miss the larger opportunities. For example,
agencies spend time and effort chasing the costs associated with employees personal
phone calls when there are significant savings to be made from ensuring those same
phones are on the correct plans.
The Audit also found that improvements in vendor and contract management has the
largest potential to deliver reduced costs. It is vital that agencies have a mechanism to
understand whether they are getting the best value from contractual arrangements on an
ongoing basis.
What does this mean in practice 1.3
In practice this means that agencies of the Queensland Government must make a shift in
how they think about and make decisions about using ICT to underpin the business of
government.
More and more commodity ICT will be provided through external vendor arrangements
allowing agencies to concentrate on more of their core business. Government owned ICT
infrastructure will reduce over time resulting in a shift from capital expenditure in ICT
towards operating expenditure to deliver the same capability. Simplification of the ICT
portfolio will ensure that change is easier and less costly.

Queensland Government ICT Audit 2012: Reduce complexity
63
Queensland Government ICT Audit 2012
More active management of the value derived from arrangements and associated active
management of vendors will be required.

Queensland Government ICT Audit 2012: Reduce complexity
64
Queensland Government ICT Audit 2012
This page has been intentionally left blank.
Queensland Government ICT Audit 2012: Applications
65
Queensland Government ICT Audit 2012
Applications

Queensland Government ICT Audit 2012: Applications
66
Queensland Government ICT Audit 2012
5 Applications
Findings
The current application portfolio across government is complex, nearing or past end
of useful life, and beyond the limits of budget to replace.
New approaches are required to deal with replacement of legacy applications at end
of life – current approaches are too complex, too slow and too expensive.
Significant duplication exists across the application portfolio with many agencies
implementing different customised systems to meet the same business need.
Almost 10% of the application portfolio across government could be decommissioned
once an appropriate archive strategy has been identified.
Some of the application portfolio across government can be delivered through
commodity applications without customisations but require changed business
processes in agencies.
Independent agency software acquisition without consideration of opportunities or
constraints across or within departments is a leading cause of the current disarray.
Shared service solutions in human resources and finance have been of limited
success and face significant challenges going forward.
5.1 Introduction
The application portfolio of government is its lifeblood in terms of support for key business
processes and provision of information to operate and manage the business. A strong
application portfolio is essential for high performing and vibrant business.
The Audit is the first time the entire application portfolio of government has been visible
with all of its value, risk, coverage, complexity and flaws. The analysis of the application
portfolio has revealed areas of particular challenge from an ICT perspective, especially
within the current government context.
The replacement cost for the application portfolio is a significant issue that has a major
impact on how the government approaches the replacement of applications reaching end
of life (see section 2– Total ICT replacement cost for detail). The annual expenditure
required is $600 million to $700 million above the current provision in years 2 through 5.

Queensland Government ICT Audit 2012: Applications
67
Queensland Government ICT Audit 2012
5.2 Current state of application portfolio
The 1730 applications reported to the Audit represent a small fraction of the total
application software in place in agencies. It is estimated that the true number of software
applications deployed is in the order of 20,000 to 30,000 applications.9 While the number
reported is a small fraction of the total number of applications, the reported applications
represent the substantial application software underpinning the business of government.
Within the 1730 reported applications, significant applications10 account for 22% of the
number and 65% of the cost.
Figure 8 - Proportion of significant applications by number
Figure 9 - Proportion of significant applications by spend
The average planned life of applications across the government is 10.3 years with the
average life for significant applications being longer at 13 years and the remaining
applications life being shorter at 9 years. The reason for this variance is that the
significant applications are overall, larger and more complex than other applications, and
are therefore more expensive and more difficult to replace. Significant applications also
tend to be those supporting stable business activities such as legislated processes.
9 20,000 to 30,000 is an estimation based on discussions with agencies. These applications, while large in number, are all
small in profile often serving only a very small number of users. Some examples, include Lotus Notes applications, Microsoft Access databases, and so on. 10
Applications that have been identified by CIOs and QGCIO as of interest, in the media, in prior audits, as critical systems or have an annual operating expenditure greater than $1M per year.
22%
78%
Number of Applications (n=1730)
Significantapplications
Other applications
65%
35%
Annual Application Spend ($547M)
Significantapplications
Other applications

Queensland Government ICT Audit 2012: Applications
68
Queensland Government ICT Audit 2012
To determine the risk associated with the application software, the technical condition of
each of the applications was assessed by the owning agency using a standard
methodology. Technical condition is an assessment of an application‘s health in terms of
its performance, maintainability, and alignment with the corporate architecture and best
practices. Across the 1730 reported applications 25% (424) were assessed as being in
poor technical condition, but only 9% (36) of the 388 significant applications were
assessed as being in poor technical condition.
These proportions of applications in poor technical condition are not alarming since
technical condition often declines with the age of an application. However, when
considered along with the end of useful life for the applications the true state of the
portfolio becomes clearer. The program of work undertaken to address the Y2K bug in
the late 1990s had the unplanned side effect of synchronising the end of life dates for
many of government‘s key systems. By December 2015, 77% of the reported applications
will be at or past their end of useful life, 84% by December 2016, 91% by December
2017, and 100% by December 2021.
Figure 10 - Percentage of total applications reaching end of life by year
A detailed analysis of this situation can be found in Annex – Significant and high risk
systems.
The software applications of government underpin all of its service delivery and
operations. Thus it is vital to deliver a level of capability that allows the government to
continue to operate after an application is no longer capable of servicing that need.

Queensland Government ICT Audit 2012: Applications
69
Queensland Government ICT Audit 2012
In the past, the most common approach has been to upgrade or replace ageing
applications. However, this approach is time consuming, expensive and difficult when the
application is not standard off-the-shelf software. Across the 1730 reported applications,
57% are custom built, 36% are based on off-the-shelf products and the remaining 7% are
procured as a service. Even within the off-the-shelf products, agency Chief Information
Officers commonly report high levels of customisation.
Figure 11 - Application acquisition strategies
The combination of poor technical condition, complex, custom applications all reaching
end of life in a short time horizon dictates that a different strategy will be needed to
provide the required level of capability. Continuing to source that capability through
heavily customised or purpose-built applications software is no longer sustainable.
A common approach in agencies to date has been to build or customise and deploy
application software to precisely reflect the current business process with all its inherent
complexity and misalignment with the available products. Failing to review the business
processes and challenge the need for the complexity or local nuances has resulted in
overly complex, expensive and difficult to maintain application software. It also results in
lengthy replacement projects when the applications reach end of life.
The Audit did not capture the level of customisation in individual packaged applications.
However, agencies have stated that the majority of their commercial off-the-shelf product
based solutions have been customised to some degree. The customisation is a by-
product of the approach taken to acquire solutions to business needs. The typical
approach has been to perform a requirements gathering exercise to gather the detailed
requirements and then attempt to procure software that best meets the requirements. The
software almost never meets all of the requirements and results in a lengthy, expensive
and complex process to customise.

Queensland Government ICT Audit 2012: Applications
70
Queensland Government ICT Audit 2012
The other dominant approach taken is where agencies review the software market and
determine that there are no candidate products on offer and, having reached that
conclusion, commence a software build project, typically in-house.
Both of these approaches can result in suboptimal solutions for the following reasons:
Specifying highly detailed and specific requirements may eliminate viable potential
products from consideration and often biases selection towards rigid solutions rather
than flexible solutions.
Heavy customisation results in upgrades or replacements that are complex, time
consuming and expensive.
Failure to consider changes to the business process to meet the software market
misses opportunities to simplify and improve the performance of the business.
In house builds create a long term dependency on maintaining those skill sets and
knowledge. While it may provide a very good fit to the current business, it also creates
long term risk and expense.
End of life migration away from heavily customised products and custom built
software is difficult and expensive.
Heavily customised products causing reliance and lock-in to specific vendors and
technology.
After the software is no longer used, it leaves behind a significant overhead with the
requirement to store and access the records it held.
It is clear that before application software is replaced or acquired the business must be
reviewed to ensure the business model is appropriate. The business processes can then
be revised to align with the application software to the highest possible degree.
5.2.1 Application platform complexity
Application software has evolved through the years in ways that have increased the
complexity of the operating environments on which they are built and run. Modern
environments have a much larger number of platform components upon which the
modern applications are dependent, as shown in Figure 12.

Queensland Government ICT Audit 2012: Applications
71
Queensland Government ICT Audit 2012
Figure 12 - Evolution of application architecture
However, this does not mean that applications are now smaller. Figure 12 shows the
increasing complexity for equivalent applications over time. In general, applications are
now much larger and richer than in past decades.
The Audit found that agencies have adopted these complex application architectures, as
shown in Figure 13 and Figure 14. The mixture of shapes used in each of these figures is
purely to aid in differentiating the (plotted) items which relate to each figure‘s respective
legend.
Application
Hardware Hardware
Operating System
Application
Hardware
Operating System
Database
Session Management
Hardware
Hypervisor
Database
Portal
Application
Operating System
Virtual Machine
Application Server
Rules engine
Integration
Authentication
1960s 1970s 1980s 2000s
Application
Evolution of application architecture

Queensland Government ICT Audit 2012: Applications
72
Queensland Government ICT Audit 2012
Figure 13 - Application platform software complexity by agency
Figure 14 - Application software engine complexity by agency
Many of the deployed applications are now dependent on inherently complex
environments. The impact of this is increased cost and complexity in the replacement or
upgrade of current applications.

Queensland Government ICT Audit 2012: Applications
73
Queensland Government ICT Audit 2012
This also points to a level of duplication in the types of platform technologies resulting
from the procurement of best fit applications, and the need to deploy the associated
infrastructure to implement them. The complex technology environments for the portfolio
of applications should be rationalised and simplified as the applications are replaced or
upgraded.
5.2.2 Application duplication
The potential scale of application system duplication is highlighted by considering
reported application assets against discrete application domains. Duplication occurs
when multiple systems support the same, or similar, business services or processes. The
Audit reviewed the functional breadth of applications at a high level which only provides
indicative information as to the potential duplication with other applications in the same
domain. A detailed assessment of each application is required to validate each potential
duplication.

Queensland Government ICT Audit 2012: Applications
74
Queensland Government ICT Audit 2012
Table 7 shows the top 12 application domains where there appears to be high levels of
duplication.
Table 7 - Application system duplication
Application Domain11
CIT
EC
DC
S
DE
ED
I
DE
RM
DE
T
DJA
G
DL
GP
Do
C
DP
C
DP
W
QH
QP
S
QS
S
SS
Q
TM
R
Tre
asu
ry
TO
TA
L12
Information Provision 4 16 29 59 16 48 1 40 6 10 44 4 1 1 12 5 296
Human Capital Management 8 9 9 6 7 7 2 10 5 12 10 17 24 1 4 2 133
Financial Management 10 2 3 6 9 13 15 2 10 8 5 29 1 4 5 122
Case Management 6 4 4 4 26 19 38 1 1 3 2 108
Customer Service and Support 3 5 3 4 11 23 1 13 4 10 2 3 8 3 4 97
Document and Records Management 7 6 10 3 12 4 13 4 10 9 3 7 3 91
Information Submission 1 4 3 9 6 13 4 13 4 22 1 80
Enterprise Business Intelligence 1 5 4 5 7 3 1 8 1 4 5 1 4 13 6 68
Research 15 1 3 4 32 3 58
Authorities, Licences, Permits and Awards 2 13 8 1 11 2 3 1 1 1 2 9 54
Scheduling and Bookings 1 2 2 6 2 6 4 8 2 2 3 38
Maintenance Management 4 2 1 2 2 1 4 6 22
Domains associated with agency service delivery, such as Information Provision, would
appropriately tend to have multiple applications to cater for the specialised nature of the
service delivery. However, application domains related to standard back office processing
such as financial management and human resource management would be expected to
provide standard functionality across agencies. There should be minimal duplication in
these domains.
11
Includes all systems that have 50% or more functionality relating to the domain OR have been identified as significant applications for this audit. 12
A single application could be mapped to two domain if it contains significant functionality from both domains

Queensland Government ICT Audit 2012: Applications
75
Queensland Government ICT Audit 2012
The Audit has identified substantial application duplication in the following domains where
standard functionality could be expected:
Human Capital Management
Financial Management
Case Management
Document and Records Management
Scheduling and Bookings.
This duplication represents wasted effort and expenditure as a result of the specialisation.
This complexity of the application environment impacts on the agencies agility to respond
to changes in requirements, legislation or government direction. Further, duplication of
front office activities causes inconsistent service delivery to the Queensland public and
businesses.
5.3 Commodity applications
Every part of the business of government is underpinned by application software. The
growth in application software within government has been organic with software being
developed or acquired in response to a business need. The application software available
from suppliers has also been growing organically with a significant body of commercial
off-the-shelf software products available today. An examination of the software market
mapped onto the domains of the QGEA and the business of government provides insight
into the potential to identify which domains have commodity solutions.

Queensland Government ICT Audit 2012: Applications
76
Queensland Government ICT Audit 2012
Figure 15 shows the domains in which commodity solutions are prominent.
Figure 15 - Commodity domains
In domains where commodity applications exist the following principles should be applied:
Standard software solutions must be used.
Configuration of the software is permitted.
Business processes must be changed to meet the functionality of the software to the
maximum extent possible.
Customisation of the software must be limited to only absolutely essential
modifications.
Software must not be extended; instead it must be loosely integrated with other
systems and components.
Software must be purchased as a service where possible.
Software must be deployed in a minimal number of instances across government.
This approach will see the government move resources away from commodity
applications over time, minimise complexity in those domains, standardise processes,
knowledge and skills, minimise expenditure and allow business areas to concentrate on
line of business specific activities.

Queensland Government ICT Audit 2012: Applications
77
Queensland Government ICT Audit 2012
5.4 Payroll systems
Payroll systems are specialist systems within the Human Resource Management domain
designed to calculate and trigger the disbursement of the salaries and wages for
employees. These systems require significant input data each fortnight. Integration
between systems that gather the required input data and the payroll system and between
the payroll system and the financial system is essential.
The total number of reported payroll systems is 14. Since the machinery of government
changes following the election, the staff of a single new agency may be fragmented
across as many as eight different payroll systems.
Figure 16 - Count of payroll systems by agency
The example that has some of its staff in each of 8 different payroll systems is DSITIA.
This is a dramatic illustration of the impact of machinery of government changes on
applications. In this case, each system delivering payroll for some staff members in
DSITIA was commissioned for a different department and staff have not yet transitioned
to a system commissioned specifically for DSITIA.
Figure 17 - Payroll systems mapped to business area for DSITIA
DSITIA
DPW
Aurion 9
DPW (CITEC)
Aurion 10
DEEDI
SAP HR 4.6c
DPC
Aurion 10
DPW
SAP HR 4.6c
DERM
SAP HR 4.6c
Collaborations and
Science Research &
Business Innovation
QSA
QSS
SSQ
DPW
SAP HR 4.6b
Environment and
Resource Sciences
& Climate
CAA & Arts
CITECChief Scientist
& QGCIO
DPC
Aurion 9

Queensland Government ICT Audit 2012: Applications
78
Queensland Government ICT Audit 2012
Payroll systems are implemented across government through a range of different
software applications – SAP, Lattice and Aurion for core payroll systems of departments;
and, Ellipse for payroll in QBuild within the Department of Housing and Public Works.
Many of these products are nearing end of support and, in the case of Lattice, past end of
support. This poses issues with respect to the maintenance of the taxation rules, which
are typically kept up to date through patches to the product / system provided by the
vendor as part of the support agreement. Once out of support these updates will have to
be applied by the provider of the service if that is even possible. Lattice has been
internally supported for a number of years.
Table 8 - End of support dates for payroll products
Payroll Product Current end of vendor support13
Number of agencies using product14
SAP HR 4.6b Jul-15 3
SAP HR 4.6c Jul-15 7
SAP ECC5 Jul-15 3
Lattice 2.5 Jun-08 1
Lattice 3.1 Jun-08 1
Aurion 9 Jul-13 13
Aurion 10 TBA 1
Ellipse Oct-14 1
The Software Solution (TSS) version 5.2.1
Oct-13 1
The implementation of payroll systems is inherently complicated as a result of the
complexities of the awards under which an employee‘s pay is calculated and the
associated taxation and legal requirements. This is further complicated by the
implementation of other payroll related components such as rostering, time capture, and
recruitment management, etc. Limiting the scope of implementation of payroll systems to
essential components will increase the chance of success of those implementations.
However, additional components may be leveraged to simplify processes to gather the
required input data for a pay run, which in turn may reduce the manual effort required to
execute a pay run.
As with other packaged software solutions, the implementation of a packaged payroll
system should be such that it is contained to configuration of the software with
customisation of the packaged solution only where absolutely essential to comply with
legislation, regulation or awards.
13
Vendor support includes mainstream support and extended vendor support arrangements such as those procured from SAP by QSS. 14
Count includes agencies where only part of the agency is serviced with the product

Queensland Government ICT Audit 2012: Applications
79
Queensland Government ICT Audit 2012
Business processes within agencies and in the provider must be changed to meet the
software package rather than changing the software. Award simplification and legislation
changes should be favoured over customisation of packaged software.
Payroll solutions are currently commercially offered in multiple models. The traditional
model is the licensing of a commercially developed product configured and deployed
inside the target organisation. This is the model that has been deployed in the
Queensland Government. Newer models offer the delivery of the software-as-a-service,
hosted in a vendor organisation and accessed from within the target organisation. In
addition, the host organisation may also manage the entire business process end-to-end
delivering all payroll processing as well as the software solution.
While the more contemporary models have not been deployed in the Queensland
Government to date, they are now mature and offer a viable alternative to the traditional
approach. Given that payroll is considered a commodity application and business
process, it is preferable to not provision this kind of application software from within
departments or internal-to-government service providers, subject to being able to secure
appropriate service quality and charging.
Success with internal implementation of payroll systems has been mixed. Recent high
profile failures in the Health payroll highlight the risks associated with failed
implementation. The current process to implement a replacement for the Lattice-based
payroll system deployed in the Department of Community Safety is rated as a very high
risk project. There are issues with ownership, governance and approach that are
highlighted elsewhere in this report. The Department of Community Safety‘s payroll
systems is a prime candidate for considering a different approach to implementation.
5.5 Human resource systems
A Human Resource (HR) system encompasses HR policies and ICT technologies to
enable administrative control of various components including some or all of:
payroll
time and attendance
appraisal performance
benefits administration
HR management information system
recruiting/Learning management
performance record
employee self-service

Queensland Government ICT Audit 2012: Applications
80
Queensland Government ICT Audit 2012
scheduling/rostering
absence management.
It is clear that HR functionality covers the entire spectrum of activity involved in
maintaining a well-managed capable workforce.
In addition to the core payroll systems of government, the Audit identified 160 other
systems with a significant HR component. These systems are typically used to provide
subordinate HR capability for a portion of the business of an agency.
While application software support for the HR function is clearly required, it is also clear
that the diversity of products underpinning the applications across the government is
overly complex.
Figure 18 - Diversity of HR products reported across government
There are strong linkages between the different aspects of HR systems and the software
supporting the payroll function; however, the connection and distinction between them
has often been blurred. This is a by-product of the approach taken by software vendors to
increase their market share and the desire by HR business units to have a single all-
encompassing solution. Over the last 10 to 15 years this has resulted in the adoption of
Enterprise Resource Planning solutions like SAP for HR and payroll with their associated
complexity and expense of implementation.

Queensland Government ICT Audit 2012: Applications
81
Queensland Government ICT Audit 2012
However, not all human resource management functionality is supported through the core
HR and payroll system of departments. These systems are supplemented by a large
variety of human resource management functions embedded in other systems.
Information flows between the payroll system and other functions supporting human
resource management are essential for successful payroll processing. For example, time
worked information is a vital input to the payroll calculation. Tight coupling between the
systems that provide information to the payroll calculation and the payroll calculation itself
creates undue complexity in implementation and management.
As noted earlier in this report, HR systems have become commodity systems. The
appropriate approach is for solutions to be acquired and configured without customisation
– preferably as a service with business processes changed to meet the capabilities
offered by the system. This has not been the approach to date. With HR systems in all
agencies reaching end of life by July 2015, it is appropriate that as they are replaced it is
done as a commodity system.
5.6 Finance systems
The finance systems across government have achieved a level of standardisation
through the implementation of standard products via the corporate solutions program.
This has resulted in broad adoption of SAP – core finance system for all departments –
and Finance One – core finance system for Corporate Administration Agency and Arts
Queensland.
The implementation of SAP for finance is currently spread across six versions of SAP –
3.1h, 3.1i, 4.0b, 4.6b, 4.6c and ECC5. This comes with issues of upgrade timelines with
extended support for the older versions of SAP ending in July 2015. A program to migrate
these implementations to an alternate platform, either a later version of SAP or some
other delivery platform, must be implemented as a matter of some urgency if unsupported
platforms are to be avoided.
Table 9 - End of support dates for finance products
Finance Product Current end of vendor support Number of agencies using product15
SAP 3.1h Jul-15 1
SAP 3.1i Jul-15 2
SAP 4.0b Jul-15 1
SAP 4.6b Jul-15 3
SAP 4.6c Jul-15 10
SAP ECC5 Jul-15 12
15
Count includes agencies where only part of the agency is serviced with the product
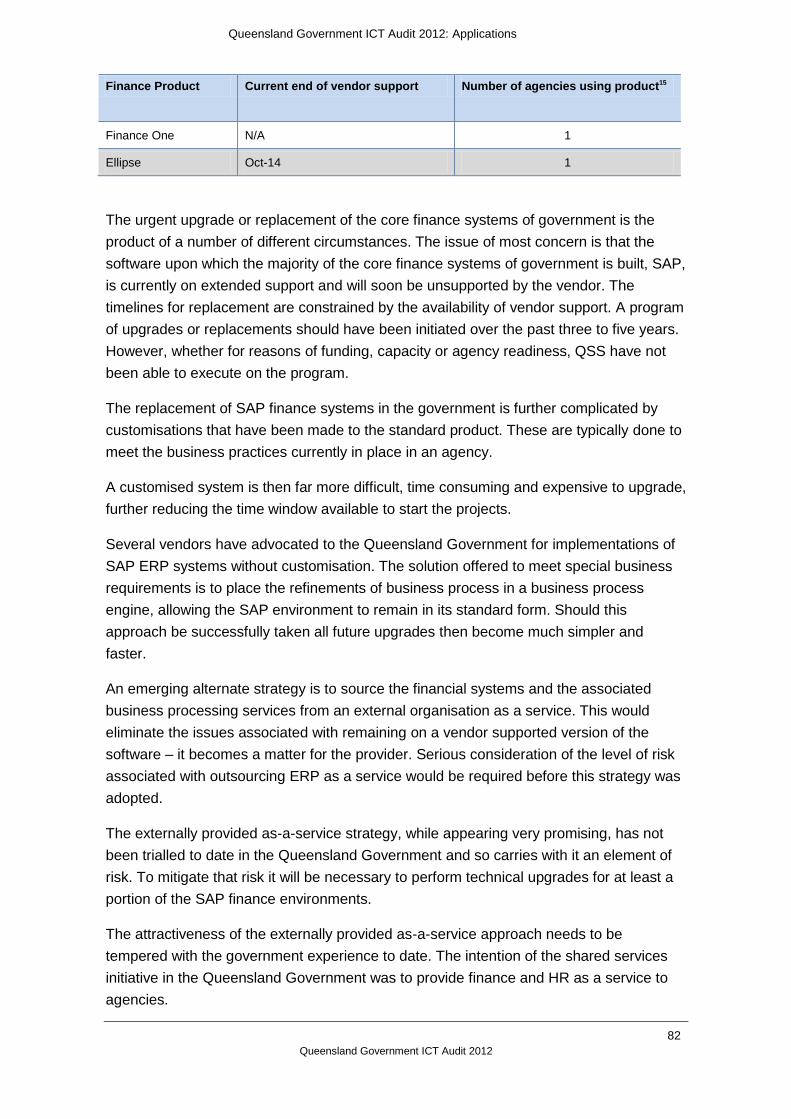
Queensland Government ICT Audit 2012: Applications
82
Queensland Government ICT Audit 2012
Finance Product Current end of vendor support Number of agencies using product15
Finance One N/A 1
Ellipse Oct-14 1
The urgent upgrade or replacement of the core finance systems of government is the
product of a number of different circumstances. The issue of most concern is that the
software upon which the majority of the core finance systems of government is built, SAP,
is currently on extended support and will soon be unsupported by the vendor. The
timelines for replacement are constrained by the availability of vendor support. A program
of upgrades or replacements should have been initiated over the past three to five years.
However, whether for reasons of funding, capacity or agency readiness, QSS have not
been able to execute on the program.
The replacement of SAP finance systems in the government is further complicated by
customisations that have been made to the standard product. These are typically done to
meet the business practices currently in place in an agency.
A customised system is then far more difficult, time consuming and expensive to upgrade,
further reducing the time window available to start the projects.
Several vendors have advocated to the Queensland Government for implementations of
SAP ERP systems without customisation. The solution offered to meet special business
requirements is to place the refinements of business process in a business process
engine, allowing the SAP environment to remain in its standard form. Should this
approach be successfully taken all future upgrades then become much simpler and
faster.
An emerging alternate strategy is to source the financial systems and the associated
business processing services from an external organisation as a service. This would
eliminate the issues associated with remaining on a vendor supported version of the
software – it becomes a matter for the provider. Serious consideration of the level of risk
associated with outsourcing ERP as a service would be required before this strategy was
adopted.
The externally provided as-a-service strategy, while appearing very promising, has not
been trialled to date in the Queensland Government and so carries with it an element of
risk. To mitigate that risk it will be necessary to perform technical upgrades for at least a
portion of the SAP finance environments.
The attractiveness of the externally provided as-a-service approach needs to be
tempered with the government experience to date. The intention of the shared services
initiative in the Queensland Government was to provide finance and HR as a service to
agencies.

Queensland Government ICT Audit 2012: Applications
83
Queensland Government ICT Audit 2012
However, the service offered has been limited to core functionality requiring agencies to
augment with their own systems and creating dependencies that constrain upgrades.
In addition to the core finance systems of government, the Audit identified 122 other
systems with a significant financial component. These systems are typically used to
provide subordinate financial transactional capability for a portion of the business of an
agency. These systems overall are in moderate to good technical condition with a
requirement for replacement over the next two to three years.
5.7 Legacy systems
The National Association of State Chief Information Officers (NASCIO) in the United
States of America defines a legacy system as:
A Legacy System is not solely defined by the age of IT systems (e.g. 20 years) as there
are many systems that were designed for continued upgrades, but the term also focuses
on elements such as supportability, risk and agility, including the availability of software
and hardware support, and the ability to acquire either internal or outsourced staffing,
equipment or technical support for the system in question. The term may also describe
the system’s inability to adequately support line-of-business requirements or meet
expectations for use of modern technologies, such as workflow, instant messaging (IM)
and user interface.16
Within the Audit, a legacy application is classified as having one of the following
attributes:
1) An age greater than the average age of all government systems.
2) Past its end of useful life date.
3) In poor technical condition.
By this definition approximately 52% of the reported applications are classified as legacy
systems.
This should not be interpreted to mean 52% of the application portfolio needs to be
decommissioned. All of the applications reported to the Audit represent systems of
substance to the business of government. The legacy classification implies that those
applications have additional risk associated with them and they will need some action to
be taken in the near term to ensure the business of government can be continued.
16
Digital States At Risk! Modernizing Legacy Systems, National Association of State Chief Information Officers (NASCIO), December 2008.
Queensland Government ICT Audit 2012: Applications
84
Queensland Government ICT Audit 2012
5.7.1 Factors leading to legacy systems
An examination of the factors that have resulted in the high level of legacy applications
reveals the following systemic issues:
Insufficient funds available for provisioning ICT resulting in:
stretching the application portfolio beyond its normal useful life
deferred maintenance and upgrade of existing applications becoming the norm.
A lack of structured analysis of the application portfolio as input to strategic plans.
Poor performance management of the application portfolio.
Mass customisation of packaged software making updates and upgrades expensive
and difficult.
Strong preference for custom built applications.
Business areas are separately funded to develop their own business solutions without
any consideration of the current application portfolio.
Subsequent limited business area willingness to fund ongoing upgrades combined
with limited appreciation for the risks associated with legacy applications.
Machinery of government changes moving ownership to departments with
incompatible technical architectures and implementation priorities.
Complex diverse heterogeneous environments that complicate maintenance and
upgrades.
The legacy problem is not confined to applications, legacy applications predominantly
depend on legacy infrastructure. The need to maintain legacy infrastructure has also
been seen to drive poor application decisions, with that same infrastructure becoming the
default preference for new applications. Further, the dependencies between the
applications and the infrastructure and between the various elements of legacy
infrastructure can be shown to be a significant constraint to moving to newer generations
of application platforms.
5.8 Dust gathering systems
The Audit has revealed a class of legacy systems which continue to incur an ongoing
operational expense but for which the business value is extremely low or zero. The Audit
refers to these systems as dust gatherers. In many cases these systems are being
maintained to meet an occasional business need of retrieving old records from the
system. Of the 1730 applications of substance reported to the Audit, 9.3% were found to
be dust gatherers.

Queensland Government ICT Audit 2012: Applications
85
Queensland Government ICT Audit 2012
The majority of these applications can be decommissioned; however, the major
impediment to decommissioning is retaining access to the records contained in the
system for occasional business reference. The Queensland Government does not have a
general purpose facility for the preservation of digital public records. Without such a
facility each agency has to provide its own mechanism to retain records in an accessible
form. For example, Queensland Shared Services have a facility for maintaining historical
records from government finance and HR/payroll systems that they manage on behalf of
agencies.
The dust gatherers that agencies consider to be suitable for decommissioning, many
subject to the availability of a mechanism for digitally archiving their records17, account for
an annual operational cost of $8M. However, it is projected that there are between 20,000
and 30,0009 small applications in government not reported as part of the Audit. If a
significant portion of those could be decommissioned, the combined reduced operational
costs could be substantial.
The Queensland Government needs to develop a general purpose digital archive. For
large systems the cost to operate is impacted by the volume of data held in those
systems. The availability of a general purpose digital archive will present a much larger
opportunity for operational cost reduction by allowing older records currently held in
operational production systems to be moved out to low cost archival storage. The
reduction in data holdings in operational production systems will reduce the operational
costs of those systems by reducing storage and processing costs on an ongoing basis.
Further, the rapid growth in storage of digital images, for example medical imagery,
geographic data and images, digital video and massive data sets will require the
availability of petabytes of low cost storage for infrequent access. The value of this
opportunity has not been modelled or estimated.
5.9 High risk applications
High risk applications are those applications for which failure is highly likely, and/or the
consequences of failure are high for the agency. These would be considered the highest
risk to the Queensland Government, and where strategies to minimise ICT risk should
begin.
A number of metrics were applied to identify systems that fall within this category. There
are many reasons a system could be considered as high risk ranging from supporting
framework and environment issues, to those related to its health or fit for purpose.
17
In dealing with both Legacy Systems and 'Dust gathering' systems, it should be noted that the systems in question will contain public records that either no longer need to be retained, may need to be retained short term, or may need to be retained long-term (including permanently). Data owners need to work with Queensland State Archives to determine the business, legal and historical value of the public records and their necessary retention periods, so that the data that does not need to be retained can be legally disposed of under the Public Records Act, 2002. Disposal of data that the Government no longer needs to retain is a potential cost saving.

Queensland Government ICT Audit 2012: Applications
86
Queensland Government ICT Audit 2012
High risk systems are systems where:
the application software is no longer supported by the vendor (for packaged
application software)
the agency does not have ready access to sufficient skilled personnel to maintain the
application software (for purpose built application software)
the application has become unstable or has reached its limits, and is difficult to
provide continuity of operational performance
the application is dependent on one or more unsupported technical components
the window for replacement of the application is shorter than the time needed to get a
replacement in place
there is an upcoming critical change to the business, which the application will not be
able to meet
the application has been identified as high risk by the CIO (HBCIS is an example)
system failure carries a large impact.
Explicit metrics on all these attributes were not available to the Audit so the following
criteria were used:
The system was identified in the Audit (3 Month Report) via CIO feedback.
The system has been assigned an extreme business exposure (high business impact,
low technical condition) by the agency.
The system is past or near end of life in poor technical health with no evidence of a
planning activity to address the issue.
For disaster critical applications, the system carries a personal safety implication if it
were to fail.
These criteria were used to develop a consolidated list of high risk systems (validated
with agencies) which can be found in Appendix G.

Queensland Government ICT Audit 2012: Applications
87
Queensland Government ICT Audit 2012
Table 10 shows the top 15 high risk applications, as considered by the Audit.
Table 10 - High risk applications
Post MOG agency
System Name Business impact
Technical condition
End of life date
Estimated replacement cost18
QH Hospital Based Corporate Information System (HBCIS)
High Good Sep 2015 $250M
DCS Human Capital Management System (HCMS)
High Poor Jun 2008 $150M
QH AUSLAB High Medium Jun 2020 $131M
QSS Corporate Finance, HR systems (excluding Health and Education)
Multiple systems, multiple instances $77M+
HPW SAP RE (Real Estate) - Housing Tenancy Management
SAP PM (Plant Maintenance)
SAP PS (Project Systems)
High Poor Jan 2016 $75M
DNRM Automated Titling System (ATS) High Good Dec 2025 $40M
QH Queensland Health payroll solution
High Good Dec 2010 $40M
(potentially under
reported)
QH AUSCARE High Medium Jun 2016 $5M
QTT TriData High Good Dec 2009 $5M
QPS Incident Management System (IMS) High Poor Jun 2013 $5M
QPS Weapons Licencing Management System (WLMS)19
Not reported Not reported Jan 2018 $4.2M
QH Finance business solution (FAMMIS)
High Good Jun 2012 $4.1M
(potentially under
reported)
DCCSDS Carepay High Poor Jan 2010 $1M
DNPRSR IAParks Version 2 High Poor Jun 2012 $0.8M
DCS Disaster Management Portal High Poor Apr 2011 $0.04M
The high risk applications shown in Table 10 have been assessed as those applications
for which immediate action must be taken to avoid a critical loss of capability for the
Queensland Government. The only exception is the Health payroll system, which was
identified because of its high profile in the media and the fact that there are still issues to
be resolved.
18
System replacement costs only, does not include implementation costs in agency 19
QPS have since provided clarification that has not been analysed.

Queensland Government ICT Audit 2012: Applications
88
Queensland Government ICT Audit 2012
It should be noted that the first five systems in the list have an estimated replacement
cost of $683 million representing a significant challenge for government to fund. Although
AUSLAB has a 2020 end of life and HBCIS has a 2015 end of life, QH have advised that
both will need a seven year lead time for replacement.
There are a large number of other applications supporting the functioning of the
Queensland Government that also require action to be taken in the next three years. It is
essential that the government undertake planning to address all applications approaching
end of life.
5.10 Business-specific applications
A distinction can be drawn between those applications that are commodity and those that
are specific to the line of business that they support. Examples of commodity applications
have been given in previous sections including HR systems, finance systems, document
and records management systems, and so on. A business-specific application is an
application that supports a specialist area of the business – and has little in common with
other areas of business from a supporting software perspective. For example, systems to
support operating theatres in Queensland Health.
Over time application types can shift toward commodity as standard software solutions
become available. For example, in recent years there has been a significant increase in
the availability of grants management solutions to such an extent that this would now be
considered a commodity application.
While business-specific applications are specialist applications, they should not require a
different approach to selection and sourcing than that used for commodity applications.
Software that supports specialist areas of the business should be sought as off-the-shelf
products in the first instance. If suitable products can be found consideration must be
given to changing the business processes, regulation and legislation to align with the
products. Only when that is impractical or inappropriate should customisation or software
builds be used.
The selection of business-specific applications is a decision for the business areas within
government agencies. However, Audit analysis reveals that these decisions have often
been made in complete isolation. The attributes commonly observed are:
business-specific applications that are heavily customised or custom built from
scratch
a completely heterogeneous set of ICT platforms that is not aligned and difficult to
manage
high levels of variance across business processes in government that are essentially
the same
Queensland Government ICT Audit 2012: Applications
89
Queensland Government ICT Audit 2012
difficulties obtaining and retaining staff skilled in the maintenance of the application or
platform
contractual arrangements that give the power to the vendor resulting in higher costs.
While the business areas of government must have the flexibility to acquire software that
suits their business needs and underpins their operation, it is essential that this
acquisition takes place within a framework that limits the negative consequences of some
choices. The framework should have the following constraints:
Decisions made must be made as portfolio decisions within the context of the other
systems of the agency and the government.
Technical architecture constraints must be applied prior to selection ensuring things
like deployment infrastructure, security, integration with standard components,
interoperability and technical standards are consistent with the requirements of the
agency and the government.
Software should be able to be deployed on the standard infrastructure of the agency.
Software supplied as a service should be preferred to software acquired as a product.
Software should be able to meet business requirements through configuration.
Customisation must be minimised with a preference for changing the business
processes to meet the software rather than changing the software.
Packaged software should be preferred over custom built software.

Queensland Government ICT Audit 2012: Applications
90
Queensland Government ICT Audit 2012
This page has been intentionally left blank.

Queensland Government ICT Audit 2012: Infrastructure
91
Queensland Government ICT Audit 2012
Infrastructure

Queensland Government ICT Audit 2012: Infrastructure
92
Queensland Government ICT Audit 2012
6 Infrastructure Findings
The Queensland Government is not getting value for money from its ICT
infrastructure arrangements.
The central infrastructure provider (CITEC) is seen as too expensive.
New business models for provision of ICT infrastructure are emerging. These
business models promise simplification, flexibility, low risk, cost reduction, mobility
and agility. While these new opportunities are attractive, the take-up within the
Queensland Government has been very low.
There is a history of follow-on strategic investments designed solely to recover sunk
costs from previous under performing investments.
Vendor lock-in across several platforms is driving up infrastructure costs, forcing the
government into unwanted upgrades and limiting alternate procurement options.
Several technology architectures that were mainstream in the 1990s are limiting
strategic options for ICT delivery.
Existing client-server architectures create silos within and across agencies, limit
mobility of staff, create islands of information, and increase the cost and impact of
machinery of government changes.
Agency-based network architectures designed to link local desktops to local servers
will constrain the value of future cloud based architectures. Inefficiencies across the
government‘s applications portfolio (including unnecessary duplication, extensive
customisation, out-dated architectures and significant numbers of applications that
should be decommissioned) are driving a range of unnecessary infrastructure
overheads. These include: increases in capacity (cycles, storage, network); additional
licensing costs; and, additional operational overheads.
Infrastructure investments have not been well prioritised.
Government‘s telecommunications networks have evolved within agencies. This has
created a complex and inefficient web of networks. In many cases there is duplication
of infrastructure in the same geographies (without the benefits of complementary
redundancy) and complex contractual arrangements that carry large administrative
overheads.

Queensland Government ICT Audit 2012: Infrastructure
93
Queensland Government ICT Audit 2012
6.1 Introduction
Dating back to the 1960s, governments across Australia were early adopters of ICT. Over
the years the Queensland Government, like other early adopters, optimised its ICT
business models driving economies of scale and efficiencies. At some point in the
lifecycle of any technology or business model there comes a point where alternative
approaches emerge that deliver a step change improvement in benefits. This doesn‘t
mean the technology isn‘t working properly or that the staff are not performing well - it
simply means that at a certain level of adoption and scale, the approach used by early
adopters (of ICT) no longer passes the ‗best value‘ test when compared to modern
emerging paradigms.
In an effort to drive improvements in efficiencies, some governments have programs in
place to simply reduce the costs of running their in-house ICT investments. While many of
these appear logical there is a risk that all they will achieve is a reduction in effectiveness
commensurate with the reduction in cost. The ICT industry is responding far more
creatively to the challenge of balancing the competing forces of cost, value and
complexity – forces faced by every large complex organisation, including government.
The Queensland Government has examples of well-run and well managed ICT
operations – a credit to the committed and professional staff responsible. However,
regardless of these individual success stories, it is impossible for government as a whole
to achieve best value for money from its ICT infrastructure arrangements.
Five key drivers undermine value for money in the area of commodity infrastructure and
systems. These are:
1. Government‘s internal infrastructure provider, CITEC, is seen as too
expensive.
2. There is unnecessary and excessive diversity across infrastructure platforms.
3. Government cannot achieve meaningful economies of scale.
4. Out-dated sourcing models are prohibiting access to modern, low cost, high
value alternatives.
5. The number, size and complexity of business applications continues to grow
without constraint.20
20
See Applications Section for discussion on this issue.

Queensland Government ICT Audit 2012: Infrastructure
94
Queensland Government ICT Audit 2012
6.1.1 Government‘s internal infrastructure provider is too expensive
The Queensland Government‘s central infrastructure provider, CITEC, carries high levels
of overhead. These overheads are passed on to agencies in infrastructure charges. It is
difficult to identify value that is delivered in exchange for these higher costs as there is
little evidence of risk reduction, economies of scale, cost savings, etc.
Figure 19 shows the raw findings from an industry and agency comparison, for a three
year infrastructure investment bundle.21 Agencies are highlighted in blue and vendors are
highlighted in orange, with the median cost indicated by the dotted line. To observe the
commercial in confidence requirements of vendors, their names have been withheld.
Figure 19 - Industry and agency comparison for a three year infrastructure investment bundle
21
For additional detail, refer to Annex – Demand, cost and performance management of ICT

Queensland Government ICT Audit 2012: Infrastructure
95
Queensland Government ICT Audit 2012
The high end of the cost spectrum is predominantly occupied by Queensland
Government agencies; with the low end of the spectrum dominated by industry for both
managed and unmanaged service offerings. In addition, the most expensive government
agencies (QSS, DPW, and DLGP) predominantly receive ICT infrastructure services from
CITEC.
The Audit identified that, where agencies were mandated to source ICT services from
CITEC, the internal government provider, agencies were paying different prices for
equivalent services. Agencies expressed concern that they were at times paying higher
prices than the official CITEC price book.
A full analysis and comparison of agency and industry costs is provided in Annex –
Demand, cost and performance management of ICT.
CITEC only provides a subset of the infrastructure services required by government.
Because CITEC does not offer an attractive end-to-end service, every agency also has
an IT business unit which provides commodity infrastructure services (in addition to
CITEC). Both agency IT business units and CITEC have overheads that contribute to
increased infrastructure costs. In addition, the devolution of commodity infrastructure
decision-making to agencies leads to high levels of diversity in infrastructure as well as
delivery and funding models.
6.1.2 Unnecessary and excessive diversity
Unnecessary diversity across infrastructure platforms impedes efforts towards economies
of scale, drives the need for a wide range of technical experts to remain in-house and
limits agility and integration.
Figure 20, Figure 21 and Figure 22 show the level of diversity currently being managed
by Queensland Government ICT staff across the following domains: operating systems
and utilities, database management systems and software development platforms. The
mixture of shapes used in each of these figures is purely to aid in differentiating the
(plotted) items which relate to each figure‘s respective legend.
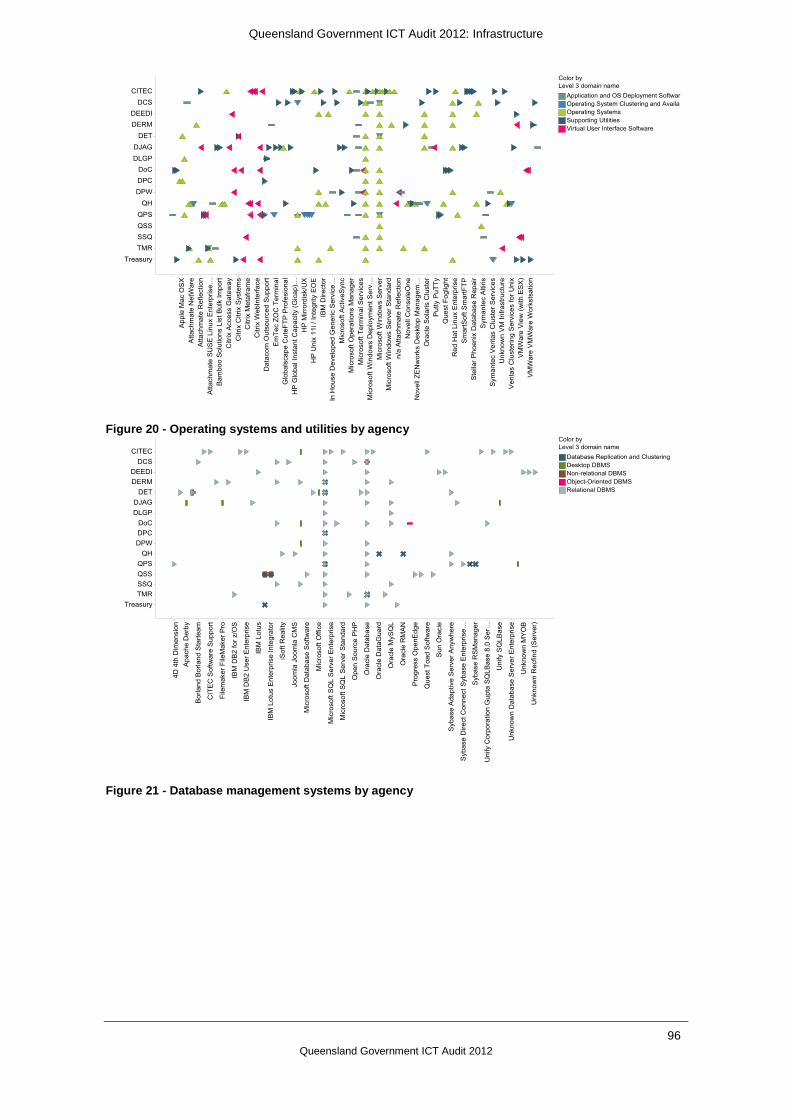
Queensland Government ICT Audit 2012: Infrastructure
96
Queensland Government ICT Audit 2012
Figure 20 - Operating systems and utilities by agency
Figure 21 - Database management systems by agency
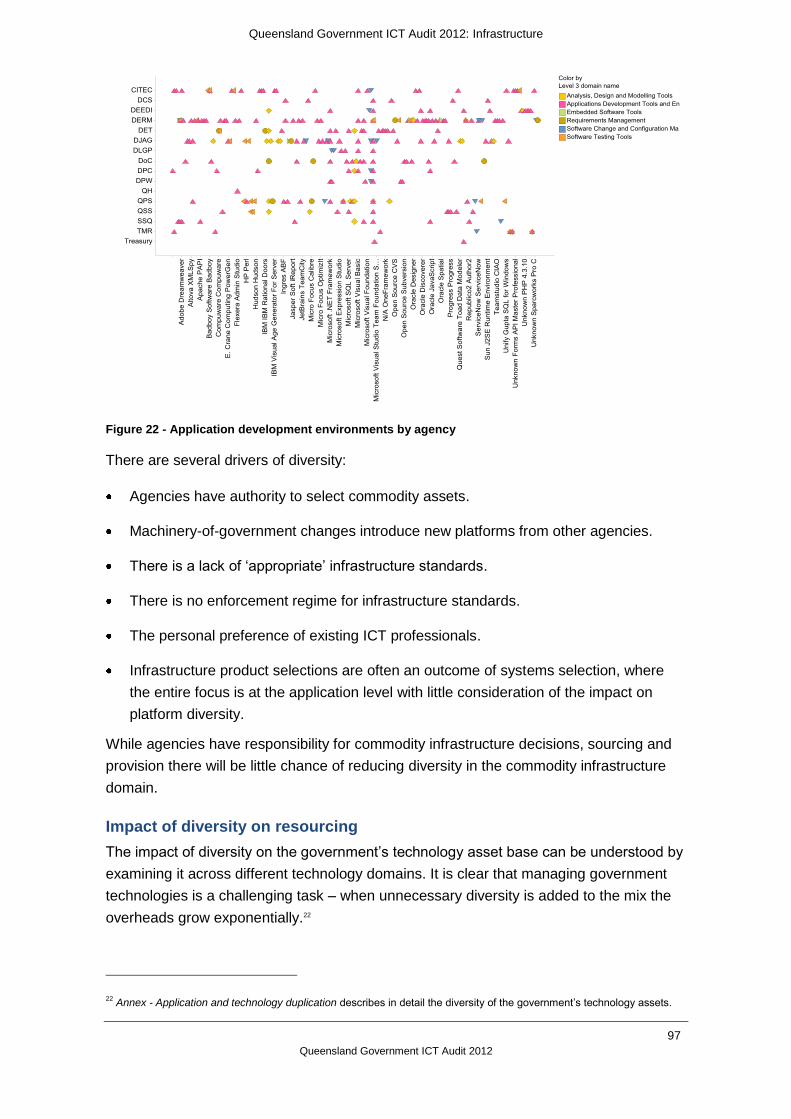
Queensland Government ICT Audit 2012: Infrastructure
97
Queensland Government ICT Audit 2012
Figure 22 - Application development environments by agency
There are several drivers of diversity:
Agencies have authority to select commodity assets.
Machinery-of-government changes introduce new platforms from other agencies.
There is a lack of ‗appropriate‘ infrastructure standards.
There is no enforcement regime for infrastructure standards.
The personal preference of existing ICT professionals.
Infrastructure product selections are often an outcome of systems selection, where
the entire focus is at the application level with little consideration of the impact on
platform diversity.
While agencies have responsibility for commodity infrastructure decisions, sourcing and
provision there will be little chance of reducing diversity in the commodity infrastructure
domain.
Impact of diversity on resourcing
The impact of diversity on the government‘s technology asset base can be understood by
examining it across different technology domains. It is clear that managing government
technologies is a challenging task – when unnecessary diversity is added to the mix the
overheads grow exponentially.22
22
Annex - Application and technology duplication describes in detail the diversity of the government‘s technology assets.

Queensland Government ICT Audit 2012: Infrastructure
98
Queensland Government ICT Audit 2012
The right hand bar chart in Figure 23 shows the technology layers in terms of annual
estimated total cost of operation (AETCO), whilst the left hand bar chart shows the
associated number of ICT support staff.
Figure 23 - Technology annual cost and support staff by technology domains
The high number of ICT operations and support staff within these domains represent a
distraction from the primary purpose of the Queensland Government – front line service
delivery. Notably, the domains representing commodity platforms including desktops,
network and operating systems dominate the AETCO and numbers of support staff.
6.1.3 Achieving meaningful economies of scale
When compared to private sector providers, the Queensland Government faces several
challenges to achieving economies of scale in commodity infrastructure domains:
The physical scale of government‘s ICT operations does not deliver significant
economy of scale advantages compared to large scale private sector ICT
infrastructure providers.
Agency silos limit economies of scale opportunities - attempts to build scale through
consolidated procurement arrangements have not overcome these issues.
Annual Estimated Total Cost of Operation (AETCO)
Queensland Government ICT Audit 2012: Infrastructure
99
Queensland Government ICT Audit 2012
Decentralised control of ICT infrastructure and commodity systems has created an
environment where extensive customisation continues to drive up costs and inhibit
economies of scale.
Existing delivery of ICT infrastructure and commodity systems is based on business
models that are rooted in the 1990s - many of the fundamental building blocks of
government‘s in-house delivery models are being challenged by new paradigms that
offer step change improvements in efficiency.
There are over 3,000 staff in Queensland Government connected in some way to ICT
operations (alternative approaches to infrastructure delivery do not require large
numbers of technical staff - many of these skilled professionals could be redirected to
more critical activities if government adopted modern sourcing models for ICT
delivery).
Detailed data centre costing, by agency can be found in Annex - Demand, cost and
performance management of ICT. It shows a large variation in per unit cost which can be
a reflection of scale, management control or quality of service. There is evidence of
incremental cost improvement which is a credit to the agencies responsible for
improvements. However these improvements could have been far more significant had
other sourcing approaches been applied.
6.1.4 Out-dated sourcing models
Traditionally, Australian governments have focused on owning and managing ICT
infrastructure and commodity systems such as email, desktops, networks and data
centres. Twenty years ago, internal ownership and management of these systems was
the only sourcing strategy available.
It can be argued this approach has strengths including control of security and certainty of
supply; however, ownership of large scale ICT infrastructure and the corresponding
responsibility for operations also has shortcomings, including high cost; limited scalability;
and a requirement to keep a broad range of skilled ICT professionals retained in-house in
case they are needed.
Architectures used with insourced approaches create issues beyond value for money.
Internal sourcing models build islands of unique technologies (applications, information
and infrastructure) and these limit the mobility of the workforce. For example: At present
people cannot take their laptop computers from one department to another, plug them
into the network and start working. Each department has its own standards for security,
identity, network access etc. When staff go home they no longer have these limitations.
They can use their personal ICT equipment to access multiple organisations (eBay,
Facebook, Qantas.com, etc) without limitations.

Queensland Government ICT Audit 2012: Infrastructure
100
Queensland Government ICT Audit 2012
Business agility is also reduced through internal sourcing approaches. The government
currently builds and implements technologies to support business initiatives. Invariably
these technology builds rapidly become the critical path for the business initiatives they
are supporting – a dependency that under modern sourcing models may not need to
exist.
Another constraint is scale. An internal sourcing model where infrastructure is owned by
the government means that government has to buy sufficient infrastructure to cover peak
loads. At non-peak times this infrastructure is wasted.
New delivery models are emerging that can meet security and scale criteria. These
models come at a significantly lower price point. Key to these sourcing models is ‗as-a-
Service‘. Table 11 shows how the ‗as-a-Service‘ model will impact the ICT industry.
Table 11 - As-a-Service versus traditional delivery models for ICT Infrastructure
Technology Past
(Traditional)
Future
(as-a-Service)
Core infrastructure Expensive
Fragile
Labour intensive
Disruptive upgrades
Robust
Agile
Cheap
Only pay for what you use
Invisible
Network Complex
Non-secure perimeter
Siloed
Usage charges
Disruptive upgrades
Secure the data
Reliable
Mobile
Ubiquitous
No usage charges
Commodity applications Expensive
Monolithic
Rigid
Disruptive upgrades
Cheap
Mobile
Standardised
The impacts of the ‗as-a-Service‘ model are significant. It will be difficult to make any
technology-based argument to sustain a policy of significant in-house ICT practices in the
face of the opportunities provided by this new paradigm.
A few years ago the main concerns with the ‗as-a-Service‘ model were security, data
sovereignty and risks associated with the paradigm change. In 2012, these risks can all
be addressed.
There are minimal risks in migrating to as ‗as-a-Service‘ model for most ICT infrastructure
and commodity systems. Queensland Government agencies however, in the main,
continue to own and operate a number of ICT commodity services.

Queensland Government ICT Audit 2012: Infrastructure
101
Queensland Government ICT Audit 2012
The challenge for the Queensland Government, like many organisations, has been in
monitoring the evolving maturity of ICT commodity services and knowing when to
transition. To date, there has not been a widespread rethink of ICT provisioning.23
The following sections discuss key components of the Queensland Government‘s ICT
infrastructure and commodity systems. Each component is assessed for efficiency in its
current state and then analysed against the ‗as-a-Service‘ business model.
6.2 Data centres
6.2.1 Recent history
The Queensland Government has two whole-of-government data centres and a number
of smaller agency level data centres. In 2006, the Service Delivery and Performance
Commission recommended the consolidation of the Queensland Government‘s data
centres, networks, infrastructure and essential ancillary services such as email and
authentication. The Commission claimed savings of up to $74 million per annum would
flow from data centre and infrastructure consolidation. The Service Delivery and
Performance Commission could not produce any working papers to support the savings
claim, with subsequent efforts to build a benefits model based on the Commission‘s
recommendations failing to demonstrate any savings.
Notwithstanding the lack of metrics and the absence of a benefits model that proved
savings, Government commissioned the Polaris data centre and began the task of
migrating agencies to a new whole-of-government data centre model. The initiative to
consolidate data centres, as a component of what is now called ICT Consolidation
(ICTC), began in 2007.
By any measure, the ICTC initiative has been unsuccessful. It has struggled to get
agencies to comply with the requirement (set by Cabinet) to consolidate data centres24
and ICT infrastructure. Six years after the Service Delivery and Performance
Commission‘s recommendations were released the mandate for infrastructure
consolidation remains ineffective and 45% of the Polaris data centre remains
underutilised. The cost of unused floor space at Polaris is $3.26 million per annum.
23
Not all applications can be transitioned to a virtualised / cloud environment. A strategy for managing legacy applications will be required. See subsequent section on hospice approach. 24
This non-compliant behaviour from some agencies still exists today and will be a concern in the implementation of findings from the Audit.

Queensland Government ICT Audit 2012: Infrastructure
102
Queensland Government ICT Audit 2012
Compounding this, the other whole-of-government data centre at 317 Edward Street is
almost fully committed with a contract for leasing additional data centre space in Wharf
Street established in February 2012. A consultancy report Strategic Data Centre Review -
Options for 2nd Primary Data Centre for Queensland Government was delivered in
February 2012 by CS Technology Pty Ltd. In respect of the 317 Edward Street data
centre, the report determined a need for:
..approximately $7.5 million of investment within the next ten years for capital
equipment only. This estimate does not take into account the installation and
associated construction costs, and does not account for ongoing upgrades that will
be required towards the back end of this ten years. Up to 70% of the required
investment will focus on ‘high risk’ with ‘serious impact’ fixes and upgrades.
Today, agency true-up requirements, challenges of demand and utilisation management,
the need to inject large sums of capital and the risks associated with ageing facilities are
no longer the only issue facing the owners of the Queensland Government‘s data
centres. There are a number of emerging challenges as well.
6.2.2 Emerging challenges
New paradigms such as cloud computing (anything-as-a-Service) are promising to
radically change how industry, the community and government will acquire and use
information technologies. The benefits of these new paradigms include:
scalability on demand
low cost high availability
very low cost computing and storage – only pay for what you use
no need for large numbers of in-house technical experts
no capital investments required
no major internal ICT projects focusing on acquisition, implementation or upgrade of
hardware and software platforms.
The move to the cloud is happening now
The Queensland Government is looking to move to cloud based email. Cloud based
email services are sold on a price per person or price per mail box per month basis. The
services provide scalability on demand, have high availability for low cost, provide high
data storage at low cost, need virtually no capital investment and need no ongoing
upgrade program. Cloud based email is a Software-as-a-Service (SaaS) architecture that
does not require government to own and run a data centre to provision a very high quality
service.

Queensland Government ICT Audit 2012: Infrastructure
103
Queensland Government ICT Audit 2012
The move to Software-as-a-Service (SaaS) is not solely limited to email. Queensland
Health is moving to SaaS approaches for major clinical systems, the Department of
Communities is using cloud services for grants management and several other agencies
have put in place cloud initiatives. This report recommends SaaS services for other areas
of government such as payroll and finance. In 2012, there are now very good arguments
for governments not to own and run data centres. In fact, there are very good reasons not
to own and manage storage or compute power.
6.2.3 Whole-of-government infrastructure initiatives
The previous sections discussed the challenges of government ownership of ICT facilities
- data centres and associated services such as storage and computer cycles. This
section discusses the government‘s track record in the delivery of centrally provided end-
to-end ICT infrastructure services.
Examples exist where internal-to-government providers (for a host of reasons) have not
demonstrated industrial strength processes for winning and operationalising new services
or the mandate for agency take-up has been ineffective. As a result some high cost
infrastructure investments have remained underutilised. One example is the Foundation
Infrastructure Project, established at CITEC, to deliver Infrastructure-as-a-Service (IaaS)
at a capital cost of $23 million.
There have been other examples where delays in implementation have resulted in
infrastructure being underutilised or abandoned even before going into production. The
Identity, Directory and Email Services (IDES) program established whole-of-government
identity and email infrastructure at a cost of $45 million, but due to delay and an
unsustainable cost position, was terminated in the pilot phase of the roll-out.
Finally the ICTC initiative itself is yet another example of an internal initiative that failed to
deliver meaningful outcomes – even with a strong Cabinet mandate.
Further detail, contained in Annex - Initiatives shows that 44% of internally run projects
had changes in schedule of greater than three months. Annex – Initiatives also examines
the impact of delays to initiatives‘ schedules. The key finding was the ‗value proposition
for the initiative weakens over time‘. This was especially the case with infrastructure
investments.
If there is a delay in implementation then competition from emerging technologies will
undermine the initiative‘s original value proposition. Nowhere is this more evident than
the IDES initiative.

Queensland Government ICT Audit 2012: Infrastructure
104
Queensland Government ICT Audit 2012
In 2006 the IDES initiative promised a whole-of-government identity and e-mail system
based on an in-house delivery model using Microsoft exchange. The project was given
the go ahead based on a positive financial business case. By 2012 alternative
commercial approaches to e-mail became mainstream. These were up to five times
cheaper than the best case model proposed by IDES. What was a good outcome in 2006
became a poor outcome in 2012.
Had IDES been implemented by 2008 it would have provided benefit to the government
for up to five years. Delays in implementation meant there were no benefits at all.
The Queensland Government has not had a good track record in the delivery of
infrastructure initiatives – especially at the whole-of-government level. Given the criticality
of ‗on time‘ completion for infrastructure projects there is an urgent need to rethink the
approach to internal provision in this domain.
6.2.4 The options for Queensland Government data centres
With utilisation at the Polaris data centre already lower than expected (by $3.26 million
per annum); a poor outcome based track record; and demand for the service falling due
to competition from other approaches such as SaaS, the Queensland Government has
two clear options for its data centre investments. These are:
1. insource with an agency mandate: Look to ‗force‘ agencies to use existing
data centre investments (made by previous governments) in an effort to
recover some of the sunk costs and contractual commitments – especially
those in the Polaris data centre.
2. adopt ‘as-a-Service’ approach: Exit the data centre business and set a
direction that prohibits agencies from running their own internal data centre
operations. Set a standard in the Queensland Government Enterprise
Architecture (QGEA) where agencies must source infrastructure services, as
required, through an Infrastructure-as-a-Service (IaaS) approach. Enforce a
migration of legacy systems (systems that cannot meet cloud architecture
requirements) to the hospice model (described below).25
Option 1 will lock in higher costs for services – services that should be low cost
commodities (e.g. computer cycles and storage) will require large numbers of technical
staff to design, maintain and run the data centres; and create an internal financial barrier
for agencies wanting to adopt solutions based on other storage models such as SaaS.
Attempts to gain value from sunk costs in in-house ICT infrastructure investments
(including excess floor space at the Polaris data centre or assets in CITEC) have the
potential to lock agencies into high ongoing costs based on dated delivery models.
25
Exiting the data centre ownership will require a strategy to manage the government‘s existing commitments to data centre space at Polaris.

Queensland Government ICT Audit 2012: Infrastructure
105
Queensland Government ICT Audit 2012
Option 2 allows (in fact encourages) government to select the best solutions and best
architectures without being constrained by needing to consume internal assets. Option 2
allows systems to be used without the overhead of owning infrastructure, managing
licences and being responsible for software upgrades. (Note: A SaaS approach will mean
that the government will not have to even consider infrastructure issues. Many systems
will be delivered this way in future.)
6.2.5 The need for a hospice
Cloud architectures require systems to operate in a virtual environment. A significant
percentage of the government‘s applications portfolio cannot operate this way and as a
result cannot be moved to the cloud or take advantage of an ‗as-a-Service‘ model. These
systems will require a different approach as they will need an environment to provide
hospice services so they can operate in production until they are decommissioned.
There are two key considerations with regard to the hospice concept:
The provision of a hospice capability is an independent piece of work and should not
constrain a rapid exit from owning and running data centres.
No system should go to a hospice unless it has a decommissioning strategy in place.
6.2.6 Sourcing
Annex - Demand, cost and performance management of ICT contains a comparison of
internal and external sourcing options on a typical infrastructure bundle. These cost
comparisons are based on existing sourcing strategies (they are not based on an as-a-
Service model). Even though these are raw numbers they clearly show that an insourced
model (and especially an insourced model with CITEC in the value chain) was far less
competitive than an outsourced model.
The Queensland Government‘s preference should be to consume services (as-a-Service)
as opposed to sourcing strategies that involve nominating specific assets. In the short
term this may not be possible – industry may not be ready to offer the services required
and/or government may not be in a position to make use of services requiring
applications to be virtualised. In this case an appropriate medium term sourcing strategy
will be required.
6.3 The government‘s cloud strategy
The current business model for Queensland Government ICT is flawed and in need of
reform. A new way of thinking about ICT is required. One that considers ICT as a service;
one that supports ease of service provisioning and right sizing; and one that does not
hinder the government‘s flexibility.

Queensland Government ICT Audit 2012: Infrastructure
106
Queensland Government ICT Audit 2012
This shift in computing paradigm for the Queensland Government requires a detailed
understanding of the current market and an appreciation of the advantages and pitfalls of
a migration to the cloud.
To ensure there is a well-planned strategy to a cloud environment the QGCIO, through
the Queensland Government Chief Technology Officer (QGCTO), has developed a Cloud
Strategy, titled the Queensland Government Cloud Computing Strategy 2013 – 2016.
Key principles of the future state ICT model include:
ICT as a service
Self-service ICT
No lock-in.
6.3.1 ICT as a service
ICT as a service is based on the concept of ‗utility services, or utility computing‘ – which
involves the packaging and sourcing of ICT resources as a metered service. Utility
services are continually rented, based on level of usage, with low or no initial cost to
acquire the ICT resources.
6.3.2 Self-service ICT
Self-service ICT is centred on the notion of enabling agencies to better manage their ICT
service requirements in real-time (or near to), by having the self service capability to
adjust their ‗ICT as a service‘ requirements, as required, without needing human
intervention by the service supplier or protracted contract variations. This allows agencies
to better manage business peaks and troughs, to easily match ICT capacity to changing
requirements, and to only pay for what is used.
6.3.3 No lock-in
No lock-in refers to the principle of avoiding ICT services and/or solutions that would
place a prohibitive exit strategy and/or cost on government. No service or solution should
be entered into without first developing and evaluating an exit strategy.
This principle is aimed at reversing the current predicament where government finds itself
all too often enmeshed in a vendor‘s solution or product set to the extent that its reversal
or alternative is cost prohibitive – effectively perpetuating a long term drain on business
and cost effectiveness.
No lock-in seeks to protect the government‘s flexibility and agility to source services and
solutions from a competitive marketplace, and leverage contemporary innovations where
available.
Queensland Government ICT Audit 2012: Infrastructure
107
Queensland Government ICT Audit 2012
These principles align closely with the attributes of cloud computing and will drive
increased adoption of cloud services across the Queensland Government.
6.3.4 What is needed
Key to the proposed Queensland Government cloud computing strategy are the
establishment of:
a cloud broker and integration services
trusted cloud services (for sensitive government information)
a federated identity management process
a cloud services panel.
6.3.5 Identity management
What is identity management
The www.opengroup.org provides a description of the concept of identity in an ICT
context.26 Management of identity is an absolutely fundamental capability for modern
business systems because it allows trusted people to be logically linked to their required
assets (information, systems, hardware, people, etc.). In a virtualised environment, such
as the cloud, this capability is critical.
Issues with identity in the Queensland Government
Identity management in the Queensland Government has been siloed on a per agency
basis utilising disparate processes. Individual agency level identities are not transportable
outside of a particular agency networking environment, nor are they guaranteed to be
unique across government or trusted by other agencies. This leads to Queensland
Government clients having to undergo multiple evidence of identity (EOI) processes
across agencies to identify themselves and establish the trusted authentication baseline
to transact online and at a counter. There is no common application of the EOI processes
across agencies and the multiplicity of approaches, in effect, discourages the transfer of
service delivery from more expensive face-to-face transactions to the online channel. In
addition, this leads to agencies adopting a reduction in the compliance requirements for
identity and authentication processes to enable online service offerings.
In addition to technical challenges with sharing services and reusing identity credentials,
a recurring issue within the Queensland Government has been a lack of trust between
agencies in identification processes and account management systems. This lack of trust
26
Identity is the fundamental concept of uniquely identifying an object (person, computer, etc.) within a context. That context might be local (within a department), corporate (within an enterprise), national (within the bounds of a country), global (all such object instances on the planet), and possibly universal (extensible to environments not yet known).

Queensland Government ICT Audit 2012: Infrastructure
108
Queensland Government ICT Audit 2012
has resulted in duplicated identification processes and issuing of additional separate
credentials across agencies and systems.
What is required
Agencies such as the Queensland Police Service, Queensland Health and the
Department of Education and Training (DET) all have unique identity management
requirements – in some cases specifications are set at the national level. It is important
that any identity initiative be cognisant of these requirements.
The establishment of a new whole-of-government identity/identifier for a public servant
which is unique, trusted and transportable across government, including external partners
is required to enable an identity centric approach. Given the various agency constraints
and the urgency for a government-wide solution, a federated identity management
arrangement (one that can cope with the varied needs of individual agencies) should be
implemented.
6.3.6 Whole-of-government email
In 2012, email services are offered by a range of vendors under a SaaS model. Prices
being offered by these vendors simply cannot be matched by internal government
providers. In fact, internal delivery of email can be up to four times more expensive than
commercial prices. SaaS delivered email has a range of other benefits apart from price.
SaaS email offers more storage (up to ten times more), more mobility, availability on
more device types, no requirement to manage upgrades, no need to engage internal
architects to design the system and limited need for regular capital investment. SaaS
delivers another benefit – true transparency of the cost of email. No agency in the
Queensland Government today can accurately demonstrate the true cost of their email
services.
To facilitate a move to cloud based email the QGCIO has developed a cloud email
business case. This cloud email strategy recommends government move to email in the
cloud in a three step process. The proposed approach allows for multiple email vendors
and an initial agency by agency implementation strategy.
6.4 Hardware and software technology platforms
6.4.1 Platform investment model
Figure 24 shows the platform investment model. This model shows the change strategies
and design goals for business applications, software technologies and hardware
technologies. Both software technologies and hardware technologies are considered
‗platforms‘ under this model. Examples of software technologies are Lotus Notes,
Outlook, Oracle, Windows XP, etc. Examples of hardware technologies are servers, PC
hardware, monitors, etc.
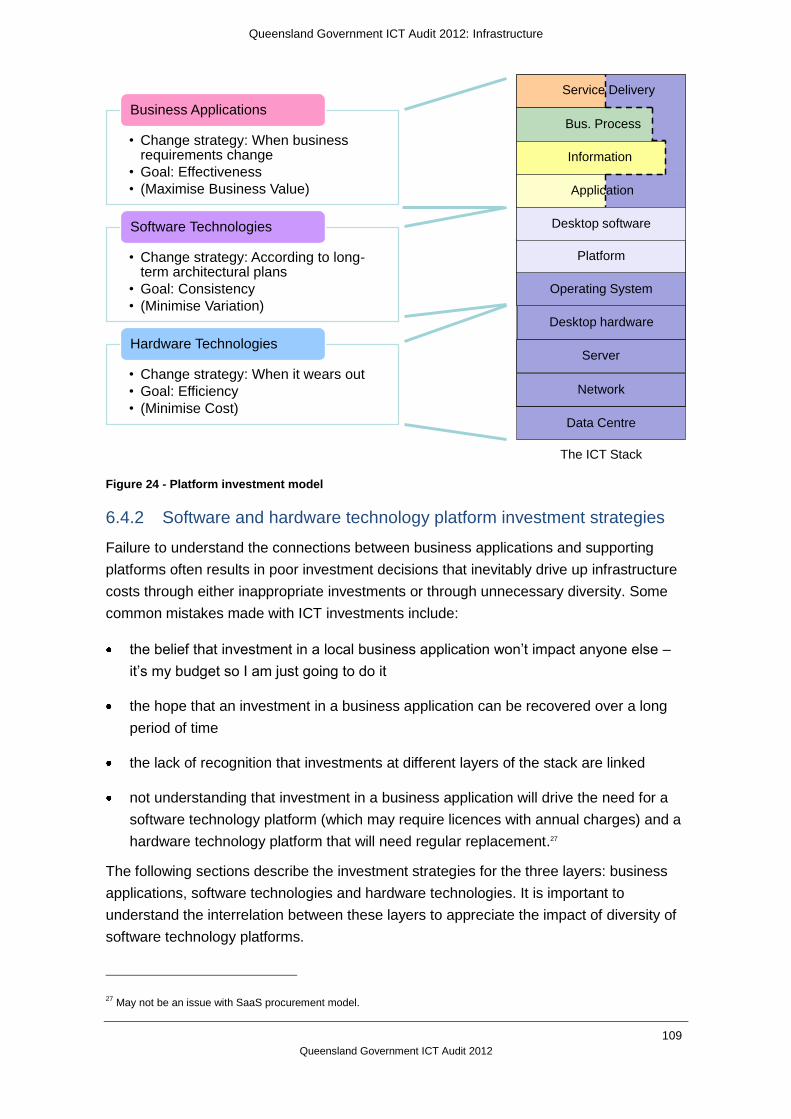
Queensland Government ICT Audit 2012: Infrastructure
109
Queensland Government ICT Audit 2012
Figure 24 - Platform investment model
6.4.2 Software and hardware technology platform investment strategies
Failure to understand the connections between business applications and supporting
platforms often results in poor investment decisions that inevitably drive up infrastructure
costs through either inappropriate investments or through unnecessary diversity. Some
common mistakes made with ICT investments include:
the belief that investment in a local business application won‘t impact anyone else –
it‘s my budget so I am just going to do it
the hope that an investment in a business application can be recovered over a long
period of time
the lack of recognition that investments at different layers of the stack are linked
not understanding that investment in a business application will drive the need for a
software technology platform (which may require licences with annual charges) and a
hardware technology platform that will need regular replacement.27
The following sections describe the investment strategies for the three layers: business
applications, software technologies and hardware technologies. It is important to
understand the interrelation between these layers to appreciate the impact of diversity of
software technology platforms.
27
May not be an issue with SaaS procurement model.
Server
Desktop hardware
Network
Operating System
Platform
Data Centre
Information
Bus. Process
Application
Service Delivery
• Change strategy: When business requirements change
• Goal: Effectiveness
• (Maximise Business Value)
Business Applications
• Change strategy: According to long-term architectural plans
• Goal: Consistency
• (Minimise Variation)
Software Technologies
• Change strategy: When it wears out
• Goal: Efficiency
• (Minimise Cost)
Hardware Technologies
Desktop software
The ICT Stack

Queensland Government ICT Audit 2012: Infrastructure
110
Queensland Government ICT Audit 2012
Business applications
Business applications do not wear out. However, they are subject to change and even
replacement when business requirements change. Business requirements can change at
any time as a result of changes in environmental factors (competitive pressures, changes
in supply chain dynamics, tax rule changes, legislation etc.) or from changes to internal
business processes. The decision to change a business application is normally an
automatic one once there is a change in business requirements. It is difficult to guarantee
a predictable return on investment (ROI) for a business application because it is difficult
to determine how long an investment in the application will remain useful.
Hardware technology platforms
Hardware technology platforms are normally replaced on a predictable duty cycle, when
they are damaged or when there are capacity issues. Unlike business applications, the
replacement cycle for hardware technologies is generally predictable and normally built
into a repeatable asset refresh cycle.28 Because hardware will be refreshed faster and
more predictably than business applications it is critical changes in hardware do not
unnecessarily drive changes in business applications. In the past this was an issue with
ICT systems. Today it would be seen as an example of poor architecture.
Software technology platforms
Software technology platforms are the longest term ICT investment. Once implemented
they are likely to remain in place for ten or more years. This occurs because over time
multiple business applications may be built on the same platform. Consequently, the
selection of a software technology platform is an important strategic decision.
A poor investment in a software technology platform can constrain future investment
options for the entire organisation – not just the business or ICT area that initiated the
selection of the platform. Too much diversity in software technology platforms can drive
far higher than necessary infrastructure costs.
Impact of lock-in
It is very important to avoid lock-in between platforms (software and hardware) and
business applications. For example: a large proportion of upgrade costs for the
Queensland Government‘s desktop fleet are caused by dependency (lock-in) between
applications that run on the desktop (business applications) and the desktop operating
systems (software technology platform). In general, client-server (fat client) architectures
tend to tie the design of desktop systems to the back end server architecture. Vendor
licensing models also contribute to this tight coupling.
28
The state of hardware infrastructure in Queensland Government is not as dire as the state of the business applications. The built in hardware replacement cycle has driven this because hardware has generally been refreshed while business systems have been ‗sweated‘ well beyond normal end of life.

Queensland Government ICT Audit 2012: Infrastructure
111
Queensland Government ICT Audit 2012
Apart from driving upgrade costs, this coupling also limits procurement options and
constrains business models for provision of infrastructure. A key architectural principle in
future will be to limit, as much as possible, tight coupling between platform technologies
and business applications.
6.4.3 Technology duplication
Annex - Application and technology duplication identifies the scope and impact of
duplication across a range of technology domains. It shows that diversity of technology
assets drives high support costs and demands a large workforce dedicated to support. In
particular technology duplication and diversity increase the challenge of keeping
technologies up-to-date.
6.4.4 Platform currency in the Queensland Government
The Queensland Government has a poor track record in managing software upgrades. All
of the following examples have very poor version management: Windows XP desktops,
SAP, Microsoft SQL, Adobe. All things being equal, options that free the Queensland
Government from the responsibility of software upgrades should be favoured.
The currency of government technologies by agency is shown in Figure 25.
Figure 25 - Technology support status, by agency

Queensland Government ICT Audit 2012: Infrastructure
112
Queensland Government ICT Audit 2012
ICT products that are unsupported by vendors are generally considered to be a risk to the
business. Failure of the technology may not be recoverable, security vulnerabilities may
not be able to be patched and vendor support may not be available.29
Approximately 19% of the reported technologies are either on extended support or
unsupported.
Key observations: ICT replacement cost – technologies at risk
The top ten unsupported technologies, commonly used across the sector are shown in
Figure 26.
Figure 26 - Support status and AETCO of key technologies
These technologies are of concern due to their low vendor support status, and include:
database software - Microsoft SQL Server 2005 and older, Oracle database 9.1/9.2
desktop fleet related - Microsoft Windows XP (operating system), Microsoft Office
2003 (office productivity suite)
collaboration/email/calendar - Microsoft Exchange 2003
internet connectivity/remote access - Microsoft Internet Explorer 6 and 7
identity management (access and authorisation) - Microsoft Active Directory 2003
application and infrastructure platforms - Microsoft Windows Server 2003.
29
In some cases, Queensland Government has negotiated extended support with individual vendors. This support comes
at higher price to support provided to current products.
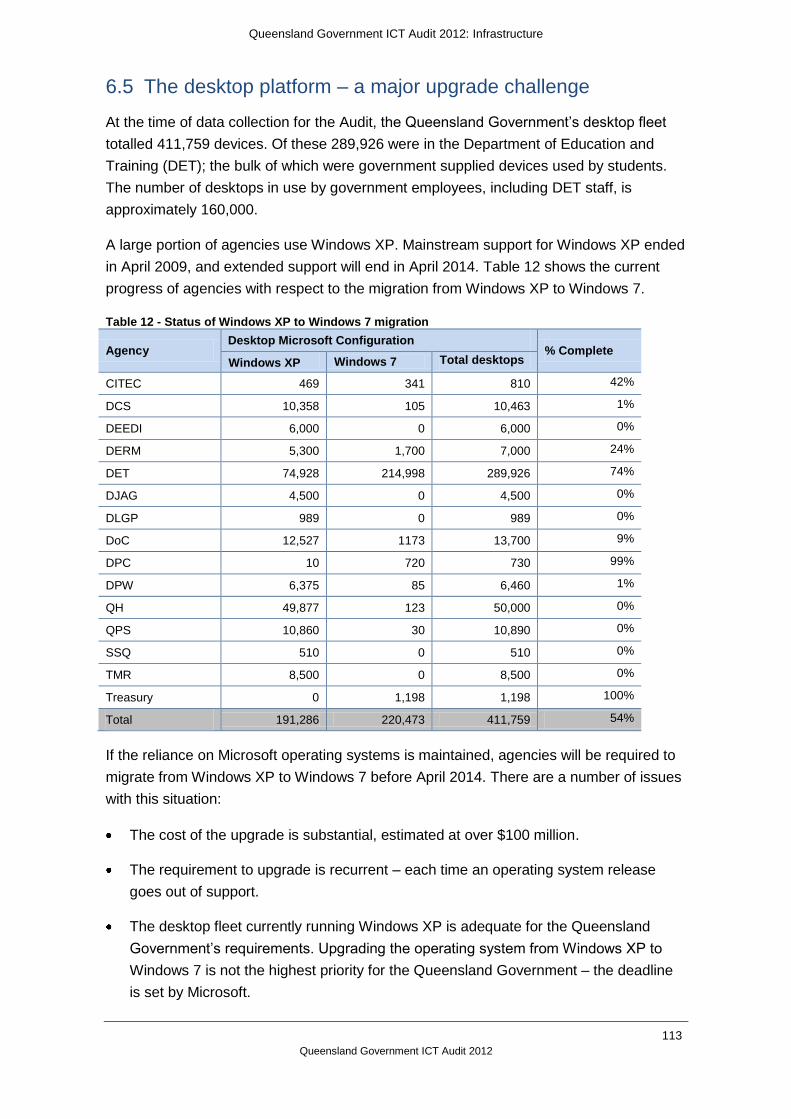
Queensland Government ICT Audit 2012: Infrastructure
113
Queensland Government ICT Audit 2012
6.5 The desktop platform – a major upgrade challenge
At the time of data collection for the Audit, the Queensland Government‘s desktop fleet
totalled 411,759 devices. Of these 289,926 were in the Department of Education and
Training (DET); the bulk of which were government supplied devices used by students.
The number of desktops in use by government employees, including DET staff, is
approximately 160,000.
A large portion of agencies use Windows XP. Mainstream support for Windows XP ended
in April 2009, and extended support will end in April 2014. Table 12 shows the current
progress of agencies with respect to the migration from Windows XP to Windows 7.
Table 12 - Status of Windows XP to Windows 7 migration
Agency Desktop Microsoft Configuration
% Complete Windows XP Windows 7 Total desktops
CITEC 469 341 810 42%
DCS 10,358 105 10,463 1%
DEEDI 6,000 0 6,000 0%
DERM 5,300 1,700 7,000 24%
DET 74,928 214,998 289,926 74%
DJAG 4,500 0 4,500 0%
DLGP 989 0 989 0%
DoC 12,527 1173 13,700 9%
DPC 10 720 730 99%
DPW 6,375 85 6,460 1%
QH 49,877 123 50,000 0%
QPS 10,860 30 10,890 0%
SSQ 510 0 510 0%
TMR 8,500 0 8,500 0%
Treasury 0 1,198 1,198 100%
Total 191,286 220,473 411,759 54%
If the reliance on Microsoft operating systems is maintained, agencies will be required to
migrate from Windows XP to Windows 7 before April 2014. There are a number of issues
with this situation:
The cost of the upgrade is substantial, estimated at over $100 million.
The requirement to upgrade is recurrent – each time an operating system release
goes out of support.
The desktop fleet currently running Windows XP is adequate for the Queensland
Government‘s requirements. Upgrading the operating system from Windows XP to
Windows 7 is not the highest priority for the Queensland Government – the deadline
is set by Microsoft.

Queensland Government ICT Audit 2012: Infrastructure
114
Queensland Government ICT Audit 2012
Microsoft Windows 7 is perceived as the only choice available to the Queensland
Government. The requirement to upgrade, and the price, has been set by Microsoft.
There has been no assessment of Windows 7 against other products because there
is an assumption that Windows PCs are the only way to deliver desktop services. This
is reinforced by a level of vendor lock-in through the tight connection between
Microsoft desktop operating system and back-end Microsoft server software.
Estimates for the cost of this migration vary between $100 million and $160 million. This
cost is substantial – almost $1,000 per desktop, at the higher end of the estimate.
Windows 8 was released during the Audit. Agencies are now looking to spend over $100
million upgrading to the second newest Microsoft Desktop operating system (Windows 7).
Within three years, when the replacement of Windows 8 is released, government will be
under pressure to complete another whole-of-government upgrade initiative. It is
incumbent on government to explore alternative arrangements for its desktop fleet.
There are several options for dealing with the desktop fleet that do not require the
government to run an expensive Windows XP to Windows 7 upgrade. These include:
considering whether desktop computers (PC or other devices) should be provisioned
as the default desktop device
considering whether the Microsoft based desktop PC platform is the only device type
that can provide access to government‘s information resources
considering whether ownership of the desktop fleet is the most appropriate model for
provisioning of information access devices
considering allowing public servants to use their personal devices (bring-your-own-
device) to access government‘s information resources.
6.6 Security
6.6.1 Security overview
This section does not discuss any technical issues or specific failings with ICT security.
Information of that nature is contained in Annex - Security. Instead, this section focuses
on:
the dated approach to security architecture
the responsibility for security across the Queensland Government
resourcing for key security roles
the compliance framework.

Queensland Government ICT Audit 2012: Infrastructure
115
Queensland Government ICT Audit 2012
6.6.2 Dated approach to security
Traditional (perimeter-based) security models as relied upon by many Queensland
Government agencies have become increasingly limited in their security effectiveness.
Failure to follow sound security practices inside some agency networks are exposing
systems and networks to compromise, particularly given the changing environment to one
of ubiquitous mobile devices, inter-organisational communication, internet access,
outsourced services and use of collaborative media.
This has lead to a lack of trust between agencies and reduced interagency cooperation.
However, agencies tend to have a self belief that their security practices are sound, and
as a result executive management are unaware of the high levels of risk they are
effectively accepting, leaving the Queensland Government exposed.
There is no silver bullet for security as absolute security cannot be achieved while still
achieving useful outcomes, requiring informed business decisions.
Within this context, organisations need to maintain a balance between the need to protect
and secure information with the need to have open access and information exchange
between government, its customers and the community. The role of information security
is not to lockdown (and prevent) business with gold plated security; it is to implement a
risk‐based approach to business enablement and information sharing.
When agencies apply security fundamentals in a poor or inconsistent manner they
inadvertently accept high levels of business risk and significant expense. The potential for
economies of scale and alternative delivery models are spurned due to perceptions of
security risk and agency centric thinking.
At the whole-of-government level and within many agencies, security and risk visibility
has been limited. Efforts to identify critical systems to improve the government‘s business
continuity and disaster recovery posture have revealed far more critical systems than
expected - refer to Annex - Security. It has also revealed that many systems are in poor
technical condition. Similar visibility stories exist for web site security, security incidents,
and security provisions within service contracts.
The Australian Government and industry are transitioning from a protect focus (we can
stop bad things happening) to more of a focus on business and technical resiliency (limit
the opportunity for bad things to happen, and be ready to detect and deal with it when it
does). In this context, resiliency is the ability to continue to meet key business goals while
resisting, and adapting to negative disruptive events and actions.
For instance, resilient ICT models include a combination of: isolation/separation of
untrusted systems, reduction of technical vulnerabilities, protection of systems, detection
of compromise to systems, containment (of infection or negative consequences) and
strong recovery capabilities.

Queensland Government ICT Audit 2012: Infrastructure
116
Queensland Government ICT Audit 2012
Organisations stuck in a predominantly perimeter mind set are not well placed to take
advantage of new business models for the provision of ICT and are likely to be suffering
from a security perception reality gap. That is, management believes the organisation is
more secure than it really is.
6.6.3 Responsibility for security
Information security leadership and coordination at a whole-of-government level has been
limited, resulting in fragmented and inconsistent security across government.
Agencies are individually responsible for adopting government security standards and
guidance, and supplementing these to meet any additional security requirements and
business objectives for the agency. For example, an agency may need to meet additional
legislative requirements or information management requirements of the federal
Government.
Information security leadership and coordination at a whole-of-government level has been
limited, resulting in fragmented and inconsistent security across government.
For the period October 2009 to June 2012, some security oversight was provided via the
Information Security Sub-committee. However, its security role was diminished due to its
limited terms of reference and tendency to focus primarily at an operational response
level. It did not pursue the broader responsibility of appropriate protection of information
and security innovation across government.
Visibility of security across government agencies has been provided through agency
Information Standard 18 – Information Security (IS18) self-assessments, Queensland
Audit Office reports and mandatory incident reporting. Participation in mandatory incident
reporting has been limited.
No formal mechanism or responsible body is in place for understanding whole-of-
government risk or for ensuring risks accepted by individual agencies are acceptable to
the broader government.
The results of Queensland Audit Office audits of IT network security confirm the true-up
requirements identified through the agency self-assessment process. The results confirm
the need for further action by agencies and better central mechanisms.
6.6.4 Security resourcing
Security resourcing is predominantly on a per agency basis.
In addition to agency security resources, a small virtual incident response team (VRT)
capability exists to allow for security resources to be drawn upon from CITEC and
agencies for a major incident response. This capability is led by the Queensland
Government Chief Technology Officer; to date the VRT has only drawn upon CITEC
resources to assist with incidents.

Queensland Government ICT Audit 2012: Infrastructure
117
Queensland Government ICT Audit 2012
Placement, skills and seniority of information security staff vary between agencies
resulting in different levels of security engagement, visibility and culture.
Approximately 39 security specialists were reported by agencies to the Audit. Figure 27
shows the reported information security expertise within agencies.
Figure 27 - Information security specialists
The agencies where no clear information security capability could be identified include:
Department of the Premier and Cabinet
Queensland Treasury
Department of Transport and Main Roads
CITEC
Queensland Shared Services
Smart Service Queensland
Department of Local Government and Planning.
These agencies may have resources whose role in part, relates to information security.
Queensland Government ICT Audit 2012: Infrastructure
118
Queensland Government ICT Audit 2012
The low level of information security capacity and capability was also highlighted in the
Whole of Queensland Government Information Security Governance Review, conducted
by Deloitte. The review highlighted that:
All agencies have a job role that is to be considered as the primary responsibility
for information security. The grade of the role varies with the size of the agency,
but in a larger agency this can be a relatively senior role, with in excess of ten staff
reporting to it, whereas in a smaller agency, this can be as low as 0.1 of an full
time equivalent (FTE) and consequently this can impact the focus and experience
of information security leadership in the agency.31
The Deloitte review recommended the establishment of a Chief Information Security
Office (CISO) to provide executive oversight of Queensland‘s information security
management program as a necessary first step toward the adequate protection of
government information.
A minimal change that should be considered for the Queensland Government is the
establishment of a central information security and risk team that supports all agencies.
This team could be structured as a permanent dedicated core team with a supplementary
virtual team spread across the sector.
The dedicated core team could effectively form the Chief Information Security Office, as
recommended by the Deloitte review. The supplementary virtual team structure would
further enhance capability across government, facilitate skills development, reduce the
impact of staff movements and provide access to expertise across government. This
access could be effectively utilised in emergencies, incident responses, projects and
business as usual activities. It could also perform a key role as a catalyst for culture
change and security visibility across government.
In addition to the above recommended core capability, making it common practice to
share staff between agencies, and leveraging their recent experiences through
secondments and short term exchanges, could be used to improve utilisation of limited
expert resources.
6.6.5 Compliance framework
The compliance centric nature of policy and the fear of risk-based decision-making
frequently leads to inadequate security for key systems, rather than resources being
allocated to areas of genuine business vulnerability and security risk. Security can
become a blocker of innovation rather than a facilitator of essential business control.
These issues are compounded by the limited availability of skilled security resources to
provide the necessary risk-based advice required by senior executives – and to create an
environment of relatively low risk, with high transparency of security exposures.
31
Whole of Queensland Government Information Security Governance Review Report, Deloitte, April 2012.

Queensland Government ICT Audit 2012: Infrastructure
119
Queensland Government ICT Audit 2012
For a number of years, the Queensland Government has had a reasonably complete and
mature security management and compliance framework through IS18, supporting
standards and guidelines.
As evidenced by agency self-assessments and Queensland Audit Office reviews, the
Queensland Government is not meeting its stated ICT security objectives and will not
meet them under current arrangements.
International and industry standards for information security management and risk
management have matured greatly since Queensland‘s IS18 was created. Support for,
and expertise in, aligning to these standards is widely available. It is also important to
note that the security validation of services offered in a standardised commodity manner
(e.g. cloud based services) are generally only available relative to international and
industry standards.
Government should consider transitioning from IS18 to a standards based security
framework to increase the opportunity for mature risk-based decision-making and to
increase transparency.
However, care must be taken to avoid the assumption that movement equals progress.
In other words, limited compliance to an ISO 2700132 statement of applicability or formally
accepting inappropriate risks is no more secure than limited compliance with IS18.
Significant sector up lift, standardisation and transparency in risk management is required
ahead of any major change in compliance arrangements.
6.7 Telecommunications
6.7.1 Background
The Queensland Government has a plethora of data and phone networks, all evolving out
of local agency requirements. These networks are supported by thousands of contracts
with telecommunications vendors. With the exception of internet services and some multi-
agency initiatives (e.g. Public Safety Network), decisions on telecommunications
arrangements are made at the agency level.
From a procurement perspective, the level of attention paid to the quality of these
arrangements across government has generally been substandard. As a result,
government has a range of telecommunications arrangements33 in place that have been
either strategically inappropriate or simply too expensive relative to current market rates.
The savings section of this report describes areas where changes to procurement
approaches can be made to improve value for money from government‘s
32
ISO 27001 is an information security management system standard published in October 2005 by the International Organization for Standardization (ISO) and the International Electrotechnical Commission (IEC). 33
There are thousands of telecommunications contracts with the two biggest telecommunications vendors.

Queensland Government ICT Audit 2012: Infrastructure
120
Queensland Government ICT Audit 2012
telecommunications arrangements. This section will outline the fundamental changes
needed to telecommunications infrastructure.
6.7.2 Relationship between government and telecommunications vendors
Complex arrangements
Contractual relationships are difficult and expensive to administer. This report has
identified significant amounts of waste, through poorly managed telecommunications
arrangements. It is also very expensive for government to pay the government‘s phone
bills – more than $100,000 per month just in transaction costs. The reason for this
excessive cost (that is borne on both the vendor and government‘s side) is the multitude
of telecommunications accounts and overly complex billing arrangements.
No-one responsible for step change improvements
At present, agencies procure a mix of telecommunications offerings through a variety of
sourcing strategies. In most cases it is unclear who has responsibility for optimisation of
the service during the contract period. If there are improvement targets, these are often
limited to small price reductions. In many cases the vendor does not have sufficient
control of the end-to-end deliverable (nor is there sufficient motivation) for them to take
responsibility for optimising the service or substantially reducing the price.
The agency is in a similar position. There is little motivation to seek major improvements
because they cannot influence price. In most cases operational changes come at a price
increase. Under the current arrangements agencies are wasting up to $25 million per
year on poorly optimised arrangements.
Pricing mechanisms drive the wrong behaviour
Telecommunications vendors invest in massive amounts of infrastructure, generally with
enormous capacity, with their objective being to get a competitive return on these
investments. The majority of the pricing regimes for telecommunications are based on
consumption. This creates a number of issues.
Consumption pricing can be very complex to implement – as a result billing systems
used by telecommunications vendors can be complex and difficult to change. This
limits innovation and that impacts both sides; the vendor and government.
Consumption pricing is very difficult to administer - so much so that an industry sector
focused on managing telecommunications bills has grown. If a process needs a new
industry sector just to make it work then there is probably something wrong with the
process.
Queensland Government ICT Audit 2012: Infrastructure
121
Queensland Government ICT Audit 2012
Consumption pricing can drive unwanted behaviour within agencies. For example,
agencies may limit the use of certain telecommunications facilities in order to reduce
costs when in fact the use of these facilities was potentially a better business model
for service delivery to the community. Neither the vendor nor government benefits
from the existing engagement models. Government is encouraged to maintain a
constant, or even reduced, consumption rate and the vendor is not motivated to
improve the overall business model in order to reduce costs and/or increase margins,
reduce prices or reduce both. A model that encourages continual innovation (in
performance, price, or both) from the vendor would benefit both parties.
The following principles should apply to the development of a new engagement model
with telecommunications vendors.
The vendor should be offered an end-to-end deliverable where they are responsible
for an outcome; not responsible for meeting technical specifications.
As far as possible, the model should allow for unlimited consumption within the
quoted price with billing based on high level outcomes (not click charges for calls or
data volumes).
Switching costs are to be eliminated as far as possible. At the end of an arrangement
government should be able to go to open market to offer the service and the existing
assets. (Note: In many managed service arrangements the incumbent vendor has a
significant advantage over new entrants).
Market testing to occur every three years.
Telecommunications to be procured through an ‗as-a-Service‘ model.
For this model to work there has to be a simplification of the government‘s
telecommunications arrangements. Key areas to address are the reduction of diversity of
telecommunication infrastructure and a centralisation of ownership and decision making
in telecommunication investments. This would result in:
a single (logical) government data network
a single point for billing arrangements
a ‗One Government‘ approach to the design and implementation of
telecommunications arrangements.
There are a number of other principles that should apply immediately. These principles
are in line with the view that government and telecommunications vendors are strategic
partners, and as such should look after each other‘s interests.
Telecommunications vendors are to ensure that government agencies are being billed
for services at contracted prices or market rate; whichever is lower. The Audit has
found instances where government was paying commercial rates higher than

Queensland Government ICT Audit 2012: Infrastructure
122
Queensland Government ICT Audit 2012
individuals in the community could achieve. This occurred because agencies had not
actively managed their telecommunications arrangements, supported by a lack of
interest from telecommunications vendors in ensuring government had the best value
for money arrangements in place. In summary, government contract management
has to improve and its strategic telecommunications vendors have to care.
Government is to work with telecommunications vendors at a strategic level to align
their investment in infrastructure with key government initiatives (i.e. infrastructure
that has community as well as government benefit). Experience over the last two
decades has proven that dated adversarial procurement processes deliver little
strategic value in this area. In addition, the perception that telecommunications is a
Federal Government issue has perpetuated Queensland‘s less than optimal results
from federally funded telecommunications initiatives.
6.7.3 Government data network(s)
The government data network is a collective of agency level networks – at least one per
agency with a total number exceeding 50. There is no single architected network for the
Queensland Government. This creates a number of issues:
The Queensland Government is paying for a large number of networks covering the
same geographic area with no ability to aggregate capacity or speed. This agency
centric investment in telecommunications prevents government from leveraging
economies of scale.
This duplication also results in an underutilisation of physical infrastructure and higher
operating costs to government.
There is little or no managed redundancy provided by duplicated networks in the
same geographic area.
Different networks managed under different regimes make a whole-of-government
security approach almost impossible, inhibiting access to, and sharing of, information
across agency boundaries.
Siloed approaches to network provision limit step change approaches for the
provision of network services, and importantly, One Government services to the
community.
Multiple vendors provide data network services with third parties (e.g. CITEC) used to
manage handoffs between vendors.
There is an inconsistent approach to, and low level of investment in, disaster recovery
and service continuity across government.
Identifying actual costs in component areas of the data network infrastructure and
associated services has proved almost impossible for the Audit. The reasons are:

Queensland Government ICT Audit 2012: Infrastructure
123
Queensland Government ICT Audit 2012
there is no consistency to the classification of costs against domains
there is an inconsistent roll up of reported costs.
As a result, it is not possible to identify dollar figures in any potential savings across the
data network.
6.7.4 A One Government network
The QGCIO has developed a vision for a single logical data network (A One Government
Network). The vision links work on strategies covering security, identity,
telecommunications and cloud. The vision states:
Any Queensland Government employee from any agency, with the appropriate
security credentials, will seamlessly access the appropriate applications and
information that are required to successfully fulfil their duties, from any location in
the whole-of-government network, according to the predefined service levels, even
if they are mobile.
In a One Government Network architecture, the traditional security perimeter disappears
and network-based firewall and VPN security practices prove ineffective. Protecting an
extended network of cloud-based services and an increasingly mobile enterprise requires
a new approach. Identity management fills the gaps left by the disappearance of the
traditional perimeter and becomes the new point of control for government / agencies;
particularly when service providers own the servers and users own the devices.
A One Government Network will provide the foundation network for the future
Queensland Government Cloud Strategy. It will offer an assured network over which
government can safely share services, including many cloud services, to collaborate in
new ways, more effectively and efficiently than ever before.
The benefits of adopting consolidated One Government Network solutions include:
the removal of unnecessary duplication of network connectivity solutions across the
Queensland Government
cost efficiencies by utilising government‘s existing investment in network connectivity
solutions and capabilities provisioned under the Foundation Infrastructure Program
agency network infrastructure that complies with QGEA interconnection standards
consistent and standard service level agreements for network connectivity services
across government, including consolidation of carrier billing
greater homogenisation of processes that align to Information Technology
Infrastructure Library (ITIL) framework best practice
reduced equipment maintenance costs through aggregation
Queensland Government ICT Audit 2012: Infrastructure
124
Queensland Government ICT Audit 2012
reduced operational support and management costs through consolidation and
rationalisation of infrastructure and resources
solutions based on global internet protocol (IP) architecture using standard based
protocols and interfaces.

Queensland Government ICT Audit 2012: Organisational
125
Queensland Government ICT Audit 2012
Organisational

Queensland Government ICT Audit 2012: Organisational
126
Queensland Government ICT Audit 2012
7 Organisational
Findings
Agencies remain very operationally focussed.
Fragmented approaches to ICT investment have resulted in inefficient implementation
and overly complex ICT environments.
Performance management in agencies is poorly done with a tendency to default
management of risk.
Service cost benchmarks indicate excessive variability in costs, especially in some
high volume service areas.
Central service providers are under-performing and increasing the costs for agencies
in supporting their business activities.
There is a lack of transparency of costs in service providers across the government.
The fee for service model is not delivering the outcomes that it set out to deliver,
instead adding cost overheads and impeding the adoption of services and the delivery
of business.
The workforce profile is heavily operational with a skills profile that does not match the
likely future needs given the changing ICT industry and the government‘s preference
to externally source commodity services.
7.1 Introduction
Through the course of the Audit, the ICT-related organisational units of the Queensland
Government were examined and reviewed. This revealed a number of characteristics of
how ICT is managed and delivered.
In most agencies, the ICT unit is seen as operational service provision to the business of
the agency, not a strategic business partner. When treated as purely an operational
capability, the ICT unit is generally not empowered to contribute to the strategic outcomes
of the agency even though all agencies are completely dependent on ICT to drive those
strategic outcomes.
In most cases the peak governance body for ICT in the agency, the Information Steering
Committee (ISC) or equivalent, is not positioned as part of the executive governance of
the organisation. It is also common for the Chief Information Officer (CIO) not to have a
leading role on the ISC, often being relegated to being an advisor or an occasional
invitee.

Queensland Government ICT Audit 2012: Organisational
127
Queensland Government ICT Audit 2012
Despite the fact that ICT accounts for a significant portion of the spend in agencies,
underpins almost all of the business of the agency, and often provides the greatest
opportunity for advancing the business, the CIO is seldom a member of the executive
board.
Investment decisions are frequently made as point decisions to address a particular
business problem. Taking a strategic view would have ICT decisions made as a portfolio
of interconnected and prioritised decisions where the agency can obtain maximum value
from the set of investments.
Performance management in agencies is not mature. It tends to be operationally
focussed and often is risk-based. Again the performance management regimes tend to
be fragmented with no consolidated picture of performance across all aspects of ICT, and
no strategic portfolio view of risk associated with ICT in the organisation. This indicates a
lack of an outcomes focus which is also reflected in the very low levels of benefits
management maturity.
Financial management in ICT units tends to be reactive and cost centre based, with
service costs often not well understood. ICT budgets tend to be subordinate to those of
business areas, not strategically considered and largely around the operational aspects
of ICT.
Service delivery is also largely operationally focussed with strong operational disciplines.
In recent times there has being a further reduction in investment prioritisation and high
value strategic activities that look at how ICT can be leveraged to design the future of the
organisation.
Procurement in ICT remains operationally focussed. The current push to consider
alternate sourcing models for ICT will require more capability in strategic procurement,
vendor and contract management.
7.2 Shared Service providers
Shared service provider models have been in place in the Queensland Government for a
long time. There has been an increase in adoption of shared service arrangements over
the last 10 years. Prominent examples include Centre for Information Technology and
Communication (CITEC), Queensland Shared Services (QSS), Smart Service
Queensland (SSQ), Corporate Administration Agency (CAA) and agency cluster shared
service providers like the recently formed Information and Technology Partners (ITP).
The Audit found the following issues to be common across most shared service
providers:
Shared service providers have little strategic control over the services they are
expected to provide. This creates a level of inflexibility in self-determination for their
business. They still retain discretion in how those services are delivered.

Queensland Government ICT Audit 2012: Organisational
128
Queensland Government ICT Audit 2012
Shared service providers are directed and protected by their host departments often
looking after the interests of the host department ahead of the interests of other
clients.
Central government ICT service providers (CITEC, QSS and SSQ) are supported by
whole-of-government mandates that require agencies to consume their services.
However, the control associated with those mandates has typically been weak
extending uptake timeframes and eroding benefits. Agencies‘ declared unique
requirements have also driven up complexity, cost and implementation time frames
further eroding benefits.
Central government ICT providers have had undue influence over government ICT
policy and mandates. This resulted in policy and mandates that favoured the service
provider‘s implementation preference, often at the expense of agencies. This lack of
independence has at times driven policy that is not balanced and in the best interests
of government as a whole.
7.3 CITEC
CITEC is the central whole-of-government provider of ICT infrastructure and associated
services. It has its origins in 1964, becoming the State Government Computer Centre in
1976, and CITEC in 1987.
The early focus was around the provision of data processing capability for the state
government. In the 1980‘s, 1990‘s and early 2000‘s CITEC established and maintained a
significant commercial business providing data centre, infrastructure and network
services along with solutions integration and information brokerage on a commercial
basis.
The Service Delivery and Performance Commission Report on ICT Governance in
September 2006 recommended that CITEC reorient itself to become the Queensland
Government‘s technology service provider, winding back its commercial business to focus
on providing services to government. The one commercial part of CITEC‘s business that
was to be unaffected by this direction change was the CONFIRM information brokerage
business. The report also recommended that CITEC provide ancillary services such as
email and authentication.
At the time CITEC operated under a fully commercial model, received no direct budget
funding and had no tied government clients. However, CITEC did provide services to
some agencies under these commercial arrangements. It also delivered the GovNet
infrastructure on behalf of government under a mix of budget funding to its host agency,
and cost recovery from all departments.

Queensland Government ICT Audit 2012: Organisational
129
Queensland Government ICT Audit 2012
7.3.1 Issues
The success of the transition of CITEC to focus on the business of government has been
mixed. Major infrastructure establishment programs have failed to deliver. The Identity,
Directory and Email Services (IDES) program was terminated without delivering in 2012.
The ICT Consolidation (ICTC) program, while getting consolidation platform infrastructure
in place, has achieved very limited uptake. The Polaris data centre remains underutilised
with leasing costs being expended for a significant area of unoccupied floor space (45%
of floor space underutilised, at a cost of $3.26M per annum).
Agencies continue to express concern over the price of services from CITEC, particularly
for mandated services.
CITEC also receives criticism for the lengthy delays in provisioning services. This is
apparent in the timeframes for the establishment of the IDES infrastructure and services
(4 years), and the establishment of the Foundation Infrastructure Program (FIP) services
as part of the ICTC program (4 years).
Some success has been achieved in consolidation of contractual arrangements, most
notably in the Internet Service Provision (ISP) space. This arrangement has delivered
significant savings across government.
CITEC have also exhibited strong performance in managing technical issues, especially
during the 2011 floods where the systems and ICT services to government were kept
operational throughout the crisis. Recovery of affected systems was handled in a
professional and efficient manner.
Evaluations conducted as part of the audit indicate that CITEC maintains robust
processes, most notably in the areas of IT service management, operational performance
reporting to clients, and operational risk management. However, the Audit also found
opportunities for improvement in options analysis, procurement planning, cost
transparency, strategic performance management, and governance.
Financial position
CITEC currently exhibits poor financial performance. This has been identified by the new
government with direction given to achieve a positive financial position in 2012. The
cancellation of the IDES program has been undertaken to enhance CITEC‘s future
financial position. Current indications are that achieving a positive financial position this
year remains challenging.
Information provided to the Audit suggests that CITEC‘s poor financial performance has
several contributing factors:
CITEC has been directed to deliver services for government with conflicting criteria –
meet the service levels of the most demanding area of government, and provide good
value for money.

Queensland Government ICT Audit 2012: Organisational
130
Queensland Government ICT Audit 2012
Weak mandates have been in place resulting in low uptake. This results in high costs
and low revenue.
CITEC has been forced to carry overheads of unused capacity. For example,
contractually obliged to pay for unused floor space in the Polaris data centre due to
slower uptake than projected.
There is poor transparency of costs in service provision.
High overheads are included in the charges for services.
Prices charged do not reflect those in the published price book. CITEC are often
prepared to lower the price when challenged, and at other times are charging
agencies much higher prices than the published price.
While some of the constraints under which CITEC has had to operate have made
financial performance more difficult, there is little to suggest that it is aggressively taking
action to address its financial position. Further, there is no evidence that CITEC is
working to improve its value proposition to agencies or to government.
The Audit conducted a market analysis to examine the price performance of standard ICT
infrastructure sourced internally versus the pricing available from the market. Some of the
variability found is attributable to differences in the models and levels of service. As
shown by Figure 28, industry generally dominate the lower prices, while government
dominates the higher prices. Unmanaged services are generally lower cost while
managed services tend to be higher. To observe the commercial in confidence
requirements of vendors, their names have been withheld.
Figure 28 – Industry and agency comparison for a three year infrastructure investment bundle.
Queensland Government ICT Audit 2012: Organisational
131
Queensland Government ICT Audit 2012
While this raw analysis does not provide definitive answers, it does show that there are
opportunities for achieving cost reductions through the judicious use of industry sourced
services. Further, with genuine utility computing now available in the market, it is now
possible to have access to low cost services without being contractually locked into those
prices long after the market has moved lower.
Transparency
A majority of agencies have reported issues with the transparency of CITEC‘s price book.
Many state that their own delivery is much more cost effective than the services they are
required to source through CITEC.
The Audit has also experienced difficulty with cost transparency. Reviews of financial
performance were unable to obtain clear evidence of the price calculation, nor evidence
of the costs that underpin the price. When attempting to undertake basic benchmarking
with agency and market pricing, CITEC provided multiple revisions of pricing for what
were standard services, with later revisions heavily discounted below the published price
book.
Agencies report not being able to procure CITEC services at prices advertised in the
price book, in several cases being forced to remain on much more expensive services for
extended periods.
In other instances agencies have challenged CITEC pricing with other commercial offers.
The response from CITEC has been to quickly offer lower prices. This suggests a level of
overhead in pricing where agencies are being asked to pay a substantial premium rather
than true cost recovery with minimal overheads.
7.4 Queensland Shared Service (QSS)
The Shared Service Initiative (the Initiative) in the Queensland Government commenced
in 2002 with a plan to consolidate the software platforms and transactional service
delivery of finance and HR systems across government. The original intention was wider
than finance and HR systems but contracted its scope over time.
The Initiative concentrated primarily on the technical implementation of systems leaving
the business processing aspects to cluster-based shared service providers. The technical
implementation arm of the Initiative became known as Corptech in 2003.
In late 2007 the cluster shared service providers were reorganised. Health and Education
each retained their own cluster shared service providers for business processing. Shared
Service Agency was formed from the remaining four cluster shared service providers.
In mid-2008, the responsibility for delivery of the shared services agenda was transferred
from Queensland Treasury to the Department of Public Works.

Queensland Government ICT Audit 2012: Organisational
132
Queensland Government ICT Audit 2012
At this time it comprised Corptech for technology implementation and Shared Services
Agency for the delivery of the business processing services. Health and Education cluster
shared service providers remained independent.
On 1 July 2011, Corptech and Shared Services Agency were combined into the single
business unit that became known as Queensland Shared Services (QSS).
In response to the failures of delivery with the Health payroll since March 2010,
government accepted the recommendations of Price Waterhouse Coopers to split the
shared services technology implementation agenda. Government‘s decision in November
2010 handed control for shared services in Queensland Health and the Department of
Education and Training back to those respective agencies with the rest remaining with
QSS. These transitions are currently in different states of completeness.
7.4.1 Issues
The Audit found that QSS have a rigorous process discipline but lack a strong outcomes
focus. Their focus is primarily operational with strategic aspects of the business largely
relegated to a compliance activity.
Over the years QSS has developed strong capabilities and retain a critical mass of skilled
resources for government. They have implemented a solid cost model that allows them to
clearly understand all of the elements of cost and how they contribute to the delivery of
their services. They are also strong in their governance framework with governance
processes well-articulated and executed.
QSS has solid mechanisms for measuring and reporting transactional performance.
However, performance measures are concentrated on operational areas and weak in
strategic measures of performance. Service Level Agreements with vendors also reflect
incident-based performance measures.
End of support for core products
At present the government is exposed to a major risk with key technology platforms
running out of time to be replaced before the end of vendor support. For example,
payroll, HR and finance applications are discussed in Applications, earlier in this report.
This issue has been known for a number of years when the government negotiated
extended support dates with the vendors. Despite this, there have been significant delays
in commencing the necessary upgrade projects. The risk associated with having to
complete so many parallel technical upgrades is now extremely high.
Authority to make key decisions
Decision-making and governance arrangements around the implementation of corporate
solutions is not ideal. The lack of clarity of ownership, authority and responsibility for go
live decisions has resulted in systems entering production with unresolved issues to meet
political imperatives and artificial timelines.

Queensland Government ICT Audit 2012: Organisational
133
Queensland Government ICT Audit 2012
This results in increased operational costs due to the heavy burden of remedial actions to
support dysfunctional aspects of the production systems and associated business
processes.
Customisation of products
The shared services model implemented in the Queensland Government through QSS
has been unable to deliver many of the expected cost reductions. This has been in part
due to the policy of allowing agencies to have specific customisations to suit their
particular way of doing business. Current practices worldwide are indicating that
specialisations of corporate systems to align with the way an organisation currently
conducts its business should be vigorously avoided. Successful organisations are
adopting packaged solutions for corporate systems without customisation. Customisation
significantly increases complexity and cost of both implementation and future
replacement, and all but eliminates opportunities for economies of scale.
Fee for service
Like other government service providers QSS currently operates a fee-for-service model.
In this model agency usage determines the billing. This imposes an overhead on QSS to
gather the usage information, perform billing calculations, prepare and distribute bills,
process and follow up on payments, and deal with adjustments and corrections. The
overhead in turn adds to the cost of the service.
Sourcing model
The history of QSS and its previous incarnations have led it down a path of applications
configured and customised in house. All of the current practices and skill sets are aligned
to in-house delivery of customised packaged applications to meet the stated needs of
agencies.
This limits the options for future implementations and locks the government into
arrangements where upgrades are slow, difficult and expensive. Long upgrade times
combined with vendor determined end of support dates for the products creates a rolling
issue where upgrades are required again soon after the previous upgrades have been
completed. The result is constant churn and change at the technical level without
delivering any significant value to the operations of government.
Industry offerings have moved far beyond product-based software acquisition with the
provision of services that incorporate the configuration and operation of the product now
mainstream. In these types of offerings the vendor takes responsibility for the software
currency on an ongoing basis.
Large organisations worldwide are starting to adopt full service delivery models where the
partner organisation configures and operates the software and delivers the service to end
users inside the organisation on a per transaction basis.

Queensland Government ICT Audit 2012: Organisational
134
Queensland Government ICT Audit 2012
One size doesn’t fit all
A key assumption of the shared services program has been that one size could be made
to fit all. Thus agencies have been forced to adopt a product that in some cases has
added cost and complexity to their business with limited, if any, additional value in return.
While there are advantages to limiting the number of different products deployed to
service particular aspects of government, careful evaluation is required as to the
suitability and value for money before committing small agencies to large expenditure on
complex products that are beyond their needs.
Benchmark costs for ICT services
In the Audit‘s benchmarking of unit costs for eight key ICT service areas, QSS was shown
to have very high costs for three services.
Table 13 - QSS benchmark service areas with high costs
Service area Compared to government median
Compared to next highest
Compared to best practice government agency
Managed desktop services
($2,810 per device)
3 times higher
($909)
44% higher
($1,950)
7.5 times higher ($375 – TAFE outsourced)
Storage
($85K per operational TB)
22 times higher
($3.9K)
60% higher
($51K)
24 times higher
($3.6K – QPS)
Microsoft hosting services ($7,240 per server resource unit)
9.5 times higher
($762)
34% higher ($5,410)
12.5 times higher
($581 – DPC outsourced)
In all of these cases the services are provided through another government service
provider, either CITEC (storage and hosting) or DPW (desktop). Data from QSS indicates
that these costs do not have any overhead or mark-up added from within their
organisation. This indicates that pricing being applied to QSS by the internal government
service providers is not competitive and that there is a failure in QSS to actively compare
and manage the charges associated with these services.34
In telecommunications services, QSS‘s own costs are considered to be at best practice
levels ($786 per FTE) indicating that QSS manage their own telecommunications costs
well and maintain a tight grip on demand for telecommunications services for their
employee base.
The benchmark in this area is, however, somewhat dependent on the type of business
being run and the associated requirement for telecommunications services in the day-to-
day work of employees.
34
QSS have indicated that there has been a significant change in CITEC service charges since 1 July 2012.
Queensland Government ICT Audit 2012: Organisational
135
Queensland Government ICT Audit 2012
QSS also manage the telecommunications accounts for a number of agencies. The Audit
found that the group of agencies that use QSS to manage their telecommunications
accounts are also the group of agencies that have the highest telecommunications costs.
There is a significant opportunity for improvement in account management by QSS to
assist agencies to manage down their telecommunications expenditure.35
7.5 Smart Service Queensland (SSQ)
Smart Service Queensland (SSQ) was formed under the then Department of Innovation
and Information Economy in 2002. The scope was to provide a set of services through
the Internet and an integrated contact centre.
Over the 10 years since, SSQ has continued to expand the services it delivered on behalf
of agencies through telephone and web channels. Commencing in 2008, face-to-face
channels were added through the hosting of integrated whole-of-government counters in
Brisbane, the Sunshine Coast and Cairns.
In late 2011, SSQ launched the new web face of government using CS Transform‘s
franchise model to deliver a more customer focussed experience. Implementation is
progressing across 17 franchises for the general public and a separate franchise for
business and industry.
SSQ has also been progressing a program to reduce the number of phone numbers the
public use to contact the Queensland Government.
This approach to advancing the service delivery of government became the foundation
for the government‘s ‗one stop shop‘ agenda to revolutionise the service delivery
experience for the public of Queensland.
SSQ operate their own ICT infrastructure and applications underpinned by service
relationships with CITEC and a number of industry partners.
7.5.1 Issues
ICT strategy and direction
The Audit found that SSQ has a well-articulated direction and focus areas although there
are issues with the timeframes in the strategies not being as current as would ideally be
preferred. It was not clear what evidence base was used to derive the ICT strategy, nor
whether a structured rigorous process was applied to prioritisation across the portfolio.
The organisation exhibits a very strong focus on the operational delivery of services to
the public with the delivery of the ICT necessary to support that more of a distraction than
a differentiator.
35
The responsibility for taking action to address high telecommunication costs rests with agencies. The current arrangement limits QSS to the provision of information to agencies.

Queensland Government ICT Audit 2012: Organisational
136
Queensland Government ICT Audit 2012
Tight funding for ICT
To date SSQ has operated their internally managed ICT on tight budgets. In addition, the
size of the organisation has not provided significant opportunities for economies of scale.
This combination has resulted in higher costs and an ICT infrastructure that is barely
sufficient to support its business operations. Over the last two years SSQ has spent a
large proportion of their effort and expenditure dealing with legacy and capacity issues.
As SSQ takes on more services from agencies it will continue to be challenged to have
ICT infrastructure with the capacity to support that growth while the current funding and
ICT service provider model remain.
Fee for service model
SSQ operates on a combination of very limited appropriation funding and fee for service.
As with other central service providers, SSQ faces challenges with agency acceptance of
their service charges. Client agencies have difficulty understanding the value for money
equation. There is evidence to suggest that the additional rigour applied by SSQ when
agency service delivery is transitioned imposes additional cost. Prior to transitioning
agencies typically have not applied the same levels of rigour to interactions and, in many
cases, have not understood the true costs of delivering the service prior to transition.
As with other service providers, the fee for service regime in place in SSQ imposes
overheads associated with billing that add to the cost of service provision. While one of
the original intents behind applying a fee for service model was to manage demand, it is
clear that from a public perspective, government service delivery is about providing
sufficient high quality services to meet public needs. Demand may be better managed
through a reduction in the need to interact with government rather than reductions in the
government‘s ability to meet those needs.
Should the fee for service model be removed, funding will have to be provided to meet
the service levels required and alternate means be employed to contain the public‘s need
to interact with government.
Channel focussed culture
The Audit has found that SSQ have a very strong service culture that is linked to a solid
channel centric set of disciplines around performance management, financial
management and governance. The Audit also found a focus on improving and supporting
staff in specific channels.
The ICT functions underpinning SSQ are also structured around the different channels of
delivery with costs associated with those channels and their cost centres. The total cost
of ICT is not visible across multiple business areas in SSQ.

Queensland Government ICT Audit 2012: Organisational
137
Queensland Government ICT Audit 2012
ICT service maturity and performance
The incident resolution times are the longest in the Queensland Government, and this is
reflective of the low funding and maturity of the ICT function within SSQ. Of particular
concern is the lack of an overall performance management approach and the lack of an
overall portfolio risk management approach. This is accompanied by low maturity in IT
Service Management (ITSM) and operational change management.
Benchmark costs for ICT services
In the Audit‘s benchmarking of unit costs for eight key ICT service areas, SSQ was shown
to have very high costs for four services.
Table 14 - SSQ benchmark service areas with high costs
Service area Compared to government median
Compared to next highest
Compared to best practice government agency
Networks
($1,670 per active network end point)
2.5 times higher
($667)
10% higher
($1,520)
5 times higher
($328 – CITEC)
Microsoft hosting services ($3,110 per server resource unit)
4 times higher
($762)
27% higher ($2,440)
5.4 times higher
($581 – DPC outsourced)
Print services
($0.13 per page)
2.6 times higher ($0.05)
44% higher
($0.09)
3.3 times higher
($0.04 – QPS)
Storage services
($9.5K per operational TB)
2.4 times higher
($3.9K)
66% higher
($5.7K)
2.6 times higher
($3.6K – QPS)
In all of these areas there are opportunities for SSQ to reduce its cost base by either
optimising the costs of current service delivery arrangements or by switching to alternate
service provision arrangement.36
7.6 Agency ICT units
The Audit examined the ICT capabilities in agencies in five dimensions:
strategy and direction
governance
performance management
financial management
service delivery.
36
SSQ currently have initiatives underway that are expected to significantly lower their costs with respect to network and storage as older technology is decommissioned.

Queensland Government ICT Audit 2012: Organisational
138
Queensland Government ICT Audit 2012
The following issues examine the findings in these areas overlaid with the changing
future ICT landscape and what generally needs to be done to position the government for
that future. In addition, there are some specific findings for individual agencies in relation
to their management and delivery of ICT services.
7.6.1 Issues
ICT management approach
Agencies tend to manage their ICT in a very operational way, managing projects and
activities often on an instance by instance basis. They do not take a service centric
approach to managing their portfolio. When a service centred approach is taken agencies
then understand the end-to-end value chain of delivering services and in doing so
optimise the ICT services required to underpin agency business as an integrated
portfolio. A service centred approach also allows for improved service comparisons,
performance management, cost management, risk management and governance.
Tighter austerity measures have resulted in agencies asking their ICT business units to
focus only on ‗lights on‘ activity. The result has been ICT business units that are geared
more to react to incidents and problems of the day than drive improved service delivery
through planning with the business.
Agency financial management for ICT has been found to be one of the most challenging
areas. The treatment of ICT as a necessary operational expense has led to the
predominant approach to management of ICT being that of cost containment.
Furthermore, the distribution of ICT budgets is primarily through allocation of budgets to
functional cost centres with expense attributing against those cost centres. This has
resulted in difficulty understanding costs at a service level and cost shifting making the
real costs of ICT impossible to understand.
Operational focus
Agency ICT units are heavily operationally focussed. Significant resources are expended
on operational ICT, with strong IT Service Management methodologies for ICT
operations, and maturing adoption of standard government project and program
management methods for the change portfolio. However, ongoing management of value
to deliver outcomes aligned with strategic direction is not evident.
Not only is this operational focus potentially having a negative impact on outcomes for
agencies, it is also not the appropriate kind of focus an internal ICT capability will need in
an as-a-service future where the operational aspects of ICT are no longer delivered by
the agency.
The Audit also found that governance is largely operationally or initiative focused, with
poor business buy in. ICT participation in business governance is also poor. Agency CIOs
are often relegated to operational roles without the opportunity to participate in strategic
decision-making for the organisation.

Queensland Government ICT Audit 2012: Organisational
139
Queensland Government ICT Audit 2012
Agencies that do include CIOs in the executive management of the organisation are
consistently leaders not only in their use of ICT to make their businesses better but also
in the operational performance of their ICT.
Queensland Health and DETE highlight that when CIOs are invited to the agency
executive table they have the ability to more proactively support business and customer
outcomes. In smaller agencies with reduced ICT staff there is a high likelihood that ICT
executives are excluded from senior executive and governance boards. CIOs still under
the auspice of corporate services are largely managed as IT operational shops.
Federated or centralised
The Audit found two models for how ICT is funded and controlled in agencies. Agencies
are either predominantly federated with funding and ICT decision-making devolved to
business areas within the agency, or they are centralised, with the funding primarily
provisioned to a central ICT unit and investment decision-making resting with the agency
Information Steering Committee. Federated ICT has been found to result in challenges in
maturing the agency‘s ICT as a whole. This also makes it difficult to achieve economies
of scale as each business area procures independently. Low portfolio management
maturity in the majority of agencies results in poor oversight of the suite of applications
being acquired and whether they can be acquired in a more holistic way.
Federated business units within an agency in most cases do not see their ICT business
units as a strategic partner. Further, the federated approach also results in lower
compliance with standards and results in much more complex, expensive and difficult to
manage ICT environments.
The Audit examined the distribution of ICT resources in the organisation between those
under the CIO and those working inside business areas of agencies. Some departments
were not able to clearly identify those ICT staff employed by business areas resulting in
potential under-reporting in those departments. The level of discipline and management
control over ICT expenditure, especially the agency‘s implementation of portfolio
management practices to underpin investment decision making, will determine how
fragmented ICT becomes. Fragmented ICT makes it difficult to maintain a streamlined
and cost-effective ICT environment.
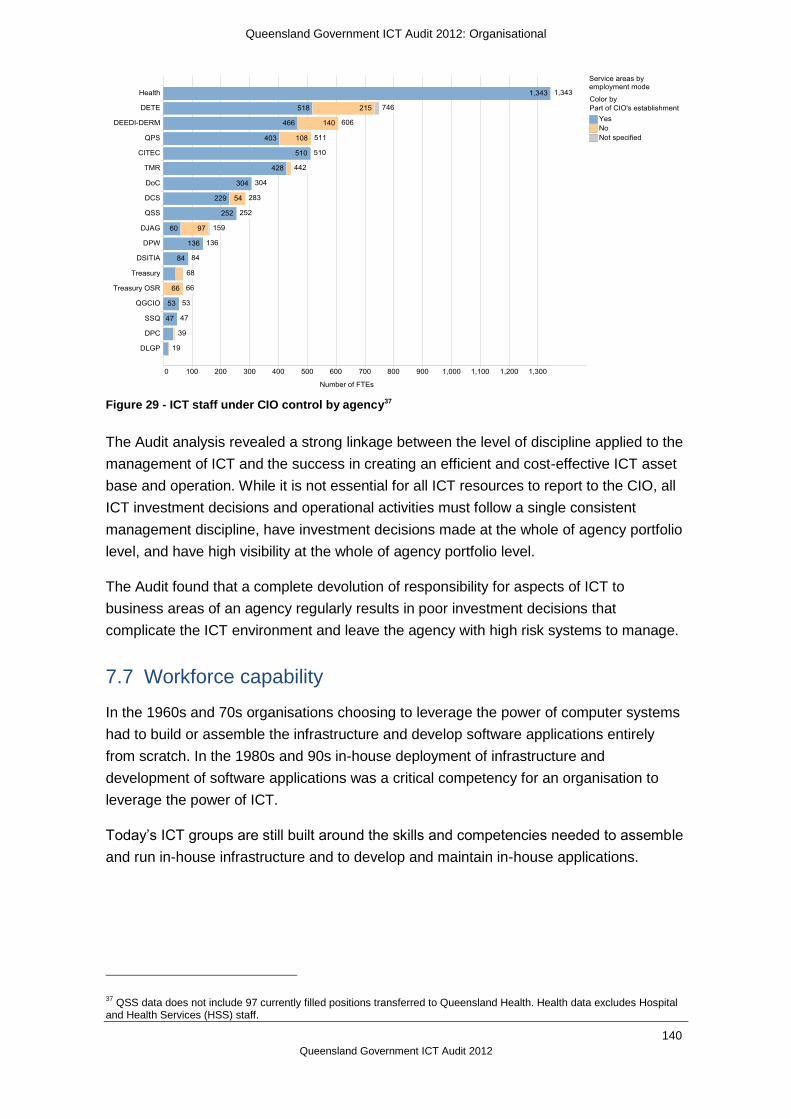
Queensland Government ICT Audit 2012: Organisational
140
Queensland Government ICT Audit 2012
Figure 29 - ICT staff under CIO control by agency37
The Audit analysis revealed a strong linkage between the level of discipline applied to the
management of ICT and the success in creating an efficient and cost-effective ICT asset
base and operation. While it is not essential for all ICT resources to report to the CIO, all
ICT investment decisions and operational activities must follow a single consistent
management discipline, have investment decisions made at the whole of agency portfolio
level, and have high visibility at the whole of agency portfolio level.
The Audit found that a complete devolution of responsibility for aspects of ICT to
business areas of an agency regularly results in poor investment decisions that
complicate the ICT environment and leave the agency with high risk systems to manage.
7.7 Workforce capability
In the 1960s and 70s organisations choosing to leverage the power of computer systems
had to build or assemble the infrastructure and develop software applications entirely
from scratch. In the 1980s and 90s in-house deployment of infrastructure and
development of software applications was a critical competency for an organisation to
leverage the power of ICT.
Today‘s ICT groups are still built around the skills and competencies needed to assemble
and run in-house infrastructure and to develop and maintain in-house applications.
37
QSS data does not include 97 currently filled positions transferred to Queensland Health. Health data excludes Hospital and Health Services (HSS) staff.

Queensland Government ICT Audit 2012: Organisational
141
Queensland Government ICT Audit 2012
As the industry moves to an ‗As-a-Service‘ paradigm, the challenge for organisations will
be: How do we leverage our existing ICT resources (people whose skills, experience and
history of success has been forged around building and running in-house ICT) in a world
where storage capacity, computing cycles, applications, networks and devices can be
delivered as a service at a fraction of the cost, more responsively, in a more flexible
manner and arguably with less risk?
It is human nature for people to play to their strengths and to fall back on proven
techniques based on their experiences. So how do we ensure these experiences in one
paradigm do not limit our ability to leverage a newer paradigm?
Fundamentally, the roles of in-house ICT staff have always been to identify and provide
the best technology solutions to support the business of the organisation. This tenant still
stands. The challenge today for ICT staff is to identify and provide the best solutions from
all of the options available – not just those that exist in-house. The impacts of this are far
reaching for ICT groups.
The old operating model for ICT groups included a range of standard roles that took care
of in-house assets. For example, assets such as networks, storage, servers, etc. will no
longer be in-house and will not need teams of people to look after them. The old
operating model for ICT assumed that applications needed to be written and maintained
in-house. A growing range of business functions can now be delivered via software-as-a-
service where the organisation never owns (and never develops the application).
The future role of ICT groups is to assist in the identification and assembly of these
functions – a very different skill set to programming and application from scratch. Some
programming capability will always be required to integrate the selected function, but this
will be a niche skill set. In essence the shift for ICT groups is as fundamental as saying
that the old ICT operating model is engineering based and the new operating model is
business based.
7.7.1 Issues
Operational focus
Approximately 64% of the ICT workforce is engaged in the implementation and day-to-
day operational support of applications and infrastructure. It is clear that the transition to
alternate methods of ICT delivery will have a significant impact on the current ICT
workforce. Whilst some agencies have already made progress in shifting the focus of ICT
delivery to fully managed services and software-as-a-service options, approximately one
quarter of current ICT workforce are supporting the internal development and ongoing
support of applications.

Queensland Government ICT Audit 2012: Organisational
142
Queensland Government ICT Audit 2012
The focus in the Queensland Government is clearly biased toward the internal provision
of business and underpinning ICT services. The Queensland Government will require
both the business leadership as well as business acumen and experience to challenge
the way that government services are currently provided and create an environment that
embraces fresh insight and radical change.
Future ICT worker
The future ICT worker in the Queensland Government will need to challenge the way that
both the business and supporting ICT services are provided. They will need to build trust
and rapport with the business as well as build confidence through the successful
implementation of alternatives that deliver value for money business and ICT services.
Currently only 2% of the ICT workforce are in roles that can challenge the way
government conducts its business. The profile of the ICT workforce is currently not
equipped to sufficiently promote or influence innovation. Insufficient resourcing in the
areas of architecture, business and ICT strategy and planning and business analysis will
inhibit the speed at which significant change can be planned and implemented.
Information and security
Understanding the nature of the government‘s information holdings will be crucial to
successfully changing how business services can be provisioned. Information must be
current, accessible, portable and able to be shared, mined and manipulated regardless of
where that information is stored. There will need to be consistent and pragmatic
approaches to developing and accessing the risk profile of government information
holdings. This will enable appropriate information security controls to be applied,
independent of specific technology security products and ICT solutions.
The information holdings of the Queensland Government are vast. Current information
architecture, information security and information management capacity and capability
will need to be expanded to better understand what and how information can be
accessed, shared and published for consumption by the public and other stakeholders.
This is an area in which some erosion in the area of information management has already
occurred. Currently less than 5% of the reported ICT workforce specialise in the security
and management of information.
Use of contractors
The use of contractors to provide specialist technology skills is consequence of the
reliance on internally provided and highly customised ICT services and applications.
Specialist areas have been supplemented with contract staff because of difficulties with
attracting and retaining people with appropriate skills at public servant salary levels. As
part of workforce planning, there needs to be recognition of the specific skill sets of
individuals with a level of remuneration commensurate with the performance, skill set,
competency and current industry rates. Programs that restrict the number of staff at
particular levels may further inhibit the government‘s ability to attract and retain qualified
and competent resources.

Queensland Government ICT Audit 2012: Organisational
143
Queensland Government ICT Audit 2012
There will always be a need to fill resource capacity and skill shortfalls with contractor and
temporary resources. These resources should however only be used to facilitate and
implement change rather than be retained on a long term basis in support roles.
Workforce planning
There is a responsibility at the whole-of-government level to set direction around ICT
provision and the subsequent reshaping of its ICT workforce. Success with resizing and
reshaping the ICT workforce rests with agencies and is dependent on the extent to which
each agency embraces innovation and alternative methods of ICT service provision.
At present, ICT workforce resizing efforts are focused on ensuring the business continuity
of in-house ICT services to ensure that there is no threat to business services. It is
expected in the longer term, that the level of technical expertise required to support ICT
services will be reduced. Roles in architecture, strategy, information security, information
management, planning, service management and sourcing will become more prominent.
The focus will be on managing integrated ICT commodity services, provided by multiple
services providers to provide seamless ICT support to the customer.
The ICT workforce has already changed and will continue to change as a result of
organisational drivers such as the Establishment Management Program and through
strategic shifts in the delivery of ICT services. Ongoing workforce planning by agencies is
required to confirm the profile of the ICT workforce in terms of size, skill, competency and
utilisation of staff as well as define and implement strategies to reshape the workforce.
Strategies for reshaping the ICT workforce in the Queensland Government should
include:
reskilling and retraining to grow the necessary skills and build new capability
redistribution of surplus resources across departments to address core skills gaps in
particular areas
pooling of key areas of expertise if possible to better utilise specialist expertise
repositioning of technical resources to service providers
transitioning surplus resources to assist in the implementation of business and ICT
change projects.
7.8 Procurement
7.8.1 Introduction
While it is acknowledged that agencies have successfully used procurement processes to
achieve agency business outcomes and significant savings at times, there are a number
of issues that are limiting the value from procurement activities and impacting the
initiatives they underpin. There is often a mix of central procurement and procurement
within the ICT division of an agency.
Queensland Government ICT Audit 2012: Organisational
144
Queensland Government ICT Audit 2012
There are few performance measures in procurement and procurement activity. This is
regardless of whether the procurement is internal to ICT or centralised in corporate
procurement. However, procurement has a large impact in the realisation of projects and
significant changes. Fragmented approaches to procurement are resulting in significant
wastage and missed opportunities. Procurement was often cited as the cause of
significant delays in delivery for ICT projects and programs.
7.8.2 Better procurement information required
The procurement function is an area of government that needs excellent supporting
metrics. The Audit found that ICT procurement information was inadequate. This leads to
a significant amount of waste. The Audit reviewed a number of procurement areas in
detail and found significant savings opportunities. For example, savings in vendor
management are up to $14.8M and in Telecommunications the savings potential is
$31.2M.
A range of process improvements and tools that can be put in place to improve the
management of the procurement discipline across government are discussed in Annex –
Procurement.
7.8.3 Internal management fees
Currently, there are a number of whole-of-government ICT procurement arrangements
that charge a management fee (typically 2% of invoice charges) to suppliers for supplying
under that specific arrangement. The fee is represented as a mechanism for recovering
the cost to government in managing the arrangement. However, the revenue collected
from suppliers is in some cases grossly disproportionate to the cost of resources required
to manage these arrangements. A number of issues present themselves when applying
administration fees on government procurement arrangements:
These fees create unnecessary red tape and drive up overheads for a range of
parties in the supply chain. It can be expected that any costs incurred by industry (the
fee plus the cost of red tape) will eventually be passed back to government as a cost.
The fee represents a barrier to doing business with the Queensland Government. The
New South Wales government has recently eliminated all instances of this type of
management fee.
The fees, in some cases, are disproportionately high compared to the real costs of
administering the arrangements. Eventually securing the fee can become more
important for the procurement group than realising the objective of streamlining
procurement and ensure good outcomes for government.

Queensland Government ICT Audit 2012: Organisational
145
Queensland Government ICT Audit 2012
7.8.4 Inefficient order processing
The Audit has identified several cases where agencies are generating many more orders
than needed, resulting in wasted effort and processing costs. These costs are substantial.
This occurs through unmanaged procurement activity within the agency.
It is not driven by constraints imposed by vendors. In fact, vendors such as Microsoft and
Adobe, for example, provide end of month processes to assist agencies in simplifying
procurement processes. Annex - Procurement discusses these issues further.
7.8.5 Vendor management maturity is low
The Audit has identified lower than adequate levels of vendor management maturity
across government. The Queensland Government has a number of major ICT vendors
such as IBM, SAP, Adobe, Microsoft, Oracle and VMware that require a higher degree of
management than other vendors. This is due to their strategic relationship to Queensland
Government ICT. The high switching costs and strategic dependencies on these large
vendors‘ solutions means a high degree of lock-in to their products and services.
Therefore, highly skilled IT vendor managers are required to manage entrenched vendors
and ensure contracts and relationships are more effectively managed to align IT and
corporate goals, and to ensure software and hardware investments are maximised.
The audit found that of 16 agencies audited, only 10 have a vendor management function
and, of these, only four had a Vendor Management Framework that governs their vendor
management function. These functions are not easily created. Vendor management is a
broad discipline that requires capabilities including legal, commercial, technology and
financial competencies. At present a significant skills gap exists.

Queensland Government ICT Audit 2012: Organisational
146
Queensland Government ICT Audit 2012
This page has been intentionally left blank.

Queensland Government ICT Audit 2012: Initiatives
147
Queensland Government ICT Audit 2012
Initiatives

Queensland Government ICT Audit 2012: Initiatives
148
Queensland Government ICT Audit 2012
8 Initiatives
Findings
While agencies are maturing in project and program management, many projects are
still showing poor project outcomes with overruns of cost and schedule.
10% of reported projects show an increase in budget of greater than 75%.
44% of reported projects ran over schedule by more than 3 months. The average
schedule slippage was one year.
Long running projects are the least likely to deliver the desired outcomes and
benefits. Conversely, staged projects show high performance in delivery of
outcomes and benefits.
Initiatives that involve shared service providers (QSS and CITEC) showed
delays in schedule and changes in budget.
Agency budgets fall far short of funding the initiatives identified by agencies as being
required to meet their business needs. Some agency budgets reflect chronic
underfunding with many in-flight initiatives recently put on hold.
As a result of the way agencies are funded, they have shown a preference for capital
expenditure (build-based) projects over operational expenditure (service-based)
projects.
Agencies are showing varying levels of portfolio management capability consistent
with the early phases of adopting these practices.
Lack of portfolio management has resulted in some poor selection of investment
priorities.
Few agencies use portfolio level information to manage the performance of their
ICT initiatives as a whole, limiting the opportunity to maximise the value being
delivered.
Many ICT initiatives are commenced without a business case. Initiatives that have
well developed business cases that are then applied to guide the execution of the
initiative deliver better outcomes.
Benefits management maturity across the government is low. Many initiatives have
not identified the expected benefits, have very low levels of measurement and do not
track the benefits/outcomes.
8.1 Introduction
The government funds and executes a large number of initiatives to maintain and
enhance the ICT asset base of government. These initiatives include activities and
programs/projects designed to deliver changed or new functionality.

Queensland Government ICT Audit 2012: Initiatives
149
Queensland Government ICT Audit 2012
Agencies reported 1,092 ICT-enabled initiatives as summarised in Table 15.
Table 15 - Aggregated initiative investment information
Initiative status No. of initiatives reported
Estimated expenditure
Initiatives completed since 30 June 2011 199 $445M total estimated expenditure
Initiatives closed (stopped) since 30 June 2011
60 $22.4M total estimated expenditure
Initiatives that are active and currently underway
304 $1,173M total estimated expenditure
$643M forecast expenditure
Initiatives yet to start, awaiting approval 207 678 $1,728M forecast expenditure
Initiatives on hold, awaiting approval 167 $189M total estimated expenditure
$93M forecast expenditure
Initiatives that are ongoing and operational in nature (business as usual)
155
It should be noted that expenditure is across the life of the project, which may be across
multiple years.
8.2 Funding
Table 16 shows a breakdown of the funding arrangements by the various agency
portfolios for 2012 onwards. It highlights where agencies vary, and where some agencies
have significantly more fully funded expenditure as a proportion of their portfolio than
others.

Queensland Government ICT Audit 2012: Initiatives
150
Queensland Government ICT Audit 2012
Table 16 - Initiative funding by agency showing forecast expenditure
As a result of recent budget cuts and a backlog of unmet demand, most agencies have a
large number of initiatives that are on hold. DCCSDS have the largest proportion with
85% of their initiatives currently on hold.
One notable initiative currently on hold is QPAS – replacement of the Queensland Patient
Administration System (HBCIS) in Queensland Health. This initiative is of very high
priority for Queensland Health, now inside the lead time required for replacement, and
still awaiting funding. This initiative not only poses risks for the agency operations if the
current system were to fail, it also entails a very difficult and complex implementation.
Capital expenditure funding was found to be more readily accessible for initiatives. This
resulted in a tendency towards capital purchase of hardware and software including in-
house software development activity rather than the acquisition of ICT solutions on a
service basis. This severely limits agencies‘ ability to be agile in their software solutions
and creates a significant long-term lock-in to the procured solutions.
8.3 Portfolio management
Portfolio management in ICT has been introduced into Queensland Government
agencies over the last few years. Some agencies have shown higher levels of adoption
than others, from awareness and understanding through to repeatable execution.
Agency
$ % $ % $ % $ %
DAFF 1.3M 83% 0.25M 17% 1.5M 100%
DCCSDS 1.4M 3% 39.2M 97% 40.6M 100%
DCS 126.2M 92% 6.5M 5% 4.8M 4% 137.5M 100%
DETE 5.7M 10% 0.35M 1% 53.0M 90% 59.0M 100%
DJAG 39.1M 83% 3.6M 8% 4.3M 9% 47.0M 100%
DLG 0.22M 59% 0.15M 41% 0.37M 100%
DNPRSR 1.6M 68% 0.75M 32% 2.4M 100%
DNRM 15.6M 55% 1.0M 4% 11.7M 41% 28.3M 100%
DPC 4.4M 100% 4.4M 100%
DSDIP 0.49M 27% 0.61M 34% 0.71M 39% 1.8M 100%
DSITIA - CITEC 0.91M 3% 4.6M 17% 21.8M 80% 27.3M 100%
DSITIA - QSS 11.9M 100% 11.9M 100%
DSITIA - SSQ 2.3M 49% 0.75M 16% 1.7M 35% 4.7M 100%
DTESB 4.2M 100% 4.2M 100%
EHP 2.1M 38% 3.4M 62% 5.4M 100%
HPW 10.7M 20% 5.8M 11% 36.9M 69% 53.3M 100%
QH 285.4M 15% 4.4M 1,632.1M 85% 1,921.9M 100%
QPS 32.4M 84% 2.9M 7% 3.4M 9% 38.7M 100%
QTT 9.5M 53% 0.10M 1% 8.3M 47% 17.9M 100%
TMR 27.6M 49% 3.2M 6% 25.7M 45% 56.5M 100%
TOTAL $581M $37M $1,847M $2,465M
Fully funded or
internally funded
Partially funded Unfunded or
awaiting approval
Total forecast
expenditure

Queensland Government ICT Audit 2012: Initiatives
151
Queensland Government ICT Audit 2012
Only a few agencies appear to leverage their initiative information to govern their
portfolio. However, there are still many initiatives that escape the attention of the ICT unit
in agencies and, depending on internal governance of ICT investment, may be entirely at
the discretion of the business units within the agency.
Without visibility of ICT investment decisions across an agency, and at a whole-of-
government level, it is inevitable that poorly aligned investment decisions will be made.
The result is poor prioritisation of ICT spend within the agency and across government.
In addition, the lack of a portfolio approach in agencies means no opportunity to
maximise the value being delivered from the suite of investments an agency is making.
Without a portfolio approach, collective good value for the agency and for government as
a whole is all down to good luck rather than good management.
8.4 Business cases
The Audit found varying levels of business cases to substantiate the rationale for funding
and commencing initiatives. In many cases, even where a business case was used to
justify funding an initiative, it was subsequently not used as the basis upon which the
initiative was conducted or managed.
The Audit did not advocate that every investment required a long and arduous business
case to be developed. Instead the Audit was seeking right-sized formal justification for the
investment. Often in the case of larger investments where a submission was required to
obtain funding for an initiative, the submission was seen as the business case but then
because of Cabinet-in-confidence requirements was not available to be used to drive the
initiative.
Business cases were often found to be deficient in catering for the ongoing operational
funding required to sustain an ICT system. This resulted in funding shortfalls in the out
years once the system has been placed into production.
8.5 Benefits management
Benefits management was poorly done in most agencies. Benefits were often poorly
articulated, described in terms of ICT benefits rather than business benefits, if they were
articulated at all.
When benefits were described they were often then not followed through with tracking
and measurement throughout the life of the project or program. Where benefits were
measured the measurement often stopped when the project was complete even though
the real delivery of the benefits was projected to be well past project closure. This was
often due to the project team being assigned responsibility for benefits management
rather than the business sponsor or owner.

Queensland Government ICT Audit 2012: Initiatives
152
Queensland Government ICT Audit 2012
The Audit was unable to determine whether benefits or outcomes articulated in business
cases were ever realised following implementation.
Benefits management practices in agencies fall well short of what is required if business
investment in ICT is to be able to demonstrate value for money.
8.6 Program and project management
The Audit found that most agencies had developed their project management capability,
however, many areas still require improvement. The basic discipline of project
management is being practiced to varying degrees in agencies. High profile project
failures are an indication of weakness in project management practices and discipline.
There was often a disconnect between the business and the ICT project resulting in
failures of communication and failures in managing business change aspects of the
projects.
A number of projects exhibited ineffective financial management processes resulting in
discrepancies between planned and actual project expenditure.
Agencies appear to be assessing risk in projects reasonably well. However, agencies
tend to have optimistic opinions about the likelihood of project success for high risk
projects.

Queensland Government ICT Audit 2012: Initiatives
153
Queensland Government ICT Audit 2012
Cost overruns in projects are not always apparent due to regular re-baselining of projects.
Table 17 shows a list of the 10% of the significant initiatives that had a cost with a greater
than 75% increase in budget since the original approval.
Table 17 - Initiatives with cost overruns greater than 75%
Significant initiative Agency
Weapons Licensing Management System QPS
ESCAD Infrastructure Upgrade Project DCS
QVAS Gateway Valuation reform and LVA 2010 (QLVA) DNRM
Effective Service Delivery (ESD) Lifecycle DTMR
Migration to VoIP DTMR
Early Childhood Education and Care (ECEC) Grants Management Solution DETE
International Students Management System (SMS) CRM DETE
A Road Management Information System (ARMIS) Remediation DTMR
DPW IDES Implementation DHPW
Complaints Management System DETE
Service Centre Online Phase 2 DTMR
State Property Asset Management (SPAM) DNRM
RTI and Case Management Tool (LALB) Implementation DETE
Ingres Software Upgrade DETE
Local Laws Enhancements DLG
Sybase ASA Upgrade DETE
General Purpose Expenditure Voucher Smart Form DETE
International Offshore Project Unit (IOPU) Management Project for the implementation of a Customer Relations Database
DETE
A large proportion (44%) of projects assessed, show changes in schedule of greater than
three months. Of those projects with schedule overruns 71% were reported to have re-
baselined (i.e. approved changes to the schedule). While re-baselining is an accepted
practice, there is evidence of a systemic issue with an average slippage of one year per
project. Agencies cited shifting priorities, procurement delays and availability of
appropriately skilled staff as some of the reasons for schedule overruns.
The Audit found that ICT projects had durations that were on average 1.9 years longer
than the ideal. Long duration projects have been found to be more likely to not deliver on
the original business case. Successful agencies were found to contain the timeframes for
projects by staging the project into stages of 12 months or less where each stage
delivered value in its own right.

Queensland Government ICT Audit 2012: Initiatives
154
Queensland Government ICT Audit 2012
8.7 At risk initiatives
Table 18 shows those initiatives assessed as being at risk through in-depth analysis.
Table 18 – Initiatives at risk
Significant initiative Agency Observation
Lattice Infrastructure Improvement
DCS, QSS, CITEC
Extreme exposure, scope agreed late 2011 but still not started, issues with inter-agency governance and accountability, need for protected environment.
CIIP – ADS Technology Refresh Project
QSS Delays due to reprioritisation of resources, inter-agency dependency, limited documentation. Project has been put on hold.
Laboratory Information Management System (LIMS)
TMR Significant procurement and vendor management issues, ongoing resource issues, concerns around quality and industry acceptance of end product, executive indecisiveness.
ParkInfo 2.0 DNPRSR Significant procurement and vendor management issues, in-house developers had inappropriate input early in project, alternate solution with revised business case under consideration.
Table 19 shows initiatives that warrant additional attention due to agency reported high
business impact and potential performance issues. Some of these initiatives may also
represent a high risk for government.
Table 19 - High business impact initiatives with potential performance issues
Significant initiative Agency Observation
SAP Assets Procurement Finance Information Resource (SAPFIR)
QH SAPFIR is the project with the largest total estimated expenditure in this table ($79.7M). Although the SAPFIR project was identified as one of the significant initiatives, it was excluded from drill down activity because of a parallel PwC review.
Mobile Data Terminal (MDT) Replacement
DCS Replacement of mobile data terminals in Queensland Ambulance Service vehicles in south-east Queensland.
Spring Hill Office Complex Data Centre Relocation All Stages
DTMR Relocate the Spring Hill Office complex (SHOC) data centre to CITEC leased floor space at the Polaris data centre in Springfield Central.
Early Childhood Education and Care (ECEC) Grants Management Solution
DETE Part of overarching information management program driven by Office of Early Childhood Education and Care (OECEC), generic SAP-based solution provided by OSR, some delays associated with national system and broad range of stakeholders.
National Occupational Licensing System (NOLS) including PAMDA split
DJAG COAG agreed to the development of a national trade licensing system in the context of its broader agenda for regulatory reform. The National Occupational Licensing System (NOLS) will be applied to seven occupational areas, including property agents.
Early Childhood Education and Care (ECEC) Reporting Services for Early Childhood Development
DETE Part of overarching information management program driven by OECEC, impacted by National Quality Agenda IT system implementation delays, delivering early outcomes for local stakeholders through incremental IM changes.
DPW IDES Implementation DHPW DHPW indicated that this project will shortly be closed, as they are currently in discussions with CITEC to wind up this project.
Application Migration SSQ Migration of ICT applications from legacy hardware to the ‗new‘ virtualised environment.
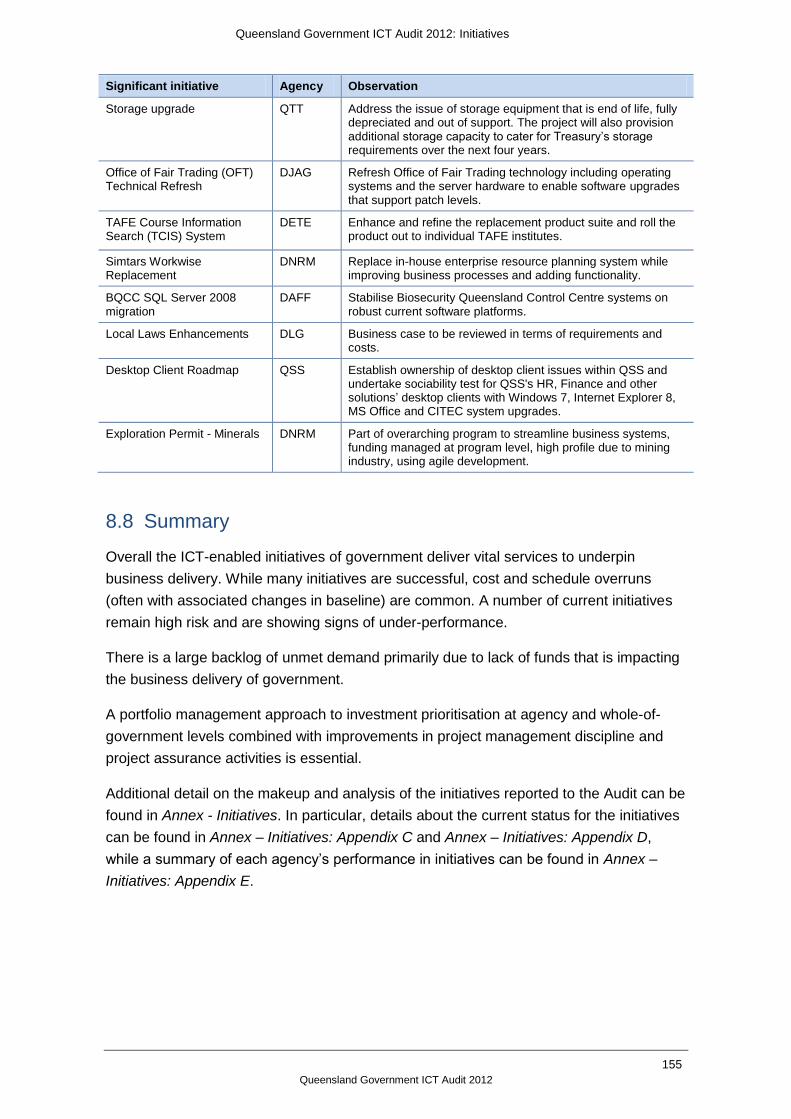
Queensland Government ICT Audit 2012: Initiatives
155
Queensland Government ICT Audit 2012
Significant initiative Agency Observation
Storage upgrade QTT Address the issue of storage equipment that is end of life, fully depreciated and out of support. The project will also provision additional storage capacity to cater for Treasury‘s storage requirements over the next four years.
Office of Fair Trading (OFT) Technical Refresh
DJAG Refresh Office of Fair Trading technology including operating systems and the server hardware to enable software upgrades that support patch levels.
TAFE Course Information Search (TCIS) System
DETE Enhance and refine the replacement product suite and roll the product out to individual TAFE institutes.
Simtars Workwise Replacement
DNRM Replace in-house enterprise resource planning system while improving business processes and adding functionality.
BQCC SQL Server 2008 migration
DAFF Stabilise Biosecurity Queensland Control Centre systems on robust current software platforms.
Local Laws Enhancements DLG Business case to be reviewed in terms of requirements and costs.
Desktop Client Roadmap QSS Establish ownership of desktop client issues within QSS and undertake sociability test for QSS's HR, Finance and other solutions‘ desktop clients with Windows 7, Internet Explorer 8, MS Office and CITEC system upgrades.
Exploration Permit - Minerals DNRM Part of overarching program to streamline business systems, funding managed at program level, high profile due to mining industry, using agile development.
8.8 Summary
Overall the ICT-enabled initiatives of government deliver vital services to underpin
business delivery. While many initiatives are successful, cost and schedule overruns
(often with associated changes in baseline) are common. A number of current initiatives
remain high risk and are showing signs of under-performance.
There is a large backlog of unmet demand primarily due to lack of funds that is impacting
the business delivery of government.
A portfolio management approach to investment prioritisation at agency and whole-of-
government levels combined with improvements in project management discipline and
project assurance activities is essential.
Additional detail on the makeup and analysis of the initiatives reported to the Audit can be
found in Annex - Initiatives. In particular, details about the current status for the initiatives
can be found in Annex – Initiatives: Appendix C and Annex – Initiatives: Appendix D,
while a summary of each agency‘s performance in initiatives can be found in Annex –
Initiatives: Appendix E.

Queensland Government ICT Audit 2012: Initiatives
156
Queensland Government ICT Audit 2012
This page has been intentionally left blank.

Queensland Government ICT Audit 2012: Relationship with industry
157
Queensland Government ICT Audit 2012
Relationship with
industry

Queensland Government ICT Audit 2012: Relationship with industry
158
Queensland Government ICT Audit 2012
9 Relationship with Industry
Findings
Government procurement processes can be too detailed – this approach can restrict
the ability of industry to propose innovative solutions.
Asking industry to provide components rather than overall outcomes limits innovation
and increases the risk of failure.
High level architectural positions (contained in the QGEA) are not used to guide
industry understanding of the government‘s ICT roadmap.
There are no repeatable approaches to enable early engagement with industry. This
limits opportunities for innovative solutions to be presented to government outside
formal procurement processes.
The existing Government Information Technology Conditions (GITC Version 5) are
seen as a significant overhead for industry.
Many industry business models are based on the assumption of year on year revenue
growth. This is no longer sustainable.
Government recognises the need for strategic industry partners.
9.1 Introduction
This section acknowledges the critical importance of the ICT industry to the operations of
almost every system across the Queensland Government.
The ICT industry was not in scope for the Audit, and as such there has been no detailed
research into industry issues. There were, however, several formal meetings between
QGCIO and the industry representatives where a range of ICT challenges facing
government were discussed in an open and collaborative way. These meetings helped
the Audit team better understand the breadth of solution options available to government
and the challenge in the existing working relationships.
The Audit team recognises the time and effort made by a broad cross-section of the ICT
industry to contribute to the audit program in an open, unbiased and independent way.
This section is based on the above industry contribution. It outlines a number of areas
where relationships between government and industry could be improved. It is not meant
to be a critical analysis, as there is already common agreement on most of these areas.

Queensland Government ICT Audit 2012: Relationship with industry
159
Queensland Government ICT Audit 2012
9.2 Why is the ICT industry important
ICT is arguably the central nervous system of government operations. All of the following
activities rely on the provision of ICT services. In fact, none of them could operate
properly in 2012 without ICT support.
A police office using a radio. A health professional reviewing a patient’s test results. A
front counter office receiving payment for a car registration. A person reporting damage
after a storm to emergency services. A child safety officer reviewing a family history. A
treasury official making a key investment decision. This list goes on and on…
Clearly government is heavily reliant on ICT and by definition the ICT industry. A healthy
and innovative ICT industry (one that has a good understanding of government) will allow
government to take advantage of new and innovative ways of doing business. ICT
innovation has resulted in the creation of whole new service areas, as well as efficiency
improvements.
9.3 The requirement for a close working relationship
The ICT industry and government should have a symbiotic relationship. Ideally this would
drive a close working relationship on the ground. A relationship that was constructive
rather than adversarial; one that sought mutual benefit rather than micro level win-lose
negotiations; and one where either party ensured the wellbeing of the other. These
aspirations, while admirable, have not become reality.
There have been several attempts to build better working relationships between the ICT
industry and government (at the vendor and association level) over an extended period of
time. While communications between government and industry could be described as
good, genuine strategic engagement remains at a level where neither side is totally
happy with the outcome. This is a situation that needs to be corrected.
There are a number of areas where the relationship between the ICT industry and
government can be improved. Whilst not exhaustive, these areas are discussed below.
These are key areas that could become the starting point for ongoing incremental
improvement built on dialogue, trust and action.
9.4 Procurement is transactional
9.4.1 Specifications are too detailed
The government has a history of going to the market seeking ICT outcomes with a clear
set of detailed specifications. On the surface this seems a logical approach, however,
whilst it is appropriate for the acquisition of components it is not as useful in outcomes
based procurement.

Queensland Government ICT Audit 2012: Relationship with industry
160
Queensland Government ICT Audit 2012
When looking for a new ICT system a detailed specification may lock out many of the
innovative solutions that industry might be able to offer. Large parts of industry may
simply ‗no-bid‘ the opportunity, on the basis that they will be assessed against
specifications they cannot align to, even though they may have a considerably better
solution.
9.4.2 Without detail it is harder to justify decisions
When multiple innovative (different) solutions are provided, judgement will be required to
pick a winner. Lack of detailed specifications means that a different approach will be
needed to justify balanced decisions. Industry will have a responsibility in these
circumstances to accept the referee‘s decision. Over time, subsequent debate over
judgement calls has the potential to drive agencies back to a detailed specification
approach – something neither government nor industry desire.
9.4.3 Breadth of solution
A key decision in any sourcing strategy is determining the boundary between what will
remain in-house and what will be acquired from industry. Identifying the correct boundary
is critical. Outsourcing strategic direction is clearly inappropriate, and insourcing low level
commodity activities drives up costs. So what guidelines exist in determining the
boundary? What is good practice and what is poor practice?
From an innovation perspective the scope of what industry is asked to do has a major
bearing on the level of innovation industry can bring to the table. A good example is the
government‘s SAP arrangements. SAP are one of the world‘s largest software
companies. The government buys software licences and low level support from SAP and
rarely anything else. The government bought software licences from SAP and then
decided it was best placed to build a payroll system in Queensland Health. The success
of that initiative is well documented. Consider two alternatives for the Health Payroll
initiative.
The government separately buys software licences from one vendor, consultancy
services from another vendor, implementation services from a third vendor, and then
runs the payroll system operations in-house through a shared services provider with
infrastructure acquired from yet another vendor.
The government asks the ICT industry to provide a payroll outcome as a fully
managed service. (This option seeks to procure an outcome rather than components,
and allows industry to bring a level of innovation to the entire problem space).
Queensland Government ICT Audit 2012: Relationship with industry
161
Queensland Government ICT Audit 2012
The Health payroll is a perfect example of outsourcing the spare parts that make up a
complex machine while taking the total responsibility of assembling them and running
them yourself. Not only is this very difficult to do but it also limits innovation as each
provider of the unique components is limited to only being able to innovate within their
own small component of the solution. It makes it very difficult to achieve innovation over
the entire solution.
9.4.4 The lock down
During the procurement process there is an effective lock down which precludes vendors
from communicating with government. However, there are instances where agencies can
tend to avoid communication with vendors (avoid sales calls); even before the formal lock
down period begins.
It is important that agencies design procurement processes that minimise the period
during which the ICT industry and government cannot communicate. It is also important
that agencies do not blame a lock down for an inability to communicate with industry.
9.5 Early engagement
9.5.1 Introduction
There are two key concepts in the ICT discipline used to describe the relationship
between business systems and information technologies. These concepts are alignment
and impact. Alignment refers to how well information technology supports a business
system while impact describes how a business system might be redefined as a result of
opportunities provided by technological breakthroughs.
Most government procurement systems support the concept of alignment by allowing
business areas to specify in detail the level and type of ICT support required. The
concept of impact does not get the same attention. To address the concept of impact
requires knowledge of the technological breakthrough before the business requirements
are developed. The concept of impact really means that until you see what you can have,
you can‘t really say what you want.
For government to successfully address the concept of impact it will need to engage with
industry at a different stage of the product lifecycle. Both industry and government agree
that early engagement is important.
9.5.2 Assessment of promising products
At present the government does not have any mechanism to review promising new
products. Vendors have to approach agencies where opportunities for engagement may
or may not exist. This increases the cost of sales for vendors. This process is not ideal for
vendors nor is it ideal for government.

Queensland Government ICT Audit 2012: Relationship with industry
162
Queensland Government ICT Audit 2012
From a government perspective the above approach results in individual agencies
selecting products in isolation from other agencies and potentially in the absence of a
government-wide direction. New and innovative products are unlikely to have any
directions or guidance set in the Queensland Government Enterprise Architecture
(QGEA). As a result government can end up with multiple solutions to the same problem
with a range of different products compounded with different technology requirements
and different sourcing strategies. This level of unmanaged diversity is bad for government
and for industry.
Clearly the current arrangements are far from ideal. One possible solution might be the
establishment of a lab to review and test drive new products that may be of value to
government. The lab could make a number of recommendations for vendors of new
innovative products, including:
Good idea. The government is not the direct client but we can introduce you to a vendor who might make your product part of their product set.
We are interested in the product but we need to align to a particular sourcing strategy (SaaS for example).
We like the product and we would like you to add / change some features.
Someone else has beaten you to the punch and we are using their product in a number of agencies already.
We don‘t want to solve that problem that way but we can hand you over to someone in our innovation area who can provide assistance in establishing markets somewhere else.
Apart from a lab the government could assist industry by being clear about desired
positions on sourcing, platforms, solution options and strategic direction.
9.5.3 Treatment of intellectual property
A key issue with early engagement, and specifically the Request for Information (RFI)
process, is the vagaries that exist around intellectual property. Processes need to be
established to allow vendors to register Intellectual Property (IP) before engaging in
arrangements such as RFIs. This is complex, as much of the IP involved is too immature
to meet formal patent processes. Government and industry need to resolve how IP can
be confidently provided to government without the concern that it will be misused.
9.6 GITC – A barrier or an enabler
Government Information Technology Conditions (GITC) is a collection of different
frameworks (with the same name and objective) used by every jurisdiction across
Australia to establish a mechanism for government and industry to do business. In
Queensland the GITC Version 5 framework appears on the QGCPO web site. There are
14 Modules in GITC Version 5 along with 22 schedules.

Queensland Government ICT Audit 2012: Relationship with industry
163
Queensland Government ICT Audit 2012
To be eligible to work with the Queensland Government there is a detailed application
process and an annual schedule.
9.6.1 Multiple non-reciprocal GITC arrangements
Jurisdictions have different GITC frameworks, and none of them are reciprocal. This
means that industry has to apply for and maintain up to seven different GITC
accreditations before being eligible to do business with government across Australia. This
is an unnecessary overhead to industry and a limitation to Queensland.
The Queensland Government limits itself to companies that have GITC version 5
accreditation. If a vendor with a unique offering is operating in New South Wales and
Federally (two of the largest ICT markets in the country), they will have little motivation to
undertake the GITC process to become accredited in Queensland where their market will
likely be smaller.
The converse is also true. Queensland firms with GITC accreditation in Queensland
cannot sell anywhere else in Australia until they complete the respective GITC processes
in other states. If you can register a car in Queensland and drive across Australia why
can‘t we do the same with GITC?
9.6.2 Reporting overheads
The reporting overheads for GITC are substantial and the benefits achieved for
government are unclear. It is unlikely there are any benefits for industry. There is an
argument that this area should be a target for red tape reduction.
9.6.3 Duplication of effort
It is common for vendors to be asked to provide information in responses for Request for
Offers – that replicates information previously supplied to the GITC authority. This is a
duplication of effort and should be avoided.
9.7 Responsibilities
9.7.1 Year on year revenue growth cannot be sustained
For decades the ICT industry has operated on the assumption that revenue must grow
year on year. In an environment where the government‘s budget is limited and where
commodity services are expected to fall in price, this assumption is clearly not
sustainable. Put simply, governments will not continue to expend money for new ICT
initiatives or increased charges unless there is a compelling reason.
Competition (especially in commodity areas) will also put pressure on year on year
income growth. The new goals for industry should be sustainability and maintenance of
margins through innovation. Just saying that an organisation wants a long term strategic
partnership with government, while setting ever increasing sales targets, will be seen as
inappropriate behaviour.

Queensland Government ICT Audit 2012: Relationship with industry
164
Queensland Government ICT Audit 2012
Internal industry key performance indicators (KPIs) seeking revenue growth will drive
sales behaviour that is inconsistent with the government‘s strategic intent.
Being a strategic partner means helping government apply limited assets in the best
possible way, not seeking an ever increasing share of these assets.
9.7.2 Cost of diversity
Unnecessary diversity, especially at the commodity layer, adds substantial costs to
government. To manage these costs, government will deliberately limit the number of
vendors in certain technology domains. This is a necessary trade-off between (a) the
ideal outcome for industry which would be to give everyone (especially local
organisations) a slice of the pie, and (b) cost / complexity reduction within government.
The government will make these decisions as openly and transparently as possible,
always seeking the best balance between diversity (and its costs) and good industry
policy. In the current revenue constrained circumstances the balance will necessarily tip
in favour of cost / complexity reduction.
9.7.3 Being a true strategic partner
Government is looking for vendors to be true strategic partners. This type of relationship
has the following characteristics which should be an aspirational target for both industry
and government.
To be a strategic partner, industry should:
ensure the sustainability of the relationship with government through quality products
and/or services - not through vendor lock in mechanisms
create low cost and easy mechanisms to exit products and/or services - that way
government will be more likely to move to them
avoid committed spend or lock in contracts - service quality is the way to keep
government business
not force government into expensive upgrades – instead, look for other ways to keep
products up to date without it costing government time and money
not allow government to pay too much for a service – if there is a lower price
available, notify the government in a timely manner and ensure it is charged at the
lower rate
advise government when it is doing or about to do something sub-optimal - don‘t let
government make bad decisions even if that is good for revenue
work to eliminate complex contractual and billing arrangements.

Queensland Government ICT Audit 2012: Relationship with industry
165
Queensland Government ICT Audit 2012
To be a strategic partner, the government should also:
establish independent governance arrangements that provide a mechanism for ICT
industry representatives to participate in decisions that impact the ICT industry
reduce unnecessary red tape – especially in procurement and contractual
arrangements
engage early with industry - so both parties can identify innovation opportunities.
respect intellectual property concerns
allow sufficient time for tender responses
be transparent about decision making processes.
True strategic partners also have high levels of respect for each other. For example:
Government should not release large tenders just before Christmas expecting them to be
completed by early January. This is disrespectful to industry.
9.8 Accreditation
Ensuring the quality of a professional discipline is a challenge for peak industry bodies.
The ICT industry is one of the few professional industries that has no high level body
monitoring industry practice. This should be addressed urgently and where necessary,
mechanisms should be put in place to sanction organisations that are operating outside
agreed industry codes of practice.
If an appropriate and agreed accreditation program were in place for ICT professionals
(individuals), the government would also consider supporting a program where all internal
ICT professionals were obliged to become accredited.

Queensland Government ICT Audit 2012: Relationship with industry
166
Queensland Government ICT Audit 2012
This page has been intentionally left blank.

Queensland Government ICT Audit 2012: Constraints
167
Queensland Government ICT Audit 2012
Constraints

Queensland Government ICT Audit 2012: Constraints
168
Queensland Government ICT Audit 2012
10 Constraints
Findings
Timely, high quality and fit for purpose agency approval and governance processes
are needed.
Visibility and capability to prioritise the right ICT investments at the right time will
avoid waste through duplication and ineffective resource management.
Implementing too much change quickly will undermine the achievement of successful
outcomes and full benefits realisation.
The capacity of the Government‘s workforce to absorb change will be a key factor in
determining the pace at which government can transition to an ICT services model.
Capability shortages in program and project management will affect government‘s
ability to successfully deliver outcomes and embed transformational change.
Careful sequencing of ICT initiatives and the steps involved in transitioning to an ICT-
as-a-Service model will be required.
Upstream cleansing and streamlining of business processes, policy and legislation
are important parts of creating a sustainable ICT environment for government.
With the transition to an ICT-as-a-Service model, government will need to be
prepared for a degree of industry pressure to maintain the status quo.
To achieve better One Government outcomes, all agencies will need to adhere to the
principle that for the greater benefit of the sector, agencies may not always be able to
pursue individual best-case outcomes.
10.1 Introduction
To actively progress the findings of the Audit, and to affect long term change in the
management of ICT, the Queensland Government will need to be cognisant of, and
willing to address a number of constraints.
10.2 Governance – agency approval processes
The ability to make timely decisions around an agency‘s ICT portfolio is an important
aspect in managing risk and project performance. Some agency approval processes may
take too long, or not be ideal for step change initiatives where a degree of initial piloting
and agile exploration need to be accommodated.
The findings of the Audit showed that whilst most agency ICT governance bodies play a
significant role in investment decision-making, agencies‘ peak governance bodies were a
Queensland Government ICT Audit 2012: Constraints
169
Queensland Government ICT Audit 2012
catch-all for management of a broad range of issues. These issues range from
operational ‗run the business‘ aspects, through to those normally considered by a
program management board. This results in agency decision making being effectively
forced through a funnel. As a result, there is a high probability of delays and a heavy
reliance on each agency‘s peak governance body to prioritise and action outcomes.
Moving forward, government will need to have quick, high quality and fit for purpose
approval processes and governance bodies.
10.3 Flow on impacts of government policy
Current issues around the technical condition, financial condition, complexity and
sustainability of the existing ICT environment, have been directly contributed to, by the
subsequent and cumulative impacts of multiple business process changes, government
policies and legislation.
The Audit makes a number of recommendations around how these impacts can be
minimised going forward through new approaches in how ICT is sourced, organised and
delivered – relying on ICT alone to solve the issue, however, is to ignore a key part of the
problem.
The Audit has found that ICT complexity through over-customisation is a result of poor
business processes and archaic industrial rules or legislation. These non-ICT causes
effectively transfer the problem to the ICT platform, instead of tackling the true problem
itself, through re-engineering / simplifying business rules, applying more standardised
processes and revisiting legislation which have been layered upon layer over the years.
To make real progress in reforming the state of government ICT, government should:
not look to transfer unnecessary business process complexity onto ICT solutions,
without first streamlining and standardising business processes wherever possible
not look to maintain old and out-dated policy and/or legislation that maintains and
transfers unnecessary complexity to ICT systems.
10.4 People - capability and capacity
10.4.1 Change load management
Alongside the need for reform of government ICT, the business of running government
continues unabated. Front line and corporate support staff have a finite capacity to
absorb and implement strategic change within their agencies. The change load on staff
from learning and implementing new processes and systems cannot be underestimated.
People need time to learn about new ways of working – but they will also have their own
jobs to do each day. There is a limit to how much change an organisation can effectively
absorb in a year before productivity and service delivery start to suffer.

Queensland Government ICT Audit 2012: Constraints
170
Queensland Government ICT Audit 2012
Within the Audit, agencies reported that there are 304 active change initiatives under way
across the sector, amounting to over $643 million forecast expenditure – this is the
current reported ICT-enabled business change load.
However, this does not account for unmet demand for change across agencies – with
agencies reporting initiatives worth an additional $215 million in unfunded forecast
expenditure across the sector (plus $1.6 million for QH alone) – this all represents
additional potential change load.
From a program management perspective, too much change will undermine the
achievement of successful projects and full benefits realisation. The change load capacity
of the government‘s workforce will be a critical factor in determining how fast the
government is able to progress the transition of ICT to a services model.
10.4.2 Capacity required to simply run ICT
Notwithstanding the capacity of the government to absorb strategic change, within the
present environment, agency ICT resources are already stretched to capacity. In effect,
the task of just running day-to-day ICT is consuming the bulk of available ICT resources,
particularly given the recent Employment Management Program (EMP).
In addition, the Audit has identified both a range of agency nominated business change
initiatives, and ICT transformation recommendations that will require a substantial ICT
resource commitment to realise outcomes.
The ICT staff required to successfully embed transformational change are usually a
shared resource, where many are also responsible for ‗keeping the lights on‘. This tends
to cause resourcing conflicts which can be complex to overcome.
How government will be able to source sufficient skilled ICT capacity to do more than
simply keep the lights on and maintain the status quo is an issue to be considered and
addressed.
10.4.3 Project and program delivery
Embedding transformational change into the business is the role of program
management, with project delivery being the controlled delivery of program outputs.
An independent assessment of each agency‘s maturity in managing ICT investments and
change initiatives in the disciplines of portfolio, program and project management was
conducted prior to the recent EMP. The assessment determined that, overall, government
has low maturity in program and project management, particularly in the areas of
organisational governance; management control; and benefits, financial, stakeholder, risk
and resource management.
Starting from an already low base, the recent loss of capacity via the EMP has further
diminished government‘s capacity to effectively deliver projects and programs
successfully.

Queensland Government ICT Audit 2012: Constraints
171
Queensland Government ICT Audit 2012
Since June 2012, the total reduction in FTEs in project and program management roles is
down 26 from 361 – leaving 335 FTEs remaining in project manager, program manager
or program director roles. Of particular concern is that the proportion of permanent
program and project managers has reduced by 10% (17 FTEs) since June 2012.
10.4.4 Portfolio management
Government has a lack of capability in portfolio management. The primary role in this
area is to manage risks at the whole-of-portfolio level and prioritise resource allocation
ensuring that agencies are always focussing on doing the right things at the right time
with the right people – thus optimising investment value and business change outcomes.
Portfolio management is a relatively new but important business discipline, with a lot of
organisations around the world in the early stages of maturity. With the current low level
of maturity, government is exposed to the risk of case-by-case decision making – with
rojects and programs approved and undertaken with little or no holistic consideration of
the broader organisational strategic objectives.
In addition, the ability to independently monitor and report on the performance of
significant change initiatives, particularly the delivery of outcomes and benefits is
diminished.
10.4.5 Other strategic areas for retaining ICT expertise
In a similar vein to portfolio management, staff reductions in the strategic disciplines of
business analysis and enterprise architecture have diluted the sector‘s ability to plan for
and to help business implement the substantial change agenda needed to transition the
government to new business models.
10.4.6 Strategies for overcoming capability shortages
Two strategies can be implemented to maximise government‘s initiative delivery capacity
moving forward.
Improve the visibility, pooling and prioritised allocation of specialist staff across
agencies. Target roles include portfolio management, program and project
management, enterprise architecture and business analysis.
Improve the allocation of responsible and accountable senior business executives as
key champions of business change initiatives. Without active senior sponsorship in
agencies, most initiatives will find it difficult to deliver agreed outcomes in an
environment of limited funds and competing business priorities.

Queensland Government ICT Audit 2012: Constraints
172
Queensland Government ICT Audit 2012
10.5 Dependency management of initiatives
Portfolio management capability is essential to ensure the government‘s mix of ICT
investments (i.e. ICT-enabled change initiatives) are regularly reviewed and assessed for
delivery performance and risk profile. This review enables initiatives to be adjusted and
(re)prioritised to maintain the optimum initiative portfolio for the sector, hence ensuring
the government is doing the right things at the right time to achieve its strategic
outcomes.
However, not all initiatives are strictly stand-alone without any reliance or dependency on
certain underlying infrastructure components. This will be especially true as government
transitions to an ICT as-a-service approach.
For example, to support the broader take-up of cloud based infrastructure, platform or
software services, the Queensland Government will be required to establish foundational
elements including:
a government Applications Store (i.e. marketplace) to provide agencies with a
catalogue of accredited cloud services
an identity management capability to provide secure access to cloud services.
Dependency management is a significant issue and will be a limiting constraint on the
portfolio mix of initiatives.
10.6 Other jurisdictions
10.6.1 Common pressures
It is not unrealistic to expect that other state jurisdictions have similar issues to
Queensland in relation to how to manage ICT going forward in a manner that is both
economically sustainable, and focussed on enabling the responsive and agile delivery of
government services.
Some jurisdictions, like Queensland, may have already recognised the depth and severity
of the issues. Other jurisdictions may be alerted through Queensland‘s experience, to the
need to address underlying issues in the near future.
10.6.2 The need for a coordinated response
There needs to be a coordinated effort across jurisdictions to achieve economies of scale
in the response to these common pressures. A coordinated approach by the states will
also increase the intensity of the signals to industry, help create an appropriate market
opportunity against which the ICT industry can respond, and provide the ability to
maximise the effective use of finite industry-based commodity ICT service resources.

Queensland Government ICT Audit 2012: Constraints
173
Queensland Government ICT Audit 2012
10.7 Industry capability
10.7.1 Introduction
To be successful in repositioning government ICT so that it is best able to address and
deliver against the challenges over the next two decades and beyond, the Queensland
Government needs to work closely with industry.
It has always been the case that government outcomes, enabled by ICT, are at their best
and most productive when industry and government are able to leverage a trusted
relationship with common goals that are clearly focused on solving defined problems.
However, as has been discussed, existing models of engagement and service delivery
need to change if the relationship is to remain relevant for all parties in the decades
ahead.
What is needed is a paradigm shift, and all parties must be able to deliver based on new
business models, not yesterday‘s.
10.7.2 Ownership versus service models
The Audit has identified strengths and weaknesses in the provision of ICT across the
Queensland Government. A key weakness discussed is the current commitment to
ageing business models for the delivery of infrastructure and systems, highlighting that a
shift from models based on asset ownership to business models based on ‗ICT-as-a-
Service‘ will be fundamental for future ICT provision.
The Queensland Government should:
not look to build applications or buy software licences – with a strong preference to
procure systems through a Software-as-a-Service (SaaS) approach
not look to rent or buy space in data centres – with a strong preference to use SaaS
or Infrastructure-as-a-Service (IaaS) approaches
seek new arrangements for the provision of telecommunications that eliminate the
need for government to own and manage telecommunications assets.
10.7.3 Impact on sales process - supply chains
A shift in government‘s business models for delivery of ICT may challenge some vendors
who are unable to transition their sales processes to a new model. Key to this transition is
the establishment of new supply chains for ICT products and services. The relationship
between government and data centre providers illustrates this change.
Under both SaaS and IaaS approaches, government would no longer seek to rent data
centre space. Renting data centre space assumes government owns applications or has
data to store for later use.

Queensland Government ICT Audit 2012: Constraints
174
Queensland Government ICT Audit 2012
Over time this will no longer be necessary because:
government will look to acquire applications under a SaaS model where the SaaS
vendor has the responsibility of meeting the performance and storage needs of the
application
if there is a data storage requirement separate to a specific application then
government will look to acquire an IaaS from a vendor who may or may not be a data
centre vendor.
Under the above examples, data centre vendors will need to review the supply chain for
ICT storage and cycles, and target the appropriate customer base. In a cloud-based
world this will be the provider of the SaaS to government or an organisation seeking IaaS.
There will still be a need for data centre services, however, under the new model the
Queensland Government may not be the direct customer of the data centre vendor.
10.7.4 Impact on sales process – products and services
Governments around Australia have traditionally been large consumers of ICT products
and services. Over time, industry has tailored many of its products and services to meet
the needs of government. This has been reinforced through government procurement
processes.
It could be argued that this symbiotic relationship between industry and government has,
to some extent, had an impact on the product offerings and underlying capability of the
ICT industry. For example, under the existing model, government has required support for
the in-house delivery of ICT. Industry has responded with businesses that provide a
contract programming industry, a range of ICT specialist contractors and software
development tools.
Government has also demanded better ways to manage operations. Industry has
responded with businesses that provide operations support contractors, service
management and operations management tools.
Looking across the existing government landscape, the current relationship has resulted
in a number of key recurring themes: internally owned and operated infrastructure; large
and complex software deployments with per user licence models; and government
responsibility for software and infrastructure upgrades.
10.7.5 Transitioning to a new model – industry impediments
By its nature, the existing model has sought to address a number of issues and industry
has, in turn, configured itself to help government resolve these issues. The only problem
is that in doing so, the current model has actually generated a longer term set of
consequences which are now unable to be resolved without altering the business model.
It is unclear if industry has the incentive or capacity to adjust if a new model were to take
these challenges away.

Queensland Government ICT Audit 2012: Constraints
175
Queensland Government ICT Audit 2012
Multi-national corporations
Multi-national corporations typically have ‗one size fits all‘ models to delivering their
offerings. Customisation is allowed, even encouraged at the product level, but not at the
contract level. The way in which these firms bundle and license their products and
services is usually strictly limited.
In a similar vein, local branches of multi-national corporations tend to be unable to
significantly refine and create a unique business model for their respective clients,
including the Queensland Government.
Vendor lock-in
One example of the need for a new business model relates to the current situation where
agencies have progressively become deeply entwined with specific vendor products. This
vendor ‗lock-in‘ occurs through two primary mechanisms:
The complexity and interconnectedness of vendor product suites can make it difficult
to unwind a vendor‘s products from government‘s operations.
Vendor licensing models tend to be constructed in a manner which promotes large
scale procurement of a vendor‘s product‘s, with limited economic flexibility in how
customers can mix and match multiple vendor products to best suit their needs.
Whilst this type of commercial approach helps a vendor to optimise licensing revenue,
it invariably locks the customer in to a defined vendor strategy.
When applied over a protracted time period, these mechanisms result in products being
interwoven in such a way that makes it hard for agencies to extract themselves from. This
does not mean that a vendor‘s product suite does not add value of and in itself. It does
mean, however, that in a competitive and open environment, government is effectively
not able to capitalise on other options that may be available.
The Queensland Government needs to be agile and the ability to remove dependencies
that overly restrict its flexibility is critical. This is particularly relevant now, when it needs
to be able to move beyond the current ownership model to a services-based model,
where ‗how a service is delivered and the underlying infrastructure components‘ is distinct
and separate from the actual business functionality required.
Local ICT industry
The local ICT industry plays an important part in underpinning a vibrant Queensland
economy. One means of doing this is by competing for business locally within
Queensland. However this presents a limited market.
In order to grow, local companies are increasingly leveraging the digital economy to
extend their market reach and customer base beyond the state and national boundaries.
This evolution of their business model enables a wider and more stable revenue base
than would normally be achievable within the relatively smaller confines of the
Queensland economy.

Queensland Government ICT Audit 2012: Constraints
176
Queensland Government ICT Audit 2012
It also promotes the establishment of strategic partnerships with other vendors – where
the local firms may do ‗on the ground‘ service delivery, or provide specialist sub-
contracting input.
However, despite the requirement to evolve their business models, service offerings and
market strategies, current practice is indicating that local vendors will still naturally seek to
play to their existing revenue bases and perceived strengths, including to their current
product and service lines. The challenge for these vendors will arise when they seek an
opportunity to sell their current capabilities where they are no longer appropriate to the
sourcing models and new environment the Queensland Government is looking to move
to.
What this all means
The move by the Queensland Government and the broader ICT ecosystem to transition
to an ICT-as-a-Service environment will drive a level of lobbying against the proposed
new models if industry players believe they are excluded from new work.
As the Queensland Government and industry transition over time to a service-based
model, those vendors that have the foresight to position themselves to help enable this
change will benefit. However, government will need to be prepared for a degree of
industry pressure to maintain the status quo – this is only to be expected given some
firms‘ commercial interests.
Ultimately, the transition to a service-based model will help develop a more mature,
competitive and relevant Queensland ICT industry, able to compete in the global
economy. This is good news for the state.
10.8 Agency support for a One Government agenda
If a one-government approach is to be most effective in delivering better outcomes for
Queensland, the sector needs to agree and commit to the principle that the whole is
greater than the sum of its parts. Agencies and executive government need to
acknowledge that to achieve substantial one-government outcomes and efficiencies for
the greater sector, some agencies may not always be able to achieve individual best-
case outcomes.
Over time, this principle will likely have implications for all agencies, including:
the need to minimise diversity in commodity infrastructure and services
adjusting initiative timelines to ensure agency and sector change load and capacity
limits are not exceeded. For this to happen, better visibility and input to prioritisation
may be required.
the need for ongoing and better visibility of agency ICT investments and information
sharing

Queensland Government ICT Audit 2012: Constraints
177
Queensland Government ICT Audit 2012
strategic alignment of shared service providers to deliver in line with agencies‘ needs
as opposed to provider nuances
flexible and shared resourcing for specialist and/or high demand roles, with the ability
to be (re)deployed to the areas of highest priority for government.

Queensland Government ICT Audit 2012: Constraints
178
Queensland Government ICT Audit 2012
This page has been intentionally left blank.

Queensland Government ICT Audit 2012: Appendices
179
Queensland Government ICT Audit 2012
Appendices

Queensland Government ICT Audit 2012: Appendices
180
Queensland Government ICT Audit 2012
This page has been intentionally left blank.

Queensland Government ICT Audit 2012: Appendices
181
Queensland Government ICT Audit 2012
Appendix A – Definitions and acronyms
The following terms have been used throughout the content of this document.
Term Definition
Annual estimated total cost of operation (AETCO)
Includes annual internal, external, depreciation, licensing and other costs.
Application domain The categories used as part of the application layer of the Queensland Government Enterprise Architecture (QGEA), to provide a consistent and convenient method of logically grouping applications into meaningful and manageable areas for analysis. (refer also to ‗Domain‘)
Applications support Includes the support of application management, application development and application base product software.
Aurion A payroll and human resource information system used widely in the Queensland Government to pay employees and manage human resources information and entitlements.
Business As Usual (BAU) ICT expenditure relating to ongoing activities to operate and maintain the current ICT capability, including:
monitoring, managing and operating the current ICT
environment
maintaining, applying patches, installing service packs,
providing break-fixes, minor enhancements and upgrades
replacing existing capability (e.g. desktop refresh) and
provisioning redundancy (e.g. backup telecom line) that does
not significantly enhance the current ICT or business
capability
refreshing content on an intranet or internet web site
changes to resourcing model to fulfil BAU activities
procuring additional technologies to meet business demand
(e.g. increasing storage capacity).
Benefits analyst The benefits analyst is responsible for assisting the business to maximise the improvements that will be delivered from an Information, Communications and Technology (ICT) project. The benefits analyst will assist business change managers with defining, agreeing, monitoring, tracking and reporting the benefits with the business.
Benefits Management The identification of potential benefits, their planning, monitoring and tracking, the assignment of responsibilities and authorities and their actual realisation as a result of investing in business change. It is usually carried out as a key part of program management or project management.
Business Process as a Service (BPaaS)
Business processes that are delivered based on the cloud services model.
Business analyst The role responsible for reviewing and analysing an organisation‘s business, including its business intentions, business services, business processes and information needs. A business analyst is regarded as a conduit between the business units, organisational stakeholders and solutions delivery teams. A business analyst will liaise with key stakeholders in an organisation to develop a solid understanding of how the business is currently operating and the future goals of the business.
Business architect Part of the enterprise architecture discipline that specialises in the business strategy, services and processes.

Queensland Government ICT Audit 2012: Appendices
182
Queensland Government ICT Audit 2012
Term Definition
Business continuity planner The business continuity planner is responsible for ensuring that there are plans in place for an organisation to continue to function in the event of a disaster or catastrophic event.
Business critical system Any system that provides vital services to the public or government in a disaster event and must be maintained irrespective of a loss of its supporting computing capability.
Business impact A measure of the significance of a system or technology to the business in terms of its coverage and support for existing business outcomes in meeting the operational and service delivery requirements. The evaluation criteria include:
the operational/political/legislative impact of unexpected
outage or failure
fitness for current purpose
scope of use
frequency of use.
Business process modeller A business process modeller is responsible for graphically representing how business is done (as-is) or how business is to be done (to-be) across a business unit, organisation or between organisations.
Bring your own device (BYOD)
Bring your own device, a term referring allowing employees bring their own devices to access corporate systems and resources.
Capability manager The capability manager is responsible for meeting current operational requirements, with the sustainable use of current capabilities, and the development of future capabilities, to meet the sometimes competing strategic and current operational objectives of an enterprise. The capability manager is responsible for assisting the organisation in better understanding, and effectively integrating, re-aligning and applying the total enterprise ability or capacity to achieve strategic and current operational objectives. The capability manager is also responsible for developing and providing innovative solutions that focus on the holistic management of the defined array of interlinking functions and activities in the enterprise's strategic and current operational contexts.
Capacity planner/analyst A capacity planner is responsible for ensuring that an organisation's ICT resources, that is, hardware, software and infrastructure resources will be able to cope with future demands. A capacity planner is required to identify the resources that are currently being used, then consider the growth in demand for those resources and then use that information to make decisions about what may be needed in the future.
Capex – Capital expenditure Funds used by an organisation to acquire or upgrade physical assets such as property, industrial buildings or equipment. This expenditure is depreciated over the life of the asset. Within the context of ICT spend, this could relate to major plant and equipment (including ICT systems and technologies) greater than $5,000 (servers, storage, and networking) and software purchased or internally generated that amount to greater than $100,000.
Case Management Covers systems supporting a prolonged series of interactions with a client, or an organisation on an issue or set of issues.
Change Advisory Board A group responsible for overseeing the process of controlling and approving changes to the infrastructure or any aspect of services, in a controlled manner.

Queensland Government ICT Audit 2012: Appendices
183
Queensland Government ICT Audit 2012
Term Definition
Change initiative A series of actions taken to implement a transformation process which should properly begin with planning, then proceeding with communicating as operational implementation, solving problems, evaluating situations and making decisions.
Change management Process of controlling changes to the infrastructure or any aspect of services, in a controlled manner, enabling approved changes with minimum disruption.
Change portfolio The amalgamation of all changes being made to a business‘s portfolio.
Chief Information Officer (CIO)
The role within an agency, department or other business group, with responsibility for the information technology and computer systems that support the enterprise‘s goals. The CIO role is generally responsible for processes and practices supporting the flow of information (information and business layers of the enterprise architecture), whereas the CTO (Chief Technology Officer) is generally responsible for technology infrastructure.
Cloud
The delivery of system hosted services over the Internet. The service is sold on demand, such as by the minute or the hour. A user can have as much or as little of a service as they want at any given time and the service is fully managed by the provider.
Commercial Business Unit (CBU)
An agency business undertaking which operates, as far as practicable, on a commercial basis.
The Control Objectives for Information and related Technology (COBIT)
COBIT is a set of best practices (framework) for information technology management. The framework supports governance of IT by defining and aligning business goals with IT goals and IT processes.
Commodity
ICT services and products that are common to most if not all agencies. Examples: desktop, networks, data centres, commercial off-the-shelf business software and business systems that support common business functions across government. These commodities can be procured directly or as services through software-as-a-service, hardware as a service or infrastructure-as-a-service arrangements.
Common use supply arrangements
Arrangements established for whole-of-government and mandated by the State Procurement Policy for all budget-sector agencies. They are managed by the Queensland Government Chief Procurement Office (QGCPO) or a lead agency approved by the QGCPO. These arrangements may also be used by other Queensland Government bodies, approved non-government organisations, or the Commonwealth, territory and other state governments.
Configuration management Configuration management is focussed on controlling the products being delivered by a project, knowing where they are at any point in time, what their status is, who is working on them and which is the latest version. Normally supported by software tools, it gives management precise control over the project assets (e.g. the products of a project), covering identification, control, status accounting and verification of the products. Maintains integrity and security over accepted products.
Consumerisation The growing trend for information technology to emerge first in the consumer market and then spread into business and government organisations as opposed to the earlier prevalence of business and government being the primary driver of information technology innovation.
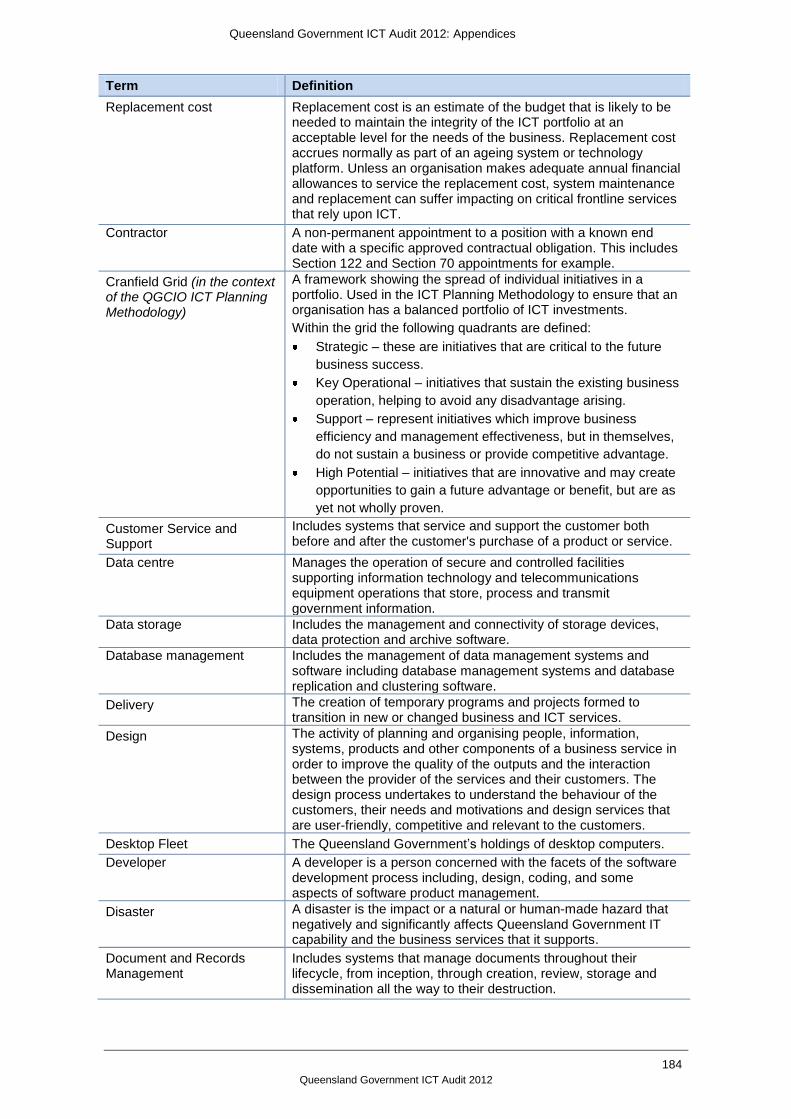
Queensland Government ICT Audit 2012: Appendices
184
Queensland Government ICT Audit 2012
Term Definition
Replacement cost Replacement cost is an estimate of the budget that is likely to be needed to maintain the integrity of the ICT portfolio at an acceptable level for the needs of the business. Replacement cost accrues normally as part of an ageing system or technology platform. Unless an organisation makes adequate annual financial allowances to service the replacement cost, system maintenance and replacement can suffer impacting on critical frontline services that rely upon ICT.
Contractor A non-permanent appointment to a position with a known end date with a specific approved contractual obligation. This includes Section 122 and Section 70 appointments for example.
Cranfield Grid (in the context of the QGCIO ICT Planning Methodology)
A framework showing the spread of individual initiatives in a portfolio. Used in the ICT Planning Methodology to ensure that an organisation has a balanced portfolio of ICT investments.
Within the grid the following quadrants are defined:
Strategic – these are initiatives that are critical to the future
business success.
Key Operational – initiatives that sustain the existing business
operation, helping to avoid any disadvantage arising.
Support – represent initiatives which improve business
efficiency and management effectiveness, but in themselves,
do not sustain a business or provide competitive advantage.
High Potential – initiatives that are innovative and may create
opportunities to gain a future advantage or benefit, but are as
yet not wholly proven.
Customer Service and Support
Includes systems that service and support the customer both before and after the customer's purchase of a product or service.
Data centre Manages the operation of secure and controlled facilities supporting information technology and telecommunications equipment operations that store, process and transmit government information.
Data storage Includes the management and connectivity of storage devices, data protection and archive software.
Database management Includes the management of data management systems and software including database management systems and database replication and clustering software.
Delivery The creation of temporary programs and projects formed to transition in new or changed business and ICT services.
Design The activity of planning and organising people, information, systems, products and other components of a business service in order to improve the quality of the outputs and the interaction between the provider of the services and their customers. The design process undertakes to understand the behaviour of the customers, their needs and motivations and design services that are user-friendly, competitive and relevant to the customers.
Desktop Fleet The Queensland Government‘s holdings of desktop computers.
Developer A developer is a person concerned with the facets of the software development process including, design, coding, and some aspects of software product management.
Disaster A disaster is the impact or a natural or human-made hazard that negatively and significantly affects Queensland Government IT capability and the business services that it supports.
Document and Records Management
Includes systems that manage documents throughout their lifecycle, from inception, through creation, review, storage and dissemination all the way to their destruction.

Queensland Government ICT Audit 2012: Appendices
185
Queensland Government ICT Audit 2012
Term Definition
Domain The categories used as part of the Queensland Government Enterprise Architecture (QGEA) to provide a consistent and convenient method of logically grouping business processes, information assets, applications and technologies and ICT initiatives into meaningful and manageable areas for analysis.
Dust gatherers Legacy applications which can be decommissioned. Some may first need an effective archive or replacement strategy.
ECC – SAP ERP Core Component
The core of SAP ERP system subsequent to SAP R/3.
Enterprise License Agreement (ELA)
A licensing agreement for large organisations that helps to standardise the ICT assets, achieve volume discounts and simplify licence management
Enterprise architect An enterprise architect works to build a holistic view of an organisation. This includes areas such as business processes, information gathered, technology used and strategy. The enterprise architect then uses this extensive knowledge of the organisation to help ensure that the business and IT are aligned in respect to the future direction to be taken.
Enterprise architecture The discipline of translating the enterprise‘s vision and strategy into a future state expressed in terms of services, business process, information, applications and technologies.
Enterprise Mobile Broadband
A Telstra mobile data plan which allow an agency to access their private data network via Telstra‘s Internet Protocol Wide Area Network service using a device such as a data card or wireless router (supersedes Mobile IPWAN).
Enterprise Resource Planning (ERP)
The class of enterprise applications with broad functionality typically spanning finance, human resources, manufacturing, supply chain management and customer relationship management.
Establishment Management Program
The program within the Queensland Government designed to ensure recruitment decisions regarding non-frontline vacancies are aligned with Government priorities.
Estimated Replacement Cost (ERC)
Estimated Replacement Cost (for purchasing and/or building the system or technology) if the system were to be replaced.
Financial Management Includes those systems that can support the financial processes of an organisation including general ledger, budgeting, costing, receipting and payments
Forester Forester is a global research and advisory firm providing proprietary research, consumer and business data, custom consulting, events and online communities, and peer-to-peer executive programs. They guide leaders in IT, marketing and strategy, and the technology industry through independent fact-based insight.
Full Time Equivalent (FTE) A unit that indicates the workload of an employee in a way that makes workloads comparable across various contexts. As an example, an FTE of 1.0 means that the person is equivalent to a full-time worker, while an FTE of 0.5 signals that the worker is only half-time.
Full Time Equivalent (FTE) licensing model
An FTE licencing model uses FTEs as a simplified licence metric that provides a right to use software regardless of the number of computer devices or users by charging a fee for an agreed number of Full Time Equivalents (FTE) in an organisation. This is in contrast to standard licence metrics that usually charge a licence fee per user or per device. FTE licence metrics offer the advantages of reducing the risk of software licence audits and simplifying software licence administration as the organisation is fully licenced as long as they have paid the agreed fee per FTE.

Queensland Government ICT Audit 2012: Appendices
186
Queensland Government ICT Audit 2012
Term Definition
Gartner Gartner, Inc. is a leading information technology research and advisory company that delivers the technology-related insight necessary to making the decisions.
Government Wireless Network (GWN)
This program is about sourcing a current technology ‗digital‘ network which can support current and future communication needs, and preferably facilitate closer cooperation with other jurisdictions.
GovNet A portal to information from various sources, including Queensland Government web sites, Commonwealth Government web sites and external service providers. It also provides basic interconnectivity between Agencies and to resources in the 317 Edward Street data centre.
Hardware as a service A procurement process where a managed service provider (MSP) remotely monitors and administers hardware on a client's site on a subscription basis.
Hosting Includes the management and operation of servers, server operating systems, server support utilities, clustering and virtualisation.
Human Capital Management Systems designed to meet the HR function of an enterprise. HR systems store employee information, automates business processes and generates reports for management.
ICT Expenditure ICT expenditure represents an organisation's costs to provide business-enabling ICT services. ICT services encompass the design, development, implementation, maintenance, support, operation and management of technologies to manipulate and communicate business information. These services include software, hardware and support services to convert, store, protect, process, and transmit data, information and voice.
ICT Operations The superset of all processes and services that are both provisioned by IT staff to their internal or external clients and used by themselves, to run themselves as a business.
ICT policy officer An ICT policy officer works to assist the organisation to meet best practice standards in the development, use and maintenance of ICT systems, information and related assets. An ICT policy officer will research, analyse, interpret and provide feedback on standards and directions. The ICT policy officer will then consult with relevant staff across the organisation, usually senior management, and staff from human resources, finance areas and legal departments to discuss the implications of any new policy direction that needs to be taken.
ICT strategist An ICT strategist works with key stakeholders in the organisation to determine how ICT can be utilised in the most efficient and economic manner. The ICT strategist will look at the way that ICT is used across the whole of the organisation and will make recommendations on how the organisation can improve the use of ICT and improve the way business is conducted.
ICT workforce Refers to any employee that fulfils a role defined by the Queensland Government ICT career streams including roles that administer and support the ICT governance, strategy, policy, applications and technologies of the organisation. ICT workforce also include any corporate services staff such as finance, human resources marketing and communication staff who may directly support the central ICT organisation and form part of its organisational structure. The ICT workforce may be part of the central ICT organisation or be deployed to business units or regional areas and offices that do not form part of the central ICT functions within the agency.

Queensland Government ICT Audit 2012: Appendices
187
Queensland Government ICT Audit 2012
Term Definition
Information Information is any collection of data that is processed, analysed, interpreted, classified or communicated in order to serve a useful purpose, present fact or represent knowledge in any medium or form. This includes the presentation in electronic (digital), print, audio, video, image, graphical, cartographic, physical sample, textual or numerical form.
Information and Communications Technology (ICT)
Concerned with the development, management, and use of computer-based information systems and telecommunications.
Information architect Part of the enterprise architecture discipline that specialises in information and data.
Information management Information management is the identification, classification and analysis of information as an organisational asset. It evaluates the data and information an organisation has and requires in order to function and meet current and future requirements. Information management practitioners are typically responsible for:
identification of information assets and their sources as well
as managing the information assets register
classification of information to one or more classification
frameworks
indexing and cataloging of information to assist with the
retrieval and retention of information
promoting information custodianship
database design and data structure for electronically stored
information
conduct of information audits to understand the information
holdings, the value of this information, the integrity of the
information, the extent and ability to share information across
business units and organisations and the ability to integrate
information across business systems.
preparation and implementation of asset management plans
and strategies.
Information security specialist
The role responsible for information confidentiality, integrity and availability. They facilitate the security classification of information assets as well as understanding and maintaining the risk profile of the organisations information assets, identifying appropriate protection and risk mitigation strategies relevant to the risk profile of information assets.
Information Steering Committee (ISC)
An advisory committee usually made up of high level stakeholders and/or experts who provide guidance on key issues regarding information and communication technology.
Information Technology Infrastructure Library (ITIL)
ITIL® (the IT Infrastructure Library ®) is the most widely accepted approach to IT service management in the world. ITIL provides a cohesive set of best practice, drawn from the public and private sectors internationally.
Information Technology Partners (ITP)
A leading provider of innovative information technology design and support services for the distributed processing marketplace.
Infrastructure-as-a-service (IaaS)
A cloud service model that provides computers as physical or more often as virtual machines, and other resources.
Infrastructure management The management of essential ICT operational components, such as policies, processes, equipment, data, human resources, and external contacts to ensure effective operations and performance. Equipment includes server hardware, virtualisation, operating systems, storage, data protection, ICT Systems management, database software.

Queensland Government ICT Audit 2012: Appendices
188
Queensland Government ICT Audit 2012
Term Definition
Initiative Projects, programs or a recommended course of action collated for analysis and possible incorporation into a forward work plan or portfolio for the organisation.
Innovation The successful application of new ideas to bring about change and continuously reinvent products, services, ways of doing business and the nature of the business itself. Innovation is an important contributor to increased productivity and performance.
Intranet / Websites Includes the management and support of technologies that allow the creation and mark up documents to be presented in a format suitable for the Internet. This includes the support of authoring suites integrated into content management systems, HTML as well as software programs used to locate and display information on the internet or on an intranet. This also includes the support of products and activities that enable users to produce and edit content in a variety of presentation formats including sound, still images, video images and, animations.
ISO 27001 Part of the growing ISO/IEC 27000 family of standards, ISO 27001 is an information security management system standard published in October 2005 by the International Organization for Standardization (ISO) and the International Electrotechnical Commission (IEC).
IT Service Management (ITSM)
ITSM refers to the implementation and management of quality IT services that meet the needs of the business.
Legacy A legacy system or technology is classified as having one of the following attributes: 1) an age greater than the average age of all government systems; 2) past its end-date of use; or 3) is classified as 'retire' or 'streamline' as part of the ICT Planning
Methodology.
‗Lights On‘ A descriptor used for expenditures and activities that are absolutely necessary for maintaining a company‘s critical business operations.
Light technology ICT solutions that provide business capability without a high level of customisation and business complexity.
Likert scale A scale commonly involved in research that employs questionnaires. The range captures the intensity of feeling for a given item.
Machinery of Government (MoG)
Machinery of Government - the interconnected structures and processes of government, such as the functions and accountability of departments in the executive branch of government. The term is used particularly in the context of changes to established systems of public administration where different elements of machinery are created.
Maintenance Management Systems that support functionality for work and materials management for fault, repair, preventative maintenance and service activities.
Managed desktops (desktop, laptops, tablets)
Includes the support of personal computing devices and operating environments for desktop PCs, laptops and tablet computers. This also includes the support of personal productivity software and standard office suite software deployed to these computing devices.
Managed Systems All systems reported to the ICT Baseline that are not classified as ‗significant‘. There were 1282 which were reported to the ICT Audit.

Queensland Government ICT Audit 2012: Appendices
189
Queensland Government ICT Audit 2012
Term Definition
Maximum Acceptable Outage (MAO)
The maximum amount of time a system can be unavailable before its loss will compromise the organisation's objectives and services.
MBRS Suite The Telstra MBRS Suite is an online billing solution consisting of the Online Information Management System (OIMS), Services Inventory Management System (SIM) and Bill Reporting System (BRS)
Mobile Internet Protocol Wide Area Network (IPWAN)
Mobile IPWAN is a Telstra mobile data plan which allows an agency to access their private data network via Telstra‘s Internet Protocol Wide Area Network service using a device such as a data card or wireless router (now superseded by Enterprise Mobile Broadband).
Natural Systems ICT solutions that negate the need for an organisation to source their own unique service, whether through buy and run, build and run, or even outsourced fee for service.
Networks Includes the management and operation of devices that provide network connectivity between IT devices. This includes fixed and wireless networking via LAN, MAN and WAN as well as network performance monitoring
NICTA Australia's Information and Communications Technology (ICT) Research Centre of Excellence, funded by the Australian Government and members, with strong ties to academic bodies.
Operating Systems and Utilities
The master set of software that controls the overall operation of the computer and facilitates the running of system software.
Operations and management
Activities required to maintain the ICT organisation as well as provide and support the ICT services offered by the ICT organisation. This includes the formulation of ICT strategy and policy, management of ICT assets through the asset lifecycle and the monitoring and measurement of the ICT organisation‘s performance.
Opex – Operational expenditure
An ongoing cost for maintaining or running a business. This could represent a fixed duration of on-going costs for initiatives or for maintaining currently owned ICT assets.
Organisational change management
Activities required to manage the effects of new business processes, changes in organisational structure or cultural changes within an enterprise.
Platform as a Service (PaaS) A category of cloud computing services that provide a computing platform (includes a hardware architecture and software and application frameworks) and a solution stack as a service
Performance Indicator A type of performance measurement commonly used by an organisation to evaluate its success or the success of a particular activity in which it is engaged.
Permanent A full time or part time position created as part of the budgeted resource establishment for the organisation.
Planning and Governance Systems that support the management of planning processes as well as functions that are essential to good governance.
Portability How readily an information, application or technology asset can be used in a different technology environment other than the one in which it was created without requiring major rework.
Portfolio A grouping of programs, projects, activities, investments or assets selected, managed and monitored to optimise business return and strategic alignment.
Print services (print, imaging, fax)
Includes the support of print and imaging services including printer devices, multifunction devices, imaging and fax hardware and software.

Queensland Government ICT Audit 2012: Appendices
190
Queensland Government ICT Audit 2012
Term Definition
Problem Management Aims to resolve the root causes of incidents and thus to minimise the adverse impact of incidents and problems on business that are caused by errors within the IT infrastructure and to prevent recurrence of incidents related to these errors.
Program A temporary structure created to coordinate, direct and oversee the implementation of a set of related projects and activities in order to deliver outcomes and benefits related to an organisation's strategic objectives. A program produces an end-state and is finite (albeit often years in duration).
Program manager A program manager is responsible for leading and managing the setting up of the program through to the delivery of the new capabilities.
Program Office The function providing the information hub to the program and its delivery objectives. Provides assistance to program role holders. Often project support is contained within the Program Office
Program office manager A program office manager is the lead role in the program office. The program office may be dedicated to supporting a single program, or it may support a number of programs.
Project A temporary process or endeavour, which has a clearly defined start and end time, a structured set of activities and tasks, a budget and a specified business case. It is developed to achieve a unique and well-defined product, service, goal or objective or deliver well defined benefits.
Project manager A project manager is responsible for ensuring the project is completed on time, on budget, within scope, to the business requirements and meeting quality standards. The project manager is responsible for the creation of project documents and reports that are used to determine the progress and success of the project.
Project, Program and Portfolio Management (P3M3)
A coordinated set of methodologies to address these strongly related management activities.
QP707 Arrangement A standing offer arrangement for the provision of desktop, laptop and server computers with related ICT services.
Queensland Government Enterprise Architecture (QGEA)
The collection of ICT policies and associated documents that guides agency ICT initiatives and investments to improve the compatibility and cost-effectiveness of ICT across the government.
Relationship management The management of the business relationship between the ICT organisation and its targeted clients and suppliers.
Release Management Includes processes to manage the smooth and timely deployment of software products or updates including the transition of system and technology changes through development, test and eventual deployment into a production environment.
Risk Management The identification, selection and adoption of countermeasures justified by the identified risks to assets in terms of their potential impact upon services if failure occurs, and the reduction of those risks to an acceptable level.
SAP
An enterprise resource planning system implemented to support common business functions such as financial management and human resource management and payroll. Produced by SAP AG, a German multinational corporation.
Software-as-a-Service (SaaS)
A different model of purchasing software where you pay a fee for your access to a software product rather than pay for a licence. This is usually done in an online environment.

Queensland Government ICT Audit 2012: Appendices
191
Queensland Government ICT Audit 2012
Term Definition
Scheduling and Bookings Systems that provide scheduling and timetabling services to customers as well as taking bookings for services or other resources.
Secure Sockets Layer (SSL) A technical acronym ‗Secure Sockets Layer‘ which is a protocol for encrypting information over the Internet. In the report it is used to refer to any of a number of protocols used to support secure web browser communication with web servers. This is typically visible in a web browser when the pad lock is displayed.
Security Includes the management of hardware and software whose main purpose is to provide security for a network, internet operations as well as the physical access to ICT facilities and equipment.
Security architect A security architect is responsible for the security countermeasures of one or more systems, applications, components, or centres.
Security specialist A security specialist is responsible for ensuring that the information an organisation gathers, stores and utilises is only available to those people who need access to that information. Information security specialists are broadly responsible for information, confidentiality, integrity and availability.
Service-centric Service-centric systems are systems that integrate heterogeneous elements in terms of services from different providers regardless of the underlying operating systems or programming languages of those applications.
Service Desk All service desk or help desk activities including call and email response management as well as recording, classifying and prioritising problems and seeking a solution while keeping users updated.
Service Level Agreement (SLA)
A written agreement between a service provider and customer(s) that documents agreed service levels for a service.
Service Management Management of services to meet the customer's requirements.
Service Oriented Architect (SOA)
A style of loosely connecting ICT systems in which the systems are generally smaller and more modular than singular monolithic systems.
Shared Service Provider (SSP)
Organisational body that provides services to multiple agencies.
Significant Procurement Plan (SPP)
Procurement of goods and services in high in either business risk, expenditure or both are significant procurements for which a plan is required. The SPP relates directly to the justification of a particular form of procurement for the goods or services being sought.
Six Sigma A business management strategy that seeks to improve the quality of process outputs by identifying and removing the causes of defects (errors) and minimizing variability in manufacturing and business processes. It uses a set of quality management methods, including statistical methods.
Software Maintenance Updating software, adding new functions, fixing bugs and solving problems. Technology vendors often sell a maintenance contact with their software. This contract is usually calculated as an annual fee based on some percentage of the total software cost. It generally provides for overall support and maintenance of a software product, including applications. Support may include telephone assistance time as well.

Queensland Government ICT Audit 2012: Appendices
192
Queensland Government ICT Audit 2012
Term Definition
Solutions architect The solutions architect is responsible for the development of the overall vision that underlies the projected solution and transforms that vision through execution into the solution. The solution architect becomes involved with a project at the time of inception and is involved in the functional analysis of developing the initial requirements. They then remain involved throughout the balance of the project.
Standing offer arrangement (SOA)
Standing offer arrangements are agreements involving one or more suppliers to provide goods and services over a set period, according to agreed terms and conditions, including price. An SOA can be established and managed by the QGCPO or another agency.
Strategic/business planner The strategic/business planner is responsible for ensuring that there are plans in place for an organisation's future course. Strategic planning is the formal consideration of an organisation's future course. The strategic/business planner is responsible for knowing where the organisation stands (What do we do?), determining where the organisation is going, and how it will get there. The resulting document is called the ‗strategic plan‘. The strategic/business planner is responsible for setting strategic objectives and defining a roadmap of ways to achieve those objectives. The strategic business planner is also responsible for ensuring that the strategies are embedded within the business operational plans and performance management plans.
System An ICT system deployed by the agency which has part of an agency's business process embedded within it. A system relates to particular business processes (for example, SAP which would typically be provided only for finance, assets management or procurement staff); whereas a Technology is involved with either essential infrastructure or general productivity (such as systems management software or standard issue tools like Microsoft Office which would typically be provided to all staff).
Systems administrator The systems administrator is responsible for the management of an organisation's computer systems and needs. This includes the planning, development, installation, configuration, maintenance, support, and optimisation of all computer systems. In some cases, especially in smaller organisations, the responsibilities of a system administrator and network administrator often overlap.
Systems analyst The system analyst works with the client to develop user requirements, however, they focus on the technical requirements required for the solution to be created. Systems analysts will also advise the client on the ability of an existing system to support proposed change of an existing system.
Technical Condition A major characteristic in the Queensland Government ICT Portfolio Assessment Methodology. It measures the health of the system or technology in terms of performance, maintainability and alignment with the corporate architecture to determine whether its use should be encouraged or curtailed. The dimensions of the evaluation vary between systems and technologies.
Technology The technologies required to support business systems, including software technologies, hardware, and network support. This includes infrastructure software which is broad based or commodity in nature. Technologies are involved with either essential infrastructure or general productivity software and hardware.

Queensland Government ICT Audit 2012: Appendices
193
Queensland Government ICT Audit 2012
Term Definition
Telecommunications Telecommunications is the transmission of signals over long distances. It includes the support of special purpose devices including voice and video communications devices including telephones, radio devices, mobile devices, pagers, audio and video devices, and IP telephony devices and software.
Telecommunications Expense Management (TEM)
TEM services encompass the processes undertaken to order, provide, support and optimise corporate communications services, both fixed and mobile.
Temporary appointment A non-permanent appointment to a position with a known end date that may or may not form part of the budgeted establishment of the organisation.
True-up A process initiated by Microsoft to see if you have deployed more software licenses than what your company has licensed under an agreement or if you have licenses that are currently unallocated.
Ubiquitous Computing Where simultaneous information processing has been thoroughly integrated into everyday objects and activities and therefore in the course of ordinary activities, some engages many computational devices and systems.
Usability How easy an application is to use
Vendor relationship manager A vendor relationship manager is responsible for building and maintaining relationships with each company that the organisation has a commercial relationship. Vendor relationship management has at its heart the concept that the customer is not passive in the commercial relationship.
Virtualisation Defined by Gartner as the abstraction of IT resources that masks the physical nature and boundaries of those resources from resource users.
An IT resource can be a server, a client, storage, networks, applications or OS‘s.
Abstraction enables better flexibility in how different parts of an IT stack are delivered, thus enabling better efficiency (through consolidation or variable usage) and mobility (shifting which resources are used behind the abstraction interface), and even alternative sourcing (shifting the service provider behind the abstraction interface, such as cloud computing).
Whole-of-government (WoG) Defines scope of context to all of the Queensland Government
Windows and MS Office Microsoft desktop operating system and productivity suite.
Windows Server A brand name for a group of server operating systems released by Microsoft.
Workforce planning A planning process used to align the needs and priorities of the organisation with those of its workforce to ensure it can meet its legislative, regulatory, service requirements and organisational objectives.

Queensland Government ICT Audit 2012: Appendices
194
Queensland Government ICT Audit 2012
Acronyms The following acronyms have been used throughout the content of this document.
Term Definition
AETCO Annual Estimated Total Cost of Operation
BAU Business As Usual
BPaaS Business Process as a Service
BYOD Bring Your Own Device
CEDA Committee for Economic Development of Australia
CEO Chief Executive Officer
CIO Chief Information Officer
COBIT The Control Objectives for Information and related Technology
DG Director General
DDG Deputy Director General
ELA Enterprise License Agreement
EMG Executive Management Group
EMP Employment Management Program
ERC Estimated Replacement Cost
ERP Enterprise Resource Planning
FTE Full Time Equivalent
GFC Global Financial Crisis
GITC Government Information Technology Conditions
GWN Government Wireless Network
ICT Information and Communications Technology
IaaS Infrastructure-as-a-Service
ISP Internet Service Provider
ITIL Information Technology Infrastructure Library
ITSM Information Technology Service Management
MAO Maximum Acceptable Outage
Mobile IPWAN Mobile Internet Protocol Wide Area Network
MoG Machinery of Government
NICTA National ICT Australia Ltd.
Opex Operational Expenditure
PaaS Platform as a Service
PSC Public Service Commission
P3M3 Project, Program and Portfolio Management
QGEA Queensland Government Enterprise Architecture
SaaS
Software-as-a-Service
SDPC Service Delivery and Performance Commission
SFIA Skills Framework for the Information Age
SLA Service Level Agreement
SOA Service Oriented Architect
SSP Shared Service Provider
SOA Standing Offer Arrangement
SRU Server Resource Unit
SSL Secure Sockets Layer
TEM Telecommunications Expense Management
WoG Whole-of-government

Queensland Government ICT Audit 2012: Appendices
195
Queensland Government ICT Audit 2012
Queensland Government Departments
Post 2012 Machinery of Government Departments
Acronym Department
DAFF Department of Agriculture, Fisheries and Forestry
DATSIMA Department of Aboriginal and Torres Strait Islander and Multicultural Affairs
DCCSDS Department of Communities, Child Safety, Disability Services
DCS Department of Community Safety
DETE Department of Education, Training and Employment
DEWS Department of Energy and Water Supply
DJAG Department of Justice and Attorney-General
DLG Department of Local Government
DNPRSR Department of National Parks, Recreation, Sport and Racing
DNRM Department of Natural Resources and Mines
DPC Department of Premier and Cabinet
DSDIP Department of State Development, Infrastructure and Planning
DSITIA Department of Science, Information Technology, Innovation and the Arts
DTESB Department of Tourism, Major Events, Small Business and the Commonwealth Games
EHP Department of Environment and Heritage Protection
HPW Department of Housing and Public Works
QH Queensland Health
QPS Queensland Police Service
QTT Queensland Treasury and Trade
TMR Department of Transport and Main Roads

Queensland Government ICT Audit 2012: Appendices
196
Queensland Government ICT Audit 2012
Pre 2012 Machinery of Government Departments
Acronym Department
CITEC CITEC
DCS Department of Community Safety
DEEDI Department of Employment, Economic Development and Innovation
DERM Department of Environment and Resource Management
DET Department of Education and Training
DJAG Department of Justice and Attorney-General
DLGP Department of Local Government and Planning
DoC Department of Communities
DPC Department of Premier and Cabinet
DPW Department of Public Works
QH Queensland Health
QPS Queensland Police Service
QSS Queensland Shared Services
SSQ Smart Service Queensland
TMR Department of Transport and Main Roads
Treasury Queensland Treasury

Queensland Government ICT Audit 2012: Appendices
197
Queensland Government ICT Audit 2012
Historical Departmental Acronyms
Acronym Department
DATSIP Department of Aboriginal and Torres Strait Islander Policy
DC Department of Communities
DChS Department of Child Safety
DCOMM Department of Communities
DE Department of Energy
DEA Department of Education and the Arts
DEIR Department of Employment and Industrial Relations
DES Department of Emergency Services
DETA Department of Education, Training and the Arts
DH Department of Housing
DI Department of Innovation
DIP Department of Local Government and Planning
DIR Department of Industrial Relations
DLGPSR Department of Local Government, Planning, Sport and Recreation
DLGSR Department of Local Government, Sport and Recreation
DME Department of Mines and Energy
DMR Department of Main Roads
DNRMW Department of Natural Resources, Mines and Water
DNRW Department of Natural Resources and Water
DPIF Department of Primary Industries and Fisheries
DSDT Department of State Development and Trade
DSDTI Department of State Development, Trade and Innovation
DSQ Disability Services Queensland
DTFTWID Department of Tourism, Fair Trading and Wine Industry Development
DTRDI Department of Tourism, Regional Development and Industry
EIDI Employment, Industry Development and Innovation
EPA Environmental Protection Agency
QAO Queensland Audit Office
QCS Queensland Corrective Services
QT Queensland Transport
SSA Shared Services Agency

Queensland Government ICT Audit 2012: Appendices
198
Queensland Government ICT Audit 2012
This page has been intentionally left blank.

Queensland Government ICT Audit 2012: Appendices
199
Queensland Government ICT Audit 2012
Appendix B – Savings and waste reduction opportunities
Opportunity Potential savings range/waste reduction opportunity
Current status Responsibility
Applications rationalisation
1 Decommission CITEC SAP
There is an opportunity to subsume the CITEC instance of SAP into the DSITIA SAP instance.
Potential savings range:
$300,000 to $1M Stage: CONSULTATION
Confidence level: 35% Frequency: Recurrent Time to Realisation:
Long Savings realised to date:
NIL
Current status:
CITEC provided the costs to support the CITEC SAP system via the ICT Baseline. This system can be decommissioned upon ERP consolidation with DSITIA.
While this information has been analysed, the conclusion will be confirmed during consultation with CITEC and DSITIA.
CITEC with DSITIA
2 Remove dust gathering systems
Identify and treat applications with low business impact; high cost; a low number of users; and low frequency of use. Decommission applications that are of low value to the business and little potential for the future.
Potential savings range:
$8M to $10M per annum Stage: DECISION
Confidence level: 80% Frequency: Recurrent Time to Realisation:
Medium Savings realised to date:
NIL
Current status:
Analysis of agency baseline data and confirmation through agency consultation has confirmed the value of the savings potential.
QGCIO with Queensland State Archives
All Queensland Government Agencies
QGCIO

Queensland Government ICT Audit 2012: Appendices
200
Queensland Government ICT Audit 2012
Opportunity Potential savings range/waste reduction opportunity
Current status Responsibility
Business service delivery
3 Agency library
consolidation
Reduce internal and external costs by consolidating agency library facilities and services.
Potential savings range:
$100,000 to $1M Stage: ANALYSIS
Confidence level: 20% Frequency: Recurrent Time to Realisation:
Long Savings realised to date:
not yet confirmed.
Current status:
Information regarding government library facilities was obtained from the Department of the Premier and Cabinet.
Some activity has occurred in this area in recent years and anecdotally agencies have begun to reduce services in this area during the period of the the Audit.
Department of the Premier and Cabinet
4 Services
migration to
online (internet)
channel
Significantly reduce the cost of front line service delivery by leveraging online self-service and mandating agency use.
Potential savings range:
$4M to $20M per annum Stage: GATHER DATA
Confidence level: 25% Frequency: Recurrent Time to Realisation:
Long Savings realised to date:
NIL
Smart Service Queensland
5 Travel management system (TMS)
Identify the savings that could be achieved if the TMS was decommissioned and agencies did the same amount of travel.
Potential savings range:
$8.8M to $9.8M per annum
Stage: DECISION
Confidential level: 95% Frequency: Recurrent Time to Realisation:
Medium Savings realised to date:
NIL
QGCPO

Queensland Government ICT Audit 2012: Appendices
201
Queensland Government ICT Audit 2012
Opportunity Potential savings range/waste reduction opportunity
Current status Responsibility
Business service delivery
6 Vehicle
registration
stickers
Avoid costs for Motor Vehicle Registration labels by relying upon currently installed traffic management systems in use by Police and Department of Transport and Main Roads.
Potential savings range:
$100,000 to $3M Stage: GATHER DATA
Confidence level: 20% Frequency: Recurrent Time to Realisation:
Long Savings realised to date:
NIL
Current status:
Early discussions have been conducted between the QGCIO and executives within the Department of Transport and Main Roads.
QGCIO
7 Website optimisation
Avoid costs via optimising website redevelopment.
Potential savings range:
$20,000 to $500,000 per annum
Stage: GATHER DATA
Confidence level: 15% Frequency: Recurrent Time to Realisation:
Long Savings realised to date:
NIL
Current status:
Information regarding the number of websites and support costs were provided by Smart Service Queensland although by admission this information was out-dated and incomplete.
Smart Service Queensland

Queensland Government ICT Audit 2012: Appendices
202
Queensland Government ICT Audit 2012
Opportunity Potential savings range/waste reduction opportunity
Current status Responsibility
ICT efficiency
8 Cloud email
Comparison of government provided email with cloud hosted solutions.
Potential savings range:
$3.7M to $17M Stage: CONSULTATION
Confidence level: 45% Frequency: Recurrent Time to Realisation:
Long Savings realised to date:
NIL
Current Status:
The QGCIO has compared internal government email solutions to potential cloud hosted email solutions.
The preliminary cost modelling indicates a saving of approximately $8 per month per user.
The best case savings estimate is the difference between the worst case government costs and the lowest market cost (Google), whereas the low savings estimate is the difference between the best case government costs less the highest market costs.
QGCIO
ICT Strategic Sourcing (DSITIA)
9 Cloud provisioning of hosting infrastructure
Comparison of the costs to provision and maintain hosting and storage solutions between government and Cloud service providers.
Potential savings range:
$5M to $12M per annum Stage: CONSULTATION
Confidence level: 45% Frequency: Recurrent Time to Realisation:
Long Savings realised to date:
NIL
QGCIO
ICT Strategic Sourcing (DSITIA)
10 Data storage consolidation and outsourcing
Consolidate and outsource data storage service for all agencies where the per unit costs exceeds comparable industry offerings.
Potential savings range:
$10M to $20M per annum. Stage: CONSULTATION
Confidence level: 60% Frequency: Recurrent Time to Realisation:
Long Savings realised to date:
NIL
Current status:
Agency costs and units have been modelled and compared to standard industry offerings. The current industry prices offer substantial savings in comparison to agency supplied data storage costs.
ICT Strategic Sourcing (DSITIA)
All Queensland Government agencies
11 Desktop consolidation and outsourcing
Consolidate and outsource desktop personal computers for all agencies where the per unit costs exceeds comparable industry offerings.
Potential savings range:
$34M to $40M per annum. Stage: CONSULTATION
Confidence level: 70% Frequency: Recurrent Time to Realisation:
Long Savings realised to date:
NIL
Current status:
Agency costs and units have been modelled and compared to standard industry offerings.
ICT Strategic Sourcing (DSITIA) All Queensland Government agencies

Queensland Government ICT Audit 2012: Appendices
203
Queensland Government ICT Audit 2012
Opportunity Potential savings range/waste reduction opportunity
Current status Responsibility
ICT efficiency
12 ICT service costing models
The Queensland Government can avoid costs by using a standard government cost model. The costs to develop a typical ICT costing and pricing model is estimated to be $200k.
Potential savings range:
$200,000 to $1M per annum
Stage: CONSULTATION
Confidence level: 55% Frequency: Recurrent Time to Realisation:
Medium Savings realised to date:
NIL
Current status:
If five or more large agencies reuse a standard model then the government can avoid an estimated $1M in expenditure.
All Queensland Government Agencies
13 Minimise transaction costs
Minimise transaction costs and GST revenue leakage by examining inter-agency and procurement transactions and identify more cost effective approaches.
Potential savings range:
$3M to $10M per annum Stage: ANALYSIS
Confidence level: 30% Frequency: Recurrent Time to Realisation:
Long Savings realised to date:
NIL
Current status:
After initial delays in receiving the requested transaction data, the transaction information has been received in a variety of formats from numerous SAP systems.
The ICT Audit team mapped the transaction data to determine procurement spend however competing priorities meant the full analysis was prioritised as a post-audit activity.
QGCIO
14 Optimise ICT asset management
Transfer asset custodianship of unutilised assets across departments to ensure assets are utilised and to avoid unnecessary purchases.
Potential savings range:
$20,000 to $500,000 per annum
Stage: GATHER DATA
Confidential level: 30% Frequency: Recurrent Time to Realisation:
Long Savings realised to date:
NIL
Current status:
ICT asset utilisation rates are currently under examination.
Early findings indicate that while demand is increasing for most ICT infrastructure, the demand for personal computers and mobile devices may decrease due to a reduction in the government workforce.
QGCIO

Queensland Government ICT Audit 2012: Appendices
204
Queensland Government ICT Audit 2012
Opportunity Potential savings range/waste reduction opportunity
Current status Responsibility
ICT efficiency
15 Optimise Internet Service Provider (ISP) bandwidth
Optimise the expenditure across government on ISP charges.
Potential savings range:
$1.2M to $1.4M per annum
Stage: REALISATION
Confidence level: 95% Frequency: Recurrent Time to Realisation:
Short Savings realised to date:
NIL
Current status:
The QGCIO brokered a better deal on ISP charges which enabled the realisation of $1.3m.
The Queensland Government ISP service provided by CITEC was at risk as DETE, the largest customer, was offered a substantially lower price by UQConnect.
A number of cost and service options were discussed including several offers and counter offers until DETE accepted a substantially revised offer from CITEC.
CITEC
16 QGCPO administration charges
Reduce the cost of ICT purchases to agencies through mandated Standing Offer Arrangements by removal of QGCPO 2% administration and management fee to reduce the cost of ICT purchases to agencies.
Potential savings range:
$1.76M to $1.8M per annum
Stage: DECISION
Confidence level: 95% Frequency: Recurrent Time to Realisation:
Short Savings realised to date:
NIL
QGCPO (DSITIA)
17 Security Software Licensing costs reduction
Utilise industry providers for security products (such as Secure Sockets Layer) rather than develop in-house.
Potential savings range:
$20,000 to $100,000 per annum
Stage: DECISION
Confidence level: 70% Frequency: Recurrent Time to Realisation:
Medium Savings realised to date:
NIL
Current status:
CITEC and QGCIO consulted to discuss opportunity for reduced ICT security cost approaches.
The QGCIO

Queensland Government ICT Audit 2012: Appendices
205
Queensland Government ICT Audit 2012
Opportunity Potential savings range/waste reduction opportunity
Current status Responsibility
ICT vendor management
18 Adobe invoice consolidation
Reduce internal invoice processing costs by the consolidation of Adobe invoices.
Potential savings range:
$88,000 to $110,000 per annum
Stage: DECISION
Confidence level: 80% Frequency: Recurrent Time to Realisation:
Short Savings realised to
date: NIL
All Queensland Government Agencies
19 ICT license management – minimise unplanned expenditure following software audits
(Exposure): >$10M per annum in unplanned expenditure due to true-up requirements with software licence terms and conditions.
Potential savings range:
Cost avoidance opportunity
Stage:
CONSULTATION
Confidence level: 40% Frequency: Recurrent Time to Realisation:
Short Savings realised to
date: NIL
Current status:
Preliminary data collection has determined this to be a viable opportunity to prevent unnecessary waste due to true-up requirements with software license terms and conditions.
All Queensland Government Agencies
ICT Strategic Sourcing Group (DSITIA)
20 Microsoft purchase order consolidation
Reduce internal invoice processing costs by consolidating Microsoft purchase orders.
Potential savings range:
$168,000 to $210,000 per annum
Stage: DECISION
Confidence level: 80% Frequency: Recurrent Time to Realisation:
Short Savings realised to
date: NIL
All Queensland Government Agencies

Queensland Government ICT Audit 2012: Appendices
206
Queensland Government ICT Audit 2012
Opportunity Potential savings range/waste reduction opportunity
Current status Responsibility
ICT vendor management
21 Microsoft ‘true-up’ cost avoidance
Avoidance of Microsoft ‘true-up’ costs and license penalties due to the reduction in the size of the public service since December 2011.
Potential savings range:
$980,000 to $1M per annum
Stage: REALISATION
Confidence level: 95% Frequency: Recurrent Time to Realisation:
Short Savings realised to date:
NIL
Current Status:
Under the State‘s Enterprise Agreement for the Microsoft Core CAL Suite, the State is obliged to make ‗true-up‘ payments, proportional to the annual growth in actual employees in budget sector agencies as at 30 June.
Based on the average growth over the previous two years of the three-year agreement, the State would have expected to pay $1M to Microsoft in December 2012.
As a result of sector wide staff reductions the cost of the Microsoft true up has been reduced by as much as $1M.
22 ‘Right size’ software application licenses
Savings opportunity in reducing maintenance charges for unused licences. Right size application licenses for largest vendors including IBM, Microsoft, Adobe, Oracle, Cisco, and SAP.
Potential savings range:
$1.4M to $5M per annum Stage: ANALYSIS
Confidence level: 25% Frequency: Recurrent Time to Realisation:
Long Savings realised to date:
NIL
All Queensland Government Agencies
23 Right size SAP licenses
Potential savings range:
$700,000 to $5,5M per annum
Stage: DECISION
Confidence level: 60% Frequency: Recurrent Time to Realisation:
Long Savings realised to date:
NIL
DSITIA
24 Standard and extended warranties
Avoid costs for standard and extended warranties for ICT assets which have a low failure rate and minimal risk impact.
Potential savings range:
$0 - $40k Stage: CONSULTATION
Confidence level: 35% Frequency: Recurrent Time to Realisation:
Short Savings realised to date:
NIL
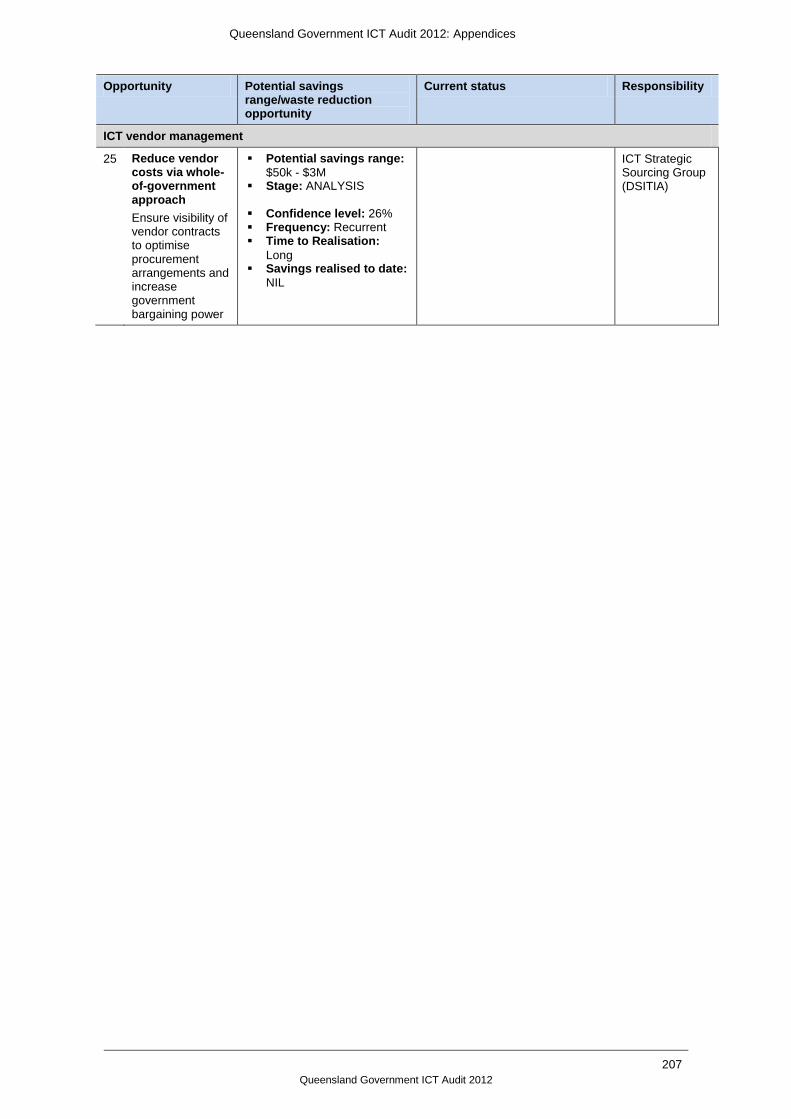
Queensland Government ICT Audit 2012: Appendices
207
Queensland Government ICT Audit 2012
Opportunity Potential savings range/waste reduction opportunity
Current status Responsibility
ICT vendor management
25 Reduce vendor costs via whole-of-government approach
Ensure visibility of vendor contracts to optimise procurement arrangements and increase government bargaining power
Potential savings range:
$50k - $3M Stage: ANALYSIS
Confidence level: 26% Frequency: Recurrent Time to Realisation:
Long Savings realised to date:
NIL
ICT Strategic Sourcing Group (DSITIA)

Queensland Government ICT Audit 2012: Appendices
208
Queensland Government ICT Audit 2012
Opportunity Potential savings range/waste reduction opportunity
Current status Responsibility
Print services
26 Colour printing reduction
All of government savings opportunity by reducing the percentage of printouts using colour.
Potential savings range:
$600,000 to $1.8M per annum
Stage: ACTION
Confidence level: 80% Frequency: Recurrent Time to Realisation:
Short Savings realised to date:
Active yet unmeasured
QGCIO
27 Print volume reduction
Demand management and policy direction to reduce volume of printing.
Potential savings range:
$100,000 to $1.1M per annum
Stage: ACTION
Confidence level: 80% Frequency: Recurrent Time to Realisation:
Short Savings realised to date:
NIL
QGCIO
28 Printing invoice management reduction
Reduce processing costs of invoices by centralising and consolidating vendor invoices.
Potential savings range:
$100,000 to $500,000 per annum.
Stage: ACTION
Confidence level: 60% Frequency: Recurrent Time to Realisation:
Short Savings realised to date:
NIL
Current status:
Data has been provided by DETE, CITEC, and for rest of government indirectly from QGCPO.
QSS data is still outstanding.
QGCIO

Queensland Government ICT Audit 2012: Appendices
209
Queensland Government ICT Audit 2012
Opportunity Potential savings range/waste reduction opportunity
Current status Responsibility
Telecommunications
29 Cancel idle mobile telecommunications services
Identify mobile service lines which have a consistent nil or unbilled usage and review them to ascertain if these are surplus service lines, or alternatively, services necessary to provide emergency or safety facilities.
Potential savings range:
$2.1M - $2.8M per annum
Stage: ACTION
Confidence level:
80% Frequency:
Recurrent Time to Realisation:
Short Savings realised to
date: NIL
Current status:
Currently analysing costs to validate the opportunity.
A total of 6,578 (12.8% of the total number of mobile services billed in July 2012) mobile services have been identified.
All Queensland Government Agencies
30 Cancel idle fixed telecommunications services
Identify fixed line telecommunications services, which have a consistent nil or unbilled usage, and review them to ascertain if these are surplus services, or alternatively, services necessary to provide emergency or safety facilities.
Potential savings range:
$4.8M to $6.5M per annum
Stage: ACTION
Confidence level: 75%
Frequency: Recurrent
Time to Realisation: Short
Savings realised to
date: NIL
Current status:
A total of 16,661 (19.6% of the total number of fixed voice services billed in August 2012) have been identified.
All Queensland Government Agencies
31 Consolidate telecommunications accounts. Consolidate/rationalise telecommunications accounts to minimise invoice processing costs and enable savings from service provider discounts relating to intra-account billing. Including: (verify ownership of telecommunications services)
Potential savings range:
$1.5M - $2.3M Stage: DECISION
Confidence level:
65% Frequency:
Recurrent Time to Realisation:
Short Savings realised to
date: NIL
Current status:
Initial analysis confirmed the value of engaging a specialist telecommunications third party to investigate detailed government telecommunications account details and provide further information on a range of potential telecommunications savings opportunities.
Fastlane Software was engaged to analyse and identify cost reduction opportunities and benchmark the latest rates/service charges.
Based on a sample of 3,700 fixed and mobile services billed to DEEDI, only four services have been positively identified as generating charges that are not the responsibility of DEEDI or other government entities.

Queensland Government ICT Audit 2012: Appendices
210
Queensland Government ICT Audit 2012
Opportunity Potential savings range/waste reduction opportunity
Current status Responsibility
Telecommunications
32 Introduce Voicemail
Utilise Voicemail to avoid fixed to mobile call diversions.
Potential savings range:
Not yet identified Stage: GATHER
DATA
Confidence level:
35% Frequency:
Recurrent Time to Realisation:
n/a Savings realised to
date: NIL
Current status:
Currently gathering data to validate the opportunity.
Obtained agreement for data provision.
QGCIO
33 Minimise fixed line fax costs
Utilise fax gateways to avoid fixed line fax costs.
Potential savings range:
$10,000 - $100,000 per annum
Stage: DECISION
Confidence level:
70% Frequency:
Recurrent Time to Realisation:
Medium Savings realised to
date: NIL
Current Status:
Currently analysing data to validate the opportunity. Obtained agreement for data provision.
QGCIO consulted with agencies and received the number of dedicated fax machines from some agencies.
Most large agencies do not have visibility of the numbers of dedicated fax machines and were not able to provide this information as requested within the timeframes of the ICT Audit.
All Queensland Government Agencies
34
Minimise fixed voice call costs
Reduce costs for fixed voice service by ensuring agencies are using the optimum Optus plan for pre-selectable calls
Potential savings range:
$587,700 - $653,000 per annum
Stage: ACTION
Confidence level:
90% Frequency:
Recurrent Time to Realisation:
Short Savings realised to
date: NIL
Current status:
Analysis completed
All Queensland Government Agencies

Queensland Government ICT Audit 2012: Appendices
211
Queensland Government ICT Audit 2012
Opportunity Potential savings range/waste reduction opportunity
Current status Responsibility
Telecommunications
35 Minimise mobile voice costs
Reduce costs for mobile voice service by ensuring agencies are using the optimum mobile voice plan for their usage.
Potential savings range:
$457,834 - $500,000 per annum
Stage: ACTION
Confidence level:
90% Frequency:
Recurrent Time to Realisation:
Short Savings realised to
date: NIL
Current status:
Analysis completed
QGCIO
36 Optimise mobile telecommunications data plans
Optimise costs for mobile data plans by ensuring agencies are using the right mobile data and voice plans that suits their usage.
Potential savings range:
$3.7M - $4.7M per annum
Stage: ACTION
Confidence level:
80% Frequency:
Recurrent Time to Realisation:
Short Savings realised to
date: NIL
Current status:
Analysis from the Fastlane Software has confirmed the potential to optimise savings opportunities.
All Queensland Government Agencies
37 Optimise WAN costs
Potential savings range:
Not yet identified Stage: GATHER
DATA
Confidence level:
25% Frequency:
Recurrent Time to Realisation:
Long Savings realised to
date: NIL
Current status:
Preliminary data gathering was hindered by inaccurate information available to fully articulate the savings opportunity.
QGCIO

Queensland Government ICT Audit 2012: Appendices
212
Queensland Government ICT Audit 2012
Opportunity Potential savings range/waste reduction opportunity
Current status Responsibility
Telecommunications
38 Telecommunications service provider billing anomalies
Identify anomalies in service providers’ billing charges.
Potential savings range:
$146,035 to $149,015 per annum
Stage:
REALISATION
Confidence level:
99% Frequency:
recurrent Time to Realisation:
Short Savings realised to
date: $434,626.50
Current status:
A service provider has agreed to credit agency accounts for excess charges totalling $434,626.50 billed since 10 November 2009.
All Queensland Government Agencies

Queensland Government ICT Audit 2012: Appendices
213
Queensland Government ICT Audit 2012
Appendix C – Analysis of Travel Management System savings
Background
Since 2003, the Queensland Government Chief Procurement Office (QGCPO) has been
managing contracts from travel suppliers. In February 2009 a contract was signed with
the supplier HRG Australia Pty Ltd (HRG), and adoption of the Travel Management
System (TMS) began in the Queensland Government.
The three key functions of the TMS are the:
booking and purchase of air travel, accommodation, car hire, and air charter
provision of a consolidated whole-of-government view of travel expenditure. This was
a key driver that led to the development of the TMS
capture of staff meal allowances as part of travel bookings. However, QGCPO has
been required to invest in a proprietary and customised middleware solution, in order
to integrate with the QSS payroll (to ensure staff were paid the necessary meal
allowances).
With the government‘s focus on implementing austerity measures, (including a reduction
in Queensland Government travel and accommodation expenditure), there is an
expectation there will be a subsequent decline in the use of TMS.
Table 20 shows a summary of total travel and accommodation expenditure recorded
within TMS for 2011.
Table 20 - 2011 expenditure recorded within the Travel Management System (TMS)
Bookings and purchases Total 2011 expenditure
Air travel $64.7 M
Accommodation $24.1 M
Car hire $8.0 M
Air charter $14.1 M

Queensland Government ICT Audit 2012: Appendices
214
Queensland Government ICT Audit 2012
Scope
QGCIO conducted analysis to assess whether TMS provides value to government, by
reviewing the air travel costs for flights available within TMS, and comparing these costs
against other external travel service providers, to determine their price competitiveness.
In 2011, air travel accounted for 58.3% of all travel expenditure incurred through TMS.
Since this represented the majority of travel expenditure within TMS, the Audit focused on
benchmarking only air travel costs. There may be a requirement to undertake a further
benchmarking assessments in the areas of accommodation, car hire and air charter
booking, in order to obtain a complete assessment of TMS‘ travel offerings.
Travel Benchmarking Analysis
A cost comparison of over 100 flights was undertaken (comprising of flights from all major
Australian capital cities, and several Queensland regional centres). The costs of these
flights were assessed from four alternative solutions:
the TMS solution from HRG
Webjet
Flight Centre
Direct from airlines
Qantas and Virgin were both selected as suitable alternatives due to their consistent
coverage across all of the destinations that are considered to be common destinations for
public service travel. Comparisons for each individual flight were made on the same day
(ensuring a consistent comparison was made across each provider), before comparing
the next flight. TMS was used as the primary source for obtaining the destinations and
flight offerings that were compared. In addition, costs were compared with and without
the administrative fees charged by each provider. The costs presented within this
analysis include administrative fees in order to accurately reflect the total cost from all
providers.
Travel Benchmarking Summary
Across more than 100 flights, direct bookings through the airlines were consistently
cheaper, by an average of 10.9%.38 There is above 95% confidence that the savings
would be between 9.5% and 11%. This provides a potential saving of between $6M
and $7M (against the total air travel costs of $64 M incurred in 2011).
38
This analysis was based on the cheapest flight available.
Queensland Government ICT Audit 2012: Appendices
215
Queensland Government ICT Audit 2012
TMS performed consistently better than other providers in the area of flexi flights,
where they were on average 14.4% cheaper. However it should be noted that public
servants are actively discouraged from purchasing these flights, and instead are
required to obtain the cheapest available flights. This reduces the usefulness of TMS‘
cheaper offerings, as they are not able to be utilised.
The Audit also found that as the as the departure time decreased there was a
decrease of flight availability in the TMS. These flights were still available directly from
the airline. A larger number of cheaper fares were also offered by the airlines which
were not available in TMS.
Analysis of total cost
There are additional operational expenses incurred by QGCPO in managing, training and
customising information brokerage with QSS. These are (but not all costs):
$3.7 million annually in supporting the TMS.
If we total these and multiply it by 58.3% to account for the percentage of travel products
related to air travel, there is an estimated $2.7 million overhead on top of the ticketed
prices. The opportunity cost therefore to government by keeping TMS as opposed to
direct procurement of air travel through airlines is $8.9 million to $9.8 million.
TMS Justification
There are other reasons that have been cited by the QGCPO in legitimising the use of
TMS, including:
process reduction and improvement
consolidated reporting of travel costs for government and agencies
an ability to gain priority allocation of flight bookings for state-declared natural
disasters.
Though a full process study can be conducted, Queensland Government staff already
use similar online systems that provide similar functionality to TMS, and do not require
training. It appears (at least from a user perspective), that there is no increased efficiency
from using TMS. Users also cite that meal allowances are calculated at the end of the
TMS process, and entering these details would be similar to any other allowances they
had to approve under existing employee awards.
Further discussion with QSS will be required or the relevant payroll provider to assess
this and determine if the backend administration is more complex. However it should be
noted that there would be no need to maintain the customised software between HRG
and the QSS payroll system if TMS was removed.
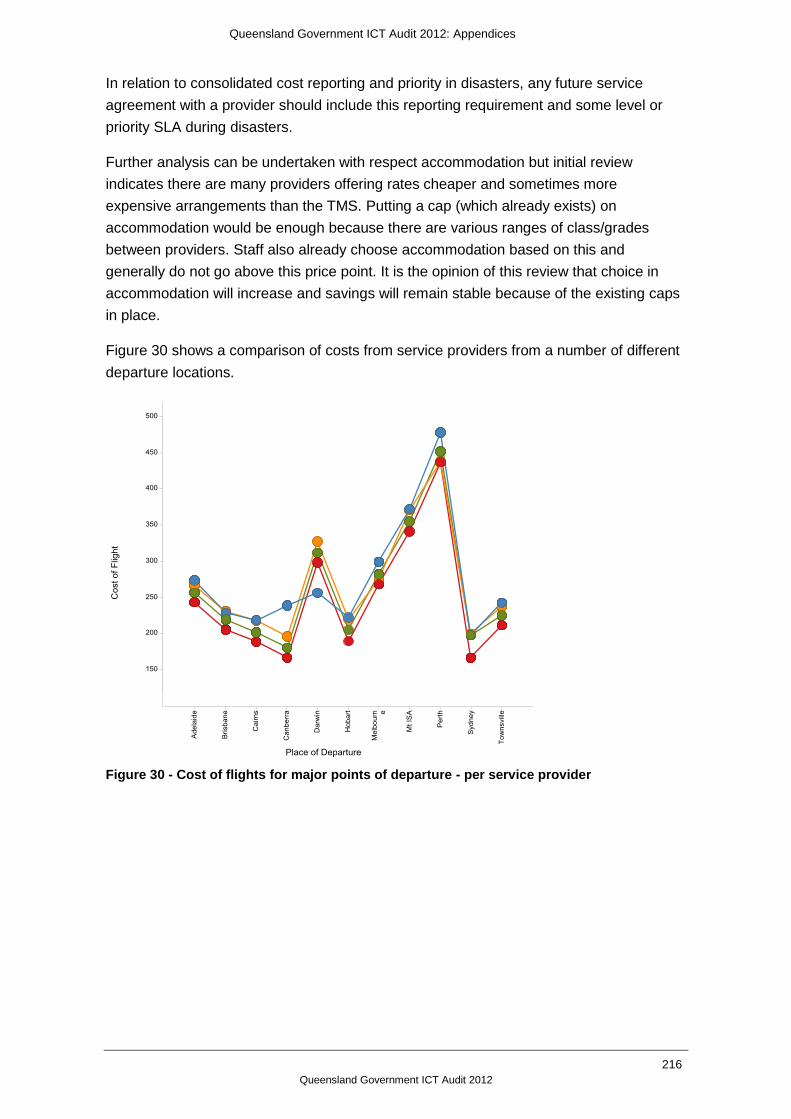
Queensland Government ICT Audit 2012: Appendices
216
Queensland Government ICT Audit 2012
In relation to consolidated cost reporting and priority in disasters, any future service
agreement with a provider should include this reporting requirement and some level or
priority SLA during disasters.
Further analysis can be undertaken with respect accommodation but initial review
indicates there are many providers offering rates cheaper and sometimes more
expensive arrangements than the TMS. Putting a cap (which already exists) on
accommodation would be enough because there are various ranges of class/grades
between providers. Staff also already choose accommodation based on this and
generally do not go above this price point. It is the opinion of this review that choice in
accommodation will increase and savings will remain stable because of the existing caps
in place.
Figure 30 shows a comparison of costs from service providers from a number of different
departure locations.
Figure 30 - Cost of flights for major points of departure - per service provider

Queensland Government ICT Audit 2012: Appendices
217
Queensland Government ICT Audit 2012
Figure 31 shows a comparison of costs per service provider to specific destinations.
Figure 31 - Cost of flights for major destinations - per service provider
Both figures clearly illustrate that direct airline flights are always cheaper than TMS.

Queensland Government ICT Audit 2012: Appendices
218
Queensland Government ICT Audit 2012
This page has been intentionally left blank.

Queensland Government ICT Audit 2012: Appendices
219
Queensland Government ICT Audit 2012
Appendix D – Analysis of Adobe and Microsoft procurement savings
The Queensland Government is a significant consumer of Microsoft and Adobe products
with Standing Offer Arrangements (SOA) established for these products. These SOAs
enable agencies to procure Microsoft and Adobe products at consistent prices, and
include standard terms and conditions for all agencies including software license
compliance.
Whilst agencies can deploy Adobe software during each quarter, they are only required to
place an order for those products at the end of that quarter. Similarly, Microsoft software,
which has been deployed during a calendar month, is only required to be purchased at
the end of that month. This process is deliberately designed to reduce red tape and the
associated costs incurred by government in processing multiple orders and purchase
orders, etc.
However, as shown in Figure 32 and Figure 33, actual data shows that agencies are
generating many more orders than needed, resulting in wasted effort and processing
costs. The green bars represent the savings that could be realised, while the blue bars
represent the optimum cost of purchasing. The costs of the ‗procure to pay‘ cycle (from
raising a purchase order, reconciling the subsequent invoice and payment) have been
assumed to average $200.
Figure 32 - Adobe purchase order and invoice processing costs for fiscal year 2011-2012
Based on the previous procurement profile during 2011-12, savings of approximately
$106,000 per annum could be realised if all customers ordered Adobe products no more
than once per quarter.

Queensland Government ICT Audit 2012: Appendices
220
Queensland Government ICT Audit 2012
Customers are only required to order Microsoft software deployed during the month at the
end of each month. Ordering more frequently has led to waste during the term of
Standing Offer Arrangement PW-ICT-062, as shown in Figure 33.
Figure 33 - Microsoft purchase order and invoice processing costs Dec 2009 – Jul 2012
Based on the previous procurement profile since December 2009, savings of
approximately $210,000 per annum could be realised if orders for Microsoft products
were placed no more frequently than once per month by all customers.

Queensland Government ICT Audit 2012: Appendices
221
Queensland Government ICT Audit 2012
Appendix E – Analysis of Telstra services savings
Fastlane Software was engaged to review Telstra‘s billing data for Queensland
Government agencies, to determine what savings might be available if:
inactive mobile and voice services were cancelled
mobile voice plans were optimised
mobile data plans were optimised
fixed voice plans were optimised
billing accounts were rationalised.
Fastlane Software provided a report that detailed anomalies in Queensland Government
telecommunication charges against negotiated charge rates; and areas where the
Queensland Government could optimise or eliminate expenditure.
Mobile Services
The Queensland Government spends approximately $23 million per annum on Telstra
mobile services.39 Savings opportunities of up to $8 million (including GST) per annum
were identified from more than 49,000 mobile services that were billed by Telstra in July
2012 (as shown by and ).
Table 21 - Savings opportunities from Telstra mobile services
Item Monthly Savings (including GST)
Annual Savings (including GST)
Cancellation of Idle or Inactive Services $236,444 $2,837,328
Cancellation of Idle Data Plans $32,125 $385,500
Minimisation of Over Plan Data Charges $27,690 $332,280
Optimisation of Data Plans for Active Mobiles $98,404 $1,180,848
Replacement of Mobile IPWAN plan with Enterprise Mobile Broadband plan
$235,422 $2,825,064
Optimisation of Voice Plans for Active Mobiles $42,392 $508,704
Total $672,477 $8,069,724
39
Based on expenditure over the six months to August 2012

Queensland Government ICT Audit 2012: Appendices
222
Queensland Government ICT Audit 2012
Figure 34 - Monthly savings opportunities from optimising Telstra mobile services
Some components of these savings can be realised quickly by completing contracts with
Telstra that apply current pricing plans to Telstra billing for services; while some will take
more time and resources to realise, e.g. cancellation of services that are idle.
As shown by , a total of 6,587 (12.8% of the total number of mobile services billed in July
2012) mobile services have been identified as idle.
Figure 35 - Count of Telstra mobile services
Idle services
Analysing the billing data identified 6,587 Telstra mobiles that had no voice usage, data
usage or even uncharged usage (i.e. same account call to another mobile) over the five-
month period. Cancelling these services would provide a saving of $2,837,340 (including
GST) per annum based on July 2012 service and equipment charges. However, there will
be termination payments associated with some of these services and redeployment may
a better option than cancellation for some services.
The criteria used for identifying idle services are as follows:
The service must have existed in March 2012.
The service has no voice call charges from March 2012 to July 2012.

Queensland Government ICT Audit 2012: Appendices
223
Queensland Government ICT Audit 2012
The service has no data usage from March 2012 to July 2012.
The service has no other calls that are not charged (i.e. same account call to another
mobile) from March 2012 to July 2012.
Figure 36 - Maximum monthly savings available from cancelling idle mobile services
Mobile data plan optimisation
There were 759 data plans in use, as at July 2012, that had no data usage for March
2012 to July 2012. The mobiles have separate voice activity, so they are not idle or
inactive. As no data usage is occurring, these data plans can be cancelled saving
$385,500 per annum in service and equipment charges.
The most significant area where savings can be achieved with the greatest benefit is with
correct and appropriate implementation of mobile data plans. A mobile with no data plan
at all or a data plan whose cap is significantly less than that required can lead to
thousands of dollars in additional mobile data usage charges. Similarly, paying for a data
plan for a mobile with no data usage is also a significant cost.
shows a summary of mobile data plan optimisation savings.
Table 22 - Summary of mobile data plan optimisation savings
Item Annual Savings (including GST)
Cancellation of Idle Data Plans $385,500
Minimisation of Over Plan Data Charges $332,280
Optimisation of Data Plans for Active Mobiles $1,180,848
Replacement of Mobile IPWAN40 plan with Enterprise Mobile Broadband plan $2,825,064
40
Mobile IPWAN is a Telstra mobile data plan which allow an agency to access their private data network via Telstra‘s Internet Protocol Wide Area Network service using a device such as a data card or wireless router, which has been superseded by the Enterprise Mobile Broadband plan

Queensland Government ICT Audit 2012: Appendices
224
Queensland Government ICT Audit 2012
As shown in , significant monthly savings may be realised by agencies entering a contract
variation for the Enterprise Mobile Broadband (EMB) plan with Telstra - shows an agency
breakdown of this opportunity.
Figure 37 - Savings obtained by entering a contract variation for the EMB plan with Telstra
Mobile voice plan optimisation
The Queensland Government utilises a number of different Telstra mobile voice plans
with migration to the latest Telstra offering of Enterprise Fleet Plan 10 slowly occurring.
Moving all services not on Enterprise Fleet Plan 10 to this plan would generate a saving
of $508,536 per annum based on the July 2012 billing data.
Benchmarking
Benchmarking by Fastlane Software illustrates that the Telstra Enterprise Fleet Plan 10
compares favourably with deals negotiated by similar sized organisations in the public
and private sector.
Fixed voice services
The Queensland Government spends approximately $36 million per annum on Telstra
voice services.41
41
Based on expenditure over the six months to August 2012

Queensland Government ICT Audit 2012: Appendices
225
Queensland Government ICT Audit 2012
Idle fixed voice services
shows that the Queensland Government has a total of 16,661 idle fixed voice services
(19.6% of the total number of fixed voice services billed in August 2012), currently costing
$544,161 per month (based on expenditure in August 2012).
Figure 38 - Count of Telstra fixed voice services
The services included in this category are those that are still incurring recurring charges
but have no usage for either outgoing calls or incoming calls for a reasonable period.
Incoming calls were identified by checking the Telstra fixed voice and mobile billing data.
To be identified as idle the service:
must have existed in March 2012
has no usage charges from March 2012 to August 2012
has no incoming calls from March 2012 to August 2012.
Figure 39 - Maximum monthly savings available from cancelling idle fixed voice services
Cancelling all these services would provide a saving of $ 6,529,932 (including GST) per
annum, based on the August 2012 service and equipment charges.
Care must be taken with cancelling these services as some will be security alarms, lift
phones, Interactive Voice Response (IVR) services used by the public, roadside
emergency phones and other critical services that are rarely used, do not make outgoing
calls and are not called by Queensland Government services.

Queensland Government ICT Audit 2012: Appendices
226
Queensland Government ICT Audit 2012
CustomNet services
CustomNet is a Telstra voice access service that provides telephone features similar to
those provided by a PABX.
Almost 39,000 Telstra CustomNet services were being billed to agencies in August 2012.
The base price for these services is $30 per month. However, under Standing Offer
Arrangement PW-ICT-067, Telstra discounts these services.
An analysis of the Telstra billing records over the period from March to August 2012
inclusive revealed that DLGP and DPC were not receiving the available discount for all of
these services.
Following representations to Telstra by the QGCIO regarding these anomalies, Telstra
agreed to:
credit agency accounts for excess charges, totalling almost $435,000 billed since 10
November 2009, and apply the discount to future bills for these services (almost
$12,400 per month savings, based on August 2012 billing)
offer the Public Service Commission the opportunity to obtain the available discount
on CustomNet Services (formerly managed through DPC) through completion of a
Customer Contract (almost $500 per month savings, based on August 2012 billing).

Queensland Government ICT Audit 2012: Appendices
227
Queensland Government ICT Audit 2012
Local calls
Almost 16 million local calls were billed to agencies by Telstra in the six months to August
2012, at a total cost of $858,677.
Under Standing Offer Arrangement PW-ICT-067, Telstra offers these services at various
rates, depending on the minimum contact term.
An analysis of the Telstra billing records over the period from March to August 2012
inclusive revealed that QH and QPS were being billed at rates exceeding this range of
call costs for nearly all of their services.
Telstra advised that three departments (DLGP, QH and QPS) had not completed
contracts for calls originating from fixed voice services that entitled them to the rates
offered subsequent to October 2009.
QPS and DLGP completed contracts on 20 August 2009 and 26 October 2009
respectively for terms of three years. However, QH last completed a contract for these
calls in February 2001, more than 11 years ago.
Under the Arrangement with Telstra, agencies may complete new contracts at any time,
either during the term of contract or following the expiry of a contract to take advantage of
the cheaper rates on offer.
Account rationalisation
The most significant saving from reducing the number of accounts is a reduced bill-
processing fee, which is an indirect cost. The Western Australian Government has
benchmarked the cost of processing a single invoice as averaging out at approximately
$250 per invoice. This includes the cost for verification and payment.
As telecommunications invoices are more complicated, the verification costs are higher
than the average. Reducing the number of invoices that need to be processed will
therefore result in an indirect cost saving to an organisation.42
Figure 40 shows there were 1,191 accounts for the August 2012 billing period. Account
rationalisation down to around 200 accounts would result in an indirect saving due to a
reduction in processing cost of almost $2.4 million per annum, assuming an average
processing cost of $200 per invoice.
42
Fastlane Software Pty Ltd
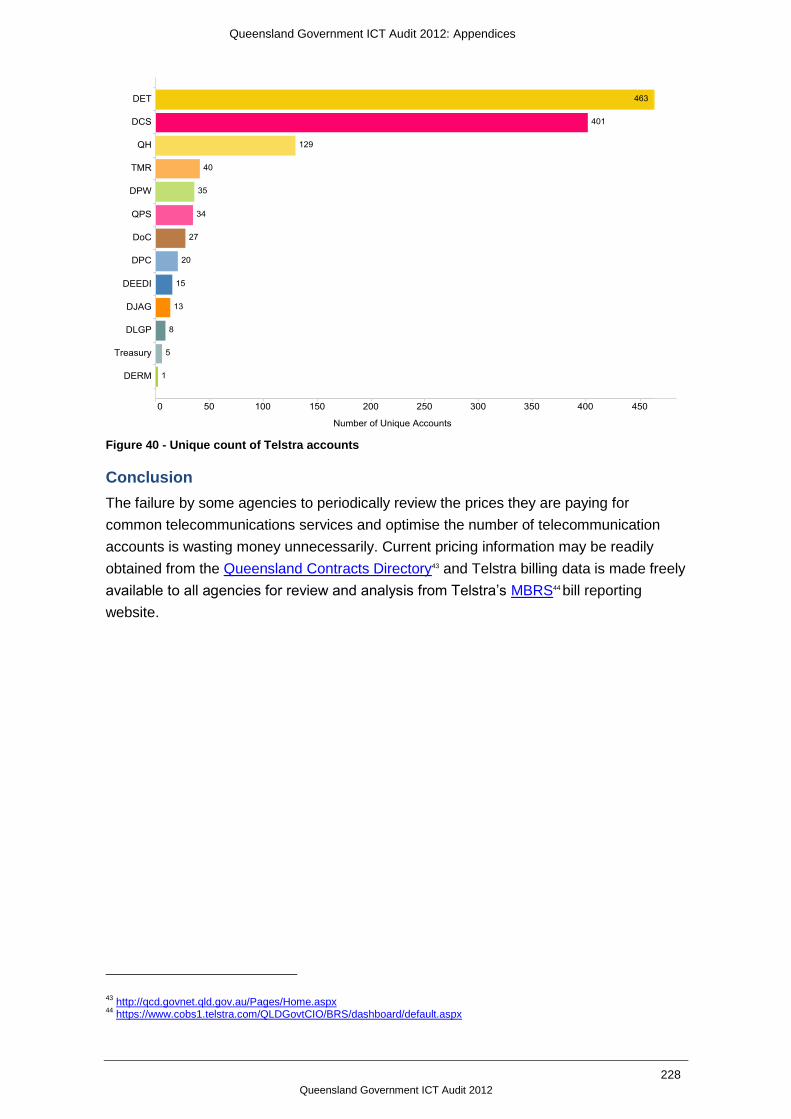
Queensland Government ICT Audit 2012: Appendices
228
Queensland Government ICT Audit 2012
Figure 40 - Unique count of Telstra accounts
Conclusion
The failure by some agencies to periodically review the prices they are paying for
common telecommunications services and optimise the number of telecommunication
accounts is wasting money unnecessarily. Current pricing information may be readily
obtained from the Queensland Contracts Directory43 and Telstra billing data is made freely
available to all agencies for review and analysis from Telstra‘s MBRS44 bill reporting
website.
43
http://qcd.govnet.qld.gov.au/Pages/Home.aspx 44
https://www.cobs1.telstra.com/QLDGovtCIO/BRS/dashboard/default.aspx

Queensland Government ICT Audit 2012: Appendices
229
Queensland Government ICT Audit 2012
Appendix F – Savings realisation framework with labels

Queensland Government ICT Audit 2012: Appendices
230
Queensland Government ICT Audit 2012
This page has been intentionally left blank.

Queensland Government ICT Audit 2012: Appendices
231
Queensland Government ICT Audit 2012
Appendix G – High risk systems
A number of business critical and significant systems were reported to the audit or identified through agency interviews and other stakeholders. The tables below lists those systems which have been assessed as significant
or business critical and represent a high risk to the government. The list does not document all significant and business critical systems.
System details (application) Related initiative information (project)
Pre MOG
agency
Post MOG
agency
Category System and description Business impact
Technical condition
End of life date
Estimated replacement
cost
Initiative and description Total estimated
expenditure
Planned end date
Agency assigned priority
Status Initiative type
DCS DCS Interim report Business critical systems
Human Capital Management System (HCMS) DCS‘s core HR management system, servicing a diverse range of key community safety personnel including fire, ambulance and emergency management. A severe impact (priority 1) BCP-DR system. HCMS is supported by Queensland Shared Services (QSS). Systems include:
Standard HR Offering Service Lattice V3.1 - $75m replacement
Existing Human Resource Solution Lattice V2.5 - $75m replacement.
High Poor Jun 2008 $150M HR Payroll Business Solution Program Business continuity for HR payroll services that provides a strong basis for workforce management. Current projects include:
SABA Upgrade – in progress
Electronic payslips – on hold
Operational Staff Recruitment Management System – on hold
Lattice Infrastructure Improvement – in progress.
$104.6M Jun 2016 Critical Active In progress - defining a program Fully funded
Program
DCS DCS Interim report Extreme business exposure Business critical systems
Disaster Management Portal Collaboration tool for sharing information across the Disaster Management Community.
High Poor Apr 2011 $0.04M All Hazards Information Management Program To build the capability of Disaster Management agencies, stakeholders and the community to ensure they are prepared and capable of effectively responding to a disaster. Dependencies include:
all frontline communications projects including relevant Queensland Police Service initiatives.
$8.1M Jun 2013 Critical Active In progress –managing program tranches Fully funded
Program
DCS DCS Personal Safety
Ambulance Arrivals Board (AAB)51 High Good Jul 1905 $0.08M Ambulance Arrivals Board (AAB)
DCS DCS Personal Safety
Electronic Ambulance Report Form (eARF)
High Good Jun 2015 $3.8M No identified initiative
DCS DCS Personal Safety
ESCAD High Good Jun 2018 $12M Various
51
DCS have since provided an updated end-of-life date of 2015 that has not been analysed

Queensland Government ICT Audit 2012: Appendices
232
Queensland Government ICT Audit 2012
System details (application) Related initiative information (project)
Pre MOG
agency
Post MOG
agency
Category System and description Business impact
Technical condition
End of life date
Estimated replacement
cost
Initiative and description Total estimated
expenditure
Planned end date
Agency assigned priority
Status Initiative type
DCS DCS Personal Safety
GPS Offender Monitoring High Good Sep 2013 $0.09M Global Positioning System Dangerous Prisoners Sex Offender Act Tracking
DCS DCS Extreme business exposure and end date before July 2014. Business critical system
Knowledge Place High Poor Jun 2012 $1.7M Related initiative: Microsoft Reporting
DCS DCS Personal Safety
ProQA High Good Jun 2015 $0.5M No identified initiative
DCS DCS Personal Safety
PSIAM High Good Dec 2013 Data not provided
No identified initiative
DCS DCS Personal Safety
RFA Online High Poor Jul 2015 $1.5M No identified initiative
DEEDI DNRM Interim report Mineral and Energy Resource Location and Information Network (Merlin) An integrated set of databases and systems that provide a range of functions including mining tenure management, geoscience and resource management, lost time accidents statistics, exploration data centre, management of land restrictions, spatial data maintenance, spatial data enquiry (being decommissioned), royalty, rent and security deposit accounting.
High Good Dec 2009 $5M Streamlining Business Systems Program Streamline the lifecycle of mining and petroleum permits to:
reduce time taken for permit approval
improve transparency and certainty for government and the industry
reduce cost of service delivery for government and industry.
Current projects include:
Mines Online Geographic Information System (Mines Online GIS)
Exploration Permit – Minerals.
$16.3M Jan 2016 Critical Active In progress –managing program tranches Fully funded
Program
DEEDI DNPRSR Extreme business exposure and end date before July 2014. Business critical system
Laboratory Information Management System (LIMS) (RSC)
High Poor Dec 2010 $2.2M Laboratory Information Management System (LIMS)

Queensland Government ICT Audit 2012: Appendices
233
Queensland Government ICT Audit 2012
System details (application) Related initiative information (project)
Pre MOG
agency
Post MOG
agency
Category System and description Business impact
Technical condition
End of life date
Estimated replacement
cost
Initiative and description Total estimated
expenditure
Planned end date
Agency assigned priority
Status Initiative type
DERM DNRM Interim report Automated Titling System (ATS) A mission critical system for all land and property related transactions
High Good Dec 2025 $40M ATS Client Modernisation (ATS-CM) A new software platform for ATS to address non-support for the existing platform from 2015. This is identified as a high risk under the government‘s software currency framework. The ATS Client software is developed in VB6, and the current end-of-life for mainstream support of the VB6 runtime is 13-Jan-15.
$3.5M Oct 2013 High Minimal work is being undertaken, just enough to keep some momentum given the high risk nature of the software currency issue and the significance of ATS to Queensland Government revenue
Project
ATS Property Exchange Australia (PEXA) Stage 1: Single Party Transactions. ATS System upgrade to meet COAG reporting commitments.
$2.5M Oct 2014 High Active In planning - initiation stage Awaiting funding approval
Project
DERM DSITIA Personal Safety
Air Quality Database Low Good Dec 2015 $0.05M Air Quality Management System (AQMS)
DERM EHP Personal Safety
Coastal Data System High Good Dec 2020 $0.2M No identified initiative
DERM EHP Personal Safety
EMR/CLR High Good Jun 2016 $0.4M Environmental Management Register / Contaminated Land Register (EMR/CLR) System Redevelopment
DERM DNPRSR Extreme business exposure and end date before July 2014. Business critical system Personal Safety
IAParks Version 2 High Poor Jun 2012 $0.8M IA Parks Operators and Web Redevelopment (IA Parks) - RUFUS_QPWS Authorities Management System

Queensland Government ICT Audit 2012: Appendices
234
Queensland Government ICT Audit 2012
System details (application) Related initiative information (project)
Pre MOG
agency
Post MOG
agency
Category System and description Business impact
Technical condition
End of life date
Estimated replacement
cost
Initiative and description Total estimated
expenditure
Planned end date
Agency assigned priority
Status Initiative type
DERM DNPRSR Personal Safety
ParkInfo High Good Jun 2012 $2M ParkInfo v2.0 $4.7M Jun 2013 High Active Revised business case under consideration Fully internally funded
Project
DERM DSITIA Personal Safety
Point Source Database High Good Dec 2012 500,000 No identified initiative
DERM DEHP Personal Safety
Property Location Service High Good Sep 2011 Data not provided
No identified initiative
DERM DNRM Personal Safety
WAS - Water Accounting System (ex SWDB - Surface Water Database)
High Good Dec 2020 $2M No identified initiative
DET DETE Extreme business exposure and end date before July 2014. Business critical system
DET Internet High Poor Jun 2013 $3M No identified initiative
DET DETE Extreme business exposure and end date before July 2014. Business critical system
Maximizer High Poor Jan 2014 $0.15M To be decommissioned 31/12/12
DET DETE Extreme business exposure and end date before July 2014. Business critical system
VET Systems Reporting (VSR) High Poor Jan 2012 $0.2M To be decommissioned
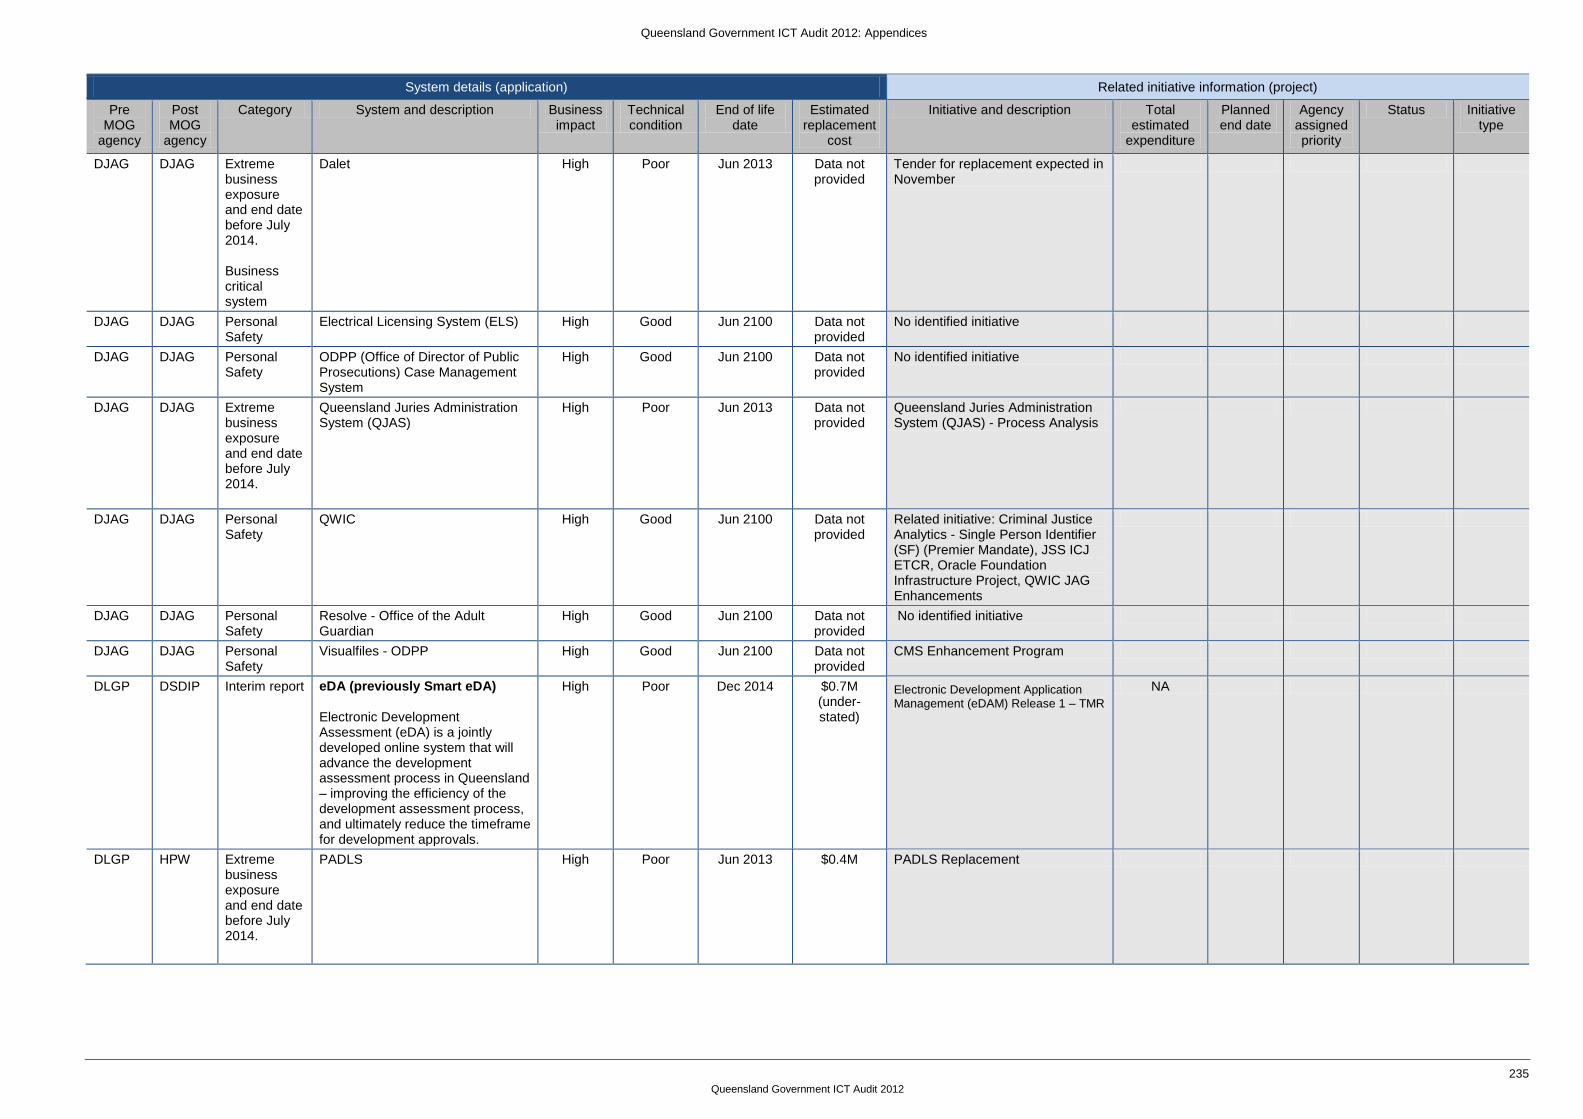
Queensland Government ICT Audit 2012: Appendices
235
Queensland Government ICT Audit 2012
System details (application) Related initiative information (project)
Pre MOG
agency
Post MOG
agency
Category System and description Business impact
Technical condition
End of life date
Estimated replacement
cost
Initiative and description Total estimated
expenditure
Planned end date
Agency assigned priority
Status Initiative type
DJAG DJAG Extreme business exposure and end date before July 2014. Business critical system
Dalet High Poor Jun 2013 Data not provided
Tender for replacement expected in November
DJAG DJAG Personal Safety
Electrical Licensing System (ELS) High Good Jun 2100 Data not provided
No identified initiative
DJAG DJAG Personal Safety
ODPP (Office of Director of Public Prosecutions) Case Management System
High Good Jun 2100 Data not provided
No identified initiative
DJAG DJAG Extreme business exposure and end date before July 2014.
Queensland Juries Administration System (QJAS)
High Poor Jun 2013 Data not provided
Queensland Juries Administration System (QJAS) - Process Analysis
DJAG DJAG Personal Safety
QWIC High Good Jun 2100 Data not provided
Related initiative: Criminal Justice Analytics - Single Person Identifier (SF) (Premier Mandate), JSS ICJ ETCR, Oracle Foundation Infrastructure Project, QWIC JAG Enhancements
DJAG DJAG Personal Safety
Resolve - Office of the Adult Guardian
High Good Jun 2100 Data not provided
No identified initiative
DJAG DJAG Personal Safety
Visualfiles - ODPP High Good Jun 2100 Data not provided
CMS Enhancement Program
DLGP DSDIP Interim report eDA (previously Smart eDA) Electronic Development Assessment (eDA) is a jointly developed online system that will advance the development assessment process in Queensland – improving the efficiency of the development assessment process, and ultimately reduce the timeframe for development approvals.
High Poor Dec 2014 $0.7M (under-stated)
Electronic Development Application Management (eDAM) Release 1 – TMR
NA
DLGP HPW Extreme business exposure and end date before July 2014.
PADLS High Poor Jun 2013 $0.4M PADLS Replacement

Queensland Government ICT Audit 2012: Appendices
236
Queensland Government ICT Audit 2012
System details (application) Related initiative information (project)
Pre MOG
agency
Post MOG
agency
Category System and description Business impact
Technical condition
End of life date
Estimated replacement
cost
Initiative and description Total estimated
expenditure
Planned end date
Agency assigned priority
Status Initiative type
DoC DCCSDS Interim report Extreme business exposure Personal Safety
Carepay Foster carer payments system that provides for the calculation of foster carer payments in respect to the placement of children including respite care.
High Poor Jan 2010 $1M Carepay Program The Carepay system is the system utilised for Foster and Kinship Carer allowances. The system has been identified through the ICT Baseline process as a candidate for replacement due to the age and risk associated with its underlying platform.
$3.4M Jun 2013 High On-hold / postponed Progress at 30% complete – during managing program tranches
Program
DoC DCCSDS Interim report Personal Safety
Business Information System (BIS) Formerly known as DISQIS. A client information management system to support, measure and report on service delivery and the management of information about people with a disability, family and contacts, providers and funding.
High Good Dec 2012 $44M Stronger Information Program (SIP) This is an over-arching Disability Services program which aims to determine the effectiveness of the existing and planned information management systems, departmental capacity and processes. Incorporates AS&RS Service Management System.
$60M Jun 2013 High On-hold / postponed Progress at 80% complete – in delivery stage Awaitingfunding approval
Program
DoC DCCSDS Interim report Personal Safety
Integrated Client Management System (ICMS) A state-wide database managing detailed assessment and casework information on children, young people and their families, who have contact with the child protection system. ICMS also supports: the management of children and young people placed in foster care; and the youth justice function.
High Good Dec 2019 $45.5M Core Application Management Program (CAMP) The Core Applications Management Program is established to enable an integrated future direction to support business systems, processes and services. All projects on hold and include:
ICMS Forms Roadmap & Replacement ($1.1m forecasted current FY expenditure)
complex Cold Fusion Replacements
server Hosted Development Environment
integration Platform Expansion.
$1.3M Jun 2015
Critical On-hold Progress at 50% complete – during managing program tranches Awaiting funding approval
Program
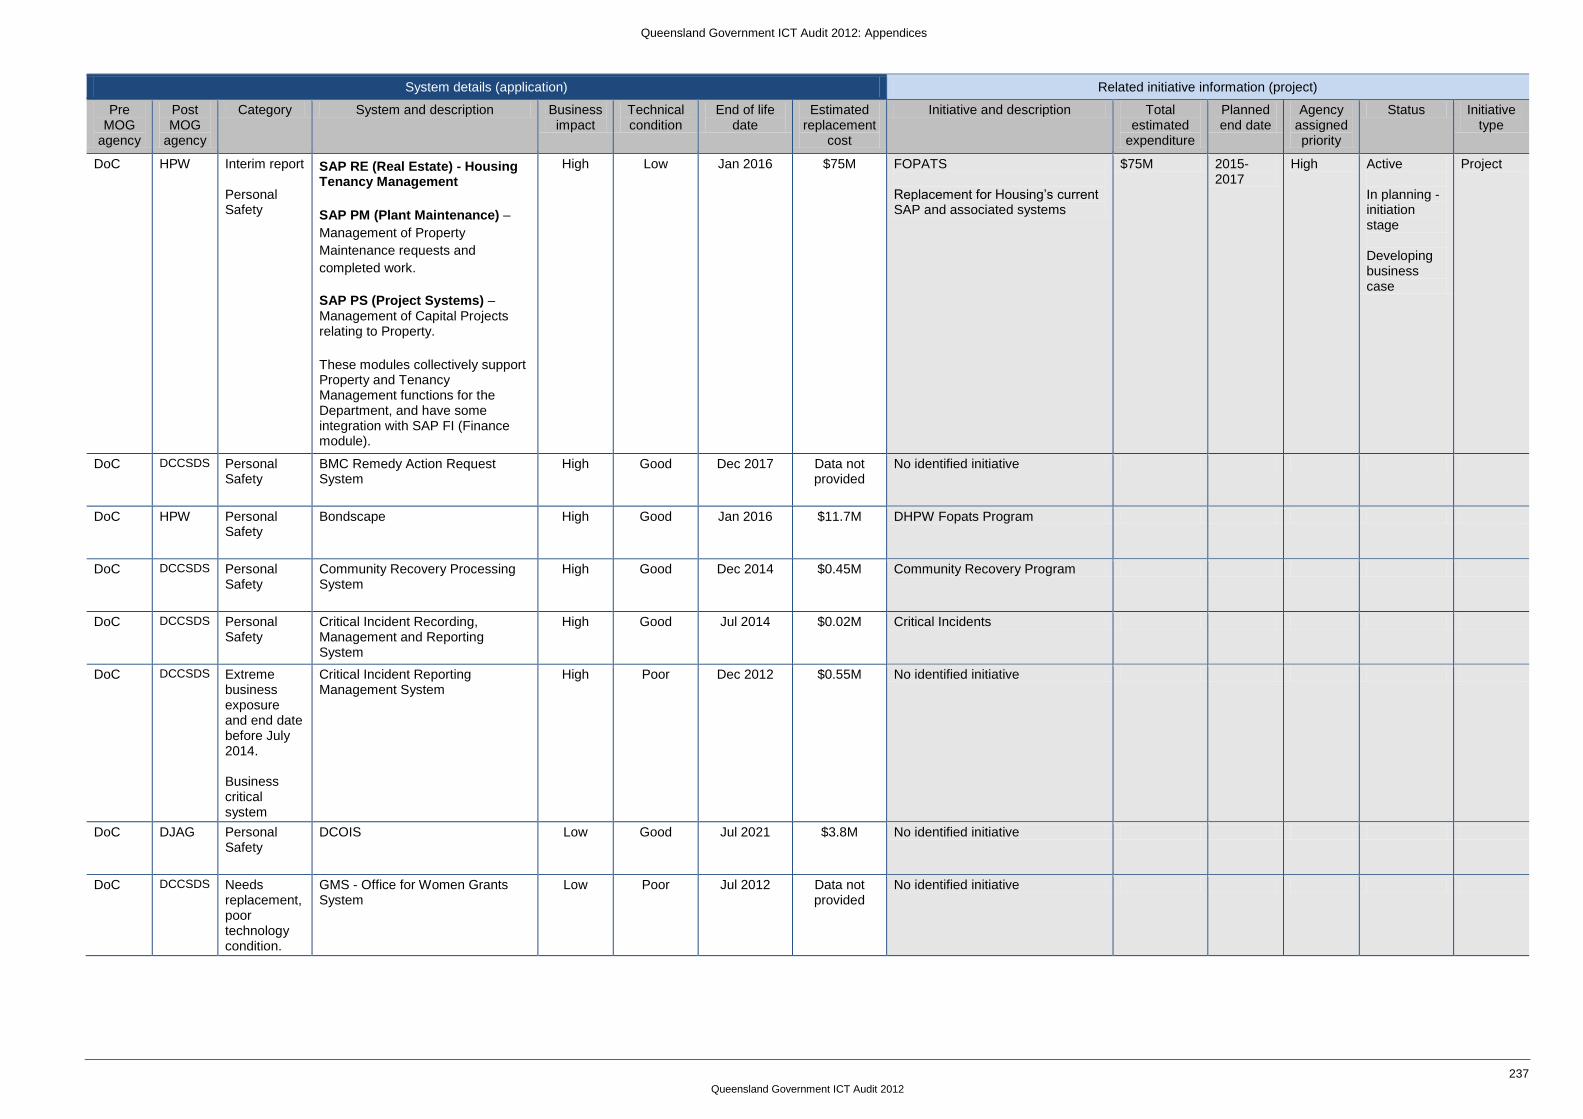
Queensland Government ICT Audit 2012: Appendices
237
Queensland Government ICT Audit 2012
System details (application) Related initiative information (project)
Pre MOG
agency
Post MOG
agency
Category System and description Business impact
Technical condition
End of life date
Estimated replacement
cost
Initiative and description Total estimated
expenditure
Planned end date
Agency assigned priority
Status Initiative type
DoC HPW Interim report Personal Safety
SAP RE (Real Estate) - Housing Tenancy Management
SAP PM (Plant Maintenance) –
Management of Property
Maintenance requests and
completed work.
SAP PS (Project Systems) – Management of Capital Projects relating to Property.
These modules collectively support Property and Tenancy Management functions for the Department, and have some integration with SAP FI (Finance module).
High Low Jan 2016 $75M FOPATS Replacement for Housing‘s current SAP and associated systems
$75M 2015-2017
High Active In planning - initiation stage Developing business case
Project
DoC DCCSDS Personal Safety
BMC Remedy Action Request System
High Good Dec 2017 Data not provided
No identified initiative
DoC HPW Personal Safety
Bondscape High Good Jan 2016 $11.7M DHPW Fopats Program
DoC DCCSDS Personal Safety
Community Recovery Processing System
High Good Dec 2014 $0.45M Community Recovery Program
DoC DCCSDS Personal Safety
Critical Incident Recording, Management and Reporting System
High Good Jul 2014 $0.02M Critical Incidents
DoC DCCSDS Extreme business exposure and end date before July 2014. Business critical system
Critical Incident Reporting Management System
High Poor Dec 2012 $0.55M No identified initiative
DoC DJAG Personal Safety
DCOIS Low Good Jul 2021 $3.8M No identified initiative
DoC DCCSDS Needs replacement, poor technology condition.
GMS - Office for Women Grants System
Low Poor Jul 2012 Data not provided
No identified initiative

Queensland Government ICT Audit 2012: Appendices
238
Queensland Government ICT Audit 2012
System details (application) Related initiative information (project)
Pre MOG
agency
Post MOG
agency
Category System and description Business impact
Technical condition
End of life date
Estimated replacement
cost
Initiative and description Total estimated
expenditure
Planned end date
Agency assigned priority
Status Initiative type
DoC DATSIMA Extreme business exposure and end date before July 2014.
Grants Administration System High Poor Jul 2012 $0.6M No identified initiative
DoC DCCSDS Needs replacement, no identified initiative, poor technology condition.
Grants Budget System Low Poor Jul 2012 Data not provided
No identified initiative
DoC DCCSDS Extreme business exposure and end date before July 2014.
Grants Management System High Poor Jul 2012 $1.6M No identified initiative
DoC DCCSDS Personal Safety
IJIS/EMMA High Good Jan 2019 $1.8M No identified initiative
DoC HPW Personal Safety
Loanscape High Good Jan 2015 $2.5M DHPW Fopats Program
DoC HPW Personal Safety
PRIME High Good Dec 2015 $0.8M DHPW Fopats Program
DoC DJAG Personal Safety
QUEST Low Good Dec 2012 $0.1M No identified initiative
DoC DCCSDS Personal Safety
Shift Worker Employee Allowance Payments
High Poor Nov 2009 $0.6M Service provided by QSS
DPW HPW Personal Safety
BEMIR High Good Jul 2015 $4M BEMIR Re-Development/Replacement
DPW HPW Extreme business exposure and end date before July 2014. Business critical system
CARS+ High Poor Jul 2013 $0.1M No identified initiative
DPW HPW Extreme business exposure and end date before July 2014.
Maximise High Poor Jul 2013 $0.08M Will be decommissioned

Queensland Government ICT Audit 2012: Appendices
239
Queensland Government ICT Audit 2012
System details (application) Related initiative information (project)
Pre MOG
agency
Post MOG
agency
Category System and description Business impact
Technical condition
End of life date
Estimated replacement
cost
Initiative and description Total estimated
expenditure
Planned end date
Agency assigned priority
Status Initiative type
QH QH Interim report Personal Safety
AUSCARE A web-based clinical diagnostic reports viewer based on the AUSLAB system. It is designed to provide easy access for clinicians across QH.
High Medium Jun 2016 $5M LISS Replacement Procurement and Implementation. AUSLAB system replacement includes a major procurement process and rollout across the state. Health Services Support Agency (HSSA) is currently finalising detailed ICT planning activities including the development of an ICT Investment Roadmap for the next 4 years. It is anticipated that additional investment opportunities will be identified to address key priorities which may include further enhancements to AUSCARE/AUSLAB. AUSCARE and AUSLAB are key critical clinical systems which support pathology and other clinical services state-wide.
$131M Jun 2016 High Planning stage Project has approved funding for $64,426
Project
QH QH Interim report Personal Safety
AUSLAB AUSLAB is a laboratory information system used by Pathology, Forensic and Population Health departments for results reporting and management. This clinical & scientific information system provides workflow management; allows for analytical instrument interfacing; provides for standardised reporting; allows for billing and information management and accommodates extended database queries. (refer Appendix A for further detail)
High Medium Jun 2020 $131M
QH QH Interim report Integrated electronic Medical Record (IeMR) – aka Cerner Originally reported in the 30 Day Report – under development as part of a current initiative. A commercial-off-the shelf integrated eMR solution from Cerner Corporation. The arrangement is expected to apply to Queensland Health state-wide and underpin the ongoing transition from a paper based medical record to an electronic Medical Record (eMR). Cerner Corporation is also establishing a Queensland based hosting service for the eMR software and related services.
Not applicable – under development as part of a current initiative.
ieMR (Integrated electronic Medical Record) Program
The ieMR Program will deliver an authoritative single source of the patient record across the State. It will provide clinicians with the ability to:
access information that is integrated, accurate and clinically relevant
support decision making and better use of information
optimise management of patients, resources and provision of services
deliver location independent diagnostic and treatment services
support interaction across a network of providers that enables providers to be located, information to be transferred and multidisciplinary providers to collaborate.
$179.6M Dec 2014 High Active In progress –managing program tranches Fullyfunded
Program

Queensland Government ICT Audit 2012: Appendices
240
Queensland Government ICT Audit 2012
System details (application) Related initiative information (project)
Pre MOG
agency
Post MOG
agency
Category System and description Business impact
Technical condition
End of life date
Estimated replacement
cost
Initiative and description Total estimated
expenditure
Planned end date
Agency assigned priority
Status Initiative type
QH QH Interim report Personal Safety
Hospital Based Corporate Information System (HBCIS) A patient administration system that includes: patient demographics; patient admissions, transfers and discharges; and patient appointments and scheduling
High Good Sep 2015 $250M QPAS - Replacement / Upgrade of Queensland Patient Administration System (HBCIS) HBCIS (Hospital Based Corporate Information System) is the current Patient Administration System (PAS) for Queensland Health and the primary system for registering and managing all patients. It is the largest corporate information system in use in Queensland Health. Activity for HBCIS Consolidation and Disaster Recovery also reported.
$438.8M Unknown (early
stages)
Critical Not started Pre project stage Proposedfunding
Project
QH QH Interim report Queensland Health payroll solution Included for completeness sake – originally reported in the 30 Day Report, however it is out of scope for the current ICT audit. HR/payroll and financial solution based on SAP
High Good Dec 2010 $40M (potentially
under reported)
QH payroll solution out of scope of audit Related QSS projects:
Queensland Health HR Technical Separation Project.
Queensland Health Transition Project.
QH QH Business critical systems
Finance business solution (FAMMIS) Finance and Materials Management Information System.
High Good Jun 2012 $4.1M (based on application
as a service)
SAP Assets Procurement
Finance Information Resource
(SAPFIR) Project
$80M Jun 2014 High Active
In progress – delivery stage
Fully funded
Project
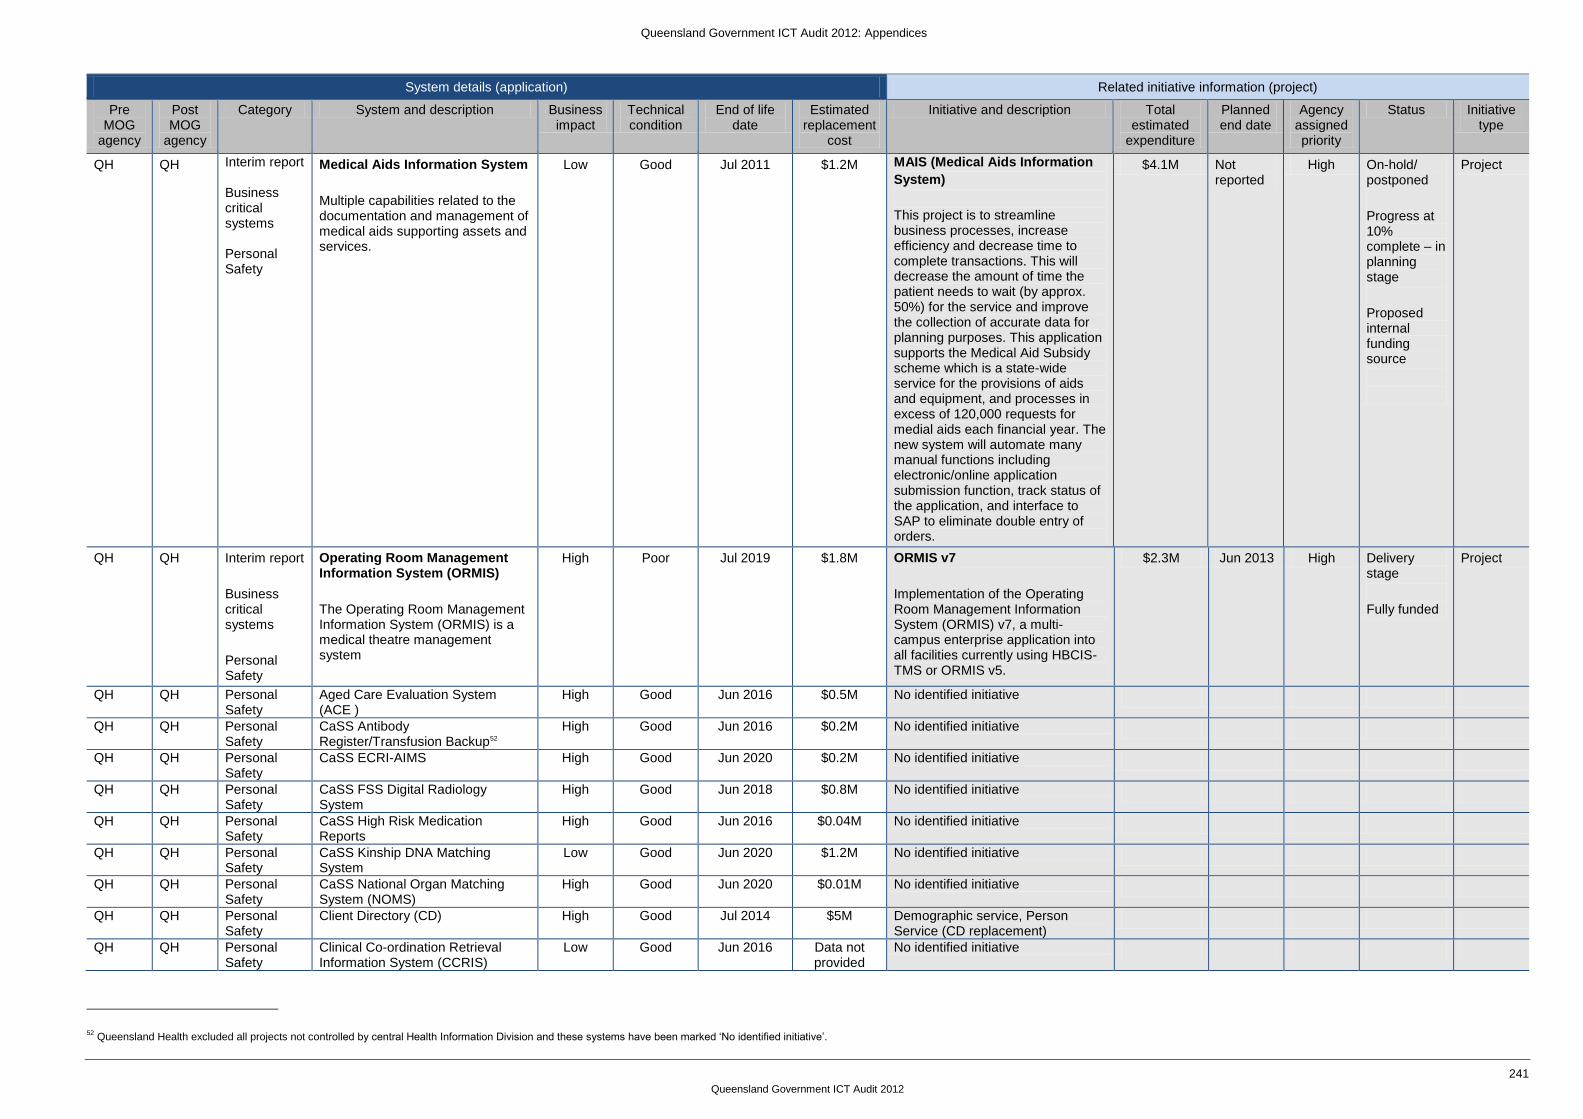
Queensland Government ICT Audit 2012: Appendices
241
Queensland Government ICT Audit 2012
System details (application) Related initiative information (project)
Pre MOG
agency
Post MOG
agency
Category System and description Business impact
Technical condition
End of life date
Estimated replacement
cost
Initiative and description Total estimated
expenditure
Planned end date
Agency assigned priority
Status Initiative type
QH QH Interim report Business critical systems Personal Safety
Medical Aids Information System
Multiple capabilities related to the documentation and management of medical aids supporting assets and services.
Low Good Jul 2011 $1.2M MAIS (Medical Aids Information
System)
This project is to streamline business processes, increase efficiency and decrease time to complete transactions. This will decrease the amount of time the patient needs to wait (by approx. 50%) for the service and improve the collection of accurate data for planning purposes. This application supports the Medical Aid Subsidy scheme which is a state-wide service for the provisions of aids and equipment, and processes in excess of 120,000 requests for medial aids each financial year. The new system will automate many manual functions including electronic/online application submission function, track status of the application, and interface to SAP to eliminate double entry of orders.
$4.1M Not reported
High On-hold/ postponed
Progress at 10% complete – in planning stage
Proposed internal funding source
Project
QH QH Interim report
Business critical systems
Personal Safety
Operating Room Management Information System (ORMIS)
The Operating Room Management Information System (ORMIS) is a medical theatre management system
High Poor Jul 2019 $1.8M ORMIS v7
Implementation of the Operating Room Management Information System (ORMIS) v7, a multi-campus enterprise application into all facilities currently using HBCIS-TMS or ORMIS v5.
$2.3M Jun 2013 High Delivery stage
Fully funded
Project
QH QH Personal Safety
Aged Care Evaluation System (ACE )
High Good Jun 2016 $0.5M No identified initiative
QH QH Personal Safety
CaSS Antibody Register/Transfusion Backup52
High Good Jun 2016 $0.2M No identified initiative
QH QH Personal Safety
CaSS ECRI-AIMS High Good Jun 2020 $0.2M No identified initiative
QH QH Personal Safety
CaSS FSS Digital Radiology System
High Good Jun 2018 $0.8M No identified initiative
QH QH Personal Safety
CaSS High Risk Medication Reports
High Good Jun 2016 $0.04M No identified initiative
QH QH Personal Safety
CaSS Kinship DNA Matching System
Low Good Jun 2020 $1.2M No identified initiative
QH QH Personal Safety
CaSS National Organ Matching System (NOMS)
High Good Jun 2020 $0.01M No identified initiative
QH QH Personal Safety
Client Directory (CD) High Good Jul 2014 $5M Demographic service, Person Service (CD replacement)
QH QH Personal Safety
Clinical Co-ordination Retrieval Information System (CCRIS)
Low Good Jun 2016 Data not provided
No identified initiative
52
Queensland Health excluded all projects not controlled by central Health Information Division and these systems have been marked ‗No identified initiative‘.

Queensland Government ICT Audit 2012: Appendices
242
Queensland Government ICT Audit 2012
System details (application) Related initiative information (project)
Pre MOG
agency
Post MOG
agency
Category System and description Business impact
Technical condition
End of life date
Estimated replacement
cost
Initiative and description Total estimated
expenditure
Planned end date
Agency assigned priority
Status Initiative type
QH QH Personal Safety
Clinical Decision Support System (CDSS)
High Good Jul 2012 $0.5M No identified initiative
QH QH Personal Safety
Consumer Integrated Mental Health Application (CIMHA)
High Good Jul 2018 $7.8M Consumer Integrated Mental Health Application (CIMHA) Phase II
QH QH Personal Safety
Emergency Department Information System (EDIS v9)
High Good Dec 2019 $2.1M No identified initiative
QH QH Personal Safety
Enterprise Liaison Medication System (eLMS )
High Good Jun 2016 $0.6M No identified initiative
QH QH Personal Safety
Enterprise PACS High Good Data not provided
Data not provided
Digital Image Service
QH QH Personal Safety
Environmental Health Information Network (EHInfoNet)
High Good Jun 2014 $0.2M No identified initiative
QH QH Personal Safety
ICU Bed Availability Register (ICUBED)
High Good Jun 2015 $0.25M No identified initiative
QH QH Personal Safety
ICUIS High Good Jul 2036 $10M ICU CIS (Intensive Care Unit Clinical Information System) Stage 1
$11.3M Nov 2013 Active
In progress – delivery stage
Fully internally funded
Project
QH QH Personal Safety
Monitoring of Drugs of Dependence System (MODDS )
High Good Jun 2012 $3M No identified initiative
QH QH Personal Safety
Notifiable Conditions System (NOCS )
High Good May 2012 $5M No identified initiative
QH QH Personal Safety
Pap Smear Register (PSR) High Good Jul 2012 $3.5M No identified initiative
QH QH Personal Safety
Queensland Radiology Information System (QRiS)
High Good Jun 2016 $0.19M Digital Image Service, Enterprise Provider Directory Release 2
QH QH Personal Safety
Surgical Access Team Reporting (SATR)
High Good Jun 2016 $0.4M No identified initiative
QH QH Extreme business exposure and end date before July 2014. Business critical system
Travel Manager Queensland Health Travel Information System
High Poor Jul 2010 $0.49M Com-Pair Interface Tool Hosting of Application on SSI Domain
QPS QPS Interim report Personal Safety
Weapons Licencing Management System (WLMS)53 A new weapons licensing system which is planned to be delivered in three stages (2009 through 2015) with a view to streamlining processes and providing efficiency of service to licence holders, firearm dealers and shooting clubs.
Not reported
Not reported
Jan 2018 $4.2M Weapons Licensing Management System The WLMS Project is implementing a new weapons licensing system which is planned to be delivered in three stages with a view to streamlining processes and providing efficiency of service to licence holders, firearm dealers and shooting clubs.
$19.6M Aug 2012 High Active In progress – delivery stage Fully internally funded
Project
53
QPS have since provided clarification that has not been analysed.

Queensland Government ICT Audit 2012: Appendices
243
Queensland Government ICT Audit 2012
System details (application) Related initiative information (project)
Pre MOG
agency
Post MOG
agency
Category System and description Business impact
Technical condition
End of life date
Estimated replacement
cost
Initiative and description Total estimated
expenditure
Planned end date
Agency assigned priority
Status Initiative type
QPS QPS Personal Safety
COMFIT54 High Good Jan 1900 $0.1M No identified initiative
QPS QPS Personal Safety
Forensics Register High Good Jan 2015 $3M No identified initiative
QPS QPS Personal Safety
Policelink Customer Relationship Management (CRM)55
Data not provided
Good Jan 2018 $3M No identified initiative
QPS QPS Personal Safety
QCAD56 Data not provided
Good Dec 2021 $34.5M No identified initiative
QPS QPS Personal Safety
QPRIME High Good Jun 2025 $53.8M Enhance QPRIME User Interface - Mobile Services (including Automatic Number Plate Recognition (ANPR)) - Technology Refresh & Improvement Program (TRIP)
QPS QPS Personal Safety
QPRIME Mapping High Good Jan 2018 $1.5M Enhance QPRIME User Interface - Mobile Services (including Automatic Number Plate Recognition (ANPR)) - Technology Refresh & Improvement Program (TRIP)
QPS QPS Personal Safety
Traffic Camera Scheduling & Reporting System (TSRS)
High Good Jan 2012 $0.85M TMR program: CDOP Intelligent Traffic Camera System (I-TCS)
$35M May 2013 High Active In progress – managing program tranches Fully externally funded
Program
QPS QPS Interim report Business critical systems Personal Safety
Incident Management System (IMS) IMS is a computer aided dispatch system. It is used for the recording and management of the response to requests for police assistance.
High Poor Jun 2013 $5M Computer Aided Dispatch (CAD) Replace Computer Aided Dispatch (CAD) system(s) currently operational in the seven scoped Police Communications Centres (PCCs) with a modern, integrated and highly reliable CAD solution providing state-wide coverage on a single platform
$35.1M Jun 2013 Critical Active In progress – delivery stage Fully internally funded
Project
54
QPS have since provided clarification that has not been analysed. 55
QPS have since provided clarification that has not been analysed. 56
QPS have since provided clarification that has not been analysed.
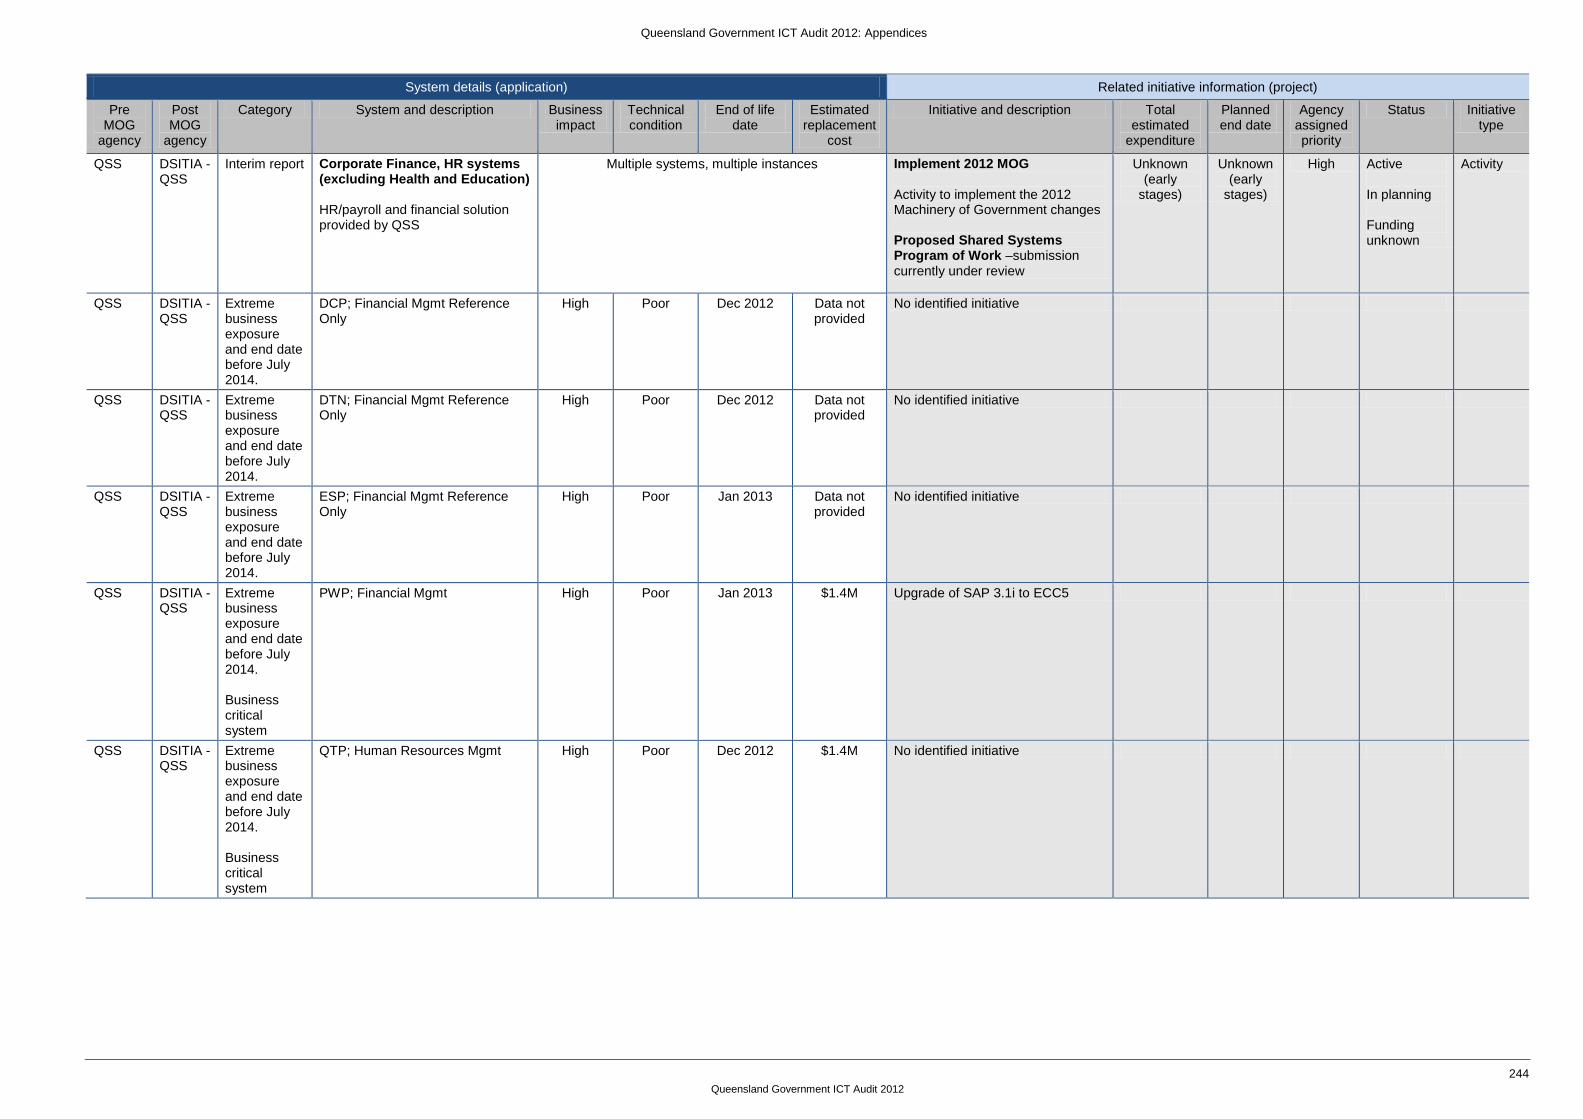
Queensland Government ICT Audit 2012: Appendices
244
Queensland Government ICT Audit 2012
System details (application) Related initiative information (project)
Pre MOG
agency
Post MOG
agency
Category System and description Business impact
Technical condition
End of life date
Estimated replacement
cost
Initiative and description Total estimated
expenditure
Planned end date
Agency assigned priority
Status Initiative type
QSS DSITIA - QSS
Interim report Corporate Finance, HR systems (excluding Health and Education) HR/payroll and financial solution provided by QSS
Multiple systems, multiple instances Implement 2012 MOG Activity to implement the 2012 Machinery of Government changes Proposed Shared Systems Program of Work –submission currently under review
Unknown (early
stages)
Unknown (early
stages)
High Active In planning Funding unknown
Activity
QSS DSITIA - QSS
Extreme business exposure and end date before July 2014.
DCP; Financial Mgmt Reference Only
High Poor Dec 2012 Data not provided
No identified initiative
QSS DSITIA - QSS
Extreme business exposure and end date before July 2014.
DTN; Financial Mgmt Reference Only
High Poor Dec 2012 Data not provided
No identified initiative
QSS DSITIA - QSS
Extreme business exposure and end date before July 2014.
ESP; Financial Mgmt Reference Only
High Poor Jan 2013 Data not provided
No identified initiative
QSS DSITIA - QSS
Extreme business exposure and end date before July 2014. Business critical system
PWP; Financial Mgmt High Poor Jan 2013 $1.4M Upgrade of SAP 3.1i to ECC5
QSS DSITIA - QSS
Extreme business exposure and end date before July 2014. Business critical system
QTP; Human Resources Mgmt High Poor Dec 2012 $1.4M No identified initiative
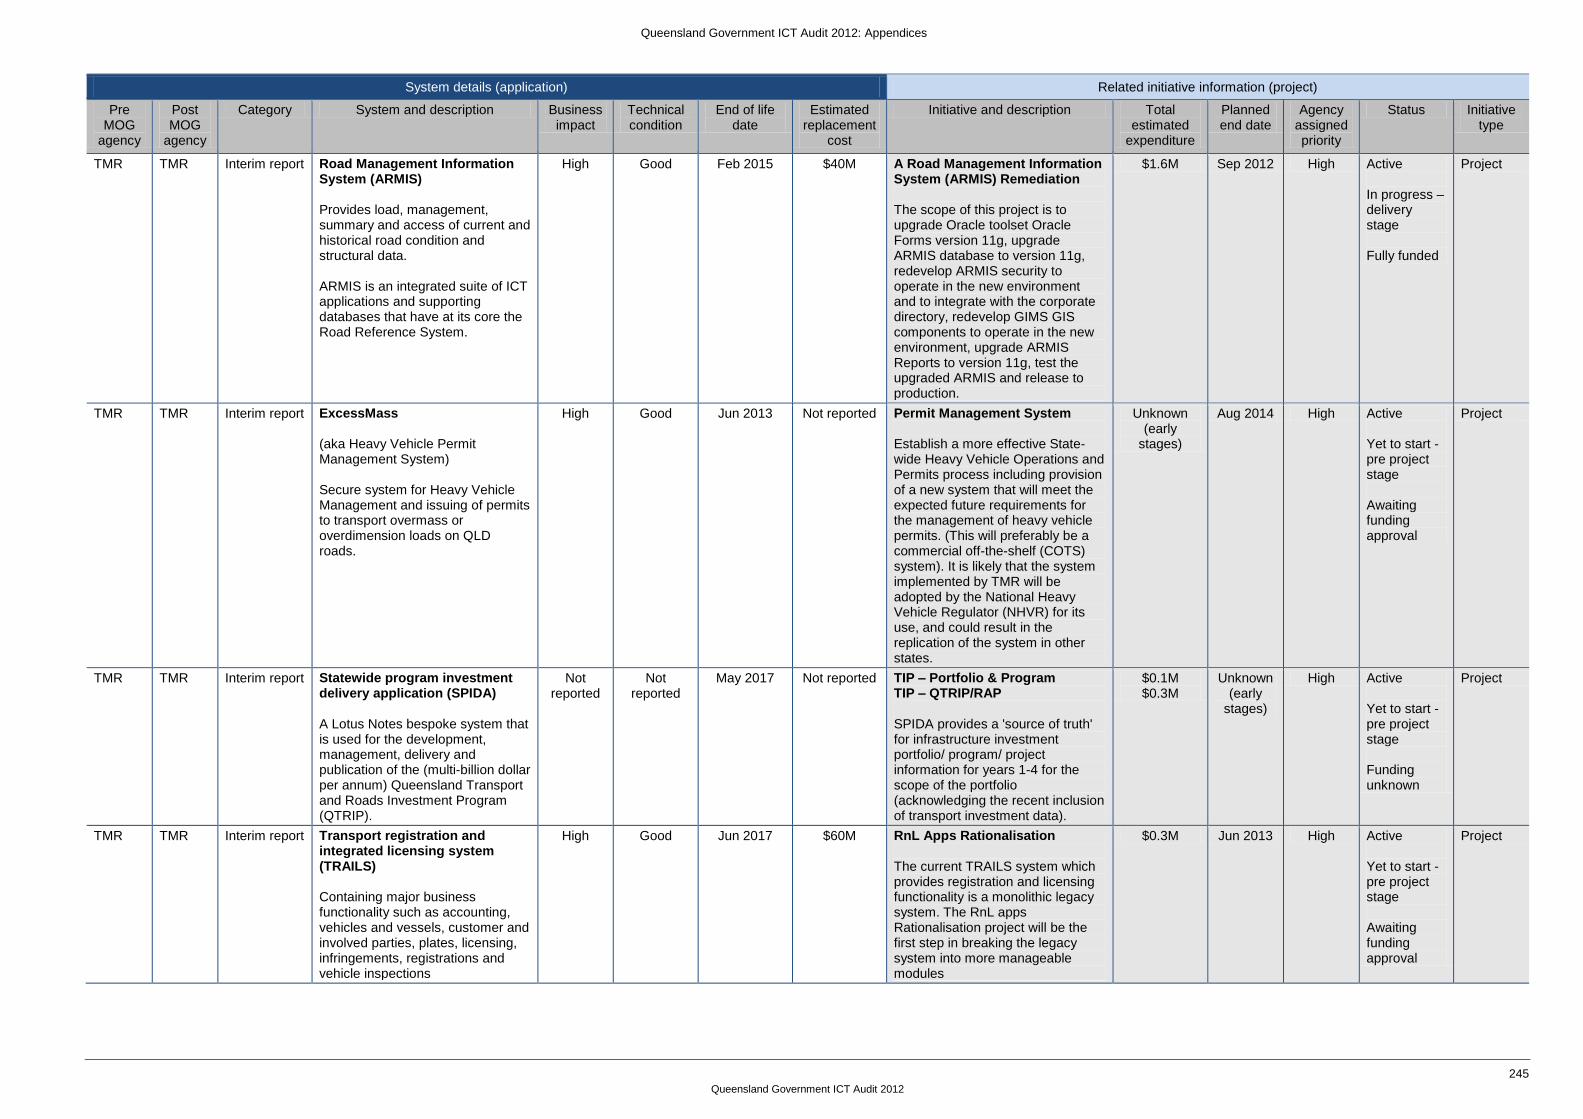
Queensland Government ICT Audit 2012: Appendices
245
Queensland Government ICT Audit 2012
System details (application) Related initiative information (project)
Pre MOG
agency
Post MOG
agency
Category System and description Business impact
Technical condition
End of life date
Estimated replacement
cost
Initiative and description Total estimated
expenditure
Planned end date
Agency assigned priority
Status Initiative type
TMR TMR Interim report Road Management Information System (ARMIS) Provides load, management, summary and access of current and historical road condition and structural data. ARMIS is an integrated suite of ICT applications and supporting databases that have at its core the Road Reference System.
High Good Feb 2015 $40M A Road Management Information System (ARMIS) Remediation The scope of this project is to upgrade Oracle toolset Oracle Forms version 11g, upgrade ARMIS database to version 11g, redevelop ARMIS security to operate in the new environment and to integrate with the corporate directory, redevelop GIMS GIS components to operate in the new environment, upgrade ARMIS Reports to version 11g, test the upgraded ARMIS and release to production.
$1.6M Sep 2012 High Active In progress – delivery stage Fully funded
Project
TMR TMR Interim report ExcessMass (aka Heavy Vehicle Permit Management System) Secure system for Heavy Vehicle Management and issuing of permits to transport overmass or overdimension loads on QLD roads.
High Good Jun 2013 Not reported Permit Management System Establish a more effective State-wide Heavy Vehicle Operations and Permits process including provision of a new system that will meet the expected future requirements for the management of heavy vehicle permits. (This will preferably be a commercial off-the-shelf (COTS) system). It is likely that the system implemented by TMR will be adopted by the National Heavy Vehicle Regulator (NHVR) for its use, and could result in the replication of the system in other states.
Unknown (early
stages)
Aug 2014 High Active Yet to start - pre project stage Awaiting funding approval
Project
TMR TMR Interim report Statewide program investment delivery application (SPIDA) A Lotus Notes bespoke system that is used for the development, management, delivery and publication of the (multi-billion dollar per annum) Queensland Transport and Roads Investment Program (QTRIP).
Not reported
Not reported
May 2017 Not reported TIP – Portfolio & Program TIP – QTRIP/RAP SPIDA provides a 'source of truth' for infrastructure investment portfolio/ program/ project information for years 1-4 for the scope of the portfolio (acknowledging the recent inclusion of transport investment data).
$0.1M $0.3M
Unknown (early
stages)
High Active Yet to start - pre project stage Funding unknown
Project
TMR TMR Interim report Transport registration and integrated licensing system (TRAILS) Containing major business functionality such as accounting, vehicles and vessels, customer and involved parties, plates, licensing, infringements, registrations and vehicle inspections
High Good Jun 2017 $60M RnL Apps Rationalisation The current TRAILS system which provides registration and licensing functionality is a monolithic legacy system. The RnL apps Rationalisation project will be the first step in breaking the legacy system into more manageable modules
$0.3M Jun 2013 High Active Yet to start - pre project stage Awaiting funding approval
Project

Queensland Government ICT Audit 2012: Appendices
246
Queensland Government ICT Audit 2012
System details (application) Related initiative information (project)
Pre MOG
agency
Post MOG
agency
Category System and description Business impact
Technical condition
End of life date
Estimated replacement
cost
Initiative and description Total estimated
expenditure
Planned end date
Agency assigned priority
Status Initiative type
TMR TMR Interim report Asset Management & Maintenance System (AMMS) AMMS is a bespoke system that is used for the management of asset maintenance backlog information, scheduling of work and data to update the Asset Management System (ARMIS), remit against schedules to allow payment to and by RoadTek and some local authorities across the state.
High Good Dec 2012 $0.9M Transport Infrastructure Asset Management System (TIAMS) The TIAM function does not have a comprehensively defined framework to provide coherence to the future development of TIAMS. The existing departmental asset management systems have limited life and expansion capability, and asset managers are highly dependent on system capability to deliver reliable information and analysis, in a timely manner.
$3.1M Unknown (early
stages)
High Active Yet to start - pre project stage Awaiting funding approval
Project
Treasury QTT Interim report TriData The Queensland Government‘s primary budgeting and reporting system. Consisting of a number of modules, it is designed to meet all of Treasury's financial management requirements under an accrual accounting environment.
High Good Dec 2009 $5M Tridata review Business review of Tridata system and reporting. The objective of the review is to:
redesign a framework for the reporting system
to build a new server side process and a new web based front-end
to permanently remove Microsoft Access as part of the Tridata development tool set
to provide a new development platform to customise new reports
$0.2M Unknown (early
stages)
Not reported
On-hold Yet to start Fully funded
Activity (finite duration)

Queensland Government ICT Audit 2012: Appendices
247
Queensland Government ICT Audit 2012
Appendix H – Agency initiative portfolio snapshots
This appendix highlights government initiative portfolios, including number of initiatives, expenditure and summary findings.
The snapshots start with whole-of-government and are then alphabetically ordered by agency name. Since the investment information
entails ‗forward‘ programs of work, current agency names are used (i.e. post machinery of government changes).

Queensland Government ICT Audit 2012: Appendices
248
Queensland Government ICT Audit 2012
Whole-of-Government
$2.465BForecast
expenditure
678Current and
proposed
initiatives
Active304 (45%)
$643M
Schedule overrun assessment77 (44%) projects > 3 month change in
planned end date
1 year average per project slip in time
potentially impacting value proposition
Not started207 (31%)
$1.7B
On hold/
postponed167 (25%)
$93M
Point in time snapshot as of 1 Sept 2012
All figures are based on agency estimates
Exposure assessment22 (13%) should ―act decisively‖
$87.4M (32%) potential expenditure at risk
27 (16%) reported high or extreme risk
Cost overrun assessment34 (19%) projects > 20% change in planned
expenditure
$28.5M (10%) expenditure not available for
other pipeline opportunities
Activities107, $52M
Projects175, $2.1B
Programs22, $338M
Value assessment38 (22%) should ―assess priority‖
$23.2M (8%) potential expenditure for
reallocation
Time to deliver assessment1.9 years average length of projects
30 (17%) projects > 3 years
Research and findings show that
initiatives which take more than
one year to deliver and initiatives
without business justification (e.g.
business cases) increase the
probability of:
Poor project outcomes (time or
cost overruns)
Poor use of government
resources
Pressure on project pipeline
(unmet demand)
Dis-benefits outweighing
benefits
Solution becoming unviable
over time
Whole-of-Government findings
show that there are opportunities
to: improve government‘s ability
to deliver value, make better use
of government resources, and
enable greater visibility of
investment information.
Summary assessment
Activities13, $7.2M
Projects193, $1.7M
Programs1, $ not reported
Activities39 $1.3M
Projects122, $75.9M
Programs6, $16.1M

Queensland Government ICT Audit 2012: Appendices
249
Queensland Government ICT Audit 2012
DCCSDS
$40.6MForecast
expenditure
40Current and
proposed
initiatives
Active6 (15%)
$1.4M
Schedule overrun assessment1 (50%) projects > 3 month change in
planned end date
0.25 year average per project slip in time
potentially impacting value proposition
Not started0
On hold/
postponed34 (85%)
$39.2M
Point in time snapshot as of 1 Sept 2012
All figures are based on agency estimates
Exposure assessment0 should ―act decisively‖
0 reported high or extreme risk
Cost overrun assessment0 projects > 20% change in planned
expenditure
Activities2, $0
Projects2, $141K
Programs2, $1.3M
Value assessment0 should ―assess priority‖
Time to deliver assessment2 years average length of projects
0 projects > 3 years
Overall agency findings show
that:
Compared with many other
agencies, the proportion of
initiatives on hold is much
greater than the sector
average
There is evidence of portfolio
prioritisation
Housing initiatives were not
reported
Notable initiatives include:
Child Safety Service
Improvement Program
(CSSIP) - initiative with
highest expenditure –
completed in August 2012
Document and Records
Management Program - on
hold initiative with highest
remaining expenditure
Summary assessment
Activities0
Projects0
Programs0
Activities11, $ not reported
Projects18, $23.1M
Programs5, $16.1M

Queensland Government ICT Audit 2012: Appendices
250
Queensland Government ICT Audit 2012
DCS
$137.5MForecast
expenditure
29Current and
proposed
initiatives
Active19 (66%)
$132.3M
Schedule overrun assessment6 (75%) projects > 3 month change in
planned end date
1 year average per project slip in time
potentially impacting value proposition
Not started0
On hold/
postponed10 (34%)
$5.2M
Point in time snapshot as of 1 Sept 2012
All figures are based on agency estimates
Exposure assessment1 (13%) should ―act decisively‖
$4.4M (18%) potential expenditure at risk
2 (26%) reported high or extreme risk
Cost overrun assessment2 (25%) projects > 20% change in planned
expenditure
$4.5M (19%) expenditure not available for
other pipeline opportunities
Activities8, $972K
Projects8, $24M
Programs3, $107M
Value assessment0 should ―assess priority‖
Time to deliver assessment2.5 years average length of projects
2 (25%) projects > 3 years
Overall agency findings show
that:
Decisions about initiative
prioritisation visible and
appear to be effective
Some initiatives reviewed
appear to be lacking
appropriate levels of rigour for
the level of exposure
Time to deliver appears above
the whole-of-Government
average
Notable initiatives include:
Lattice infrastructure
improvement project -
extreme exposure and critical
priority, highlighted as an
example portraying inter-
agency governance issues
HR business solution
program – recent CBRC
funding and high exposure
All hazards program - critical
priority
Triple zero - DCS‘s active
initiative with highest
expenditure
Summary assessment
Activities0
Projects0
Programs0
Activities3, $618K
Projects7, $4.6M
Programs0

Queensland Government ICT Audit 2012: Appendices
251
Queensland Government ICT Audit 2012
DETE
$59MForecast
expenditure
58Current and
proposed
initiatives
Active27 (47%)
$42M
Schedule overrun assessment12 (48%) projects > 3 month change in
planned end date
0.7 year average per project slip in time
potentially impacting value proposition
Not started3 (5%)
$3.9M
On hold/
postponed28 (48%)
$13.1M
Point in time snapshot as of 1 Sept 2012
All figures are based on agency estimates
Exposure assessment3 (12%) should ―act decisively‖
$2.1M (5%) potential expenditure at risk
6 (24%) reported high or extreme risk
Cost overrun assessment*10 (40%) projects > 20% change in planned
expenditure
$4.9M (12%) expenditure not available for
other pipeline opportunities
Activities2, $338K
Projects25, $41.7M
Programs0
Value assessment5 (20%) should ―assess priority‖
$4.6M (11%) potential expenditure for
reallocation
Time to deliver assessment2 years average length of projects
4 (16%) projects > 3 years
Overall agency findings show
that:
Prioritisation appears to be
working well
As the total budget is
managed at the portfolio level,
these are not considered by
DETE as project cost
overruns*
Notable initiatives include:
TSS payroll refresh -
highlighted as example of
good project rigour
ERP6 project - highest cost
initiative
International students
management system (ISMS)
- was assessed with an overall
low result due to four out of
five assessments scoring low
Summary assessment
Activities0
Projects3, $3.9M
Programs0
Activities3, $ not reported
Projects25, $13.1M
Programs0

Queensland Government ICT Audit 2012: Appendices
252
Queensland Government ICT Audit 2012
DJAG
$47MForecast
expenditure
87Current and
proposed
initiatives
Active50 (57%)
$26M
Schedule overrun assessment5 (63%) projects > 3 month change in
planned end date
0.9 year average per project slip in time
potentially impacting value proposition
Not started9 (10%)
$17.4M
On hold/
postponed28 (32%)
$3.6M
Point in time snapshot as of 1 Sept 2012
All figures are based on agency estimates
Exposure assessment2 (25%) should ―act decisively‖
$2M (12%) potential expenditure at risk
3 (38%) reported high or extreme risk
Cost overrun assessment1 (13%) projects > 20% change in planned
expenditure
$169K (1%) expenditure not available for
other pipeline opportunities
Activities37, $260K
Projects8, $16.4M
Programs5, $9.4M
Value assessment0 should ―assess priority‖
Time to deliver assessment2.7 years average length of projects
4 (50%) projects > 3 years
Overall agency findings show
that:
There is a pattern of schedule
overruns
Decisions about prioritisation
not visible, although aware of
the business being involved
with prioritisation
BAU type activities (including
IM) are a large part of DJAG‘s
change agenda
Notable initiatives include:
Youth justice program –
transferred from DoC; initiative
closed in late July; now
considered BAU
BDM digitisation project -
DJAG‘s initiative with highest
expenditure
Summary assessment
Activities0
Projects9, $17.4M
Programs0
Activities12, $70K
Projects15, $3.5M
Programs1, $ not reported
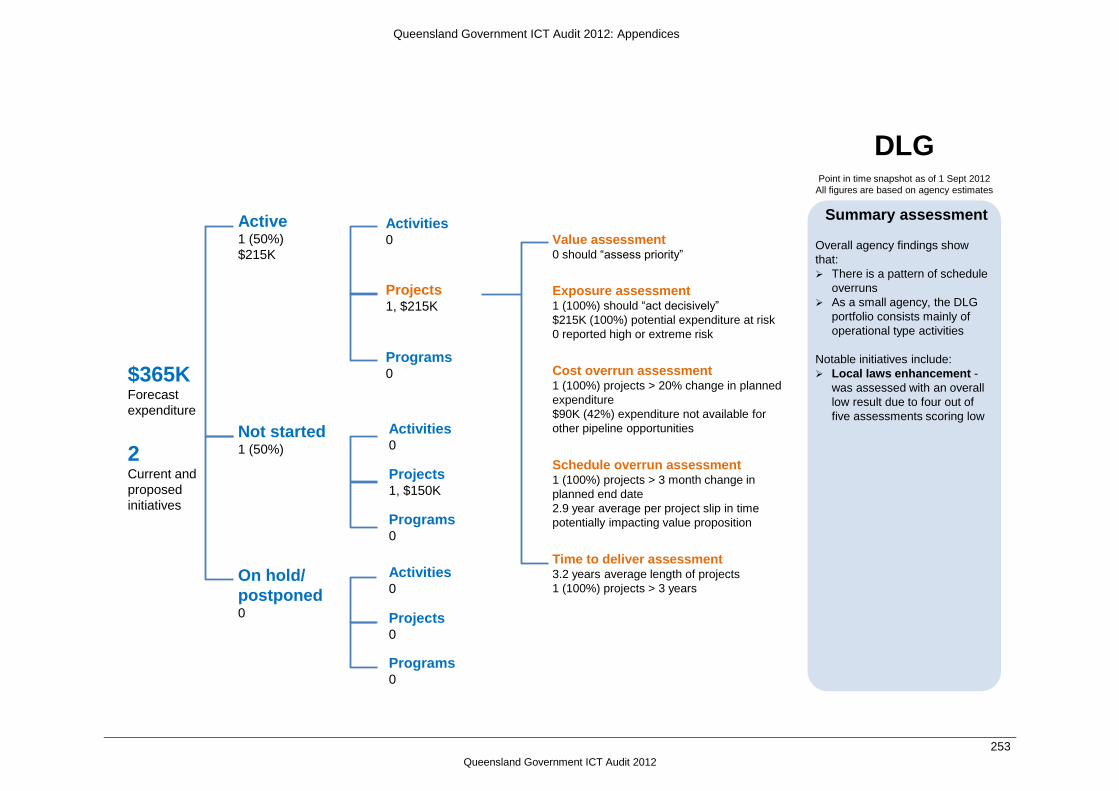
Queensland Government ICT Audit 2012: Appendices
253
Queensland Government ICT Audit 2012
$365KForecast
expenditure
2Current and
proposed
initiatives
Active1 (50%)
$215K
Schedule overrun assessment1 (100%) projects > 3 month change in
planned end date
2.9 year average per project slip in time
potentially impacting value proposition
Not started1 (50%)
On hold/
postponed0
Point in time snapshot as of 1 Sept 2012
All figures are based on agency estimates
Exposure assessment1 (100%) should ―act decisively‖
$215K (100%) potential expenditure at risk
0 reported high or extreme risk
Cost overrun assessment1 (100%) projects > 20% change in planned
expenditure
$90K (42%) expenditure not available for
other pipeline opportunities
Activities0
Projects1, $215K
Programs0
Value assessment0 should ―assess priority‖
Time to deliver assessment3.2 years average length of projects
1 (100%) projects > 3 years
DLG
Overall agency findings show
that:
There is a pattern of schedule
overruns
As a small agency, the DLG
portfolio consists mainly of
operational type activities
Notable initiatives include:
Local laws enhancement -
was assessed with an overall
low result due to four out of
five assessments scoring low
Summary assessment
Activities0
Projects1, $150K
Programs0
Activities0
Projects0
Programs0

Queensland Government ICT Audit 2012: Appendices
254
Queensland Government ICT Audit 2012
$4.4MForecast
expenditure
3Current and
proposed
initiatives
Active2 (67%)
$4.4M
Schedule overrun assessment0 projects > 3 month change in planned
end date
Not started0
On hold/
postponed1 (33%)
$0
Point in time snapshot as of 1 Sept 2012
All figures are based on agency estimates
Exposure assessment0 should ―act decisively‖
1 (50%) reported high or extreme risk
Cost overrun assessment0 projects > 20% change in planned
expenditure
Activities0
Projects2, $4.4M
Programs0
Value assessment0 should ―assess priority‖
Time to deliver assessment2.2 years average length of projects
0 projects > 3 years
DPC
Overall agency findings show
that:
In line with whole-of-
Government findings showing
a pattern with time to deliver
greater than 1.5 years
BAU type activities are a large
part of DPC‘s work, however
neither IM nor vendor
management activities were
reported
Notable initiatives include:
eLegislation – enabling online
access to legislation
Summary assessment
Activities0
Projects0
Programs0
Activities0
Projects1, $ not reported
Programs0

Queensland Government ICT Audit 2012: Appendices
255
Queensland Government ICT Audit 2012
DSDIP
$1.8MForecast
expenditure
18Current and
proposed
initiatives
Active11 (61%)
$826.7K
Schedule overrun assessment3 (60%) projects > 3 month change in
planned end date
0.7 year average per project slip in time
potentially impacting value proposition
Not started6 (33%)
$712.6K
On hold/
postponed1 (6%)
$275K
Point in time snapshot as of 1 Sept 2012
All figures are based on agency estimates
Exposure assessment1 (20%) should ―act decisively‖
$8K (9%) potential expenditure at risk
0 reported high or extreme risk
Cost overrun assessment0 projects > 20% change in planned
expenditure
Activities6 $734.8K
Projects5, $91.9K
Programs0
Value assessment3 (60%) should ―assess priority‖
$18K (20%) potential expenditure for
reallocation
Time to deliver assessment1 year average length of projects
0 projects > 3 years
Overall agency findings show
that:
As a small agency, the DSDIP
portfolio consists mainly of
operational type activities
Limited project documentation
has equated to 3 ―assess
priority‖ results
Notable initiatives include:
None
Summary assessment
Activities1, $ not reported
Projects5, $712.6
Programs0
Activities0
Projects1, $275K
Programs0

Queensland Government ICT Audit 2012: Appendices
256
Queensland Government ICT Audit 2012
DSITIA - CITEC
$27.3MForecast
expenditure
75Current and
proposed
initiatives
Active15 (20%)
$4.5M
Schedule overrun assessment0 projects > 3 month change in planned
end date
Not started59 (79%)
$22.5M
On hold/
postponed1 (1%)
$279K
Point in time snapshot as of 1 Sept 2012
All figures are based on agency estimates
Exposure assessment0 should ―act decisively‖
2 (15%) reported high or extreme risk
Cost overrun assessment0 projects > 20% change in planned
expenditure
Activities2, $1.5M
Projects13, $3M
Programs0
Value assessment5 (38%) should ―assess priority‖
$503K (17%) potential expenditure for
reallocation
Time to deliver assessment0.9 years average length of projects
0 projects > 3 years
Overall agency findings show
that:
CITEC generally reported
internal infrastructure projects
with low impact. These
account the five ―assess
priority‖ results
As a service provider, CITEC
is not accountable for the
budget or schedule of agency
sponsored initiatives
Notable initiatives include:
DCS Lattice infrastructure
improvement project -
highlighted as an example
portraying inter-agency
governance issues
Summary assessment
Activities0
Projects59, $22.5M
Programs0
Activities0
Projects1, $279K
Programs0
CITEC, QSS, SSQ reported work plan details independently as
the DSITIA PMO was not operational at the time of reporting.
These agency names are used throughout the report.

Queensland Government ICT Audit 2012: Appendices
257
Queensland Government ICT Audit 2012
DSITIA - QSS
$11.9MForecast
expenditure
28Current and
proposed
initiatives
Active22 (79%)
$11.9M
Schedule overrun assessment8 (42%) projects > 3 month change in
planned end date
0.7 year average per project slip in time
potentially impacting value proposition
Not started6 (21%)
$0
On hold/
postponed0
Point in time snapshot as of 1 Sept 2012
All figures are based on agency estimates
Exposure assessment3 (16%) should ―act decisively‖
$1.8M (18%) potential expenditure at risk
3 (16%) reported high or extreme risk
Cost overrun assessment1 (5%) projects > 20% change in planned
expenditure
$33.8K (<1%) expenditure not available for
other pipeline opportunities
Activities2, $999K
Projects19, $9.9M
Programs1, $980K
Value assessment5 (26%) should ―assess priority‖
$101K (1%) potential expenditure for
reallocation
Time to deliver assessment1.4 years average length of projects
1 (5%) projects > 3 years
Overall agency findings show
that:
One of the few agencies that
did not report ―on hold‖
initiatives
No explicit evidence of
prioritisation
Notable initiatives include:
Shared systems program of
work - not clearly articulated
in work plan, although some
reporting at project level – see
examples below
DCS lattice infrastructure
improvement project -
highlighted as an example
portraying inter-agency
governance issues
Aurion upgrade - highest
expenditure
Summary assessment
Activities1, $ not reported
Projects5, $ not reported
Programs0
Activities0
Projects0
Programs0
CITEC, QSS, SSQ reported work plan details independently as
the DSITIA PMO was not operational at the time of reporting.
These agency names are used throughout the report.
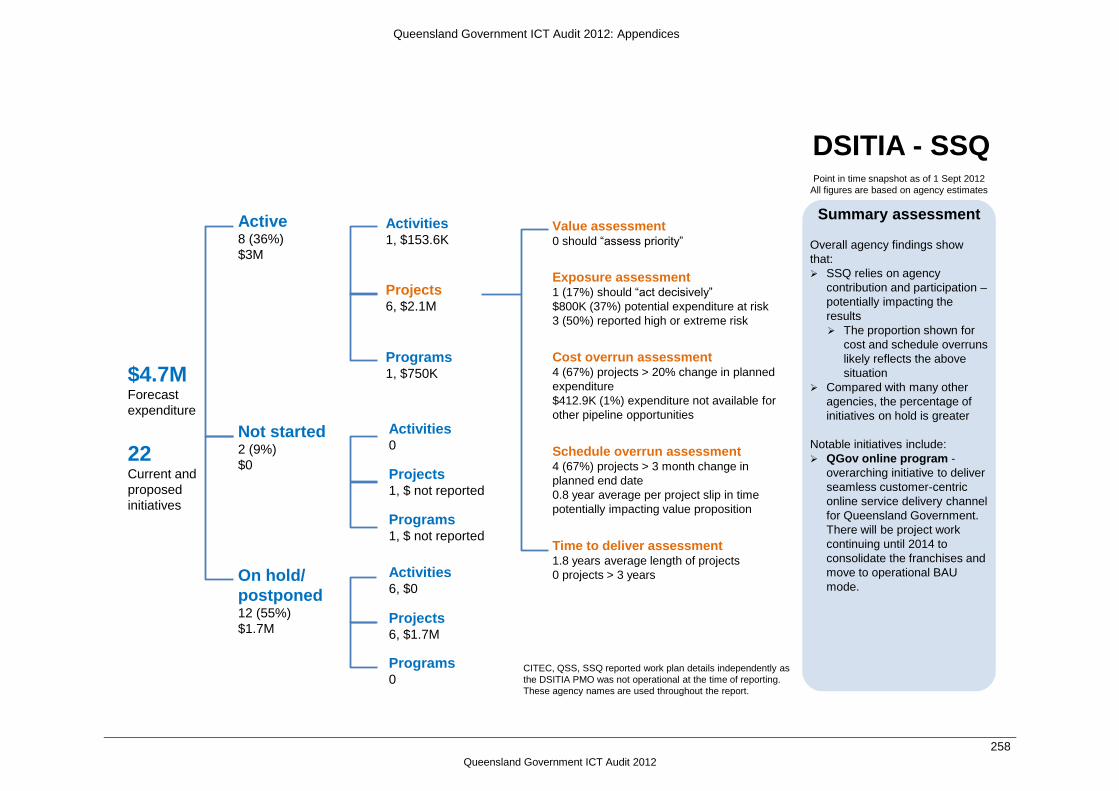
Queensland Government ICT Audit 2012: Appendices
258
Queensland Government ICT Audit 2012
DSITIA - SSQ
$4.7MForecast
expenditure
22Current and
proposed
initiatives
Active8 (36%)
$3M
Schedule overrun assessment4 (67%) projects > 3 month change in
planned end date
0.8 year average per project slip in time
potentially impacting value proposition
Not started2 (9%)
$0
On hold/
postponed12 (55%)
$1.7M
Point in time snapshot as of 1 Sept 2012
All figures are based on agency estimates
Exposure assessment1 (17%) should ―act decisively‖
$800K (37%) potential expenditure at risk
3 (50%) reported high or extreme risk
Cost overrun assessment4 (67%) projects > 20% change in planned
expenditure
$412.9K (1%) expenditure not available for
other pipeline opportunities
Activities1, $153.6K
Projects6, $2.1M
Programs1, $750K
Value assessment0 should ―assess priority‖
Time to deliver assessment1.8 years average length of projects
0 projects > 3 years
Overall agency findings show
that:
SSQ relies on agency
contribution and participation –
potentially impacting the
results
The proportion shown for
cost and schedule overruns
likely reflects the above
situation
Compared with many other
agencies, the percentage of
initiatives on hold is greater
Notable initiatives include:
QGov online program -
overarching initiative to deliver
seamless customer-centric
online service delivery channel
for Queensland Government.
There will be project work
continuing until 2014 to
consolidate the franchises and
move to operational BAU
mode.
Summary assessment
Activities0
Projects1, $ not reported
Programs1, $ not reported
Activities6, $0
Projects6, $1.7M
Programs0
CITEC, QSS, SSQ reported work plan details independently as
the DSITIA PMO was not operational at the time of reporting.
These agency names are used throughout the report.
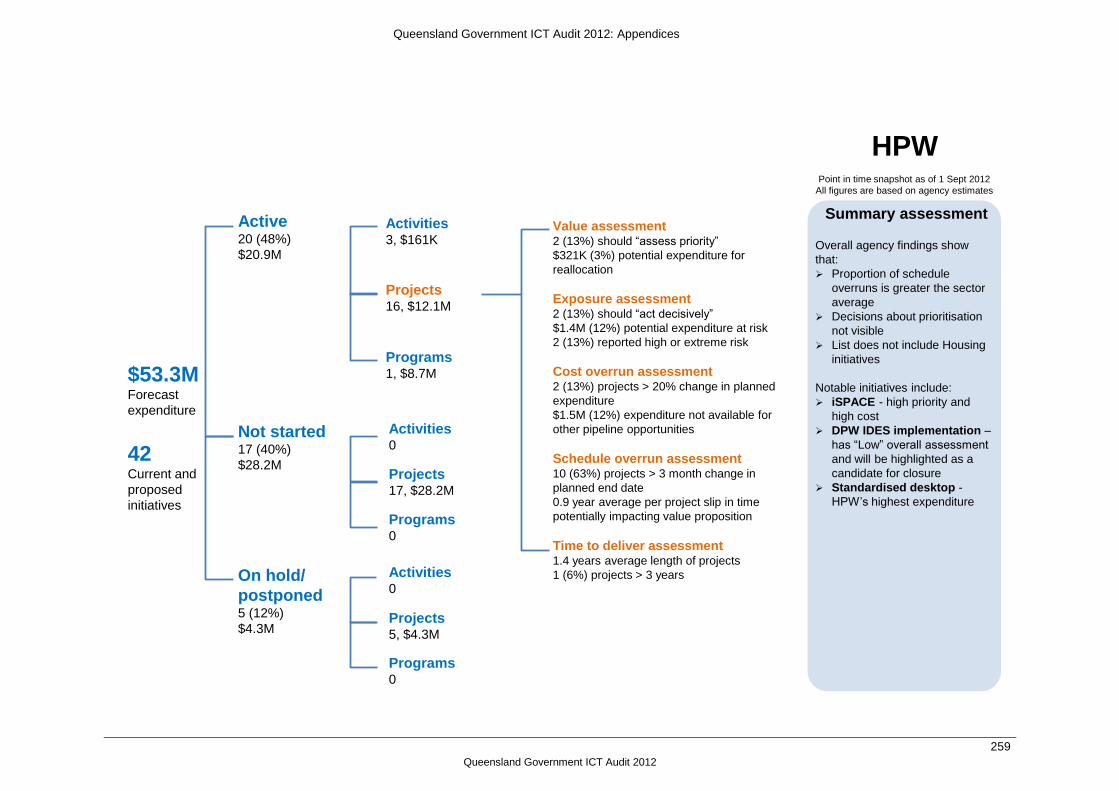
Queensland Government ICT Audit 2012: Appendices
259
Queensland Government ICT Audit 2012
HPW
$53.3MForecast
expenditure
42Current and
proposed
initiatives
Active20 (48%)
$20.9M
Schedule overrun assessment10 (63%) projects > 3 month change in
planned end date
0.9 year average per project slip in time
potentially impacting value proposition
Not started17 (40%)
$28.2M
On hold/
postponed5 (12%)
$4.3M
Point in time snapshot as of 1 Sept 2012
All figures are based on agency estimates
Exposure assessment2 (13%) should ―act decisively‖
$1.4M (12%) potential expenditure at risk
2 (13%) reported high or extreme risk
Cost overrun assessment2 (13%) projects > 20% change in planned
expenditure
$1.5M (12%) expenditure not available for
other pipeline opportunities
Activities3, $161K
Projects16, $12.1M
Programs1, $8.7M
Value assessment2 (13%) should ―assess priority‖
$321K (3%) potential expenditure for
reallocation
Time to deliver assessment1.4 years average length of projects
1 (6%) projects > 3 years
Overall agency findings show
that:
Proportion of schedule
overruns is greater the sector
average
Decisions about prioritisation
not visible
List does not include Housing
initiatives
Notable initiatives include:
iSPACE - high priority and
high cost
DPW IDES implementation –
has ―Low‖ overall assessment
and will be highlighted as a
candidate for closure
Standardised desktop -
HPW‘s highest expenditure
Summary assessment
Activities0
Projects17, $28.2M
Programs0
Activities0
Projects5, $4.3M
Programs0

Queensland Government ICT Audit 2012: Appendices
260
Queensland Government ICT Audit 2012
ITP
$41.8MForecast
expenditure
42Current and
proposed
initiatives
Active19 (45%)
$26.8M
Schedule overrun assessment8 (53%) projects > 3 month change in
planned end date
1.3 year average per project slip in time
potentially impacting value proposition
Not started4 (10%)
$1.6M
On hold/
postponed19 (45%)
$13.4M
Point in time snapshot as of 1 Sept 2012
All figures are based on agency estimates
Exposure assessment4 (27%) should ―act decisively‖
$1.8M (19%) potential expenditure at risk
1 (7%) reported high or extreme risk
Cost overrun assessment5 (33%) projects > 20% change in planned
expenditure
$3.7M (39%) expenditure not available for
other pipeline opportunities
Activities2, $125K
Projects15, $9.6M
Programs2, $17M
Value assessment1 (7%) should ―assess priority‖
$2.5M (26%) potential expenditure for
reallocation
Time to deliver assessment2.2 years average length of projects
2 (13%) projects > 3 years
Overall agency findings show
that:
Despite oversight challenges
associated with multiple
agency responsibilities, ITP
demonstrated appropriate
levels of governance
Expectations that there should
be more information
management and vendor
management activities moving
forward
Notable initiatives include:
Online services program -
initiative with highest
expenditure
Streamlining tenures
program and associated
projects - newsworthy, high
expenditure and example of
agile development
Parkinfo v2.0 - reporting does
not reflect true picture,
highlighted as an example
portraying procurement/
vendor management issues
Summary assessment
Activities0
Projects4, $1.6M
Programs0
Activities0
Projects19, $13.4M
Programs0
The Information & Technology Partners (ITP ) snapshot
includes the following: DAFF, DTESB, DNRM, DEWS,
DNPRSR, EHP.

Queensland Government ICT Audit 2012: Appendices
261
Queensland Government ICT Audit 2012
QH
$1.921BForecast
expenditure
119Current and
proposed
initiatives
Active46 (39%)
$279.4M
Schedule overrun assessment7 (54%) projects > 3 month change in
planned end date
1.4 year average per project slip in time
potentially impacting value proposition
Not started70 (59%)
$1.638B
On hold/
postponed3 (3%)
$3.6M
Point in time snapshot as of 1 Sept 2012
All figures are based on agency estimates
Exposure assessment1 (8%) should ―act decisively‖
$70M (65%) potential expenditure at risk
2 (15%) reported high or extreme risk
Cost overrun assessment1 (8%) projects > 20% change in planned
expenditure
$319K (<1%) expenditure not available for
other pipeline opportunities
Activities31, $36.4M
Projects13, $108.1M
Programs2, $134.9M
Value assessment2 (15%) should ―assess priority‖
$923K (<1%) potential expenditure for
reallocation
Time to deliver assessment3.9 years average length of projects
10 (77%) projects > 3 years
Overall agency findings show
that:
Schedule overruns appear in
line with whole-of-Government
findings
Time to deliver is greater than
sector wide average, which
QH indicates is due in part to a
complex operational
environment
Most unfunded initiatives
sector wide equating to $1.6B
forecast expenditure
Notable initiatives include:
QPAS – replacement
/upgrade of Queensland
Patient Administration
System (HBCIS) - noted as
highest priority for QH, but still
awaiting funding
SAPFIR – due to exposure
assessment, high expenditure
and recent PwC review
ieMR program, GroupWise
to Exchange, Cardiac
information solution
program - active initiatives
with forecast expenditure
greater than $10M each
Summary assessment
Activities6, $5.7M
Projects64, $1.633B
Programs0
Activities0
Projects3, $3.6M
Programs0

Queensland Government ICT Audit 2012: Appendices
262
Queensland Government ICT Audit 2012
QPS
$38.7MForecast
expenditure
18Current and
proposed
initiatives
Active9 (50%)
$35.6M
Schedule overrun assessment3 (43%) projects > 3 month change in
planned end date
0.86 year average per project slip in time
potentially impacting value proposition
Not started9 (50%)
$3.1M
On hold/
postponed0
Point in time snapshot as of 1 Sept 2012
All figures are based on agency estimates
Exposure assessment0 should ―act decisively‖
0 reported high or extreme risk
Cost overrun assessment1 (14%) projects > 20% change in planned
expenditure
$7.9M (33%) expenditure not available for
other pipeline opportunities
Activities0
Projects7, $24.3M
Programs2, $11.3M
Value assessment2 (29%) should ―assess priority‖
$8.6M (35%) potential expenditure for
reallocation
Time to deliver assessment1.9 years average length of projects
1 (14%) projects > 3 years
Overall agency findings show
that:
There were no operational
type activities reported, which
understates the level of
resources required for
information management and
security
Decisions about initiative
prioritisation visible and
appear to be effective
Notable initiatives include:
Computer aided dispatch -
initiative with highest
expenditure and highlighted as
an initiative with appropriate
rigour against the level of
exposure
Weapons licensing - high
expenditure, design and
newsworthy
Public safety frontline
communications – QPS
contribution to Government
Wireless Network
Summary assessment
Activities0
Projects9, $3.1M
Programs0
Activities0
Projects0
Programs0

Queensland Government ICT Audit 2012: Appendices
263
Queensland Government ICT Audit 2012
$17.9MForecast
expenditure
35Current and
proposed
initiatives
Active16 (46%)
$7.8M
Schedule overrun assessment1 (17%) projects > 3 month change in
planned end date
1.5 years average per project slip in time
potentially impacting value proposition
Not started3 (8%)
$1.6M
On hold/
postponed16 (46%)
$8.5M
Point in time snapshot as of 1 Sept 2012
All figures are based on agency estimates
Exposure assessment1 (17%) should ―act decisively‖
$495K (9%) potential expenditure at risk
0 reported high or extreme risk
Cost overrun assessment1 (17%) projects > 20% change in planned
expenditure
$199K (3%) expenditure not available for
other pipeline opportunities
Activities10, $2M
Projects6, $5.8M
Programs0
Value assessment3 (50%) should ―assess priority‖
$4.3M (75%) potential expenditure for
reallocation
Time to deliver assessment1.3 years average length of projects
0 projects > 3 years
QTT
Overall agency findings show
that:
Assessments appear to be
misrepresenting QTT‘s current
position (e.g. business impact)
Project condition was not
reported for active grants
initiatives
Notable initiatives include:
Royalties - noteworthy due to
focus around revenue
collection and links with
mining; reuse of existing RMS;
recently successfully
completed
Project link - high
expenditure; agile
development by OIC with QTT
IS support
3 grants projects -
noteworthy due to parallel
grants activity through the
Commission of Audit; in-house
development based on reuse
of RMS; newly established
grants reference group
Summary assessment
Activities2, $1.5M
Projects1, $64k
Programs0
Activities4, $652K
Projects12, $7.9M
Programs0

Queensland Government ICT Audit 2012: Appendices
264
Queensland Government ICT Audit 2012
TMR
$56.5MForecast
expenditure
59Current and
proposed
initiatives
Active33 (56%)
$45.6M
Schedule overrun assessment8 (28%) projects > 3 month change in
planned end date
0.8 year average per project slip in time
potentially impacting value proposition
Not started18 (31%)
$10.7M
On hold/
postponed8 (14%)
$235K
Point in time snapshot as of 1 Sept 2012
All figures are based on agency estimates
Exposure assessment2 (7%) should ―act decisively‖
$2.3M (16%) potential expenditure at risk
2 (7%) reported high or extreme risk
Cost overrun assessment5 (17%) projects > 20% change in planned
expenditure
$4.6M (31%) expenditure not available for
other pipeline opportunities
Activities1, $25K
Projects29, $15M
Programs3, $30.6M
Value assessment10 (34%) should ―assess priority‖
$1.4M (9%) potential expenditure for
reallocation
Time to deliver assessment1.6 years average length of projects
3 (11%) projects > 3 years
Overall agency findings show
that:
Decisions about prioritisation
not visible
Limited reporting of IM and IS
activities
Notable initiatives include:
CDOP intelligent traffic
camera system - TMR‘s
highest cost initiative
Laboratory information
management system (LIMS)
- example of long running
initiative contributing to poor
project outcomes
Summary assessment
Activities3, $ not reported
Projects15, $10.7
Programs0
Activities0
Projects8, $235K
Programs0

Queensland Government ICT Audit 2012: Appendices
265
Queensland Government ICT Audit 2012
Appendix I – Top agency initiatives
This appendix provides an overview of 45 top agency initiatives. Although infrastructure projects or programs in some agencies are
significant programs of work with high expenditure, these types of initiatives have been excluded to focus on applications that generally
support transformational change.
Since the investment information entails ‗forward‘ programs of work, current agency names are used (i.e. post machinery of government
changes).
The top agency initiatives are ordered by total estimated expenditure.

Queensland Government ICT Audit 2012: Appendices
266
Queensland Government ICT Audit 2012
Post MOG agency
Initiative and description Status Start date
End date Total estimated expenditure
Expenditure remaining
Comments
1. QH QPAS - Replacement / Upgrade of
Queensland Patient Administration System
(HBCIS)
HBCIS (Hospital Based Corporate Information
System) is the current Patient Administration
System (PAS) for Queensland Health and the
primary system for registering and managing all
patients. It is the largest corporate information
system in use in Queensland Health. It
incorporates eBilling capability
Not started
Pre project
stage
Proposed
funding
$438,800,000 $438,800,000 Of QH unfunded initiatives, this is the
highest priority.
2. QH ieMR (Integrated electronic Medical
Record) Program
The ieMR program will deliver an authoritative
single source of the patient record across the
State. It will provide clinicians with the ability to:
access information that is integrated,
accurate and clinically relevant
support decision making and better use
of information
optimise management of patients,
resources and provision of services
deliver location independent diagnostic
and treatment services
support interaction across a network of
providers that enables providers to be
located, information to be transferred
and multidisciplinary providers to
collaborate. collaborate.
Active
In progress -
managing
program
tranches
Fully funded
Oct
2009
Dec 2014 $179,581,291 $124,783,291 Dependencies include:
Availability of Simulation Centre;
Ability to leverage messaging services,
medical objects, argus and health-link;
Enhancements to CDR;
Integration of data from AUSLAB, eLMS,
HBCIS, ORMIS, ICU CIS, EDIS, PACS
and AARK;
Availability of eMR Viewer; Availability of
supporting infrastructure such as eMPI,
Clinical Data Service, eOrder
Management, eReferrals and Single
Sign-On

Queensland Government ICT Audit 2012: Appendices
267
Queensland Government ICT Audit 2012
Post MOG agency
Initiative and description Status Start date
End date Total estimated expenditure
Expenditure remaining
Comments
3. QH Personally Controlled Electronic Health
Record (PCEHR) Integration - National
eHealth readiness
COAG has invested significant funds in national
eHealth infrastructure to underpin healthcare
reform, including establishing the individual
healthcare identifier service, the healthcare
provider identifier service and acceleration of a
national personally controlled electronic health
record (PCEHR) system. A jurisdictional impact
assessment (JIA) was undertaken for QH
integration with the PCEHR. The key activities
were: Sending of discharge summaries, event
summaries, shared health summaries and
specialist letters to the PCEHR; Viewing the
PCEHR; Assisted consumer registration;
Provider education and recruitment; Sending of
pathology and Diagnostic Imaging result reports
to the PCEHR; and Development of a PCEHR
conformant repository.
Not started
Pre project
stage
Funding source
unknown at this
stage
$140,370,526 $140,370,526 National PCEHR and associated
foundational eHealth projects
4. DCS DCS HR Payroll Business Solution Program
Business continuity for HR payroll services that
provides a strong basis for workforce
management. Projects include:
SABA Upgrade
Electronic payslips
Operational Staff Recruitment
Management System
Lattice Infrastructure Improvement
Active
In progress -
defining a
program
Fully funded
Jul
2010
Jun 2016 $104,563,717 $101,500,000 The program has recently received
funding approval. The Lattice
Infrastructure Improvement Project has
experienced inter-agency governance
issues which have prolonged business
exposure associated with old
infrastructure. DCS have indicated that
they will ensure accountability and
strong governance for the program
moving forward.

Queensland Government ICT Audit 2012: Appendices
268
Queensland Government ICT Audit 2012
Post MOG agency
Initiative and description Status Start date
End date Total estimated expenditure
Expenditure remaining
Comments
5. QH RIP - Queensland Health Teleradiology
Network Phase 2
The Queensland Health Teleradiology Network
Phase 2 will extend the Radiology Informatics
Program (RIP) to all Queensland Health
hospitals.
Not started
Pre project
stage
Funding source
unknown at this
stage
$93,740,000 $93,740,000
6. QH SAP Assets Procurement Finance
Information Resource (SAPFIR) Project
The SAPFIR project involves the greenfield
implementation of the latest version of SAP
finance, materials management and plant
maintenance modules (ECC6). This system will
ensure that Queensland Health and its Local
Health and Hospital Network (LHHN) are able to
comply with statutory finance and performance
requirements.
Active
In progress -
delivery stage
Fully externally
funded
Nov
2010
Jun 2014 $79,736,000 $70,052,000 This initiative was referred to as 'NHHN
ICT Program' as part of last year's QH
ICT Work Plan submission.
To ensure continuation of data the
project needs to be aware of
configuration changes to systems that
supply or extract data from FAMMIS,
QH‘s current finance system.
The Activity Based Funding (ABF)
project will be making changes to
enterprise and state-wide systems and
may have additional requirements that
impact this project.
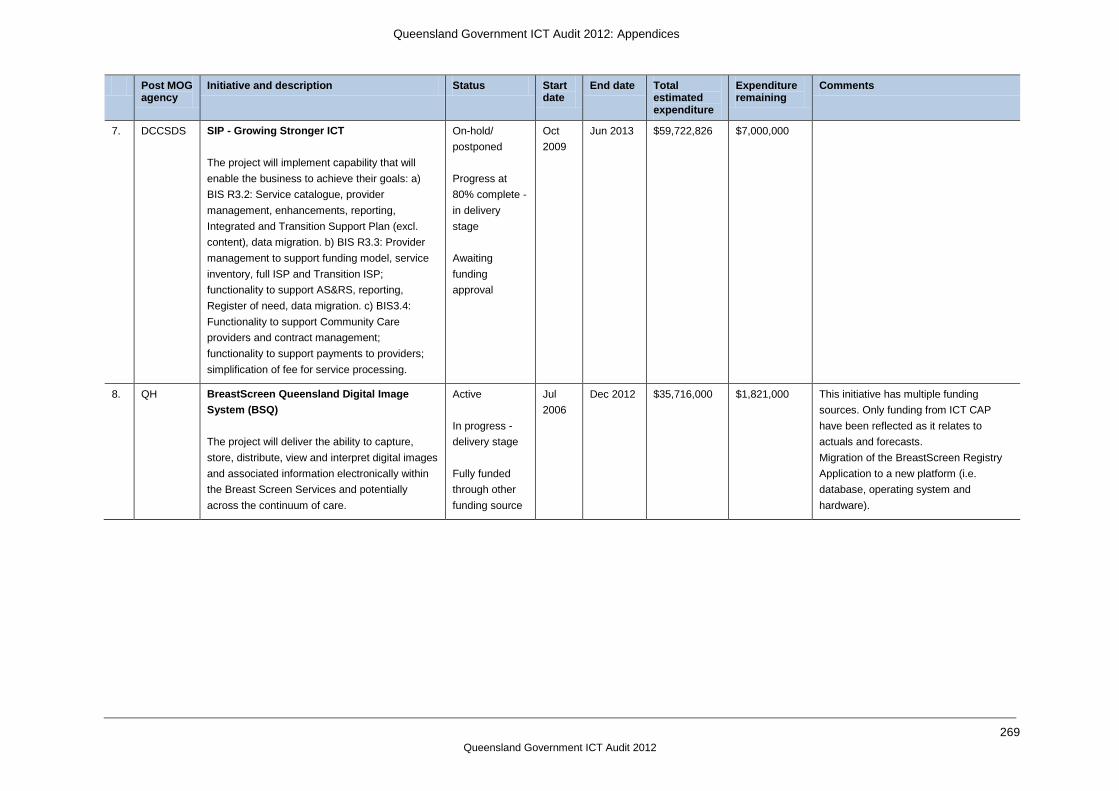
Queensland Government ICT Audit 2012: Appendices
269
Queensland Government ICT Audit 2012
Post MOG agency
Initiative and description Status Start date
End date Total estimated expenditure
Expenditure remaining
Comments
7. DCCSDS SIP - Growing Stronger ICT
The project will implement capability that will
enable the business to achieve their goals: a)
BIS R3.2: Service catalogue, provider
management, enhancements, reporting,
Integrated and Transition Support Plan (excl.
content), data migration. b) BIS R3.3: Provider
management to support funding model, service
inventory, full ISP and Transition ISP;
functionality to support AS&RS, reporting,
Register of need, data migration. c) BIS3.4:
Functionality to support Community Care
providers and contract management;
functionality to support payments to providers;
simplification of fee for service processing.
On-hold/
postponed
Progress at
80% complete -
in delivery
stage
Awaiting
funding
approval
Oct
2009
Jun 2013 $59,722,826 $7,000,000
8. QH BreastScreen Queensland Digital Image
System (BSQ)
The project will deliver the ability to capture,
store, distribute, view and interpret digital images
and associated information electronically within
the Breast Screen Services and potentially
across the continuum of care.
Active
In progress -
delivery stage
Fully funded
through other
funding source
Jul
2006
Dec 2012 $35,716,000 $1,821,000 This initiative has multiple funding
sources. Only funding from ICT CAP
have been reflected as it relates to
actuals and forecasts.
Migration of the BreastScreen Registry
Application to a new platform (i.e.
database, operating system and
hardware).

Queensland Government ICT Audit 2012: Appendices
270
Queensland Government ICT Audit 2012
Post MOG agency
Initiative and description Status Start date
End date Total estimated expenditure
Expenditure remaining
Comments
9. QPS Computer Aided Dispatch (CAD)
Replace Computer Aided Dispatch (CAD)
system(s) currently operational in the seven
scoped Police Communications Centres (PCCs)
with a modern, integrated and highly reliable
CAD solution providing state-wide coverage on a
single platform that aims to:
Improve efficiencies in tasking frontline
resources and response to calls for service
Reduce administrative burden for
operational police in documenting
occurrences
Enhance police and community safety
through improved intelligence reporting
Enhance ability to respond to planned
and unplanned events
Active
In progress -
delivery stage
Fully internally
funded
Jul
2010
Jun 2013 $35,123,000 $8,292,000 Three out of seven site implementations
completed.
Scope extended by two sites and
inclusion of LCAD at stations and mobile
MDT client.
All delivery milestones met on schedule
and below budget.
10. QH Primary and Community Care - Release 2 -
Regional
This initiative is an interim option and part two of
a three-release journey. Far North Queensland
is a challenging geographic and service delivery
environment. This project will improve the
eHealth infrastructure for primary and community
care settings in regional far north Queensland.
This initiative would reduce the fragmented
nature of information systems currently in place,
improve links with partner organisations and
enable Queensland Health to participate flexibly
and strongly in the changing national primary
and community health care environment and the
context of National Health Reform.
Not started
Pre project
Funding source
unknown at this
stage
$35,000,000 $35,000,000

Queensland Government ICT Audit 2012: Appendices
271
Queensland Government ICT Audit 2012
Post MOG agency
Initiative and description Status Start date
End date Total estimated expenditure
Expenditure remaining
Comments
11. TMR CDOP Intelligent Traffic Camera System (I-
TCS) Program
Replace the Traffic Camera Office (TCO) legacy
Back Office System (BOS) with a digital Redflex
Integrated Infringement Processing System
(IIPS) BOS, and deliver proof of concept digital
cameras for use by the TCO. The I-TCS Project
is funded from the Camera Detected Offence
Program (CDOP) and is in Stage 2 of a three
Stage program.
Active
In progress -
managing
program
tranches
Fully externally
funded
Jun
2008
May 2013 $34,954,666 $14,996,103
12. QH AARK (Automated Anaesthetic Record
Keeping) Tranche 2
The Automated Anaesthetic (Perioperative)
Record-Keeping (AARK) was initiated to deliver
an integrated state wide anaesthetic record
keeping solution which is an essential pre-
requisite in enabling the State-wide Anaesthetic
Network to implement good practice. Tranche 2
of AARK will complete: a) rollout of
the procedural and recovery module for the
remaining 12 hospitals within Queensland
(Beaudesert, Cunnamulla, Miles, Theodore, The
Prince Charles, Royal Children's, Robina, Gold
Coast, Mater, Noosa, Queensland Children's
Hospital and the new Sunshine Coast Hospital).
b) rollout the pre-procedural clinical assessment
module to tranche I and 2 hospitals; c) rollout the
acute pain module to tranche 1and 2 hospitals;
d) commission the enterprise database.
Not started
Pre project
Funding source
unknown at this
stage
$33,500,000 $33,500,000

Queensland Government ICT Audit 2012: Appendices
272
Queensland Government ICT Audit 2012
Post MOG agency
Initiative and description Status Start date
End date Total estimated expenditure
Expenditure remaining
Comments
13. QPS Weapons Licensing Management System
The WLMS Project is implementing a new
weapons licensing system which is planned to
be delivered in three stages with a view to
streamlining processes and providing efficiency
of service to licence holders, firearm dealers and
shooting clubs. Stage 1, delivery of the new
WLMS, essentially a mandatory end-of-life
replacement activity for 3 legacy systems. Stage
2, delivering an internet service for the public to
be able to apply and pay for licence and weapon
applications on-line (including Permits To
Acquire (PTAs)).
Active
In progress -
delivery stage
Fully internally
funded
Jan
2010
Aug 2012 $19,617,433 $2,955,000 During agency consultation, the project
team advised that on-line forms will go
live in mid-November; and (stage 2)
project will be closed by the end of
December 2012. Stage 3 will be
considered at a later time when other
priorities (e.g. GWN for G20) have been
addressed.
14. DTESB Online Services Program
formerly Integrated Services Delivery eBusiness
Implement a franchise model for business and
industry on-line service delivery.
Active
In progress -
managing
program
tranches
Fully internally
funded
Nov
2010
Dec 2014 $16,400,000 $3,400,000 Program is delivering the Business and
Industry Franchise for WoG
(www.business.qld.gov.au)
15. DNRM Streamlining Business Systems Program
formerly Streamline Tenure Approvals
Streamline the lifecycle of mining and petroleum
permits to: reduce time taken for permit
approval; improve transparency and certainty for
government and the industry; and reduce cost of
service delivery for government and industry.
Projects include:
• Mines Online Geographic Information System
(Mines Online GIS)
• Exploration Permit - Minerals (EPM)
Active
In progress -
managing
program
tranches
Fully funded
Jul
2009
Jan 2016 $16,318,000 $13,602,000 Dependencies on legislative change,
industry cooperation, business
transformation

Queensland Government ICT Audit 2012: Appendices
273
Queensland Government ICT Audit 2012
Post MOG agency
Initiative and description Status Start date
End date Total estimated expenditure
Expenditure remaining
Comments
16. DETE ERP6 Project
DETE to implement an ERP6 SAP finance
instance separate from the current whole-of-
government instance, configured to meet
DETE‘s specific requirements.
Active
In planning -
initiation stage
Awaiting
internal funding
approval
Jan
2012
Aug 2013 $15,942,702 $15,000,000 ICT Control - Shared with Finance
17. DJAG BDM Digitisation
The foundation Digitisation project will image the
Registry‘s 6 million records and source
documents (in physical form) and fully transcribe
2.5 million of the most frequently accessed birth,
death and marriage records to establish a full
electronic repository. The tender for the
outsourced work was awarded in October 2011
and delivery will commence from June 2012.
The contractor is Salmat Limited, an Australian
incorporated company. Imaged and transcribed
records will be provided to the Registry on
secure hard drive, checked for accuracy and
uploaded into the Registry's production life event
system.
Active
In planning -
initiation stage
Fully funded
Jul
2009
Dec 2014 $14,082,000 $13,192,000
18. DCS Triple Zero Statewide Telephony
Implementation of new 000 emergency
telephony system to provide increased call
taking management and business continuity
capability for QAS Communications Centres.
Active
In progress -
delivery stage
Fully internally
funded
Mar
2010
Jun 2015 $13,300,000 $9,992,000 Dependency with Communications
Centre Modernisation Project
ECM is limited to $13.3M

Queensland Government ICT Audit 2012: Appendices
274
Queensland Government ICT Audit 2012
Post MOG agency
Initiative and description Status Start date
End date Total estimated expenditure
Expenditure remaining
Comments
19. DCCSDS Document and Record Management Program
The DRMP will provide a consistent and
seamless approach to document and records
management that will enable improved frontline
service delivery through better information
sharing as well as ensuring the department‘s
recordkeeping complies with relevant legislation.
The introduction of a single eDRMS will mitigate
the legislative, environmental, financial and
frontline service delivery risks the department
faces through current documents and records
management practices, as well as improving
client services through frontline staff having
easier access, improved availability and greater
visibility of departmental document and records.
On-hold/
postponed
Progress at
26% complete -
during
managing
program
tranches
Awaiting
internal funding
approval
Nov
2010
Jun 2016 $12,621,986 $10,330,000
20. QH Public Health Information and Clinical
Services Solution (PHICSS)
The objective of the PHICSS project is to
procure and implement an enterprise 'paperless'
electronic medical record into these sites. It
includes migration of a limited set of core client
data from disparate legacy applications and
where necessary, additional equipment to
support a paperless clinical consulting
environment.
Active
In progress -
delivery stage
Fully funded
through other
funding source
Nov
2007
Apr 2013 $11,312,000 $2,395,405 This initiative has multiple funding
sources. Only funding from ICT CAP
have been reflected as it relates to
actuals and forecasts
Dependencies on AUSLAB/LISS and
Private pathology providers; External
Connectivity Project; eVici Interface
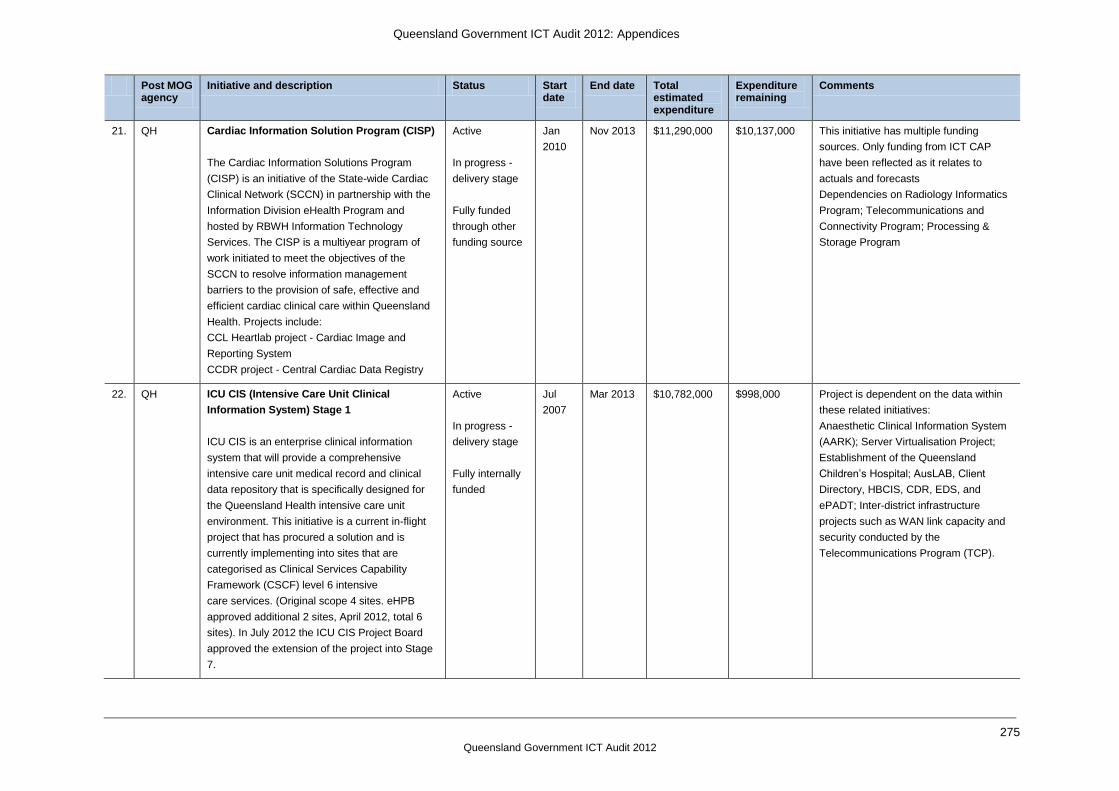
Queensland Government ICT Audit 2012: Appendices
275
Queensland Government ICT Audit 2012
Post MOG agency
Initiative and description Status Start date
End date Total estimated expenditure
Expenditure remaining
Comments
21. QH Cardiac Information Solution Program (CISP)
The Cardiac Information Solutions Program
(CISP) is an initiative of the State-wide Cardiac
Clinical Network (SCCN) in partnership with the
Information Division eHealth Program and
hosted by RBWH Information Technology
Services. The CISP is a multiyear program of
work initiated to meet the objectives of the
SCCN to resolve information management
barriers to the provision of safe, effective and
efficient cardiac clinical care within Queensland
Health. Projects include:
CCL Heartlab project - Cardiac Image and
Reporting System
CCDR project - Central Cardiac Data Registry
Active
In progress -
delivery stage
Fully funded
through other
funding source
Jan
2010
Nov 2013 $11,290,000 $10,137,000 This initiative has multiple funding
sources. Only funding from ICT CAP
have been reflected as it relates to
actuals and forecasts
Dependencies on Radiology Informatics
Program; Telecommunications and
Connectivity Program; Processing &
Storage Program
22. QH ICU CIS (Intensive Care Unit Clinical
Information System) Stage 1
ICU CIS is an enterprise clinical information
system that will provide a comprehensive
intensive care unit medical record and clinical
data repository that is specifically designed for
the Queensland Health intensive care unit
environment. This initiative is a current in-flight
project that has procured a solution and is
currently implementing into sites that are
categorised as Clinical Services Capability
Framework (CSCF) level 6 intensive
care services. (Original scope 4 sites. eHPB
approved additional 2 sites, April 2012, total 6
sites). In July 2012 the ICU CIS Project Board
approved the extension of the project into Stage
7.
Active
In progress -
delivery stage
Fully internally
funded
Jul
2007
Mar 2013 $10,782,000 $998,000 Project is dependent on the data within
these related initiatives:
Anaesthetic Clinical Information System
(AARK); Server Virtualisation Project;
Establishment of the Queensland
Children‘s Hospital; AusLAB, Client
Directory, HBCIS, CDR, EDS, and
ePADT; Inter-district infrastructure
projects such as WAN link capacity and
security conducted by the
Telecommunications Program (TCP).

Queensland Government ICT Audit 2012: Appendices
276
Queensland Government ICT Audit 2012
Post MOG agency
Initiative and description Status Start date
End date Total estimated expenditure
Expenditure remaining
Comments
23. DETE Curriculum Into the Classroom
To support school staff implement the Australian
Curriculum released in late 2010. The project
seeks to simplify the curriculum planning
process further, by clearly articulating the core
knowledge and understandings outlined in the
AC and providing quality assured unit and lesson
plans (developed for teachers by teachers) that
will clarify for staff exactly what is required to be
taught resulting in time saving.
Active
In progress -
delivery stage
Fully internally
funded
Feb
2011
Jun 2013 $10,457,000 $1,400,000 Responsibility transferred to Education
Qld (corporate unit) with recent
organisational restructure. Involves
curriculum development - will be
delivered using existing investment in
core ICT systems. Cost of content
development unknown. Cost includes full
project lifecycle costs.
24. DETE VET Purchasing Solution
Development of a Training Purchasing System
(TPS) for managing VET procurement and
migration of the current TPS into a flexible, user
friendly system that meets the requirements of
DET enterprise architecture.
On-hold/
postponed
Progress at
50% complete -
delivery stage
Partially
internally
funded
Dec
2009
Mar 2013 $9,059,886 $100,000
25. DCS All Hazards Information Management
Program
Build the capability of Disaster Management
agencies, stakeholders and the community to
ensure they are prepared and capable of
effectively responding to a disaster.
Dependencies include all frontline
communications projects, including relevant
Queensland Police Service initiatives. Projects
include, Disaster Management Portal Project,
Emergency Virtual Operations Centre Project,
All Hazards Public Engagement Project.
Active
In progress -
managing
program
tranches
Fully funded
Apr
2011
Jun 2013 $8,101,223 $3,565,133 Dependency on all frontline
communications projects including
relevant Queensland Police Service
initiative.
Resourcing limitations associated with
the EMP process.
High level of cooperation with external
agencies including local government,
utilities, NGOs.

Queensland Government ICT Audit 2012: Appendices
277
Queensland Government ICT Audit 2012
Post MOG agency
Initiative and description Status Start date
End date Total estimated expenditure
Expenditure remaining
Comments
26. HPW iSPACE
To purchase and implement a commercial off-
the-shelf system that supports the planning,
design, management and utilisation of the
Queensland Government's real estate portfolio.
The system will replace existing systems.
Active
In progress -
delivery stage
Fully internally
funded
Apr
2011
Apr 2013 $7,458,429 $4,844,182
27. QSS Aurion Upgrade
Aurion version 9 has been on extended
maintenance since 2002. The current extended
support expires in July 2012. Negotiation of
support on this version will be required at
additional cost if migration to the current version
10 offering is not complete by this time.
Legislative obligations will not be met if either of
these requirements is not met in this timeframe.
The ACE solution is currently responsible for
paying 8,000 employees. It is also a target
environment to receive a number of separate
instances of Aurion in the near future. This
upgrade has a number of downstream
dependencies that also have similar
requirements.
Active
In planning -
initiation stage
Fully funded
Oct
2011
Sep 2013 $7,030,830 $6,390,477
28. DETE SAP BI Project
DETE to engage an implementation partner to
work with the business to configure and
implement a business intelligence capability
taking advantage of the DETE configured ERP6
SAP instance.
Active
In planning -
initiation stage
Awaiting
internal funding
approval
Jan
2012
Sep 2013 $6,674,391 $6,425,000 ICT Control - Shared with Finance

Queensland Government ICT Audit 2012: Appendices
278
Queensland Government ICT Audit 2012
Post MOG agency
Initiative and description Status Start date
End date Total estimated expenditure
Expenditure remaining
Comments
29. TMR Laboratory Information Management System
(LIMS)
The LIMS project will deliver a core business
solution for TMR's Materials Services Branch
and regional laboratories. The solution will be
used to manage materials testing activities and
will replace and consolidate existing legacy
systems into one single state-wide system.
Active
In progress -
delivery stage
Fully externally
funded
Jul
2007
Nov 2012 $6,239,222 $2,189,222 Financial benefits only realised if rolled
out to industry.
Approved project budget has been up to
$11.7M but has recently been reduced
along with scope to comply with recent
government priority changes.
30. QPS Enhance QPRIME User Interface
To maximise QPRIME usability and quality
through system and process improvement.
EQUIP - NC5 will deliver a new method of data
entry for front line operational police that is
streamlined and targets specific policing
activities in QPRIME.
Active
In progress -
delivery stage
Partially
internally
funded
Oct
2010
Dec 2013 $5,667,000 $2,889,000 Lite PID exists (rather than Business
Case).
31. DETE The Solution Series (TSS) Payroll Refresh
A TSS payroll system software and hardware
refresh to ensure continued operation until
beyond 2015.
Active
In planning -
initiation stage
Awaiting
internal funding
approval
May
2012
Jun 2013 $5,620,000 $5,600,000

Queensland Government ICT Audit 2012: Appendices
279
Queensland Government ICT Audit 2012
Post MOG agency
Initiative and description Status Start date
End date Total estimated expenditure
Expenditure remaining
Comments
32. QH Credentialing
Implement a state-wide credentialing information
repository and provide financial assistance to
Districts to procure local credentialing solutions
to improve the efficiency and effectiveness of the
credentialing process and provision of a central
repository of eligible medical and dental
practitioner Clinical Scope of Practice.
Active
In planning -
initiation stage
Fully internally
funded
Oct
2010
Jun 2014 $5,580,000 $5,580,000
33. DETE Learning Management System Business
Continuity
TAFE Queensland has a requirement to provide
business continuity in the provision of e-learning
capability when the current contractual
arrangements expire in Sept 2013. This is being
done in conjunction with Education Queensland
(corporate office) to provide the opportunity for
establishing a shared licensing arrangement and
optimised financial benefit for the Queensland
Government.
On-hold/
postponed
Progress at
10% complete -
pre project
stage
Awaiting
internal funding
approval
Mar
2012
Jun 2015 $5,066,369 $5,026,369
34. DNPRSR ParkInfo v2.0
The ParkInfo system will manage the
Queensland Parks and Wildlife Service (QPWS)
estate through providing a portal to present,
capture, integrate, and interact with the full range
of QPWS data.
Active
In progress -
delivery stage
Fully internally
funded
Oct
2010
Jun 2013 $4,713,981 $1,420,981 October 2010, when contract was
signed, is now considered the start date.
However, the Business Case was first
raised in September 2007. All figures
relate to the later date.

Queensland Government ICT Audit 2012: Appendices
280
Queensland Government ICT Audit 2012
Post MOG agency
Initiative and description Status Start date
End date Total estimated expenditure
Expenditure remaining
Comments
35. QH MAIS (Medical Aids Information System)
This project is to streamline business processes,
increase efficiency and decrease time to
complete transactions. This will decrease the
amount of time the patient needs to wait (by
approx. 50%) for the service and improve the
collection of accurate data for planning
purposes. This application supports the Medical
Aid Subsidy scheme which is a state-wide
service for the provisions of aids and equipment
and processes in excess of 120,000 requests for
medial aids each financial year. The new
database will automate many manual functions
including electronic/online application
submission function, track status of the
application, interface to SAP to eliminate double
entry of orders.
On-hold/
postponed
Progress at
10% complete -
in planning
stage
Proposed
internal funding
source
Sep
2008
$4,117,000 $3,574,000
36. QTT Royalties
Implementation of Mining Royalties into RMS
Active
In progress -
delivery stage
Fully internally
funded
Oct
2011
Nov 2012 $3,825,000 $1,840,000 New project/activity due to machinery of
Government change

Queensland Government ICT Audit 2012: Appendices
281
Queensland Government ICT Audit 2012
Post MOG agency
Initiative and description Status Start date
End date Total estimated expenditure
Expenditure remaining
Comments
37. TMR 131940
The 131940 system is a comprehensive system
that collects data from disparate systems,
provides a single source of truth for traffic and
travel information that provides information to
TMR, other authorised agencies and the people
of Queensland through a variety of mediums.
The 131940 system has been evolving for
several years and is now a mature system that
potentially requires redevelopment in light of its
changing role in the community.
Active
In progress -
delivery stage
Fully externally
funded
Jul
2011
Oct 2012 $3,808,833 $1,342,606 A single integrator contract finalised by 1
October 2012.
Service transition from Road Corridor
use to Information Division to be
completed by 1 September 2012.
38. DPC eLegislation
WoG access to legislation
Active
In planning -
initiation stage
Fully funded
Jul
2011
Dec 2013 $3,805,591 $3,500,000
39. DETE eLearning for special needs student
The eLearning for special needs students
election commitment will provide tablets for use
by students with special needs directly to State
Special Schools, State Schools and non-
government schools with special education
programs.
Active
In progress -
delivery stage
Apr
2012
Dec 2012 $3,505,000 $3,500,000 Ongoing costs still to be determined
40. DNRM ATS Client Modernisation (ATS-CM)
Develop and implement a new software platform
for the Automated Titles System (ATS) to
address non-support for the existing platform
from 2015. This is identified as high risk under
the government‘s software currency framework.
On-hold/
postponed
No progress - in
pre project
stage
Aug
2012
Oct 2013 $3,500,000 $3,500,000 Submission documentation only.
Update: 9-Aug-12 - Minimal work is
being undertaken, just enough to keep
some momentum given the high risk
nature of the software currency issue
and the significance of ATS to
Queensland Government revenue.

Queensland Government ICT Audit 2012: Appendices
282
Queensland Government ICT Audit 2012
Post MOG agency
Initiative and description Status Start date
End date Total estimated expenditure
Expenditure remaining
Comments
41. DCCSDS CarePay Program
The Carepay system is the system utilised for
Foster and Kinship Carer allowances. The
system has been identified through the ICT
Baseline Process as a candidate for
replacement due to the age and risk associated
with its underlying platform.
On-hold/
postponed
Progress at
30% complete -
during
managing
program
tranches
Nov
2011
Jun 2013 $3,439,593 $3,143,000 Constraint is that Carepay solution
should interact with ICMS platform
42. SSQ QGov Online Program
The Franchise Implementation Project is the
overarching project required to complete the
QGov Online Program of Work—to deliver a
seamless customer-centric online service
delivery channel for the Queensland
Government. This is being achieved using the
franchise model, different agencies take a lead
role for a sub-section of www.qld.gov.au (a
‗franchise‘) but deliver a seamless experience by
following a central set of defined processes and
tools for its delivery and maintenance.
Active
In progress -
managing
program
tranches
Partially
internally
funded
Apr
2011
Dec 2014 $3,182,753 $750,000 An options paper undertaken which led
to a mandate of QGOV online supports
the single entry point for citizens within
the online channel for whole-of-
government.
Dependent on the ability of franchise
owners to adequately resource franchise
teams to undertake appropriate
customer research, content editing and
publishing and stakeholder engagement.
Program continuation and completion
also dependent on allocation of funding
internally from Smart Service
Queensland. Budget for this overarching
program of work covers projects -
Franchise Implementation Tranche 2
and Franchise Implementation Tranche
3.

Queensland Government ICT Audit 2012: Appendices
283
Queensland Government ICT Audit 2012
Post MOG agency
Initiative and description Status Start date
End date Total estimated expenditure
Expenditure remaining
Comments
43. DETE ECEC Grants Management Solution
The scope of the project is to replace the current
ECEC grants applications with a contemporary
Grants Management Solution to manage the
end-to-end process of the grants lifecycle in
ECEC. As a result of the Universal Access to
Kindergarten legislation and other initiatives, the
ECEC anticipates funding approximately 2,000
service providers in the next four years and $90
million recurrent and capital grants per year, by
2014. The current solution to manage grants
relies on a legacy bespoke application from
DCCSDS that is non-compliant with DETE‘s
Enterprise Architecture and does not have the
capability to meet the current or future business
requirements.
Active
In progress -
delivery stage
Feb
2011
Jan 2013 $2,351,405 $705,000
44. QTT Project Link
formerly PCS/PCMS replacement
Replace the Claims Management systems (PCS
and PCMS) used by the Office of the Insurance
Commissioner (OIC) and its statutory authorities.
The project will identify, procure and implement
an insurance focussed business system that will
provide efficient and comprehensive functionality
to support industry best practice processes, for
both the CTP scheme and general insurance, in
a ‗leading edge‘ or ‗state-of-the-art‘ software
package.
Active
In progress -
delivery stage
Fully funded
through other
funding source
Mar
2012
Dec 2013 $2,000,000 $1,860,000
45. DSITIA -
CITEC
Public Safety Frontline Communications
The GWN will deliver a state-wide digital
communications network for mobile voice and
data for all operational public safety personnel.
Active
In early
planning
May
2012
TBA TBA TBA This is a multi-agency initiative led by
DSITIA that includes QPS and DCS.
A request for expression of interest was
released to industry in October 2012.