Embed Size (px)
Citation preview

Quel Profil Ecologique pour la Chine Industrialisée?
DR. CORALINE GORON
ULB, 7 MARCH 2018

The Challenge of
Decarbonization
Need to radically reduce use of fossil fuels to address climate change and reduce local air pollution problems
What is the power structure around the manufacturing of climate change and smog within industrializing societies?
Who leads whom in the power relationship between energy industries and states? What about China, the most rapidly industrializing economy?

0
100000
200000
300000
400000
500000
600000
700000
800000
19
78
19
80
19
82
19
84
19
86
19
88
19
90
19
92
19
94
19
96
19
98
20
00
20
02
20
04
20
06
20
08
20
10
20
12
20
14
China's GDP (unit: 100 million RMB)
0
500
1000
1500
2000
2500
3000
3500
4000
4500
1985 1990 1995 2000 2005 2010 2015 2020
Coal Consumption (unit: Million tons)
0,00
2000000,00
4000000,00
6000000,00
8000000,00
10000000,00
12000000,00
19
76
19
79
19
82
19
85
19
88
19
91
19
94
19
97
20
00
20
03
20
06
20
09
20
12
20
15
CO2 Emissions (Unit : kilo tons)
0
5
10
15
20
25
30
SO2 missions

Research
Question
and
Hypothesis
The thesis explores how, in China, the necessity to address environmental issues has transformed the way in
which the state exercises its power over the economy, particularly
over the electric power system.
The political recognition of the need to address environmental concerns has
increased the use of commands in the economy, and hindered efforts to
rationalise the use of political power over market development.

Method and
Concepts
Transformations
as the
Continuation of
the Politics of
Modern State
Formation
Transformation
Not a critical juncture
Not a transition
A political process involving ideologicalcontrontations and conflicts of interests
(Newell, Leach, 2015)
State
Not an Organisation
Not an objectively bounded entity separated
from society
A politicalenterprise acting on and
through the economy and society via the practice of
its institutions (Mitchell, 1991; Shue, 1988)

The Power Sector
Large social transformation and state power core
dilemmas involved in letting
states regulate individual
conducts, between freedom
and coercion, to induce such
change
Meaning of production of
electricity as a “Commanding
Height” of the Chinese Economy?
FIELDWORK
51 Interviews
1. Snowballing
2. Bottom-up
Participant activities
1. Energy industry
events
2. Wechat groups

Rise of the
Power System
From 79 GW in early 1980s to
1650 GW (of which 1050 GW
of coal-fired power) in 2016
Surpassed all predictions,
accelerated in the 2000s
0
1000000
2000000
3000000
4000000
5000000
6000000
Power Production by Source
coal oil gas biofuels waste nuclear
hydro geothermal solar PV solar thermal wind tide
(unit Gw/h)

Future
Expansion
increase threefold
by 2050, to reach
between 10, 000
and 15, 000 TW/h,
which would
necessitate a
capacity of 3630
GW

The Politics of Expansion and Market Creation
2008-12 reform2003 reform1996+98 reform1988+93 reform

Source: Wu et al, 2012. Based on data from the State Electric Regulatory Commission (SERC)
49%
13%
10%
28%
Five Major Power Companies
Other Centrally-Owned Power
Companies
Large Locally-Owned Power
Companies
Other Local and private/foreign Power
Companies
Creating Power Markets for State-Owned Champions

Power Market without Electricity Market Prices

“The power sector reform has basically failed (…) Absent a strong determination
and regulatory might, and without legal support, the power sector reforms have
met layers upon layers of resistance and ended up in stagnation, deadlock and
relapse: The development of power industry has not yet come out of the morass of
high-investment, high-consumption, high-pollution, high production costs and low
efficiency; the generation and the grids have not been thoroughly separated; the
reform of transmission and distribution is stuck, the corporatization of the industry
has been “emasculated”; power supply has expanded blindly; the development of
the grid has been chaotic, and monopolies have become more and more severely
entrenched” (M. Yang 2005)
Creating Power Markets without Independent Regulators

The meaning of ecological civilsation
0
5000
10000
15000
20000
25000
30000
35000
2000 2001 2002 2003 2004 2005 2006 2007 2008 2009 2010 2011 2012 2013 2014 2015 2016
Scientific Development, Ecocivilization and Low-Carbon Development in state
newspapers (CNKI) 2000-2016
Ecocivilization low carbon development Scientific Development

In 2012, the 18th Party Congress replaced
the “material civilisation and spiritual
civilisation” by a “Five in One”
comprehensive Party mission that
included “economic, political, cultural,
social and ecological civilisation
construction (经济建设、政治建设、文化建设、社会建设与生态文明建设的« 五位一体 »)
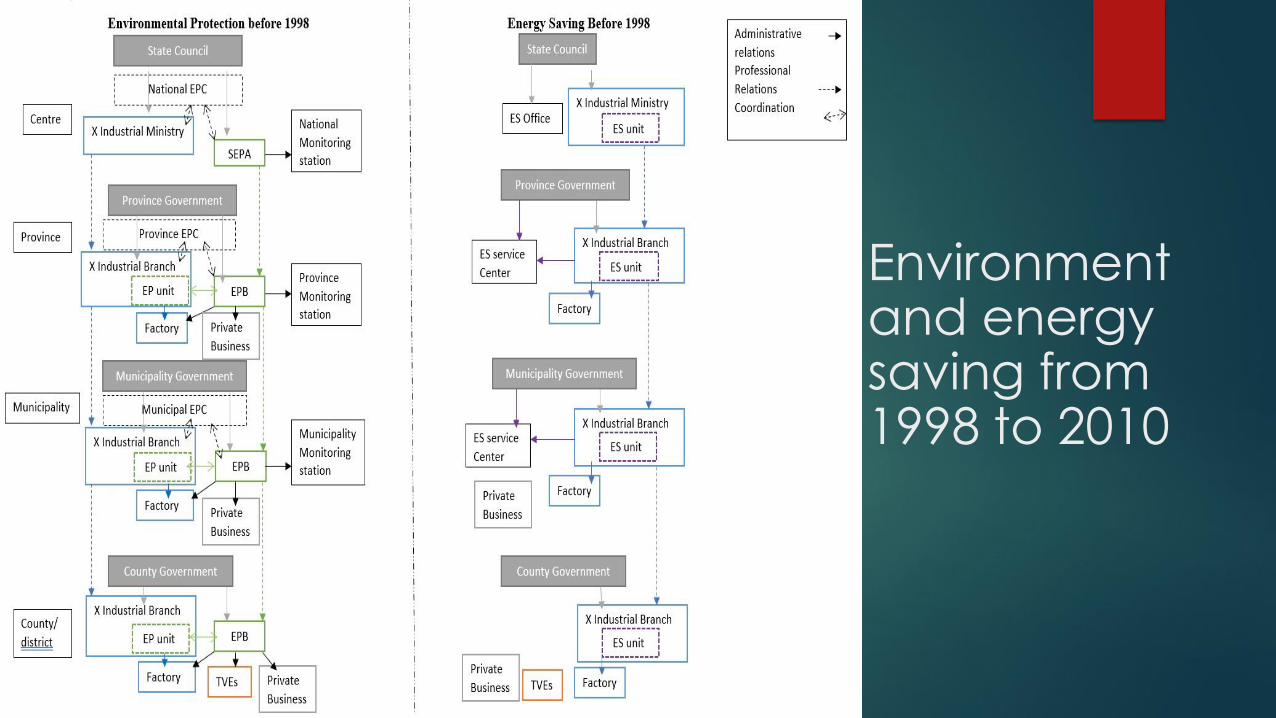
Environment and energy saving from 1998 to 2010


Case 1. Renewable Energy and the New Politics of Expansion
Rapid Expansion
reproducing the dynamics
of Market Expansion in the
Power Sector
Defective regulation: Unre-
formed Power System,
conflicts of redistribution
and curtailement

Rise of Wind
and Solar
Power
Installed
Capacity in
China341,6 403,5 469,8 568,1 764,9 1271,82559,4
5870,712024,4
25827,7
44734
62364
75324
91413
114763
145104
168690
19 24 42 52 62 70 80 100 140 284 864 29346500
19418
28199
43180
77420
0
20000
40000
60000
80000
100000
120000
140000
160000
180000
2000 2001 2002 2003 2004 2005 2006 2007 2008 2009 2010 2011 2012 2013 2014 2015 2016
TOTAL INSTALLED CAPACITY (MW)
total wind capacity total pv capacity

50%
31%
11%
3%
1%1%
1%
1% 1% 0%0%
10 Top Countries in Global Solar
PV Capacity in 2006
Germany
Japan
US
Spain
China
Italy
South Korea
India
France
Belgium
Rest of the World
28%
16%
16%
8%
4%
3%
3%
3%
2%2% 15%
10 Top Countries in global wind
capacity in 2006Germany
Spain
US
India
Denmark
China
Italy
UK
Portugal
France
Rest of the World
35%
17%10%
6%
5%3%
2%2%
2%2% 16%
10 Top Countries in Global Wind
Capacity in 2016China
US
Germany
India
Spain
UK
France
Canada
Brazil
Italy
Rest of the World
26%
14%
14%
13%
6%
4%
3%
2%2%
2%
14%
10 Top Countries in Global Solar
PV Capacity in 2016
China
Japan
Germany
US
Italy
UK
India
France
Australia
Spain
Rest of the World

Investors
’ ranking2009 2010 2011 2012 2013 2014
1
Guodian (inc
subsidiary
Longyuan)
Guodian
(inc
subsidiary
Longyuan)
Guodian
(inc
subsidiary
Longyuan)
Guodian
(inc
subsidiary
Longyuan)
Guodian (inc
subsidiary
Longyuan)
Guodian
(inc
subsidiary
Longyuan)
2 Datang Huaneng Datang Datang Datang Huaneng
3 Huaneng Datang Huaneng Huaneng Huaneng Datang
4 Huadian Huadian Huadian Huadian Huadian Huadian
5 Guohua CGN Guohua Guohua CGN CGN
6 CGN Guohua CPI CPI CPI CPI
7 Jingneng CPIChina
ResourcesCGN Guohua Guohua
8 CPIChina
ResourcesCGN
China
Resources
China
Resources
China
Resources
9 CECEP Jingneng Jingneng Jingneng Three Gorges Tianhun
10 Jointo HebeiChina
SuntianCECEP CECEP Jingneng
Three
Gorges
Combin
ed
Market
share
74 percent 74 percent 77 percent 75 percent 71 percent
Ten Major Wind Power Project Investors
Utility scale
onshore wind FIT
(Yuan/kwh) 2009 2015 2016 2018
2009
decision
2014
decision
2015 decision (for
2016 and 2018)
2016
Decisio
n
category I 0.51 0.49 0.47 0.44 0.4
category II 0.54 0.52 0.5 0.47 0.45
category III 0.58 0.56 0.54 0.51 0.49
category IV 0.61 0.61 0.6 0.58 0.57
China’s Feed-in-tariff for wind power (2009-2018)

Investors'
ranking2012 2013 2014
1 CPI CPI CPI
2 Guodian Guodian CECEP
3 CECEP CECEP Guodian
4 CGN Huadian Three Gorges
5 Datang Datang Huadian
6 Chint Group Huaneng Shufeng Guangdian
7 Huadian CGN Chint Group
8 Longyuan Chint Group Huaneng
9 Guotou Three Gorges CGN
10 Ningxia EnergyShunfeng
GuangdianDatang
Market
share
57.22 percent of
connected
capacity
49.2 percent of
connected
capacity
47.4 percent of
connected
capacity
Ten Major Large-scale Solar Power Projects Investors
2011 2013 2016 2017
2011
decision:
national FIT
2013 Decision: regional FIT
(Yuan/kwh)
2015
decision
2016
Decision
before
31/12/20111.15 category I 0.9 0.80 0.65
after
31/12/20111.00 category II 0.95 0.88 0.75
*
excep
t Tibet
category III 1.00 0.98 0.85
Distributed solar
FIT (national)0.42
Feed-in-Tariff for Solar Power (2011-2017)

wind power investments Solar power investments
wind power investments in 2015 Solar power investments in 2015
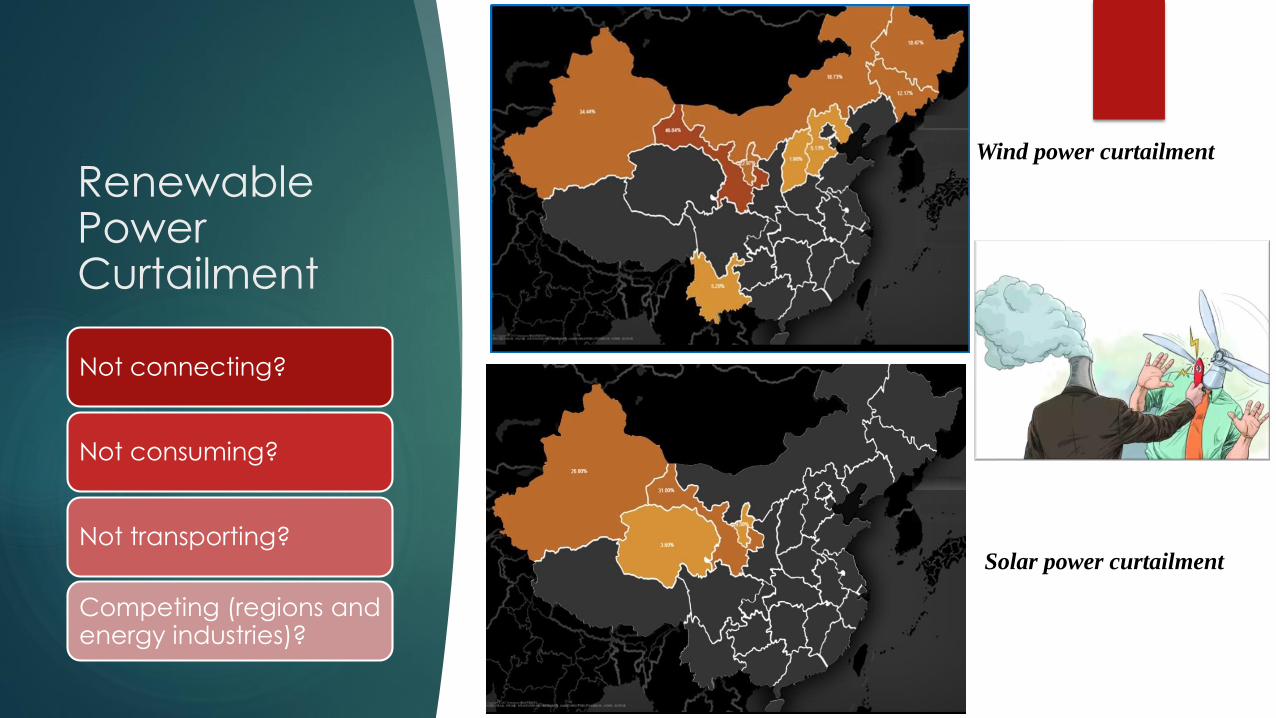
Renewable Power Curtailment
Not connecting?
Not consuming?
Not transporting?
Competing (regions and energy industries)?
Solar power curtailment
Wind power curtailment
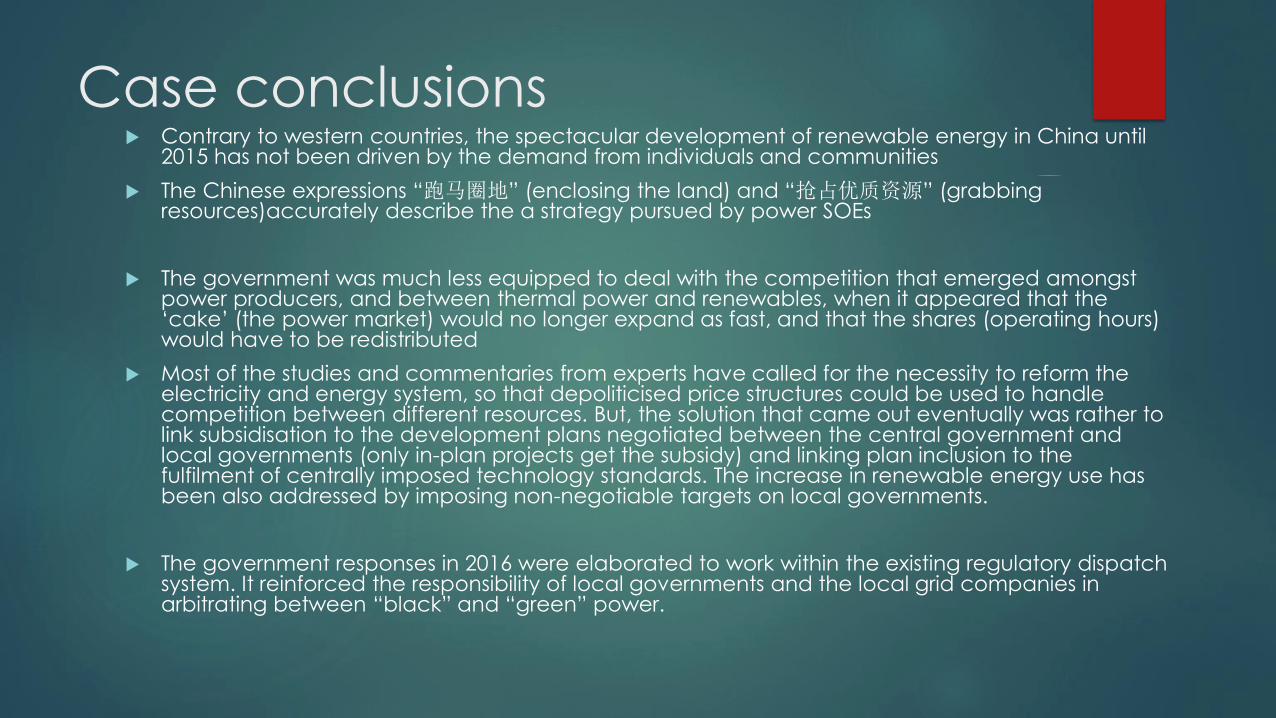
Case conclusions Contrary to western countries, the spectacular development of renewable energy in China until
2015 has not been driven by the demand from individuals and communities
The Chinese expressions “跑马圈地” (enclosing the land) and “抢占优质资源” (grabbing resources)accurately describe the a strategy pursued by power SOEs
The government was much less equipped to deal with the competition that emerged amongst power producers, and between thermal power and renewables, when it appeared that the ‘cake’ (the power market) would no longer expand as fast, and that the shares (operating hours) would have to be redistributed
Most of the studies and commentaries from experts have called for the necessity to reform the electricity and energy system, so that depoliticised price structures could be used to handle competition between different resources. But, the solution that came out eventually was rather to link subsidisation to the development plans negotiated between the central government and local governments (only in-plan projects get the subsidy) and linking plan inclusion to the fulfilment of centrally imposed technology standards. The increase in renewable energy use has been also addressed by imposing non-negotiable targets on local governments.
The government responses in 2016 were elaborated to work within the existing regulatory dispatch system. It reinforced the responsibility of local governments and the local grid companies in arbitrating between “black” and “green” power.

Case 2. The Energy Saving & Emissions Reduction Policy
11th FYP adoption of binding
environmental and energy
targets (环境与能源双重约束): 20 percent reduction of
energy intensity, and the 10
percent reduction of SO2 (and COD emissions) by 2010
Mobilisation of the Target-
Responsibility System
Re-invention of Responsibility
Contracts and Campaigns
‘Command
without control’
and
reliance on local
governments
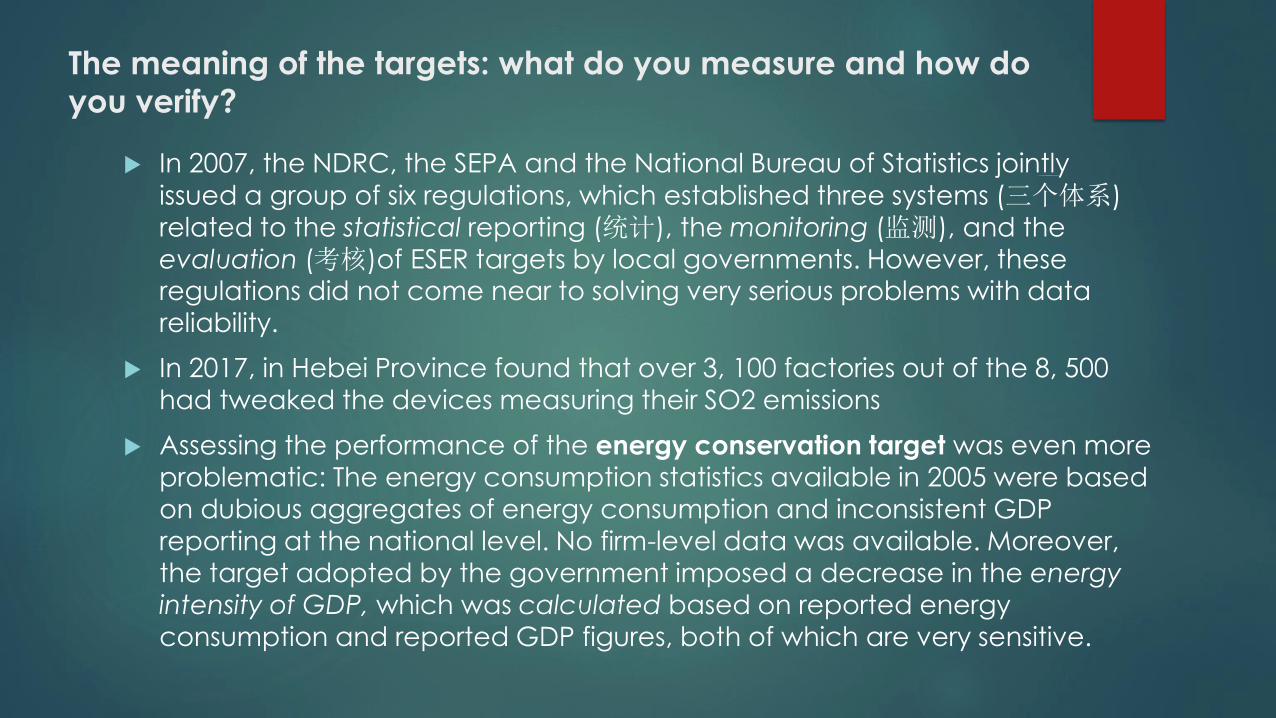
The meaning of the targets: what do you measure and how do
you verify?
In 2007, the NDRC, the SEPA and the National Bureau of Statistics jointly
issued a group of six regulations, which established three systems (三个体系)
related to the statistical reporting (统计), the monitoring (监测), and the evaluation (考核)of ESER targets by local governments. However, these regulations did not come near to solving very serious problems with data
reliability.
In 2017, in Hebei Province found that over 3, 100 factories out of the 8, 500
had tweaked the devices measuring their SO2 emissions
Assessing the performance of the energy conservation target was even more
problematic: The energy consumption statistics available in 2005 were based
on dubious aggregates of energy consumption and inconsistent GDP reporting at the national level. No firm-level data was available. Moreover,
the target adopted by the government imposed a decrease in the energy
intensity of GDP, which was calculated based on reported energy
consumption and reported GDP figures, both of which are very sensitive.

year 2005 2006 2007 2008 2009 2010
Energy intensity
of GDP (in TCE
per 10 thousand
Yuan)
2009 data
1.226 1.204 1.555 1.102
Energy intensity
of GDP (in Tce
per 10 thousand
Yuan)
2010 data
1.276 1.241 1.179 1.118 1.077 1.034
Decrease
(reported in
2009)
-1.79 -3.66 -4.21 -2.20
Decrease
Calculated
(reported in
2010)
-2.74 -5.04 -5.20 -3.61 -3.99
Energy Intensity Reduction in the 11th FYP According to the
Data Reported in 2010 Compared with the Data Reported in
2009
Source: data compiled by the author, based on the national Bureau of Statistics and Yuan et al. (2011) and X.
Wang (2011)
“The Gigatones’ gap”
In 2010, the national figure reported was 3.249
Mtce, but the aggregated data from the
Provinces was 3.895 Mtce, or 20 percent more.
Translated in CO2 emissions, this meant a gap
of 1.4 gigatons, equivalent to the annual
emissions of Japan (Guan et al. 2012)
= continuation of over-and under reporting by
local governments. The strong correlation
between GDP statistics and energy
consumption statistics pushes local officials to
fake the latter to cover up for the falsehood in
the former

if, in total, China’s energy intensity did decrease by 19.1 percent in
the 11th FYP, its energy consumption actually skyrocketed. The 11th
FYP for energy development indicated that the total energy
consumption by 2010 should ideally be limited to 2.7 Btce. However,
in 2007 this limit was already reached, and by 2010 it was 3.1 Btce.
Similar problems occurred at the individual firm level.
To remedy this situation, the 12th FYP mentioned for the first time the
need to control overall energy consumption and issued non-binding
guidance on absolute energy consumption targets to the Provinces.
adoption of the Energy Strategy (2014-2020) and the adoption of a
cap on coal consumption (as opposed to production) in the 13th
FYP.
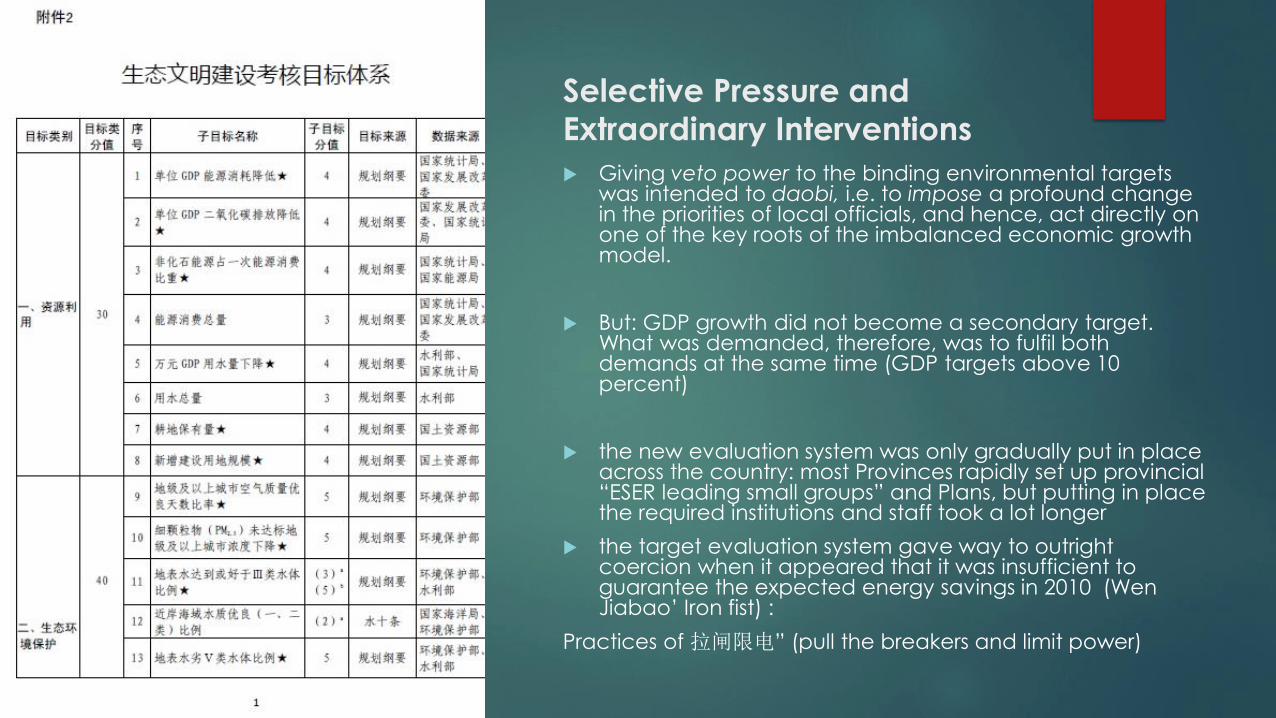
Selective Pressure and
Extraordinary Interventions
Giving veto power to the binding environmental targets was intended to daobi, i.e. to impose a profound change in the priorities of local officials, and hence, act directly on one of the key roots of the imbalanced economic growth model.
But: GDP growth did not become a secondary target. What was demanded, therefore, was to fulfil both demands at the same time (GDP targets above 10 percent)
the new evaluation system was only gradually put in place across the country: most Provinces rapidly set up provincial “ESER leading small groups” and Plans, but putting in place the required institutions and staff took a lot longer
the target evaluation system gave way to outright coercion when it appeared that it was insufficient to guarantee the expected energy savings in 2010 (Wen Jiabao’ Iron fist) :
Practices of 拉闸限电” (pull the breakers and limit power)
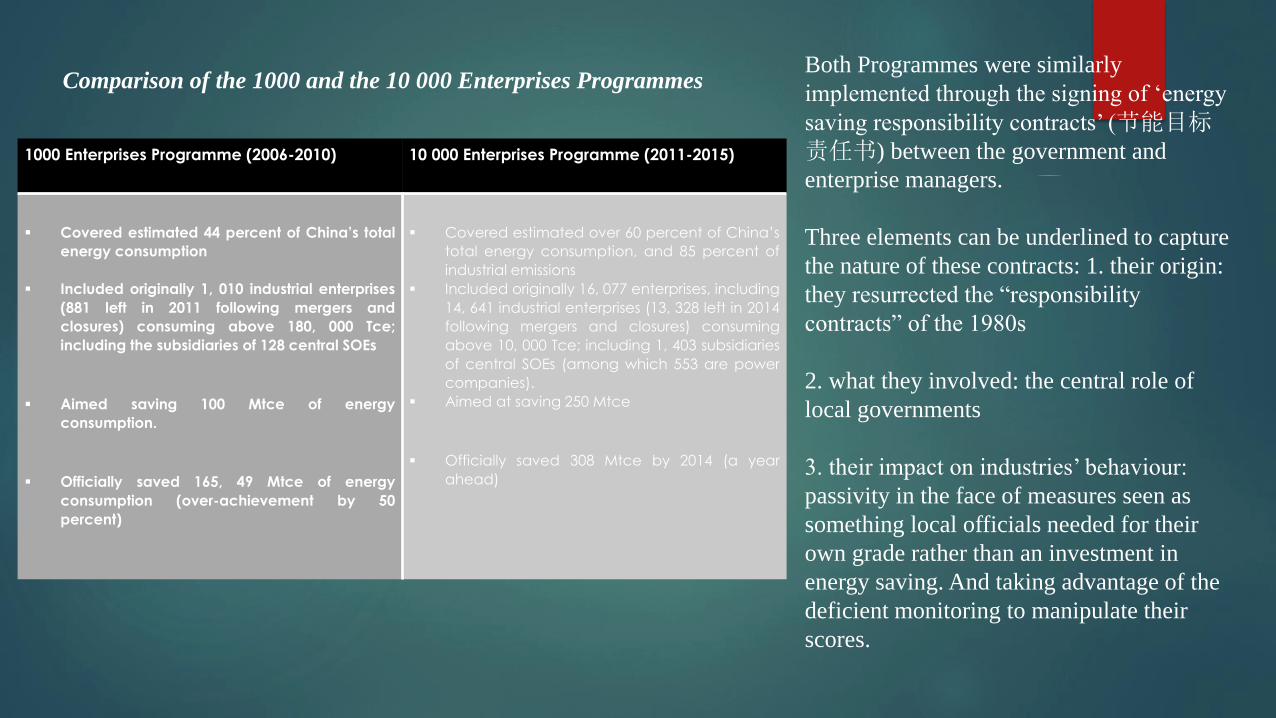
1000 Enterprises Programme (2006-2010) 10 000 Enterprises Programme (2011-2015)
▪ Covered estimated 44 percent of China’s total
energy consumption
▪ Included originally 1, 010 industrial enterprises
(881 left in 2011 following mergers and
closures) consuming above 180, 000 Tce;
including the subsidiaries of 128 central SOEs
▪ Aimed saving 100 Mtce of energy
consumption.
▪ Officially saved 165, 49 Mtce of energy
consumption (over-achievement by 50
percent)
▪ Covered estimated over 60 percent of China’s
total energy consumption, and 85 percent of
industrial emissions
▪ Included originally 16, 077 enterprises, including
14, 641 industrial enterprises (13, 328 left in 2014
following mergers and closures) consuming
above 10, 000 Tce; including 1, 403 subsidiaries
of central SOEs (among which 553 are power
companies).
▪ Aimed at saving 250 Mtce
▪ Officially saved 308 Mtce by 2014 (a year
ahead)
Comparison of the 1000 and the 10 000 Enterprises ProgrammesBoth Programmes were similarly
implemented through the signing of ‘energy
saving responsibility contracts’ (节能目标责任书) between the government and
enterprise managers.
Three elements can be underlined to capture
the nature of these contracts: 1. their origin:
they resurrected the “responsibility
contracts” of the 1980s
2. what they involved: the central role of
local governments
3. their impact on industries’ behaviour:
passivity in the face of measures seen as
something local officials needed for their
own grade rather than an investment in
energy saving. And taking advantage of the
deficient monitoring to manipulate their
scores.

Closing Small Capacity Campaigns
46.25 GW, or 64 percent of the total 72.1 GW reported closures operated in the 11th FYP was closed in that last year alone, which would tend to validate the media reports that denounced the excessive brutality on the part of local governments in the implementation of the emissions reductions targets in the last months.
, in 1996 the central government had already conducted a campaign against the “twelve small” Township and Village Enterprises, including small coal mines and power plants.
The main change in 2007 was the fact that the closure was now directly linked to the officials’ personal evaluations
another very important tool managed directly by the NDRC was the “build big-close small” (上大压小): the approval of new large power projects would depend on a commitment by power firms to phase out designated smaller and backward facilities. The closures lists were decided at the discretion of local governments.
The strategy often met with resistance from these industries and the lower (county level) governments relying on them for tax income

Attempting to use the Invisible Hand of the Market
Differentiated electricity prices:
0.015 yuan/kWh would be paid to the power
plants equipped with desulphurisation filters, in
addition to the provincial benchmark coal-
fired on-grid electricity tariffs (脱硫机组电价). At the same time, small and backward power
plants were no longer allowed to receive a
higher price than the benchmark price:
problem with dispatch system
On the retail side, the differentiated and
punitive prices imposed on polluting industries,
adopted at the national level, could be
applied with various levels of stringency
Carbon markets

Case conclusions
instead of dismantling the target responsibility system and reinforcing the legal and regulatory apparatus, the CPC decided instead to make it a central piece of its new development strategy.
Mostly, it assigned new purposes to it, by acting on the hierarchy of priorities in the responsibility system commanding to the evaluation and the careers of local officials
According to an interlocutors in the central government research unit, to obtain a real low-carbon transformation, it was necessary to force the hand of local officials.
However, the top-down imposition of targets has always had perverse effects. Kostka correctly emphasised that the targets themselves, being pushed down to the local level, would often become inappropriate, rigid, and inflated. The original unfairness and, sometimes, simply the impossibility of achieving the announced objectives encouraged selective, negligent and sometimes dishonest implementation practices.

Conclusions
The main consequence of the hange in the official doctrine of the CPC was the multiplication of environmental targets and campaign-style pursuit of environmental goals, which amplified the power of officials in local economies.
However, the sometimes arbitrary and brutal implementation of environmental goals has triggered resistance, undermining the construction of a rule-based state power in China.
China’s decarbonisation politics have carried on the expansionary economic logic that characterised earlier decades of the reform era, while multiplying the reasons for the political interventions aimed at correcting perceived excesses.
from the 1970s until today, the basic dilemma of industrialising and growing while protecting the environment remained unresolved. In 2015 after three decades of intense industrialisation and pollution, China is still faced with the challenge to “keep growing while simultaneously reducing environmental and resource cost and emissions” (D. Ma 2015).

Conclusions - continued The structures of the Chinese Party-state, which were developed in the
reform era to spur and re-form the state around the emerging market, have constrained the extent to which the recognition of environmental concerns in the Party Doctrine enabled institutional change:
the Target-Responsibility System (TRS) was specifically mobilised to tie the careers of local officials to the achievement of a limited number of quantified environmental targets.
unresolved tensions between control and regulation have affected evolution of China’s power sector in the reform era. This is most visible in the way that the administrative electric power dispatch system has operated under the administrative control of local governments and local grid companies, which has constrained both the integration of renewable energy in the power system and the effectiveness of policies introduced to encourage a more efficient use of energy.