Embed Size (px)
Citation preview
-25.0
-20.0
-15.0
-10.0
-5.0
0.0
5.0
0w 4w 8w 12w
全脂肪面積変化量
対照飲料
被験飲料
***,###
***,###
(cm2)
-25.0
-20.0
-15.0
-10.0
-5.0
0.0
5.0
0w 4w 8w 12w
内臓脂肪面積変化量
対照飲料
被験飲料
***,##
***,###
(cm2)
** *****
-25.0
-20.0
-15.0
-10.0
-5.0
0.0
5.0
0w 4w 8w 12w
皮下脂肪面積変化量
対照飲料
被験飲料
#
**,###
(cm2) *
●●
●
●
●
●
●
●
●
●
●
●
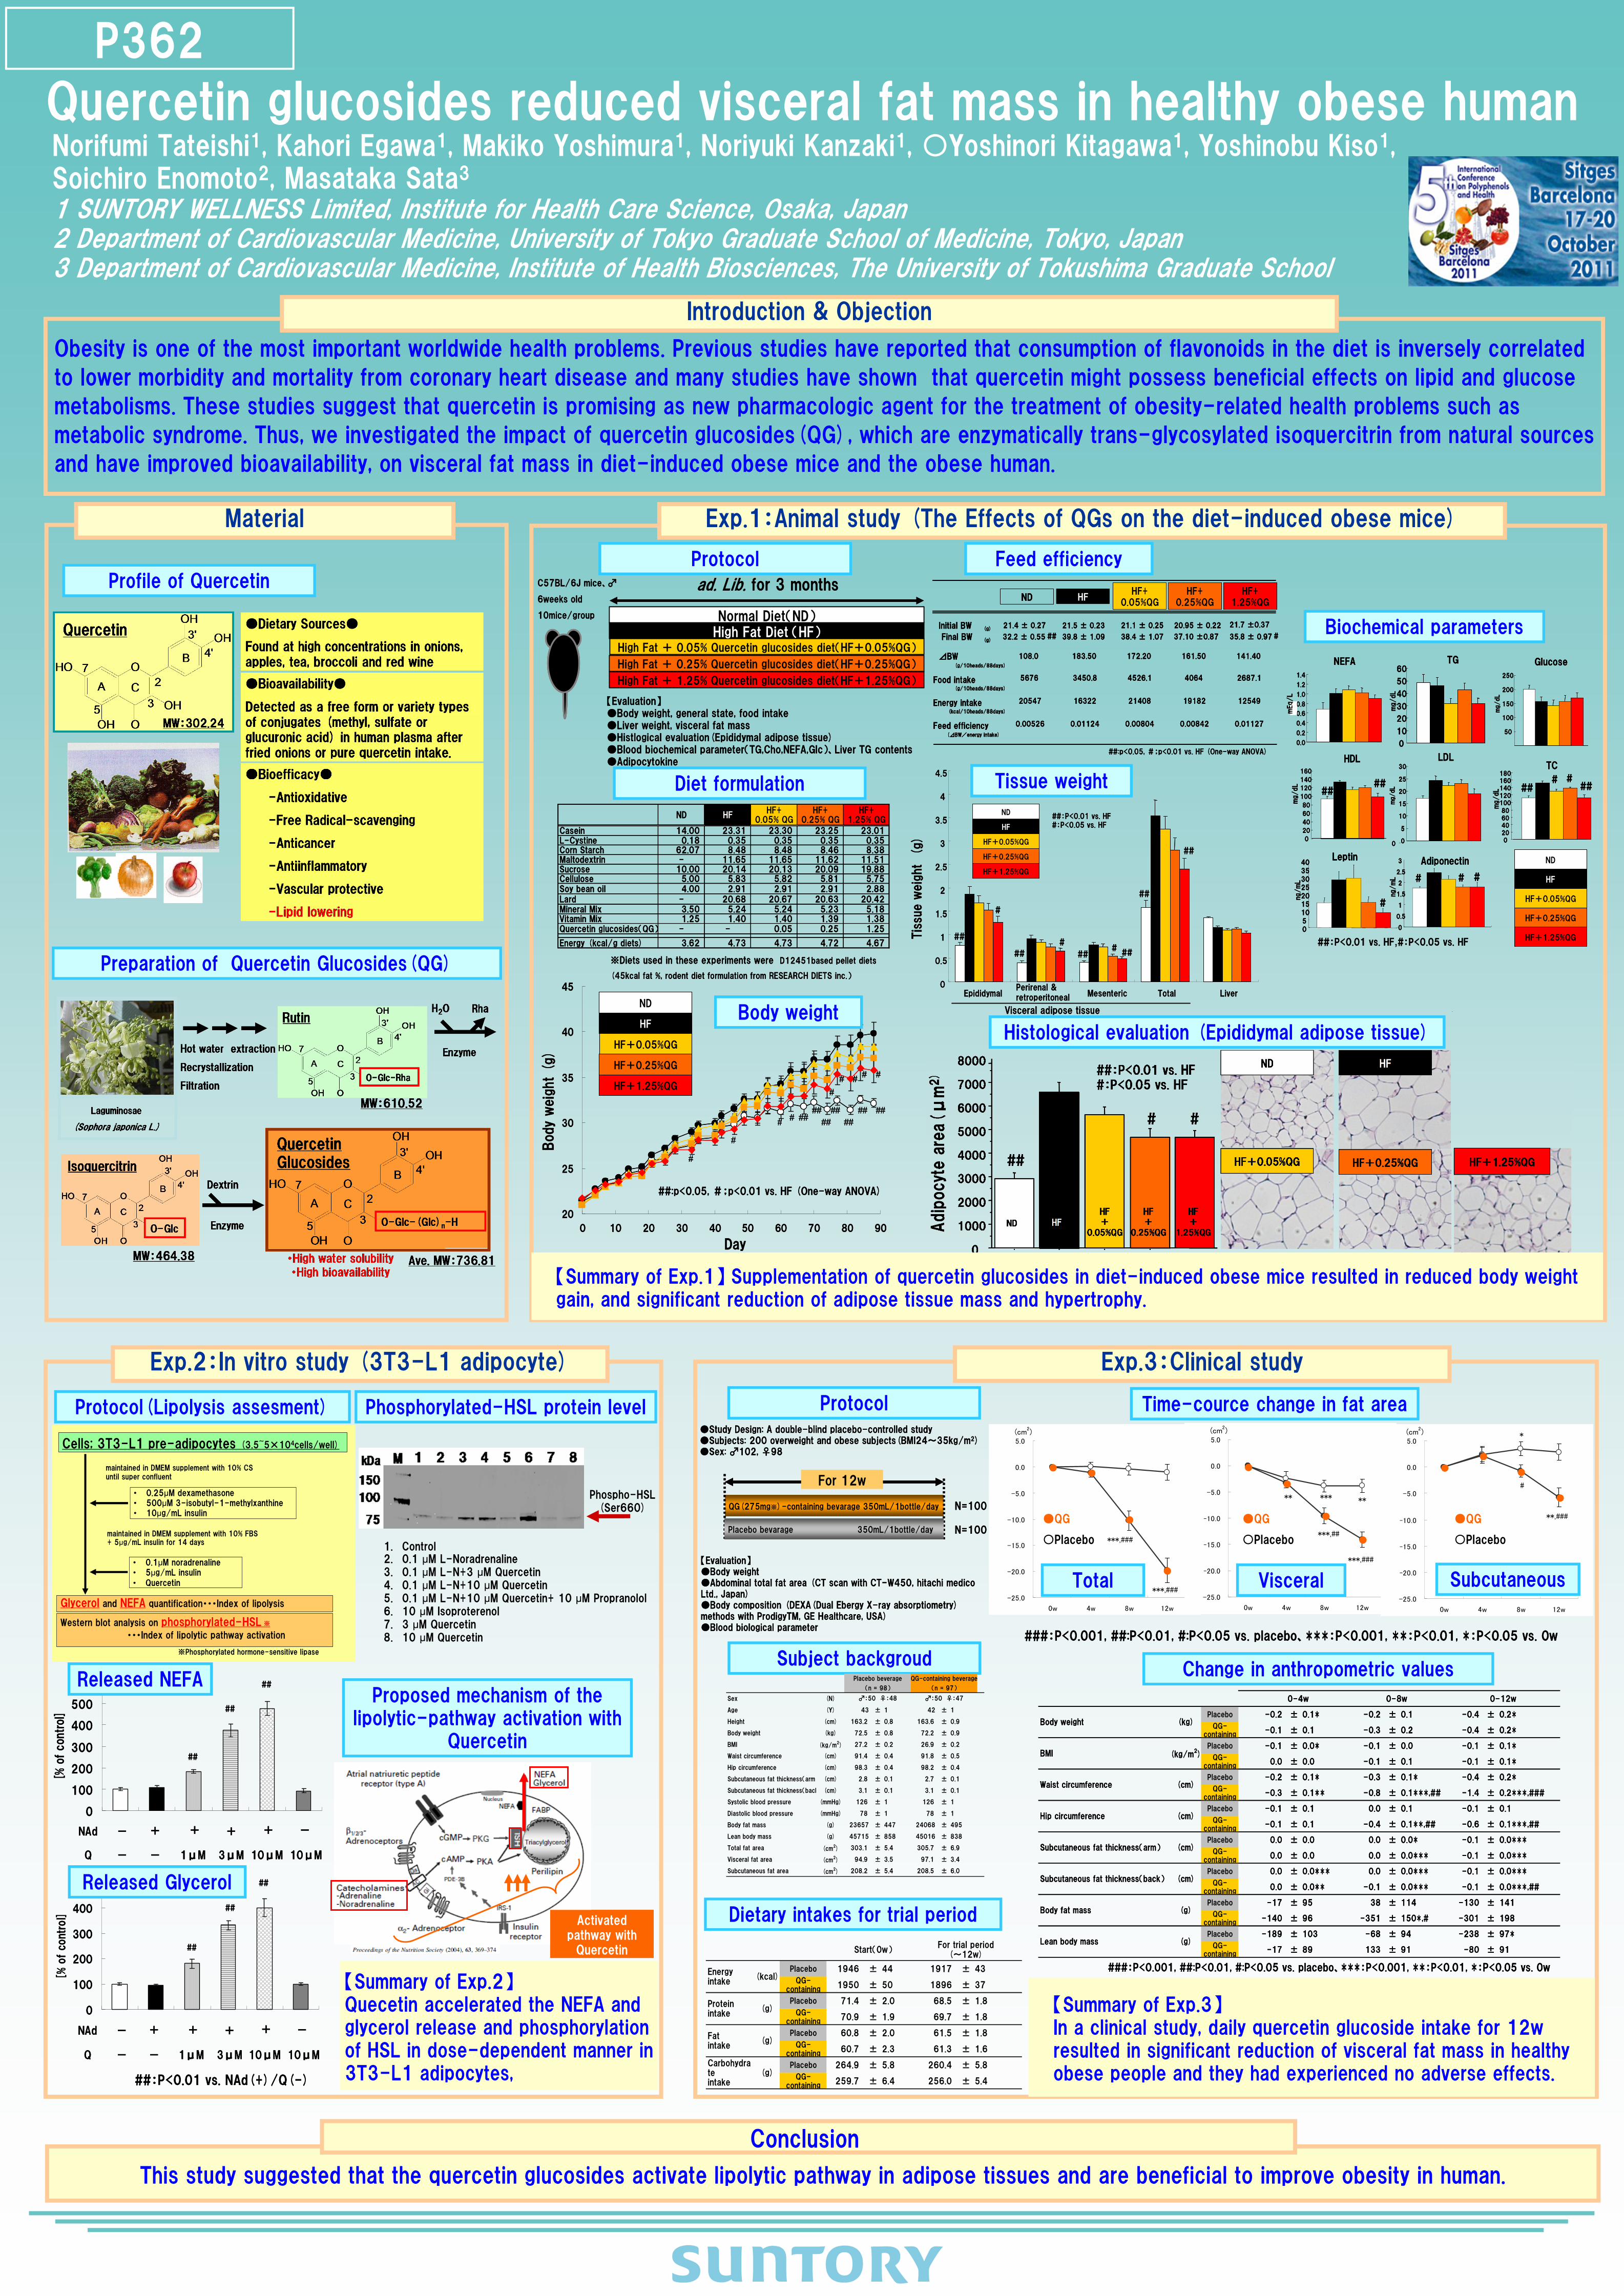
###:P<0.001, ##:P<0.01, #:P<0.05 vs. placebo、***:P<0.001, **:P<0.01, *:P<0.05 vs. 0w
-25.0
-20.0
-15.0
-10.0
-5.0
0.0
5.0
0w 4w 8w 12w
全脂肪面積変化量
対照飲料
被験飲料
***,###
***,###
(cm2)
-25.0
-20.0
-15.0
-10.0
-5.0
0.0
5.0
0w 4w 8w 12w
内臓脂肪面積変化量
対照飲料
被験飲料
***,##
***,###
(cm2)
** *****
-25.0
-20.0
-15.0
-10.0
-5.0
0.0
5.0
0w 4w 8w 12w
皮下脂肪面積変化量
対照飲料
被験飲料
#
**,###
(cm2) *
●●
●
●
●
●
●
●
●
●
●
●
###:P<0.001, ##:P<0.01, #:P<0.05 vs. placebo、***:P<0.001, **:P<0.01, *:P<0.05 vs. 0w
Obesity is one of the most important worldwide health problems. Previous studies have reported that consumption of flavonoids in the diet is inversely correlated
to lower morbidity and mortality from coronary heart disease and many studies have shown that quercetin might possess beneficial effects on lipid and glucose
metabolisms. These studies suggest that quercetin is promising as new pharmacologic agent for the treatment of obesity-related health problems such as
metabolic syndrome. Thus, we investigated the impact of quercetin glucosides(QG), which are enzymatically trans-glycosylated isoquercitrin from natural sources
and have improved bioavailability, on visceral fat mass in diet-induced obese mice and the obese human.
Introduction & Objection
This study suggested that the quercetin glucosides activate lipolytic pathway in adipose tissues and are beneficial to improve obesity in human.
P362
Conclusion
Quercetin glucosides reduced visceral fat mass in healthy obese human Norifumi Tateishi1, Kahori Egawa1, Makiko Yoshimura1, Noriyuki Kanzaki1, ○Yoshinori Kitagawa1, Yoshinobu Kiso1, Soichiro Enomoto2, Masataka Sata3
1 SUNTORY WELLNESS Limited, Institute for Health Care Science, Osaka, Japan2 Department of Cardiovascular Medicine, University of Tokyo Graduate School of Medicine, Tokyo, Japan3 Department of Cardiovascular Medicine, Institute of Health Biosciences, The University of Tokushima Graduate School
Profile of Quercetin
Material
Preparation of Quercetin Glucosides(QG)
Exp.1:Animal study (The Effects of QGs on the diet-induced obese mice)
Protocol
ND HFHF+
0.05% QGHF+
0.25% QGHF+
1.25% QG
Casein 14.00 23.31 23.30 23.25 23.01L-Cystine 0.18 0.35 0.35 0.35 0.35Corn Starch 62.07 8.48 8.48 8.46 8.38Maltodextrin - 11.65 11.65 11.62 11.51Sucrose 10.00 20.14 20.13 20.09 19.88Cellulose 5.00 5.83 5.82 5.81 5.75Soy bean oil 4.00 2.91 2.91 2.91 2.88Lard - 20.68 20.67 20.63 20.42Mineral Mix 3.50 5.24 5.24 5.23 5.18Vitamin Mix 1.25 1.40 1.40 1.39 1.38Quercetin glucosides(QG) - - 0.05 0.25 1.25
Energy (kcal/g diets) 3.62 4.73 4.73 4.72 4.67
※Diets used in these experiments were D12451based pellet diets
(45kcal fat %, rodent diet formulation from RESEARCH DIETS inc.)
Diet formulation
##:p<0.05, #;p<0.01 vs. HF (One-way ANOVA)
HF+0.05%QG
HF
ND
HF+0.25%QG
HF+1.25%QG
20
25
30
35
40
45
0 10 20 30 40 50 60 70 80 90
Day
Body
weig
ht
(g)
#
#
####
#
####
##
##
##
#####
#
##:p<0.05, #;p<0.01 vs. HF (One-way ANOVA)
HF+0.05%QG
HF
ND
HF+0.25%QG
HF+1.25%QG
20
25
30
35
40
45
0 10 20 30 40 50 60 70 80 90
Day
Body
weig
ht
(g)
#
#
####
#
####
##
##
##
#####
#
Feed efficiency
Exp.2:In vitro study (3T3-L1 adipocyte) Exp.3:Clinical study
Histological evaluation (Epididymal adipose tissue)
0
0.5
1
1.5
2
2.5
3
3.5
4
4.5
EpididymalPerirenal & retroperitoneal Mesenteric Total Liver
Tis
sue w
eig
ht (
g)
Visceral adipose tissue
##
##:P<0.01 vs. HF#:P<0.05 vs. HF
HF+0.05%QG
HF
ND
HF+0.25%QG
HF+1.25%QG
## ## ##
##
##
##
#
0
0.5
1
1.5
2
2.5
3
3.5
4
4.5
EpididymalPerirenal & retroperitoneal Mesenteric Total Liver
Tis
sue w
eig
ht (
g)
Visceral adipose tissue
##
##:P<0.01 vs. HF#:P<0.05 vs. HF
HF+0.05%QG
HF
ND
HF+0.25%QG
HF+1.25%QG
## ## ##
##
##
##
#
Biochemical parameters
TG
0
10
20
30
40
50
60
mg/dL
NEFA
0.0
0.2
0.4
0.6
0.8
1.0
1.2
1.4
mEq/L
Glucose
50
100
150
200
250
mg/dL
05101520
25303540
Leptin
ng/m
L
#
0
0.5
1
1.5
2
2.5
3 Adiponectin
ng/m
L # ##
HDL
0
20
40
60
80
100
120
140
160
mg/dL
####
LDL
0
5
10
15
20
25
30
mg/dL
0
#
020406080
100120140160180
mg/dL
TC
###
##
##:P<0.01 vs. HF,#:P<0.05 vs. HF
HF+0.05%QG
HF
ND
HF+0.25%QG
HF+1.25%QG
TG
0
10
20
30
40
50
60
mg/dL
TG
0
10
20
30
40
50
60
mg/dL
NEFA
0.0
0.2
0.4
0.6
0.8
1.0
1.2
1.4
mEq/L
NEFA
0.0
0.2
0.4
0.6
0.8
1.0
1.2
1.4
mEq/L
Glucose
50
100
150
200
250
mg/dL
Glucose
50
100
150
200
250
mg/dL
05101520
25303540
Leptin
ng/m
L
#
05101520
25303540
Leptin
ng/m
L
#
0
0.5
1
1.5
2
2.5
3 Adiponectin
ng/m
L # ##
0
0.5
1
1.5
2
2.5
3 Adiponectin
ng/m
L # ##
HDL
0
20
40
60
80
100
120
140
160
mg/dL
####
HDL
0
20
40
60
80
100
120
140
160
mg/dL
####
LDL
0
5
10
15
20
25
30
mg/dL
0
LDL
0
5
10
15
20
25
30
mg/dL
0
#
020406080
100120140160180
mg/dL
TC
###
###
020406080
100120140160180
mg/dL
TC
###
##
##:P<0.01 vs. HF,#:P<0.05 vs. HF
HF+0.05%QG
HF
ND
HF+0.25%QG
HF+1.25%QG
Proposed mechanism of the lipolytic-pathway activation with
Quercetin
Protocol(Lipolysis assesment)
0
100
200
300
400
500
600
[% o
f control]
NAd
Q
- -
- - 1μM
+ + + +
3μM 10μM 10μM
##
##
##
0
100
200
300
400
500
[% o
f control]
NAd
Q
- -
- - 1μM
+ + + +
3μM 10μM 10μM
##
##
##
##:P<0.01 vs. NAd(+)/Q(-)
0
100
200
300
400
500
600
[% o
f control]
NAd
Q
- -
- - 1μM
+ + + +
3μM 10μM 10μM
##
##
##
0
100
200
300
400
500
[% o
f control]
NAd
Q
- -
- - 1μM
+ + + +
3μM 10μM 10μM
##
##
##
##:P<0.01 vs. NAd(+)/Q(-)
Released NEFA
Released Glycerol
Phosphorylated-HSL protein level Protocol
Subject backgroud
Dietary intakes for trial period
Start(0w)For trial period
(~12w)
Placebo 1946 ± 44 1917 ± 43
QG-containing
1950 ± 50 1896 ± 37
Placebo 71.4 ± 2.0 68.5 ± 1.8
QG-containing
70.9 ± 1.9 69.7 ± 1.8
Placebo 60.8 ± 2.0 61.5 ± 1.8
QG-containing
60.7 ± 2.3 61.3 ± 1.6
Placebo 264.9 ± 5.8 260.4 ± 5.8
QG-containing
259.7 ± 6.4 256.0 ± 5.4
Fatintake
(g)
Carbohydrateintake
(g)
Energyintake
(kcal)
Proteinintake
(g)
Time-cource change in fat area
Total Visceral Subcutaneous
Placebo beverage QG-containing beverage
(n = 98) (n = 97)
Sex (N)
Age (Y) 43 ± 1 42 ± 1
Height (cm) 163.2 ± 0.8 163.6 ± 0.9
Body weight (kg) 72.5 ± 0.8 72.2 ± 0.9
BMI (kg/m2) 27.2 ± 0.2 26.9 ± 0.2
Waist circumference (cm) 91.4 ± 0.4 91.8 ± 0.5
Hip circumference (cm) 98.3 ± 0.4 98.2 ± 0.4
Subcutaneous fat thickness(arm) (cm) 2.8 ± 0.1 2.7 ± 0.1
Subcutaneous fat thickness(back) (cm) 3.1 ± 0.1 3.1 ± 0.1
Systolic blood pressure (mmHg) 126 ± 1 126 ± 1
Diastolic blood pressure (mmHg) 78 ± 1 78 ± 1
Body fat mass (g) 23657 ± 447 24068 ± 495
Lean body mass (g) 45715 ± 858 45016 ± 838
Total fat area (cm2) 303.1 ± 5.4 305.7 ± 6.9
Visceral fat area (cm2) 94.9 ± 3.5 97.1 ± 3.4
Subcutaneous fat area (cm2) 208.2 ± 5.4 208.5 ± 6.0
♂:50 ♀:48 ♂:50 ♀:47
Change in anthropometric values
【Summary of Exp.2】Quecetin accelerated the NEFA and glycerol release and phosphorylation of HSL in dose-dependent manner in 3T3-L1 adipocytes,
【Summary of Exp.3】In a clinical study, daily quercetin glucoside intake for 12w resulted in significant reduction of visceral fat mass in healthy obese people and they had experienced no adverse effects.
【Summary of Exp.1】 Supplementation of quercetin glucosides in diet-induced obese mice resulted in reduced body weight gain, and significant reduction of adipose tissue mass and hypertrophy.
Initial BW (g) 21.4 ± 0.27 21.5 ± 0.23 21.1 ± 0.25 20.95 ± 0.22 21.7 ±0.37
Final BW (g)32.2 ± 0.55 ## 39.8 ± 1.09 38.4 ± 1.07 37.10 ±0.87 35.8 ± 0.97 #
⊿BW(g/10heads/88days)
Food intake(g/10heads/88days)
Energy intake(kcal/10heads/88days)
Feed efficiency(⊿BW/energy intake)
0.01127
20547 16322 21408 19182 12549
0.00526 0.01124 0.00804 0.00842
108.0 183.50 172.20
5676 3450.8 4526.1 4064 2687.1
161.50 141.40
ND HFHF+
0.05%QGHF+
0.25%QGHF+
1.25%QG
##:p<0.05, #;p<0.01 vs. HF (One-way ANOVA)
Initial BW (g) 21.4 ± 0.27 21.5 ± 0.23 21.1 ± 0.25 20.95 ± 0.22 21.7 ±0.37
Final BW (g)32.2 ± 0.55 ## 39.8 ± 1.09 38.4 ± 1.07 37.10 ±0.87 35.8 ± 0.97 #
⊿BW(g/10heads/88days)
Food intake(g/10heads/88days)
Energy intake(kcal/10heads/88days)
Feed efficiency(⊿BW/energy intake)
0.01127
20547 16322 21408 19182 12549
0.00526 0.01124 0.00804 0.00842
108.0 183.50 172.20
5676 3450.8 4526.1 4064 2687.1
161.50 141.40
ND HFHF+
0.05%QGHF+
0.25%QGHF+
1.25%QG
##:p<0.05, #;p<0.01 vs. HF (One-way ANOVA)
Body weight
Tissue weight
【Evaluation】●Body weight, general state, food intake●Liver weight, visceral fat mass●Histlogical evaluation(Epididymal adipose tissue)●Blood biochemical parameter(TG,Cho,NEFA,Glc)、Liver TG contents●Adipocytokine
High Fat + 0.05% Quercetin glucosides diet(HF+0.05%QG)
High Fat Diet (HF)Normal Diet(ND)
ad. Lib. for 3 monthsC57BL/6J mice、♂
6weeks old
10mice/group
High Fat + 0.25% Quercetin glucosides diet(HF+0.25%QG)
High Fat + 1.25% Quercetin glucosides diet(HF+1.25%QG)
Activated pathway with
Quercetin
Activated pathway with
Quercetin
QG(275mg※)-containing bevarage 350mL/1bottle/day
For 12w
●Study Design: A double-blind placebo-controlled study●Subjects: 200 overweight and obese subjects(BMI24~35kg/m2)●Sex: ♂102, ♀98
N=100
Placebo bevarage 350mL/1bottle/day N=100
【Evaluation】●Body weight●Abdominal total fat area (CT scan with CT-W450, hitachi medico Ltd., Japan)●Body composition (DEXA(Dual Ebergy X-ray absorptiometry) methods with ProdigyTM, GE Healthcare, USA)●Blood biological parameter
0-4w 0-8w 0-12w
Placebo -0.2 ± 0.1* -0.2 ± 0.1 -0.4 ± 0.2*
QG-containing
-0.1 ± 0.1 -0.3 ± 0.2 -0.4 ± 0.2*
Placebo -0.1 ± 0.0* -0.1 ± 0.0 -0.1 ± 0.1*
QG-containing
0.0 ± 0.0 -0.1 ± 0.1 -0.1 ± 0.1*
Placebo -0.2 ± 0.1* -0.3 ± 0.1* -0.4 ± 0.2*
QG-containing
-0.3 ± 0.1** -0.8 ± 0.1***,## -1.4 ± 0.2***,###
Placebo -0.1 ± 0.1 0.0 ± 0.1 -0.1 ± 0.1
QG-containing
-0.1 ± 0.1 -0.4 ± 0.1**,## -0.6 ± 0.1***,##
Placebo 0.0 ± 0.0 0.0 ± 0.0* -0.1 ± 0.0***
QG-containing
0.0 ± 0.0 0.0 ± 0.0*** -0.1 ± 0.0***
Placebo 0.0 ± 0.0*** 0.0 ± 0.0*** -0.1 ± 0.0***
QG-containing
0.0 ± 0.0** -0.1 ± 0.0*** -0.1 ± 0.0***,##
Placebo -17 ± 95 38 ± 114 -130 ± 141
QG-containing
-140 ± 96 -351 ± 150*,# -301 ± 198
Placebo -189 ± 103 -68 ± 94 -238 ± 97*
QG-containing
-17 ± 89 133 ± 91 -80 ± 91
Waist circumference (cm)
Hip circumference (cm)
Body weight (kg)
BMI (kg/m2)
Subcutaneous fat thickness(arm) (cm)
Lean body mass (g)
Body fat mass (g)
Subcutaneous fat thickness(back) (cm)
###:P<0.001, ##:P<0.01, #:P<0.05 vs. placebo、***:P<0.001, **:P<0.01, *:P<0.05 vs. 0w
●QG
○Placebo
●QG
○Placebo
●QG
○Placebo
Glycerol and NEFA quantification・・・Index of lipolysis
Cells; 3T3-L1 pre-adipocytes (3.5~5×10⁴cells/well)
maintained in DMEM supplement with 10% CSuntil super confluent
• 0.25µM dexamethasone• 500µM 3-isobutyl-1-methylxanthine• 10µg/mL insulin
maintained in DMEM supplement with 10% FBS+ 5µg/mL insulin for 14 days
• 0.1µM noradrenaline• 5µg/mL insulin
• Quercetin
Western blot analysis on phosphorylated-HSL ※
・・・Index of lipolytic pathway activation
※Phosphorylated hormone-sensitive lipase
1. Control2. 0.1 µM L-Noradrenaline3. 0.1 µM L-N+3 µM Quercetin4. 0.1 µM L-N+10 µM Quercetin5. 0.1 µM L-N+10 µM Quercetin+ 10 µM Propranolol6. 10 µM Isoproterenol7. 3 µM Quercetin8. 10 µM Quercetin
Phospho-HSL (Ser660)