Embed Size (px)
Citation preview

STATE COUNCIL OF EDUCATIONAL RESEARCH &TRAINING
VARUN MARG, DEFENCE COLONY, NEW DELHI
Question Bank With Solution
For Class XII
PGT (Economics)
Chief Advisor
Ms. Rashmi Krishnan, Director, SCERT
Advisors
Dr. Pratibha Sharma, Joint Director, SCERT
Mohammad Zamir, Principal, DIET Keshav Puram
Co- ordinators
Dr. Seema Srivastava, Sr. Lecturer, DIET, Moti Bagh
Ms. Meenakshi Yadav, Sr. Lecturer, SCERT
Contributors
Dr. Seema Srivastava, Sr. Lecturer, DIET, Moti Bagh
Ms. Meenakshi Yadav, Sr. Lecturer, SCERT
Mr Bharat Thakur, PGT (Economics) RPVV, Surajmal Vihar

Support MaterialFor
Teachers
InEconomics – Class XII
Co-ordinators : Dr. Seema Srivastava
Ms. Meenakshi Yadav
Contributors: Dr. Seema Srivastava
Ms. Meenakshi Yadav
Mr.Bharat Thakur
Technical Support : Sh. Mukesh Yadav
Ms. Radha
Question Bank
Economics – Class XIIUnit Coverage- 3&4 (Producers’ Equilibrium& Market Competition)
Abstract
Friends, till now we were uploading support material in content areas from the week-wise syllabus from July, 2011.In this section we intend to give you different types of questions based on Board pattern along with expected Answers /Solutions. Hope this will enable you to prepare students accordingly. As preparing test - items for a balanced question paper is an art, answering appropriately and precisely is also a skill which we have to equip our children with. Understanding the question and using appropriate terminology. Language for framing answers is very important for high scoring in examinations. This requires practice and teachers play an important role in providing this skill in class rooms. This is an exemplar, try your own question- bank preparation based on small section of content covered.
I Question Bank (with Answer/Solution)
Producers Behavior and Supply
Very Short answer Type Questions (1 mark)
1 How does fall in total product affect marginal product?
2 Which Cost Curve is parallel to OX- axis? Why?
3 What do you mean by Fixed Factors of Production?
4 What is meant by Market Period?
5 What causes a downward Movement along the Curve?
6 When does the Elasticity of Supply of commodity is equal to Unity?
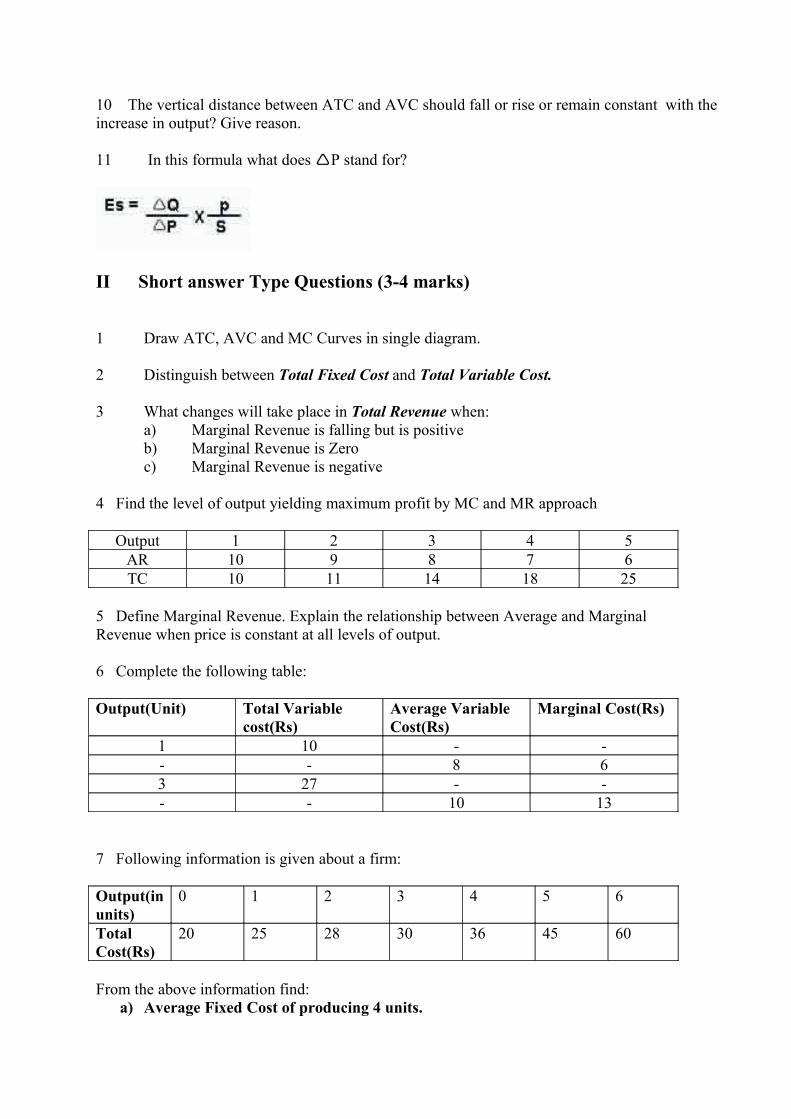
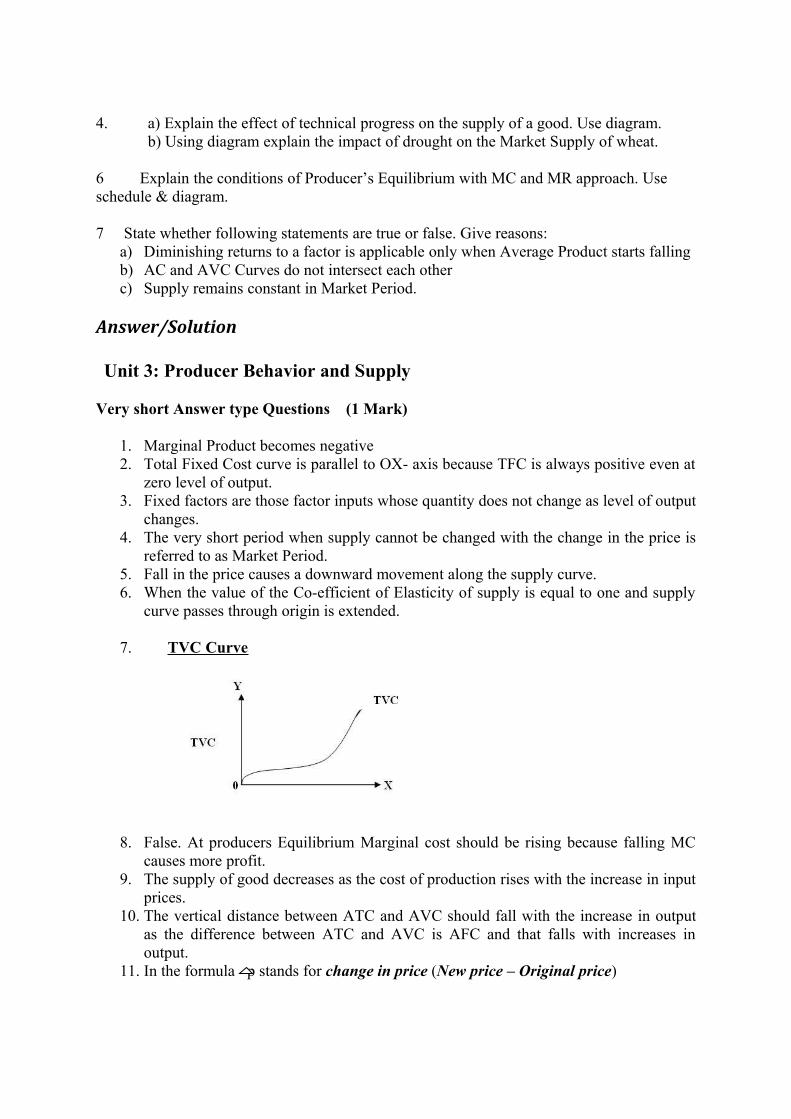
7 Draw TVC Curve.
8 “At Producers’ Equilibrium Marginal Cost should be falling.” True/ False. Give reason.
9 What happens to Supply of a Good when price of inputs used rise while producing the same ?
10 The vertical distance between ATC and AVC should fall or rise or remain constant with the increase in output? Give reason.
11 In this formula what does P stand for?
II Short answer Type Questions (3-4 marks)
1 Draw ATC, AVC and MC Curves in single diagram.
2 Distinguish between Total Fixed Cost and Total Variable Cost.
3 What changes will take place in Total Revenue when:a) Marginal Revenue is falling but is positiveb) Marginal Revenue is Zeroc) Marginal Revenue is negative
4 Find the level of output yielding maximum profit by MC and MR approach
Output 1 2 3 4 5AR 10 9 8 7 6TC 10 11 14 18 25
5 Define Marginal Revenue. Explain the relationship between Average and Marginal Revenue when price is constant at all levels of output.
6 Complete the following table:
Output(Unit) Total Variable cost(Rs)
Average Variable Cost(Rs)
Marginal Cost(Rs)
1 10 - -- - 8 63 27 - -- - 10 13
7 Following information is given about a firm:
Output(in units)
0 1 2 3 4 5 6
Total Cost(Rs)
20 25 28 30 36 45 60
From the above information find:a) Average Fixed Cost of producing 4 units.
b) Average Variable Cost of producing 5 units.c) Marginal Cost of producing 3rd unit.d) Average Cost of producing 6 units.
8 Whether statements are True or False? State reasonsi) As long as MC is rising, ATC will also rise.ii) At an output of one unit, ATC is equal to MC.iii) Total Revenue declines as long as Marginal Revenue is falling.
9 State three reasons of a Rightward Shift of a Supply Curve.
10 Using diagrams explain the difference between Contraction and Decrease in Supply.
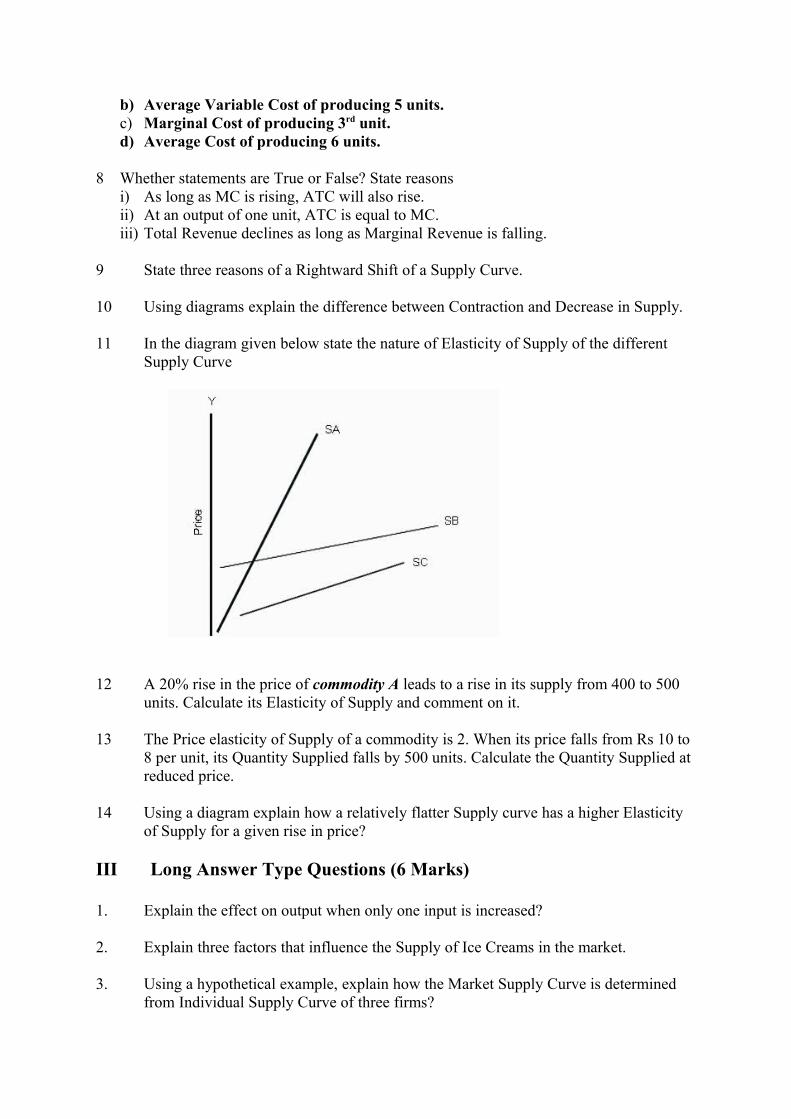
11 In the diagram given below state the nature of Elasticity of Supply of the different Supply Curve
12 A 20% rise in the price of commodity A leads to a rise in its supply from 400 to 500 units. Calculate its Elasticity of Supply and comment on it.
13 The Price elasticity of Supply of a commodity is 2. When its price falls from Rs 10 to 8 per unit, its Quantity Supplied falls by 500 units. Calculate the Quantity Supplied at reduced price.
14 Using a diagram explain how a relatively flatter Supply curve has a higher Elasticity of Supply for a given rise in price?
III Long Answer Type Questions (6 Marks)
1. Explain the effect on output when only one input is increased?
2. Explain three factors that influence the Supply of Ice Creams in the market.
3. Using a hypothetical example, explain how the Market Supply Curve is determined from Individual Supply Curve of three firms?
4. a) Explain the effect of technical progress on the supply of a good. Use diagram. b) Using diagram explain the impact of drought on the Market Supply of wheat.
6 Explain the conditions of Producer’s Equilibrium with MC and MR approach. Use schedule & diagram.
7 State whether following statements are true or false. Give reasons:a) Diminishing returns to a factor is applicable only when Average Product starts fallingb) AC and AVC Curves do not intersect each otherc) Supply remains constant in Market Period.
Answer/Solution
Unit 3: Producer Behavior and Supply
Very short Answer type Questions (1 Mark)
1. Marginal Product becomes negative2. Total Fixed Cost curve is parallel to OX- axis because TFC is always positive even at
zero level of output.3. Fixed factors are those factor inputs whose quantity does not change as level of output
changes.4. The very short period when supply cannot be changed with the change in the price is
referred to as Market Period.5. Fall in the price causes a downward movement along the supply curve.6. When the value of the Co-efficient of Elasticity of supply is equal to one and supply
curve passes through origin is extended.
7. TVC Curve
8. False. At producers Equilibrium Marginal cost should be rising because falling MC causes more profit.
9. The supply of good decreases as the cost of production rises with the increase in input prices.
10. The vertical distance between ATC and AVC should fall with the increase in output as the difference between ATC and AVC is AFC and that falls with increases in output.
11. In the formula p stands for change in price (New price – Original price)
Short Answer Type Questions
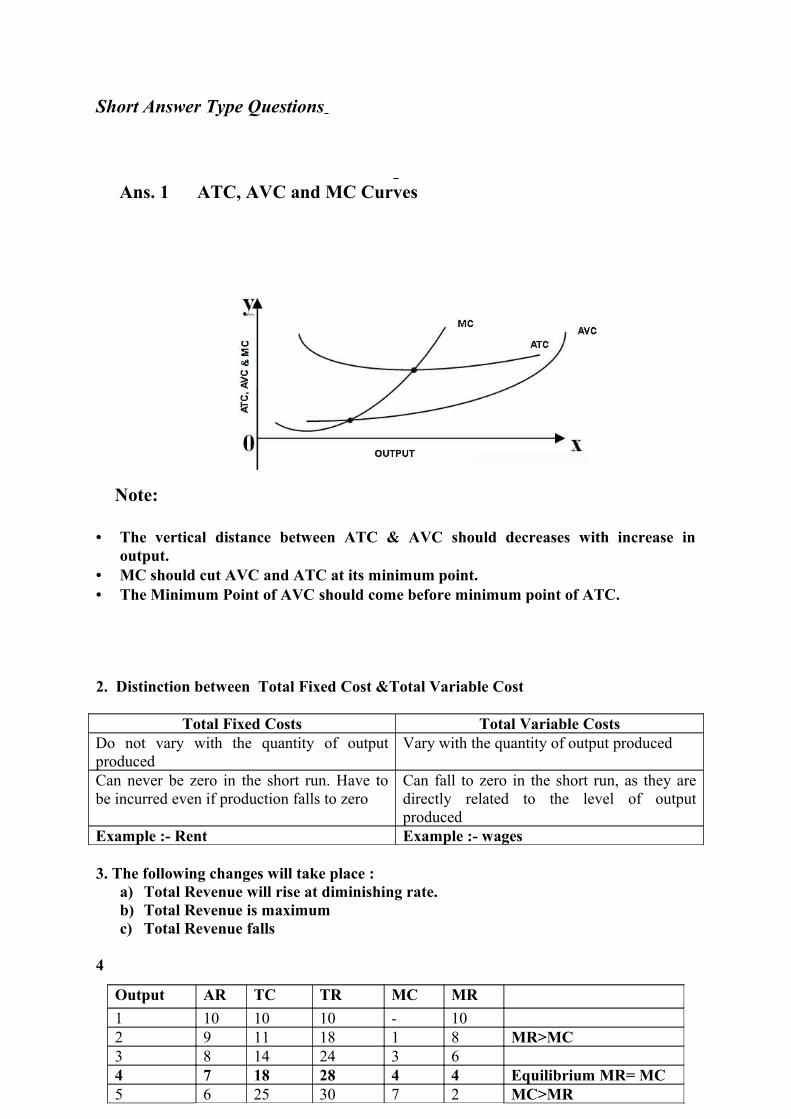
Ans. 1 ATC, AVC and MC Curves
Note:
• The vertical distance between ATC & AVC should decreases with increase in output.
• MC should cut AVC and ATC at its minimum point.• The Minimum Point of AVC should come before minimum point of ATC.
2. Distinction between Total Fixed Cost &Total Variable Cost
Total Fixed Costs Total Variable CostsDo not vary with the quantity of output produced
Vary with the quantity of output produced
Can never be zero in the short run. Have to be incurred even if production falls to zero
Can fall to zero in the short run, as they are directly related to the level of output produced
Example :- Rent Example :- wages
3. The following changes will take place :a) Total Revenue will rise at diminishing rate.b) Total Revenue is maximumc) Total Revenue falls
4
Output AR TC TR MC MR
1 10 10 10 - 102 9 11 18 1 8 MR>MC 3 8 14 24 3 64 7 18 28 4 4 Equilibrium MR= MC5 6 25 30 7 2 MC>MR
At output level of 4 unit, the project is maximum as here MC = MR
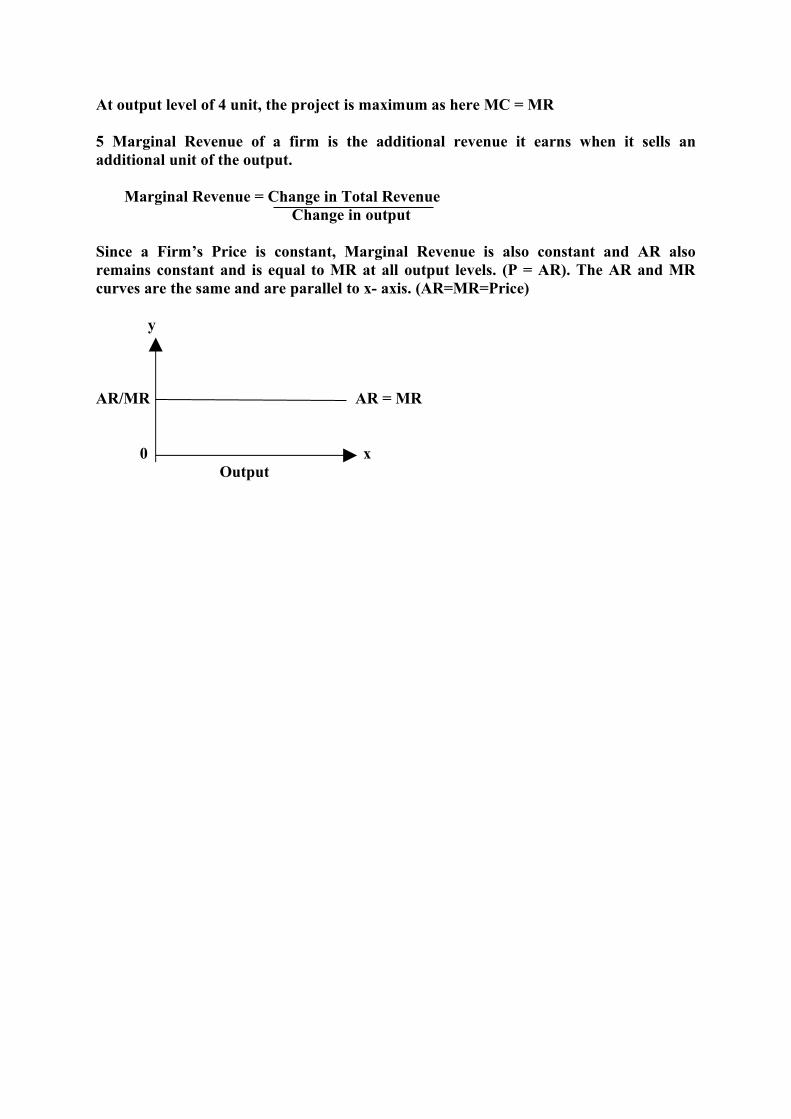
5 Marginal Revenue of a firm is the additional revenue it earns when it sells an additional unit of the output.
Marginal Revenue = Change in Total Revenue Change in output
Since a Firm’s Price is constant, Marginal Revenue is also constant and AR also remains constant and is equal to MR at all output levels. (P = AR). The AR and MR curves are the same and are parallel to x- axis. (AR=MR=Price)
y
AR/MR AR = MR
0 x Output
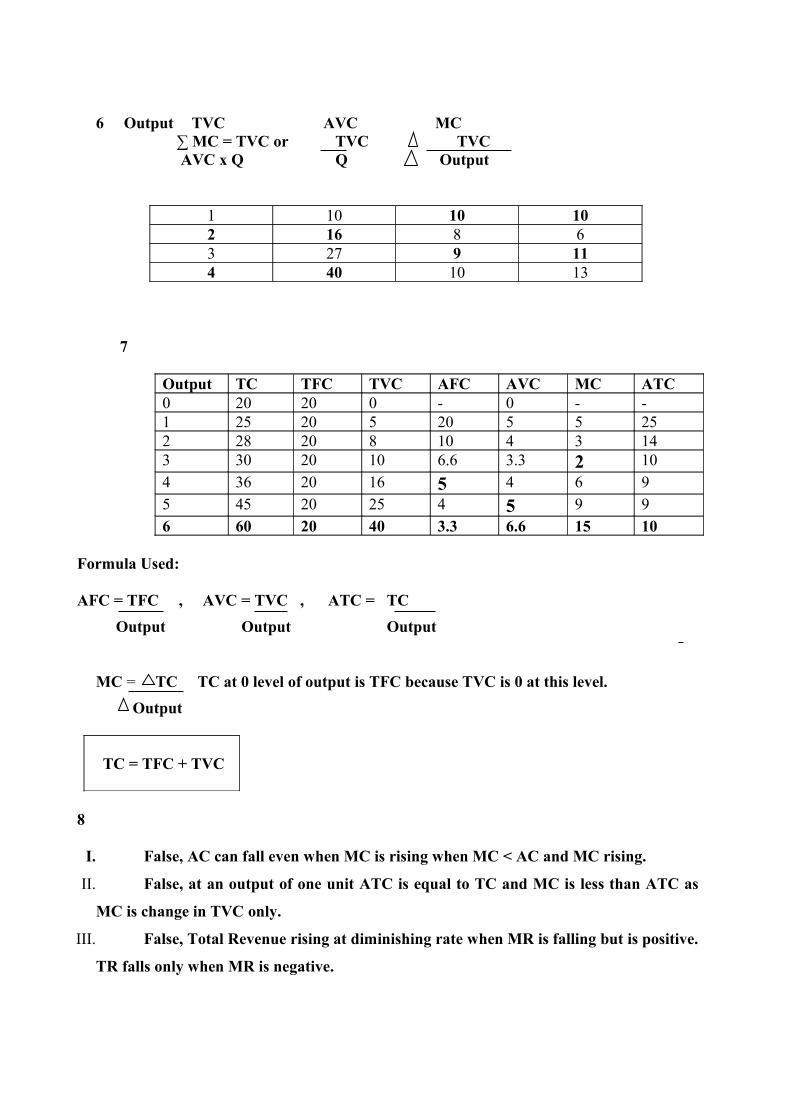
6 Output TVC AVC MC ∑ MC = TVC or TVC TVC AVC x Q Q Output
1 10 10 102 16 8 63 27 9 114 40 10 13
7
Output TC TFC TVC AFC AVC MC ATC0 20 20 0 - 0 - -1 25 20 5 20 5 5 252 28 20 8 10 4 3 143 30 20 10 6.6 3.3 2 104 36 20 16 5 4 6 95 45 20 25 4 5 9 96 60 20 40 3.3 6.6 15 10
Formula Used:
AFC = TFC , AVC = TVC , ATC = TC
Output Output Output
MC = TC TC at 0 level of output is TFC because TVC is 0 at this level.
Output
TC = TFC + TVC
8
I. False, AC can fall even when MC is rising when MC < AC and MC rising.
II. False, at an output of one unit ATC is equal to TC and MC is less than ATC as
MC is change in TVC only.
III. False, Total Revenue rising at diminishing rate when MR is falling but is positive.
TR falls only when MR is negative.
9. Three causes of Rightward Shift of the Supply Curve.
I. Fall in Input Price
II. Improvement in Technology
III. Reduction in Taxation Rate
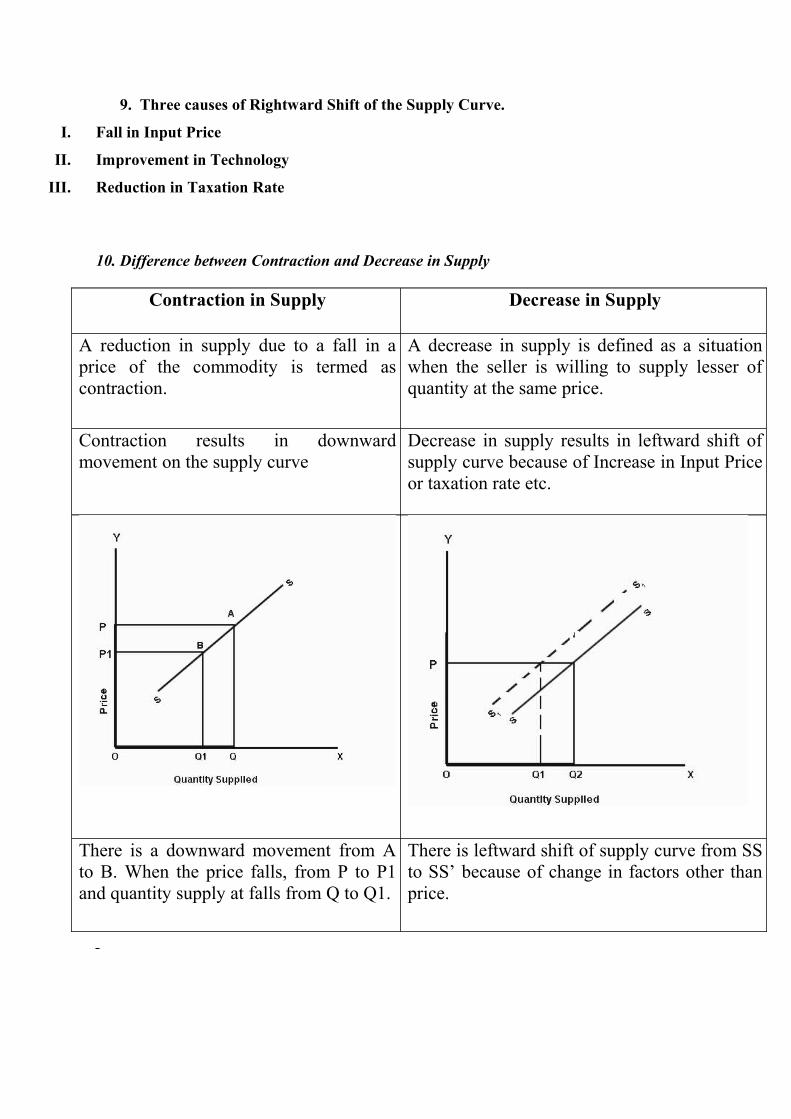
10. Difference between Contraction and Decrease in Supply
Contraction in Supply Decrease in Supply
A reduction in supply due to a fall in a price of the commodity is termed as contraction.
A decrease in supply is defined as a situation when the seller is willing to supply lesser of quantity at the same price.
Contraction results in downward movement on the supply curve
Decrease in supply results in leftward shift of supply curve because of Increase in Input Price or taxation rate etc.
There is a downward movement from A to B. When the price falls, from P to P1 and quantity supply at falls from Q to Q1.
There is leftward shift of supply curve from SS to SS’ because of change in factors other than price.
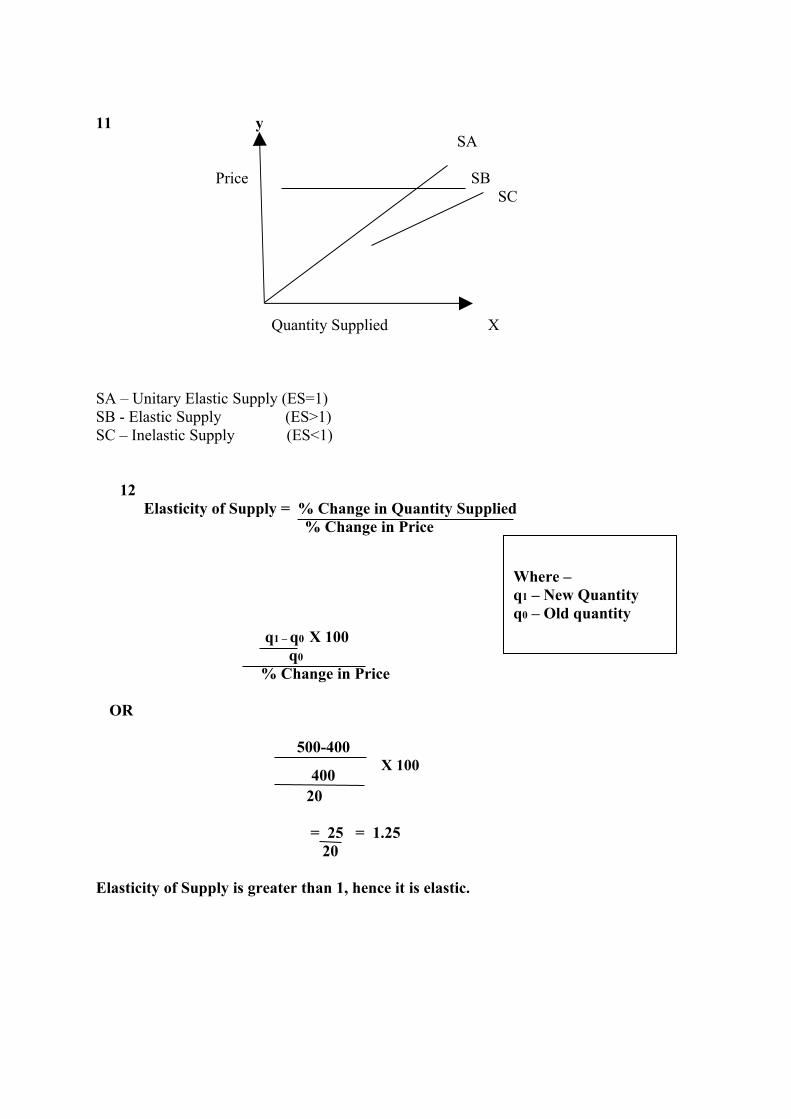
11 ySA
Price SBSC
Quantity Supplied X
SA – Unitary Elastic Supply (ES=1)SB - Elastic Supply (ES>1)SC – Inelastic Supply (ES<1)
12Elasticity of Supply = % Change in Quantity Supplied
% Change in Price
q1 – q0 X 100 q0
% Change in Price OR 500-400
400 X 100
20
= 25 = 1.25 20
Elasticity of Supply is greater than 1, hence it is elastic.
Where –q1 – New Quantityq0 – Old quantity
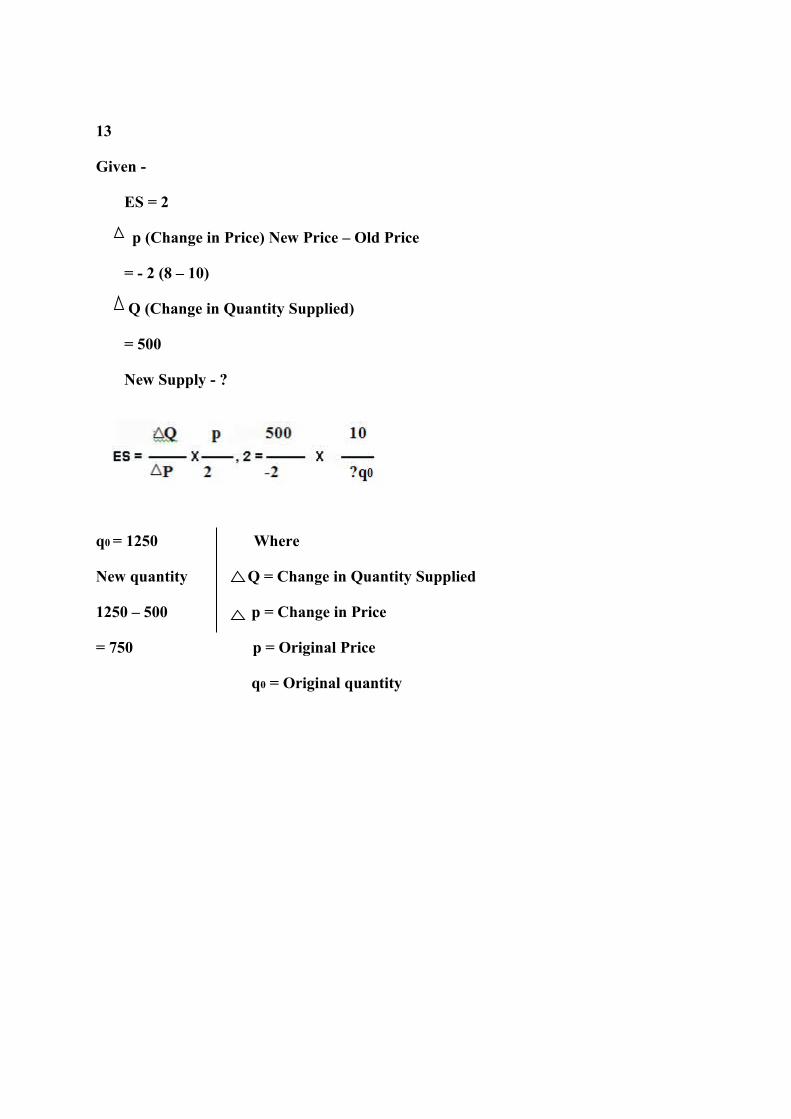
13
Given -
ES = 2
p (Change in Price) New Price – Old Price
= - 2 (8 – 10)
Q (Change in Quantity Supplied)
= 500
New Supply - ?
q0 = 1250 Where
New quantity Q = Change in Quantity Supplied
1250 – 500 p = Change in Price
= 750 p = Original Price
q0 = Original quantity
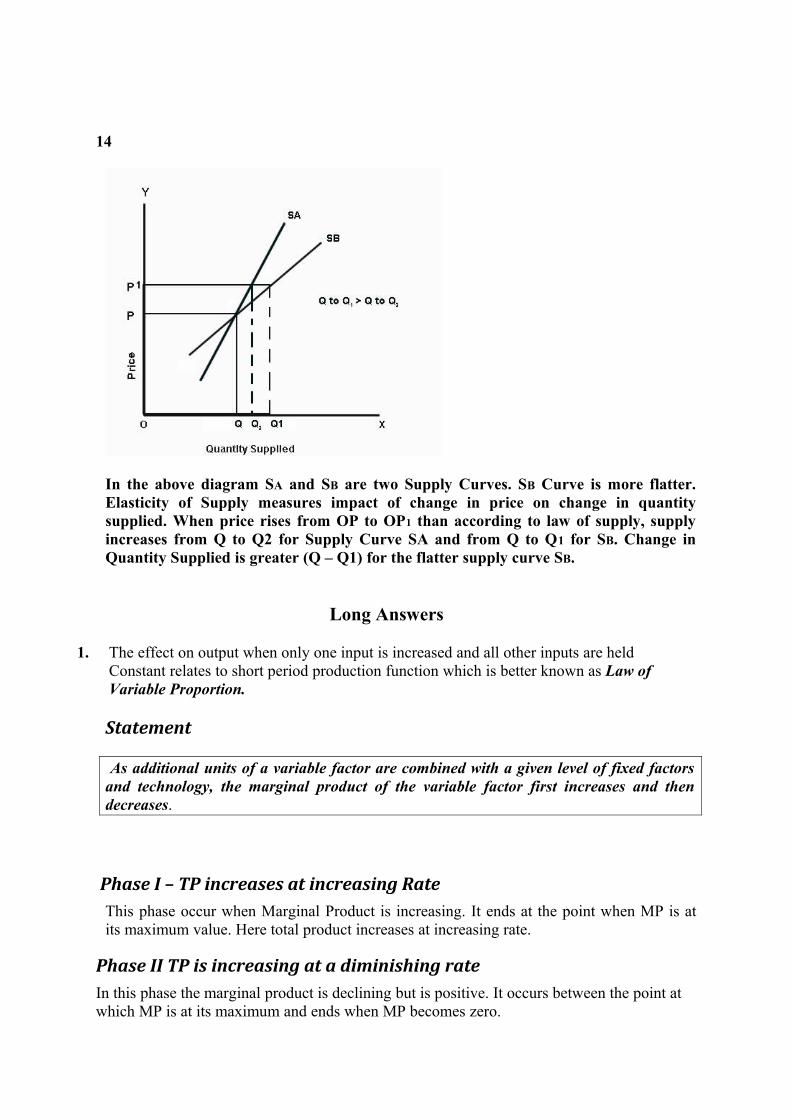
14
In the above diagram SA and SB are two Supply Curves. SB Curve is more flatter. Elasticity of Supply measures impact of change in price on change in quantity supplied. When price rises from OP to OP1 than according to law of supply, supply increases from Q to Q2 for Supply Curve SA and from Q to Q1 for SB. Change in Quantity Supplied is greater (Q – Q1) for the flatter supply curve SB.
Long Answers
1. The effect on output when only one input is increased and all other inputs are held Constant relates to short period production function which is better known as Law of Variable Proportion.
Statement
As additional units of a variable factor are combined with a given level of fixed factors and technology, the marginal product of the variable factor first increases and then decreases.
Phase I – TP increases at increasing RateThis phase occur when Marginal Product is increasing. It ends at the point when MP is at its maximum value. Here total product increases at increasing rate.
Phase II TP is increasing at a diminishing rateIn this phase the marginal product is declining but is positive. It occurs between the point at which MP is at its maximum and ends when MP becomes zero.
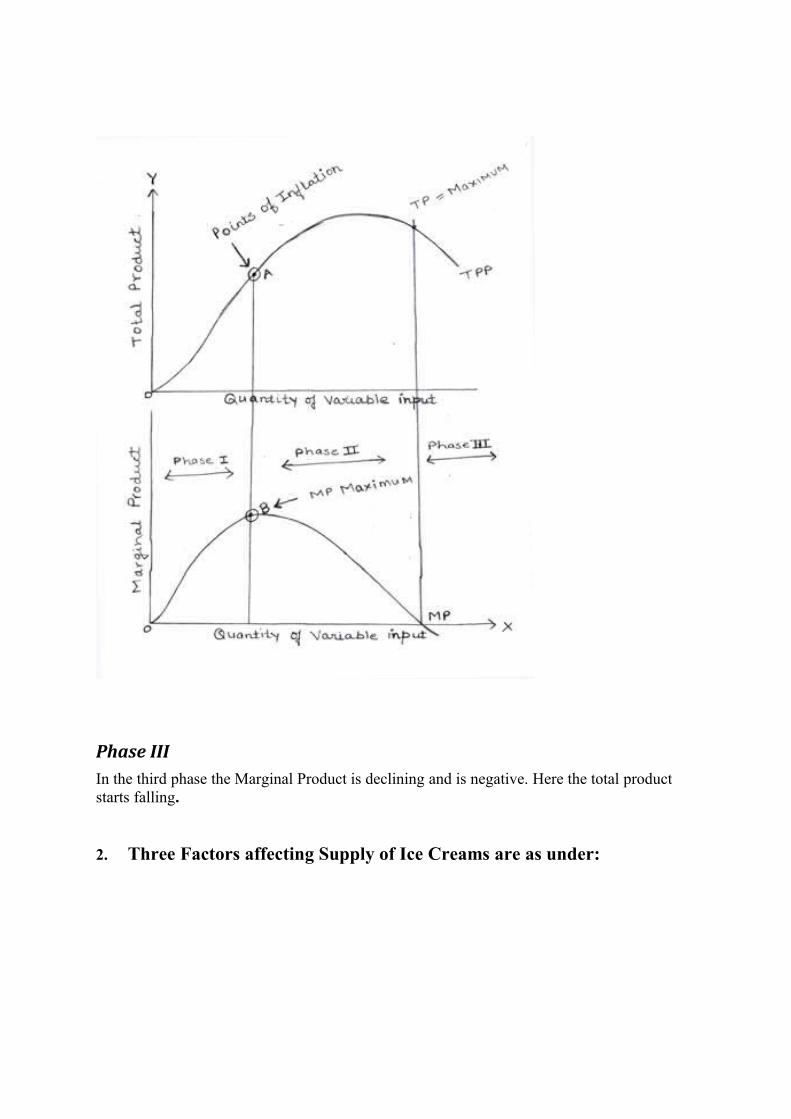
Phase IIIIn the third phase the Marginal Product is declining and is negative. Here the total product starts falling.
2. Three Factors affecting Supply of Ice Creams are as under:
Price of Input
The production of ice cream will depend on the prices of input required to make ice cream i.e. milk, sugar, flavour etc. The increase in the price of input will lead to increase in cost of production thus reduction in production and supply.
Improvement in Technology
Any betterment in the technology of producing ice cream will lead to reduction in cost and increase in production and supply.
Government Taxation Policy
The various Indirect Taxes by the government on the production and sales of goods affect the cost of production. More Taxes less Supply and Less Taxes more supply.
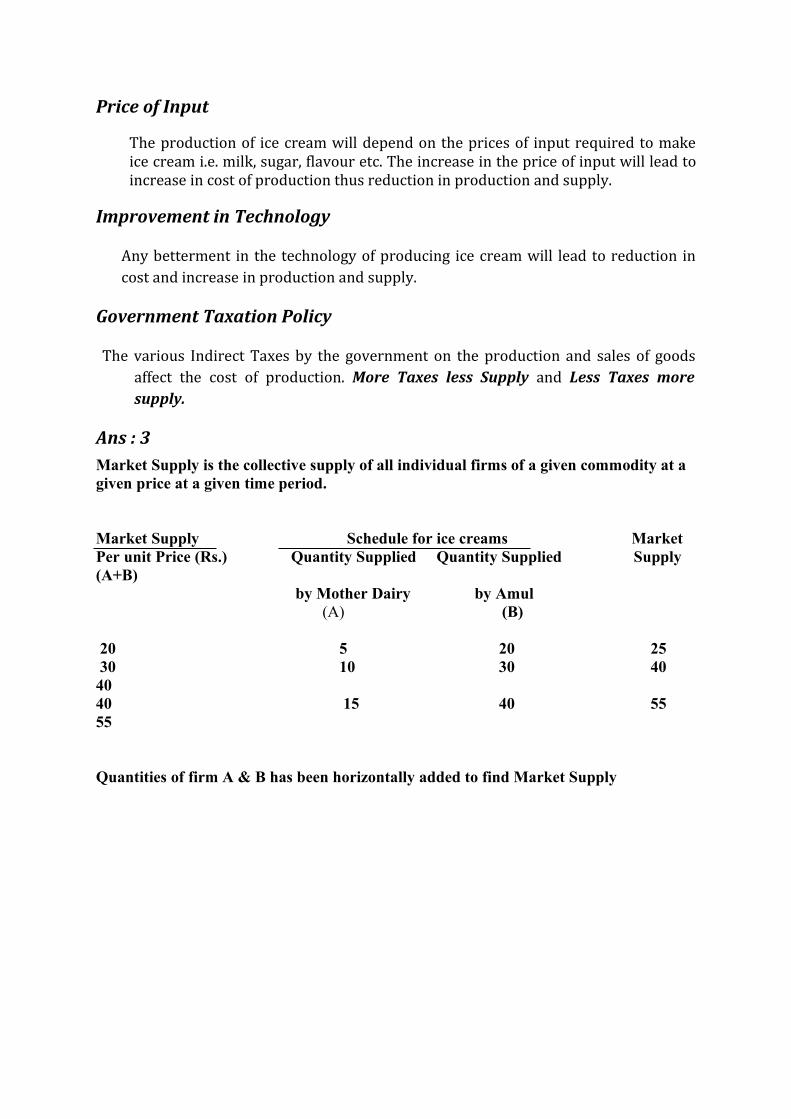
Ans : 3Market Supply is the collective supply of all individual firms of a given commodity at a given price at a given time period.
Market Supply Schedule for ice creams MarketPer unit Price (Rs.) Quantity Supplied Quantity Supplied Supply (A+B) by Mother Dairy by Amul
(A) (B)
20 5 20 25 30 10 30 40 4040 15 40 55 55
Quantities of firm A & B has been horizontally added to find Market Supply
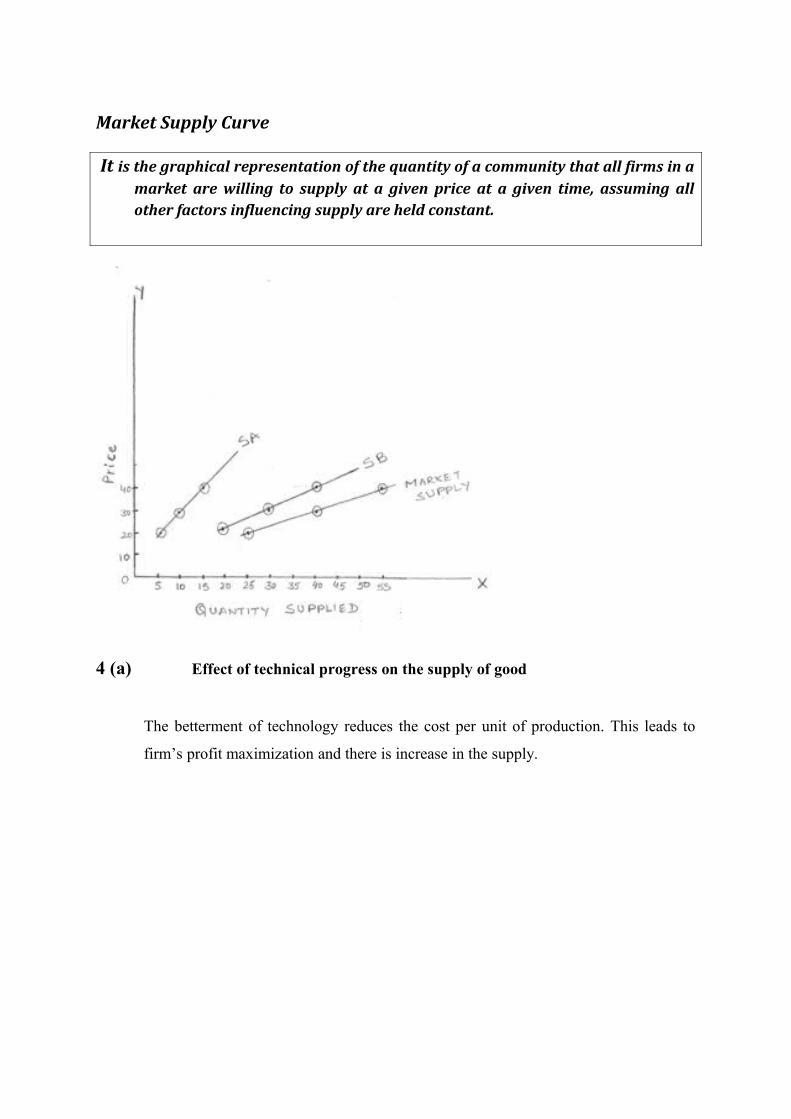
Market Supply Curve
It is the graphical representation of the quantity of a community that all firms in a market are willing to supply at a given price at a given time, assuming all other factors influencing supply are held constant.
4 (a) Effect of technical progress on the supply of good
The betterment of technology reduces the cost per unit of production. This leads to
firm’s profit maximization and there is increase in the supply.
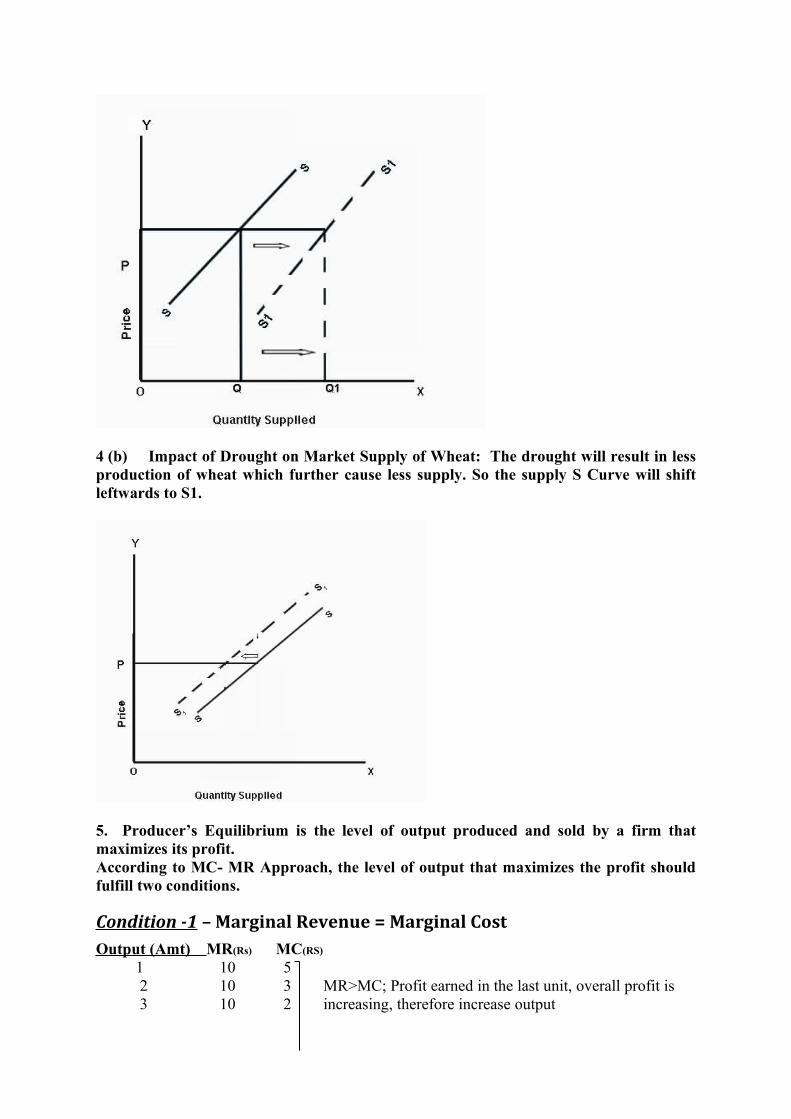
4 (b) Impact of Drought on Market Supply of Wheat: The drought will result in less production of wheat which further cause less supply. So the supply S Curve will shift leftwards to S1.
5. Producer’s Equilibrium is the level of output produced and sold by a firm that maximizes its profit.According to MC- MR Approach, the level of output that maximizes the profit should fulfill two conditions.
Condition -1 – Marginal Revenue = Marginal CostOutput (Amt) MR(Rs) MC(RS)
1 10 5 2 10 3 MR>MC; Profit earned in the last unit, overall profit is 3 10 2 increasing, therefore increase output
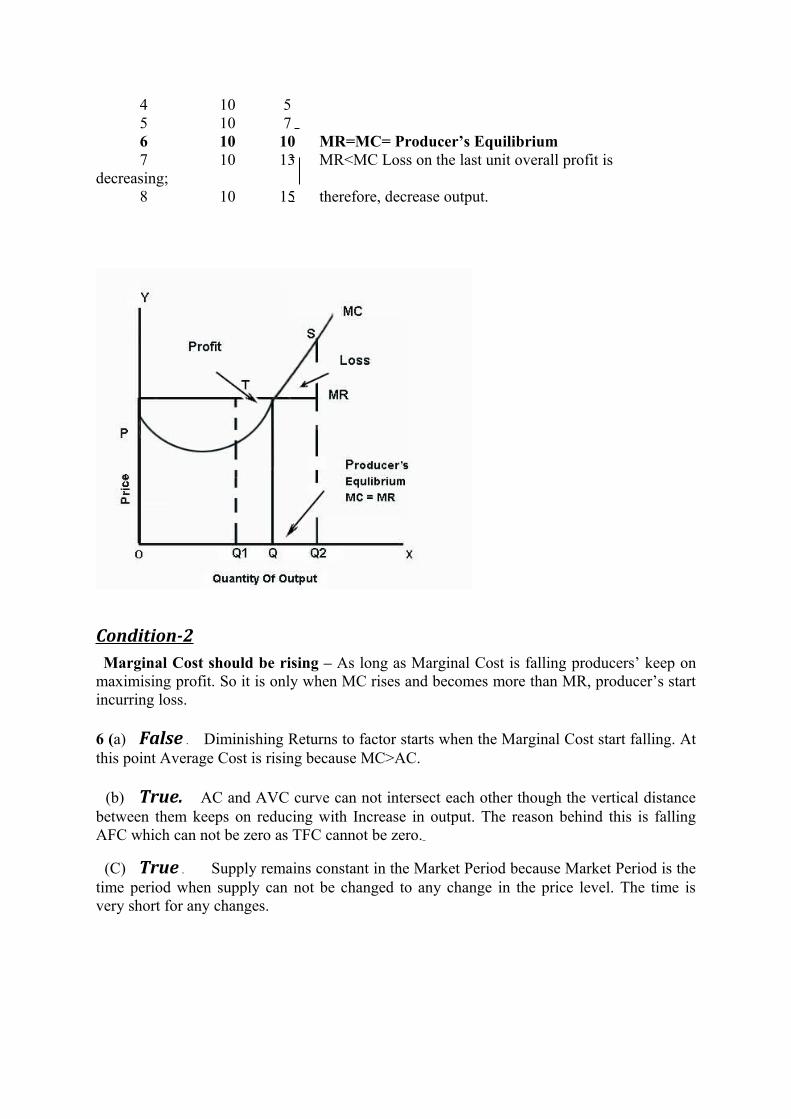
4 10 5 5 10 7 6 10 10 MR=MC= Producer’s Equilibrium 7 10 13 MR<MC Loss on the last unit overall profit is decreasing; 8 10 15 therefore, decrease output.
Condition-2 Marginal Cost should be rising – As long as Marginal Cost is falling producers’ keep on maximising profit. So it is only when MC rises and becomes more than MR, producer’s start incurring loss.
6 (a) False . Diminishing Returns to factor starts when the Marginal Cost start falling. At this point Average Cost is rising because MC>AC.
(b) True. AC and AVC curve can not intersect each other though the vertical distance between them keeps on reducing with Increase in output. The reason behind this is falling AFC which can not be zero as TFC cannot be zero.
(C) True . Supply remains constant in the Market Period because Market Period is the time period when supply can not be changed to any change in the price level. The time is very short for any changes.
QUESTIONS ON MARKET COMPETITION AND MARKET
EQUILIBRIUM (PRICE DETERMINATION)
Very Short Answer Questions (1 mark)
1 Under which market form a firm is a Price Taker?
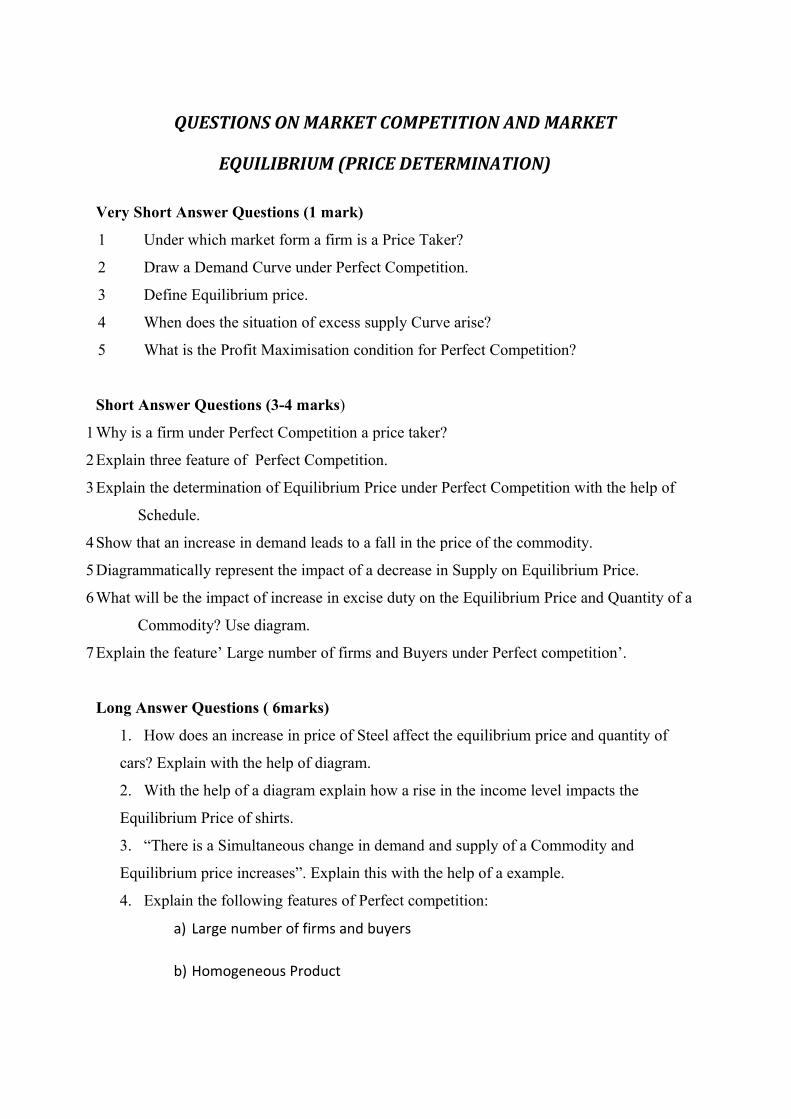
2 Draw a Demand Curve under Perfect Competition.
3 Define Equilibrium price.
4 When does the situation of excess supply Curve arise?
5 What is the Profit Maximisation condition for Perfect Competition?
Short Answer Questions (3-4 marks)
1Why is a firm under Perfect Competition a price taker?
2Explain three feature of Perfect Competition.
3Explain the determination of Equilibrium Price under Perfect Competition with the help of
Schedule.
4Show that an increase in demand leads to a fall in the price of the commodity.
5Diagrammatically represent the impact of a decrease in Supply on Equilibrium Price.
6What will be the impact of increase in excise duty on the Equilibrium Price and Quantity of a
Commodity? Use diagram.
7Explain the feature’ Large number of firms and Buyers under Perfect competition’.
Long Answer Questions ( 6marks)
1. How does an increase in price of Steel affect the equilibrium price and quantity of
cars? Explain with the help of diagram.
2. With the help of a diagram explain how a rise in the income level impacts the
Equilibrium Price of shirts.
3. “There is a Simultaneous change in demand and supply of a Commodity and
Equilibrium price increases”. Explain this with the help of a example.
4. Explain the following features of Perfect competition:
a) Large number of firms and buyers
b) Homogeneous Product
ANSWERS OF PERFECT COMPETITION AND MARKET
EQUILIBRIUM (PRICE DETERMINATION)
VERY SHORT ANSWER TYPE QUESTIONS (01 MARK)
1. Under Perfect Competition a firm is a price taker.2. Demand Curve under a Perfect Competition.
Price AR/ Demand Curve
X
3. Equilibrium Price is the price of a commodity at which its quantity demanded equals to quantity supplied in the market.
4. The situation of Excess supply arise when at a given price, the market supply of a commodity is more than its market demand.
5. The firm maximises profit in perfect competition where MR = MC since AR = MR in perfect competition. So we can also say P = AR = MR = MC
SHORT ANSWER TYPE QUESTIONS (3-4 Marks)
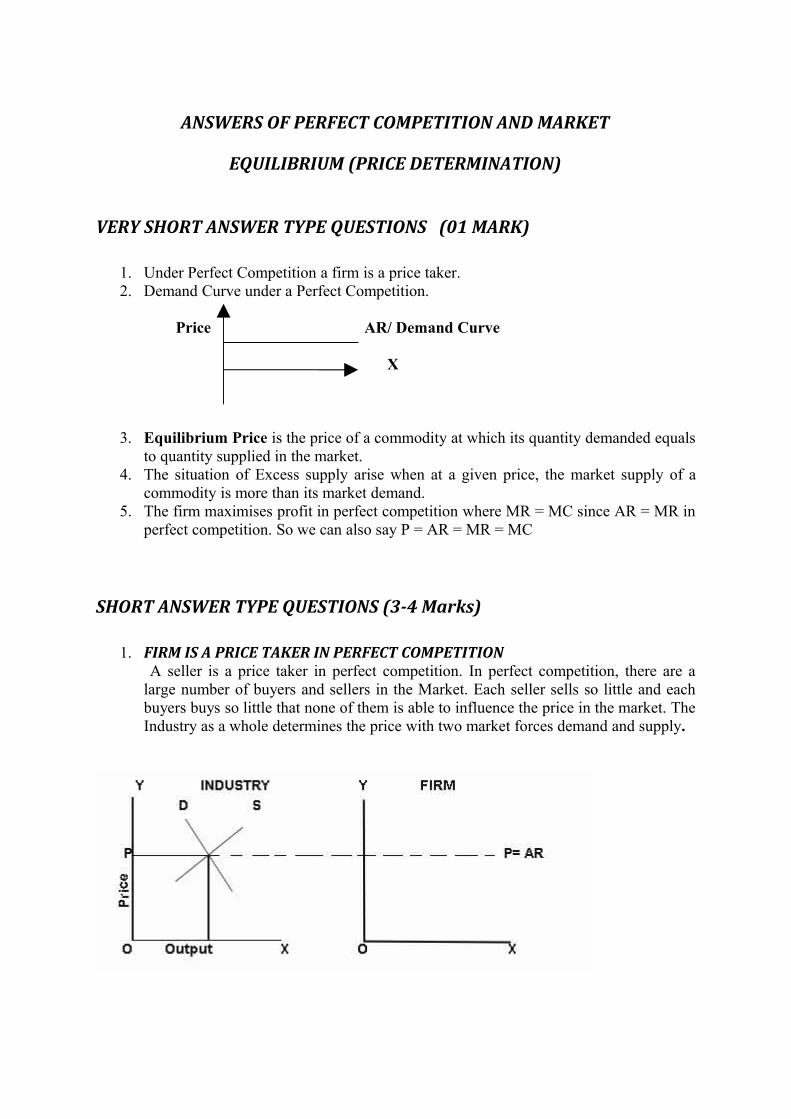
1. FIRM IS A PRICE TAKER IN PERFECT COMPETITION A seller is a price taker in perfect competition. In perfect competition, there are a large number of buyers and sellers in the Market. Each seller sells so little and each buyers buys so little that none of them is able to influence the price in the market. The Industry as a whole determines the price with two market forces demand and supply.
Ans 2. Three Features of Perfect Competition:i) Very Large number of Buers and Sellers:There is such a large number of buyers
and sellers that none of them is in a position to influence the price in a market. The price of good is determined by the whole industry.
Homogeneous Product: Product sold in this kind of market are homogeneous or identical in every respect like quality, size, design, colour etc. The products are perfect substitutes of one- another.
iii) Free Entry and Exit: Buyers and sellers are free to enter or leave the market at any time they like large profit will induce firms into the market and loss exit if any.
3 Determination of Equilibrium price under Perfect competition: Price is determined in a perfectly competitive market at a point where Market Demand is equal to Market Supply.
Demand and Supply SchedulePrice (Rs) Market Demand Market Supply Situation 20 120 40 Demand>Supply 30 100 60 Demand>Supply 40 80 80 Demand=Supply 50 60 100 Demand<Supply 60 40 120 Demand<Supply
In the schedule given above, at the price of Rs 40 per unit the demand and supply are equal to each other. Before this point there is competition among the buyers and therefore prices rise till Demand and Supply are not equal once again. In case of Excess supply, there is competition amongst sellers which leads to the fall in the price till it reach to equilibrium level.
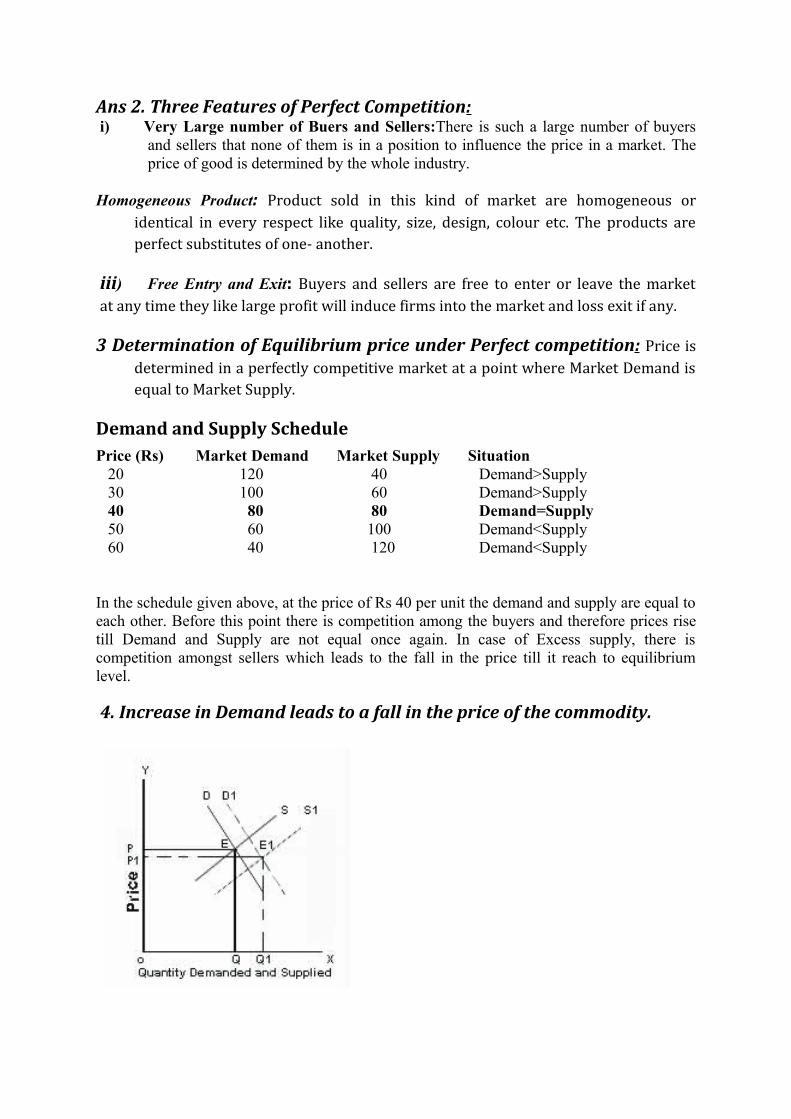
4. Increase in Demand leads to a fall in the price of the commodity.
This can happen when increase in supply is more than increase in Demand. In the diagram the initial equilibrium is at E point where OP is the price and OQ is the quantity. Then demand curve shifts to its right due to increase in supply, which is more than increase in demand. Due to this change price falls to P1 and new equilibrium point is E1, where the market price is OP1 and Market equilibrium quantity is OQ1.
5 Impact of a decrease in Supply on Equilibrium Price and Quantity when demand is perfectly elastic.
In the above diagram initial market equilibrium is achieved at E point where market price is OP and Market equilibrium quantity OQ. When supply decreases and shifts to left new equilibrium point is achieved at E1 point where Market Price OP remains same but the quantity is reduced from OQ to OQ1.
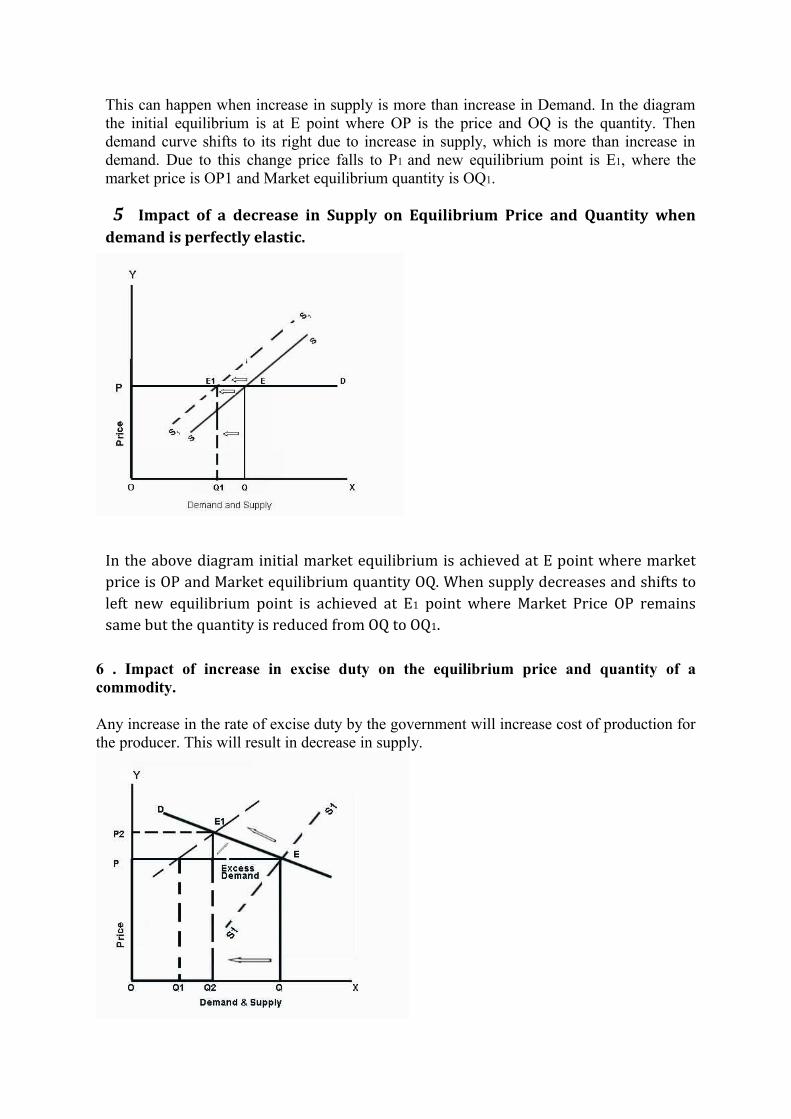
6 . Impact of increase in excise duty on the equilibrium price and quantity of a commodity.
Any increase in the rate of excise duty by the government will increase cost of production for the producer. This will result in decrease in supply.
The decrease in supply creates the situation of Excess Demand. Competition amongst buyers raises the price till Demand and Supply are once again equal. Price rise results in extension in supply and contraction in demand. New Market equilibrium establishes at E1 point.
7 Large numbers of buyers and sellers under perfect competition
There is large number of buyers and sellers, each firm or seller in a Perfectly Competitive market- forms an insignificant part of the market. So, no single seller has the ability to determine or influence the price at which commodity is sold. The forces of market demand and supply determine the price. So a firm is a Price Taker while an industry is Price Maker.
LONG ANSWER TYPE QUESTION
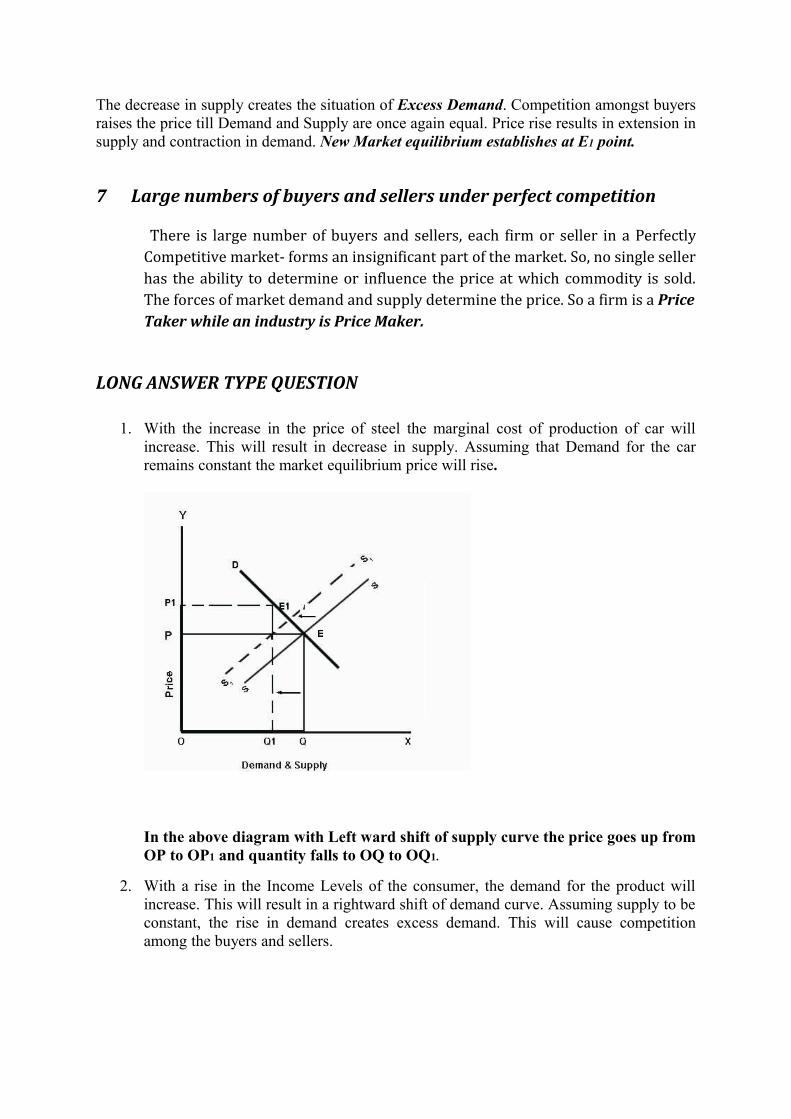
1. With the increase in the price of steel the marginal cost of production of car will increase. This will result in decrease in supply. Assuming that Demand for the car remains constant the market equilibrium price will rise.
In the above diagram with Left ward shift of supply curve the price goes up from OP to OP1 and quantity falls to OQ to OQ1.
2. With a rise in the Income Levels of the consumer, the demand for the product will increase. This will result in a rightward shift of demand curve. Assuming supply to be constant, the rise in demand creates excess demand. This will cause competition among the buyers and sellers.
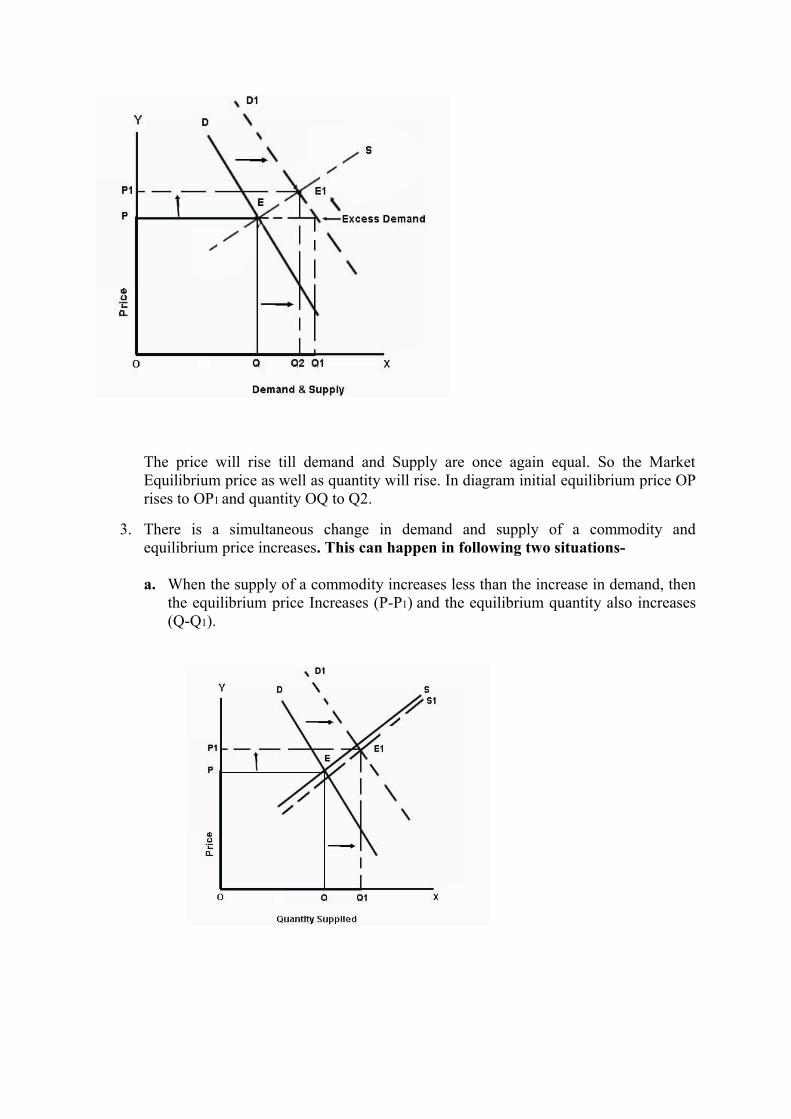
The price will rise till demand and Supply are once again equal. So the Market Equilibrium price as well as quantity will rise. In diagram initial equilibrium price OP rises to OP1 and quantity OQ to Q2.
3. There is a simultaneous change in demand and supply of a commodity and equilibrium price increases. This can happen in following two situations-
a. When the supply of a commodity increases less than the increase in demand, then the equilibrium price Increases (P-P1) and the equilibrium quantity also increases (Q-Q1).
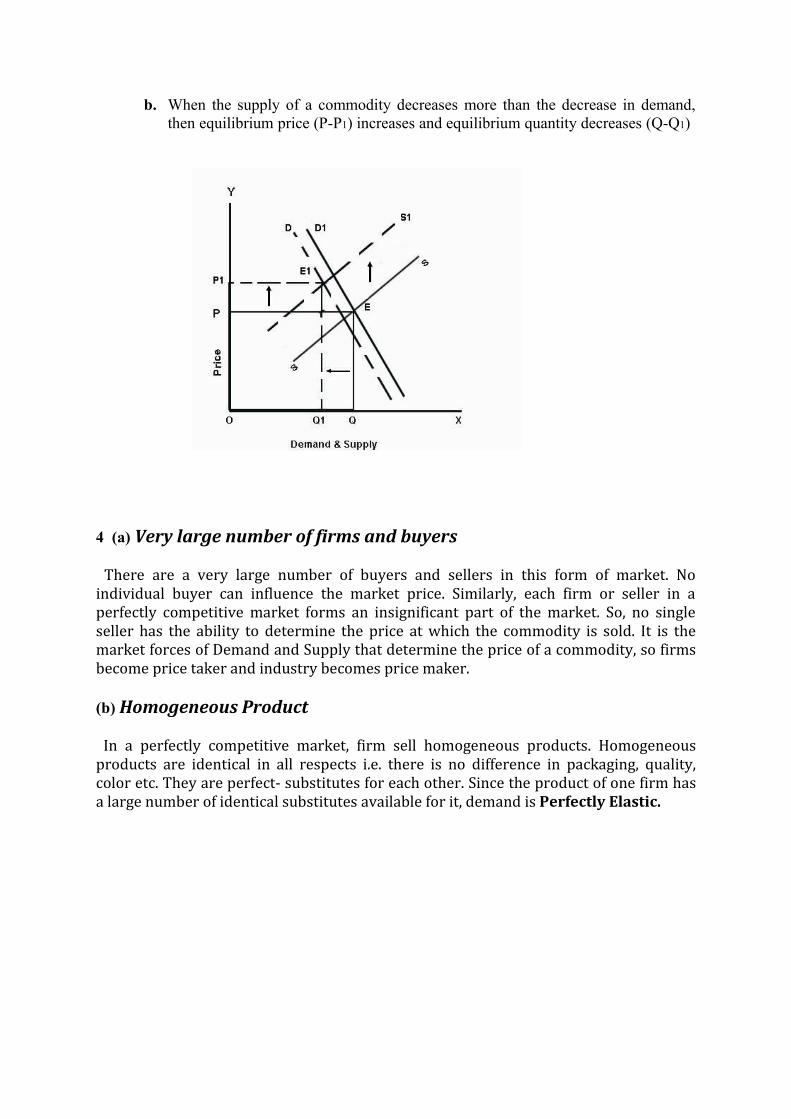
b. When the supply of a commodity decreases more than the decrease in demand, then equilibrium price (P-P1) increases and equilibrium quantity decreases (Q-Q1)
4 (a) Very large number of firms and buyers
There are a very large number of buyers and sellers in this form of market. No individual buyer can influence the market price. Similarly, each firm or seller in a perfectly competitive market forms an insignificant part of the market. So, no single seller has the ability to determine the price at which the commodity is sold. It is the market forces of Demand and Supply that determine the price of a commodity, so firms become price taker and industry becomes price maker.
(b) Homogeneous Product
In a perfectly competitive market, firm sell homogeneous products. Homogeneous products are identical in all respects i.e. there is no difference in packaging, quality, color etc. They are perfect- substitutes for each other. Since the product of one firm has a large number of identical substitutes available for it, demand is Perfectly Elastic.