Embed Size (px)
Citation preview
Quick R Tutorial
for Beginners
Version 03 2015-12-3
Rintaro Saito University of California San Diego
Haruo Suzuki Keio University
2
0 Introduction
R is one of the best languages to perform statistical analyses it can analyze huge amount of
data through scientific calculations find tendencies among the data and visualize them In
this tutorial you will learn fundamentals of R language
1 Starting and ending R
How to start R depends on the system you are using In the UNIX system with R installed
you may be able to start R by just typing R In Windows or Macintosh double-click R icon to
start To end R just type
q()
2 Simple value assignments to variables
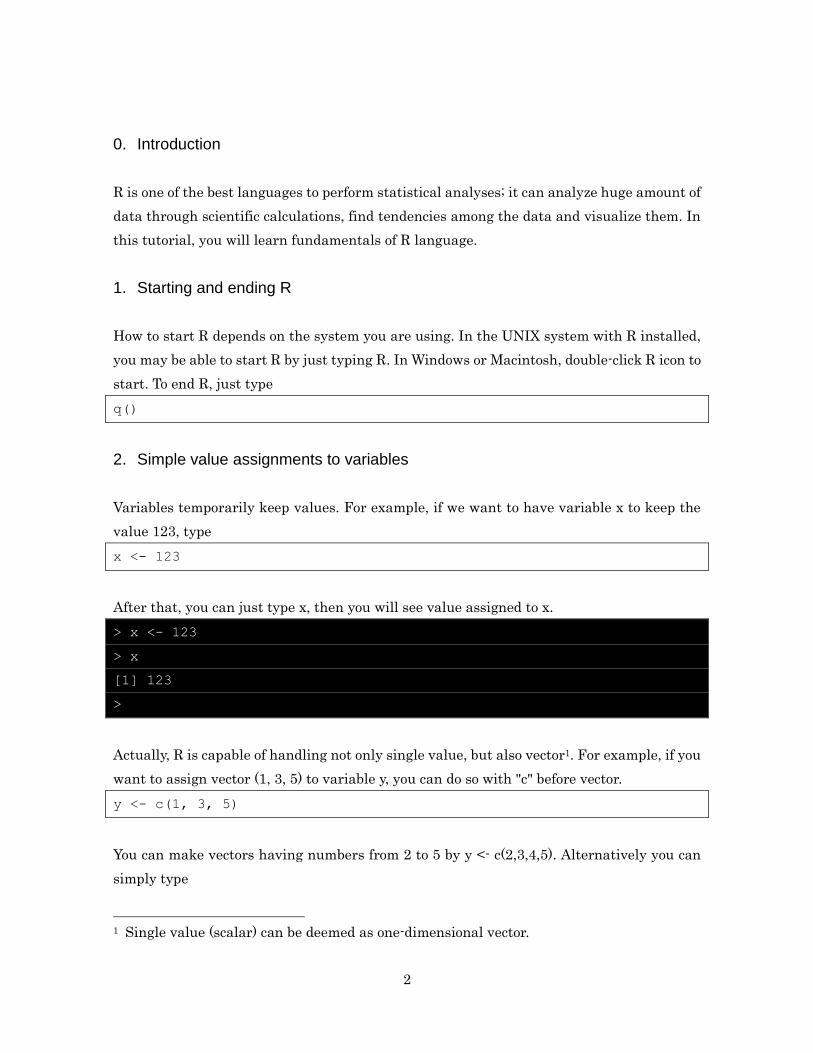
Variables temporarily keep values For example if we want to have variable x to keep the
value 123 type
x lt- 123
After that you can just type x then you will see value assigned to x
gt x lt- 123
gt x
[1] 123
gt
Actually R is capable of handling not only single value but also vector1 For example if you
want to assign vector (1 3 5) to variable y you can do so with c before vector
y lt- c(1 3 5)
You can make vectors having numbers from 2 to 5 by y lt- c(2345) Alternatively you can
simply type
1 Single value (scalar) can be deemed as one-dimensional vector
3
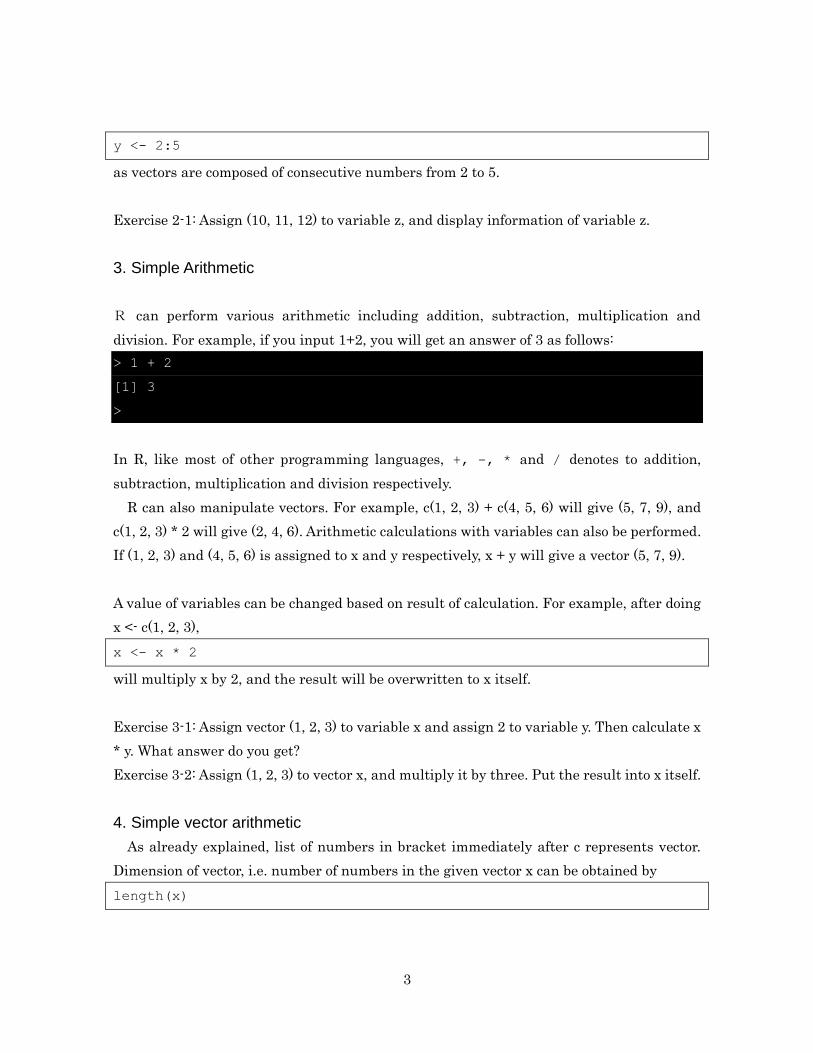
y lt- 25
as vectors are composed of consecutive numbers from 2 to 5
Exercise 2-1 Assign (10 11 12) to variable z and display information of variable z
3 Simple Arithmetic
R can perform various arithmetic including addition subtraction multiplication and
division For example if you input 1+2 you will get an answer of 3 as follows
gt 1 + 2
[1] 3
gt
In R like most of other programming languages + - and denotes to addition
subtraction multiplication and division respectively
R can also manipulate vectors For example c(1 2 3) + c(4 5 6) will give (5 7 9) and
c(1 2 3) 2 will give (2 4 6) Arithmetic calculations with variables can also be performed
If (1 2 3) and (4 5 6) is assigned to x and y respectively x + y will give a vector (5 7 9)
A value of variables can be changed based on result of calculation For example after doing
x lt- c(1 2 3)
x lt- x 2
will multiply x by 2 and the result will be overwritten to x itself
Exercise 3-1 Assign vector (1 2 3) to variable x and assign 2 to variable y Then calculate x
y What answer do you get
Exercise 3-2 Assign (1 2 3) to vector x and multiply it by three Put the result into x itself
4 Simple vector arithmetic
As already explained list of numbers in bracket immediately after c represents vector
Dimension of vector ie number of numbers in the given vector x can be obtained by
length(x)
4
One can extract desired number from the vector For example after inputting x lt-
c(246810)
x[3]
will give you 6 which is the third number of the vector
x[c(24)]
will give you second and fourth numbers of the vector and
x[24]
will give you numbers from second to fourth elements of the vector
You can also perform vector comparison For example x gt 5 will give you vectors
containing TRUE andor FALSE (abbreviated as T and F respectively) where each element
denotes whether corresponding number in x is greater than x or not
gt x lt- c(246810)
gt x
[1] 2 4 6 8 10
gt x gt 5
[1] FALSE FALSE TRUE TRUE TRUE
gt
R function ldquowhichrdquo will returns where the Trsquos are in the given vector as index numbers
Using the vector c(F F T T T) returned by x gt 5 which(c(F F T T T)) will give you vector
(345) More easily ldquowhich(x gt 5)rdquo will give you exactly the same answer
gt x lt- c(246810)
gt which(x gt 5)
[1] 3 4 5
gt
Using this vector which is composed of T and F we can extract elements which correspond
to T
x[ c(F F T T T)]
By putting above together it is sufficient to just type
x[ x gt 5 ]
to extract elements whose values are above 5
5
Actually we can also deal with set of strings as vector For example after typing
x lt- c(Sunday Monday Tuesday Wednesday Thursday Friday Saturday)
x[2] will give you second string rdquoMondayrdquo Various manipulations are available for a vector
containing strings
grep(es x)
will give you indices of strings in vector x where string contain substring ldquoesrdquo Thus the
below inputs will return strings containing ldquoesrdquo
gt x lt- c(Sunday Monday Tuesday Wednesday Thursday Friday Saturday)
gt x[ grep(es x) ]
[1] Tuesday Wednesday
gt
You can assign name for each element in a vector using function ldquonamerdquo For example
x lt- c(2 4 6)
names(x) lt- c(First Second Third)
will assign (ldquoFirstrdquo ldquoSecondrdquo ldquoThirdrdquo) to name attribute of variable x
x[[ Second ]]
will give you second element
Various statistical functions are defined for vectors containing only numerical values For
example
sum(x)
will give you sum of numerical elements in vector x and
mean(x)
will give you average of numerical elements in x The function sum will count number of Trsquos
in vector x containing only T andor F Thus
x lt- c(246810)
sum(x gt 5)
will count number of numerical elements greater than 5 (ie 3 will be returned)
Exercise 4-1 Create vector containing numerical values larger than 5 in vector (3 1 4 1 5
9 2 6 5)
6
Exercise 4-2 Assign names (ldquoJanrdquo ldquoFebrdquo ldquoMarrdquo ldquoAprrdquo ldquoMayrdquo ldquoJunrdquo ldquoJulrdquo ldquoAugrdquo ldquoSeprdquo
ldquoOctrdquo ldquoNovrdquo ldquoDecrdquo) for respective element of vector (123456789101112) Then
extract third element from the vector using the string rdquoMarrdquo The extracted element should
be 3
5 Simple matrix construction and arithmetic
By gathering vectors it is possible to create a matrix using the function rbind For example
if you want to create a matrix x = 1 2 3
4 5 6
aelig
egraveccedil
ouml
oslashdivide where the first and second rows are (123)
and (456) respectively type
x lt- rbind(c(123) c(456))
Then just type x to display the matrix you have created
gt x lt- rbind(c(123) c(456))
gt x
[1] [2] [3]
[1] 1 2 3
[2] 4 5 6
gt
Alternatively
x lt- matrix(c(1 4 2 5 3 6) nrow=2 ncol=3)
or
x lt- matrix(c(1 2 3 4 5 6) nrow=2 ncol=3 byrow=T)
should return the identical matrix The latter one means that matrix of size 2 times 3 will be
created (nrow=2 ncol=3) and numbers are filled in each row first (byrow=T)
Various functions are available for a matrix nrow(x) and ncol(x) will return number of
rows and columns of the matrix x respectively x+1 will add 1 to all the elements in x and x
2 will multiply all the elements in x by 2 Various kinds of arithmetic between matrices
are also available For example after typing y lt- rbind(c(2 4 6) c(8 10 12)) x + y will give
you matrix where each element correspond to sum of corresponding element of x and y x y
will give you matrix where each element correspond to product of corresponding element of
7
x and y2
Any specific row or column can be extracted from a given matrix For example if you
want to extract second row you type
gt x[2]
[1] 4 5 6
gt
If you want to extract second column you type
gt x[2]
[1] 2 5
t(x) will transpose the matrix x
gt t(x)
[1] [2]
[1] 1 4
[2] 2 5
[3] 3 6
gt
Average of each row of matrix x can be calculated as below3
gt apply(x 1 mean)
[1] 2 5
Average of each column of matrix x can be calculated as below
gt apply(x 2 mean)
[1] 25 35 45
Actually matrix can be deemed as set of numbers in two dimensional array R can also
deal with array having n dimensions using array(vector numbers of elements in each
2 Product of the matrices based on canonical mathematical definition can be calculated by
the operator 3 Second parameter of 1 in apply function denotes that we will calculate average for each
position of the first dimension (in this case the first dimension is row number) Similarly
second parameter of 2 denotes that we will calculate average for each position of the second
dimension (in this case the second dimension is column number)
8
dimension) For example
x lt- array(124 c(342))
will create three dimensional array with size of 3times4times2 and fills numbers in the given
vector from the first dimension to the third dimension
gt x lt- array(124 c(342))
gt x
1 The first 3times4 array of the third dimension
[1] [2] [3] [4]
[1] 1 4 7 10
[2] 2 5 8 11
[3] 3 6 9 12
2 The second 3times4 array of the third dimension
[1] [2] [3] [4]
[1] 13 16 19 22
[2] 14 17 20 23
[3] 15 18 21 24
gt
Exercise 5-1 Calculate 1 3 5
7 9 11
aelig
egraveccedil
ouml
oslashdivide+
1 2 3
2 4 6
aelig
egraveccedil
ouml
oslashdivide
Exercise 5-2 For the matrix obtained in the above calculation calculate row average and
column average
6 Simple list creation
A list in R can gather various kinds of data into a single object to manage them
x lt- list(Ichiro rdquo Seattlerdquo Right fielder)
will create a list containing Ichiro rdquo Seattlerdquo Right fielder Although a vector cannot
9
contain another vector a list can contain a vector as shown in the example below
x lt- list(Ichiro Seattle Right fielder c(184 214 225))
To extract the second element you can type
x[[2]]
You can assign names to each element as below
x lt- list(player = Ichiro team = Seattle
position = Right fielder hits = c(184 214 225))
Type x to confirm that names are given to each element
gt x
$player
[1] Ichiro
$team
[1] Seattle
$position
[1] Right fielder
$hits
[1] 184 214 225
gt
You can use assigned name to extract corresponding element For example
x[[team]]
or
x$team
will extract ldquoSeattlerdquo
Exercise 6-2 Create a list containing ldquoSan Diegordquo vector (32 117) 9645 and ldquoCaliforniardquo
Give names ldquocityrdquo ldquocoordinatesrdquo ldquoareardquo and ldquostaterdquo to respective element
10
11
7 Simple data frame creation
Data frame is one of data class in R It is one type of list and has two dimensional
structure just like a matrix Each row can be deemed as a sample and each column can be
deemed as attribute of the sample Using this idea data frame can represent a table
Following table gives data of five retired major league baseball players
Team atbats hits homeruns
Rose Reds 14053 4256 160
Aaron Brewers 12364 3771 755
Yastrzemski Red Sox 11988 3419 452
Ripken Orioles 11551 3184 431
Cobb Athletics 11434 4191 117
The above table can be represented by data frame as follows
x lt- dataframe(
rownames = c(Rose Aaron Yastrzemski Ripken Cobb)
team = c(Reds Brewers Red Sox Orioles Athletics)
atbats = c(14053 12364 11988 11551 11434)
hits = c(4256 3771 3419 3184 4191)
homeruns = c(160 755 452 431 117))
The function dataframe can generate a data frame and can be used in the format of
dataframe(rownames = vector for column labels column name 1 = vector 1 column name
2 = vector 2 hellip) You can check the content of x by typing x
gt x
team atbats hits homeruns
Rose Reds 14053 4256 160
Aaron Brewers 12364 3771 755
Yastrzemski Red Sox 11988 3419 452
Ripken Orioles 11551 3184 431
Cobb Athletics 11434 4191 117
gt
Like a regular list column name can be used to extract corresponding vector
gt x$hits
[1] 4256 3771 3419 3184 4191
gt
12
Any part of data frame can be extracted as another data frame For example
x[ c(15) c(234) ]
will extract row 1 5 and column 2 3 4 as a new data frame You can also use row names
and column names to do the same thing
x[ c(Rose Cobb) c(atbats hits homeruns)]
Various functions are defined for data frame Let us get attributes associated with the data
frame x
gt attributes(x)
$names
[1] team atbats hits homeruns
$rownames
[1] Rose Aaron Yastrzemski Ripken Cobb
$class
[1] dataframe
gt
We got names rownames and class Type names(x) rownames(x) and class(x) You can
obtain row names column names and class of x respectively
Exercise 7-1 The below table shows characteristic values of each planet in solar system
Masses are represented in 1023 kg and diameters are represented in km Make a data frame
representing the table4
Mass Diameter Satellites
Mercury 3301 4879 0
Venus 12103 48690 0
Earth 59736 12756 1
4 As all the elements are numeric in this case this data frame can be dealt as a matrix
asmatrix(x) will return x as a matrix
13
Mars 6419 6794 2
Jupiter 18986 142984 63
Saturn 5688 120536 48
Uranus 8686 51118 27
Neptune 1024 49528 13
Exercise 7-2 Using the created data frame in the previous exercise calculate averages of
mass diameter and number of satellites
8 Data reading from file
So far we have been inputting data directly However in most of cases numerical data
may be prepared by files So we will learn how to import data into a variable in R First
prepare a text file with the following values Let us name the file ldquotestdatatxtrdquo We assume
that the file is placed under the directory UserssmithTMP
14
14
21
35
6
Using setwd we change the working directory to UserssmithTMP
setwd(UserssmithTMP)
Then using scan function read the data to a variable x
gt x lt- scan(testdatatxt)
Read 5 items
gt x
[1] 14 14 21 35 6
gt
You notice that the values are stored in x as a vector
R has a function readtable to read a table where each line is separated by TABs like the
following example (file name is ldquobatterstxtrdquo)
Team At_Bat Hits Home_Runs
14
Bonds Giants 9847 2935 762
Aaron Braves 12364 3771 755
Ruth Yankees 8398 2873 714
Rodriguez Yankees 10341 3070 687
Mays Giants 10881 3283 660
readtable can read this as data frame
gt x lt- readtable(batterstxt header = T
sep = t rownames = 1)
gt x
Team At_Bat Hits Home_Runs
Bonds Giants 9847 2935 762
Aaron Braves 12364 3771 755
Ruth Yankees 8398 2873 714
Rodriguez Yankees 10341 3070 687
Mays Giants 10881 3283 660
gt
The first parameter of the function readtable states that the name of the file to read
is rdquobatterstxtrdquo Subsequently header = T states that there is a header for the table sep =
ldquotrdquo indicates that each line is separated by TAB Finally we can specify that there is one
column for row names by rownames = 1 Since x will be a data frame we can get number of
hits by $Hits
Exercise 8 Save table in exercise 7-1 as tab-delimited file and read it as data frame
9 Writing data to file
There are many cases where we want to have statistical results written in file rather
than temporary seeing the results on screen In this way we can open the results by
spreadsheet software or process the results using other programming language afterwards
Using write function is one of the simplest ways to output the results to files This
function enables us to output numerical values assigned to variable to file For example
after assigning the vector to x as shown below
x lt- c(10 12 15 19 21 34)
15
the following line
write(x outfile1txt ncolumns = 1)
will write content of x to the file ldquooutfile1txtrdquo ncolumns = 1 states that the vector will be
written to the file by one column
Content of outfile1txt
10
12
15
19
21
34
write function also enable us to write matrix data to file as shown below
gt x lt- matrix(c(123456) nrow=2 ncol=3 byrow=T)
gt x
[1] [2] [3]
[1] 1 2 3
[2] 4 5 6
gt write(t(x) outfile2txt ncolumns=ncol(x) sep=t)
gt
t(x) transposes matrix x If we do not do it the matrix written in the file will look
transposed ncolumns=ncol(x) will tell R that the number of columns to output should be
identical to that of matrix x sep = ldquotrdquo indicates that the columns in the output file will be
separated by tabs
Content of outfile2txt
1 2 3
4 5 6
For writing data frame to a file writetable function is provided
gt x lt- dataframe(
rownames = c(Bonds Aaron Ruth Rodriguez Mays)
Team = c(Giants Braves Yankees Yankees Giants)
16
At_Bat = c(9847 12364 8398 10341 10881)
Hits = c(2935 3771 2873 3070 3283)
Home_Runs = c(762 755 714 687 660))
gt x[c(Hits Home_Runs)]
Hits Home_Runs
Bonds 2935 762
Aaron 3771 755
Ruth 2873 714
Rodriguez 3070 687
Mays 3283 660
gt writetable(x[c(Hits Home_Runs)] outfile3txt sep=t
rownames=T colnames=NA)
gt
With rownames=T and colnames=NA row names and column names will be added
respectively (blank on the top-left)
Content of outfile3
Hits Home_Runs
Bonds 2935 762
Aaron 3771 755
Ruth 2873 714
Rodriguez 3070 687
Mays 3283 660
By giving quote=F output will be without double quotations
Excercise 9 Using the data frame in the above example calculate ratio of hits and at bat
and write the result to rdquooutfile4txtrdquo
10 Writing a program in a file
So far we have done our works interactively without saving what R codes we have written
However when we repeat the same works with R it is laborious to interactively write the
same codes again and again To solve this issue we can write the set of codes in a file and R
can read the file to execute the codes written in the file
For example we can prepare a text file with the following code Let us name the
17
file vecsumtestR
x lt- c(12345)
y lt- c(246810)
z lt- x + y
Then giving source( vecsumtestR) will let R execute the set of codes in the file
vecsumtestR You can check that based on the codes in vecsumtestR vectors are assigned
to each of x y and z
gt source( vecsumtestR)
gt x
[1] 1 2 3 4 5
gt y
[1] 2 4 6 8 10
gt z
[1] 3 6 9 12 15
gt
Exercise 10 Write the procedure in exercise 8 to a file dframetestR and execute the
procedure using ldquosourcerdquo
11 Defining functions
In mathematics function outputs the value which is determined by the input value In
programming it often represents a defined set of procedures5 For example let us consider
a function f which divides the sum of two given input values In mathematics it can be
written as f(x y) = (x + y) 2 In R it is written as follows by introducing the keyword
ldquofunctionrdquo
f lt- function(x y)
return ((x + y) 2)
In this way a function with two parameters (x and y) is defined And the returned value
(output) will be (x + y) 2 After defining f
5 Probably ldquosubroutinerdquo may be the better terminology
18
f(10 20)
will assign 10 and 20 to parameters x and y respectively and 15 will be returned as (x +y) 2
= (10 + 20) 2 = 15 Here ldquoreturnrdquo statement will return the value given just after it You
can also explicitly give the parameter names x and y as follows
f(x = 10 y = 20)
The general way to define a function is
name_of_function lt- function(parameter 1 parameter 2 hellip)
various procedures possibly using the given parameters6
hellip
return(return_value)
Exercise 11 Implement a mathematical function f(x a b c) = ax2 + bx + c in R Then
calculate f(4 3 2 1)
12 Making graphs
R is equipped with functions capable of making graphs easily ldquoplotrdquo function may be one
of the simplest ones It creates a plot in the two-dimensional space For example
assigning the following vectors to x and y will create a plot with points on the locations
(12) (34) (59) (77) and (98)
x lt- c(13579)
y lt- c(24978)
plot(x y xlab=X Value ylab=Y Value)
Labels on the x and y axes can be given to the parameters xlab and ylab
respectively
6 Optional parameters hellip can be access with list(hellip) as a list
19
A plot created by ldquoplotrdquo function
A bar graph can be created using ldquobarplotrdquo function In the following example a bar
graph is created by giving the heights of each bar by vector x The labels of each bar
are given by the element names of the vector x ie names(x)
x lt- c(1232101)
names(x) lt- c(A B C D E F)
barplot(x)
A bar graph created by ldquobarplotrdquo function
ldquohistrdquo function generates a histogram for a set of numbers given by a vector
2 4 6 8
23
45
67
89
X Value
YV
alu
e
A B C D E F
02
46
810
A B C D E F
02
46
810
20
x lt- c(32 12 42 23 34 59 52 53 41 52 32 14)
hist(x xlab = Test Value main = Test Histogram)
The parameter ldquomainrdquo is used to state the title of the histogram
A generated histogram using ldquohistrdquo function
ldquoboxplotrdquo function creates a boxplot for the numbers given by the vectors
x1 lt- c(1112111011111213151211101213)
x2 lt- c(20212791223231211921157121292315)
boxplot(x1 x2 names=c(Data 1 Data 2))
Test Histogram
Test Value
Fre
qu
en
cy
1 2 3 4 5 6
01
23
4
21
Example of a box plot
Exercise 12 Using the table (data frame) given in exercise 7-1 make a plot which describes
relationship between masses of the planets and number of satellites
13 Basic program structure
R is equipped with programming grammars which are important and common in other
programming languages Here some of the most important ones will be described briefly
131 if-statement
ldquoifrdquo statement gives you a way to execute a specific procedure only if a specified condition7
is satisfied For example if you want to assign 1 to y when x gt 0 and otherwise assign 0 to y
you can write as follows
if (x gt 0)
y lt- 1
7 When specifying a condition logical operators such as amp (logical AND) and | (logical OR)
can be used
Data 1 Data 2
10
15
20
25
Median
Outlier 50 of the
data are within this
range
The bottom
25 excluding outliers
The top 25
excluding outliers
22
else
y lt- 0
Investigate the value of y after doing x lt- -5 Then after doing x lt- 3 investigate the value
of y again to make sure that the value has changed
The general form of if-statement is as follows
if (condition 1)
Set of procedures to execute when the condition 1 is satisfied
else if (condition 2)
Set of procedures to execute when the condition the condition 2 is satisfied (but the
condition 1 is NOT met)
else if(condition 3)
Se of procedures to execute when condition 3 is satisfied (but condition 1 to 2 are NOT
met)
else if hellip
else
Set of procedures to execute when NONE of the above conditions are satisfied
Exercise 13-1 Define a function which returns 1 when the input parameter is 0 and
otherwise returns 0
132 while-statement
while-statement iterates a set of given procedures as long as the given condition is satisfied
The general form of while-statement is as follows8
while(condition)
8 next-statement in the while-statement forces program to start the next iteration
immediately break-statement in while-statement forces the program to immediately stop
the iteration and get out of the while-loop
23
A set of procedures to execute when the condition is satisfied
For example executing while(x lt= 3) print(x) x lt- x + 1 after doing x lt- 1 will generate
the output of 1 to 3
gt x lt- 1
gt while (x lt= 3) print(x) x lt- x + 1
[1] 1
[1] 2
[1] 3
gt
If you are to write this procedure as a program in a file you may want to write each step
line by line as follows so that the program will be easy to read
x lt- 1
while (x lt= 3)
print(x)
x lt- x + 1
Initially the value of x is 1 and the condition of the while-block ie x le 3 is met Thus R
goes into the while-block The first procedure print(x) which displays the value of x is
executed and 1 will be displayed
In the next procedure in the while-block (x lt- x + 1) the value of x is increased by 1 Thus
at the end of the first loop of while-block x is 2
R interpreter then comes back to the condition check at the beginning of the while-block
(x lt= 3) The variable x is 2 at this point and still x le 3 holds so the procedures in the
while-block will be executed again ie displaying the value of x 2 by print(x) and
increasing the value of x by 1 by x lt- x + 1 At the end of the while-block x is 3
24
R interpreter will then come back again to the condition check at the beginning of the
while-block (x lt= 3) The variable x is 3 at this point and still x le 3 holds so the
procedures in the while-block will be executed again ie displaying the value of x which
is 3 by print(x) and increasing the value of x by 1 by x lt- x + 1 At the end of the
while-block x is 4
R interpreter will then come back again to the condition check at the beginning of the
while-block (x lt= 3) The variable x is 4 at this point and x le 3 is NOT satisfied any more
Thus R interpreter steps out of the while-loop Final value of x is 4
Exercise 13-2 Using while-statement display 13579 and 11 respectively in each line
133 for-statement
for-statement also does iteration like while-statement The for-statement assigns each of
given elements to the given variable starting from the first element to the last element in
the given elements After each assignment the procedures in the for-block are executed
The general form of for-statement is
for(variables in elements)
procedures
For example for (i in c(135)) print(i) will assign each of 1 3 5 into the variable i and
after each assignment the procedures in the file-block are executed Thus in this case
number 1 is displayed in the first iteration after the assignment 3 is displayed in the
second iteration after the assignment and finally 5 is displayed in the third iteration after
the assignment The following example makes a vector of set of squared values of 1 to 59
x lt- NULL
for (i in 15)
x lt- append(x i2)
9 Actually using for-statement is unnecessary here Just do x lt- (15)2
25
x lt- NULL assigns an empty vector to x NULL represents an empty vector
In the for-statement each value of 1 to 5 is assigned to i and after the assignment the
procedure in the for-block is executed
In the procedure in the for-block the squared value of i (represented as i2) is
concatenated to the vector x The function append(x i) concatenates i to vector x10
Exercise 13-3 Rewrite procedure in 12-2 using for-statement
14 Other useful functions
Here some of the frequently used R functions are introduced briefly
141 How to use
help(function_name) will display how to use function_name
142 variables and attributes
ls() or objects() will display currently defined variables
class(variable_name) or mode(variable_name) will give you the type of the variable (object
For example whether it is numerical variable character list or matrix)
attributes(variable_name) will return attributes defined for the given variable
variabl_name
143 Family of apply functions
ldquosapplyrdquo function will return a vector containing a set of output values from a given
function after using each value in the given vector as a single input to that given function
each by each
func1_sub lt- function(elm)
a function expecting a single number as a parameter
if(-1 lt= elm amp elm lt= 1) return (1) else return (0)
10 The same procedure can be done with x lt- c(x i2) c can be used to concatenate given
vectors
26
func1 lt- function(x) a function with a vector parameter x
return(sapply(x func1_sub))
144 Making figures
rdquocurverdquo function generates a graph for a given function See help for details
Example
curve(dnorm -7 +7) Draws normal (Gaussian) distribution
curve(cos(x)+cos(2x) -2pi 2pi 1000) 1000 is number of points
curve(func1 -3 3) The function defined in 143 Family of apply functions
27
2
0 Introduction
R is one of the best languages to perform statistical analyses it can analyze huge amount of
data through scientific calculations find tendencies among the data and visualize them In
this tutorial you will learn fundamentals of R language
1 Starting and ending R
How to start R depends on the system you are using In the UNIX system with R installed
you may be able to start R by just typing R In Windows or Macintosh double-click R icon to
start To end R just type
q()
2 Simple value assignments to variables
Variables temporarily keep values For example if we want to have variable x to keep the
value 123 type
x lt- 123
After that you can just type x then you will see value assigned to x
gt x lt- 123
gt x
[1] 123
gt
Actually R is capable of handling not only single value but also vector1 For example if you
want to assign vector (1 3 5) to variable y you can do so with c before vector
y lt- c(1 3 5)
You can make vectors having numbers from 2 to 5 by y lt- c(2345) Alternatively you can
simply type
1 Single value (scalar) can be deemed as one-dimensional vector
3
y lt- 25
as vectors are composed of consecutive numbers from 2 to 5
Exercise 2-1 Assign (10 11 12) to variable z and display information of variable z
3 Simple Arithmetic
R can perform various arithmetic including addition subtraction multiplication and
division For example if you input 1+2 you will get an answer of 3 as follows
gt 1 + 2
[1] 3
gt
In R like most of other programming languages + - and denotes to addition
subtraction multiplication and division respectively
R can also manipulate vectors For example c(1 2 3) + c(4 5 6) will give (5 7 9) and
c(1 2 3) 2 will give (2 4 6) Arithmetic calculations with variables can also be performed
If (1 2 3) and (4 5 6) is assigned to x and y respectively x + y will give a vector (5 7 9)
A value of variables can be changed based on result of calculation For example after doing
x lt- c(1 2 3)
x lt- x 2
will multiply x by 2 and the result will be overwritten to x itself
Exercise 3-1 Assign vector (1 2 3) to variable x and assign 2 to variable y Then calculate x
y What answer do you get
Exercise 3-2 Assign (1 2 3) to vector x and multiply it by three Put the result into x itself
4 Simple vector arithmetic
As already explained list of numbers in bracket immediately after c represents vector
Dimension of vector ie number of numbers in the given vector x can be obtained by
length(x)
4
One can extract desired number from the vector For example after inputting x lt-
c(246810)
x[3]
will give you 6 which is the third number of the vector
x[c(24)]
will give you second and fourth numbers of the vector and
x[24]
will give you numbers from second to fourth elements of the vector
You can also perform vector comparison For example x gt 5 will give you vectors
containing TRUE andor FALSE (abbreviated as T and F respectively) where each element
denotes whether corresponding number in x is greater than x or not
gt x lt- c(246810)
gt x
[1] 2 4 6 8 10
gt x gt 5
[1] FALSE FALSE TRUE TRUE TRUE
gt
R function ldquowhichrdquo will returns where the Trsquos are in the given vector as index numbers
Using the vector c(F F T T T) returned by x gt 5 which(c(F F T T T)) will give you vector
(345) More easily ldquowhich(x gt 5)rdquo will give you exactly the same answer
gt x lt- c(246810)
gt which(x gt 5)
[1] 3 4 5
gt
Using this vector which is composed of T and F we can extract elements which correspond
to T
x[ c(F F T T T)]
By putting above together it is sufficient to just type
x[ x gt 5 ]
to extract elements whose values are above 5
5
Actually we can also deal with set of strings as vector For example after typing
x lt- c(Sunday Monday Tuesday Wednesday Thursday Friday Saturday)
x[2] will give you second string rdquoMondayrdquo Various manipulations are available for a vector
containing strings
grep(es x)
will give you indices of strings in vector x where string contain substring ldquoesrdquo Thus the
below inputs will return strings containing ldquoesrdquo
gt x lt- c(Sunday Monday Tuesday Wednesday Thursday Friday Saturday)
gt x[ grep(es x) ]
[1] Tuesday Wednesday
gt
You can assign name for each element in a vector using function ldquonamerdquo For example
x lt- c(2 4 6)
names(x) lt- c(First Second Third)
will assign (ldquoFirstrdquo ldquoSecondrdquo ldquoThirdrdquo) to name attribute of variable x
x[[ Second ]]
will give you second element
Various statistical functions are defined for vectors containing only numerical values For
example
sum(x)
will give you sum of numerical elements in vector x and
mean(x)
will give you average of numerical elements in x The function sum will count number of Trsquos
in vector x containing only T andor F Thus
x lt- c(246810)
sum(x gt 5)
will count number of numerical elements greater than 5 (ie 3 will be returned)
Exercise 4-1 Create vector containing numerical values larger than 5 in vector (3 1 4 1 5
9 2 6 5)
6
Exercise 4-2 Assign names (ldquoJanrdquo ldquoFebrdquo ldquoMarrdquo ldquoAprrdquo ldquoMayrdquo ldquoJunrdquo ldquoJulrdquo ldquoAugrdquo ldquoSeprdquo
ldquoOctrdquo ldquoNovrdquo ldquoDecrdquo) for respective element of vector (123456789101112) Then
extract third element from the vector using the string rdquoMarrdquo The extracted element should
be 3
5 Simple matrix construction and arithmetic
By gathering vectors it is possible to create a matrix using the function rbind For example
if you want to create a matrix x = 1 2 3
4 5 6
aelig
egraveccedil
ouml
oslashdivide where the first and second rows are (123)
and (456) respectively type
x lt- rbind(c(123) c(456))
Then just type x to display the matrix you have created
gt x lt- rbind(c(123) c(456))
gt x
[1] [2] [3]
[1] 1 2 3
[2] 4 5 6
gt
Alternatively
x lt- matrix(c(1 4 2 5 3 6) nrow=2 ncol=3)
or
x lt- matrix(c(1 2 3 4 5 6) nrow=2 ncol=3 byrow=T)
should return the identical matrix The latter one means that matrix of size 2 times 3 will be
created (nrow=2 ncol=3) and numbers are filled in each row first (byrow=T)
Various functions are available for a matrix nrow(x) and ncol(x) will return number of
rows and columns of the matrix x respectively x+1 will add 1 to all the elements in x and x
2 will multiply all the elements in x by 2 Various kinds of arithmetic between matrices
are also available For example after typing y lt- rbind(c(2 4 6) c(8 10 12)) x + y will give
you matrix where each element correspond to sum of corresponding element of x and y x y
will give you matrix where each element correspond to product of corresponding element of
7
x and y2
Any specific row or column can be extracted from a given matrix For example if you
want to extract second row you type
gt x[2]
[1] 4 5 6
gt
If you want to extract second column you type
gt x[2]
[1] 2 5
t(x) will transpose the matrix x
gt t(x)
[1] [2]
[1] 1 4
[2] 2 5
[3] 3 6
gt
Average of each row of matrix x can be calculated as below3
gt apply(x 1 mean)
[1] 2 5
Average of each column of matrix x can be calculated as below
gt apply(x 2 mean)
[1] 25 35 45
Actually matrix can be deemed as set of numbers in two dimensional array R can also
deal with array having n dimensions using array(vector numbers of elements in each
2 Product of the matrices based on canonical mathematical definition can be calculated by
the operator 3 Second parameter of 1 in apply function denotes that we will calculate average for each
position of the first dimension (in this case the first dimension is row number) Similarly
second parameter of 2 denotes that we will calculate average for each position of the second
dimension (in this case the second dimension is column number)
8
dimension) For example
x lt- array(124 c(342))
will create three dimensional array with size of 3times4times2 and fills numbers in the given
vector from the first dimension to the third dimension
gt x lt- array(124 c(342))
gt x
1 The first 3times4 array of the third dimension
[1] [2] [3] [4]
[1] 1 4 7 10
[2] 2 5 8 11
[3] 3 6 9 12
2 The second 3times4 array of the third dimension
[1] [2] [3] [4]
[1] 13 16 19 22
[2] 14 17 20 23
[3] 15 18 21 24
gt
Exercise 5-1 Calculate 1 3 5
7 9 11
aelig
egraveccedil
ouml
oslashdivide+
1 2 3
2 4 6
aelig
egraveccedil
ouml
oslashdivide
Exercise 5-2 For the matrix obtained in the above calculation calculate row average and
column average
6 Simple list creation
A list in R can gather various kinds of data into a single object to manage them
x lt- list(Ichiro rdquo Seattlerdquo Right fielder)
will create a list containing Ichiro rdquo Seattlerdquo Right fielder Although a vector cannot
9
contain another vector a list can contain a vector as shown in the example below
x lt- list(Ichiro Seattle Right fielder c(184 214 225))
To extract the second element you can type
x[[2]]
You can assign names to each element as below
x lt- list(player = Ichiro team = Seattle
position = Right fielder hits = c(184 214 225))
Type x to confirm that names are given to each element
gt x
$player
[1] Ichiro
$team
[1] Seattle
$position
[1] Right fielder
$hits
[1] 184 214 225
gt
You can use assigned name to extract corresponding element For example
x[[team]]
or
x$team
will extract ldquoSeattlerdquo
Exercise 6-2 Create a list containing ldquoSan Diegordquo vector (32 117) 9645 and ldquoCaliforniardquo
Give names ldquocityrdquo ldquocoordinatesrdquo ldquoareardquo and ldquostaterdquo to respective element
10
11
7 Simple data frame creation
Data frame is one of data class in R It is one type of list and has two dimensional
structure just like a matrix Each row can be deemed as a sample and each column can be
deemed as attribute of the sample Using this idea data frame can represent a table
Following table gives data of five retired major league baseball players
Team atbats hits homeruns
Rose Reds 14053 4256 160
Aaron Brewers 12364 3771 755
Yastrzemski Red Sox 11988 3419 452
Ripken Orioles 11551 3184 431
Cobb Athletics 11434 4191 117
The above table can be represented by data frame as follows
x lt- dataframe(
rownames = c(Rose Aaron Yastrzemski Ripken Cobb)
team = c(Reds Brewers Red Sox Orioles Athletics)
atbats = c(14053 12364 11988 11551 11434)
hits = c(4256 3771 3419 3184 4191)
homeruns = c(160 755 452 431 117))
The function dataframe can generate a data frame and can be used in the format of
dataframe(rownames = vector for column labels column name 1 = vector 1 column name
2 = vector 2 hellip) You can check the content of x by typing x
gt x
team atbats hits homeruns
Rose Reds 14053 4256 160
Aaron Brewers 12364 3771 755
Yastrzemski Red Sox 11988 3419 452
Ripken Orioles 11551 3184 431
Cobb Athletics 11434 4191 117
gt
Like a regular list column name can be used to extract corresponding vector
gt x$hits
[1] 4256 3771 3419 3184 4191
gt
12
Any part of data frame can be extracted as another data frame For example
x[ c(15) c(234) ]
will extract row 1 5 and column 2 3 4 as a new data frame You can also use row names
and column names to do the same thing
x[ c(Rose Cobb) c(atbats hits homeruns)]
Various functions are defined for data frame Let us get attributes associated with the data
frame x
gt attributes(x)
$names
[1] team atbats hits homeruns
$rownames
[1] Rose Aaron Yastrzemski Ripken Cobb
$class
[1] dataframe
gt
We got names rownames and class Type names(x) rownames(x) and class(x) You can
obtain row names column names and class of x respectively
Exercise 7-1 The below table shows characteristic values of each planet in solar system
Masses are represented in 1023 kg and diameters are represented in km Make a data frame
representing the table4
Mass Diameter Satellites
Mercury 3301 4879 0
Venus 12103 48690 0
Earth 59736 12756 1
4 As all the elements are numeric in this case this data frame can be dealt as a matrix
asmatrix(x) will return x as a matrix
13
Mars 6419 6794 2
Jupiter 18986 142984 63
Saturn 5688 120536 48
Uranus 8686 51118 27
Neptune 1024 49528 13
Exercise 7-2 Using the created data frame in the previous exercise calculate averages of
mass diameter and number of satellites
8 Data reading from file
So far we have been inputting data directly However in most of cases numerical data
may be prepared by files So we will learn how to import data into a variable in R First
prepare a text file with the following values Let us name the file ldquotestdatatxtrdquo We assume
that the file is placed under the directory UserssmithTMP
14
14
21
35
6
Using setwd we change the working directory to UserssmithTMP
setwd(UserssmithTMP)
Then using scan function read the data to a variable x
gt x lt- scan(testdatatxt)
Read 5 items
gt x
[1] 14 14 21 35 6
gt
You notice that the values are stored in x as a vector
R has a function readtable to read a table where each line is separated by TABs like the
following example (file name is ldquobatterstxtrdquo)
Team At_Bat Hits Home_Runs
14
Bonds Giants 9847 2935 762
Aaron Braves 12364 3771 755
Ruth Yankees 8398 2873 714
Rodriguez Yankees 10341 3070 687
Mays Giants 10881 3283 660
readtable can read this as data frame
gt x lt- readtable(batterstxt header = T
sep = t rownames = 1)
gt x
Team At_Bat Hits Home_Runs
Bonds Giants 9847 2935 762
Aaron Braves 12364 3771 755
Ruth Yankees 8398 2873 714
Rodriguez Yankees 10341 3070 687
Mays Giants 10881 3283 660
gt
The first parameter of the function readtable states that the name of the file to read
is rdquobatterstxtrdquo Subsequently header = T states that there is a header for the table sep =
ldquotrdquo indicates that each line is separated by TAB Finally we can specify that there is one
column for row names by rownames = 1 Since x will be a data frame we can get number of
hits by $Hits
Exercise 8 Save table in exercise 7-1 as tab-delimited file and read it as data frame
9 Writing data to file
There are many cases where we want to have statistical results written in file rather
than temporary seeing the results on screen In this way we can open the results by
spreadsheet software or process the results using other programming language afterwards
Using write function is one of the simplest ways to output the results to files This
function enables us to output numerical values assigned to variable to file For example
after assigning the vector to x as shown below
x lt- c(10 12 15 19 21 34)
15
the following line
write(x outfile1txt ncolumns = 1)
will write content of x to the file ldquooutfile1txtrdquo ncolumns = 1 states that the vector will be
written to the file by one column
Content of outfile1txt
10
12
15
19
21
34
write function also enable us to write matrix data to file as shown below
gt x lt- matrix(c(123456) nrow=2 ncol=3 byrow=T)
gt x
[1] [2] [3]
[1] 1 2 3
[2] 4 5 6
gt write(t(x) outfile2txt ncolumns=ncol(x) sep=t)
gt
t(x) transposes matrix x If we do not do it the matrix written in the file will look
transposed ncolumns=ncol(x) will tell R that the number of columns to output should be
identical to that of matrix x sep = ldquotrdquo indicates that the columns in the output file will be
separated by tabs
Content of outfile2txt
1 2 3
4 5 6
For writing data frame to a file writetable function is provided
gt x lt- dataframe(
rownames = c(Bonds Aaron Ruth Rodriguez Mays)
Team = c(Giants Braves Yankees Yankees Giants)
16
At_Bat = c(9847 12364 8398 10341 10881)
Hits = c(2935 3771 2873 3070 3283)
Home_Runs = c(762 755 714 687 660))
gt x[c(Hits Home_Runs)]
Hits Home_Runs
Bonds 2935 762
Aaron 3771 755
Ruth 2873 714
Rodriguez 3070 687
Mays 3283 660
gt writetable(x[c(Hits Home_Runs)] outfile3txt sep=t
rownames=T colnames=NA)
gt
With rownames=T and colnames=NA row names and column names will be added
respectively (blank on the top-left)
Content of outfile3
Hits Home_Runs
Bonds 2935 762
Aaron 3771 755
Ruth 2873 714
Rodriguez 3070 687
Mays 3283 660
By giving quote=F output will be without double quotations
Excercise 9 Using the data frame in the above example calculate ratio of hits and at bat
and write the result to rdquooutfile4txtrdquo
10 Writing a program in a file
So far we have done our works interactively without saving what R codes we have written
However when we repeat the same works with R it is laborious to interactively write the
same codes again and again To solve this issue we can write the set of codes in a file and R
can read the file to execute the codes written in the file
For example we can prepare a text file with the following code Let us name the
17
file vecsumtestR
x lt- c(12345)
y lt- c(246810)
z lt- x + y
Then giving source( vecsumtestR) will let R execute the set of codes in the file
vecsumtestR You can check that based on the codes in vecsumtestR vectors are assigned
to each of x y and z
gt source( vecsumtestR)
gt x
[1] 1 2 3 4 5
gt y
[1] 2 4 6 8 10
gt z
[1] 3 6 9 12 15
gt
Exercise 10 Write the procedure in exercise 8 to a file dframetestR and execute the
procedure using ldquosourcerdquo
11 Defining functions
In mathematics function outputs the value which is determined by the input value In
programming it often represents a defined set of procedures5 For example let us consider
a function f which divides the sum of two given input values In mathematics it can be
written as f(x y) = (x + y) 2 In R it is written as follows by introducing the keyword
ldquofunctionrdquo
f lt- function(x y)
return ((x + y) 2)
In this way a function with two parameters (x and y) is defined And the returned value
(output) will be (x + y) 2 After defining f
5 Probably ldquosubroutinerdquo may be the better terminology
18
f(10 20)
will assign 10 and 20 to parameters x and y respectively and 15 will be returned as (x +y) 2
= (10 + 20) 2 = 15 Here ldquoreturnrdquo statement will return the value given just after it You
can also explicitly give the parameter names x and y as follows
f(x = 10 y = 20)
The general way to define a function is
name_of_function lt- function(parameter 1 parameter 2 hellip)
various procedures possibly using the given parameters6
hellip
return(return_value)
Exercise 11 Implement a mathematical function f(x a b c) = ax2 + bx + c in R Then
calculate f(4 3 2 1)
12 Making graphs
R is equipped with functions capable of making graphs easily ldquoplotrdquo function may be one
of the simplest ones It creates a plot in the two-dimensional space For example
assigning the following vectors to x and y will create a plot with points on the locations
(12) (34) (59) (77) and (98)
x lt- c(13579)
y lt- c(24978)
plot(x y xlab=X Value ylab=Y Value)
Labels on the x and y axes can be given to the parameters xlab and ylab
respectively
6 Optional parameters hellip can be access with list(hellip) as a list
19
A plot created by ldquoplotrdquo function
A bar graph can be created using ldquobarplotrdquo function In the following example a bar
graph is created by giving the heights of each bar by vector x The labels of each bar
are given by the element names of the vector x ie names(x)
x lt- c(1232101)
names(x) lt- c(A B C D E F)
barplot(x)
A bar graph created by ldquobarplotrdquo function
ldquohistrdquo function generates a histogram for a set of numbers given by a vector
2 4 6 8
23
45
67
89
X Value
YV
alu
e
A B C D E F
02
46
810
A B C D E F
02
46
810
20
x lt- c(32 12 42 23 34 59 52 53 41 52 32 14)
hist(x xlab = Test Value main = Test Histogram)
The parameter ldquomainrdquo is used to state the title of the histogram
A generated histogram using ldquohistrdquo function
ldquoboxplotrdquo function creates a boxplot for the numbers given by the vectors
x1 lt- c(1112111011111213151211101213)
x2 lt- c(20212791223231211921157121292315)
boxplot(x1 x2 names=c(Data 1 Data 2))
Test Histogram
Test Value
Fre
qu
en
cy
1 2 3 4 5 6
01
23
4
21
Example of a box plot
Exercise 12 Using the table (data frame) given in exercise 7-1 make a plot which describes
relationship between masses of the planets and number of satellites
13 Basic program structure
R is equipped with programming grammars which are important and common in other
programming languages Here some of the most important ones will be described briefly
131 if-statement
ldquoifrdquo statement gives you a way to execute a specific procedure only if a specified condition7
is satisfied For example if you want to assign 1 to y when x gt 0 and otherwise assign 0 to y
you can write as follows
if (x gt 0)
y lt- 1
7 When specifying a condition logical operators such as amp (logical AND) and | (logical OR)
can be used
Data 1 Data 2
10
15
20
25
Median
Outlier 50 of the
data are within this
range
The bottom
25 excluding outliers
The top 25
excluding outliers
22
else
y lt- 0
Investigate the value of y after doing x lt- -5 Then after doing x lt- 3 investigate the value
of y again to make sure that the value has changed
The general form of if-statement is as follows
if (condition 1)
Set of procedures to execute when the condition 1 is satisfied
else if (condition 2)
Set of procedures to execute when the condition the condition 2 is satisfied (but the
condition 1 is NOT met)
else if(condition 3)
Se of procedures to execute when condition 3 is satisfied (but condition 1 to 2 are NOT
met)
else if hellip
else
Set of procedures to execute when NONE of the above conditions are satisfied
Exercise 13-1 Define a function which returns 1 when the input parameter is 0 and
otherwise returns 0
132 while-statement
while-statement iterates a set of given procedures as long as the given condition is satisfied
The general form of while-statement is as follows8
while(condition)
8 next-statement in the while-statement forces program to start the next iteration
immediately break-statement in while-statement forces the program to immediately stop
the iteration and get out of the while-loop
23
A set of procedures to execute when the condition is satisfied
For example executing while(x lt= 3) print(x) x lt- x + 1 after doing x lt- 1 will generate
the output of 1 to 3
gt x lt- 1
gt while (x lt= 3) print(x) x lt- x + 1
[1] 1
[1] 2
[1] 3
gt
If you are to write this procedure as a program in a file you may want to write each step
line by line as follows so that the program will be easy to read
x lt- 1
while (x lt= 3)
print(x)
x lt- x + 1
Initially the value of x is 1 and the condition of the while-block ie x le 3 is met Thus R
goes into the while-block The first procedure print(x) which displays the value of x is
executed and 1 will be displayed
In the next procedure in the while-block (x lt- x + 1) the value of x is increased by 1 Thus
at the end of the first loop of while-block x is 2
R interpreter then comes back to the condition check at the beginning of the while-block
(x lt= 3) The variable x is 2 at this point and still x le 3 holds so the procedures in the
while-block will be executed again ie displaying the value of x 2 by print(x) and
increasing the value of x by 1 by x lt- x + 1 At the end of the while-block x is 3
24
R interpreter will then come back again to the condition check at the beginning of the
while-block (x lt= 3) The variable x is 3 at this point and still x le 3 holds so the
procedures in the while-block will be executed again ie displaying the value of x which
is 3 by print(x) and increasing the value of x by 1 by x lt- x + 1 At the end of the
while-block x is 4
R interpreter will then come back again to the condition check at the beginning of the
while-block (x lt= 3) The variable x is 4 at this point and x le 3 is NOT satisfied any more
Thus R interpreter steps out of the while-loop Final value of x is 4
Exercise 13-2 Using while-statement display 13579 and 11 respectively in each line
133 for-statement
for-statement also does iteration like while-statement The for-statement assigns each of
given elements to the given variable starting from the first element to the last element in
the given elements After each assignment the procedures in the for-block are executed
The general form of for-statement is
for(variables in elements)
procedures
For example for (i in c(135)) print(i) will assign each of 1 3 5 into the variable i and
after each assignment the procedures in the file-block are executed Thus in this case
number 1 is displayed in the first iteration after the assignment 3 is displayed in the
second iteration after the assignment and finally 5 is displayed in the third iteration after
the assignment The following example makes a vector of set of squared values of 1 to 59
x lt- NULL
for (i in 15)
x lt- append(x i2)
9 Actually using for-statement is unnecessary here Just do x lt- (15)2
25
x lt- NULL assigns an empty vector to x NULL represents an empty vector
In the for-statement each value of 1 to 5 is assigned to i and after the assignment the
procedure in the for-block is executed
In the procedure in the for-block the squared value of i (represented as i2) is
concatenated to the vector x The function append(x i) concatenates i to vector x10
Exercise 13-3 Rewrite procedure in 12-2 using for-statement
14 Other useful functions
Here some of the frequently used R functions are introduced briefly
141 How to use
help(function_name) will display how to use function_name
142 variables and attributes
ls() or objects() will display currently defined variables
class(variable_name) or mode(variable_name) will give you the type of the variable (object
For example whether it is numerical variable character list or matrix)
attributes(variable_name) will return attributes defined for the given variable
variabl_name
143 Family of apply functions
ldquosapplyrdquo function will return a vector containing a set of output values from a given
function after using each value in the given vector as a single input to that given function
each by each
func1_sub lt- function(elm)
a function expecting a single number as a parameter
if(-1 lt= elm amp elm lt= 1) return (1) else return (0)
10 The same procedure can be done with x lt- c(x i2) c can be used to concatenate given
vectors
26
func1 lt- function(x) a function with a vector parameter x
return(sapply(x func1_sub))
144 Making figures
rdquocurverdquo function generates a graph for a given function See help for details
Example
curve(dnorm -7 +7) Draws normal (Gaussian) distribution
curve(cos(x)+cos(2x) -2pi 2pi 1000) 1000 is number of points
curve(func1 -3 3) The function defined in 143 Family of apply functions
27
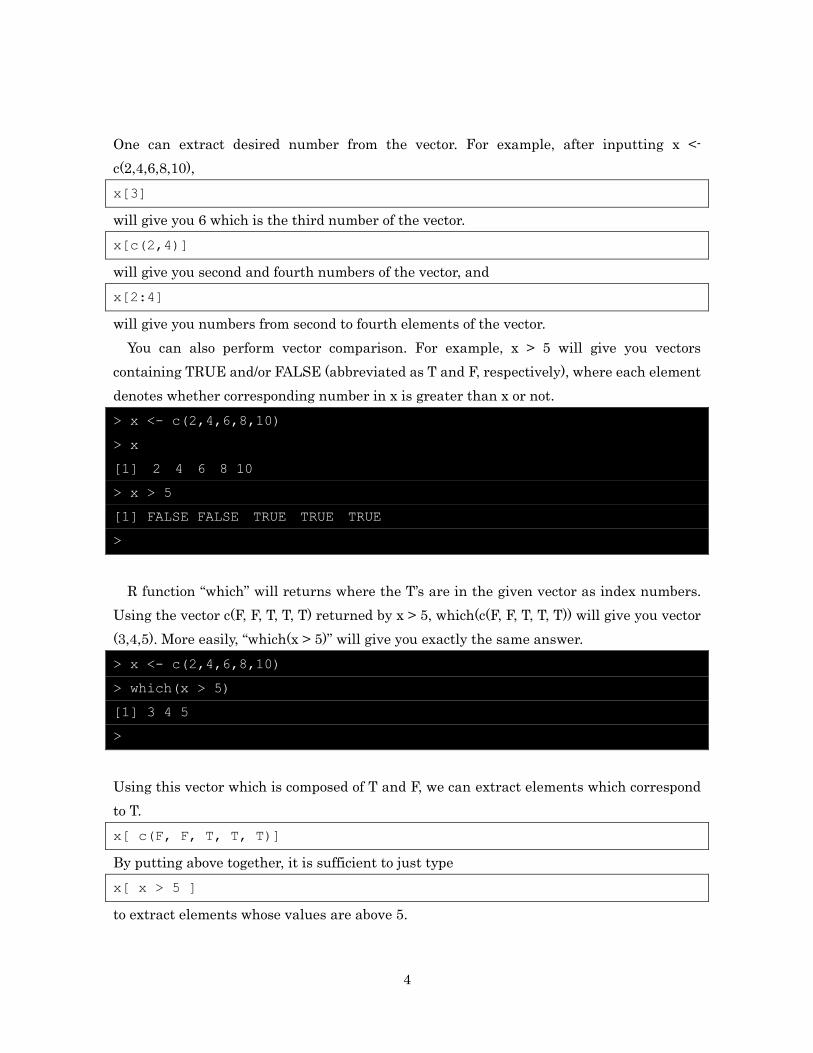
4
One can extract desired number from the vector For example after inputting x lt-
c(246810)
x[3]
will give you 6 which is the third number of the vector
x[c(24)]
will give you second and fourth numbers of the vector and
x[24]
will give you numbers from second to fourth elements of the vector
You can also perform vector comparison For example x gt 5 will give you vectors
containing TRUE andor FALSE (abbreviated as T and F respectively) where each element
denotes whether corresponding number in x is greater than x or not
gt x lt- c(246810)
gt x
[1] 2 4 6 8 10
gt x gt 5
[1] FALSE FALSE TRUE TRUE TRUE
gt
R function ldquowhichrdquo will returns where the Trsquos are in the given vector as index numbers
Using the vector c(F F T T T) returned by x gt 5 which(c(F F T T T)) will give you vector
(345) More easily ldquowhich(x gt 5)rdquo will give you exactly the same answer
gt x lt- c(246810)
gt which(x gt 5)
[1] 3 4 5
gt
Using this vector which is composed of T and F we can extract elements which correspond
to T
x[ c(F F T T T)]
By putting above together it is sufficient to just type
x[ x gt 5 ]
to extract elements whose values are above 5
5
Actually we can also deal with set of strings as vector For example after typing
x lt- c(Sunday Monday Tuesday Wednesday Thursday Friday Saturday)
x[2] will give you second string rdquoMondayrdquo Various manipulations are available for a vector
containing strings
grep(es x)
will give you indices of strings in vector x where string contain substring ldquoesrdquo Thus the
below inputs will return strings containing ldquoesrdquo
gt x lt- c(Sunday Monday Tuesday Wednesday Thursday Friday Saturday)
gt x[ grep(es x) ]
[1] Tuesday Wednesday
gt
You can assign name for each element in a vector using function ldquonamerdquo For example
x lt- c(2 4 6)
names(x) lt- c(First Second Third)
will assign (ldquoFirstrdquo ldquoSecondrdquo ldquoThirdrdquo) to name attribute of variable x
x[[ Second ]]
will give you second element
Various statistical functions are defined for vectors containing only numerical values For
example
sum(x)
will give you sum of numerical elements in vector x and
mean(x)
will give you average of numerical elements in x The function sum will count number of Trsquos
in vector x containing only T andor F Thus
x lt- c(246810)
sum(x gt 5)
will count number of numerical elements greater than 5 (ie 3 will be returned)
Exercise 4-1 Create vector containing numerical values larger than 5 in vector (3 1 4 1 5
9 2 6 5)
6
Exercise 4-2 Assign names (ldquoJanrdquo ldquoFebrdquo ldquoMarrdquo ldquoAprrdquo ldquoMayrdquo ldquoJunrdquo ldquoJulrdquo ldquoAugrdquo ldquoSeprdquo
ldquoOctrdquo ldquoNovrdquo ldquoDecrdquo) for respective element of vector (123456789101112) Then
extract third element from the vector using the string rdquoMarrdquo The extracted element should
be 3
5 Simple matrix construction and arithmetic
By gathering vectors it is possible to create a matrix using the function rbind For example
if you want to create a matrix x = 1 2 3
4 5 6
aelig
egraveccedil
ouml
oslashdivide where the first and second rows are (123)
and (456) respectively type
x lt- rbind(c(123) c(456))
Then just type x to display the matrix you have created
gt x lt- rbind(c(123) c(456))
gt x
[1] [2] [3]
[1] 1 2 3
[2] 4 5 6
gt
Alternatively
x lt- matrix(c(1 4 2 5 3 6) nrow=2 ncol=3)
or
x lt- matrix(c(1 2 3 4 5 6) nrow=2 ncol=3 byrow=T)
should return the identical matrix The latter one means that matrix of size 2 times 3 will be
created (nrow=2 ncol=3) and numbers are filled in each row first (byrow=T)
Various functions are available for a matrix nrow(x) and ncol(x) will return number of
rows and columns of the matrix x respectively x+1 will add 1 to all the elements in x and x
2 will multiply all the elements in x by 2 Various kinds of arithmetic between matrices
are also available For example after typing y lt- rbind(c(2 4 6) c(8 10 12)) x + y will give
you matrix where each element correspond to sum of corresponding element of x and y x y
will give you matrix where each element correspond to product of corresponding element of
7
x and y2
Any specific row or column can be extracted from a given matrix For example if you
want to extract second row you type
gt x[2]
[1] 4 5 6
gt
If you want to extract second column you type
gt x[2]
[1] 2 5
t(x) will transpose the matrix x
gt t(x)
[1] [2]
[1] 1 4
[2] 2 5
[3] 3 6
gt
Average of each row of matrix x can be calculated as below3
gt apply(x 1 mean)
[1] 2 5
Average of each column of matrix x can be calculated as below
gt apply(x 2 mean)
[1] 25 35 45
Actually matrix can be deemed as set of numbers in two dimensional array R can also
deal with array having n dimensions using array(vector numbers of elements in each
2 Product of the matrices based on canonical mathematical definition can be calculated by
the operator 3 Second parameter of 1 in apply function denotes that we will calculate average for each
position of the first dimension (in this case the first dimension is row number) Similarly
second parameter of 2 denotes that we will calculate average for each position of the second
dimension (in this case the second dimension is column number)
8
dimension) For example
x lt- array(124 c(342))
will create three dimensional array with size of 3times4times2 and fills numbers in the given
vector from the first dimension to the third dimension
gt x lt- array(124 c(342))
gt x
1 The first 3times4 array of the third dimension
[1] [2] [3] [4]
[1] 1 4 7 10
[2] 2 5 8 11
[3] 3 6 9 12
2 The second 3times4 array of the third dimension
[1] [2] [3] [4]
[1] 13 16 19 22
[2] 14 17 20 23
[3] 15 18 21 24
gt
Exercise 5-1 Calculate 1 3 5
7 9 11
aelig
egraveccedil
ouml
oslashdivide+
1 2 3
2 4 6
aelig
egraveccedil
ouml
oslashdivide
Exercise 5-2 For the matrix obtained in the above calculation calculate row average and
column average
6 Simple list creation
A list in R can gather various kinds of data into a single object to manage them
x lt- list(Ichiro rdquo Seattlerdquo Right fielder)
will create a list containing Ichiro rdquo Seattlerdquo Right fielder Although a vector cannot
9
contain another vector a list can contain a vector as shown in the example below
x lt- list(Ichiro Seattle Right fielder c(184 214 225))
To extract the second element you can type
x[[2]]
You can assign names to each element as below
x lt- list(player = Ichiro team = Seattle
position = Right fielder hits = c(184 214 225))
Type x to confirm that names are given to each element
gt x
$player
[1] Ichiro
$team
[1] Seattle
$position
[1] Right fielder
$hits
[1] 184 214 225
gt
You can use assigned name to extract corresponding element For example
x[[team]]
or
x$team
will extract ldquoSeattlerdquo
Exercise 6-2 Create a list containing ldquoSan Diegordquo vector (32 117) 9645 and ldquoCaliforniardquo
Give names ldquocityrdquo ldquocoordinatesrdquo ldquoareardquo and ldquostaterdquo to respective element
10
11
7 Simple data frame creation
Data frame is one of data class in R It is one type of list and has two dimensional
structure just like a matrix Each row can be deemed as a sample and each column can be
deemed as attribute of the sample Using this idea data frame can represent a table
Following table gives data of five retired major league baseball players
Team atbats hits homeruns
Rose Reds 14053 4256 160
Aaron Brewers 12364 3771 755
Yastrzemski Red Sox 11988 3419 452
Ripken Orioles 11551 3184 431
Cobb Athletics 11434 4191 117
The above table can be represented by data frame as follows
x lt- dataframe(
rownames = c(Rose Aaron Yastrzemski Ripken Cobb)
team = c(Reds Brewers Red Sox Orioles Athletics)
atbats = c(14053 12364 11988 11551 11434)
hits = c(4256 3771 3419 3184 4191)
homeruns = c(160 755 452 431 117))
The function dataframe can generate a data frame and can be used in the format of
dataframe(rownames = vector for column labels column name 1 = vector 1 column name
2 = vector 2 hellip) You can check the content of x by typing x
gt x
team atbats hits homeruns
Rose Reds 14053 4256 160
Aaron Brewers 12364 3771 755
Yastrzemski Red Sox 11988 3419 452
Ripken Orioles 11551 3184 431
Cobb Athletics 11434 4191 117
gt
Like a regular list column name can be used to extract corresponding vector
gt x$hits
[1] 4256 3771 3419 3184 4191
gt
12
Any part of data frame can be extracted as another data frame For example
x[ c(15) c(234) ]
will extract row 1 5 and column 2 3 4 as a new data frame You can also use row names
and column names to do the same thing
x[ c(Rose Cobb) c(atbats hits homeruns)]
Various functions are defined for data frame Let us get attributes associated with the data
frame x
gt attributes(x)
$names
[1] team atbats hits homeruns
$rownames
[1] Rose Aaron Yastrzemski Ripken Cobb
$class
[1] dataframe
gt
We got names rownames and class Type names(x) rownames(x) and class(x) You can
obtain row names column names and class of x respectively
Exercise 7-1 The below table shows characteristic values of each planet in solar system
Masses are represented in 1023 kg and diameters are represented in km Make a data frame
representing the table4
Mass Diameter Satellites
Mercury 3301 4879 0
Venus 12103 48690 0
Earth 59736 12756 1
4 As all the elements are numeric in this case this data frame can be dealt as a matrix
asmatrix(x) will return x as a matrix
13
Mars 6419 6794 2
Jupiter 18986 142984 63
Saturn 5688 120536 48
Uranus 8686 51118 27
Neptune 1024 49528 13
Exercise 7-2 Using the created data frame in the previous exercise calculate averages of
mass diameter and number of satellites
8 Data reading from file
So far we have been inputting data directly However in most of cases numerical data
may be prepared by files So we will learn how to import data into a variable in R First
prepare a text file with the following values Let us name the file ldquotestdatatxtrdquo We assume
that the file is placed under the directory UserssmithTMP
14
14
21
35
6
Using setwd we change the working directory to UserssmithTMP
setwd(UserssmithTMP)
Then using scan function read the data to a variable x
gt x lt- scan(testdatatxt)
Read 5 items
gt x
[1] 14 14 21 35 6
gt
You notice that the values are stored in x as a vector
R has a function readtable to read a table where each line is separated by TABs like the
following example (file name is ldquobatterstxtrdquo)
Team At_Bat Hits Home_Runs
14
Bonds Giants 9847 2935 762
Aaron Braves 12364 3771 755
Ruth Yankees 8398 2873 714
Rodriguez Yankees 10341 3070 687
Mays Giants 10881 3283 660
readtable can read this as data frame
gt x lt- readtable(batterstxt header = T
sep = t rownames = 1)
gt x
Team At_Bat Hits Home_Runs
Bonds Giants 9847 2935 762
Aaron Braves 12364 3771 755
Ruth Yankees 8398 2873 714
Rodriguez Yankees 10341 3070 687
Mays Giants 10881 3283 660
gt
The first parameter of the function readtable states that the name of the file to read
is rdquobatterstxtrdquo Subsequently header = T states that there is a header for the table sep =
ldquotrdquo indicates that each line is separated by TAB Finally we can specify that there is one
column for row names by rownames = 1 Since x will be a data frame we can get number of
hits by $Hits
Exercise 8 Save table in exercise 7-1 as tab-delimited file and read it as data frame
9 Writing data to file
There are many cases where we want to have statistical results written in file rather
than temporary seeing the results on screen In this way we can open the results by
spreadsheet software or process the results using other programming language afterwards
Using write function is one of the simplest ways to output the results to files This
function enables us to output numerical values assigned to variable to file For example
after assigning the vector to x as shown below
x lt- c(10 12 15 19 21 34)
15
the following line
write(x outfile1txt ncolumns = 1)
will write content of x to the file ldquooutfile1txtrdquo ncolumns = 1 states that the vector will be
written to the file by one column
Content of outfile1txt
10
12
15
19
21
34
write function also enable us to write matrix data to file as shown below
gt x lt- matrix(c(123456) nrow=2 ncol=3 byrow=T)
gt x
[1] [2] [3]
[1] 1 2 3
[2] 4 5 6
gt write(t(x) outfile2txt ncolumns=ncol(x) sep=t)
gt
t(x) transposes matrix x If we do not do it the matrix written in the file will look
transposed ncolumns=ncol(x) will tell R that the number of columns to output should be
identical to that of matrix x sep = ldquotrdquo indicates that the columns in the output file will be
separated by tabs
Content of outfile2txt
1 2 3
4 5 6
For writing data frame to a file writetable function is provided
gt x lt- dataframe(
rownames = c(Bonds Aaron Ruth Rodriguez Mays)
Team = c(Giants Braves Yankees Yankees Giants)
16
At_Bat = c(9847 12364 8398 10341 10881)
Hits = c(2935 3771 2873 3070 3283)
Home_Runs = c(762 755 714 687 660))
gt x[c(Hits Home_Runs)]
Hits Home_Runs
Bonds 2935 762
Aaron 3771 755
Ruth 2873 714
Rodriguez 3070 687
Mays 3283 660
gt writetable(x[c(Hits Home_Runs)] outfile3txt sep=t
rownames=T colnames=NA)
gt
With rownames=T and colnames=NA row names and column names will be added
respectively (blank on the top-left)
Content of outfile3
Hits Home_Runs
Bonds 2935 762
Aaron 3771 755
Ruth 2873 714
Rodriguez 3070 687
Mays 3283 660
By giving quote=F output will be without double quotations
Excercise 9 Using the data frame in the above example calculate ratio of hits and at bat
and write the result to rdquooutfile4txtrdquo
10 Writing a program in a file
So far we have done our works interactively without saving what R codes we have written
However when we repeat the same works with R it is laborious to interactively write the
same codes again and again To solve this issue we can write the set of codes in a file and R
can read the file to execute the codes written in the file
For example we can prepare a text file with the following code Let us name the
17
file vecsumtestR
x lt- c(12345)
y lt- c(246810)
z lt- x + y
Then giving source( vecsumtestR) will let R execute the set of codes in the file
vecsumtestR You can check that based on the codes in vecsumtestR vectors are assigned
to each of x y and z
gt source( vecsumtestR)
gt x
[1] 1 2 3 4 5
gt y
[1] 2 4 6 8 10
gt z
[1] 3 6 9 12 15
gt
Exercise 10 Write the procedure in exercise 8 to a file dframetestR and execute the
procedure using ldquosourcerdquo
11 Defining functions
In mathematics function outputs the value which is determined by the input value In
programming it often represents a defined set of procedures5 For example let us consider
a function f which divides the sum of two given input values In mathematics it can be
written as f(x y) = (x + y) 2 In R it is written as follows by introducing the keyword
ldquofunctionrdquo
f lt- function(x y)
return ((x + y) 2)
In this way a function with two parameters (x and y) is defined And the returned value
(output) will be (x + y) 2 After defining f
5 Probably ldquosubroutinerdquo may be the better terminology
18
f(10 20)
will assign 10 and 20 to parameters x and y respectively and 15 will be returned as (x +y) 2
= (10 + 20) 2 = 15 Here ldquoreturnrdquo statement will return the value given just after it You
can also explicitly give the parameter names x and y as follows
f(x = 10 y = 20)
The general way to define a function is
name_of_function lt- function(parameter 1 parameter 2 hellip)
various procedures possibly using the given parameters6
hellip
return(return_value)
Exercise 11 Implement a mathematical function f(x a b c) = ax2 + bx + c in R Then
calculate f(4 3 2 1)
12 Making graphs
R is equipped with functions capable of making graphs easily ldquoplotrdquo function may be one
of the simplest ones It creates a plot in the two-dimensional space For example
assigning the following vectors to x and y will create a plot with points on the locations
(12) (34) (59) (77) and (98)
x lt- c(13579)
y lt- c(24978)
plot(x y xlab=X Value ylab=Y Value)
Labels on the x and y axes can be given to the parameters xlab and ylab
respectively
6 Optional parameters hellip can be access with list(hellip) as a list
19
A plot created by ldquoplotrdquo function
A bar graph can be created using ldquobarplotrdquo function In the following example a bar
graph is created by giving the heights of each bar by vector x The labels of each bar
are given by the element names of the vector x ie names(x)
x lt- c(1232101)
names(x) lt- c(A B C D E F)
barplot(x)
A bar graph created by ldquobarplotrdquo function
ldquohistrdquo function generates a histogram for a set of numbers given by a vector
2 4 6 8
23
45
67
89
X Value
YV
alu
e
A B C D E F
02
46
810
A B C D E F
02
46
810
20
x lt- c(32 12 42 23 34 59 52 53 41 52 32 14)
hist(x xlab = Test Value main = Test Histogram)
The parameter ldquomainrdquo is used to state the title of the histogram
A generated histogram using ldquohistrdquo function
ldquoboxplotrdquo function creates a boxplot for the numbers given by the vectors
x1 lt- c(1112111011111213151211101213)
x2 lt- c(20212791223231211921157121292315)
boxplot(x1 x2 names=c(Data 1 Data 2))
Test Histogram
Test Value
Fre
qu
en
cy
1 2 3 4 5 6
01
23
4
21
Example of a box plot
Exercise 12 Using the table (data frame) given in exercise 7-1 make a plot which describes
relationship between masses of the planets and number of satellites
13 Basic program structure
R is equipped with programming grammars which are important and common in other
programming languages Here some of the most important ones will be described briefly
131 if-statement
ldquoifrdquo statement gives you a way to execute a specific procedure only if a specified condition7
is satisfied For example if you want to assign 1 to y when x gt 0 and otherwise assign 0 to y
you can write as follows
if (x gt 0)
y lt- 1
7 When specifying a condition logical operators such as amp (logical AND) and | (logical OR)
can be used
Data 1 Data 2
10
15
20
25
Median
Outlier 50 of the
data are within this
range
The bottom
25 excluding outliers
The top 25
excluding outliers
22
else
y lt- 0
Investigate the value of y after doing x lt- -5 Then after doing x lt- 3 investigate the value
of y again to make sure that the value has changed
The general form of if-statement is as follows
if (condition 1)
Set of procedures to execute when the condition 1 is satisfied
else if (condition 2)
Set of procedures to execute when the condition the condition 2 is satisfied (but the
condition 1 is NOT met)
else if(condition 3)
Se of procedures to execute when condition 3 is satisfied (but condition 1 to 2 are NOT
met)
else if hellip
else
Set of procedures to execute when NONE of the above conditions are satisfied
Exercise 13-1 Define a function which returns 1 when the input parameter is 0 and
otherwise returns 0
132 while-statement
while-statement iterates a set of given procedures as long as the given condition is satisfied
The general form of while-statement is as follows8
while(condition)
8 next-statement in the while-statement forces program to start the next iteration
immediately break-statement in while-statement forces the program to immediately stop
the iteration and get out of the while-loop
23
A set of procedures to execute when the condition is satisfied
For example executing while(x lt= 3) print(x) x lt- x + 1 after doing x lt- 1 will generate
the output of 1 to 3
gt x lt- 1
gt while (x lt= 3) print(x) x lt- x + 1
[1] 1
[1] 2
[1] 3
gt
If you are to write this procedure as a program in a file you may want to write each step
line by line as follows so that the program will be easy to read
x lt- 1
while (x lt= 3)
print(x)
x lt- x + 1
Initially the value of x is 1 and the condition of the while-block ie x le 3 is met Thus R
goes into the while-block The first procedure print(x) which displays the value of x is
executed and 1 will be displayed
In the next procedure in the while-block (x lt- x + 1) the value of x is increased by 1 Thus
at the end of the first loop of while-block x is 2
R interpreter then comes back to the condition check at the beginning of the while-block
(x lt= 3) The variable x is 2 at this point and still x le 3 holds so the procedures in the
while-block will be executed again ie displaying the value of x 2 by print(x) and
increasing the value of x by 1 by x lt- x + 1 At the end of the while-block x is 3
24
R interpreter will then come back again to the condition check at the beginning of the
while-block (x lt= 3) The variable x is 3 at this point and still x le 3 holds so the
procedures in the while-block will be executed again ie displaying the value of x which
is 3 by print(x) and increasing the value of x by 1 by x lt- x + 1 At the end of the
while-block x is 4
R interpreter will then come back again to the condition check at the beginning of the
while-block (x lt= 3) The variable x is 4 at this point and x le 3 is NOT satisfied any more
Thus R interpreter steps out of the while-loop Final value of x is 4
Exercise 13-2 Using while-statement display 13579 and 11 respectively in each line
133 for-statement
for-statement also does iteration like while-statement The for-statement assigns each of
given elements to the given variable starting from the first element to the last element in
the given elements After each assignment the procedures in the for-block are executed
The general form of for-statement is
for(variables in elements)
procedures
For example for (i in c(135)) print(i) will assign each of 1 3 5 into the variable i and
after each assignment the procedures in the file-block are executed Thus in this case
number 1 is displayed in the first iteration after the assignment 3 is displayed in the
second iteration after the assignment and finally 5 is displayed in the third iteration after
the assignment The following example makes a vector of set of squared values of 1 to 59
x lt- NULL
for (i in 15)
x lt- append(x i2)
9 Actually using for-statement is unnecessary here Just do x lt- (15)2
25
x lt- NULL assigns an empty vector to x NULL represents an empty vector
In the for-statement each value of 1 to 5 is assigned to i and after the assignment the
procedure in the for-block is executed
In the procedure in the for-block the squared value of i (represented as i2) is
concatenated to the vector x The function append(x i) concatenates i to vector x10
Exercise 13-3 Rewrite procedure in 12-2 using for-statement
14 Other useful functions
Here some of the frequently used R functions are introduced briefly
141 How to use
help(function_name) will display how to use function_name
142 variables and attributes
ls() or objects() will display currently defined variables
class(variable_name) or mode(variable_name) will give you the type of the variable (object
For example whether it is numerical variable character list or matrix)
attributes(variable_name) will return attributes defined for the given variable
variabl_name
143 Family of apply functions
ldquosapplyrdquo function will return a vector containing a set of output values from a given
function after using each value in the given vector as a single input to that given function
each by each
func1_sub lt- function(elm)
a function expecting a single number as a parameter
if(-1 lt= elm amp elm lt= 1) return (1) else return (0)
10 The same procedure can be done with x lt- c(x i2) c can be used to concatenate given
vectors
26
func1 lt- function(x) a function with a vector parameter x
return(sapply(x func1_sub))
144 Making figures
rdquocurverdquo function generates a graph for a given function See help for details
Example
curve(dnorm -7 +7) Draws normal (Gaussian) distribution
curve(cos(x)+cos(2x) -2pi 2pi 1000) 1000 is number of points
curve(func1 -3 3) The function defined in 143 Family of apply functions
27
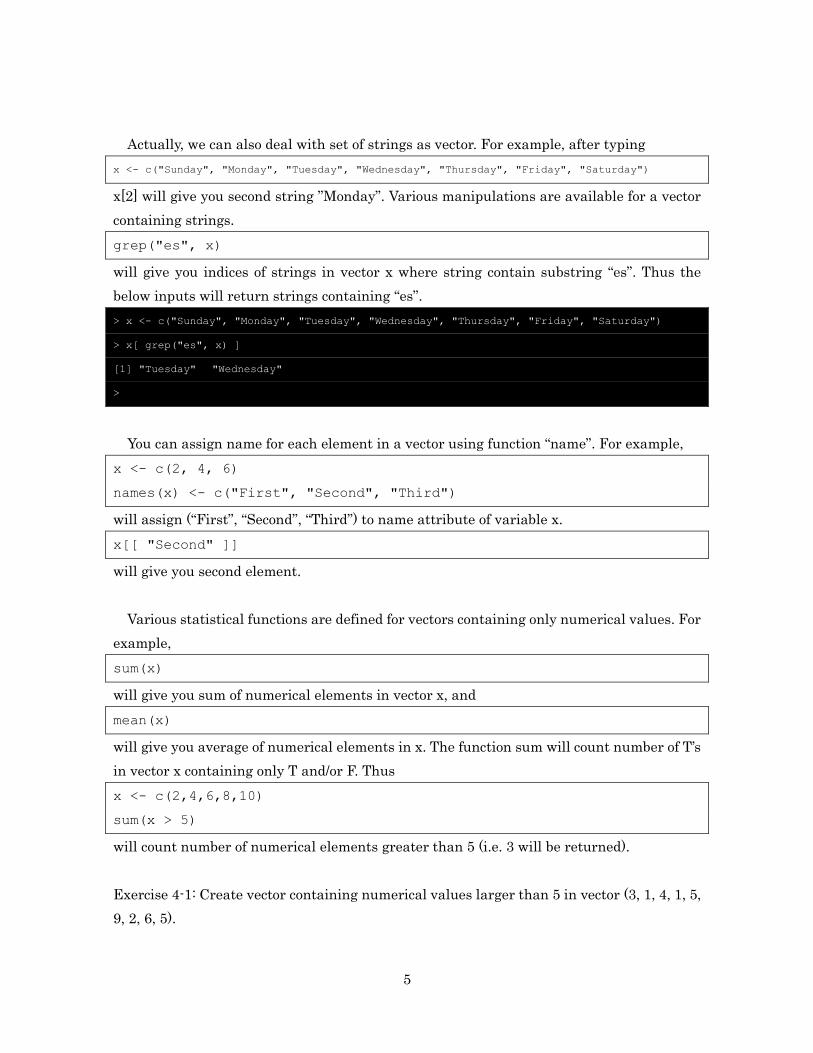
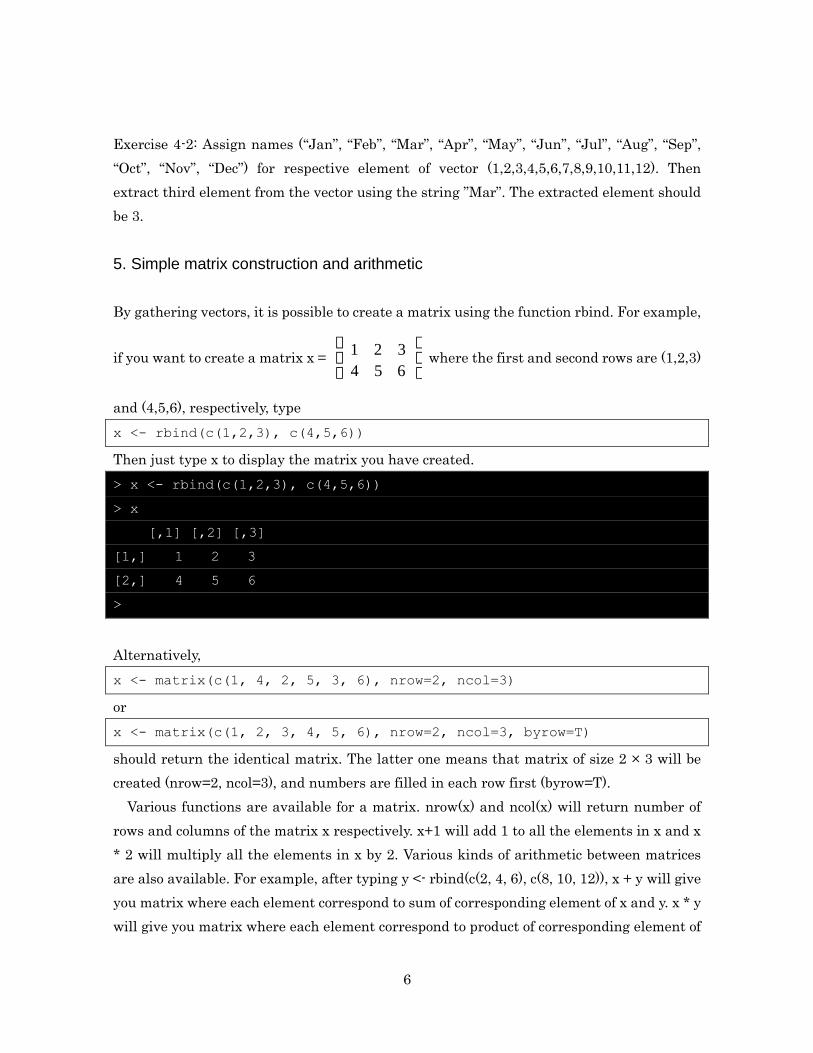
6
Exercise 4-2 Assign names (ldquoJanrdquo ldquoFebrdquo ldquoMarrdquo ldquoAprrdquo ldquoMayrdquo ldquoJunrdquo ldquoJulrdquo ldquoAugrdquo ldquoSeprdquo
ldquoOctrdquo ldquoNovrdquo ldquoDecrdquo) for respective element of vector (123456789101112) Then
extract third element from the vector using the string rdquoMarrdquo The extracted element should
be 3
5 Simple matrix construction and arithmetic
By gathering vectors it is possible to create a matrix using the function rbind For example
if you want to create a matrix x = 1 2 3
4 5 6
aelig
egraveccedil
ouml
oslashdivide where the first and second rows are (123)
and (456) respectively type
x lt- rbind(c(123) c(456))
Then just type x to display the matrix you have created
gt x lt- rbind(c(123) c(456))
gt x
[1] [2] [3]
[1] 1 2 3
[2] 4 5 6
gt
Alternatively
x lt- matrix(c(1 4 2 5 3 6) nrow=2 ncol=3)
or
x lt- matrix(c(1 2 3 4 5 6) nrow=2 ncol=3 byrow=T)
should return the identical matrix The latter one means that matrix of size 2 times 3 will be
created (nrow=2 ncol=3) and numbers are filled in each row first (byrow=T)
Various functions are available for a matrix nrow(x) and ncol(x) will return number of
rows and columns of the matrix x respectively x+1 will add 1 to all the elements in x and x
2 will multiply all the elements in x by 2 Various kinds of arithmetic between matrices
are also available For example after typing y lt- rbind(c(2 4 6) c(8 10 12)) x + y will give
you matrix where each element correspond to sum of corresponding element of x and y x y
will give you matrix where each element correspond to product of corresponding element of
7
x and y2
Any specific row or column can be extracted from a given matrix For example if you
want to extract second row you type
gt x[2]
[1] 4 5 6
gt
If you want to extract second column you type
gt x[2]
[1] 2 5
t(x) will transpose the matrix x
gt t(x)
[1] [2]
[1] 1 4
[2] 2 5
[3] 3 6
gt
Average of each row of matrix x can be calculated as below3
gt apply(x 1 mean)
[1] 2 5
Average of each column of matrix x can be calculated as below
gt apply(x 2 mean)
[1] 25 35 45
Actually matrix can be deemed as set of numbers in two dimensional array R can also
deal with array having n dimensions using array(vector numbers of elements in each
2 Product of the matrices based on canonical mathematical definition can be calculated by
the operator 3 Second parameter of 1 in apply function denotes that we will calculate average for each
position of the first dimension (in this case the first dimension is row number) Similarly
second parameter of 2 denotes that we will calculate average for each position of the second
dimension (in this case the second dimension is column number)
8
dimension) For example
x lt- array(124 c(342))
will create three dimensional array with size of 3times4times2 and fills numbers in the given
vector from the first dimension to the third dimension
gt x lt- array(124 c(342))
gt x
1 The first 3times4 array of the third dimension
[1] [2] [3] [4]
[1] 1 4 7 10
[2] 2 5 8 11
[3] 3 6 9 12
2 The second 3times4 array of the third dimension
[1] [2] [3] [4]
[1] 13 16 19 22
[2] 14 17 20 23
[3] 15 18 21 24
gt
Exercise 5-1 Calculate 1 3 5
7 9 11
aelig
egraveccedil
ouml
oslashdivide+
1 2 3
2 4 6
aelig
egraveccedil
ouml
oslashdivide
Exercise 5-2 For the matrix obtained in the above calculation calculate row average and
column average
6 Simple list creation
A list in R can gather various kinds of data into a single object to manage them
x lt- list(Ichiro rdquo Seattlerdquo Right fielder)
will create a list containing Ichiro rdquo Seattlerdquo Right fielder Although a vector cannot
9
contain another vector a list can contain a vector as shown in the example below
x lt- list(Ichiro Seattle Right fielder c(184 214 225))
To extract the second element you can type
x[[2]]
You can assign names to each element as below
x lt- list(player = Ichiro team = Seattle
position = Right fielder hits = c(184 214 225))
Type x to confirm that names are given to each element
gt x
$player
[1] Ichiro
$team
[1] Seattle
$position
[1] Right fielder
$hits
[1] 184 214 225
gt
You can use assigned name to extract corresponding element For example
x[[team]]
or
x$team
will extract ldquoSeattlerdquo
Exercise 6-2 Create a list containing ldquoSan Diegordquo vector (32 117) 9645 and ldquoCaliforniardquo
Give names ldquocityrdquo ldquocoordinatesrdquo ldquoareardquo and ldquostaterdquo to respective element
10
11
7 Simple data frame creation
Data frame is one of data class in R It is one type of list and has two dimensional
structure just like a matrix Each row can be deemed as a sample and each column can be
deemed as attribute of the sample Using this idea data frame can represent a table
Following table gives data of five retired major league baseball players
Team atbats hits homeruns
Rose Reds 14053 4256 160
Aaron Brewers 12364 3771 755
Yastrzemski Red Sox 11988 3419 452
Ripken Orioles 11551 3184 431
Cobb Athletics 11434 4191 117
The above table can be represented by data frame as follows
x lt- dataframe(
rownames = c(Rose Aaron Yastrzemski Ripken Cobb)
team = c(Reds Brewers Red Sox Orioles Athletics)
atbats = c(14053 12364 11988 11551 11434)
hits = c(4256 3771 3419 3184 4191)
homeruns = c(160 755 452 431 117))
The function dataframe can generate a data frame and can be used in the format of
dataframe(rownames = vector for column labels column name 1 = vector 1 column name
2 = vector 2 hellip) You can check the content of x by typing x
gt x
team atbats hits homeruns
Rose Reds 14053 4256 160
Aaron Brewers 12364 3771 755
Yastrzemski Red Sox 11988 3419 452
Ripken Orioles 11551 3184 431
Cobb Athletics 11434 4191 117
gt
Like a regular list column name can be used to extract corresponding vector
gt x$hits
[1] 4256 3771 3419 3184 4191
gt
12
Any part of data frame can be extracted as another data frame For example
x[ c(15) c(234) ]
will extract row 1 5 and column 2 3 4 as a new data frame You can also use row names
and column names to do the same thing
x[ c(Rose Cobb) c(atbats hits homeruns)]
Various functions are defined for data frame Let us get attributes associated with the data
frame x
gt attributes(x)
$names
[1] team atbats hits homeruns
$rownames
[1] Rose Aaron Yastrzemski Ripken Cobb
$class
[1] dataframe
gt
We got names rownames and class Type names(x) rownames(x) and class(x) You can
obtain row names column names and class of x respectively
Exercise 7-1 The below table shows characteristic values of each planet in solar system
Masses are represented in 1023 kg and diameters are represented in km Make a data frame
representing the table4
Mass Diameter Satellites
Mercury 3301 4879 0
Venus 12103 48690 0
Earth 59736 12756 1
4 As all the elements are numeric in this case this data frame can be dealt as a matrix
asmatrix(x) will return x as a matrix
13
Mars 6419 6794 2
Jupiter 18986 142984 63
Saturn 5688 120536 48
Uranus 8686 51118 27
Neptune 1024 49528 13
Exercise 7-2 Using the created data frame in the previous exercise calculate averages of
mass diameter and number of satellites
8 Data reading from file
So far we have been inputting data directly However in most of cases numerical data
may be prepared by files So we will learn how to import data into a variable in R First
prepare a text file with the following values Let us name the file ldquotestdatatxtrdquo We assume
that the file is placed under the directory UserssmithTMP
14
14
21
35
6
Using setwd we change the working directory to UserssmithTMP
setwd(UserssmithTMP)
Then using scan function read the data to a variable x
gt x lt- scan(testdatatxt)
Read 5 items
gt x
[1] 14 14 21 35 6
gt
You notice that the values are stored in x as a vector
R has a function readtable to read a table where each line is separated by TABs like the
following example (file name is ldquobatterstxtrdquo)
Team At_Bat Hits Home_Runs
14
Bonds Giants 9847 2935 762
Aaron Braves 12364 3771 755
Ruth Yankees 8398 2873 714
Rodriguez Yankees 10341 3070 687
Mays Giants 10881 3283 660
readtable can read this as data frame
gt x lt- readtable(batterstxt header = T
sep = t rownames = 1)
gt x
Team At_Bat Hits Home_Runs
Bonds Giants 9847 2935 762
Aaron Braves 12364 3771 755
Ruth Yankees 8398 2873 714
Rodriguez Yankees 10341 3070 687
Mays Giants 10881 3283 660
gt
The first parameter of the function readtable states that the name of the file to read
is rdquobatterstxtrdquo Subsequently header = T states that there is a header for the table sep =
ldquotrdquo indicates that each line is separated by TAB Finally we can specify that there is one
column for row names by rownames = 1 Since x will be a data frame we can get number of
hits by $Hits
Exercise 8 Save table in exercise 7-1 as tab-delimited file and read it as data frame
9 Writing data to file
There are many cases where we want to have statistical results written in file rather
than temporary seeing the results on screen In this way we can open the results by
spreadsheet software or process the results using other programming language afterwards
Using write function is one of the simplest ways to output the results to files This
function enables us to output numerical values assigned to variable to file For example
after assigning the vector to x as shown below
x lt- c(10 12 15 19 21 34)
15
the following line
write(x outfile1txt ncolumns = 1)
will write content of x to the file ldquooutfile1txtrdquo ncolumns = 1 states that the vector will be
written to the file by one column
Content of outfile1txt
10
12
15
19
21
34
write function also enable us to write matrix data to file as shown below
gt x lt- matrix(c(123456) nrow=2 ncol=3 byrow=T)
gt x
[1] [2] [3]
[1] 1 2 3
[2] 4 5 6
gt write(t(x) outfile2txt ncolumns=ncol(x) sep=t)
gt
t(x) transposes matrix x If we do not do it the matrix written in the file will look
transposed ncolumns=ncol(x) will tell R that the number of columns to output should be
identical to that of matrix x sep = ldquotrdquo indicates that the columns in the output file will be
separated by tabs
Content of outfile2txt
1 2 3
4 5 6
For writing data frame to a file writetable function is provided
gt x lt- dataframe(
rownames = c(Bonds Aaron Ruth Rodriguez Mays)
Team = c(Giants Braves Yankees Yankees Giants)
16
At_Bat = c(9847 12364 8398 10341 10881)
Hits = c(2935 3771 2873 3070 3283)
Home_Runs = c(762 755 714 687 660))
gt x[c(Hits Home_Runs)]
Hits Home_Runs
Bonds 2935 762
Aaron 3771 755
Ruth 2873 714
Rodriguez 3070 687
Mays 3283 660
gt writetable(x[c(Hits Home_Runs)] outfile3txt sep=t
rownames=T colnames=NA)
gt
With rownames=T and colnames=NA row names and column names will be added
respectively (blank on the top-left)
Content of outfile3
Hits Home_Runs
Bonds 2935 762
Aaron 3771 755
Ruth 2873 714
Rodriguez 3070 687
Mays 3283 660
By giving quote=F output will be without double quotations
Excercise 9 Using the data frame in the above example calculate ratio of hits and at bat
and write the result to rdquooutfile4txtrdquo
10 Writing a program in a file
So far we have done our works interactively without saving what R codes we have written
However when we repeat the same works with R it is laborious to interactively write the
same codes again and again To solve this issue we can write the set of codes in a file and R
can read the file to execute the codes written in the file
For example we can prepare a text file with the following code Let us name the
17
file vecsumtestR
x lt- c(12345)
y lt- c(246810)
z lt- x + y
Then giving source( vecsumtestR) will let R execute the set of codes in the file
vecsumtestR You can check that based on the codes in vecsumtestR vectors are assigned
to each of x y and z
gt source( vecsumtestR)
gt x
[1] 1 2 3 4 5
gt y
[1] 2 4 6 8 10
gt z
[1] 3 6 9 12 15
gt
Exercise 10 Write the procedure in exercise 8 to a file dframetestR and execute the
procedure using ldquosourcerdquo
11 Defining functions
In mathematics function outputs the value which is determined by the input value In
programming it often represents a defined set of procedures5 For example let us consider
a function f which divides the sum of two given input values In mathematics it can be
written as f(x y) = (x + y) 2 In R it is written as follows by introducing the keyword
ldquofunctionrdquo
f lt- function(x y)
return ((x + y) 2)
In this way a function with two parameters (x and y) is defined And the returned value
(output) will be (x + y) 2 After defining f
5 Probably ldquosubroutinerdquo may be the better terminology
18
f(10 20)
will assign 10 and 20 to parameters x and y respectively and 15 will be returned as (x +y) 2
= (10 + 20) 2 = 15 Here ldquoreturnrdquo statement will return the value given just after it You
can also explicitly give the parameter names x and y as follows
f(x = 10 y = 20)
The general way to define a function is
name_of_function lt- function(parameter 1 parameter 2 hellip)
various procedures possibly using the given parameters6
hellip
return(return_value)
Exercise 11 Implement a mathematical function f(x a b c) = ax2 + bx + c in R Then
calculate f(4 3 2 1)
12 Making graphs
R is equipped with functions capable of making graphs easily ldquoplotrdquo function may be one
of the simplest ones It creates a plot in the two-dimensional space For example
assigning the following vectors to x and y will create a plot with points on the locations
(12) (34) (59) (77) and (98)
x lt- c(13579)
y lt- c(24978)
plot(x y xlab=X Value ylab=Y Value)
Labels on the x and y axes can be given to the parameters xlab and ylab
respectively
6 Optional parameters hellip can be access with list(hellip) as a list
19
A plot created by ldquoplotrdquo function
A bar graph can be created using ldquobarplotrdquo function In the following example a bar
graph is created by giving the heights of each bar by vector x The labels of each bar
are given by the element names of the vector x ie names(x)
x lt- c(1232101)
names(x) lt- c(A B C D E F)
barplot(x)
A bar graph created by ldquobarplotrdquo function
ldquohistrdquo function generates a histogram for a set of numbers given by a vector
2 4 6 8
23
45
67
89
X Value
YV
alu
e
A B C D E F
02
46
810
A B C D E F
02
46
810
20
x lt- c(32 12 42 23 34 59 52 53 41 52 32 14)
hist(x xlab = Test Value main = Test Histogram)
The parameter ldquomainrdquo is used to state the title of the histogram
A generated histogram using ldquohistrdquo function
ldquoboxplotrdquo function creates a boxplot for the numbers given by the vectors
x1 lt- c(1112111011111213151211101213)
x2 lt- c(20212791223231211921157121292315)
boxplot(x1 x2 names=c(Data 1 Data 2))
Test Histogram
Test Value
Fre
qu
en
cy
1 2 3 4 5 6
01
23
4
21
Example of a box plot
Exercise 12 Using the table (data frame) given in exercise 7-1 make a plot which describes
relationship between masses of the planets and number of satellites
13 Basic program structure
R is equipped with programming grammars which are important and common in other
programming languages Here some of the most important ones will be described briefly
131 if-statement
ldquoifrdquo statement gives you a way to execute a specific procedure only if a specified condition7
is satisfied For example if you want to assign 1 to y when x gt 0 and otherwise assign 0 to y
you can write as follows
if (x gt 0)
y lt- 1
7 When specifying a condition logical operators such as amp (logical AND) and | (logical OR)
can be used
Data 1 Data 2
10
15
20
25
Median
Outlier 50 of the
data are within this
range
The bottom
25 excluding outliers
The top 25
excluding outliers
22
else
y lt- 0
Investigate the value of y after doing x lt- -5 Then after doing x lt- 3 investigate the value
of y again to make sure that the value has changed
The general form of if-statement is as follows
if (condition 1)
Set of procedures to execute when the condition 1 is satisfied
else if (condition 2)
Set of procedures to execute when the condition the condition 2 is satisfied (but the
condition 1 is NOT met)
else if(condition 3)
Se of procedures to execute when condition 3 is satisfied (but condition 1 to 2 are NOT
met)
else if hellip
else
Set of procedures to execute when NONE of the above conditions are satisfied
Exercise 13-1 Define a function which returns 1 when the input parameter is 0 and
otherwise returns 0
132 while-statement
while-statement iterates a set of given procedures as long as the given condition is satisfied
The general form of while-statement is as follows8
while(condition)
8 next-statement in the while-statement forces program to start the next iteration
immediately break-statement in while-statement forces the program to immediately stop
the iteration and get out of the while-loop
23
A set of procedures to execute when the condition is satisfied
For example executing while(x lt= 3) print(x) x lt- x + 1 after doing x lt- 1 will generate
the output of 1 to 3
gt x lt- 1
gt while (x lt= 3) print(x) x lt- x + 1
[1] 1
[1] 2
[1] 3
gt
If you are to write this procedure as a program in a file you may want to write each step
line by line as follows so that the program will be easy to read
x lt- 1
while (x lt= 3)
print(x)
x lt- x + 1
Initially the value of x is 1 and the condition of the while-block ie x le 3 is met Thus R
goes into the while-block The first procedure print(x) which displays the value of x is
executed and 1 will be displayed
In the next procedure in the while-block (x lt- x + 1) the value of x is increased by 1 Thus
at the end of the first loop of while-block x is 2
R interpreter then comes back to the condition check at the beginning of the while-block
(x lt= 3) The variable x is 2 at this point and still x le 3 holds so the procedures in the
while-block will be executed again ie displaying the value of x 2 by print(x) and
increasing the value of x by 1 by x lt- x + 1 At the end of the while-block x is 3
24
R interpreter will then come back again to the condition check at the beginning of the
while-block (x lt= 3) The variable x is 3 at this point and still x le 3 holds so the
procedures in the while-block will be executed again ie displaying the value of x which
is 3 by print(x) and increasing the value of x by 1 by x lt- x + 1 At the end of the
while-block x is 4
R interpreter will then come back again to the condition check at the beginning of the
while-block (x lt= 3) The variable x is 4 at this point and x le 3 is NOT satisfied any more
Thus R interpreter steps out of the while-loop Final value of x is 4
Exercise 13-2 Using while-statement display 13579 and 11 respectively in each line
133 for-statement
for-statement also does iteration like while-statement The for-statement assigns each of
given elements to the given variable starting from the first element to the last element in
the given elements After each assignment the procedures in the for-block are executed
The general form of for-statement is
for(variables in elements)
procedures
For example for (i in c(135)) print(i) will assign each of 1 3 5 into the variable i and
after each assignment the procedures in the file-block are executed Thus in this case
number 1 is displayed in the first iteration after the assignment 3 is displayed in the
second iteration after the assignment and finally 5 is displayed in the third iteration after
the assignment The following example makes a vector of set of squared values of 1 to 59
x lt- NULL
for (i in 15)
x lt- append(x i2)
9 Actually using for-statement is unnecessary here Just do x lt- (15)2
25
x lt- NULL assigns an empty vector to x NULL represents an empty vector
In the for-statement each value of 1 to 5 is assigned to i and after the assignment the
procedure in the for-block is executed
In the procedure in the for-block the squared value of i (represented as i2) is
concatenated to the vector x The function append(x i) concatenates i to vector x10
Exercise 13-3 Rewrite procedure in 12-2 using for-statement
14 Other useful functions
Here some of the frequently used R functions are introduced briefly
141 How to use
help(function_name) will display how to use function_name
142 variables and attributes
ls() or objects() will display currently defined variables
class(variable_name) or mode(variable_name) will give you the type of the variable (object
For example whether it is numerical variable character list or matrix)
attributes(variable_name) will return attributes defined for the given variable
variabl_name
143 Family of apply functions
ldquosapplyrdquo function will return a vector containing a set of output values from a given
function after using each value in the given vector as a single input to that given function
each by each
func1_sub lt- function(elm)
a function expecting a single number as a parameter
if(-1 lt= elm amp elm lt= 1) return (1) else return (0)
10 The same procedure can be done with x lt- c(x i2) c can be used to concatenate given
vectors
26
func1 lt- function(x) a function with a vector parameter x
return(sapply(x func1_sub))
144 Making figures
rdquocurverdquo function generates a graph for a given function See help for details
Example
curve(dnorm -7 +7) Draws normal (Gaussian) distribution
curve(cos(x)+cos(2x) -2pi 2pi 1000) 1000 is number of points
curve(func1 -3 3) The function defined in 143 Family of apply functions
27
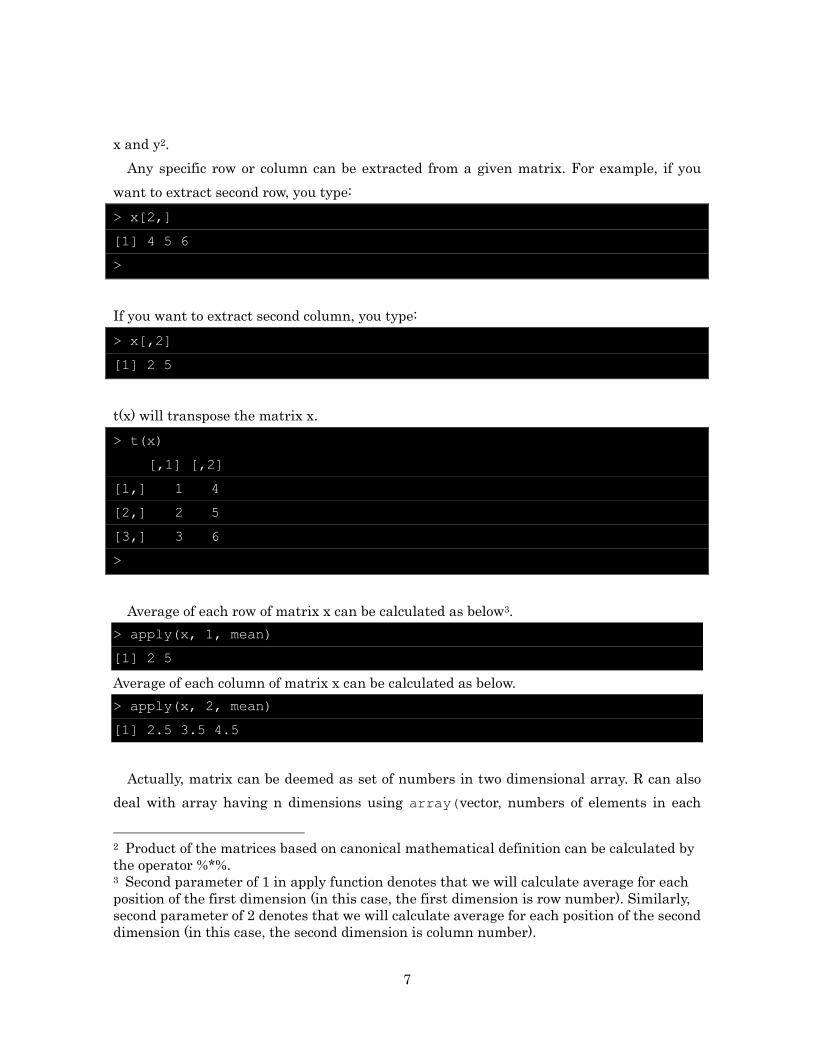
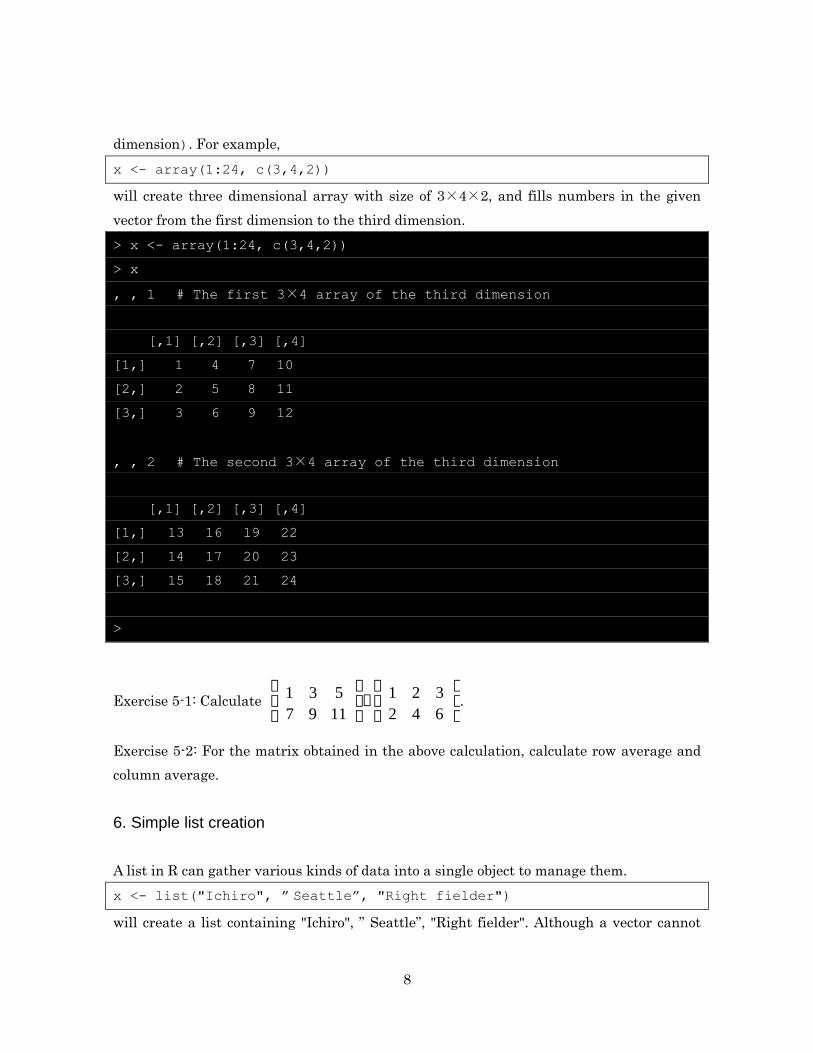
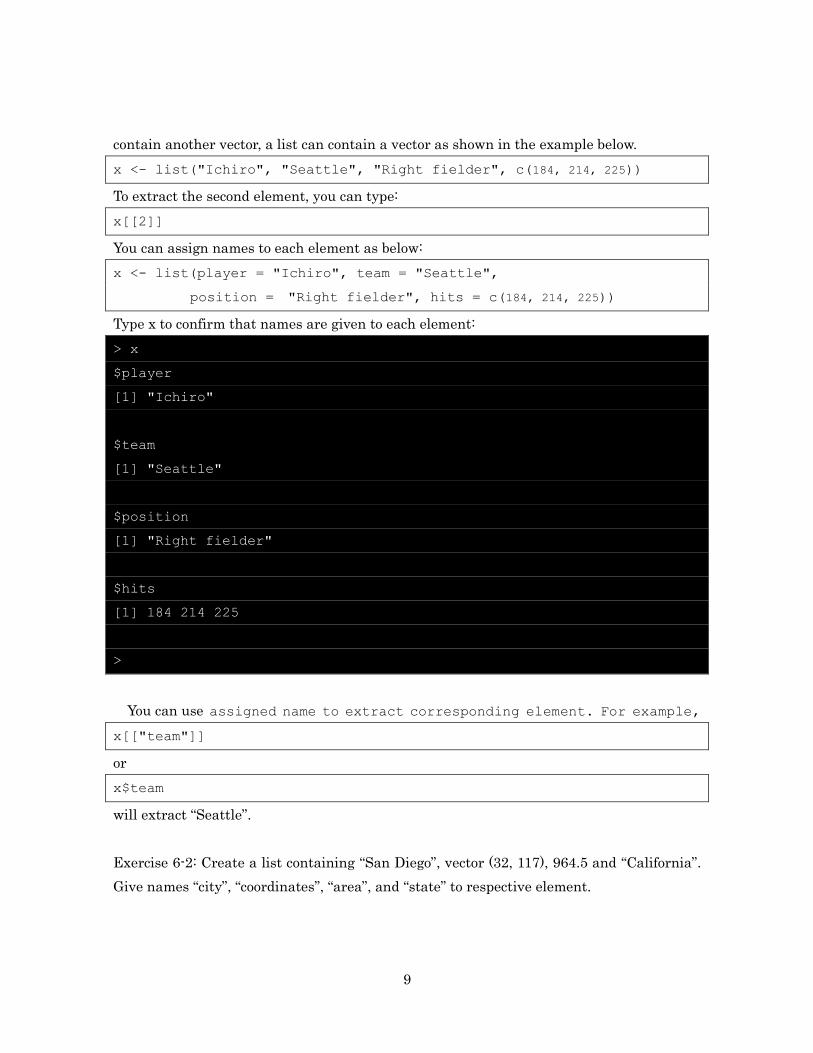

10
11
7 Simple data frame creation
Data frame is one of data class in R It is one type of list and has two dimensional
structure just like a matrix Each row can be deemed as a sample and each column can be
deemed as attribute of the sample Using this idea data frame can represent a table
Following table gives data of five retired major league baseball players
Team atbats hits homeruns
Rose Reds 14053 4256 160
Aaron Brewers 12364 3771 755
Yastrzemski Red Sox 11988 3419 452
Ripken Orioles 11551 3184 431
Cobb Athletics 11434 4191 117
The above table can be represented by data frame as follows
x lt- dataframe(
rownames = c(Rose Aaron Yastrzemski Ripken Cobb)
team = c(Reds Brewers Red Sox Orioles Athletics)
atbats = c(14053 12364 11988 11551 11434)
hits = c(4256 3771 3419 3184 4191)
homeruns = c(160 755 452 431 117))
The function dataframe can generate a data frame and can be used in the format of
dataframe(rownames = vector for column labels column name 1 = vector 1 column name
2 = vector 2 hellip) You can check the content of x by typing x
gt x
team atbats hits homeruns
Rose Reds 14053 4256 160
Aaron Brewers 12364 3771 755
Yastrzemski Red Sox 11988 3419 452
Ripken Orioles 11551 3184 431
Cobb Athletics 11434 4191 117
gt
Like a regular list column name can be used to extract corresponding vector
gt x$hits
[1] 4256 3771 3419 3184 4191
gt
12
Any part of data frame can be extracted as another data frame For example
x[ c(15) c(234) ]
will extract row 1 5 and column 2 3 4 as a new data frame You can also use row names
and column names to do the same thing
x[ c(Rose Cobb) c(atbats hits homeruns)]
Various functions are defined for data frame Let us get attributes associated with the data
frame x
gt attributes(x)
$names
[1] team atbats hits homeruns
$rownames
[1] Rose Aaron Yastrzemski Ripken Cobb
$class
[1] dataframe
gt
We got names rownames and class Type names(x) rownames(x) and class(x) You can
obtain row names column names and class of x respectively
Exercise 7-1 The below table shows characteristic values of each planet in solar system
Masses are represented in 1023 kg and diameters are represented in km Make a data frame
representing the table4
Mass Diameter Satellites
Mercury 3301 4879 0
Venus 12103 48690 0
Earth 59736 12756 1
4 As all the elements are numeric in this case this data frame can be dealt as a matrix
asmatrix(x) will return x as a matrix
13
Mars 6419 6794 2
Jupiter 18986 142984 63
Saturn 5688 120536 48
Uranus 8686 51118 27
Neptune 1024 49528 13
Exercise 7-2 Using the created data frame in the previous exercise calculate averages of
mass diameter and number of satellites
8 Data reading from file
So far we have been inputting data directly However in most of cases numerical data
may be prepared by files So we will learn how to import data into a variable in R First
prepare a text file with the following values Let us name the file ldquotestdatatxtrdquo We assume
that the file is placed under the directory UserssmithTMP
14
14
21
35
6
Using setwd we change the working directory to UserssmithTMP
setwd(UserssmithTMP)
Then using scan function read the data to a variable x
gt x lt- scan(testdatatxt)
Read 5 items
gt x
[1] 14 14 21 35 6
gt
You notice that the values are stored in x as a vector
R has a function readtable to read a table where each line is separated by TABs like the
following example (file name is ldquobatterstxtrdquo)
Team At_Bat Hits Home_Runs
14
Bonds Giants 9847 2935 762
Aaron Braves 12364 3771 755
Ruth Yankees 8398 2873 714
Rodriguez Yankees 10341 3070 687
Mays Giants 10881 3283 660
readtable can read this as data frame
gt x lt- readtable(batterstxt header = T
sep = t rownames = 1)
gt x
Team At_Bat Hits Home_Runs
Bonds Giants 9847 2935 762
Aaron Braves 12364 3771 755
Ruth Yankees 8398 2873 714
Rodriguez Yankees 10341 3070 687
Mays Giants 10881 3283 660
gt
The first parameter of the function readtable states that the name of the file to read
is rdquobatterstxtrdquo Subsequently header = T states that there is a header for the table sep =
ldquotrdquo indicates that each line is separated by TAB Finally we can specify that there is one
column for row names by rownames = 1 Since x will be a data frame we can get number of
hits by $Hits
Exercise 8 Save table in exercise 7-1 as tab-delimited file and read it as data frame
9 Writing data to file
There are many cases where we want to have statistical results written in file rather
than temporary seeing the results on screen In this way we can open the results by
spreadsheet software or process the results using other programming language afterwards
Using write function is one of the simplest ways to output the results to files This
function enables us to output numerical values assigned to variable to file For example
after assigning the vector to x as shown below
x lt- c(10 12 15 19 21 34)
15
the following line
write(x outfile1txt ncolumns = 1)
will write content of x to the file ldquooutfile1txtrdquo ncolumns = 1 states that the vector will be
written to the file by one column
Content of outfile1txt
10
12
15
19
21
34
write function also enable us to write matrix data to file as shown below
gt x lt- matrix(c(123456) nrow=2 ncol=3 byrow=T)
gt x
[1] [2] [3]
[1] 1 2 3
[2] 4 5 6
gt write(t(x) outfile2txt ncolumns=ncol(x) sep=t)
gt
t(x) transposes matrix x If we do not do it the matrix written in the file will look
transposed ncolumns=ncol(x) will tell R that the number of columns to output should be
identical to that of matrix x sep = ldquotrdquo indicates that the columns in the output file will be
separated by tabs
Content of outfile2txt
1 2 3
4 5 6
For writing data frame to a file writetable function is provided
gt x lt- dataframe(
rownames = c(Bonds Aaron Ruth Rodriguez Mays)
Team = c(Giants Braves Yankees Yankees Giants)
16
At_Bat = c(9847 12364 8398 10341 10881)
Hits = c(2935 3771 2873 3070 3283)
Home_Runs = c(762 755 714 687 660))
gt x[c(Hits Home_Runs)]
Hits Home_Runs
Bonds 2935 762
Aaron 3771 755
Ruth 2873 714
Rodriguez 3070 687
Mays 3283 660
gt writetable(x[c(Hits Home_Runs)] outfile3txt sep=t
rownames=T colnames=NA)
gt
With rownames=T and colnames=NA row names and column names will be added
respectively (blank on the top-left)
Content of outfile3
Hits Home_Runs
Bonds 2935 762
Aaron 3771 755
Ruth 2873 714
Rodriguez 3070 687
Mays 3283 660
By giving quote=F output will be without double quotations
Excercise 9 Using the data frame in the above example calculate ratio of hits and at bat
and write the result to rdquooutfile4txtrdquo
10 Writing a program in a file
So far we have done our works interactively without saving what R codes we have written
However when we repeat the same works with R it is laborious to interactively write the
same codes again and again To solve this issue we can write the set of codes in a file and R
can read the file to execute the codes written in the file
For example we can prepare a text file with the following code Let us name the
17
file vecsumtestR
x lt- c(12345)
y lt- c(246810)
z lt- x + y
Then giving source( vecsumtestR) will let R execute the set of codes in the file
vecsumtestR You can check that based on the codes in vecsumtestR vectors are assigned
to each of x y and z
gt source( vecsumtestR)
gt x
[1] 1 2 3 4 5
gt y
[1] 2 4 6 8 10
gt z
[1] 3 6 9 12 15
gt
Exercise 10 Write the procedure in exercise 8 to a file dframetestR and execute the
procedure using ldquosourcerdquo
11 Defining functions
In mathematics function outputs the value which is determined by the input value In
programming it often represents a defined set of procedures5 For example let us consider
a function f which divides the sum of two given input values In mathematics it can be
written as f(x y) = (x + y) 2 In R it is written as follows by introducing the keyword
ldquofunctionrdquo
f lt- function(x y)
return ((x + y) 2)
In this way a function with two parameters (x and y) is defined And the returned value
(output) will be (x + y) 2 After defining f
5 Probably ldquosubroutinerdquo may be the better terminology
18
f(10 20)
will assign 10 and 20 to parameters x and y respectively and 15 will be returned as (x +y) 2
= (10 + 20) 2 = 15 Here ldquoreturnrdquo statement will return the value given just after it You
can also explicitly give the parameter names x and y as follows
f(x = 10 y = 20)
The general way to define a function is
name_of_function lt- function(parameter 1 parameter 2 hellip)
various procedures possibly using the given parameters6
hellip
return(return_value)
Exercise 11 Implement a mathematical function f(x a b c) = ax2 + bx + c in R Then
calculate f(4 3 2 1)
12 Making graphs
R is equipped with functions capable of making graphs easily ldquoplotrdquo function may be one
of the simplest ones It creates a plot in the two-dimensional space For example
assigning the following vectors to x and y will create a plot with points on the locations
(12) (34) (59) (77) and (98)
x lt- c(13579)
y lt- c(24978)
plot(x y xlab=X Value ylab=Y Value)
Labels on the x and y axes can be given to the parameters xlab and ylab
respectively
6 Optional parameters hellip can be access with list(hellip) as a list
19
A plot created by ldquoplotrdquo function
A bar graph can be created using ldquobarplotrdquo function In the following example a bar
graph is created by giving the heights of each bar by vector x The labels of each bar
are given by the element names of the vector x ie names(x)
x lt- c(1232101)
names(x) lt- c(A B C D E F)
barplot(x)
A bar graph created by ldquobarplotrdquo function
ldquohistrdquo function generates a histogram for a set of numbers given by a vector
2 4 6 8
23
45
67
89
X Value
YV
alu
e
A B C D E F
02
46
810
A B C D E F
02
46
810
20
x lt- c(32 12 42 23 34 59 52 53 41 52 32 14)
hist(x xlab = Test Value main = Test Histogram)
The parameter ldquomainrdquo is used to state the title of the histogram
A generated histogram using ldquohistrdquo function
ldquoboxplotrdquo function creates a boxplot for the numbers given by the vectors
x1 lt- c(1112111011111213151211101213)
x2 lt- c(20212791223231211921157121292315)
boxplot(x1 x2 names=c(Data 1 Data 2))
Test Histogram
Test Value
Fre
qu
en
cy
1 2 3 4 5 6
01
23
4
21
Example of a box plot
Exercise 12 Using the table (data frame) given in exercise 7-1 make a plot which describes
relationship between masses of the planets and number of satellites
13 Basic program structure
R is equipped with programming grammars which are important and common in other
programming languages Here some of the most important ones will be described briefly
131 if-statement
ldquoifrdquo statement gives you a way to execute a specific procedure only if a specified condition7
is satisfied For example if you want to assign 1 to y when x gt 0 and otherwise assign 0 to y
you can write as follows
if (x gt 0)
y lt- 1
7 When specifying a condition logical operators such as amp (logical AND) and | (logical OR)
can be used
Data 1 Data 2
10
15
20
25
Median
Outlier 50 of the
data are within this
range
The bottom
25 excluding outliers
The top 25
excluding outliers
22
else
y lt- 0
Investigate the value of y after doing x lt- -5 Then after doing x lt- 3 investigate the value
of y again to make sure that the value has changed
The general form of if-statement is as follows
if (condition 1)
Set of procedures to execute when the condition 1 is satisfied
else if (condition 2)
Set of procedures to execute when the condition the condition 2 is satisfied (but the
condition 1 is NOT met)
else if(condition 3)
Se of procedures to execute when condition 3 is satisfied (but condition 1 to 2 are NOT
met)
else if hellip
else
Set of procedures to execute when NONE of the above conditions are satisfied
Exercise 13-1 Define a function which returns 1 when the input parameter is 0 and
otherwise returns 0
132 while-statement
while-statement iterates a set of given procedures as long as the given condition is satisfied
The general form of while-statement is as follows8
while(condition)
8 next-statement in the while-statement forces program to start the next iteration
immediately break-statement in while-statement forces the program to immediately stop
the iteration and get out of the while-loop
23
A set of procedures to execute when the condition is satisfied
For example executing while(x lt= 3) print(x) x lt- x + 1 after doing x lt- 1 will generate
the output of 1 to 3
gt x lt- 1
gt while (x lt= 3) print(x) x lt- x + 1
[1] 1
[1] 2
[1] 3
gt
If you are to write this procedure as a program in a file you may want to write each step
line by line as follows so that the program will be easy to read
x lt- 1
while (x lt= 3)
print(x)
x lt- x + 1
Initially the value of x is 1 and the condition of the while-block ie x le 3 is met Thus R
goes into the while-block The first procedure print(x) which displays the value of x is
executed and 1 will be displayed
In the next procedure in the while-block (x lt- x + 1) the value of x is increased by 1 Thus
at the end of the first loop of while-block x is 2
R interpreter then comes back to the condition check at the beginning of the while-block
(x lt= 3) The variable x is 2 at this point and still x le 3 holds so the procedures in the
while-block will be executed again ie displaying the value of x 2 by print(x) and
increasing the value of x by 1 by x lt- x + 1 At the end of the while-block x is 3
24
R interpreter will then come back again to the condition check at the beginning of the
while-block (x lt= 3) The variable x is 3 at this point and still x le 3 holds so the
procedures in the while-block will be executed again ie displaying the value of x which
is 3 by print(x) and increasing the value of x by 1 by x lt- x + 1 At the end of the
while-block x is 4
R interpreter will then come back again to the condition check at the beginning of the
while-block (x lt= 3) The variable x is 4 at this point and x le 3 is NOT satisfied any more
Thus R interpreter steps out of the while-loop Final value of x is 4
Exercise 13-2 Using while-statement display 13579 and 11 respectively in each line
133 for-statement
for-statement also does iteration like while-statement The for-statement assigns each of
given elements to the given variable starting from the first element to the last element in
the given elements After each assignment the procedures in the for-block are executed
The general form of for-statement is
for(variables in elements)
procedures
For example for (i in c(135)) print(i) will assign each of 1 3 5 into the variable i and
after each assignment the procedures in the file-block are executed Thus in this case
number 1 is displayed in the first iteration after the assignment 3 is displayed in the
second iteration after the assignment and finally 5 is displayed in the third iteration after
the assignment The following example makes a vector of set of squared values of 1 to 59
x lt- NULL
for (i in 15)
x lt- append(x i2)
9 Actually using for-statement is unnecessary here Just do x lt- (15)2
25
x lt- NULL assigns an empty vector to x NULL represents an empty vector
In the for-statement each value of 1 to 5 is assigned to i and after the assignment the
procedure in the for-block is executed
In the procedure in the for-block the squared value of i (represented as i2) is
concatenated to the vector x The function append(x i) concatenates i to vector x10
Exercise 13-3 Rewrite procedure in 12-2 using for-statement
14 Other useful functions
Here some of the frequently used R functions are introduced briefly
141 How to use
help(function_name) will display how to use function_name
142 variables and attributes
ls() or objects() will display currently defined variables
class(variable_name) or mode(variable_name) will give you the type of the variable (object
For example whether it is numerical variable character list or matrix)
attributes(variable_name) will return attributes defined for the given variable
variabl_name
143 Family of apply functions
ldquosapplyrdquo function will return a vector containing a set of output values from a given
function after using each value in the given vector as a single input to that given function
each by each
func1_sub lt- function(elm)
a function expecting a single number as a parameter
if(-1 lt= elm amp elm lt= 1) return (1) else return (0)
10 The same procedure can be done with x lt- c(x i2) c can be used to concatenate given
vectors
26
func1 lt- function(x) a function with a vector parameter x
return(sapply(x func1_sub))
144 Making figures
rdquocurverdquo function generates a graph for a given function See help for details
Example
curve(dnorm -7 +7) Draws normal (Gaussian) distribution
curve(cos(x)+cos(2x) -2pi 2pi 1000) 1000 is number of points
curve(func1 -3 3) The function defined in 143 Family of apply functions
27
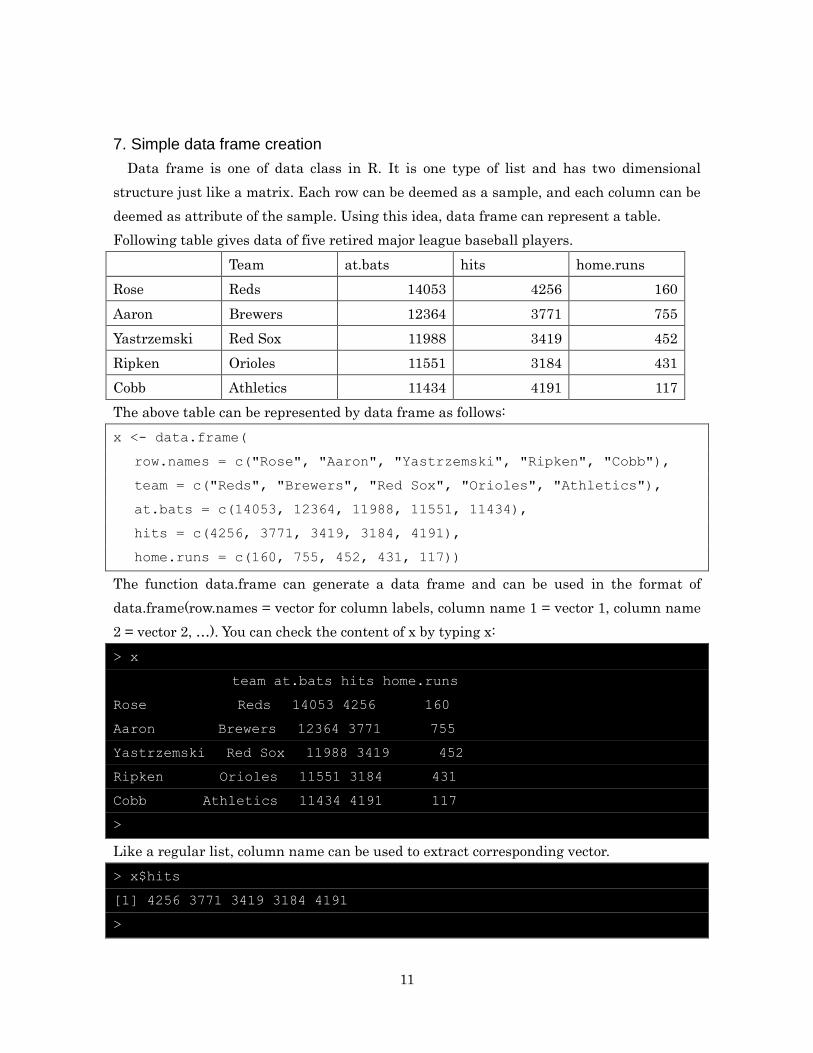
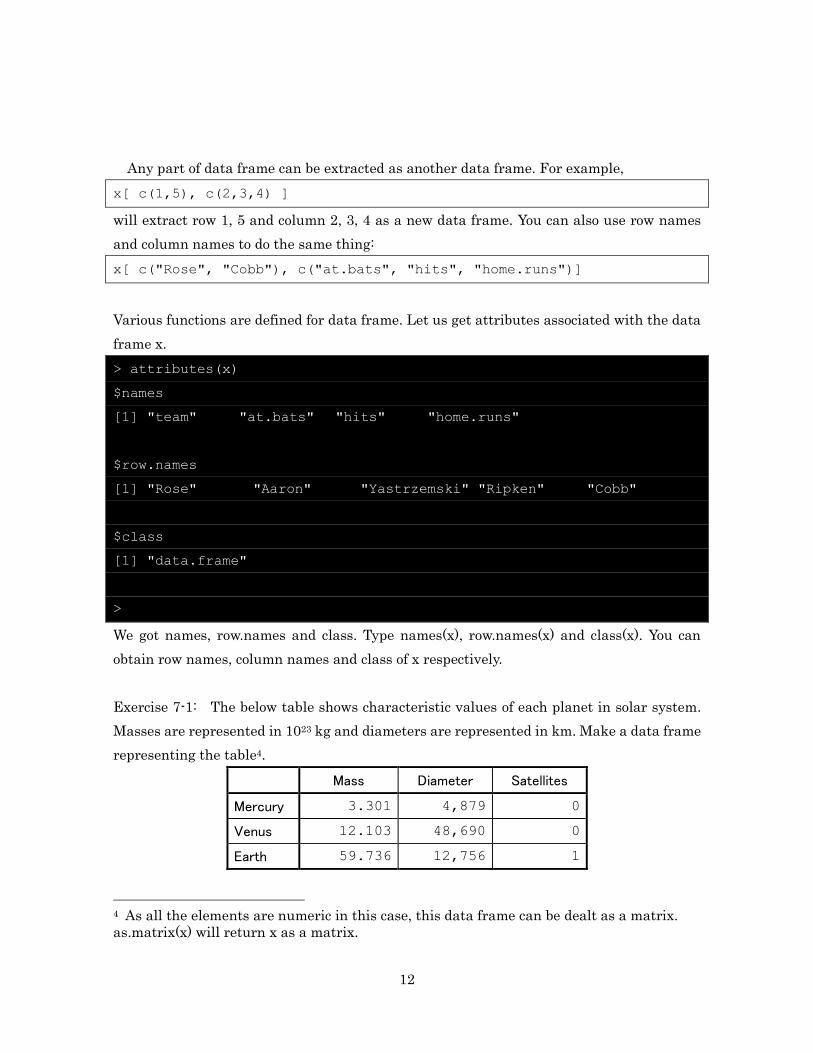
12
Any part of data frame can be extracted as another data frame For example
x[ c(15) c(234) ]
will extract row 1 5 and column 2 3 4 as a new data frame You can also use row names
and column names to do the same thing
x[ c(Rose Cobb) c(atbats hits homeruns)]
Various functions are defined for data frame Let us get attributes associated with the data
frame x
gt attributes(x)
$names
[1] team atbats hits homeruns
$rownames
[1] Rose Aaron Yastrzemski Ripken Cobb
$class
[1] dataframe
gt
We got names rownames and class Type names(x) rownames(x) and class(x) You can
obtain row names column names and class of x respectively
Exercise 7-1 The below table shows characteristic values of each planet in solar system
Masses are represented in 1023 kg and diameters are represented in km Make a data frame
representing the table4
Mass Diameter Satellites
Mercury 3301 4879 0
Venus 12103 48690 0
Earth 59736 12756 1
4 As all the elements are numeric in this case this data frame can be dealt as a matrix
asmatrix(x) will return x as a matrix
13
Mars 6419 6794 2
Jupiter 18986 142984 63
Saturn 5688 120536 48
Uranus 8686 51118 27
Neptune 1024 49528 13
Exercise 7-2 Using the created data frame in the previous exercise calculate averages of
mass diameter and number of satellites
8 Data reading from file
So far we have been inputting data directly However in most of cases numerical data
may be prepared by files So we will learn how to import data into a variable in R First
prepare a text file with the following values Let us name the file ldquotestdatatxtrdquo We assume
that the file is placed under the directory UserssmithTMP
14
14
21
35
6
Using setwd we change the working directory to UserssmithTMP
setwd(UserssmithTMP)
Then using scan function read the data to a variable x
gt x lt- scan(testdatatxt)
Read 5 items
gt x
[1] 14 14 21 35 6
gt
You notice that the values are stored in x as a vector
R has a function readtable to read a table where each line is separated by TABs like the
following example (file name is ldquobatterstxtrdquo)
Team At_Bat Hits Home_Runs
14
Bonds Giants 9847 2935 762
Aaron Braves 12364 3771 755
Ruth Yankees 8398 2873 714
Rodriguez Yankees 10341 3070 687
Mays Giants 10881 3283 660
readtable can read this as data frame
gt x lt- readtable(batterstxt header = T
sep = t rownames = 1)
gt x
Team At_Bat Hits Home_Runs
Bonds Giants 9847 2935 762
Aaron Braves 12364 3771 755
Ruth Yankees 8398 2873 714
Rodriguez Yankees 10341 3070 687
Mays Giants 10881 3283 660
gt
The first parameter of the function readtable states that the name of the file to read
is rdquobatterstxtrdquo Subsequently header = T states that there is a header for the table sep =
ldquotrdquo indicates that each line is separated by TAB Finally we can specify that there is one
column for row names by rownames = 1 Since x will be a data frame we can get number of
hits by $Hits
Exercise 8 Save table in exercise 7-1 as tab-delimited file and read it as data frame
9 Writing data to file
There are many cases where we want to have statistical results written in file rather
than temporary seeing the results on screen In this way we can open the results by
spreadsheet software or process the results using other programming language afterwards
Using write function is one of the simplest ways to output the results to files This
function enables us to output numerical values assigned to variable to file For example
after assigning the vector to x as shown below
x lt- c(10 12 15 19 21 34)
15
the following line
write(x outfile1txt ncolumns = 1)
will write content of x to the file ldquooutfile1txtrdquo ncolumns = 1 states that the vector will be
written to the file by one column
Content of outfile1txt
10
12
15
19
21
34
write function also enable us to write matrix data to file as shown below
gt x lt- matrix(c(123456) nrow=2 ncol=3 byrow=T)
gt x
[1] [2] [3]
[1] 1 2 3
[2] 4 5 6
gt write(t(x) outfile2txt ncolumns=ncol(x) sep=t)
gt
t(x) transposes matrix x If we do not do it the matrix written in the file will look
transposed ncolumns=ncol(x) will tell R that the number of columns to output should be
identical to that of matrix x sep = ldquotrdquo indicates that the columns in the output file will be
separated by tabs
Content of outfile2txt
1 2 3
4 5 6
For writing data frame to a file writetable function is provided
gt x lt- dataframe(
rownames = c(Bonds Aaron Ruth Rodriguez Mays)
Team = c(Giants Braves Yankees Yankees Giants)
16
At_Bat = c(9847 12364 8398 10341 10881)
Hits = c(2935 3771 2873 3070 3283)
Home_Runs = c(762 755 714 687 660))
gt x[c(Hits Home_Runs)]
Hits Home_Runs
Bonds 2935 762
Aaron 3771 755
Ruth 2873 714
Rodriguez 3070 687
Mays 3283 660
gt writetable(x[c(Hits Home_Runs)] outfile3txt sep=t
rownames=T colnames=NA)
gt
With rownames=T and colnames=NA row names and column names will be added
respectively (blank on the top-left)
Content of outfile3
Hits Home_Runs
Bonds 2935 762
Aaron 3771 755
Ruth 2873 714
Rodriguez 3070 687
Mays 3283 660
By giving quote=F output will be without double quotations
Excercise 9 Using the data frame in the above example calculate ratio of hits and at bat
and write the result to rdquooutfile4txtrdquo
10 Writing a program in a file
So far we have done our works interactively without saving what R codes we have written
However when we repeat the same works with R it is laborious to interactively write the
same codes again and again To solve this issue we can write the set of codes in a file and R
can read the file to execute the codes written in the file
For example we can prepare a text file with the following code Let us name the
17
file vecsumtestR
x lt- c(12345)
y lt- c(246810)
z lt- x + y
Then giving source( vecsumtestR) will let R execute the set of codes in the file
vecsumtestR You can check that based on the codes in vecsumtestR vectors are assigned
to each of x y and z
gt source( vecsumtestR)
gt x
[1] 1 2 3 4 5
gt y
[1] 2 4 6 8 10
gt z
[1] 3 6 9 12 15
gt
Exercise 10 Write the procedure in exercise 8 to a file dframetestR and execute the
procedure using ldquosourcerdquo
11 Defining functions
In mathematics function outputs the value which is determined by the input value In
programming it often represents a defined set of procedures5 For example let us consider
a function f which divides the sum of two given input values In mathematics it can be
written as f(x y) = (x + y) 2 In R it is written as follows by introducing the keyword
ldquofunctionrdquo
f lt- function(x y)
return ((x + y) 2)
In this way a function with two parameters (x and y) is defined And the returned value
(output) will be (x + y) 2 After defining f
5 Probably ldquosubroutinerdquo may be the better terminology
18
f(10 20)
will assign 10 and 20 to parameters x and y respectively and 15 will be returned as (x +y) 2
= (10 + 20) 2 = 15 Here ldquoreturnrdquo statement will return the value given just after it You
can also explicitly give the parameter names x and y as follows
f(x = 10 y = 20)
The general way to define a function is
name_of_function lt- function(parameter 1 parameter 2 hellip)
various procedures possibly using the given parameters6
hellip
return(return_value)
Exercise 11 Implement a mathematical function f(x a b c) = ax2 + bx + c in R Then
calculate f(4 3 2 1)
12 Making graphs
R is equipped with functions capable of making graphs easily ldquoplotrdquo function may be one
of the simplest ones It creates a plot in the two-dimensional space For example
assigning the following vectors to x and y will create a plot with points on the locations
(12) (34) (59) (77) and (98)
x lt- c(13579)
y lt- c(24978)
plot(x y xlab=X Value ylab=Y Value)
Labels on the x and y axes can be given to the parameters xlab and ylab
respectively
6 Optional parameters hellip can be access with list(hellip) as a list
19
A plot created by ldquoplotrdquo function
A bar graph can be created using ldquobarplotrdquo function In the following example a bar
graph is created by giving the heights of each bar by vector x The labels of each bar
are given by the element names of the vector x ie names(x)
x lt- c(1232101)
names(x) lt- c(A B C D E F)
barplot(x)
A bar graph created by ldquobarplotrdquo function
ldquohistrdquo function generates a histogram for a set of numbers given by a vector
2 4 6 8
23
45
67
89
X Value
YV
alu
e
A B C D E F
02
46
810
A B C D E F
02
46
810
20
x lt- c(32 12 42 23 34 59 52 53 41 52 32 14)
hist(x xlab = Test Value main = Test Histogram)
The parameter ldquomainrdquo is used to state the title of the histogram
A generated histogram using ldquohistrdquo function
ldquoboxplotrdquo function creates a boxplot for the numbers given by the vectors
x1 lt- c(1112111011111213151211101213)
x2 lt- c(20212791223231211921157121292315)
boxplot(x1 x2 names=c(Data 1 Data 2))
Test Histogram
Test Value
Fre
qu
en
cy
1 2 3 4 5 6
01
23
4
21
Example of a box plot
Exercise 12 Using the table (data frame) given in exercise 7-1 make a plot which describes
relationship between masses of the planets and number of satellites
13 Basic program structure
R is equipped with programming grammars which are important and common in other
programming languages Here some of the most important ones will be described briefly
131 if-statement
ldquoifrdquo statement gives you a way to execute a specific procedure only if a specified condition7
is satisfied For example if you want to assign 1 to y when x gt 0 and otherwise assign 0 to y
you can write as follows
if (x gt 0)
y lt- 1
7 When specifying a condition logical operators such as amp (logical AND) and | (logical OR)
can be used
Data 1 Data 2
10
15
20
25
Median
Outlier 50 of the
data are within this
range
The bottom
25 excluding outliers
The top 25
excluding outliers
22
else
y lt- 0
Investigate the value of y after doing x lt- -5 Then after doing x lt- 3 investigate the value
of y again to make sure that the value has changed
The general form of if-statement is as follows
if (condition 1)
Set of procedures to execute when the condition 1 is satisfied
else if (condition 2)
Set of procedures to execute when the condition the condition 2 is satisfied (but the
condition 1 is NOT met)
else if(condition 3)
Se of procedures to execute when condition 3 is satisfied (but condition 1 to 2 are NOT
met)
else if hellip
else
Set of procedures to execute when NONE of the above conditions are satisfied
Exercise 13-1 Define a function which returns 1 when the input parameter is 0 and
otherwise returns 0
132 while-statement
while-statement iterates a set of given procedures as long as the given condition is satisfied
The general form of while-statement is as follows8
while(condition)
8 next-statement in the while-statement forces program to start the next iteration
immediately break-statement in while-statement forces the program to immediately stop
the iteration and get out of the while-loop
23
A set of procedures to execute when the condition is satisfied
For example executing while(x lt= 3) print(x) x lt- x + 1 after doing x lt- 1 will generate
the output of 1 to 3
gt x lt- 1
gt while (x lt= 3) print(x) x lt- x + 1
[1] 1
[1] 2
[1] 3
gt
If you are to write this procedure as a program in a file you may want to write each step
line by line as follows so that the program will be easy to read
x lt- 1
while (x lt= 3)
print(x)
x lt- x + 1
Initially the value of x is 1 and the condition of the while-block ie x le 3 is met Thus R
goes into the while-block The first procedure print(x) which displays the value of x is
executed and 1 will be displayed
In the next procedure in the while-block (x lt- x + 1) the value of x is increased by 1 Thus
at the end of the first loop of while-block x is 2
R interpreter then comes back to the condition check at the beginning of the while-block
(x lt= 3) The variable x is 2 at this point and still x le 3 holds so the procedures in the
while-block will be executed again ie displaying the value of x 2 by print(x) and
increasing the value of x by 1 by x lt- x + 1 At the end of the while-block x is 3
24
R interpreter will then come back again to the condition check at the beginning of the
while-block (x lt= 3) The variable x is 3 at this point and still x le 3 holds so the
procedures in the while-block will be executed again ie displaying the value of x which
is 3 by print(x) and increasing the value of x by 1 by x lt- x + 1 At the end of the
while-block x is 4
R interpreter will then come back again to the condition check at the beginning of the
while-block (x lt= 3) The variable x is 4 at this point and x le 3 is NOT satisfied any more
Thus R interpreter steps out of the while-loop Final value of x is 4
Exercise 13-2 Using while-statement display 13579 and 11 respectively in each line
133 for-statement
for-statement also does iteration like while-statement The for-statement assigns each of
given elements to the given variable starting from the first element to the last element in
the given elements After each assignment the procedures in the for-block are executed
The general form of for-statement is
for(variables in elements)
procedures
For example for (i in c(135)) print(i) will assign each of 1 3 5 into the variable i and
after each assignment the procedures in the file-block are executed Thus in this case
number 1 is displayed in the first iteration after the assignment 3 is displayed in the
second iteration after the assignment and finally 5 is displayed in the third iteration after
the assignment The following example makes a vector of set of squared values of 1 to 59
x lt- NULL
for (i in 15)
x lt- append(x i2)
9 Actually using for-statement is unnecessary here Just do x lt- (15)2
25
x lt- NULL assigns an empty vector to x NULL represents an empty vector
In the for-statement each value of 1 to 5 is assigned to i and after the assignment the
procedure in the for-block is executed
In the procedure in the for-block the squared value of i (represented as i2) is
concatenated to the vector x The function append(x i) concatenates i to vector x10
Exercise 13-3 Rewrite procedure in 12-2 using for-statement
14 Other useful functions
Here some of the frequently used R functions are introduced briefly
141 How to use
help(function_name) will display how to use function_name
142 variables and attributes
ls() or objects() will display currently defined variables
class(variable_name) or mode(variable_name) will give you the type of the variable (object
For example whether it is numerical variable character list or matrix)
attributes(variable_name) will return attributes defined for the given variable
variabl_name
143 Family of apply functions
ldquosapplyrdquo function will return a vector containing a set of output values from a given
function after using each value in the given vector as a single input to that given function
each by each
func1_sub lt- function(elm)
a function expecting a single number as a parameter
if(-1 lt= elm amp elm lt= 1) return (1) else return (0)
10 The same procedure can be done with x lt- c(x i2) c can be used to concatenate given
vectors
26
func1 lt- function(x) a function with a vector parameter x
return(sapply(x func1_sub))
144 Making figures
rdquocurverdquo function generates a graph for a given function See help for details
Example
curve(dnorm -7 +7) Draws normal (Gaussian) distribution
curve(cos(x)+cos(2x) -2pi 2pi 1000) 1000 is number of points
curve(func1 -3 3) The function defined in 143 Family of apply functions
27
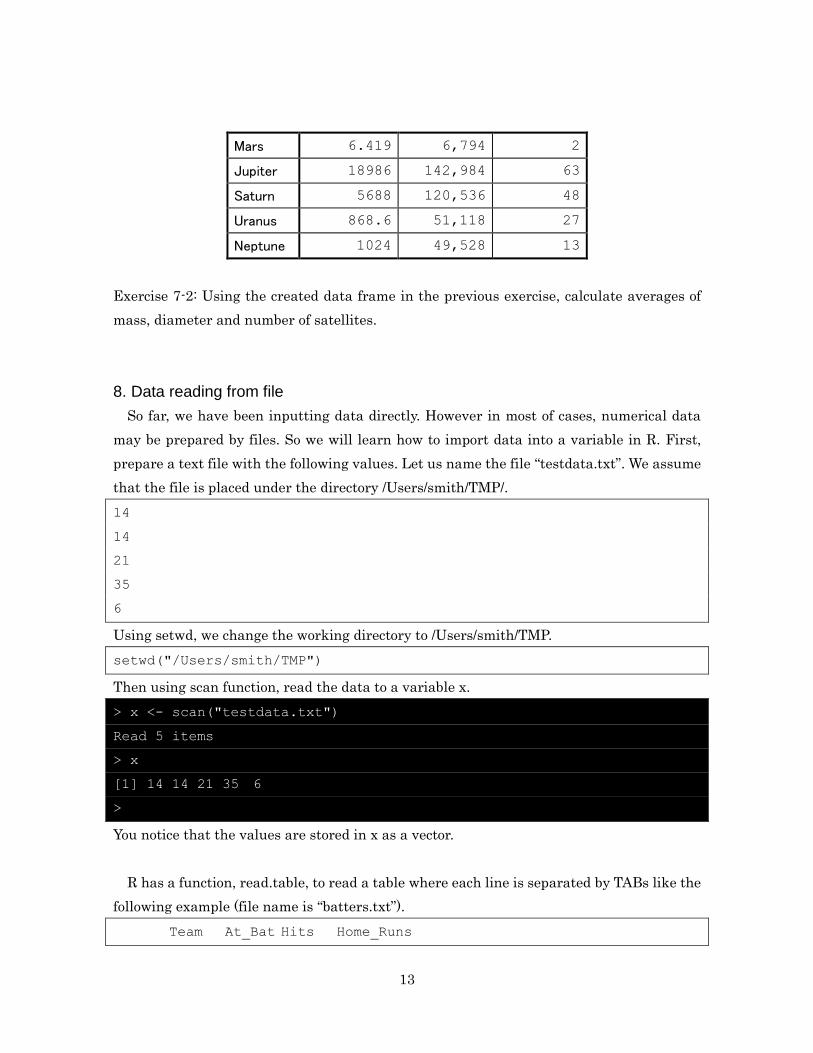
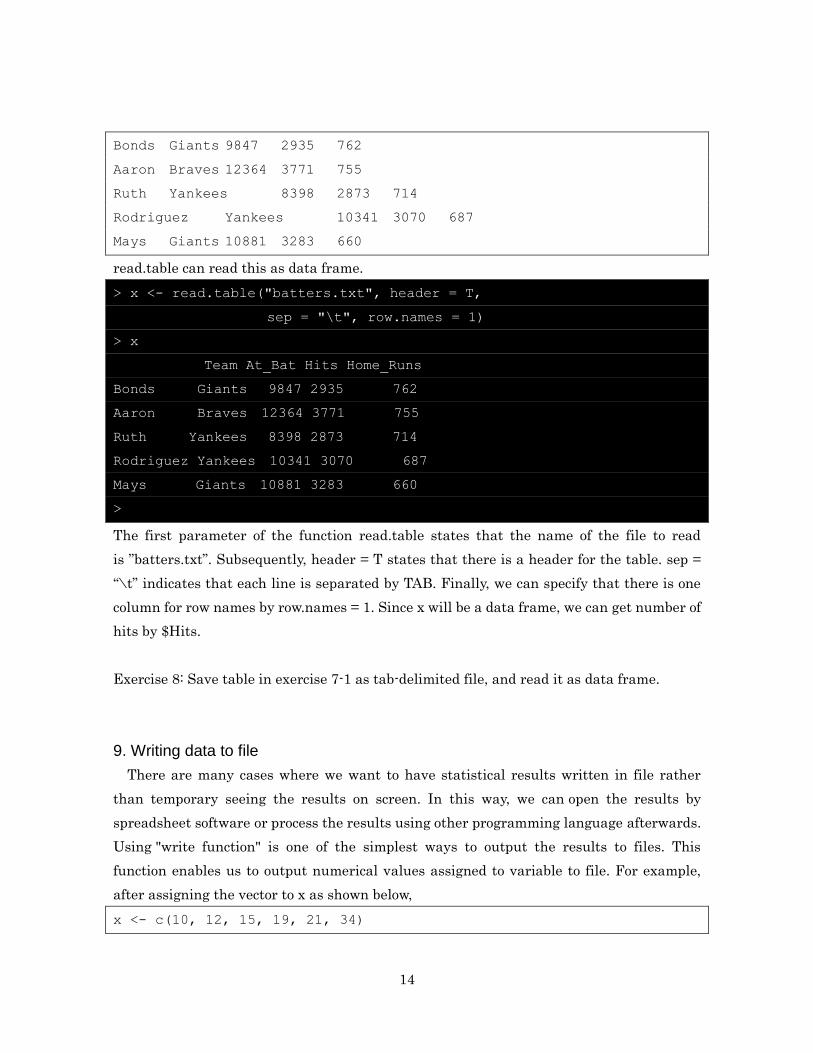
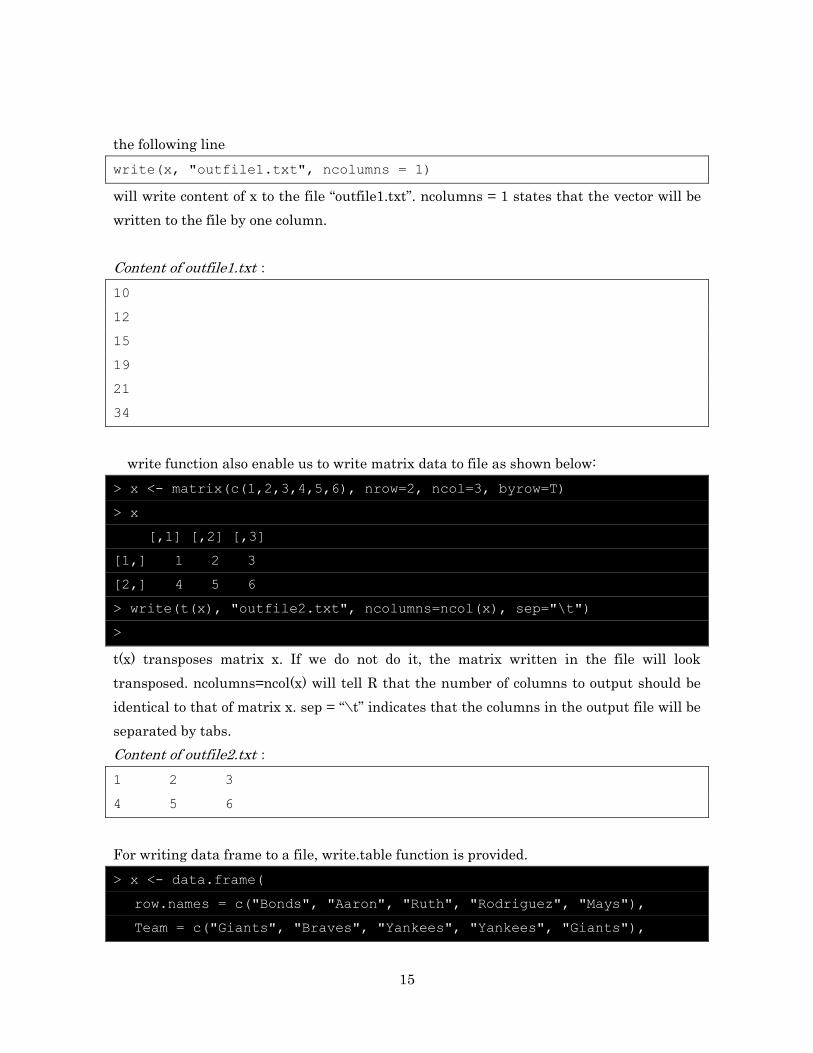
15
the following line
write(x outfile1txt ncolumns = 1)
will write content of x to the file ldquooutfile1txtrdquo ncolumns = 1 states that the vector will be
written to the file by one column
Content of outfile1txt
10
12
15
19
21
34
write function also enable us to write matrix data to file as shown below
gt x lt- matrix(c(123456) nrow=2 ncol=3 byrow=T)
gt x
[1] [2] [3]
[1] 1 2 3
[2] 4 5 6
gt write(t(x) outfile2txt ncolumns=ncol(x) sep=t)
gt
t(x) transposes matrix x If we do not do it the matrix written in the file will look
transposed ncolumns=ncol(x) will tell R that the number of columns to output should be
identical to that of matrix x sep = ldquotrdquo indicates that the columns in the output file will be
separated by tabs
Content of outfile2txt
1 2 3
4 5 6
For writing data frame to a file writetable function is provided
gt x lt- dataframe(
rownames = c(Bonds Aaron Ruth Rodriguez Mays)
Team = c(Giants Braves Yankees Yankees Giants)
16
At_Bat = c(9847 12364 8398 10341 10881)
Hits = c(2935 3771 2873 3070 3283)
Home_Runs = c(762 755 714 687 660))
gt x[c(Hits Home_Runs)]
Hits Home_Runs
Bonds 2935 762
Aaron 3771 755
Ruth 2873 714
Rodriguez 3070 687
Mays 3283 660
gt writetable(x[c(Hits Home_Runs)] outfile3txt sep=t
rownames=T colnames=NA)
gt
With rownames=T and colnames=NA row names and column names will be added
respectively (blank on the top-left)
Content of outfile3
Hits Home_Runs
Bonds 2935 762
Aaron 3771 755
Ruth 2873 714
Rodriguez 3070 687
Mays 3283 660
By giving quote=F output will be without double quotations
Excercise 9 Using the data frame in the above example calculate ratio of hits and at bat
and write the result to rdquooutfile4txtrdquo
10 Writing a program in a file
So far we have done our works interactively without saving what R codes we have written
However when we repeat the same works with R it is laborious to interactively write the
same codes again and again To solve this issue we can write the set of codes in a file and R
can read the file to execute the codes written in the file
For example we can prepare a text file with the following code Let us name the
17
file vecsumtestR
x lt- c(12345)
y lt- c(246810)
z lt- x + y
Then giving source( vecsumtestR) will let R execute the set of codes in the file
vecsumtestR You can check that based on the codes in vecsumtestR vectors are assigned
to each of x y and z
gt source( vecsumtestR)
gt x
[1] 1 2 3 4 5
gt y
[1] 2 4 6 8 10
gt z
[1] 3 6 9 12 15
gt
Exercise 10 Write the procedure in exercise 8 to a file dframetestR and execute the
procedure using ldquosourcerdquo
11 Defining functions
In mathematics function outputs the value which is determined by the input value In
programming it often represents a defined set of procedures5 For example let us consider
a function f which divides the sum of two given input values In mathematics it can be
written as f(x y) = (x + y) 2 In R it is written as follows by introducing the keyword
ldquofunctionrdquo
f lt- function(x y)
return ((x + y) 2)
In this way a function with two parameters (x and y) is defined And the returned value
(output) will be (x + y) 2 After defining f
5 Probably ldquosubroutinerdquo may be the better terminology
18
f(10 20)
will assign 10 and 20 to parameters x and y respectively and 15 will be returned as (x +y) 2
= (10 + 20) 2 = 15 Here ldquoreturnrdquo statement will return the value given just after it You
can also explicitly give the parameter names x and y as follows
f(x = 10 y = 20)
The general way to define a function is
name_of_function lt- function(parameter 1 parameter 2 hellip)
various procedures possibly using the given parameters6
hellip
return(return_value)
Exercise 11 Implement a mathematical function f(x a b c) = ax2 + bx + c in R Then
calculate f(4 3 2 1)
12 Making graphs
R is equipped with functions capable of making graphs easily ldquoplotrdquo function may be one
of the simplest ones It creates a plot in the two-dimensional space For example
assigning the following vectors to x and y will create a plot with points on the locations
(12) (34) (59) (77) and (98)
x lt- c(13579)
y lt- c(24978)
plot(x y xlab=X Value ylab=Y Value)
Labels on the x and y axes can be given to the parameters xlab and ylab
respectively
6 Optional parameters hellip can be access with list(hellip) as a list
19
A plot created by ldquoplotrdquo function
A bar graph can be created using ldquobarplotrdquo function In the following example a bar
graph is created by giving the heights of each bar by vector x The labels of each bar
are given by the element names of the vector x ie names(x)
x lt- c(1232101)
names(x) lt- c(A B C D E F)
barplot(x)
A bar graph created by ldquobarplotrdquo function
ldquohistrdquo function generates a histogram for a set of numbers given by a vector
2 4 6 8
23
45
67
89
X Value
YV
alu
e
A B C D E F
02
46
810
A B C D E F
02
46
810
20
x lt- c(32 12 42 23 34 59 52 53 41 52 32 14)
hist(x xlab = Test Value main = Test Histogram)
The parameter ldquomainrdquo is used to state the title of the histogram
A generated histogram using ldquohistrdquo function
ldquoboxplotrdquo function creates a boxplot for the numbers given by the vectors
x1 lt- c(1112111011111213151211101213)
x2 lt- c(20212791223231211921157121292315)
boxplot(x1 x2 names=c(Data 1 Data 2))
Test Histogram
Test Value
Fre
qu
en
cy
1 2 3 4 5 6
01
23
4
21
Example of a box plot
Exercise 12 Using the table (data frame) given in exercise 7-1 make a plot which describes
relationship between masses of the planets and number of satellites
13 Basic program structure
R is equipped with programming grammars which are important and common in other
programming languages Here some of the most important ones will be described briefly
131 if-statement
ldquoifrdquo statement gives you a way to execute a specific procedure only if a specified condition7
is satisfied For example if you want to assign 1 to y when x gt 0 and otherwise assign 0 to y
you can write as follows
if (x gt 0)
y lt- 1
7 When specifying a condition logical operators such as amp (logical AND) and | (logical OR)
can be used
Data 1 Data 2
10
15
20
25
Median
Outlier 50 of the
data are within this
range
The bottom
25 excluding outliers
The top 25
excluding outliers
22
else
y lt- 0
Investigate the value of y after doing x lt- -5 Then after doing x lt- 3 investigate the value
of y again to make sure that the value has changed
The general form of if-statement is as follows
if (condition 1)
Set of procedures to execute when the condition 1 is satisfied
else if (condition 2)
Set of procedures to execute when the condition the condition 2 is satisfied (but the
condition 1 is NOT met)
else if(condition 3)
Se of procedures to execute when condition 3 is satisfied (but condition 1 to 2 are NOT
met)
else if hellip
else
Set of procedures to execute when NONE of the above conditions are satisfied
Exercise 13-1 Define a function which returns 1 when the input parameter is 0 and
otherwise returns 0
132 while-statement
while-statement iterates a set of given procedures as long as the given condition is satisfied
The general form of while-statement is as follows8
while(condition)
8 next-statement in the while-statement forces program to start the next iteration
immediately break-statement in while-statement forces the program to immediately stop
the iteration and get out of the while-loop
23
A set of procedures to execute when the condition is satisfied
For example executing while(x lt= 3) print(x) x lt- x + 1 after doing x lt- 1 will generate
the output of 1 to 3
gt x lt- 1
gt while (x lt= 3) print(x) x lt- x + 1
[1] 1
[1] 2
[1] 3
gt
If you are to write this procedure as a program in a file you may want to write each step
line by line as follows so that the program will be easy to read
x lt- 1
while (x lt= 3)
print(x)
x lt- x + 1
Initially the value of x is 1 and the condition of the while-block ie x le 3 is met Thus R
goes into the while-block The first procedure print(x) which displays the value of x is
executed and 1 will be displayed
In the next procedure in the while-block (x lt- x + 1) the value of x is increased by 1 Thus
at the end of the first loop of while-block x is 2
R interpreter then comes back to the condition check at the beginning of the while-block
(x lt= 3) The variable x is 2 at this point and still x le 3 holds so the procedures in the
while-block will be executed again ie displaying the value of x 2 by print(x) and
increasing the value of x by 1 by x lt- x + 1 At the end of the while-block x is 3
24
R interpreter will then come back again to the condition check at the beginning of the
while-block (x lt= 3) The variable x is 3 at this point and still x le 3 holds so the
procedures in the while-block will be executed again ie displaying the value of x which
is 3 by print(x) and increasing the value of x by 1 by x lt- x + 1 At the end of the
while-block x is 4
R interpreter will then come back again to the condition check at the beginning of the
while-block (x lt= 3) The variable x is 4 at this point and x le 3 is NOT satisfied any more
Thus R interpreter steps out of the while-loop Final value of x is 4
Exercise 13-2 Using while-statement display 13579 and 11 respectively in each line
133 for-statement
for-statement also does iteration like while-statement The for-statement assigns each of
given elements to the given variable starting from the first element to the last element in
the given elements After each assignment the procedures in the for-block are executed
The general form of for-statement is
for(variables in elements)
procedures
For example for (i in c(135)) print(i) will assign each of 1 3 5 into the variable i and
after each assignment the procedures in the file-block are executed Thus in this case
number 1 is displayed in the first iteration after the assignment 3 is displayed in the
second iteration after the assignment and finally 5 is displayed in the third iteration after
the assignment The following example makes a vector of set of squared values of 1 to 59
x lt- NULL
for (i in 15)
x lt- append(x i2)
9 Actually using for-statement is unnecessary here Just do x lt- (15)2
25
x lt- NULL assigns an empty vector to x NULL represents an empty vector
In the for-statement each value of 1 to 5 is assigned to i and after the assignment the
procedure in the for-block is executed
In the procedure in the for-block the squared value of i (represented as i2) is
concatenated to the vector x The function append(x i) concatenates i to vector x10
Exercise 13-3 Rewrite procedure in 12-2 using for-statement
14 Other useful functions
Here some of the frequently used R functions are introduced briefly
141 How to use
help(function_name) will display how to use function_name
142 variables and attributes
ls() or objects() will display currently defined variables
class(variable_name) or mode(variable_name) will give you the type of the variable (object
For example whether it is numerical variable character list or matrix)
attributes(variable_name) will return attributes defined for the given variable
variabl_name
143 Family of apply functions
ldquosapplyrdquo function will return a vector containing a set of output values from a given
function after using each value in the given vector as a single input to that given function
each by each
func1_sub lt- function(elm)
a function expecting a single number as a parameter
if(-1 lt= elm amp elm lt= 1) return (1) else return (0)
10 The same procedure can be done with x lt- c(x i2) c can be used to concatenate given
vectors
26
func1 lt- function(x) a function with a vector parameter x
return(sapply(x func1_sub))
144 Making figures
rdquocurverdquo function generates a graph for a given function See help for details
Example
curve(dnorm -7 +7) Draws normal (Gaussian) distribution
curve(cos(x)+cos(2x) -2pi 2pi 1000) 1000 is number of points
curve(func1 -3 3) The function defined in 143 Family of apply functions
27
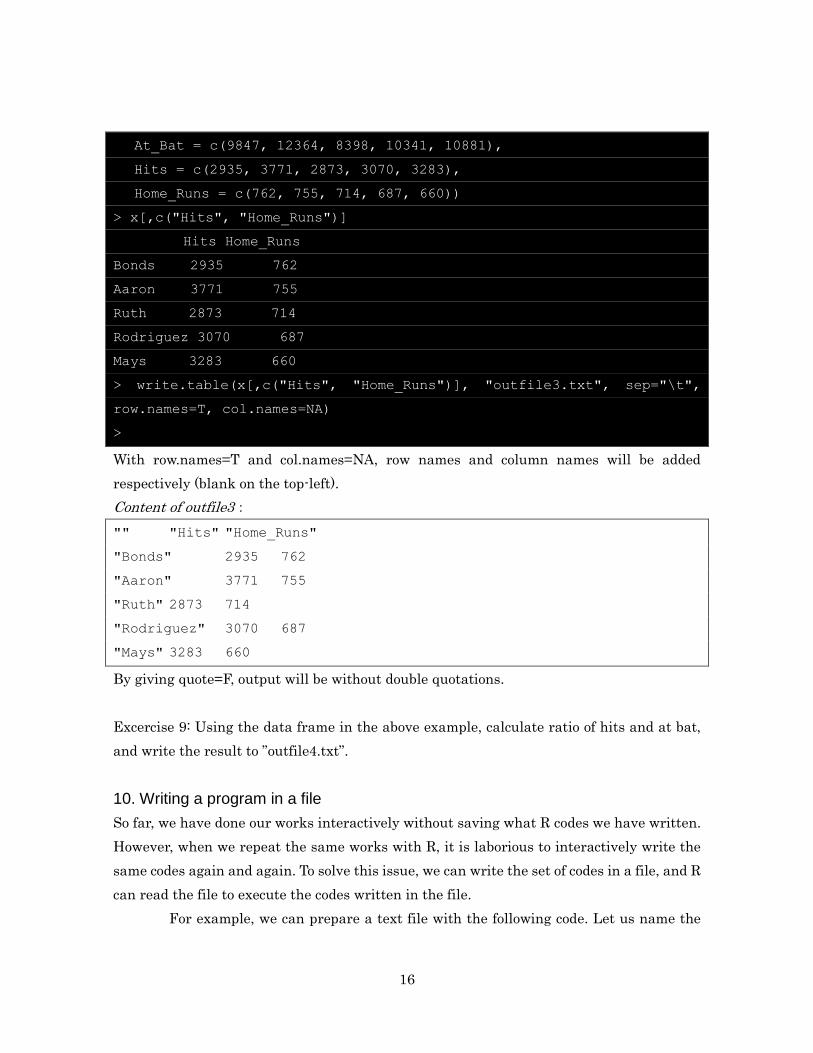
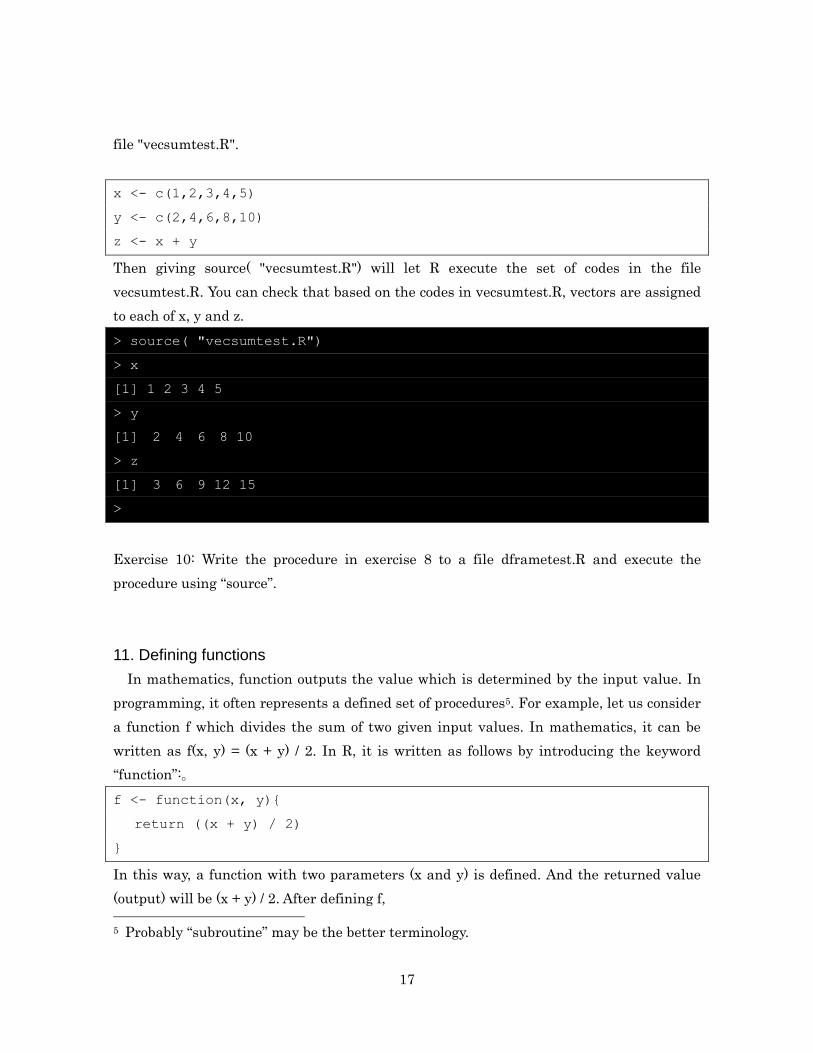
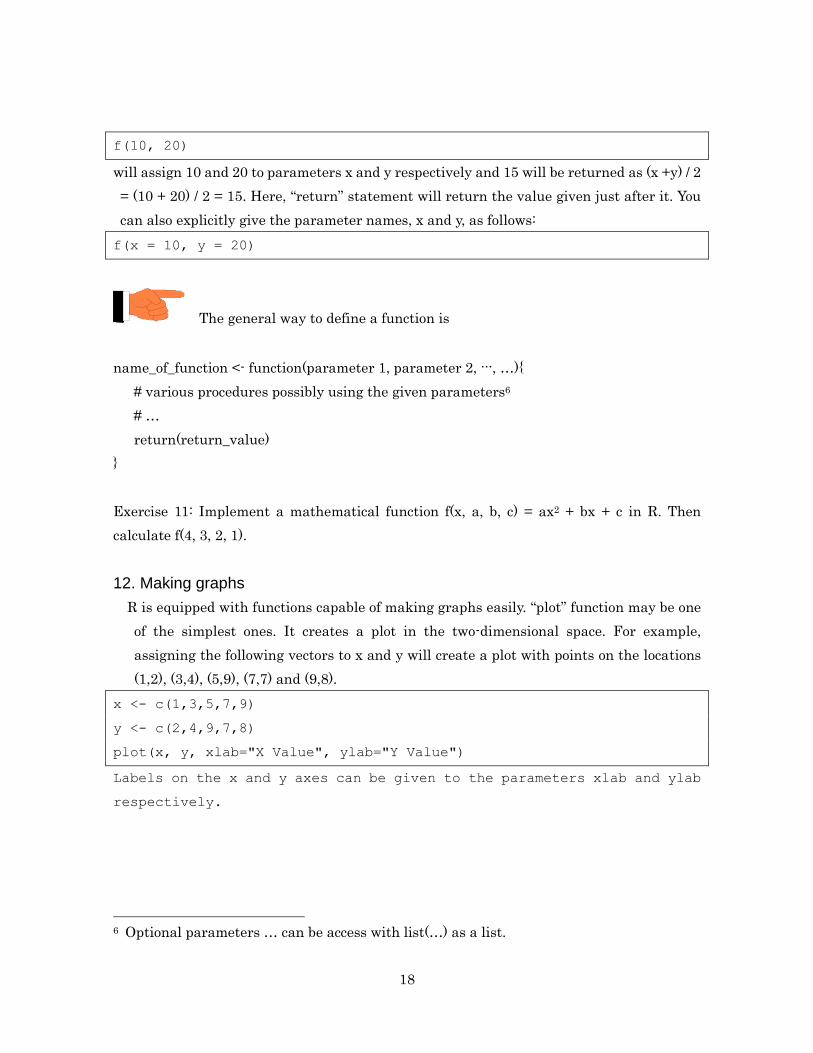
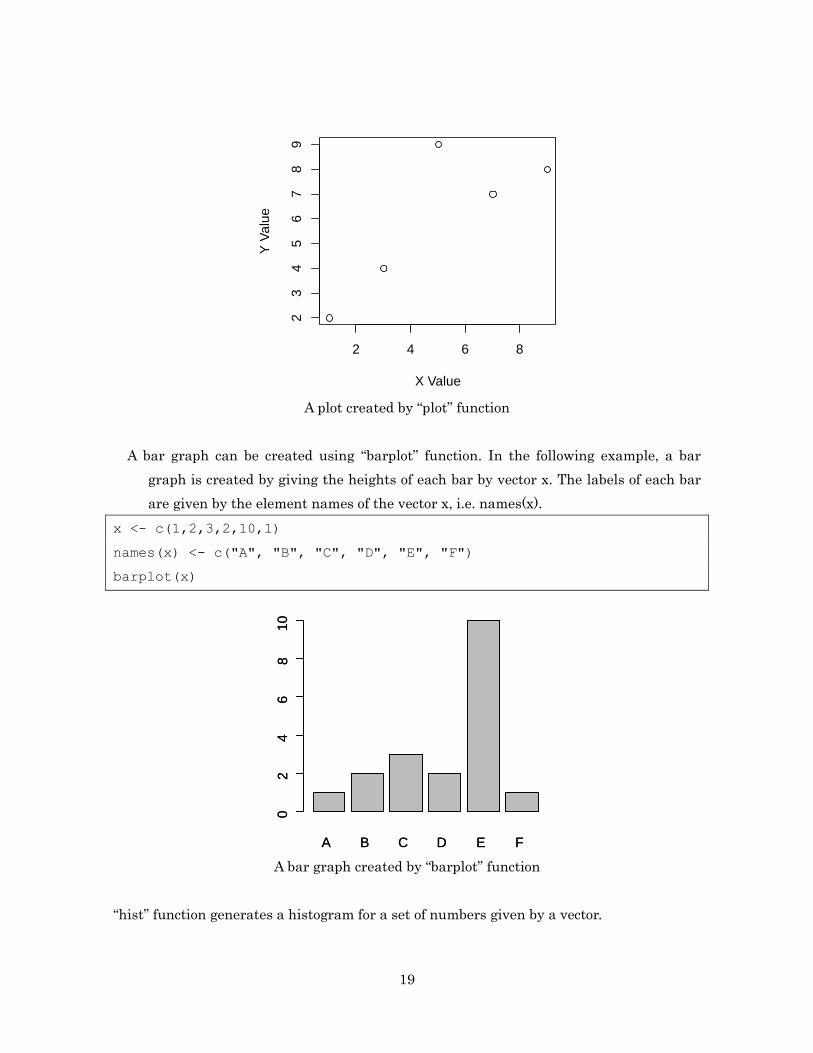
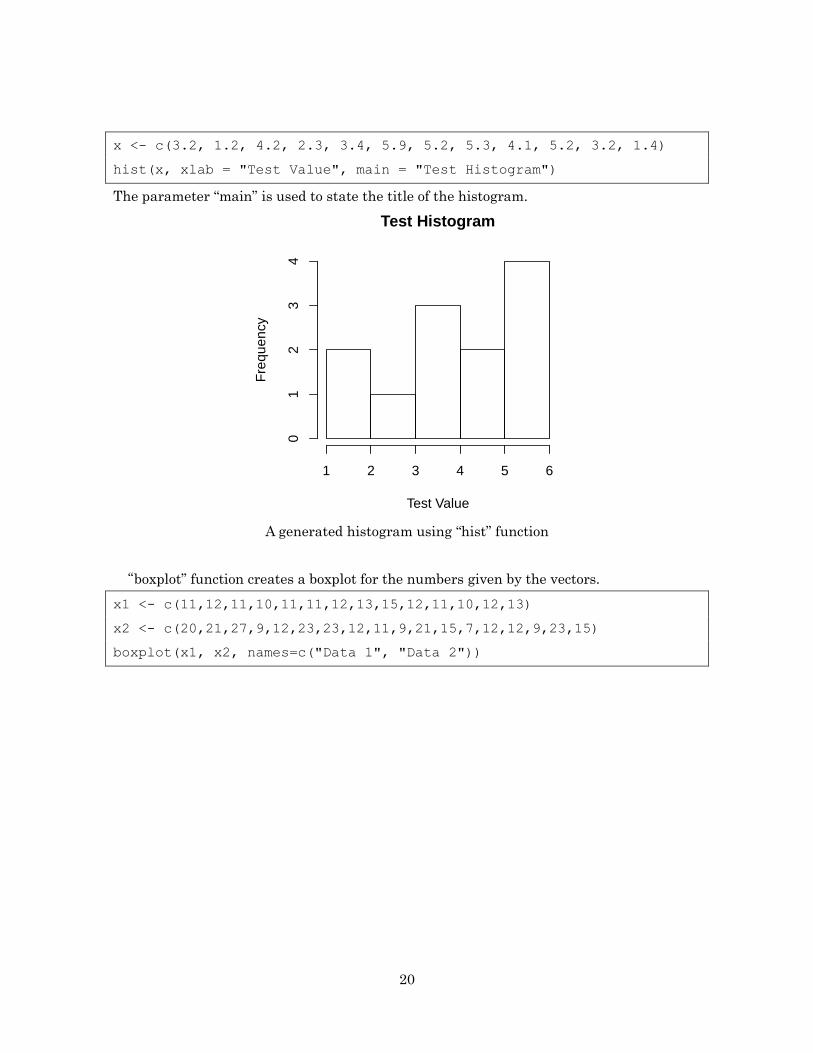
20
x lt- c(32 12 42 23 34 59 52 53 41 52 32 14)
hist(x xlab = Test Value main = Test Histogram)
The parameter ldquomainrdquo is used to state the title of the histogram
A generated histogram using ldquohistrdquo function
ldquoboxplotrdquo function creates a boxplot for the numbers given by the vectors
x1 lt- c(1112111011111213151211101213)
x2 lt- c(20212791223231211921157121292315)
boxplot(x1 x2 names=c(Data 1 Data 2))
Test Histogram
Test Value
Fre
qu
en
cy
1 2 3 4 5 6
01
23
4
21
Example of a box plot
Exercise 12 Using the table (data frame) given in exercise 7-1 make a plot which describes
relationship between masses of the planets and number of satellites
13 Basic program structure
R is equipped with programming grammars which are important and common in other
programming languages Here some of the most important ones will be described briefly
131 if-statement
ldquoifrdquo statement gives you a way to execute a specific procedure only if a specified condition7
is satisfied For example if you want to assign 1 to y when x gt 0 and otherwise assign 0 to y
you can write as follows
if (x gt 0)
y lt- 1
7 When specifying a condition logical operators such as amp (logical AND) and | (logical OR)
can be used
Data 1 Data 2
10
15
20
25
Median
Outlier 50 of the
data are within this
range
The bottom
25 excluding outliers
The top 25
excluding outliers
22
else
y lt- 0
Investigate the value of y after doing x lt- -5 Then after doing x lt- 3 investigate the value
of y again to make sure that the value has changed
The general form of if-statement is as follows
if (condition 1)
Set of procedures to execute when the condition 1 is satisfied
else if (condition 2)
Set of procedures to execute when the condition the condition 2 is satisfied (but the
condition 1 is NOT met)
else if(condition 3)
Se of procedures to execute when condition 3 is satisfied (but condition 1 to 2 are NOT
met)
else if hellip
else
Set of procedures to execute when NONE of the above conditions are satisfied
Exercise 13-1 Define a function which returns 1 when the input parameter is 0 and
otherwise returns 0
132 while-statement
while-statement iterates a set of given procedures as long as the given condition is satisfied
The general form of while-statement is as follows8
while(condition)
8 next-statement in the while-statement forces program to start the next iteration
immediately break-statement in while-statement forces the program to immediately stop
the iteration and get out of the while-loop
23
A set of procedures to execute when the condition is satisfied
For example executing while(x lt= 3) print(x) x lt- x + 1 after doing x lt- 1 will generate
the output of 1 to 3
gt x lt- 1
gt while (x lt= 3) print(x) x lt- x + 1
[1] 1
[1] 2
[1] 3
gt
If you are to write this procedure as a program in a file you may want to write each step
line by line as follows so that the program will be easy to read
x lt- 1
while (x lt= 3)
print(x)
x lt- x + 1
Initially the value of x is 1 and the condition of the while-block ie x le 3 is met Thus R
goes into the while-block The first procedure print(x) which displays the value of x is
executed and 1 will be displayed
In the next procedure in the while-block (x lt- x + 1) the value of x is increased by 1 Thus
at the end of the first loop of while-block x is 2
R interpreter then comes back to the condition check at the beginning of the while-block
(x lt= 3) The variable x is 2 at this point and still x le 3 holds so the procedures in the
while-block will be executed again ie displaying the value of x 2 by print(x) and
increasing the value of x by 1 by x lt- x + 1 At the end of the while-block x is 3
24
R interpreter will then come back again to the condition check at the beginning of the
while-block (x lt= 3) The variable x is 3 at this point and still x le 3 holds so the
procedures in the while-block will be executed again ie displaying the value of x which
is 3 by print(x) and increasing the value of x by 1 by x lt- x + 1 At the end of the
while-block x is 4
R interpreter will then come back again to the condition check at the beginning of the
while-block (x lt= 3) The variable x is 4 at this point and x le 3 is NOT satisfied any more
Thus R interpreter steps out of the while-loop Final value of x is 4
Exercise 13-2 Using while-statement display 13579 and 11 respectively in each line
133 for-statement
for-statement also does iteration like while-statement The for-statement assigns each of
given elements to the given variable starting from the first element to the last element in
the given elements After each assignment the procedures in the for-block are executed
The general form of for-statement is
for(variables in elements)
procedures
For example for (i in c(135)) print(i) will assign each of 1 3 5 into the variable i and
after each assignment the procedures in the file-block are executed Thus in this case
number 1 is displayed in the first iteration after the assignment 3 is displayed in the
second iteration after the assignment and finally 5 is displayed in the third iteration after
the assignment The following example makes a vector of set of squared values of 1 to 59
x lt- NULL
for (i in 15)
x lt- append(x i2)
9 Actually using for-statement is unnecessary here Just do x lt- (15)2
25
x lt- NULL assigns an empty vector to x NULL represents an empty vector
In the for-statement each value of 1 to 5 is assigned to i and after the assignment the
procedure in the for-block is executed
In the procedure in the for-block the squared value of i (represented as i2) is
concatenated to the vector x The function append(x i) concatenates i to vector x10
Exercise 13-3 Rewrite procedure in 12-2 using for-statement
14 Other useful functions
Here some of the frequently used R functions are introduced briefly
141 How to use
help(function_name) will display how to use function_name
142 variables and attributes
ls() or objects() will display currently defined variables
class(variable_name) or mode(variable_name) will give you the type of the variable (object
For example whether it is numerical variable character list or matrix)
attributes(variable_name) will return attributes defined for the given variable
variabl_name
143 Family of apply functions
ldquosapplyrdquo function will return a vector containing a set of output values from a given
function after using each value in the given vector as a single input to that given function
each by each
func1_sub lt- function(elm)
a function expecting a single number as a parameter
if(-1 lt= elm amp elm lt= 1) return (1) else return (0)
10 The same procedure can be done with x lt- c(x i2) c can be used to concatenate given
vectors
26
func1 lt- function(x) a function with a vector parameter x
return(sapply(x func1_sub))
144 Making figures
rdquocurverdquo function generates a graph for a given function See help for details
Example
curve(dnorm -7 +7) Draws normal (Gaussian) distribution
curve(cos(x)+cos(2x) -2pi 2pi 1000) 1000 is number of points
curve(func1 -3 3) The function defined in 143 Family of apply functions
27
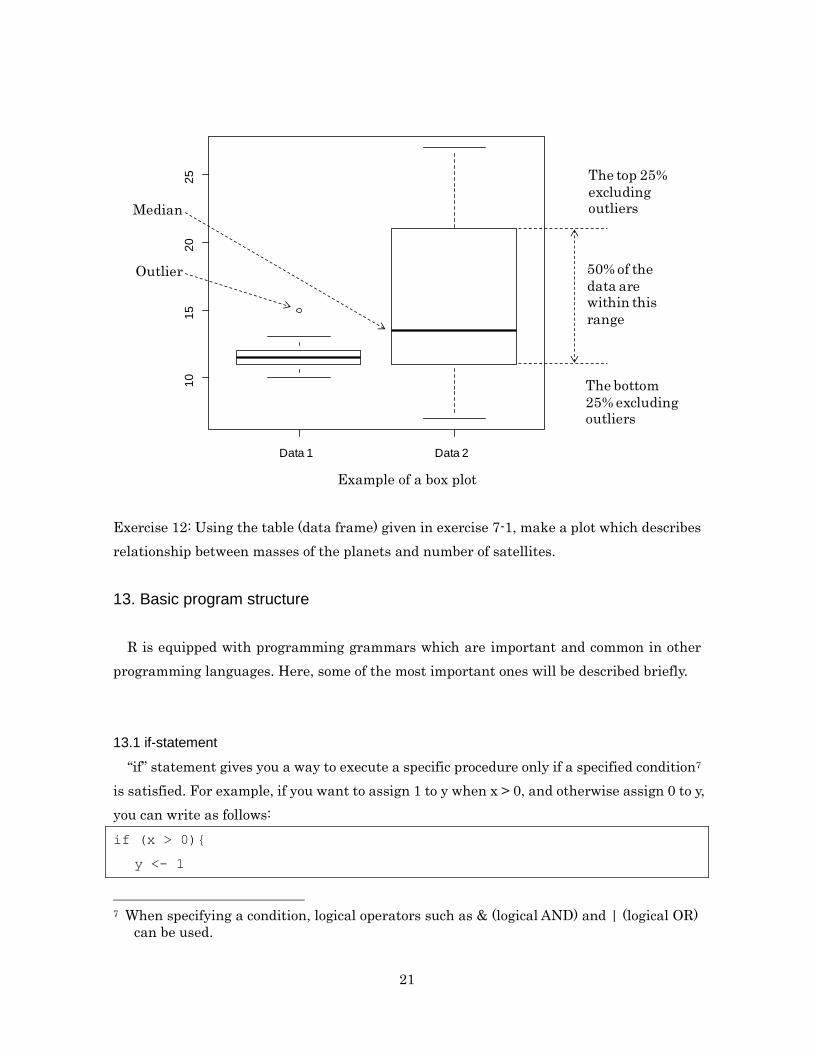
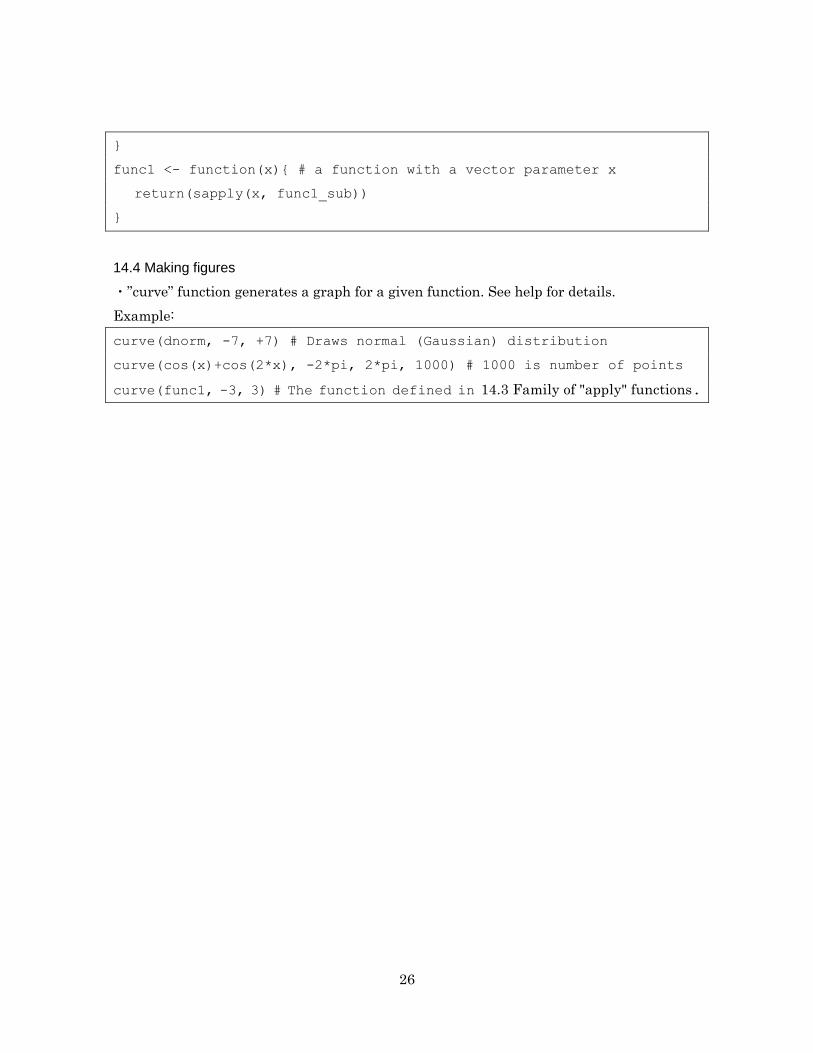

27
![初心者用 - Trey Ideker Laboratorychianti.ucsd.edu/~rsaito/ENTRY1/WEB_RS3/PDF/JPN/Texts/R...7 [1] 2.5 3.5 4.5 行列は2 次元の数値の羅列ですが、R ではarray(ベクトル、各次元の要素の個数)を使っ](https://img.pdfslide.net/doc/110x75/5aae65dd7f8b9a07498c0a66/-trey-ideker-rsaitoentry1webrs3pdfjpntextsr7-1-25-35.jpg)