Embed Size (px)
Citation preview

www.optasense.com © 2021 OptaSense Ltd.
OptaSense DxS BrowserQuick Start Guide for V2.XOPTA/DXS/1070 – Issue 1
2 │ www.optasense.com │ OPTA/DXS/1070 – Issue 1
Introduction
This is the Quick Start Guide for version 2.X of the DxSBrowser. The DxS Browser is a software package written by OptaSense which is used to enable the viewing and processing of DAS and DTS data. Additionally, it also provides a range of utilities to help petroleum engineers and analysts to process and display data.
The Browser is intended primarily for the following applications:
• Flow Monitoring;
• Hydraulic Fracture Monitoring;
• Cross Well Monitoring; and
• A number of tools to convert data between various formats.
This Quick Start guide is intended to introduce an operator to the key steps required to start a basic project and view an FFT plot
3 │ www.optasense.com │ OPTA/DXS/1070 – Issue 1
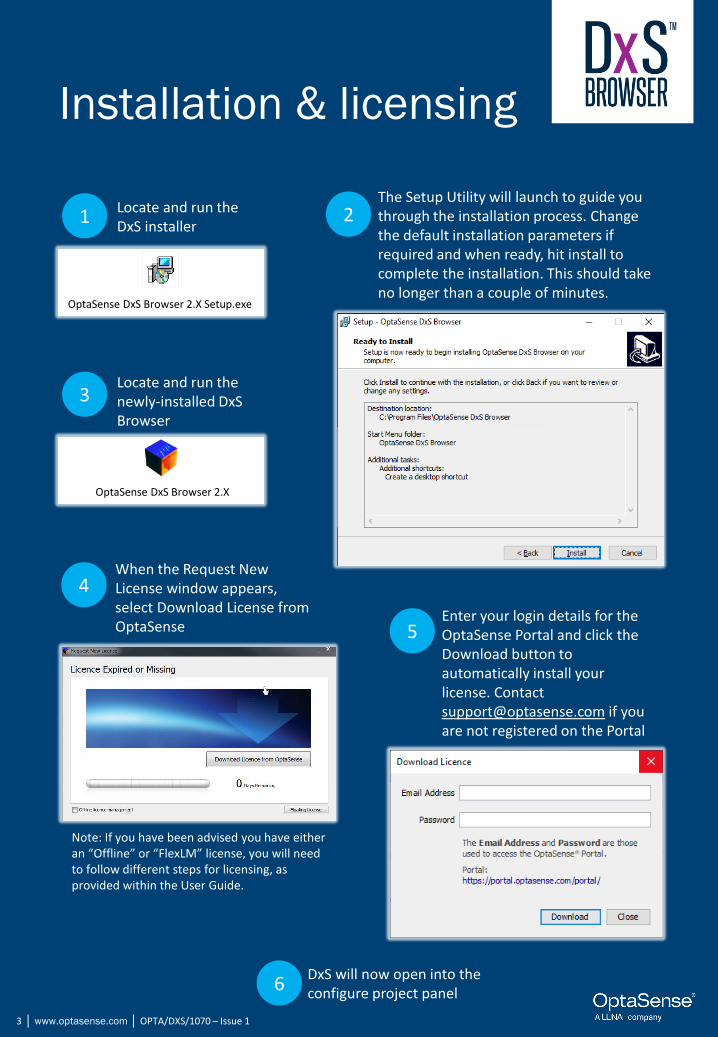
Installation & licensing
Locate and run the DxS installer
1 2The Setup Utility will launch to guide you through the installation process. Change the default installation parameters if required and when ready, hit install to complete the installation. This should take no longer than a couple of minutes.
When the Request New License window appears, select Download License from OptaSense
Locate and run the newly-installed DxSBrowser
3
4
Enter your login details for the OptaSense Portal and click the Download button to automatically install your license. Contact [email protected] if you are not registered on the Portal
5
Note: If you have been advised you have either an “Offline” or “FlexLM” license, you will need to follow different steps for licensing, as provided within the User Guide.
6DxS will now open into the configure project panel
OptaSense DxS Browser 2.X
OptaSense DxS Browser 2.X Setup.exe
4 │ www.optasense.com │ OPTA/DXS/1070 – Issue 1
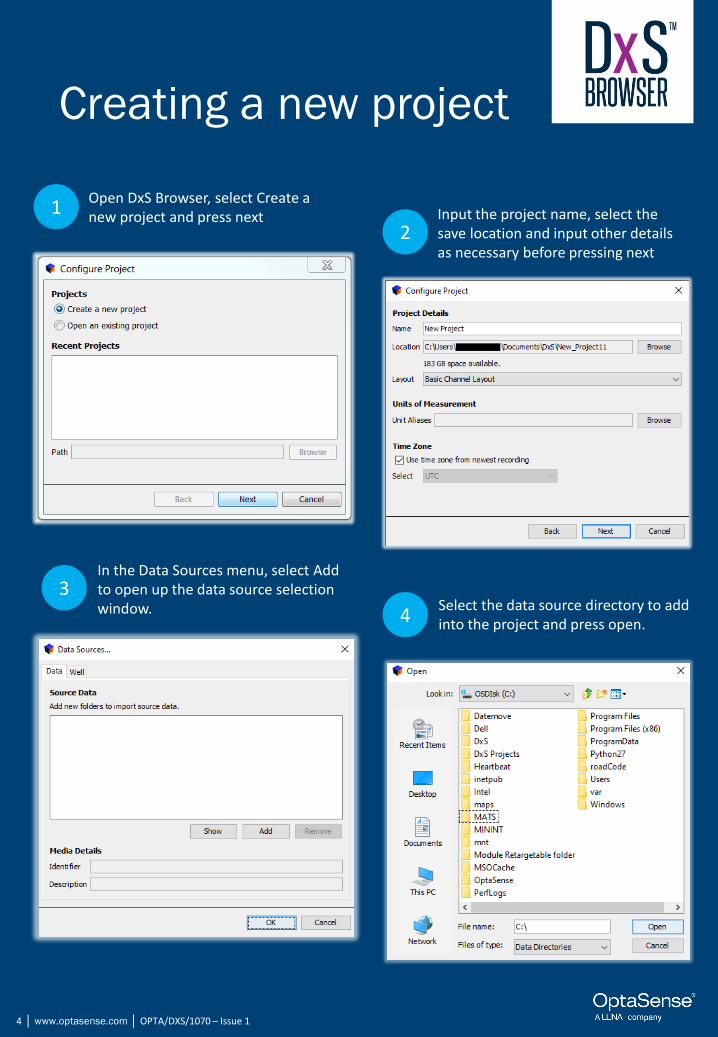
Creating a new project
Open DxS Browser, select Create a new project and press next
1 Input the project name, select the save location and input other details as necessary before pressing next
2
3In the Data Sources menu, select Add to open up the data source selection window. 4
Select the data source directory to add into the project and press open.
5 │ www.optasense.com │ OPTA/DXS/1070 – Issue 1
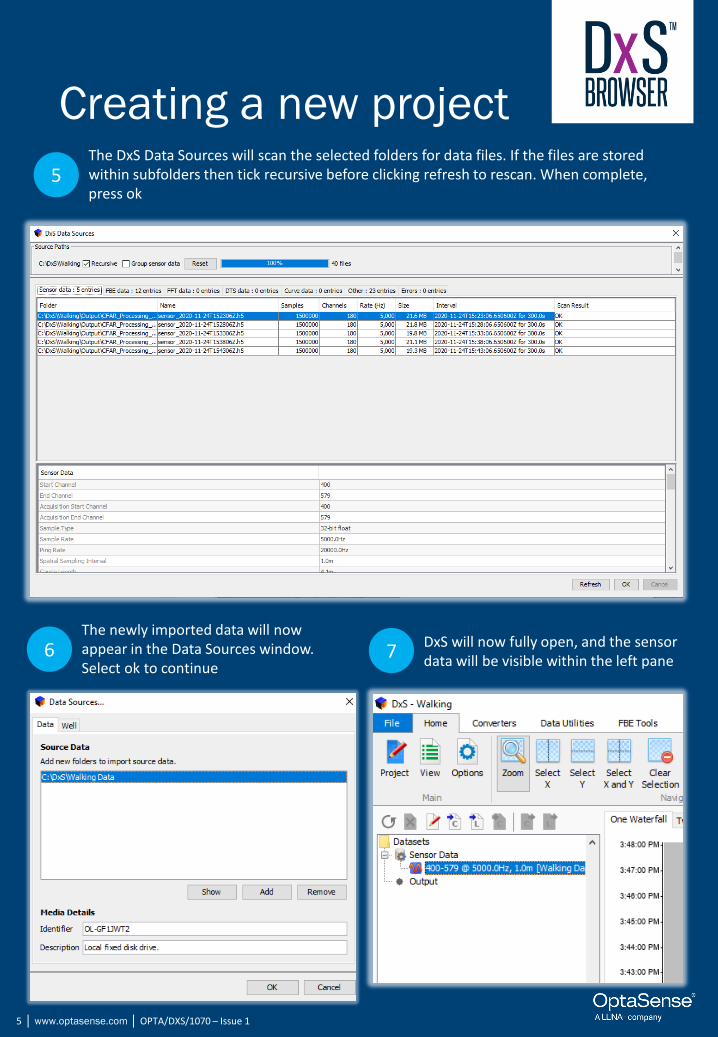
Creating a new projectThe DxS Data Sources will scan the selected folders for data files. If the files are stored within subfolders then tick recursive before clicking refresh to rescan. When complete, press ok
5
The newly imported data will now appear in the Data Sources window. Select ok to continue
6 DxS will now fully open, and the sensor data will be visible within the left pane
7
6 │ www.optasense.com │ OPTA/DXS/1070 – Issue 1
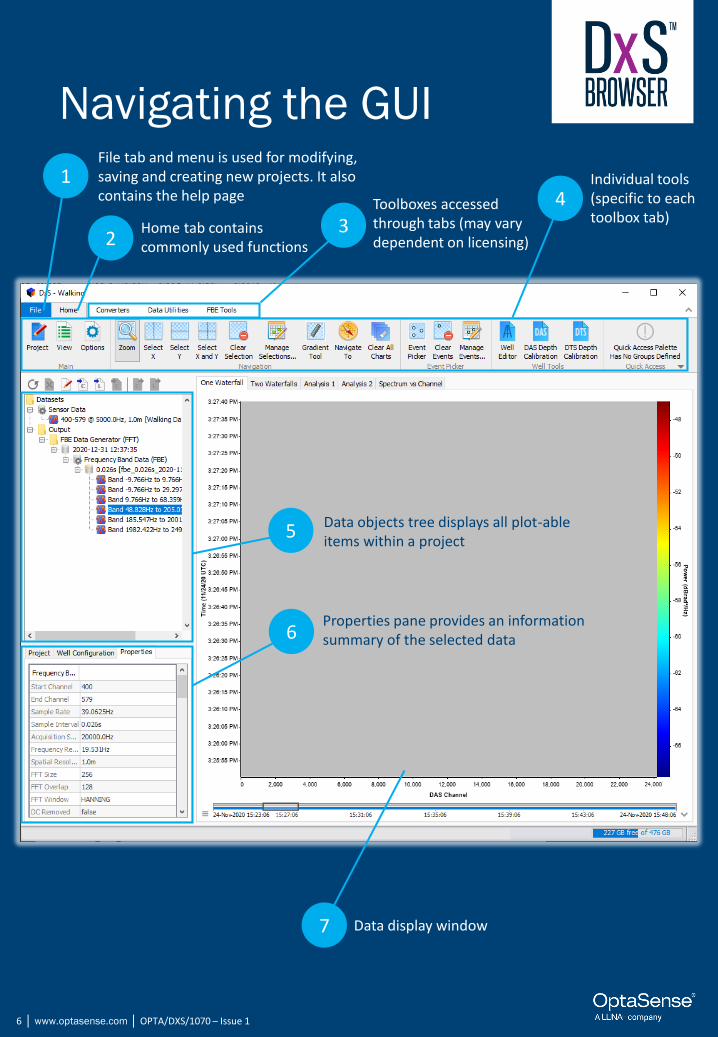
Navigating the GUIFile tab and menu is used for modifying, saving and creating new projects. It also contains the help page
1
Home tab contains commonly used functions2
Toolboxes accessed through tabs (may vary dependent on licensing)
3
Individual tools (specific to each toolbox tab)
4
6
Data objects tree displays all plot-able items within a project
5
Properties pane provides an information summary of the selected data
Data display window7
7 │ www.optasense.com │ OPTA/DXS/1070 – Issue 1
Creating an FFT
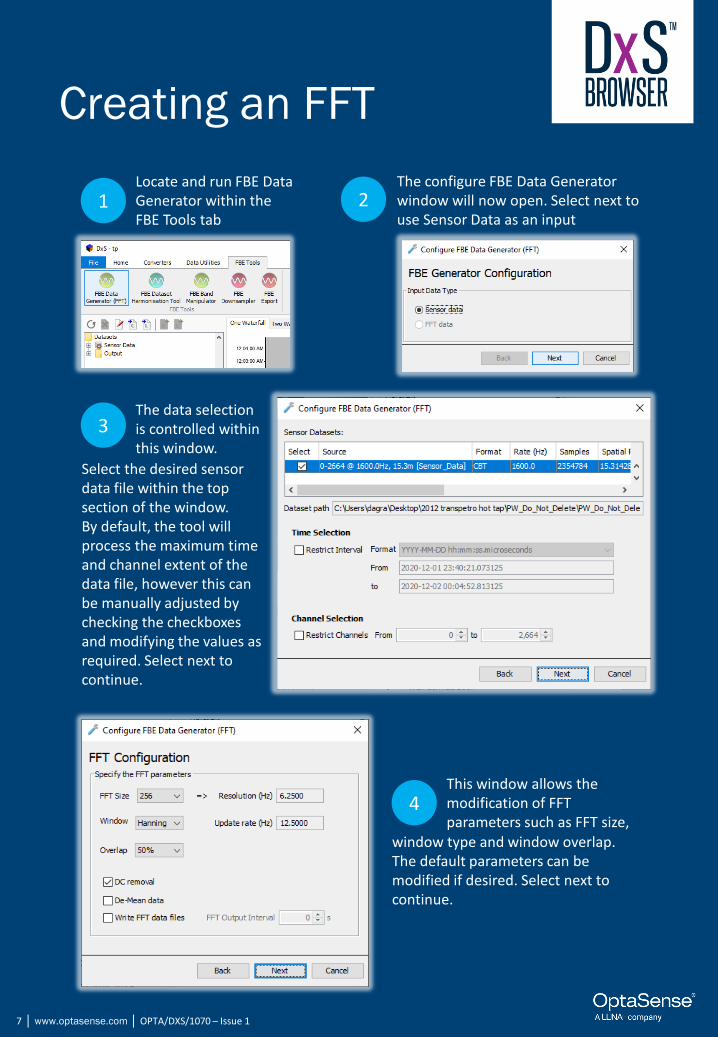
Locate and run FBE Data Generator within the FBE Tools tab
1 2The configure FBE Data Generator window will now open. Select next to use Sensor Data as an input
3The data selection is controlled within this window.
Select the desired sensor data file within the top section of the window.By default, the tool will process the maximum time and channel extent of the data file, however this can be manually adjusted by checking the checkboxes and modifying the values as required. Select next to continue.
4This window allows the modification of FFT parameters such as FFT size,
window type and window overlap. The default parameters can be modified if desired. Select next to continue.
8 │ www.optasense.com │ OPTA/DXS/1070 – Issue 1
Creating an FFT
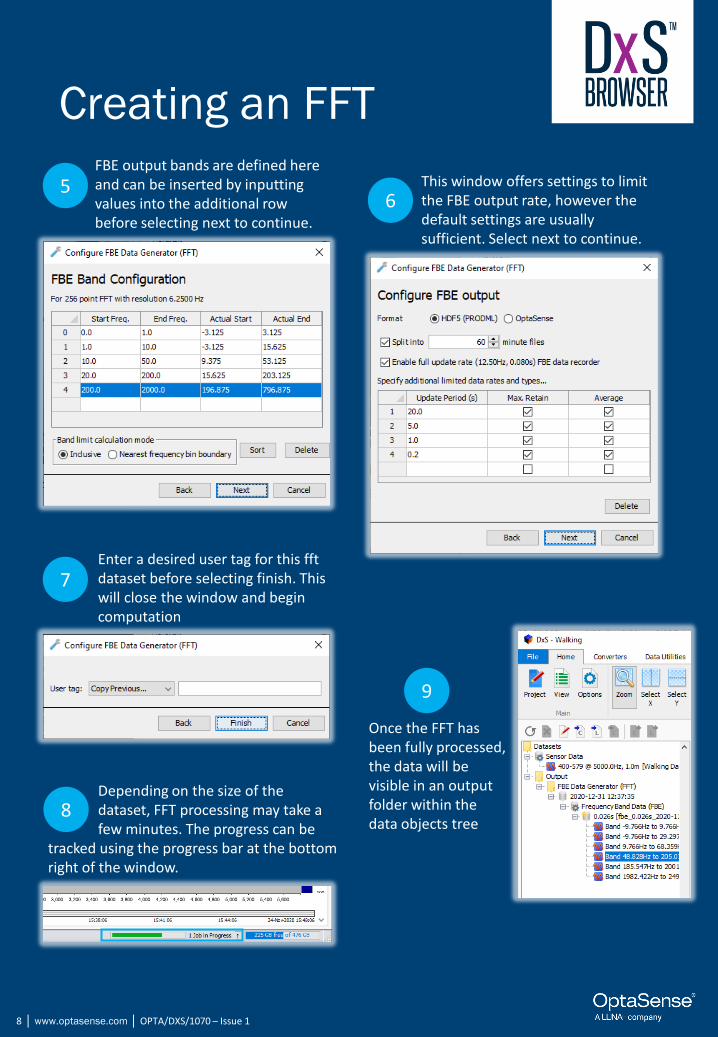
56
7Enter a desired user tag for this fftdataset before selecting finish. This will close the window and begin computation
8Depending on the size of the dataset, FFT processing may take a few minutes. The progress can be
tracked using the progress bar at the bottom right of the window.
9
Once the FFT has been fully processed, the data will be visible in an output folder within the data objects tree
This window offers settings to limit the FBE output rate, however the default settings are usually sufficient. Select next to continue.
FBE output bands are defined here and can be inserted by inputting values into the additional row before selecting next to continue.
9 │ www.optasense.com │ OPTA/DXS/1070 – Issue 1
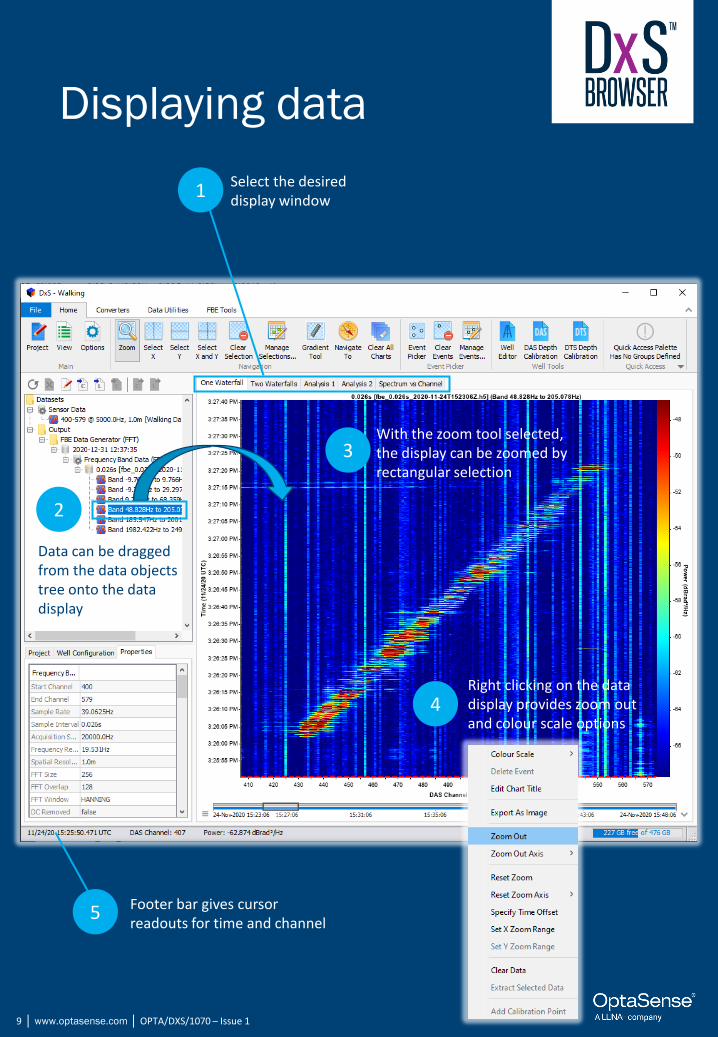
Displaying data
Data can be dragged from the data objects tree onto the data display
2
With the zoom tool selected, the display can be zoomed by rectangular selection
3
Select the desired display window
1
5 Footer bar gives cursor readouts for time and channel
4Right clicking on the data display provides zoom out and colour scale options
10 │ www.optasense.com │ OPTA/DXS/1070 – Issue 1
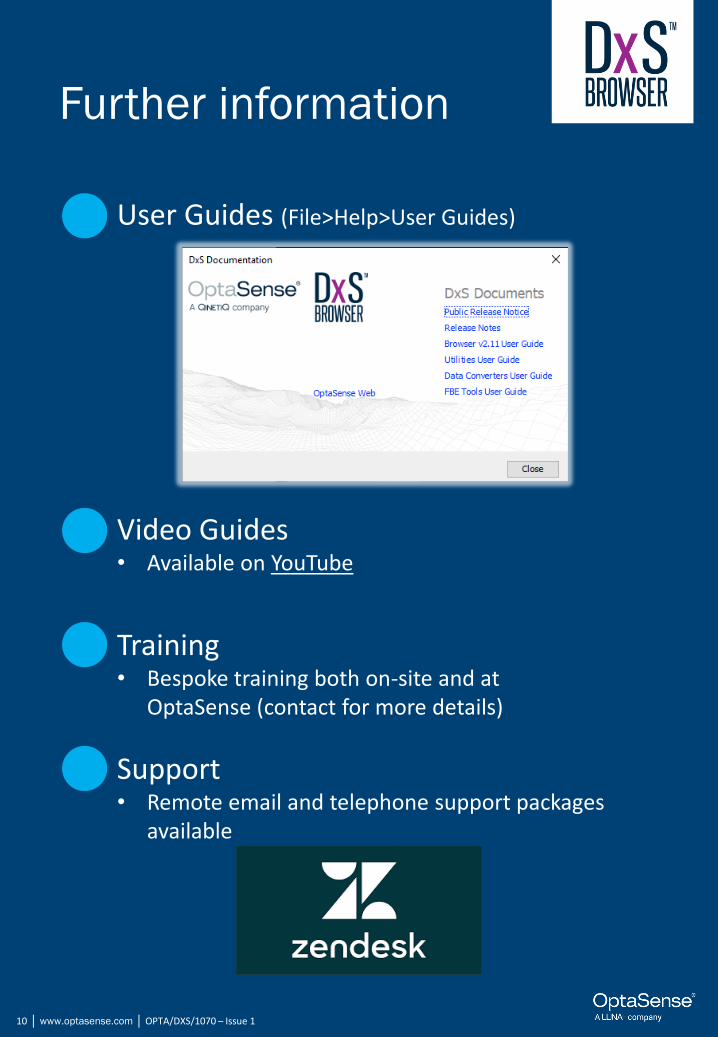
Further information
User Guides (File>Help>User Guides)
Training• Bespoke training both on-site and at
OptaSense (contact for more details)
Support• Remote email and telephone support packages
available
Video Guides• Available on YouTube


![SimEMR V2 Quick Start Guide€¦ · Quick Start Guide R018103104 7 Select [ADMISSIONS]. Enter -1H for in the Admission Date box. Fill out all other information and select [SAVE] at](https://img.pdfslide.net/doc/110x75/5fc1554e8e57503b59573a42/simemr-v2-quick-start-guide-quick-start-guide-r018103104-7-select-admissions.jpg)