Embed Size (px)
Citation preview


Quick, what comes to your mind when you think of Kodak?


S u re. Kodak has helped the world create a lot of memories.

But there ’s something else we’ve helped cre a t e .

H u n d reds of billions of dollars of value in today’s net economy.

And there ’s a name for how it was done: infoimaging.

12
Infoimaging. It’s how a garm e n tmaker in Iceland sells sweaters…and how real estate agents inyour neighborhood sell homes.I t ’s how your kids buy CDs…andhow Detroit buys manufacturingc o m p o n e n t s .

H e a t h e r
J a m e s
L a rry
Paul
James Flewellyn kicked the tires of dozens of new cars before ever stepping foot into a dealer’s showro o m . L a rry Houston found the perfect re t i rement home in Florida while sitting in his den in Maryland. Heather Obert ’s home furnishings studio shipsworldwide to customers who see her creations on the We b . Paul Mart i n selects part ssuppliers for his car customization business based upon the high resolution pro d u c tphotos they e-mail to him.

14
Infoimaging. It’s how Motorola turn scell phones into web browsers. I t ’s how your doctor gets diagnosticdata in seconds…and how you willp re s e rve your most important documents for centuries.

M i k e
Elizabeth
J o h n
J e n n i f e r
Jennifer Laperle of Paris, France and Mike Goodman of Santa Barbara, California arehelping their classmates learn about the world through the digital photo diaries theys h a re on the Web. John Bern a rd ’s radiologist in Seattle got a second opinion withinminutes from a team of specialists at a teaching hospital in Boston. Elizabeth Dryer p ro-vides better service to her auto insurance policyholders by capturing pictures of the car,along with diagrams and witness statements on her Palm handheld org a n i z e r.

16
Infoimaging is the convergence o f I n f o rmation Technology andImaging Science. I t ’s already a$225 billion industry. And it’s g rowing daily.

S a m a n t h a
F r a n k
D o l o re s
Frank Lee buys toys on the Web for his six children, twenty-two grandchildren and fort y -nine gre a t - g r a n d c h i l d ren. D o l o res Eason s h a red her wedding pictures over the Intern e twith everyone who couldn’t attend the ceremony held in Ta h i t i . Samantha Grace is writ-ing a re s e a rch study on Pacific coral reefs with the help of satellite images that pinpointecosystems that have suff e red damage.

18
D e v i c e s
Cameras / ScannersPrinters / X-ray laser outputsystems / Image-enabledinformation devices / Flatpanel displays / Healthimaging equipment /Sensors
I n f r a s t ru c t u re
Online imaging and photofinishing networks/Imaging software / Imagingprotocols and transmissions
Services and Media
Photo printing, storage andsharing / Document preser-vation / Motion picture digi -tal imaging services andvisual effects / Film andpaper / Inkjet paper and pig-ments / Writable CDs andCD-Roms
I n f o i m a g i n g @ K o d a k
S e rvices and Media
I n f r a s t ru c t u re
D e v i c e sI n f oi m a gi n g

Last year, the number of pictures on the Web grew by an aston-ishing 500%. To d a y, consumers are converting nearly 30 millionfilm images a month into digital files. In one industry alone — t h emedical pro f e s s i on — m o re than $20 billion a year is spent onimaging products and serv i c e s .
C l e a r l y, something important is happening here. Suddenly,sharing ideas and information with images is as easy — no, e a s i er — than putting the same thoughts into words. And sud-d e n l y, many of the world’s leading technology companies —including Cisco, Intel, and Hewlett Packard — a re discoveringnew ways to reap profits from pixels.
A $225 billion industry has emerged, creating new imagingdevices, offering imaging services and media, and constru c t i n gthe digital infrastru c t u re that ties it all together.
Now this new industry has a name: infoimaging. Kodak has builtthe foundations that make infoimaging possible. With nearly1,000 new patents in imaging technology a year, we are the catalyst for value creation for virtually every company who p roduces infoimaging products and serv i c e s .
75% of all images currently on the Web are touched by Kodakt e c h n o l o g y. Kodak leads the world in film-to-digital image scan-ning capability and capacity. Kodak has the number one systemin the world for online image distribution.
But Kodak is doing more than supplying the technologies thatdrive this new category. We are also introducing a constants t ream of products and services that carry the Kodak brand intothe three key infoimaging sectors — c reating opportunities fors y n e rgy and linkage across the entire space.

20
Devices
Kodak PalmPix The hot, must-have accessory for the Palm hand-held org a n i z e r. Unlike other digital cameras, the PalmPix camerahas no moving parts and does not re q u i re a memory card. It turn sany Palm organizer into a digital camera with 2X digital zoom.N o w, what-you-see is what-you-can-store on your Palm, for business or fun. With the ultra-lightweight (less than 2 ounces)PalmPix, you can capture and store up to 1,000 color images, ordownload them to your personal computer so you can save,manipulate, and e-mail standard JPEG or BMP files.
OLED It stands for Organic Light-Emitting Diode. And this Kodakinnovation may be the coolest full-color, full-motion display tech-nology ever invented: a viewing panel that’s thin as a dime, with asharp, bright picture viewable from virtually any angle, even in fulldaylight. The winner of Industry We e k ’s Technology of the Ye a ra w a rd, OLED is now used in select Motorola cellular phones andin Pioneer and Alpine car audio systems. However, OLED maysoon be the display of choice for laptop computers and otherdevices, growing to an estimated $3 billion industry by 2005.

Kodak mc3 The first all-in-one compact video re c o rd e r, Intern e tmusic player and digital still camera — the ultimate personal digitale n t e rtainment device. Designed with the “Y Generation” in mind,the Kodak mc3 lets you download and listen to your favorite MP3s,snap up to 600 still pictures or shoot your own movies. Better yet,you can edit everything you capture into personalized video clips ormusic videos and e-mail them to your friends.
Advantix Preview Camera We combined the best-liked feature of digital cameras — instant previews of each shot — with the easiest-to-use film system ever developed. With the new KodakAdvantix Preview Camera, you see the picture the moment youtake it, on a color LCD screen. Then, just select how many printsyou’d like — f rom zero to nine — and a code on the film will conveyyour instructions to the photo pro c e s s o r. No more prints you don’twant, and no more trips back to the store or mailbox for re p r i n t s .

22
Services and Media
Digital Film Mastering Technology Kodak technology lets filmmak-ers convert motion pictures into high quality digital format, so theycan use the power of the computer to adjust the color, contrast,and lighting of each scene, as well as create special effects. TheCoen Brothers’ “O Bro t h e r, Where Art Thou?” is the first majormotion picture to use this process throughout. Working withCinesite (a Kodak subsidiary), the filmmakers gave the entiremovie a hand-painted look in keeping with the story ’s era. Theresulting Kodak Digital Intermediate enables film prints as well ascontent for digital cinema, high definition television and other futurea p p l i c a t i o ns to be made from a single digital source.
Document Pre s e rvation Most of today’s digital images and docu-ments will someday become unreadable, because of the finite lifeexpectancy of discs and tapes, and because they are created withs o f t w a re or hard w a re that will one day become outmoded.F o rt u n a t e l y, we have developed a simple, aff o rdable re m e d y :Kodak Digital Pre s e rvation Solutions. You safely and secure l yupload your documents to Kodak, where they will be re c o rded in ahighly compressed, but human readable, film-based medium. Ofcourse, you will have instant, secure access to your documents —in digital or hard copy form — and so will future generations.

Medical Radiography Systems With last year’s acquisition ofLumisys and its computed radiography desktop systems, Kodak’sp o rtfolio of digital and computed radiography products re p re s e n t sthe broadest set of choices in the medical imaging market. We alsonow can offer a combined PACS (Picture Archiving andCommunications Systems) and RIS (Radiology/Inform a t i o nSystem), meaning complete patient histories can be stored anddistributed throughout a hospital in tandem with the full set of thep a t i e n t ’s medical images. And because diagnosticians still wanth a rd copy prints, we offer the market-leading Kodak Dry View fam-ily of dry laser imagers, for stand-alone use or as components ofcomplete imaging systems.
Kodak Earth Imaging Products Kodak is building the world’s mostc o m p rehensive online earth imaging store, with high re s o l u t i o ncolor aerial images of 95 North American urban areas, plus imagesof Australia and We s t e rn Europe, available this year. For numero u sindustries, including construction, engineering, telecommunica-tions, utilities and real estate, Kodak Earth Imaging Pro d u c ts — a tw w w. k o d a k . c o m / g o / e a rt h i m a g i ng — will be the fastest, easiestand most economical way to obtain high resolution aerial imagery.I n d u s t ry analysts predict the earth imaging information market willexceed $1.6 billion in the next three years, and Kodak plans to leadthe category.

24
Print@Kodak service What do the Internet photo sharing websitesSnapfish.com, PhotoPoint.com and MyFamily.com have in com-mon? They all offer photofinishing from a brand their customers trust, Print@Kodak, our branded online print fulfillments e rvice. Naturally, you can also find the Print@Kodak icon onK o d a k ’s own popular website, Kodak.com. And as the onlinephoto sharing industry grows, Kodak will be the backbone of thebusiness, with the technologies and the production capacity toc reate 40 million high-quality prints a day.
Kodak Professional Wo r k f l o w Kodak is creating an industry stan-d a rd that will offer an online digital alternative to today’s cumber-some method of manually shipping hard copy “proofs” back andf o rth among professional photo studios, labs and customers,a c c o m p anied by written instructions on photo selection andq u a n t i t y, c ropping, etc. With the Kodak workflow link system,images can easily be transmitted and viewed online — with elec-t ronically embedded instructions for each ord e r. For example, wed-ding portrait pro o fs — which photographers now commonly shareonly with the bride and groom and their families — can now bee-mailed to all of the wedding guests, giving everyone an oppor-tunity to order prints.
Services and Media

Infrastructure
Kodak PhotoNet Online With the world’s leading online photosharing network, we’ve made getting your pictures online as easyas “checking the box” on the envelope when you drop off your filmfor processing. Since 1998, Kodak has scanned, stored and deliv-e red millions of photos as downloaded files, prints, Kodak PictureCDs and Kodak Picture Discs. Kodak PhotoNet online is also theengine behind America Online’s You’ve Got Pictures, displayed onthe welcome screen seen by more than 27 million AOL members.
Q u a l e x K o d a k ’s Qualex subsidiary is the world’s largest photop ro c e s s o r, with more than 50 wholesale photofinishing labs andover one billion dollars in annual revenues. Qualex leases on-siteone-hour processing equipment to more than 10,000 retail locations including Wa l g reens, Ta rget and CVS. By the summer of2000, Qualex labs and on-site locations were printing up to one million pictures per day! Qualex does all scanning and pro-cessing for Kodak PhotoNet online and America Online’s Yo u ’ v eGot Picture s. Last year, consumer demand for Qualex digital serv-ices grew 70%, with more than 260 million images scanned.

2 7 Financial Highlights
2 8 Letter to Shareholders
3 1 M a n a g e m e n t ’s Discussion and Analysis
3 2 Detailed Results of Operations
4 1 M a n a g e m e n t ’s Responsibility
4 1 R e p o rt of Independent Accountants
4 2 Consolidated Statement of Earnings
4 3 Consolidated Statement of Financial Position
4 4 Consolidated Statement of Share h o l d e r ’s Equity
4 5 Consolidated Statement of Cash Flows
4 6 Notes to Financial Statements
6 4 S u m m a ry of Operating Data
6 5 2000 Kodak Health, Safety, and Enviro n m e n t
6 6 2000 Global Diversity
6 7 Corporate Dire c t o ry
6 8 Corporate Inform a t i o n

(Dollar amounts and shares in millions, except per share data) 2 0 0 0( 1 ) 1 9 9 9( 2 )
Stock price per share at year end $ 3 9 . 3 8 $ 6 6 . 2 5
S a l e s $ 1 3 , 9 9 4 $ 1 4 , 0 8 9
E a rnings from operations $ 2 , 2 1 4 $ 1 , 9 9 0
Net earn i n g s $ 1 , 4 0 7 $ 1 , 3 9 2
Basic earnings per share $ 4 . 6 2 $ 4 . 3 8
Diluted earnings per share $ 4 . 5 9 $ 4 . 3 3
Cash dividends declare d $ 5 3 3 $ 5 6 0
—per common share $ 1 . 7 6 $ 1 . 7 6
Average number of common shares outstanding 3 0 4 . 9 3 1 8 . 0
S h a reholders at year end 1 1 3 , 3 0 8 1 3 1 , 7 1 9
Total shareholders’ equity $ 3 , 4 2 8 $ 3 , 9 1 2
Additions to pro p e rt i e s $ 9 4 5 $ 1 , 1 2 7
D e p re c i a t i o n $ 7 3 8 $ 7 7 3
Wages, salaries and employee benefits $ 3 , 7 2 6 $ 3 , 9 6 2
Employees at year end
—in the U.S. 4 3 , 2 0 0 4 3 , 3 0 0
— w o r l d w i d e 7 8 , 4 0 0 8 0 , 6 5 0
( 1 )Results for the year included charges related to the sale and exit of a manufacturing facility of $50 million, which reduced net earnings by $33 million. Excluding this
item, net earnings were $1,440 million. Basic and diluted earnings per share were $4.73 and $4.70, re s p e c t i v e l y.( 2 ) Results for the year included $350 million of re s t ructuring charges, which reduced net earnings by $231 million, and an additional $11 million of charges related to this re s t ru c-
turing program, which reduced net earnings by $7 million; $103 million of charges associated with business exits, which reduced net earnings by $68 million; a gain of $95 mil-lion on the sale of The Image Bank, which increased net earnings by $63 million; and a gain of $25 million on the sale of the Motion Analysis Systems Division, which incre a s e dnet earnings by $16 million. Excluding these items, net earnings were $1,619 million. Basic and diluted earnings per share were $5.09 and $5.03, re s p e c t i v e l y.
Financial Highlights

2000 was, in re t rospect, a year that kept the investment analysts
and economic pundits working overtime.
Last year, the U.S. economy was red hot, and the so-called
“new economy” was even hotter. To d a y, as you scan the business
headlines, the key word is “slump”…consumer confidence is in a
blue funk…and the NASDAQ couldn’t get much flatter.
The question for investors now becomes, “Where do you
invest your money after the bubble bursts?”
Let me suggest three possible answers. First, it makes
sense, now more than ever, to invest in strong brands. Because
when times are tighter, consumers are less inclined to risk their
money on a new or unknown name.
Second, invest in products and services that offer high sat-
isfaction at a low price. In other words, value-for-the-money is king.
T h i rd, it might be wise to seek companies that are adept at
generating cash. Those are the firms that will continue to invest
in themselves and prepare for growth, regardless of the economy.
And that, as you might have already surmised, brings us
straight to Kodak. However, if a great brand and a great balance
sheet are not sufficiently compelling, there is something else
investors should consider: this is a very smart time to be in the
p i c t u re business.
P i c t u re-taking is now at an all-time high worldwide. Amateur
photographers took more than 80 billion snapshots last year, a
new re c o rd. They ord e red more than 100 billion prints, another
milestone for the industry.
In the health imaging category (our second largest busi-
ness), more re c o rds were shattered. Healthcare pro f e s s i o n a l s
last year ord e red more than 1.5 billion Kodak radiological images.
For the past century, our business has been all about
making it simpler for people to capture better images, first with
film, and more re c e n t l y, with digital technology. And, as we
continue to make film and digital photography more accessible,
p i c t u re-taking will continue to gro w.
To d a y, though, image capture is only half the story. The re a l
g rowth in our business will accrue to those who give people new
and better ways to u s e their pictures.
Take, for example, the world of opportunity that has opened
on the Internet. Last year, more than $45 billion worth of pro d u c t s
and services were sold on the Web — with the help of more than
one billion online images. And 75% of those images are touched
by Kodak technology.
The explosion of technologies that drive picture usage is
fueling a whole new industry. Specifically, the fusion of inform a-
tion technology and image science has given rise to i n f o i m a g i n g .
The dozen new Kodak products and services arrayed
a c ross the preceding pages offer just a small glimpse into how
To Our Share h o l d e r s
Charles S. Brown and Patricia A. Bitnar (left and center)
received the 2000 Kodak “CEO Diversity Aw a rd” for exemplifying
s t rong leadership in fostering a work environment that re s p e c t s
and values all individuals.
In 2000, May Snowden (right) was appointed Kodak’s Chief
Diversity Off i c e r, a newly created position for the company. For the
complete 2000 Diversity Report, see page 66.

infoimaging is redefining our business. We are playing a leading
role in the use of images on the Web…in digitizing still and
motion picture film …in analyzing and extracting information fro m
digital pictures…in wireless and broadband transmission of
i m a g es… in storage and pre s e rv a t i on… and in dozens of other
technologies that will shape the industry for years to come.
The perf o rmance of Kodak’s principal business units in
2000 reflects this new focus.
K o d a k ’s Consumer Imaging business is entering the infoimaging
era with a dual mission: better pictures and better sharing.
For many consumers, better pictures begin with better
f i lm — such as the new, improved Kodak Max 400 film, which
delivers significantly better results for up to 25% of picture s
taken, when compared to 100 and 200 speed films. In the U.S.,
p remium film products such as Kodak Max and Advantix films
comprise more than 60% of film sales.
Consumer pictures can also be significantly improved by
the technologies Kodak has developed for digital photo pro-
cessing. In 2000, we introduced the Kodak I.Lab system, a high-
speed digital lab system for wholesale photofinishers that auto-
matically corrects the most common problems consumers have
with their pictures: poor exposure, dark shadows, graininess
and red eye. We’ve seen customer satisfaction rates jump sig-
nificantly among people who receive these digital prints.
As we move into the era of infoimaging, image capture
will become an ubiquitous, 24/7 activity. New devices like the
Kodak PalmPix camera, which turns your handheld org a n i z e r
into a digital camera, will help make more people “picture -
re a d y,” anytime, anywhere. And to further ensure no one misses
a potential picture-taking opport u n i t y, we are partnering with
Maytag Corporation to create a national network of high-tech
Kodak Max film vending machines that carry a fresh, refrigerated
supply of one-time-use cameras and film. Taking a cue from the
soft drink industry, we will be “putting the product where the
people are,” at leisure locations such as re s o rts, amusement
parks and zoos. Each machine will feature wireless Intern e t - c o n-
nectivity for processing debit and charge card sales and
monitoring inventory.
Our Digital and Applied Imaging division continues to find new
ways to make digital photography easy, seamless and more
accessible for people.
And there ’s no doubt about it, digital photography has
caught fire with consumers. Last year, Kodak’s sales of digital
cameras leaped 80%. In addition to marketing our own branded
p roducts, Kodak is a major supplier of CCD and CMOS sens-
ing devices — the heart of a digital camera — to other manufac-
t u rers. In fact, 25% of all the high-resolution CCDs in use today
a re from Kodak.
Last year, we introduced the Kodak DC4800 digital camera
to rave reviews. The camera combines supercrisp 3.1 megapixel
resolution with ease of use and full creative control for the
serious photographer.
Our inkjet paper and media business saw a 31% incre a s e
in revenues in 2000, with quality products such as the new
Kodak Ultima Picture Papers for prints that retain their original
brilliance for 20–30 years. Kodak was once again cited by a
recent Lyra Research study as the inkjet photo paper brand
consumers most widely pre f e r.
In our Health Imaging business, 45 new products were launched
in 2000, providing solutions in every link of the medical imaging
and information chain.
A p p roximately 50% of this division’s sales now come from
digital products, such as Kodak’s computed radiography and
digital radiography systems. In 2000, a milestone was achieved
with the sale of our 10,000th Kodak DryView Laser Imager,
with a nearly 70% increase in placements for the year. Looking
ahead, we just signed an agreement with Novation, the nation’s
l a rgest healthcare purchasing organization, to provide an esti-
mated $1.4 billion in laser imagers and medical film pro d u c t s
over the next five years.
In another exciting development, our Health Imaging divi-
sion is partnering with Intel and Cedars-Sinai Medical Center to
pilot an Application Service Provider model for the medical
imaging business. Cedars-Sinai will transmit images — c a p t u re d
and managed via Kodak digital systems — to an Intel Online
S e rvices data center. The images will be available to physicians
via the Internet and billed on a fee-per-use basis.
For our Kodak Professional division, the past two years have
been marked by numerous business challenges and accelerating
technology transition.
H o w e v e r, with a newly organized unit pursuing new gro w t h
a re as — and last year’s successful re s t ructuring of the Kodak
P o l y c h rome Graphics joint venture— we believe the business
will regain momentum as the economy picks up.
Kodak Professional introduced several bre a k t h rough pro d-
ucts in 2000. The NexPress 2100 digital color printer, developed
in a joint venture with Heidelberg, can serve as an extension of
a company’s web site or customer call center, creating individu-
ally customized marketing materials. Names, pictures, text and
other variables can be changed “on the fly” as customer

requests are received online.
Kodak Pro f e s s i o n a l ’s bid for leadership in new technologies
is perhaps best exemplified by the introduction of the DCS Pro
Back digital camera, incorporating the world’s first 16-megapixel
s e n s o r. This re p resented a truly prestigious achievement for
Kodak, as no one else has ever introduced a digital camera that
can deliver even half the image resolution of this device.
As the entertainment industry moves towards an incre a s i n g l y
digital future, Entertainment Imaging is successfully driving film,
hybrid, and digital strategies to provide leadership in
the transition.
In 2000, a healthy worldwide box office contributed to
re c o rd-setting print film sales and very strong demand for color
negatives. And, once again, all Academy Aw a rd - n o m i n a t e d
movies in Best Picture, Best Cinematography, and virtually all
other major categories were produced on Kodak motion
p i c t u re film.
Cinesite (Entertainment Imaging’s digital services unit) pro-
vided scanning, re c o rding, and special effects for a re c o rd num-
ber of high-profile movies. Cinesite also created the first end-to-
end Kodak Digital Intermediate of a major motion picture (“O
B ro t h e r, Where Art Thou?”), introducing an innovative digital
p rocess that extends the creativity of filmmakers and provides a
high-quality bridge to digital display.
Work is now in pro g ress on a digital cinema infrastru c t u re ,
combining Kodak technology with components from others, to
c reate a system with on-screen picture quality that surpasses
anything else available.
K o d a k ’s Document Imaging division continues to be a stro n g
competitor in the business and government markets it serv e s .
For example, since entering the color scanning business in
1998, Kodak’s market share has rocketed from 10% to more
than 50% today. Our high-speed production scanning equip-
ment played a pivotal role in the recent U.S. census, pro c e s s i n g
m o re than 2 million forms per day. Kodak scanners are now
p a rticipating in more than 20 other census counts worldwide,
including the census for the United Kingdom, France, Australia
and Brazil.
Kodak Digital Pre s e rvation Service will be a major contrib-
utor to the division’s future growth. Industry experts estimate this
will be a $7 billion category by the year 2004. At present, the
United States Social Security Administration is pre s e rving its
critical digital and paper documents with Kodak systems, as are
many banks and insurance companies.
Our Commercial and Government Systems division turned in a
year of strong growth, while it collected more kudos for
advanced imaging technology.
The Kodak team that helped develop the Chandra X-ray
O b s e rv a t o ry was recognized for outstanding scientific achieve-
ment by the National Air & Space Museum. In its first year,
Chandra has already revealed the brilliant remains of a stellar
explosion in the Crab Nebula, a possible emission from the black
hole at the center of the Milky Way galaxy, and several other
a s t ronomic firsts.
Kodak people also provided the digital imaging technology
a b o a rd the IKONOS earth-orbiting satellite, a winner of last
y e a r ’s “Best of What’s New” award from Popular Science
magazine. Since January of last year, IKONOS has collected
200,000 images covering 24 million square miles of our planet—
i n f o rmation that is proving immensely valuable to enviro n m e n t a l
scientists.
As you can see, Kodak’s business these days goes far
beyond the familiar roll of film in the bright yellow box. Which
brings up another good question: What category do you assign
to a company that is creating technologies that will drive every-
thing from online commerce to interstellar exploration?
That new category is infoimaging. Because, in the digital
age, images drive value. And Kodak drives images.
Daniel A. Carp
C h a i rman, President and Chief Executive Off i c e r
Daniel A. Carp

2 0 0 0
The Company’s results for the year included the following:
P re-tax charges of approximately $50 million ($33 million
after tax) associated with the sale and exit of one of the Com-
p a n y ’s equipment manufacturing facilities. The costs for this
e ff o rt, which began in 1999, related to accelerated depre c i a t i o n
of assets still in use prior to the sale of the facility in the second
q u a rt e r, and costs for relocation of the operations. Additional re l o-
cation costs of approximately $10 million pre-tax, per quart e r, will
be re c o rded through the first half of 2001 in connection with
these actions.
Excluding the above, net earnings were $1,440 million. Basic
e a rnings per share were $4.73 and diluted earnings per share
w e re $4.70.
1 9 9 9
The Company’s results for the year included the following:
A pre-tax re s t ructuring charge of $350 million ($231 million
after tax) related to worldwide manufacturing and photofinishing
consolidation and reductions in selling, general and administra-
tive positions worldwide. See Note 11, Restructuring Pro g r a m s
and Cost Reduction. In addition, the Company incurred pre - t a x
c h a rges of $11 million ($7 million after tax) related to accelerated
d e p reciation of assets still in use during 1999 and sold in 2000,
in connection with the exit of one of the Company’s equipment
manufacturing facilities.
P re-tax charges totaling approximately $103 million ($68 mil-
lion after tax) associated with the exits of the Eastman Software
business ($51 million pre-tax) and Entertainment Imaging’s sticker
print kiosk product line ($32 million pre-tax) as well as the write-
o ff of the Company’s Calcomp investment ($20 million pre - t a x ) ,
which was determined to be unre c o v e r a b l e .
P re-tax gains of approximately $120 million ($79 million after
tax) related to the sale of The Image Bank ($95 million pre - t a x
gain) and the Motion Analysis Systems Division ($25 million pre -
tax gain). See Note 16, Sales of Assets and Divestiture s .
Excluding the above items, net earnings were $1,619 million.
Basic earnings per share were $5.09 and diluted earnings per
s h a re were $5.03.
1 9 9 8
The Company’s results for the year included the following:
The sales of its NanoSystems subsidiary and a portion of
the Company’s investment in Gretag Imaging Group (Gre t a g ) ,
resulting in pre-tax gains of $87 and $66 million ($57 and
$44 million after tax), re s p e c t i v e l y. See Note 16, Sales of Assets
and Divestiture s .
A pre-tax charge of $132 million ($87 million after tax) for
asset write-downs and employee severance in the Office Imaging
division due to volume reductions from Danka Business Systems
PLC (Danka). See Note 16, Sales of Assets and Divestiture s .
A pre-tax charge of $45 million ($30 million after tax), pri-
marily for in-process re s e a rch and development (R&D), associ-
ated with the acquisition of the medical imaging business of
Imation Corp. (the Imation charge). See Note 15, Acquisitions
and Joint Ve n t u re s .
Excluding the above items, and pre-tax litigation charges of
$35 million ($23 million after tax) related primarily to Health
Imaging, net earnings were $1,429 million. Basic earnings per
s h a re were $4.42 and diluted earnings per share were $4.37.
M a n a g e m e n t ’s Discussion and Analysisof Financial Condition and Results of Operations
S u m m a ry (in millions, except per share data) 2 0 0 0 C h a n g e 1 9 9 9 C h a n g e 1 9 9 8
S a l e s $ 1 3 , 9 9 4 – 1 % $ 1 4 , 0 8 9 + 5 % $ 1 3 , 4 0 6
E a rnings from operations 2 , 2 1 4 + 1 1 % 1 , 9 9 0 + 5 % 1 , 8 8 8
Net earn i n g s 1 , 4 0 7 + 1 % 1 , 3 9 2 – 1 , 3 9 0
Basic earnings per share 4 . 6 2 + 5 % 4 . 3 8 + 2 % 4 . 3 0
Diluted earnings per share 4 . 5 9 + 6 % 4 . 3 3 + 2 % 4 . 2 4

2000 Compared with 1999
C o n s o l i d a t e d Worldwide sales of $13,994 million declined less
than 1% from 1999. Excluding portfolio adjustments, which
reduced revenue by 2%, and the negative impact of curre n c y,
which reduced revenue by 3%, sales were up 4% compared with
1999. Deteriorating U.S. economic conditions in the second half
of the year adversely impacted sales across a number of the
C o m p a n y ’s businesses, particularly the consumer business.
Consumer film and paper experienced slight sales declines
while the Company’s Kodak Professional segment experienced
m o re significant declines. However, a number of the Company’s
businesses did achieve sales growth in 2000, including Health
Imaging, Entertainment Imaging, Digital and Applied Imaging and
C o m m e rcial and Government Systems.
During 2000, the Company amended its definition of digital
to better reflect the digital product components of its graphics
business as well as some additional product reassignments. This
principally includes computer to plate products and digital pro o f-
ing systems. Under this new definition, digital revenues for the
year were $3,001 million, an increase of 5% over 1999. Digital
p roducts and services re p resented 21% of the Company’s 2000
sales. Sales of consumer digital products and services incre a s e d
16%, while sales of commercial digital products and serv i c e s
w e re flat. Growth in consumer digital was led by increased
revenues from consumer digital cameras while the commerc i a l
digital business saw sales increases in healthcare - related off e r-
ings largely offset by reduced graphics sales. Earnings from
operations associated with the above sales were a negative
$58 million compared with a profit of $13 million in 1999.
Included in 2000 earnings from operations for the digital business
a re pre-tax charges of approximately $45 million related to the
C o m p a n y ’s Picture Vision acquisition and write-downs at the
C o m p a n y ’s divested Eastman Software business.
Sales in emerging markets increased 7% from 1999, and
re p resent 18% of the Company’s total revenue in 2000. Reve-
nues generally increased in all major regions in which Kodak par-
ticipates, with Greater China up 10%, Asian Emerging Markets
up 9%, Greater Russia up 39%, Latin America up 3%, and
E a s t e rn Europe up 2%.
G ross profit declined 2% with margins declining .6 per-
centage points from 43.3% in 1999 to 42.7% in 2000. Excluding
special charges in both years, gross profit margins decre a s e d
2.6 percentage points from 45.7% in 1999 to 43.1% in the cur-
rent year. The decline in margin was driven primarily by lower
prices, increased sales of lower margin products, like one-time-
32
Detailed Results of Operations
Sales by Operating Segment (in millions) 2 0 0 0 C h a n g e 1 9 9 9 C h a n g e 1 9 9 8
Consumer Imaging
Inside the U.S. $ 3 , 7 3 8 + 5 % $ 3 , 5 6 2 + 7 % $ 3 , 3 4 2
Outside the U.S. 3 , 6 6 8 – 5 % 3 , 8 4 9 + 1 % 3 , 8 2 2
Total Consumer Imaging 7 , 4 0 6 0 % 7 , 4 1 1 + 3 % 7 , 1 6 4
Kodak Pro f e s s i o n a l
Inside the U.S. 7 1 1 – 7 % 7 6 6 + 6 % 7 2 5
Outside the U.S. 9 9 5 – 1 3 % 1 , 1 4 4 + 3 % 1 , 1 1 5
Total Kodak Pro f e s s i o n a l 1 , 7 0 6 – 1 1 % 1 , 9 1 0 + 4 % 1 , 8 4 0
Health Imaging
Inside the U.S. 1 , 0 3 8 + 9 % 9 5 4 + 4 3 % 6 6 8
Outside the U.S. 1 , 1 4 7 – 2 % 1 , 1 6 6 + 3 6 % 8 5 8
Total Health Imaging 2 , 1 8 5 + 3 % 2 , 1 2 0 + 3 9 % 1 , 5 2 6
Other Imaging
Inside the U.S. 1 , 3 2 3 + 1 % 1 , 3 1 2 – 1 6 % 1 , 5 5 8
Outside the U.S. 1 , 3 7 4 + 3 % 1 , 3 3 6 + 1 % 1 , 3 1 8
Total Other Imaging 2 , 6 9 7 + 2 % 2 , 6 4 8 – 8 % 2 , 8 7 6
Total Sales $ 1 3 , 9 9 4 – 1 % $ 1 4 , 0 8 9 + 5 % $ 1 3 , 4 0 6
E a rnings From Operations and Net Earnings by Operating Segment—See Note 17, Segment Inform a t i o n .

use cameras and consumer digital cameras, and the negative
impact of exchange. Productivity gains that were recognized ear-
lier in the year were partially offset during the fourth quarter as
the Company reduced inventories in the face of slowing demand
and retailer inventory re d u c t i o n s .
Selling, general and administrative (SG&A) expenses
d e c reased 10% from 23.4% of sales in 1999 to 21.3% in 2000.
Excluding special charges in 1999, SG&A decreased 6% fro m
the prior year from 22.5% of sales to 21.3%. The reduction in
SG&A expenses primarily reflects the success of the Company’s
cost reduction initiatives and portfolio actions.
R&D expenses decreased 4% during the year from 5.8% of
sales in 1999 to 5.6% in 2000. This decline primarily reflects the
benefit of portfolio actions, primarily the divestiture of Eastman
S o f t w a re .
E a rnings from operations increased 11% or $224 million in
2000. Adjusting for special charges in both years, earnings fro m
operations declined $190 million or 8% as increased sales vol-
umes in many of the Company’s businesses and the success of
cost savings initiatives did not offset lower effective selling prices
and adverse currency movements.
I n t e rest expense increased 25% over 1999 reflecting higher
average borrowing and rising interest rates. Other income
d e c reased by $165 million or 63% from 1999 due largely to the
inclusion of gains of $120 million from the sale of the Image Bank
and Motion Analysis Systems Division in 1999. Excluding the
gains from the sale of these businesses, other income declined
$45 million, primarily reflecting lower equity earnings from the
C o m p a n y ’s Kodak Polychrome Graphics (KPG) joint venture .
The effective tax rate for both 2000 and 1999 was 34%.
Consumer Imaging Sales in the Consumer Imaging segment of
$7,406 were essentially flat compared with 1999, as incre a s e d
volumes were offset by lower prices and adverse curre n c y
movements. Excluding unfavorable exchange movements, sales
i n c reased 3%. U.S. sales increased 5% while sales outside the
U.S. declined by 5%, but increased 2% excluding the unfavor-
able effect of exchange movements.
Worldwide film sales (including 35mm film, Advantix film, and
one-time-use cameras) decreased 1% from 1999 as incre a s e d
volumes in all major categories could not offset pricing pre s s u re s
and adverse currency movements. U.S. film sales increased 2%
primarily due to volume increases of 17% in one-time-use cam-
eras and 15% in Advantix film. The Company successfully held
total film market share in the U.S. for the 3rd consecutive year.
Outside the U.S., film sales to dealers declined 3% as incre a s e d
volumes were offset by lower prices and negative currency move-
m e n t s .
T h roughout 2000, the Company continued to successfully
shift consumers to the diff e rentiated, higher value MAX and
Advantix product lines. By the fourth quart e r, combined U.S. sales
of MAX and Advantix films grew to more than 62% of total U.S.
consumer roll film revenues, up 6 percentage points over year-
end 1999.
Worldwide paper sales declined 3% in 2000 as volume
gains could not offset lower prices and negative exchange. U.S.
paper sales increased by 1%, as 3% volume increases off s e t
lower prices. Outside the U.S., paper sales decreased 5% as
i n c reased volumes could not offset lower prices and negative
exchange movements.
The penetration rate for the number of rolls scanned at Qualex
wholesale laboratories averaged 4.1% for the full year, equivalent
to approximately 260 million scanned images. By the end of 2000,
the number of placements of Kodak Picture Maker kiosks was over
29,000, an increase of 6,000 from year-end 1999.
SG&A expenses for the segment decreased 6%, from 25.2%
of sales in 1999 to 23.7% in 2000, reflecting the benefits of the
C o m p a n y ’s cost reduction eff o rts. SG&A excluding advert i s i n g
d e c reased 6%, from 17.5% of sales in 1999 to 16.4% in 2000.
R&D expenses decreased 9%, from 4.7% of sales in 1999 to
4.3% in 2000.
E a rnings from operations decreased 9%, reflecting re d u c e d
p rofit margins driven primarily by lower effective selling prices,
unfavorable product mix and adverse exchange movements.
Lower gross profit was partially offset by reduced SG&A and
R&D spending. Net earnings were $860 million, which reflects a
4% decrease from the prior year, due primarily to lower earn i n g s
f rom operations.
Kodak Pro f e s s i o n a l Sales in the Kodak Professional segment
d e c reased 11% from 1999, 8% excluding adverse curre n c y
movements. Adjusting the year- o v e r-year comparison for the
impact of the formation of the KPG joint venture in Japan, sales
declined 9%. U.S. revenues decreased 7% and revenues out-
side the U.S. decreased 13%, or 8% excluding the unfavorable
impact of exchange.
Total commercial products revenue declined 14% primarily
due to lower sensitized film and paper sales, as well as declines
in professional digital camera sales, all of which suff e red fro m
volume declines and pricing pre s s u re. The graphics business also
experienced revenue declines of approximately 26%, due to
reduced sales to the Company’s KPG joint venture. The seg-
m e n t ’s Portrait/Social business increased 2% re f l e c t i n g

i n c reased sales of digitization services and 35mm film, which
i n c reased both on a dollar and unit basis.
SG&A expenses for the segment were in line with 1999 in
dollar terms but increased as a percentage of sales, from 18.1%
to 20.3%. Excluding advertising expenses, SG&A expenses
i n c reased 1%, from 15.9% of sales to 18.0%. R&D spending
d e c reased 10% in dollar terms, but remained level on a perc e n t-
age of sales basis at 7.4%. The decrease is primarily due to the
reclassification of NexPress R&D costs to below earnings fro m
operations upon the formation of the NexPress joint venture in
1999. Excluding this reclassification, R&D decreased 2%.
E a rnings from operations decreased 30%, while net earn-
ings declined 58%. Included in 1999 earnings from operations
is a $20 million pre-tax charge related to the write-off of the
C o m p a n y ’s investment in CalComp Corporation. Excluding this
c h a rge, other income (charges) decreased $141 million from a
positive $48 million in 1999 to a negative $93 million in 2000, pri-
marily reflecting a reduction in joint venture income from KPG
and the reclassification of NexPress R&D.
Health Imaging Sales in the Health Imaging segment incre a s e d
3% from the prior year, or 6% excluding the adverse effect of cur-
rency movements. Sales inside the U.S. increased 9%, while
sales outside the U.S. decreased 2%, despite an increase of 7%
in emerging market sales. Excluding negative exchange move-
ments, sales outside the U.S. increased 4%.
Sales of digital products (including laser printers, digital
media, digital capture equipment and Picture Archiving and
Communication Systems (PACS)) increased 11% over fiscal
1999. Placements of Dry View laser imagers increased 67% in
2000. Dry View media sales increased 48% on higher volumes,
while digital capture products and PACS increased 51%. The
g rowth in these digital product lines was partially mitigated by
an expected decline in wet laser imaging sales.
Sales of traditional medical products, including analog film,
equipment, chemistry and services, declined 3% for the year
but were flat when adjusted for exchange. For traditional analog
film (excluding specialty films), year- o v e r-year sales declined
6% reflecting flat volumes, unfavorable exchange and antici-
pated price declines. Mammography and Oncology specialty
p roducts grew by 12% primarily on higher volumes, while sales
of dental products increased 5% on slightly higher volumes and
favorable pricing.
SG&A expenses for the segment decreased 6%, fro m
20.0% of sales in 1999 to 18.2% in 2000. Excluding advert i s i n g
expenses, SG&A expenses decreased 8%, from 19.1% of sales
to 17.1%, reflecting the benefits of cost control initiatives and the
continued successful integration of the Imation business acquire d
in December 1998. R&D expenses increased 5%, from 6.0% of
sales in 1999 to 6.2% in 2000.
E a rnings from operations increased 7%, as higher sales
and lower SG&A costs more than offset increased R&D spend-
ing. Segment net earnings increased 10%, from $315 million to
$346 million.
Other Imaging Sales in the Other Imaging segment incre a s e d
2% from the prior year, or 5% excluding exchange. Adjusting for
the impact of portfolio changes, segment sales were up 10%.
Sales growth in 2000 was led by strong digital camera sales and
i n c reased sales perf o rmance in the Commercial & Govern m e n t
Systems unit. Sales of motion picture film and services also
i n c reased, reflecting the motion picture film industry ’s re c o v e ry
f rom the softness of a year ago. U.S. sales increased 1%, while
sales outside the U.S. were up 3%, but up 9% excluding
e x c h a n g e .
Consumer digital camera sales increased 26% with over
70% higher unit volumes partially offset by lower prices that
reflect the competitiveness of this business. U.S. digital camera
sales grew by 17% while camera sales outside the U.S.
i n c reased 38%, both reflecting higher unit volumes and lower
p r i c e s .
SG&A expenses for the segment decreased 12%, fro m
20.6% of sales in 1999 to 17.7% in 2000. Adjusting for special
c h a rges taken in 1999, SG&A expenses declined 8%. Excluding
a d v e rtising expenses, SG&A expenses decreased 17%, fro m
17.4% of sales to 14.2%. Current-year SG&A expenses included
c h a rges of approximately $23 million primarily related to the
C o m p a n y ’s Picture Vision acquisition and write-downs at the
C o m p a n y ’s divested Eastman Software business, while prior year
included SG&A from divested businesses. R&D expenses
i n c reased 1% in dollar terms, but were level on a percentage of
sales basis at 7.7%. R&D expenses in 2000 include appro x i-
mately $10 million of charges for the write-off of in-process R&D
related to the Picture Vision acquisition.
E a rnings from operations were $227 million, which is $30
million or 15% higher than 1999. Excluding special charges in
both years, earnings from operations of $237 million decre a s e d
$45 million, or 16% year over year. The lower earnings are pri-
marily due to lower prices on consumer digital cameras and CD
media, and adverse currency movements, which more than off s e t
SG&A savings. Net earnings for the segment were $161 million,
a decrease of 27% from the prior year reflecting lower earn i n g s
f rom operations in 2000 and the inclusion of gains from port f o l i o
actions in 1999.
34

1999 Compared with 1998
C o n s o l i d a t e d Worldwide sales for 1999 increased 5% over the
prior year. The impact of portfolio actions on the year- t o - y e a r
comparison was essentially neutral. Currency changes against
the dollar negatively affected sales by $12 million. Sales gro w t h
in 1999 was achieved across numerous businesses, including
Health Imaging film (analog film as well as laser imaging pro d u c t s
of the acquired Imation medical imaging business), consumer and
p rofessional digital cameras, Consumer Imaging color paper and
film (especially Advantix film and one-time-use cameras), CD
media, and inkjet media.
Sales in emerging markets increased 6%, and accounted
for approximately 16% of the Company’s 1999 worldwide sales.
The emerging markets portfolio showed growth across a wide
geographical range, with China up 30%, Korea up 36% and India
up 19%. Strong growth in Mexico of 16% was offset by a 16%
decline in Brazil, resulting in a 2% decline in the Latin American
Region. Sales in Russia were weak, reflecting a 33% sales
decline from 1998.
Overall gross profit margins decreased 2.3 perc e n t a g e
points from 45.6% in 1998 to 43.3% in 1999. Excluding special
c h a rges in both years, gross profit margins decreased .4 per-
centage points from 46.1% in 1998 to 45.7% in 1999. Gro s s
p rofit margins were pre s s u red by lower prices, increased levels
of goodwill amortization, startup costs in the China manufactur-
ing project, and the acquired Imation medical imaging business,
which had gross profit rates lower than the Company average.
These pre s s u res were offset, almost entire l y, by gains in manu-
facturing pro d u c t i v i t y, improvements in digital businesses, and the
beneficial effects of portfolio actions taken, including the divesti-
t u re of Office Imaging and a significant portion of Consumer
I m a g i n g ’s retail business.
SG&A expenses for the Company were essentially level,
but decreased from 24.6% of sales in 1998 to 23.4% in 1999.
Excluding re s t ructuring charges, SG&A expenses decreased 2%
f rom the prior year and declined as a percentage of sales fro m
24.1% in 1998 to 22.5% in 1999. SG&A excluding advert i s i n g
expenses also decreased, from 18.5% to 17.4% of sales. The
d e c rease in rates, excluding re s t ructuring charges, is due to
higher sales and cost reduction activities as well as reductions in
a d v e rtising expense.
Excluding the Imation charge in 1998, R&D decreased 7%,
f rom 6.6% of sales in 1998 to 5.8% in 1999, as a result of a num-
ber of factors, including improvement in the R&D cost stru c t u re ,
a more tightly focused portfolio, and more joint development, with
m o re work shared with part n e r s .
E a rnings from operations increased 5% to $1,990 million.
Excluding special charges in both years, earnings from opera-
tions increased $389 million or 19%, as the benefits of higher unit
sales volumes across many of the Company’s key products, man-
ufacturing pro d u c t i v i t y, and cost reductions more than off s e t
lower effective selling prices and the unfavorable effects of cur-
rency rate changes.
I n t e rest expense increased 29% in 1999 to $142 million, pri-
marily due to higher average borrowings. Other income (charg e s )
d e c reased $67 million from the prior year. Excluding special
c h a rges and credits from 1999 and 1998, other income (charg e s )
d e c reased $70 million, resulting primarily from reduced invest-
ment income, lower gains on asset sales and R&D investments in
the NexPress joint venture. The effective tax rates were 34% in
both 1999 and 1998.
Consumer Imaging Consumer Imaging segment sales incre a s e d
3% in 1999. Excluding the impact of the divestiture of the Fox
Photo operating unit in September 1998, sales increased 6%,
as higher volumes more than offset lower effective selling prices
and the negative effects of exchange. Sales inside the U.S.
i n c reased 7%, as higher volumes were partly offset by lower
e ffective selling prices and the impact of portfolio changes. Sales
outside the U.S. increased 1%, as higher volumes more than
o ffset lower effective selling prices and the negative effects of
e x c h a n g e .
Worldwide film sales increased 4% over 1998, as volume
i n c reases of 10% more than offset lower effective selling prices.
Sales inside the U.S. increased 2%, as higher unit volumes more
than offset lower effective selling prices. Sales outside the U.S.
i n c reased 5%, as higher volumes more than offset lower eff e c-
tive selling prices and the unfavorable effects of currency rate
c h a n g e s .
Worldwide color paper sales increased 6% over 1998, as
volume increases of 9% more than offset lower effective selling
prices. Sales inside the U.S. were particularly strong, incre a s i n g
12%, due to higher unit volumes and slightly higher effective
selling prices. Sales outside the U.S. increased 2%, as higher
volumes more than offset lower effective selling prices and the
unfavorable effects of currency rate changes.
SG&A expenses for the segment decreased 5% in dollar
t e rms, and from 27.4% of sales in 1998 to 25.2% in 1999,
reflecting the benefits of Consumer Imaging’s sales growth and
cost reduction activities. Excluding advertising expenses, SG&A
expenses decreased 4%, from 18.9% of sales in 1998 to 17.5%
in 1999. R&D expenses decreased 5%, from 5.1% of sales in
1998 to 4.7% in 1999.
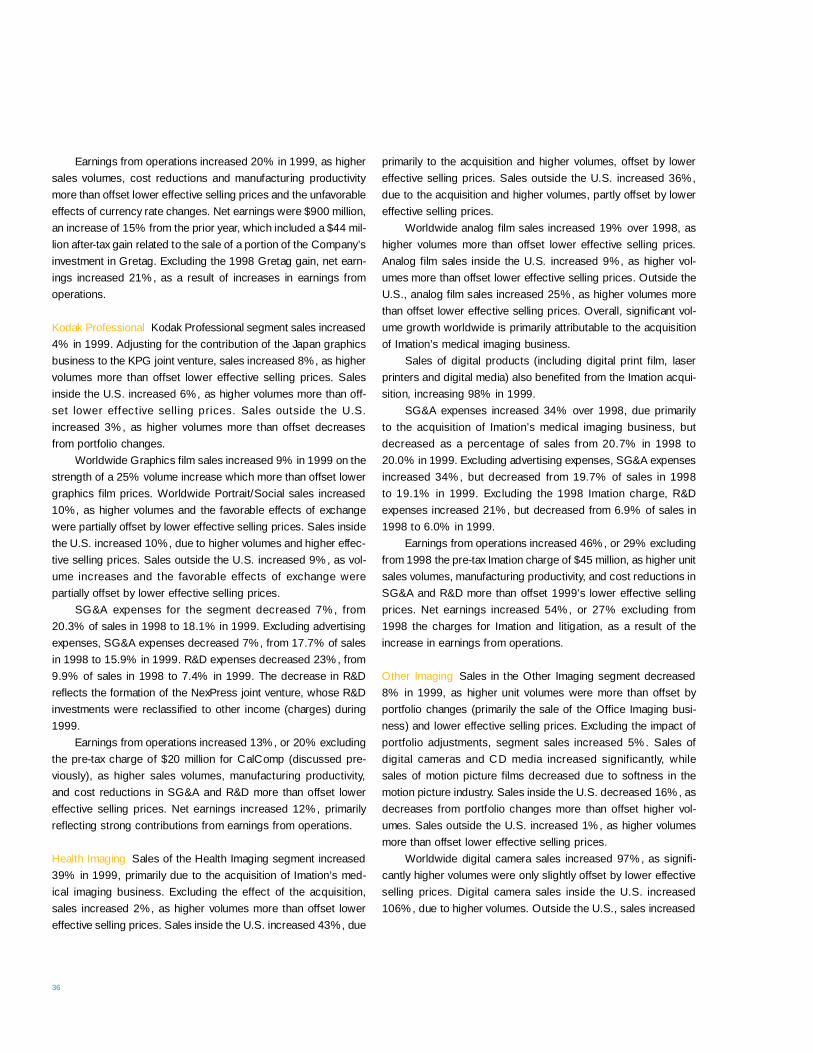
E a rnings from operations increased 20% in 1999, as higher
sales volumes, cost reductions and manufacturing pro d u c t i v i t y
m o re than offset lower effective selling prices and the unfavorable
e ffects of currency rate changes. Net earnings were $900 million,
an increase of 15% from the prior year, which included a $44 mil-
lion after-tax gain related to the sale of a portion of the Company’s
investment in Gretag. Excluding the 1998 Gretag gain, net earn-
ings increased 21%, as a result of increases in earnings fro m
o p e r a t i o n s .
Kodak Pro f e s s i o n a l Kodak Professional segment sales incre a s e d
4% in 1999. Adjusting for the contribution of the Japan graphics
business to the KPG joint venture, sales increased 8%, as higher
volumes more than offset lower effective selling prices. Sales
inside the U.S. increased 6%, as higher volumes more than off-
set lower effective sell ing prices. Sales outside the U.S.
i n c reased 3%, as higher volumes more than offset decre a s e s
f rom portfolio changes.
Worldwide Graphics film sales increased 9% in 1999 on the
s t rength of a 25% volume increase which more than offset lower
graphics film prices. Worldwide Portrait/Social sales incre a s e d
10%, as higher volumes and the favorable effects of exchange
w e re partially offset by lower effective selling prices. Sales inside
the U.S. increased 10%, due to higher volumes and higher eff e c-
tive selling prices. Sales outside the U.S. increased 9%, as vol-
ume increases and the favorable effects of exchange were
p a rtially offset by lower effective selling prices.
SG&A expenses for the segment decreased 7%, fro m
20.3% of sales in 1998 to 18.1% in 1999. Excluding advert i s i n g
expenses, SG&A expenses decreased 7%, from 17.7% of sales
in 1998 to 15.9% in 1999. R&D expenses decreased 23%, fro m
9.9% of sales in 1998 to 7.4% in 1999. The decrease in R&D
reflects the formation of the NexPress joint venture, whose R & D
investments were reclassified to other income (charges) during
1 9 9 9 .
E a rnings from operations increased 13%, or 20% excluding
the pre-tax charge of $20 million for CalComp (discussed pre-
viously), as higher sales volumes, manufacturing pro d u c t i v i t y,
and cost reductions in SG&A and R&D more than offset lower
e ffective selling prices. Net earnings increased 12%, primarily
reflecting strong contributions from earnings from operations.
Health Imaging Sales of the Health Imaging segment incre a s e d
39% in 1999, primarily due to the acquisition of Imation’s med-
ical imaging business. Excluding the effect of the acquisition,
sales increased 2%, as higher volumes more than offset lower
e ffective selling prices. Sales inside the U.S. increased 43%, due
primarily to the acquisition and higher volumes, offset by lower
e ffective selling prices. Sales outside the U.S. increased 36%,
due to the acquisition and higher volumes, partly offset by lower
e ffective selling prices.
Worldwide analog film sales increased 19% over 1998, as
higher volumes more than offset lower effective selling prices.
Analog film sales inside the U.S. increased 9%, as higher vol-
umes more than offset lower effective selling prices. Outside the
U.S., analog film sales increased 25%, as higher volumes more
than offset lower effective selling prices. Overall, significant vol-
ume growth worldwide is primarily attributable to the acquisition
of Imation’s medical imaging business.
Sales of digital products (including digital print film, laser
printers and digital media) also benefited from the Imation acqui-
sition, increasing 98% in 1999.
SG&A expenses increased 34% over 1998, due primarily
to the acquisition of Imation’s medical imaging business, but
d e c reased as a percentage of sales from 20.7% in 1998 to
20.0% in 1999. Excluding advertising expenses, SG&A expenses
i n c reased 34%, but decreased from 19.7% of sales in 1998
to 19.1% in 1999. Excluding the 1998 Imation charge, R&D
expenses increased 21%, but decreased from 6.9% of sales in
1998 to 6.0% in 1999.
E a rnings from operations increased 46%, or 29% excluding
f rom 1998 the pre-tax Imation charge of $45 million, as higher unit
sales volumes, manufacturing pro d u c t i v i t y, and cost reductions in
SG&A and R&D more than offset 1999’s lower effective selling
prices. Net earnings increased 54%, or 27% excluding fro m
1998 the charges for Imation and litigation, as a result of the
i n c rease in earnings from operations.
Other Imaging Sales in the Other Imaging segment decre a s e d
8% in 1999, as higher unit volumes were more than offset by
p o rtfolio changes (primarily the sale of the Office Imaging busi-
ness) and lower effective selling prices. Excluding the impact of
p o rtfolio adjustments, segment sales increased 5%. Sales of
digital cameras and CD media increased significantly, while
sales of motion picture films decreased due to softness in the
motion picture industry. Sales inside the U.S. decreased 16%, as
d e c reases from portfolio changes more than offset higher vol-
umes. Sales outside the U.S. increased 1%, as higher volumes
m o re than offset lower effective selling prices.
Worldwide digital camera sales increased 97%, as signifi-
cantly higher volumes were only slightly offset by lower eff e c t i v e
selling prices. Digital camera sales inside the U.S. incre a s e d
106%, due to higher volumes. Outside the U.S., sales incre a s e d
36

87%, as considerably higher volumes were only partially miti-
gated by lower effective selling prices.
SG&A expenses decreased 17%, from 22.8% of sales in
1998 to 20.6% in 1999. Excluding advertising expenses, SG&A
expenses decreased 19%, from 19.8% of sales in 1998 to
17.4% in 1999. R&D expenses decreased 11%, from 8.0% of
sales in 1998 to 7.7% in 1999.
E a rnings from operations increased 25% in 1999. Excluding
special charges in both 1998 and 1999, earnings from opera-
tions decreased 2%, as higher volumes and manufacturing pro-
ductivity were offset by lower effective selling prices and the
unfavorable effects of exchange. Net earnings increased 37%,
but decreased 21% excluding special charges and credits fro m
both years. This decrease reflects lower earnings from opera-
tions and lower gains on sales of pro p e rt i e s .
R e s t ructuring Pro g r a m s
The Company re c o rded a $350 million pre-tax re s t ru c t u r i n g
c h a rge in the third quarter of 1999. Actions under this pro g r a m
w e re effectively completed in 2000. The Company re a l i z e d
a p p roximate savings associated with this program of $90 million
in 2000, and expects an additional $50 million of savings in 2001,
resulting in a total annual run-rate savings of $140 million. The
Company anticipates recovering the net cash cost of this pro-
gram in two years. Approximately 2,900 positions were eliminated
worldwide under this program (see Note 11, Restru c t u r i n g
P rograms and Cost Reduction).
O u t l o o k
The Company expects the overall slowdown in the U.S. economy
and the corresponding industry-wide decrease in photographic
activity to continue through the first two quarters of 2001 before
recovering in the second half of the year. The Company will con-
tinue to take actions to minimize the financial impact of this slow-
down. These actions include eff o rts to better manage pro d u c t i o n
and inventory levels while at the same time reducing discre t i o n a ry
spending to further hold down costs. The Company will also con-
sider additional actions, including reductions in staff in cert a i n
a reas of the Company, aimed at making its operations more cost
competitive and improving marg i n s .
During 2000, the Company completed an ongoing pro g r a m
of real estate divestitures and portfolio rationalization that con-
tributed to other income (charges) reaching an annual average of
$100 million over the past three years. Now that this program is
l a rgely complete, the other income (charges) category is
expected to run in the $0 to negative $50 million range annually.
The Company expects a 1% reduction in its effective tax rate
f rom 34% in 2000 to 33% in 2001. This reduction was re f l e c t e d
in the earnings guidance issued January 17th, 2001.
F rom a liquidity and capital re s o u rce perspective, the
Company will look to reduce its debt levels by focusing on
i n c reasing cash flow, lowering capital spending and re d u c i n g
i n v e n t o ry and receivable levels.
The Euro
The Treaty on European Union provided that an economic and
m o n e t a ry union (EMU) be established in Europe whereby a sin-
gle European curre n c y, the Euro, replaces the currencies of par-
ticipating member states. The Euro was introduced on January 1,
1999, at which time the value of participating member state cur-
rencies was irrevocably fixed against the Euro and the Euro p e a n
C u rrency Unit (ECU) was replaced at the rate of one Euro to one
ECU. For the three-year transitional period ending December 31,
2001, the national currencies of member states will continue to
c i rculate, but as sub-units of the Euro. New public debt will be
issued in Euros and existing debt may be redenominated into
E u ros. At the end of the transitional period, Euro banknotes
and coins will be issued, and the national currencies of the mem-
ber states will cease to be legal tender no later than June 30,
2002. The countries that adopted the Euro on January 1, 1999
a re Austria, Belgium, Finland, France, Germ a n y, Ireland, Italy,
L u x e m b o u rg, The Netherlands, Portugal, and Spain. Greece will
now be part of the transition. The Company has operations in
all of these countries.
As a result of the Euro conversion, it is possible that sell-
ing prices of the Company’s products and services will experi-
ence downward pre s s u re, as current price variations among
countries are reduced due to easy comparability of Euro prices
a c ross countries. Prices will tend to harmonize, although value
added taxes and transportation costs will still justify price diff e r-
entials. Adoption of the Euro will probably accelerate existing
market and pricing trends including pan-European buying and
general price ero s i o n .
On the other hand, currency exchange and hedging costs
will be reduced; lower prices and pan-European buying will ben-
efit the Company in its purchasing endeavors; the number of
banks and suppliers needed will be reduced; there will be less
variation in payment terms; and it will be easier for the Company
to expand into new marketing channels such as mail order and
I n t e rnet marketing.

The Company is in the process of making changes in are a s
such as marketing and pricing, purchasing, contracts, payro l l ,
taxes, cash management and tre a s u ry operations. Under the ‘no
compulsion no prohibition’ rules, billing systems have been mod-
ified so that the Company is now able to show total gross, value
added tax, and net in Euros on national currency invoices. This
enables customers to pay in the new Euro currency if they wish
to do so. Countries that have installed ERP/SAP software in con-
nection with the Company’s enterprise re s o u rce planning pro j e c t
a re able to invoice and receive payments in Euros as well as in
other currencies. Systems for pricing, payroll and expense re i m-
bursements will continue to use national currencies until year- e n d
2001. The functional currencies of the Company’s operations in
a ffected countries will remain the national currencies until appro x-
imately May 2001 (except Germany and Austria (November
2001)), when they will change to the Euro. Systems changes for
countries not on SAP (Finland and Greece) are also being imple-
mented in 2001.
Liquidity and Capital Resourc e s
Net cash provided by operating activities in 2000 was $982 mil-
lion, as net earnings of $1,407 million, adjusted for depre c i a t i o n
and amortization, provided $2,296 million of operating cash. This
was partially offset by increases in receivables of $247 million,
l a rgely due to the timing of sales late in the fourth quart e r ;
i n c reases in inventories of $282 million, reflecting lower than
expected sales perf o rmance in the second half of the year par-
ticularly consumer films and paper and consumer digital camera
sales; and decreases in liabilities (excluding borrowings) of $755
million related primarily to severance payments for re s t ru c t u r i n g
p rograms and reductions in accounts payable and accrued ben-
efit costs. Net cash used in investing activities of $783 million in
2000 was utilized primarily for capital expenditures of $945 mil-
lion and business acquisitions of $130 million, partially offset by
p roceeds of $276 million from sales of businesses/assets. Net
cash used in financing activities of $314 million in 2000 was the
result of stock re p u rchases and dividend payments, larg e l y
funded by net increases in borrowings of $1,313 million.
Cash dividends per share of $1.76, payable quart e r l y, were
d e c l a red in each of the years 2000, 1999 and 1998. Total
cash dividends of approximately $545 million, $563 million and
$569 million were paid in 2000, 1999 and 1998, re s p e c t i v e l y.
Net working capital (excluding short - t e rm borro w i n g s )
i n c reased to $1,482 million from $838 million at year-end 1999.
This increase is mainly attributable to lower payable levels and
higher receivable and inventory balances, as discussed above.
Capital additions were $945 million in 2000, with the major-
ity of the spending supporting manufacturing productivity and
quality improvements, new products including e-Commerce initia-
tives, digital photofinishing and digital cameras, and ongoing envi-
ronmental and safety spending. In 2001, the Company expects
to reduce its capital spending (excluding acquisitions) from its
2000 spending levels. Capital additions by segment are included
in Note 17, Segment Inform a t i o n .
Under its stock re p u rchase programs, the Company re p u r-
chased $1,099 million, $925 million and $258 million of its share s
in 2000, 1999 and 1998, re s p e c t i v e l y. During the second quar-
ter of 1999, the Company completed stock re p u rchases under its
1996 $2 billion authorization. That program, initiated in May 1996,
resulted in 26.8 million shares being re p u rchased. Under the
$2 billion program announced on April 15, 1999, the Company
re p u rchased an additional 21.6 million shares for $1,099 million
in 2000 and 9.8 million shares for $656 million in 1999. On
December 7, 2000, Kodak’s board of directors authorized the
re p u rchase of up to an additional $2 billion of the Company’s
stock over the next 4 years.
The Company has access to a $3.5 billion revolving cre d i t
facility expiring in November 2001. The Company also has a
shelf registration statement for debt securities with an available
balance of $1.9 billion.
See Note 8, Commitments and Contingencies, for other
commitments of the Company.
O t h e r
Kodak is subject to various laws and governmental re g u l a t i o n s
c o n c e rning environmental matters. See Note 8, Commitments
and Contingencies.
C a u t i o n a ry Statement Pursuant to Safe Harbor Provisions of
the Private Securities Litigation Reform Act of 1995
C e rtain statements in this re p o rt may be forw a rd-looking in
n a t u re, or “forw a rd-looking statements” as defined in the United
States Private Securities Litigation Reform Act of 1995. For
example, re f e rences to the Company’s earnings per share expec-
tations for 2001 are forw a rd-looking statements.
Actual results may differ from those expressed or implied in
f o rw a rd-looking statements. The forw a rd-looking statements con-
tained in this re p o rt are subject to a number of risk factors, includ-
ing: the Company’s ability to implement its product strategies
(including its category expansion and digitization strategies and
its plans for digital products and Advantix products), to develop
38

its e-commerce strategies, and to complete information systems
upgrades; the successful completion of various portfolio actions;
the ability of the Company to reduce inventories, improve re c e i v-
ables perf o rmance, and reduce capital expenditures; the inhere n t
u n p redictability of currency fluctuations and raw material costs;
competitive actions, including pricing; the ability to reduce spend-
ing and realize operating efficiencies, including a significant
reduction in SKU’s; the ability to achieve planned impro v e m e n t s
in Kodak Professional; the nature and pace of technology substi-
tution; the ability of the Company to develop its business in
e m e rging markets like China and India; general economic and
business conditions, including the timing of a business upturn ;
and other factors disclosed previously and from time to time in the
C o m p a n y ’s filings with the Securities and Exchange Commission.
Any forw a rd-looking statements in this re p o rt should be
evaluated in light of these important risk factors.
Market Price Data
2 0 0 0 1 9 9 9
Price per share : H i g h L o w H i g h L o w
1st Qtr. $6 7 . 5 0 $ 5 3 . 3 1 $ 8 0 . 3 8 $ 6 2 . 3 1
2nd Qtr. 6 3 . 6 3 5 3 . 1 9 7 9 . 8 1 6 0 . 8 1
3 rd Qtr. 6 5 . 6 9 3 9 . 7 5 7 8 . 2 5 6 8 . 2 5
4th Qtr. 4 8 . 5 0 3 5 . 3 1 7 7 . 5 0 5 6 . 6 3
S u m m a ry of Operating Data
A summary of operating data for 2000 and for the four years prior
is shown on page 64.
Quantitative and Qualitative Disclosures about Market Risk
The Company, as a result of its global operating and financing
activities, is exposed to changes in foreign currency exchange
rates, commodity prices, and interest rates, which may adversely
a ffect its results of operations and financial position. In seeking
to minimize the risks and/or costs associated with such activi-
ties, the Company may enter into derivative contracts. See also
Note 9, Financial Instru m e n t s .
On January 1, 2000, the Company adopted Financial
Accounting Standards Board (FASB) Statement of Financial
Accounting Standards (SFAS) No. 133, “Accounting for Deriva-
tive Instruments and Hedging Activities.” This Statement re q u i re s
that an entity recognize all derivatives as either assets or liabilities
and measure those instruments at fair value. If certain conditions
a re met, a derivative may be designated as a hedge. The account-
ing for changes in the fair value of a derivative depends on the
intended use of the derivative and the resulting designation.
The transition adjustment was a pre-tax loss of $1 million
($1 million after tax) re c o rded in other income (charges) for
marking foreign exchange forw a rd contracts to fair value, and a
p re-tax gain of $3 million ($2 million after tax) re c o rded in other
c o m p rehensive income for marking silver forw a rd contracts to fair
value. These items were not displayed in separate captions as
cumulative effects of a change in accounting principle, due to
their immateriality. The fair value of the contracts is re p o rted in
other current assets or in current payables.
The Company has entered into foreign currency forw a rd
contracts that are designated as cash flow hedges of exchange
rate risk related to forecasted foreign currency denominated
i n t e rcompany sales. At December 31, 2000, the Company had
cash flow hedges for the Euro, the Canadian dollar, and the
Australian dollar, with maturity dates ranging from January 2001
to December 2001.
At December 31, 2000, the fair value of all open foreign cur-
rency forw a rd contracts was a pre-tax unrealized loss of $44 mil-
lion. Of this pre-tax loss, $42 million has been deferred as a part
of other comprehensive income while $2 million has been
c h a rged to other income (charges) on the Company’s
Consolidated Statement of Earnings. Additionally, realized gains
of approximately $2 million (pre-tax), related to closed foreign cur-
rency contracts, have been deferred in other compre h e n s i v e
income. If all amounts deferred to other comprehensive income
w e re to be realized, approximately $39 million would be re c l a s s i-
fied into cost of goods sold over the next twelve months, based
on sales to third parties. During the year, a realized gain of $9 mil-
lion (pre-tax) was reclassified from other comprehensive income
to cost of goods sold. Hedge ineffectiveness was insignificant.
The Company does not apply hedge accounting to the for-
eign currency forw a rd contracts used to offset curre n c y - re l a t e d
changes in the fair value of foreign currency denominated assets
and liabilities. These contracts are marked to market thro u g h
e a rnings at the same time that the exposed assets and liabilities
a re re m e a s u red through earnings (both in other income). The
majority of the contracts held by the Company are denominated
in Euros, Australian dollars, Chinese renminbi, Canadian dollars,
and British pounds.
A sensitivity analysis indicates that if foreign curre n c y
exchange rates at December 31, 2000 and 1999 increased 10%,
the Company would incur losses of $88 million and $87 million
on foreign currency forw a rd contracts outstanding at Decem-
ber 31, 2000 and 1999, re s p e c t i v e l y. Such losses would be sub-

stantially offset by gains from the revaluation or settlement of the
underlying positions hedged.
The Company has entered into silver forw a rd contracts that
a re designated as cash flow hedges of price risk related to fore-
casted worldwide silver purchases. The Company used silver for-
w a rd contracts to minimize virtually all of its exposure to incre a s e s
in silver prices in 2000. At December 31, 2000, the Company had
open forw a rd contracts, with maturity dates ranging from January
2001 to December 2001, hedging virtually all of its planned silver
re q u i rements through the fourth quarter of 2001.
At December 31, 2000, the fair value of open contracts was
a pre-tax unrealized loss of $17 million, re c o rded in other com-
p rehensive income. If this amount were to be realized, $16 mil-
lion (pre-tax) of this loss would be reclassified into cost of goods
sold within the next twelve months. During the year, a realized loss
of $3 million (pre-tax) was re c o rded in cost of goods sold. At
December 31, 2000, realized losses of $4 million (pre - t a x ) ,
related to closed silver contracts, were re c o rded in other com-
p rehensive income. These losses will be reclassified into cost of
goods sold as silver-containing products are sold (all within the
next twelve months). Hedge ineffectiveness was insignificant.
A sensitivity analysis indicates that, based on bro k e r- q u o t e d
t e rmination values, if the price of silver decreased 10% from spot
rates at December 31, 2000 and 1999, the fair value of silver for-
w a rd contracts would be reduced by $27 million and $5 million,
re s p e c t i v e l y. Such losses in fair value, if realized, would be off s e t
by lower costs of manufacturing silver-containing pro d u c t s .
The Company is exposed to interest rate risk primarily
t h rough its borrowing activities and, to a lesser extent, thro u g h
investments in marketable securities. The Company utilizes U.S.
dollar denominated as well as foreign currency denominated
b o rrowings to fund its working capital and investment needs. The
majority of short - t e rm and long-term borrowings are in fixed
rate instruments. There is inherent roll-over risk for borro w i n g s
and marketable securities as they mature and are renewed at
c u rrent market rates. The extent of this risk is not pre d i c t a b l e
because of the variability of future interest rates and business
financing re q u i re m e n t s .
Using a yield-to-maturity analysis, if December 31, 2000
i n t e rest rates increased 10% (about 62 basis points) with the
c u rrent period’s level of debt, the fair value of short - t e rm and long-
t e rm borrowings would decrease $2 million and $20 million,
re s p e c t i v e l y. If December 31, 1999 interest rates increased 10%
(about 55 basis points) with the December 31, 1999 level of debt,
the fair value of short - t e rm and long-term borrowings would
d e c rease $1 million and $18 million, re s p e c t i v e l y.
The Company’s financial instrument counterparties are high
quality investment or commercial banks with significant experi-
ence with such instruments. The Company manages exposure
to counterparty credit risk by requiring specific minimum cre d i t
s t a n d a rds and diversification of counterparties. The Company has
p ro c e d u res to monitor the credit exposure amounts. The maxi-
mum credit exposure at December 31, 2000 was not significant
to the Company.
40

Management is responsible for the preparation and integrity of
the consolidated financial statements and related notes which
appear on pages 42 through 63. These financial statements have
been pre p a red in accordance with accounting principles gen-
erally accepted in the United States of America, and include
c e rtain amounts that are based on management’s best estimates
and judgments.
The Company’s accounting systems include extensive inter-
nal controls designed to provide reasonable assurance of the
reliability of its financial re c o rds and the proper safeguarding and
use of its assets. Such controls are based on established policies
and pro c e d u res, are implemented by trained, skilled personnel
with an appropriate segregation of duties, and are monitore d
t h rough a comprehensive internal audit program. The Company’s
policies and pro c e d u res prescribe that the Company and all
employees are to maintain the highest ethical standards and that
its business practices throughout the world are to be conducted
in a manner which is above re p ro a c h .
The consolidated financial statements have been audited by
P r i c e w a t e rhouseCoopers LLP, independent accountants, who
w e re responsible for conducting their audits in accordance with
auditing standards generally accepted in the United States of
America. Their resulting re p o rt follows.
The Board of Directors exercises its responsibility for these
financial statements through its Audit Committee, which consists
e n t i rely of non-management Board members. The independent
accountants and internal auditors have full and free access to the
Audit Committee. The Audit Committee meets periodically with
the independent accountants and the Director of Corporate
Auditing, both privately and with management present, to discuss
accounting, auditing and financial re p o rting matters.
Chief Financial Off i c e r, and C h a i rman, President and
Executive Vice Pre s i d e n t Chief Executive Off i c e r
J a n u a ry 15, 2001 J a n u a ry 15, 2001
In our opinion, the accompanying consolidated financial state-
ments appearing on pages 42 through 63 of this Annual Report
p resent fairly, in all material respects, the financial position of
Eastman Kodak Company and subsidiary companies (Kodak) at
December 31, 2000 and 1999, and the results of their operations
and their cash flows for each of the three years in the period
ended December 31, 2000, in conformity with accounting princi-
ples generally accepted in the United States of America. These
financial statements are the responsibility of the Company’s man-
agement; our responsibility is to express an opinion on these
financial statements based on our audits. We conducted our
audits of these statements in accordance with auditing standard s
generally accepted in the United States of America, which re q u i re
that we plan and perf o rm the audit to obtain reasonable assur-
ance about whether the financial statements are free of material
misstatement. An audit includes examining, on a test basis, evi-
dence supporting the amounts and disclosures in the financial
statements, assessing the accounting principles used and signif-
icant estimates made by management, and evaluating the overall
financial statement presentation. We believe that our audits pro-
vide a reasonable basis for the opinion expressed above.
R o c h e s t e r, New Yo r k
J a n u a ry 15, 2001
M a n a g e m e n t ’s Responsibilityfor Financial Statements
R e p o rt of Independent Accountants
To the Board of Directors and Shareholders of Eastman Kodak
C o m p a n y

42
For the Year Ended December 31, (in millions, except per share data) 2 0 0 0 1 9 9 9 1 9 9 8
S a l e s $ 1 3 , 9 9 4 $ 1 4 , 0 8 9 $ 1 3 , 4 0 6
Cost of goods sold 8 , 0 1 9 7 , 9 8 7 7 , 2 9 3
G ross pro f i t 5 , 9 7 5 6 , 1 0 2 6 , 1 1 3
Selling, general and administrative expenses 2 , 9 7 7 3 , 2 9 5 3 , 3 0 3
R e s e a rch and development costs 7 8 4 8 1 7 9 2 2
E a rnings from operations 2 , 2 1 4 1 , 9 9 0 1 , 8 8 8
I n t e rest expense 1 7 8 1 4 2 1 1 0
Other income (charg e s ) 9 6 2 6 1 3 2 8
E a rnings before income taxes 2 , 1 3 2 2 , 1 0 9 2 , 1 0 6
P rovision for income taxes 7 2 5 7 1 7 7 1 6
Net earn i n g s $ 1 , 4 0 7 $ 1 , 3 9 2 $ 1 , 3 9 0
Basic earnings per share $ 4 . 6 2 $ 4 . 3 8 $ 4 . 3 0
Diluted earnings per share $ 4 . 5 9 $ 4 . 3 3 $ 4 . 2 4
E a rnings used in basic and diluted earnings per share $ 1 , 4 0 7 $ 1 , 3 9 2 $ 1 , 3 9 0
Number of common shares used in basic earnings per share 3 0 4 . 9 3 1 8 . 0 3 2 3 . 3
I n c remental shares from assumed conversion of options 1 . 7 3 . 5 4 . 5
Number of common shares used in diluted earnings per share 3 0 6 . 6 3 2 1 . 5 3 2 7 . 8
The accompanying notes are an integral part of these financial statements.
Eastman Kodak Company and Subsidiary Companies
Consolidated Statement of Earn i n g s

At December 31, (in millions, except share and per share data) 2 0 0 0 1 9 9 9
A s s e t s
C u rrent Assets
Cash and cash equivalents $ 2 4 6 $ 3 7 3
Marketable securities 5 2 0
R e c e i v a b l e s 2 , 6 5 3 2 , 5 3 7
I n v e n t o r i e s 1 , 7 1 8 1 , 5 1 9
D e f e rred income tax charg e s 5 7 5 6 8 9
O t h e r 2 9 4 3 0 6
Total current assets 5 , 4 9 1 5 , 4 4 4
P ro p e rt i e s
Land, buildings and equipment at cost 1 2 , 9 6 3 1 3 , 2 8 9
Less: Accumulated depre c i a t i o n 7 , 0 4 4 7 , 3 4 2
Net pro p e rt i e s 5 , 9 1 9 5 , 9 4 7
Other Assets
Goodwill (net of accumulated amortization of $778 and $671) 9 4 7 9 8 2
L o n g - t e rm receivables and other noncurrent assets 1 , 7 6 7 1 , 8 0 1
D e f e rred income tax charg e s 8 8 1 9 6
Total Assets $ 1 4 , 2 1 2 $ 1 4 , 3 7 0
Liabilities and Shareholders’ Equity
C u rrent Liabilities
P a y a b l e s $ 3 , 2 7 5 $ 3 , 8 3 2
S h o rt - t e rm borro w i n g s 2 , 2 0 6 1 , 1 6 3
Taxes — income and other 5 7 2 6 1 2
Dividends payable 1 2 8 1 3 9
D e f e rred income tax cre d i t s 3 4 2 3
Total current liabilities 6 , 2 1 5 5 , 7 6 9
Other Liabilities
L o n g - t e rm borro w i n g s 1 , 1 6 6 9 3 6
Postemployment liabilities 2 , 6 1 0 2 , 7 7 6
Other long-term liabilities 7 3 2 9 1 8
D e f e rred income tax cre d i t s 6 1 5 9
Total Liabilities 1 0 , 7 8 4 1 0 , 4 5 8
S h a reholders’ Equity
Common stock, par value $2.50 per share 950,000,000 shares authorized;
issued 391,292,760 shares in 2000 and 1999 9 7 8 9 7 8
Additional paid in capital 8 7 1 8 8 9
Retained earn i n g s 7 , 8 6 9 6 , 9 9 5
Accumulated other comprehensive loss ( 4 8 2 ) ( 1 4 5 )
9 , 2 3 6 8 , 7 1 7
Tre a s u ry stock, at cost 100,808,494 shares in 2000 and 80,871,830 shares in 1999 5 , 8 0 8 4 , 8 0 5
Total Shareholders’ Equity 3 , 4 2 8 3 , 9 1 2
Total Liabilities and Shareholders’ Equity $ 1 4 , 2 1 2 $ 1 4 , 3 7 0
The accompanying notes are an integral part of these financial statements.
Eastman Kodak Company and Subsidiary Companies
Consolidated Statement of Financial Position
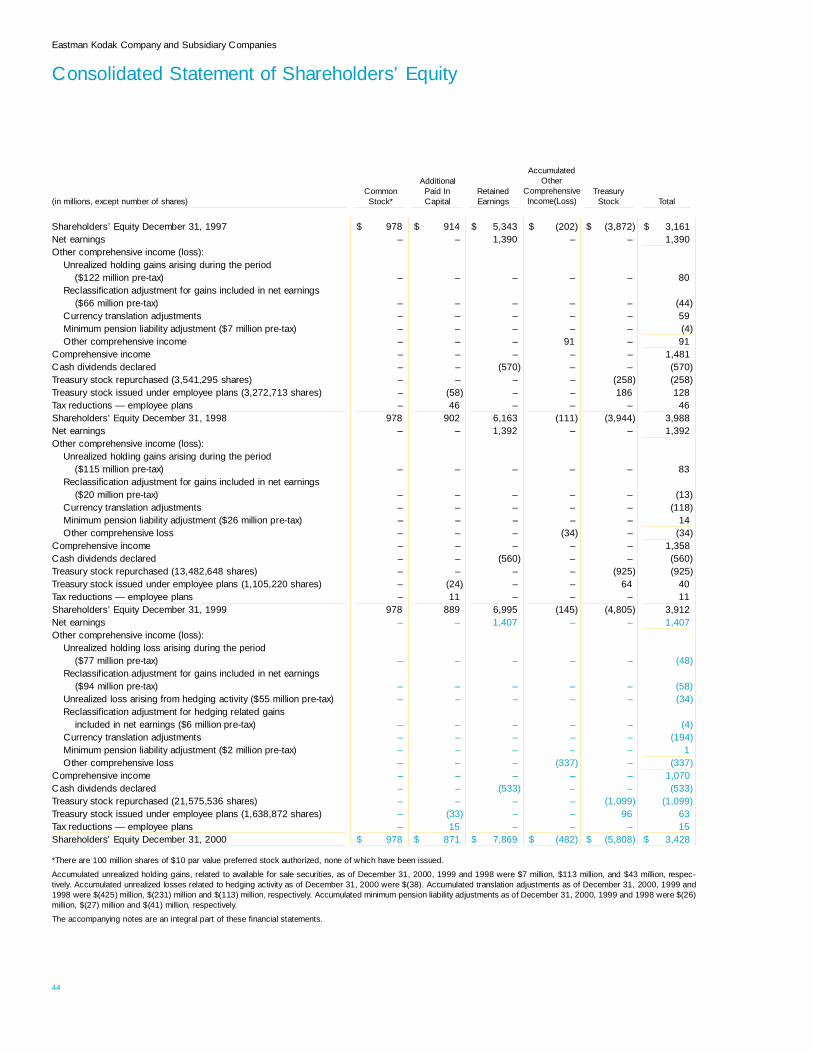
A c c u m u l a t e dO t h e r
A d d i t i o n a l C o m p re h e n s i v eC o m m o n Paid In R e t a i n e d I n c o m e ( L o s s ) Tre a s u ry
(in millions, except number of share s ) S t o c k * C a p i t a l E a rn i n g s S t o c k To t a l
S h a reholders’ Equity December 31, 1997 $ 9 7 8 $ 9 1 4 $ 5 , 3 4 3 $ ( 2 0 2 ) $ ( 3 , 8 7 2 ) $ 3 , 1 6 1Net earn i n g s – – 1 , 3 9 0 – – 1 , 3 9 0Other comprehensive income (loss):
U n realized holding gains arising during the period ($122 million pre - t a x ) – – – – – 8 0
Reclassification adjustment for gains included in net earnings ($66 million pre - t a x ) – – – – – ( 4 4 )
C u rrency translation adjustments – – – – – 5 9Minimum pension liability adjustment ($7 million pre - t a x ) – – – – – ( 4 )Other comprehensive income – – – 9 1 – 9 1
C o m p rehensive income – – – – – 1 , 4 8 1Cash dividends declare d – – ( 5 7 0 ) – – ( 5 7 0 )Tre a s u ry stock re p u rchased (3,541,295 share s ) – – – – ( 2 5 8 ) ( 2 5 8 )Tre a s u ry stock issued under employee plans (3,272,713 share s ) – ( 5 8 ) – – 1 8 6 1 2 8Tax reductions — employee plans – 4 6 – – – 4 6S h a reholders’ Equity December 31, 1998 9 7 8 9 0 2 6 , 1 6 3 ( 1 1 1 ) ( 3 , 9 4 4 ) 3 , 9 8 8Net earn i n g s – – 1 , 3 9 2 – – 1 , 3 9 2Other comprehensive income (loss):
U n realized holding gains arising during the period ($115 million pre - t a x ) – – – – – 8 3
Reclassification adjustment for gains included in net earnings ($20 million pre - t a x ) – – – – – ( 1 3 )
C u rrency translation adjustments – – – – – ( 1 1 8 )Minimum pension liability adjustment ($26 million pre - t a x ) – – – – – 1 4Other comprehensive loss – – – ( 3 4 ) – ( 3 4 )
C o m p rehensive income – – – – – 1 , 3 5 8Cash dividends declare d – – ( 5 6 0 ) – – ( 5 6 0 )Tre a s u ry stock re p u rchased (13,482,648 share s ) – – – – ( 9 2 5 ) ( 9 2 5 )Tre a s u ry stock issued under employee plans (1,105,220 share s ) – ( 2 4 ) – – 6 4 4 0Tax reductions — employee plans – 1 1 – – – 1 1S h a reholders’ Equity December 31, 1999 9 7 8 8 8 9 6 , 9 9 5 ( 1 4 5 ) ( 4 , 8 0 5 ) 3 , 9 1 2Net earn i n g s – – 1 , 4 0 7 – – 1 , 4 0 7Other comprehensive income (loss):
U n realized holding loss arising during the period ($77 million pre - t a x ) – – – – – ( 4 8 )
Reclassification adjustment for gains included in net earnings ($94 million pre - t a x ) – – – – – ( 5 8 )
U n realized loss arising from hedging activity ($55 million pre - t a x ) – – – – – ( 3 4 )Reclassification adjustment for hedging related gains
included in net earnings ($6 million pre - t a x ) – – – – – ( 4 )C u rrency translation adjustments – – – – – ( 1 9 4 )Minimum pension liability adjustment ($2 million pre - t a x ) – – – – – 1Other comprehensive loss – – – ( 3 3 7 ) – ( 3 3 7 )
C o m p rehensive income – – – – – 1 , 0 7 0Cash dividends declare d – – ( 5 3 3 ) – – ( 5 3 3 )Tre a s u ry stock re p u rchased (21,575,536 share s ) – – – – ( 1 , 0 9 9 ) ( 1 , 0 9 9 )Tre a s u ry stock issued under employee plans (1,638,872 share s ) – ( 3 3 ) – – 9 6 6 3Tax reductions — employee plans – 1 5 – – – 1 5S h a reholders’ Equity December 31, 2000 $ 9 7 8 $ 8 7 1 $ 7 , 8 6 9 $ ( 4 8 2 ) $ ( 5 , 8 0 8 ) $ 3 , 4 2 8
* T h e re are 100 million shares of $10 par value pre f e rred stock authorized, none of which have been issued.
Accumulated unrealized holding gains, related to available for sale securities, as of December 31, 2000, 1999 and 1998 were $7 million, $113 million, and $43 million, re s p e c-t i v e l y. Accumulated unrealized losses related to hedging activity as of December 31, 2000 were $(38). Accumulated translation adjustments as of December 31, 2000, 1999 and1998 were $(425) million, $(231) million and $(113) million, re s p e c t i v e l y. Accumulated minimum pension liability adjustments as of December 31, 2000, 1999 and 1998 were $(26)million, $(27) million and $(41) million, re s p e c t i v e l y.
The accompanying notes are an integral part of these financial statements.
44
Eastman Kodak Company and Subsidiary Companies
Consolidated Statement of Shareholders’ Equity
A c c u m u l a t e dO t h e r
C o m p re h e n s i v eI n c o m e ( L o s s )

For the Year Ended December 31, (in millions) 2 0 0 0 1 9 9 9 1 9 9 8
Cash flows from operating activities:
Net earn i n g s $ 1 , 4 0 7 $ 1 , 3 9 2 $ 1 , 3 9 0
Adjustments to reconcile to net cash provided by operating activities:
D e p reciation and amort i z a t i o n 8 8 9 9 1 8 8 5 3
Gains on sales of businesses/assets ( 1 1 7 ) ( 1 6 2 ) ( 1 6 6 )
R e s t ructuring costs, asset impairments and other charg e s – 4 5 3 4 2
P rovision for deferred income taxes 2 3 5 2 4 7 2 0 2
I n c rease in re c e i v a b l e s ( 2 4 7 ) ( 1 2 1 ) ( 1 )
I n c rease in inventories ( 2 8 2 ) ( 2 0 1 ) ( 4 3 )
D e c rease in liabilities excluding borro w i n g s ( 7 5 5 ) ( 4 7 8 ) ( 5 1 6 )
Other items, net ( 1 4 8 ) ( 1 1 5 ) ( 2 7 8 )
Total adjustments ( 4 2 5 ) 5 4 1 9 3
Net cash provided by operating activities 9 8 2 1 , 9 3 3 1 , 4 8 3
Cash flows from investing activities:
Additions to pro p e rt i e s ( 9 4 5 ) ( 1 , 1 2 7 ) ( 1 , 1 0 8 )
P roceeds from sales of businesses/assets 2 7 6 4 6 8 2 9 7
Cash flows related to sales of businesses 1 ( 4 6 ) ( 5 9 )
Acquisitions, net of cash acquire d ( 1 3 0 ) ( 3 ) ( 9 4 9 )
Marketable securities — sales 8 4 1 2 7 1 6 2
Marketable securities — purc h a s e s ( 6 9 ) ( 1 0 4 ) ( 1 8 2 )
Net cash used in investing activities ( 7 8 3 ) ( 6 8 5 ) ( 1 , 8 3 9 )
Cash flows from financing activities:
Net increase (decrease) in borrowings with original maturities of 90 days or less 9 3 9 ( 1 3 6 ) 8 9 4
P roceeds from other borro w i n g s 1 , 3 1 0 1 , 3 4 3 1 , 1 3 3
Repayment of other borro w i n g s ( 9 3 6 ) ( 1 , 1 1 8 ) ( 1 , 2 5 1 )
Dividends to share h o l d e r s ( 5 4 5 ) ( 5 6 3 ) ( 5 6 9 )
E x e rcise of employee stock options 4 3 4 4 1 2 8
Stock re p u rchase pro g r a m s ( 1 , 1 2 5 ) ( 8 9 7 ) ( 2 5 8 )
Net cash (used in) provided by financing activities ( 3 1 4 ) ( 1 , 3 2 7 ) 7 7
E ffect of exchange rate changes on cash ( 1 2 ) ( 5 ) 8
Net decrease in cash and cash equivalents ( 1 2 7 ) ( 8 4 ) ( 2 7 1 )
Cash and cash equivalents, beginning of year 3 7 3 4 5 7 7 2 8
Cash and cash equivalents, end of year $ 2 4 6 $ 3 7 3 $ 4 5 7
Supplemental Cash Flow Inform a t i o n
Cash paid for interest and income taxes was:
I n t e rest, net of portion capitalized of $40, $36 and $41 $ 1 6 6 $ 1 2 0 $ 9 0
Income taxes 4 8 6 4 4 5 4 9 8
The following transactions are not reflected in the Consolidated Statement of Cash Flows:
Contribution of assets to Kodak Polychrome Graphics joint venture $ – $ 1 3 $ –
Minimum pension liability adjustment ( 1 ) ( 1 4 ) 4
Liabilities assumed in acquisitions 3 1 – 4 7 3
The accompanying notes are an integral part of these financial statements.
Eastman Kodak Company and Subsidiary Companies
Consolidated Statement of Cash Flows

Note 1: Significant Accounting Policies
Company Operations Eastman Kodak Company (the Company
or Kodak) is engaged primarily in developing, manufacturing, and
marketing consumer, professional, health and other imaging
p roducts and services. The Company’s products are manufac-
t u red in a number of countries in North and South America,
E u rope, Australia and Asia. The Company’s products are mar-
keted and sold in many countries throughout the world.
Basis of Consolidation The consolidated financial statements
include the accounts of Eastman Kodak Company and its major-
ity owned subsidiary companies. Intercompany transactions are
eliminated and net earnings are reduced by the portion of the earn-
ings of subsidiaries applicable to minority interests. The equity
method of accounting is used for investments in associated com-
panies over which Kodak does not have effective contro l .
Use of Estimates The preparation of financial statements in con-
f o rmity with generally accepted accounting principles re q u i re s
management to make estimates and assumptions that affect the
re p o rted amounts of assets and liabilities and disclosure of con-
tingent assets and liabilities at year end and the re p o rted amounts
of revenues and expenses during the re p o rting period. Actual
results could differ from those estimates.
F o reign Curre n c y For most subsidiaries and branches outside
the U.S., the local currency is the functional currency and trans-
lation adjustments are accumulated in a separate component of
s h a reholders’ equity. Translation adjustments are not tax-eff e c t e d
since they relate to investments which are permanent in nature .
For subsidiaries and branches that operate in U.S. dollars or
whose economic environment is highly inflationary, the U.S. dollar
is the functional curre n c y.
The effects of foreign currency transactions, including
related hedging activities, were losses of $13 million, $2 million,
and $20 million in the years 2000, 1999, and 1998, re s p e c t i v e l y.
Cash Equivalents All highly liquid investments with an original
maturity of three months or less at date of purchase are consid-
e red to be cash equivalents.
Marketable Securities and Noncurrent Investments At Decem-
ber 31, 2000, investments of $5 million, which were included in
marketable securities, were considered held to maturity. Long-
t e rm marketable securities and other investments of $44 million,
which were included in other noncurrent assets, were considere d
available for sale.
At December 31, 1999, investments of $10 million, which
w e re included in marketable securities, were considered held to
m a t u r i t y. Investments of $10 million included in marketable secu-
rities, and $117 million of long-term marketable securities and
other investments which were included in other noncurre n t
assets, were considered available for sale.
I n v e n t o r i e s Inventories are valued at cost, which is not in excess
of market. The cost of most inventories in the U.S. is determ i n e d
by the “last-in, first-out” (LIFO) method. The cost of other inven-
tories is determined by the “first-in, first-out” (FIFO) or average
cost method, which approximates current cost. The Company
p rovides inventory re s e rves for excess, obsolete or slow-moving
i n v e n t o ry based on changes in customer demand, technology
developments or other economic factors.
P ro p e rt i e s P ro p e rties are re c o rded at cost net of accumulated
d e p reciation. Depreciation expense is provided based on histor-
ical cost and estimated useful lives ranging from appro x i m a t e l y
t h ree years to fifty years for buildings and building equipment and
t h ree years to twenty years for machinery and equipment. The
Company generally uses the straight-line method for calculating
the provision for depre c i a t i o n .
G o o d w i l l Goodwill is charged to earnings on a straight-line basis
over the period estimated to be benefited, generally ten years.
The Company regularly assesses all of its long-lived assets for
i m p a i rment when events or circumstances indicate their carry i n g
amounts may not be recoverable, in accordance with SFAS No.
121, “Accounting for the Impairment of Long-Lived Assets and for
Long-Lived Assets to Be Disposed Of.” This is accomplished by
comparing the estimated undiscounted future cash flows of the
asset grouping with the respective carrying amount as of the date
of assessment. Should aggregate future cash flows be less than
the carrying value, a write-down would be re q u i red, measured
as the diff e rence between the carrying value and the discounted
f u t u re cash flows.
R e v e n u e The Company recognizes revenue when it is realized or
realizable and earned. The Company considers revenue re a l i z e d
or realizable and earned when it has persuasive evidence of an
a rrangement, the products or the services have been provided to
the customer, the sales price is fixed or determinable, and col-
lectibility is reasonably assure d .
46
Eastman Kodak Company and Subsidiary Companies
Notes to Financial Statements
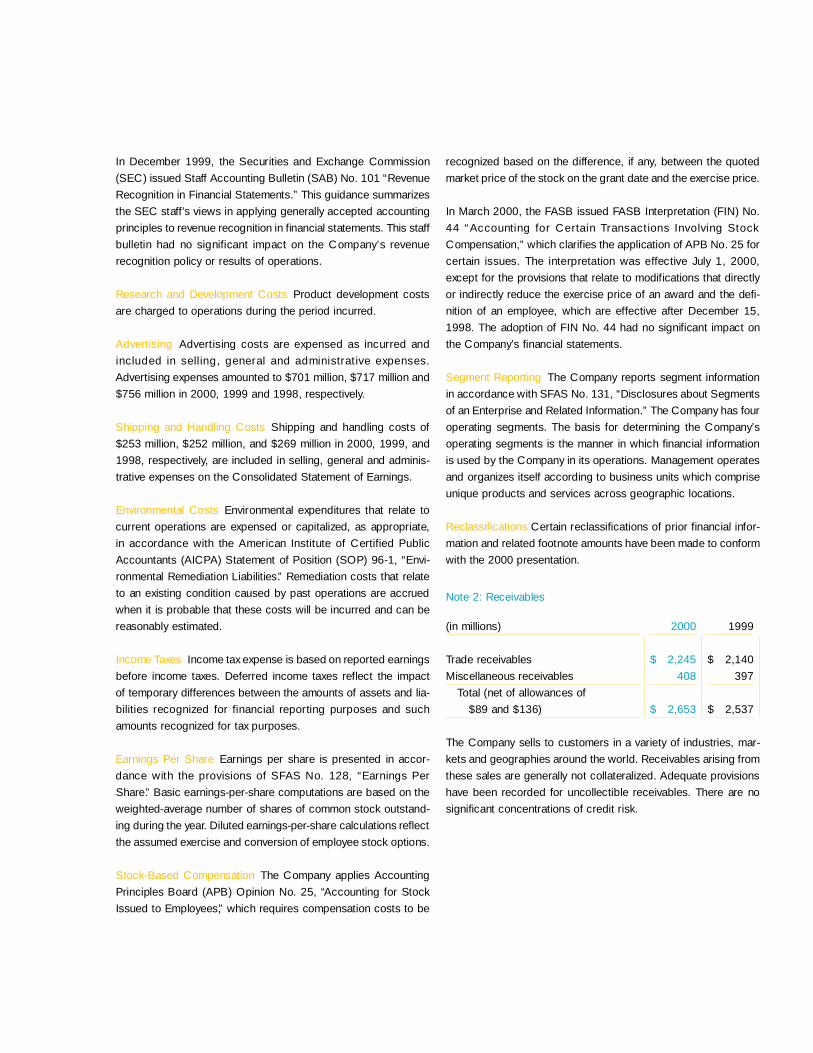
In December 1999, the Securities and Exchange Commission
(SEC) issued Staff Accounting Bulletin (SAB) No. 101 “Revenue
Recognition in Financial Statements.” This guidance summarizes
the SEC staff’s views in applying generally accepted accounting
principles to revenue recognition in financial statements. This staff
bulletin had no significant impact on the Company’s re v e n u e
recognition policy or results of operations.
R e s e a rch and Development Costs P roduct development costs
a re charged to operations during the period incurre d .
A d v e rt i s i n g A d v e rtising costs are expensed as incurred and
included in sell ing, general and administrat ive expenses.
A d v e rtising expenses amounted to $701 million, $717 million and
$756 million in 2000, 1999 and 1998, re s p e c t i v e l y.
Shipping and Handling Costs Shipping and handling costs of
$253 million, $252 million, and $269 million in 2000, 1999, and
1998, re s p e c t i v e l y, are included in selling, general and adminis-
trative expenses on the Consolidated Statement of Earn i n g s .
E n v i ronmental Costs E n v i ronmental expenditures that relate to
c u rrent operations are expensed or capitalized, as appropriate,
in accordance with the American Institute of Certified Public
Accountants (AICPA) Statement of Position (SOP) 96-1, “Envi-
ronmental Remediation Liabilities.” Remediation costs that re l a t e
to an existing condition caused by past operations are accru e d
when it is probable that these costs will be incurred and can be
reasonably estimated.
Income Ta x e s Income tax expense is based on re p o rted earn i n g s
b e f o re income taxes. Deferred income taxes reflect the impact
of temporary diff e rences between the amounts of assets and lia-
bilities recognized for financial re p o rting purposes and such
amounts recognized for tax purposes.
E a rnings Per Share E a rnings per share is presented in accor-
dance with the provisions of SFAS No. 128, “Earnings Per
S h a re.” Basic earn i n g s - p e r- s h a re computations are based on the
weighted-average number of shares of common stock outstand-
ing during the year. Diluted earn i n g s - p e r- s h a re calculations re f l e c t
the assumed exercise and conversion of employee stock options.
Stock-Based Compensation The Company applies Accounting
Principles Board (APB) Opinion No. 25, “Accounting for Stock
Issued to Employees,” which re q u i res compensation costs to be
recognized based on the diff e rence, if any, between the quoted
market price of the stock on the grant date and the exercise price.
In March 2000, the FASB issued FASB Interpretation (FIN) No.
44 “Accounting for Certain Transactions Involving Stock
Compensation,” which clarifies the application of APB No. 25 for
c e rtain issues. The interpretation was effective July 1, 2000,
except for the provisions that relate to modifications that dire c t l y
or indirectly reduce the exercise price of an award and the defi-
nition of an employee, which are effective after December 15,
1998. The adoption of FIN No. 44 had no significant impact on
the Company’s financial statements.
Segment Report i n g The Company re p o rts segment inform a t i o n
in accordance with SFAS No. 131, “Disclosures about Segments
of an Enterprise and Related Information.” The Company has four
operating segments. The basis for determining the Company’s
operating segments is the manner in which financial inform a t i o n
is used by the Company in its operations. Management operates
and organizes itself according to business units which comprise
unique products and services across geographic locations.
Reclassifications C e rtain reclassifications of prior financial infor-
mation and related footnote amounts have been made to conform
with the 2000 pre s e n t a t i o n .
Note 2: Receivables
(in millions) 2 0 0 0 1 9 9 9
Trade re c e i v a b l e s $ 2 , 2 4 5 $ 2 , 1 4 0
Miscellaneous re c e i v a b l e s 4 0 8 3 9 7
Total (net of allowances of
$89 and $136) $ 2 , 6 5 3 $ 2 , 5 3 7
The Company sells to customers in a variety of industries, mar-
kets and geographies around the world. Receivables arising fro m
these sales are generally not collateralized. Adequate pro v i s i o n s
have been re c o rded for uncollectible receivables. There are no
significant concentrations of credit risk.

Note 3: Inventories
(in millions) 2 0 0 0 1 9 9 9
At FIFO or average cost
( a p p roximates current cost)
Finished goods $ 1 , 1 5 5 $ 1 , 0 2 6
Work in pro c e s s 4 2 3 4 8 7
Raw materials and supplies 5 8 9 4 7 1
2 , 1 6 7 1 , 9 8 4
LIFO re s e rv e ( 4 4 9 ) ( 4 6 5 )
To t a l $ 1 , 7 1 8 $ 1 , 5 1 9
Inventories valued on the LIFO method are approximately 47%
and 48% of total inventories in 2000 and 1999, re s p e c t i v e l y.
Note 4: Pro p e rt i e s
(in millions) 2 0 0 0 1 9 9 9
L a n d $ 1 4 1 $ 1 6 6
Buildings and building equipment 2 , 2 8 5 2 , 5 7 9
M a c h i n e ry and equipment 9 , 5 8 5 9 , 6 6 9
C o n s t ruction in pro g re s s 9 5 2 8 7 5
1 2 , 9 6 3 1 3 , 2 8 9
Accumulated depre c i a t i o n ( 7 , 0 4 4 ) ( 7 , 3 4 2 )
Net pro p e rt i e s $ 5 , 9 1 9 $ 5 , 9 4 7
Note 5: Payables and Short - Te rm Borro w i n g s
(in millions) 2 0 0 0 1 9 9 9
Trade cre d i t o r s $ 8 1 7 $ 9 4 0
A c c rued advertising and
p romotional expenses 5 7 8 5 4 8
E m p l o y m e n t - related liabilities 7 8 0 9 1 2
R e s t ructuring pro g r a m s – 3 6 2
O t h e r 1 , 1 0 0 1 , 0 7 0
Total payables $ 3 , 2 7 5 $ 3 , 8 3 2
S h o rt - t e rm bank borrowings totaled $2,206 million at year- e n d
2000 and $1,163 million at year-end 1999. Borrowings included
$1,809 million and $894 million of commercial paper at year- e n d
2000 and 1999, re s p e c t i v e l y. The weighted-average interest rate
of borrowings outstanding at year end was 6.4% in 2000 and
5.8% in 1999.
The Company has a $3.5 billion unused revolving credit facil-
ity established in 1996 and expiring in November 2001 which is
available to support the Company’s commercial paper pro g r a m
and for general corporate purposes. If unused, it has a commit-
ment fee of $1.9 million per year, at the Company’s current cre d i t
rating. Interest on amounts borrowed under this facility is calcu-
lated at rates based on spreads above certain re f e rence rates.
Note 6: Long-Te rm Borro w i n g s
Description and M a t u r i t y
I n t e rest Rates D a t e s
of 2000 of 2000
B o rro w i n g s B o rro w i n g s
(in millions) 2 0 0 0 1 9 9 9
N o t e s :
5 . 8 5 % – 8 . 2 5 % 2 0 0 1 – 2 0 0 5 $ 4 7 3 $ 2 7 2
9 . 2 0 % – 9 . 9 5 % 2 0 0 3 – 2 0 2 1 1 9 1 1 9 1
D e b e n t u re s :
1 . 9 8 % – 3 . 1 6 % 2 0 0 2 – 2 0 0 4 6 1 1 2 2
O t h e r :
2 . 0 0 % – 1 7 . 0 0 % 2 0 0 1 – 2 0 1 0 5 9 1 3 5 3
1 , 3 1 6 9 3 8
C u rrent maturities ( 1 5 0 ) ( 2 )
To t a l $ 1 , 1 6 6 $ 9 3 6
Annual maturities (in millions) of long-term borrowings outstand-
ing at December 31, 2000 are as follows: 2001: $150; 2002:
$73; 2003: $419; 2004: $366; 2005: $260; and 2006 and
beyond: $48.
The Company has a shelf registration statement for debt
securities with an available balance of $1.9 billion.
Note 7: Other Long-Te rm Liabilities
(in millions) 2 0 0 0 1 9 9 9
D e f e rred compensation $ 1 4 6 $ 1 6 0
Minority interest in Kodak companies 9 3 9 8
O t h e r 4 9 3 6 6 0
To t a l $ 7 3 2 $ 9 1 8
48
Description and
I n t e rest Rates
of 2000
B o rro w i n g s
M a t u r i t y
D a t e s
of 2000
B o rro w i n g s

Note 8: Commitments and Contingencies
E n v i ro n m e n t a l E x p e n d i t u res for pollution prevention and waste
t reatment for the Company’s current manufacturing facilities were
as follows:
(in millions) 2 0 0 0 1 9 9 9 1 9 9 8
R e c u rring costs for
managing hazardous
substances and
pollution pre v e n t i o n $ 7 2 $ 6 9 $ 7 5
Capital expenditures
to limit or monitor
h a z a rdous substances
and pollutants 3 6 2 0 2 5
Site remediation costs 3 5 4
To t a l $ 1 1 1 $ 9 4 $ 1 0 4
At December 31, 2000 and 1999, the Company’s undiscounted
a c c rued liabilities for environmental remediation costs amounted
to $113 million and $124 million, re s p e c t i v e l y.
The Company anticipates the above expenditures to incre a s e
in the future. However, it is not expected that these costs will
have an impact which is materially diff e rent from 2000’s enviro n-
mental expenditures on financial position, results of operations,
cash flows or competitive position.
A Consent Decree was signed in 1994 in settlement of a civil
complaint brought by the U.S. Environmental Protection Agency
and the U.S. Department of Justice under which the Company is
subject to a Compliance Schedule by which the Company
i m p roved its waste characterization pro c e d u res, upgraded one of
its incinerators, and is evaluating and upgrading its industrial
sewer system. The total expenditures re q u i red to complete this
p rogram are currently estimated to be approximately $33 million
over the next eight years. These expenditures are primarily capi-
tal in nature .
The Company is presently designated as a potentially
responsible party (PRP) under the Comprehensive Enviro n m e n t a l
Response, Compensation, and Liability Act of 1980, as amended
(the Superfund law), or under similar state laws, for enviro n m e n-
tal assessment and cleanup costs as the result of the Company’s
alleged arrangements for disposal of hazardous substances at
a p p roximately four active Superfund sites. With respect to each
of these sites, the Company’s actual or potential allocated share
of responsibility is small. Furt h e rm o re, numerous other PRPs
have also been designated at these sites and, although the law
imposes joint and several liability on PRPs, as a practical matter,
costs are shared with other PRPs. Settlements and costs paid
by the Company in Superfund matters to date have not been
material. Future costs are also not expected to be material to
the Company’s financial position or results of operations.
In addition to the foregoing environmental actions, the
Company is currently implementing a Corrective Action Pro g r a m
re q u i red by the Resource Conservation and Recovery Act
(RCRA) at the Kodak Park site in Rochester, NY. As part of this
P rogram, the Company has completed the RCRA Facility Assess-
ment (RFA), a broad-based environmental investigation of the site.
The Company is currently in the process of completing, and in
some cases has completed, RCRA Facility Investigations (RFIs)
and Corrective Measures Studies (CMS) for areas at the site.
Estimated future remediation costs are accrued by the Company
and are included in remediation accruals re c o rded at Decem-
ber 31, 2000.
The Clean Air Act Amendments were enacted in 1990.
E x p e n d i t u res to comply with the Clean Air Act implementing re g-
ulations issued to date have not been material and have been
primarily capital in nature. In addition, future expenditures for
existing regulations, which are primarily capital in nature, are not
expected to be material. Many of the regulations to be pro m u l-
gated pursuant to this Act have not been issued.
The Company has retained certain obligations for enviro n-
mental remediation and Superfund matters related to the non-
imaging health businesses sold in 1994. Actions to fulfill these
remedial obligations are not expected to be completed in the near
t e rm and costs related to the obligations are included in accru a l s
re c o rded at December 31, 2000 and 1999. Also included in these
a c c ruals are responsibilities for the liabilities associated with the
non-imaging health businesses as a PRP in approximately four
active Superfund sites.
Other Commitments and Contingencies The Company has
e n t e red into agreements with several companies which pro v i d e
Kodak with products and services to be used in its normal oper-
ations. The minimum payments for these agreements are appro x-
imately $198 million in 2001, $148 million in 2002, $128 million
in 2003, $113 million in 2004, $79 million in 2005, and $201 mil-
lion in 2006 and there a f t e r.
The Company has also guaranteed debt and other obli-
gations under agreements with certain affiliated companies and
customers. At December 31, 2000, these guarantees totaled
a p p roximately $250 million. The Company does not expect that
these guarantees will have a material impact on the Company’s
f u t u re financial position or results of operations.

At December 31, 2000, the Company had outstanding letters
of credit totaling $54 million to ensure the completion of enviro n-
mental remediations and payment of possible casualty and
Workers’ Compensation claims.
Rental expense, net of minor sublease income, amounted to
$155 million in 2000, $142 million in 1999 and $149 million in
1998. The approximate amounts of noncancelable lease commit-
ments with terms of more than one year, principally for the re n t a l
of real pro p e rt y, reduced by minor sublease income, are $104 mil-
lion in 2001, $78 million in 2002, $65 million in 2003, $33 million
in 2004, $24 million in 2005, and $47 million in 2006 and there a f t e r.
The Company and its subsidiary companies are involved
in lawsuits, claims, investigations and proceedings, including
p roduct liability, commercial, environmental, and health and safety
matters, which are being handled and defended in the ord i n a ry
course of business. There are no such matters pending that the
Company and its General Counsel expect to be material in
relation to the Company’s business, financial position or re s u l t s
of operations.
Note 9: Financial Instru m e n t s
The following table presents the carrying amounts and the esti-
mated fair values of financial instruments at December 31, 2000
and 1999; ( ) denotes liabilities:
2 0 0 0 1 9 9 9
C a rry i n g F a i r C a rry i n g F a i r
(in millions) A m o u n t Va l u e A m o u n t Va l u e
Marketable
s e c u r i t i e s :
C u rre n t $ 5 $ 5 $ 2 0 $ 2 0
L o n g - t e rm 4 8 5 3 9 3 9 3
Other
i n v e s t m e n t s 2 2 2 4 3 5
L o n g - t e rm
b o rro w i n g s ( 1 , 1 6 6 ) ( 1 , 1 8 4 ) ( 9 3 6 ) ( 9 4 8 )
F o reign
c u rrency
f o rw a rd s ( 4 4 ) ( 4 4 ) ( 6 ) ( 4 )
Silver forw a rd s ( 1 7 ) ( 1 7 ) – 3
Marketable securities and other investments are valued at quoted
market prices. The fair values of long-term borrowings were
d e t e rmined by re f e rence to quoted market prices or by obtaining
quotes from dealers. The fair values for the remaining financial
i n s t ruments in the above table are based on dealer quotes and
reflect the estimated amounts the Company would pay or re c e i v e
to terminate the contracts. The carrying values of cash and cash
equivalents, receivables, short - t e rm borrowings and payables
a p p roximate their fair values.
The Company, as a result of its global operating and
financing activities, is exposed to changes in foreign curre n c y
exchange rates, commodity prices, and interest rates which may
adversely affect its results of operations and financial position.
The Company manages such exposures, in part, with derivative
financial instru m e n t s .
F o reign currency forw a rd contracts are used to hedge exist-
ing foreign currency denominated assets and liabilities, especially
those of the Company’s International Tre a s u ry Center, as well as
f o recasted foreign currency denominated intercompany sales.
Silver forw a rd contracts are used to mitigate the Company’s risk
to fluctuating silver prices. The Company’s exposure to changes
in interest rates results from its investing and borrowing activities
used to meet its liquidity needs. Long-term debt is generally
used to finance long-term investments, while short - t e rm debt
is used to meet working capital re q u i rements. Derivative instru-
ments are not presently used to adjust the Company’s intere s t
rate risk profile. The Company does not utilize financial instru-
ments for trading or other speculative purposes.
The Company’s financial instrument counterparties are high-
quality investment or commercial banks with significant experi-
ence with such instruments. The Company manages exposure to
c o u n t e r p a rty credit risk by requiring specific minimum credit stan-
d a rds and diversification of counterparties. The Company has
p ro c e d u res to monitor the credit exposure amounts. The maxi-
mum credit exposure at December 31, 2000 was not significant
to the Company.
50

Note 10: Income Ta x e s
The components of earnings before income taxes and the re l a t e d
p rovision for U.S. and other income taxes were as follows:
(in millions) 2 0 0 0 1 9 9 9 1 9 9 8
E a rnings before
income taxes
U . S . $ 1 , 2 9 4 $ 1 , 3 9 8 $ 1 , 5 7 8
Outside the U.S. 8 3 8 7 1 1 5 2 8
To t a l $ 2 , 1 3 2 $ 2 , 1 0 9 $ 2 , 1 0 6
U.S. income taxes
C u rrent pro v i s i o n $ 1 4 5 $ 1 8 5 $ 3 5 1
D e f e rred pro v i s i o n 2 2 5 2 1 5 1 3 6
Income taxes outside
the U.S.
C u rrent pro v i s i o n 2 6 8 2 2 5 1 1 3
D e f e rred pro v i s i o n 3 7 2 3 6 1
State and other
income taxes
C u rrent pro v i s i o n 3 5 6 0 5 0
D e f e rred pro v i s i o n 1 5 9 5
To t a l $ 7 2 5 $ 7 1 7 $ 7 1 6
The diff e rences between the provision for income taxes and
income taxes computed using the U.S. federal income tax rate
w e re as follows:
(in millions) 2 0 0 0 1 9 9 9 1 9 9 8
Amount computed using
the statutory rate $ 7 4 6 $ 7 3 8 $ 7 3 7
I n c rease (reduction) in
taxes resulting fro m :
State and other
income taxes 3 3 4 5 3 8
Goodwill amort i z a t i o n 4 0 3 6 2 8
E x p o rt sales and
manufacturing
c re d i t s ( 4 8 ) ( 4 5 ) ( 3 9 )
Operations outside
the U.S. ( 7 9 ) ( 3 6 ) ( 1 5 )
O t h e r, net 3 3 ( 2 1 ) ( 3 3 )
P rovision for
income taxes $ 7 2 5 $ 7 1 7 $ 7 1 6
The significant components of deferred tax assets and liabilities
w e re as follows:
(in millions) 2 0 0 0 1 9 9 9
D e f e rred tax assets
Postemployment obligations $ 9 1 6 $ 9 9 2
R e s t ructuring pro g r a m s – 7 4
I n v e n t o r i e s 1 3 9 1 5 3
Tax loss carry f o rw a rd s 1 0 3 9 4
O t h e r 8 8 4 9 0 5
2 , 0 4 2 2 , 2 1 8
Valuation allowance ( 1 0 3 ) ( 9 4 )
To t a l $ 1 , 9 3 9 $ 2 , 1 2 4
D e f e rred tax liabilities
D e p re c i a t i o n $ 5 5 5 $ 5 2 7
L e a s i n g 2 2 5 2 6 0
O t h e r 5 9 1 5 3 4
To t a l $ 1 , 3 7 1 $ 1 , 3 2 1
The valuation allowance is primarily attributable to certain net
operating loss carry f o rw a rds outside the U.S. A majority of the
net operating loss carry f o rw a rds are subject to a five-year expi-
ration period.
Retained earnings of subsidiary companies outside the
U.S. were approximately $1,574 million and $1,439 million at
December 31, 2000 and 1999, re s p e c t i v e l y. Retained earnings
at December 31, 2000 are considered to be reinvested indefi-
n i t e l y. If remitted, they would be substantially free of additional
tax. It is not practicable to determine the deferred tax liability for
t e m p o r a ry diff e rences related to these retained earn i n g s .
Note 11: Restructuring Programs and Cost Reduction
During the third quarter of 1999, the Company re c o rded a pre -
tax re s t ructuring charge of $350 million relating to worldwide
manufacturing and photofinishing consolidation and reductions in
selling, general and administrative positions worldwide. The
Company re c o rded $236 million of the $350 million provision as
cost of goods sold, primarily for employee severance costs, asset
write-downs, and shutdown costs related to these actions. The
remaining $114 million was re c o rded as SG&A for employee
severance payments.

In the second quarter of 2000, the Company re v e r s e d
a p p roximately $44 million of severance related costs originally
re c o rded as part of this program. The reversal was the result of
two factors which occurred during the second quart e r. First, cer-
tain manufacturing operations originally planned to be outsourc e d
will now be retained, as cost beneficial arrangements for the
Company could not be reached. Second, severance actions in
Japan and Europe were completed at a cost less than originally
estimated. Consequently, approximately 500 (450 manufacturing
and 50 administrative) fewer employees were separated. Of the
$44 million reversal, approximately $25 million was re c o rded in
cost of goods sold and approximately $19 million was re c o rd e d
as part of SG&A, consistent with where the original charges
w e re re c o rded. Aside from the actions described above, all other
p rojects included in this program were effectively completed
by December 31, 2000. A total of 2,900 employees were term i-
nated under this pro g r a m .
In addition to the charges discussed above, the Company
i n c u rred pre-tax charges of approximately $50 million during 2000
for the accelerated depreciation of certain assets which re m a i n e d
in use until the Company sold its Elmgrove manufacturing facility
in the second quart e r, and related relocation costs. The sale of
this facility did not result in a material gain or loss to the Company.
Also during 2000, the Company completed all planned
actions related to a re s t ructuring program which began in 1997.
The actual cost to complete the 1997 program was in line with
the Company’s expectations.
Note 12: Retirement Plans
Substantially all U.S. employees are covered by a noncontributory
plan, the Kodak Retirement Income Plan (KRIP), which is funded
by Company contributions to an irrevocable trust fund. The fund-
ing policy for KRIP is to contribute amounts sufficient to meet
minimum funding re q u i rements as determined by employee ben-
efit and tax laws plus additional amounts the Company determines
to be appropriate. Generally, benefits are based on a formula
recognizing length of service and final average earnings. Assets
in the fund are held for the sole benefit of participating employ-
ees and re t i rees. The assets of the trust fund are comprised of
corporate equity and debt securities, U.S. government securities,
p a rtnership and joint venture investments, interests in pooled
funds, and various types of interest rate, foreign currency and
equity market financial instruments. Kodak common stock re p re-
sents approximately 4.0% of trust assets.
On March 25, 1999, the Company amended this plan to
include a separate cash balance formula for all U.S. employees
h i red after Febru a ry 1999. All U.S. employees hired prior to that
date were granted the option to choose the KRIP plan or the
Cash Balance Plus plan. Written elections were made by employ-
ees in 1999, and were effective January 1, 2000. The Cash
Balance Plus plan credits employees’ accounts with an amount
equal to 4% of their pay, plus interest based on the 30-year tre a s-
u ry bond rate. In addition, for employees participating in this plan
and the Company’s defined contribution plan, the Savings and
Investment Plan (SIP), the Company will match SIP contributions
for an amount up to 3% of pay, for employee contributions of up
to 5% of pay. As a result of employee elections to the Cash
Balance Plus plan, the reductions in future pension expense will
be almost entirely offset by the cost of matching employee con-
tributions to SIP. The impact of the Cash Balance Plus plan is
shown as a plan amendment.
Most subsidiaries and branches operating outside the U.S.
have re t i rement plans covering substantially all employees. Con-
tributions by the Company for these plans are typically deposited
under government or other fiduciary-type arrangements. Retire-
ment benefits are generally based on contractual agreements that
p rovide for benefit formulas using years of service and/or com-
pensation prior to re t i rement. The actuarial assumptions used for
these plans reflect the diverse economic environments within the
various countries in which the Company operates.
52
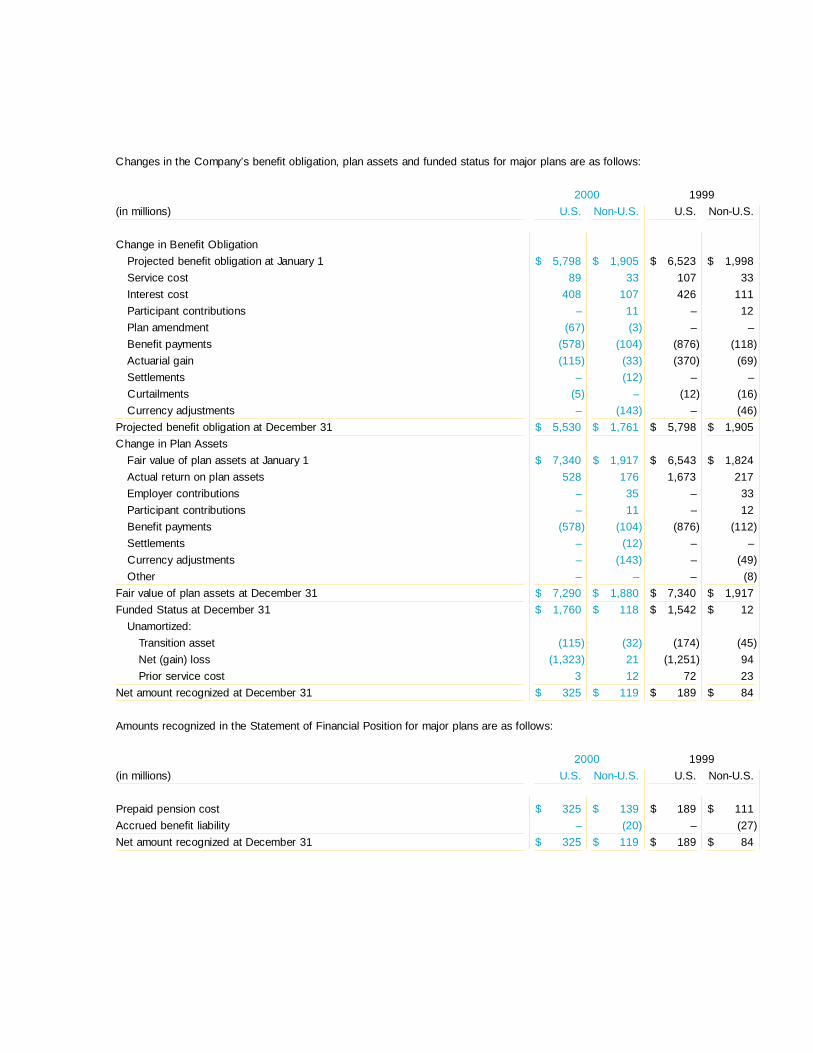
Changes in the Company’s benefit obligation, plan assets and funded status for major plans are as follows:
2 0 0 0 1 9 9 9
(in millions) U . S . N o n - U . S . U . S . N o n - U . S .
Change in Benefit Obligation
P rojected benefit obligation at January 1 $ 5 , 7 9 8 $ 1 , 9 0 5 $ 6 , 5 2 3 $ 1 , 9 9 8
S e rvice cost 8 9 3 3 1 0 7 3 3
I n t e rest cost 4 0 8 1 0 7 4 2 6 1 1 1
P a rticipant contributions – 1 1 – 1 2
Plan amendment ( 6 7 ) ( 3 ) – –
Benefit payments ( 5 7 8 ) ( 1 0 4 ) ( 8 7 6 ) ( 1 1 8 )
Actuarial gain ( 1 1 5 ) ( 3 3 ) ( 3 7 0 ) ( 6 9 )
S e t t l e m e n t s – ( 1 2 ) – –
C u rt a i l m e n t s ( 5 ) – ( 1 2 ) ( 1 6 )
C u rrency adjustments – ( 1 4 3 ) – ( 4 6 )
P rojected benefit obligation at December 31 $ 5 , 5 3 0 $ 1 , 7 6 1 $ 5 , 7 9 8 $ 1 , 9 0 5
Change in Plan Assets
Fair value of plan assets at January 1 $ 7 , 3 4 0 $ 1 , 9 1 7 $ 6 , 5 4 3 $ 1 , 8 2 4
Actual re t u rn on plan assets 5 2 8 1 7 6 1 , 6 7 3 2 1 7
Employer contributions – 3 5 – 3 3
P a rticipant contributions – 1 1 – 1 2
Benefit payments ( 5 7 8 ) ( 1 0 4 ) ( 8 7 6 ) ( 1 1 2 )
S e t t l e m e n t s – ( 1 2 ) – –
C u rrency adjustments – ( 1 4 3 ) – ( 4 9 )
O t h e r – – – ( 8 )
Fair value of plan assets at December 31 $ 7 , 2 9 0 $ 1 , 8 8 0 $ 7 , 3 4 0 $ 1 , 9 1 7
Funded Status at December 31 $ 1 , 7 6 0 $ 1 1 8 $ 1 , 5 4 2 $ 1 2
U n a m o rt i z e d :
Transition asset ( 1 1 5 ) ( 3 2 ) ( 1 7 4 ) ( 4 5 )
Net (gain) loss ( 1 , 3 2 3 ) 2 1 ( 1 , 2 5 1 ) 9 4
Prior service cost 3 1 2 7 2 2 3
Net amount recognized at December 31 $ 3 2 5 $ 1 1 9 $ 1 8 9 $ 8 4
Amounts recognized in the Statement of Financial Position for major plans are as follows:
2 0 0 0 1 9 9 9
(in millions) U . S . N o n - U . S . U . S . N o n - U . S .
P repaid pension cost $ 3 2 5 $ 1 3 9 $ 1 8 9 $ 1 1 1
A c c rued benefit liability – ( 2 0 ) – ( 2 7 )
Net amount recognized at December 31 $ 3 2 5 $ 1 1 9 $ 1 8 9 $ 8 4

The Company re c o rded a $3 million curtailment gain in 2000 and
a $9 million curtailment loss in 1999 as a result of the re d u c t i o n
in employees from the 1997 re s t ructuring program. Additionally,
the Company re c o rded a $10 million curtailment gain in 1999 as
a result of the sale of the Office Imaging business, which was
included in the gain on the sale.
The weighted assumptions used to compute pension
amounts for major plans were as follows:
2 0 0 0 1 9 9 9
U . S . N o n - U . S . U . S . N o n - U . S .
Discount rate 7 . 5 % 6 . 1 % 7 . 5 % 6 . 1 %
S a l a ry increase
r a t e 4 . 3 % 3 . 1 % 4 . 3 % 3 . 2 %
L o n g - t e rm rate
of re t u rn on
plan assets 9 . 5 % 8 . 7 % 9 . 5 % 8 . 7 %
The Company also sponsors an unfunded plan for certain U.S.
employees, primarily executives. The benefits of this plan are
obtained by applying KRIP provisions to all compensation, includ-
ing amounts being deferred, and without re g a rd to the legislated
qualified plan maximums, reduced by benefits under KRIP. At
December 31, 2000 and 1999, the projected benefit obligations
of this plan amounted to $187 million and $192 million, re s p e c-
t i v e l y. The Company had re c o rded long-term liabilities at those
dates of $171 million and $174 million, re s p e c t i v e l y. Pension
expense re c o rded in 2000, 1999 and 1998 related to this plan
was $34 million, $21 million and $26 million, re s p e c t i v e l y.
54
Pension expense (income) for all plans included:
2 0 0 0 1 9 9 9 1 9 9 8
(in millions) U . S . N o n - U . S . U . S . N o n - U . S . U . S . N o n - U . S .
S e rvice cost $ 8 9 $ 3 3 $ 1 0 7 $ 3 4 $ 1 2 2 $ 3 3
I n t e rest cost 4 0 8 1 0 7 4 2 6 1 1 1 4 4 4 1 1 8
Expected re t u rn on plan assets ( 5 7 2 ) ( 1 4 7 ) ( 5 3 7 ) ( 1 3 7 ) ( 5 5 1 ) ( 1 3 7 )
A m o rtization of:
Transition asset ( 5 9 ) ( 1 0 ) ( 5 9 ) ( 1 0 ) ( 6 0 ) ( 9 )
Prior service cost 1 8 1 0 8 1 2 8
Actuarial loss – 3 2 1 0 1 1 5
( 1 3 3 ) ( 6 ) ( 5 1 ) 1 6 ( 2 2 ) 1 8
C u rt a i l m e n t s ( 3 ) – ( 1 ) – 7 1
S e t t l e m e n t s – 1 – – – 1
Net pension (income) expense ( 1 3 6 ) ( 5 ) ( 5 2 ) 1 6 ( 1 5 ) 2 0
Other plans including unfunded plans 4 1 6 9 3 3 5 1 3 6 4 6
Total net pension (income) expense $ ( 9 5 ) $ 6 4 $ ( 1 9 ) $ 6 7 $ 2 1 $ 6 6

Note 13: Nonpension Postre t i rement Benefits
The Company provides healthcare, dental and life insurance
benefits to U.S. eligible re t i rees and eligible survivors of re t i re e s .
In general, these benefits are provided to U.S. re t i rees that are
c o v e red by the Company’s KRIP plan. These benefits are funded
f rom the general assets of the Company as they are incurre d .
C e rtain non-U.S. subsidiaries offer healthcare benefits; however,
the cost of such benefits is insignificant to the Company.
Changes in the Company’s benefit obligation and funded
status are as follows:
(in millions) 2 0 0 0 1 9 9 9
Net benefit obligation at
beginning of year $ 2 , 3 0 7 $ 2 , 2 8 0
S e rvice cost 1 2 1 3
I n t e rest cost 1 6 9 1 5 2
Plan participants’ contributions 3 3
Plan amendments 6 2 ( 3 3 )
Actuarial loss 2 2 9 7 0
C u rt a i l m e n t s 1 ( 1 3 )
Benefit payments ( 1 8 1 ) ( 1 6 5 )
Net benefit obligation
at end of year $ 2 , 6 0 2 $ 2 , 3 0 7
Funded status at end of year $ ( 2 , 6 0 2 ) $ ( 2 , 3 0 7 )
U n a m o rtized net loss 7 0 0 4 9 1
U n a m o rtized plan amendments ( 5 1 0 ) ( 6 4 6 )
Net amount recognized and
re c o rded at end of year $ ( 2 , 4 1 2 ) $ ( 2 , 4 6 2 )
The weighted-average assumptions used to compute postre t i re-
ment benefit amounts were as follows:
2 0 0 0 1 9 9 9
Discount rate 7 . 5 % 7 . 5 %
S a l a ry increase rate 4 . 3 % 4 . 3 %
H e a l t h c a re cost tre n d( a ) 8 . 0 % 8 . 5 %
( a )d e c reasing to 5.0% by 2007
(in millions) 2 0 0 0 1 9 9 9 1 9 9 8
Components of net
p o s t re t i rement
benefit cost
S e rvice cost $ 1 2 $ 1 3 $ 1 9
I n t e rest cost 1 6 9 1 5 2 1 6 1
A m o rtization of:
Prior service cost ( 6 7 ) ( 6 8 ) ( 7 0 )
Actuarial loss 1 8 8 1 6
1 3 2 1 0 5 1 2 6
C u rt a i l m e n t s ( 6 ) ( 9 0 ) ( 1 0 3 )
Total net postre t i rement
benefit cost $ 1 2 6 $ 1 5 $ 2 3
The Company re c o rded a $6 million and $71 million gain in 2000
and 1999, re s p e c t i v e l y, as a result of the reduction in employees
in those years from the 1997 re s t ructuring program. Additionally,
the Company re c o rded a $15 million curtailment gain in 1999 as
a result of the sale of the Office Imaging business, which was
included in the gain on the sale, and a $4 million curtailment gain
as part of the investment in the joint venture with NexPre s s .
The Company will no longer fund healthcare and dental ben-
efits for employees who elected to participate in the Company’s
Cash Balance Plus plan, effective January 1, 2000. This change
is not expected to have a material impact on the Company’s future
p o s t re t i rement benefit cost.

Assumed healthcare cost trend rates have a significant eff e c t
on the amounts re p o rted for the healthcare plans. A one per-
centage point change in assumed healthcare cost trend rates
would have the following eff e c t s :
1 % 1 %
i n c re a s e d e c re a s e
E ffect on total service and interest
cost components $ 6 $ ( 4 )
E ffect on postre t i rement benefit
o b l i g a t i o n 8 3 ( 5 2 )
Note 14: Stock Option And Compensation Plans
The Company’s stock incentive plans consist of the 2000
Omnibus Long-Te rm Compensation Plan (the 2000 Plan), the
1995 Omnibus Long-Te rm Compensation Plan (the 1995 Plan),
and the 1990 Omnibus Long-Te rm Compensation Plan (the 1990
Plan). The Plans are administered by the Executive Compensation
and Development Committee of the Board of Dire c t o r s .
Under the 2000 Plan, 22 million shares of the Company’s
common stock may be granted to a variety of employees between
J a n u a ry 1, 2000 and December 31, 2004. The 2000 Plan is sub-
stantially similar to, and is intended to replace, the 1995 Plan
which expired on December 31, 1999.
Under the 1995 Plan, 22 million shares of the Company’s
common stock were eligible for grant to a variety of employees
between Febru a ry 1, 1995 and December 31, 1999. Option
prices are not less than 100% of the per- s h a re fair market value
on the date of grant, and the options generally expire ten years
f rom the date of grant, but may expire sooner if the optionee’s
employment terminates. The 1995 Plan also provides for Stock
A p p reciation Rights (SARs) to be granted, either in tandem with
options or freestanding. SARs allow optionees to receive pay-
ment equal to the diff e rence between the Company’s stock mar-
ket price on grant date and exercise date. At December 31, 2000,
229,215 freestanding SARs were outstanding at option prices
ranging from $56.31 to $71.81.
Under the 1990 Plan, 22 million shares of the Company’s
common stock were eligible for grant to key employees between
F e b ru a ry 1, 1990 and January 31, 1995. Option prices could not
be less than 50% of the per- s h a re fair market value on the date
of grant; however, no options below fair market value were
granted. The options generally expire ten years from the date of
grant, but may expire sooner if the optionee’s employment term i-
nates. The 1990 Plan also provided that options with dividend
equivalents, tandem SARs and freestanding SARs could be
granted. At December 31, 2000, 106,754 freestanding SARs
w e re outstanding at option prices ranging from $32.50 to $44.50.
In April 1998, the Company made a grant of 100 stock
options for common stock to most employees of the Company at
that date (8,468,100 shares under options). The options were
granted at fair market value on the date of grant and expire ten
years from the grant date. The options have a two-year vesting
period. The Executive Compensation and Development Commit-
tee of the Board of Directors approved the grant. A second grant
of 100 stock options for common stock was made on March 13,
2000 to most employees of the Company at that date (7,004,400
s h a res under options). The options were granted at fair market
value on the date of grant and expire ten years from the grant
date. The options have a two-year vesting period.
56

F u rther information relating to options is as follows:
S h a re s
(Amounts in thousands, U n d e r Range of Price
except per share amounts) O p t i o n Per Share
Outstanding on
December 31, 1997 2 4 , 2 0 4 $ 3 0 . 2 5 – $ 9 2 . 3 1
G r a n t e d 1 4 , 5 4 6 $ 5 9 . 0 0 – $ 8 7 . 5 9
E x e rc i s e d 3 , 2 0 8 $ 3 0 . 2 5 – $ 8 2 . 0 0
Te rminated, Canceled
or Surre n d e re d 1 , 2 1 1 $ 3 1 . 4 5 – $ 8 3 . 3 8
Outstanding on
December 31, 1998 3 4 , 3 3 1 $ 3 0 . 2 5 – $ 9 2 . 3 1
G r a n t e d 4 , 2 7 6 $ 6 0 . 1 3 – $ 7 9 . 6 3
E x e rc i s e d 1 , 1 0 1 $ 3 0 . 2 5 – $ 7 4 . 3 1
Te rminated, Canceled
or Surre n d e re d 4 7 3 $ 3 1 . 4 5 – $ 9 2 . 3 1
Outstanding on
December 31, 1999 3 7 , 0 3 3 $ 3 0 . 2 5 – $ 9 2 . 3 1
G r a n t e d 1 2 , 5 3 3 $ 3 7 . 2 5 – $ 6 9 . 5 3
E x e rc i s e d 1 , 3 2 6 $ 3 0 . 2 5 – $ 5 8 . 6 3
Te rminated, Canceled
or Surre n d e re d 3 , 3 9 4 $ 3 1 . 4 5 – $ 9 0 . 5 0
Outstanding on
December 31, 2000 4 4 , 8 4 6 $ 3 2 . 5 0 – $ 9 2 . 3 1
E x e rcisable on
December 31, 2000 2 8 , 7 8 3 $ 3 2 . 5 0 – $ 9 2 . 3 1
P ro forma net earnings and earnings per share information, as
re q u i red by SFAS No. 123, “Accounting for Stock-Based Com-
p e n s a t i o n,” has been determined as if the Company had accounted
for employee stock options under SFAS No. 123’s fair value
method. The fair value of options was estimated at grant date
using a Black-Scholes option pricing model with the following
weighted-average assumptions:
2 0 0 0 1 9 9 9 1 9 9 8
Risk free interest rates 6 . 2 % 5 . 1 % 5 . 6 %
Expected option lives 7 years 7 years 7 years
Expected volatilities 2 9 % 2 8 % 2 7 %
Expected dividend yields 3 . 1 9 % 2 . 7 6 % 2 . 7 1 %
The weighted-average fair value of options granted was $16.79,
$18.77 and $19.94 for 2000, 1999 and 1998, re s p e c t i v e l y.
For purposes of pro forma disclosures, the estimated fair value
of the options is amortized to expense over the options’ vesting
period (2-3 years). The Company’s pro forma information follows:
Year Ended December 31,
(in millions,
except per share data) 2 0 0 0 1 9 9 9 1 9 9 8
Net earn i n g s
As re p o rt e d $ 1 , 4 0 7 $ 1 , 3 9 2 $ 1 , 3 9 0
P ro form a 1 , 3 4 6 1 , 2 6 3 1 , 2 7 2
Basic earnings per share
As re p o rt e d $ 4 . 6 2 $ 4 . 3 8 $ 4 . 3 0
P ro form a 4 . 4 1 3 . 9 7 3 . 9 4
Diluted earnings per share
As re p o rt e d $ 4 . 5 9 $ 4 . 3 3 $ 4 . 2 4
P ro form a 4 . 4 1 3 . 9 6 3 . 9 3

Note 15: Acquisitions and Joint Ve n t u re s
2 0 0 0 During the second quart e r, the Company acquired the
remaining ownership interest in Picture Vision, Inc. for cash and
assumed liabilities with a total transaction value of appro x i m a t e l y
$90 million. Picture Vision, the leading provider of digital imaging
network services and solutions at retail, now operates as a wholly-
owned subsidiary of the Company. Kodak has integrated the
p roducts and activities of its Picture Network, which pro v i d e s
consumers with an Internet-based digital imaging network serv-
ice, with Picture Vi s i o n ’s digital imaging service, PhotoNet. In re l a-
tion to this acquisition, the Company’s second quarter re s u l t s
included $10 million in charges for acquired in-process R&D and
a p p roximately $15 million for other acquisition-related charg e s .
Goodwill related to this acquisition is being amortized over 7 years.
1 9 9 9 In connection with the sale of the Company’s digital printer,
c o p i e r- d u p l i c a t o r, and roller assembly operations primarily asso-
ciated with the Office Imaging business (See Note 16, Sales
of Assets and Divestitures), the Company and Heidelberg e r
D ruckmaschinen AG (Heidelberg) also announced an agre e m e n t
to expand their joint venture company, NexPress, to include the
black-and-white electrophotographic business. The Company
contributed R&D re s o u rces to NexPress, as well as its toner and
developer operations in Rochester and Kirkby, England. This
transaction did not have a material effect on the Company’s
results of operations or financial position in 1999. Kodak and
H e i d e l b e rg established the NexPress joint venture in September
1997 for the purpose of developing and marketing new digital
color printing solutions for the graphic arts industry. In connec-
tion with these arrangements, the Company serves as a supplier
both to Heidelberg and NexPress for consumables such as pho-
t o c o n d u c t o r s and raw materials for toner/developer manufacturing.
58
The following table summarizes information about stock options at December 31, 2000:
(Number of options in thousands) Options Outstanding Options Exerc i s a b l e
We i g h t e d -
Range of Exercise Prices Av e r a g e We i g h t e d - We i g h t e d -
R e m a i n i n g Av e r a g e Av e r a g e
A t L e s s C o n t r a c t u a l E x e rc i s e E x e rc i s e
L e a s t T h a n O p t i o n s L i f e P r i c e O p t i o n s P r i c e
$ 3 0 – $ 4 5 6 , 8 8 9 2 . 7 3 $ 4 0 . 0 4 6 , 3 4 8 $ 4 0 . 0 2
$ 4 5 – $ 6 0 1 3 , 4 3 3 7 . 9 4 $ 5 4 . 4 9 3 , 2 3 0 $ 5 4 . 1 8
$ 6 0 – $ 7 5 2 1 , 4 0 6 7 . 0 7 $ 6 7 . 7 7 1 6 , 7 3 8 $ 6 8 . 3 7
$ 7 5 – $ 9 0 9 9 6 6 . 7 7 $ 8 0 . 4 3 8 4 5 $ 8 0 . 9 6
Over $90 2 , 1 2 2 6 . 1 5 $ 9 0 . 1 9 1 , 6 2 2 $ 9 0 . 2 1
4 4 , 8 4 6 2 8 , 7 8 3
(Number of options in thousands)
1 9 9 8 On March 12, 1998, the Company acquired 51% of
P i c t u re Vision Inc.’s stock for approximately $50 million. The
acquisition was accounted for as a purchase and, accord i n g l y,
the operating results of the business have been included in the
accompanying consolidated financial statements from the date
of acquisition.
In Febru a ry 1998, the Company contributed $308 million
to Kodak (China) Company Limited (KCCL), a newly form e d
company operating in China, in exchange for 80% of the out-
standing shares of the company. On March 25 and September 1,
1998, the new company acquired certain manufacturing assets
of Shantou Era Photo Material Industry Corporation, a Chinese
domestic photographic enterprise, for $159 million in cash and
$22 million in debt payable in 2003. On March 26, 1998, KCCL
a c q u i red certain manufacturing assets of Xiamen Fuda Photo-
graphic Materials Company, Ltd., another Chinese domestic
photographic enterprise, for $149 million.
In Febru a ry 1998, the Company contributed $32 million to
Kodak (Wuxi) Company Limited (KWCL), a newly formed com-
pany operating in China, in exchange for 70% of the outstanding
s h a res of the business. On April 2, 1998, KWCL acquired part
of the manufacturing assets of Wuxi Aermei Film and Chemical
Corporation, a Chinese domestic photographic enterprise, for
$11 million in cash and $21 million in debt payable in 1999.
The acquisitions by KCCL and KWCL were accounted for
as purchases and, accord i n g l y, the operating results of the
a c q u i red companies have been included in the accompanying
consolidated financial statements from the dates of acquisition.
Substantial portions of the purchase prices were allocated to
goodwill, which is being amortized over a ten-year period.
On November 30, 1998, Kodak acquired certain assets and
assumed certain liabilities of Imation’s medical imaging business,
including all of the outstanding shares of Imation’s Cemax-Icon
s u b s i d i a ry, for approximately $530 million. At the date of acquisi-
tion, the business acquired by Kodak generated appro x i m a t e l y
$500 million in annual revenues. The transaction was accounted
for by the purchase method and, accord i n g l y, the operating
results of the business have been included in the accompanying
consolidated financial statements from the date of acquisition. A
substantial portion of the purchase price was allocated to tangi-
ble assets and goodwill, which is being amortized over a ten-year
period. See discussion re g a rding in-process R&D charges below.
P u rchased In-process Research and Development Charg e s I n
connection with the 2000 Picture Vision Inc. acquisition and the
1998 purchase of Imation’s medical imaging business, the
Company allocated $10 million and $42 million of the purc h a s e
price, re s p e c t i v e l y, to in-process R&D.
The Company used independent professional appraisal
consultants to assess and allocate values to the in-process R&D.
At the dates of the respective business combinations, the devel-
opment of these projects had not yet reached technological
feasibility and the R&D in pro g ress had no alternative uses.
A c c o rd i n g l y, these costs were expensed as of the re s p e c t i v e
acquisition dates.
The valuations were determined by the Company using the
income approach. This methodology involves estimating the con-
tribution of the purchased in-process technology to developing
c o m m e rcially viable products and estimating the resulting cash
flows from the expected product sales of such products. The
resulting cash flows were discounted to their present value using
a p p ropriate risk adjusted rates. Cash flows attributable to devel-
opment eff o rts, including the completion of developments under-
w a y, and future versions of the product that have not yet been
u n d e rtaken, were excluded in the valuation of in-process R&D.
A contributory asset charge was applied for the use of working
capital, fixed assets, developed technology and other intangibles.
There were no material anticipated changes from historical pricing,
m a rgins, and expense tre n d s .
The Company believes that the assumptions used in the fore-
casts were reasonable at the time of the respective business
combinations. No assurance can be given, however, that the
underlying assumptions used to estimate expected project sales,
development costs or pro f i t a b i l i t y, or the events associated with
such projects, will transpire as estimated. For these re a s o n s ,
actual results may vary from the projected re s u l t s .

Management plans to continue supporting the viable re m a i n-
ing R&D programs and believes the Company has a re a s o n a b l e
chance of successfully completing the remaining R&D pro g r a m s .
H o w e v e r, there is a risk associated with the completion of the
R&D projects and the Company cannot be assured that these
p rojects will result in commercial success.
Without successful completion of the remaining R&D eff o rt s
on the acquired in-process technologies, the end result would be
to fail to fulfill product design specifications and in turn fail to
meet market re q u i rements. As a result, the Company would not
realize the future revenues and profits attributed to the acquire d
R&D. Ultimately, the Company would fail to realize the expected
re t u rn on such investments. The failure of any particular individ-
ual in-process R&D project would not materially impact the
C o m p a n y ’s financial position or results of operations. Operating
results are subject to uncertain market events and risks, which
a re beyond the Company’s control, such as trends in technology,
market size and growth, and product introduction or other actions
by competitors.
P i c t u re Vi s i o n The in-process technology acquired fro m
P i c t u re Vision primarily related to two projects: PhotoNet2 and
the PhotoRamp valued at $16 million and $4 million. These pro j-
ects resulted in a total in-process R&D charge of $10 million,
reflecting the Company’s 49% acquisition.
PhotoNet2, or P2, is an enhanced version of Picture Vi s i o n ’s
original PhotoNet system which will allow higher capacity and
activity levels. PhotoNet essentially allows photofinishers to scan
(digitize) rolls of film and upload the images to a branded web site
that stores the images in a database for consumer use. The
PhotoRamp is designed to provide digitization of existing photos
as opposed to digitization of film and will support a variety of film
types including 35mm, Advantix, 110, and 120 films.
The PhotoRamp was completed in 2000 and P2 is expected
to be completed in 2001. The remaining costs to complete P2 are
not anticipated to be material.
Imation Medical Imaging The in-process technology acquire d
f rom Imation consists of eight R&D projects within three bro a d
technology groupings: Dry, Imagesetting, and Analog.
Work on all in-process technology projects related to this
acquisition was concluded in 2000. The imagesetting pro j e c t s
w e re discontinued while cash inflows from the remaining acquire d
technology commenced in 2000. These inflows are expected to
peak in 2001 and steadily decline through 2007.
A c q u i red developed technology of approximately $90 million
was capitalized at acquisition date and is being amortized over
seven years on a straight-line basis.
Note 16: Sales of Assets and Divestiture s
1 9 9 9 In April 1999, the Company sold its digital printer, copier-
d u p l i c a t o r, and roller assembly operations primarily associated
with its Office Imaging business, which included its operations in
R o c h e s t e r, NY, Muehlhausen, Germany and Tijuana, Mexico to
H e i d e l b e rg for approximately $80 million. The transaction did not
have a material effect on the Company’s results of operations or
financial position.
In November 1999, the Company sold The Image Bank, a
wholly-owned subsidiary which markets and licenses image
re p roduction rights, to Getty Images, Inc. for $183 million in cash.
As a result of this transaction, the Company re c o rded a pre - t a x
gain of $95 million in other income (charg e s ) .
In November 1999, the Company sold its Motion Analysis
Systems Division, which manufactures digital cameras and digi-
tal video cameras for the automotive and industrial markets, to
Roper Industries, Inc. for approximately $50 million in cash. As a
result of this transaction, the Company re c o rded a pre-tax gain of
$25 million in other income (charg e s ) .
60

1 9 9 8 In June 1998, the Company sold part of its investment in
G retag Imaging Group, a Swiss manufacturer of film pro c e s s i n g
equipment, in connection with Gre t a g ’s initial public offering. The
p roceeds from the sale were $72 million and resulted in a pre - t a x
gain of $66 million in other income (charg e s ) .
On September 1, 1998, the Company sold all of its share s
of Fox Photo, Inc. to Wolf Camera for an amount appro x i m a t i n g
the current value of Fox Photo’s net assets.
On October 1, 1998, Elan Corporation, plc purchased
f rom Kodak all the assets and liabilities of Kodak’s subsidiary
NanoSystems L.L.C., a drug delivery company, for appro x i m a t e l y
$150 million in a combination of $137 million cash and warr a n t s
to purchase ord i n a ry shares in Elan. The Company re c o rded a
p re-tax gain of $87 million in other income (charges) on the sale
in the fourth quarter of 1998.
In the fourth quarter of 1998, financial difficulties on the part
of Danka affected its ability to fulfill the original terms of cert a i n
of its agreements with the Company which were established in
connection with the sale of the Office Imaging business in 1996.
As a result, in December 1998, the Company’s supply agre e m e n t
and certain other agreements with Danka were terminated and
interim arrangements for the supply by the Company to Danka of
copier equipment, parts and supplies were established on a
month-to-month basis. As a result of significant volume re d u c-
tions by Danka, the Company was re q u i red to take action in the
f o u rth quarter of 1998 that resulted in charges for employee
severance (800 personnel) and write-downs of working capital
and equipment. Such pre-tax charges amounted to $132 mil-
lion and were re c o rded to cost of goods sold ($68 million) and
SG&A expenses ($64 million). All actions with respect to this
c h a rge, including employee terminations, were completed by the
Company in 1998.
Note 17: Segment Inform a t i o n
The Consumer Imaging segment derives revenues from photo-
graphic film, paper, chemicals, cameras, photoprocessing equip-
ment, digitization services, and photoprocessing services sold
to consumers. The Kodak Professional segment derives re v e n u e s
f rom photographic film, paper, chemicals, and digital cameras
sold to professional customers and graphics film products sold
to the KPG joint venture. The Health Imaging segment derives
revenues from medical film and processing equipment sold to
h e a l t h c a re organizations. The Other Imaging segment derives re v-
enues from motion picture film sold to movie production and dis-
tr ibution companies, and microfilm equipment and media,
printers, scanners, other business equipment, document imaging
s o f t w a re, and consumer digital cameras and media sold to com-
m e rcial and government customers.
Transactions between segments, which are immaterial,
a re made on a basis intended to reflect the market value of
the products, recognizing prevailing market prices and distribu-
tor discounts. Diff e rences between the re p o rtable segments’
operating results and net assets, and the Company’s consoli-
dated financial statements relate primarily to items held at the
corporate level, and to other items excluded from segment oper-
ating measure m e n t s .
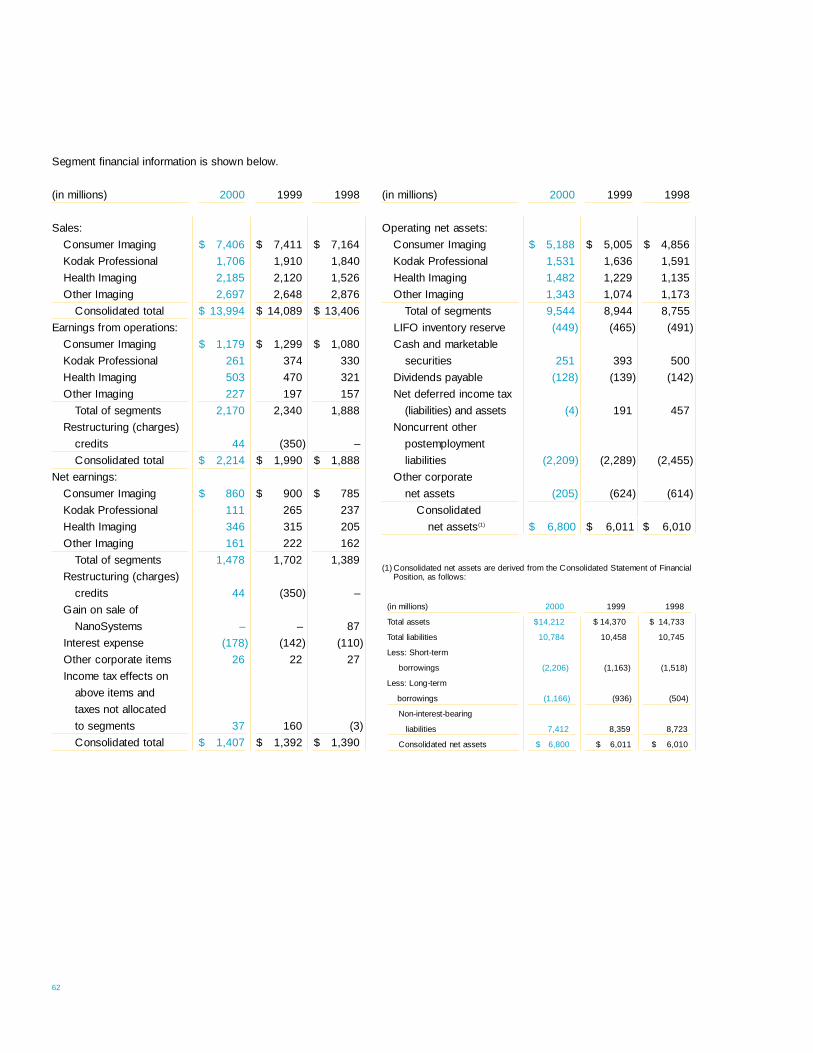
(in millions) 2 0 0 0 1 9 9 9 1 9 9 8
Operating net assets:
Consumer Imaging $ 5 , 1 8 8 $ 5 , 0 0 5 $ 4 , 8 5 6
Kodak Pro f e s s i o n a l 1 , 5 3 1 1 , 6 3 6 1 , 5 9 1
Health Imaging 1 , 4 8 2 1 , 2 2 9 1 , 1 3 5
Other Imaging 1 , 3 4 3 1 , 0 7 4 1 , 1 7 3
Total of segments 9 , 5 4 4 8 , 9 4 4 8 , 7 5 5
LIFO inventory re s e rv e ( 4 4 9 ) ( 4 6 5 ) ( 4 9 1 )
Cash and marketable
s e c u r i t i e s 2 5 1 3 9 3 5 0 0
Dividends payable ( 1 2 8 ) ( 1 3 9 ) ( 1 4 2 )
Net deferred income tax
(liabilities) and assets ( 4 ) 1 9 1 4 5 7
N o n c u rrent other
postemployment
l i a b i l i t i e s ( 2 , 2 0 9 ) ( 2 , 2 8 9 ) ( 2 , 4 5 5 )
Other corporate
net assets ( 2 0 5 ) ( 6 2 4 ) ( 6 1 4 )
Consolidated
net assets ( 1 ) $ 6 , 8 0 0( )$ 6 , 0 1 1 $ 6 , 0 1 0
D e p reciation expense:
Segment financial information is shown below.
(in millions) 2 0 0 0 1 9 9 9 1 9 9 8
S a l e s :
Consumer Imaging $ 7 , 4 0 6 $ 7 , 4 1 1 $ 7 , 1 6 4
Kodak Pro f e s s i o n a l 1 , 7 0 6 1 , 9 1 0 1 , 8 4 0
Health Imaging 2 , 1 8 5 2 , 1 2 0 1 , 5 2 6
Other Imaging 2 , 6 9 7 2 , 6 4 8 2 , 8 7 6
Consolidated total $ 1 3 , 9 9 4 $ 1 4 , 0 8 9 $ 1 3 , 4 0 6
E a rnings from operations:
Consumer Imaging $ 1 , 1 7 9 $ 1 , 2 9 9 $ 1 , 0 8 0
Kodak Pro f e s s i o n a l 2 6 1 3 7 4 3 3 0
Health Imaging 5 0 3 4 7 0 3 2 1
Other Imaging 2 2 7 1 9 7 1 5 7
Total of segments 2 , 1 7 0 2 , 3 4 0 1 , 8 8 8
R e s t ructuring (charg e s )
c re d i t s 4 4 ( 3 5 0 ) –
Consolidated total $ 2 , 2 1 4 $ 1 , 9 9 0 $ 1 , 8 8 8
Net earn i n g s :
Consumer Imaging $ 8 6 0 $ 9 0 0 $ 7 8 5
Kodak Pro f e s s i o n a l 1 1 1 2 6 5 2 3 7
Health Imaging 3 4 6 3 1 5 2 0 5
Other Imaging 1 6 1 2 2 2 1 6 2
Total of segments 1 , 4 7 8 1 , 7 0 2 1 , 3 8 9
R e s t ructuring (charg e s )
c re d i t s 4 4 ( 3 5 0 ) –
Gain on sale of
N a n o S y s t e m s – – 8 7
I n t e rest expense ( 1 7 8 ) ( 1 4 2 ) ( 1 1 0 )
Other corporate items 2 6 2 2 2 7
Income tax effects on
above items and
taxes not allocated
to segments 3 7 1 6 0 ( 3 )
Consolidated total $ 1 , 4 0 7 $ 1 , 3 9 2 $ 1 , 3 9 0
62
(in millions) 2 0 0 0 1 9 9 9 1 9 9 8
Total assets $1 4 , 2 1 2 $ 1 4 , 3 7 0 $ 1 4 , 7 3 3
Total liabilities 1 0 , 7 8 4 1 0 , 4 5 8 1 0 , 7 4 5
Less: Short - t e rm
b o rro w i n g s ( 2 , 2 0 6 ) ( 1 , 1 6 3 ) ( 1 , 5 1 8 )
Less: Long-term
b o rro w i n g s ( 1 , 1 6 6 ) ( 9 3 6 ) ( 5 0 4 )
N o n - i n t e rest-bearing
l i a b i l i t i e s 7 , 4 1 2 8 , 3 5 9 8 , 7 2 3
Consolidated net assets $ 6 , 8 0 0 $ 6 , 0 1 1 $ 6 , 0 1 0
( 1 ) Consolidated net assets are derived from the Consolidated Statement of FinancialPosition, as follows:

Note 18: Subsequent Events
On Febru a ry 7, 2001, the Company completed its acquisi-
tion of substantially all of the imaging businesses of Bell & Howell
C o m p a n y. The purchase price of this stock and asset acquisition
was $135 million in cash. The acquired units provide business
customers worldwide with maintenance for document imaging
components, micro g r a p h i c - related equipment, supplies, part s
and serv i c e .
Note 19: Quarterly Sales and Earnings Data—Unaudited
(in millions,
except per 4th 3 rd 2nd 1st
s h a re data) Q t r. Q t r. Q t r. Q t r.
2 0 0 0
S a l e s $ 3 , 5 6 0 $ 3 , 5 9 0 $ 3 , 7 4 9 $ 3 , 0 9 5
G ross pro f i t 1 , 3 2 7 1 , 6 0 3 1 , 7 0 6 1 , 3 3 9
Net earn i n g s 1 9 4( 1 ) 4 1 8( 1 ) 5 0 6( 1 ) 2 8 9( 1 )
Basic earnings
per share( 5 ) . 6 6 1 . 3 7 1 . 6 3 . 9 3
Diluted
e a rnings
per share( 5 ) . 6 6 1 . 3 6 1 . 6 2 . 9 3
1 9 9 9
S a l e s $ 3 , 7 9 9 $ 3 , 5 8 0 $ 3 , 6 1 0 $ 3 , 1 0 0
G ross pro f i t 1 , 6 5 4 1 , 4 9 3 1 , 7 2 4 1 , 2 3 1
Net earn i n g s 4 7 5( 2 ) 2 3 5( 3 ) 4 9 1 1 9 1( 4 )
Basic earnings
per share( 5 ) 1 . 5 1 . 7 4 1 . 5 4 . 5 9
Diluted
e a rnings
per share( 5 ) 1 . 5 0 . 7 3 1 . 5 2 . 5 9
( 1 ) Includes charges related to the sale and exit of a manufacturing facility of $11 mil-lion, $12 million, $18 mil lion, and $9 mil lion, which reduced net earnings by $7 million, $8 million, $12 million, and $6 million in the first, second, third and fourt hq u a rters, re s p e c t i v e l y.
( 2 ) Includes a gain of $95 million on the sale of The Image Bank, which increased nete a rnings by $63 million; a gain of $25 million on the sale of the Motion AnalysisSystems Division, which increased net earnings by $16 million; and $11 million ofc h a rges related to the sale and exit of a manufacturing facility, which reduced nete a rnings by $7 million.
( 3 ) Includes $350 mil lion of re s t ructuring costs, which reduced net earnings by $231 million.
( 4 ) Includes $103 million of charges associated with business exits, which reduced nete a rnings by $68 million.
( 5 ) Each quarter is calculated as a discrete period and the sum of the four quarters maynot equal the full year amount.
(in millions) 2 0 0 0 1 9 9 9 1 9 9 8
D e p reciation expense:
Consumer Imaging $ 3 6 8 $ 3 9 6 $ 4 0 1
Kodak Pro f e s s i o n a l 9 9 1 0 0 1 1 7
Health Imaging 9 2 8 2 5 1
Other Imaging 1 7 9 1 9 5 1 6 8
Consolidated total $ 7 3 8 $ 7 7 3 $ 7 3 7
Goodwill amortization:
Consumer Imaging $ 7 7 $ 9 4 $ 7 7
Kodak Pro f e s s i o n a l 1 3 1 3 1 0
Health Imaging 2 7 2 4 8
Other Imaging 3 4 1 4 2 1
Consolidated total $ 1 5 1 $ 1 4 5 $ 1 1 6
Capital additions:
Consumer Imaging $ 5 0 7 $ 7 2 5 $ 6 2 2
Kodak Pro f e s s i o n a l 1 2 3 1 4 7 1 4 3
Health Imaging 1 2 0 9 2 8 8
Other Imaging 1 9 5 1 6 3 2 5 5
Consolidated total $ 9 4 5 $ 1 , 1 2 7 $ 1 , 1 0 8
Sales to external customers
attributed to:( 2 )
The United States $ 6 , 8 0 0 $ 6 , 7 1 4 $ 6 , 4 1 7
E u rope, Middle East
and Africa 3 , 4 6 4 3 , 7 3 4 3 , 7 0 1
Asia Pacific 2 , 3 4 9 2 , 2 6 7 2 , 0 0 9
Canada and
Latin America 1 , 3 8 1 1 , 3 7 4 1 , 2 7 9
Consolidated total $ 1 3 , 9 9 4 $ 1 4 , 0 8 9 $ 1 3 , 4 0 6
Long-lived assets
located in:
The United States $ 3 , 9 1 3 $ 3 , 9 0 4 $ 4 , 0 4 4
E u rope, Middle East
and Africa 6 4 7 7 1 5 8 6 1
Asia Pacific 1 , 0 5 6 1 , 0 2 4 7 0 4
Canada and
Latin America 3 0 3 3 0 4 3 0 5
Consolidated total $ 5 , 9 1 9 $ 5 , 9 4 7 $ 5 , 9 1 4
( 2 ) Sales are re p o rted in the geographic area in which they originate.
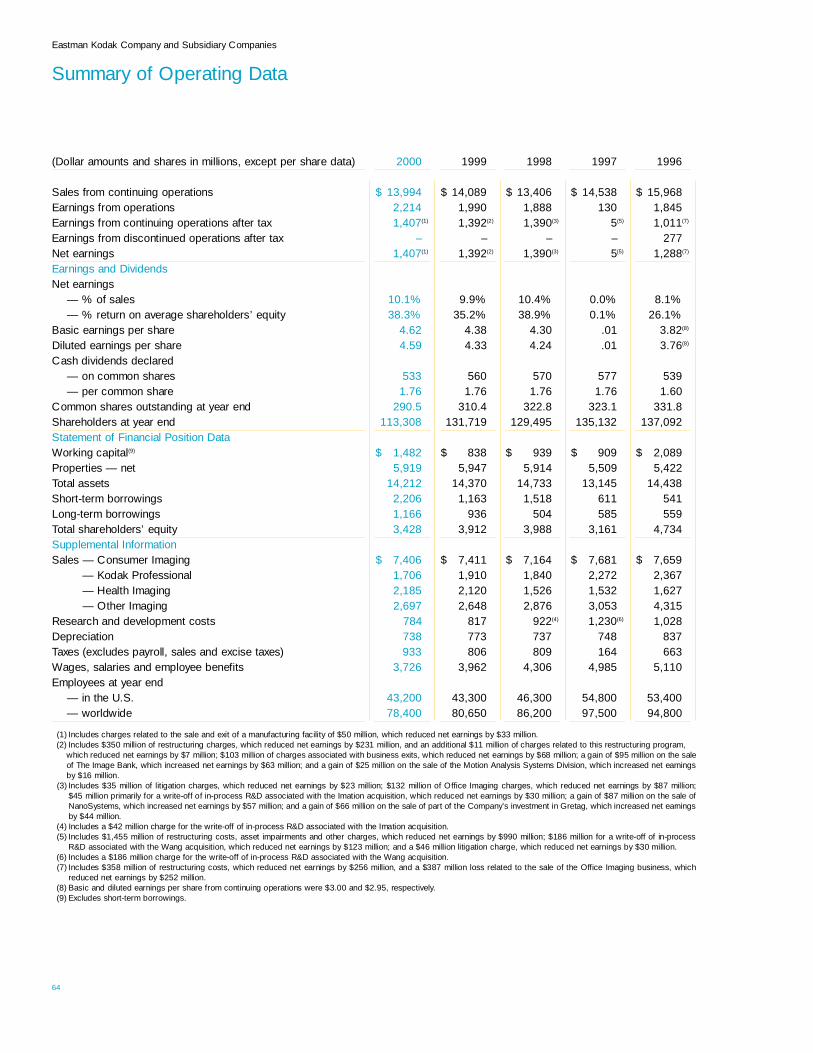
(Dollar amounts and shares in millions, except per share data) 2 0 0 0 1 9 9 9 1 9 9 8 1 9 9 7 1 9 9 6
Sales from continuing operations $ 1 3 , 9 9 4 $ 1 4 , 0 8 9 $ 1 3 , 4 0 6 $ 1 4 , 5 3 8 $ 1 5 , 9 6 8
E a rnings from operations 2 , 2 1 4 1 , 9 9 0 1 , 8 8 8 1 3 0 1 , 8 4 5
E a rnings from continuing operations after tax 1 , 4 0 7( 1 ) 1 , 3 9 2(2) 1 , 3 9 0( 3 ) 5( 5 ) 1 , 0 1 1( 7 )
E a rnings from discontinued operations after tax – – – – 2 7 7
Net earn i n g s 1 , 4 0 7( 1 ) 1 , 3 9 2( 2 ) 1 , 3 9 0( 3 ) 5( 5 ) 1 , 2 8 8( 7 )
E a rnings and Dividends
Net earn i n g s
— % of sales 1 0 . 1 % 9 . 9 % 1 0 . 4 % 0 . 0 % 8 . 1 %
— % re t u rn on average shareholders’ equity 3 8 . 3 % 3 5 . 2 % 3 8 . 9 % 0 . 1 % 2 6 . 1 %
Basic earnings per share 4 . 6 2 4 . 3 8 4 . 3 0 . 0 1 3 . 8 2( 8 )
Diluted earnings per share 4 . 5 9 4 . 3 3 4 . 2 4 . 0 1 3 . 7 6( 8 )
Cash dividends declare d
— on common share s 5 3 3 5 6 0 5 7 0 5 7 7 5 3 9
— per common share 1 . 7 6 1 . 7 6 1 . 7 6 1 . 7 6 1 . 6 0
Common shares outstanding at year end 2 9 0 . 5 3 1 0 . 4 3 2 2 . 8 3 2 3 . 1 3 3 1 . 8
S h a reholders at year end 1 1 3 , 3 0 8 1 3 1 , 7 1 9 1 2 9 , 4 9 5 1 3 5 , 1 3 2 1 3 7 , 0 9 2
Statement of Financial Position Data
Working capital( 9 ) $ 1 , 4 8 2 $ 8 3 8 $ 9 3 9 $ 9 0 9 $ 2 , 0 8 9
P ro p e rties — net 5 , 9 1 9 5 , 9 4 7 5 , 9 1 4 5 , 5 0 9 5 , 4 2 2
Total assets 1 4 , 2 1 2 1 4 , 3 7 0 1 4 , 7 3 3 1 3 , 1 4 5 1 4 , 4 3 8
S h o rt - t e rm borro w i n g s 2 , 2 0 6 1 , 1 6 3 1 , 5 1 8 6 1 1 5 4 1
L o n g - t e rm borro w i n g s 1 , 1 6 6 9 3 6 5 0 4 5 8 5 5 5 9
Total shareholders’ equity 3 , 4 2 8 3 , 9 1 2 3 , 9 8 8 3 , 1 6 1 4 , 7 3 4
Supplemental Inform a t i o n
S a l e s — Consumer Imaging $ 7 , 4 0 6 $ 7 , 4 1 1 $ 7 , 1 6 4 $ 7 , 6 8 1 $ 7 , 6 5 9
— Kodak Pro f e s s i o n a l 1 , 7 0 6 1 , 9 1 0 1 , 8 4 0 2 , 2 7 2 2 , 3 6 7
— Health Imaging 2 , 1 8 5 2 , 1 2 0 1 , 5 2 6 1 , 5 3 2 1 , 6 2 7
— Other Imaging 2 , 6 9 7 2 , 6 4 8 2 , 8 7 6 3 , 0 5 3 4 , 3 1 5
R e s e a rch and development costs 7 8 4( 2 ) 8 1 7 9 2 2( 4 ) 1 , 2 3 0( 6 ) 1 , 0 2 8
D e p re c i a t i o n 7 3 8 7 7 3 7 3 7 7 4 8 8 3 7
Taxes (excludes payroll, sales and excise taxes) 9 3 3 8 0 6 8 0 9 1 6 4 6 6 3
Wages, salaries and employee benefits 3 , 7 2 6 3 , 9 6 2 4 , 3 0 6 4 , 9 8 5 5 , 1 1 0
Employees at year end
— in the U.S. 4 3 , 2 0 0 4 3 , 3 0 0 4 6 , 3 0 0 5 4 , 8 0 0 5 3 , 4 0 0
— worldwide 7 8 , 4 0 0 8 0 , 6 5 0 8 6 , 2 0 0 9 7 , 5 0 0 9 4 , 8 0 0
( 1 ) Includes charges related to the sale and exit of a manufacturing facility of $50 million, which reduced net earnings by $33 million.( 2 ) Includes $350 million of re s t ructuring charges, which reduced net earnings by $231 million, and an additional $11 million of charges related to this re s t ructuring pro g r a m ,
which reduced net earnings by $7 million; $103 million of charges associated with business exits, which reduced net earnings by $68 million; a gain of $95 million on the saleof The Image Bank, which increased net earnings by $63 million; and a gain of $25 million on the sale of the Motion Analysis Systems Division, which increased net earn i n g sby $16 million.
( 3 ) Includes $35 million of litigation charges, which reduced net earnings by $23 million; $132 million of Office Imaging charges, which reduced net earnings by $87 million; $45 million primarily for a write-off of in-process R&D associated with the Imation acquisition, which reduced net earnings by $30 million; a gain of $87 million on the sale ofNanoSystems, which increased net earnings by $57 million; and a gain of $66 million on the sale of part of the Company’s investment in Gretag, which increased net earn i n g sby $44 million.
( 4 ) Includes a $42 million charge for the write-off of in-process R&D associated with the Imation acquisition.( 5 ) Includes $1,455 million of re s t ructuring costs, asset impairments and other charges, which reduced net earnings by $990 million; $186 million for a write-off of in-pro c e s s
R&D associated with the Wang acquisition, which reduced net earnings by $123 million; and a $46 million litigation charge, which reduced net earnings by $30 million.( 6 ) Includes a $186 million charge for the write-off of in-process R&D associated with the Wang acquisition.( 7 ) Includes $358 million of re s t ructuring costs, which reduced net earnings by $256 million, and a $387 million loss related to the sale of the Office Imaging business, which
reduced net earnings by $252 million.( 8 ) Basic and diluted earnings per share from continuing operations were $3.00 and $2.95, re s p e c t i v e l y.( 9 ) Excludes short - t e rm borro w i n g s .
64
Eastman Kodak Company and Subsidiary Companies
S u m m a ry of Operating Data

To Share h o l d e r s :
For Kodak, the year 2000 marked continued, diligent attention to
world-class principles and practices in the Health, Safety and
E n v i ronment (HSE) arena.
It also was a year in which we:
1 . recycled our 427 millionth one-time-use camera; 2 . a d v a n c e d
our worldwide manufacturing systems to the brink of
complete International Standards Organization 14001
E n v i ronmental Management System registration; 3 . p a rt n e re d
with the U.S. Environmental Protection Agency (EPA) on a pro j-
ect promoting computer-based screening of new chemicals; 4 .
extended even further our support for environmental education
and outreach initiatives; 5 . conducted a rigorous external audit of
our HSE Assessment Pro g r a m .
H e re ’s a bit more information on each of these achievements:
1. One-Time-Use Camera Recycling In 2000, Kodak re c y c l e d
116 million one-time-use cameras, which meant we diverted 19
million pounds of material from landfills. Since 1990, Kodak has
recycled 427 million one-time-use cameras and diverted 71 mil-
lion pounds from landfills.
As a point of comparison, the recycling rate for aluminum
cans in the United States is approximately 63 percent. For
Kodak one-time-use cameras in the United States, the re c y c l i n g
rate is 74 perc e n t .
2. ISO 14001 Environmental Management System Registration
Four more Kodak manufacturing sites — two in China, one in
India, and one in Ore g on — attained ISO 14001 registration in
the year 2000. To date, 23 manufacturing sites worldwide have
achieved this registration by adhering to the stringent enviro n-
mental re q u i rements set by the ISO. In addition, the Corporate
HSE program has attained ISO 14001 registration. By year end
2001, it is expected that every Kodak major manufacturing site
worldwide will have achieved this cert i f i c a t i o n .
3. EPA Pro j e c t Kodak and the U.S. EPA signed an innovative
agreement that will lead to significant reduction in waste, improve-
ments in cycle time, and savings in R&D costs while enabling
Kodak to produce more environmentally friendly products.
Kodak will use a series of pollution-prevention, computer-
ized tools developed by EPA to screen chemicals while they are
in early stages of development. The agreement is part of the
E PA’s Project XL (eXcellence and Leadership).
2000 Kodak Health, Safety, and Environment
4. Education and Outreach Kodak continued to support efforts to
encourage conservation of resources and to help more people —
p a rticularly young people — to learn about biodiversity. Thro u g h
the Kodak American Greenways Aw a rds, we support an initiative
of The Conservation Fund which promotes green corridors and
open spaces across the United States. Through World Wi l d l i f e
F u n d ’s “Windows on the Wild” program, we help children to
c o m p rehend the meaning and importance of biodiversity. In
2000, we also began an affiliation with the National Parks
Foundation as one of five corporate “Proud Partners” who have
pledged to help encourage the public to learn about, to experi-
ence, and to get involved with the 380 U.S. National Parks. We
also are strong supporters of The Nature Conserv a n c y.
5. Outstanding Audit Every three years, we submit our Corporate
HSE Assessment Program to a rigorous audit by an independent
f i rm that specializes in environmental assessments and consult-
ing. In 2000, the URS Corporation of San Francisco conducted
the audit and found that Kodak’s HSE Assessment Program “met
or exceeded” every one of URS’ 13 key assessment criteria.
The executive summary of that audit noted that Kodak’s
Corporate HSE Assessment Program “is a premier quality pro-
gram that provides the company with an accurate measure m e n t
of worldwide HSE compliance,” and “the program is actively sup-
p o rted by senior management.”
A Look to the Future While we are proud of our accomplishments
in the year 2000, we mostly view them as a solid foundation for a
new century and a new millennium of environmental stewardship.
Daniel A. Carp
C h a i rman, President and Chief Executive Off i c e r
R. Hays Bell
Vi c e - P resident, Dire c t o r, Health,Safety and Environment
C h a i rman, Health,Safety and Environment Coordinating Committee
Charles S. Brown, Jr.
Senior Vi c e - P resident, Dire c t o r, Global Manufacturing
C h a i rman, Health, Safety and Environmental Management Council

L e a d e r s h i p Last year, Kodak re a ff i rmed its commitment to diver-
sity by naming May Snowden as the company’s first Chief
Diversity Off i c e r. She will guide and direct Kodak’s pro g re s s
t o w a rds its diversity goals with the aims of fully engaging the
talents of all employees and maximizing the support we enjoy
f rom the external communities we serve.
“At Kodak,” Ms. Snowden says, “our commitment to diver-
sity means shaping our culture so that all stakeholders contribute
fully to our success as a global leader in imaging. I believe that
holding ourselves accountable for higher diversity standards will
lead to a healthier business, and to healthier communities as well.”
Kodak is Committed to Diversity as a Wo r k f o rce Strategy A t
Kodak, we know that our prime source of sustainable competitive
advantage is our people and the effectiveness of their work
t o g e t h e r. Diverse opinions and fresh ideas create the most com-
petitive solutions. To aggressively re c ruit people of color (POC)
and women, we have part n e red with colleges and universities
that historically graduate these students, and attend local, regional
and national conferences and career fairs.
Eastman Kodak Company: United States Wo r k f o rc e
Voice of Employees When our employees were asked about
their workplace, a full seventy-two percent agreed that their
s u p e rvisors demonstrate respect for the styles, personalities,
and viewpoints of others. More than half of all employees agre e
that Kodak is creating an inclusive environment that values diversity.
O ff i c e r s M e a s u rement is the hallmark of Kodak’s commitment to
integration of diversity and inclusion into our day-to-day opera-
tion. Each officer is held accountable for his or her re s u l t s
through the Leadership and Diversity metric of the M a n a g e m e n t
P e rf o rmance Commitment Process (MPCP) that is tied to a por-
tion of compensation. This measures pro g ress in workforc e
diversity and culture transformation. Senior managers re g u l a r l y
m e a s u re pro g ress as part of ongoing operational reviews.
P e rcent Wo m e n P e rcent POC
0 0 9 9 9 8 0 0 9 9 09 80
Total U.S. Employees 3 7 % 3 7 % 3 7 % 2 1 % 2 1 % 2 0 %B o a rd of Dire c t o r s 3 3 % 3 3 % 2 3 % 8 % 0 % 8 %Senior Managers,
D i rectors, Managers and Superv i s o r s 3 0 % 2 7 % 2 7 % 1 2 % 1 1 % 1 0 %
Exempt Individual C o n t r i b u t o r s 2 9 % 2 9 % 2 8 % 1 1 % 1 1 % 9 %
Nonexempt Contributors 4 1 % 4 1 % 4 1 % 2 5 % 2 5 % 2 4 %
66
2000 Global Diversity
CEO Diversity Aw a rd The Kodak CEO Diversity Aw a rd is pre-
sented annually to a Kodak middle- or senior-level manager
who demonstrates excellence in advancing the company’s
diversity initiatives. Candidates for the award are nominated
by other employees and are judged on the basis of demon-
strated achievements.
In 2000, there were two honorees: Patricia A. Bitnar,
Regional Business General Manager, and Vice President, Kodak
P rofessional, Latin American Region, and Charles S. Bro w n ,
D i rector of Global Manufacturing, and Senior Vice Pre s i d e n t ,
Eastman Kodak Company.
Ms. Bitnar has received many accolades for helping women
and minorities break new ground within the company’s Latin
American Region. Mr. Brown is frequently cited as a role model
for his aggressive eff o rts to create and sustain an inclusive envi-
ronment within Kodak’s Global Manufacturing are a .
Kodak is Committed to Our Communities Kodak contributes to
the vitality of the communities and the strength of the local
economies in which our company does business. Kodak actively
s u p p o rts and promotes eff o rts to strengthen education, econom-
ic development of minority communities, and equal employment
o p p o rt u n i t y. Among the organizations we proudly support are :
N A A C P, National Urban League, National Council of La Raza,
the American Indian Science and Engineering Society and the
Society of Women Engineers.
Supplier Diversity Kodak continues to benchmark against
A m e r i c a ’s leading companies as we accelerate our goals for
Supplier Diversity. By doing business with more minority-owned
and women-owned enterprises, we expand our purc h a s i n g
options, help create new jobs and enjoy increased access to
i m p o rtant markets.
Last year alone, our Supplier Diversity team awarded more
than $240 million in contracts to qualified contractors and sub-
contractors, who are now part of our supplier network. Our sen-
ior purchasing managers have a portion of their future compensa-
tion tied to their success in building upon these diversity accom-
plishments.
E x t e rnal Recognition We continue to establish a standard of
excellence that is recognized extern a l l y. Highlights from the year
2000 include: 100 Best Companies for Working Mothers —
Working Mother magazine / Top 50 Blacks in Corporate
A m e r i c a (Lance Drummond, COO of Kodak Professional) —
Black Enterprisemagazine / 50 Top Companies for Hispanic
E m p l o y e es — Latina Stylemagazine / Out & Equal Wo r k p l a c e
Aw a rd — Out and Equal Workplace Advocates.

Corporate Directory
B o a rd of Dire c t o r s
Daniel A. Carp*C h a i rman, President & Chief Executive Off i c e rEastman Kodak Company6
R i c h a rd S. BraddockC h a i rm a np r i c e l i n e . c o m3, 2, 6
M a rtha Layne CollinsExecutive Scholar in ResidenceG e o rgetown College, Kentucky5, 1, 6
Alice F. EmersonSenior AdvisorThe Andrew W. Mellon Foundation2, 3
Paul E. GrayP resident Emeritus & Pro f e s s o rMassachusetts Institute of Te c h n o l o g y1, 5, 6
Durk I. JagerR e t i red Chairman, President & Chief Executive Off i c e rThe Procter & Gamble Company4, 3, 6
Debra L. LeeP resident & Chief Operating Off i c e rBET Holdings, Inc.2, 5
John J. Phelan, Jr.R e t i red Chairman & Chief Executive Off i c e rNew York Stock Exchange, Inc.3, 4
Hector de J. RuizP resident and Chief Operating Off i c e rAdvanced Micro Devices, Inc.1, 5
Laura D’Andrea Tyson Dean, Walter A. Haas School of BusinessUniversity of California, Berkeley1, 4
R i c h a rd A. Zimmerm a nR e t i red Chairman & Chief Executive Off i c e rHershey Foods Corporation2, 4, 6
1. Audit Committee (Paul E. Gray, Chair)2. Committee on Directors (R.A. Zimmerman, Chair)3. Executive Compensation and Development Committee
(R.S. Braddock, Chair)4. Finance Committee (Durk I. Jager, Chair)5. Public Policy Committee (M.L. Collins, Chair)6. Executive Committee (Daniel A. Carp, Chair)
Corporate
Daniel A. Carp*C h a i rman, President & Chief Executive Off i c e r
R o b e rt H. Bru s t *Chief Financial Officer; Executive Vice Pre s i d e n t
Mark V. GullingChief Information Officer; Vice Pre s i d e n t
William G. LoveTre a s u re r
E. Mark Rajkowski*C o n t ro l l e r
M a rtin M. Coyne*P resident, Commercial Group; Executive Vice Pre s i d e n t
Michael P. Morley*Chief Administrative Officer; Executive Vice President
R. Hays BellD i re c t o r, Health, Safety & Environment; Vice President
Michael P. Benard *D i re c t o r, Communications & Public Affairs; Vice Pre s i d e n t
Essie L. CalhounD i re c t o r, Community Relations & Contributions, Communications & Public Affairs; Vice Pre s i d e n t
Sandra E. Ta y l o rD i re c t o r, Public Affairs, Communications & Public Aff a i r s ;Vice Pre s i d e n t
S h a ron E. Elliott*D i re c t o r, Human Resources; Senior Vice Pre s i d e n t
G a ry P. Van Graafeiland*General Counsel; Senior Vice Pre s i d e n t
Joyce P. HaagAssistant General Counsel and Secre t a ry
L a u rence L. HickeyAssistant Secre t a ry
Eric L. Steenburg h *Executive Vice President, Global Operations
Charles S. Brown, Jr. *D i re c t o r, Global Manufacturing; Senior Vice Pre s i d e n t
A a ron C. Cro s sDirector, Global Equipment Manufacturing; Vice President
Daniel T. MeekD i re c t o r, Worldwide Color Film, Global Manufacturing; Vice Pre s i d e n t
Charles C. Barre n t i n eM a n a g e r, Rochester Color Film Flow, Global Manufacturing; Vice Pre s i d e n t
T h e o d o re D. McNeffM a n a g e r, Worldwide Color Paper Flow andD i re c t o r, Worldwide Manufacturing Services, Global Manufacturing; Vice Pre s i d e n t
Alain H. PopelardAssociate Dire c t o r, Global Manufacturing; Vice Pre s i d e n t
John J. ChiazzaGeneral Manager, Global Integrated Supply Chain; Vice President
L e o n a rd E. RedonD i re c t o r, Rochester Area Operations; Vice Pre s i d e n t
R i c h a rd S. MorabitoChief Purchasing Officer; Vice Pre s i d e n t
Stevan G. Ramire zChief Quality Officer; Vice Pre s i d e n t
Carl E. Gustin, Jr. *Chief Marketing Officer; Senior Vice Pre s i d e n t
T h e o d o re G. Lewis*D i re c t o r, Digital Business Development; Senior Vice President
James C. Stoff e l *Chief Technical Off i c e r, Dire c t o r, Research & Development;Senior Vice Pre s i d e n t
Jack C. ChangAssociate Dire c t o r, Research & Development; Vice Pre s i d e n t
Business Units
J o e rg D. Agin*P resident, Entertainment Imaging; Senior Vice Pre s i d e n t
Yoshikazu HoriP resident, Kodak Japan Ltd., General Manager, Japan Region;Vice Pre s i d e n t
Alain Joff r i nGeneral Manager, European, African & Middle Eastern Region;Vice Pre s i d e n t
G e o rge M. KingGeneral Manager, Latin American Region; Vice Pre s i d e n t
Carl A. Marc h e t t o *P resident, Commercial & Government Systems; Senior Vice Pre s i d e n t
J. Michael McQuade*P resident, Health Imaging; Senior Vice Pre s i d e n t
R i c h a rd F. CiminoA rea Business General Manager, Americas Area, Health Imaging; Vice Pre s i d e n t
S h a ron J. CrinoA rea Business General Manager, Europe, Pacific, Middle East, Africa, Russia Area, Health Imaging; Vice Pre s i d e n t
Candy M. Obourn *P resident, Document Imaging; Senior Vice Pre s i d e n t
Daniel P. Palumbo*P resident, Consumer Imaging; Senior Vice Pre s i d e n t
Matthias Fre u n dChief Operating Off i c e r, Consumer Imaging, P resident and CEO, Qualex, Inc.; Vice Pre s i d e n t
P i e rre E. CohadeRegional Business General Manager, European, African and Middle Eastern Region, Consumer Imaging; Vice Pre s i d e n t
K a ren A. Smith-PilkingtonGeneral Manager, Output Products Business, Consumer Imaging; Vice President
M a ry Jane HellyarGeneral Manager, Film Business, Consumer Imaging;Vice President
Kent D. McNeleyChief Marketing Off i c e r, Consumer Imaging; Vice Pre s i d e n t
B ruce C. Swinsky P resident, Consumer Imaging, U.S. & Canada Region; Vice Pre s i d e n t
John Ts e n gRegional Business General Manager, Greater Asia Region, Consumer Imaging; Vice Pre s i d e n t
Henri D. PetitC h a i rman & President, Greater Asia Region; Vice Pre s i d e n t
E d w a rd P. HoppeVice Chairman, Greater Asia Region; Vice Pre s i d e n t
Willy C. Shih*P resident, Digital & Applied Imaging; Senior Vice Pre s i d e n t
Philip GerskovichChief Operating Off i c e r, Digital and Applied Imaging; Vice Pre s i d e n t
R o b e rt L. LaPerleGeneral Manager, kodak.com; Vice Pre s i d e n t
David L. Swift*P resident, Kodak Professional; Senior Vice Pre s i d e n t
Lance F. Dru m m o n dChief Operating Off i c e r, Kodak Professional; Vice Pre s i d e n t
K a rel K. Czandern aGeneral Manager, Output Systems, Kodak Professional; Vice Pre s i d e n t
A a ron J. McLeodGeneral Manager, Photographic Services, Kodak Professional; Vice Pre s i d e n t
Regina A. PizzoliRegional Business General Manager, U.S. and Canada Region, Kodak Professional; Vice Pre s i d e n t
Philip V. Ta t u s k oGeneral Manager, Graphics and Printing Systems, Kodak Professional; Vice Pre s i d e n t
David W. Wi l s o nGeneral Manager, U.S. & Canada Region; Vice Pre s i d e n t
* ”Executive Officer” under the Securities Exchange Act of 1934

68
Corporate Information
Corporate Off i c e s
343 State Stre e t
R o c h e s t e r, NY 14650 USA
7 1 6 / 7 2 4 - 4 0 0 0
State of Incorporation
New Jersey
Annual Meeting
E.M. Pearson Theatre
at Concordia University
St. Paul, MN
We d n e s d a y, May 9, 2001
10:00 a.m.
Common Stock
Ticker symbol: EK.
Most newspaper stock tables list the Company’s
stock as “EKodak.” The common stock is listed
and traded on the New York Stock Exchange,
which is the principal market for it.
D i v i d e n d s
Eastman Kodak Company normally pays divi-
dends four times a year, on the first business day
of January, April, July, and October, with re c o rd
dates on the first business day of the pre c e d i n g
D e c e m b e r, March, June, and September.
S h a reholder Assistance
For information about stock transfers, addre s s
changes, dividends, account consolidation,
registration changes, lost stock certificates, and
F o rm 1099, contact:
Transfer Agent & Registrar
Fleet National Bank c/o EquiServ e
P.O. Box 43016
P rovidence, RI 02940-3016
8 0 0 / 2 5 3 - 6 0 5 7
On the World Wide Web at:
w w w. e q u i s e rv e . c o m
For copies of the Annual Report, 10-K,
P roxy Statement, or 10-Q, contact:
L i t e r a t u re & Marketing Support
Eastman Kodak Company
343 State Stre e t
R o c h e s t e r, NY 14650-0532
7 1 6 / 7 2 4 - 2 7 8 3
For information about the most recent quart e r l y
Sales and Earnings, call:
800/785-6325 (800/78-KODAK)
For other information
or questions, contact:
C o o rd i n a t o r, Shareholder Serv i c e s
Eastman Kodak Company
343 State Stre e t
R o c h e s t e r, NY 14650-0205
7 1 6 / 7 2 4 - 5 4 9 2
Eastman Kodak Shares Pro g r a m
The Eastman Kodak Shares Program is designed
to give investors a way to systematically and
a ff o rdably build their ownership interest in the
C o m p a n y. This Program provides a means of re g-
ular dividend reinvestment and includes a volun-
t a ry investment option, as well as an automatic
monthly investment option, for purchases of addi-
tional shares up to $120,000 per year. The mini-
mum initial investment is $150, with additional
investments as little as $50.
For information contact:
Fleet National Bank c/o EquiServ e
Eastman Kodak Shares Pro g r a m
P.O. Box 43016
P rovidence, RI 02940-3016
8 0 0 / 2 5 3 - 6 0 5 7
Duplicate Mailings
If you receive more than one annual re p o rt and
p roxy statement and wish to help us reduce
costs by discontinuing multiple mailings to
your address, contact:
Fleet National Bank c/o EquiServ e
P.O. Box 43016
P rovidence, RI 02940-3016
8 0 0 / 2 5 3 - 6 0 5 7
E l e c t ronic Proxy Materials
K o d a k ’s proxy materials can now be re c e i v e d
e l e c t ro n i c a l l y. This option will save the Company
the cost of printing and mailing these materials to
you. It will also make them accessible to you
immediately as soon as they are available.
If you are a re g i s t e red holder (you own the
stock in your name), and wish to receive your
p roxy materials electronically rather than re c e i v i n g
h a rd copy, go to www. e c o n s e n t . c o m / e k
If you are a street holder (you own the stock
t h rough a bank or broker), please contact your
b roker and ask for electronic delivery of Kodak’s
p roxy materials.
P roduct Inform a t i o n
For information about Kodak products and
services, call the Kodak Information Center:
800/242-2424
Kodak on the Net
For information about the Company and its pro d-
ucts, please visit us on the World Wide Web at:
w w w. k o d a k . c o m .
C re d i t sPhotos: Todd Hido pg 13-17, Allan Farkus pg 30, StephenKelly pgs 2,5,20-25 and inside front cover.
Several of the photos in this annual re p o rt are the work ofamateur photographers, winners of an annual photographycontest that Kodak sponsored from 1937 through 1998. Theya re: Sharon Ann Lucas (front cover), Linda Beavers (page 3),Deborah Marsh (page 4), Bruce G. Laval (page 6), DavisParsons (page 7), Arline Grower (inside back cover) andCesar M. Celdon (back cover). We extend our appre c i a t i o nand thanks to them and to all who use our products to cap-t u re the special moments in their lives.
Design: Cahan & Associates, San Francisco, CA.
This 2000 Annual Report was produced using Kodak films,papers, graphic arts products, and Kodak photo CD pro d-ucts. This re p o rt is printed on recycled paper containing atleast 10% post-consumer waste. Kodak, Advantix, AdvantixP review Camera, Digital Science, Duraflex, Ektachrome, Elite,E s t a r, Fun Saver, Gold, Image Magic, ImageSourc e ,K o d a c o l o r, Kodachrome, Kodak Express, Kodak MC3, KodakPhotoNet online, Kodak Polychrome Graphics, KodakP rofessional, Kodak Select, Max, Min-R, Photo CD, Port r a ,Print@Kodak, Pro Image, Royal, Vision, and Take Pictures.Further, are trademarks of Eastman Kodak Company.
Palm is a trademark of Palm, Inc. PalmPix is a trademark ofPalm, Inc. used under license by Eastman Kodak Company.