Embed Size (px)
Citation preview

QuikChem® Method 12-107-06-3-D
DETERMINATION OF AMMONIA BY FLOW INJECTION ANALYSIS
(Salicylate Method/DCIC) (Water and 1M KCl)
Written by Lynn Egan
Applications Group
Revision Date:
14 April 2014
LACHAT INSTRUMENTS 5600 LINDBERGH DRIVE
LOVELAND, CO 80539 USA


Written and copyrighted by L. Egan 14 Apr 2014 by Lachat Instruments, 5600 Lindbergh Drive, Loveland Colorado 80539 USA. Phone: 970-663-1377 FAX: 970-962-6710.. This document is the property of Lachat Instruments. Unauthorized copying of this document is prohibited.
QuikChem® Method 12-107-06-3-D
Ammonia in Surface and Wastewaters and Extracts of Plants and Soils Salicylate Method/DCIC
1.0-75 mg N/L as NH3 (Water, 1M KCl,)
– Principle –
When ammonia is heated with salicylate and hypochlorite in an alkaline phosphate buffer an emerald green color is produced which is proportional to the ammonia concentration. Hypochlorite in this method is provided by an alkaline solution of DCIC (sodium dichloroisocyanurate [dichloro-s-triazine 2,4,6,(1H,3H,H)-trione sodium salt]). The color is intensified by the addition of sodium nitroprusside. This method utilizes the salicylate chemistry used in EPA Method 351.2 not the phenate chemistry used in EPA Method 350.1 and 351.1. The difference between salicylate and phenate is that the aromatic ring in salicylate contains a carboxylate group. Both chemistries are essentially variations of the Berthelot reaction and rely on electrophillic aromatic substitution.
This method may be used with waters and extracts of soils and plants. Water and 1M KCl matrices can be used with this method.
– Interferences – 1. In alkaline solution, calcium and magnesium can interfere by forming a precipitate, which scatters light.
EDTA is used in this chemistry to prevent this interference.
2. Non-volatile amines such as cysteine, ethanolamine and ethylenediamine cause a decrease in ammonia sensitivity.
3. Lauryl sulfate and some detergents can cause low ammonia recoveries.
4. Soil extracts may be colored. If this color interferes, it can be subtracted by replacing the DCIC solution with a solution containing only NaOH and reanalyzing the problematic sample or samples. Alternatively, decolorizing carbon can be used.
– Special Apparatus – Please see Parts and Price list for Ordering Information
1. Heating Unit Lachat Part No. A85X00 (X=1 for 110V, X=2 for 220V)
2. PVC PUMP TUBES MUST BE USED FOR THIS METHOD


CONTENTS
1. SCOPE AND APPLICATION ...................................................................................................1
2. SUMMARY OF METHOD ........................................................................................................1
4. INTERFERENCES .....................................................................................................................3
5. SAFETY .....................................................................................................................................3
6. EQUIPMENT AND SUPPLIES .................................................................................................3
7. REAGENTS AND STANDARDS .............................................................................................4
7.1. PREPARATION OF REAGENTS ........................................................................................ 4
7.2. PREPARATION OF STANDARDS ..................................................................................... 5
8. SAMPLE COLLECTION, PRESERVATION AND STORAGE..............................................6
9. QUALITY CONTROL ...............................................................................................................7
10. CALIBRATION AND STANDARDIZATION .......................................................................9
11. PROCEDURE .........................................................................................................................10
11.1. CALIBRATION PROCEDURE .......................................................................................... 10
11.2. SYSTEM NOTES ................................................................................................................ 10
12. DATA ANALYSIS AND CALCULATIONS .......................................................................10
13. METHOD PERFORMANCE .................................................................................................11
14. POLLUTION PREVENTION ................................................................................................11
15. WASTE MANAGEMENT .....................................................................................................11
16. REFERENCES .......................................................................................................................12
17. TABLE, DIAGRAMS, FLOWCHARTS, AND VALIDATION DATA...............................13
17.1. DATA SYSTEM PARAMETERS FOR QUIKCHEM 8000/8500 ..................................... 13
17.2. SUPPORT DATA FOR QUIKCHEM 8000/8500 ............................................................... 14
17.3. AMMONIA MANIFOLD DIAGRAM ................................. Error! Bookmark not defined.


12-107-06-3-D Page 1 14 April 2014/lme
QuikChem® Method 12-107-06-3-D
DETERMINATION OF AMMONIA BY FLOW INJECTION ANALYSIS
1. SCOPE AND APPLICATION
1.1. This method covers the determination of ammonia in waters, and 1M KCl extracts of soils and plants.
1.2. The method is based on reactions that are specific for the ammonia ion.
1.3. The applicable range is 1.0-75 mg N/L as NH3. The method detection limits are:
Water: 0.2 mg N/L as NH3
1M KCl: 0.2 mg N/L as NH3
1.4. The method throughput is 80 injections per hour.
2. SUMMARY OF METHOD
2.1. When ammonia is heated with salicylate and hypochlorite in an alkaline phosphate buffer An emerald green color is produced which is proportional to the ammonia concentration. Hypochlorite in this method is provided by an alkaline solution of DCIC (sodium dichloroisocyanurate [dichloro-s-triazine 2,4,6,(1H,3H,H)-trione sodium salt]). The color is intensified by the addition of sodium nitroprusside. 2.2. This method utilizes the salicylate chemistry used in EPA Method 351.2 not the phenate chemistry used in EPA Method 350.1 and 351.1. The difference between salicylate and phenate is that the aromatic ring in salicylate contains a carboxylate group. Both chemistries are essentially variations of the Berthelot reaction and rely on electrophillic aromatic substitution.
2.3. This method may be used with waters and extracts of soils and plants. Water, preserved water and 1M KCl matrices can be used with this method.
12-107-06-3-D Page 2 14 April 2014/lme
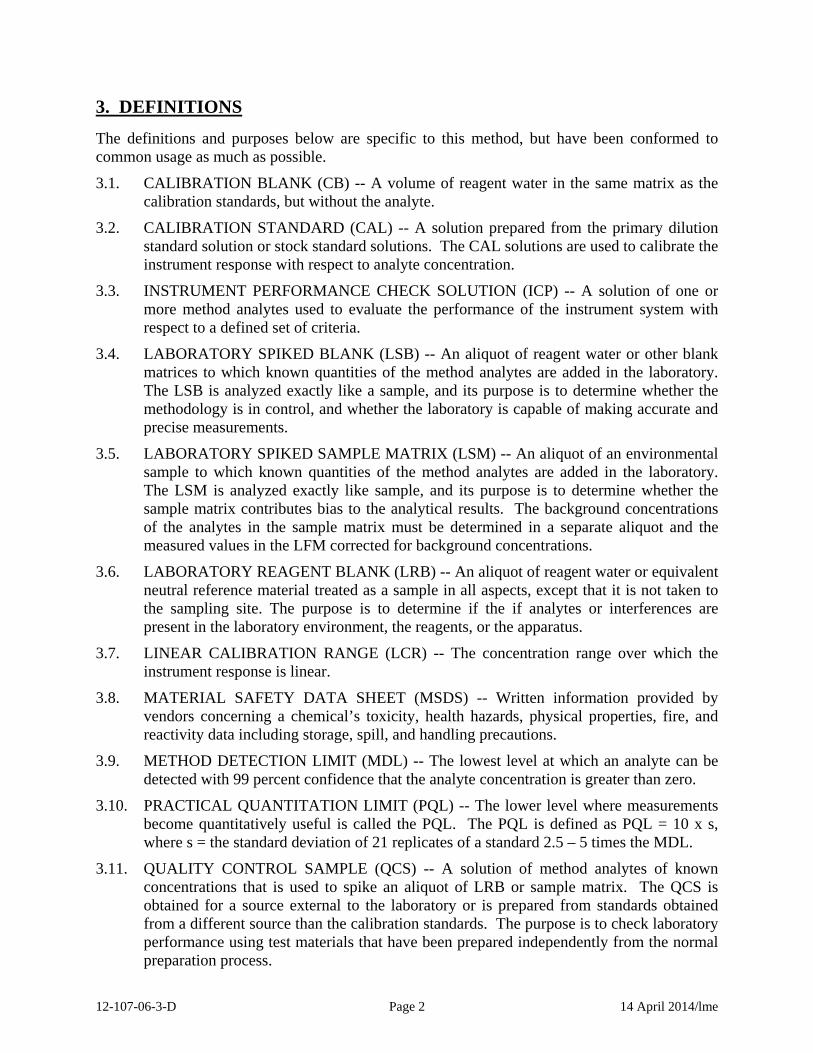
3. DEFINITIONS
The definitions and purposes below are specific to this method, but have been conformed to common usage as much as possible.
3.1. CALIBRATION BLANK (CB) -- A volume of reagent water in the same matrix as the calibration standards, but without the analyte.
3.2. CALIBRATION STANDARD (CAL) -- A solution prepared from the primary dilution standard solution or stock standard solutions. The CAL solutions are used to calibrate the instrument response with respect to analyte concentration.
3.3. INSTRUMENT PERFORMANCE CHECK SOLUTION (ICP) -- A solution of one or more method analytes used to evaluate the performance of the instrument system with respect to a defined set of criteria.
3.4. LABORATORY SPIKED BLANK (LSB) -- An aliquot of reagent water or other blank matrices to which known quantities of the method analytes are added in the laboratory. The LSB is analyzed exactly like a sample, and its purpose is to determine whether the methodology is in control, and whether the laboratory is capable of making accurate and precise measurements.
3.5. LABORATORY SPIKED SAMPLE MATRIX (LSM) -- An aliquot of an environmental sample to which known quantities of the method analytes are added in the laboratory. The LSM is analyzed exactly like sample, and its purpose is to determine whether the sample matrix contributes bias to the analytical results. The background concentrations of the analytes in the sample matrix must be determined in a separate aliquot and the measured values in the LFM corrected for background concentrations.
3.6. LABORATORY REAGENT BLANK (LRB) -- An aliquot of reagent water or equivalent neutral reference material treated as a sample in all aspects, except that it is not taken to the sampling site. The purpose is to determine if the if analytes or interferences are present in the laboratory environment, the reagents, or the apparatus.
3.7. LINEAR CALIBRATION RANGE (LCR) -- The concentration range over which the instrument response is linear.
3.8. MATERIAL SAFETY DATA SHEET (MSDS) -- Written information provided by vendors concerning a chemical’s toxicity, health hazards, physical properties, fire, and reactivity data including storage, spill, and handling precautions.
3.9. METHOD DETECTION LIMIT (MDL) -- The lowest level at which an analyte can be detected with 99 percent confidence that the analyte concentration is greater than zero.
3.10. PRACTICAL QUANTITATION LIMIT (PQL) -- The lower level where measurements become quantitatively useful is called the PQL. The PQL is defined as PQL = 10 x s, where s = the standard deviation of 21 replicates of a standard 2.5 – 5 times the MDL.
3.11. QUALITY CONTROL SAMPLE (QCS) -- A solution of method analytes of known concentrations that is used to spike an aliquot of LRB or sample matrix. The QCS is obtained for a source external to the laboratory or is prepared from standards obtained from a different source than the calibration standards. The purpose is to check laboratory performance using test materials that have been prepared independently from the normal preparation process.

12-107-06-3-D Page 3 14 April 2014/lme
3.12. STOCK STANDARD SOLUTION (SSS) -- A concentrated solution containing one or more method analytes prepared in the laboratory using assayed reference materials or purchased from a reputable commercial source.
3.13. USEPA -- United States Environmental Protection Agency.
4. INTERFERENCES
4.1. In alkaline solution, calcium and magnesium can interfere by forming a precipitate, which scatters light. EDTA is used in this chemistry to prevent this interference.
4.2 Non-volatile amines such as cysteine, ethanolamine and ethylenediamine cause a decrease in ammonia sensitivity.
4.3. Lauryl sulfate and other detergents can cause low ammonia recoveries.
4.4. Soil extracts may be colored. If this color interferes, it can be subtracted by replacing the DCIC solution with a solution containing only NaOH and then reanalyzing the problematic sample or samples. Alternatively, decolorizing carbon can be used.
5. SAFETY
5.1. The toxicity or carcinogenicity of each reagent used in this method has not been fully established. Each chemical should be regarded as a potential health hazard and exposure should be as low as reasonably achievable. Cautions are included for known extremely hazardous materials.
5.2. Each laboratory is responsible for maintaining a current awareness file of the Occupational Health and Safety Act (OSHA) regulations regarding the safe handling of the chemicals specified in this method. A reference file of Material Safety Data sheets (MSDS) should be made available to all personnel involved in the chemical analysis. The preparation of a formal safety plan is also advisable.
5.3. The following chemicals have the potential to be highly toxic or hazardous, for detailed explanation consult the MSDS.
3.3.1. Sodium Hydroxide
3.3.2. Sodium Nitroprusside
3.3.3. Disodium ethylenediaminetetracetic acid dehydrate
3.3.4. Sodium dichloroisocyanurate
6. EQUIPMENT AND SUPPLIES
6.1. Balance -- analytical, capable of accurately weighing to the nearest 0.0001 g.
6.2. Glassware -- Class A volumetric flasks and pipettes or plastic containers as required. Samples may be stored in plastic or glass.
6.3. Flow injection analysis equipment designed to deliver and react sample and reagents in the required order and ratios.

12-107-06-3-D Page 4 14 April 2014/lme
6.3.1. Sampler
6.3.2. Multichannel proportioning pump
6.3.3. Reaction unit or manifold
6.3.4. Colorimetric detector
6.3.5. Data system
6.4. Special Apparatus
6.4.1 Heating unit Lachat Part No. A85X00 (X=1 for 110V, X=2 for 220V)
6.4.2. PVC PUMP TUBES MUST BE USED FOR THIS METHOD
7. REAGENTS AND STANDARDS
7.1. PREPARATION OF REAGENTS
Use deionized water (10 megohm or greater) for all solutions.
Degassing with helium:
If solutions are left at room temperature, degassing may not be required. If bubbles are problematic, degas solutions (except for the standards) with helium. Use He at 140kPa (20 lb/in2) through a helium degassing tube (Lachat Part No. 50100.) Bubble He through the solution for one minute.
Reagent 1. EDTA Solution (6.6%). pH 7.0
In a 1 L graduated beaker, dissolve 66 g ethylenediamine tetra-acetic acid disodium salt dihydrate in about 900 mL DI water with a magnetic stirrer. The pH at this point is approximately 5.2 and the solution is cloudy. Adjust the pH to 7.0 with sodium hydroxide pellets (approx. 25 pellets). Stir with a magnetic stirrer. Add sodium hydroxide pellets in five pellet increments until pH 7.0 is reached. The solution will become clearer as the pH of the solution nears pH 7.0. Transfer the solution to a 1 L volumetric flask and dilute to the mark with DI water. Invert to mix. (If air spikes occur, after transferring solution to a 1 L container, degas with helium).
Reagent 2. Buffer
By Volume: In a 1 L volumetric flask, dissolve 28.0 g sodium hydroxide (NaOH) and 50.0 g sodium phosphate dibasic heptahydrate (Na2HPO47H2O) in about 900 mL DI water. Dilute to the mark with DI water and invert to mix. Degas with helium.
By Weight: To a tared 1 L container, add 28.0 g sodium hydroxide (NaOH), 50.0 g sodium phosphate dibasic heptahydrate (Na2HPO47H2O) and 910 g DI water. Shake or stir until dissolved. (If air spikes occur, degas with helium).
Reagent 3. Salicylate - Nitroprusside Color Reagent
By Volume: In a 1 L volumetric flask, dissolve 150 g sodium salicylate [salicylic acid sodium salt (C6H4(OH)(COO)Na)], and 1.0 g sodium nitroprusside [sodium nitroferricyanide dihydrate (Na2Fe(CN)5NO2H2O)], in about 800 mL DI water. Dilute to the mark with DI water and stir to until mixed. (If air spikes occur, degas with helium). Store in a light-proof bottle. Discard if this reagent develops a blue color.

12-107-06-3-D Page 5 14 April 2014/lme
By Weight: To a tared 1 L light proof container, add 150 g sodium salicylate [salicylic acid sodium salt (C6H4(OH)(COO)Na)], and 1.0 g sodium nitroprusside [sodium nitroferricyanide dihydrate (Na2Fe(CN)5NO2H2O)] and 908 g DI water. Stir until dissolved. (If air spikes occur, degas with helium). Store in a light-proof bottle. Discard if this reagent develops a blue color.
Reagent 4 DCIC (Hypochlorite source)
By Volume: To a 250 mL volumetric flask, add 1.25 g Sodium Hydroxide (NaOH) and 0.5 g DCIC sodium dichloroisocyanurate [dichloro-s-triazine 2,4,6,(1H,3H,H)-trione sodium salt]. Dilute to mark with DI water and invert to mix. Prepare daily.
By Weight: To a tared 250 mL container, add 1.25 g Sodium Hydroxide (NaOH) and 0.5 g DCIC sodium dichloroisocyanurate [dichloro-s-triazine 2,4,6,(1H,3H,H)-trione sodium salt], and 250 g DI water and invert to mix. Prepare daily.
7.2. PREPARATION OF STANDARDS
To prepare the stock and working standards, the following containers will be required
By Volume: One 1 L volumetric flask and one 500 mL volumetric flask, and eight 100 mL volumetric flasks or eight 100 mL containers (Stock and working standard are prepared volumetrically, the rest may be prepared by weight). Volumes of the diluents should be scaled according to need.
Although the sample matrix solutions may not always be used as the carrier solution, standards should always be prepared to match the sample matrix.
Diluent 1: 2 mL H2SO4/L. To a 2L Volumetric flask containing about 1500 mL of DI water, add 4 mL (7.36g) of concentrated sulfuric acid (H2SO4). Dilute to volume with DI water and stir to mix.
Diluent 2: 1M KCl: To a 2L Volumetric flask containing about 1500 mL of DI water, add 149.1 g of KCl. Stir until dissolved and dilute to volume. Please note that this solution is used to extract soil samples and may also be used as the carrier and so a larger volume should be prepared (Standards, extractions, dilution of over range samples and the carrier if desired).
Standard 1. Stock Standard 1000.0 mg N/L as NH3
By Volume: In a 1 L volumetric flask, dissolve 3.819 g of ammonium chloride (NH4Cl) that has been dried for two hours at 110C in about 800 mL DI water. Dilute to the mark with DI water and invert three times to mix. (This can also be purchased from Hach Company. PN 2354153 is a premade, 1L bottle of 1000 mg N/L as ammonia standard)
Standard 2: Working Standard 100 mg N/L as NH3
By Volume: In a 500 mL volumetric flask containing 400 mL of DI water or diluent 1 or 2, place 50.0 mL or g of Stock Standard 1. Dilute to the mark with DI water or Diluent 1 or 2, and invert three times to mix.

12-107-06-3-D Page 6 14 April 2014/lme
Working Standards (Prepare at least monthly (sooner if QC fails)
Concentration mg N/L
A
75
B
50
C
25
D
10
E
5
F
2.5
G
1.0
H
0.0
By Volume
Volume (mL) of stock standard 1 diluted to 100 mL with DI water or
Diluent 1 or 2.
75 50 25 10 5 2.5 1.0 --
By Weight
Weight (g) of stock standard 1 diluted to final weight (~100 g)
divided by factor below with DI water or diluent 1 or 2.
75 50 25 10 5 2.5 1.0 ---
Division Factor Divide exact weight of the
standard by this factor to give the final weight.
0.75 0.5 0.25 0.1 0.05 0.025 0.01 1
8. SAMPLE COLLECTION, PRESERVATION AND STORAGE
8.1. Ammonia is volatile and will leave the sample slowly, even through polyethylene bottles.
8.2. Samples must be preserved with sulfuric acid at pH < 2 and cooled to <6C at the time of collection for NPDES monitoring. Do not add more than 2 mL sulfuric acid/L unless it is required to obtain pH < 2.
8.3. Samples should be analyzed as soon as possible after collection. If storage is required, acid preserved samples are maintained at <6C and may be held for up to 28 days. Plant and soil extracts may be frozen for storage.
8.4. Samples should be collected in plastic or glass bottles. All bottles must be thoroughly cleaned and rinsed with reagent water. The volume collected should be sufficient to insure a representative sample, allow for replicate analysis (if required), and minimize waste disposal.
8.5. The Federal Register entry which defines standard EPA NPDES and NPDWR methods states that “Manual Distillation is NOT required if comparability data on representative effluent samples are on company file to show that this preliminary distillation step is not necessary; however, manual distillation will be required to resolve any controversies” (See Sources). This suggests that the user perform recovery studies on representative sample types, studies that show that the non-distilled samples give the same recoveries as the manually distilled samples. See EPA Method 350.1 for the complete distillation procedure.

12-107-06-3-D Page 7 14 April 2014/lme
9. QUALITY CONTROL
9.1. Each laboratory using this method is required to operate a formal quality control (QC) program. The minimum requirements of this program consist of an initial demonstration of laboratory capability, and the periodic analysis of laboratory reagent blanks, fortified blanks and other laboratory solutions as a continuing check on performance. The laboratory is required to maintain performance records that define the quality of the data that are generated.
9.2. INITIAL DEMONSTRATION OF PERFORMANCE
9.2.1. The initial demonstration of performance is used to characterize instrument performance (determination of LCRs and analysis of QCS) and laboratory performance (determination of MDLs) prior to performing analyses by this method.
9.2.2. Linear Calibration Range (LCR) -- The LCR must be determined initially and verified every 6 months or whenever a significant change in instrument response is observed or expected. The initial demonstration of linearity must use sufficient standards to insure that the resulting curve is linear. The verification of linearity must use a minimum of a blank and three standards. If any verification data exceeds the initial values by +/- 10%, linearity must be nonlinear, sufficient standards must be used to clearly define the nonlinear portion.
9.2.3. Quality Control Sample (QCS) -- When beginning the use of this method, on a quarterly basis, or as required to meet data-quality needs, verify the calibration standards and acceptable instrument performance with the preparation and analyses of a QCS. If the determined concentrations are not within +/-10% of the stated values, performance of the determinative step of the method is unacceptable. The source of the problem must be identified and corrected before either proceeding with the initial determination of MDLs or continuing with on-going analyses.
9.2.4. Method Detection Limit (MDL) -- MDLs must be established for all analytes, using reagent water (blank) fortified at a concentration of two to three times the estimated instrument detection limit. To determine MDL values, take seven replicate aliquots of the fortified reagent water and process through the entire analytical method. Perform all calculations defined in the method and report the concentration values in the appropriate units. Calculate the MDL as follows:
MDL = t x S
Where, t = Student's t value for a 99% confidence level and a standard deviation estimate with n-1 degrees of freedom [t = 3.14 for seven replicates, t= 2.528 for twenty-one replicates]. S = standard deviation of the replicate analyses.
MDLs should be determined every six months, when a new operator begins work, or whenever there is a significant change in the background or instrument response.

12-107-06-3-D Page 8 14 April 2014/lme
9.3. ASSESSING LABORATORY PERFORMANCE
9.3.1. Laboratory Reagent Blank (LRB) -- The laboratory must analyze at least one LRB with each batch of no more than 20 samples. Data produced are used to assess contamination from the laboratory environment. Values that exceed the MDL indicate laboratory or reagent contamination should be suspected and corrective actions must be taken before continuing the analysis.
9.3.2. Laboratory Fortified Blank (LFB) -- The laboratory must analyze at least one LFB with each batch of no more than 20 samples. Calculate accuracy as percent recovery (Sect. 9.4.2). If the recovery of any analyte falls outside the required control limits of 90-110%, that analyte is judged out of control, and the source of the problem should be identified and resolved before continuing analyses.
9.3.3. The laboratory must used LFB analyses data to assess laboratory performance against the required control limits of 90-110%. When sufficient internal performance data become available (usually a minimum of 20-30 analyses), optional control limits can be developed from the percent mean recovery and the standard deviation (S) of the mean recovery. These data can be used to establish the upper and lower control limits as follows:
UPPER CONTROL LIMIT = X S 3
LOWER CONTROL LIMIT = X S 3
The optional control limits must be equal to or better than the required control limits of 90-110%. After each five to ten new recovery measurements, new control limits can be calculated using only the most recent 20-30 data points. Also, the standard deviation (S) data should be used to establish an on-going precision statement for the level of concentrations included in the LFB. These data must be kept on file and be available for review.
9.3.4. Instruments Performance Check Solution (IPC) -- For all determinations the laboratory must analyze the IPC (a mid-range check standard) and a calibration blank immediately following daily calibration, after every tenth sample (or more or less frequently, as required) and at the end of the sample run. Analysis of the IPC solution and calibration blank immediately following calibration must verify that the instrument is within +/-10% of calibration. Subsequent analyses of the IPC solution must verify the calibration is still within +/-10%. If the calibration cannot be verified within the specified limits, reanalyze the IPC solution. If the second analysis of the IPC solution confirms calibration to be outside the limits, sample analysis must be discontinued, the cause determined and/or in the case of drift the instrument recalibrated. All samples following the last acceptable IPC solution must be reanalyzed. The analysis data of the calibration blank and IPC solution must be kept on file with sample analyses data.

12-107-06-3-D Page 9 14 April 2014/lme
9.4. ASSESSING ANALYTE RECOVERY AND DATA QUALITY
9.4.1. Laboratory Spiked Sample Matrix (LSM) -- The laboratory must spike, in duplicate, minimum of 5% of routine samples. In each case the LSM aliquots must be a duplicate of the aliquot used for sample analysis. The spiking level shall be at 1 to 5 times higher than the background concentration of the sample.
Calculate the percent recovery for each analyte, corrected for concentrations measured in the unfortified sample, and compare these values to the designated LFM recovery range 90-110%. Percent recovery may be calculated using the following equation:
RC C
ss
x 100
Where, R = percent recovery, Cs = fortified sample concentration, C = sample background concentration, s = concentration equivalent of analyte added to sample.
9.4.3. If the recovery of any analyte falls outside the designated LSM recovery range and the laboratory performance for that analyte is shown to be in control (sect. 9.3), the recovery problem encountered with the LSM is judged to be either matrix or solution related, not system related.
9.4.4. Compute the relative percent difference (RPD) between the two LSM results and compare the value to the designated RPD recovery range of 10%. The RPD may be calculated using the following equation:
RPDD D
D D
( )
( ) /
1 2
1 2 2100 x
Where: D1 = Concentration of analyte in the sample, D2 = Concentration of analyte in the second (duplicate) sample.
9.4.5. If the RPD falls outside the designated recovery range and the laboratory performance for that analyte is shown to be in control (sect. 9.3), the recovery problem encountered with the LSM is judged to be either matrix or solution related, not system related.
9.4.6. Where reference materials are available, they should be analyzed to provide additional performance data. The analysis of reference samples is a valuable tool for demonstrating the ability to perform the method acceptably.
10. CALIBRATION AND STANDARDIZATION
10.1. Prepare a series of standards, covering the desired range, and a blank by diluting suitable volumes of standard solution (suggested range in Section 7.2.) with the correct diluent.
10.2. Calibrate the instrument as described in Section 11.

12-107-06-3-D Page 10 14 April 2014/lme
10.3. Prepare standard curve by plotting instrument response against concentration values. A calibration curve will be fitted to the calibration solution concentration/response data by the computer. Acceptance or control limits should be established using the difference between the measured value of the calibration solution and the “true value” concentration.
10.4. After the calibration has been established, it must be verified by the analysis of a suitable quality control sample (QCS). If measurements exceed 10% of the established QCS value, the analysis should be terminated and the instrument recalibrated. The new calibration must be verified before continuing analysis. Periodic reanalysis of the QCS is recommended as a continuing calibration check.
11. PROCEDURE
11.1. CALIBRATION PROCEDURE
11.1.1. Prepare reagent and standards as described in section 5.
11.1.2. Set up manifold as shown in section 11.
11.1.3. Input data system parameters as in section 11.
11.1.4. Pump DI water through all reagent lines and check for leaks and smooth flow. Switch to reagents and allow the system to equilibrate until a stable baseline is achieved.
11.1.5. Place samples and/or standards in the auto sampler. Input the information required by the data system, such as concentration, replicates and QuikChem scheme. (See section 17)
11.1.6. Calibrate the instrument by injecting the standards. The data system will then associate the concentrations with the instrument responses for each standard.
11.2. SYSTEM NOTES
11.2.1. For information on system maintenance and troubleshooting refer to the Troubleshooting Guide in the System Operation Manual. This guide is also available on request from Lachat.
11.2.2. Allow about 15 minutes for heating unit to warm up to 60C. (The QuikChem 8500 Series of instruments will not allow the run to start until this temperature has been reached).
12. DATA ANALYSIS AND CALCULATIONS
12.1. Calibration is done by injecting standards. The data system will then prepare a calibration curve by plotting response versus standard concentration. Sample concentration is calculated from the regression equation.
12.2. Report only those values that fall between the lowest and highest calibration standards. Samples exceeding the highest standard should be diluted and reanalyzed.
12.3. Report results in mg N/L or mg N/kg as NH3.

12-107-06-3-D Page 11 14 April 2014/lme
13. METHOD PERFORMANCE
13.1. The method support data are presented in section 17. This data was generated according to a Lachat Work Instruction during development of the method.
13.2. Although Lachat Instrument publishes method performance data, including MDL, precision, accuracy and carryover studies, we cannot guarantee that each laboratory will be capable of meeting such performance. Individual laboratory and instrument conditions, as well as laboratory technique, play a major role in determining method performance. The support data serves as a guide of the potential method performance. Some labs may not be able to reach this level of performance for various reasons, while other labs may exceed it.
14. POLLUTION PREVENTION
14.1. Pollution prevention encompasses any technique that reduces or eliminates the quantity or toxicity of waste at the point of generation. Numerous opportunities for pollution prevention exist in laboratory operation. The USEPA has established a preferred hierarchy of environmental management techniques that places pollution prevention as the management option of first choice. Whenever feasible, laboratory personnel should use pollution prevention techniques to address their waste generation. When wastes cannot be feasibly reduced at the source, the United States Environmental Agency (USEPA) recommends recycling as the next best option.
14.2. The quantity of chemicals purchased should be based on expected usage during their shelf life and disposal cost of unused material. Actual reagent preparation volumes should reflect anticipated usage and reagent stability.
14.3. For information about pollution prevention that may be applicable to laboratories and research institutions, consult "Less is Better: Laboratory Chemical Management for Waste Reduction," available from the American Chemical Society's Department of Government Regulations and Science Policy, 1155 16th Street N. W., Washington D. C. 20036, (202) 872-4477.
15. WASTE MANAGEMENT
15.1. It is the laboratory’s responsibility to comply with all federal, state, and local regulations governing waste management, particularly the hazardous waste identification rules and land disposal restrictions, and to protect the air, water and land by minimizing and controlling all releases from fume hoods and bench operation. Compliance with all sewage discharge permits and regulations is also required.
15.2. For further information on waste management consult the "Waste Management Manual for Laboratory Personnel", available from the American Chemical Society's Department of Government Regulations and Science Policy, 1155 16th Street N. W., Washington D. C. 20036, (202) 872-4477.

12-107-06-3-D Page 12 14 April 2014/lme
16. REFERENCES
16.1. U.S. Environmental Protection Agency, Methods for the Chemical Analysis of Water and Wastes, EPA-600/4-79-020, Revised March 1983, Method 351.2
16.2. U.S. Environmental Protection Agency, Methods for the Chemical Analysis of Water and Wastes, EPA-600/4-79-020, Revised March 1983, Method 350.1.
16.3. Standard Methods, For the Examination of Water and Wastewater, 18th ed., p. 4-77, Methods 4500 NH3 B and H (1992).
16.4. Code of Federal Regulations 40, Ch. 1, Pt. 136, Table II.
16.5. Lachat QuikChem Method Number 90-107-06-3-A

12-107-06-3-D Page 13 14 April 2014/lme
17. TABLE, DIAGRAMS, FLOWCHARTS, AND VALIDATION DATA
17.1. DATA SYSTEM PARAMETERS FOR QUIKCHEM 8000/8500
The timing values listed below are approximate and will need to be optimized using graphical events programming.
Sample throughput: 80 samples/h, 40 s/sample
Pump Speed: 35
Cycle Period: 40
Analyte Data:
Concentration Units: mg N/L as NH3
Peak Base Width: 30s
Inject to Peak Start: 32s
Chemistry: Direct/Bipolar
Calibration Data:
Level 1 2 3 4 5 6 7 8 Concentration mg N/L 75 50 25 10 5 2.5 1 0
Calibration Fit Type: 2nd Order Polynomial
Weighting Method: 1/x
Force through zero: No
Sampler Timing:
Min. Probe in Wash Period: 5.0 s
Probe in Sample Period: 15 s
Valve Timing:
Load Period: 10 s
Inject Period: 30 s

12-107-06-3-D Page 14 14 April 2014/lme
17.2. SUPPORT DATA FOR QUIKCHEM 8000/8500
Calibration Data for Ammonia in Water
Calibration Graph and Statistics
File Name: preserved water DI carrier.omn Acq. Date: 11 April 2014

12-107-06-3-D Page 15 14 April 2014/lme
Method Detection Limit (water) for ammonia using 1.0 mg N/L standard MDL= 0.2 mg N/L Standard Deviation (s) = 0.0195 mg N/L, Mean (x) = 0.969 mg N/L Known value = 1.0 mg N/L File Name: preserved water DI carrier.omn Acq. Date: 11 April 2014
Precision data for ammonia using 25.0 mg N/L standard % RSD =1.47 Standard Deviation (s) = 0.372 mg N/L , Mean (x) = 25.21 mg N/L, Known value = 25.0 mg N/L File Name: preserved water DI carrier.omn Acq. Date: 11 April 2014
Carryover Study: 75.0 mg N/L standard followed by 3 blanks Carryover Passed File Name: preserved water DI carrier.omn Acq. Date: 11 April 2014

12-107-06-3-D Page 16 14 April 2014/lme
Calibration Data for Ammonia 1M KCl, 1M KCl Carrier
Calibration Graph and Statistics
File Name: 1M KCl 1M KCl carrier run 1.OMN Acq. Date: 14 April 2014
Method Detection Limit for ammonia (1M KCl) using 1.0 mg N/L standard

12-107-06-3-D Page 17 14 April 2014/lme
MDL= 0.2 mg N/L Standard Deviation (s) = 0.011 mg N/L, Mean (x) = 1.017 mg N/L, Known value = 1.0 mg N/L File Name: 1M KCl 1M KCl carrier run 1.OMN Acq. Date: 14 April 2014
Precision data for ammonia using 50.0 mg N/L standard % RSD =0.97 Standard Deviation (s) = 0.5 mg N/L, Mean (x) =51.55 mg N/L, Known value = 50.0 mg N/L File Name: 1M KCl 1M KCl carrier run 1.OMN Acq. Date: 14 April 2014
Carryover Study: 75.0 mg N/L standard followed by 3 blanks Carryover Passed File Name: 1M KCl 1M KCl carrier run 1.OMN Acq. Date: 14 April 2014

12-107-06-3-D Page 18 14 April 2014/lme
Calibration Data for Ammonia in 1M KCl, DI Carrier
Calibration Graph and Statistics
File Name: 1M KCl standards DI carrier.OMN Acq. Date: 14 April 2014

12-107-06-3-D Page 19 14 April 2014/lme
Method Detection Limit for ammonia using 1.0 mg N/L standard MDL= 0.2 mg N/L Standard Deviation (s) = 0.019 mg N/L, Mean (x) = 1.008 mg N/L, Known value = 1.0 mg N/L File Name: 1M KCl standards DI carrier.OMN Acq. Date: 14 April 2014
Precision data for ammonia using 50.0 mg N/L standard % RSD =0.70 Standard Deviation (s) = 0.35 mg N/L, Mean (x) = 49.87 mg N/L, Known value = 50.0 mg N/L File Name: 1M KCl standards DI carrier.OMN Acq. Date: 14 April 2014
Carryover Study: 75.0 mg N/L standard followed by 3 blanks Carryover Passed File Name: 1M KCl standards DI carrier.OMN Acq. Date: 14 April 2014

12-107-06-3-D Page 20 14 April 2014/lme