Embed Size (px)
Citation preview

Quincannon Associates Inc.Quincannon Associates Inc.
ShipbrokersShipbrokersPresentation to
INTERTANKO’S CHEMICAL TANKER SEMINAR
April 8, 2008Panama City, RPSoren Wolmar
Quincannon Associates, Inc.

Quincannon Associates Inc.Quincannon Associates Inc.
The Chemical Tanker The Chemical Tanker MarketMarket
• Development• Trends which will influence the market• Outlook

Quincannon Associates Inc.Quincannon Associates Inc.
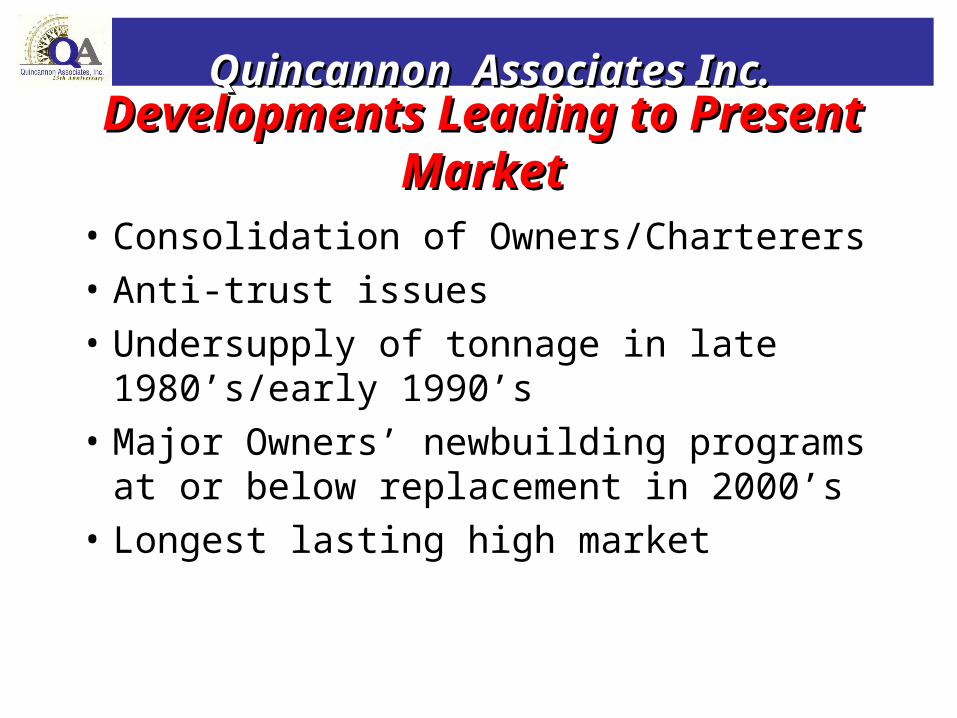
Developments Leading to Developments Leading to Present MarketPresent Market
• Increase in cargo volumes, in particular to China
• New Regulations: IMO/Marpol, upgrading cargoes
• Phasing out single hull vessels• Charterers’ vetting systems• High CPP markets
Quincannon Associates Inc.Quincannon Associates Inc.
Developments Leading to Developments Leading to Present MarketPresent Market
• Consolidation of Owners/Charterers• Anti-trust issues• Undersupply of tonnage in late
1980’s/early 1990’s• Major Owners’ newbuilding
programs at or below replacement in 2000’s
• Longest lasting high market

Quincannon Associates Inc.Quincannon Associates Inc.
QUINCANNON ANNUAL RATES5000MT SIMPLE CHEMICALS
1977-2007
0.00
20.00
40.00
60.00
80.00
100.00
120.00
140.00
1977
1978
1979
1980
1981
1982
1983
1984
1985
1986
1987
1988
1989
1990
1991
1992
1993
1994
1995
1996
1997
1998
1999
2000
2001
2002
2003
2004
2005
2006
2007
YEARS
AV
ER
AG
E U
SD
PM
T
TRANSPACIFIC
TRANSATLANTIC
Quincannon Associates Inc.Quincannon Associates Inc.
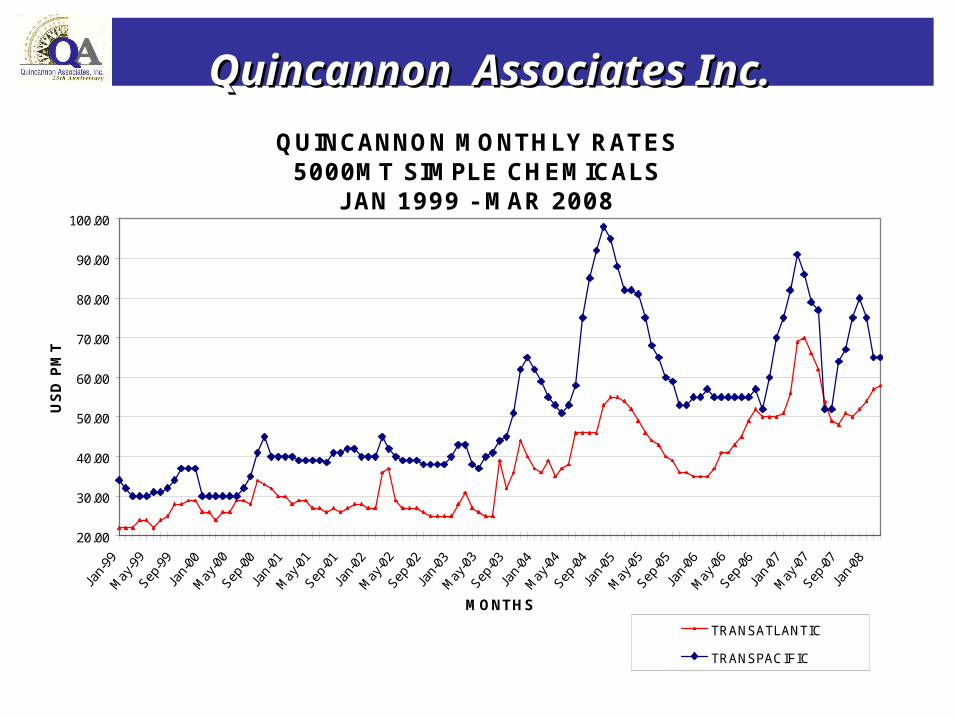
QUINCANNON MONTHLY RATES5000MT SIMPLE CHEMICALS
J AN 1999 - MAR 2008
20.00
30.00
40.00
50.00
60.00
70.00
80.00
90.00
100.00
Jan-
99M
ay-9
9Sep
-99
Jan-
00M
ay-0
0Sep
-00
Jan-
01M
ay-0
1Sep
-01
Jan-
02M
ay-0
2Sep
-02
Jan-
03M
ay-0
3Sep
-03
Jan-
04M
ay-0
4Sep
-04
Jan-
05M
ay-0
5Sep
-05
Jan-
06M
ay-0
6Sep
-06
Jan-
07M
ay-0
7Sep
-07
Jan-
08
MONTHS
USD
PM
T
TRANSATLANTIC
TRANSPACIFIC

Quincannon Associates Inc.Quincannon Associates Inc.
Atlantic Basin CPP Market Review J une 2001 through March 2008
50
150
250
350
450
550
650
Jun-
01Aug
-01
Oct
-01
Dec-0
1Fe
b-02
Apr-0
2Ju
n-02
Aug-0
2O
ct-0
2Dec
-02
Feb-
03Apr
-03
Jun-
03Aug
-03
Oct
-03
Dec-0
3Fe
b-04
Apr-0
4Ju
n-04
Aug-0
4O
ct-0
4Dec
-04
Feb-
05Apr
-05
Jun-
05Aug
-05
Oct
-05
Dec-0
5Fe
b-06
Apr-0
6Ju
n-06
Aug-0
6O
ct-0
6Dec
-06
Feb-
07Apr
-07
Jun-
07Aug
-07
Oct
-07
Dec-0
7Fe
b-08
Months
Wo
rld
Sca
le
Caribs/USAC - 38,000MT
Cont/USAC - 37,000MT

Quincannon Associates Inc.Quincannon Associates Inc.
Quincannon Fleet AnalysisTHE AGE OF CHEMICAL TANKERS (By # Vessels)
28 Fleets Servicing the North America Market - January 2008
0
10
20
30
40
50
60
70
80
1983
& P
rior
1984
1985
1986
1987
1988
1989
1990
1991
1992
1993
1994
1995
1996
1997
1998
1999
2000
2001
2002
2003
2004
2005
2006
2007
2008
2009
2010
2011
2012
2013
Year Built
# V
esse
ls B
uilt
per
Yea
r

Quincannon Associates Inc.Quincannon Associates Inc.
Quincannon Fleet AnalysisTHE AGE OF CHEMICAL TANKERS (By Deadweight)
28 Fleets Servicing the North America Market - January 2008
0
200,000
400,000
600,000
800,000
1,000,000
1,200,000
1,400,000
1,600,000
1,800,000
2,000,000
1983
& P
rior
1984
1985
1986
1987
1988
1989
1990
1991
1992
1993
1994
1995
1996
1997
1998
1999
2000
2001
2002
2003
2004
2005
2006
2007
2008
2009
2010
2011
2012
2013
Year Built
Dea
dw
eig
ht
Bu
ilt p
er Y
ear

Quincannon Associates Inc.Quincannon Associates Inc.
Quincannon Fleet AnalysisTONNAGE DISTRIBUTION OF THE LARGEST FLEETS
28 Fleets Servicing the North America Market - January 2008BY NUMBER OF VESSELS
Clipper Wonsild6%
Eitzen Chemical11%
Odfjell Seachem13%
Stolt-Nielsen Transportation
15%Tokyo Marine
8%
Other47%

Quincannon Associates Inc.Quincannon Associates Inc.
Quincannon Fleet AnalysisTONNAGE DISTRIBUTION OF THE LARGEST FLEETS
28 Fleets Servicing the North America Market - January 2008BY DEADWEIGHT
Eitzen Chemical9%
Odfjell Seachem14%
Stolt-Nielsen Transportation
16%
Tokyo Marine6%
UCT-UPT United6%
Other49%

Quincannon Associates Inc.Quincannon Associates Inc. TOP 12 PRODUCTS BY VOLUME TOP 12 PRODUCTS BY VOLUME 20062006
Upgraded in 2007 by New IMO Upgraded in 2007 by New IMO RulesRulesPalmoil 29.0 Million Tons, upgraded to IMO 2
Methanol 15.0 Million Tons, upgraded to IMO 3Soybeanoil 10.0 Million Tons, upgraded to IMO 2Caustic(liq) 8.7 Million Tons, unchanged (IMO 3)Sulfuric Acid 8.2 Million Tons, unchanged (IMO 3)Molasses 7.3 Million Tons, unchanged (none)MEG 5.8 Million Tons, upgraded to IMO 3MTBE 5.3 Million Tons, upgraded to IMO 3Xylene 5.1 Million Tons, upgraded to IMO 2Phosphoric Acid 4.1 Million Tons, unchanged (IMO 3)Ethanol 3.5 Million Tons, unchanged
(none)UAN 3.1 Million Tons, upgraded to IMO 3

Quincannon Associates Inc.Quincannon Associates Inc.
Future Trend on TonnageFuture Trend on Tonnage• The chemical tanker fleet is growing• Fleet composition is changing:
Smaller vessels, simple/sophisticatedLarger vessels mostly simple
General: less tanks/segregations
• Large owners’ fleet remain constant• Mid size owners growing, new trade
routes With 30 vsl + 1998: 4, 2008: 9
• New owners entering market

Quincannon Associates Inc.Quincannon Associates Inc.
Supply of TonnageSupply of TonnageQA Fleet Review of the approximately 30 owners serving the U.S. marketis published each year. The number of owners serving this market variesslightly from year to year.
Year Existing vsls/dwt of which +20 new buildings
2001 554/12.0 mill 78/2.0 mill 36/1.0 mill
2002 567/12.3 mill 112/2.6 mill 65/2.0 mill
2003 597/13.5 mill 125/3.1 mill 104/3.1 mill
2004 628/15.0 mill 111/2.8 mill 90/2.3 mill
2005 680/16.4 mill 111/2.9 mill 128/3.1 mill
2006 680/16.1 mill 125/3.5 mill 154/4.2 mill
2007 699/16.9 mill 114/3.1 mill 173/5.0 mill

Quincannon Associates Inc.Quincannon Associates Inc.
Supply of Tonnage Supply of Tonnage Chemical tankers between 1,000 dwt and 50,000 dwt with IMOclassification:
EXISTING +20 YEARS NEW BUILDINGSYear Vsls/Dwt Vsls/Dwt Vsls/Dwt
2004: 2169/33 mill 625/6.8 mill 320/7.8 mill
2005: 2295/36 mill 663/7.1 mill 475/10.1 mill
2006: 2487/41 mill 738/8.3 mill 523/10.1 mill
2007: 2677/45 mill* 726/8.7 mill 755/16.1 mill

Quincannon Associates Inc.Quincannon Associates Inc.
Future Trend on TonnageFuture Trend on Tonnage
• Modifying factors:Availability of finance/credit crunchDelay in delivery of new buildingsCancellation of new buildings

Quincannon Associates Inc.Quincannon Associates Inc.
Change in Fleet CompositionChange in Fleet CompositionChemical Tankers and Tankers for Chemical Tankers and Tankers for
Oil/ChemicalsOil/Chemicals(approximate figures for 2007)(approximate figures for 2007)
Vessel size (dwt) Existing Fleet 20 Years+ New Buildings
1,000 - 5,000 727 304 64* 5,000 - 10,000 617 219 12210,000 - 20,000 514 89 31320,000 - 30,000 134 55 2530,000 - 40,000 340 60 9540,000 - 50,000 345 35 136TOTAL 2,677 762 755
*Does not include large number of small vessels being built in China for domestic trade

Quincannon Associates Inc.Quincannon Associates Inc.
Future Trends on CargoFuture Trends on Cargo
• 2007: about 150 mill chemicals/vegoils shipped
• Vegoil growing by 7.5% to 10% pa• Chemicals growing by 6% pa

Quincannon Associates Inc.Quincannon Associates Inc.
Future Trends on CargoFuture Trends on Cargo• Ton/miles:• China, SE Asia and AG will replace U.S.
and European production• Chemical ton/miles will be reduced• Bio Diesel, Ethanol and vegoils will
increase ton/miles• More emphasize on regional trade, less
on deep sea• Recession, less volume, change in
direction

Quincannon Associates Inc.Quincannon Associates Inc.
Other Factors Impacting Other Factors Impacting MarketMarket
• Chemical tanker/clean tanker market interaction
• Future restriction on last cargoes• Political turmoil• Weather related production
interruption• Port congestion

Quincannon Associates Inc.Quincannon Associates Inc.
QUINCANNON ASSOCIATESPACIFIC FREIGHT RATES
USG TO FEA & FEA TO USG 5000MTONS SIMPLE CHEMICALS
2005-2007
40
50
60
70
80
90
100
110
120
Dec-0
4
Jan-
05
Feb-0
5
Mar
-05
Apr-0
5
May
-05
Jun-
05
Jul-0
5
Aug-0
5
Sep-0
5
Oct-05
Nov-0
5
Dec-0
5
Jan-
06
Feb-0
6
Mar
-06
Apr-0
6
May
-06
Jun-
06
Jul-0
6
Aug-0
6
Sep-0
6
Oct-06
Nov-0
6
Dec-0
6
Jan-
07
Feb-0
7
Mar
-07
US
$ /
PM
T
USG to FE FE to USG
Example of Weather Related Market Interruptions
Hurricane Katrina

Quincannon Associates Inc.Quincannon Associates Inc.
OutlookOutlook• More vessels/capacity• More owners competing • Declining or steady ton/miles• Turning point in the market• The end of the longest lasting high market• Open questions: • Recession, declining cargo volumes• New building prices/steel prices• Chinese shipbuilding policy in low market

Quincannon Associates Inc.Quincannon Associates Inc.
ShipbrokersShipbrokers
Thank you