Embed Size (px)
Citation preview
Quarterly Journal of Political Science, 2013, 8: 451–464
Research Note
Presidential Prospects, Political Support,and Stock Market Performance
Nikhar Gaikwad∗
Yale University, New Haven, CT 06520, USA; [email protected]
ABSTRACT
I exploit the sudden and dramatic jolt that Osama Bin Laden’s cap-ture gave to Barack Obama’s 2012 re-election prospects to gauge therelationship between presidential prospects and stock market valuationchanges. Using campaign contributions as an indicator of political sup-port, I find that following Bin Laden’s death, firms that had previouslysupported Democrats registered significant positive returns, whereasfirms that had supported Republicans registered significant negativereturns. Across the S&P 500, the president’s transformed re-electionprospects shifted market capital worth $101 billion over one day and
∗ I thank Adam Bonica, Joshua Clinton, James Davis, Thad Dunning, Andrew Eggers,Justin Grimmer, Jacob Hacker, Gregory Huber, Keith Krehbiel, Andrew Metrick, Clay-ton Nall, Celia Paris, Eleanor Powell, Pia Raffler, Kenneth Scheve, Nicole Simonelli,Richard Skinner, Heather Tookes, Steven Wilkinson, two anonymous reviewers, andseminar participants at Yale University, New York University, The Tobin Project, andthe Midwest Political Science Association for feedback and advice. Susan Alger and thestaff at the Center for Responsive Politics generously provided data and volunteeredtheir time on this project.
Online Appendix available from:http://dx.doi.org/10.1561/100.00012114 appSupplementary Material available from:http://dx.doi.org/10.1561/100.00012114 suppMS submitted 19 December 2012 ; final version received 11 July 2013ISSN 1554-0626; DOI 10.1561/100.00012114c© 2013 N. Gaikwad
452 Gaikwad
$245 billion over one week. My findings indicate that the relationshipbetween the presidency and firm valuations is associated with patternsof past political support, substantively and significantly important, andmore pronounced for the presidency than for Congress.
Keywords: Money and politics; event studies; campaign contributions;presidential elections.
Osama Bin Laden’s capture on May 1, 2011 unexpectedly and dramati-cally augmented President Barack Obama’s re-election prospects. Becausethe operation to locate Bin Laden was shrouded in secrecy, market partic-ipants had no prior knowledge of it. I use this exogenous jolt to Obama’sre-election prospects to study whether firms that had previously donatedto Democrats (or Republicans) gained (or lost) stock market value fromthe suddenly increased probability that the president would win a secondterm. My approach neither adjudicates the causal effect of contributions onfirm valuations, nor assumes that investors believe that contributions influ-ence political outcomes. It accurately ascertains, however, the value that thepresidency bestows on firms, and provides evidence that this relationship isassociated with patterns of past support.
The small but growing literature investigating how political events impactpolitically oriented firms has produced contradictory results. Although somestudies argue that political alignments do not matter for firm valuations(e.g., Ansolabehere et al., 2004; Fisman et al., 2012; Werner, 2011), othersdemonstrate that they do matter (e.g., Jayachandran, 2006; Knight, 2006;Mattozzi, 2008; Monroe, 2010). These inconsistent results likely stem fromthe nature of the event analyzed; it may be that only entirely unanticipatedand highly salient political events generate discernible market reactions.1
The event I study satisfies both requirements. In addition to being a
1 Even if the judicial verdicts on campaign finance analyzed by Ansolabehere et al. or Wernercontained information entirely new to shareholders, to the extent that these verdicts werematerial, investors might have developed prior expectations about them based on media cover-age, expert commentary, or courtroom disclosures. Similarly, in studies that look at politicians’health shocks (e.g., Fisman et al.), investors might previously have priced health concerns intostock prices. Likewise, even in events with considerable uncertainty, such as tossup elections,stock prices should already have incorporated the probability that the election would swing ineither direction.
Presidential Prospects, Political Support, and Stock Market Performance 453
complete surprise, Bin Laden’s capture resulted in the largest increase andthe highest level reached in the president’s re-election probability duringthe entire election cycle, thereby making it an ideal case for adjudicatingbetween competing claims in the literature.
Apart from leveraging a rare and potent exogenous event, my study takesadvantage of methodological improvements and new sources of data to buildupon and extend the findings of its predecessors. My approach follows thatof Jayachandran (2006), whose study shows that partisan realignments inthe Senate impact the valuations of politically oriented firms. I focus onthe presidency, however, and I improve on the study’s method by usingprediction markets data to independently identify the extent and durationof the president’s electoral boost.2
Studies concentrating on presidential electoral probabilities (e.g., Knight,2006; Mattozzi, 2008) explore how investors use stock markets to hedgeagainst political uncertainty or how policy platforms are capitalized intoequity prices, not how contributions correlate with firm returns, whichis my focus.3 Moreover, they investigate presidential races over extendedelection cycles during which confounding developments such as concurrentpolitical races (Shon, 2010) or economic events can affect both electoralprobabilities and stock prices (Snowberg et al. 2011). The intra-day andshort-term market reactions I study, by contrast, alleviate concerns aboutreverse causality and omitted variable bias that arise from using protractedevent windows. Furthermore, I disentangle firm contributions from industrycontributions in order to study how the presidency shapes both industryand firm-level prospects.
My study documents the precise magnitude of the effect of the president’sre-election probability on firm valuations. There is considerable debate aboutthe impact of the presidency on broader economic outcomes, especially inregard to inequality, taxation, and redistribution (Hacker and Pierson, 2012),
2 Snowberg et al. (2011) argue that prediction markets data can be used to ascertain event win-dows. The start of the event window is difficult to identify in Jayachandran’s study, becauserumors about the Senate shift were aired for days before the switch was announced. Addition-ally, the study considers event windows ranging from four days to six months, but does notoffer an ex ante rationale to favor any particular time frame of analysis.
3 Knight selects a sample of 70 firms that equity analysts identify as partisan-leaning firms,and only uses campaign contributions as a reliability check. Mattozzi applies contributionthresholds to identify a small subset of firms that potentially fare differently under Democrat orRepublican control. Both studies investigate how portfolio movements correlate with electoralpolls, not how contributions are associated with stock returns.
454 Gaikwad
and the impact of the presidency on firm-level outcomes is similarly unclear.4
Prior studies have documented a relationship between the presidency andmarket-wide outcomes, and have shown that the presidency typically has abigger impact than Congress on markets (Snowberg et al., 2007). My resultsindicate that the presidency is more consequential than Congress for thevaluation of politically oriented firms.
1 Measuring Stock Price Responses to Presidential Prospects
1.1 Event
As the mastermind behind the September 11th terrorist attacks and thehead of al-Qaeda, Bin Laden’s capture had immediate and dramatic signif-icance for both foreign and domestic politics. Given the absolute secrecy ofOperation Neptune Spear, it is implausible that market participants couldhave anticipated either the timing of Bin Laden’s capture or its politicalrepercussions (e.g., Bergen, 2012). The event was made public on Sunday,May 1, 2011. I thus analyze changes in equity valuations after Friday, April29th, the previous trading day.
1.2 Effect
Receiving credit for Bin Laden’s capture unambiguously enhanced Obama’spolitical standing, at least temporarily. Following the event, media punditsand equity research analysts all opined that Obama’s re-election chances hadsubstantially improved; additionally, a Pew Research Center poll conductedon the heels of Bin Laden’s capture showed that Obama’s approval ratinghad increased by 19%.5 Prediction markets — websites that allow tradersto make real-time bets on key events — quantify the extent to which BinLaden’s capture affected Obama’s re-election prospects. On May 2nd, therewas a 19% increase in Obama’s re-election probability, the sharpest change
4 On the one hand, the presidency might offer few direct benefits to firms. Presidents dependon the support of broader constituencies, receive heightened media scrutiny, and endure asustained vetting process that arguably makes them less amenable to capture by special inter-ests. On the other hand, media coverage and round-the-clock attention ensures that marketparticipants are acutely aware of factors influencing presidential prospects, and the downstreamimplications of these prospects for politically oriented firms.
5 See, e.g., Business Insider, May 2, 2011; KeyBanc Capital Markets, May 2, 2011; J.P.Morgan,May 2, 2011; Deutsche Bank, May 2, 2011; Pew Research Center Publications, May 3, 2011;and Online Appendix.
Presidential Prospects, Political Support, and Stock Market Performance 455
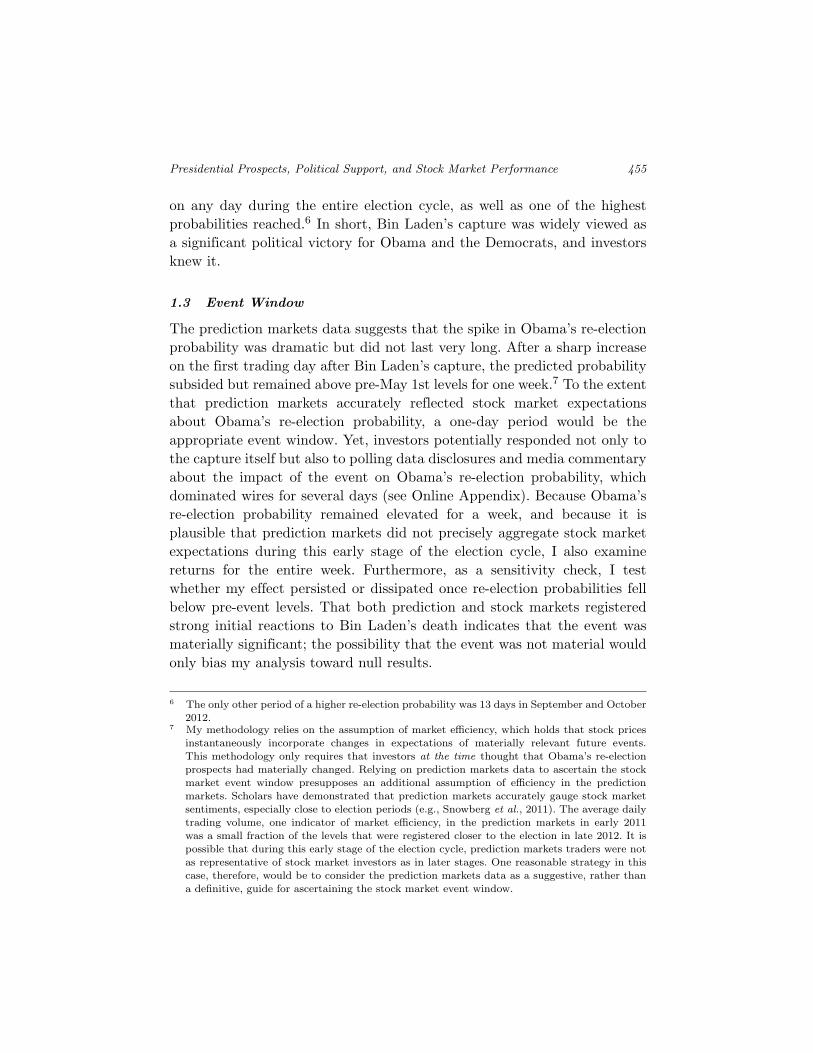
on any day during the entire election cycle, as well as one of the highestprobabilities reached.6 In short, Bin Laden’s capture was widely viewed asa significant political victory for Obama and the Democrats, and investorsknew it.
1.3 Event Window
The prediction markets data suggests that the spike in Obama’s re-electionprobability was dramatic but did not last very long. After a sharp increaseon the first trading day after Bin Laden’s capture, the predicted probabilitysubsided but remained above pre-May 1st levels for one week.7 To the extentthat prediction markets accurately reflected stock market expectationsabout Obama’s re-election probability, a one-day period would be theappropriate event window. Yet, investors potentially responded not only tothe capture itself but also to polling data disclosures and media commentaryabout the impact of the event on Obama’s re-election probability, whichdominated wires for several days (see Online Appendix). Because Obama’sre-election probability remained elevated for a week, and because it isplausible that prediction markets did not precisely aggregate stock marketexpectations during this early stage of the election cycle, I also examinereturns for the entire week. Furthermore, as a sensitivity check, I testwhether my effect persisted or dissipated once re-election probabilities fellbelow pre-event levels. That both prediction and stock markets registeredstrong initial reactions to Bin Laden’s death indicates that the event wasmaterially significant; the possibility that the event was not material wouldonly bias my analysis toward null results.
6 The only other period of a higher re-election probability was 13 days in September and October2012.
7 My methodology relies on the assumption of market efficiency, which holds that stock pricesinstantaneously incorporate changes in expectations of materially relevant future events.This methodology only requires that investors at the time thought that Obama’s re-electionprospects had materially changed. Relying on prediction markets data to ascertain the stockmarket event window presupposes an additional assumption of efficiency in the predictionmarkets. Scholars have demonstrated that prediction markets accurately gauge stock marketsentiments, especially close to election periods (e.g., Snowberg et al., 2011). The average dailytrading volume, one indicator of market efficiency, in the prediction markets in early 2011was a small fraction of the levels that were registered closer to the election in late 2012. It ispossible that during this early stage of the election cycle, prediction markets traders were notas representative of stock market investors as in later stages. One reasonable strategy in thiscase, therefore, would be to consider the prediction markets data as a suggestive, rather thana definitive, guide for ascertaining the stock market event window.
456 Gaikwad
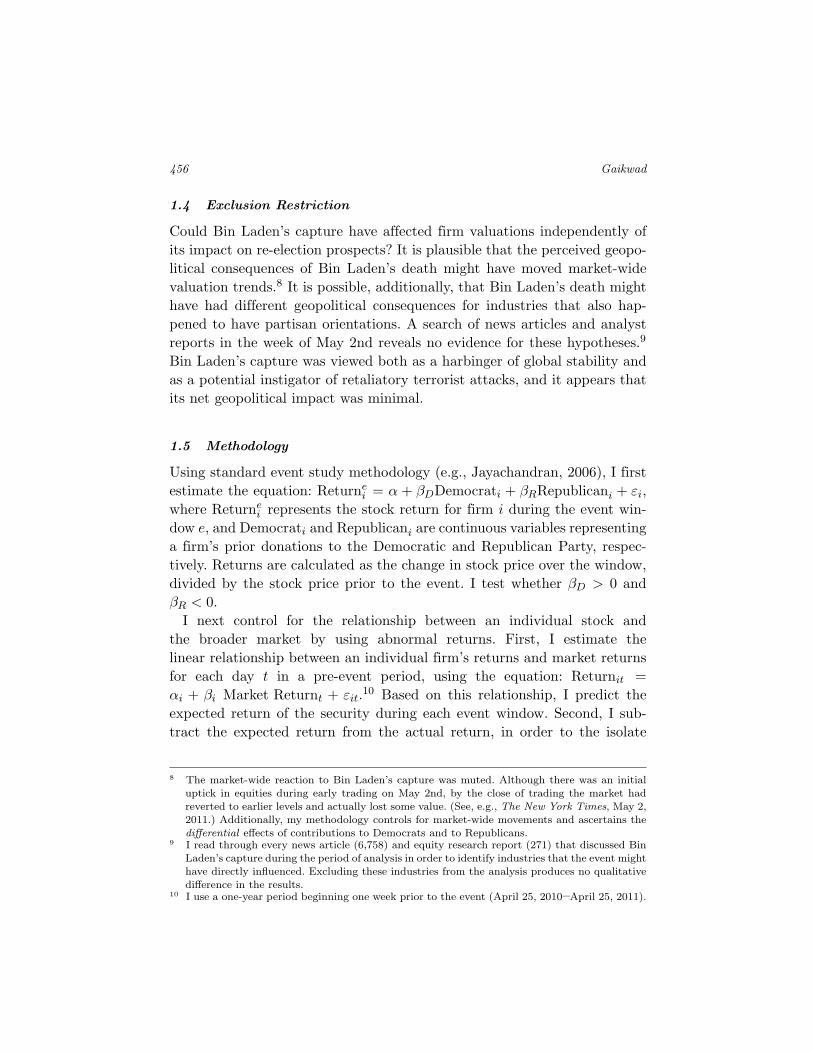
1.4 Exclusion Restriction
Could Bin Laden’s capture have affected firm valuations independently ofits impact on re-election prospects? It is plausible that the perceived geopo-litical consequences of Bin Laden’s death might have moved market-widevaluation trends.8 It is possible, additionally, that Bin Laden’s death mighthave had different geopolitical consequences for industries that also hap-pened to have partisan orientations. A search of news articles and analystreports in the week of May 2nd reveals no evidence for these hypotheses.9
Bin Laden’s capture was viewed both as a harbinger of global stability andas a potential instigator of retaliatory terrorist attacks, and it appears thatits net geopolitical impact was minimal.
1.5 Methodology
Using standard event study methodology (e.g., Jayachandran, 2006), I firstestimate the equation: Returne
i = α + βDDemocrati + βRRepublicani + εi,where Returne
i represents the stock return for firm i during the event win-dow e, and Democrati and Republicani are continuous variables representinga firm’s prior donations to the Democratic and Republican Party, respec-tively. Returns are calculated as the change in stock price over the window,divided by the stock price prior to the event. I test whether βD > 0 andβR < 0.
I next control for the relationship between an individual stock andthe broader market by using abnormal returns. First, I estimate thelinear relationship between an individual firm’s returns and market returnsfor each day t in a pre-event period, using the equation: Returnit =αi + βi Market Returnt + εit.10 Based on this relationship, I predict theexpected return of the security during each event window. Second, I sub-tract the expected return from the actual return, in order to the isolate
8 The market-wide reaction to Bin Laden’s capture was muted. Although there was an initialuptick in equities during early trading on May 2nd, by the close of trading the market hadreverted to earlier levels and actually lost some value. (See, e.g., The New York Times, May 2,2011.) Additionally, my methodology controls for market-wide movements and ascertains thedifferential effects of contributions to Democrats and to Republicans.
9 I read through every news article (6,758) and equity research report (271) that discussed BinLaden’s capture during the period of analysis in order to identify industries that the event mighthave directly influenced. Excluding these industries from the analysis produces no qualitativedifference in the results.
10 I use a one-year period beginning one week prior to the event (April 25, 2010–April 25, 2011).
Presidential Prospects, Political Support, and Stock Market Performance 457
the firm-specific component of the valuation changes, by using the formula:Abnormal Returne
i = Returnei − [α̂i + β̂i Market Returne].
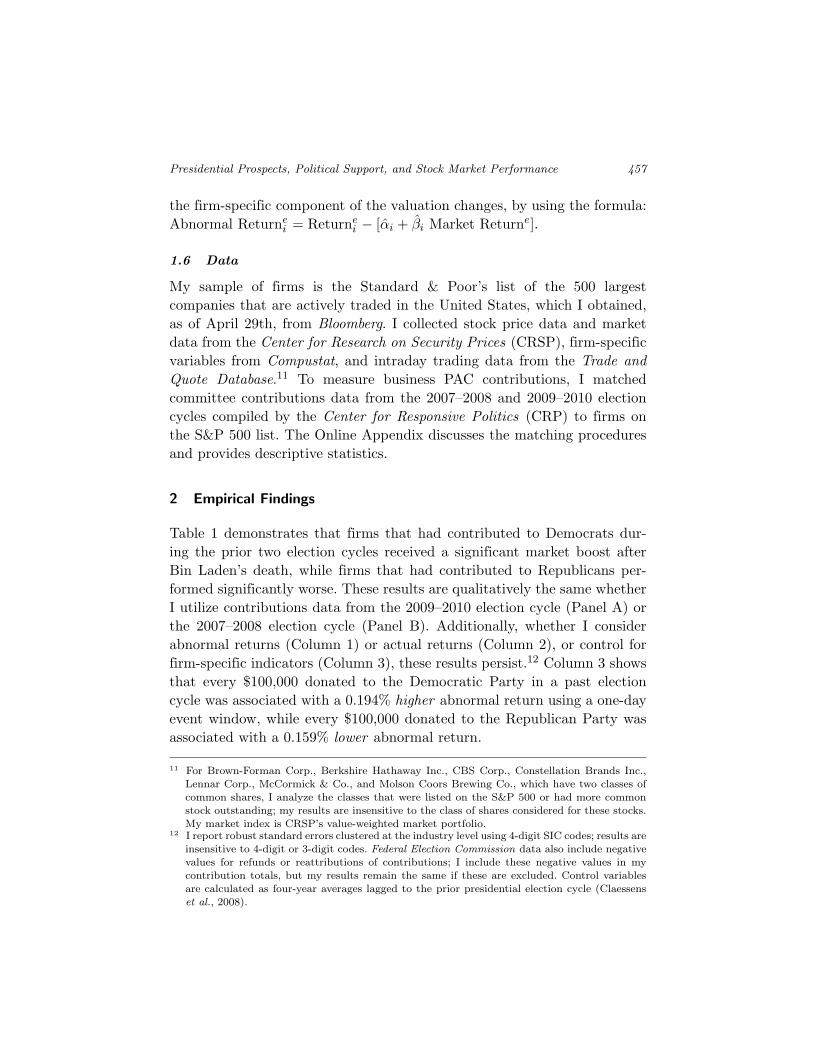
1.6 Data
My sample of firms is the Standard & Poor’s list of the 500 largestcompanies that are actively traded in the United States, which I obtained,as of April 29th, from Bloomberg. I collected stock price data and marketdata from the Center for Research on Security Prices (CRSP), firm-specificvariables from Compustat, and intraday trading data from the Trade andQuote Database.11 To measure business PAC contributions, I matchedcommittee contributions data from the 2007–2008 and 2009–2010 electioncycles compiled by the Center for Responsive Politics (CRP) to firms onthe S&P 500 list. The Online Appendix discusses the matching proceduresand provides descriptive statistics.
2 Empirical Findings
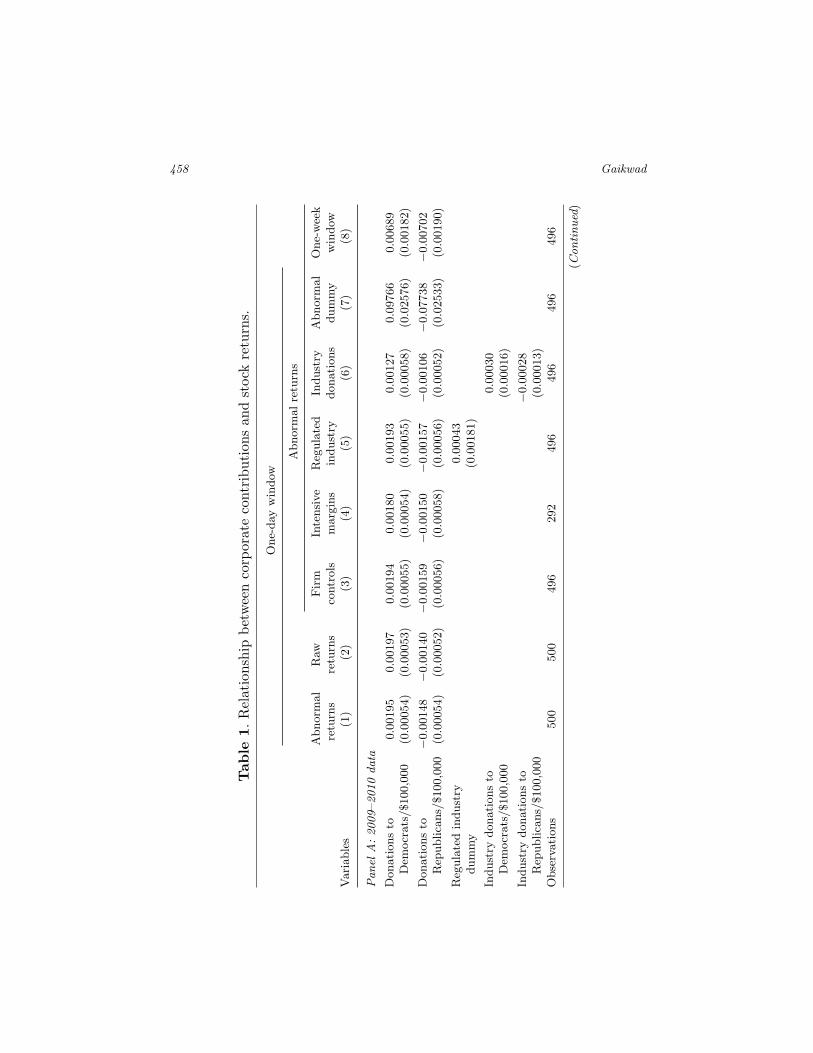
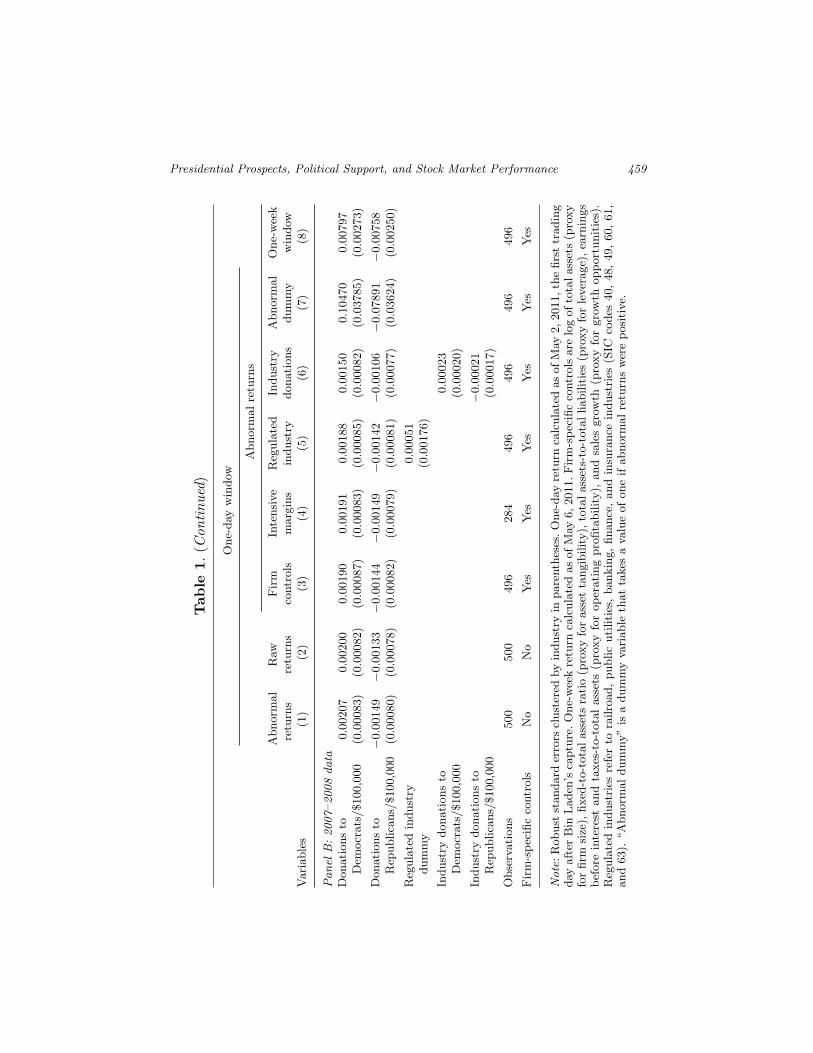
Table 1 demonstrates that firms that had contributed to Democrats dur-ing the prior two election cycles received a significant market boost afterBin Laden’s death, while firms that had contributed to Republicans per-formed significantly worse. These results are qualitatively the same whetherI utilize contributions data from the 2009–2010 election cycle (Panel A) orthe 2007–2008 election cycle (Panel B). Additionally, whether I considerabnormal returns (Column 1) or actual returns (Column 2), or control forfirm-specific indicators (Column 3), these results persist.12 Column 3 showsthat every $100,000 donated to the Democratic Party in a past electioncycle was associated with a 0.194% higher abnormal return using a one-dayevent window, while every $100,000 donated to the Republican Party wasassociated with a 0.159% lower abnormal return.
11 For Brown-Forman Corp., Berkshire Hathaway Inc., CBS Corp., Constellation Brands Inc.,Lennar Corp., McCormick & Co., and Molson Coors Brewing Co., which have two classes ofcommon shares, I analyze the classes that were listed on the S&P 500 or had more commonstock outstanding; my results are insensitive to the class of shares considered for these stocks.My market index is CRSP’s value-weighted market portfolio.
12 I report robust standard errors clustered at the industry level using 4-digit SIC codes; results areinsensitive to 4-digit or 3-digit codes. Federal Election Commission data also include negativevalues for refunds or reattributions of contributions; I include these negative values in mycontribution totals, but my results remain the same if these are excluded. Control variablesare calculated as four-year averages lagged to the prior presidential election cycle (Claessenset al., 2008).
458 Gaikwad
Tab
le1.
Rel
atio
nshi
pbe
twee
nco
rpor
ate
cont
ribu
tion
san
dst
ock
retu
rns.
One
-day
win
dow
Abn
orm
alre
turn
s
Abn
orm
alre
turn
sR
awre
turn
sFir
mco
ntro
lsIn
tens
ive
mar
gins
Reg
ulat
edin
dust
ryIn
dust
rydo
nati
ons
Abn
orm
aldu
mm
yO
ne-w
eek
win
dow
Var
iabl
es(1
)(2
)(3
)(4
)(5
)(6
)(7
)(8
)
Pan
elA
:20
09–2
010
data
Don
atio
nsto
Dem
ocra
ts/$
100,
000
0.00
195
0.00
197
0.00
194
0.00
180
0.00
193
0.00
127
0.09
766
0.00
689
(0.0
0054
)(0
.000
53)
(0.0
0055
)(0
.000
54)
(0.0
0055
)(0
.000
58)
(0.0
2576
)(0
.001
82)
Don
atio
nsto
Rep
ublic
ans/
$100
,000
−0.0
0148
−0.0
0140
−0.0
0159
−0.0
0150
−0.0
0157
−0.0
0106
−0.0
7738
−0.0
0702
(0.0
0054
)(0
.000
52)
(0.0
0056
)(0
.000
58)
(0.0
0056
)(0
.000
52)
(0.0
2533
)(0
.001
90)
Reg
ulat
edin
dust
rydu
mm
y0.
0004
3(0
.001
81)
Indu
stry
dona
tion
sto
Dem
ocra
ts/$
100,
000
0.00
030
(0.0
0016
)
Indu
stry
dona
tion
sto
Rep
ublic
ans/
$100
,000
−0.0
0028
(0.0
0013
)O
bser
vati
ons
500
500
496
292
496
496
496
496
(Con
tinu
ed)
Presidential Prospects, Political Support, and Stock Market Performance 459
Tab
le1.
(Con
tinu
ed)
One
-day
win
dow
Abn
orm
alre
turn
s
Abn
orm
alre
turn
sR
awre
turn
sFir
mco
ntro
lsIn
tens
ive
mar
gins
Reg
ulat
edin
dust
ryIn
dust
rydo
nati
ons
Abn
orm
aldu
mm
yO
ne-w
eek
win
dow
Var
iabl
es(1
)(2
)(3
)(4
)(5
)(6
)(7
)(8
)
Pan
elB:20
07–2
008
data
Don
atio
nsto
Dem
ocra
ts/$
100,
000
0.00
207
0.00
200
0.00
190
0.00
191
0.00
188
0.00
150
0.10
470
0.00
797
(0.0
0083
)(0
.000
82)
(0.0
0087
)(0
.000
83)
(0.0
0085
)(0
.000
82)
(0.0
3785
)(0
.002
73)
Don
atio
nsto
Rep
ublic
ans/
$100
,000
−0.0
0149
−0.0
0133
−0.0
0144
−0.0
0149
−0.0
0142
−0.0
0106
−0.0
7891
−0.0
0758
(0.0
0080
)(0
.000
78)
(0.0
0082
)(0
.000
79)
(0.0
0081
)(0
.000
77)
(0.0
3624
)(0
.002
50)
Reg
ulat
edin
dust
rydu
mm
y0.
0005
1(0
.001
76)
Indu
stry
dona
tion
sto
Dem
ocra
ts/$
100,
000
0.00
023
(0.0
0020
)
Indu
stry
dona
tion
sto
Rep
ublic
ans/
$100
,000
−0.0
0021
(0.0
0017
)
Obs
erva
tion
s50
050
049
628
449
649
649
649
6
Fir
m-s
peci
ficco
ntro
lsN
oN
oY
esY
esY
esY
esY
esY
es
Not
e:R
obus
tst
anda
rder
rors
clus
tere
dby
indu
stry
inpa
rent
hese
s.O
ne-d
ayre
turn
calc
ulat
edas
ofM
ay2,
2011
,the
first
trad
ing
day
afte
rB
inLad
en’s
capt
ure.
One
-wee
kre
turn
calc
ulat
edas
ofM
ay6,
2011
.Fir
m-s
peci
ficco
ntro
lsar
elo
gof
tota
lass
ets
(pro
xyfo
rfir
msi
ze),
fixed
-to-
tota
lass
ets
rati
o(p
roxy
for
asse
tta
ngib
ility
),to
tala
sset
s-to
-tot
allia
bilit
ies
(pro
xyfo
rle
vera
ge),
earn
ings
befo
rein
tere
stan
dta
xes-
to-t
otal
asse
ts(p
roxy
for
oper
atin
gpr
ofita
bilit
y),an
dsa
les
grow
th(p
roxy
for
grow
thop
port
unit
ies)
.R
egul
ated
indu
stri
esre
fer
tora
ilroa
d,pu
blic
utili
ties
,ba
nkin
g,fin
ance
,an
din
sura
nce
indu
stri
es(S
ICco
des
40,48
,49
,60
,61
,an
d63
).“A
bnor
mal
dum
my”
isa
dum
my
vari
able
that
take
sa
valu
eof
one
ifab
norm
alre
turn
sw
ere
posi
tive
.
460 Gaikwad
I next conduct several analyses to explore political factors related to theevent study. First, I restrict my sample to only those firms that donatedmoney (Column 4) in order to ascertain the extent to which contributor/non-contributor margins explain the results, and find similar coefficients to thosein the extensive margins analysis. I also investigate whether firms in regu-lated industries are driving my results (Column 5), as it is possible that thesefirms are more sensitive to the executive; the coefficient on the regulatedindustry dummy is statistically indistinguishable from zero, suggesting thatDemocrat and Republican donor firms had larger stock price changes thanregulated firms. Additionally, I explore whether industry-wide contributionsreflect political alignments that benefit individual firms. For each firm inmy sample, I subtract the firm’s own contributions from the total contribu-tions of all other S&P 500 firms in the industry, and include this variable inthe regression (Column 6).13 The coefficients on individual firms’ donationsare larger and have more predictive power than the coefficients on industrydonations. Moreover, to study the role of outliers, I convert my dependentvariable into a dummy that takes a value of one if abnormal returns arepositive (Column 7). Every $100,000 donated to Democrats was associatedwith a 9.77% higher probability that the firm gained market value; dona-tions to Republicans have the opposite effect. Last, I extend my analysis toa one-week period (Column 8), and find larger effects in this window.
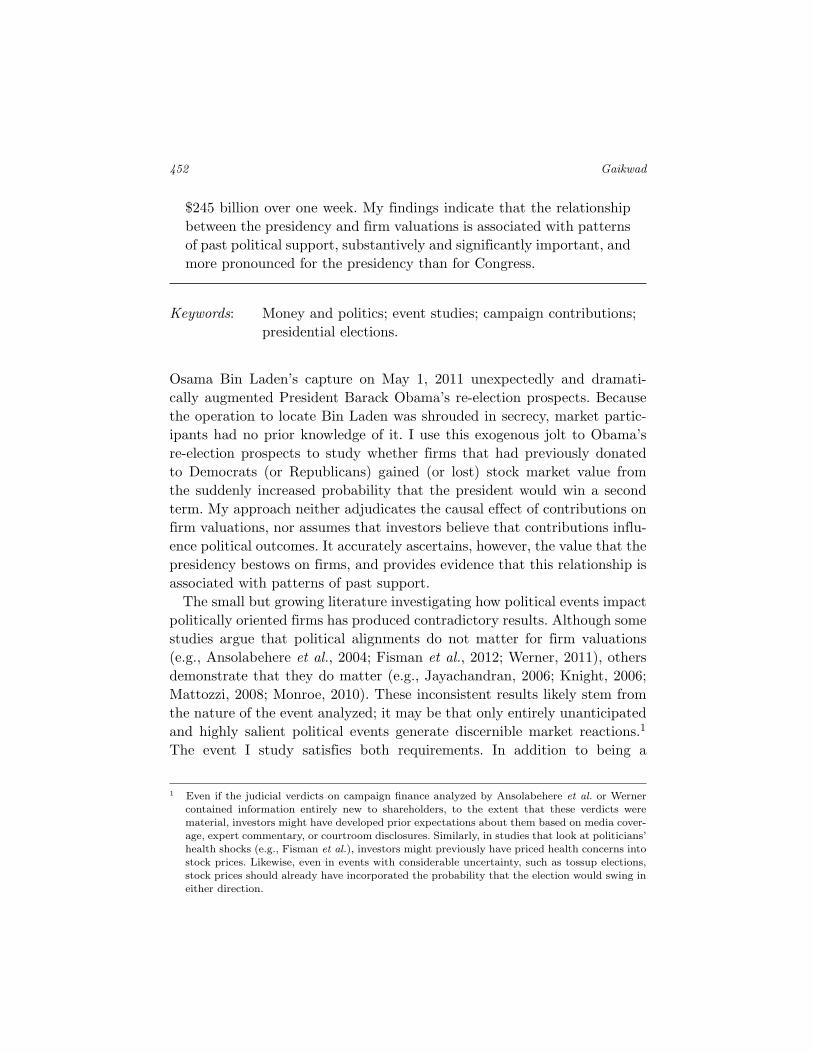
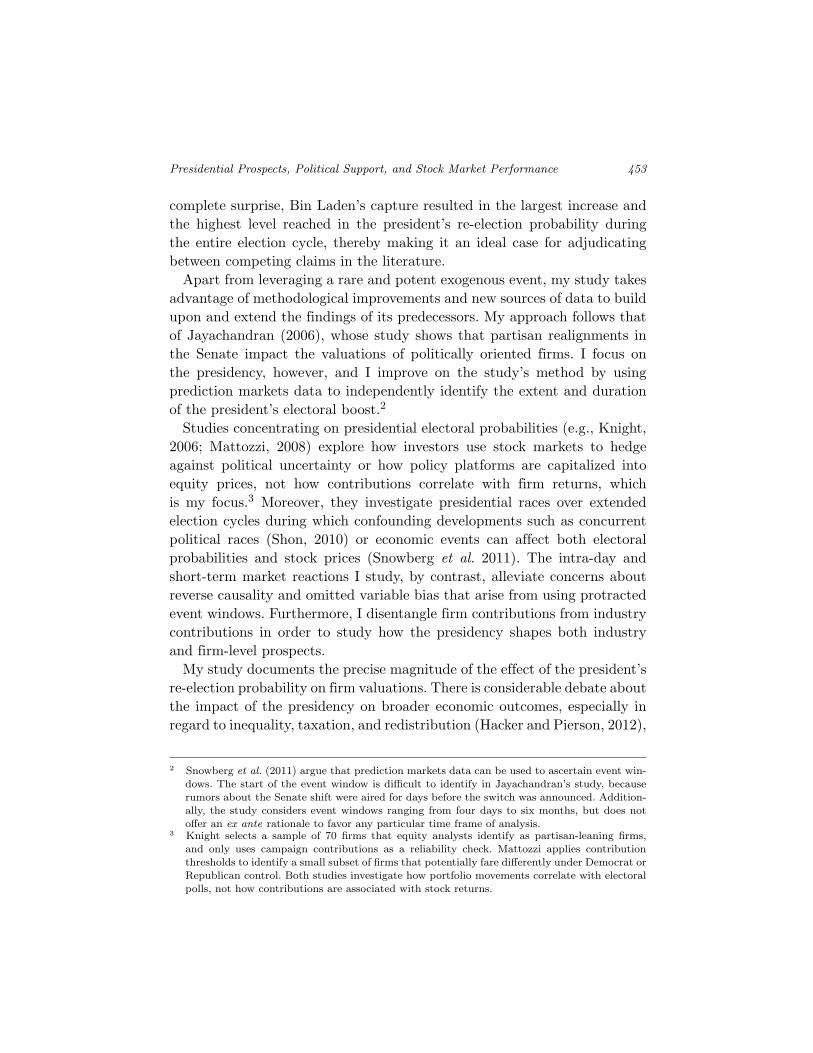
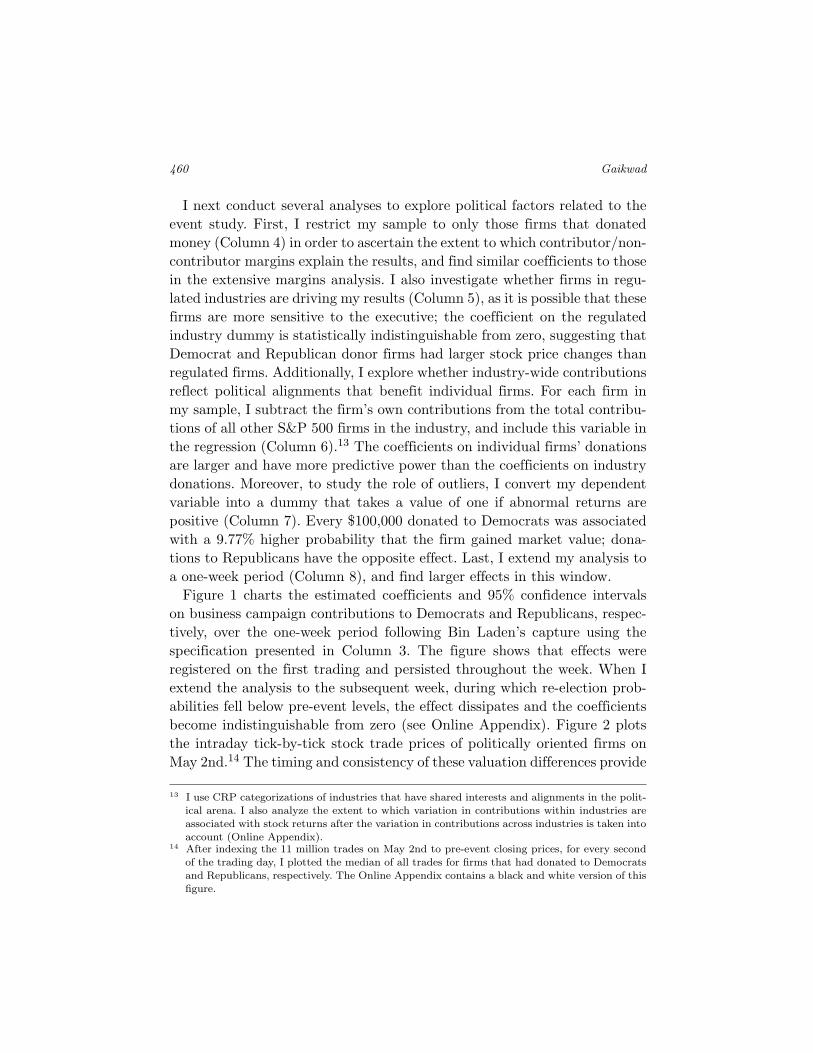
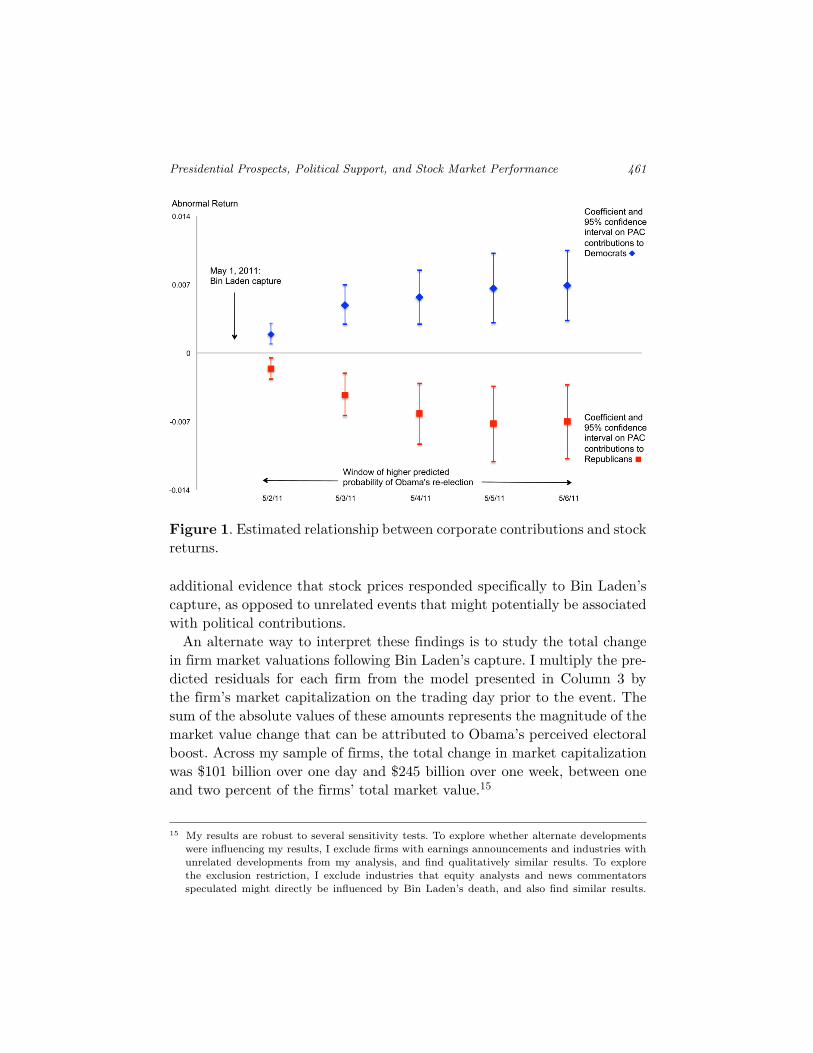
Figure 1 charts the estimated coefficients and 95% confidence intervalson business campaign contributions to Democrats and Republicans, respec-tively, over the one-week period following Bin Laden’s capture using thespecification presented in Column 3. The figure shows that effects wereregistered on the first trading and persisted throughout the week. When Iextend the analysis to the subsequent week, during which re-election prob-abilities fell below pre-event levels, the effect dissipates and the coefficientsbecome indistinguishable from zero (see Online Appendix). Figure 2 plotsthe intraday tick-by-tick stock trade prices of politically oriented firms onMay 2nd.14 The timing and consistency of these valuation differences provide
13 I use CRP categorizations of industries that have shared interests and alignments in the polit-ical arena. I also analyze the extent to which variation in contributions within industries areassociated with stock returns after the variation in contributions across industries is taken intoaccount (Online Appendix).
14 After indexing the 11 million trades on May 2nd to pre-event closing prices, for every secondof the trading day, I plotted the median of all trades for firms that had donated to Democratsand Republicans, respectively. The Online Appendix contains a black and white version of thisfigure.
Presidential Prospects, Political Support, and Stock Market Performance 461
Figure 1. Estimated relationship between corporate contributions and stockreturns.
additional evidence that stock prices responded specifically to Bin Laden’scapture, as opposed to unrelated events that might potentially be associatedwith political contributions.
An alternate way to interpret these findings is to study the total changein firm market valuations following Bin Laden’s capture. I multiply the pre-dicted residuals for each firm from the model presented in Column 3 bythe firm’s market capitalization on the trading day prior to the event. Thesum of the absolute values of these amounts represents the magnitude of themarket value change that can be attributed to Obama’s perceived electoralboost. Across my sample of firms, the total change in market capitalizationwas $101 billion over one day and $245 billion over one week, between oneand two percent of the firms’ total market value.15
15 My results are robust to several sensitivity tests. To explore whether alternate developmentswere influencing my results, I exclude firms with earnings announcements and industries withunrelated developments from my analysis, and find qualitatively similar results. To explorethe exclusion restriction, I exclude industries that equity analysts and news commentatorsspeculated might directly be influenced by Bin Laden’s death, and also find similar results.
462 Gaikwad
Figure 2. Intraday trades for politically oriented firms.
3 Discussion
My findings show that the fortunes of firms parallel the fortunes of thepoliticians they support. The data neither captures the causal effect of con-tributions on valuations nor identifies the reason for this correlation. It ispossible, for example, that businesses donate to supportive politicians, suchthat policy outcomes remain unaffected by donations. Yet, that firms gainor lose from political events in ways that are correlated with past supportsuggests that donations might serve ends beyond simple consumption, a viewfound in previous work (Ansolabehere et al., 2003). It is equally plausiblethat contributions proxy the favorability of political parties toward certainindustries. By disaggregating firm- and industry-level contributions, how-ever, I provide evidence that political outlooks might influence firm-level
Additionally, I conduct different types of placebo tests and use alternate model specifications.See Online Appendix.
Presidential Prospects, Political Support, and Stock Market Performance 463
prospects in addition to industry-level prospects. Whether investors disen-tangle the relationship between contributions, political prospects, and firmoutlooks is an open question — one that I leave to future studies.
Comparing the magnitude of these effects with the results of prior eventstudies suggests that the presidency is more important than Congress forthe valuation of politically oriented firms.16 This is perhaps surprising,because Congress — not the president — determines appropriations andother types of policies that donating firms might conceivably find interest-ing. One potential explanation for this finding is that the president shapesbusiness outlooks, and that business contributions mirror the president’spolicy preferences. Another possibility is that investors do not differenti-ate between the various political influences on business policies, but insteadsimply look to the president as the bellwether for the overall direction ofpublic policy in the nation.
This paper leverages a short-term spike in electoral probabilities to studytemporary valuation differentials in equity prices. My preferred interpre-tation of the finding is that the temporary jolt to both electoral proba-bilities and firm values reflected fundamental changes in the expectationsof investors, and that this relationship sheds light on how a permanentchange in electoral probabilities (and, ultimately, the president’s electionitself) would lead to sustained changes in the valuation of politically ori-ented firms. The short-lived nature of the event can reasonably be viewed toreflect updated market expectations in light of other events that overtookObama’s electoral prospects, as well as new disclosures about the passingimpact of Bin Laden’s death on the presidential election. This interpretation,however, is speculative for a number of reasons. First, the temporary changein re-election probabilities and firm economic outlooks in this case may havereflected investor speculation rather than fundamental changes. Second, theeffect of a permanent change might be different than a temporary one, as
16 Jayachandran (2006) estimates, for example, that the shift in the Senate from Republican toDemocratic majority decreased the valuations of firms that had donated to Republicans by0.3%, and had a statistically insignificant impact on firms that had donated to Democrats.Using a comparable event window and regression specification, I find that the increased likeli-hood of the Democrats retaining the presidency decreased Republican-oriented firm returns by0.7%, and increased Democratic-oriented firm returns by 0.7%. When Jayachandran considersa shorter event window, her coefficients become statistically indistinguishable from zero; bycontrast, even with a one-day event window, the magnitudes of my effects are large and sig-nificant. Although these comparisons focus only on the Senate, there are few reasons to doubtthat the findings do not generalize to Congress.

464 Gaikwad
firms and parties adapt their behavior over time. Scholars are interestedin long-term relationships, yet measuring incremental valuation differen-tials over protracted time periods is fraught with methodological difficulties;the benefit of my approach is that short-term price reactions afford precisemeasurements. Although this methodology does not sort through questionsrelated to the causal interpretation of the findings, it nonetheless accuratelycaptures how exogenous jolts to electoral expectations trigger instantaneousvaluation differentials for politically oriented firms. That political outcomesmatter for market performance suggests that firms might face incentives toinfluence these outcomes via campaign contributions.
References
Ansolabehere, S., J. M. De Figueiredo, and J. M. Snyder Jr. 2003. “Why is There so LittleMoney in U.S. Politics?” Journal of Economic Perspectives 17(1): 105–130.
Ansolabehere, S., J. M. Snyder Jr., and M. Ueda. 2004. “Did Firms Profit From SoftMoney?” Election Law Journal 3(2): 193-198.
Bergen, P. L. 2012. Manhunt: The Ten-Year Search for Bin Laden–from 9/11 to Abbot-tabad. New York: Crown Publishers.
Claessens, S., E. Feijen, and L. Laeven. 2008. “Political Connections and PreferentialAccess to Finance: The Role of Campaign Contributions.” Journal of Financial Eco-nomics 88(3): 554–580.
Fisman, D., R. Fisman, J. Galef, R. Khurana, and Y. Wang. 2012. “Estimating the Valueof Connections to Vice-President Cheney.” The B.E. Journal of Economic Analysis &Policy 13(3), Article 5.
Hacker, J. S. and P. Pierson. 2012. “Presidents and the Political Economy: The CoalitionalFoundations of Presidential Power.” Presidential Studies Quarterly 42(1): 101–131.
Jayachandran, S. 2006. “The Jeffords Effect.” Journal of Law and Economics 49(2):397–425.
Knight, B. 2006. “Are Policy Platforms Capitalized into Equity Prices? Evidence from theBush/Gore 2000 Presidential Election.” Journal of Public Economics 90(4–5): 751–773.
Mattozzi, A. 2008. “Can we Insure Against Political Uncertainty? Evidence from the U.S.Stock Market.” Public Choice 137(1–2): 43-55.
Monroe, N. 2010. “The Policy Impact of Unified Government: Evidence from 2000-2002.”Public Choice 142(1–2): 111–124.
Shon, J. J. 2010. “Do Stock Returns Vary with Campaign Contributions? Bush vs. Gore:The Florida Recount.” Economics and Politics 22(3): 257–281.
Snowberg, E., J. Wolfers, and E. Zitzewitz. 2007. “Party Influence in Congress and theEconomy.” Quarterly Journal of Political Science 2(3): 277–286.
Snowberg, E., J. Wolfers, and E. Zitzewitz. 2011. “How Prediction Markets Can SaveEvent Studies.” NBER Working Paper 16949.
Werner, T. 2011. “The Sound, the Fury, and the Nonevent: Business Power and MarketReactions to the Citizens United Decision.” American Politics Research 39(1): 118–141.


![Issue Report [Monthly Prospects] Political Climate and Prospects … · Issue Report Issue 60 (September 30, 2019) Project ‖ Social Index [Monthly Prospects] Political Climate and](https://img.pdfslide.net/doc/110x75/5f7e67acb8f5af23f250134a/issue-report-monthly-prospects-political-climate-and-prospects-issue-report-issue.jpg)