Embed Size (px)
Citation preview

FINAL REPORT DEVELOPMENT OF A BAGASSE PELLETING MACHINE
USING A ROLLING PRINCIPLE
PART B
UNIVERSITY OF QUEENSLAND COMPONENT
Ke1vin Grove A23187573B Final report : development of a bagasse pelleting machine using a rolling principle
002331
1985
QUT Library

A23187573B

PROJECT TITLE: DEVELOPMENT OF A BAGASSE PELLETING
MACHINE USING A ROLLING PRINCIPLE,
82/2435.
DATE OF ISSUE: 1982
AUTHORS: PART A. SUGAR RESEARCH INSTITUTE
R. CULLEN
V. MASON
PART B. UNIVERSITY OF QUEENSLAND
R. CULLEN
R. STALKER
P. KILLEN
NAMES OF ORGANISATIONS: SUGAR RESEARCH INSTITUTE
AND
DEPARTMENT OF MECHANICAL ENGINEERING,
UNIVERSITY OF QUEENSLAND.
TOTAL EXPENDITURE
UNDER GRANT: $93 960

DEVELOPMENT OF A BAGASSE PELLETING MACHINE USING A ROLLING PRINCIPLE
CONTENTS
SUMMARY
PART B: UNIVERSITY OF QUEENSLAND COMPONENT
CHAPTER 1. INTRODUCTION
CHAPTER 2. RESULTS OF TESTS AT CSIRO DIVISION OF
TEXTILE INDUSTRY
2.1 INTRODUCTION
2.2 OPERATION OF PRESS
2.3 TEST RESULTS
CHAPTER 3. TESTS WITH CRUCIFORM ROLLING MACHINE
3.1 INTRODUCTION
3.2 SINGLE FACTOR EFFECTS
3.3 OTHER INTERACTIONS - DENSITY
3.3.1 Interactions Involving Compression
3.3.2 Interactions Involving Temperature
3.3.3 Interactions Involving Moisture 3.4 OTHER INTERACTIONS - DURABILITY
3.5 CONCLUSIONS
CHAPTER 4. PROPERTIES OF SINGLE FIBRES
4.1 INTRODUCTION
4.2 YIELD STRESS AND YOUNG'S MODULUS
4.3 DENSITY OF FIBRES
4.4 INFLUENCE OF FIBRE PROPERTIES ON
PACKING THEORIES
4.5 CONCLUSIONS
PAGE

(ii)
CHAPTER 5. PRESSURE RELAXATION EFFECTS
5.1 INTRODUCTION
5.2 PREPARATION
5.3 PROCEDURE
5.4 RESULTS OF TESTS AT 10 PER CENT
MOISTURE - LINEAR COMPACTION
5.4.1 Peak Pressure
5.4.2 Ratio of Pressure at 2 min to
Peak Pressure
5.5 RESULTS OF TESTS AT 10 PER CENT
MOISTURE - SINUSOIDAL COMPACTION 5.5.1 Peak Pressure
5.5.2 Ratio of Pressure at 2 min to
p max 5.6 CONCLUSIONS
PAGE
39
39
43
43
45
45
48
58
58
61
CHAPTER 6. ENERGY OF COMPACTION 63 6.1 INTRODUCTION 63 6.2 SCOPE OF TESTS 63
6.3 RESULTS 64
6.3.1 Influence of Variables on Tests
at 20°C - 1st Compaction 64
6.3.2 Influence of Variables on Tests
at 20°C - 10th Compaction 73
6.3.3 Effect of Temperature on
Energy of Compaction 73
6.4 CONCLUSIONS 77
CHAPTER 7. A THEORY OF BAGASSE COMPACTION
7.1 BAGASSE FILAMENTS - STRESS-STRAIN
RELATIONSHIP
7.2 A BAGASSE COMPACTION MODEL
79
82
CHAPTER 8. FRICTION TESTS
8.1 AIM
8.2 APPARATUS
8.3 METHOD
95
95
95
96
79

(iii)
PAGE
8.4 RESULTS 99
8.4.1 Results for Coefficient of
Static Friction at 20°C 99
8.4.2 Results of Coefficient of Static
Friction Tests with Different
Material Size - 20°C 104
8.4.3 Results of Dynamic Coefficient
of Friction - 20°C 107
8.4.4 Results of Coefficient of
Dynamic Friction Tests with
Different Material Size - 20°C 107
8.4.5 Influence of Temperature 111
8.5 CONCLUSIONS 114
REFERENCES 115
APPENDIX A. RAPID BENDING OF BAGASSE FIBRE BUNDLES 117
APPENDIX B. PROBABILITY OF A MACROSTATE 121


DEVELOPMENT OF A BAGASSE PELLETING MACHINE USING A ROLLING PRINCIPLE
82/2435
SUMMARY
The project report consists of two parts. The University of Queensland component describes the results of tests to establish information on basic properties of bagasse that are of significance in the design of a rolling pelleting machine. These properties include the dynamic compression and relaxation characteristics under normal and sinusoidal (as developed in a rolling pelleter) compression, the frictional properties, and the energy required to compact the bagasse. The properties were measured over a range of variables such as temperature, moisture content and particle size.
The properties of single fibres were investigated and a theory has been proposed to explain the compaction process.
The Sugar Research Institute component of the report
describes the development of the rolling pelleting machine. The
pilot plant machine was able to produce pellets of up to the
design density of 500 kg/m3 at a rate of up to 500 kg/h. This
throughput was below that originally predicted due to feeding
problems with the light low moisture material. Difficulties were
experienced with scraper action of the roll scrapers.
The pilot plant and trials established the feasibility of
the rolling principle for pellet production. Further development
is required before a 'production' unit can be produced.


3.
PART B: UNIVERSITY OF QUEENSLAND COMPONENT
CHAPTER 1
INTRODUCTION
The objectives of the project have been outlined in Part A
- the Sugar Research Institute component of the work. The
investigations at the Department of Mechanical Engineering,
carried out under the present grant, considered further the
influence of precompression by rolling, retention, particle size,
temperature and moisture on the properties of the pellets
produced. This work was initiated under the Project Grant
"Elimination of the Use of Fuel Oil for Steam Generation in the
Sugar Industry".
The opportunity was taken to use the facilities at the
CSIRO Division of Textile Industry, Geelong, to study three
dimensional compression characteristics of bagasse over a range
of compression and retention times. This work confirmed that
reasonable pellets could be obtained at the lower levels of press
times achieved.
Work undertaken under the previous NERDDC grant showed
that retention, i.e. holding a load on the bagasse sample after
compression, was a significant way in which pellet properties
could be improved. In an attempt to obtain an understanding of
retention it was decided to investigate the relaxation
characteristic of bagasse under conditions of both linear
compression and sinusoidal compression which simulted the
compression experienced in a rolling machine. The relaxation
characteristics were studied over a wide range of operating
conditions which included moisture content, temperature, level of
compaction, speed of compaction, and particle size. The extent
of relaxation can have a significant influence on the design of a
pelleting machine, particularly in relation to discharge
conditions.

4.
In any pelleting machine the energy of compaction of the
material is an important design parameter. Tests were carried
out over a range of temperatures, speeds of compaction, bagasse
moistures, bagasse fineness and levels of compaction to
investigate their influence on the compaction energy.
In any practical pelleting machine friction plays a very
important role. Both the rolling die and reciprocating type of
pelleting machines rely on friction to supply the back pressure
necessary to achieve compaction. As outlined in Part A of the
report friction plays an important role in the two roll pelleter
since friction on the rolls provide the driving force to push the
material through the machine and also contributes to the back
pressure supplied by the chutes. A series of tests was therefore
carried out to investigate the coefficient of friction over a
range of bagasse moisture, particle size, temperatures and
pressures for a range of surface conditions.
An investigation of the literature on pelleting and
compaction established that no theory exists for pelleting of
agricultural waste materials such as bagasse. An effective
theory for pelleting is necessary if a full understanding of the
process is to be obtained. An attempt was made to develop a
theory of compaction and the results are outlined in this report.
The theory explains the pelleting process but does not cover the
influence of retention.

5.
CHAPTER 2 RESULTS OF TESTS AT CSIRO DIVISION OF TEXTILE INDUSTRY
2·1 INTRODUCTION
The CSIRO Division of Textile Industry has for many years
now conducted tests on compaction of wool. As an essential part
of this programme they have developed several presses to compact
the wool under an approximation to triaxial conditions. The
largest of the presses is shown schematically in Figure 2.1 This
unit produces compressed blocks with typical dimensions 200 x 150
x 40 mm. Typical pellets are shown in Figure 2.2.
2·2 OPERATION OF PRESS
The sample to be compressed - typically 1.5 kg - is loaded
into a metal box where it can be heated in a closed atmosphere by
hot air. This ensures that the initial moisture content is
retained. The heated material is then dropped into a hopper with
a moveable side which allows the sample to be presented to a ram
to apply an initial precompression. This extent of compression
is dictated by the initial charge mass since the ram compresses
to a constant height. After this initial compression the second
ram applies a preset pressure to the sample. After a controlled
hold time at this pressure the wad is ejected into a 'cold frame'
where it can be held at fixed dimensions for a predetermined
time.
2·3 TEST RESULTS
The objective of the tests was to investigate the
influence of pressing time and retention time (time held in a
'cold box' of constant dimensions) on the resulting properties of
the pellets.
The results of the test series for a range of press times
from 0.5 to 5 minutes and retention times from 1 to 320 minutes
are shown in Figures 2.3 and 2.4. The lower limits of press time

FIGURE 2.1 SCHEMATIC ARRANGEMENT OF PRESSING SYSTEM -
CSIRO DIVISION OF TEXTILE INDUSTRY
6.

FIGURE 2.2 SAMPLE OF PELLET PRODUCED
7.

Condi t ions : Temperature 80° C; Moisture 8%; Material whole.
FIGURE 2·3 RELATIONSHIP BETWEEN DENSITY AT REMOVAL AND
RETENTION TIME FOR A RANGE OF PRESS TIMES
Conditions: Temperature 80° C; Moisture 8%; Material whole.
FIGURE 2·4 RELATIONSHIP BETWEEN DENSITY AFTER 12 HOURS AND
RETENTION TIME FOR A RANGE OF PRESS TIMES
8.

9.
and retention time were dictated by the physical constraints of
the machine.
The results illustrate that whilst increases in press time
and retention increased the density of the pellet at removal, the
densities after 12 hours were not adversely affected by reduction
in press time at retention times down to the lower limit achiev-
able in the test rig (1 minute). These results gave some confid-
ence that the pressure and retention times planned for the
rolling apparatus would produce acceptable pellet densities.
11.
CHAPTER 3 TESTS WITH CRUCIFORM ROLLING MACHINE
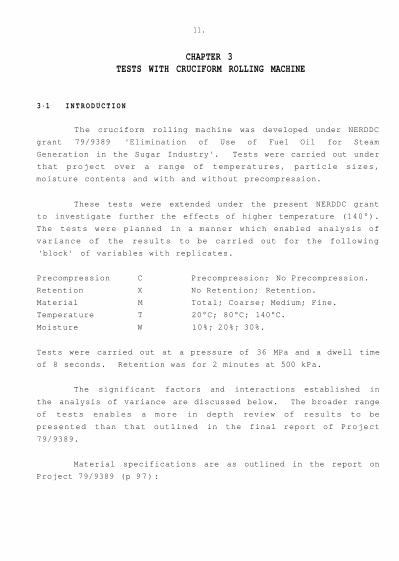
3·1 I N T R O D U C T I O N
The cruciform rolling machine was developed under NERDDC
grant 79/9389 'Elimination of Use of Fuel Oil for Steam
Generation in the Sugar Industry'. Tests were carried out under
that project over a range of temperatures, particle sizes,
moisture contents and with and without precompression.
These tests were extended under the present NERDDC grant
to investigate further the effects of higher temperature (140°).
The tests were planned in a manner which enabled analysis of
variance of the results to be carried out for the following
'block' of variables with replicates.
Precompression C Precompression; No Precompression.
Retention X No Retention; Retention.
Material M Total; Coarse; Medium; Fine.
Temperature T 20°C; 80°C; 140°C.
Moisture W 10%; 20%; 30%.
Tests were carried out at a pressure of 36 MPa and a dwell time
of 8 seconds. Retention was for 2 minutes at 500 kPa.
The significant factors and interactions established in
the analysis of variance are discussed below. The broader range
of tests enables a more in depth review of results to be
presented than that outlined in the final report of Project
79/9389.
Material specifications are as outlined in the report on
Project 79/9389 (p 97):

12.
"The fibre fractions were sieved from whole bagasse. About 30
shakes of the 250 mm diameter sieves of 2.8 mm and 0.6 mm
aperture sizes gave three fibre definitions: coarse
(< 2.8 m m ) , medium (< 2.8 mm, > 0.6 mm) and fine (< 0.6 mm).
An additional fibre fraction consisted of the original whole
bagasse. The fine fraction contained mostly small flaky pith
particles with occasional tiny broken fibres. The medium
fraction contained mostly thin fibres or vascular bundles
with average length of about 10 mm. The coarse fraction
necessarily contained the thick rind particles and long fibre
bundles."
Full test results are shown in Tables 3.1 and 3.2. The
results of the analysis of variance on the data are outlined in
Tables 3.3 and 3.4.
3·2 SINGLE FACTOR EFFECTS
All variables, with the exception of precompression, had a
significant effect on the density of the pellet at 24 hours. All
variables had a significant effect on durability. The effect of
the single variables, averaged over all other variables, is
summarised below.
. PRECOMPRESSION
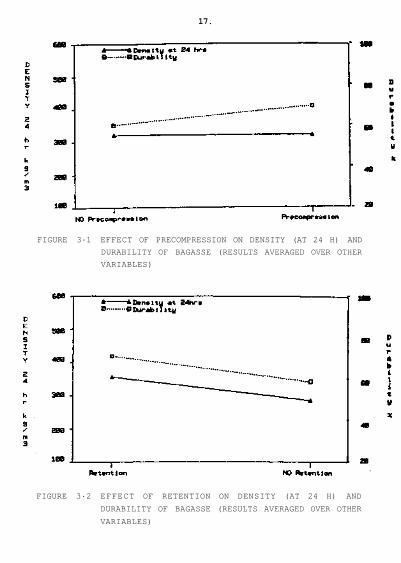
Figure 3.1 illustrates the fact that precompression had no
significant effect on density at 24 hours but increased
durability.
. RETENTION
Figure 3.2 illustrates the beneficial effect of retention to
improve both density and durability.
. TEMPERATURE
Figure 3.3 shows that there is very little difference between
densities obtained at 20° and 80°C but that densities at 140°C
are inferior to those at 20° and 80°C. The durabilities show
a similar trend.

13.

14.

TABLE 3 . 3 ANALYSIS OF VARIANCE RESULTS FOR DENSITY AT 24 H
Source
Total
C
X
M
T
W
CX
CM
CT
CW
XM
XT
XW
MT
MW
TW
CXM
CXT
cxw CMT
CMW
CTW
XMT
XMW
XTW
MTW
CXMT
CXMW
CXTW
CMTW
XMTW
CXMTW
ERROR
' Degrees of Freedom
287
1
1
3
2
2
1
3
2
2
3
2
2
6
6
4
3
2
2
6
6
4
6
6
4
12
6
6
4
12
12
12
144
Variance Ratio
.084
485.332
363.410
79.904
4933.458
2.724
21.322
3.117
5.113
4.813
42.466
109.208
68.440
37.354
131.836
2.060
1.917
.438
10.819
8.665
2.725
4.171
2.306
19.735
10.885
4.231
3.118
.560
10.868
1.240
2.821
Significance Level
Less than .001
Less than .001
Less than .001
Less than .001
.100 - .250
Less than .001
.010 - .050
.001 - .010
.001 - .010
Less than .001
Less than .001
Less than .001
Less than .001
Less than .001
.100 - .250
.100 - .250
Less than .001
Less than .001
.010 - .050
Less than .001
.010 - .350
Less than .001
Less than .001
Less than .001
.001 - .010
Less than .001
Greater than .250
.001 - .010
15.

1 6 .
TABLE 3 . 4 ANALYSIS OF VARIANCE RESULTS FOR DURABILITY
Source
Total
C
X
M
T
W
CX
CM
CT
CW
XM
XT
Xw
MT
MW
TW
CXM
CXT
CXW
CMT
CMW
CTW
XMT
XMW
XTW
MTW
CXMT
CXMW
CXTW
CMTW
XMTW
CXMTW
ERROR
Degrees of Freedom
287
1
1
3
2
2
1
3
2
2
3
2
2
6
6
4
3
2
2
6
6
4
6
6
4
12
6
6
4
12
12
12
144
Variance Ratio
56.515
93.166
157.395
26.062
769.978
6.084
18.934
.277
4.365
5.425
5.424
14.156
14.607
34.468
18.953
.964
.923
2.394
1.213
6.635
3.643
2.197
3.521
3.438
14.822
.324
.792
.911
1.428
2.412
.167
Significance Level
Less than .001
Less than .001
Less than .001
Less than .001
Less than .001
.010 - .050
Less than .001
.010 - .050
.001 - .010
.001 - .010
Less than .001
Less than .001
Less than .001
Less than .001
.050 - .100
Greater than .250
Less than .001
.001 - .010
.010 - .050
.001 - .010
.010 - .050
Less than .001
.100 - .250
.001 - .010
17.
FIGURE 3·1 EFFECT OF PRECOMPRESSION ON DENSITY (AT 24 H) AND
DURABILITY OF BAGASSE (RESULTS AVERAGED OVER OTHER
VARIABLES)
FIGURE 3·2 EFFECT OF RETENTION ON DENSITY (AT 24 H) AND
DURABILITY OF BAGASSE (RESULTS AVERAGED OVER OTHER
VARIABLES)

FIGURE 3.3 EFFECT OF TEMPERATURE ON DENSITY (AT 24 H) AND
DURABILITY OF BAGASSE (RESULTS AVERAGED OVER OTHER
VARIABLES)
18.

1 9 .
. MOISTURE CONTENT
F i g u r e 3 . 4 s h o w s how d e n s i t i e s a n d d u r a b i l i t i e s f a l l a s
m o i s t u r e i s i n c r e a s e d i n t h e r a n g e 1 0 t o 3 0 p e r c e n t .
. PARTICLE SIZE
F i g u r e 3 . 5 i l l u s t r a t e s t h a t t h e t o t a l m a t e r i a l a n d f i n e
m a t e r i a l h a v e s i m i l a r p e l l e t i n g c h a r a c t e r i s t i c s a n d g i v e
b e t t e r d e n s i t i e s a n d d u r a b i l i t i e s t h a n t h e c o a r s e o r medium
f r a c t i o n .
3·3 OTHER INTERACTIONS - DENSITY
In the following discussions only interactions that are of
some practical significance will be discussed. They will be
discussed in order of presentation in Table 3.3, i.e. any inter
action between precompression and retention would be discussed
under precompression.
3.3.1 INTERACTIONS INVOLVING PRECOMPRESSION
CM and CMW Interactions
Figure 3.6 illustrates the particle size, precompression
interaction. This shows that there is a tendency for better
performance with fine material when there is no precompression.
Tests were carried out to determine the movement characteristics
down the chute for the 2 : 1 compression system. These results,
shown in Figure 3.7, show that whilst slippage occurs with
'whole', 'medium' and 'coarse', material could not be controlled
for 'fine' material. Because of this lack of control with the
fine material interactions which are explained by this phenom-
enon, e.g. CMT, will not be discussed further.
3.3.2 INTERACTIONS INVOLVING TEMPERATURE
Figure 3.8 i l l u s t r a t e s the MT i n t e r a c t i o n which shows t h a t
p e l l e t i n g d e n s i t i e s a r e b e t t e r f o r whole and worse f o r f i n e
m a t e r i a l than those o b t a i n e d at 20° and 80° C.

FIGURE 3·4 EFFECT OF MOISTURE CONTENT ON DENSITY (AT 24 H)
AND DURABILITY OF BAGASSE (RESULTS AVERAGED OVER
OTHER VARIABLES)
FIGURE 3·5 EFFECT OF MATERIAL SIZE ON DENSITY (AT 24 H) AND
DURABILITY OF BAGASSE (RESULTS AVERAGED OVER OTHER
VARIABLES)
20.

FIGURE 3·7 INFLUENCE OF PARTICLE SIZE AND MOISTURE CONTENT ON
RATIO OF ACTUAL CHUTE SPEED TO THEORETICAL CHUTE
SPEED
21.
FIGURE 3·6 ILLUSTRATION OF PARTICLE SIZE-PRECOMPRESSION
INTERACTION

22.
FIGURE 3·8 ILLUSTRATION OF PARTICLE SIZE AND TEMPERATURE
INTERACTION

23.
Figure 3.9 illustrates the XT interaction which shows that
the effect of retention is enhanced at 80° compared with 20°C and
140°C.
The TW interaction is illustrated in Figure 3.10 and the
XTW interaction is illustrated in Figure 3.11. The XTW interact-
ion illustrates the fact that at 80°C the densities at 10 per
cent moisture are better than those at 20° or 140°C whilst at 20
per cent moisture and 30 per cent moisture better results are
obtained at 20°C. Best overall performance is at 80°C with
retention. The relatively poor result for 140°C at 10 per cent
moisture is surprising.
The most interesting aspect of this interaction is that
the best compactions are obtained at 80° C and 10 per cent
moisture. It is to be noted that the fall off in compaction with
increase in moisture is more pronounced at higher temperatures.
3.3.3 INTERACTIONS INVOLVING MOISTURE
The XW interaction illustrated in Figure 3.12 illustrates
the fact that the effect of precompression in increasing pellet
density is more pronounced at lower moistures.
Figure 3.13 illustrates that response by 10 per cent and
20 per cent material is consistent one with the other for the
different particle sizes but at 30 per cent moisture the improve-
ment in density for the medium and fine, compared with the
coarse, does not occur.
3.4 OTHER INTERACTIONS - DURABILITY
It can be seen from Table 3.2 that the durabilities at 30
per cent moisture are all very low and from a practical point of
view would be unacceptable. Consideration has therefore been
given to the results at 10 and 20 per cent moisture which produce
acceptable pellets. The supplementary analysis of variance
carried out on the results at 10 and 20 per cent is shown in
Table 3.5.

FIGURE 3.9 ILLUSTRATION OF TEMPERATURE-RETENTION INTERACTION
FIGURE 3.10 ILLUSTRATION OF MOISTURE-TEMPERATURE INTERACTION
24 .

FIGURE 3.11 ILLUSTRATION OF MOISTURE-TEMPERATURE-RETENTION
INTERACTION
FIGURE 3.12 ILLUSTRATION OF MOISTURE-PRECOMPRESSION
INTERACTION
25.

FIGURE 3.13 ILLUSTRATION OF PARTICLE SIZE-MOISTURE
INTERACTION
26.

27.
TABLE 3.5 RESULTS OF ANALYSIS OF VARIANCE - DURABILITY 10 AND
15 PER CENT
Source
TOTAL
T
W
C
X
M
TW
TC
TX
TM
WC
WX
WM
CX
CM
XM
TWC
TWX
TWM
TCX
TCM
TXM
WCX
WCM
WXM
CXM
TWCX
TWCM
TWXM
TCXM
WCXM
TWCXM
ERROR
Degrees of Freedom
191
2
1
1
1
3
2
2
2
6
1
1
3
1
3
3
2
2
6
2
6
6
1
3
3
3
2
6
6
6
3
6
96
Variance Ratio
15.404
373.329
149.585
273.499
204.529
36.551
4.538
2.775
24.001
15.118
51.040
85.224
27.318
75.503
14.641
10.287
12.128
6.710
0.111
1.215
2.329
3.953
8.231
13.214
5.553
2.536
4.561
4.025
0.548
0.720
0.680
Significance Level
Less than .001
Less than .001
Less than .001
Less than .001
Less than .001
Less than .001
.010 - .050 |
.050 - .100
Less than .001
Less than .001
Less than .001
Less than .001
Less than .001
Less than .001
Less than .001
Less than .001
Less than .001
Less than .001
Greater than .250
.010 - .050
.010 - .050
Less than .001
Less than .001
.001 - .010
.050 - .100
Less than .001
.001 - .010

The CX interaction is outlined in Figure 3.14. This
illustrates that precompression was relatively more beneficial
when no retention was used.
The CM, MW and MT interactions are illustrated in Figures
3.15 to 3.17. These interactions are due to the relatively
poorer performance of the coarse fraction at no precompression,
higher moisture and lower temperature.
3.5 CONCLUSIONS
The tests carried out have extended the knowledge of
bagasse compactions and durabilities from those previously
reported in report 79/9389. The higher temperatures of 140° did
not produce better performance than at 80°C.
The tests established that the best condition within the
range tested for design of a pelleting machine would be:
Moisture of Bagasse 10 per cent
Temperature of Bagasse 80° C
Bagasse Whole
Retention 500 kPa for 2 minutes
Precompression Not necessary
28.

FIGURE 3.15 ILLUSTRATION OF PARTICLE SIZE-PRECOMPRESSION
INTERACTION
29.
FIGURE 3.14 ILLUSTRATION OF RETENTION-PRECOMPRESSION
INTERACTION

FIGURE 3.16 ILLUSTRATION OF PARTICLE SIZE-MOISTURE
INTERACTION
FIGURE 3.17 ILLUSTRATION OF PARTICLE SIZE-TEMPERATURE
INTERACTION

31.
CHAPTER 4 PROPERTIES OF SINGLE FIBRES
4.1 INTRODUCTION
The compaction characteristics of a mass of bagasse depend
on the properties of the individual components that make up a
sample. Very little work has been carried out to establish the
basic properties of bagasse fibres so some preliminary experi
ments were carried out to evaluate these properties in an attempt
to understand better the compression process for bagasse.
4.2 Y IELD STRESS AND YOUNG'S MODULUS
A small rig was constructed which consisted of a beam
arrangement where an individual fibre could be loaded at its mid
point and deflections measured by means of a projection micro
scope. The basic gauge length used was 19 mm and fibres (or more
precisely fibro vascular bundles) were selected at random. These
ranged from typically .38 mm diameter up to larger beams of 1.7 x
1.45 mm and approximately oval in cross section.
The stress/strain relationships were established for the
individual fibres and Figure 4.1 shows the relationship between
applied bending stress and measured deflection of the beam. This
test shows that initial yield occurs at stresses of approximately
54 MPa and with repeated loading significantly higher yield
stresses were obtained. Figure 4.1 also illustrates signific
antly the hysteresis effect experienced with the bagasse fibres.
The initial tests established that the stress/strain relationship
was time dependent and tests were carried out to quantify the
magnitude of the influence of time.
Figure 4.2 shows the relationships for bending stress and
deflection of a beam when each load is applied for a 2 minute
period. From this figure it can be seen how significant the hold
time is. The results of tests on a range of fibres is

FIGURE 4.1 RELATIONSHIP BETWEEN DEFLECTION OF BEAM AND
BENDING STRESS FOR SINGLE FIBRE
( 1 ) 1ST APPLICATION OF LOAD ( 2 ) 2ND APPLICATION OF LOAD
FIGURE 4.2 RELATIONSHIP BETWEEN DEFLECTION OF BEAM AND
BENDING STRESS FOR INDIVIDUAL F I B R E . HOLD TIME
BETWEEN SUCCESSIVE INCREASES IN BENDING MOMENT
2 MIN.

33.
illustrated in Table 4.1. Yield stresses are seen to vary
significantly for the fibres in the general diameter range .38 to
.46 mm from 54 to 120 MPa. These yield stresses were recorded on
the first loading.
Values of Young's modulus are seen to be reasonably
consistent for the fibres in the range .38 to .43 mm diameter
when the tests were conducted with a gauge length of 19 mm.
However for the slightly larger diameter fibres with tests
conducted on the 10.2 mm gauge length the values of Young's
modulus that were established tended to be lower. The reasons
for this have not been fully investigated.
It can also be seen from Table 4.1 that the larger fibro
vascular pellets tested gave significantly lower value of yield
stress and Young's modulus.
4.3 DENSITY OF FIBRES
Tests were carried out to determine the density of
individual fibres and the results are shown in Table 4.1.
Densities for the smaller fibres ranged from 711 to 719 kg/m3
whilst the densities of the larger fibro vascular bundles ranges
from 296 to 449 kg/m3 . The relationship between Young's modulus
and density was investigated and the results are shown in Figure
4.3. For the tests at 19 mm beam length there appears to be a
reasonable linear relationship.
4.4 INFLUENCE OF FIBRE PROPERTIES ON PACKING THEORIES
The Van Wyk model was developed to investigate the packing
characteristics of wool and preliminary tests by Loughran
established that it could give an approximation to the compaction
relationship for bagasse. The Van Wyk relationship as described
by Loughran is:

TABLE 4.1 RESULTS OF TESTS ON SINGLE FIBRES
Fibre NO.
1
2
3
4
6
8
9
Fibre Diameter
(mm)
.41
.38
.43
.46
1.7 x 1.45
1.45 x 1.17
.53
Gauge Length (mm)
19
19
19
10.2
19.3
19.3
10.2
Yield Stress (MPa)
54
120
105
90
28
25
105
Ultimate Stress (MPa)
110
105
Youngs Modulus-
MPa x 103
7.86
8.13
7.02
5.08
1.24
1.00
3.44
Density
(kg/m3)
730
870
711
879
449
296
-

FIGURE 4.3 RELATIONSHIP BETWEEN DENSITY OF FIBRES AND
YOUNG'S MODULUS

36.
p = Pressure (MPa)
k = Constant
E = Young's Modulus (MPa)
m = Mass charge (kg)
f = fibre density (kg/m3 )
v = Volume (m-3 )
vO = Initial volume at pO (m-3)
The values of Young's Modulus and fibre density obtained in the
tests outlined in Table 4.1 have been used to develop the
pressure density relationship for bagasse fibres. This
relationship is shown in Figure 4.4, The figure also shows the
density versus pressure regression relationship for whole bagasse
at 10 per cent moisture developed in the experimental work.
Whilst it can be seen that the forms of the equations are
similar there is an obvious need for much more work under
controlled conditions of temperature and moisture.
4.5 CONCLUSIONS
The work described in this section has been purely of a
preliminary nature and has established the importance of time
dependence on the stress/strain relationships for bagasse fibres.
It has also highlighted the need for a more thorough investigat
ion under controlled conditions before the Van Wyk theory can be
tested rigorously for applicability to the bagasse compaction
model.

FIGURE 4.4 RELATIONSHIP BETWEEN DENSITY AND PRESSURE

39.
CHAPTER 5 PRESSURE RELAXATION EFFECTS
5.1 INTRODUCTION
The basic aim of these experiments was to obtain an
understanding of the retention mechanism by monitoring the load
on and compaction of a sample of bagasse, both during compression
and for a period afterwards, whilst the pellet's density was held
constant.
The experiments were conducted using the INSTRON materials
testing machine on which it is possible to control accurately the
load or strain on, or displacement of a sample.
A summary of the specifications and the desirable operat
ing ranges for these experiments appear in Tables 5.1 and 5.2.
The apparatus used is shown in Figures 5.1 and 5.2.
The Instron was operated with position control for all the
experiments. This control may be achieved either by using the
Instron's own function generating circuits or by supplying a
suitable signal from an external source. The internal ramp
function was used for the constant velocity compression experi
ments. However, in order to achieve stability at the very low
frequencies necessary for these tests, a Hewlett-Packard variable
phase function generator with < 0.06 per cent distortion of the
sinusoid was used.
The variables which were investigated are presented in
Table 5.3.
The sinusoidal loading experiments were intended to
simulate the compression speed experienced by a sample passing
through a pair of rollers and then being held at the maximum
compaction achieved at the nip.

40.
TABLE 5.1 SUMMARY OF SPECIFICATION OF INSTRON
Load Rating, ± 250 kN dynamic
Speed Range, 30 mm sec-1
Stroke 100 mm max
Load Ranges, High ± 250 kN full scale
Low ± 25 kN full scale
TABLE 5.2 DESIRABLE OPERATING RANGES
Nominal Height (mm)
Nominal Charge compaction in
cylinders before compression
(kg/m3)
Maximum compaction for the
range (kg/m3 )
Height of pellet (mm)
Dry mass of fibre (g)
Estimated maximum load
High Range
80
200
1100
14.5
73
185
Low Range
80
60
300
16
22
3.75
TABLE 5.3 VARIABLES INVESTIGATED
Fibre fraction
Temperature OC
Moisture content wet basis (MCWB) %
Pellet density at compaction
Type of loading
Speed* of compaction mms-1
*The corresponding frequencies for the sinusoidal compactions are: (Hz)
coarse
20
10
300
fine
80
20
800
whole
140
30
1100
constant speed, sinusoidal*
1.8
0.0025
15
0.021
45
0.062
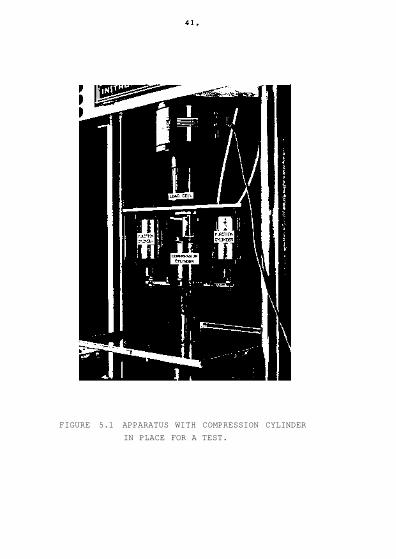
FIGURE 5.1 APPARATUS WITH COMPRESSION CYLINDER
IN PLACE FOR A TEST.

FIGURE 5.2 PELLET AFTER EJECTION OF COMPRESSION CYLINDER
43.
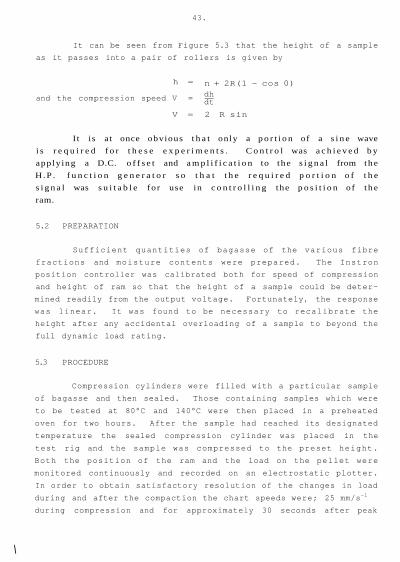
It can be seen from Figure 5.3 that the height of a sample
as it passes into a pair of rollers is given by
h =
and the compression speed V =
V =
I t is at once obvious t h a t only a p o r t i o n of a s i n e wave
i s r e q u i r e d f o r t h e s e e x p e r i m e n t s . C o n t r o l was a c h i e v e d b y
app ly ing a D.C. o f f s e t and a m p l i f i c a t i o n to t he s i g n a l from t h e
H . P . f u n c t i o n g e n e r a t o r s o t h a t t h e r e q u i r e d p o r t i o n o f t h e
s i g n a l was s u i t a b l e fo r use in c o n t r o l l i n g the p o s i t i o n of t h e
ram.
5.2 PREPARATION
Sufficient quantities of bagasse of the various fibre
fractions and moisture contents were prepared. The Instron
position controller was calibrated both for speed of compression
and height of ram so that the height of a sample could be deter
mined readily from the output voltage. Fortunately, the response
was linear. It was found to be necessary to recalibrate the
height after any accidental overloading of a sample to beyond the
full dynamic load rating.
5.3 PROCEDURE
Compression cylinders were filled with a particular sample
of bagasse and then sealed. Those containing samples which were
to be tested at 80°C and 140°C were then placed in a preheated
oven for two hours. After the sample had reached its designated
temperature the sealed compression cylinder was placed in the
test rig and the sample was compressed to the preset height.
Both the position of the ram and the load on the pellet were
monitored continuously and recorded on an electrostatic plotter.
In order to obtain satisfactory resolution of the changes in load
during and after the compaction the chart speeds were; 25 mm/s-1
during compression and for approximately 30 seconds after peak
n + 2R(1 - cos 0) dh dt
2 R sin
\

FIGURE 4.3 HEIGHT OF A SAMPLE PASSING THROUGH A PAIR OF ROLLERS

45.
loading, 5 mm/s-1 for the next 30 seconds and thereafter inter
mittently at 30 second intervals for the remainder of the test.
After each test, the pellet was unloaded, the compression
cylinder removed and the pellet's weight (80° and 140°C tests
only), height and diameter were recorded. Further measurements
of height and diameter were made at 24 hours. At 80°C and 140°C,
the difference between the total mass of material placed in the
cylinder and that of the pellet is largely a measure of the
moisture loss during compression.
Some typical charts are shown in Figures 5.4 and 5.5.
These illustrate the effect that the type and speed of loading
has on the sample.
The following information was obtained from each chart:
Peak pressure (P )
Pressure after 2 minutes (P2min)
Rate of application of load (Lu)
Rate of relaxation of load (Ld)
The ratios P_ . /P and Lu/Ld were also calculated. 2 m m max
5-4 RESULTS OF TESTS AT 10 PER CENT MOISTURE - LINEAR COMPACTION
A series of tests was carried out with bagasse at 10 per
cent moisture to investigate the effect of the following
variables on the dynamic compression characteristics of bagasse.
Temperature of compression T 20°C; 80°C; 140°C.
Material F Fine; Coarse; Whole.
Compaction C 300 kg/m3; 800 kg/m3; 1 100 kg/m3.
Speed of compaction s 45 mm/s; 15 mm/s; 1.8 mm/s.
5.4.1 PEAK PRESSURE
The values obtained for the peak pressure are outlined in
Table 5.4. The results of an analysis of variance on the results

4 6 .
FIGURE 5-4 EFFECT OF HOLD TIME ON PRESSURE OF A PELLET AT
CONSTANT HEIGHT - CONSTANT VELOCITY COMPACTION
FIGURE 5.5 EFFECT OF HOLD T IME ON PRESSURE OF A PELLET AT
CONSTANT HEIGHT - SINUSOIDAL COMPACTION

TABLE 5.4 PEAK PRESSURES OBTAINED (MPa) - 10% MOISTURE LINEAR COMPRESSION
Temp.
20°C
80°C
140°C
Comp.
1 100
800
300
1 100
800
300
1 100
800
300
44 mm/s
C o a r s e
4 7 . 5
1 5 . 7 2
0 . 9 8
4 1 . 2 5
1 2 . 2
. 577
2 9 . 9 0
7 . 1 3
. 5 5 9
F i n e
3 0 . 2
8 .80
0 . 6 3
2 6 . 6
6 . 2 3
. 5 1 1
1 8 . 3 1
3 .07
.467
Whole
4 5 . 8
1 4 . 1
.800
2 9 . 6
8 .77
. 4 3 9
2 0 . 8
3 .90
. 4 2 5
15mm/s
C o a r s e
4 5 . 5
1 4 . 8
0 .97
4 2 . 7 6
1 2 . 7
. 555
3 4 . 3
6 . 9 1
. 6 0 3
F i n e
2 8 . 6
9 . 1
0 .64
2 1 . 9 3
5 . 5 5
. 456
1 5 . 7 9
3 . 8 3
. 482
Whole
4 2 . 5
1 3 . 3
.785
3 2 . 1
7 . 6 8
. 4 5 8
1 6 . 2
5 .66
.387
1.8 mm/s
C o a r s e
3 6 . 7
1 2 . 8 3
0 . 9 3
3 4 . 8 2
1 0 . 3 4
. 4 6 1
2 7 . 9 6
6 . 2 1
.526
F i n e
2 2 . 7
8 .22
0 .57
2 1 . 1
5 .59
. 423
1 6 . 1 1
3 .84
.406
Whole
3 5 . 1
1 2 . 0
.674
24 .84
7 .02
.400
1 9 . 5
5.26
.362

48.
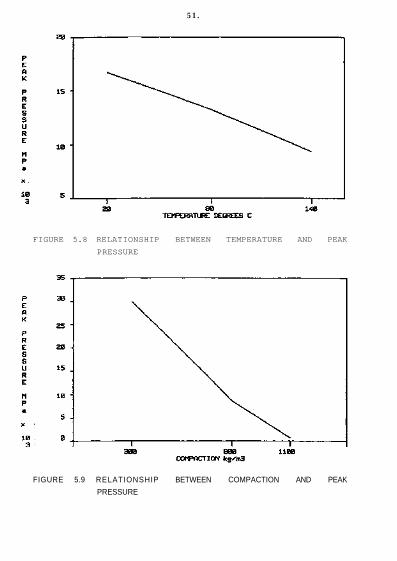
are shown in Table 5.5. All factors are significant and the
results are shown graphically in Figures 5.6 to 5.9. Peak
pressure is seen to increase as speed of application increases
and falls as temperature is increased in the range 20° to 140°C.
The influence of particle size and compaction are as would be
expected, peak pressure increasing as compaction increases and
being lower for fine than for coarse material, with whole
material being somewhere between coarse and fine. The results
shown in these figures are averaged over all other variables.
Of the two-factor interactions the TC and FC interactions
shown in Figures 5.10 and 5.11 are of most interest. These show
that the effect of both temperature and material size is less as
compaction is decreased.
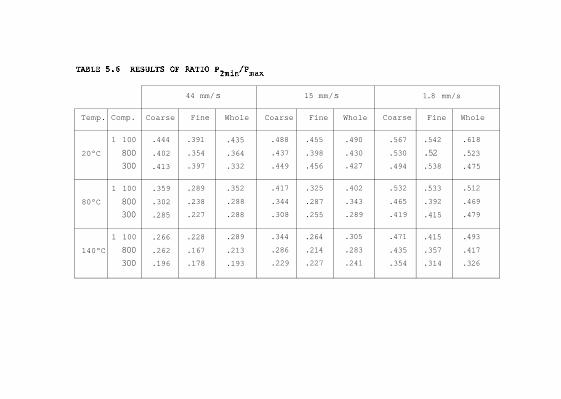
5.4.2 RATIO OF PRESSURE AT 2 MIN TO PEAK PRESSURE
The values of the ratio P2min/Pmax which is a measure of
the relaxation of the pressure are shown in Table 5.6 and the
results of the analysis of variance are shown in Table 5.7. All
of the prime variables are seen to have a significant effect on
the ratio. The effects are shown graphically in Figures 5.12 to
5.15.
It can be seen that the pressure for the fine material
falls slightly more than that for coarse and whole. Of partic
ular interest is the fact that as the speed of compression
increases, the smaller the relative value of pressure after two
minutes. The relative value of pressure after two minutes is
seen to decrease as temperature increases and increase as the
level of compaction increases.
5-5 RESULTS OF TESTS AT 10% MOISTURE - SINUSOIDAL COMPACTION
Tests were carried out to determine the effect of method
of compression - sinusoidal or linear - on the compression
characteristics of bagasse. Tests were confined to whole bagasse
and were carried out under the following conditions.

49.
TABLE 5.5 RESULTS OF ANALYSIS OF VARIANCE - PEAK PRESSURES
Source
TOTAL
S
F
T
C
SF
ST
SC
FT
FC
TC
SFT
SFC
STC
FTC
SFTC
ERROR
Degrees of Freedom
80
2
2
2
2
4
4
4
4
4
4
8
8
8
8
16
16
Variance Ratio
22.687
179.738
204.934
3487.325
1.725
3.724
12.457
9.170
78.115
73.784
0.477
1.335
2.448
6.026
1.000
Significance Level
Less than .001
Less than .001
Less than .001
Less than .001
.100 - .250
.010 - .050
Less than .001
Less than .001
Less than .001
Less than .001
Greater than .250
.050 - .100
.001 - .010
Greater than .250

FIGURE 5-6 RELATIONSHIP BETWEEN PARTICLE SIZE AND
PRESSURE
PEAK
FIGURE 5-7 R E L A T I O N S H I P BETWEEN SPEED OF COMPACTION AND
PEAK PRESSURE
5 0 .
5 1 .
FIGURE 5.8 RELATIONSHIP BETWEEN TEMPERATURE AND PEAK
PRESSURE
FIGURE 5.9 RELATIONSHIP BETWEEN COMPACTION AND PEAK
PRESSURE

5 2 .
FIGURE 5.10 ILLUSTRATION OF TEMPERATURE-COMPACTION INTERACTION
Temp.
20°C
80°C
140°C
Comp.
1 100
800
300
1 100
800
300
1 100
800
300
Coarse
.444
.402
.413
.359
.302
.285
.266
.262
.196
44 mm/
Fine
.391
.354
.397
.289
.238
.227
.228
.167
.178
s
Whole
.435
.364
.332
.352
.288
.288
.289
.213
.193
Coarse
.488
.437
.449
.417
.344
.308
.344
.286
.229
15 mm/
Fine
.455
.398
.456
.325
.287
.255
.264
.214
.227
s
Whole
.490
.430
.427
.402
.343
.289
.305
.283
.241
Coarse
.567
.530
.494
.532
.465
.419
.471
.435
.354
1.8 mm/s
Fine
.542
.52
.538
.533
.392
.415
.415
.357
.314
Whole
.618
.523
.475
.512
.469
.479
.493
.417
.326

5 4 .
Source
TOTAL
S
F
T
C
SF
ST
SC
FT
FC
TC
SFT
SFC
STC
FTC
SFTC
ERROR 1
Degrees of Freedom
80
2
2
2
2
4
4
4
4
4
4
8
8
8
8
16
16
Variance Ratio
525.701
35.133
486.364
109.914
1.327
5.204
2.274
4.216
4.910
4.244
0.726
0.471
1.283
1.982
1.000
Significance Level
Less than .001
Less than .001
Less than .001
Less than .001
Greater than .250
.001 - .010
.100 - .250
.010 - .050
.001 - .010
.010 - .050
Greater than .250
.100 - .250
Greater than .250

5 5 .

5 6 .

5 7 .
Type of Compression L Linear; Sinusoidal.
Speed of Compression S 45 mm/s; 15 mm/s; 1.8 mm/s.
Temperature T 20°C; 80°C; 140°C.
Compression C 300 kg/m3; 800 kg/m3; 1 100 kg/m3.
5.5.1 PEAK PRESSURE
The results of peak pressure obtained from the tests are
shown in Table 5.8 and the analysis of variance of the results is
shown in Table 5.9. As expected from previous tests there is a
significant effect of level of compaction and temperature but it
was found that speed of compression was of limited significance
and that the effect of type of loading was significant only at
the 0.05 level with the sinusoidal type of loading giving
slightly lower maximum pressures as shown in Table 5.10. The TC
interaction discussed in 5.4.1 is again evident.
TABLE 5.10 AVERAGE PEAK PRESSURES MPa
S i n u s o i d a l
11.9
Linear
13.0
5.5.2 RATIO OF PRESSURE AT 2 MIN TO P
max
The results obtained for the tests are shown in Table 5.11
and the analysis of variance results are shown in Table 5.12.
The effects of temperature , compaction and speed are similar to
those outlined in Figures 5.13 to 5.15. The effect of type of
loading is shown in Table 5.11.

TABLE 5.8 VALUES OF PEAK PRESSURE MPa
Speed (mm/s)
20°C
80°C
140°C
1 100
800
300
1 100
800
300
1 100
800
300
Linear
45
45.8
14.1
.797
29.6
8.77
.438
20.8
3.9
.422
15
42.5
13.3
.781
32.1
7.68
.457
16.2
5.66
3.87
1.8
35.1
12.0
.672
24.8
7.02
.398
19.5
5.26
.359
Sinusoidal
45
36.3
12.8
.797
2 9.1
7.68
.375
17.9
3.76
.285
15
39.2
11.8
5.73
26.0
6.54
.402
16.5
4.22
.328
1.8
37.4
9.98
.684
24.6
6.33
.414
17.8
4.66
2.93
TABLE 5.9 RESULTS OF ANALYSIS OF VARIANCE P M A X SINUSOIDAL VS
LINEAR COMPACTION
Source
TOTAL
L
S
T
C
LS
LT
LC
ST
SC
TC
LST
LSC
LTC
STC
LSTC
ERROR
Degrees of Freedom
53
1
2
2
2
2
2
2
4
4
4
4
4
4
8
8
Variance Ratio
4.205
3.096
110.659
900.947
0.589
0.000
1.767
1.110
1.281
40.836
0.825
0.717
0.609
0.749
1.000
Significance Level
.050 - .100
.100 - .250
Less than .001
Less than .001
.100 - .250 '
Greater than .250
Greater than .250
Less than .001
Greater than .250
5 8 .

5 9 .
Speed
20°C
80°C
140°C
(mm/s)
1 100
800
300
1 100
800
300
1 100
800
300
45
.435
.364
.332
.352
.288
.288
.289
.213
.193
Linear
15
.490
.430
.427
.402
.343
.289
.305
.283
.241
1.8
.618
.523
.475
.512
.469
.479
.493
.417
.326
45
.513
.410
.468
.415
.386
.290
.368
.306
.209
Sinusoidal
15
.545
.481
.498
.468
.419
.345
.419
.351
.264
1.8
.606
.560
.532
.598
.502
.447
.549
.435
.436
Source
TOTAL
L
S
T
C
LS
LT
LC
ST
SC
TC
LST
LSC
LTC
STC
LSTC
ERROR
Degrees of Freedom
53
1
2
2
2
2
2
2
4
4
4
4
4
4
8
8
Variance Ratio
46.121
124.370
99.090
50.524
1.152
0.242
0.310
1.731
0.289
1.363
0.406
0.228
1.614
0.449
1.000
Significance Level
Less than .001
Less than .001
Less than .001
Less than .001
Greater than .250
.100 - .250
Greater than .250
Greater than .250
Greater than .250

60 .
TABLE 5 . 1 3 AVERAGE VALUES OF P 0 m , . „ / P m a v
2min max
Sinusoidal
.438
Linear
.381
5.6 CONCLUSIONS
The results presented in this section have given a basic
understanding of the relaxation properties of bagasse. The
relaxation properties are of particular importance in the rolling
action type of pelleter machine where the material is compressed
by moving it through a gap of fixed dimensions and not at
constant pressure. Because of this tendency for pressure to fall
off, thus reducing hold time and potentially pellet density it is
important that pressure in the horizontal direction i.e. at right
angles to roll pressure applied vertically, to be maintained.
The controlling influence on force in the horizontal direction is
coefficient of friction. This will be discussed in Chapter 7.

CHAPTER 6 ENERGY OF COMPACTION
This gave a series of 108 tests.
The second series was carried out to investigate the
effect of temperature. The variables investigated in this series
were:
Temperature T 20°C; 80°C; 140°C.
Moisture M 10%; 20%; 30%.
Material F Coarse, Fine, Whole.
Compaction C 1 100 kg/m3; 800 kg/m .
Speed
Moisture
Material
Compaction
Replication
S 15 nrai/s .094 Hz; 1.8 ram/s .0113 Hz M 10%; 20%; 30%.
F Coarse, Fine, Whole.
C 1 100 kg/m3; 800 kg/m3; 300 kg/ra3.
R 2
This gave a total of 54 tests.
6 1 .
6-1 INTRODUCTION
The energy required to compact a sample of bagasse is of
prime importance in the design of a compacting machine. Tests
were therefore carried out to determine the energy of compaction,
not only of the first compression stroke but on subsequent
strokes up to the tenth compression. The tests were carried out
on the equipment shown in Figures 5.1 and 5.2.
6-2 SCOPE OF TESTS
Two series of tests were carried out, the first series was
at the following conditions:

62.
6-3 RESULTS
The form of the curves obtained for the tests is shown in
Figure 6.1. The areas under the curves were found by integration
using digital techniques on the recorded data and the energies
were calculated in kJ/kg. Results of the tests are shown in
Tables 6.1, 6.2 and 6.3.
6.3.1 INFLUENCE OF VARIABLES ON TESTS AT 20°C - 1ST COMPACTION
The results of the analysis of variance are shown in Table
6.4. It can be seen from this table that all of the factors
investigated had a significant effect on the energy of compact
ion. The results averaged over other variables are shown in
Figures 6.2 to 6.5. It can be seen from the results that:
Increases in compaction increase the energy required for
compaction.
Increase in moisture content reduces the energy required for
compaction.
Fine material requires significantly less energy for compact
ion than whole or coarse material.
An increase in speed increases the energy required for
compaction.
Four of the two-factor interactions are significant. The
most significant of these is the FC interaction shown in Figure
6.6. The MC interaction which is also significant, is shown in
Figure 6.7. This shows how the difference between the energy
required for compaction at different moistures increases as
compaction increases.

FIGURE 6.1 TYPICAL HYSTERESIS CURVES FOR BAGASSE
63 .

64 .
TABLE 6.1 ENERGY OF COMPACTION - 1ST CYCLE (kJ/kg) TESTS AT 20°C

65.
TABLE 6.2 ENERGY OF COMPACTION - 10TH CYCLE (kj/kg) TESTS AT 20°C

TABLE 6.3 ENERGY COMPACTION - 1ST CYCLE (kJ/kg) - RESULTS AT 15 mm/s .094 Hz
Moist %
10
20
30
Comp kg/m3
1 100
800
1 100
800
1 100
800
20°C
Coarse
16.65
9.287
14.28
6.826
11.08
6.155
Fine
8.183
4.037
7.434
3.357
4.196
2.309
Whole
15.05
8.336
10.39
4.215
8.853
5.319
80°C
Coarse
12.11
6.25
8.114
3.667
6.596
2.499
Fine
5.237
2.505
3.932
1.796
6.944
3.541
Whole
8.090
4.020
6.596
2.499
2.421
1.233
140°C
Coarse
7.982
4.162
5.809
2.305
6.452
1.764
Fine
3.013
1.436
2.847
1.075
5.465
1.005
Whole
6.566
2.840
3.336
1.962
3.180
1.310

TABLE 6.4 RESULTS OF ANALYSIS OF VARIANCE - ENERGY OF 1ST CYCLE
20°C
Source
TOTAL
S
F
M
C
SF
SM
SC
FM
FC
MC
SFM
SFC
SMC
FMC
SFMC
ERROR
Degrees of Freedom
107
1
2
2
2
2
2
2
4
4
4
4
4
4
8
8
54
Variance Ratio
22.450
395.072
223.750
2665.840
5.116
4.112
16.433
6.066
91.691
58.647
2.874
1.224
1.342
2.323
0.641
Significance Level
Less than .001
Less than .001
Less than .001
Less than .001
.001 - .010
.010 - .050
Less than .001
Less than .001
Less than .001
Less than .001
.010 - .050
Greater than .250
Greater than .250
.010 - .050
6 7 .


71.
6.3.2 INFLUENCE OF VARIABLES ON TESTS AT 20°C - 10TH COMPACTION
The results of the analysis of variance of the energies of
compaction for the 10th cycle are shown in Table 6.5. These
results in general show the same trends as the energy for the 1st
cycle but the effects are less significant.
Average results of the ratio of the energy for the 10th
cycle to the energy for the 1st cycle are shown in Table 6.6.
TABLE 6.6 RATIO OF ENERGY AT 10TH COMPACTION TO ENERGY AT
1ST COMPACTION
Ratio
Compaction (kg/m3 )
300
.0781
800
.0643
1 100
.0632
6.3.3 EFFECT OF TEMPERATURE ON ENERGY OF COMPACTION
The results of the tests carried out to determine the
effect of temperature on energy of compaction at higher levels of
compaction are shown in Table 6.3. The results of the analyses
of variance carried out on the results of these tests are shown
in Table 6.7. The material size, moisture and compaction are all
significant, together with the FM and FC interactions, as would
be expected from the previous results.
Figure 6.8 illustrates the effect of temperature on energy
of compaction. Increases in temperature are seen to signif
icantly reduce compaction energy requirements.
Figure 6.9 illustrates the TF interaction. This shows
that the difference between compaction energies for the range of
material sizes is greater at 20°C than at 80° or 140 C.

72.
TABLE 6.5 RESULTS OF ANALYSIS OF VARIANCE ON ENERGY OF
COMPACTION FOR 10TH CYCLE
Source
TOTAL
S
F
M
C SF
SM
SC
FM
FC
MC
SFM
SFC
SMC
FMC
SFMC
ERROR
Degrees of Freedom
107
1
2
2
2
2
2
2
4
4
4
4
4
4
8
8
54
Variance Ratio
1.588
61.903
4.724
277.321
5.603
1.130
1.396
0.522
10.710
6.108
0.006
2.027
2.942
1.696
1.039
Significance Level
.100 - .250
Less than .001
.010 - .050
Less than .001
.001 - .010
Greater than .250
Greater than .250
Less than .001
Less than .001
.100 - .250
.010 - .050
.100 - .250
Greater than .250

73.
TABLE 6.7 RESULTS OF ANALYSIS OF VARIANCE OF TESTS AT DIFFERENT
TEMPERATURES - ENERGY AT 1ST CYCLE
Source
TOTAL
T
F
M
C
TF
TM
TC
FM
FC
MC
TFM
TFC
TMC
FMC
TFMC
ERROR
Degrees of Freedom
53
2
2
2
1
4
4
2
4
2
2
8
4
4
4
8
8
Variance Ratio
341.910
185.324
102.238
658.535
26.888
10.087
16.541
20.732
19.360
4.575
5.490
1.607
4.884
2.986
1.000
Significance Level
Less than .001
Less than .001
Less than .001
Less than .001
Less than .001
.001 - .010
.001 - .010
Less than .001
Less than .001
.010 - .050
.010 - .050 1
Greater than .250
.010 - .050
.050 - .100
Greater than .250


6.4 CONCLUSIONS
The tests carried out to determine compression energy have
quantified the influence of the different parameters. From a
practical pelleting point of view the desirability of high temp
eratures and fine materials have been demonstrated. However the
tests described in Chapter 5 have illustrated that the durability
of fine material is not as good as that for the whole material.
It is interesting to consider the values of compression
. energy in relation to energies recorded in practical pelleting
machines. The comparison is shown in Table 6.9 where it is seen
that the energy to actually compress the fibres is a small
fraction of total energy absorbed and therefore there is signif
icant potential to reduce energy usage in operating machines.
TABLE 6.9 ENERGY REQUIRED TO PELLET BAGASSE
Condition
Drying Energy 50% to 10% Moisture
Theoretical
Compression Energy (from U of Q)
Extrusion Energy in Dies
Actual
Rotating Die - Jaybee
Slow Speed Extrusion - Haussman
Energy kJ/kg
Dry Matter
2 300
2.3 - 10.7
25 |
180 - 900
180
7 5 .

77.
CHAPTER 7 A THEORY OF BAGASSE COMPACTION
In this chapter the results of tests on individual
bagasse fibre bundles are combined with a theory of the collective
behaviour of many bagasse filaments in an attempt to relate
the bulk properties of bagasse to individual filament properties.
7.1 BAGASSE FILAMENTS - STRESS-STRAIN RELATIONSHIP
As described in Chapter 4, tests were conducted on
single filaments of bagasse, supported on two knife edge
supports and loaded as shown.
Typical stress-deflection curves obtained in these
tests are presented in Figure 4.1. For relatively low maximum
stress levels, the loading and unloading curves lie close
to one another implying that the material in the beam is
behaving nearly elastically. However, as maximum stress
levels are increased. the unloading curve is displaced to
the right, implying that yield has taken place. For a given
fibre, near maximum stress, increased deflection occurs with
only small increases and in fact, most of the yield occurs
at these stress levels. This behaviour can be idealized
as a linear elastic relation between stress and strain up
to a yield value, at which further non-elastic deflection
occurs at constant stress.
However, it is well known that cellulose based materials,
such as bagasse, also tend to exhibit creep i.e. under constant
stress, strain increases with time. Thus the tests above
were modified to allow 2 minute periods for creep relaxtion
at selected stress levels. Figure 4.2 shows that creep does
indeed take place, with deflection increasing with stress
levels. Creep recovery also takes place during the unloading
process but recovery is not complete -i.e. some part of the
creep is elastic, and some represents yield. This behaviour,
can be idealized by assuming that creep takes place at a

78.
rate proportional to stress, that it is elastic up the yield
stress, but creep taking place at yield is non-elastic, leading
to permanent deformation. Also, as the second cycle in the
Figure shows, if deflection in the beam is restrained when
it is in the yield region, then creep takes place as a reduction
in stress, but this still leads to an overall permanent deform
ation when the beam is unloaded.
Observation of a creep phenomenon raises the question
of the relationship between stress and strain under more
rapid loading conditions. This is particularly relevant
to operation of a rolling type compaction apparatus, since
the time spent in the nip of a pair of rollers is likely
to be of the order of seconds, whilst the time for a complete
cycle to produce the stress-strain curves of Figure 4.1 was
of the order of 2 to 3 minutes. Thus the experiments reported
in Appendix A were undertaken. Here the beam formed by the
bagasse filament was loaded rapidly by applying the weight
suddenly, and observing the resultant deflection of the beam
by multiple flash photography.
Results are shown in Figure A.3. The filaments which
did not rupture provide a stress-deflection curve which,
because of elastic rebound of the beam, included part of
an unloading curve. It can be seen that the cycle is qualita
tively similar to that obtained with the much longer loading
times associated with Figure 4.1, and can be idealized in
the same way. The time for the complete cycle in these experi
ments was of the order of 0.1 sec, implying that the idealized
model can be applied over a range of times which includes
those appropriate to a rolling operation.
The concepts arising from these experiments lead to
an idealized description of the behaviour of a filament,
acting as a beam, which is part of an assembly subjected
to compression. Deflection of the filament is elastic until
the stress reaches a yield value, after which further deflection
is plastic in nature, and produces a "permanent set" of the

79.
beam. If the deflection is maintained over a period of time,
creep will occur, and the stress in the beam will reduce.
If the beam is in the elastic region, this creep is recovered
when the beam is unloaded (although this may take some time).
If the beam has yielded, then the stress reduction is associated
with further permanent set.
In the elastic region, comparison of values of Young's
Modulus, E, determined from the experiments in Chapter 4
and Appendix A show no consistent variation of E with time,
and therefore we will regard E as a constant property of
the material. This conflicts with the results in Figures
5.4 and 5.5 in Chapter 5, which show substantial relaxation
of the bagasse compaction pressure when it is held at constant
volume; relaxation which takes place over a time less than
one second. The conflict may be seen as an inadequacy of
the single filament experiments, and it is likely to be signifi
cant when calculating effects such as nipforces as the bagasse
passes through a roller pair. However, for the present work,
where we are interested in understanding the permanent set
which arises from yield, which is thought to be the mechanism
which makes compaction possible, the discrepancy is not consider
ed to be significant.
For creep in the plastic region, Figure 4.2 suggests
that the proportional creep rate is similar to that in the
elastic region. Therefore, for a deflected beam, the amount
of deflection which will subsequently appear as permanent
set, a , is given by
da /dt = k6 ,
where * is the total deflection of the beam, t is time, and
k is a constant which, from the experiments, is given a.
value of 0.04. If it is assumed that ° is small compared
with 6 , then this can be integrated to yield

This permanent set should be added to that due to
the initial, time independent, yield of the beam.
These concepts will subsequently be used to develop
a model for the behaviour of bagasse when it is compacted.
However, it should be remembered that considerable experi
mental inaccuracies were tolerated in the experiments of
Chapter 4 and Appendix A, in order to allow formulation
of a preliminary set of physical concepts. Whilst this
is acceptable for present purposes, further experimental
work would be needed in order to establish an accurate
description of single filament behaviour.
7.2 A BAGASSE COMPACTION MODEL
MODELLING THE BAGASSE SAMPLE
The possibility of differing deflections amongst the
bagasse filaments in a compaction sample would seem to make
extrapolation from single filament properties to overall
sample behaviour an impractical task. However, it can
be tackled by following an approach suggested by the applica
tion of Statistical Mechanics to thermodynamic systems
consisting of many small subsystems (Sears, 1980) - for
example, the molecules of a gas, or the atoms in the matrix of
a metal crystal.
Following Loughran (1981) the bagasse sample is modelled
as a collection of many small beams, of varying length
and cross section, which interact with each other through
the forces and reactions occurring at the points of contact
between the beams. Deflection of each beam requires it
to store strain energy, and the task of determining the
proportion of the total number of beams which have a given
deflection is essentially that of determining the proportion
which have stored the associated amount of strain energy.
In considering this problem, the spirit of the Van Wyck
model, outlined by Loughran (1981), is followed. It is assumed
that the collective behaviour of the beams can be represented
8 0 .

81.
by considering a sample consisting of beams of one representa
tive set of dimensions i.e. all the beams in the sample
are identical. It is further assumed that each beam is
loaded at midspan and, because each of the beams will be
part of a bagasse filament consisting of many beams, the
beams will deflect as if their ends were encastered. Thus
MICROSTATES AND MACROSTATES
The state of a bagasse sample under a given degree
of compression can be specified by specifying the strain
energy of each individual beam in the sample. This is
referred to as the specification of a "microstate". However,
in considering the overall behaviour of the sample, interest
is not centred on the level of strain energy of each individ
ual beam, but rather, on determination of the number of
beams which have a particular level of strain energy.
This is referred to as specification of a "macrostate".
It is clear that many differing microstates can correspond
to any one particular macrostate.
It will also be noted that fixing the total amount
of strain energy in a sample does not fix the distribution
numbers - i.e. there are many possible macrostates correspond
ing to a given state of compression of the sample. The

task here is to determine which of these macrostates will
apply in practice.
THE MOST PROBABLE MACROSTATE
The task is tackled by determining which of the macro-
states has the maximum probability of occurrence. At first
sight this may seem to leave an element of uncertainty
regarding the state which may actually occur in a sample.
In fact, for the very large numbers of beams involved
in a typical sample, analysis shows that the probability
of the most probable macrostate is many orders of magnitude
higher than the combined probability of all possible macro-
states and therefore that, for all practical purposes,
the probability of occurence of the most probable macrostate
is unity i.e. it is a certainty.
Now, there is no apparent mechanism which seems to
favour the occurrence of any one possible microstate over
any other, and therefore it is reasonable to assume that
all microstates are equally probable. With this assumption,
8 2 .

8 3 .
number of beams within the sample is fixed. Therefore, the N's
can only be varied according to the condition
The second is that the total strain energy must remain constant
These three equations can be combined into one by using
Lagranges "Method of Undetermined Multipliers"
i.e. equ (4) is multiplied by a , and equ (5) by 6 , where
a and B are constants which are chosen such that

84.
since N is a constant. If Stirling's approximation is now used
in the form
CONTINUOUSLY VARYING STRAIN ENERGY,
So far, it has been assumed that the strain energy in the
beams takes up discrete energy levels u1 , u2 , ....etc.
However, equ (9) can readily be interpreted for the case
where the allowable energy levels vary in a continuous manner
(as in the practical case) by rewriting it in the form

8 5 .
Thus, although the fraction of the beams with strain energy
u decreases exponentially as u increases with respect to
the average energy per beam, nevertheless there is, in prin
ciple, always some beams with strain energy greater than
any given value. This implies there will always be some
beams with deflection much greater than the average.
AVERAGE DEFLECTION AND PERMANENT SET
The average deflection of the beams in the sample
is given by
The permanent set arises from plastic yield associated
with the initial state of compression of the sample, when some
beam elements are deflected beyond their yield point, and from the
plastic creep which subsequently occurs in those beam elements.

8 6 .
Considering first the initial yield, the average permanent
set resulting from this is given by

8 7 .
For l a r g e r va lues of the second exponential term in the
integrand of the integral within the brackets can be written as
Equ(16) is plotted in Figure 7.1. It can be seen that
no significant initial yield occurs until the average deflec
tion approaches roughly 30% of the yield deflection. Further
increase in average deflection then rapidly increases the
permanent set due to yield to nearly half of the average
defection, after which it constitutes a slowly increasing
fraction of the average deflection.
BULK COMPACTION PROPERTIES
The final density of a compacted bagasse pellet,
after the compaction process is completed, depends upon
the permanent set which is induced within the fibres of
the pellet. This is compounded of the permanent set due
to initial yield, and that due to retention (identified
here as plastic creep). Here we concentrate on the first.

88.
The permanent set due to initial yield can be deduced
from equ(16). The mean deflection of the beams is proportional
to the movement of the boundaries of a pellet as it is com
pressed. Thus, if the pellet is being formed in a cylinder,
the deflection at peak compression, w i l l be p r o p o r t i o n a l to the movement of the piston i.e.

8 9 .
When these results are translated into abscissa on Figure 7.1, it |
is seen that the pellet is well into the region where initial
permanent set takes place at all significant peak compaction
densities.
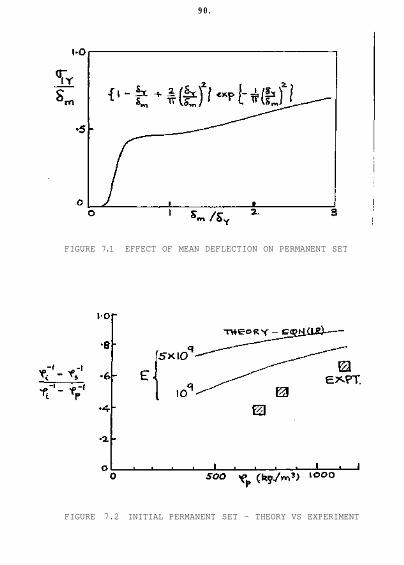
9 0 .
FIGURE 7.1 EFFECT OF MEAN DEFLECTION ON PERMANENT SET
FIGURE 7.2 INITIAL PERMANENT SET - THEORY VS EXPERIMENT

91.
permanent set is over-predicted by the theory, although
discrepancies could well be associated with uncertainties in
the basic data. However, the fact that experiment and theory
are not too widely separated at this stage is very encouraging.

9 3 .
CHAPTER 8 FRICTION TESTS
8 - 1 A I M
To determine the coefficients of shear and/or friction for
bagasse pellets on different surfaces at various temperatures,
pressures and moisture contents, so that this information may be
used in the development of the bagasse pelleting machine at Sugar
Research Institute.
The surfaces investigated were:
i) smooth mild steel (MS)
ii) smooth cast iron (CS)
iii) grooved cast iron (CG)
(triangular grooves; depth 3 mm, pitch 5 mm)
The surface finish on the plates was initially 5 0 u m in
the direction of slip but this finish was subject to very rapid
wear which reduced the roughness significantly after two or three
tests at 35 MPa pellet pressure. While it was relatively easy to
reroughen the smooth plates with some coarse emery cloth, it was
found to be quite time consuming attempting the same task on the
grooved plate, where grinding powder and a grooved block were
employed. In addition, it was very difficult to ensure that the
surfaces of the plates were completely free of residue from the
roughening process.
Therefore it was decided that all tests would be conducted
at the "equilibrium" roughness for each plate and that the only
surface preparation of the plates would be to use a scraper to
remove any bagasse adhering to them.
8.2 APPARATUS
The experimental rig consisted of three hydraulic
cylinders arranged on a support structure. The two horizontal

94.
cylinders were used to press the pellets onto each side of a
friction plate. The vertical cylinder was used to push the plate
between the pellets. A displacement transducer mounted on the
cylinder and attached to the end of the ram was used to provide
the location and hence velocity of the friction plate during each
test. The oil pressure in the cylinders was measured with
pressure transducers. The pressures and displacement were
recorded as function of time on an electrostatic chart recorder.
8.3 METHOD
Pellets of the suitable density and thickness were formed
on the INSTRON. They were stored until required in sealed
plastic bags so that moisture loss would be minimal.
Pellets for the 80°C and 140°C tests were formed in a
69.8 mm diameter cylinder so that two pellets could be pushed
into each of the standard 76.2 mm diameter cylinders which were
sealed and placed in the oven for heating to the test temper
ature. An experiment had been conducted to determine the time
required for this (Figure 8.1).
The force to be applied to the pellets was set to the
required value by adjusting the relief valve on the 3-way valve
which was used to control the movement of the horizontal rams.
Because the air supply pressure varied considerably/ this was
found to be a more reliable way of producing the desired force
than attempting to regulate the air supply to the pneumatically
powered hydraulic pump which drove the rams.
Once the relief valve had been set the rams were
positioned for the test and the friction plate propped into place
with a piece of wood. The pellets were placed between the
plattens on the rams and the friction plate and loaded to the set
force.
In the 80°C and 140°C tests, the friction plate and
plattens were heated in the oven in order to simulate as closely
as possible the conditions being modelled and reduce cooling of
the pellets.

FIGURE 8.1 RELATIONSHIP BETWEEN PELLET TEMPERATURE AND TIME

Next, the piece of wood supporting the friction plate was
removed and the alignment of the friction plate checked to ensure
that it would not foul on the pellet supports as it was pushed
between the pellets.
At this stage the procedure adopted depended on the force
applied to the pellets.
i) High Pressure
At the two high values corresponding to 35 and 10 MPa pellet
pressure it was possible to drive the vertical ram down at
low pressure until it stopped at the friction plate. This
preloaded the structure and reduced the movement produced by
the next stage which was the application of full pressure to
the cylinder.
ii) Low Pressure
At the lowest pellet pressure (1 MPa) it was found that the
force produced by the vertical cylinder was sufficient to
cause slow movement of the friction plate and thus
preloading could not be achieved. Fortunately very little
movement of the structure occurred during tests and so this
posed no problems.
Immediately before full pressure was applied to the
vertical cylinder, the chart drive was switched on.
During all tests, careful attention was given to the
progress and alignment of the friction plate so that, at the
first indication of trouble, the ram's direction could be
reversed and the plate stopped before severe damage occurred.
The maximum travel of the friction plate was 285 mm or
approximately 3.6 pellet diameters.
9 6 .

9 7 .
8.4 RESULTS
It was observed that shear of the bagasse fibres in the
pellets occurred in some cases, particularly at high pressure.
These instances are marked with an asterisk in the tables of
results.
8.4.1 RESULTS FOR COEFFICIENT OF STATIC FRICTION AT 20°C
The results of the tests conducted on whole material at
20°C for a range of surfaces, moisture contents and pressures,
are outlined in Table 8.1 and the results of the analysis of
variance are shown in Table 8.2. It can be seen that all of the
factors investigated significantly influenced the coefficient of
static friction and that all interactions were significant.
TABLE 8.1. COEFFICIENT OF STATIC FRICTION
Moisture Content
%
10 (W1)
20 (W2)
30 (W3)
Pressure
MPa
35 (P1)
10 (P2)
1 (P3)
35
10
1
35
10
1
Mild Steel
Smooth (F1)
Rl
.39*
.35
.13
.44
.28
.31
.14
.27
.35
R 2
.33*
.29
.12
.39
.31
. 35
.14
.28
.38
Friction Plate
Cast
Smooth (F2)
Rl
.37*
.34
.23
.40
.35
.31
.14
.27
.30
R2
.37*
.34
.16
.41
.39
.33
.14
.25
.27
Iron
Grooved (F3)
Rl
.42*
.48*
.38
.71*
.54*
.43
.30
.39
.29
R2
.40*
.49*
.30
.76*
.53*
.40
.29
.36 |
.31

98.
Figures 8.2 to 8.7 illustrate the significant single
factor effects and interactions.
Single Factor Effects
It can be seen that, averaged over all other variables,
the coefficient of static pressure increases with applied
pressure from 1 to 10 MPa with no increase from 10 to 35 MPa.
The coefficient of static friction is seen to be maximum at 20
per cent moisture and whilst, as expected, the coefficient is
highest with grooved surfaces, there is no difference in the
coefficient of friction between the mild steel and cast iron
surfaces.
Interactions
Perhaps the most interesting of the interactions is the
more rapid fall off in the coefficient of static friction at the
highest pressure as the moisture content of material increases.
TABLE 8.2. RESULTS OF ANALYSIS OF VARIANCE OF RESULTS CARRIED
OUT AT 20°C.
Source
F
w P
FW
FP
WP
FWP
ERROR
TOTAL
Degrees of Freedom
2
2
2
4
4
4
8
27
53
Variance Ratio
167.142
166.926
39.235
14.229
7.596
71.684
11.705
Significance Level
< .001
< .001
< .001
< .001
< .001
< .001
< .001

9 9 .
FIGURE 8.2 INFLUENCE OF APPLIED PRESSURE ON
COEFFICIENT OF STATIC FRICTION.
FIGURE 8,3 INFLUENCE OF MOISTURE CONTENT ON
COEFFICIENT OF STATIC PRESSURE.

FIGURE 8.4 INFLUENCE OF SURFACE ON COEFFICIENT
OF STATIC FRICTION.
FIGURE 8.5 ILLUSTRATION OF SURFACE PRESSURE
INTERACTION.
100.

FIGURE 8.6 ILLUSTRATION OF PRESSURE MOISTURE
INTERACTION.
FIGURE 8.7 ILLUSTRATION OF SURFACE, MOISTURE
INTERACTION,
101 .

102.
8.4.2 RESULTS OF COEFFICIENT OF STATIC FRICTION TESTS WITH
DIFFERENT MATERIAL SIZE - 20°C
A series of tests was carried out at 10 per cent moisture
with both coarse and whole material to investigate the influence
of material size for a range of pressures and surfaces. The
results obtained are shown in Table 8.3 and the results of the
analysis of variance are shown in Table 8.4. From this it can be
seen that only the single factors were significant and there were
no significant interactions.
TABLE 8.3. COEFFICIENT OF STATIC FRICTION FOR DIFFERENT MATERIAL
SIZE - TEMPERATURE 20°C, MOISTURE 10%.
The influences of pressure and material are similar to
those illustrated in Figures 8.2 and 8.4. Figure 8.8 illustrates
that the coefficient of static friction is marginally less with
the coarser material.

FIGURE 8.8 INFLUENCE OF MATERIAL SIZE ON
COEFFICIENT OF STATIC FRICTION.
103 .

104.
TABLE 8.4. RESULTS OF ANALYSES OF VARIANCE OF RESULTS FOR
DIFFERENT MATERIAL SIZE.
TABLE 8.5. COEFFICIENT OF DYNAMIC FRICTION MATERIAL: WHOLE, 20°C

105.
TABLE 8.6. RESULTS OF ANALYSIS OF VARIANCE OF RESULTS FOR
COEFFICIENT OF DYNAMIC FRICTION - COARSE MATERIAL,
20°C.
8.4.3 RESULTS FOR DYNAMIC COEFFICIENT OF FRICTION - 20°C
The results of the coefficient of dynamic friction for
whole material at 20°C are summarised in Table 8.5 and the
results of the analysis of variance of the results are shown in
Table 8.6.
All factors investigated were significant and these
effects are illustrated in Figures 8.9 to 8.11, which show
similar trends to those exhibited for the coefficient of static
friction.
8.4.4 RESULTS OF COEFFICIENT OF DYNAMIC FRICTION TESTS WITH
DIFFERENT MATERIAL SIZE - 20°C.
The results obtained for tests on whole and coarse
material are shown in Table 8.7. The results of the analysis of
variance on the data is shown in Table 8.8. It is seen that the
influence of material size is significant and similar to that
found for the coefficient of static friction. This influence is
illustrated in Figure 8.12.

FIGURE 8,9 INFLUENCE OF SURFACE ON
COEFFICIENT OF DYNAMIC FRICTION,
FIGURE 8.10 INFLUENCEOF MOISTURE ON COEFFICIENT
OF DYNAMIC FRICTION
1 0 6 .

FIGURE 8.11 INFLUENCE OF PRESSURE ON COEFFICIENT
OF DYNAMIC FRICTION,
FIGURE 8.12 INFLUENCE OF MATERIAL SIZE ON
COEFFICIENT OF DYNAMIC FRICTION.
107.

108.
TABLE 8.7. COEFFICIENT OF DYNAMIC FRICTION - TEMPERATURE 20°C,
MOISTURE 20%.
TABLE 8.8. RESULTS OF ANALYSIS OF VARIANCE OF TESTS TO DETERMINE
EFFECT OF MATERIAL SIZE ON DYNAMIC COEFFICIENT OF
FRICTION.

109.
8.4.5 INFLUENCE OF TEMPERATURE
A series of tests was carried out to determine the
influence of temperature on the coefficient of friction. The
tests were carried out on whole material at 10 per cent moisture
for three levels of pressure on each of the three surfaces.
The results are shown in Table 8.9. The results of an
analysis of variance carried out on these data are shown in Table
8.10. This shows that temperature had a significant effect on
the coefficients of friction. Several tests were carried out at
140°C and the results are shown in Table 8.11. Figures 8.13 and
8. 14 show the extent to which the coefficients of friction
decrease as temperature increases. It is interesting to note
from Table 8.10 that there is no significant difference between
the values of coefficient of static and dynamic friction.
TABLE 8.9. RESULTS OF COEFFICIENTS OF FRICTION AT 20°C AND 80°C
MATERIAL - WHOLE, 10% MOISTURE.

FIGURE 8,13 INFLUENCE OF TEMPERATURE ON COEFFICIENT
OF STATIC FRICTION,
FIGURE 8.14 INFLUENCE OF TEMPERATURE ON COEFFICIENT
OF DYNAMIC FRICTION,
1 1 0 .

111.
TABLE 8.10. RESULTS OF ANALYSIS OF VARIANCE OF COEFFICIENTS OF FRICTION AT 20° AND 80°C.
TABLE 8.11. COEFFICIENTS OF FRICTION AT 140°C - MATERIALS:
WHOLE, 10% MOISTURE. PRESSURE 10 MPa.

8.5 CONCLUSIONS
The results outlined in this chapter have illustrated the
following major factors affecting the coefficient of friction of
relatively dry bagasse.
Very high values of coefficient of friction can be obtained.
The highest values of greater than .7 for static friction
occur with grooved surfaces at 20 per cent moisture.
The coefficient of static and dynamic friction increase with
pressure except at the 30 per cent moisture level where
expression of moisture at the higher pressures causes the
coefficient of friction to decrease.
There was little difference between values obtained for flat
cast iron and steel surfaces. As expected the coefficient of
friction increased for grooved surfaces compared to flat
surfaces.
Coarse material had lower coefficient of friction than whole
material.
Whilst the coefficient of dynamic friction was somewhat less
than the coefficient of static friction when the values were
high on average there was no significant difference between
the two coefficients over the range of tests.
The coefficient of friction decreased as temperature
increased in the range 20°C to 140°C.
1 1 2 .

1 1 3 .
REFERENCES
Sears, F.W. "An Introduction to Thermodynamics, The Kinetic
Theory of Gases, and Statistical Mechanics". Addiston-Wesley,
U.S.A. 2nd Edition, June 1980.
Loughran, J.G. "Some Aspects of the Mechanics of Bagasse
Compaction" M.Eng.Sc. Thesis, Department of Mechanical
Engineering, University of Queensland, 1981.
Marks, L.S. "Mechanical Engineers' Handbook" 5th Edition,
McGraw-Hill Book Coy. Inc., 1951.
Anderson, C.N., et al. Final Report "Elimination of Fuel Oil for
Steam Generation in the Sugar Industry" Part 2, University of
Queensland component. Department of Mechanical Engineering
Research Report 3/83.

115.
APPENDIX A
RAPID BENDING OF BAGASSE FIBRE BUNDLES
I N T R O D U C T I O N
This rapid fall off of load on the bagasse pellets which
was observed during the compression tests conducted on the
Instron materials testing machine in the Department of
Mechanical Engineering (see Figures 5.4 and 5.5) indicated that
the relaxation processes which governed the formation of a good
quality pellet occurred in the order of 0.4 s or less.
In order to gain some further understanding of the
relaxation process it was decided to investigate the response
of some typical or average fibre bundles to loads of the order
of those required to cause failure of the bundle.
PROCEDURE
The apparatus used is shown schematically in Figure A.1.
The fibre bundle was placed across two smooth metal supports
12.5 ± 0.05 mm apart. A chosen mass was placed on the hinged
support and the height of the hook adjusted until it was in
contact with, but not visibly deforming, the fibre bundle.
A black wooden dowel with a white line on it was placed
beside the mass. This provided a time reference for the
experiment as its motion was that due to gravity only. The
time reference was necessary because there was a ± 1.5 ms
variation in the time required for the relay to release the
hinged support.
Once the fibre bundle, mass and dowel had been placed in
position and the camera focused and loaded, the test began.
The electronic timing apparatus was triggered by opening the
shutter. This immediately provided the 12 V required to open
the relay and started the counter which provided the delay for

116.
the triggering of the stroboscope. The delay and time interval
between flashes could be varied in increments of 2.5, 5 or 10
ms. The number of flashes could be varied between 1 and 10.
Satisfactory photographs were obtained with delays of
12.5 and 15 ms and intervals between flashes of 10 and 20 ms.
The shutter was held open for 1/8 s (nominally 125 ms) . A
typical photograph is reproduced in Figure A.2.
The separation of the images of the white lines on the
weight and dowel were measured with the aid of a travelling
microscope. This procedure enabled the opening of the relay
(and hence the application of the load on the fibre bundle) to
be determined to within ± 1% of the duration of a test
(typically 20 to 40 ms, being the time to either "steady state"
deformation or failure of the bundle).
Once the timing of the test had been established it was
possible, using a multiple linear regression program supplied
by Mr. C.N. Anderson, to produce a polynomial equation
describing the motion of the fibre bundle as a function of
time. - This equation was differentiated to provide velocity and
acceleration and hence the force on the fibre bundle was
obtained. Further calculations, using simple bending theory
provided value of Young's Modulus (E) and the extreme fibre
stress (a) as functions of time. Figure A.3 is a plot of
extreme fibre stress as a function of displacement for three of
the fibre bundles which did not break under the loads
indicated.

FIGURE A.l SCHEMATIC VIEW OF APPARATUS
FIGURE A.2 MULTIPLE EXPOSURES OF A FIBRE BUNDLE UNDER LOAD
1 1 7 .

FIGURE A,3 RELATIONSHIP BETWEEN STRESS AND DISPLACEMENT FOR RAPID BENDING TESTS

119.
APPENDIX B
PROBABILITY OF A MACROSTATE
In determining the number of microstates corresponding
to a given macrostate, first take the molecular properties
corresponding to the macrostate as given (i.e. take N values
of the property A, of which N, are the value A , N are
the value A2 ,etc....) and assess the number of ways the
N beam elements can be assigned to these properties.
The first element may be allotted to one of N values
The second element may be allotted to one of (N-l) values
.- etc.
whence the elements can be allotted to the N values in N!
different ways.
However, taking this as the possible number of micro-
states would imply that the order in which the elements
were arranged in each of the groups of identical values
of A was important - i.e. for example, an element in the
group corresponding to the value A1 could take this value
of A in N1 different ways, and thus give rise to not one,
but N1 different microstates with no change in the distribution
of the remaining molecules. This is incorrect, (since a
given distribution of the values of A amongst the elements
corresponds to a single microstate) whence, so far as this
group is concerned, the number of possible microstates has
been overestimated by a factor equal to the number of ways
a given N1 molecules can be rearranged within the group
i.e. by a factor N1 . A similar argument applies to
the other groups, wherefore the number of possible microstates
is correctly given by

1 2 0 .