Embed Size (px)
DESCRIPTION
qvm
Citation preview
QUALITY AND RELIABILITY CORNER
Quality revolution: leading theinnovation and competitive
advantagesM.A. Berawi
Civil Engineering and Construction Management Department,Oxford Brookes University, Oxford, UK
Keywords Quality, Value analysis, Knowledge management, Industry competitiveness,Innovation, Competitive advantage
Abstract Knowledge management (KM) addresses the critical issues of organizationaladaptation, survival and competence in a rapidly evolving environment. KM embodiesorganizational processes that seek a synergistic combination of the data and informationprocessing capabilities of information and communication technologies (ICT), and the creative andinnovative capacity of human beings to improve ICT. In that role, knowledge management has thecapacity to improve quality management and avoid or minimize losses and weaknesses that resultfrom poor performance as well as increase the competitive level of the company and inability tomaximize its survival potential in the global marketplace. To achieve quality, all parties includingthe clients, company consultants, contractors, entrepreneurs, suppliers, and governing bodies (i.e.all involved stakeholders) must encourage collaboration and commitment to quality. Design-basedorganizations have to be quality driven to support healthy growth in today’s competitive market. Inthe march towards globalization (i.e. the one world community) as well as local industriescomprising many companies, their design-based organizations need to have superior qualitymanagement and knowledge management capabilities to anticipate changes. Intelligence andknowledge is a form of strategic capital, which can be cultivated, created, stored, managed,retrieved and measured to give competitive advantage. To anticipate the needs of the marketplace,a new system that is called quality value model (QVM) is proposed. QVM is a combination ofcommunication and information technologies (ICT) as well as creative and innovative capabilitiesof human beings to meet challenges and to develop high-quality products. Quality is a reflection ofthe properties in a product that customers use to value and evaluate its economic worth.Furthermore, the mathematical technique within QVM calculates input-factor changes within theproduct. This enables companies to be more responsive and aids prediction in respect to changeand the management of decision uncertainty.
IntroductionThe combination of intelligence and knowledge is a key factor in the move toglobalization. Knowledge management involves the identification and analysis ofavailable and required knowledge, and the subsequent planning and control of actionsto develop knowledge assets so as to fulfill the organizational objective of profitabilitythrough higher quality levels as recognized by customers (Berawi, 2002a). Knowledgeassets comprise the knowledge regarding markets, products, technologies andorganizations that a business owns or needs to own and that enable the enterprise togenerate profits. High-quality goals for products, along with a good means to schedule,track and predict costs are the mechanism needed to manage the design from concept
The Emerald Research Register for this journal is available at The current issue and full text archive of this journal is available at
www.em eraldinsight.com/res earchregister www.em eraldinsight .com/0265-671X .htm
Qualityrevolution
425
Received October 2002Revised November 2003
Accepted November 2003
International Journal of Quality &Reliability Management
Vol. 21 No. 4, 2004pp. 425-438
q Emerald Group Publishing Limited0265-671X
DOI 10.1108/02656710410530118
to delivery (Abdul-Rahman and Berawi, 2001). Products that are completed on timeand in budget are important parameters for success and quality through QVM. Thefollowing are five definitions and perspectives on quality (Garvin, 1998):
(1) Transcendent: “Quality is neither mind nor matter, but a third entityindependent of the two . . . even though quality cannot be defined, you knowwhat it is” (Pirsig, 1974).
(2) Product-based: “Quality is based on the presence or absence of a certainattribute” (Abbott, 1955).
(3) Manufacturing-based: “Quality is conformation to requirement” (Crosby, 1979;Ishikawa, 1985).
(4) User-based: “Quality means fitness for use” (Juran, 1974; Deming, 1982).
(5) Value-based: “Quality means the degree of the excellence at an acceptable priceand the control of variability at an acceptable cost” (Broh, 1982).
QVM – adding value through innovation and changeThe main objective of any management activity is to improve the performance of acompany or business to meet strategic objectives. This paper describes a model thatcan be used to move closer to an elegant solution. This is a tool for management thatenables them to anticipate the direction in which competitive advantage throughdesign should head. Therefore, companies will be empowered to seek new designadvantages proactively. As customers control revenue the management of quality isthe means to influence the “value for money” comparison in the purchase decision.What is more, as levels of global competition increase, companies must activelymanage their external and internal perceptions by engaging in three areas of activity:
(1) Adjusting external perceptions to reflect innovativeness and creation.
(2) Managing internal capabilities by the appropriate use of ICT and the media andthe company’s knowledge and ability.
(3) Changing the reality, in terms of behaviors, actions, and symbols (supportingsociety and environment culture).
Companies constantly make their commitment to innovation visible through actionsthat reinforce the need to outperform what already exists. They highlight theimportance of having experienced, effective and capable human resources and levelsof performance that enable development, improvement and innovation in the movetowards globalization (Abdul-Rahman and Berawi, 2002). A vision for a company’sfuture is identified through careful analysis of the system in which the firm existsand the ability of the company to achieve future growth (Woodhead and McCuish,2003). The key success factors are the specific indicators that are considered reliablemeasures. They are determined by an analysis of the ability to meet globalcompetition with rapid innovations that reduce the new product developmentduration of industrial products and projects (Berawi, 2002b). The alternativeapproach is to be a trend-setter rather than a follower, but the company must knowhow to play and change its role by using the talents of various cultures andcombinations of competition and cooperation. Deploying technology to successfullyorganize and share knowledge will remain important. A knowledge development
IJQRM21,4
426
cycle in an organization consists of knowledge creation, knowledge adoption,knowledge distribution, and knowledge review and revision phases (Bhatt, 2000).The challenge for a company is to create an environment that demands and allowsgeneration and processing of information continually as well as facilitatingknowledge creation and utilization. This is especially true for firms operating inhighly competitive environments (Nonaka and Takeuchi, 1995; Malhotra, 2001).“Value added” in most industries today is in the form of knowledge, not stuff. Theability of a company to adapt to changes at the right time is important for a companyto survive and maintain its competitive advantage. What this paper offers is a toolthat will help co-ordinate knowledge. The optimization of intangible assets, such asin-house knowledge are the “why” and “how” the company makes progress towardshigher level of quality. There is a direct and different influence on designconsiderations and market analysis to achieve higher quality. Companies needsuperior quality to face global competition, yet many classical quality managementtheories do not promote innovation and change in a dynamic fashion but rather asincremental and continuous tweaks. The attitude to work in businesses andindustries drives the attitude to design and the search for innovation. Qualitymanagement in business is a system that deals with the procedures of obtainingquality levels that perform intended functions, and to do so within the varioushuman, social, and environmental requirements and constraints.
Mathematical model for QVMGiven we are not so much interested in achieving a comparable level of quality as offeredby rivals, we now explain how we can anticipate quality improvements that enablecompetitive advantages. Our goal is to identify these factors that really make a differenceso that we can ignore insufficient ones. The success of a product can be evaluated by thedegree to which it meets or exceeds the customer’s requirements. Achieving this requiresnot only the resources of a number of organizations and individuals, but also successfulinteraction amongst those parties. The concept of QVM has arisen in recognition of thegrowing customer use of the Internet to source products and the reducing knowledgeproducers have of what rivals offer. The basic idea for a mathematical approach to anoptimal design is to increase all of the product’s strength factors and at the same timeminimize all of its weaknesses. The QVM concept can be applied to all kinds of productand business process innovations as they are essentially different forms of design. Theproduct needs an optimal design and allows us to consider “what is” as well as “whatcould be” (Ilyas et al., 2001). The quality of a product or process is measured in terms ofits characteristics or properties that customers’ value. Weight determined by customersvia market research in actual episodes using paired comparison technique (Woodheadand Downs, 2001) allows the explicit link to the customer’s preferential power overrevenue streams to be included in our contemplation.
Let me explain the funding theories and move forward to a more detailedexplanation of the model. As customers evaluate the worth of an offer themanufacturer must consider the following:
. the ability to sell is dependent on the customer’s perceived worth; and
. the customer’s perceived worth is a product of the amount of quality in a productin relation to the price.
From this point, we can show the trends shown in Figure 1.
Qualityrevolution
427
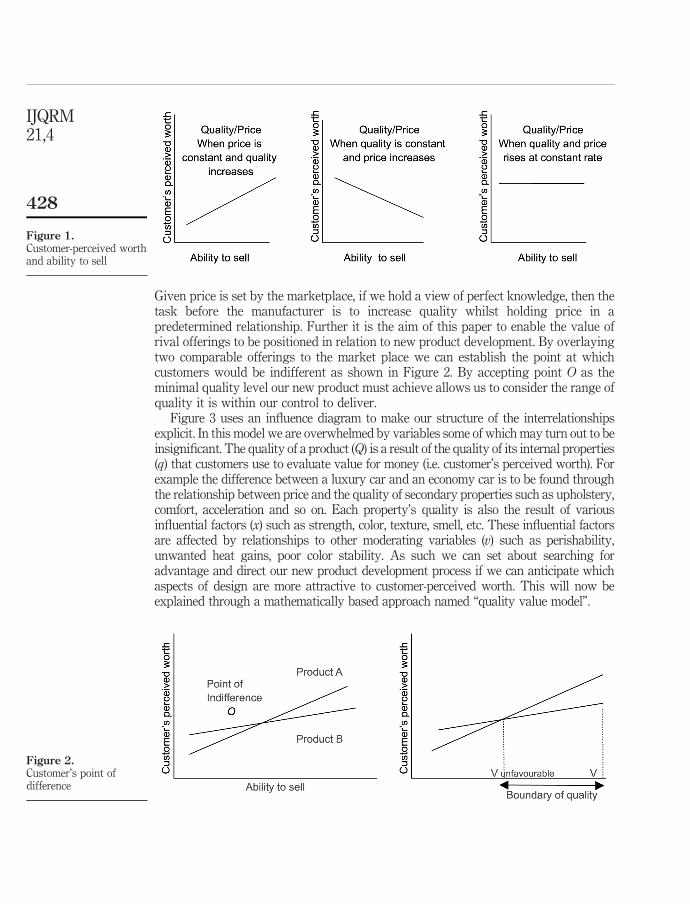
Given price is set by the marketplace, if we hold a view of perfect knowledge, then thetask before the manufacturer is to increase quality whilst holding price in apredetermined relationship. Further it is the aim of this paper to enable the value ofrival offerings to be positioned in relation to new product development. By overlayingtwo comparable offerings to the market place we can establish the point at whichcustomers would be indifferent as shown in Figure 2. By accepting point O as theminimal quality level our new product must achieve allows us to consider the range ofquality it is within our control to deliver.
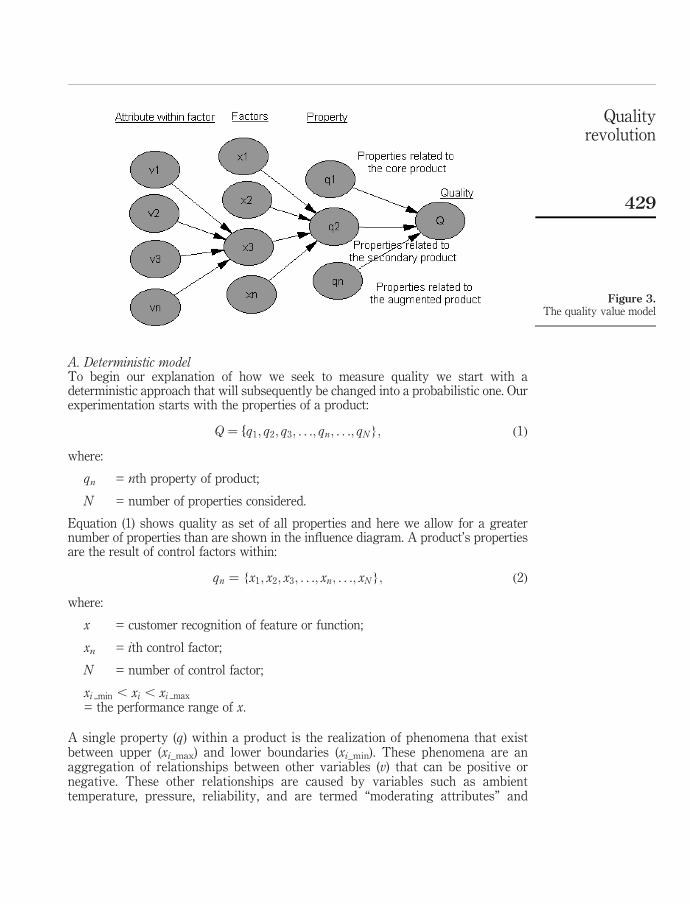
Figure 3 uses an influence diagram to make our structure of the interrelationshipsexplicit. In this model we are overwhelmed by variables some of which may turn out to beinsignificant. The quality of a product (Q) is a result of the quality of its internal properties(q) that customers use to evaluate value for money (i.e. customer’s perceived worth). Forexample the difference between a luxury car and an economy car is to be found throughthe relationship between price and the quality of secondary properties such as upholstery,comfort, acceleration and so on. Each property’s quality is also the result of variousinfluential factors (x) such as strength, color, texture, smell, etc. These influential factorsare affected by relationships to other moderating variables (v) such as perishability,unwanted heat gains, poor color stability. As such we can set about searching foradvantage and direct our new product development process if we can anticipate whichaspects of design are more attractive to customer-perceived worth. This will now beexplained through a mathematically based approach named “quality value model”.
Figure 1.Customer-perceived worthand ability to sell
Figure 2.Customer’s point ofdifference
IJQRM21,4
428
A. Deterministic modelTo begin our explanation of how we seek to measure quality we start with adeterministic approach that will subsequently be changed into a probabilistic one. Ourexperimentation starts with the properties of a product:
Q ¼ fq1; q2; q3; . . .; qn; . . .; qN }; ð1Þ
where:
qn = nth property of product;
N = number of properties considered.
Equation (1) shows quality as set of all properties and here we allow for a greaternumber of properties than are shown in the influence diagram. A product’s propertiesare the result of control factors within:
qn ¼ {x1; x2; x3; . . .; xn; . . .; xN }; ð2Þ
where:
x = customer recognition of feature or function;
xn = ith control factor;
N = number of control factor;
xi min , xi , xi max
= the performance range of x.
A single property (q) within a product is the realization of phenomena that existbetween upper (xi_max) and lower boundaries (xi_min). These phenomena are anaggregation of relationships between other variables (v) that can be positive ornegative. These other relationships are caused by variables such as ambienttemperature, pressure, reliability, and are termed “moderating attributes” and
Figure 3.The quality value model
Qualityrevolution
429
modeled as v in the influence diagram in such a way that another boundary set isestablished:
xi ¼ v1; v2; v3; . . .; vn; . . .; vN }; ð3Þ
where:
vn = nth moderating attribute;
N = number of moderating factor;
Vi unfav, Vi , Vi fav
= the range of effect caused by moderating variables.
Given some attributes are qualitative and others such as weight are in different unitswe need to translate the attributes into a common format (Woodhead and McCuish,2003). By positioning statements that correspond to percentiles makes this easilyachieved. From equations (1)-(3) we can derive a quality target function that hasmathematically represented relationship, which we want to achieve as:
Q� ¼ Opt ðX ;V Þ: ð4Þ
In other words, an optimal quality is achieved when a balance is found for theproperties within the boundaries of control and moderating factors. The value beforeoptimization is used to determine which factors are influential to the performancecharacteristic of interest given not all factors will influence quality. Hence:
X inf ¼ X and V inf # V ; ð5Þ
where:
Xinf = number of influential control factors;
Vinf = number of influential moderating factors.
Then formula (4) may be rewritten to show that we are only interested in influentialcontrol and moderating factors, and this becomes:
Q� ¼ OptðX inf;V infÞ: ð6Þ
The mathematical model for one quality characteristic (i.e. one property) and threeinfluential control factors that leads to a seventh permutation may be written as:
q ¼ fa þ axinf1 þ axinf
2 þ axinf3 þ axinf
1 xinf2
þ axinf1 xinf
3 þ axinf2 xinf
3 þ axinf1 xinf
2 xinf3 }:
ð7Þ
We now move on to consider two potential designs (AB) as shown in Paretto’s area inFigure 4. A and B represent the upper and lower boundaries for hypothetical optimalsolutions that reside on the boundary line between these two points. In this scenario wedefine optimum as the minimization of both q1 and q2 (see point C). Due to our goal hereto maximize quality and minimize cost and we are considering levels to set for twoproperties. In other situations such as if q1 were “design style” and q2 were “designcost” we might seek to maximize q1 and minimize q2. The important point here is that
IJQRM21,4
430
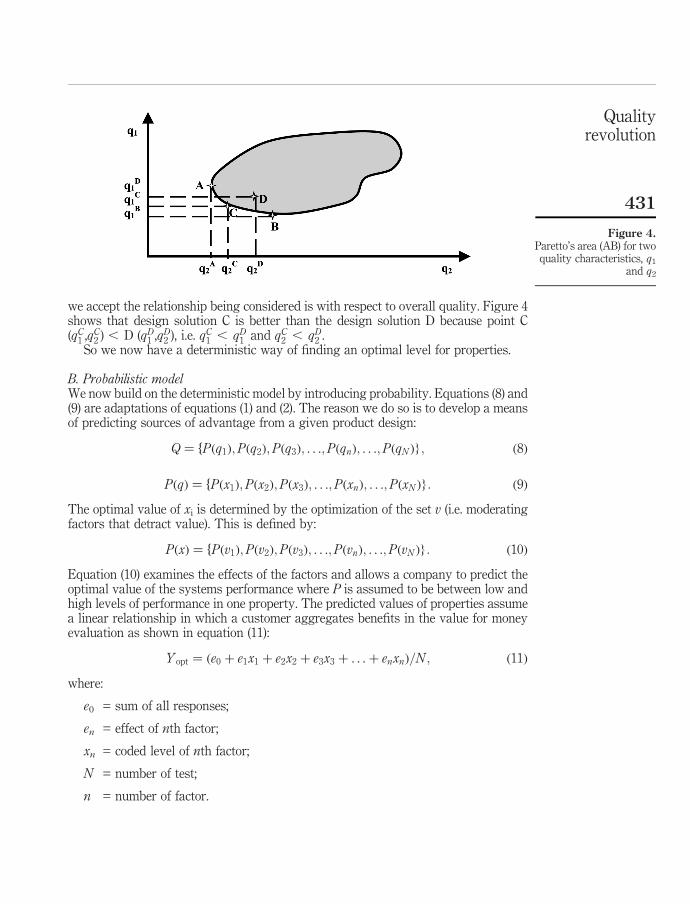
we accept the relationship being considered is with respect to overall quality. Figure 4shows that design solution C is better than the design solution D because point C(qC
1 ,qC2 ) , D (qD
1 ,qD2 ), i.e. qC
1 , qD1 and qC
2 , qD2 .
So we now have a deterministic way of finding an optimal level for properties.
B. Probabilistic modelWe now build on the deterministic model by introducing probability. Equations (8) and(9) are adaptations of equations (1) and (2). The reason we do so is to develop a meansof predicting sources of advantage from a given product design:
Q ¼ fPðq1Þ;Pðq2Þ;Pðq3Þ; . . .;PðqnÞ; . . .;PðqN Þ}; ð8Þ
PðqÞ ¼ fPðx1Þ;Pðx2Þ;Pðx3Þ; . . .;PðxnÞ; . . .;PðxN Þ}: ð9Þ
The optimal value of xi is determined by the optimization of the set v (i.e. moderatingfactors that detract value). This is defined by:
PðxÞ ¼ fPðv1Þ;Pðv2Þ;Pðv3Þ; . . .;PðvnÞ; . . .;PðvN Þ}: ð10Þ
Equation (10) examines the effects of the factors and allows a company to predict theoptimal value of the systems performance where P is assumed to be between low andhigh levels of performance in one property. The predicted values of properties assumea linear relationship in which a customer aggregates benefits in the value for moneyevaluation as shown in equation (11):
Y opt ¼ ðe0 þ e1x1 þ e2x2 þ e3x3 þ . . .þ enxnÞ=N ; ð11Þ
where:
e0 = sum of all responses;
en = effect of nth factor;
xn = coded level of nth factor;
N = number of test;
n = number of factor.
Figure 4.Paretto’s area (AB) for twoquality characteristics, q1
and q2
Qualityrevolution
431
From equation (11) we can calculate the change in the response value with equation(12) by:
Xn new ¼ ½r 2 ðrþ þ r2Þ=2�=½ðrþ 2 r2Þ=2�; ð12Þ
where:
Xn_new
= new nth factor coded level;
r = new level factor natural value;
r+ = new high level factor value;
r2 = new low level factor value.
The above equations will shortly be demonstrated through a case study.Implementation. Specifications and parameters were identified as having most
effect on the quality and performance of a product. If the number of the factors is two tothree, four tests are required. If the number of the factors is four to seven, eight tests arerequired. If the number of the factors is eight to 15, 16 tests are required, and so on. Thenumber of tests required is thus twice the lowest number of factors being considered.Furthermore, this paper describes a business performance evaluation model anddiscusses how quality value model (QVM) can be used to define the best use ofresources to meet the overall business strategy and deal with change and uncertaintywithin the venture. Tables I and II use three input factors, namely, material costs (f1),man-hours (f2), and number of sub-contractors (f3). We can utilize the intelligence andknowledge based on past experience and experiment as input factors in QVM. Theresult aims to achieve higher quality, profit and reduce schedule. The mathematicaltechnique in QVM calculates for any input factor changes within the project. Thisenables companies to respond more quickly because of better ability to predict changeand manage decision uncertainty.
Test f1 f2 f3 Response
12(a)
2(b)
+(c) m
2+(d)
2(e)
2(f) n
32(g)
+(h)
2(i) o
4+(j)
+(k)
+(l) p
Table I.The calculation ofresponse
Factors Minimum/low level (2 ) Maximum/high level (+)
Cost material 10 million 40 millionMan hours (schedule) 50 days 300 daysNumber of sub-contractors 5 sub-contractors 20 sub-contractors
Table II.Input factors
IJQRM21,4
432
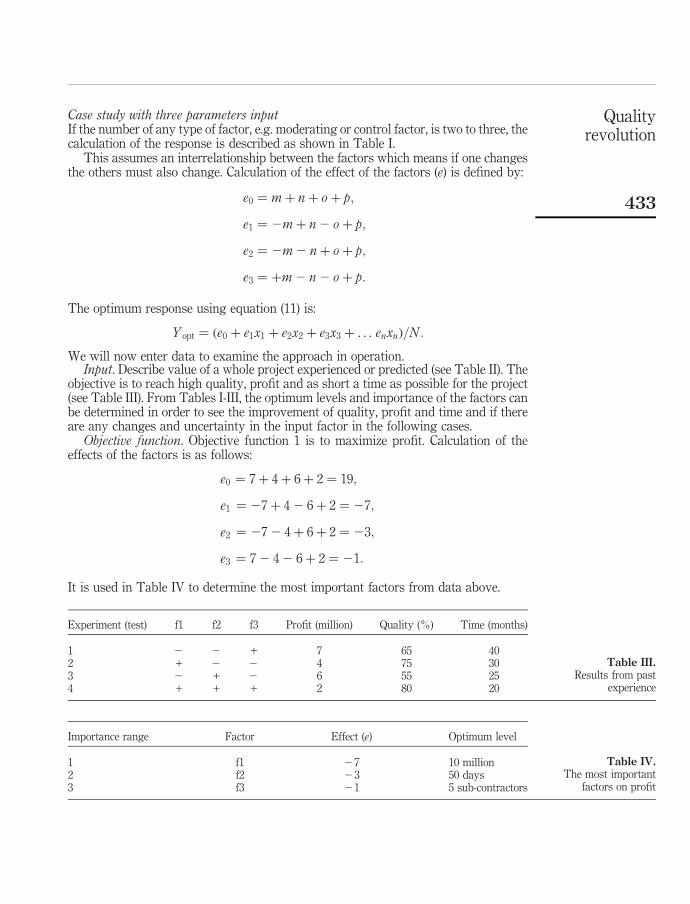
Case study with three parameters inputIf the number of any type of factor, e.g. moderating or control factor, is two to three, thecalculation of the response is described as shown in Table I.
This assumes an interrelationship between the factors which means if one changesthe others must also change. Calculation of the effect of the factors (e) is defined by:
e0 ¼ m þ n þ o þ p;
e1 ¼ 2m þ n 2 o þ p;
e2 ¼ 2m 2 n þ o þ p;
e3 ¼ þm 2 n 2 o þ p:
The optimum response using equation (11) is:
Y opt ¼ ðe0 þ e1x1 þ e2x2 þ e3x3 þ . . . enxnÞ=N :
We will now enter data to examine the approach in operation.Input. Describe value of a whole project experienced or predicted (see Table II). The
objective is to reach high quality, profit and as short a time as possible for the project(see Table III). From Tables I-III, the optimum levels and importance of the factors canbe determined in order to see the improvement of quality, profit and time and if thereare any changes and uncertainty in the input factor in the following cases.
Objective function. Objective function 1 is to maximize profit. Calculation of theeffects of the factors is as follows:
e0 ¼ 7 þ 4 þ 6 þ 2 ¼ 19;
e1 ¼ 27 þ 4 2 6 þ 2 ¼ 27;
e2 ¼ 27 2 4 þ 6 þ 2 ¼ 23;
e3 ¼ 7 2 4 2 6 þ 2 ¼ 21:
It is used in Table IV to determine the most important factors from data above.
Experiment (test) f1 f2 f3 Profit (million) Quality (%) Time (months)
1 2 2 + 7 65 402 + 2 2 4 75 303 2 + 2 6 55 254 + + + 2 80 20
Table III.Results from past
experience
Importance range Factor Effect (e) Optimum level
1 f1 27 10 million2 f2 23 50 days3 f3 21 5 sub-contractors
Table IV.The most important
factors on profit
Qualityrevolution
433
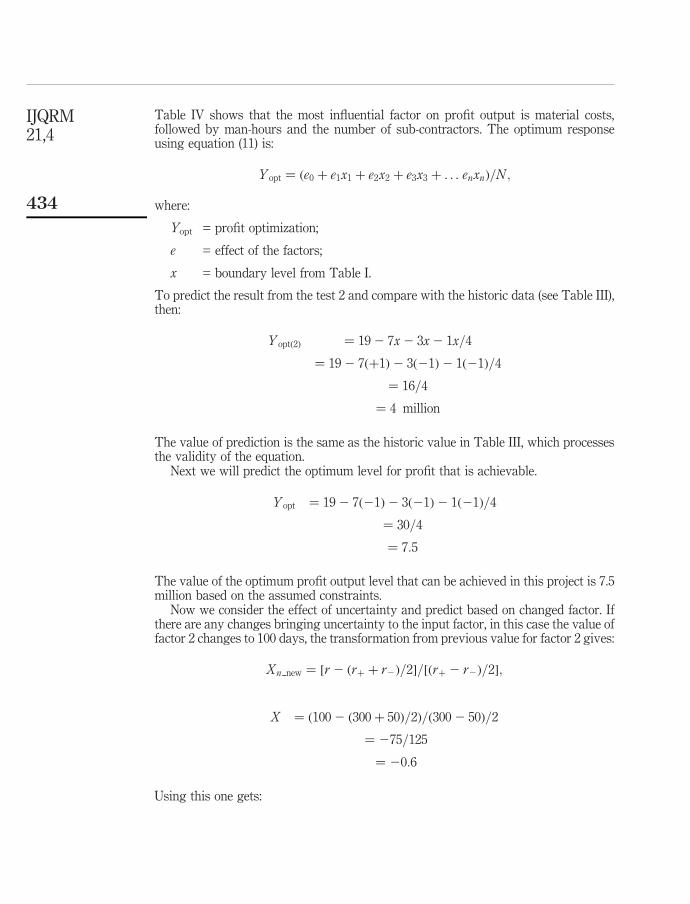
Table IV shows that the most influential factor on profit output is material costs,followed by man-hours and the number of sub-contractors. The optimum responseusing equation (11) is:
Y opt ¼ ðe0 þ e1x1 þ e2x2 þ e3x3 þ . . . enxnÞ=N ;
where:
Yopt = profit optimization;
e = effect of the factors;
x = boundary level from Table I.
To predict the result from the test 2 and compare with the historic data (see Table III),then:
Y optð2Þ ¼ 19 2 7x 2 3x 2 1x=4
¼ 19 2 7ðþ1Þ2 3ð21Þ2 1ð21Þ=4
¼ 16=4
¼ 4 million
The value of prediction is the same as the historic value in Table III, which processesthe validity of the equation.
Next we will predict the optimum level for profit that is achievable.
Y opt ¼ 19 2 7ð21Þ2 3ð21Þ2 1ð21Þ=4
¼ 30=4
¼ 7:5
The value of the optimum profit output level that can be achieved in this project is 7.5million based on the assumed constraints.
Now we consider the effect of uncertainty and predict based on changed factor. Ifthere are any changes bringing uncertainty to the input factor, in this case the value offactor 2 changes to 100 days, the transformation from previous value for factor 2 gives:
Xn new ¼ ½r 2 ðrþ þ r2Þ=2�=½ðrþ 2 r2Þ=2�;
X ¼ ð100 2 ð300 þ 50Þ=2Þ=ð300 2 50Þ=2
¼ 275=125
¼ 20:6
Using this one gets:
IJQRM21,4
434
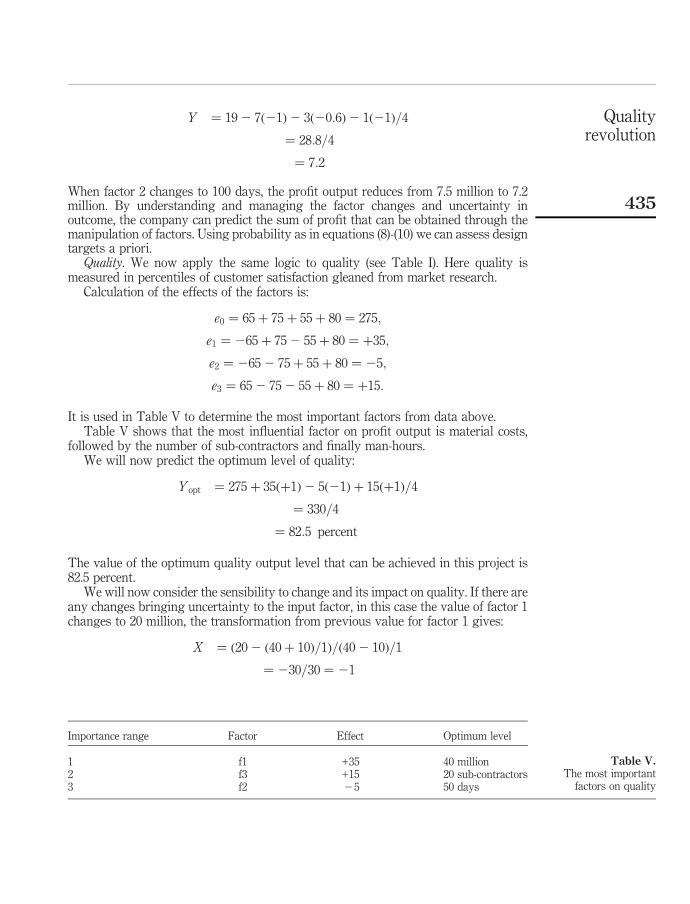
Y ¼ 19 2 7ð21Þ2 3ð20:6Þ2 1ð21Þ=4
¼ 28:8=4
¼ 7:2
When factor 2 changes to 100 days, the profit output reduces from 7.5 million to 7.2million. By understanding and managing the factor changes and uncertainty inoutcome, the company can predict the sum of profit that can be obtained through themanipulation of factors. Using probability as in equations (8)-(10) we can assess designtargets a priori.
Quality. We now apply the same logic to quality (see Table I). Here quality ismeasured in percentiles of customer satisfaction gleaned from market research.
Calculation of the effects of the factors is:
e0 ¼ 65 þ 75 þ 55 þ 80 ¼ 275;
e1 ¼ 265 þ 75 2 55 þ 80 ¼ þ35;
e2 ¼ 265 2 75 þ 55 þ 80 ¼ 25;
e3 ¼ 65 2 75 2 55 þ 80 ¼ þ15:
It is used in Table V to determine the most important factors from data above.Table V shows that the most influential factor on profit output is material costs,
followed by the number of sub-contractors and finally man-hours.We will now predict the optimum level of quality:
Y opt ¼ 275 þ 35ðþ1Þ2 5ð21Þ þ 15ðþ1Þ=4
¼ 330=4
¼ 82:5 percent
The value of the optimum quality output level that can be achieved in this project is82.5 percent.
We will now consider the sensibility to change and its impact on quality. If there areany changes bringing uncertainty to the input factor, in this case the value of factor 1changes to 20 million, the transformation from previous value for factor 1 gives:
X ¼ ð20 2 ð40 þ 10Þ=1Þ=ð40 2 10Þ=1
¼ 230=30 ¼ 21
Importance range Factor Effect Optimum level
1 f1 +35 40 million2 f3 +15 20 sub-contractors3 f2 25 50 days
Table V.The most important
factors on quality
Qualityrevolution
435
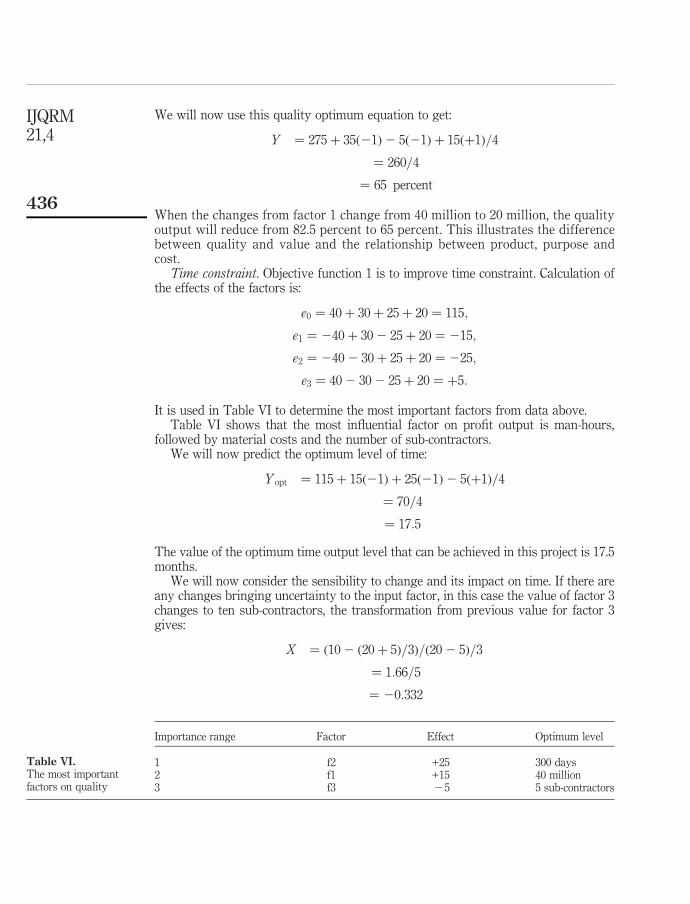
We will now use this quality optimum equation to get:
Y ¼ 275 þ 35ð21Þ2 5ð21Þ þ 15ðþ1Þ=4
¼ 260=4
¼ 65 percent
When the changes from factor 1 change from 40 million to 20 million, the qualityoutput will reduce from 82.5 percent to 65 percent. This illustrates the differencebetween quality and value and the relationship between product, purpose andcost.
Time constraint. Objective function 1 is to improve time constraint. Calculation ofthe effects of the factors is:
e0 ¼ 40 þ 30 þ 25 þ 20 ¼ 115;
e1 ¼ 240 þ 30 2 25 þ 20 ¼ 215;
e2 ¼ 240 2 30 þ 25 þ 20 ¼ 225;
e3 ¼ 40 2 30 2 25 þ 20 ¼ þ5:
It is used in Table VI to determine the most important factors from data above.Table VI shows that the most influential factor on profit output is man-hours,
followed by material costs and the number of sub-contractors.We will now predict the optimum level of time:
Y opt ¼ 115 þ 15ð21Þ þ 25ð21Þ2 5ðþ1Þ=4
¼ 70=4
¼ 17:5
The value of the optimum time output level that can be achieved in this project is 17.5months.
We will now consider the sensibility to change and its impact on time. If there areany changes bringing uncertainty to the input factor, in this case the value of factor 3changes to ten sub-contractors, the transformation from previous value for factor 3gives:
X ¼ ð10 2 ð20 þ 5Þ=3Þ=ð20 2 5Þ=3
¼ 1:66=5
¼ 20:332
Importance range Factor Effect Optimum level
1 f2 +25 300 days2 f1 +15 40 million3 f3 25 5 sub-contractors
Table VI.The most importantfactors on quality
IJQRM21,4
436
We will now use this time optimum equation to get:
Y ¼ 115 þ 15ð21Þ þ 25ð21Þ2 5ðþ0:332Þ=4
¼ 73:35=4
¼ 18:33
When the changes from factor 3 change from 20 sub-contractors to ten sub-contractors,the time schedule output will change to 18.33 months.
ConclusionThe QVM in this paper is offered as a means to help a company to face theglobalization and one world community. QVM produces a synergy between technologyand behavioral issues and human innovation that is necessary to compete and survivein the challenging global marketplace of the new world. The optimization of intangibleassets, such as in-house knowledge are the “why” and “how” the company makesprogress towards high quality. The basic idea for a mathematical approach to anoptimal design is to increase all of the product’s strength factors and at the same timeminimize all its weaknesses. Furthermore, the mathematical technique in QVM alsocalculates for any input factor changes within the project. This enables companies tobe more responsive and predictable in respect to change and the management ofdecision uncertainty. Once having set up the model it becomes a routine simplexprocess to establish the optimal levels in individual qualities to maximize the quality.Therefore, the concept of QVM has arisen to ensure that companies can plan theirquality improvement, anticipate their rivals’ development plan and finally developcompetitive advantage by better knowledge management.
References
Abbott, L. (1955), Quality and Competition, Columbia University Press, New York, NY.
Abdul-Rahman, H. and Berawi, M.A. (2001), Developing Knowledge Management for ConstructionContract Management, Prolog Association of Japan, Tokyo, pp. 358-78.
Abdul-Rahman, H. and Berawi, M.A. (2002), “Managing change in construction contracting”,Contract Management, Vol. 42, pp. 10-16.
Berawi, M.A. (2002a), “Developing a knowledge system”, Proceedings of the 20th Annual Associationof Management and International Association of Management (AoM/IAoM) Conference,Canada.
Berawi, M.A. (2002b), “A new system for quality management in globalization – towardsinnovation and competitive advantages”, paper presented at the 3rd InternationalConference on Decision Making in Urban and Civil Engineering, London.
Bhatt, G. (2000), “Organizing knowledge in the knowledge development cycle”, Journal ofKnowledge Management, Vol. 4 No. 1, pp. 15-26.
Broh, R.A. (1982), Managing Quality for Higher Profits, McGraw-Hill, New York, NY.
Crosby, P.B. (1979), Quality Is Free, New American Library, New York, NY.
Deming, W.E. (1982), Quality, Productivity and Competitive Position, MIT/CAES, Boston, MA.
Garvin, D.A. (1998), Managing Quality: The Strategic and Competitive Edge, The Free Press, NewYork, NY.
Qualityrevolution
437

Ilyas, T., Tamjis, M.R. and Berawi, M.A. (2001), Optimizer, Applied Science Fair, Kuala Lumpur.
Ishikawa, K. (1985), What Is Total Quality Control?, (Lu, D.J. (trans.)), Prentice-Hall, EnglewoodCliffs, NJ.
Juran, J.M. (1974), Quality Control Handbook, McGraw-Hill, New York, NY.
Malhotra, Y. (Ed.) (2001), Knowledge Management and Business Model Innovation, Idea GroupPublishing, Hershey, PA.
Nonaka, I. and Takeuchi, H. (1995), The Knowledge-Creating Company. How Japanese CompaniesCreate the Dynamics of Innovation, The Oxford University Press, New York, NY.
Pirsig, R.M. (1974), Zen and the Art of Motor-cycle Maintenance, Bantam Books, New York, NY.
Woodhead, R.M. and Downs, C.G. (2001), Value Management: Improving Capabilities, ThomasTelford Ltd, London.
Woodhead, R. and McCuish, J. (2003), Achieving Results: How to Create Value, Thomas TelfordLtd, London.
IJQRM21,4
438