Embed Size (px)
Citation preview
Private Equity and Executive CompensationRobert J. Jackson, Jr.
AbstrACt
After the financial crisis, Congress directed regulators to enact new rules on CEO pay at public companies. The rules would address the possibility that directors of public companies put managers’ interests ahead of shareholders’ when setting executive pay. Yet little is known about how CEOs are paid in companies whose directors have undivided loyalty to shareholders. These directors can be found in companies owned by private equity firms—the savvy investors long renowned for their ability to maximize shareholder value.
This Article presents the first study of how CEO pay in companies owned by private equity firms differs from CEO pay in public companies. The study finds that directors appointed by private equity firms tie CEO pay much more closely to performance by preventing CEOs from selling, or “unloading,” their holdings of the company’s stock. My findings suggest that public company boards should also limit unloading to strengthen the CEO pay-performance link. Furthermore, regulators should require public companies to disclose CEO stock holdings prominently. Both current law and post-crisis rulemaking emphasize transparency in pay levels rather than incentives, a focus that perversely encourages directors to weaken the relationship between CEO pay and performance.
Author
Robert J. Jackson, Jr. is Associate Professor of Law and Milton Handler Fellow at Columbia Law School.
I wish to thank Lucian Bebchuk, William Bratton, Andrew Buzin, Steven Davidoff, Allen Ferrell, Jeffrey Gordon, Steven Kaplan, Richard Squire, Randall Thomas, Norman Veasey, and participants in faculty workshops at the UC Berkeley School of Law, Columbia Law School, George Washington University Law School, Harvard Law School, and the University of Pennsylvania Law School, as well as participants at the University of Colorado Law School Junior Business Law Conference, for helpful comments. I also thank the private equity professionals who shared their perspectives with me in confidential interviews, Capital IQ and Dealogic for access to their proprietary databases, and Jonathan Olsen and Chapmann Wong for exceptional research assistance.
uCLA
LAW
rEV
IEW
60 UCLA L. Rev. 638 (2013)
tAbLE of ContEnts
Introduction.............................................................................................................640I. Agency and Executive Pay ............................................................................641
A. Agency Problems in Setting CEO Pay .....................................................643B. Potential Effects of Agency Problems on CEO Pay .................................645
1. Pay Levels .........................................................................................6452. Portfolio Incentives ...........................................................................645
II. Evidence on How Private Equity Investors Pay CEOs ...........................647A. Methodology and Dataset .........................................................................647B. Evidence on Agency and CEO Pay ..........................................................650
1. Pay Levels .........................................................................................6512. Portfolio Incentives ...........................................................................6533. Potential Private Equity Selection Effects........................................6564. Effects of the Exit of the Private Equity Investor ............................657
III. Implications for Public Companies and Policymakers ...........................659A. Bargains Over CEO Incentives .................................................................660
1. Magnitude of Public Company CEO Incentives ............................6612. Contracting for CEO Incentives ......................................................662
B. Regulation of CEO Incentives ..................................................................6631. Existing Disclosure Rules .................................................................6642. Post-Crisis Rulemaking ...................................................................6653. Disclosing Portfolio Incentives .........................................................666
Conclusion ................................................................................................................668Appendix A. Data ......................................................................................................668
A. Dataset Assembly ......................................................................................6691. Companies Owned by Private Equity Firms ...................................6692. Companies Targeted by Private Equity Firms .................................670
B. Constructed Variables ................................................................................6711. CEO Pay Levels ...............................................................................6712. Portfolio Incentives ...........................................................................6713. Company Characteristics .................................................................672
Appendix B. Analysis ................................................................................................673A. CEO Pay Levels ........................................................................................673B. CEO Portfolio Incentives ..........................................................................674C. Private Equity Selection Effects ................................................................675D. Private Equity Ownership and CEO Portfolio Incentives .......................676
639
640 60 UCLA L. REV. 638 (2013)
INTRODUCTION
Congress’s response to the recent financial crisis, the Dodd-Frank Act, mandates new rules on CEO pay at public companies.1 Like other observers, Congress was concerned that public company directors favor managers’ interests
over those of shareholders when setting CEO pay. While public company direc-tors owe their legal duties to shareholders, they often owe their positions on the
board to the CEO. A great deal of study has been dedicated to whether these di-rectors’ divided loyalties cause them to favor CEOs over shareholders in pay ne-gotiations. No previous study has considered, however, how directors with
undivided fidelity to shareholders pay CEOs. Such directors can be found in com-panies owned by private equity firms—savvy investors long known for their abil-ity to maximize shareholder value.
To test how divided director loyalties affect executive compensation, this
Article presents the first study of CEO pay in companies owned by private equity
firms. The evidence shows that private equity investors tie CEO pay much more
closely to performance than do the boards of directors of otherwise similar public
companies. This finding has important implications for the increasingly vociferous de-
bates over CEO pay. Because, over the past two decades, public company CEOs
have received most of their pay in the form of stock rather than cash, some ob-servers have argued that their pay is adequately linked to performance. But public
company boards allow CEOs to unload (that is, to sell) their stock holdings. The
data presented here suggest that private equity firms strictly prohibit such unload-ing. As a result, the pay–performance link is much weaker in public companies
than in companies owned by private equity investors. Borrowing from their pri-vate equity counterparts, public company boards seeking to strengthen the link be-tween pay and performance should restrict CEOs’ freedom to unload.
These findings also offer lessons for regulators now charged with writing new
rules on public company CEO pay. For one thing, existing executive pay disclo-sure rules, which provide investors with extensive information on CEO pay levels
but little information on CEO stock holdings, may perversely encourage public
company directors to weaken the pay–performance link. For another, regulators
1. See, e.g., Dodd-Frank Wall Street Reform and Consumer Protection Act, Pub. L. No. 111-203, §§ 951–956, 124 Stat. 1899–1906 (2010) (codified at 12 U.S.C. § 5641 (Supp. V 2011) &
15 U.S.C. §§ 78j-3, 78j-4, 78l, 78n-1 (Supp. V 2011)) (requiring most public companies to, among other things, provide shareholders with a nonbinding vote on executive compensation and
disclose new details on top executives’ pay).
Private Equity and Executive Compensation 641
should be wary of the impact of the new rules on CEO pay that Congress has now
mandated under Dodd-Frank, which could exacerbate these effects. Regulators
should respond by ensuring that new rules on executive pay are accompanied by a
requirement that public companies also prominently disclose CEO stock holdings. The Article proceeds as follows. Part I explains how the divided loyalties of
public company directors can affect CEO pay. Part II tests the impact of these di-vided loyalties by presenting data on CEO pay in companies owned by private eq-uity firms and contrasting it with evidence from comparable public companies. Part III discusses the implications of this study’s findings for current policy debates
over the regulation of CEO pay at public companies. The Article concludes by
briefly describing the broader corporate-governance lessons that might be learned
from closer study of companies owned by private equity investors.
I. AGENCY AND EXECUTIVE PAY
Although the official duty of the board of directors is to advance the interests
of shareholders,2 in practice the interests of shareholders and directors frequent-ly diverge. This is especially true in public companies without a controlling
shareholder. In these companies, directors generally own very small amounts of the firm’s equity, and so do not internalize most of the costs of corporate de-cisionmaking. Meanwhile, managers exercise a great deal of influence over
whether directors retain their positions on the board. And most public company
shareholders own too small an interest in the firm to make monitoring of directors
worthwhile. Hence there is an agency problem: Director-agents may have incen-tives to favor the interests of management over the interests of their shareholder-principals.3
This problem is particularly acute when directors bargain with the CEO to
set her compensation. Directors have reason to favor the CEO in these negoti-ations, and the CEO can benefit personally when directors stray from the bargain
that is in the shareholders’ best interest. Extensive previous work has been dedi-cated to the question whether public company directors frequently favor the in-terests of CEOs when bargaining over executive pay. But no previous study has
examined the agency problem by comparing the CEO pay deals struck by directors
with potentially divided loyalties, such as those in public companies, to those
2. See, e.g., Aronson v. Lewis, 473 A.2d 805, 811 (Del. 1984) (citing DEL. CODE ANN. tit. 8, § 141(a) (1983)).
3. For the seminal articulation of the agency problem caused by the separation of ownership from
control in public corporations, see ADOLF A. BERLE, JR. & GARDINER C. MEANS, THE
MODERN CORPORATION AND PRIVATE PROPERTY (1932).
642 60 UCLA L. REV. 638 (2013)
struck by directors who have undivided incentives to advance the interests of shareholders.4
Private equity firms, which own and operate trillions of dollars’ worth of American businesses, provide one basis for such a comparison.5 Financial econ-omists have long recognized that the governance structure employed in compa-nies owned by private equity investors reduces the agency costs associated with the
public corporation.6 In particular, the directors of these companies are appointed
by the private equity firms themselves, and these directors hold substantial equity
stakes in the company.7 They are therefore much less likely to be subject to the
agency problem that may affect bargains struck by directors at public companies. Considerable work has been dedicated to understanding the agency-cost related
benefits of private equity ownership,8 and even more study has been dedicated to
the effects of agency costs on executive pay in public companies.9 Nevertheless, because companies owned by private equity firms are generally not required to
disclose executive pay, almost nothing is known about how directors at these
companies pay CEOs.
4. Some attention has been given to executive pay at firms in bankruptcy, a situation in which creditors have bargaining influence that may counteract managers’ boardroom influence. Empirical results are mixed. Compare M. Todd Henderson, Paying CEOs in Bankruptcy: Executive Compensation When
Agency Costs Are Low, 101 NW. U. L. REV. 1543, 1618 (2007), with Lynn M. LoPucki & William C. Whitford, Corporate Governance in the Bankruptcy Reorganization of Large, Publicly Held Companies, 141 U. PA. L. REV. 669, 711 (1993).
5. Private equity firms acquired some $1.6 trillion worth of American businesses from 2005 through
June 2007 alone. See, e.g., Steven N. Kaplan & Per Strömberg, Leveraged Buyouts and Private Equity, J. ECON. PERSP., Winter 2009, at 121, 126 fig.2, 127–28. Although the pace of private equity acqui-sitions slowed in 2008 and 2009 as a result of reduced access to debt after the financial crisis, more
recently funds have flowed into private equity firms at record rates, leaving little doubt that the role of private equity investors in American corporate governance will continue to grow in the coming years. See, e.g., Vincent Ryan, More Money Flows Into Private Equity, CFO MAG., Sept. 15, 2011, http:// www3.cfo.com/article/2011/9/capital-markets_more-money-flows-into-private-equity (reporting
that private equity funds raised $142 billion during the first half of 2011). 6. See Michael C. Jensen, The Eclipse of the Public Corporation, HARV. BUS. REV., Sept.–Oct. 1989, at 61. 7. For a helpful discussion of the typical structure and incentives of the boards of directors of companies
owned by private equity firms, see Ronald W. Masulis & Randall S. Thomas, Does Private Equity
Create Wealth? The Effects of Private Equity and Derivatives on Corporate Governance, 76 U. CHI. L. REV. 219, 224 (2009) (noting that boards of directors at companies owned by private equity firms “are
more effective than public company boards, as ‘even the best part-time independent directors are not the equivalent of full-time, highly-incentivized private equity managers’” (quoting Ronald J. Gilson
& Charles K. Whitehead, Deconstructing Equity: Public Ownership, Agency Costs, and Complete Capital Markets, 108 COLUM. L. REV. 231, 260 (2008))).
8. For an example of empirical work on the effects of private equity ownership, see Steven Kaplan, The Effects of Management Buyouts on Operating Performance and Value, 24 J. FIN. ECON. 217
(1989). 9. See Kevin J. Murphy, Executive Compensation, in 3B HANDBOOK OF LABOR ECONOMICS 2486
(Orley Ashenfelter & David Card eds., 1999) (concluding that growth in the academic articles on
executive pay has generally outpaced the growth in executive pay itself).
Private Equity and Executive Compensation 643
Yet bargains between private equity firms and the CEOs of the companies
they own can tell us a great deal about the consequences of the director agency
problem in public companies. First, these bargains can help us understand wheth-er directors’ divided loyalties lead public companies to pay CEOs more than they
would if directors pursued shareholder interests more vigorously. Second, bargains
over CEO incentives in companies owned by private equity firms can tell us wheth-er agency problems lead directors of public companies to bargain for too weak a link
between CEO pay and performance.
A. Agency Problems in Setting CEO Pay
When bargaining with CEOs over compensation, public company directors
must reconcile the competing interests of shareholders and executives. Wheth-er public company directors favor CEOs over shareholders in determining the
amount and kind of the CEO’s pay has been the subject of considerable scholar-ly debate.
Two major schools of thought have emerged. The “optimal contracting”
view contends that market forces are sufficient to induce directors to pursue the
deal that is best for shareholders.10 Theorists in this school argue that markets in
products, labor, and corporate control discipline directors who stray from that deal.11 While market slack may leave room for occasional departures from the
compensation bargain that is in the best interest of shareholders, generally nego-tiations between CEOs and public company boards will yield the pay package that is in the shareholders’ best interest.12
The alternative, known as the “managerial power” view, holds that mar-ket forces are inadequate to counteract the strong influence that CEOs of public
companies wield over their boards of directors. These scholars emphasize that CEOs influence whether a director is nominated for reelection, and that direc-tors therefore face strong incentives to satisfy the CEO’s demands in order to retain
their seats on the board.13 In addition, public company directors typically own very
10. For a highly influential early work expressing this view, see Frank H. Easterbrook, Managers’ Discretion and Investors’ Welfare: Theories and Evidence, 9 DEL. J. CORP. L. 540 (1984).
11. See, e.g., Eugene F. Fama, Agency Problems and the Theory of the Firm, 88 J. POL. ECON. 288, 291–92
(1980) (arguing that labor markets discipline opportunistic CEO behavior because managers are
aware that such conduct will harm their reputations and therefore decrease the value of their human
capital). 12. See generally John E. Core et al., Executive Equity Compensation and Incentives: A Survey, FRBNY
ECON. POL’Y REV., Apr. 2003, at 27, 28; Andrei Shliefer & Robert W. Vishny, A Survey of Corporate Governance, 52 J. FIN. 737 (1997).
13. See, e.g., Lucian Arye Bebchuk et al., Managerial Power and Rent Extraction in the Design of Executive
Compensation, 69 U. CHI. L. REV. 751, 761–62 (2002); see also LUCIAN BEBCHUK & JESSE
644 60 UCLA L. REV. 638 (2013)
small proportions of the company’s stock, and thus personally bear very few of the
costs of the CEO’s compensation package. Moreover, individual shareholders, who typically hold relatively small stakes in large public companies, lack incentives
to discipline directors who favor the CEO’s interests. For these reasons, the costs to
directors of resisting the CEO’s pay demands are many while the benefits are few. None of the conditions that characterize the managerial power view of public
company directors hold for the directors of companies owned by private equity
firms. Private equity firms are usually contractually entitled to appoint directors to
the board, so they, rather than the CEO, control whether directors retain their
seats.14 Directors appointed by private equity firms, unlike public company direc-tors, own large stakes in their companies.15 And experienced, sophisticated private
equity investors like Henry Kravis, George Roberts, and Ted Forstmann frequently
put themselves on the boards of the companies they own.16 Such directors are
faithful to shareholder interests because they often are the principal shareholders.17
Therefore, companies owned by private equity firms offer a rare opportunity to test the implications of the managerial power hypothesis in an environment in which
agency costs are low. Yet little is known about how these companies pay their CEOs.18 While pre-
vious work has established that private equity owners encourage executives to own
FRIED, PAY WITHOUT PERFORMANCE: THE UNFULFILLED PROMISE OF EXECUTIVE
COMPENSATION (2004); Lucian Arye Bebchuk & Jesse M. Fried, Executive Compensation as an
Agency Problem, J. ECON. PERSP., Summer 2003, at 71, 72–73. Nominees listed on the company’s proxy statement are virtually assured election, and although those nominees are ordinarily chosen by
an independent committee, see Orders Relating to Equity Compensation Plans, 68 Fed. Reg. 39,995
(July 3, 2003), it is well known that the CEO exercises considerable influence over who is listed on
the proxy. See, e.g., JAY W. LORSCH & ELIZABETH MACIVER, PAWNS OR POTENTATES: THE
REALITY OF AMERICA’S CORPORATE BOARDS 20 (1989); Martin Lipton, The Millennium
Bubble and Its Aftermath: Reforming America and Getting Back to Business, M & A LAW., July–Aug. 2003, at 1, 4.
14. These contractual rights are generally contained in shareholder agreements entered into at the time
the private equity firm invests in the company. See Scott D. Miller, Private Equity Shareholder
Arrangements, in FOURTH ANNUAL PRIVATE EQUITY FORUM: LEGAL AND FINANCIAL
STRATEGIES FOR DEALMAKING IN THE CURRENT MARKET 428 (2002); see also, e.g., Digitas, Inc., Registration Statement (Form S-1), at 50 (Dec. 23, 1999) (describing a private equity firm’s right to appoint at least two directors to the company’s board).
15. See, e.g., Masulis & Thomas, supra note 7, at 228 (arguing that companies owned by private equity
firms have “much stronger financial incentives for directors” because private equity firms serve as
“blockholder[s], whose representatives are placed on the board”). 16. See, e.g., Alliance Imaging, Inc., Registration Statement (Form S-1), at 47 (July 2, 2011) (describing
the board membership of Henry Kravis and George Roberts). 17. See, e.g., Masulis & Thomas, supra note 7, at 228. 18. Anecdotal reports in the press have variously concluded that private equity owners pay more, less, or
the same as public companies. Compare Elizabeth MacDonald, Pay Dirt: Who Gets Paid More, Chief Executives at Public or Private Companies?, FORBES, May 21, 2007, at 108 (public companies pay
much more), with Andrew Ross Sorkin & Eric Dash, Private Firms Lure CEOs With Top Pay, N.Y.
Private Equity and Executive Compensation 645
large equity stakes in their companies, almost no attention has been given to the
comparison between CEO pay at companies owned by private equity firms and
public company CEO pay.19
B. Potential Effects of Agency Problems on CEO Pay
The managerial power theory suggests that public company directors stray
from the CEO pay bargain that maximizes shareholder value in two ways. First, they pay CEOs more than is necessary to induce optimal effort. Second, they fail to link enough of that pay to performance.
1. Pay Levels
Perhaps the most familiar refrain in debates over CEO pay is that the CEOs
of public companies are paid too much. This claim has dominated the popular20
and academic21 press as well as debates over the regulation of public company cor-porate governance for decades. Although this literature has grown increasingly
complex, the argument is straightforward: Directors of public companies allow
CEOs to extract excessive levels of compensation from shareholders.22
2. Portfolio Incentives
A more nuanced claim is that public company directors fail to adequately link
CEO pay to performance. Like all risk-averse individuals, CEOs prefer pay that is
TIMES, Jan. 8, 2007, at A4 (public companies pay far less), and Joseph E. Bachelder III, Executive
Compensation: Public Versus Private-Equity-Controlled Companies, N.Y. L.J., May 30, 2008, at 3
(public companies and companies owned by private equity pay the same). 19. Previous work has established, for example, that managerial ownership in the company’s stock
generally increases in connection with certain private equity transactions. See Kaplan & Strömberg, supra note 5, at 131. A contemporaneous working paper also compares CEO pay and incentives in
companies owned by private equity firms and public companies. See Phillip Leslie & Paul Oyer, Managerial Incentives and Value Creation: Evidence From Private Equity (Stanford Graduate Sch. of Bus., Working Paper, 2009), available at http://faculty-gsb.stanford.edu/oyer/wp/pe.pdf.
20. See, e.g., Albert R. Hunt, Letter From Washington: As U.S. Rich–Poor Gap Grows, So Does Public Outcry, N.Y. TIMES, Feb. 18, 2007, http://www.nytimes.com/2007/02/18/world/americas/18iht-letter.
4637416.html (“Inflated CEO pay . . . is fueling [a] populist backlash . . . .”). 21. See, e.g., Michael Faulkender et al., Executive Compensation: An Overview of Research on Corporate
Practices and Proposed Reforms, J. APPLIED CORP. FIN., Winter 2010, at 107, 110 (describing the
“intense and ongoing debate among academics” over whether CEO pay in public companies is
excessive). 22. See, e.g., Bebchuk et al., supra note 13, at 789 (arguing that CEOs can extract additional amounts of
excessive pay by receiving pay in forms that are “camouflaged,” or hidden from shareholder and
public view).
646 60 UCLA L. REV. 638 (2013)
fixed and certain in amount.23 But CEOs may be better motivated to maximize
shareholder value if they receive pay that fluctuates with the company’s value.24
Managerial power theorists argue that public company boards favor the interests
of CEOs over those of investors in part by permitting CEOs to extract fixed pay-ments rather than payments based on the company’s value.25
One way to link CEO pay to shareholder value is to give the CEO bonuses
that vary based on the CEO’s performance. But financial economists have long
argued that these bonus payments do not adequately link the CEO’s pay to the val-ue of the company. Instead, economists generally measure the strength of the re-lationship between CEO pay and shareholder value through the CEO’s holdings
of company stock, or her “portfolio incentives.”26 For many years, the majority of CEO compensation at public companies has
in fact been paid in equity.27 Thus, many have argued that public company CEOs
now have sufficient stock ownership in the companies they run to align their pay
with their company’s performance.28 But because CEOs are risk-averse, we can
expect that they will respond to receiving stock-based pay by unloading their stock
holdings if they are permitted to do so. Thus, the extent to which CEO pay is
linked to the company’s performance depends not only on the amount of stock
CEOs are paid, but also on how much of that stock they retain. Because portfolio
23. In this Article, I follow the broader literature on executive compensation and assume that CEOs are risk-averse. See, e.g., Core et al., supra note 12, at 27. The premises underlying this assumption are
hotly disputed, see, e.g., Victor P. Goldberg, Aversion to Risk Aversion in the New Institutional Economics, 146 J. INSTITUTIONAL & THEORETICAL ECON. 216, 216 (1990), but for purposes of this Article I assume that CEOs are risk-averse and therefore prefer fixed compensation to pay that varies in tandem with the value of the firm.
24. For the classic work on this point, see Steven Shavell, Risk Sharing and Incentives in the Principal and
Agent Relationship, 10 BELL J. ECON. 55 (1979). See also Michael C. Jensen & William H. Meckling, Theory of the Firm: Managerial Behavior, Agency Costs and Ownership Structure, 3 J. FIN. ECON. 305, 308–10 (1976).
25. See, e.g., Bebchuk et al., supra note 13, at 813–27 (arguing that directors use particular types of compensation to convey fixed value to executives rather than to link pay to performance).
26. For the seminal work arguing in favor of these measures, see Michael C. Jensen & Kevin J. Murphy, Performance Pay and Top-Management Incentives, 98 J. POL. ECON. 225, 251, 232 (1990) (concluding
that “annual executive bonuses are not highly variable” with performance and arguing that CEO
portfolio incentives provide a superior proxy for the relationship between the CEO’s wealth and the
value of the company). 27. See, e.g., David I. Walker, Evolving Executive Equity Compensation and the Limits of Optimal
Contracting, 64 VAND. L. REV. 611 (2011). 28. See, e.g., John E. Core et al., Is U.S. CEO Compensation Inefficient Pay Without Performance?, 103
MICH. L. REV. 1142, 1172 (2005).
Private Equity and Executive Compensation 647
incentives reflect the CEO’s holdings of company stock after accounting for the ef-fects of unloading, they offer the most meaningful measure of the link between
CEO pay and performance. In public companies, CEOs may use their influence over directors to obtain
the contractual freedom to unload their companies’ stock. To the extent, then, that the divided loyalties of public company directors lead them to favor CEOs in
pay negotiations, we would expect to see differences between CEO portfolio incen-tives at public companies and at companies owned by private equity firms.
II. EVIDENCE ON HOW PRIVATE EQUITY INVESTORS PAY CEOS
As we have seen, CEO pay in companies owned by private equity firms can
tell us a great deal about public company directors’ bargains over CEO pay. Does
managerial influence cause public company directors to overpay CEOs, or un-dercut the creation of a strong link between pay and performance? This Part pre-sents the first empirical study of those questions.
The evidence suggests that the agency problem in public companies affects
not the amount of CEO pay, but rather the strength of CEOs’ portfolio incen-tives. CEO pay at companies owned by private equity investors is linked much
more closely to performance than CEO pay at public companies.
A. Methodology and Dataset
Private equity firms have attracted considerable attention from both financial economists and legal scholars. And CEO pay in companies owned by private eq-uity firms can provide critical insights into longstanding debates over public com-pany corporate governance. But, for two reasons, almost nothing is known about how private equity investors pay the CEOs of the companies they own. First, companies owned by private equity firms usually do not have publicly traded secu-rities, and therefore are not required to disclose what they pay their CEOs. Second, the databases generally used for comprehensive empirical studies on executive pay
are limited to large public companies. Private equity firms, however, often take the companies they own public
through initial public offerings of stock (IPOs). At the time of the IPO, the
company must file a registration statement with the Securities and Exchange
Commission (SEC) providing detailed information on executive pay prior to the
offering. Furthermore, as long as the company remains public, it must file pub-licly available annual proxy statements describing the CEO’s pay. By drawing on
648 60 UCLA L. REV. 638 (2013)
these filings, this Article provides the first systematic study of how private equity
firms pay the CEOs of the companies they own.29 I gathered data on CEO pay at 108 companies that were owned by a private
equity firm and completed an IPO between 2000 and 2004. I compared these da-ta to information on CEO pay in a group of comparable public companies that were not owned by a private equity firm.30 Table 1 summarizes key characteristics
of the companies and CEOs in each group.
29. For more detail on the assembly of the dataset, see infra Appendix A, text accompanying notes 82–97. The companies that engage in an IPO represent only a small fraction of the companies owned by
private equity firms, and are often among the most successful companies they own. See, e.g., Kaplan
& Strömberg, supra note 5, at 129 tbl.2 (finding that, in a sample of more than 17,000 companies owned by private equity between 1970 and 2007, less than 15 percent were the subject of an IPO). Thus, it is possible that CEO pay and portfolio incentives at these companies are not representative
of pay practices in companies owned by private equity firms more generally. In interviews, however, private equity and executive compensation professionals indicated that CEO pay at the companies that completed an IPO was unlikely to be significantly different from pay in companies owned by
private equity firms more generally. Contracts governing CEO pay arrangements at these companies are negotiated consistently across the private equity investor’s portfolio of companies—and these
bargains are struck long before the CEO, the company, or the private equity investor is able to antic-ipate whether the company will eventually be one of the few in the portfolio that will be the subject of an IPO.
Separately, if private equity owners and executives are able to anticipate when an IPO will be com-pleted, executive compensation practices in these firms may change as the IPO approaches. This would make data on CEO compensation from filings in the year before the company’s IPO less
representative of pay practices at companies owned by private equity investors more generally. Private
equity professionals that I asked about this possibility responded, however, that it is difficult to antic-ipate with precision when an IPO will be completed. That response is consistent with the securities-filing activity of the companies owned by private equity firms studied here. Many of these firms repeatedly filed amended registration statements in continued anticipation of a completed
offering. 30. To ensure that the comparison group of public companies included only firms that were also close to
the IPO stage, I removed from the comparison sample all firm years in which a firm was more than
seven years from its IPO as well as all firms for which information on the date of the IPO was not available. In addition, in the multivariate regressions described in the Appendices, I separately control for the number of years since a firm’s public offering. See infra Appendix A, text accompanying
notes 85–86.
Private Equity and Executive Compensation 649
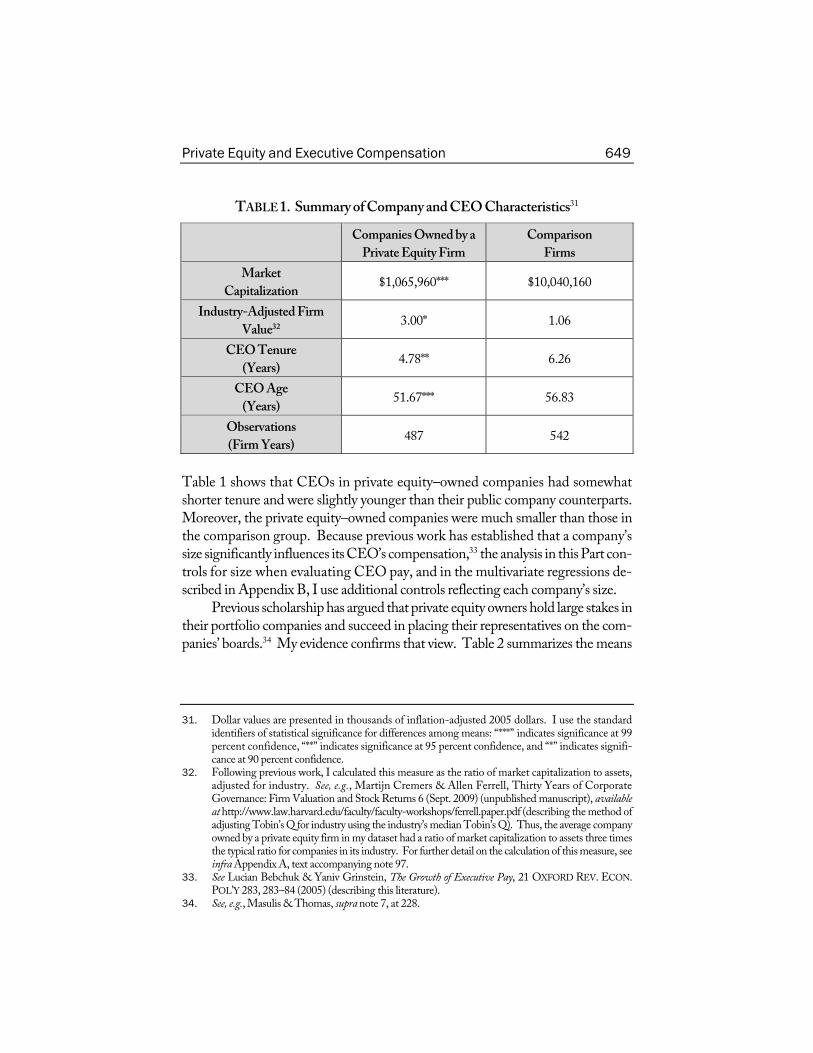
TABLE 1. Summary of Company and CEO Characteristics31
Companies Owned by a
Private Equity Firm
Comparison
Firms
Market
Capitalization $1,065,960*** $10,040,160
Industry-Adjusted Firm
Value32 3.00* 1.06
CEO Tenure
(Years) 4.78** 6.26
CEO Age
(Years) 51.67*** 56.83
Observations
(Firm Years) 487 542
Table 1 shows that CEOs in private equity–owned companies had somewhat shorter tenure and were slightly younger than their public company counterparts. Moreover, the private equity–owned companies were much smaller than those in
the comparison group. Because previous work has established that a company’s
size significantly influences its CEO’s compensation,33 the analysis in this Part con-trols for size when evaluating CEO pay, and in the multivariate regressions de-scribed in Appendix B, I use additional controls reflecting each company’s size.
Previous scholarship has argued that private equity owners hold large stakes in
their portfolio companies and succeed in placing their representatives on the com-panies’ boards.34 My evidence confirms that view. Table 2 summarizes the means
31. Dollar values are presented in thousands of inflation-adjusted 2005 dollars. I use the standard
identifiers of statistical significance for differences among means: “***” indicates significance at 99
percent confidence, “**” indicates significance at 95 percent confidence, and “*” indicates signifi-cance at 90 percent confidence.
32. Following previous work, I calculated this measure as the ratio of market capitalization to assets, adjusted for industry. See, e.g., Martijn Cremers & Allen Ferrell, Thirty Years of Corporate
Governance: Firm Valuation and Stock Returns 6 (Sept. 2009) (unpublished manuscript), available
at http://www.law.harvard.edu/faculty/faculty-workshops/ferrell.paper.pdf (describing the method of adjusting Tobin’s Q for industry using the industry’s median Tobin’s Q). Thus, the average company
owned by a private equity firm in my dataset had a ratio of market capitalization to assets three times the typical ratio for companies in its industry. For further detail on the calculation of this measure, see
infra Appendix A, text accompanying note 97. 33. See Lucian Bebchuk & Yaniv Grinstein, The Growth of Executive Pay, 21 OXFORD REV. ECON.
POL’Y 283, 283–84 (2005) (describing this literature). 34. See, e.g., Masulis & Thomas, supra note 7, at 228.
650 60 UCLA L. REV. 638 (2013)
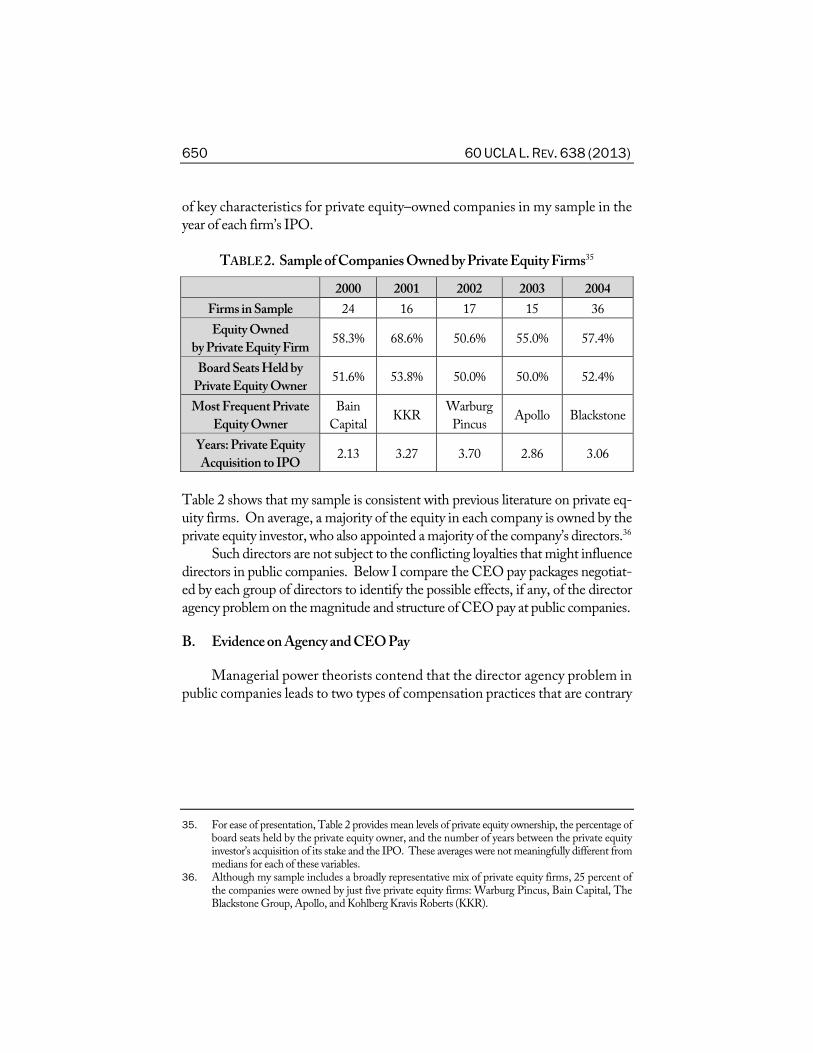
of key characteristics for private equity–owned companies in my sample in the
year of each firm’s IPO.
TABLE 2. Sample of Companies Owned by Private Equity Firms35
2000 2001 2002 2003 2004
Firms in Sample 24 16 17 15 36
Equity Owned
by Private Equity Firm 58.3% 68.6% 50.6% 55.0% 57.4%
Board Seats Held by
Private Equity Owner 51.6% 53.8% 50.0% 50.0% 52.4%
Most Frequent Private
Equity Owner
Bain
CapitalKKR
Warburg
PincusApollo Blackstone
Years: Private Equity
Acquisition to IPO 2.13 3.27 3.70 2.86 3.06
Table 2 shows that my sample is consistent with previous literature on private eq-uity firms. On average, a majority of the equity in each company is owned by the
private equity investor, who also appointed a majority of the company’s directors.36 Such directors are not subject to the conflicting loyalties that might influence
directors in public companies. Below I compare the CEO pay packages negotiat-ed by each group of directors to identify the possible effects, if any, of the director agency problem on the magnitude and structure of CEO pay at public companies.
B. Evidence on Agency and CEO Pay
Managerial power theorists contend that the director agency problem in
public companies leads to two types of compensation practices that are contrary
35. For ease of presentation, Table 2 provides mean levels of private equity ownership, the percentage of board seats held by the private equity owner, and the number of years between the private equity
investor’s acquisition of its stake and the IPO. These averages were not meaningfully different from
medians for each of these variables. 36. Although my sample includes a broadly representative mix of private equity firms, 25 percent of
the companies were owned by just five private equity firms: Warburg Pincus, Bain Capital, The
Blackstone Group, Apollo, and Kohlberg Kravis Roberts (KKR).
Private Equity and Executive Compensation 651
to shareholder interests. First, public company directors pay CEOs more than is in
shareholders’ interests. Second, these directors fail to create a strong link between
CEO pay and performance. The evidence from private equity supports the second
claim—but not the first.
1. Pay Levels
Do the hard-bargaining directors appointed by private equity investors pay
their CEOs more or less than directors at comparable public companies? Anecdo-tal reports have suggested both.37 My evidence suggests that the more likely an-swer is neither.
Previous work has measured the level of CEO pay in two ways. First, we can
approximate the amount of pay the CEO receives in cash by measuring the sum of the salary and bonus received by the CEO. Second, we can estimate the amount of total compensation the CEO receives by adding to the sum of salary and bo-nus any other compensation received by the CEO, including the value of stock-based pay.38
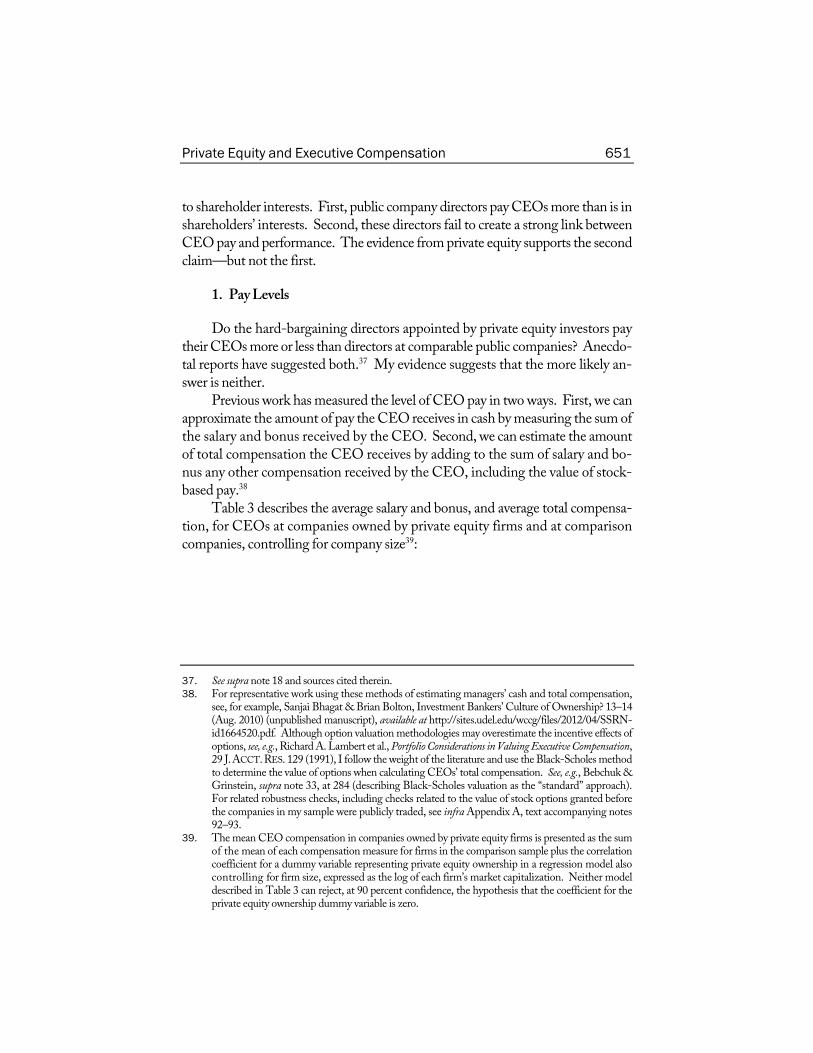
Table 3 describes the average salary and bonus, and average total compensa-tion, for CEOs at companies owned by private equity firms and at comparison
companies, controlling for company size39:
37. See supra note 18 and sources cited therein. 38. For representative work using these methods of estimating managers’ cash and total compensation,
see, for example, Sanjai Bhagat & Brian Bolton, Investment Bankers’ Culture of Ownership? 13–14
(Aug. 2010) (unpublished manuscript), available at http://sites.udel.edu/wccg/files/2012/04/SSRN-id1664520.pdf. Although option valuation methodologies may overestimate the incentive effects of options, see, e.g., Richard A. Lambert et al., Portfolio Considerations in Valuing Executive Compensation, 29 J. ACCT. RES. 129 (1991), I follow the weight of the literature and use the Black-Scholes method
to determine the value of options when calculating CEOs’ total compensation. See, e.g., Bebchuk &
Grinstein, supra note 33, at 284 (describing Black-Scholes valuation as the “standard” approach). For related robustness checks, including checks related to the value of stock options granted before
the companies in my sample were publicly traded, see infra Appendix A, text accompanying notes
92–93. 39. The mean CEO compensation in companies owned by private equity firms is presented as the sum
of the mean of each compensation measure for firms in the comparison sample plus the correlation
coefficient for a dummy variable representing private equity ownership in a regression model also
controlling for firm size, expressed as the log of each firm’s market capitalization. Neither model described in Table 3 can reject, at 90 percent confidence, the hypothesis that the coefficient for the
private equity ownership dummy variable is zero.
652 60 UCLA L. REV. 638 (2013)
TABLE 3. CEO Pay in Companies Owned by Private Equity Firms
Companies Owned
by Private Equity
Firms
Comparison
Companies
Annual Salary
and Bonus $1,860,899 $1,789,166
Total Annual
Compensation $8,440,587 $9,280,719
The level of CEO pay in companies owned by private equity firms is statistically
indistinguishable40 from the level of pay in comparison firms.41 The evidence does
not support the view that managerial power causes directors to overpay executives. For several reasons, however, the possibility that divided director incentives
lead to excessive CEO pay in public companies should not be ruled out. For one
thing, companies owned by private equity firms compete with public companies in
the market for CEO talent. Because companies owned by private equity investors
represent only a small fraction of the companies in the economy, we would expect these firms to have relatively little power in this market. Thus, even if principal–agent conflict causes public company boards to overpay CEOs, market forces may
give companies owned by private equity investors little choice but to pay compa-rable amounts. Moreover, as I explain below, companies owned by private equity
firms link CEO pay far more closely to performance than comparable public com-panies. By persuading CEOs to accept similar pay levels and riskier pay packages, companies owned by private equity firms may effectively pay CEOs less than com-parable public companies.42 Nevertheless, overall the evidence from private equity
offers little direct support for the view that managerial influence leads to excessive
CEO pay in public companies.43
40. More extensive multivariate analysis is set forth in Appendix B. Results from those models, which
control for a variety of differences among firms and CEOs in the sample, are consistent with those
presented in Table 3. See infra Appendix B, Table 7 & text accompanying note 99. 41. It is possible that CEOs of companies owned by private equity firms face a systematically higher
likelihood that they will be dismissed than public company CEOs, and thus expect to receive
higher pay to compensate them for this additional risk. See, e.g., Viral V. Acharya et al., Private
Equity: Boom and Bust?, J. APP. CORP. FIN., Fall 2007, at 1. For details on additional robustness
checks I conducted to control for this possibility in multivariate regression analyses, see infra Appendix
B, note 98. 42. Notably, however, even controlling for differences in the CEO’s pay–performance link, I observe no
statistically meaningful differences in CEO pay levels. See infra Appendix B, Table 7 & note 99. 43. See infra Table 4 and accompanying text. Public company CEOs may also receive additional pay in
forms not subject to disclosure, and thus not captured by my dataset, in connection with directors’
Private Equity and Executive Compensation 653
2. Portfolio Incentives
Managerial power theorists also argue that the divided loyalties of public
company directors cause them to tie CEO pay too weakly to performance. Stud-ying CEO pay in companies owned by private equity firms permits us to test that claim.
Financial economists have developed two metrics for the portfolio incentives
that best capture the link between a CEO’s pay and her company’s performance. Both metrics reflect the effect of a given change in the value of the company on
the value of the stock and stock options held by the CEO. The first metric is the
“dollar-on-dollar” measure, which indicates how much a $1,000 change in firm
value would cause the value of the stock and stock options owned by the CEO to
change.44 This metric is useful in evaluating CEO incentives in making marginal decisions, such as whether to consume corporate perquisites. A CEO with $1 in
dollar-on-dollar incentives, for example, can consume $1,000 in perquisites at a
private cost of $1. The second metric, known as the “equity returns” proxy,45 in-dicates the change in the value of the CEO’s stock and stock options caused by a 1
percent change in the firm’s value.46 This metric is useful for evaluating CEO in-centives in making large-scale decisions that are likely to significantly affect returns
to shareholders.47
efforts to camouflage CEO pay levels—a proposition for which there is some evidence. See Lucian
Bebchuk & Robert J. Jackson, Jr., Executive Pensions, 30 J. CORP. L. 823, 845 (2005). The CEOs of companies owned by private equity investors may be less likely to receive pay in those forms, because
directors of these companies do not have to disclose their executive compensation decisions and thus have no reason to camouflage pay levels.
44. For early work describing and analyzing this metric in a sample of large public companies, see Jensen
& Murphy, supra note 26, at 226. 45. See Brian J. Hall & Jeffrey B. Liebman, Are CEOs Really Paid Like Bureaucrats?, 113 Q.J. ECON. 653,
671–72 (1998). Both measures require calculation of the delta of the CEO’s stock options—that is, the change in the value of a stock option based on a given change in the company’s stock price. The
value of delta depends on the exercise price and duration of each stock option held by the CEO. For further detail, see infra Appendix A, text accompanying notes 94–95.
46. These metrics are more precise than simply measuring the number of shares the CEO owns, which
excludes the effects of stock options from analysis of the CEO’s incentives. Calculating each mea-sure is straightforward. The dollar-on-dollar measure is the CEO’s percentage of the total shares
outstanding plus the percentage of outstanding shares the CEO can acquire through options
(weighted by option delta), multiplied by $1,000. The equity-returns measure is the stock price
divided by 100, multiplied by the number of shares and options held; the latter figure is again
weighted by option delta. 47. Because a CEO’s exposure to changes in firm value is limited by his wealth, we expect the two metrics
to have opposite relationships to firm size. As the firm grows, the CEO is able to own a smaller per-centage of its outstanding shares. Since the dollar-on-dollar metric depends on the CEO’s percentage
ownership of total shares, we would expect the dollar-on-dollar measure to fall as firm size increases. Since the equity-returns measure depends on the absolute value of shares and options held by the
654 60 UCLA L. REV. 638 (2013)
Previous study of these metrics, relying exclusively on analysis of large public
companies, has yielded mixed results. Some have contended that CEO portfolio
incentives are too low.48 More recent work, on the other hand, has argued that CEOs have portfolio incentives that are already “quite large,” concluding that man-agerial influence is unlikely to affect CEO portfolio incentives.49 No previous
work, however, has evaluated whether CEO incentives in public companies differ
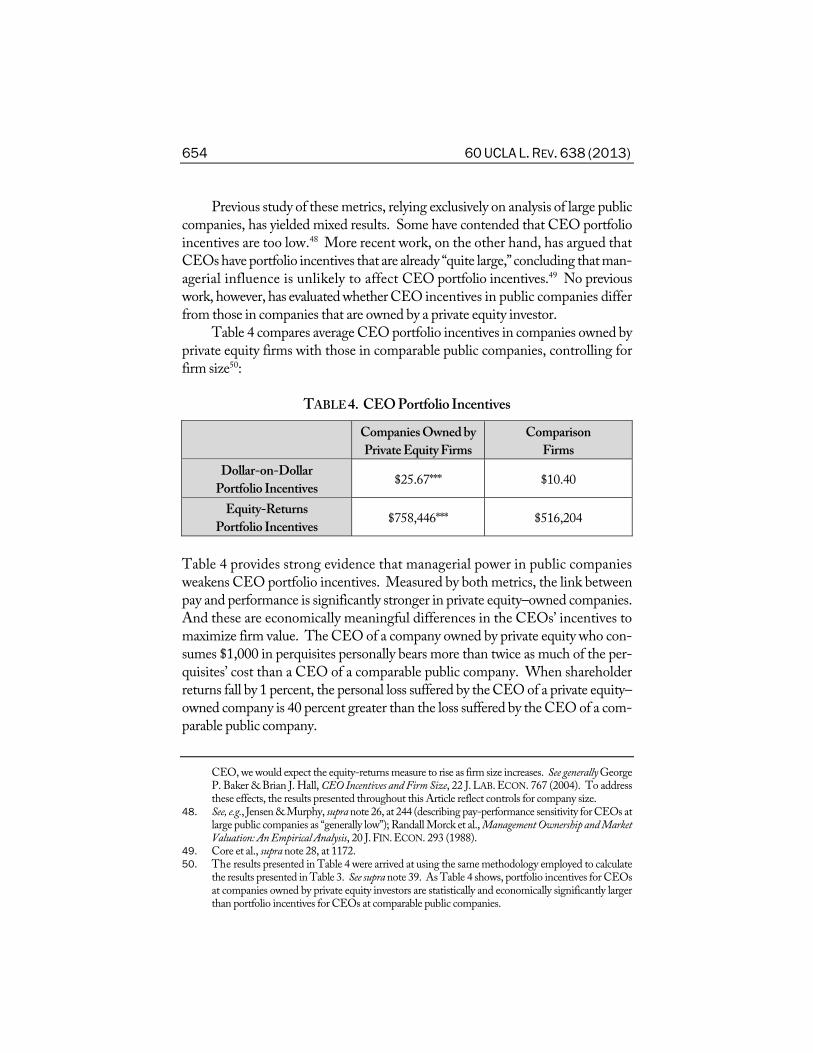
from those in companies that are owned by a private equity investor. Table 4 compares average CEO portfolio incentives in companies owned by
private equity firms with those in comparable public companies, controlling for
firm size50:
TABLE 4. CEO Portfolio Incentives
Companies Owned by
Private Equity Firms
Comparison
Firms
Dollar-on-Dollar
Portfolio Incentives $25.67*** $10.40
Equity-Returns
Portfolio Incentives $758,446*** $516,204
Table 4 provides strong evidence that managerial power in public companies
weakens CEO portfolio incentives. Measured by both metrics, the link between
pay and performance is significantly stronger in private equity–owned companies. And these are economically meaningful differences in the CEOs’ incentives to
maximize firm value. The CEO of a company owned by private equity who con-sumes $1,000 in perquisites personally bears more than twice as much of the per-quisites’ cost than a CEO of a comparable public company. When shareholder
returns fall by 1 percent, the personal loss suffered by the CEO of a private equity–owned company is 40 percent greater than the loss suffered by the CEO of a com-parable public company.
CEO, we would expect the equity-returns measure to rise as firm size increases. See generally George
P. Baker & Brian J. Hall, CEO Incentives and Firm Size, 22 J. LAB. ECON. 767 (2004). To address these effects, the results presented throughout this Article reflect controls for company size.
48. See, e.g., Jensen & Murphy, supra note 26, at 244 (describing pay-performance sensitivity for CEOs at large public companies as “generally low”); Randall Morck et al., Management Ownership and Market Valuation: An Empirical Analysis, 20 J. FIN. ECON. 293 (1988).
49. Core et al., supra note 28, at 1172. 50. The results presented in Table 4 were arrived at using the same methodology employed to calculate
the results presented in Table 3. See supra note 39. As Table 4 shows, portfolio incentives for CEOs at companies owned by private equity investors are statistically and economically significantly larger than portfolio incentives for CEOs at comparable public companies.
Private Equity and Executive Compensation 655
These results provide strong support for the view that managerial power
in public companies weakens the link between CEO pay and performance. In
Appendix B, I subject the findings in Table 4 to controls for several potential al-ternative explanations.51 Those models confirm that CEO portfolio incentives are
significantly higher in companies owned by private equity firms than incentives in
comparable public companies. The evidence, then, suggests that the differences
in CEO incentives observed here are attributable, at least in part, to the director
agency problem in public companies. These results are especially striking when combined with those in Table 3,
which showed that the total amount of CEO pay (including the value of stock and stock options so granted to the CEO) is statistically indistinguishable be-tween the two types of companies.52 This suggests that the stronger portfolio
incentives that we see in private equity–owned companies are not the result of larger stock and option grants at those companies. Rather, the incentives are
stronger because of what happens after the CEO receives stock and options: Pri-vate equity firms restrict CEOs’ freedom to unload the equity they receive as
compensation.53 By contrast, public company directors have long allowed CEOs
to unload their stock-based pay—a practice that has drawn criticism from man-agerial-power theorists.54 After accounting for the effects of unloading, CEO
incentives are much stronger in companies owned by private equity than in pub-lic companies.
51. These include, for example, the illiquidity of the CEO’s stock holdings when companies are not publicly traded and the leverage usually associated with private equity ownership. The models in
Appendix B control for these effects. For example, the models contain a proxy for the potential effects of the illiquidity of CEO stock holdings through a dummy variable signifying any year in which the
firm was private. The results of those models are consistent with those presented in Table 4. See infra
Appendix B & Table 8. 52. In unreported analysis, I tested whether CEOs in the two types of companies receive similar levels of
stock-based compensation—that is, pay in the form of grants of stock and stock options. The
levels of stock-based compensation for CEOs in companies owned by private equity and comparable
public companies are statistically indistinguishable—suggesting, as indicated in the text, that stronger incentives in private equity–owned firms are not the result of larger stock and option grants but instead reflect the CEO’s freedom to unload.
53. See, e.g., DEALLAWYERS, WEBCAST: COMPENSATION ARRANGEMENTS FOR PRIVATE
EQUITY DEALS 4 (Oct. 31, 2007) (on file with author) (summarizing private equity firms’ approach
to CEO unloading as follows: “[The CEO] get[s] out when we get out.”). 54. See Bebchuk et al., supra note 13, at 825 (“[F]irms take surprisingly few steps to prevent or regulate the
[unloading] of the incentives provided by the grant of options and restricted stock.”).
656 60 UCLA L. REV. 638 (2013)
3. Potential Private Equity Selection Effects
CEOs at companies owned by private equity firms have a far stronger pay–performance link than CEOs at comparable public companies. One possible
reason for this result is that the directors appointed by private equity firms drive a
harder bargain on the pay–performance link than directors at public companies. Another possibility, however, is that private equity firms simply choose to invest in
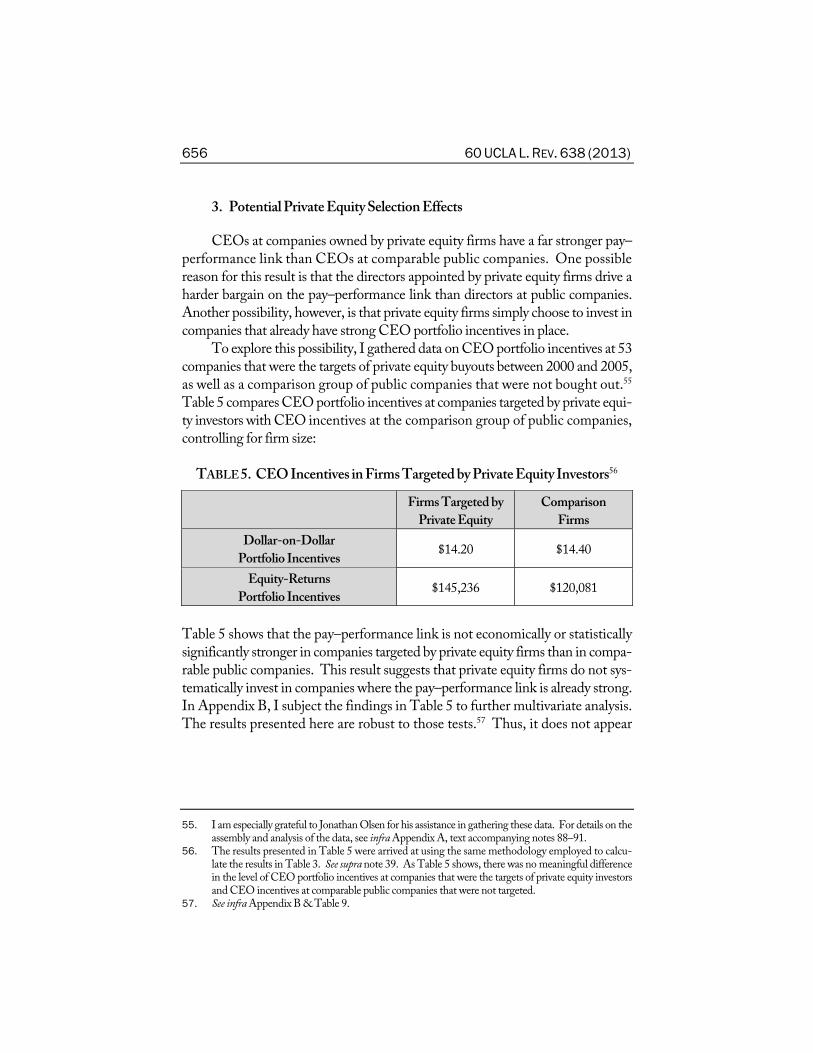
companies that already have strong CEO portfolio incentives in place. To explore this possibility, I gathered data on CEO portfolio incentives at 53
companies that were the targets of private equity buyouts between 2000 and 2005, as well as a comparison group of public companies that were not bought out.55
Table 5 compares CEO portfolio incentives at companies targeted by private equi-ty investors with CEO incentives at the comparison group of public companies, controlling for firm size:
TABLE 5. CEO Incentives in Firms Targeted by Private Equity Investors56
Firms Targeted by
Private Equity
Comparison
Firms
Dollar-on-Dollar
Portfolio Incentives$14.20 $14.40
Equity-Returns
Portfolio Incentives$145,236 $120,081
Table 5 shows that the pay–performance link is not economically or statistically
significantly stronger in companies targeted by private equity firms than in compa-rable public companies. This result suggests that private equity firms do not sys-tematically invest in companies where the pay–performance link is already strong. In Appendix B, I subject the findings in Table 5 to further multivariate analysis. The results presented here are robust to those tests.57 Thus, it does not appear
55. I am especially grateful to Jonathan Olsen for his assistance in gathering these data. For details on the
assembly and analysis of the data, see infra Appendix A, text accompanying notes 88–91. 56. The results presented in Table 5 were arrived at using the same methodology employed to calcu-
late the results in Table 3. See supra note 39. As Table 5 shows, there was no meaningful difference
in the level of CEO portfolio incentives at companies that were the targets of private equity investors and CEO incentives at comparable public companies that were not targeted.
57. See infra Appendix B & Table 9.
Private Equity and Executive Compensation 657
that private equity firms’ selection of the companies they buy fully explains the sig-nificantly stronger CEO portfolio incentives that we see in the companies that they own.
4. Effects of the Exit of the Private Equity Investor
The evidence shows that CEOs in companies owned by private equity firms
have far stronger portfolio incentives than their public company counterparts. One
explanation for this result is that managerial influence over public company boards
of directors weakens the pay–performance link. Analyzing preliminary results
from the study presented in this Article, however, one commentator has suggested
an alternative explanation for why companies owned by private equity firms have
stronger CEO portfolio incentives: Perhaps the CEOs chosen by private equity
firms prefer more risk, and thus are more willing to accept pay packages that tie
their wealth more closely to the value of their companies.58 Which explanation is
more likely to account for the large differences in CEO portfolio incentives identi-fied in this Article?
One way to approach that question is to ask whether CEO portfolio incen-tives change as a private equity investor sells its stake in a company and its repre-sentatives leave the board. If CEO risk tolerance, rather than the presence of the
private equity firm’s representatives on the board, explains the stronger portfolio
incentives we see in companies owned by private equity investors, the exit of the
private equity investor should have no effect on those incentives. But if private eq-uity investors’ board representatives force CEOs to accept stronger portfolio in-centives, then those incentives should weaken as the private equity firm exits.
I begin with a summary of the exit behavior of private equity firms in my
sample. Figure 1 shows the average stake held by private equity firms at the time of the IPO and in the years following the offering:
58. Professor David Walker provided a preliminary assessment of the evidence presented in this Article
in recently published work. See David I. Walker, Executive Pay Lessons From Private Equity, 91 B.U. L. REV. 1209, 1219 (2011).
658 60 UCLA L. REV. 638 (2013)
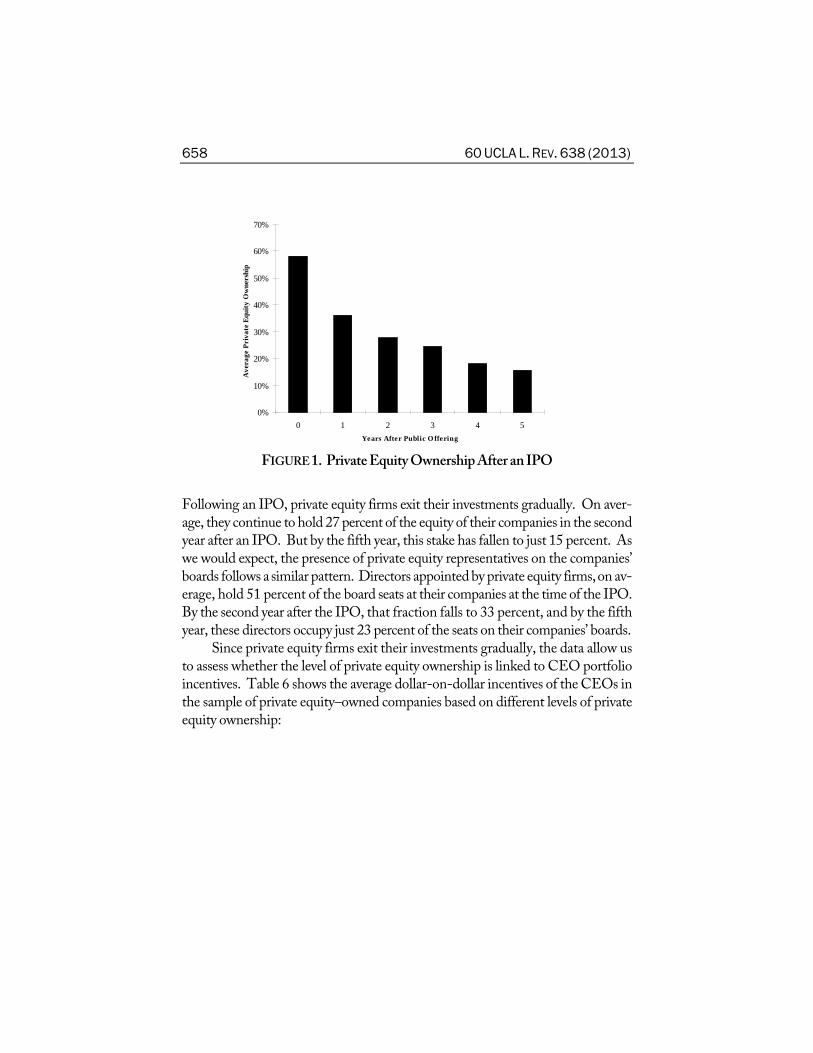
FIGURE 1. Private Equity Ownership After an IPO
Following an IPO, private equity firms exit their investments gradually. On aver-age, they continue to hold 27 percent of the equity of their companies in the second
year after an IPO. But by the fifth year, this stake has fallen to just 15 percent. As
we would expect, the presence of private equity representatives on the companies’ boards follows a similar pattern. Directors appointed by private equity firms, on av-erage, hold 51 percent of the board seats at their companies at the time of the IPO. By the second year after the IPO, that fraction falls to 33 percent, and by the fifth
year, these directors occupy just 23 percent of the seats on their companies’ boards. Since private equity firms exit their investments gradually, the data allow us
to assess whether the level of private equity ownership is linked to CEO portfolio
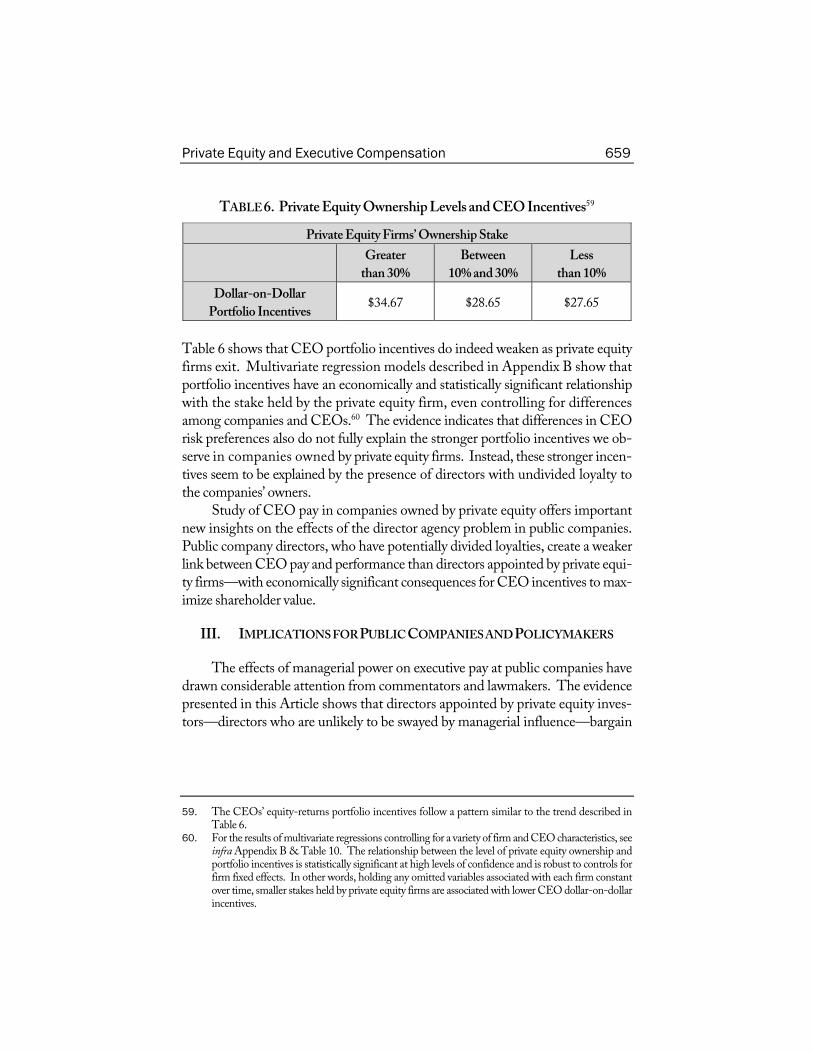
incentives. Table 6 shows the average dollar-on-dollar incentives of the CEOs in
the sample of private equity–owned companies based on different levels of private
equity ownership:
0%
10%
20%
30%
40%
50%
60%
70%
0 1 2 3 4 5Years After Public O ffering
Ave
rage
Pri
vate
Equ
ity O
wne
rshi
p
Private Equity and Executive Compensation 659
TABLE 6. Private Equity Ownership Levels and CEO Incentives59
Private Equity Firms’ Ownership Stake
Greater
than 30%
Between
10% and 30%
Less
than 10%
Dollar-on-Dollar
Portfolio Incentives $34.67 $28.65 $27.65
Table 6 shows that CEO portfolio incentives do indeed weaken as private equity
firms exit. Multivariate regression models described in Appendix B show that portfolio incentives have an economically and statistically significant relationship
with the stake held by the private equity firm, even controlling for differences
among companies and CEOs.60 The evidence indicates that differences in CEO
risk preferences also do not fully explain the stronger portfolio incentives we ob-serve in companies owned by private equity firms. Instead, these stronger incen-tives seem to be explained by the presence of directors with undivided loyalty to
the companies’ owners. Study of CEO pay in companies owned by private equity offers important
new insights on the effects of the director agency problem in public companies. Public company directors, who have potentially divided loyalties, create a weaker
link between CEO pay and performance than directors appointed by private equi-ty firms—with economically significant consequences for CEO incentives to max-imize shareholder value.
III. IMPLICATIONS FOR PUBLIC COMPANIES AND POLICYMAKERS
The effects of managerial power on executive pay at public companies have
drawn considerable attention from commentators and lawmakers. The evidence
presented in this Article shows that directors appointed by private equity inves-tors—directors who are unlikely to be swayed by managerial influence—bargain
59. The CEOs’ equity-returns portfolio incentives follow a pattern similar to the trend described in
Table 6. 60. For the results of multivariate regressions controlling for a variety of firm and CEO characteristics, see
infra Appendix B & Table 10. The relationship between the level of private equity ownership and
portfolio incentives is statistically significant at high levels of confidence and is robust to controls for firm fixed effects. In other words, holding any omitted variables associated with each firm constant over time, smaller stakes held by private equity firms are associated with lower CEO dollar-on-dollar incentives.
660 60 UCLA L. REV. 638 (2013)
for a far stronger link between CEO pay and performance than their public com-pany counterparts.
This Part discusses two implications of these findings for current debates on
CEO pay at public companies. First, although public company boards have been
paying CEOs in stock for decades, CEOs at companies owned by private equity
firms—where directors restrict CEOs’ freedom to unload—have far stronger
portfolio incentives. Drawing on the lessons from private equity, public company
directors who seek to align CEO pay more closely with performance should pur-sue contractual arrangements that limit CEOs’ freedom to unload company stock.
Second, to encourage directors to insist upon such arrangements, regulators
should mandate that public companies disclose CEO portfolio incentives. Current rules require clear, salient disclosure of pay levels but not portfolio incentives, giving
directors little reason to bargain for stronger portfolio incentives—and perhaps
even encouraging directors to weaken them. Moreover, after the recent financial crisis, Congress directed regulators to enact new rules on executive compensation
at public companies. But these rules will not provide investors with information
on portfolio incentives, exacerbating the law’s current emphasis on pay levels. Regulators should respond by mandating that all public companies provide clear, salient disclosure of the portfolio incentives that have long been the focus of pri-vate equity firms’ bargains over CEO pay.61
A. Bargains Over CEO Incentives
Because public company CEOs have long received the bulk of their pay in
stock, many have argued that CEO incentives at public companies are now ap-proaching the optimal bargain for shareholders. The evidence presented in this
Article, however, shows that directors with undivided loyalty to shareholders
bargain for far stronger CEO portfolio incentives than directors at public com-panies.
Public company directors who seek to align CEO pay with performance
should thus insist upon contractual arrangements that would limit their CEO’s
ability to unload the company’s stock. The evidence from private equity offers im-portant lessons for public companies that are now developing these arrangements.
61. Since federal securities regulators have plenary authority to require additional disclosure of this type, no additional statutory authorization will be necessary for rulemakers to provide investors with this information. See, e.g., Securities Exchange Act of 1934, § 14, 15 U.S.C. § 78n(a) (2006) (providing
the SEC with authority to require disclosure “necessary and appropriate in the public interest or for the
protection of investors”).
Private Equity and Executive Compensation 661
1. Magnitude of Public Company CEO Incentives
For more than two decades, public company CEOs have received the bulk of their compensation in the form of stock-based pay.62 The widespread adoption
of these pay practices has led many to argue that CEO pay at public companies is
already adequately linked to performance.63 Yet the evidence presented in this
Article shows that directors with undivided loyalty to shareholders bargain for far stronger CEO portfolio incentives than directors in public companies. These di-rectors, like their public company counterparts, pay CEOs largely in stock.64 Un-like public company directors, however, directors appointed by private equity firms
restrict CEOs’ freedom to unload, and thus tie CEO pay much more closely to
performance. To be sure, the optimal level of CEO portfolio incentives in public companies
is far from clear. Differences between public companies and companies owned by
private equity firms may offer important explanations for some of the differences in
CEO portfolio incentives identified in this Article.65 These differences, howev-er, do not explain why directors in both groups of companies pay CEOs similar
amounts of stock yet obtain far different levels of CEO portfolio incentives. Instead, that outcome is explained by the fact that public company directors give
their CEOs the freedom to unload company stock while the directors with undi-vided loyalty to savvy private equity investors do not.66
62. See, e.g., Walker, supra note 58, at 1225–26 (noting that stock-based pay accounts, on average, for about 50 percent of public company CEO compensation).
63. See, e.g., Core et al., supra note 28, at 1156. Indeed, some have argued that the adoption of these
practices suggests that public company directors have internalized the governance expertise of private
equity firms. See, e.g., Walker, supra note 58, at 1224 (“[P]ublic company executive pay practices have
moved in the direction of private equity portfolio company pay.”); see also Bengt Holmstrom & Steven
N. Kaplan, Corporate Governance and Merger Activity in the United States: Making Sense of the 1980s and
1990s, J. ECON. PERSP., Spring 2001, at 121, 136 (“[M]anagement’s acceptance of the shareholder’s perspective was greatly aided by lucrative stock option plans, which allowed executives to reap big
financial benefits from increased share prices.”). 64. See supra note 52 (noting that CEOs in private equity–owned firms receive similar levels of stock-
based pay as CEOs in comparable public companies). 65. For example, companies owned by private equity firms typically have more leverage than public com-
panies. Cf. Walker, supra note 58, at 1221–22 (concluding that the “observed difference in equity
portfolio [incentives] is directionally consistent with” the fact that companies owned by private eq-uity firms are typically more leveraged than their public company counterparts). I note, however, that the economically and statistically significant differences in portfolio incentives identified in this Article
remain after controlling for several observable differences between the two types of firms, including
differences in capital structure. See supra note 51. 66. It bears noting that the differences in CEO portfolio incentives identified in this Article cannot fully
be explained by the fact that the stock of public companies is traded in highly liquid public markets while the stock of companies owned by private equity firms is not. These differences persist even after
662 60 UCLA L. REV. 638 (2013)
2. Contracting for CEO Incentives
Public company boards seeking to strengthen the link between CEO pay and
performance should thus pursue contractual arrangements that address the CEO’s
portfolio incentives—after accounting for the effects of any unloading. For exam-ple, CEOs could be required by contract to hold a given amount of stock and op-tions in the companies they run.
Indeed, several public companies have already adopted policies requiring
CEOs to own a specified level of company stock.67 For two reasons, however, the
policies currently in use at most of these public companies are unlikely to strength-en CEO portfolio incentives. First, the required level of stock ownership tends to
be very low relative both to the CEO’s compensation and to the firm’s value; most CEOs can sell substantial proportions of the stock they already own within the
limits of the policy.68 Second, many of these policies are purely voluntary; there is
no penalty for CEOs who fall below the required amount of stock ownership.69
The evidence from companies owned by private equity firms suggests that public
company directors should drive a far harder bargain over the CEO’s ownership
of the company’s equity. Instead of voluntary policies, companies seeking to im-prove the pay–performance link should pursue binding contractual agreements
addressing the amount of stock and options the CEO will hold. Like their private
equity counterparts, public company directors concerned about the link between
pay and performance should consider these arrangements central to the CEO pay
bargain—rather than matters adequately addressed by nonbinding statements of policy.
Alternatively, public company boards seeking to align CEO pay and per-formance more closely could impose contractual restrictions on CEOs’ freedom
to unload. Indeed, several well-known public companies have imposed such re-strictions on their top executives. For example, Goldman Sachs now requires its
controlling for the illiquidity of the CEO’s stock holdings when companies are not publicly traded. See supra note 51.
67. For an empirical assessment of public company stock ownership policies, see John E. Core & David
F. Larcker, Performance Consequences of Mandatory Increases in Executive Stock Ownership, 64 J. FIN. ECON. 317, 326 (2002).
68. For example, the Lockheed Martin Corporation has in place stock ownership guidelines that require
its CEO to hold stock equal to $10.8 million in value. See Lockheed Martin Corp., Definitive Proxy
Statement (Schedule 14A), at 51 (Mar. 9, 2012). This figure is less than 15 percent of the $70 million
the CEO earned in total compensation between 2009 and 2011. See id. at 53. The company’s mar-ket capitalization is over $30 billion. See, e.g., Stock Quote of Lockheed Martin Corporation, YAHOO! FINANCE, http://finance.yahoo.com/q?s=LMT (last visited Nov. 18, 2012). Thus, the mandated
level of stock ownership would cause the CEO to internalize just $0.38 of every $1,000 change in the
company’s value. 69. See, e.g., Core & Larcker, supra note 67, at 320.
Private Equity and Executive Compensation 663
CEO to own, until his retirement, at least the number of shares equal to 75 percent of the number of shares he has received in stock-based pay during his tenure.70
While these restrictions will likely strengthen CEO portfolio incentives at these companies, commentators have criticized these restrictions for leaving the
CEO substantial freedom to unload.71 Of course, the exact nature of the optimal restrictions on CEO unloading is far from clear. For present purposes, however, the evidence from private equity allows us to make two preliminary observations. First, although nearly all companies owned by private equity firms meaningfully
restrict the CEO’s freedom to unload, relatively few public companies have adopt-ed such restrictions.72 Second, although companies owned by private equity firms
generally prohibit CEOs from unloading, the few public companies that have
adopted any contractual limits on unloading still permit their CEOs to unload sub-stantial amounts of stock.73
B. Regulation of CEO Incentives
It is unsurprising that most public companies have not adopted contractual arrangements governing CEO portfolio incentives. For one thing, CEOs can use
their influence to persuade directors not to insist on contractual terms that re-quire CEOs to accept riskier pay. For another, because current law does not require
clear, salient disclosure of CEO portfolio incentives, directors have little reason to
worry that low levels of CEO equity ownership will be detected by investors or the
public. Indeed, current law requires public companies to provide extensive disclosure
of CEO pay levels but not incentives, encouraging directors to weaken the pay–performance link. And new rules that Congress has required regulators to develop
in the wake of the financial crisis will likely exacerbate this problem. Regulators
should thus respond by requiring that public companies disclose the bargains over
70. See Robert J. Jackson, Jr., Stock Unloading and Banker Incentives, 112 COLUM. L. REV. 951, 962 n.35
(2012) (describing these restrictions). 71. See Lucian A. Bebchuk & Jesse M. Fried, Paying for Long-Term Performance, 158 U. PA. L. REV.
1915, 1926–27 (2010) (arguing that restrictions on unloading that are lifted upon retirement have
several important disadvantages, including the possibility that “the arrangement will encourage [the
manager] to place excessive weight on short-term results in her last year or two of service”). 72. See id. 73. See, e.g., DEALLAWYERS, supra note 53, at 4. Interestingly, even sophisticated investors who are not
associated with private equity firms appear to be unsatisfied with contractual arrangements that leave
CEOs substantial freedom to unload. In connection with Warren Buffett’s purchase of preferred
stock in Goldman Sachs during the financial crisis, the company agreed to adopt significant addi-tional restrictions on its CEO’s freedom to unload. See Goldman Sachs Grp., Inc., Definitive Proxy
Statement (Schedule 14A), at 16 (Apr. 6, 2009).
664 60 UCLA L. REV. 638 (2013)
CEO portfolio incentives that have long been the focus of directors at companies
owned by private equity firms.
1. Existing Disclosure Rules
Under current law, public companies are required to disclose extensive and
highly salient information about CEO pay levels. By contrast, existing rules re-quire relatively little disclosure of CEO incentives. Taken together, current rules
may discourage public company directors from insisting upon a strong link be-tween CEO pay and performance.
All public companies are required to disclose the amount of their CEO’s pay
in a clear, simple table, known as the “Summary Compensation Table,” in their
annual proxy statements.74 Over time, securities rules have evolved to require that this table include more detailed information on pay levels, including the value of each element of the CEO’s pay—salary, bonus, stock-based pay, retirement bene-fits, and other compensation—as well as the total value of the CEO’s pay package. The total levels of CEO pay, as disclosed in these tables, have been the subject of considerable scrutiny from investors and the public.
Yet the Summary Compensation Table provides no information, summary or otherwise, about CEO portfolio incentives. While some of the information need-ed to calculate the CEO’s portfolio incentives can be gleaned from information
scattered throughout the proxy statement and filings public companies are required
to make under insider-trading rules, these disclosures offer only limited infor-mation on unloading.75 Particularly in contrast to the extensive disclosure regime
that governs pay levels, public company investors receive very little information on
CEO portfolio incentives. Given the evidence that the divided loyalties of public
company directors are associated with significantly weaker CEO incentives, the
law’s emphasis on the magnitude of pay appears to be misplaced. Worse, this unhealthy emphasis on pay levels may give public company direc-
tors additional reason not to drive harder bargains over CEO incentives. We would
expect risk-averse CEOs to demand additional compensation in exchange for ac-
74. See generally 17 C.F.R. § 229.402(a) (2012). 75. Public companies are required to provide some information about CEO stock ownership, and
outstanding grants of stock and stock options, in separate tables in the company’s annual proxy state-ment. See, e.g., id. § 229.402(f) (describing disclosure requirements related to outstanding grants of stock-based pay). In addition, some information on unloading is dispersed among a series of filings that public companies provide pursuant to Section 16 of the Securities Exchange Act of 1934. Researchers have long noted the difficulties associated with estimating CEO portfolio incentives on
the basis of these disclosures, however. See, e.g., Hall & Liebman, supra note 45, at 687 (describing
several difficulties that arise when attempting to calculate CEO portfolio incentives with precision
from these disclosures).
Private Equity and Executive Compensation 665
cepting pay that is more closely linked to performance. Directors who demand a
stronger pay–performance link will likely have to agree to pay CEOs more in the
bargain. These directors know, however, that information on the CEO’s increased
level of pay will be prominently described in the company’s proxy statement, while
information on her stronger incentives will be obscured. Fearing that investors
will object to increased levels of CEO pay, directors may choose not to demand
that the CEO accept a stronger pay–performance link.
2. Post-Crisis Rulemaking
After the recent financial crisis, lawmakers became convinced that addition-al rules were needed to regulate CEO pay at large public companies.76 Congress
directed securities regulators to adopt two types of reforms. First, it directed the
SEC to require additional disclosure related to CEO pay. Second, it required
the SEC to adopt new rules mandating that public company shareholders be given
a nonbinding vote on executive compensation. Neither addresses the link between
CEO pay and performance, and both risk exacerbating the consequences of the
law’s existing emphasis on CEO pay levels. The Dodd-Frank Wall Street Reform and Consumer Protection Act of 2010
requires all public companies to disclose the ratio of the amount of the CEO’s pay
to the median pay of all of the company’s employees.77 This requirement would
not, of course, give investors any information about CEO portfolio incentives. And, like existing law, the rule’s emphasis on pay levels may have the unintended
consequence of encouraging directors to weaken the pay–performance link. Directors of public companies may fear that the public will object to high ra-
tios between the levels of CEO and employee pay. If public company directors in-sist that their CEOs accept a stronger link between pay and performance, we can
expect that CEOs will respond by demanding higher levels of pay. Yet there is no
reason to expect that the median pay of the company’s employees will change
because of this new bargain. As a result, the new rules might require directors
bargaining for stronger CEO portfolio incentives to disclose a higher ratio be-tween the CEO’s pay and the median pay of the company’s employees. To the ex-tent that directors suffer, or fear to suffer, approbation for such disclosure, this rule
76. See, e.g., Timothy F. Geithner, Secretary of the Treasury, Statement on Compensation (June 10, 2009), available at http://www.treasury.gov/press-center/press-releases/Pages/tg163.aspx (“This
financial crisis had many significant causes, but executive compensation practices were a contributing
factor.”). 77. Dodd-Frank Wall Street Reform and Consumer Protection Act, Pub. L. No. 111-203, § 953(b), 124
Stat. 1376, 1904 (2010) (codified at 15 U.S.C. § 78n-1 (Supp. V 2011)).
666 60 UCLA L. REV. 638 (2013)
may give directors additional reason not to bargain for stronger CEO portfolio in-centives in the first place.
The Dodd-Frank Act also requires that public companies allow shareholders
to vote on nonbinding resolutions approving the executive pay disclosures includ-ed in proxy statements.78 As we have seen, however, these disclosures include no
information on CEO portfolio incentives—and their emphasis on CEO pay levels
may well discourage directors from bargaining for a stronger pay–performance link. Giving shareholders the power to vote on these disclosures—armed only with in-formation on CEO pay levels—may render the law’s already unhealthy emphasis
on pay levels even more virulent.79 It is too soon to tell whether the shareholder votes mandated by Dodd-Frank
will actually have this effect.80 By giving investors the right to vote to approve dis-closures that provide extensive information on CEO pay levels but none on CEO
incentives, however, Dodd-Frank may well exacerbate the law’s existing tendency
to discourage directors from bargaining for the pay–performance link that is in
shareholders’ best interest.
3. Disclosing Portfolio Incentives
Current law provides shareholders and the public with extensive disclosure
on CEO pay levels but relatively little information about incentives. And the
post-crisis rulemaking mandated by the Dodd-Frank Act will lead to new dis-closures that further emphasize pay levels. Yet the evidence from private equity
suggests that directors with undivided loyalty to investors emphasize incentives,
78. Id. § 951(a), 124 Stat. at 1899 (codified at 15 U.S.C. § 78l). 79. See Jeffrey N. Gordon, Essay, “Say on Pay”: Cautionary Notes on the U.K. Experience and the Case for
Shareholder Opt-In, 46 HARV. J. ON LEGIS. 323, 352 (2009) (predicting that the introduction of man-datory shareholder votes on executive pay in the United States might distort managerial incentives).
80. The effects of these votes will depend, among other things, on the influence of the advisory services that provide recommendations to institutional shareholders on how their votes should be cast on
these matters. Although commentators have debated the extent to which these advisors influence
shareholder voting more generally, see, e.g., Stephen Choi et al., The Power of Proxy Advisors: Myth or
Reality?, 59 EMORY L.J. 869 (2010), the early evidence suggests that these advisors wield consid-erable influence over shareholder votes on executive pay. See Yonca Ertimur et al., Shareholder Votes and Proxy Advisors: Evidence From Say on Pay 32–33 (July 13, 2012) (unpublished manu-script), available at http://papers.ssrn.com/sol3/papers.cfm?abstract_id=2019239. These advisors
have developed guidelines for their recommendations on shareholder votes on executive pay. See id. at 3. These guidelines currently do not include CEO portfolio incentives among the considerations that the advisors take into account when making a recommendation on how shareholders should vote on
executive pay. See GARY HEWITT & CAROL BOWIE, INST’L S’HOLDER SERVS., EVALUATING
PAY FOR PERFORMANCE ALIGNMENT: ISS’ QUANTITATIVE AND QUALITATIVE APPROACH
(2011), available at http://www.issgovernance.com/sites/default/files/EvaluatingPayForPerformance_ 20111219.pdf.
Private Equity and Executive Compensation 667
rather than pay levels, in their bargains with executives. Regulators should re-spond by requiring clear, summary disclosure of CEO portfolio incentives.
Because public companies already have the information necessary to calculate
their CEOs’ portfolio incentives, this disclosure is unlikely to be administratively
expensive.81 The information would allow investors to ascertain, with some meas-ure of precision, the relationship between the CEO’s wealth and the company’s
value. Moreover, the data would allow shareholders to monitor whether paying the
CEO in stock has strengthened the pay–performance link—or whether CEO
unloading has undermined the incentive effects of stock-based pay. To the extent that regulators are concerned about the effects of managerial influence on CEO
pay, it is difficult to see why CEO portfolio incentives should not be summarily
disclosed to public company investors. By mandating that public companies pro-vide this information, regulators could mitigate the potentially deleterious effects
of the law’s current emphasis on pay levels. It might be argued that some of the information necessary to estimate a
CEO’s portfolio incentives is already disclosed in filings public companies are re-quired to make under insider-trading rules. But because these disclosures are not designed to provide information on portfolio incentives, they are of limited value to
investors concerned about the link between CEO pay and performance. Instead
of requiring shareholders to rely on these filings, regulators should require public
companies to include clear, summary disclosures of CEO portfolio incentives in
their annual proxy disclosure on CEO pay. Moreover, the fact that shareholders now have the power to vote on execu-
tive pay makes the case for summary disclosure of CEO portfolio incentives even
stronger. Disclosure of this information will allow shareholders to incorporate
the pay–performance link into their voting decisions, giving directors reason
to hew more closely to shareholder preferences when bargaining with CEOs
over compensation. The law’s existing emphasis on pay levels discourages public company direc-
tors from pursuing the pay–performance link that is in shareholders’ best interest, and post-crisis rulemaking required by the Dodd-Frank Act risks exacerbating this
problem. Regulators should require that public companies provide clear, salient information on the CEO incentives that have long been the focus of directors with
undivided loyalty to the company’s owners.
81. Because calculation of a CEO’s portfolio incentives only requires information on the CEO’s stock and
option ownership, companies are likely to have this information readily available. In any event, the
costs of calculating CEO incentives will be far lower for public companies than for shareholders
attempting to monitor the compensation decisions of directors.
668 60 UCLA L. REV. 638 (2013)
CONCLUSION
Directors of public companies have reason to favor the interests of managers
over those of shareholders when they negotiate with CEOs over compensation. No such conflict exists, however, for directors appointed by private equity investors. In this Article, I have used the first study of how companies owned by private equi-ty firms pay CEOs to illustrate the impact of divided director loyalties on CEO pay
at public companies. The evidence shows that directors appointed by private equity firms create a
stronger link between CEO pay and performance than public company directors. These differences in CEO incentives are not explained by the existing compensa-tion practices of the companies private equity firms choose to buy or the risk prefer-ences of the CEOs they hire. Instead, the stronger pay–performance link we see in
companies owned by private equity firms arises from their directors’ unconflicted
motivation to maximize shareholder value. This finding has important implications for investors and regulators who wish
to neutralize managerial influence over CEO pay at public companies. Boards of public companies seeking to align CEO pay more closely with performance should
pursue contractual arrangements that address CEO portfolio incentives. And reg-ulators should recognize that current law, by requiring disclosure of information on
CEO pay levels but not on incentives, perversely discourages public company di-rectors from pursuing pay packages that are in shareholders’ interests. Moreover, post-crisis rulemaking on executive pay will likely exacerbate this problem. Regu-lators should respond by supplementing existing rules on executive pay with a
requirement that public companies provide shareholders with clear, salient infor-mation on CEO portfolio incentives.
The data presented here merely scratch the surface of what can be learned
from companies owned by private equity firms. All questions of public company
corporate governance, to the extent they arise from the separation of ownership
and control, can be illuminated by comparison with practices in private equity. This Article offers a first glimpse of the governance lessons that can be drawn
from the boardrooms of companies owned by private equity investors.
APPENDIX A. DATA
The evidence presented in the Article is based on data drawn by hand from
filings that public companies are required to provide to the SEC. Prior to an IPO, companies are required to file a registration statement with the Commission de-scribing, among other matters, CEO pay. In the years following the IPO, com-panies must annually file a proxy statement providing the same information. All
Private Equity and Executive Compensation 669
of the filings used to assemble the dataset are available on the SEC’s website, and
all of the data used in this Article are available upon request.
A. Dataset Assembly
1. Companies Owned by Private Equity Firms
To examine how private equity investors pay CEOs, I identified companies
that private equity firms took public between 2000 and 2005. Because no public
database reliably identifies which companies completing an IPO are owned by pri-vate equity firms, I identified those companies by searching two proprietary da-tabases: the Dealogic Sponsor Analytics database and the Standard & Poor’s
Capital IQ database.82 My dataset includes only IPOs that were identified in both
proprietary databases as involving a company owned by a private equity firm. These databases included several companies whose CEOs had also founded
the firm. In this Article, I focus only on evidence from negotiations between pro-fessional managers and directors. Previous work has established, however, that founders who also serve as CEOs receive different compensation, and have differ-ent motivations, from professional managers.83 Thus, I excluded companies with
founder-CEOs from my sample,84 leaving 108 companies owned by private equi-ty investors that completed an IPO during the sample period. I drew data on
CEO pay, portfolio incentives, and CEO and company characteristics by hand for each company. Data for the year prior to each company’s IPO were drawn from
the company’s registration statement, and data for years following each company’s
IPO were drawn from the company’s annual proxy statements. I then identified a separate group of public companies that were not owned by
a private equity firm, including all of the companies that were included in the S&P
1500 index during the sample period. The sample of companies owned by private
equity firms, however, included only companies that recently completed an IPO.
82. See generally DEALOGIC EQUITY CAPITAL MARKETS ANALYTICS (proprietary data on file with
author), available at http://www.dealogic.com/en/ecm.htm; STANDARD & POOR’S, CAPITAL IQ
(proprietary data on file with author), available at http://www.standardandpoors.com/products-services/capitaliq-compustat. I am grateful to Dealogic and Standard & Poor’s for providing me with
access to their proprietary databases. 83. See, e.g., John C. Coates IV & Reinier Kraakman, CEO Tenure, Performance and Turnover in S&P 500
Companies 15 (ECGI Finance Working Paper No. 191, 2010), available at http://papers.ssrn.com/ sol3/papers.cfm?abstract_id=925532.
84. To proxy for founder-CEOs, I excluded from the sample any company with a CEO who owned
more than 5 percent of the company at the time of the IPO. See, e.g., Jerry Cao & Josh Lerner, The Performance of Reverse Leveraged Buyouts (Oct. 15, 2006) (unpublished manuscript), available at http://papers.ssrn.com/sol3/papers.cfm?abstract_id=937801 (using a similar method).
670 60 UCLA L. REV. 638 (2013)
To ensure that the group of public companies also included only firms close to the
IPO stage, I used the proprietary Bloomberg Financial Services Database to iden-tify the date on which each company in the group of public companies was taken
public.85 I then removed from the group of public companies any company that was more than seven years from the date of its IPO or for which information on
the IPO date was not available.86 Finally, I drew data on CEO pay, portfolio in-centives, and CEO and company characteristics for all firms in this group from the
Standard & Poor’s ExecuComp database.87
2. Companies Targeted by Private Equity Firms
To explore whether private equity firms systematically invest in companies
that already have a strong link between pay and performance, I separately identified
a group of companies that were the targets of private equity investments during my
sample period. No public database reliably identifies such companies. Thus, I
used the proprietary Capital IQ database to search for firms that were the targets of private equity investments between 2000 and 2005.88 Once again, I excluded com-panies whose CEOs founded the company from this group, leaving 53 companies
that were the targets of private equity investments during the sample period.89 For
each of these companies, I drew data on CEO pay, portfolio incentives, and CEO
and company characteristics by hand from the last available proxy statement filed
by the firm before the private equity investment took place. I then identified a separate group of public companies that were not the target
of private equity investments, including all of the firms in the S&P 1500 index.90
85. BLOOMBERG L.P., BLOOMBERG FINANCIAL SERVICES DATABASE (proprietary data on file with
author), available at http://www.bloomberg.com. 86. In addition, I also control separately for the number of years since each company’s IPO in the multivar-
iate regressions presented below. 87. See STANDARD & POOR’S, EXECUCOMP ANNUAL COMPENSATION DATASET (data on file with
author), available at http://wrds.wharton.upenn.edu. 88. See STANDARD & POOR’S, supra note 82. 89. I used the same method for identifying and excluding companies with founder-CEOs from this group
of companies as I did for the group of companies owned by private equity firms. See supra note 84. 90. The companies that were targeted by private equity firms were significantly smaller than the com-
panies in the S&P 1500. Thus, to ensure that the two groups of companies were comparable, I elim-inated from the group of companies in the S&P 1500 any company with a market capitalization
greater than that of the largest company in the group targeted by private equity firms. Because the
group of companies in the S&P 1500 may still not be fully comparable to the group of companies
targeted by private equity firms, as a robustness check I also conducted a separate analysis of CEO
portfolio incentives in the two groups of companies using a more precise matching procedure. See
infra note 101.
Private Equity and Executive Compensation 671
For each of these companies, I drew data on CEO pay, portfolio incentives, and
CEO and company characteristics from the ExecuComp database.91
B. Constructed Variables
1. CEO Pay Levels
I calculated each CEO’s total pay as the sum of the CEO’s salary, bonus, oth-er compensation, and stock-based pay, including the value of stock and stock op-tions. The values for each element of the CEO’s pay were generally drawn from
the companies’ securities filings. Following previous literature, I used the Black-Scholes method to value stock
options granted to the CEO as compensation.92 To calculate an option’s value, the Black-Scholes formula requires information on the volatility of the price of the
stock underlying the option. Some stock options for CEOs in the group of com-panies owned by private equity firms, however, were granted to CEOs before their company’s IPO. To value these options, I assumed that the volatility of the un-derlying stock was equal to the actual volatility of the stock from the time of the
IPO through the end of the sample period. As a robustness check, I recalculated
the value of each option grant based on the average annualized volatility of the
stocks in the firm’s Standard Industry Classification.93 The results described below
remained unchanged.
2. Portfolio Incentives
To calculate both measures for CEO portfolio incentives described in Part II.B.2, one must know the delta of the CEO’s options—that is, the amount by
which the value of each option changes based on a given change in firm value.94 In
turn, to calculate the option delta one must know the exercise price and term—that is, the amount of time remaining until the expiration—of each stock option. This
information could not be obtained for some of the options granted to the CEOs in
my sample.
91. See STANDARD & POOR’S, supra note 87. 92. See supra note 38; see also Fischer Black & Myron Scholes, The Pricing of Options and Corporate
Liabilities, 81 J. POL. ECON. 637 (1973). 93. I am grateful to James Zeitler of Harvard Business School’s Baker Library Research Services for his as-
sistance in conducting this analysis. 94. See supra note 45.
672 60 UCLA L. REV. 638 (2013)
In these cases, I assumed that option delta was equal to the median option
delta for all option grants made by the company during the sample period. As
a robustness check, I recalculated all CEO portfolio incentives on the basis of two
alternative assumptions. First, I assumed that option delta was equal to the median
delta for all options granted during the sample period, which was 0.87. Second, following an approach previously employed in the literature, I assumed that delta
for all stock options was equal to 0.70.95 The results presented in the Article, and
described in the tables below, remained unchanged.
3. Company Characteristics
Data on the characteristics of each company in my sample, such as firm size
and equity volatility, were generally drawn by hand from the company’s securities
filings or from the Center for Research in Security Prices.96 Because previous work
has shown that a company’s industry is particularly relevant to CEO incentives, however, I took two additional steps to control for industry.
First, I identified each company’s Standard Industry Classification code. Based on this code, I then identified each company’s Fama-French industry des-ignation, which captures industry-specific company characteristics more accurate-ly than Standard Industry Classification codes.97 All of the results in the Article, and described in the tables below, control separately for each company’s Fama-French industry classification.
Second, I separately controlled for measures of company value that were ad-justed by Fama-French industry. Following previous work in this area, I proxied
for company value using Tobin’s Q, which is the ratio of the company’s equity
value to the book value of its assets. I then adjusted each company’s Tobin’s Q to
reflect its Fama-French industry. The results presented in the Article, and de-scribed in the tables below, control for the ratio of each company’s Tobin’s Q to
the median Tobin’s Q for all of the companies in the company’s Fama-French in-dustry.
95. See Hall & Liebman, supra note 45 (using this approach). 96. See CTR. FOR RESEARCH IN SECURITY PRICES, CSRP—ANNUAL UPDATE, available at http://
wrds.wharton.upenn.edu (accessed Dec. 14, 2007). 97. See Eugene F. Fama & Kenneth R. French, Industry Costs of Equity, 43 J. FIN. ECON. 153, 179–81
(1997). Kenneth French’s online library identifies Fama-French industry codes for each Standard
Industry Classification code. Detail for 49 Industry Portfolios, KENNETH R. FRENCH, http://mba. tuck.dartmouth.edu/pages/faculty/ken.french/Data_Library/det_49_ind_port.html (last visited
Nov. 18, 2012).
Private Equity and Executive Compensation 673
APPENDIX B. ANALYSIS
Below I provide the results of econometric analysis that describes the statisti-cal relationships identified in the Article. Tables 7 through 10 provide correlation
coefficients and measures of statistical significance from ordinary least squares re-gressions using the data described in Appendix A. All models include controls for observation year and the characteristics of each company (including company size
(expressed as the log of the firm’s market capitalization), equity volatility, indus-try, and industry-relative firm value) and CEO (including each CEO’s age and
tenure—that is, the number of years the executive has served as CEO). Each mod-el also includes controls for managerial continuity through a dummy variable indi-cating whether a company’s CEO was replaced in the year prior to the observation
year. I separately report the results of models that include year fixed effects. In the
tables below, robust standard errors, which are clustered by firm, are given in pa-rentheses. Mean values for dependent variables are also given in parentheses.
A. CEO Pay Levels
To test whether companies owned by private equity firms pay their CEOs
different amounts than public companies, I specify a multivariate regression model in which the dependent variable is a proxy for the CEO’s cash compensation (the
sum of the CEO’s salary and bonus, in models (a) and (b)) or for the CEO’s total compensation (models (c) and (d)). Each model includes separate controls for the
number of years since each company’s IPO.98 “Private Equity Ownership” is a
dummy variable equal to one for companies owned by a private equity firm and ze-ro for all others.99
98. The CEO of a company owned by a private equity firm may face a systematically different probabil-ity of being dismissed than the CEO of a comparable public company, and this difference could affect the relative value of the CEO’s compensation. See supra note 41. As an additional check, each of the
models in Table 7 was recalculated, this time including a control for a variable measuring the interac-tion between the dummy variable for private equity ownership and CEO tenure to approximate the
effects of different levels of CEO tenure in companies owned by private equity firms. The results were
consistent with those described in Table 7. 99. Because the CEOs of companies owned by private equity firms have an economically and statistically
significantly stronger link between pay and performance than their public company counterparts, I
recalculated the models described in Table 7 with separate controls for each CEO’s portfolio incen-tives, using both the dollar-on-dollar and equity-returns measures. See infra Table 8. These models, too, revealed no statistically significant relationship between CEO pay levels and private equity
ownership.
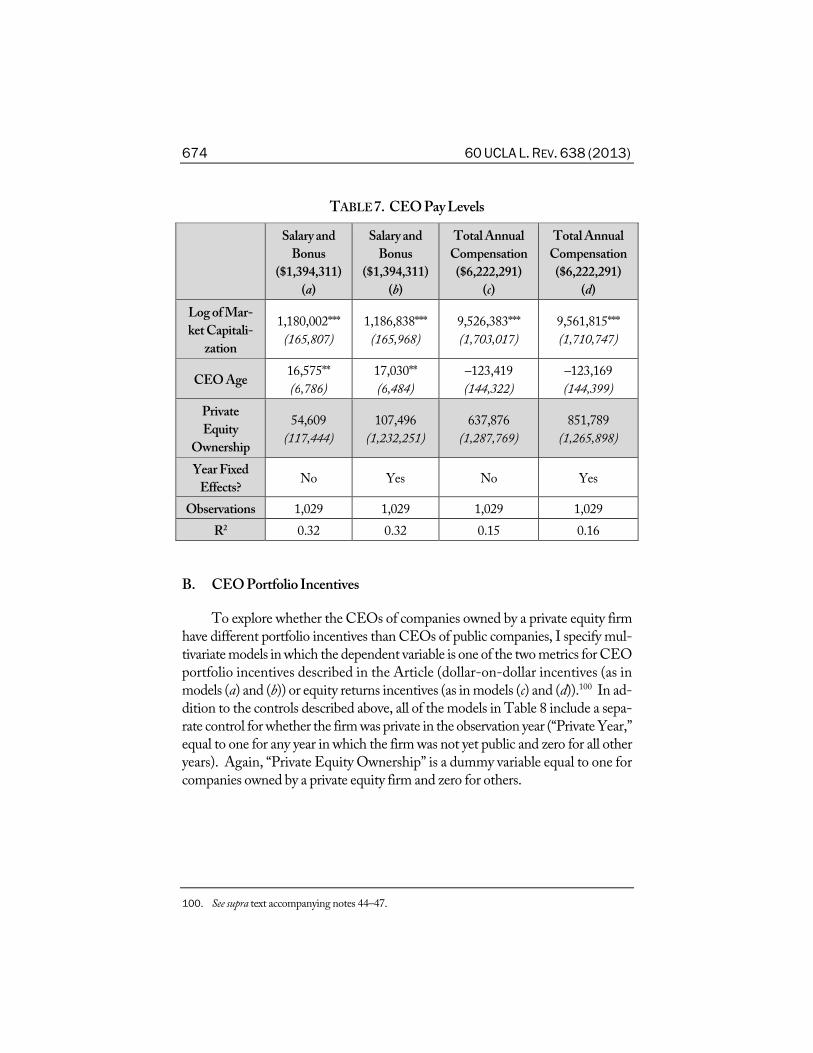
674 60 UCLA L. REV. 638 (2013)
TABLE 7. CEO Pay Levels
Salary and
Bonus
($1,394,311)
(a)
Salary and
Bonus
($1,394,311)
(b)
Total Annual
Compensation
($6,222,291)
(c)
Total Annual
Compensation
($6,222,291)
(d)
Log of Mar-
ket Capitali-
zation
1,180,002***
(165,807)
1,186,838***
(165,968)
9,526,383***
(1,703,017)
9,561,815***
(1,710,747)
CEO Age 16,575**
(6,786)
17,030**
(6,484)
–123,419
(144,322)
–123,169
(144,399)
Private
Equity
Ownership
54,609
(117,444)
107,496
(1,232,251)
637,876
(1,287,769)
851,789
(1,265,898)
Year Fixed
Effects? No Yes No Yes
Observations 1,029 1,029 1,029 1,029
R2 0.32 0.32 0.15 0.16
B. CEO Portfolio Incentives
To explore whether the CEOs of companies owned by a private equity firm
have different portfolio incentives than CEOs of public companies, I specify mul-tivariate models in which the dependent variable is one of the two metrics for CEO
portfolio incentives described in the Article (dollar-on-dollar incentives (as in
models (a) and (b)) or equity returns incentives (as in models (c) and (d)).100 In ad-dition to the controls described above, all of the models in Table 8 include a sepa-rate control for whether the firm was private in the observation year (“Private Year,”
equal to one for any year in which the firm was not yet public and zero for all other years). Again, “Private Equity Ownership” is a dummy variable equal to one for
companies owned by a private equity firm and zero for others.
100. See supra text accompanying notes 44–47.
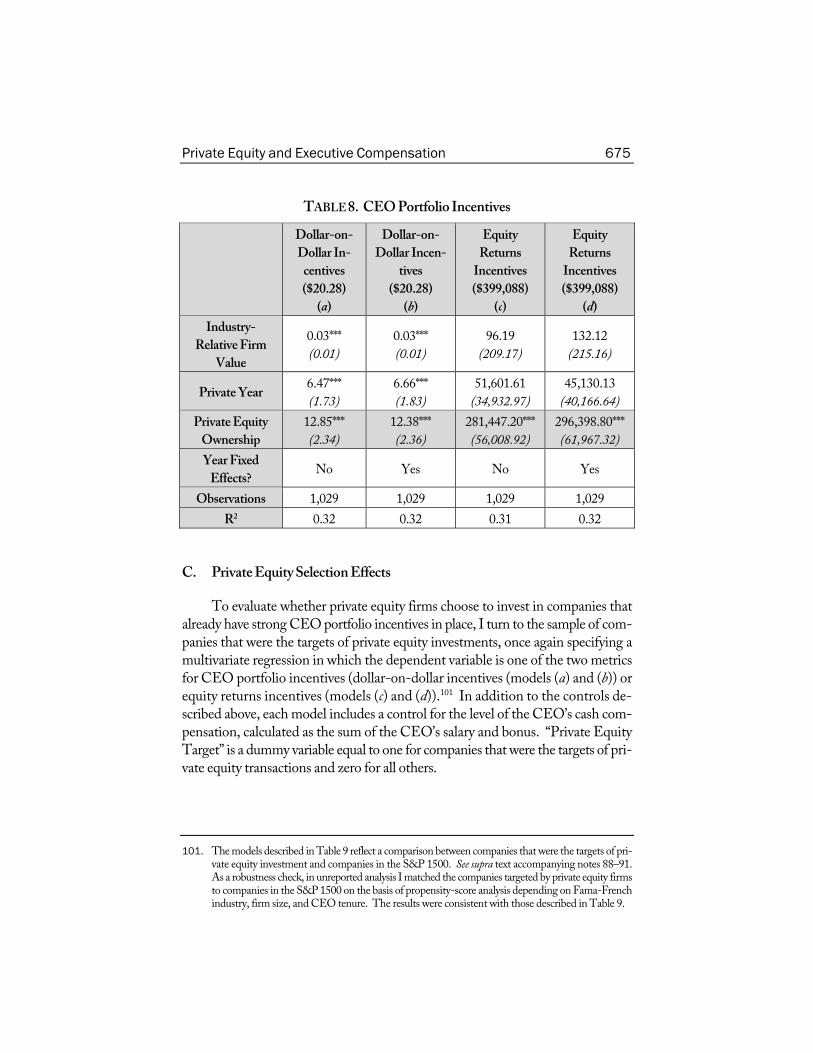
Private Equity and Executive Compensation 675
TABLE 8. CEO Portfolio Incentives
Dollar-on-
Dollar In-
centives
($20.28)
(a)
Dollar-on-
Dollar Incen-
tives
($20.28)
(b)
Equity
Returns
Incentives
($399,088)
(c)
Equity
Returns
Incentives
($399,088)
(d)
Industry-
Relative Firm
Value
0.03***
(0.01)
0.03***
(0.01)
96.19
(209.17)
132.12
(215.16)
Private Year 6.47***
(1.73)
6.66***
(1.83)
51,601.61
(34,932.97)
45,130.13
(40,166.64)
Private Equity
Ownership
12.85***
(2.34)
12.38***
(2.36)
281,447.20***
(56,008.92)
296,398.80***
(61,967.32)
Year Fixed
Effects? No Yes No Yes
Observations 1,029 1,029 1,029 1,029
R2 0.32 0.32 0.31 0.32
C. Private Equity Selection Effects
To evaluate whether private equity firms choose to invest in companies that already have strong CEO portfolio incentives in place, I turn to the sample of com-panies that were the targets of private equity investments, once again specifying a
multivariate regression in which the dependent variable is one of the two metrics
for CEO portfolio incentives (dollar-on-dollar incentives (models (a) and (b)) or
equity returns incentives (models (c) and (d)).101 In addition to the controls de-scribed above, each model includes a control for the level of the CEO’s cash com-pensation, calculated as the sum of the CEO’s salary and bonus. “Private Equity
Target” is a dummy variable equal to one for companies that were the targets of pri-vate equity transactions and zero for all others.
101. The models described in Table 9 reflect a comparison between companies that were the targets of pri-vate equity investment and companies in the S&P 1500. See supra text accompanying notes 88–91. As a robustness check, in unreported analysis I matched the companies targeted by private equity firms to companies in the S&P 1500 on the basis of propensity-score analysis depending on Fama-French
industry, firm size, and CEO tenure. The results were consistent with those described in Table 9.
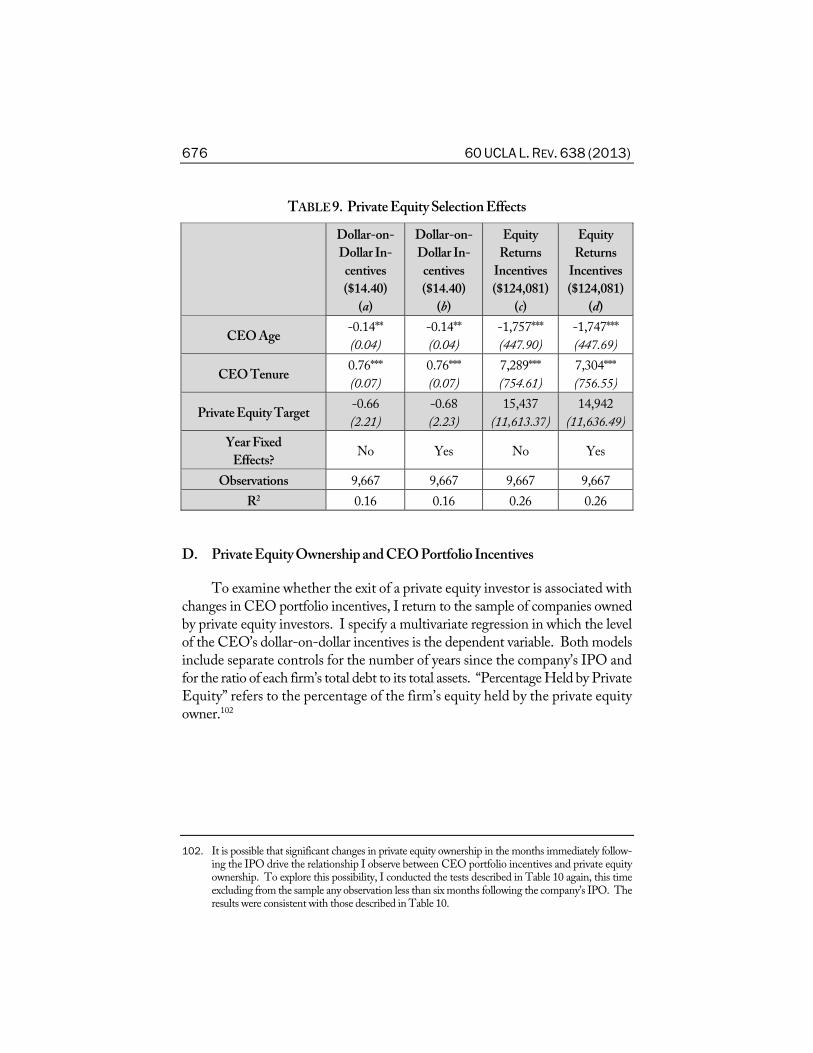
676 60 UCLA L. REV. 638 (2013)
TABLE 9. Private Equity Selection Effects
Dollar-on-
Dollar In-
centives
($14.40)
(a)
Dollar-on-
Dollar In-
centives
($14.40)
(b)
Equity
Returns
Incentives
($124,081)
(c)
Equity
Returns
Incentives
($124,081)
(d)
CEO Age -0.14**
(0.04)
-0.14**
(0.04)
-1,757***
(447.90)
-1,747***
(447.69)
CEO Tenure 0.76***
(0.07)
0.76***
(0.07)
7,289***
(754.61)
7,304***
(756.55)
Private Equity Target -0.66
(2.21)
-0.68
(2.23)
15,437
(11,613.37)
14,942
(11,636.49)
Year Fixed
Effects? No Yes No Yes
Observations 9,667 9,667 9,667 9,667
R2 0.16 0.16 0.26 0.26
D. Private Equity Ownership and CEO Portfolio Incentives
To examine whether the exit of a private equity investor is associated with
changes in CEO portfolio incentives, I return to the sample of companies owned
by private equity investors. I specify a multivariate regression in which the level of the CEO’s dollar-on-dollar incentives is the dependent variable. Both models
include separate controls for the number of years since the company’s IPO and
for the ratio of each firm’s total debt to its total assets. “Percentage Held by Private
Equity” refers to the percentage of the firm’s equity held by the private equity
owner.102
102. It is possible that significant changes in private equity ownership in the months immediately follow-ing the IPO drive the relationship I observe between CEO portfolio incentives and private equity
ownership. To explore this possibility, I conducted the tests described in Table 10 again, this time
excluding from the sample any observation less than six months following the company’s IPO. The
results were consistent with those described in Table 10.
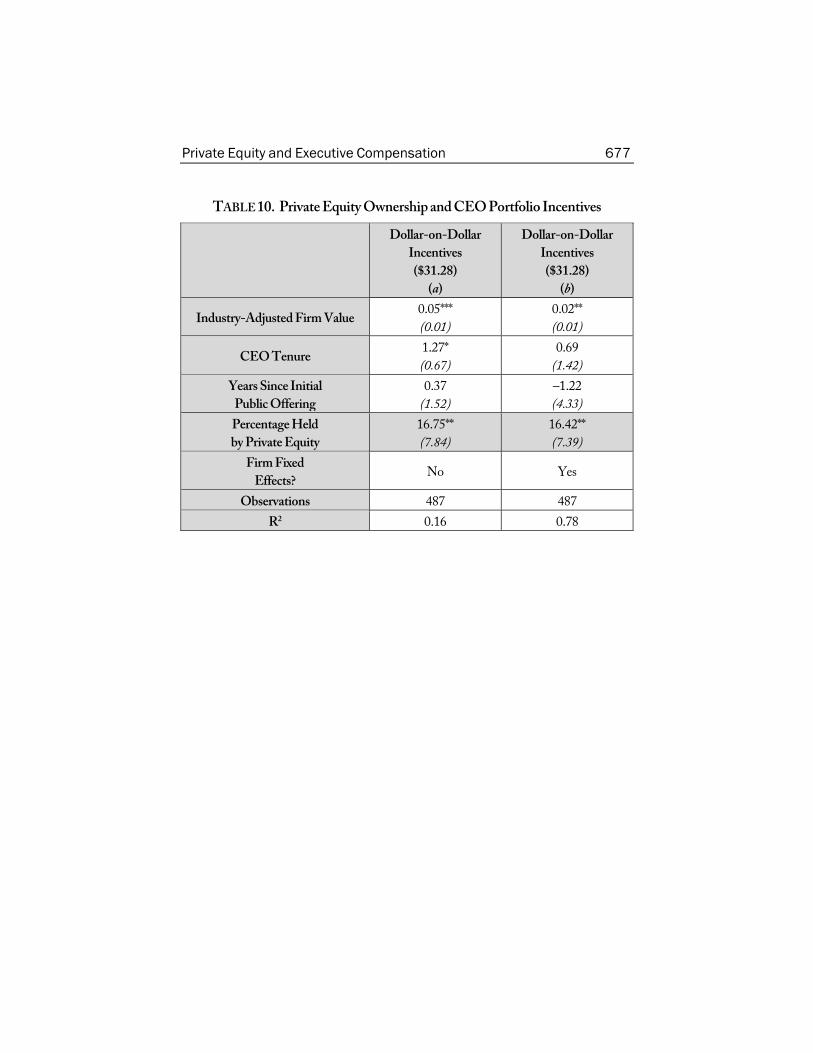
Private Equity and Executive Compensation 677
TABLE 10. Private Equity Ownership and CEO Portfolio Incentives
Dollar-on-Dollar
Incentives
($31.28)
(a)
Dollar-on-Dollar
Incentives
($31.28)
(b)
Industry-Adjusted Firm Value 0.05***
(0.01)
0.02**
(0.01)
CEO Tenure 1.27*
(0.67)
0.69
(1.42)
Years Since Initial
Public Offering
0.37
(1.52)
–1.22
(4.33)
Percentage Held
by Private Equity
16.75**
(7.84)
16.42**
(7.39)
Firm Fixed
Effects? No Yes
Observations 487 487
R2 0.16 0.78