Embed Size (px)
Citation preview

This PDF is a selection from an out-of-print volume from the National Bureauof Economic Research
Volume Title: R & D, Patents, and Productivity
Volume Author/Editor: Zvi Griliches, ed.
Volume Publisher: University of Chicago Press
Volume ISBN: 0-226-30884-7
Volume URL: http://www.nber.org/books/gril84-1
Publication Date: 1984
Chapter Title: Who Does R&D and Who Patents?
Chapter Author: John Bound, Clint Cummins, Zvi Griliches, Bronwyn H.Hall, Adam B. Jaffe
Chapter URL: http://www.nber.org/chapters/c10043
Chapter pages in book: (p. 21 - 54)

2 Who Does R&Dand Who Patents?John Bound, Clint Cummins, Zvi Griliches,Bronwyn H. Hall, and Adam Jaffe
2.1 Introduction
As part of an ongoing study of R&D, inventive output, and productivity change, the authors are assembling a large data set for a panel of U.S.firms with annual data from 1972 (or earlier) through 1978. This file willinclude financial variables, research and development expenditures, anddata on patents. The goal is to have as complete a cross section as possibleof U.S. firms in the manufacturing sector which existed in 1976, withtime-series information on the same firms for the years before and after1976. This paper presents a preliminary analysis of these data in thecross-sectional dimension, laying some groundwork for the future byexploring the characteristics of this sample and by describing the R&Dand patenting behavior of the firms in it. This paper follows previouswork on a smaller sample of 157 firms (see Pakes and Griliches 1980 andPakes 1981).
We first describe the construction of our sample from the several datasources available to us. Then we discuss the reporting of our key variable,
John Bound, Clint Cummins, and Adam Jaffe are graduate students in the Departmentof Economics at Harvard University. Zvi Griliches is professor of economics at HarvardUniversity, and program director, Productivity and Technical Change, at the NationalBureau of Economic Research Research. Bronwyn H. Hall is a research analyst for theNational Bureau of Economic Research.
This paper is a revision of an earlier draft presented at the NBER conference on R&D,Patents, and Productivity in Lenox, Massachusetts, October 1981. That version containedpreliminary results on patenting in the drug and computer industries which have beenreplaced in this revision by a section on patenting in all manufacturing industries.
This work has been supported by the NBER Productivity and Technical Change StudiesProgram and NSF grants PR79-13740 and SOC79-04279. We are indebted to SumanthAddanki and Elizabeth Stromberg for research assistance. The research reported here ispart of NBER's research program in productivity. Any opinions expressed are those of theauthors and not those of NBER.
21
22 Bound/Cummins/Griliches/Hall1Jaffe
research and development expenditures, and relate this variable to firmcharacteristics, such as industry, size, and capital intensity. An importantissue is whether the fact that many firms do not report R&D expenditures will bias results based only on firms which do. We attempt to correctfor this bias using the well-known Heckman (1976) procedure.
Section 2.4 describes the patenting behavior of the same large sampleof firms. We attempt to quantify the relationship between patenting, R &D spending, and firm size, and to explore the interindustry differences inpatenting in a preliminary way. Because of the many small firms in thisdata set, we pay considerable attention to the problem of estimationwhen our dependent variable, patents, takes on small integer values. Thepaper concludes with some suggestions for future work using this largeand fairly rich data set.
2.2 Sample Description
The basic universe of the sample is the set of firms in the U.S. manufacturing sector which existed in 1976 on Standard and Poor's CompustatAnnual Industrial Files. The sources of data for these tapes are companyreports to the Securities and Exchange Commission (SEC), primarily the10-K report, supplemented by market data from such sources as NationalAssociation of Securities Dealers Automated Quotations (NASDAQ)and occasionally by personal communication with the company involved.The manufacturing sector is defined to be firms in the Compustat SICgroups 2000-3999 and conglomerates (SIC 9997).1
Company data were taken from four Compustat tapes. The Industrialfile includes the Standard and Poor 400 companies, plus all other companies traded on the New York and American Stock Exchanges. TheOver the Counter (OTC) tape includes companies traded over the counter that command significant investor interest. The Research tape includes companies deleted from other files because of acquisition, merger,bankruptcy, and the like. Finally, the Full Coverage tape includes othercompanies which file 10-K's, including companies traded on regionalexchanges, wholly owned subsidiaries, and privately held companies.From these tapes we obtained data on the capital stock, balance sheets,income statements including such expense items as research and development expenditures, stock valuation and dividends, and a few miscellaneous variables such as employment.
Unfortunately, our patent data do not come in a form which can bematched easily at the firm level. Owing to the computerization of the
1. This limitation is primarily for convenience; about 97 percent of company-sponsoredR&D was performed in the manufacturing sector in 1976 (NSF 1979). It does, however,exclude a few large performers of R&D in the communications and computer serviceindustries.
23 Who Does R&D and Who Patents?
U.S. Patent Office in the late 1960s, we are able to obtain a file with dataon each individual patent granted by the Patent Office from 1969 through1979. For each such patent we have the year it was applied for, the PatentOffice number of the organization to which it was granted, an assignmentcode telling whether the organization is foreign or domestic, corporate orindividual, and some information on the product field and SIC of thepatent. We also have a file listing the Patent Office organization numbersand the correspondent names of these organizations. The difficulty is thatthese patenting organizations, although frequently corporations in oursample, may also be subsidiaries of our firms or have a slightly differentname from that given on the Compustat files ("Co." instead of "Inc." or"Incorporated" and other such changes or abbreviations).2 Thus, thematching of the Patent Office file with the Compustat data is a major taskin our sample creation.
To do the matching, we proceeded as follows: All firms in the finalsample (about 2700) were looked up in the Dictionary of CorporateAffiliations (National Register 1976). Their names as well as the names oftheir subsidiaries were entered in a data file to be matched by a computerprogram to the names on the Patent Office organization file. This program had various techniques for accommodating differences in spellingand abbreviations. The matched list of names which it produced waschecked for incorrect matches manually, and a final file was producedwhich related the Compustat identifying Committee on Uniform Securities Identification Procedures (CUSIP) number of each firm to one ormore (in some cases, none) Patent Office organization numbers. Usingthis file, we aggregated the file with individual patent records to the firmlevel. As this paper is being written, we are engaged in a reverse check ofthe matching process which involves looking at the large patenting organizations which are recorded as domestic U.S. corporations, but whichour matching program missed. The results of this check may furtherincrease some of our patent totals.
In assembling this data set we have attempted to confine the sample todomestic corporations, since the focus of our research program is theinteraction between research and development, technological innovation, and productivity growth within the United States. Inspection of theCompustat files reveals that at least a few large foreign firms, mostlyJapanese, are traded on the New York Stock Exchange, and they consequently file 10-K's with the SEC and would be included in our sample,although presumably their R&D is primarily done abroad and their U.S.patents are recorded as foreign owned. To clean our sample of these firmswe did several things: First, \ve were able to identify and delete all firmswhich Compustat records as traded on the Canadian Stock Exchange.
2. The vast majority of patents are owned by principal companies. In our earlier sampleabout 10 percent of total patents were accounted for by patents of subsidiaries.
24 Bound/Cummins/Griliches/Hall1Jaffe
Then we formed a ratio 'of foreign-held U.S. patents to total number ofU.S. patents for each firm in our sample. For most of our sample, thisratio is less than 15 percent; the list of firms for which it is larger includesmost of the American Deposit Receipts (ADR) firms on the New YorkStock Exchange and several other firms clearly identifiable as foreign.After deleting these firms from the sample, as a final check we printed alist of the remaining firms with "ADR" or "LTD" in their names. Therewere eighteen such firms remaining, which we deleted from the sample.
The firms which were left still had a few foreign-owned patents (about 2percent of the total number of patents in 1976) from joint ventures orforeign subsidiaries. Since their Compustat data are consolidated andinclude R&D done by these subsidiaries in the R&D figure, we addedthose patents to the domestic patents to produce a total successful patentapplication figure for the firm.
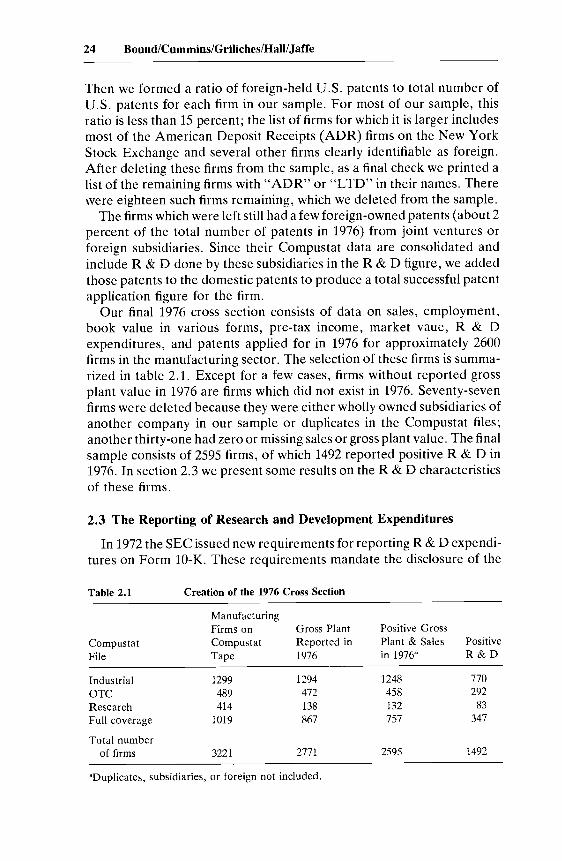
Our final 1976 cross section consists of data on sales, employment,book value in various forms, pre-tax income, market vaue, R&Dexpenditures, and patents applied for in 1976 for approximately 2600firms in the manufacturing sector. The selection of these firms is summarized in table 2.1. Except for a few cases, firms without reported grossplant value in 1976 are firms which did not exist in 1976. Seventy-sevenfirms were deleted because they were either wholly owned subsidiaries ofanother company in our sample or duplicates in the Compustat files;another thirty-one had zero or missing sales or gross plant value. The finalsample consists of 2595 firms, of which 1492 reported positive R&D in1976. In section 2.3 we present some results on the R&D characteristicsof these firms.
2.3 The Reporting of Research and Development Expenditures
In 1972 the SEC issued new requirements for reporting R&D expenditures on Form 10-K. These requirements mandate the disclosure of the
Table 2.1 Creation of the 1976 Cross Section
ManufacturingFirms on Gross Plant Positive Gross
Compustat Compustat Reported in Plant & Sales PositiveFile Tape 1976 in 19763 R&D
Industrial 1299 1294 1248 770aTC 489 472 458 292Research 414 138 132 83Full coverage 1019 867 757 347
Total numberof firms 3221 2771 2595 1492
aDuplicates, subsidiaries, or foreign not included.

25 Who Does R&D and Who Patents?
estimated amount of R&D expenditures when (a) it was "material," (b)it exceeded 1 percent of sales, or (c) a policy of deferral or amortization ofR&D expenses was pursued. Acting on these new requirements, theFinancial Accounting Standards Board issued a new standard for reporting R&D expeditures in June 1974. Until this time, accepted accountingpractices appear to have allowed the amortizing of R&D expendituresover a short time period as an alternative to simple expensing, but thenew standard allows only expensing (San Miguel and Ansari 1975).Accordingly, we believe that by 1976 most of our firms were reportingR&D expense when it was "material" and that the expense reported hadbeen incurred that year.
For the purpose of this paper, we make no distinction among firmswhose R&D is reported by Compustat as "not available," "zero," or"not significant."3 All such firms are treated as not reporting positive R &D because of both the nature of the SEC reporting requirements for R &D and the way Compustat handles company responses. As noted above,companies are supposed to report "material" R&D expenditures. If thecompanies and their accountants conclude that R&D expenditures were"not material" (possibly zero but not necessarily), they sometimes saythis in the 10-K report, in which case Compustat records "zero."4 Alternatively, a company may say nothing about R&D, in which caseCompustat records "not available." It is also likely that companies reported as "not available" include some which are "randomly" missing,that is, a company performs "material" R&D but for some reasonCompustat could not get the number for that year. 5
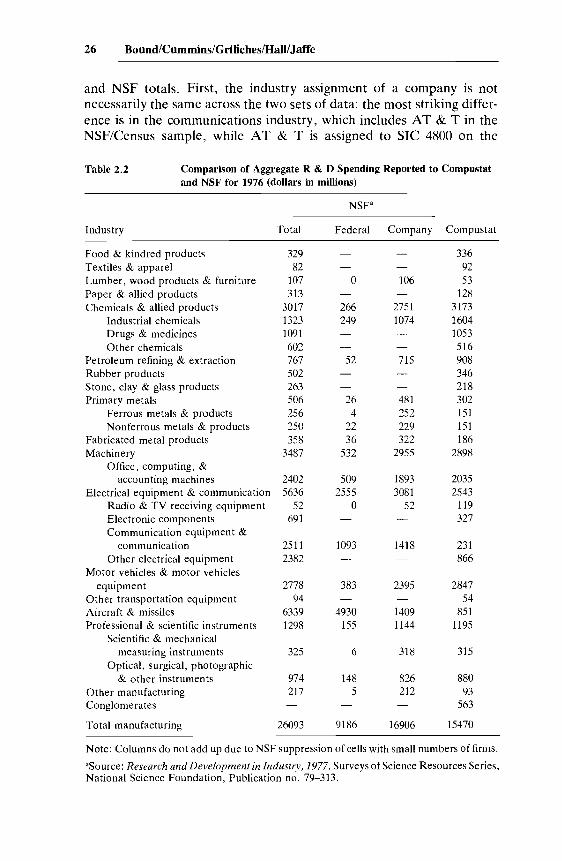
Another source of data on aggregate R&D spending by U.S. industryis the National Science Foundation which reports total R&D spending inthe United States every year, broken down into approximately thirtyindustry groupings. These data are obtained from a comprehensive survey of U.S. enterprises by the Industry Division of the U.S. Bureau of theCensus, which covers larger firms completely and samples smaller firms.Although there are several important differences between these data andthose reported by Compustat, it is interesting to compare the aggregatefigures, which we show in table 2.2. The company R&D figures are themost directly comparable to our Compustat numbers, but we also showthe figures for total R&D since NSF does not provide a breakdownbetween company-sponsored and federal-sponsored R&D expendituresfor many of the industries (to avoid disclosing individual company data).There are several reasons for the discrepancies between the Compustat
3. The "not significant" code is a 1977 Compustat innovation which appears in 1976 dataonly for the Full Coverage tape companies.
4. Or, more recently, "not significant." See note 3.5. Also included in "missing" are companies that reported R&D but Compustat
concluded that their definition of R&D did not conform.
26 Bound/Cummins/Griliches/Hall1Jaffe
and NSF totals. First, the industry assignment of a company is notnecessarily the same across the two sets of data: the most striking differ-ence is in the communications industry, which includes AT & T in theNSF/Census sample, while AT & T is assigned to SIC 4800 on the
Table 2.2 Comparison of Aggregate R&D Spending Reported to Compustatand NSF for 1976 (dollars in millions)
NSFa
Industry Total Federal Company Compustat
Food & kindred products 329 336Textiles & apparel 82 92Lumber, wood products & furniture 107 0 106 53Paper & allied products 313 128Chemicals & allied products 3017 266 2751 3173
Industrial chemicals 1323 249 1074 1604Drugs & medicines 1091 1053Other chemicals 602 516
Petroleum refining & extraction 767 52 715 908Rubber products 502 346Stone, clay & glass products 263 218Primary metals 506 26 481 302
Ferrous metals & products 256 4 252 151Nonferrous metals & products 250 22 229 151
Fabricated metal products 358 36 322 186Machinery 3487 532 2955 2898
Office, computing, &accounting machines 2402 509 1893 2035
Electrical equipment & communication 5636 2555 3081 2543Radio & TV receiving equipment 52 0 52 119Electronic components 691 327Communication equipment &
communication 2511 1093 1418 231Other electrical equipment 2382 866
Motor vehicles & motor vehiclesequipment 2778 383 2395 2847
Other transportation equipment 94 54Aircraft & missiles 6339 4930 1409 851Professional & scientific instruments 1298 155 1144 1195
Scientific & mechanicalmeasuring instruments 325 6 318 315
Optical, surgical, photographic& other instruments 974 148 826 880
Other manufacturing 217 5 212 93Conglomerates 563
Total manufacturing 26093 9186 16906 15470
Note: Columns do not add up due to NSF suppression of cells with small numbers of firms.
aSource: Research and Development in Industry, 1977. Surveys of Science Resources Series,National Science Foundation, Publication no. 79-313.
27 Who Does R&D and Who Patents?
Compustat files and is therefore not in our sample. Adding the 1976 R &D for AT & T and its subsidiary, Western Electric, to the Compustatcommunications total would raise it to about $1 billion, not enough toaccount for the difference.
There are also definitional differences between the Form lO-K R&Dand that in the Census survey. The 10-K includes international andcontracted out R&D, while these are entered on a separate line of theCensus survey.6 The total amount involved is about $1.7 billion in 1976.This is likely to explain why our industrial chemicals figure is too high, forexample. Some firms include engineering or product testing on onesurvey but exclude it on the other, apparently because the Census surveyis quite explicit about the definition of research and development, whilethe 10-K allows considerably more flexibility. Finally, the coverage offirms in the U.S. manufacturing sector by Compustat is less completethan by the Census for two reasons: (1) privately held firms are notrequired to file Form 10-K, and (2) some large firms which do file a 10-Krecord their R&D as not "material" even though a positive figure isreported to the Census Bureau. In spite of all these caveats, the Compustat and NSF numbers do seem to match fairly well across industries, andthe total is within 15 percent after correcting for AT & T and theinternational and contracted out R&D.
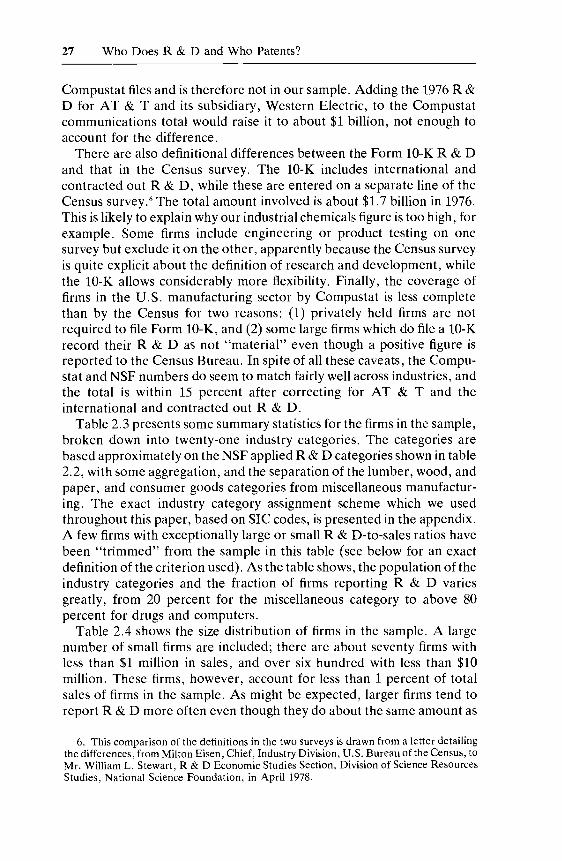
Table 2.3 presents some summary statistics for the firms in the sample,broken down into twenty-one industry categories. The categories arebased approximately on the NSF applied R&D categories shown in table2.2, with some aggregation, and the separation of the lumber, wood, andpaper, and consumer goods categories from miscellaneous manufacturing. The exact industry category assignment scheme which we usedthroughout this paper, based on SIC codes, is presented in the appendix.A few firms with exceptionally large or small R & D-to-sales ratios havebeen "trimmed" from the sample in this table (see below for an exactdefinition of the criterion used). As the table shows, the population of theindustry categories and the fraction of firms reporting R&D variesgreatly, from 20 percent for the miscellaneous category to above 80percent for drugs and computers.
Table 2.4 shows the size distribution of firms in the sample. A largenumber of small firms are included; there are about seventy firms withless than $1 million in sales, and over six hundred with less than $10million. These firms, however, account for less than 1 percent of totalsales of firms in the sample. As might be expected, larger firms tend toreport R&D more often even though they do about the same amount as
6. This comparison of the definitions in the two surveys is drawn from a letter detailingthe differences, from Milton Eisen, Chief, Industry Division, U.S. Bureau of the Census, toMr. William L. Stewart, R&D Economic Studies Section, Division of Science ResourcesStudies, National Science Foundation, in April 1978.
28 Bound/Cummins/Griliches/HalllJaffe
Table 2.3 Statistics for the 1976 Cross Section: Trimmed Data
Industry NFIRMS AVEPLANT AVESALES
Food & kindred products 182 178.7 585.7Textile & apparel 188 55.2 137.8Chemicals, excl. drugs 121 503.2 693.6Drugs & medical inst. 112 116.6 301.7Petroleum refining & ex. 54 3200.1 4622.8Rubber & misc. plastics 98 122.4 214.8Stone, clay & glass 81 186.1 243.6Primary metals 103 499.6 488.5Fabric. metal products 196 57.8 131.0Engines, farm & const. equip. 64 186.9 457.3Office, compo & acctg. eq. 106 288.2 352.9Other machinery, not elec. 199 40.8 116.1Elec. equip. & supplies 105 155.0 405.5Communication equipment 258 31.8 89.9Motor veh. & transport eq. 105 464.2 1233.6Aircraft and aerospace 37 237.4 754.1Professional & sci. equip. 139 73.4 130.5Lumber, wood, and paper 163 204.2 260.4Misc. consumer goods 100 81.6 232.5Conglomerates 23 1174.3 2202.3Misc. manuf., n.e.c. 148 36.3 89.3
All firms 2582 230.9 417.2
Note:NFIRMS = Total number of firms in industry.AVEPLANT = Average gross plant in millions of dollars.A VESALES = Average sales in millions of dollars.AVEEMP = Average employment in thousands.
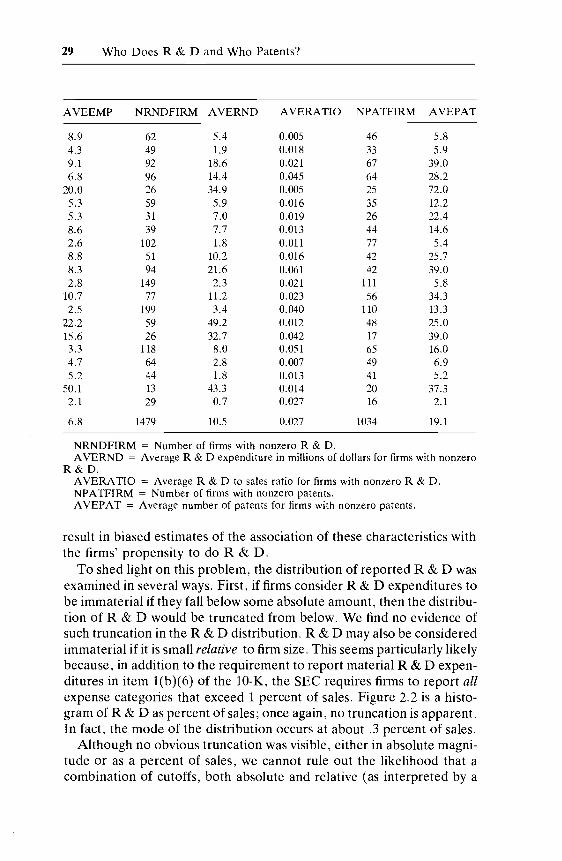
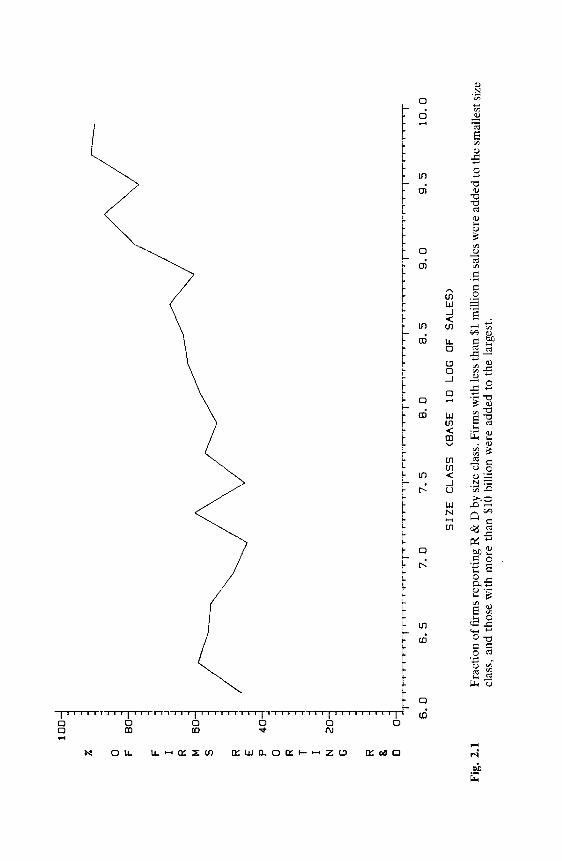
a fraction of sales. This is shown graphically in figure 2.1. Up until about$100 million in sales, only about half the companies report R&D, butabove $10 billion almost 90 percent do. Previous analysts have suggestedthat this may be because big companies are able to do their accountingmore carefully (San Miguel and Ansari 1975), but it is surprising how biga company must be before it has a 75 percent probability of reportingR&D.
As we indicated above, the nature of SEC reporting rules results inambiguity in the interpretation of firms' reporting zero R&D or notreporting R&D. This ambiguity has implications for the analysis of thesubsample of firms that do report R&D ("the R&D sample").Althou:gh we do not believe that the non-R & D sample firms all do zeroR&D, it is likely that they do less than the firms that report it. Also, theypossibly do less R&D than would be expected, given their othercharacteristics such as industry, size, and capital intensity. If so, thentheir exclusion from regressions of R&D on firm characteristics will
29 Who Does R&D and Who Patents?
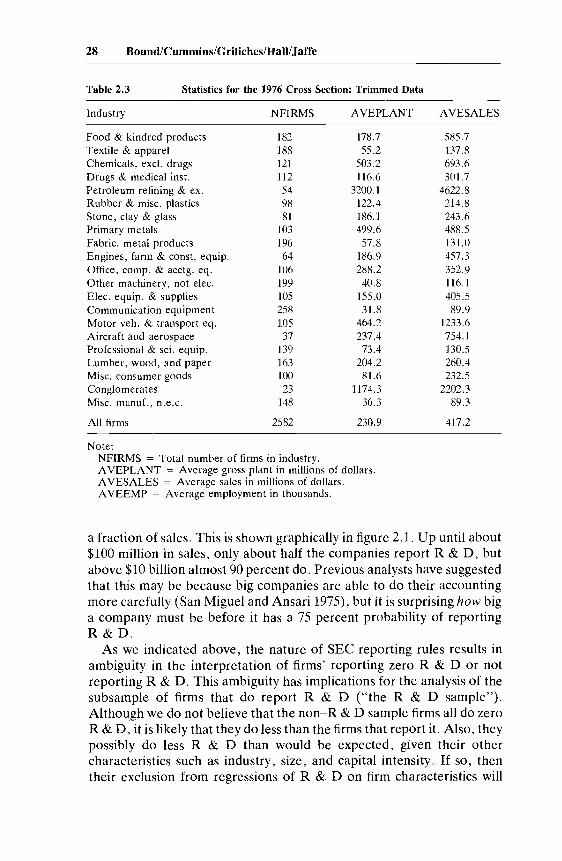
AVEEMP NRNDFIRM AVERND AVERATIO NPATFIRM AVEPAT
8.9 62 5.4 0.005 46 5.84.3 49 1.9 0.018 33 5.99.1 92 18.6 0.021 67 39.06.8 96 14.4 0.045 64 28.2
20.0 26 34.9 0.005 25 72.05.3 59 5.9 0.016 35 12.25.3 31 7.0 0.019 26 22.48.6 39 7.7 0.013 44 14.62.6 102 1.8 0.011 77 5.48.8 51 10.2 0.016 42 25.78.3 94 21.6 0.061 42 39.02.8 149 2.3 0.021 111 5.8
10.7 77 11.2 0.023 56 34.32.5 199 3.4 0.040 110 13.3
22.2 59 49.2 0.012 48 25.015.6 26 32.7 0.042 17 39.03.3 118 8.0 0.051 65 16.04.7 64 2.8 0.007 49 6.95.2 44 1.8 0.013 41 5.2
50.1 13 43.3 0.014 20 37.32.1 29 0.7 0.027 16 2.1
6.8 1479 10.5 0.027 1034 19.1
NRNDFIRM = Number of firms with nonzero R&D.AVERND = Average R&D expenditure in millions of dollars for firms with nonzero
R&D.AVERATIO = Average R&D to sales ratio for firms with nonzero R&D.NPATFIRM = Number of firms with nonzero patents.AVEPAT = Average number of patents for firms with nonzero patents.
result in biased estimates of the association of these characteristics withthe firms' propensity to do R&D.
To shed light on this problem, the distribution of reported R&D wasexamined in several ways. First, if firms consider R&D expenditures tobe immaterial if they fall below some absolute amount, then the distribution of R&D would be truncated from below. We find no evidence ofsuch truncation in the R&D distribution. R&D may also be consideredimmaterial if it is small relative to firm size. This seems particularly likelybecause, in addition to the requirement to report material R&D expenditures in item 1(b)(6) of the lO-K, the SEC requires firms to report allexpense categories that exceed 1 percent of sales. Figure 2.2 is a histogram of R&D as percent of sales; once again, no truncation is apparent.In fact, the mode of the distribution occurs at about .3 percent of sales.
Although no obvious truncation was visible, either in absolute magnitude or as a percent of sales, we cannot rule out the likelihood that acombination of cutoffs, both absolute and relative (as interpreted by a
30 Bound/Cummins/GrilicheslHall1Jaffe
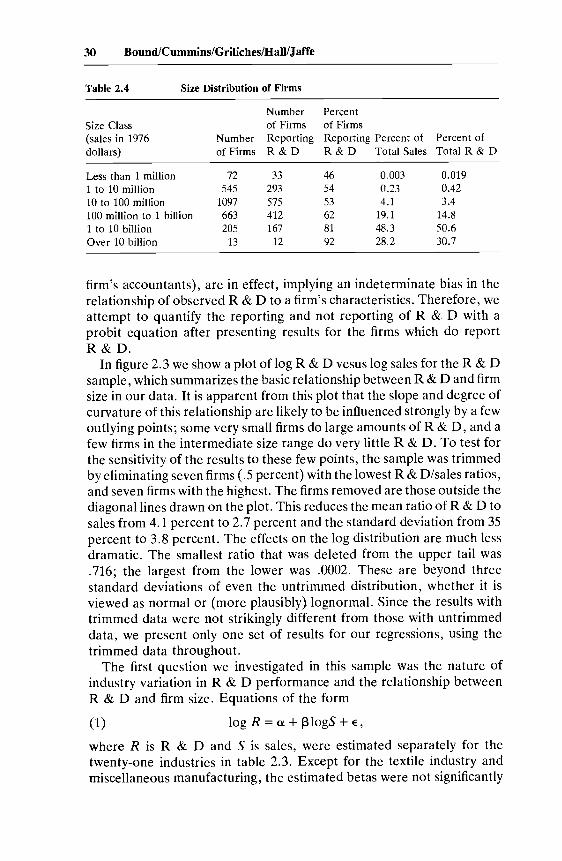
Table 2.4 Size Distribution of Firms
Number PercentSize Class of Firms of Firms(sales in 1976 Number Reporting Reporting Percent of Percent ofdollars) of Firms R&D R&D Total Sales Total R&D
Less than 1 million 72 33 46 0.003 0.0191 to 10 million 545 293 54 0.23 0.4210 to 100 million 1097 575 53 4.1 3.4100 million to 1 billion 663 412 62 19.1 14.81 to 10 billion 205 167 81 48.3 50.6Over 10 billion 13 12 92 28.2 30.7
firm's accountants), are in effect, implying an indeterminate bias in therelationship of observed R&D to a firm's characteristics. Therefore, weattempt to quantify the reporting and not reporting of R&D with aprobit equation after presenting results for the firms which do reportR&D.
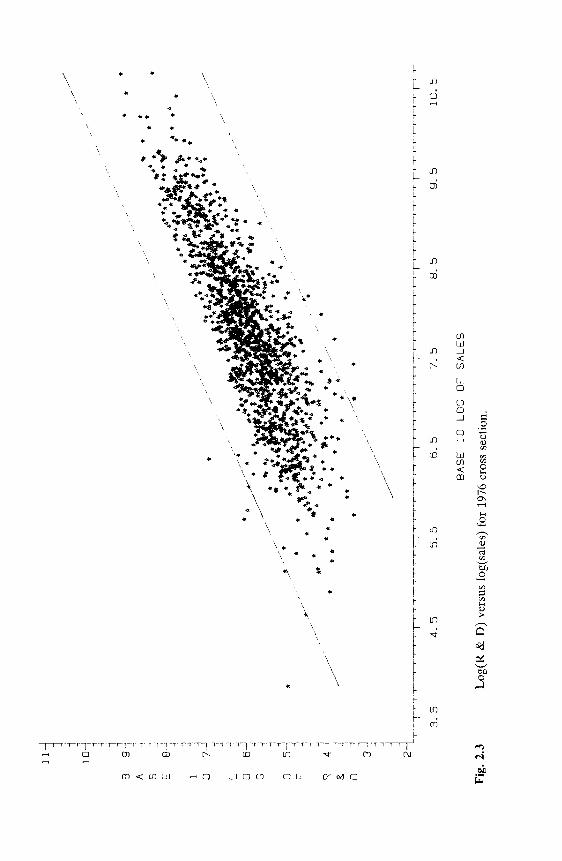
In figure 2.3 we show a plot of log R&D vesus log sales for the R&Dsample, which summarizes the basic relationship between R&D and firmsize in our data. It is apparent from this plot that the slope and degree ofcurvature of this relationship are likely to be influenced strongly by a fewoutlying points; some very small firms do large amounts of R&D, and afew firms in the intermediate size range do very little R&D. To test forthe sensitivity of the results to these few points, the sample was trimmedby eliminating seven firms (.5 percent) with the lowest R&D/sales ratios,and seven firms with the highest. The firms removed are those outside thediagonal lines drawn on the plot. This reduces the mean ratio of R&D tosales from 4.1 percent to 2.7 percent and the standard deviation from 35percent to 3.8 percent. The effects on the log distribution are much lessdramatic. The smallest ratio that was deleted from the upper tail was.716; the largest from the lower was .0002. These are beyond threestandard deviations of even the untrimmed distribution, whether it isviewed as normal or (more plausibly) lognormal. Since the results withtrimmed data were not strikingly different from those with untrimmeddata, we present only one set of results for our regressions, using thetrimmed data throughout.
The first question we investigated in this sample was the nature ofindustry variation in R&D performance and the relationship betweenR&D and firm size. Equations of the form
(1) log R = <X + 13 logS + e ,
where R is R&D and S is sales, were estimated separately for thetwenty-one industries in table 2.3. Except for the textile industry andmiscellaneous manufacturing, the estimated betas were not significantly
a F R & oF I R M 5 R E P a R T I N G
10
0j
%~
8°1J j
6°1~
40~
~
2°1-4 ot~-
-r"'"T.r
r.t-.-.t
..,.-r-r"'
--r--r-r-T
-r-~•.-.-
-t....-
.-.--r
-rr-r-
r-r.-t
.,I
II
JI-.-
-r-r--~~
.......,
II
II
II
II~
6.0
6.5
7.0
7.5
8.0
8.5
9.0
9.5
10
.0
SIZ
EC
LA
SS(B
ASE
10
LOG
OF
SA
LE
S)
Fig
.2.
1F
ract
ion
off
irm
sre
port
ing
R&
Dby
size
clas
s.F
irm
sw
ith
less
than
$1m
illi
onin
sale
sw
ere
adde
dto
the
smal
lest
size
clas
s,an
dth
ose
wit
hm
ore
than
$10
bill
ion
wer
ead
ded
toth
ela
rges
t.

80
-1 ~ -; .4"
..•
*•
* * ..
..*
*
~*
...i ., -4
40~ ~
70
-j -! -;50~
o FN60~
U-
M B E R
••" ..
...
... • •'"
•*
" ..
*"'..
'It
*
•*.
•,
...
...
.j
••••••
•*.'I
t.*
•••
*.."..
..*•
•I
••••••
"..
.
~...
...
...
°1
,-.r
-rt,
TT
T1
Trr
rrt'
-1t-
rr-
IT
r-r·
T"t
1·r
-....·
r·l·
TrT
"f"
r'·r
,r'T
iT-T
TI
r"T
TT
11
r,"
lT
r-t'
rT
Tl"'
lTl"
rn
rl,
'riT
,rrl-
rT
rr'r
lTrrriT
tt-
rfi·
t·,rt
rrr"
T"r
r'T
-,,'
T1
11
""lT
lr
lO~"'
i
30
-:F
~I
:R
20
-1-1
M~
S
o2
34
56
78
91
01
11
2
R&D
AS
PER
CEN
TO
FSA
LE
S
Fig
.2.
2D
istr
ibut
ion
ofR
&D
aspe
rcen
tofs
ales
for
firm
sre
port
ing
R&
D.
Obs
erva
tion
sw
ith
R&
D/s
ales
perc
enta
gegr
eate
rth
an12
are
not
show
n.
B A S E 1 o
Ilj 1
10
J ~ ~ Jg.
-J ~ -j ~
//
"1
./
8-j
,..,
J..
..,,/
~
,,-./
'
..,
,.,."./-'~
-1
7--1
I
~ ~
""ft
•....
..
*~
ft
Itlt
·'·1
·.~.
",
·:JJi
.~~n
·••
ft.f
t
"••
••t
't'.,'"
ill
II'
.i-
•
~~-,
•••~"
.*•
'"I
:•
.ti
t..~
.'\"
'\~"
'.M
*~.IL
•.!.
*
//
~/.--
/-'
•
//,,/.
ft*
*
..6'
*Ii
•6'
Ii*
.r'
•
~//'
-j6~~ j ~
5-i ~ ~
4-j ~
3J ~
2~T-r
TT."-r
--r-
,-,-
·-r-
r---
rrT
""·"
'"·.
--r-
T·-
·rT
-r-r
··T
-r-r
TT
-,-·
·,..
...,
.··.
,...
,.-r
'-T
-,-.
..,.
,·T,-..
.,.·-r.,..
..r,-~r-T·
r--r-..,.-
-r-,..r---
,--r·--.--
,-.-T--r-r
-r-.---r--
-.-r."....
..,---
R & oL o G o F
3.5
4.5
5.5
6.5
7.5
8.5
9.5
10
.5
Fig
.2.
3
BA
SE1
0LO
GO
FSA
LE
S
Log
(R&
D)
vers
uslo
g(s
ales
)fo
r19
76cr
oss
sect
ion.
34 Bound/Cummins/Griliches/HalllJaffe
different from one another statistically, and the R -squares were above.65. The remainder of the analysis was performed using uniform slopecoefficients, while allowing for different industry intercepts by usingindustry dummies. This was done primarily for convenience, but it is notinconsistent with the individual industry results. While such aggregationis rejected by a conventional F-test for the simple regression of log R&Don log sales (F[20, 1437] = 3.34), given the size of our sample one shouldreally use a much higher critical value (about 8), in which case one neednot reject it. 7
After accepting the hypothesis of equality of the slope coefficients, weestimated equations of the form
(2) log R = ~llogS + ~210gA + ~3(logS)2 + ~i + E,
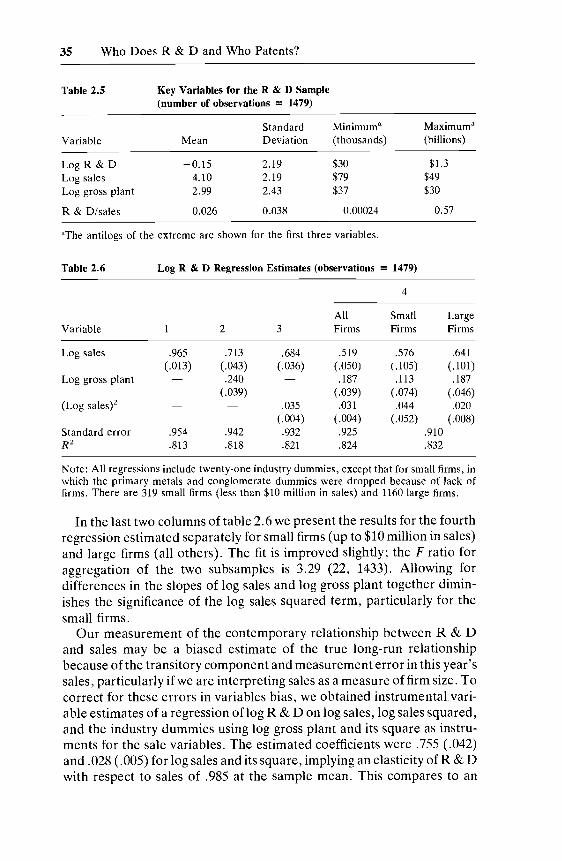
where Rand S are as previously defined, A is gross plant, and ~i is a set ofindustry intercepts. Simple statistics on the regression variables areshown in table 2.5 and basic regression results in table 2.6.
The first column in table 2.6 gives the results of the simplestregression.Although we know that this story is incomplete, this equation indicatesalmost no fall in R&D intensity with increasing firm size. An analysis ofvariance using this equation and restrictions on it is also interesting. Logsales explains 73 percent of the total variance in log R&D and 79 percentof the variance remaining after we control for the variations in industrymeans. Looked at the other way, the industry dummies explain 10percent of the total variance and 30 percent of the variance remainingafter we control for log sales.
The second column shows the effect of capital intensity on R&Dintensity. If we interpret this equation in terms of the equivalent regression of log R&D on log sales and log of the capital-sales ratio, we find itimplies a sales coefficient of .95, almost identical to that of the firstcolumn, and a complementarity between capital intensity and R&Dintensity (coefficient of .24 for log [gross plant/sales]). While this effect ishighly significant, its additional contribution to the fit is small.
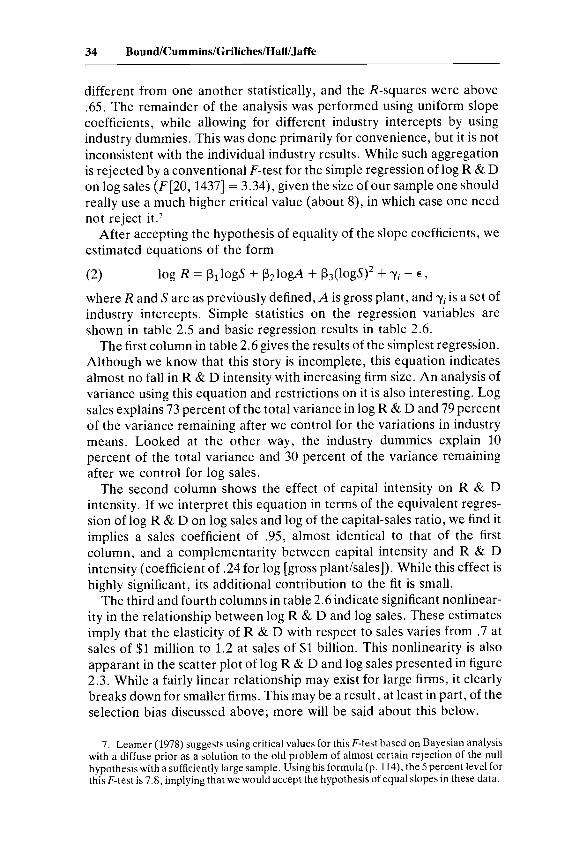
The third and fourth columns in table 2.6 indicate significant nonlinearity in the relationship between log R&D and log sales. These estimatesimply that the elasticity of R&D with respect to sales varies from .7 atsales of $1 million to 1.2 at sales of $1 billion. This nonlinearity is alsoapparant in the scatter plot of log R&D and log sales presented in figure2.3. While a fairly linear relationship may exist for large firms, it clearlybreaks down for smaller firms. This may be a result, at least in part, of theselection bias discussed above; more will be said about this below.
7. Leamer (1978) suggests using critical values for this F-test based on Bayesian analysiswith a diffuse prior as a solution to the old problem of almost certain rejection of the nullhypothesis with a sufficiently large sample. Using his formula (p. 114), the 5 percent level forthis F-test is 7.8, implying that we would accept the hypothesis of equal slopes in these data.
35 Who Does R&D and Who Patents?
Table 2.5
Variable
Log R&DLog salesLog gross plant
R&D/sales
Key Variables for the R&D Sample(number of observations = 1479)
Standard Minimuma Maximuma
Mean Deviation (thousands) (billions)
-0.15 2.19 $30 $1.34.10 2.19 $79 $492.99 2.43 $37 $30
0.026 0.038 0.00024 0.57
aThe antilogs of the extreme are shown for the first three variables.
Table 2.6
Variable
Log sales
Log gross plant
(Log sales)2
Standard errorR2
Log R&D Regression Estimates (observations = 1479)
4
All Small Large2 3 Firms Firms Firms
.965 .713 .684 .519 .576 .641(.013) (.043) (.036) (.050) (.105) ( .101)
.240 .187 .113 .187(.039) ( .039) (.074) (.046)
.035 .031 .044 .020(.004) (.004) (.052) (.008)
.954 .942 .932 .925 .910
.813 .818 .821 .824 .832
Note: All regressions include twenty-one industry dummies, except that for small firms, inwhich the primary metals and conglomerate dummies were dropped because of lack offirms. There are 319 small firms (less than $10 million in sales) and 1160 large firms.
In the last two columns of table 2.6 we present the results for the fourthregression estimated separately for small firms (up to $10 million in sales)and large firms (all others). The fit is improved slightly; the F ratio foraggregation of the two subsamples is 3.29 (22, 1433). Allowing fordifferences in the slopes of log sales and log gross plant together diminishes the significance of the log sales squared term, particularly for thesmall firms.
Our measurement of the contemporary relationship between R&Dand sales may be a biased estimate of the true long-run relationshipbecause of the transitory component and measurement error in this year'ssales, particularly if we are interpreting sales as a measure of firm size. Tocorrect for these errors in variables bias, we obtained instrumentaLvariable estimates of a regression of log R&D on log sales, log sales squared,and the industry dummies using log gross plant and its square as instruments for the sale variables. The estimated coefficients were .755 (.042)and .028 (.005) for log sales and its square, implying an elasticity of R&Dwith respect to sales of .985 at the sample mean. This compares to an

36 Bound/Cummins/Griliches/Hall1Jaffe
elasticity of .972 for equation (3) in table 2.6 and suggests that the errorsin variables bias, although probably present, are not very large in magnitude.
As a first step in our attempts to correct for possible bias from nonreporting of R&D, we estimated a probit equation whose dependentvariable was one when R&D was reported and zero otherwise. Themodel underlying this equation is the following: The true regressionmodel for R&D is
(3)
where Xi is a vector of firm characteristics such as industry and size, andEil is a disturbance. We observe R when it is larger than some (noisy)threshold value Ci , different for each firm. This model is a variation of thegeneralized Tobit model, described by many authors; this particularversion is in Nelson (1977) and is equivalent to a model described byGriliches, Hall, and Hausman (1978). Ci contains the 1 percent of salesrule and anything else the firm uses to decide whether R&D is "material," plus a stochastic piece, E2, which describes our inability to predictexactly when a firm will report:
(4)
In this framework, the probability of observing R&D may be expressed as Prob (El - E2> ZiO - Xi~ I Zi ,Xi)' If we assume El and E2 aredistributed jointly as multivariate normal, we get the standard probitmodel
(5)
where a is the variance of El - E2' and F(') is the cumulative normalprobability function. Since the probit model is only identified up to a scalefactor, we can only estimate ola and ~/a. Deriving the model in this wayalso reveals what it is we are estimating when we run a probit on this data:presumably Zi and Xi include many, if not all, of the same variables. Forexample, if the Zi were only log sales and the 1 percent rule was beingfollowed, the coefficient 0 would be unity, and if the true elasticity of R &D with respect to sales were also unity, the probit equation would yield asales coefficient of zero. However, if reporting depended only on theabsolute amount of R&D performed, then Ci would be a constant, andpredicting large R&D would be equivalent to predicting high reportingprobability; this hypothesis implies that the coefficients in the probitshould be the same as those in the R&D regression (up to a scale factor).Finally, if reporting depends in a more complex way on industry and sizeof the firm, then no obvious relationship is needed between the coefficients of the probit model and those of the regression.
37 Who Does R&D and Who Patents?
Table 2.7
Variable
Log sales(Log sales)2Log gross plantMills ratioStandard errorR2
Log R&D Regression Corrected for Selectivity Bias
Log R&D RegressionProbitEstimatesa Uncorrected Corrected
.016 (.051) .519 (.050) .536 (.050)
.0018 (.0050) .031 (.004) .032 (.004)
.140 ( .039) .186 (.039) .246 (.044).933 (.326)
.925 .923
.824 .825
(6)
Note: All models contain industry dummies.
aThese are the maximum likelihood estimates of the coefficients in equation (5), theprobability of R&D reporting. There are 2582 observations and 1479 report R&D. The X2
for the three variables besides the industry dummies is 233.
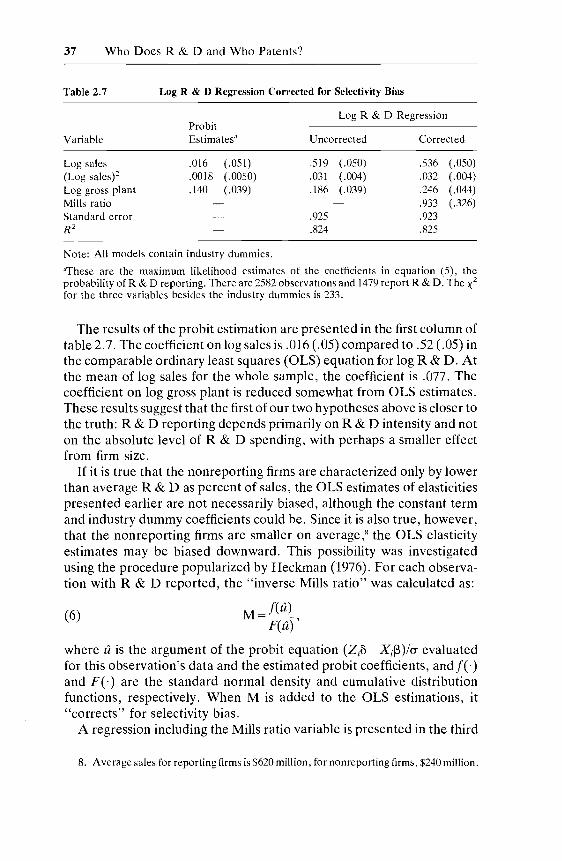
The results of the probit estimation are presented in the first column oftable 2.7. The coefficient on log sales is .016 (.05) compared to .52 (.05) inthe comparable ordinary least squares (OLS) equation for log R&D. Atthe mean of log sales for the whole sample, the coefficient is .077. Thecoefficient on log gross plant is reduced somewhat from OLS estimates.These results suggest that the first of our two hypotheses above is closer tothe truth: R&D reporting depends primarily on R&D intensity and noton the absolute level of R&D spending, with perhaps a smaller effectfrom firm size.
If it is true that the nonreporting firms are characterized only by lowerthan average R&D as percent of sales, the OLS estimates of elasticitiespresented earlier are not necessarily biased, although the constant termand industry dummy coefficients could be. Since it is also true, however,that the nonreporting firms are smaller on average,8 the OLS elasticityestimates may be biased downward. This possibility was investigatedusing the procedure popularized by Heckman (1976). For each observation with R&D reported, the "inverse Mills ratio" was calculated as:
M == feu)F(u) ,
where uis the argument of the probit equation (Zi() - X if3)!a evaluatedfor this observation's data and the estimated probit coefficients, and f(·)and F(·) are the standard normal density and cumulative distributionfunctions, respectively. When M is added to the OLS estimations, it"corrects" for selectivity bias.
A regression including the Mills ratio variable is presented in the third
8. Average sales for reporting firms is $620 million, for nonreporting firms, $240 million.

38 Bound/Cummins/Griliches/Hall1Jaffe
column of table 2.7, together with the "uncorrected" estimates for comparison. The coefficients on the Mills ratio is positive and significant,indicating the presence of selectivity bias. There is only a slight rise in thesales coefficients, however, and the nonlinearity is about the same. Thelargest increase is in the log gross plant coefficient, which was also thebest predictor of R&D reporting. Thus we would underestimate thecomplementarity of capital intensity and R&D intensity if we did nottake into account the fact that non-capital-intensive firms also tend to bethose which do not report R&D expenditures.
It should be emphasized that in this application of the Heckmantechnique the Mills ratios are nonlinear functions of all the other independent variables in the equation, because we have no variables thatpredict reporting but not quantity of R&D. For this reason, the incremental explanatory power of the M variable is caused solely by thenonlinearity of its relationship to the other variables in the model. Weknow, however, that the dependence of R&D on these variables is likelyto be nonlinear to begin with. In the absence of a reporting predictor thatis excluded from the quantity equation, it is impossible to distinguishselectivity bias and "true" nonlinearity in the R&D-size relationship.This makes it impossible to draw a definitive conclusion regarding thepossibility of bias in the OLS estimates.
2.4 Patenting
The matching project described in the section 2.1 yielded 4,553 patenting entities which were matched to the companies in our sample. Of our2582 companies, 1754 were granted at least one patent during the 196579 period, but only about 60 percent of that number applied for a patentin 1976. Firms with R&D programs are far more likely to apply forpatents: about 20 percent of the firms with zero or missing R&D have atleast one patent in 1976, but this fraction rises rapidly with size of R&Dprogram until well over 90 percent of firms with R&D larger than $10million have patents in 1976.
If we look at the size of the firm rather than the R&D program, 28percent of the small firms (less than $10 million in sales) applied for apatent in contrast to the 53 percent which reported R&D, but thisdifference results primarily from the integer nature of the patents data:When we consider all years rather than just 1976, the percentage whopatent rises to sixty. These same small firms account for 4.3 percent ofsales, 3.8 percent of R&D, but 5.7 percent of patent in our sample.However, the latter number may be an overestimate since we know thatapproximately one-third of all domestic corporate patents remain unmatched in 1976 in our sample, and it is likely that some of these belong to
39 Who Does R&D and Who Patents?
subsidiaries of our larger companies which we have overlooked. Furtherchecking of these patents is being done.
In table 2.3 we show the mean number of patents and number of firmswhich have one or more patents for each of our twenty-one industryclasses. As we expect, patenting is higher in the science-based or technological industries in terms of both the fraction of firms which patent andthe average number of patents taken out by the patenting firms. Theindustries with more than twenty-five patents per firm are chemicals,drugs, petroleum, engines, computers, electrical equipment, motor vehicles, aircraft and aerospace, and conglomerates. Presumably petroleum,motor vehicles, and conglomerates appear on this list partly because ofthe average size of the firms in those industries. On the other hand, thescientific instrument and the machinery industries have a large number ofpatents per R&D dollar but are composed of relatively small firms.
Earlier studies by Pakes and Griliches (1980) on a sample of 157 largeU.S. manufacturing firms show a strong contemporaneous relationshipbetween patent applications and R&D expenditures across firms inseveral industries, and they suggest that patents are a fairly good indicator of the inventive output of the research department of a firm. Weconsider the relationship again in figure 2.4. Because of the large sizerange of our firms, the patents-R & D relationship will be obscured bythe simple correlation between number of patents and size of firm.Therefore, we plot the log of patents normalized by gross plant versus thelog of R&D normalized by the same quantity for the firms which both doR&D and patent. The plot shows a strong correlation between patentingand R&D for those firms with a slope slightly greater than one and a hintof nonlinearity in the relationship (increasing slope for higher R&D).There is considerable variance: the range of patents per million dollars ofR&D for the firms which patent is from about one-seventh of a patent toninety patents. The typical firm has a ratio of about two, that is, half amillion dollars of R&D per patent. 9
This picture is slightly misleading, however, since it covers only onethird of our sample. Accordingly, when we turn to modeling the relationship, we want to include the zero observations on both patents andR&D in our estimation. We attempt to solve this problem in two ways:First we set log patents to zero for all zero patent observations and allowthose firms to have a separate intercept (PATDUM) in our regressions,as suggested by Pakes and Griliches (1980). It should be emphasized thatthere are about 1700 such observations, which suggest that the significance level of our estimates needs to be interpreted with caution. The
9. Scherer (1981), using data on 443 large industrial corporations comprising 59 percentof corporate patenting activity in the United States, found an R&D cost per patent of$588,000 for the period of June 1976 through March 1977 (adjusted to annual basis).

1-1
"'1
'"t-
-ltr
--tt
--r-
-t--
-t-t
t--1
"1-r
1-1-
-1--
"1--
-'-1
-'r'
t-'-
t--t
--r-
-t-t
-'--"
1---
t--"
'-1""
t-·r
--1-
-11-
--.-
r,..-
-t--
-r-.
.-.
,..-
-,--
r---
r--t
T'-
1-1
-t-T
-,"r-
t-'-
--r-
-1--
-rT
-"-I
'-'-
II--
r-r-
r-r
0.5
0.0
• ••
**
••..
•,.
**\.
.
*•
•*
...... .. -0.5
...• **
-1.
a
..'* ..•
-1
.5
*
..
-2.0
*
*...
•* ..
*
-2.5
*....
•
,,"",
,"t
""
""
"""
t.~
"""",,
.,"
""
•"."
.**
,,~:*
***
**..
.*..
*'
.."\
t**
.*
**:
*•.,
.*"
*•
*,,":~
f**•
••")
"tIt"
'''*.
It"'.
;1"*,
t:'*
l-
"~.*
..~...
"tB.lI"
"'.l·
,:.'...1**
""•.
""*,,~
**,,
*'"
..••
".*~
u.S('
t:.
:"*:
'"'*
**
*....
..~...
.....~
,.'V,*
••*
•'\r
:~
",itt:'
:;.V
r~*~
~**tt'
tl'."
'/t
*•
**
•",
,'"
\**
"",
•.\
..~..
.."I
-:*
•*
*.
*"••
**
,,"*
*....
•"
*"*"
*."
**
..,.
.*-"
**
"*
•*..
.*
•
••
•
-3.0
L2
·°1 -l I
01
.5l
G1
11
·°1
01
0.5-
10
o.o~
F1 r l
p-0.5~
AJ I
T-1
.0-
1E
I
N-1
.5~
T-1
s-2
.0-1
/j !
*A
-2.5~
i
S-4
Sj
-3.0
"""1
E T-3.
S{S
-'T
-tr
1
-3.5
BA
SE1
0LO
GO
FR
&O
/AS
SE
TS
Fig
.2.
4P
lots
oflo
g(pa
tent
s/as
sets
)ve
rsus
log(
R&
D/a
sset
s)fo
r19
76cr
oss
sect
ion.
41 Who Does R&D and Who Patents?
estimates we obtain imply that the observations with no patents have anexpected value of about one-half of a patenL Second, we model thepatents properly as a counts (Poisson) variable, taking on values 0, 1,2,etc., as suggested by Hausman, Hall, and Griliches (1984). In this case,with our many small and few very large observations, the Poisson modelturns out to give quite different results from the logarithmic OLS model.
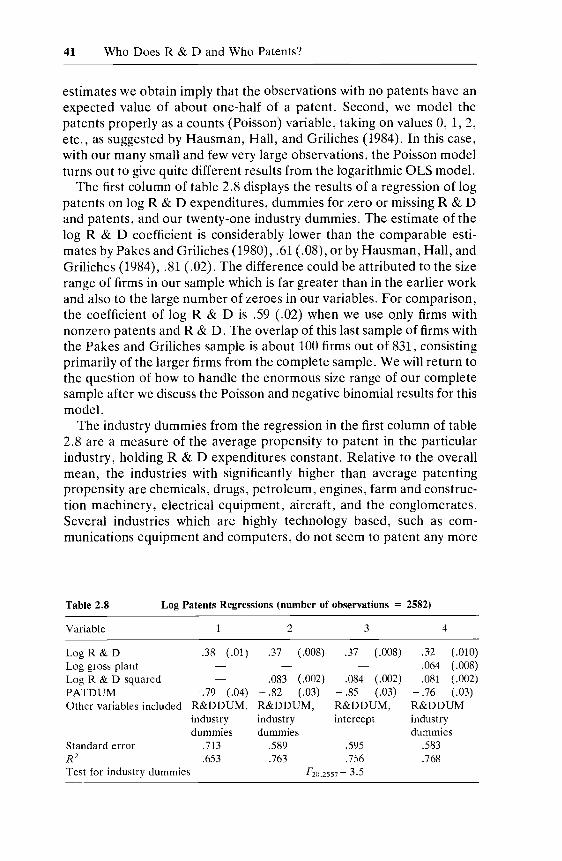
The first column of table 2.8 displays the results of a regression of logpatents on log R&D expenditures, dummies for zero or missing R&Dand patents, and our twenty-one industry dummies. The estimate of thelog R&D coefficient is considerably lower than the comparable estimates by Pakes and Griliches (1980), .61 (.08), or by Hausman, Hall, andGriliches (1984), .81 (.02). The difference could be attributed to the sizerange of firms in our sample which is far greater than in the earlier workand also to the large number of zeroes in our variables. For comparison,the coefficient of log R&D is .59 (.02) when we use only firms withnonzero patents and R&D. The overlap of this last sample of firms withthe Pakes and Griliches sample is about 100 firms out of 831, consistingprimarily of the larger firms from the complete sample. We will return tothe question of how to handle the enormous size range of our completesample after we discuss the Poisson and negative binomial results for thismodel.
The industry dummies from the regression in the first column of table2.8 are a measure of the average propensity to patent in the particularindustry, holding R&D expenditures constant. Relative to the overallmean, the industries with significantly higher than average patentingpropensity are chemicals, drugs, petroleum, engines, farm and construction machinery, electrical equipment, aircraft, and the conglomerates.Several industries which are highly technology based, such as communications equipment and computers, do not seem to patent any more
Table 2.8 Log Patents Regressions (number of observations = 2582)
Variable 2 3 4
.32 (.010)
.064 (.008)
.081 (.002)- .76 (.03)R&DDUMindustrydummies
.583
.768.595.756
F20 ,2557 = 3.5
.37 (.008) .37 (.008)
.084 (.002)- .85 (.03)R&DDUM,intercept
.083 (.002)- .82 (.03)R&DDUM,industrydummies
.589
.763
.38 (.01)Log R&DLog gross plantLog R&D squaredPATDUM - .79 (.04)Other variables included R&DDUM,
industrydummies
.713
.653Standard errorR2
Test for industry dummies

42 Bound/Cummins/Griliches/Hall1Jaffe
than the average: in fact, a firm in the computer industry has 85 percent ofthe patents of an average firm doing the same amount of R&D.
To allow for possible nonlinearity in the patenting-R & D relationship,we add the log of R&D expenditures squared to the regression in columntwo of table 2.8. This coefficient is highly significant and implies asubstantially higher propensity to patent for firms with larger R&Dprograms, with an elasticity of .25 at R&D of half a million, rising to overunity at R&D expenditures of $100 million. The F-test for the industrydummies is now F(20, 2557) == 3.5, implying very little difference in theaverage propensity to patent across industries once we allow R&D tohave a variable coefficient. This is a bit surprising and probably reflectsthe nonhomogeneity of the firms in our industry classes and the problemsassociated with assigning each firm to one and only one industry. Theindustries which have coefficients significantly different from the averageare the petroleum industry (patenting 30 percent higher on average),engines, farm and construction machinery (28 percent), conglomerates(76 percent), and computers (20 percent less on average). We reestimated the equation with no industry dummies (column three of table 2.8)and found that the slopes hardly changed; this result held true for severaldifferent specifications of the model, including one with only the log ofR&D in the equation. 10 Although we believe that there are significantdifferences in the relationship of R&D and patenting at the detailedindustry level from inspection of the distribution of the two variables byindustry, these differences do not affect the basic results of this aggregatestudy. We have therefore omitted the industry dummies for the sake ofsimplicity in what follows.
In the fourth column of table 2.8 we add the log of gross plant value tothe regression to control for firm size independently of R&D expenditures. Larger firms may patent more often simply because they are biggerand employ patent lawyers and other personnel solely for this purpose.The coefficient estimate for log gross plant lends some support to thishypothesis. However, one should be careful in interpreting the estimatedsize (assets) effects. To a significant extent they may be just compensatingfor transitory and timing errors in our R&D measure. The equationestimated assumes that this year's patents applied for depends only onthis year's R&D expenditures. We know that this ~s not exactly correct(see Pakes and Griliches, this volume). Some of the patents applied forare the result of R&D expenditures in years past, while not all of theR&D expenditures in this year will result in patents, even in subsequent
10. We also looked at this question for two different size classes of firms: above andbelow $100 million in gross plant. We found that the smaller firms had a lower R&Dcoefficient (.26 in contrast to .36) and slightly less curvature. For the smaller firms, theindustry dummies were completely insignificant, whereas they remained at about the samelevel for the large firms.
43 Who Does R&D and Who Patents?
years. In this sense, the R&D variable is subject to significant errorwhich will be exacerbated once we control for size, thereby reducing thesignal-to-noise ratio. This may explain both the reduction of the R&Dcoefficient when assets are introduced as a separate variable and therather large estimated pure size effect. We cannot do much about this inthis paper, but we shall return to this topic when we turn to the panelaspects of this data set in later work.
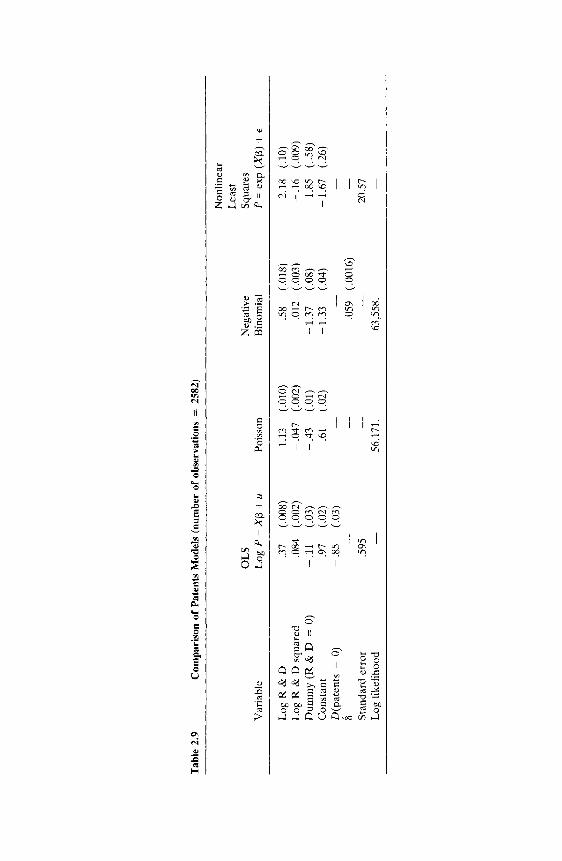
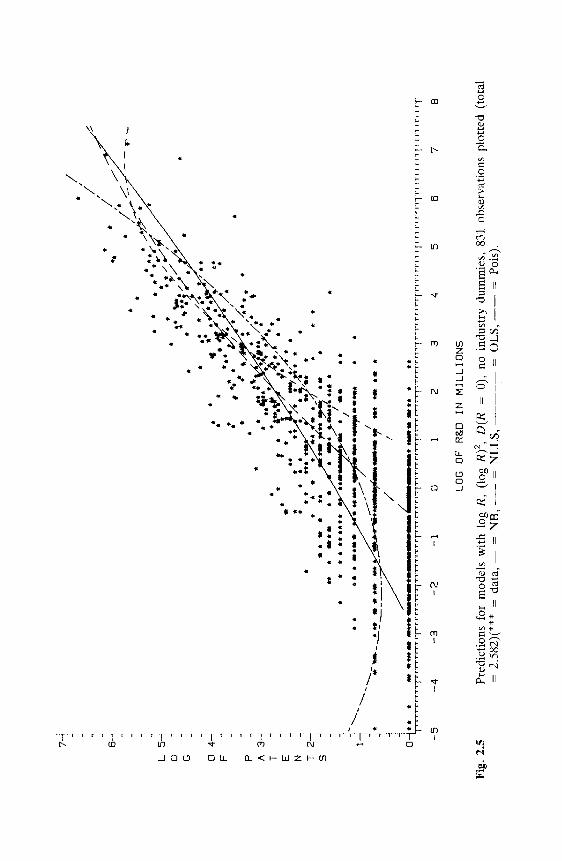
We now turn to the Poisson formulation of the patents model. Thismodel treats the patents for each firm as arising from a Poisson distribution whose underlying mean is given by exp(X~), where X~ is a regression function of the independent variables in our model. Coefficientsestimated for this model are directly comparable to those from a logpatents regression; we have merely taken account of the fact that thedependent variable is nonnegative counts rather than continuous.However, for our data we might expect the Poisson formulation of themodel to give quite different answers from a simple log patents regressionfor two reasons: First, over half of our observations on patents are zero,and many are quite small. Second, the Poisson objective function tends togive the largest observations more weight than least squares on logpatents, therefore these observations will have more influence on theresults. This is what we find in our results, which are shown in the secondcolumn of table 2.9, together with the OLS estimates for comparison.The OLS estimates imply an elasticity of patenting with respect to R&Dwhich rises from zero at $100,000 of R&D to well above one at $1 billion.For the Poisson model, on the other hand, the elasticity is one at $4million of R&D and falls to one-half at $1 billion. This is because thevery largest firms do less patenting per R&D dollar than would bepredicted by a linear regression of log patents on log R&D, and they arehaving more influence on the Poisson estimates than the OLS. We showthis graphically in figure 2.5: What is plotted is the predicted logarithm ofpatents versus the logarithm of R&D expenditures, superposed on theactual data. Clearly the differences in fit of the models are most pronounced in the tails of the distribution.
As was pointed out by Hausman, Hall, and Griliches (1984), thePoisson model is highly restrictive, since it imposes a distribution on thedata whose mean is equal to its variance. This property arises from theindependence assumed for the Poisson arrival of "events" (patent applications) and is unlikely to be true, even approximately, of our data.One way out of this problem is the negative binomial model in which thePoisson parameter is drawn from a gama distribution with parametersexp (X~) and &. We estimated such a model in the third column of table2.9 and found that the results, although qualitatively closer to the OLSestimates than to the Poisson, produce quite different predictions overthe range of the data and imply a lower and less varying elasticity of
Tab
le2.
9C
ompa
riso
no
fP
aten
tsM
odel
s(n
umbe
rof
obse
rvat
ions
=25
82)
OL
SV
aria
ble
Log
P=
Xf3
+u
Poi
sson
Log
R&
D.3
7(.
008)
1.13
(.01
0)L
ogR
&D
squa
red
.084
(.00
2)-.
04
7(.
002)
Dum
my
(R&
D=
0)-
.11
(.03
)-.
43
(.01
)C
onst
ant
.97
(.02
).6
1(.
02)
D(p
aten
ts=
0)-
.85
(.03
)& S
tand
ard
erro
r.5
95L
ogli
keli
hood
-56
,171
.
Neg
ativ
eB
inom
ial
.58
(.01
8).0
12(.
003)
-1.3
7(.
08)
-1.3
3(.
04)
.059
(.00
16)
63,5
58.
Non
line
arL
east
Squ
ares
P=
exp
(Xr3
)+
E
2.18
(.10
)-
.16
(.00
9)1.
85(.
.58)
-1.6
7(.
26)
20.5
7
* ..*
*•
./ /' ,*
,[/
/~/-
-r-
,,~
**
*/~
•..
..:*
;•
~*/~I
t...
..../;/
A•
ft·:J.~.
*•••
/i;:."
••••
..••
.,;Y
.*'/
to.
*.
•~7*..
..
•*
.**.~~
"/*
•#
*.*
V/
*I
...;,.
4*.
*•
.\*
*/".
,•~
**~.**
/:*
.*~.
.~
r*•
*.
**J
•'*
..*....
~t~
*"•
•i
..•
•",*
:.t'*
j:
*:
*:*~
•~
*~
"r".
..••
2-J
*.
***
*/.~
.....*
*~
•*
....*
to:"
*...~**.
*....7
*.
..*J
**•
_*.*.
;Z./'~**".
j*
*.*
******..
19ft
*I..
**...
.../
1j
.........~
··.*
•-...
....
.~_
......,
......
.•
I..
....
....
....'-
.--'
/
j*.-
....-
-.!...~
........_~..
,.-..
.,..
...,
........
~----
//
oj*
**
.---(
--*
**
*.l.fr=
r••r
,TM
1-r
r-M
-rl-
-r-t
11
''trr
-rrl
't"r
rr"t
·r-r
--""
,·r-
r--r
-rrr
--r-
t-r-
r-rr
·rlr
-r-l
--r"
!r-.
..-t
"11
11
'1 -
rri '
TT
·,r,
--n
-n-1
Tr-
rrr-
rr-r
rrT
--rn
Ttr
rrr-
·p,,
·rrr
-rr-
r-·1
1T
1"r
-lrt
-rrr
T-,
.-t-
rlrr
r-r-
TT
~4~ ~
P~
A3J
T!
E N T 5
7-1..J I -! j
6-1-i ~ ~ ~
L5~
o G
-5-4
-3-2
-1o
23
45
67
8
Fig.
2.5
LOG
OF
R&D
INM
ILL
ION
S
Pre
dict
ions
for
mod
els
wit
hlo
gR
,(l
ogR
)2,
D(R
=0)
,no
indu
stry
dum
mie
s,83
1ob
serv
atio
nspl
otte
d(t
otal
=2.
582)
(***
=da
ta,
-=
NB
,---
=N
LL
S,-----
=O
LS
,--
=P
ais)
.

46 Bound/Cummins/Griliches/Hall/Jaffe
patenting with respect to R&D. The range of elasticities is now .55 at$100,000 in R&D to .66 at $1 billion. A typical firm with zero or missingR&D is predicted to have applied for 1.3 patents in 1976, as opposed to2.4 under the OLS model.
A defect of the negative binomial model is that it imposes a specificdistribution, namely gamma, on the multiplicative disturbance. Unlikethe least squares case, if this distribution is wrongly specified, the resulting maximum likelihood estimates may be inconsistent. For this reasonand because of the large swings in our estimates under the models wetried, we also estimated our model with nonlinear least squares usingpatents as the dependent variable, which was proved by Gourieroux,Monfort, and Trognon (1981) to be consistent for a wide class of Poissontype models. This produced the result shown in the last column of table2.9. The discrepancies between these estimates and those of the Poissonmodel are a kind of "specification" test, since both are consistent estimates of a large class of count models with additive or multiplicativedisturbances. Our data, however, have one feature which violates theassumptions of most of these models: not only is the residual variance ofpatents larger than the mean, but the ratio increases as the magnitude ofthe exogenous variables (R & D) increases (see Hausman, Hall, andGriliches 1984). This implies a correlation between the X's in the modeland the disturbance which can lead to inconsistent estimates of the slopeparameters. Figure 2.5, which displays the nonzero portion of the datadistribution with the predictions for our various specifications superimposed, reveals that in trying to impose a quadratic on our data to look forscale effects we may mislead ourselves seriously because of the very largerange of the data and the peculiar distribution of the dependent variable.It appears that the form we choose for the error distribution of the patentsvariable will have a considerable effect on the results. It should beemphasized that this result does not depend only on the large number ofzero observations in the data: we obtained qualitatively the same resultswhen we reestimated, including only those firms with both nonzeropatents and R&D.
Because of the increasing variance with R&D and the difficulty ofchoosing a proper functional form for both tails of the distributionsimultaneously, we chose to look at the interesting questions in this data(the existence of a patenting threshold and the measurement of returns toscale at the upper end of the R&D distribution) by dividing the sampleinto two parts, using R&D as the selection variable. To do this we firstplotted the patents-R & D ratio for firms with both patents and R&Dgrouped by R&D size class, as shown in figure 2.6. This plot is consistentwith a patenting elasticity of considerably less than one up to about $1 or$2 million of R&D and an elasticity of about one after that, with a hint of

~\ \
p
35 1
~30~
E...;
N~
~25 1 ~20 1
~15~
~~
:
10 1
o4
t51
~otrrn
TT1"TfTT'"
~TTff'..-n
rrrnTr,..r
n'Tf..,...
-n-rrrr""'
TtTT-rtTTj
TTTT'-rrrt
""f'"rrnTr
nnnn
n'Tn
Tn~r~T
nn~n
,.nn
n~~5
.05
.25
.45
.65
.86
.06
.26
.46
.66
.87
.07
.27
.47
.67
.8
R&D
SIZ
EC
LASS
(BA
SE10
LOG
OF
R&D
)
Fig
.2.
6P
aten
tspe
rm
illi
onR
&D
doll
ars
byR
&D
size
clas
sfo
rfi
rms
wit
hbo
thR
&D
and
pate
nts.
48 Bound/Cummins/Griliches/HalllJaffe
downturn at the upper end (above $100 million). Accordingly, we dividedour sample into two groups: those with R&D greater than $2 million andthose with R&D less than $2 million or missing.
The coefficients of interest from estimates on the two groups of firmsare shown in table 2.10 and the differences between them are striking.The small firms show both the features we might have expected: thePoisson-type models all are quite different from OLS on log patents,since most of these firms have less than five patents, and the estimates areall much closer to each other, since the problem of inconsistency arisingfrom the increasing variance of patents is considerably mitigated. Substantively, there is no real evidence of curvature in the relationship ofR&D and patents at this end of the distribution, and the elasticity ofpatenting with respect to R&D is close to the earlier estimates for largefirms, albeit not very well determined.
Turning to the larger firms, as we might expect, since the range ofR&D is about ten times that of the smaller firms, there is considerablymore variation in the estimates. The log patents regression estimates aremuch closer to the others, since the integer nature of the patents data isnot much of a problem here. However, there does seem to be someevidence of a decrease in the elasticity of patenting with respect to R&Dfor the largest firms. The Poisson and nonlinear least squares estimatesexhibit increasing returns up to about $20-40 million of R&D and thenstart declining, whereas the OLS and negative binomial estimates showdecreasing returns with a slightly higher elasticity than the smaller firmsthroughout. It is clear, however, that we have not really solved thespecification problem for these large firms. The predicted values fromthese estimates exhibit nearly the same sensitivity to exactly how weweight the observations as did those from the whole sample. Our tentative conclusion is that there are nearly constant returns to scale in patenting throughout the range of R&D above $2 million, with decreasingreturns setting in some place above $100 million.
2.5 Conclusion
We began this paper with a question: Who does R&D and whopatents? We can now provide at least a partial answer. We have seen thatresearch and development is done across all manufacturing industrieswith much higher intensities in such technologically progressive industries as chemicals, drugs, computing equipment, communication equipment, and professional and scientific instruments. We have found anelasticity of R&D with respect to sales of close to unity, but we alsofound significant nonlinearity in the relationship, implying that both verysmall and very large firms are more R&D intensive than average-size

Tab
le2.
10E
stim
ates
for
Tw
oR
&D
Size
Cla
sses
Non
line
arO
LS
Neg
ativ
eL
east
Squ
ares
Var
iabl
elo
gP
=X
J3+
uP
oiss
onB
inom
ial
P=
exp
(XJ3
)+
E
Smal
lF
irm
s(N
=21
02)
Log
R&
D.1
0(.
03)
.62
(.06
).4
9(.
10)
.58
(.32
)L
ogR
&D
squa
red
.017
(.00
6).0
14(.
020)
.026
(.03
0)-.
00
4(.
193)
Ela
stic
ity
(R&
D=
$100
k).0
2.5
6.3
7.6
0E
last
icit
y(R
&D
=($
2M)
.12
.64
.53
.57
Lar
geF
irm
s(N
=48
0)
Log
R&
D.9
0(.
12)
1.57
(.02
).9
0(.
08)
2.19
(.22
)L
ogR
&D
squa
red
-.0
03
(.02
)-
.098
(.00
3)-.
03
4(.
009)
-.1
6(.
02)
Ela
stic
ity
(R&
D=
$2M
).9
01.
43.8
51.
97E
last
icit
y(R
&D
=$1
00M
).6
5.6
7.5
9.7
2
50 Bound/Cummins/Griliches/Hall1Jaffe
firms. 11 This effect remained after an attempt to account for the (possibly)nonrandom selection of the dependent variable, although the lack of anexclusion restriction in this procedure casts some doubt on the completeness of this correction. We also found evidence of complementaritybetween capital intensity and R&D intensity, which was increased whenwe corrected for the selectivity of R&D.
These results are contrary to the preponderance of previous work onthe size-R & D intensity relationship. 12 Hamberg (1964) and Comanor(1967) found a weakly decreasing relationship between R&D intensityand firm size. Scherer (1965a) found that R&D intensity increased withfirm size up to an intermediate level, and then decreased (except in thechemical and petroleum industries, in which it increased throughout).This has been interpreted to imply, for most industries, a threshold sizenecessary before R&D is performed, presumably because of fixed costsin performing R&D (Kamien and Schwartz 1975). As noted above, ourresults suggest the opposite, though the selectivity issue precludes adefinitive conclusion. In any case, these data cast strong doubt on theexistence of any significant R&D threshold. 13
There are several possible reasons for these conflicting results. First,earlier studies were based on small samples of larger companies of theFortune 500 variety. An attempt was made to approximate these samplesby estimating equation (3) of table 2.6 on those firms with sales of $500million or more (256 observations). This regression indicates that thissample difference is not the source of the discrepancy; the relationshipwas close to linear with an implied elasticity of R&D with respect to salesof 1.23 at sales of $1 billion. I4
In addition, our R&D variable is an expenditure variable, whereasmuch of the previous work used the number of R&D employees. IfR&D expenditures per research employee rise fast enough with incr~as
ing firm size, perhaps because of greater capital intensity of R&D, wewould expect the observed difference in the results. It is not possible,with these data, to test this hypothesis.
Finally, it is possible that the size-R & D intensity relationship haschanged since the earlier work was done. IS Because that work did notlook at small firms at all, it would be sufficient to postulate increased
11. It should be emphasized, however, that our finding of increasing R&D intensity asfirm size rises does not necessarily imply returns to scale in R&D unless one assumeshomogeneity of some degree in the R&D production function (see Fisher and Temin 1973,1979).
12. See Kamien and Schwartz (1975) for a summary.13. These data also do not support the existence of a peculiar size-R & D intensity
relationship in the chemical or petroleum industries.14. The coefficients (standard errors) were: log sales: 1.29 (.61); log sales squared:
- .008 (.038).15. Hamberg used 1960 data; Comanor used 1955 and 1960 data; Scherer used 1955
data.

51 Who Does R&D and Who Patents?
relative R&D intensity by the largest firms to reconcile their results withours. We hope that our examination of the time-series component of thisdata set will shed some light on this question.
Turning to the second question in our title, we have found that some,but not all, of the firms which do R&D also patent, and that there is astrong relationship between the two activities throughout our sample.The small firms which do R&D tend to patent more per R&D dollarthan larger firms, and firms with R&D programs larger than about $1 or$2 million have a nearly constant ratio of patenting to R&D throughoutthe sample, except for the firms with the very largest R&D programs.
Previous research on the relationship of R&D and patenting, inparticular Scherer (1965b), has tended to focus on the largest U.S.corporations. Scherer found an elasticity of patenting with respect toR&D employment of unity with a hint of diminishing returns at thehighest R&D input intensity. Our data do not contradict this result, butthey do suggest that for these larger firms the elasticity of patenting withrespect to R&D may have fallen slightly between 1955 and 1976.However, measurement issues cloud this conclusion since we are relatingcontemporary R&D expenditures and successful patent applications,while Scherer looks at patents granted and the number of R&D employees (lagged by four years). It is not easy to say a priori whichrelationship will be most free of noise, and we must wait for time-seriesstudies to give us a better reading on the precise relationship of the twovariables. Work thus far (Pakes and Griliches 1980; Pakes 1981) hasshown a strong contemporaneous relationship of R&D and patentapplications, but it has also found a total elasticity closer to one whenlagged R&D is included.
These data also confirm and extend what others, including Scherer,have observed: a higher output of patents per R&D dollar for smallerfirms. However, our results are for many more smaller firms than previously, and they show much sharper decreasing returns both in themeasured elasticity and in the basic patents-to-R & D ratio. We alsofound that for this sample it mattered very much whether we used amodel and estimation method which allowed for zero-valued observations.
In looking at these results on smaller firms, however, it is important toemphasize that although we include all manufacturing firms in our sample, whether or not they do R&D or patent, another kind of selectivity isat work: for a smaller firm, whether or not it appears on the Compustatfile in the first place is a sign of success of some sort, or of a need forcapital. The basic definition which gets a firm into the sample (if it is notautomatically included as a result of being traded on a major stockexchange) is that it "commands sufficient investor interest." One of thelikely causes of interest is a successful R&D program, and hence some

52 Bound/Cummins/Griliches/Hall/Jaffe
patent applications. Thus we tend to observe small firms only when theyhave become "successful," whereas almost all large firms are publiclytraded and will appear in our sample whether or not they have beenparticularly successful recently in research or innovation. We find itdifficult to argue purely from this data that small firms have a higherreturn to R&D when we have reason to believe that only those which aresuccessful at R&D are likely to be in our sample in the first place.
This is our first exploration of this rather large and rich data set. Wehope to focus in the near future on the time-series characteristics of thesedata. We expect to be able to construct a consistent set of data for at leastseven years (1972-78) for over a thousand firms. This should allow us toinvestigate more thoroughly some of these same questions and also manyother aspects of R&D and patenting behavior.
AppendixComposition of Industry Classes
Industry
Food and kindred productsTextiles & apparelChemicals, excluding drugsDrugs & medical instrumentsPetroleum refining & extractionRubber & misc. plasticsStone, clay, and glassPrimary metalsFabricated metal productsEngines, farm & construction equipmentOffice, computers, & accounting equipmentOther machinery, not electricElectric equipment & suppliesCommunication equipmentMotor vehicles & transportation equipmentAircraft & aerospaceProfessional & scientific equipmentLumber, wood & paperMiscellaneous consumer goodsMiscellaneous manufacturers, n.e.c.
Included SIC Groups
2022,2328, excluding 2830, 28442830, 2844, 3841, 38432930323334, excluding 34803510--35363570,357335, excluding 3510--3536, 35736, excluding 3650--36793650--367937, excluding 3720--3729, 37603720--3729, 376038, excluding 3841, 384324,25,2621, 31, 3480, 3900--398927,3990

53 Who Does R&D and Who Patents?
References
Comanor, W. S. 1967. Market structure, product differentiation, andindustrial research. Quarterly Journal ofEconomics 81, no. 4:639-57.
Fisher, Franklin M., and Peter Temin. 1973. Returns to scale in researchand development: What does the Schumpeterian hypothesis imply?Journal of Political Economy 81, no. 1:56-70.
---.1979. The Schumpeterian hypothesis: Reply. Journal ofPoliticalEconomy 87, no. 2:386-89.
Gourieroux, C., A. Monfort, and A. Trognon. 1981. Pseudo maximumlikelihood methods: Applications to Poisson models. Universite ParisIX, CEPREMAP, and ENSAE, December.
Griliches, Zvi, Bronwyn H. Hall, and Jerry A. Hausman. 1978. Missingdata and self-selection in large panels. Annales de l'INSEE 30-31(April-September): 137-76.
Hamberg, D. 1964. Size of firm, oligopoly, and research: the evidence.Canadian Journal of Economics 30:62-75.
---. 1967. Size of enterprise and technical change. Antitrust Law andEconomics 1, no. 1:43-51.
Hausman, Jerry A., Bronwyn H. Hall, and Zvi Griliches. 1984. Econometric models for count data with an application to the patentsR&D relationship. Econometrica, forthcoming.
Heckman, James J. 1976. The common structure of statistical models oftruncation, sample selection, and limited dependent variables and asample estimator for such models. Annals of Economic and SocialMeasurement 5: 475-92.
Kamien, Morton I., and Nancy L. Schwartz. 1975. Market structure andinnovation: A survey. Journal of Economic Literature 13:1-37.
Leamer, Edward E. 1978. Specification searches: Ad hoc inferences withnonexperimental data. New York: Wiley.
National Register Publishing Company. 1972. 1976. Dictionary ofcorporate affiliations. Skokie, Illinois.
National Science Foundation. 1979. Research and Development in Industry, 1977. Surveys of Science Resources Series, Publication no. 79-313.
Nelson, Forrest D. 1977. Censored regression models with unobservedstochastic censoring thresholds. Journal of Econometrics 6:309-22.
Pakes, Ariel. 1981. Patents, R&D, and the one period rate of return.NBER Discussion Paper no. 786.
Pakes, Ariel, and Zvi Griliches. 1980. Patents and R&D at the firmlevel: A first report. Economics Letters 5:377-81.
San Miguel, Joseph G., and Shahid L. Ansari. 1975. Accounting bybusiness firms for investment in R&D. New York University, August.

54 Bound/Cummins/Griliches/Hall/Jaffe
Scherer, F. M. 1965a. Size of firm, oligopoly, and research: A comment.Canadian Journal of Economics 31, no. 2:256-66.
---. 1965b. Firm size, market structure, opportunity, and the outputof patented inventions. American Economic Review 55, no. 5:10971125.
---. 1981. Research and development, patenting, and the microstructure of productivity growth. Final report, National Science Foundation, grant no. PRA-7826526.
Standard and Poor's Compustat Service, Inc. 1980. Compustat II. Englewood, Colorado.