Embed Size (px)
Citation preview
UNITED STATESSECURITIES AND EXCHANGE COMMISSION
Washington, DC 20549
FORM 10-K
☒ ANNUAL REPORT PURSUANT TO SECTION 13 OR 15(d) OF THE SECURITIES EXCHANGE ACT OF 1934
For the fiscal year ended December 31, 2020or
☐ TRANSITION REPORT PURSUANT TO SECTION 13 OR 15(d) OF THE SECURITIES EXCHANGE ACT OF 1934
For the transition period from to
Commission File Number 1-12298 (Regency Centers Corporation)Commission File Number 0-24763 (Regency Centers, L.P.)
REGENCY CENTERS CORPORATIONREGENCY CENTERS, L.P.
(Exact name of registrant as specified in its charter)
FLORIDA (REGENCY CENTERS CORPORATION) 59-3191743DELAWARE (REGENCY CENTERS, L.P.) 59-3429602
(State or other jurisdiction of incorporation or organization) (I.R.S. Employer Identification No.)
One Independent Drive, Suite 114Jacksonville, Florida 32202
(904) 598-7000
(Address of principal executive offices) (zip code) (Registrant's telephone number, including area code)
Securities registered pursuant to Section 12(b) of the Act:Regency Centers Corporation
Title of each class Trading Symbol Name of each exchange on which registeredCommon Stock, $.01 par value REG The Nasdaq Stock Market LLC
Regency Centers, L.P.
Title of each class Trading Symbol Name of each exchange on which registeredNone N/A N/A
Securities registered pursuant to Section 12(g) of the Act:
Regency Centers Corporation: None
Regency Centers, L.P.: Units of Partnership Interest
Indicate by check mark if the registrant is a well-known seasoned issuer, as defined in Rule 405 of the Securities Act.
Regency Centers Corporation Yes ☒ No ☐ Regency Centers, L.P. Yes ☒ No ☐
Indicate by check mark if the registrant is not required to file reports pursuant to Section 13 or Section 15(d) of the Act
Regency Centers Corporation Yes ☐ No ☒ Regency Centers, L.P. Yes ☐ No ☒
Indicate by check mark whether the registrant (1) has filed all reports required to be filed by Section 13 or 15(d) of the Securities Exchange Act of 1934 during the preceding12 months (or for such shorter period that the registrant was required to file such reports), and (2) has been subject to such filing requirements for the past 90 days.
Regency Centers Corporation Yes ☒ No ☐ Regency Centers, L.P. Yes ☒ No ☐
Indicate by check mark whether the registrant has submitted electronically every Interactive Data File required to be submitted pursuant to Rule 405 of Regulation S-T(§232.405 of this chapter) during the preceding 12 months (or for such shorter period that the registrant was required to submit such files).
Regency Centers Corporation Yes ☒ No ☐ Regency Centers, L.P. Yes ☒ No ☐
Indicate by check mark whether the registrant is a large accelerated filer, an accelerated filer, a non-accelerated filer, a smaller reporting company, or an emerging growthcompany. See the definitions of “large accelerated filer,” “accelerated filer,” “smaller reporting company,” and “emerging growth company” in Rule 12b-2 of the ExchangeAct. (Check one):
Regency Centers Corporation:
Large accelerated filer ☒ Accelerated filer ☐ Emerging growth company ☐
Non-accelerated filer ☐ Smaller reporting company ☐
Regency Centers, L.P.:
Large accelerated filer ☐ Accelerated filer ☒ Emerging growth company ☐
Non-accelerated filer ☐ Smaller reporting company ☐ If an emerging growth company, indicate by check mark if the registrant has elected not to use the extended transition period for complying with any new or revisedfinancial accounting standards provided pursuant to Section 13(a) of the Exchange Act.
Regency Centers Corporation ☐ Regency Centers, L.P. ☐ Indicate by check mark whether the registrant has filed a report on and attestation to its management’s assessment of the effectiveness of its internal control over financialreporting under Section 404(b) of the Sarbanes-Oxley Act (15 U.S.C. 7262(b)) by the registered public accounting firm that prepared or issued its audit report.
Regency Centers Corporation ☒ Regency Centers, L.P. ☒
Indicate by check mark whether the registrant is a shell company (as defined in Rule 12b-2 of the Act).
Regency Centers Corporation Yes ☐ No ☒ Regency Centers, L.P. Yes ☐ No ☒
State the aggregate market value of the voting and non-voting common equity held by non-affiliates computed by reference to the price at which the common equity was lastsold, or the average bid and asked price of such common equity, as of the last business day of the registrants' most recently completed second fiscal quarter.
Regency Centers Corporation $7.7 billion Regency Centers, L.P. N/A
The number of shares outstanding of the Regency Centers Corporation’s common stock was 169,828,953 as of February 15, 2021.
Documents Incorporated by Reference
Portions of Regency Centers Corporation's proxy statement in connection with its 2021 Annual Meeting of Stockholders are incorporated by reference in Part III.

EXPLANATORY NOTE
This report combines the annual reports on Form 10-K for the year ended December 31, 2020, of Regency Centers Corporation and Regency Centers, L.P.Unless stated otherwise or the context otherwise requires, references to “Regency Centers Corporation” or the “Parent Company” mean Regency CentersCorporation and its controlled subsidiaries and references to “Regency Centers, L.P.” or the “Operating Partnership” mean Regency Centers, L.P. and itscontrolled subsidiaries. The term “the Company”, “Regency Centers” or “Regency” means the Parent Company and the Operating Partnership, collectively.
The Parent Company is a real estate investment trust (“REIT”) and the general partner of the Operating Partnership. The Operating Partnership’s capitalincludes general and limited common Partnership Units (“Units”). As of December 31, 2020, the Parent Company owned approximately 99.6% of theUnits in the Operating Partnership. The remaining limited Units are owned by investors. As the sole general partner of the Operating Partnership, theParent Company has exclusive control of the Operating Partnership’s day-to-day management.
The Company believes combining the annual reports on Form 10-K of the Parent Company and the Operating Partnership into this single report providesthe following benefits:
• Enhances investors’ understanding of the Parent Company and the Operating Partnership by enabling investors to view the business as a whole inthe same manner as management views and operates the business;
• Eliminates duplicative disclosure and provides a more streamlined and readable presentation; and
• Creates time and cost efficiencies through the preparation of one combined report instead of two separate reports.
Management operates the Parent Company and the Operating Partnership as one business. The management of the Parent Company consists of the sameindividuals as the management of the Operating Partnership. These individuals are officers of the Parent Company and employees of the OperatingPartnership.
The Company believes it is important to understand the key differences between the Parent Company and the Operating Partnership in the context of howthe Parent Company and the Operating Partnership operate as a consolidated company. The Parent Company is a REIT, whose only material asset is itsownership of partnership interests of the Operating Partnership. As a result, the Parent Company does not conduct business itself, other than acting as thesole general partner of the Operating Partnership, issuing public equity from time to time and guaranteeing certain debt of the Operating Partnership.Except for $200 million of unsecured private placement debt, the Parent Company does not hold any indebtedness, but guarantees all of the unsecured debtof the Operating Partnership. The Operating Partnership is also the co-issuer and guarantees the $200 million of Parent Company debt. The OperatingPartnership holds all the assets of the Company and retains the ownership interests in the Company’s joint ventures. Except for net proceeds from publicequity issuances by the Parent Company, which are contributed to the Operating Partnership in exchange for partnership units, the Operating Partnershipgenerates all remaining capital required by the Company’s business. These sources include the Operating Partnership’s operations, its direct or indirectincurrence of indebtedness, and the issuance of partnership units.
Stockholders’ equity, partners’ capital, and noncontrolling interests are the main areas of difference between the consolidated financial statements of theParent Company and those of the Operating Partnership. The Operating Partnership’s capital includes general and limited common Partnership Units. Thelimited partners’ units in the Operating Partnership owned by third parties are accounted for in partners’ capital in the Operating Partnership’s financialstatements and outside of stockholders’ equity in noncontrolling interests in the Parent Company’s financial statements.
In order to highlight the differences between the Parent Company and the Operating Partnership, there are sections in this report that separately discuss theParent Company and the Operating Partnership, including separate financial statements, controls and procedures sections, and separate Exhibit 31 and 32certifications. In the sections that combine disclosure for the Parent Company and the Operating Partnership, this report refers to actions or holdings asbeing actions or holdings of the Company.
As general partner with control of the Operating Partnership, the Parent Company consolidates the Operating Partnership for financial reporting purposes,and the Parent Company does not have assets other than its investment in the Operating Partnership. Therefore, while stockholders’ equity and partners’capital differ as discussed above, the assets and liabilities of the Parent Company and the Operating Partnership are the same on their respective financialstatements.
TABLE OF CONTENTS
Item No.
Form 10-KReport Page
PART I
1. Business 1
1A. Risk Factors 8
1B. Unresolved Staff Comments 20
2. Properties 21
3. Legal Proceedings 36
4. Mine Safety Disclosures 36
PART II
5. Market for the Registrant's Common Equity, Related Stockholder Matters, and Issuer Purchases of Equity Securities 36
6. Selected Financial Data 38
7. Management's Discussion and Analysis of Financial Condition and Results of Operations 40
7A. Quantitative and Qualitative Disclosures About Market Risk 58
8. Consolidated Financial Statements and Supplementary Data 59
9. Changes in and Disagreements with Accountants on Accounting and Financial Disclosure 124
9A. Controls and Procedures 124
9B. Other Information 125
PART III
10. Directors, Executive Officers, and Corporate Governance 125
11. Executive Compensation 125
12. Security Ownership of Certain Beneficial Owners and Management and Related Stockholder Matters 126
13. Certain Relationships and Related Transactions, and Director Independence 126
14. Principal Accountant Fees and Services 126
PART IV
15. Exhibits and Financial Statement Schedules 127
16. Form 10-K Summary 133
SIGNATURES
17. Signatures 134
Forward-Looking Statements
Certain statements in this document regarding anticipated financial, business, legal or other outcomes including business and market conditions, outlookand other similar statements relating to Regency’s future events, developments, or financial or operational performance or results, are “forward-lookingstatements” made pursuant to the safe harbor provisions of the Private Securities Litigation Reform Act of 1995 and other federal securities laws. Theseforward-looking statements are identified by the use of words such as “may,” “will,” “should,” “expect,” “estimate,” “believe,” “intend,” “forecast,”“anticipate,” “guidance,” and other similar language. However, the absence of these or similar words or expressions does not mean a statement is notforward-looking. While we believe these forward-looking statements are reasonable when made, forward-looking statements are not guarantees of futureperformance or events and undue reliance should not be placed on these statements. Although we believe the expectations reflected in any forward-lookingstatements are based on reasonable assumptions, we can give no assurance these expectations will be attained, and it is possible actual results may differmaterially from those indicated by these forward-looking statements due to a variety of risks and uncertainties.
Our operations are subject to a number of risks and uncertainties including, but not limited to, those described in Item 1A, Risk Factors. When consideringan investment in our securities, you should carefully read and consider these risks, together with all other information in our Annual Reports on Form 10-K,Quarterly Reports on Form 10-Q and our other filings and submissions to the SEC. If any of the events described in the risk factors actually occur, ourbusiness, financial condition or operating results, as well as the market price of our securities, could be materially adversely affected. Forward-lookingstatements are only as of the date they are made, and Regency undertakes no duty to update its forward-looking statements except as required by law.
PART I
Item 1. Business
Regency Centers Corporation is a fully integrated real estate company and self-administered and self-managed real estate investment trust that began itsoperations as a publicly-traded REIT in 1993. Regency Centers L.P. is the entity through which Regency Centers Corporation conducts substantially all ofits operations and owns substantially all of its assets. Our business consists of acquiring, developing, owning and operating income-producing retail realestate principally located in many of the top markets in the United States. We generate revenues by leasing space to retail tenants such as highly productivegrocers, restaurants, service providers, and best-in-class retailers. Regency has been an S&P 500 Index member since 2017.
As of December 31, 2020, we had full or partial ownership interests in 411 properties, primarily anchored by market leading grocery stores, encompassing51.9 million square feet (“SF”) of gross leasable area (“GLA”). Our Pro-rata share of this GLA is 42.2 million square feet, including our share of thepartially owned properties.
Our mission is to be the preeminent national owner, operator, and developer of shopping centers, creating places that provide a thriving environment foroutstanding retailers and service providers to connect with the surrounding neighborhoods and communities.
Our goals are to:
• Own and manage a portfolio of high-quality neighborhood and community shopping centers primarily anchored by market leading grocers andlocated in affluent suburban and near urban trade areas in the country’s most desirable metro areas. We expect that this combination will producehighly desirable and attractive centers with best-in-class retailers. These centers should command higher rental and occupancy rates resulting inexcellent prospects to grow net operating income (“NOI”);
• Maintain an industry leading and disciplined development and redevelopment platform to deliver exceptional retail centers at higher returns ascompared to acquisitions;
• Support our business activities with a conservative capital structure, including a strong balance sheet;
• Implement leading environmental, social, and governance practices through our Corporate Responsibility Program;
• Engage an exceptional and diverse team that is guided by our strong values and special culture, while fostering an environment of innovation andcontinuous improvement; and
• Create shareholder value by increasing earnings and dividends per share and generate total returns at or near the top of our shopping center peers.
1
Key strategies to achieve our goals are to:
• Sustain same property NOI growth that over the long-term consistently ranks at or near the top of our shopping center peers;
• Develop and redevelop high quality shopping centers at attractive returns on investment;
• Maintain a conservative balance sheet that provides liquidity, financial flexibility and cost effective funding of investment opportunities, whilealso managing debt maturities that enable us to weather economic downturns;
• Maintain high standards for corporate governance and act as good stewards of our communities and the environment; and
• Attract and motivate an exceptional team of diverse employees who operate efficiently and are recognized as industry leaders.
COVID-19 Pandemic
On March 11, 2020, the novel coronavirus disease (“COVID-19”) was declared a pandemic (“COVID-19 pandemic” or the “pandemic”) by the WorldHealth Organization as the disease spread throughout the world. The pandemic continues to evolve, making the broader implications on our future resultsof operations and overall financial performance uncertain at this time. While much of our lease income is derived from contractual rent payments, ourtenants’ ability to meet their lease obligations has been negatively impacted by the disruptions and uncertainties of the pandemic. Certain of our tenants’ability to respond to these disruptions, including adapting to governmental orders, recommendations, and changes in their customers’ shopping habits andbehaviors, could influence their ability to survive and ultimately fulfill their lease obligations. While the announcement of vaccine approvals by the U.S.Food and Drug Administration (“FDA”) in early December 2020 was a positive development, at about the same time, several states and many localitiesreinstituted mandatory business limitations and closures as infection rates increased, in advance of full scale vaccine deployment. Forced closures maycontinue to occur as infection rates increase or additional strains of the virus emerge, while the speed of vaccine rollout remains uncertain.
Due to the pandemic, certain tenants have requested rent concessions or have sought to renegotiate future rents based on changes to the economicenvironment. Other tenants have chosen not to reopen or honor the terms of their existing lease agreements. In addition, in 2020 we saw a meaningfulincrease in the number of bankruptcy filings by our tenants versus prior years, which in certain cases can lead to a tenant “rejecting” (terminating) one ormore of our leases as permitted by applicable bankruptcy law, or seeking to negotiate reduced rent as part of the bankruptcy reorganization process.
We are closely monitoring our rent collections from our tenants, which significantly declined from historic levels at the start of the pandemic, but havesince gradually improved. As of February 8, 2021, we experienced sequential improvement in our collection rates of Pro-rata base rent billed by quarter in2020 as follows:
Q2 Q3 Q4 Base Rent Collections 79% 89% 92%
Since the pandemic began, we have executed approximately 1,600 rent deferral agreements within our consolidated and unconsolidated real estateportfolios. The weighted average deferral period of these agreements is approximately 3.3 months, with repayment periods of approximately 9.7 monthsbeginning on average in December 2020. In some cases, we expect to continue to work with tenants to address the adverse impacts of the pandemic, whichmay result in further rent deferrals, concessions or abatements. As a result, there can be no assurance that our future base rent collection percentages willcontinue at or above Q4 2020 levels, or that cash flows from operations will be sufficient to sustain and fund our dividend payments without the benefit ofother sources of capital or changes to our current dividend levels. In the event of a surge in COVID-19 cases or new governmental restrictions causing ourtenants to reduce their operations or close, our base rent collection percentages and percent leased could decline from current levels.
New leasing activity declined in 2020 and is expected to remain below 2019 levels into 2021 as businesses delay executing leases amidst the immediateand uncertain future economic impacts of the pandemic. This, coupled with tenant failures and bankruptcies, may result in decreased demand for retailspace in our centers, which could result in difficulty attracting new tenants resulting in pricing pressure on rents. Additionally, if construction of tenantimprovements are delayed due to the impacts of the pandemic, it may take longer before new tenants are able to open and commence rent payments.
The pandemic has significantly slowed and in certain situations delayed tenant buildouts, new ground up developments or redevelopment of existingproperties. The pandemic has also limited our ability to timely source materials for construction and has caused labor shortages, which have impacted ourability to complete construction projects on anticipated schedules. In the event a surge in new cases resulting in additional lockdowns occurs, similarimpacts to our supply chain may arise which could have a material adverse effect on our business, financial condition and results of operations. Wecontinue to closely monitor our projects, which has resulted in prudently delaying, phasing or curtailing certain of our development, redevelopment andcapital expenditure projects.
2
The duration and severity of the pandemic across the United States will continue to negatively impact many of our tenants and their ability to meet theirrent obligations under their lease agreements. As such, the pandemic could continue to negatively impact our results of operations and overall financialcondition in the future. See also Part I, Item 1A, Risk Factors for further discussion.
Our business continuity and disaster recovery plan enabled us to continue operating productively during the pandemic. We have maintained, and expect tocontinue to maintain, without interruption, our financial reporting systems as well as our internal controls over our financial reporting and disclosurecontrols and procedures.
Competition
We are among the largest owners of shopping centers in the nation based on revenues, number of properties, GLA, and market capitalization. There arenumerous companies and individuals engaged in the ownership, development, acquisition, and operation of shopping centers that compete with us in ourtargeted markets, including grocery store chains that also anchor some of our shopping centers. This results in competition for attracting tenants, as well asthe acquisition of existing shopping centers and new development sites. In addition, brick and mortar shopping centers, in general, face continuedcompetition from alternative shopping and delivery methods, including e-commerce and home delivery. We believe that our competitive advantages aredriven by:
• our locations within our market areas;
• the design of our shopping centers including our practice of maintaining and renovating these centers to our high standards of quality;
• the strong demographics surrounding our shopping centers;
• our relationships with our anchor, shop, and out-parcel tenants;
• our management experience and expertise; and
• our ability to source and develop new shopping centers.
Corporate Responsibility
Our vision is to be the preeminent national owner, operator and developer of shopping centers, connecting outstanding retailers and service providers withtheir neighborhoods and communities while striving to achieve best-in-class corporate responsibility. To integrate corporate responsibility into our vision,we focus on three key overarching concepts: long-term value creation, our Regency brand and reputation, and the importance of maintaining our culture.
We have established four pillars for our corporate responsibility program that we believe enable us to support our vision and implement these concepts:
• Our People;
• Our Communities;
• Ethics and Governance; and
• Environmental Stewardship.
Our People – Our people are our most important asset and we strive to ensure that they are engaged, passionate about their work, connected to their teams,and supported to deliver their best performance. We recognize and value the importance of attracting and retaining talented individuals to Regency’sperformance and growth. We strive to maintain a safe and healthy workspace, promote employee well-being, and empower our employees by focusing ontheir training and education. Another key element of our focus on people is our understanding and appreciation of the value of an inclusive and diverseworkforce. In 2020, we began developing and implementing a comprehensive three-year diversity, equity, and inclusion (“DEI”) strategy, which includestraining, recruitment, and engagement. Our employees have been directly engaged in the development of our DEI strategy to ensure they are connected toand actively involved in its implementation across the entirety of our business.
Our Communities – Our predominately grocery-anchored neighborhood centers provide many benefits to the communities in which we live and work,including significant local economic impacts in the form of investment, jobs and taxes. Our local teams are also passionate about investing in and engagingwith our communities, as they customize and cultivate our centers to create a distinctive environment to bring our tenants and shoppers together for the bestretail experience. Further, philanthropy and giving back are cornerstones of what we do and who Regency is. In addition, charitable contributions are madedirectly by the Company, and the vast majority of our employees donate their time and money to local non-profits serving their communities.
3
Ethics and Governance – As long-term stewards of our investors’ capital, we are committed to best-in-class corporate governance. To create long-termvalue for our stakeholders, we place great emphasis on our culture and core values, the integrity and transparency of our reporting practices, and our overallgovernance structure in respect of oversight and shareholder rights.
Environmental Stewardship – We believe sustainability is in the best interest of our investors, tenants, employees, and the communities in which weoperate, and we strive to integrate sustainable practices throughout our business. We have six strategic priorities when it comes to identifying andimplementing sustainable business practices and minimizing our environmental impact: green building, energy efficiency, greenhouse gas emissionsreduction, water conservation, waste minimization and management, and climate resilience. We believe these commitments are not only the right thing todo to address material environmental topics such as air pollution, climate change, and resource scarcity, but also support us in achieving key strategicobjectives in our operations and development projects.
More information about our corporate responsibility strategy, goals, performance, and reporting is available on our website atwww.regencycenters.com. The content of our website, including information relating to corporate responsibility, is not incorporated by reference into thisAnnual Report on Form 10-K or in any other report or document we file with the SEC, and any references to our website are intended to be inactive textualreferences only.
Employees
Our corporate headquarters are located at One Independent Drive, Suite 114, Jacksonville, Florida. We presently maintain 22 market offices nationwide,including our corporate headquarters, where we conduct management, leasing, construction, and investment activities. We have 431 employees throughoutthe United States and we believe that our relations with our employees are good.
Compliance with Governmental Regulations
We are subject to various regulatory and tax-related requirements within the jurisdictions in which we operate. Changes to such requirements may result inunanticipated financial impacts or adverse tax consequences, and could affect our operating results and financial condition. Significant regulatoryrequirements include the laws and regulations described below.
REIT Laws and Regulations
We have elected to be taxed as a REIT under the federal income tax laws. As a REIT, we are generally not subject to federal income tax on taxable incomethat we distribute to our stockholders. Under the Internal Revenue Code (the “Code”), REITs are subject to numerous regulatory requirements, includingthe requirement to generally distribute at least 90% of taxable income each year. We will be subject to federal income tax on our taxable income at regularcorporate rates if we fail to qualify as a REIT for tax purposes in any taxable year, or to the extent we distribute less than 100% of our taxable income. Wewill also generally not qualify for treatment as a REIT for federal income tax purposes for four years following the year during which qualification is lost.Even if we qualify as a REIT for federal income tax purposes, we may be subject to certain state and local income and franchise taxes and to federalincome and excise taxes on our undistributed taxable income.
We have elected to treat certain of our subsidiaries as taxable REIT subsidiaries (“TRS”). In general, a TRS may engage in any real estate business andcertain non-real estate businesses, subject to certain limitations under the Code. A TRS is subject to federal and state income taxes which, to date, have notbeen material to us.
Environmental Laws and Regulations
Under various federal, state and local laws, ordinances and regulations, we may be liable for the cost to assess and remediate certain hazardous substancesat our shopping centers that generally arise from dry cleaners, gas stations, asbestos, and historic land use practices. These requirements often imposeliability without regard to whether the owner knew of, or committed the acts or omissions that caused, the presence of the hazardous substances. Thepresence of such substances, or the failure to properly address contamination caused by such substances, may adversely affect our ability to sell or lease theproperty or borrow using the property as collateral. Although we have a number of properties that could require or are currently undergoing varying levelsof assessment and remediation, known environmental liabilities are not currently expected to have a material financial impact.
4
Executive Officers
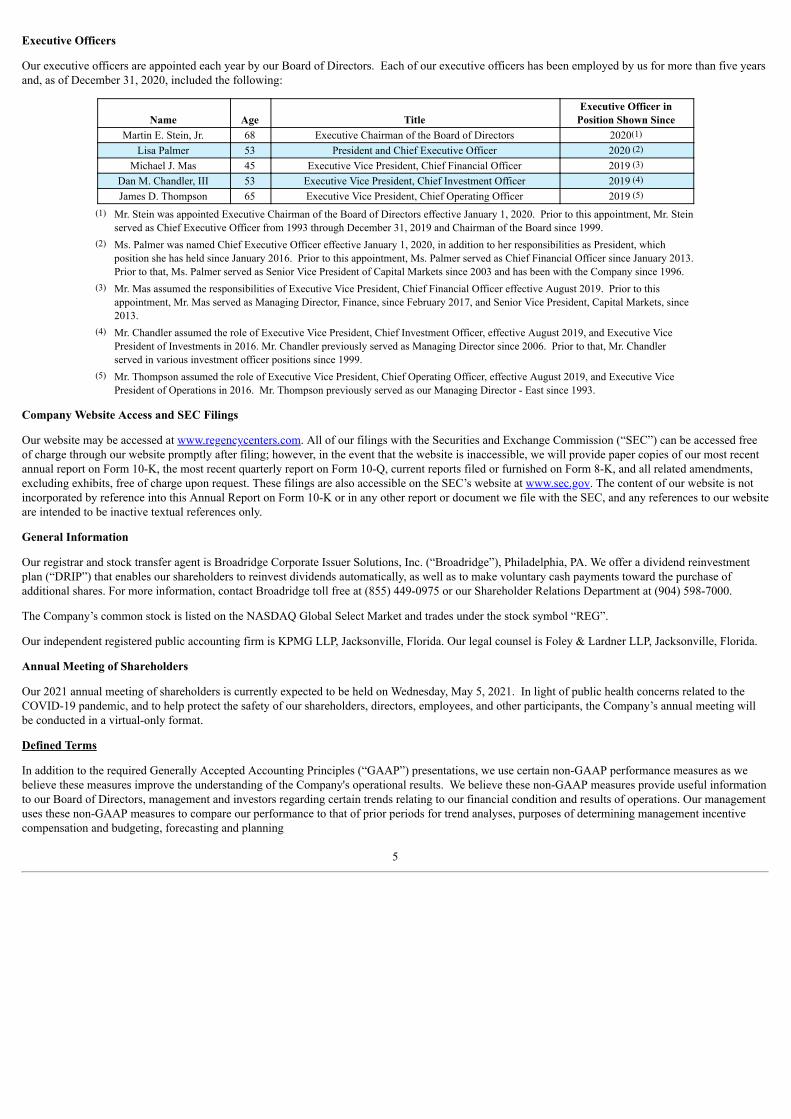
Our executive officers are appointed each year by our Board of Directors. Each of our executive officers has been employed by us for more than five yearsand, as of December 31, 2020, included the following:
Name Age TitleExecutive Officer in
Position Shown SinceMartin E. Stein, Jr. 68 Executive Chairman of the Board of Directors 2020(1)
Lisa Palmer 53 President and Chief Executive Officer 2020 (2)
Michael J. Mas 45 Executive Vice President, Chief Financial Officer 2019 (3)
Dan M. Chandler, III 53 Executive Vice President, Chief Investment Officer 2019 (4)
James D. Thompson 65 Executive Vice President, Chief Operating Officer 2019 (5)
(1) Mr. Stein was appointed Executive Chairman of the Board of Directors effective January 1, 2020. Prior to this appointment, Mr. Steinserved as Chief Executive Officer from 1993 through December 31, 2019 and Chairman of the Board since 1999.
(2) Ms. Palmer was named Chief Executive Officer effective January 1, 2020, in addition to her responsibilities as President, whichposition she has held since January 2016. Prior to this appointment, Ms. Palmer served as Chief Financial Officer since January 2013.Prior to that, Ms. Palmer served as Senior Vice President of Capital Markets since 2003 and has been with the Company since 1996.
(3) Mr. Mas assumed the responsibilities of Executive Vice President, Chief Financial Officer effective August 2019. Prior to thisappointment, Mr. Mas served as Managing Director, Finance, since February 2017, and Senior Vice President, Capital Markets, since2013.
(4) Mr. Chandler assumed the role of Executive Vice President, Chief Investment Officer, effective August 2019, and Executive VicePresident of Investments in 2016. Mr. Chandler previously served as Managing Director since 2006. Prior to that, Mr. Chandlerserved in various investment officer positions since 1999.
(5) Mr. Thompson assumed the role of Executive Vice President, Chief Operating Officer, effective August 2019, and Executive VicePresident of Operations in 2016. Mr. Thompson previously served as our Managing Director - East since 1993.
Company Website Access and SEC Filings
Our website may be accessed at www.regencycenters.com. All of our filings with the Securities and Exchange Commission (“SEC”) can be accessed freeof charge through our website promptly after filing; however, in the event that the website is inaccessible, we will provide paper copies of our most recentannual report on Form 10-K, the most recent quarterly report on Form 10-Q, current reports filed or furnished on Form 8-K, and all related amendments,excluding exhibits, free of charge upon request. These filings are also accessible on the SEC’s website at www.sec.gov. The content of our website is notincorporated by reference into this Annual Report on Form 10-K or in any other report or document we file with the SEC, and any references to our websiteare intended to be inactive textual references only.
General Information
Our registrar and stock transfer agent is Broadridge Corporate Issuer Solutions, Inc. (“Broadridge”), Philadelphia, PA. We offer a dividend reinvestmentplan (“DRIP”) that enables our shareholders to reinvest dividends automatically, as well as to make voluntary cash payments toward the purchase ofadditional shares. For more information, contact Broadridge toll free at (855) 449-0975 or our Shareholder Relations Department at (904) 598-7000.
The Company’s common stock is listed on the NASDAQ Global Select Market and trades under the stock symbol “REG”.
Our independent registered public accounting firm is KPMG LLP, Jacksonville, Florida. Our legal counsel is Foley & Lardner LLP, Jacksonville, Florida.
Annual Meeting of Shareholders
Our 2021 annual meeting of shareholders is currently expected to be held on Wednesday, May 5, 2021. In light of public health concerns related to theCOVID-19 pandemic, and to help protect the safety of our shareholders, directors, employees, and other participants, the Company’s annual meeting willbe conducted in a virtual-only format.
Defined Terms
In addition to the required Generally Accepted Accounting Principles (“GAAP”) presentations, we use certain non-GAAP performance measures as webelieve these measures improve the understanding of the Company's operational results. We believe these non-GAAP measures provide useful informationto our Board of Directors, management and investors regarding certain trends relating to our financial condition and results of operations. Our managementuses these non-GAAP measures to compare our performance to that of prior periods for trend analyses, purposes of determining management incentivecompensation and budgeting, forecasting and planning
5
purposes. We continually evaluate the usefulness, relevance, limitations, and calculation of our reported non-GAAP performance measures to determinehow best to provide relevant information to the public, and thus such reported measures could change.
We do not consider non-GAAP measures an alternative to financial measures determined in accordance with GAAP, rather they supplement GAAPmeasures by providing additional information we believe to be useful to our shareholders. The principal limitation of these non-GAAP financial measuresis they may exclude significant expense and income items that are required by GAAP to be recognized in our consolidated financial statements. In addition,they reflect the exercise of management’s judgment about which expense and income items are excluded or included in determining these non-GAAPfinancial measures. In order to compensate for these limitations, reconciliations of the non-GAAP financial measures we use to their most directlycomparable GAAP measures are provided. Non-GAAP financial measures should not be relied upon in evaluating the financial condition, results ofoperations or future prospects of the Company.
The following terms, as defined, are commonly used by management and the investing public to understand and evaluate our operational results:
• Development Completion is a property in development that is deemed complete upon the earliest of: (i) 90% of total estimated net developmentcosts have been incurred and percent leased equals or exceeds 95%, or (ii) the property features at least two years of anchor operations, or (iii)three years have passed since the start of construction. Once deemed complete, the property is termed a Retail Operating Property the followingcalendar year.
• Fixed Charge Coverage Ratio is defined as Operating EBITDAre divided by the sum of the gross interest and scheduled mortgage principal paidto our lenders.
• Nareit EBITDAre is a measure of REIT performance, which the National Association of Real Estate Investment Trusts (“Nareit”) defines as netincome, computed in accordance with GAAP, excluding (i) interest expense, (ii) income tax expense, (iii) depreciation and amortization, (iv)gains on sales of real estate, (v) impairments of real estate, and (vi) adjustments to reflect the Company’s share of unconsolidated partnershipsand joint ventures.
• Nareit Funds from Operations (“Nareit FFO”) is a commonly used measure of REIT performance, which Nareit defines as net income,computed in accordance with GAAP, excluding gains on sales and impairments of real estate, net of tax, plus depreciation and amortization, andafter adjustments for unconsolidated partnerships and joint ventures. We compute Nareit FFO for all periods presented in accordance withNareit’s definition.
Companies use different depreciable lives and methods, and real estate values historically fluctuate with market conditions. Since Nareit FFOexcludes depreciation and amortization and gains on sale and impairments of real estate, it provides a performance measure that, when comparedyear over year, reflects the impact on operations from trends in percent leased, rental rates, operating costs, acquisition and developmentactivities, and financing costs. This provides a perspective of our financial performance not immediately apparent from net income determined inaccordance with GAAP. Thus, Nareit FFO is a supplemental non-GAAP financial measure of our operating performance, which does notrepresent cash generated from operating activities in accordance with GAAP; and, therefore, should not be considered a substitute measure ofcash flows from operations. We provide a reconciliation of Net Income Attributable to Common Stockholders to Nareit FFO.
• Net Operating Income (“NOI”) is the sum of base rent, percentage rent, recoveries from tenants, other lease income, and other property income,less operating and maintenance expenses, real estate taxes, ground rent, and uncollectible lease income. NOI excludes straight-line rental incomeand expense, above and below market rent and ground rent amortization, tenant lease inducement amortization, and other fees. We also providedisclosure of NOI excluding termination fees, which excludes both termination fee income and expenses.
• Non-Same Property is any property, during either calendar year period being compared, that was acquired, sold, a Property in Development, aDevelopment Completion, or a property under, or being positioned for, significant redevelopment that distorts comparability betweenperiods. Non-retail properties and corporate activities, including the captive insurance program, are part of Non-Same Property.
• Operating EBITDAre begins with the Nareit EBITDAre and excludes certain non-cash components of earnings derived from above and belowmarket rent amortization and straight-line rents. We provide a reconciliation of Net Income to Nareit EBITDAre to Operating EBITDAre.
6
• Pro-rata information includes 100% of our consolidated properties plus our economic share (based on our ownership interest) in ourunconsolidated real estate investment partnerships.
We provide Pro-rata financial information because we believe it assists investors and analysts in estimating our economic interest in ourconsolidated and unconsolidated partnerships, when read in conjunction with the Company’s reported results under GAAP. We believepresenting our Pro-rata share of assets, liabilities, operating results, and other metrics, along with certain other non-GAAP measures, makescomparisons of other REITs’ operating results to ours more meaningful. The Pro-rata information provided is not, nor is it intended to be,presented in accordance with GAAP. The Pro-rata supplemental details of assets and liabilities and supplemental details of operations reflect ourproportionate economic ownership of the assets, liabilities, and operating results of the properties in our portfolio
The Pro-rata information is prepared on a basis consistent with the comparable consolidated amounts and is intended to more accurately reflectour proportionate economic interest in the assets, liabilities, and operating results of properties in our portfolio. We do not control theunconsolidated investment partnerships, and the Pro-rata presentations of the assets and liabilities, and revenues and expenses do not representour legal claim to such items. The partners are entitled to profit or loss allocations and distributions of cash flows according to the operatingagreements, which generally provide for such allocations according to their invested capital. Our share of invested capital establishes theownership interests we use to prepare our Pro-rata share.
The presentation of Pro-rata information has limitations which include, but are not limited to, the following:
o The amounts shown on the individual line items were derived by applying our overall economic ownership interest percentagedetermined when applying the equity method of accounting and do not necessarily represent our legal claim to the assets andliabilities, or the revenues and expenses; and
o Other companies in our industry may calculate their Pro-rata interest differently, limiting the comparability of Pro-rata information.
Because of these limitations, the Pro-rata financial information should not be considered independently or as a substitute for our financialstatements as reported under GAAP. We compensate for these limitations by relying primarily on our GAAP financial statements, using the Pro-rata information as a supplement.
• Property In Development includes properties in various stages of ground-up development.
• Property In Redevelopment includes Retail Operating Properties under redevelopment or being positioned for redevelopment. Unless otherwiseindicated, a Property in Redevelopment is included in the Same Property pool.
• Retail Operating Property is any retail property not termed a Property in Development. A retail property is any property where the majority ofthe income is generated from retail uses.
• Same Property is a Retail Operating Property that was owned and operated for the entirety of both calendar year periods being compared. Thisterm excludes Properties in Development, prior year Development Completions, and Non-Same Properties. Properties in Redevelopment areincluded unless otherwise indicated.
7
Item 1A. Risk Factors
Our operations are subject to a number of risks and uncertainties including, but not limited to, those listed below. When considering an investment in oursecurities, carefully read and consider these risks, together with all other information in our other filings and submissions to the SEC, which provide muchmore information and detail. If any of the events described in the following risk factors actually occur, our business, financial condition and/ or operatingresults, as well as the market price of our securities, could be materially adversely affected.
Risk Factors Related to the COVID-19 Pandemic
Pandemics or other health crises, such as the pandemic, may adversely affect our tenants’ financial condition, the profitability of our properties,and our access to the capital markets and could have a material adverse effect on our business, results of operations, cash flows and financialcondition.
During the ongoing pandemic, U.S. federal, state, and local governments have continued to mandate or recommend various actions to reduce or prevent thespread of COVID-19 which continues to directly impact many of our tenants, and in particular those whose businesses may be considered non-essential. Grocery stores, which anchor over 80% of our operating centers, have generally been able to continue operating and serving their customers.However, non-essential businesses such as dine-in restaurants, fitness facilities and movie theaters in many states continue to experience significantdeclines in customer traffic when compared to previous years, or have temporarily closed their locations (in some cases multiple times) in response togovernmental orders or voluntary efforts to support social distancing.
Due to the pandemic, certain tenants have requested rent concessions or have sought to renegotiate future rents based on changes to the economicenvironment. Other tenants have chosen not to reopen or honor the terms of their existing lease agreements. In addition, moratoria and other temporarylegal restrictions in certain states on our ability to bring legal action to enforce our leases have impacted our ability to collect rent and may continue to doso into 2021.
New leasing activity has declined and is expected to remain at lower levels than pre-pandemic into 2021 as businesses delay executing leases amidst theimmediate and uncertain future economic impacts of the pandemic. This, coupled with tenant failures, may result in decreased demand for retail space inour centers, which could result in downward pressure on rents. Additionally, due to delays in construction of tenant improvements due to the impacts of thepandemic, it may take longer before new tenants are able to open and commence rent payments.
The pandemic has adversely impacted our ability to start or complete tenant buildouts, new ground up development and redevelopment of existingproperties. The pandemic has also impacted our ability to timely source materials for construction and caused labor shortages, which have impacted ourability to complete construction projects on anticipated schedules. New or extended government orders to combat the further spread of the virus couldresult in similar impacts to our development and redevelopment projects and supply chain, which could have a material adverse effect on our business,financial condition and results of operation.
The full impacts of the pandemic on our future results of operations and overall financial performance remain uncertain. While the vast majority of ourlease income is derived from contractual rent payments, the ability of certain of our tenants to meet their lease obligations have been negatively impactedby the disruptions and uncertainties of the pandemic. Our tenants’ ability to respond to these disruptions and uncertainties, including adjusting togovernmental orders and changes in their customers’ shopping habits and behaviors, will impact their businesses’ ability to survive, and ultimately, theirability to comply with their lease obligations. The risk of diminished sales and future closures exists so long as the virus remains active and continues tospread. Ultimately, the duration and severity of the health crisis in the United States and the speed at which the country, states and localities are able tosafely reopen and remain open, will continue to materially impact the overall economy, our retail tenants, and therefore our results of operations, financialcondition and cash flows. Until the virus is contained or eradicated, or effective and reliable treatments and/or vaccines are widely available and acceptedby the public, commerce and employment may not return to pre-pandemic levels and we may experience material reductions in our cash flows, NOI andfinancial performance compared to pre-pandemic periods.
8
Risk Factors Related to Operating Retail-Based Shopping Centers
Economic and market conditions may adversely affect the retail industry and consequently reduce our revenues and cash flow, and increase ouroperating expenses.
Our properties are leased primarily to retail tenants from whom we derive most of our revenue in the form of base rent, expense recoveries and otherincome. Therefore, our performance and operating results are directly linked to the economic and market conditions occurring in the retail industry. We aresubject to the risks that, upon expiration, leases for space in our properties are not renewed by existing tenants, vacant space is not leased to new tenants,and/or tenants demand modified lease terms, including costs for renovations or concessions. Moreover, pandemics, such as the pandemic, may exacerbatethe effects of these risks. The economic and market conditions potentially affecting the retail industry and our properties specifically include the following:
• changes in national, regional and local economic conditions;
• changes in population and migration patterns to/from the markets in which we operate;
• deterioration in the competitiveness and creditworthiness of our retail tenants;
• increased competition from the use of e-commerce by retailers and consumers as well as other concepts such as super-stores and warehouseclubs;
• tenant bankruptcies and subsequent rejections of our leases;
• reductions in consumer spending and retail sales;
• reduced tenant demand for retail space;
• oversupply of retail space;
• reduced consumer demand for certain retail categories;
• consolidation within the retail sector;
• increased operating costs attendant to owning and operating retail shopping centers;
• perceptions by retailers and shoppers of the safety, convenience and attractiveness of our properties; and
• acts of terrorism and war, natural disasters and other physical and weather-related damages to our properties.
To the extent that any or a combination of these conditions occur they are likely to impact the retail industry, our retail tenants, the demand and marketrents for retail space, the percent leased levels of our properties, our ability to sell, acquire or develop properties, our operating results and our cashavailable for distributions to stock and unit holders.
Shifts in retail trends, sales, and delivery methods between brick and mortar stores, e-commerce, home delivery, and curbside pick-up mayadversely impact our revenues and cash flows.
Retailers are increasingly impacted by e-commerce and changes in customer buying habits, including the delivery or curbside pick-up of items orderedonline. The pandemic has likely accelerated these trends and their potential impacts. Retailers are considering these e-commerce trends when makingdecisions regarding their bricks and mortar stores and how they will compete and innovate in a rapidly changing retail environment. Many retailers in ourshopping centers provide services or sell goods, which have historically been less likely to be purchased online; however, the continuing increase in e-commerce sales in all retail categories may cause retailers to adjust the size or number of their retail locations in the future or close stores. Our grocertenants are incorporating e-commerce concepts through home delivery and curbside pick-up, which could reduce foot traffic at our centers. In certainhigher-income markets, foot traffic at our centers may be impacted more meaningfully by these alternative delivery methods if consumers are willing topay premiums for such services. Changes in shopping trends as a result of the growth in e-commerce may also impact the profitability of retailers that donot adapt to changes in market conditions, including their financial condition and ability to pay rent. This shift may adversely impact our percent leased andrental rates, which would impact our results of operations and cash flows.
9
Changing economic and retail market conditions in geographic areas where our properties are concentrated may reduce our revenues and cashflow.
Economic conditions in markets where our properties are concentrated can greatly influence our financial performance. During the year endedDecember 31, 2020, our properties in California, Florida, Texas, New York and Georgia accounted for 27.2%, 22.1%, 7.5%, 5.2%, and 5.1% respectively,of our NOI from Consolidated Properties plus our Pro-rata share from Unconsolidated Properties. Our revenues and cash flow may be adversely affectedby this geographic concentration if market conditions, such as supply of or demand for retail space, deteriorate more significantly in these states comparedto other geographic areas. For example, with respect to the pandemic, California has imposed very stringent restrictions on re-opening and hasimplemented stringent eviction moratoria, making it more difficult in certain circumstances to collect rent and enforce our leases. Additionally, there is arisk that many businesses and residents in major metropolitan cities may desire to relocate to different states or suburban markets as a result of thepandemic, following the impact of state regulations on businesses and residents coupled with the shift to remote work.
Our success depends on the continued presence and success of our “anchor” tenants.
“Anchor Tenants” (tenants occupying 10,000 square feet or more) operate large stores in our shopping centers, pay a significant portion of the total rent at aproperty and contribute to the success of other tenants by attracting shoppers to the property. Our net income and cash flow may be adversely affected bythe loss of revenues and incurrence of additional costs in the event a significant Anchor Tenant:
• becomes bankrupt or insolvent;
• experiences a downturn in its business;
• materially defaults on its leases;
• does not renew its leases as they expire;
• renews at lower rental rates and/or requires a tenant improvement allowance; or
• renews but reduces its store size, which results in down-time and additional tenant improvement costs to the landlord to re-lease the vacatedspace.
Some anchors have the right to vacate their space and may prevent us from re-tenanting by continuing to comply and pay rent in accordance with theirlease agreement. Vacated anchor space, including space that may be owned by the anchor (as discussed below), can reduce rental revenues generated by theshopping center in other spaces because of the loss of the departed anchor's customer drawing power. In addition, if a significant tenant vacates a property,co-tenancy clauses in select lease contracts may allow other tenants to modify or terminate their rent or lease obligations. Co-tenancy clauses have severalvariants: they may allow a tenant to postpone a store opening if certain other tenants fail to open their stores; they may allow a tenant to close its store priorto lease expiration if another tenant closes its store prior to lease expiration; or more commonly, they may allow a tenant to pay reduced levels of rent untila certain number of tenants open their stores within the same shopping center.
Additionally, some of our shopping centers are anchored by retailers who own their space whose location is within or immediately adjacent to our shoppingcenter (“shadow anchors”). In those cases, the shadow anchors appear to the consumer as a retail tenant of the shopping center and, as a result, attractadditional consumer traffic to the center. In the event that a shadow anchor were to close, it could negatively impact our center as consumer traffic wouldlikely be reduced.
A significant percentage of our revenues are derived from smaller “shop space” tenants and our net income may be adversely impacted if oursmaller shop tenants are not successful.
At December 31, 2020, tenants occupying less than 10,000 square feet (“Shop Space Tenants”) represent approximately 35.6% of our GLA, withapproximately 14.3% of those considered local tenants. These tenants may be more vulnerable to negative economic conditions, including the impactsfrom pandemics, as they may have more limited resources and access to capital than Anchor Tenants. Shop Space Tenants may be facing reduced sales as aresult of an increase in competition including from e-commerce retailers. The types of Shop Space Tenants vary from retail shops and restaurants to serviceproviders. If we are unable to attract the right type or mix of Shop Space Tenants into our centers, our revenues and cash flow may be adversely impacted.
During times of economic downturns or uncertainties, including during pandemics such as COVID-19, some tenants may suffer disproportionally greaterimpacts and be at greater risk of default on their lease obligations or request lease concessions from us. If we are unable to attract the right type or mix oflow or non-credit tenants into our centers, our revenues and cash flow may be adversely impacted.
10
We may be unable to collect balances due from tenants in bankruptcy.
Although lease income is supported by long-term lease contracts, tenants who file for bankruptcy have the legal right to reject any or all of their leases andclose related stores. Any unsecured claim we hold against a bankrupt tenant for unpaid rent may be paid only to the extent that funds are available and onlyin the same percentage as is paid to all other holders of unsecured claims. As a result, it is likely that we would recover substantially less than the full valueof any unsecured claims we hold. Moreover, in the year ended December 31, 2020, we saw meaningfully higher levels of tenant bankruptcies than in recentyears as a result of the pandemic, and we expect this trend to continue into at least the first half of 2021. Additionally, we may incur significant expense torecover our claim and to re-lease the vacated space. In the event that a tenant with a significant number of leases in our shopping centers files forbankruptcy and rejects its leases, we may experience a significant reduction in our revenues and may not be able to collect all pre-petition amounts owed bythe bankrupt tenant.
Many of our costs and expenses associated with operating our properties may remain constant or increase, even if our lease income decreases.
Certain costs and expenses associated with our operating our properties, such as real estate taxes, insurance, utilities and common area expenses, generallydo not decrease in the event of reduced occupancy or rental rates, non-payment of rents by tenants, general economic downturns, pandemics or othersimilar circumstances. In fact, in some cases, such as real estate taxes and insurance, they may actually increase despite such events. As such, we may notbe able to lower the operating expenses of our properties sufficiently to fully offset such circumstances, and may not be able to fully recoup these costsfrom our tenants. In such cases, our cash flows, operating results and financial performance may be adversely impacted.
Compliance with the Americans with Disabilities Act and fire, safety and other regulations may have a negative effect on us.
All of our properties are required to comply with the Americans with Disabilities Act (“ADA”), which generally requires that buildings be made accessibleto people with disabilities. Compliance with ADA requirements may require removal of access barriers, and noncompliance may result in imposition offines by the U.S. government or an award of damages to private litigants, or both. While the tenants to whom we lease space in our properties are obligatedby law to comply with the ADA provisions, and typically under tenant leases are obligated to cover costs associated with compliance, if required changesinvolve greater expenditures than anticipated, or if the changes must be made on a more accelerated basis than anticipated, the ability of these tenants tocover costs may be adversely affected. In addition, we are required to operate the properties in compliance with fire and safety regulations, building codesand other land use regulations, as they may be adopted by governmental entities and become applicable to the properties. Costs to be in compliance withthe ADA or any other building regulations could be material and have a negative impact on our results of operations.
Risk Factors Related to Real Estate Investments
Our real estate assets may decline in value and be subject to impairment losses which may reduce our net income.
Our real estate properties are carried at cost unless circumstances indicate that the carrying value of these assets may not be recoverable. We evaluatewhether there are any indicators, including property operating performance and general market conditions, such that the value of the real estate properties(including any related tangible or intangible assets or liabilities, including goodwill) may not be recoverable. Through the evaluation, we compare thecurrent carrying value of the asset to the estimated undiscounted cash flows that are directly associated with the use and ultimate disposition of the asset.Our estimated cash flows are based on several key assumptions, including rental rates, costs of tenant improvements, leasing commissions, anticipatedholding periods, and assumptions regarding the residual value upon disposition, including the exit capitalization rate. These key assumptions are subjectivein nature and may differ materially from actual results. Changes in our disposition strategy or changes in the marketplace may alter the holding period of anasset or asset group, which may result in an impairment loss and such loss may be material to the Company's financial condition or operating performance.To the extent that the carrying value of the asset exceeds the estimated undiscounted cash flows, an impairment loss is recognized equal to the excess ofcarrying value over fair value.
The fair value of real estate assets is subjective and is determined through the use of comparable sales information and other market data if available, orthrough use of an income approach such as the direct capitalization method or the discounted cash flow approach. Such cash flow projections take intoaccount expected future operating income, trends and prospects, as well as the effects of demand, competition and other relevant criteria, and therefore aresubject to management judgment. The impacts of the pandemic to future income, trends and prospects is uncertain and continues to evolve, therefore anyassumptions impacting real estate values may be subject to change in the future, which may impact the determination of fair value. In estimating the fairvalue of undeveloped land, we generally use market data and comparable sales information.
These subjective assessments have a direct impact on our net income because recording an impairment charge results in an immediate negative adjustmentto net income, which may be material. There can be no assurance that we will not record impairment charges in the future related to our assets.
11
We face risks associated with development, redevelopment and expansion of properties.
We actively pursue opportunities for new retail development and existing property redevelopment or expansion. Development and redevelopment activitiesrequire various government and other approvals for entitlements and any delay in such approvals may significantly delay development and redevelopmentprojects. We may not recover our investment in our projects for which approvals are not received, and delays may adversely impact our expected returns.Additionally, changes in political elections and policies may impact our ability to obtain favorable land use and zoning for in-process and futuredevelopments and redevelopment projects. We are subject to other risks associated with these activities, including the following:
• we may be unable to lease developments or redevelopments to full occupancy on a timely basis;
• the occupancy rates and rents of a completed project may not be sufficient to make the project profitable;
• actual costs of a project may exceed original estimates, possibly making the project unprofitable;
• delays in the development or construction process may increase our costs;
• construction cost increases may reduce investment returns on development and redevelopment opportunities;
• we may abandon development or redevelopment opportunities and lose our investment due to adverse market conditions;
• the size of our development and redevelopment pipeline may strain our labor or capital capacity to complete the development and redevelopmentprojects within targeted timelines and may reduce our investment returns;
• a reduction in the demand for new retail space may reduce our future development and redevelopment activities, which in turn may reduce ournet operating income; and
• changes in the level of future development and redevelopment activity may adversely impact our results from operations by reducing the amountof internal overhead costs that may be capitalized.
We face risks associated with the development of mixed-use commercial properties.
We have expanded our investment focus to include a limited number of more complex acquisitions and mixed-use development and redevelopment projectsin dense urban locations, which pose unique risks to our return on investment. Mixed-use projects refer to real estate projects that, in addition to retailspace, may also include space for residential, office, hotel or other commercial purposes. We have less experience in developing and managing non-retailreal estate than we do retail real estate. As a result, if a development or redevelopment project includes a non-retail use, we may seek to develop thatcomponent ourselves, sell the rights to that component to a third-party developer, or partner with a developer.
• If we decide to develop the non-retail components ourselves, we would be exposed not only to those risks typically associated with thedevelopment of commercial real estate, but also to risks associated with developing, owning, operating or selling non-retail real estate, includingbut not limited to more complex entitlement processes and multiple-story buildings. These unique risks may adversely impact our return oninvestment in these mixed-use development projects.
• If we sell the non-retail components, our retail component will be impacted by the decisions made by the other owners, and actions of thoseoccupying the non-retail spaces in these mixed-use properties.
• If we partner with a developer, it makes us dependent upon the partner's ability to perform and to agree on major decisions that impact ourinvestment returns of the project. In addition, there is a risk that the non-retail developer may default on its obligations necessitating that wecomplete the other components ourselves, including providing necessary financing.
In addition, redevelopment of existing shopping centers into mixed-use projects generally includes tenant vacancies before and during the redevelopment,which could result in volatility in NOI.
12
We face risks associated with the acquisition of properties.
Our investment strategy includes investing in high-quality shopping centers that are leased to market-leading grocers, category-leading anchors, specialtyretailers, or restaurants located in areas with high barriers to entry and above average household incomes and population densities. The acquisition ofproperties and/or real estate entities entails risks that include, but are not limited to, the following, any of which may adversely affect our results ofoperations and cash flows:
• properties we acquire may fail to achieve the occupancy or rental rates we project, within the time frames we estimate, which may result in theproperties' failure to achieve the investment returns we project;
• our investigation of an entity, property or building prior to our acquisition, and any representation we may have received from such seller, mayfail to reveal various liabilities including defects, necessary repairs or environmental matters requiring corrective action, which may increase ourcosts;
• our estimate of the costs to improve, reposition or redevelop a property may prove to be too low, or the time we estimate to complete theimprovement, repositioning or redevelopment may be too short, either of which may result in the property failing to achieve our projected return,either temporarily or permanently;
• we may not recover our costs from an unsuccessful acquisition;
• our acquisition activities may distract or strain our management capacity; and
• we may not be able to successfully integrate an acquisition into our existing operations platform.
We may be unable to sell properties when desired because of market conditions.
Our properties, including their related tangible and intangible assets, represent the majority of our total consolidated assets and they may not be readilyconvertible to cash. Moreover, pandemics such as COVID-19 may impact our ability to sell properties on our preferred timing and at prices and returns wedeem acceptable. As a result, our ability to sell one or more of our properties, including properties held in joint ventures, in response to changes ineconomic, industry, or other conditions may be limited. The real estate market is affected by many factors, such as general economic conditions,availability and terms of financing, interest rates and other factors, including supply and demand for space, that are beyond our control. There may be lessdemand for lower quality properties that we have identified for ultimate disposition in markets with uncertain economic or retail environments, and wherebuyers are more reliant on the availability of third party mortgage financing. If we want to sell a property, we can provide no assurance that we will be ableto dispose of it in the desired time period or at all or that the sales price of a property will be attractive at the relevant time or even exceed the carryingvalue of our investment.
Changes in tax laws could impact our acquisition or disposition of real estate.
Certain properties we own have a low tax basis, which may result in a taxable gain on sale. We intend to utilize Internal Revenue Code Section 1031 like-kind exchanges to mitigate taxable income; however, there can be no assurance that we will identify properties that meet our investment objectives foracquisitions or that changes to the tax laws do not eliminate or significantly change 1031 exchanges. In the event that we do not utilize 1031 exchanges, wemay be required to distribute the gain proceeds to shareholders or pay income tax, which may reduce our cash flow available to fund our commitments.
Risk Factors Related to the Environment Affecting Our Properties
Climate change may adversely impact our properties directly, and may lead to additional compliance obligations and costs as well as additionaltaxes and fees.
We cannot reliably predict the extent, rate, or impact of climate change. To the extent climate change causes adverse changes in weather patterns, ourproperties in certain markets, especially those nearer to the coasts, may experience increases in storm intensity and rising sea‑levels. Further, populationmigration may occur in response to these or other factors and negatively impact our centers. Climate and other environmental changes may result in volatileor decreased demand for retail space at certain of our properties or, in extreme cases, our inability to operate certain properties at all. Climate change mayalso have indirect effects on our business by increasing the cost of insurance, or making insurance unavailable. Moreover, while the federal government hasnot yet enacted comprehensive legislation to address climate change, certain states in which we own and operate shopping centers, including California andNew York, have done so. Compliance with these and future new laws or regulations related to climate change may require us to make improvements to ourexisting properties, resulting in increased capital expenditures, or pay additional taxes and fees assessed on us or our properties. Although we strive toidentify, analyze, and respond to the risk and opportunities that climate change presents, at this time, there can be no assurance that climate change will nothave an adverse effect on the value of our properties and our financial performance.
13
Geographic concentration of our properties makes our business more vulnerable to natural disasters, severe weather conditions and climatechange.
A significant number of our properties are located in areas that are susceptible to earthquakes, tropical storms, hurricanes, tornadoes, wildfires, sea-levelrise due to climate change, and other natural disasters. At December 31, 2020, 22% of the GLA of our portfolio is located in the state of California,including a number of properties in the San Francisco Bay and Los Angeles areas. Additionally, 23% and 8% of the GLA of our portfolio is located in thestates of Florida and Texas, respectively. Insurance costs for properties in these areas have increased, and recent intense weather conditions may causeproperty insurance premiums to increase significantly in the future. We recognize that the frequency and / or intensity of extreme weather events, sea-levelrise, and other climatic changes may continue to increase, and as a result, our exposure to these events may increase. These weather conditions may disruptour business and the business of our tenants, which may affect the ability of some tenants to pay rent and may reduce the willingness of tenants or residentsto remain in or move to these affected areas. Therefore, as a result of the geographic concentration of our properties, we face risks, including disruptions toour business and the businesses of our tenants and higher costs, such as uninsured property losses, higher insurance premiums, and potential additionalregulatory requirements by government agencies in response to perceived risks.
Costs of environmental remediation may impact our financial performance and reduce our cash flow.
Under various federal, state, and local laws, an owner or manager of real property may be liable for the costs to assess and remediate the presence ofhazardous substances on the property, which in our case generally arise from former dry cleaners, gas stations, asbestos usage, and historic land usepractices. These laws often impose liability without regard to whether the owner knew of, or was responsible for, the presence of hazardous substances. Thepresence of, or the failure to properly address the presence of, hazardous substances may adversely affect our ability to sell or lease the property or borrowusing the property as collateral. We can provide no assurance that we are aware of all potential environmental liabilities or their ultimate cost to address;that our properties will not be affected by tenants or nearby properties or other unrelated third parties; and that future uses or conditions, or changes inenvironmental laws and regulations, or their interpretation, will not result in additional material environmental liabilities to us.
Risk Factors Related to Corporate Matters
An uninsured loss or a loss that exceeds the insurance coverage on our properties may subject us to loss of capital and revenue on those properties.
We carry comprehensive liability, fire, flood, terrorism, business interruption, and environmental insurance for our properties with policy specifications andinsured limits customarily carried for similar properties. Some types of losses, such as losses from named windstorms, earthquakes, terrorism, or wars mayhave more limited coverage, or in some cases, can be excluded from insurance coverage. In addition, it is possible that the availability of insurancecoverage in certain areas may decrease in the future, and the cost to procure such insurance may increase due to factors beyond our control. We mayreduce the insurance we procure as a result of the foregoing or other factors. While we believe our coverage is appropriate and adequate to cover ourinsurable risks, should a loss occur at any of our properties that is in excess of the property or casualty insurance limits of our policies, we may lose part orall of our invested capital and revenues from such property, which may have a material adverse impact on our operating results, financial condition, and ourability to make distributions to stock and unit holders.
Terrorist activities or violence occurring at our properties also may directly affect the value of our properties through damage, destruction orloss. Insurance for such acts may be unavailable or cost more resulting in an increase to our operating expenses and adversely affect our results ofoperations. To the extent that our tenants are affected by such attacks and threats of attacks, their businesses may be adversely affected, including theirability to continue to meet obligations under their existing leases.
Failure to attract and retain key personnel may adversely affect our business and operations.
The success of our business depends, in part, on the leadership and performance of our executive management team and key employees, and our ability toattract, retain and motivate talented employees may significantly impact our future performance. Competition for these individuals is intense, and wecannot be assured that we will retain all of our executive management team and other key employees or that we will be able to attract and retain otherhighly qualified individuals for these positions in the future. Losing any one or more of these persons may have an adverse effect on us.
14
The unauthorized access, use, theft or destruction of tenant or employee personal, financial or other data or of Regency’s proprietary orconfidential information stored in our information systems or by third parties on our behalf could impact our reputation and brand and expose usto potential liability and loss of revenues.
Many of our information technology systems (including those we use for administration, accounting, and communications, as well as the systems of our co-investment partners and other third-party business partners and service providers, whether cloud-based or hosted in proprietary servers) contain personal,financial or other information that is entrusted to us by our tenants and employees. Many of our information technology systems also contain ourproprietary information and other confidential information related to our business. We are frequently subject to attempts to compromise our informationtechnology systems. To the extent we or a third party were to experience a material breach of our or such third party’s information technology systems thatresult in the unauthorized access, theft, use, destruction or other compromises of tenants’ or employees' data or our confidential information stored in suchsystems, including through cyber-attacks or other external or internal methods, such a breach may damage our reputation and cause us to lose tenants andrevenues, incur third party claims and cause disruption to our business and plans. Such security breaches also could result in a violation of applicable U.S.privacy and other laws, and subject us to private consumer, business partner, or securities litigation and governmental investigations and proceedings, anyof which could result in our exposure to material civil or criminal liability, and we may not be able to recover these expenses from our service providers,responsible parties, or insurance carriers. Despite the ongoing significant investments in technology and training we make in cybersecurity, we can provideno assurance that we will avoid or prevent such breaches or attacks.
Additionally, federal, state and local authorities continue to develop laws to address data privacy protection. Monitoring such changes, and taking steps tocomply, involves significant costs and effort by management, which may adversely affect our operating results and cash flows.
Despite the implementation of security measures for our disaster recovery and business continuity plans, our systems are vulnerable to damages frommultiple sources, including computer viruses, unauthorized access, energy blackouts, natural disasters, terrorism, war, and telecommunication failure. Anysystem failure or accident that causes interruptions in our operations could result in a material disruption to our business and cause us to incur additionalcosts to remedy such damages.
Risk Factors Related to Our Partnerships and Joint Ventures
We do not have voting control over all of the properties owned in our co-investment partnerships and joint ventures, so we are unable to ensurethat our objectives will be pursued.
We have invested substantial capital as a partner in a number of partnerships and joint ventures to acquire, own, lease, develop or redevelop properties.These activities are subject to the same risks as our investments in our wholly-owned properties. These investments, and other future similar investmentsmay involve risks that would not be present were a third party not involved, including the possibility that partners or other owners might become bankrupt,suffer a deterioration in their creditworthiness, or fail to fund their share of required capital contributions. Partners or other owners may have economic orother business interests or goals that are inconsistent with our own business interests or goals, and may be in a position to take actions contrary to ourpolicies or objectives.
These investments, and other future similar investments, also have the potential risk of creating impasses on decisions, such as a sale or financing, becauseneither we nor our partner or other owner has full control over the partnership or joint venture. Disputes between us and partners or other owners mightresult in litigation or arbitration that may increase our expenses and prevent management from focusing their time and efforts on our business.Consequently, actions by, or disputes with, partners or other owners might result in subjecting properties owned by the partnership or joint venture toadditional risk. In addition, we risk the possibility of being liable for the actions of our partners or other owners. These factors may limit the return that wereceive from such investments or cause our cash flows to be lower than our estimates.
The termination of our partnerships may adversely affect our cash flow, operating results, and our ability to make distributions to stock and unitholders.
If partnerships owning a significant number of properties were dissolved for any reason, we could lose the asset, property management, leasing andconstruction management fees from these partnerships as well as the operating income of the properties, which may adversely affect our operating resultsand our cash available for distribution to stock and unit holders. Certain of our partnership operating agreements provide either member the ability to electbuy/sell clauses. The election of these dissolution provisions could require us to invest additional capital to acquire the partners’ interest or to sell our shareof the property thereby losing the operating income and cash flow.
15

Risk Factors Related to Funding Strategies and Capital Structure
Our ability to sell properties and fund acquisitions and developments may be adversely impacted by higher market capitalization rates and lowerNOI at our properties which may dilute earnings.
As part of our funding strategy, we sell operating properties that no longer meet our investment standards or those with a limited future growth profile.These sales proceeds are used to fund debt repayment, acquisition of operating properties, and the construction of new developments and redevelopments.An increase in market capitalization rates or a decline in NOI may cause a reduction in the value of centers identified for sale, which would have an adverseimpact on the amount of cash generated. Additionally, the sale of properties resulting in significant tax gains may require higher distributions to ourstockholders or payment of additional income taxes in order to maintain our REIT status.
We depend on external sources of capital, which may not be available in the future on favorable terms or at all.
To qualify as a REIT, the Parent Company must, among other things, distribute to its stockholders each year at least 90% of its REIT taxable income(excluding any net capital gains). Because of these distribution requirements, we may not be able to fund all future capital needs with income fromoperations. In such instances, we would rely on third-party sources of capital, which may or may not be available on favorable terms or at all. Our access tothird-party sources of capital depends on a number of things, including the market's perception of our growth potential and our current and potential futureearnings. Our access to debt depends on our credit rating, the willingness of creditors to lend to us and conditions in the capital markets. In addition tofinding creditors willing to lend to us, we are dependent upon our joint venture partners to contribute their pro rata share of any amount needed to repay orrefinance existing debt when lenders reduce the amount of debt our partnerships and joint ventures are eligible to refinance.
In addition, our existing debt arrangements also impose covenants that limit our flexibility in obtaining other financing. Additional equity offerings mayresult in substantial dilution of stockholders' interests and additional debt financing may substantially increase our degree of leverage.
Without access to external sources of capital, we would be required to pay outstanding debt with our operating cash flows and proceeds from propertysales. Our operating cash flows may not be sufficient to pay our outstanding debt as it comes due and real estate investments generally cannot be soldquickly at a return we believe is appropriate. If we are required to deleverage our business with operating cash flows and proceeds from property sales, wemay be forced to reduce the amount of, or eliminate altogether, our distributions to stock and unit holders or refrain from making investments in ourbusiness.
Our debt financing may adversely affect our business and financial condition.
Our ability to make scheduled payments or to refinance our indebtedness will depend primarily on our future performance, which to a certain extent issubject to economic, financial, competitive and other factors beyond our control. In addition, we do not expect to generate sufficient operating cash flow tomake balloon principal payments on our debt when due. If we are unable to refinance our debt on acceptable terms, we may be forced (i) to dispose ofproperties, which might result in losses, or (ii) to obtain financing at unfavorable terms, either of which may reduce the cash flow available for distributionsto stock and unit holders. If we cannot make required mortgage payments, the mortgagee may foreclose on the property securing the mortgage.
Covenants in our debt agreements may restrict our operating activities and adversely affect our financial condition.
Our unsecured notes, unsecured term loans, and unsecured line of credit (the “Line”) contain customary covenants, including compliance with financialratios, such as ratio of indebtedness to total asset value and fixed charge coverage ratio. These covenants may limit our operational flexibility and ourinvestment activities. Moreover, if we breach any of the covenants in our debt agreements, and do not cure the breach within the applicable cure period, ourlenders may require us to repay the debt immediately, even in the absence of a payment default. Many of our debt arrangements, including our unsecurednotes, unsecured term loan, and unsecured line of credit are cross-defaulted, which means that the lenders under those debt arrangements can requireimmediate repayment of their debt if we breach and fail to cure a default under certain of our other material debt obligations. As a result, any default underour debt covenants may have an adverse effect on our financial condition, our results of operations, our ability to meet our obligations, and the marketvalue of our stock.
16
Increases in interest rates would cause our borrowing costs to rise and negatively impact our results of operations.
Although a significant amount of our outstanding debt has fixed interest rates, we do borrow funds at variable interest rates under our credit facility, termloan, and certain secured borrowings. As of December 31, 2020, less than 1.0% of our outstanding debt was variable rate debt not hedged to fixed rate debt.Increases in interest rates would increase our interest expense on any variable rate debt to the extent we have not hedged our exposure to changes in interestrates. In addition, increases in interest rates will affect the terms under which we refinance our existing debt as it matures, to the extent we have not hedgedour exposure to changes in interest rates. This would reduce our future earnings and cash flows, which may adversely affect our ability to service our debtand meet our other obligations and also may reduce the amount we are able to distribute to our stock and unit holders.
Hedging activity may expose us to risks, including the risks that a counterparty will not perform and that the hedge will not yield the economicbenefits we anticipate, which may adversely affect us.
We manage our exposure to interest rate volatility by using interest rate hedging arrangements. These arrangements involve risk, such as the risk thatcounterparties may fail to honor their obligations under these arrangements, and that these arrangements may not be effective in reducing our exposure tointerest rate changes. There can be no assurance that our hedging arrangements will qualify for hedge accounting or that our hedging activities will have thedesired beneficial impact on our results of operations. Should we desire to terminate a hedging arrangement, there may be significant costs and cashrequirements involved to fulfill our obligations under the hedging arrangement. In addition, failure to effectively hedge against interest rate changes mayadversely affect our results of operations.
The interest rates on our Unsecured Credit facilities as well as on our variable rate mortgages and interest rate swaps might change based onchanges to the method in which LIBOR or its replacement rate is determined.
In July 2017, the Financial Conduct Authority (“FCA”) that regulates the London Inter-bank Offered Rate (“LIBOR”) announced it intends to stopcompelling banks to submit rates for the calculation of LIBOR after 2021. As a result, the Federal Reserve Board and the Federal Reserve Bank of NewYork organized the Alternative Reference Rates Committee (“ARRC”) which identified the Secured Overnight Financing Rate (“SOFR”) as its preferredalternative to USD-LIBOR in derivatives and other financial contracts. We are not able to predict when LIBOR will cease to be available or when therewill be sufficient liquidity in the SOFR markets. Any changes adopted by FCA or other governing bodies in the method used for determining LIBOR mayresult in a sudden or prolonged increase or decrease in reported LIBOR. If that were to occur, our interest payments could change. In addition, uncertaintyabout the extent and manner of future changes may result in interest rates and/or payments that are higher or lower than if LIBOR were to remain availablein its current form.
We have contracts that are indexed to LIBOR, including our $1.25 billion unsecured revolving credit facility and fifteen mortgages within our consolidatedand unconsolidated portfolios totaling $225.5 million on a Pro-rata basis, as well as interest rate swaps to fix these variable cash flows with notionalamounts totaling $177.0 million on a Pro-rata basis. These LIBOR based instruments mature between 2020 and 2028. We are monitoring and evaluatingthe related risks, which include interest on loans or amounts received and paid on derivative instruments. These risks arise in connection with transitioningcontracts to a new alternative rate, including any resulting value transfer that may occur. The value of loans, securities, or derivative instruments tied toLIBOR could also be impacted if LIBOR is limited or discontinued. For some instruments, the method of transitioning to an alternative rate may bechallenging, as they may require negotiation with the respective counterparty.
If a contract is not transitioned to an alternative rate and LIBOR is discontinued, the impact is likely to vary by contract. If LIBOR is discontinued or if themethods of calculating LIBOR change from their current form, interest rates on our current or future indebtedness and related interest rate swaps may beadversely affected.
While we expect LIBOR to be available in substantially its current form through June 2023, it is possible that LIBOR will become nonrepresentative priorto that point. This could result, for example, if sufficient banks decline to make submissions to the LIBOR administrator. In that case, the risks associatedwith the transition to an alternative reference rate will be accelerated and magnified.
17

Risk Factors Related to the Market Price for Our Securities
Changes in economic and market conditions may adversely affect the market price of our securities.
The market price of our debt and equity securities may fluctuate significantly in response to many factors, many of which are out of our control, including:
• actual or anticipated variations in our operating results;
• changes in our funds from operations or earnings estimates;
• publication of research reports about us or the real estate industry in general and recommendations by financial analysts or actions taken by ratingagencies with respect to our securities or those of other REITs;
• the ability of our tenants to pay rent and meet their other obligations to us under current lease terms and our ability to re-lease space as leasesexpire;
• increases in market interest rates that drive purchasers of our stock to demand a higher dividend yield;
• changes in market valuations of similar companies;
• adverse market reaction to any additional debt we incur in the future;
• any future issuances of equity securities;
• additions or departures of key management personnel;
• strategic actions by us or our competitors, such as acquisitions or restructurings;
• actions by institutional stockholders;
• reports by corporate governance rating companies;
• increased investor focus on sustainability-related risks, including climate change;
• changes in our dividend payments;
• potential tax law changes on REITs;
• speculation in the press or investment community; and
• general market and economic conditions.
These factors may cause the market price of our securities to decline, regardless of our financial condition, results of operations, business or prospects. It isimpossible to ensure that the market price of our securities, including our common stock, will not fall in the future. A decrease in the market price of ourcommon stock may reduce our ability to raise additional equity in the public markets. Selling common stock at a decreased market price would have adilutive impact on existing stockholders.
There is no assurance that we will continue to pay dividends at historical rates.
Our ability to continue to pay dividends at historical rates or to increase our dividend rate will depend on a number of factors, including, among others, thefollowing:
• our financial condition and results of future operations;
• the terms of our loan covenants; and
• our ability to acquire, finance, develop or redevelop and lease additional properties at attractive rates.
If we do not maintain or periodically increase the dividend on our common stock, it may have an adverse effect on the market price of our common stockand other securities.
18
Risk Factors Relating to the Company’s Qualification as a REIT
If the Parent Company fails to qualify as a REIT for federal income tax purposes, it would be subject to federal income tax at regular corporaterates.
We believe that the Parent Company qualifies for taxation as a REIT for federal income tax purposes, and we plan to operate so that we can continue tomeet the requirements for taxation as a REIT. If the Parent Company continues to qualify as a REIT, it generally will not be subject to federal income taxon income that we distribute to our stockholders. Many REIT requirements, however, are highly technical and complex. The determination that the ParentCompany is a REIT requires an analysis of various factual matters and circumstances, some of which may not be totally within our control and some ofwhich involve questions of interpretation. For example, to qualify as a REIT, at least 95% of our gross income must come from specific passive sources,like rent, that are itemized in the REIT tax laws. There can be no assurance that the Internal Revenue Service (“IRS”) or a court would agree with thepositions we have taken in interpreting the REIT requirements. We are also required to distribute to our stockholders at least 90% of our REIT taxableincome, excluding net capital gains. We will be subject to U.S. federal income tax on our undistributed taxable income and net capital gain and to a 4%nondeductible excise tax on any amount by which distributions we pay with respect to any calendar year are less than the sum of 85% of our ordinaryincome, 95% of our capital gain net income and 100% of our undistributed income from prior years. The fact that we hold many of our assets through co-investment partnerships and their subsidiaries further complicates the application of the REIT requirements. Furthermore, Congress and the IRS mightmake changes to the tax laws and regulations, and the courts might issue new rulings, that make it more difficult for the Parent Company to remainqualified as a REIT.
Also, unless the IRS granted relief under certain statutory provisions, the Parent Company would remain disqualified as a REIT for four years following theyear it first failed to qualify. If the Parent Company failed to qualify as a REIT (currently and/or with respect to any tax years for which the statute oflimitations has not expired), we would have to pay significant income taxes, reducing cash available to pay dividends, which would likely have asignificant adverse effect on the value of our securities. In addition, we would no longer be required to pay any dividends to stockholders in order tomaintain our REIT status. Although we believe that the Parent Company qualifies as a REIT, we cannot be assured that the Parent Company will continueto qualify or remain qualified as a REIT for tax purposes.
Even if the Parent Company qualifies as a REIT for federal income tax purposes, we are required to pay certain federal, state, and local taxes on our incomeand property. For example, if we have net income from “prohibited transactions,” that income will be subject to a 100% tax. In general, prohibitedtransactions include sales or other dispositions of property held primarily for sale to customers in the ordinary course of business. The determination as towhether a particular sale is a prohibited transaction depends on the facts and circumstances related to that sale. While we have undertaken a significantnumber of asset sales in recent years, we do not believe that those sales should be considered prohibited transactions, but there can be no assurance that theIRS would not contend otherwise.
New legislation, as well as new regulations, administrative interpretations, or court decisions may be introduced, enacted, or promulgated from time totime, that may change the tax laws or interpretations of the tax laws regarding qualification as a REIT, or the federal income tax consequences of thatqualification, in a manner that is adverse to our stockholders.
Dividends paid by REITs generally do not qualify for reduced tax rates.
Subject to limited exceptions, dividends paid by REITs (other than distributions designated as capital gain dividends, qualified dividends or returns ofcapital) are not eligible for reduced rates for qualified dividends paid by “C” corporations and are taxable at ordinary income tax rates. The more favorabletax rates applicable to regular corporate qualified dividends may cause investors who are individuals, trusts and estates to perceive investments in REITs tobe relatively less attractive than investments in the stocks of non-REIT corporations that pay dividends, which may adversely affect the value of the sharesof REITs, including the shares of our capital stock.
Certain foreign stockholders may be subject to U.S. federal income tax on gain recognized on a disposition of our common stock if we do notqualify as a “domestically controlled” REIT.
A foreign person disposing of a U.S. real property interest, including shares of a U.S. corporation whose assets consist principally of U.S. real propertyinterests is generally subject to U.S. federal income tax on any gain recognized on the disposition. This tax does not apply, however, to the disposition ofstock in a REIT if the REIT is “domestically controlled.” In general, we will be a domestically controlled REIT if at all times during the five-year periodending on the applicable stockholder’s disposition of our stock, less than 50% in value of our stock was held directly or indirectly by non-U.S. persons. Ifwe were to fail to qualify as a domestically controlled REIT, gain recognized by a foreign stockholder on a disposition of our common stock would besubject to U.S. federal income tax unless our common stock was traded on an established securities market and the foreign stockholder did not at any timeduring a specified testing period directly or indirectly own more than 10% of our outstanding common stock.
19

Legislative or other actions affecting REITs may have a negative effect on us.
The rules dealing with federal income taxation are constantly under review by persons involved in the legislative process and by the IRS and the U.S.Department of the Treasury. Changes to the tax laws, with or without retroactive application, may adversely affect Regency or our investors. We cannotpredict how changes in the tax laws might affect Regency or our investors. New legislation, Treasury Regulations, administrative interpretations or courtdecisions may significantly and negatively affect our ability to qualify as a REIT or the federal income tax consequences of such qualification, or thefederal income tax consequences of an investment in us. There is also a risk that REIT status may be adversely impacted by a change in tax or otherlaws. Also, the law relating to the tax treatment of other entities, or an investment in other entities, may change, making an investment in such otherentities more attractive relative to an investment in a REIT.
Complying with REIT requirements may limit our ability to hedge effectively and may cause us to incur tax liabilities.
The REIT provisions of the Code limit our ability to hedge our liabilities. Generally, income from a hedging transaction that constitutes “qualifyingincome” for purposes of the 75% or 95% gross income tests applicable to REITs, does not constitute “gross income” for purposes of the 75% or 95% grossincome tests, provided that we properly identify the hedging transaction pursuant to the applicable sections of the Code and Treasury Regulations. To theextent that we enter into other types of hedging transactions, or fail to make the proper tax identifications, the income from those transactions is likely to betreated as non-qualifying income for purposes of both gross income tests. As a result of these rules, we may need to limit our use of otherwiseadvantageous hedging techniques or implement those hedges through a taxable REIT subsidiary (“TRS”).
Risks Related to the Company’s Common Stock
Restrictions on the ownership of the Parent Company’s capital stock to preserve its REIT status may delay or prevent a change in control.
Ownership of more than 7% by value of our outstanding capital stock is prohibited, with certain exceptions, by the Parent Company's articles ofincorporation, for the purpose of maintaining its qualification as a REIT. This 7% limitation may discourage a change in control and may also (i) detertender offers for our capital stock, which offers may be attractive to our stockholders, or (ii) limit the opportunity for our stockholders to receive a premiumfor their capital stock that might otherwise exist if an investor attempted to assemble a block in excess of 7% of our outstanding capital stock or to affect achange in control.
The issuance of the Parent Company's capital stock may delay or prevent a change in control.
The Parent Company's articles of incorporation authorize our Board of Directors to issue up to 30,000,000 shares of preferred stock and 10,000,000 sharesof special common stock and to establish the preferences and rights of any shares issued. The issuance of preferred stock or special common stock mayhave the effect of delaying or preventing a change in control. The provisions of the Florida Business Corporation Act regarding affiliated transactions mayalso deter potential acquisitions by preventing the acquiring party from consummating a merger or other extraordinary corporate transaction without theapproval of our disinterested stockholders.
Ownership in the Parent Company may be diluted in the future.
In the future, a stockholder’s percentage ownership in the Company may be diluted because of equity issuances for acquisitions, capital market transactionsor other corporate purposes, including equity awards we will grant to our directors, officers and employees. In the past we have issued equity in thesecondary market and may do so again in the future, depending on the price of our stock and other factors.
In addition, our amended and restated certificate of incorporation authorizes us to issue, without the approval of our stockholders, one or more classes orseries of preferred stock having such designation, powers, preferences and relative, participating, optional and other special rights, including preferencesover our common stock respecting dividends and distributions, as our board of directors generally may determine. The terms of one or more classes orseries of preferred stock could dilute the voting power or reduce the value of our common stock. For example, we could grant the holders of preferred stockthe right to elect some number of our directors in all events or on the happening of specified events or the right to veto specified transactions. Similarly, therepurchase or redemption rights or liquidation preferences we could assign to holders of preferred stock could affect the residual value of the commonstock.
Item 1B. Unresolved Staff Comments
None.
20
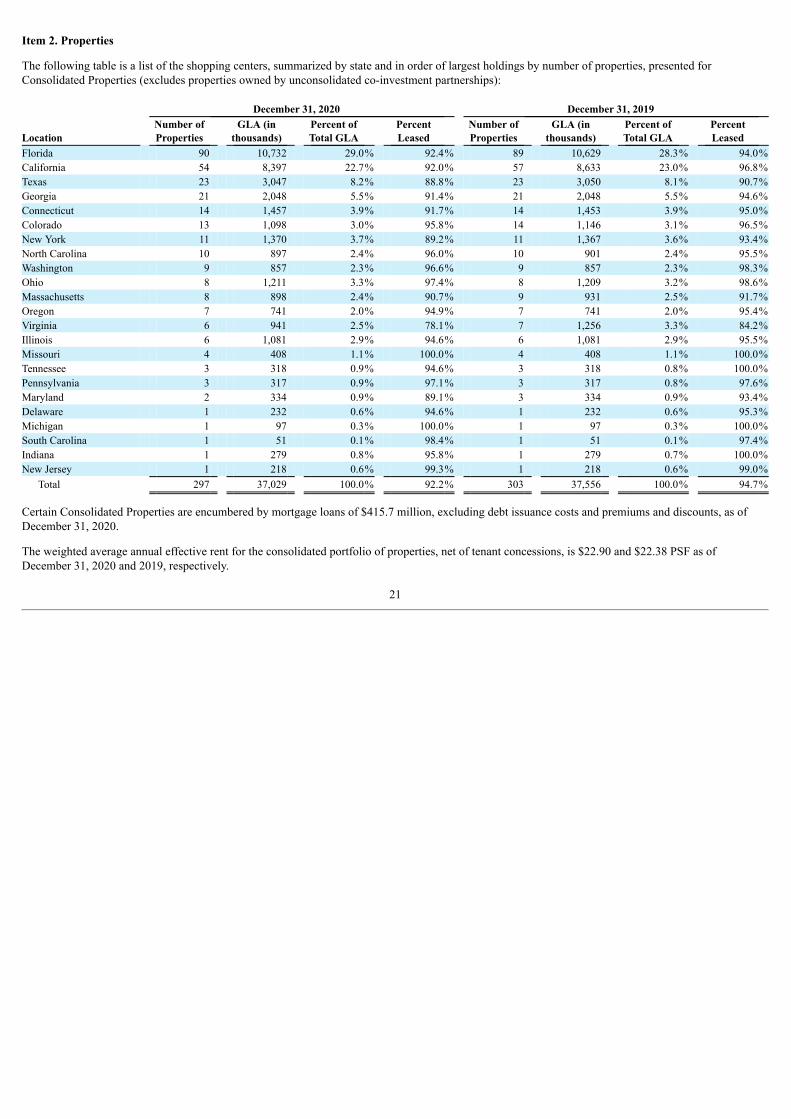
Item 2. Properties
The following table is a list of the shopping centers, summarized by state and in order of largest holdings by number of properties, presented forConsolidated Properties (excludes properties owned by unconsolidated co-investment partnerships):
December 31, 2020 December 31, 2019
Location Number ofProperties
GLA (inthousands)
Percent ofTotal GLA
PercentLeased
Number ofProperties
GLA (inthousands)
Percent ofTotal GLA
PercentLeased
Florida 90 10,732 29.0% 92.4% 89 10,629 28.3% 94.0%California 54 8,397 22.7% 92.0% 57 8,633 23.0% 96.8%Texas 23 3,047 8.2% 88.8% 23 3,050 8.1% 90.7%Georgia 21 2,048 5.5% 91.4% 21 2,048 5.5% 94.6%Connecticut 14 1,457 3.9% 91.7% 14 1,453 3.9% 95.0%Colorado 13 1,098 3.0% 95.8% 14 1,146 3.1% 96.5%New York 11 1,370 3.7% 89.2% 11 1,367 3.6% 93.4%North Carolina 10 897 2.4% 96.0% 10 901 2.4% 95.5%Washington 9 857 2.3% 96.6% 9 857 2.3% 98.3%Ohio 8 1,211 3.3% 97.4% 8 1,209 3.2% 98.6%Massachusetts 8 898 2.4% 90.7% 9 931 2.5% 91.7%Oregon 7 741 2.0% 94.9% 7 741 2.0% 95.4%Virginia 6 941 2.5% 78.1% 7 1,256 3.3% 84.2%Illinois 6 1,081 2.9% 94.6% 6 1,081 2.9% 95.5%Missouri 4 408 1.1% 100.0% 4 408 1.1% 100.0%Tennessee 3 318 0.9% 94.6% 3 318 0.8% 100.0%Pennsylvania 3 317 0.9% 97.1% 3 317 0.8% 97.6%Maryland 2 334 0.9% 89.1% 3 334 0.9% 93.4%Delaware 1 232 0.6% 94.6% 1 232 0.6% 95.3%Michigan 1 97 0.3% 100.0% 1 97 0.3% 100.0%South Carolina 1 51 0.1% 98.4% 1 51 0.1% 97.4%Indiana 1 279 0.8% 95.8% 1 279 0.7% 100.0%New Jersey 1 218 0.6% 99.3% 1 218 0.6% 99.0%
Total 297 37,029 100.0% 92.2% 303 37,556 100.0% 94.7%
Certain Consolidated Properties are encumbered by mortgage loans of $415.7 million, excluding debt issuance costs and premiums and discounts, as ofDecember 31, 2020.
The weighted average annual effective rent for the consolidated portfolio of properties, net of tenant concessions, is $22.90 and $22.38 PSF as ofDecember 31, 2020 and 2019, respectively.
21
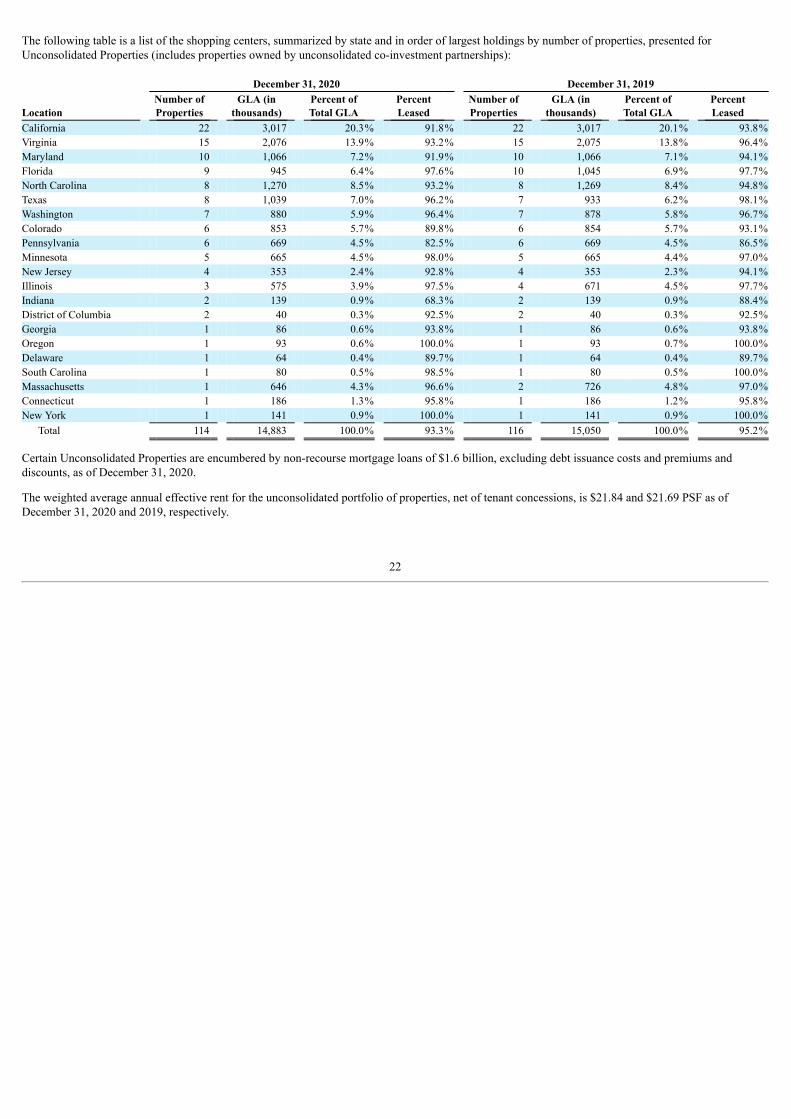
The following table is a list of the shopping centers, summarized by state and in order of largest holdings by number of properties, presented forUnconsolidated Properties (includes properties owned by unconsolidated co-investment partnerships):
December 31, 2020 December 31, 2019
Location Number ofProperties
GLA (inthousands)
Percent ofTotal GLA
PercentLeased
Number ofProperties
GLA (inthousands)
Percent ofTotal GLA
PercentLeased
California 22 3,017 20.3% 91.8% 22 3,017 20.1% 93.8%Virginia 15 2,076 13.9% 93.2% 15 2,075 13.8% 96.4%Maryland 10 1,066 7.2% 91.9% 10 1,066 7.1% 94.1%Florida 9 945 6.4% 97.6% 10 1,045 6.9% 97.7%North Carolina 8 1,270 8.5% 93.2% 8 1,269 8.4% 94.8%Texas 8 1,039 7.0% 96.2% 7 933 6.2% 98.1%Washington 7 880 5.9% 96.4% 7 878 5.8% 96.7%Colorado 6 853 5.7% 89.8% 6 854 5.7% 93.1%Pennsylvania 6 669 4.5% 82.5% 6 669 4.5% 86.5%Minnesota 5 665 4.5% 98.0% 5 665 4.4% 97.0%New Jersey 4 353 2.4% 92.8% 4 353 2.3% 94.1%Illinois 3 575 3.9% 97.5% 4 671 4.5% 97.7%Indiana 2 139 0.9% 68.3% 2 139 0.9% 88.4%District of Columbia 2 40 0.3% 92.5% 2 40 0.3% 92.5%Georgia 1 86 0.6% 93.8% 1 86 0.6% 93.8%Oregon 1 93 0.6% 100.0% 1 93 0.7% 100.0%Delaware 1 64 0.4% 89.7% 1 64 0.4% 89.7%South Carolina 1 80 0.5% 98.5% 1 80 0.5% 100.0%Massachusetts 1 646 4.3% 96.6% 2 726 4.8% 97.0%Connecticut 1 186 1.3% 95.8% 1 186 1.2% 95.8%New York 1 141 0.9% 100.0% 1 141 0.9% 100.0%
Total 114 14,883 100.0% 93.3% 116 15,050 100.0% 95.2%
Certain Unconsolidated Properties are encumbered by non-recourse mortgage loans of $1.6 billion, excluding debt issuance costs and premiums anddiscounts, as of December 31, 2020.
The weighted average annual effective rent for the unconsolidated portfolio of properties, net of tenant concessions, is $21.84 and $21.69 PSF as ofDecember 31, 2020 and 2019, respectively.
22
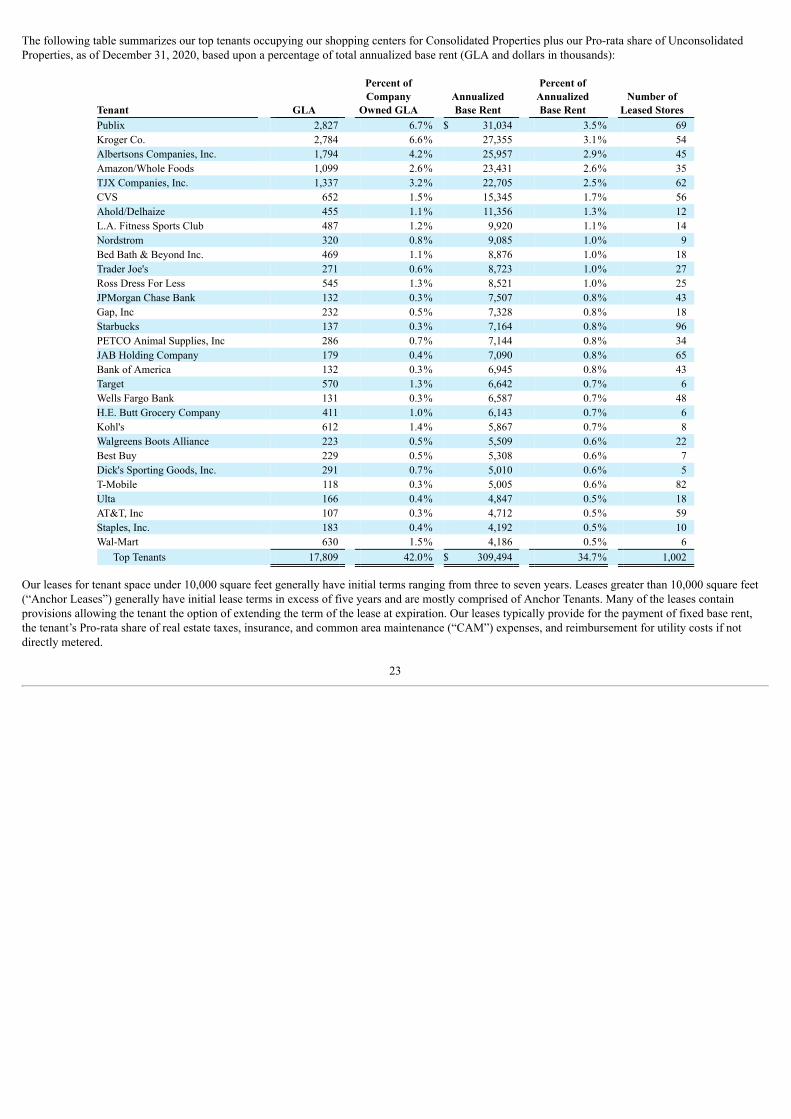
The following table summarizes our top tenants occupying our shopping centers for Consolidated Properties plus our Pro-rata share of UnconsolidatedProperties, as of December 31, 2020, based upon a percentage of total annualized base rent (GLA and dollars in thousands):
Tenant GLA
Percent ofCompany
Owned GLA AnnualizedBase Rent
Percent ofAnnualizedBase Rent
Number ofLeased Stores
Publix 2,827 6.7% $ 31,034 3.5% 69 Kroger Co. 2,784 6.6% 27,355 3.1% 54 Albertsons Companies, Inc. 1,794 4.2% 25,957 2.9% 45 Amazon/Whole Foods 1,099 2.6% 23,431 2.6% 35 TJX Companies, Inc. 1,337 3.2% 22,705 2.5% 62 CVS 652 1.5% 15,345 1.7% 56 Ahold/Delhaize 455 1.1% 11,356 1.3% 12 L.A. Fitness Sports Club 487 1.2% 9,920 1.1% 14 Nordstrom 320 0.8% 9,085 1.0% 9 Bed Bath & Beyond Inc. 469 1.1% 8,876 1.0% 18 Trader Joe's 271 0.6% 8,723 1.0% 27 Ross Dress For Less 545 1.3% 8,521 1.0% 25 JPMorgan Chase Bank 132 0.3% 7,507 0.8% 43 Gap, Inc 232 0.5% 7,328 0.8% 18 Starbucks 137 0.3% 7,164 0.8% 96 PETCO Animal Supplies, Inc 286 0.7% 7,144 0.8% 34 JAB Holding Company 179 0.4% 7,090 0.8% 65 Bank of America 132 0.3% 6,945 0.8% 43 Target 570 1.3% 6,642 0.7% 6 Wells Fargo Bank 131 0.3% 6,587 0.7% 48 H.E. Butt Grocery Company 411 1.0% 6,143 0.7% 6 Kohl's 612 1.4% 5,867 0.7% 8 Walgreens Boots Alliance 223 0.5% 5,509 0.6% 22 Best Buy 229 0.5% 5,308 0.6% 7 Dick's Sporting Goods, Inc. 291 0.7% 5,010 0.6% 5 T-Mobile 118 0.3% 5,005 0.6% 82 Ulta 166 0.4% 4,847 0.5% 18 AT&T, Inc 107 0.3% 4,712 0.5% 59 Staples, Inc. 183 0.4% 4,192 0.5% 10 Wal-Mart 630 1.5% 4,186 0.5% 6
Top Tenants 17,809 42.0% $ 309,494 34.7% 1,002
Our leases for tenant space under 10,000 square feet generally have initial terms ranging from three to seven years. Leases greater than 10,000 square feet(“Anchor Leases”) generally have initial lease terms in excess of five years and are mostly comprised of Anchor Tenants. Many of the leases containprovisions allowing the tenant the option of extending the term of the lease at expiration. Our leases typically provide for the payment of fixed base rent,the tenant’s Pro-rata share of real estate taxes, insurance, and common area maintenance (“CAM”) expenses, and reimbursement for utility costs if notdirectly metered.
23
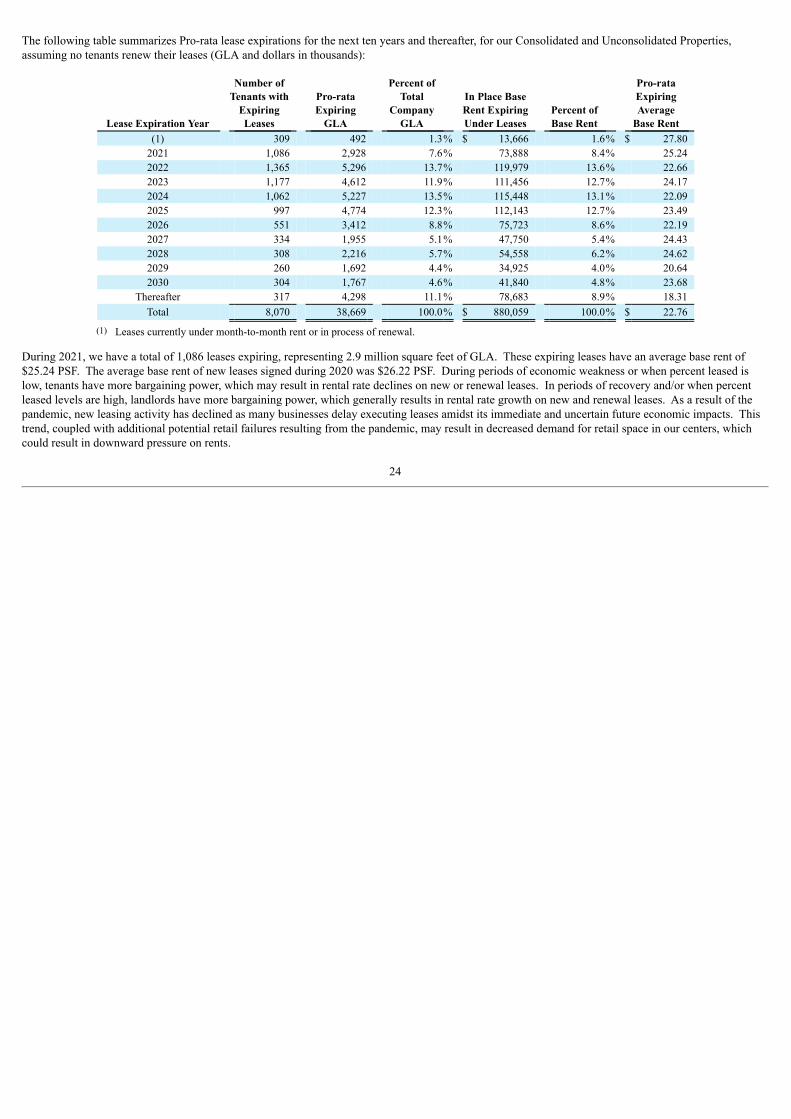
The following table summarizes Pro-rata lease expirations for the next ten years and thereafter, for our Consolidated and Unconsolidated Properties,assuming no tenants renew their leases (GLA and dollars in thousands):
Lease Expiration Year
Number ofTenants with
ExpiringLeases
Pro-rataExpiring
GLA
Percent ofTotal
CompanyGLA
In Place BaseRent ExpiringUnder Leases
Percent ofBase Rent
Pro-rataExpiringAverage
Base Rent (1) 309 492 1.3% $ 13,666 1.6% $ 27.80
2021 1,086 2,928 7.6% 73,888 8.4% 25.24 2022 1,365 5,296 13.7% 119,979 13.6% 22.66 2023 1,177 4,612 11.9% 111,456 12.7% 24.17 2024 1,062 5,227 13.5% 115,448 13.1% 22.09 2025 997 4,774 12.3% 112,143 12.7% 23.49 2026 551 3,412 8.8% 75,723 8.6% 22.19 2027 334 1,955 5.1% 47,750 5.4% 24.43 2028 308 2,216 5.7% 54,558 6.2% 24.62 2029 260 1,692 4.4% 34,925 4.0% 20.64 2030 304 1,767 4.6% 41,840 4.8% 23.68
Thereafter 317 4,298 11.1% 78,683 8.9% 18.31 Total 8,070 38,669 100.0% $ 880,059 100.0% $ 22.76
(1) Leases currently under month-to-month rent or in process of renewal.
During 2021, we have a total of 1,086 leases expiring, representing 2.9 million square feet of GLA. These expiring leases have an average base rent of$25.24 PSF. The average base rent of new leases signed during 2020 was $26.22 PSF. During periods of economic weakness or when percent leased islow, tenants have more bargaining power, which may result in rental rate declines on new or renewal leases. In periods of recovery and/or when percentleased levels are high, landlords have more bargaining power, which generally results in rental rate growth on new and renewal leases. As a result of thepandemic, new leasing activity has declined as many businesses delay executing leases amidst its immediate and uncertain future economic impacts. Thistrend, coupled with additional potential retail failures resulting from the pandemic, may result in decreased demand for retail space in our centers, whichcould result in downward pressure on rents.
24
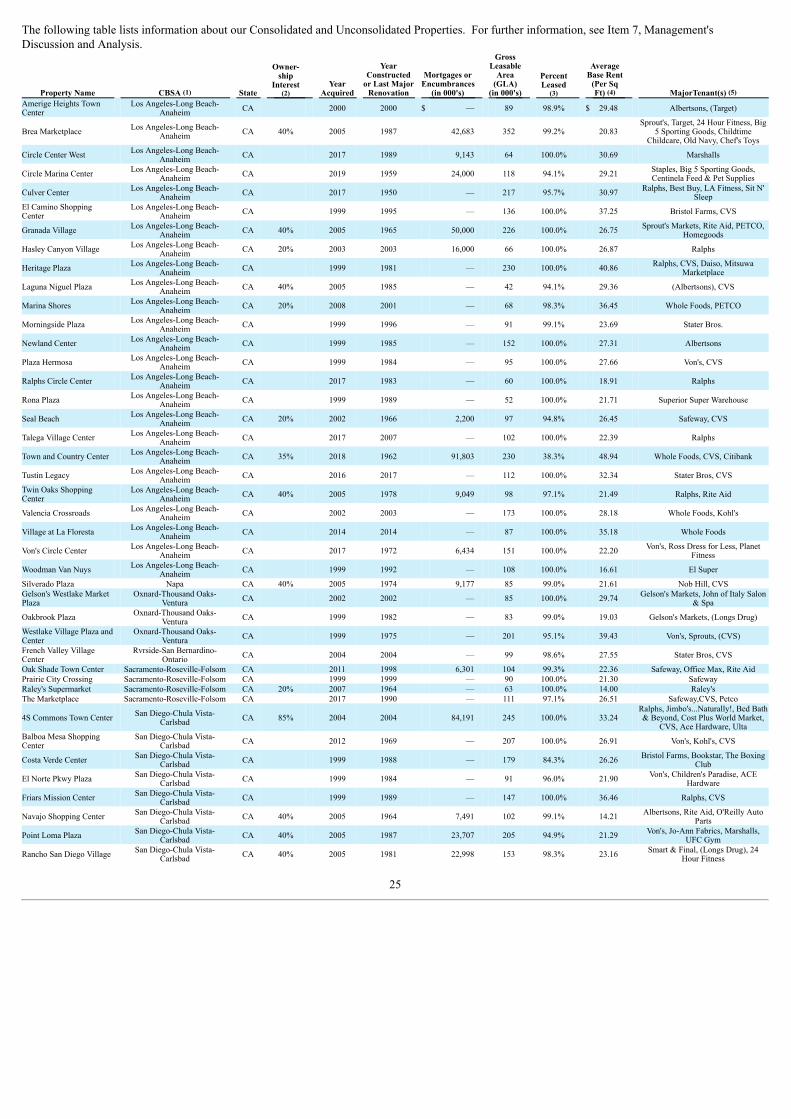
The following table lists information about our Consolidated and Unconsolidated Properties. For further information, see Item 7, Management'sDiscussion and Analysis.
Property Name CBSA (1) State
Owner-ship
Interest(2)
YearAcquired
YearConstructed
or Last MajorRenovation
Mortgages orEncumbrances
(in 000's)
GrossLeasable
Area(GLA)
(in 000's)
PercentLeased
(3)
AverageBase Rent
(Per SqFt) (4) MajorTenant(s) (5)
Amerige Heights TownCenter Los Angeles-Long Beach-
Anaheim CA 2000 2000 $ — 89 98.9% $ 29.48 Albertsons, (Target)
Brea Marketplace Los Angeles-Long Beach-Anaheim CA 40% 2005 1987 42,683 352 99.2% 20.83
Sprout's, Target, 24 Hour Fitness, Big5 Sporting Goods, Childtime
Childcare, Old Navy, Chef's Toys
Circle Center West Los Angeles-Long Beach-Anaheim CA 2017 1989 9,143 64 100.0% 30.69 Marshalls
Circle Marina Center Los Angeles-Long Beach-Anaheim CA 2019 1959 24,000 118 94.1% 29.21 Staples, Big 5 Sporting Goods,
Centinela Feed & Pet Supplies
Culver Center Los Angeles-Long Beach-Anaheim CA 2017 1950 — 217 95.7% 30.97 Ralphs, Best Buy, LA Fitness, Sit N'
SleepEl Camino ShoppingCenter Los Angeles-Long Beach-
Anaheim CA 1999 1995 — 136 100.0% 37.25 Bristol Farms, CVS
Granada Village Los Angeles-Long Beach-Anaheim CA 40% 2005 1965 50,000 226 100.0% 26.75 Sprout's Markets, Rite Aid, PETCO,
Homegoods
Hasley Canyon Village Los Angeles-Long Beach-Anaheim CA 20% 2003 2003 16,000 66 100.0% 26.87 Ralphs
Heritage Plaza Los Angeles-Long Beach-Anaheim CA 1999 1981 — 230 100.0% 40.86 Ralphs, CVS, Daiso, Mitsuwa
Marketplace
Laguna Niguel Plaza Los Angeles-Long Beach-Anaheim CA 40% 2005 1985 — 42 94.1% 29.36 (Albertsons), CVS
Marina Shores Los Angeles-Long Beach-Anaheim CA 20% 2008 2001 — 68 98.3% 36.45 Whole Foods, PETCO
Morningside Plaza Los Angeles-Long Beach-Anaheim CA 1999 1996 — 91 99.1% 23.69 Stater Bros.
Newland Center Los Angeles-Long Beach-Anaheim CA 1999 1985 — 152 100.0% 27.31 Albertsons
Plaza Hermosa Los Angeles-Long Beach-Anaheim CA 1999 1984 — 95 100.0% 27.66 Von's, CVS
Ralphs Circle Center Los Angeles-Long Beach-Anaheim CA 2017 1983 — 60 100.0% 18.91 Ralphs
Rona Plaza Los Angeles-Long Beach-Anaheim CA 1999 1989 — 52 100.0% 21.71 Superior Super Warehouse
Seal Beach Los Angeles-Long Beach-Anaheim CA 20% 2002 1966 2,200 97 94.8% 26.45 Safeway, CVS
Talega Village Center Los Angeles-Long Beach-Anaheim CA 2017 2007 — 102 100.0% 22.39 Ralphs
Town and Country Center Los Angeles-Long Beach-Anaheim CA 35% 2018 1962 91,803 230 38.3% 48.94 Whole Foods, CVS, Citibank
Tustin Legacy Los Angeles-Long Beach-Anaheim CA 2016 2017 — 112 100.0% 32.34 Stater Bros, CVS
Twin Oaks ShoppingCenter Los Angeles-Long Beach-
Anaheim CA 40% 2005 1978 9,049 98 97.1% 21.49 Ralphs, Rite Aid
Valencia Crossroads Los Angeles-Long Beach-Anaheim CA 2002 2003 — 173 100.0% 28.18 Whole Foods, Kohl's
Village at La Floresta Los Angeles-Long Beach-Anaheim CA 2014 2014 — 87 100.0% 35.18 Whole Foods
Von's Circle Center Los Angeles-Long Beach-Anaheim CA 2017 1972 6,434 151 100.0% 22.20 Von's, Ross Dress for Less, Planet
Fitness
Woodman Van Nuys Los Angeles-Long Beach-Anaheim CA 1999 1992 — 108 100.0% 16.61 El Super
Silverado Plaza Napa CA 40% 2005 1974 9,177 85 99.0% 21.61 Nob Hill, CVSGelson's Westlake MarketPlaza Oxnard-Thousand Oaks-
Ventura CA 2002 2002 — 85 100.0% 29.74 Gelson's Markets, John of Italy Salon& Spa
Oakbrook Plaza Oxnard-Thousand Oaks-Ventura CA 1999 1982 — 83 99.0% 19.03 Gelson's Markets, (Longs Drug)
Westlake Village Plaza andCenter Oxnard-Thousand Oaks-
Ventura CA 1999 1975 — 201 95.1% 39.43 Von's, Sprouts, (CVS)
French Valley VillageCenter Rvrside-San Bernardino-
Ontario CA 2004 2004 — 99 98.6% 27.55 Stater Bros, CVS
Oak Shade Town Center Sacramento-Roseville-Folsom CA 2011 1998 6,301 104 99.3% 22.36 Safeway, Office Max, Rite AidPrairie City Crossing Sacramento-Roseville-Folsom CA 1999 1999 — 90 100.0% 21.30 SafewayRaley's Supermarket Sacramento-Roseville-Folsom CA 20% 2007 1964 — 63 100.0% 14.00 Raley'sThe Marketplace Sacramento-Roseville-Folsom CA 2017 1990 — 111 97.1% 26.51 Safeway,CVS, Petco
4S Commons Town Center San Diego-Chula Vista-Carlsbad CA 85% 2004 2004 84,191 245 100.0% 33.24
Ralphs, Jimbo's...Naturally!, Bed Bath& Beyond, Cost Plus World Market,
CVS, Ace Hardware, UltaBalboa Mesa ShoppingCenter San Diego-Chula Vista-
Carlsbad CA 2012 1969 — 207 100.0% 26.91 Von's, Kohl's, CVS
Costa Verde Center San Diego-Chula Vista-Carlsbad CA 1999 1988 — 179 84.3% 26.26 Bristol Farms, Bookstar, The Boxing
Club
El Norte Pkwy Plaza San Diego-Chula Vista-Carlsbad CA 1999 1984 — 91 96.0% 21.90 Von's, Children's Paradise, ACE
Hardware
Friars Mission Center San Diego-Chula Vista-Carlsbad CA 1999 1989 — 147 100.0% 36.46 Ralphs, CVS
Navajo Shopping Center San Diego-Chula Vista-Carlsbad CA 40% 2005 1964 7,491 102 99.1% 14.21 Albertsons, Rite Aid, O'Reilly Auto
Parts
Point Loma Plaza San Diego-Chula Vista-Carlsbad CA 40% 2005 1987 23,707 205 94.9% 21.29 Von's, Jo-Ann Fabrics, Marshalls,
UFC Gym
Rancho San Diego Village San Diego-Chula Vista-Carlsbad CA 40% 2005 1981 22,998 153 98.3% 23.16 Smart & Final, (Longs Drug), 24
Hour Fitness
25
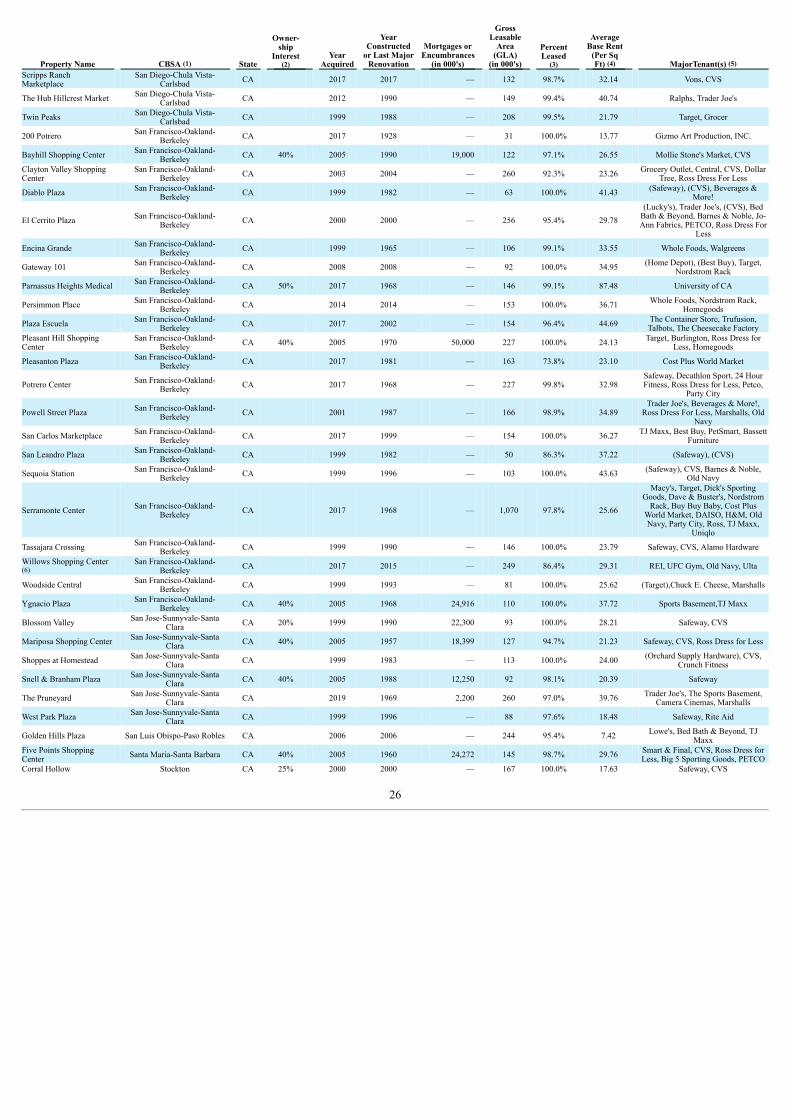
Property Name CBSA (1) State
Owner-ship
Interest(2)
YearAcquired
YearConstructed
or Last MajorRenovation
Mortgages orEncumbrances
(in 000's)
GrossLeasable
Area(GLA)
(in 000's)
PercentLeased
(3)
AverageBase Rent
(Per SqFt) (4) MajorTenant(s) (5)
Scripps RanchMarketplace San Diego-Chula Vista-
Carlsbad CA 2017 2017 — 132 98.7% 32.14 Vons, CVS
The Hub Hillcrest Market San Diego-Chula Vista-Carlsbad CA 2012 1990 — 149 99.4% 40.74 Ralphs, Trader Joe's
Twin Peaks San Diego-Chula Vista-Carlsbad CA 1999 1988 — 208 99.5% 21.79 Target, Grocer
200 Potrero San Francisco-Oakland-Berkeley CA 2017 1928 — 31 100.0% 13.77 Gizmo Art Production, INC.
Bayhill Shopping Center San Francisco-Oakland-Berkeley CA 40% 2005 1990 19,000 122 97.1% 26.55 Mollie Stone's Market, CVS
Clayton Valley ShoppingCenter San Francisco-Oakland-
Berkeley CA 2003 2004 — 260 92.3% 23.26 Grocery Outlet, Central, CVS, DollarTree, Ross Dress For Less
Diablo Plaza San Francisco-Oakland-Berkeley CA 1999 1982 — 63 100.0% 41.43 (Safeway), (CVS), Beverages &
More!
El Cerrito Plaza San Francisco-Oakland-Berkeley CA 2000 2000 — 256 95.4% 29.78
(Lucky's), Trader Joe's, (CVS), BedBath & Beyond, Barnes & Noble, Jo-Ann Fabrics, PETCO, Ross Dress For
Less
Encina Grande San Francisco-Oakland-Berkeley CA 1999 1965 — 106 99.1% 33.55 Whole Foods, Walgreens
Gateway 101 San Francisco-Oakland-Berkeley CA 2008 2008 — 92 100.0% 34.95 (Home Depot), (Best Buy), Target,
Nordstrom Rack
Parnassus Heights Medical San Francisco-Oakland-Berkeley CA 50% 2017 1968 — 146 99.1% 87.48 University of CA
Persimmon Place San Francisco-Oakland-Berkeley CA 2014 2014 — 153 100.0% 36.71 Whole Foods, Nordstrom Rack,
Homegoods
Plaza Escuela San Francisco-Oakland-Berkeley CA 2017 2002 — 154 96.4% 44.69 The Container Store, Trufusion,
Talbots, The Cheesecake FactoryPleasant Hill ShoppingCenter San Francisco-Oakland-
Berkeley CA 40% 2005 1970 50,000 227 100.0% 24.13 Target, Burlington, Ross Dress forLess, Homegoods
Pleasanton Plaza San Francisco-Oakland-Berkeley CA 2017 1981 — 163 73.8% 23.10 Cost Plus World Market
Potrero Center San Francisco-Oakland-Berkeley CA 2017 1968 — 227 99.8% 32.98
Safeway, Decathlon Sport, 24 HourFitness, Ross Dress for Less, Petco,
Party City
Powell Street Plaza San Francisco-Oakland-Berkeley CA 2001 1987 — 166 98.9% 34.89
Trader Joe's, Beverages & More!,Ross Dress For Less, Marshalls, Old
Navy
San Carlos Marketplace San Francisco-Oakland-Berkeley CA 2017 1999 — 154 100.0% 36.27 TJ Maxx, Best Buy, PetSmart, Bassett
Furniture
San Leandro Plaza San Francisco-Oakland-Berkeley CA 1999 1982 — 50 86.3% 37.22 (Safeway), (CVS)
Sequoia Station San Francisco-Oakland-Berkeley CA 1999 1996 — 103 100.0% 43.63 (Safeway), CVS, Barnes & Noble,
Old Navy
Serramonte Center San Francisco-Oakland-Berkeley CA 2017 1968 — 1,070 97.8% 25.66
Macy's, Target, Dick's SportingGoods, Dave & Buster's, Nordstrom
Rack, Buy Buy Baby, Cost PlusWorld Market, DAISO, H&M, OldNavy, Party City, Ross, TJ Maxx,
Uniqlo
Tassajara Crossing San Francisco-Oakland-Berkeley CA 1999 1990 — 146 100.0% 23.79 Safeway, CVS, Alamo Hardware
Willows Shopping Center(6) San Francisco-Oakland-
Berkeley CA 2017 2015 — 249 86.4% 29.31 REI, UFC Gym, Old Navy, Ulta
Woodside Central San Francisco-Oakland-Berkeley CA 1999 1993 — 81 100.0% 25.62 (Target),Chuck E. Cheese, Marshalls
Ygnacio Plaza San Francisco-Oakland-Berkeley CA 40% 2005 1968 24,916 110 100.0% 37.72 Sports Basement,TJ Maxx
Blossom Valley San Jose-Sunnyvale-SantaClara CA 20% 1999 1990 22,300 93 100.0% 28.21 Safeway, CVS
Mariposa Shopping Center San Jose-Sunnyvale-SantaClara CA 40% 2005 1957 18,399 127 94.7% 21.23 Safeway, CVS, Ross Dress for Less
Shoppes at Homestead San Jose-Sunnyvale-SantaClara CA 1999 1983 — 113 100.0% 24.00 (Orchard Supply Hardware), CVS,
Crunch Fitness
Snell & Branham Plaza San Jose-Sunnyvale-SantaClara CA 40% 2005 1988 12,250 92 98.1% 20.39 Safeway
The Pruneyard San Jose-Sunnyvale-SantaClara CA 2019 1969 2,200 260 97.0% 39.76 Trader Joe's, The Sports Basement,
Camera Cinemas, Marshalls
West Park Plaza San Jose-Sunnyvale-SantaClara CA 1999 1996 — 88 97.6% 18.48 Safeway, Rite Aid
Golden Hills Plaza San Luis Obispo-Paso Robles CA 2006 2006 — 244 95.4% 7.42 Lowe's, Bed Bath & Beyond, TJMaxx
Five Points ShoppingCenter Santa Maria-Santa Barbara CA 40% 2005 1960 24,272 145 98.7% 29.76 Smart & Final, CVS, Ross Dress for
Less, Big 5 Sporting Goods, PETCOCorral Hollow Stockton CA 25% 2000 2000 — 167 100.0% 17.63 Safeway, CVS
26
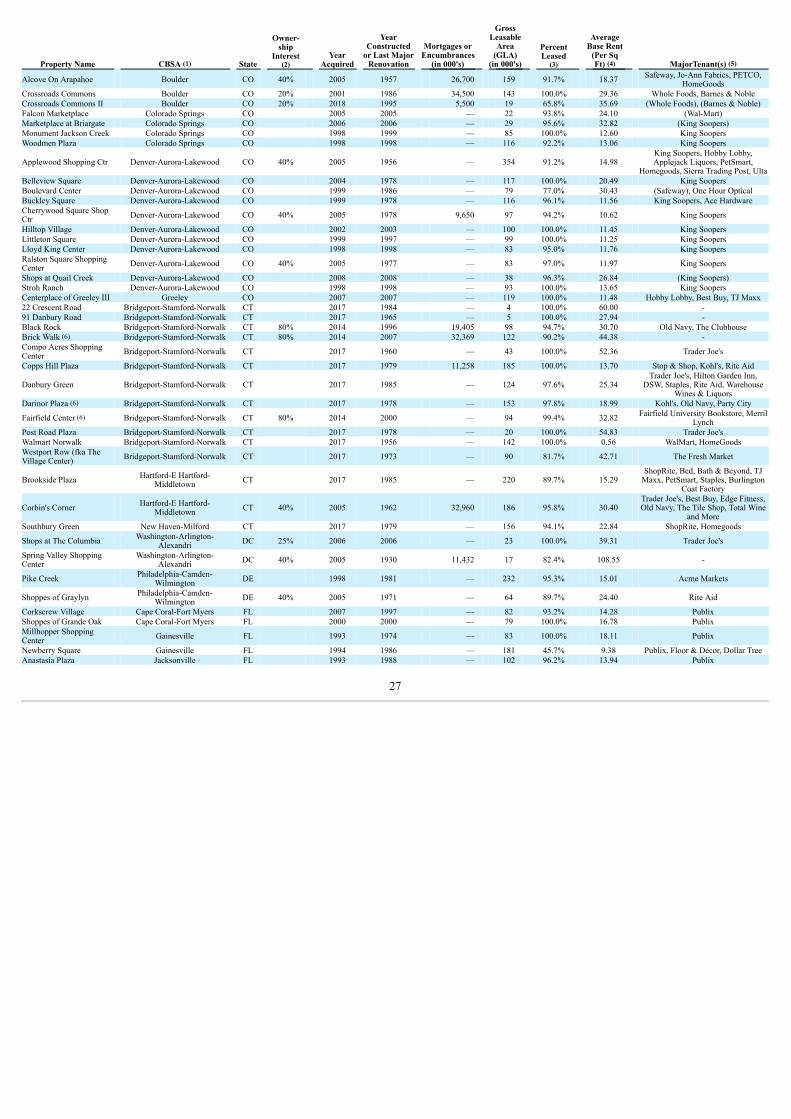
Property Name CBSA (1) State
Owner-ship
Interest(2)
YearAcquired
YearConstructed
or Last MajorRenovation
Mortgages orEncumbrances
(in 000's)
GrossLeasable
Area(GLA)
(in 000's)
PercentLeased
(3)
AverageBase Rent
(Per SqFt) (4) MajorTenant(s) (5)
Alcove On Arapahoe Boulder CO 40% 2005 1957 26,700 159 91.7% 18.37 Safeway, Jo-Ann Fabrics, PETCO,HomeGoods
Crossroads Commons Boulder CO 20% 2001 1986 34,500 143 100.0% 29.36 Whole Foods, Barnes & NobleCrossroads Commons II Boulder CO 20% 2018 1995 5,500 19 65.8% 35.69 (Whole Foods), (Barnes & Noble)Falcon Marketplace Colorado Springs CO 2005 2005 — 22 93.8% 24.10 (Wal-Mart)Marketplace at Briargate Colorado Springs CO 2006 2006 — 29 95.6% 32.82 (King Soopers)Monument Jackson Creek Colorado Springs CO 1998 1999 — 85 100.0% 12.60 King SoopersWoodmen Plaza Colorado Springs CO 1998 1998 — 116 92.2% 13.06 King Soopers
Applewood Shopping Ctr Denver-Aurora-Lakewood CO 40% 2005 1956 — 354 91.2% 14.98 King Soopers, Hobby Lobby,Applejack Liquors, PetSmart,
Homegoods, Sierra Trading Post, UltaBelleview Square Denver-Aurora-Lakewood CO 2004 1978 — 117 100.0% 20.49 King SoopersBoulevard Center Denver-Aurora-Lakewood CO 1999 1986 — 79 77.0% 30.43 (Safeway), One Hour OpticalBuckley Square Denver-Aurora-Lakewood CO 1999 1978 — 116 96.1% 11.56 King Soopers, Ace HardwareCherrywood Square ShopCtr Denver-Aurora-Lakewood CO 40% 2005 1978 9,650 97 94.2% 10.62 King Soopers
Hilltop Village Denver-Aurora-Lakewood CO 2002 2003 — 100 100.0% 11.45 King SoopersLittleton Square Denver-Aurora-Lakewood CO 1999 1997 — 99 100.0% 11.25 King SoopersLloyd King Center Denver-Aurora-Lakewood CO 1998 1998 — 83 95.0% 11.76 King SoopersRalston Square ShoppingCenter Denver-Aurora-Lakewood CO 40% 2005 1977 — 83 97.0% 11.97 King Soopers
Shops at Quail Creek Denver-Aurora-Lakewood CO 2008 2008 — 38 96.3% 26.84 (King Soopers)Stroh Ranch Denver-Aurora-Lakewood CO 1998 1998 — 93 100.0% 13.65 King SoopersCenterplace of Greeley III Greeley CO 2007 2007 — 119 100.0% 11.48 Hobby Lobby, Best Buy, TJ Maxx22 Crescent Road Bridgeport-Stamford-Norwalk CT 2017 1984 — 4 100.0% 60.00 -91 Danbury Road Bridgeport-Stamford-Norwalk CT 2017 1965 — 5 100.0% 27.94 -Black Rock Bridgeport-Stamford-Norwalk CT 80% 2014 1996 19,405 98 94.7% 30.70 Old Navy, The ClubhouseBrick Walk (6) Bridgeport-Stamford-Norwalk CT 80% 2014 2007 32,369 122 90.2% 44.38 -Compo Acres ShoppingCenter Bridgeport-Stamford-Norwalk CT 2017 1960 — 43 100.0% 52.36 Trader Joe's
Copps Hill Plaza Bridgeport-Stamford-Norwalk CT 2017 1979 11,258 185 100.0% 13.70 Stop & Shop, Kohl's, Rite Aid
Danbury Green Bridgeport-Stamford-Norwalk CT 2017 1985 — 124 97.6% 25.34 Trader Joe's, Hilton Garden Inn,
DSW, Staples, Rite Aid, WarehouseWines & Liquors
Darinor Plaza (6) Bridgeport-Stamford-Norwalk CT 2017 1978 — 153 97.8% 18.99 Kohl's, Old Navy, Party City
Fairfield Center (6) Bridgeport-Stamford-Norwalk CT 80% 2014 2000 — 94 99.4% 32.82 Fairfield University Bookstore, MerrilLynch
Post Road Plaza Bridgeport-Stamford-Norwalk CT 2017 1978 — 20 100.0% 54.83 Trader Joe'sWalmart Norwalk Bridgeport-Stamford-Norwalk CT 2017 1956 — 142 100.0% 0.56 WalMart, HomeGoodsWestport Row (fka TheVillage Center) Bridgeport-Stamford-Norwalk CT 2017 1973 — 90 81.7% 42.71 The Fresh Market
Brookside Plaza Hartford-E Hartford-Middletown CT 2017 1985 — 220 89.7% 15.29
ShopRite, Bed, Bath & Beyond, TJMaxx, PetSmart, Staples, Burlington
Coat Factory
Corbin's Corner Hartford-E Hartford-Middletown CT 40% 2005 1962 32,960 186 95.8% 30.40
Trader Joe's, Best Buy, Edge Fitness,Old Navy, The Tile Shop, Total Wine
and MoreSouthbury Green New Haven-Milford CT 2017 1979 — 156 94.1% 22.84 ShopRite, Homegoods
Shops at The Columbia Washington-Arlington-Alexandri DC 25% 2006 2006 — 23 100.0% 39.31 Trader Joe's
Spring Valley ShoppingCenter Washington-Arlington-
Alexandri DC 40% 2005 1930 11,432 17 82.4% 108.55 -
Pike Creek Philadelphia-Camden-Wilmington DE 1998 1981 — 232 95.3% 15.01 Acme Markets
Shoppes of Graylyn Philadelphia-Camden-Wilmington DE 40% 2005 1971 — 64 89.7% 24.40 Rite Aid
Corkscrew Village Cape Coral-Fort Myers FL 2007 1997 — 82 93.2% 14.28 PublixShoppes of Grande Oak Cape Coral-Fort Myers FL 2000 2000 — 79 100.0% 16.78 PublixMillhopper ShoppingCenter Gainesville FL 1993 1974 — 83 100.0% 18.11 Publix
Newberry Square Gainesville FL 1994 1986 — 181 45.7% 9.38 Publix, Floor & Décor, Dollar TreeAnastasia Plaza Jacksonville FL 1993 1988 — 102 96.2% 13.94 Publix
27
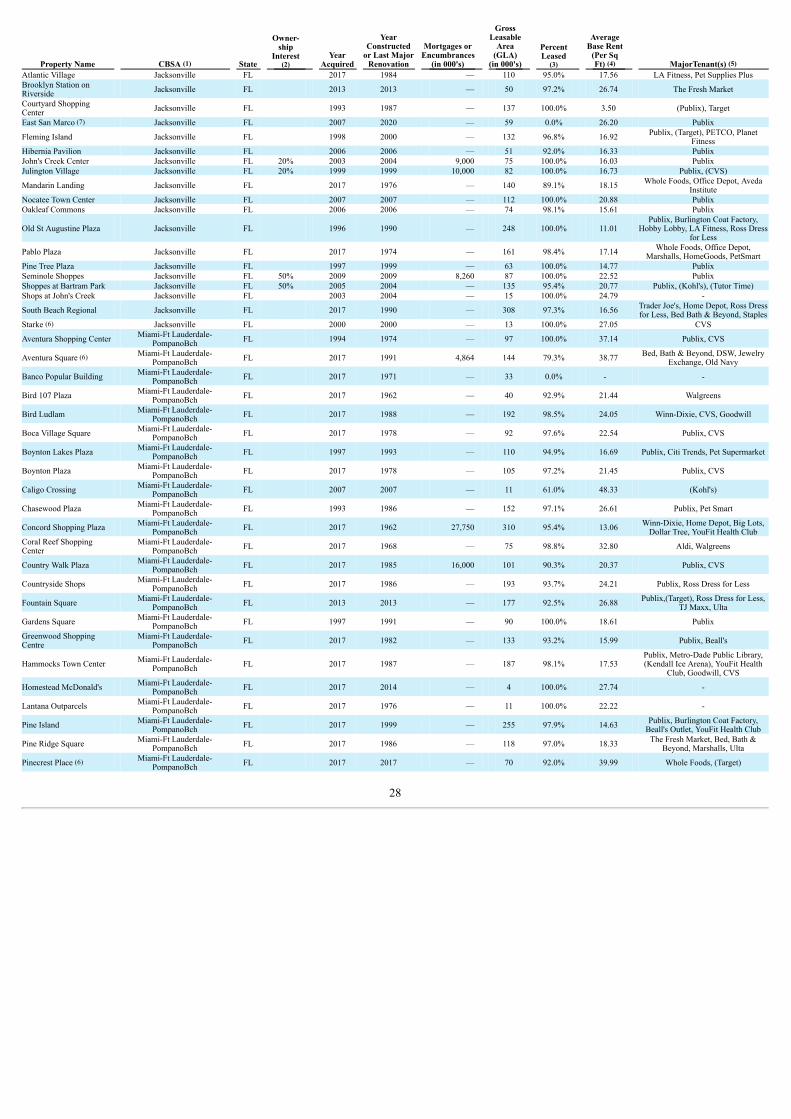
Property Name CBSA (1) State
Owner-ship
Interest(2)
YearAcquired
YearConstructed
or Last MajorRenovation
Mortgages orEncumbrances
(in 000's)
GrossLeasable
Area(GLA)
(in 000's)
PercentLeased
(3)
AverageBase Rent
(Per SqFt) (4) MajorTenant(s) (5)
Atlantic Village Jacksonville FL 2017 1984 — 110 95.0% 17.56 LA Fitness, Pet Supplies PlusBrooklyn Station onRiverside Jacksonville FL 2013 2013 — 50 97.2% 26.74 The Fresh Market
Courtyard ShoppingCenter Jacksonville FL 1993 1987 — 137 100.0% 3.50 (Publix), Target
East San Marco (7) Jacksonville FL 2007 2020 — 59 0.0% 26.20 Publix
Fleming Island Jacksonville FL 1998 2000 — 132 96.8% 16.92 Publix, (Target), PETCO, PlanetFitness
Hibernia Pavilion Jacksonville FL 2006 2006 — 51 92.0% 16.33 PublixJohn's Creek Center Jacksonville FL 20% 2003 2004 9,000 75 100.0% 16.03 PublixJulington Village Jacksonville FL 20% 1999 1999 10,000 82 100.0% 16.73 Publix, (CVS)
Mandarin Landing Jacksonville FL 2017 1976 — 140 89.1% 18.15 Whole Foods, Office Depot, AvedaInstitute
Nocatee Town Center Jacksonville FL 2007 2007 — 112 100.0% 20.88 PublixOakleaf Commons Jacksonville FL 2006 2006 — 74 98.1% 15.61 Publix
Old St Augustine Plaza Jacksonville FL 1996 1990 — 248 100.0% 11.01 Publix, Burlington Coat Factory,
Hobby Lobby, LA Fitness, Ross Dressfor Less
Pablo Plaza Jacksonville FL 2017 1974 — 161 98.4% 17.14 Whole Foods, Office Depot,Marshalls, HomeGoods, PetSmart
Pine Tree Plaza Jacksonville FL 1997 1999 — 63 100.0% 14.77 PublixSeminole Shoppes Jacksonville FL 50% 2009 2009 8,260 87 100.0% 22.52 PublixShoppes at Bartram Park Jacksonville FL 50% 2005 2004 — 135 95.4% 20.77 Publix, (Kohl's), (Tutor Time)Shops at John's Creek Jacksonville FL 2003 2004 — 15 100.0% 24.79 -
South Beach Regional Jacksonville FL 2017 1990 — 308 97.3% 16.56 Trader Joe's, Home Depot, Ross Dressfor Less, Bed Bath & Beyond, Staples
Starke (6) Jacksonville FL 2000 2000 — 13 100.0% 27.05 CVS
Aventura Shopping Center Miami-Ft Lauderdale-PompanoBch FL 1994 1974 — 97 100.0% 37.14 Publix, CVS
Aventura Square (6) Miami-Ft Lauderdale-PompanoBch FL 2017 1991 4,864 144 79.3% 38.77 Bed, Bath & Beyond, DSW, Jewelry
Exchange, Old Navy
Banco Popular Building Miami-Ft Lauderdale-PompanoBch FL 2017 1971 — 33 0.0% - -
Bird 107 Plaza Miami-Ft Lauderdale-PompanoBch FL 2017 1962 — 40 92.9% 21.44 Walgreens
Bird Ludlam Miami-Ft Lauderdale-PompanoBch FL 2017 1988 — 192 98.5% 24.05 Winn-Dixie, CVS, Goodwill
Boca Village Square Miami-Ft Lauderdale-PompanoBch FL 2017 1978 — 92 97.6% 22.54 Publix, CVS
Boynton Lakes Plaza Miami-Ft Lauderdale-PompanoBch FL 1997 1993 — 110 94.9% 16.69 Publix, Citi Trends, Pet Supermarket
Boynton Plaza Miami-Ft Lauderdale-PompanoBch FL 2017 1978 — 105 97.2% 21.45 Publix, CVS
Caligo Crossing Miami-Ft Lauderdale-PompanoBch FL 2007 2007 — 11 61.0% 48.33 (Kohl's)
Chasewood Plaza Miami-Ft Lauderdale-PompanoBch FL 1993 1986 — 152 97.1% 26.61 Publix, Pet Smart
Concord Shopping Plaza Miami-Ft Lauderdale-PompanoBch FL 2017 1962 27,750 310 95.4% 13.06 Winn-Dixie, Home Depot, Big Lots,
Dollar Tree, YouFit Health ClubCoral Reef ShoppingCenter Miami-Ft Lauderdale-
PompanoBch FL 2017 1968 — 75 98.8% 32.80 Aldi, Walgreens
Country Walk Plaza Miami-Ft Lauderdale-PompanoBch FL 2017 1985 16,000 101 90.3% 20.37 Publix, CVS
Countryside Shops Miami-Ft Lauderdale-PompanoBch FL 2017 1986 — 193 93.7% 24.21 Publix, Ross Dress for Less
Fountain Square Miami-Ft Lauderdale-PompanoBch FL 2013 2013 — 177 92.5% 26.88 Publix,(Target), Ross Dress for Less,
TJ Maxx, Ulta
Gardens Square Miami-Ft Lauderdale-PompanoBch FL 1997 1991 — 90 100.0% 18.61 Publix
Greenwood ShoppingCentre Miami-Ft Lauderdale-
PompanoBch FL 2017 1982 — 133 93.2% 15.99 Publix, Beall's
Hammocks Town Center Miami-Ft Lauderdale-PompanoBch FL 2017 1987 — 187 98.1% 17.53
Publix, Metro-Dade Public Library,(Kendall Ice Arena), YouFit Health
Club, Goodwill, CVS
Homestead McDonald's Miami-Ft Lauderdale-PompanoBch FL 2017 2014 — 4 100.0% 27.74 -
Lantana Outparcels Miami-Ft Lauderdale-PompanoBch FL 2017 1976 — 11 100.0% 22.22 -
Pine Island Miami-Ft Lauderdale-PompanoBch FL 2017 1999 — 255 97.9% 14.63 Publix, Burlington Coat Factory,
Beall's Outlet, YouFit Health Club
Pine Ridge Square Miami-Ft Lauderdale-PompanoBch FL 2017 1986 — 118 97.0% 18.33 The Fresh Market, Bed, Bath &
Beyond, Marshalls, Ulta
Pinecrest Place (6) Miami-Ft Lauderdale-PompanoBch FL 2017 2017 — 70 92.0% 39.99 Whole Foods, (Target)
28
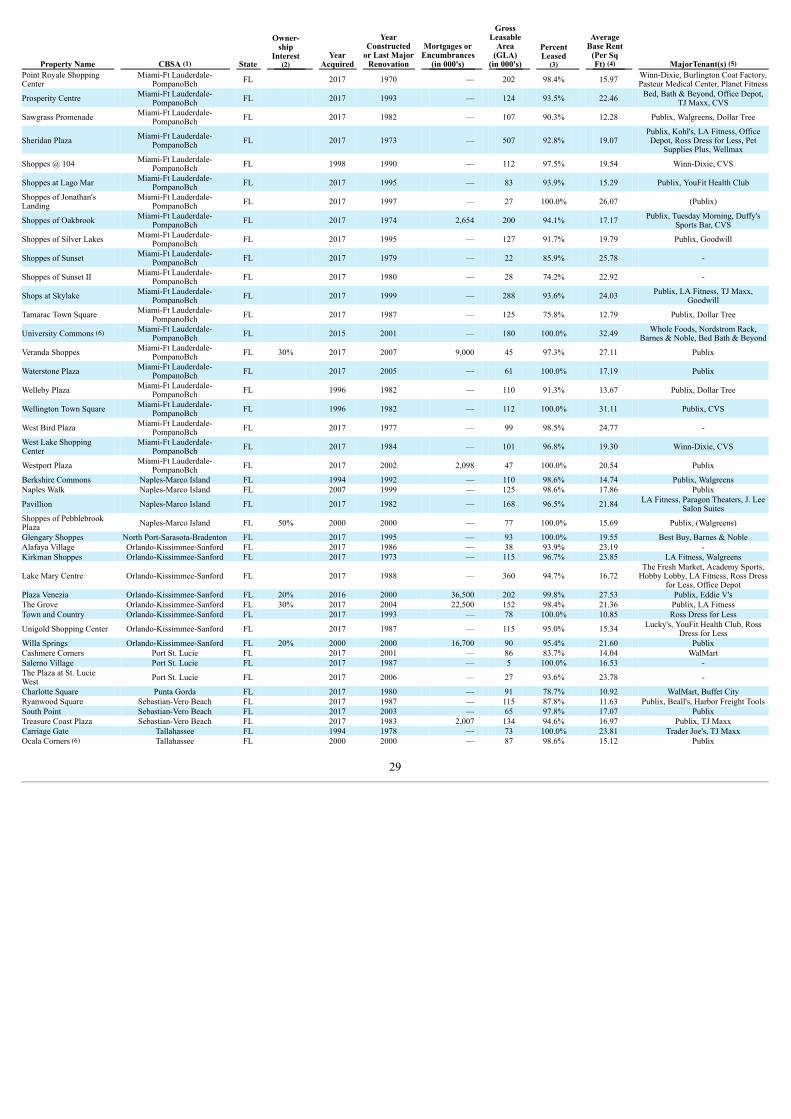
Property Name CBSA (1) State
Owner-ship
Interest(2)
YearAcquired
YearConstructed
or Last MajorRenovation
Mortgages orEncumbrances
(in 000's)
GrossLeasable
Area(GLA)
(in 000's)
PercentLeased
(3)
AverageBase Rent
(Per SqFt) (4) MajorTenant(s) (5)
Point Royale ShoppingCenter Miami-Ft Lauderdale-
PompanoBch FL 2017 1970 — 202 98.4% 15.97 Winn-Dixie, Burlington Coat Factory,Pasteur Medical Center, Planet Fitness
Prosperity Centre Miami-Ft Lauderdale-PompanoBch FL 2017 1993 — 124 93.5% 22.46 Bed, Bath & Beyond, Office Depot,
TJ Maxx, CVS
Sawgrass Promenade Miami-Ft Lauderdale-PompanoBch FL 2017 1982 — 107 90.3% 12.28 Publix, Walgreens, Dollar Tree
Sheridan Plaza Miami-Ft Lauderdale-PompanoBch FL 2017 1973 — 507 92.8% 19.07
Publix, Kohl's, LA Fitness, OfficeDepot, Ross Dress for Less, Pet
Supplies Plus, Wellmax
Shoppes @ 104 Miami-Ft Lauderdale-PompanoBch FL 1998 1990 — 112 97.5% 19.54 Winn-Dixie, CVS
Shoppes at Lago Mar Miami-Ft Lauderdale-PompanoBch FL 2017 1995 — 83 93.9% 15.29 Publix, YouFit Health Club
Shoppes of Jonathan'sLanding Miami-Ft Lauderdale-
PompanoBch FL 2017 1997 — 27 100.0% 26.07 (Publix)
Shoppes of Oakbrook Miami-Ft Lauderdale-PompanoBch FL 2017 1974 2,654 200 94.1% 17.17 Publix, Tuesday Morning, Duffy's
Sports Bar, CVS
Shoppes of Silver Lakes Miami-Ft Lauderdale-PompanoBch FL 2017 1995 — 127 91.7% 19.79 Publix, Goodwill
Shoppes of Sunset Miami-Ft Lauderdale-PompanoBch FL 2017 1979 — 22 85.9% 25.78 -
Shoppes of Sunset II Miami-Ft Lauderdale-PompanoBch FL 2017 1980 — 28 74.2% 22.92 -
Shops at Skylake Miami-Ft Lauderdale-PompanoBch FL 2017 1999 — 288 93.6% 24.03 Publix, LA Fitness, TJ Maxx,
Goodwill
Tamarac Town Square Miami-Ft Lauderdale-PompanoBch FL 2017 1987 — 125 75.8% 12.79 Publix, Dollar Tree
University Commons (6) Miami-Ft Lauderdale-PompanoBch FL 2015 2001 — 180 100.0% 32.49 Whole Foods, Nordstrom Rack,
Barnes & Noble, Bed Bath & Beyond
Veranda Shoppes Miami-Ft Lauderdale-PompanoBch FL 30% 2017 2007 9,000 45 97.3% 27.11 Publix
Waterstone Plaza Miami-Ft Lauderdale-PompanoBch FL 2017 2005 — 61 100.0% 17.19 Publix
Welleby Plaza Miami-Ft Lauderdale-PompanoBch FL 1996 1982 — 110 91.3% 13.67 Publix, Dollar Tree
Wellington Town Square Miami-Ft Lauderdale-PompanoBch FL 1996 1982 — 112 100.0% 31.11 Publix, CVS
West Bird Plaza Miami-Ft Lauderdale-PompanoBch FL 2017 1977 — 99 98.5% 24.77 -
West Lake ShoppingCenter Miami-Ft Lauderdale-
PompanoBch FL 2017 1984 — 101 96.8% 19.30 Winn-Dixie, CVS
Westport Plaza Miami-Ft Lauderdale-PompanoBch FL 2017 2002 2,098 47 100.0% 20.54 Publix
Berkshire Commons Naples-Marco Island FL 1994 1992 — 110 98.6% 14.74 Publix, WalgreensNaples Walk Naples-Marco Island FL 2007 1999 — 125 98.6% 17.86 Publix
Pavillion Naples-Marco Island FL 2017 1982 — 168 96.5% 21.84 LA Fitness, Paragon Theaters, J. LeeSalon Suites
Shoppes of PebblebrookPlaza Naples-Marco Island FL 50% 2000 2000 — 77 100.0% 15.69 Publix, (Walgreens)
Glengary Shoppes North Port-Sarasota-Bradenton FL 2017 1995 — 93 100.0% 19.55 Best Buy, Barnes & NobleAlafaya Village Orlando-Kissimmee-Sanford FL 2017 1986 — 38 93.9% 23.19 -Kirkman Shoppes Orlando-Kissimmee-Sanford FL 2017 1973 — 115 96.7% 23.85 LA Fitness, Walgreens
Lake Mary Centre Orlando-Kissimmee-Sanford FL 2017 1988 — 360 94.7% 16.72 The Fresh Market, Academy Sports,
Hobby Lobby, LA Fitness, Ross Dressfor Less, Office Depot
Plaza Venezia Orlando-Kissimmee-Sanford FL 20% 2016 2000 36,500 202 99.8% 27.53 Publix, Eddie V'sThe Grove Orlando-Kissimmee-Sanford FL 30% 2017 2004 22,500 152 98.4% 21.36 Publix, LA FitnessTown and Country Orlando-Kissimmee-Sanford FL 2017 1993 — 78 100.0% 10.85 Ross Dress for Less
Unigold Shopping Center Orlando-Kissimmee-Sanford FL 2017 1987 — 115 95.0% 15.34 Lucky's, YouFit Health Club, RossDress for Less
Willa Springs Orlando-Kissimmee-Sanford FL 20% 2000 2000 16,700 90 95.4% 21.60 PublixCashmere Corners Port St. Lucie FL 2017 2001 — 86 83.7% 14.04 WalMartSalerno Village Port St. Lucie FL 2017 1987 — 5 100.0% 16.53 -The Plaza at St. LucieWest Port St. Lucie FL 2017 2006 — 27 93.6% 23.78 -
Charlotte Square Punta Gorda FL 2017 1980 — 91 78.7% 10.92 WalMart, Buffet CityRyanwood Square Sebastian-Vero Beach FL 2017 1987 — 115 87.8% 11.63 Publix, Beall's, Harbor Freight ToolsSouth Point Sebastian-Vero Beach FL 2017 2003 — 65 97.8% 17.07 PublixTreasure Coast Plaza Sebastian-Vero Beach FL 2017 1983 2,007 134 94.6% 16.97 Publix, TJ MaxxCarriage Gate Tallahassee FL 1994 1978 — 73 100.0% 23.81 Trader Joe's, TJ MaxxOcala Corners (6) Tallahassee FL 2000 2000 — 87 98.6% 15.12 Publix
29
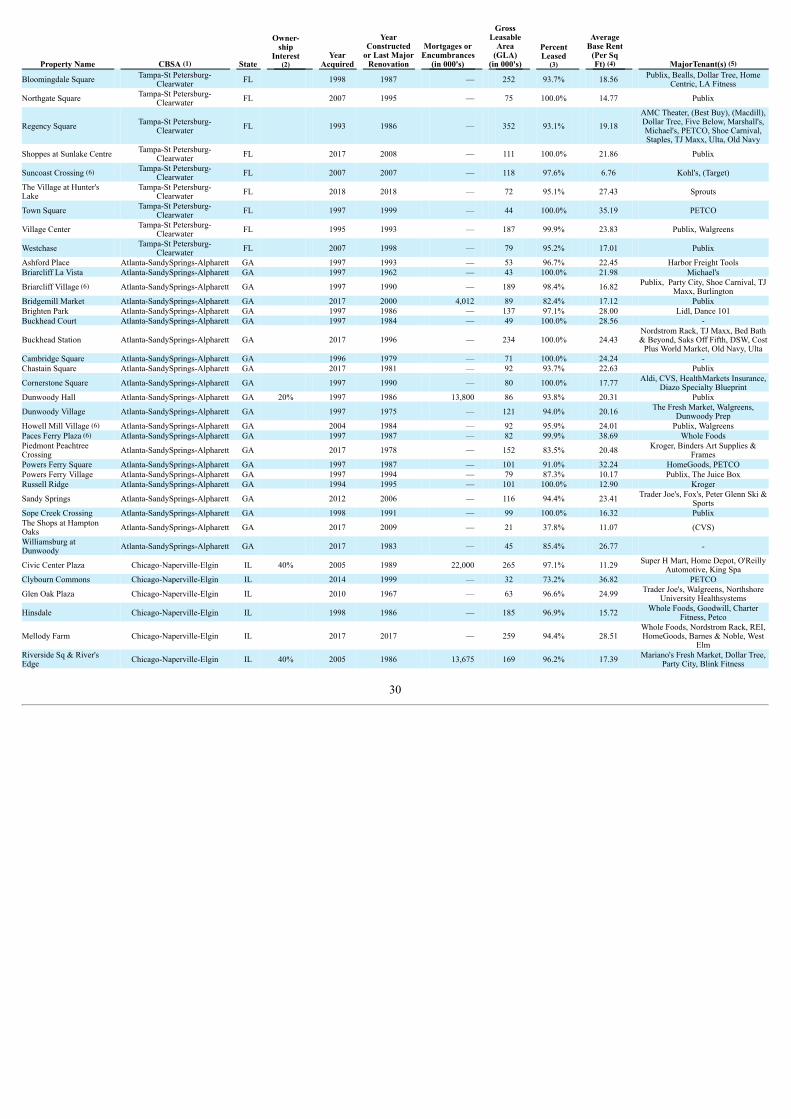
Property Name CBSA (1) State
Owner-ship
Interest(2)
YearAcquired
YearConstructed
or Last MajorRenovation
Mortgages orEncumbrances
(in 000's)
GrossLeasable
Area(GLA)
(in 000's)
PercentLeased
(3)
AverageBase Rent
(Per SqFt) (4) MajorTenant(s) (5)
Bloomingdale Square Tampa-St Petersburg-Clearwater FL 1998 1987 — 252 93.7% 18.56 Publix, Bealls, Dollar Tree, Home
Centric, LA Fitness
Northgate Square Tampa-St Petersburg-Clearwater FL 2007 1995 — 75 100.0% 14.77 Publix
Regency Square Tampa-St Petersburg-Clearwater FL 1993 1986 — 352 93.1% 19.18
AMC Theater, (Best Buy), (Macdill),Dollar Tree, Five Below, Marshall's,Michael's, PETCO, Shoe Carnival,Staples, TJ Maxx, Ulta, Old Navy
Shoppes at Sunlake Centre Tampa-St Petersburg-Clearwater FL 2017 2008 — 111 100.0% 21.86 Publix
Suncoast Crossing (6) Tampa-St Petersburg-Clearwater FL 2007 2007 — 118 97.6% 6.76 Kohl's, (Target)
The Village at Hunter'sLake Tampa-St Petersburg-
Clearwater FL 2018 2018 — 72 95.1% 27.43 Sprouts
Town Square Tampa-St Petersburg-Clearwater FL 1997 1999 — 44 100.0% 35.19 PETCO
Village Center Tampa-St Petersburg-Clearwater FL 1995 1993 — 187 99.9% 23.83 Publix, Walgreens
Westchase Tampa-St Petersburg-Clearwater FL 2007 1998 — 79 95.2% 17.01 Publix
Ashford Place Atlanta-SandySprings-Alpharett GA 1997 1993 — 53 96.7% 22.45 Harbor Freight ToolsBriarcliff La Vista Atlanta-SandySprings-Alpharett GA 1997 1962 — 43 100.0% 21.98 Michael's
Briarcliff Village (6) Atlanta-SandySprings-Alpharett GA 1997 1990 — 189 98.4% 16.82 Publix, Party City, Shoe Carnival, TJMaxx, Burlington
Bridgemill Market Atlanta-SandySprings-Alpharett GA 2017 2000 4,012 89 82.4% 17.12 PublixBrighten Park Atlanta-SandySprings-Alpharett GA 1997 1986 — 137 97.1% 28.00 Lidl, Dance 101Buckhead Court Atlanta-SandySprings-Alpharett GA 1997 1984 — 49 100.0% 28.56 -
Buckhead Station Atlanta-SandySprings-Alpharett GA 2017 1996 — 234 100.0% 24.43 Nordstrom Rack, TJ Maxx, Bed Bath& Beyond, Saks Off Fifth, DSW, Cost
Plus World Market, Old Navy, UltaCambridge Square Atlanta-SandySprings-Alpharett GA 1996 1979 — 71 100.0% 24.24 -Chastain Square Atlanta-SandySprings-Alpharett GA 2017 1981 — 92 93.7% 22.63 Publix
Cornerstone Square Atlanta-SandySprings-Alpharett GA 1997 1990 — 80 100.0% 17.77 Aldi, CVS, HealthMarkets Insurance,Diazo Specialty Blueprint
Dunwoody Hall Atlanta-SandySprings-Alpharett GA 20% 1997 1986 13,800 86 93.8% 20.31 Publix
Dunwoody Village Atlanta-SandySprings-Alpharett GA 1997 1975 — 121 94.0% 20.16 The Fresh Market, Walgreens,Dunwoody Prep
Howell Mill Village (6) Atlanta-SandySprings-Alpharett GA 2004 1984 — 92 95.9% 24.01 Publix, WalgreensPaces Ferry Plaza (6) Atlanta-SandySprings-Alpharett GA 1997 1987 — 82 99.9% 38.69 Whole FoodsPiedmont PeachtreeCrossing Atlanta-SandySprings-Alpharett GA 2017 1978 — 152 83.5% 20.48 Kroger, Binders Art Supplies &
FramesPowers Ferry Square Atlanta-SandySprings-Alpharett GA 1997 1987 — 101 91.0% 32.24 HomeGoods, PETCOPowers Ferry Village Atlanta-SandySprings-Alpharett GA 1997 1994 — 79 87.3% 10.17 Publix, The Juice BoxRussell Ridge Atlanta-SandySprings-Alpharett GA 1994 1995 — 101 100.0% 12.90 Kroger
Sandy Springs Atlanta-SandySprings-Alpharett GA 2012 2006 — 116 94.4% 23.41 Trader Joe's, Fox's, Peter Glenn Ski &Sports
Sope Creek Crossing Atlanta-SandySprings-Alpharett GA 1998 1991 — 99 100.0% 16.32 PublixThe Shops at HamptonOaks Atlanta-SandySprings-Alpharett GA 2017 2009 — 21 37.8% 11.07 (CVS)
Williamsburg atDunwoody Atlanta-SandySprings-Alpharett GA 2017 1983 — 45 85.4% 26.77 -
Civic Center Plaza Chicago-Naperville-Elgin IL 40% 2005 1989 22,000 265 97.1% 11.29 Super H Mart, Home Depot, O'ReillyAutomotive, King Spa
Clybourn Commons Chicago-Naperville-Elgin IL 2014 1999 — 32 73.2% 36.82 PETCO
Glen Oak Plaza Chicago-Naperville-Elgin IL 2010 1967 — 63 96.6% 24.99 Trader Joe's, Walgreens, NorthshoreUniversity Healthsystems
Hinsdale Chicago-Naperville-Elgin IL 1998 1986 — 185 96.9% 15.72 Whole Foods, Goodwill, CharterFitness, Petco
Mellody Farm Chicago-Naperville-Elgin IL 2017 2017 — 259 94.4% 28.51 Whole Foods, Nordstrom Rack, REI,HomeGoods, Barnes & Noble, West
ElmRiverside Sq & River'sEdge Chicago-Naperville-Elgin IL 40% 2005 1986 13,675 169 96.2% 17.39 Mariano's Fresh Market, Dollar Tree,
Party City, Blink Fitness
30
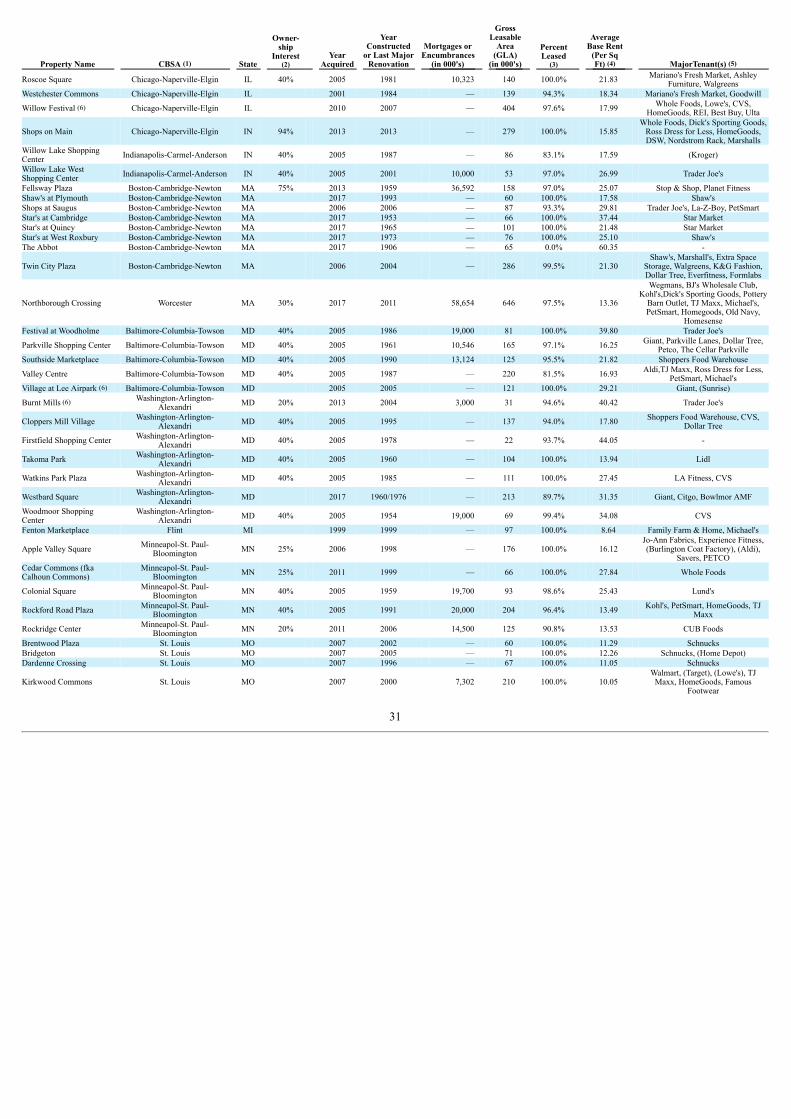
Property Name CBSA (1) State
Owner-ship
Interest(2)
YearAcquired
YearConstructed
or Last MajorRenovation
Mortgages orEncumbrances
(in 000's)
GrossLeasable
Area(GLA)
(in 000's)
PercentLeased
(3)
AverageBase Rent
(Per SqFt) (4) MajorTenant(s) (5)
Roscoe Square Chicago-Naperville-Elgin IL 40% 2005 1981 10,323 140 100.0% 21.83 Mariano's Fresh Market, AshleyFurniture, Walgreens
Westchester Commons Chicago-Naperville-Elgin IL 2001 1984 — 139 94.3% 18.34 Mariano's Fresh Market, Goodwill
Willow Festival (6) Chicago-Naperville-Elgin IL 2010 2007 — 404 97.6% 17.99 Whole Foods, Lowe's, CVS,HomeGoods, REI, Best Buy, Ulta
Shops on Main Chicago-Naperville-Elgin IN 94% 2013 2013 — 279 100.0% 15.85 Whole Foods, Dick's Sporting Goods,
Ross Dress for Less, HomeGoods,DSW, Nordstrom Rack, Marshalls
Willow Lake ShoppingCenter Indianapolis-Carmel-Anderson IN 40% 2005 1987 — 86 83.1% 17.59 (Kroger)
Willow Lake WestShopping Center Indianapolis-Carmel-Anderson IN 40% 2005 2001 10,000 53 97.0% 26.99 Trader Joe's
Fellsway Plaza Boston-Cambridge-Newton MA 75% 2013 1959 36,592 158 97.0% 25.07 Stop & Shop, Planet FitnessShaw's at Plymouth Boston-Cambridge-Newton MA 2017 1993 — 60 100.0% 17.58 Shaw'sShops at Saugus Boston-Cambridge-Newton MA 2006 2006 — 87 93.3% 29.81 Trader Joe's, La-Z-Boy, PetSmartStar's at Cambridge Boston-Cambridge-Newton MA 2017 1953 — 66 100.0% 37.44 Star MarketStar's at Quincy Boston-Cambridge-Newton MA 2017 1965 — 101 100.0% 21.48 Star MarketStar's at West Roxbury Boston-Cambridge-Newton MA 2017 1973 — 76 100.0% 25.10 Shaw'sThe Abbot Boston-Cambridge-Newton MA 2017 1906 — 65 0.0% 60.35 -
Twin City Plaza Boston-Cambridge-Newton MA 2006 2004 — 286 99.5% 21.30 Shaw's, Marshall's, Extra Space
Storage, Walgreens, K&G Fashion,Dollar Tree, Everfitness, Formlabs
Northborough Crossing Worcester MA 30% 2017 2011 58,654 646 97.5% 13.36
Wegmans, BJ's Wholesale Club,Kohl's,Dick's Sporting Goods, Pottery
Barn Outlet, TJ Maxx, Michael's,PetSmart, Homegoods, Old Navy,
HomesenseFestival at Woodholme Baltimore-Columbia-Towson MD 40% 2005 1986 19,000 81 100.0% 39.80 Trader Joe's
Parkville Shopping Center Baltimore-Columbia-Towson MD 40% 2005 1961 10,546 165 97.1% 16.25 Giant, Parkville Lanes, Dollar Tree,Petco, The Cellar Parkville
Southside Marketplace Baltimore-Columbia-Towson MD 40% 2005 1990 13,124 125 95.5% 21.82 Shoppers Food Warehouse
Valley Centre Baltimore-Columbia-Towson MD 40% 2005 1987 — 220 81.5% 16.93 Aldi,TJ Maxx, Ross Dress for Less,PetSmart, Michael's
Village at Lee Airpark (6) Baltimore-Columbia-Towson MD 2005 2005 — 121 100.0% 29.21 Giant, (Sunrise)
Burnt Mills (6) Washington-Arlington-Alexandri MD 20% 2013 2004 3,000 31 94.6% 40.42 Trader Joe's
Cloppers Mill Village Washington-Arlington-Alexandri MD 40% 2005 1995 — 137 94.0% 17.80 Shoppers Food Warehouse, CVS,
Dollar Tree
Firstfield Shopping Center Washington-Arlington-Alexandri MD 40% 2005 1978 — 22 93.7% 44.05 -
Takoma Park Washington-Arlington-Alexandri MD 40% 2005 1960 — 104 100.0% 13.94 Lidl
Watkins Park Plaza Washington-Arlington-Alexandri MD 40% 2005 1985 — 111 100.0% 27.45 LA Fitness, CVS
Westbard Square Washington-Arlington-Alexandri MD 2017 1960/1976 — 213 89.7% 31.35 Giant, Citgo, Bowlmor AMF
Woodmoor ShoppingCenter Washington-Arlington-
Alexandri MD 40% 2005 1954 19,000 69 99.4% 34.08 CVS
Fenton Marketplace Flint MI 1999 1999 — 97 100.0% 8.64 Family Farm & Home, Michael's
Apple Valley Square Minneapol-St. Paul-Bloomington MN 25% 2006 1998 — 176 100.0% 16.12
Jo-Ann Fabrics, Experience Fitness,(Burlington Coat Factory), (Aldi),
Savers, PETCOCedar Commons (fkaCalhoun Commons) Minneapol-St. Paul-
Bloomington MN 25% 2011 1999 — 66 100.0% 27.84 Whole Foods
Colonial Square Minneapol-St. Paul-Bloomington MN 40% 2005 1959 19,700 93 98.6% 25.43 Lund's
Rockford Road Plaza Minneapol-St. Paul-Bloomington MN 40% 2005 1991 20,000 204 96.4% 13.49 Kohl's, PetSmart, HomeGoods, TJ
Maxx
Rockridge Center Minneapol-St. Paul-Bloomington MN 20% 2011 2006 14,500 125 90.8% 13.53 CUB Foods
Brentwood Plaza St. Louis MO 2007 2002 — 60 100.0% 11.29 SchnucksBridgeton St. Louis MO 2007 2005 — 71 100.0% 12.26 Schnucks, (Home Depot)Dardenne Crossing St. Louis MO 2007 1996 — 67 100.0% 11.05 Schnucks
Kirkwood Commons St. Louis MO 2007 2000 7,302 210 100.0% 10.05 Walmart, (Target), (Lowe's), TJ
Maxx, HomeGoods, FamousFootwear
31
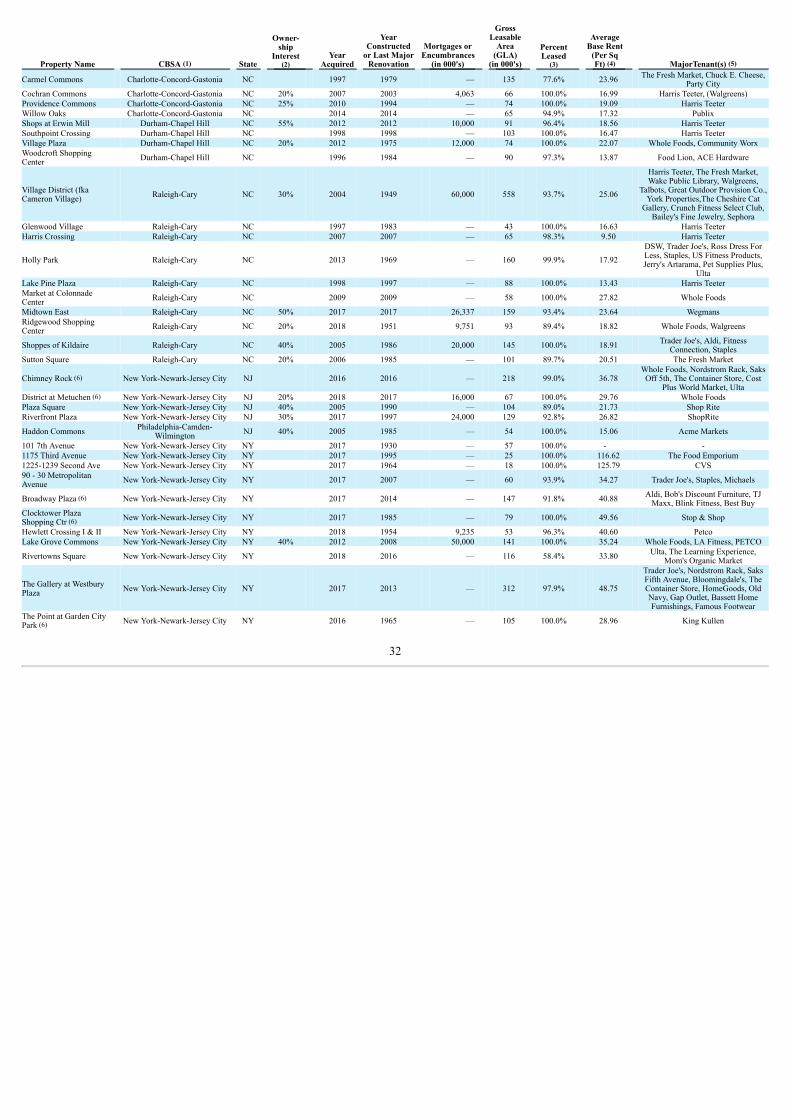
Property Name CBSA (1) State
Owner-ship
Interest(2)
YearAcquired
YearConstructed
or Last MajorRenovation
Mortgages orEncumbrances
(in 000's)
GrossLeasable
Area(GLA)
(in 000's)
PercentLeased
(3)
AverageBase Rent
(Per SqFt) (4) MajorTenant(s) (5)
Carmel Commons Charlotte-Concord-Gastonia NC 1997 1979 — 135 77.6% 23.96 The Fresh Market, Chuck E. Cheese,Party City
Cochran Commons Charlotte-Concord-Gastonia NC 20% 2007 2003 4,063 66 100.0% 16.99 Harris Teeter, (Walgreens)Providence Commons Charlotte-Concord-Gastonia NC 25% 2010 1994 — 74 100.0% 19.09 Harris TeeterWillow Oaks Charlotte-Concord-Gastonia NC 2014 2014 — 65 94.9% 17.32 PublixShops at Erwin Mill Durham-Chapel Hill NC 55% 2012 2012 10,000 91 96.4% 18.56 Harris TeeterSouthpoint Crossing Durham-Chapel Hill NC 1998 1998 — 103 100.0% 16.47 Harris TeeterVillage Plaza Durham-Chapel Hill NC 20% 2012 1975 12,000 74 100.0% 22.07 Whole Foods, Community WorxWoodcroft ShoppingCenter Durham-Chapel Hill NC 1996 1984 — 90 97.3% 13.87 Food Lion, ACE Hardware
Village District (fkaCameron Village) Raleigh-Cary NC 30% 2004 1949 60,000 558 93.7% 25.06
Harris Teeter, The Fresh Market,Wake Public Library, Walgreens,
Talbots, Great Outdoor Provision Co.,York Properties,The Cheshire Cat
Gallery, Crunch Fitness Select Club,Bailey's Fine Jewelry, Sephora
Glenwood Village Raleigh-Cary NC 1997 1983 — 43 100.0% 16.63 Harris TeeterHarris Crossing Raleigh-Cary NC 2007 2007 — 65 98.3% 9.50 Harris Teeter
Holly Park Raleigh-Cary NC 2013 1969 — 160 99.9% 17.92 DSW, Trader Joe's, Ross Dress ForLess, Staples, US Fitness Products,Jerry's Artarama, Pet Supplies Plus,
UltaLake Pine Plaza Raleigh-Cary NC 1998 1997 — 88 100.0% 13.43 Harris TeeterMarket at ColonnadeCenter Raleigh-Cary NC 2009 2009 — 58 100.0% 27.82 Whole Foods
Midtown East Raleigh-Cary NC 50% 2017 2017 26,337 159 93.4% 23.64 WegmansRidgewood ShoppingCenter Raleigh-Cary NC 20% 2018 1951 9,751 93 89.4% 18.82 Whole Foods, Walgreens
Shoppes of Kildaire Raleigh-Cary NC 40% 2005 1986 20,000 145 100.0% 18.91 Trader Joe's, Aldi, FitnessConnection, Staples
Sutton Square Raleigh-Cary NC 20% 2006 1985 — 101 89.7% 20.51 The Fresh Market
Chimney Rock (6) New York-Newark-Jersey City NJ 2016 2016 — 218 99.0% 36.78 Whole Foods, Nordstrom Rack, Saks
Off 5th, The Container Store, CostPlus World Market, Ulta
District at Metuchen (6) New York-Newark-Jersey City NJ 20% 2018 2017 16,000 67 100.0% 29.76 Whole FoodsPlaza Square New York-Newark-Jersey City NJ 40% 2005 1990 — 104 89.0% 21.73 Shop RiteRiverfront Plaza New York-Newark-Jersey City NJ 30% 2017 1997 24,000 129 92.8% 26.82 ShopRite
Haddon Commons Philadelphia-Camden-Wilmington NJ 40% 2005 1985 — 54 100.0% 15.06 Acme Markets
101 7th Avenue New York-Newark-Jersey City NY 2017 1930 — 57 100.0% - -1175 Third Avenue New York-Newark-Jersey City NY 2017 1995 — 25 100.0% 116.62 The Food Emporium1225-1239 Second Ave New York-Newark-Jersey City NY 2017 1964 — 18 100.0% 125.79 CVS90 - 30 MetropolitanAvenue New York-Newark-Jersey City NY 2017 2007 — 60 93.9% 34.27 Trader Joe's, Staples, Michaels
Broadway Plaza (6) New York-Newark-Jersey City NY 2017 2014 — 147 91.8% 40.88 Aldi, Bob's Discount Furniture, TJMaxx, Blink Fitness, Best Buy
Clocktower PlazaShopping Ctr (6) New York-Newark-Jersey City NY 2017 1985 — 79 100.0% 49.56 Stop & Shop
Hewlett Crossing I & II New York-Newark-Jersey City NY 2018 1954 9,235 53 96.3% 40.60 PetcoLake Grove Commons New York-Newark-Jersey City NY 40% 2012 2008 50,000 141 100.0% 35.24 Whole Foods, LA Fitness, PETCO
Rivertowns Square New York-Newark-Jersey City NY 2018 2016 — 116 58.4% 33.80 Ulta, The Learning Experience,Mom's Organic Market
The Gallery at WestburyPlaza New York-Newark-Jersey City NY 2017 2013 — 312 97.9% 48.75
Trader Joe's, Nordstrom Rack, SaksFifth Avenue, Bloomingdale's, TheContainer Store, HomeGoods, OldNavy, Gap Outlet, Bassett HomeFurnishings, Famous Footwear
The Point at Garden CityPark (6) New York-Newark-Jersey City NY 2016 1965 — 105 100.0% 28.96 King Kullen
32
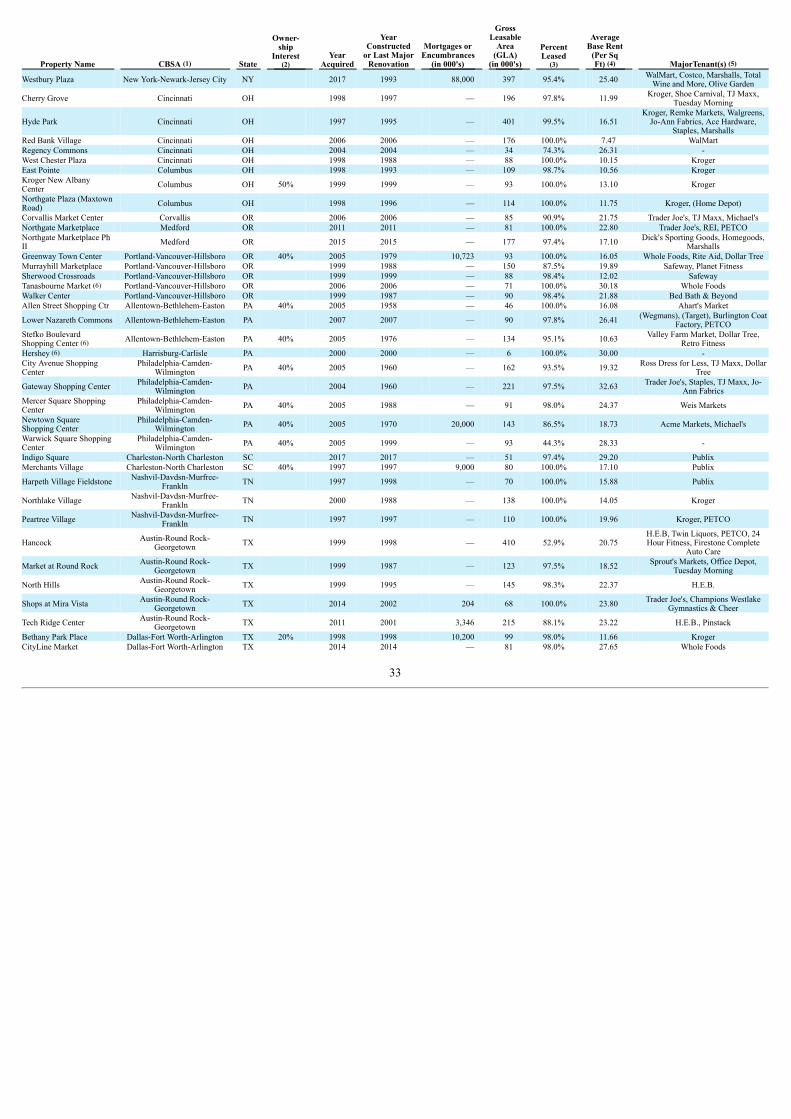
Property Name CBSA (1) State
Owner-ship
Interest(2)
YearAcquired
YearConstructed
or Last MajorRenovation
Mortgages orEncumbrances
(in 000's)
GrossLeasable
Area(GLA)
(in 000's)
PercentLeased
(3)
AverageBase Rent
(Per SqFt) (4) MajorTenant(s) (5)
Westbury Plaza New York-Newark-Jersey City NY 2017 1993 88,000 397 95.4% 25.40 WalMart, Costco, Marshalls, TotalWine and More, Olive Garden
Cherry Grove Cincinnati OH 1998 1997 — 196 97.8% 11.99 Kroger, Shoe Carnival, TJ Maxx,Tuesday Morning
Hyde Park Cincinnati OH 1997 1995 — 401 99.5% 16.51 Kroger, Remke Markets, Walgreens,
Jo-Ann Fabrics, Ace Hardware,Staples, Marshalls
Red Bank Village Cincinnati OH 2006 2006 — 176 100.0% 7.47 WalMartRegency Commons Cincinnati OH 2004 2004 — 34 74.3% 26.31 -West Chester Plaza Cincinnati OH 1998 1988 — 88 100.0% 10.15 KrogerEast Pointe Columbus OH 1998 1993 — 109 98.7% 10.56 KrogerKroger New AlbanyCenter Columbus OH 50% 1999 1999 — 93 100.0% 13.10 Kroger
Northgate Plaza (MaxtownRoad) Columbus OH 1998 1996 — 114 100.0% 11.75 Kroger, (Home Depot)
Corvallis Market Center Corvallis OR 2006 2006 — 85 90.9% 21.75 Trader Joe's, TJ Maxx, Michael'sNorthgate Marketplace Medford OR 2011 2011 — 81 100.0% 22.80 Trader Joe's, REI, PETCONorthgate Marketplace PhII Medford OR 2015 2015 — 177 97.4% 17.10 Dick's Sporting Goods, Homegoods,
MarshallsGreenway Town Center Portland-Vancouver-Hillsboro OR 40% 2005 1979 10,723 93 100.0% 16.05 Whole Foods, Rite Aid, Dollar TreeMurrayhill Marketplace Portland-Vancouver-Hillsboro OR 1999 1988 — 150 87.5% 19.89 Safeway, Planet FitnessSherwood Crossroads Portland-Vancouver-Hillsboro OR 1999 1999 — 88 98.4% 12.02 SafewayTanasbourne Market (6) Portland-Vancouver-Hillsboro OR 2006 2006 — 71 100.0% 30.18 Whole FoodsWalker Center Portland-Vancouver-Hillsboro OR 1999 1987 — 90 98.4% 21.88 Bed Bath & BeyondAllen Street Shopping Ctr Allentown-Bethlehem-Easton PA 40% 2005 1958 — 46 100.0% 16.08 Ahart's Market
Lower Nazareth Commons Allentown-Bethlehem-Easton PA 2007 2007 — 90 97.8% 26.41 (Wegmans), (Target), Burlington CoatFactory, PETCO
Stefko BoulevardShopping Center (6) Allentown-Bethlehem-Easton PA 40% 2005 1976 — 134 95.1% 10.63 Valley Farm Market, Dollar Tree,
Retro FitnessHershey (6) Harrisburg-Carlisle PA 2000 2000 — 6 100.0% 30.00 -City Avenue ShoppingCenter Philadelphia-Camden-
Wilmington PA 40% 2005 1960 — 162 93.5% 19.32 Ross Dress for Less, TJ Maxx, DollarTree
Gateway Shopping Center Philadelphia-Camden-Wilmington PA 2004 1960 — 221 97.5% 32.63 Trader Joe's, Staples, TJ Maxx, Jo-
Ann FabricsMercer Square ShoppingCenter Philadelphia-Camden-
Wilmington PA 40% 2005 1988 — 91 98.0% 24.37 Weis Markets
Newtown SquareShopping Center Philadelphia-Camden-
Wilmington PA 40% 2005 1970 20,000 143 86.5% 18.73 Acme Markets, Michael's
Warwick Square ShoppingCenter Philadelphia-Camden-
Wilmington PA 40% 2005 1999 — 93 44.3% 28.33 -
Indigo Square Charleston-North Charleston SC 2017 2017 — 51 97.4% 29.20 PublixMerchants Village Charleston-North Charleston SC 40% 1997 1997 9,000 80 100.0% 17.10 Publix
Harpeth Village Fieldstone Nashvil-Davdsn-Murfree-Frankln TN 1997 1998 — 70 100.0% 15.88 Publix
Northlake Village Nashvil-Davdsn-Murfree-Frankln TN 2000 1988 — 138 100.0% 14.05 Kroger
Peartree Village Nashvil-Davdsn-Murfree-Frankln TN 1997 1997 — 110 100.0% 19.96 Kroger, PETCO
Hancock Austin-Round Rock-Georgetown TX 1999 1998 — 410 52.9% 20.75
H.E.B, Twin Liquors, PETCO, 24Hour Fitness, Firestone Complete
Auto Care
Market at Round Rock Austin-Round Rock-Georgetown TX 1999 1987 — 123 97.5% 18.52 Sprout's Markets, Office Depot,
Tuesday Morning
North Hills Austin-Round Rock-Georgetown TX 1999 1995 — 145 98.3% 22.37 H.E.B.
Shops at Mira Vista Austin-Round Rock-Georgetown TX 2014 2002 204 68 100.0% 23.80 Trader Joe's, Champions Westlake
Gymnastics & Cheer
Tech Ridge Center Austin-Round Rock-Georgetown TX 2011 2001 3,346 215 88.1% 23.22 H.E.B., Pinstack
Bethany Park Place Dallas-Fort Worth-Arlington TX 20% 1998 1998 10,200 99 98.0% 11.66 KrogerCityLine Market Dallas-Fort Worth-Arlington TX 2014 2014 — 81 98.0% 27.65 Whole Foods
33
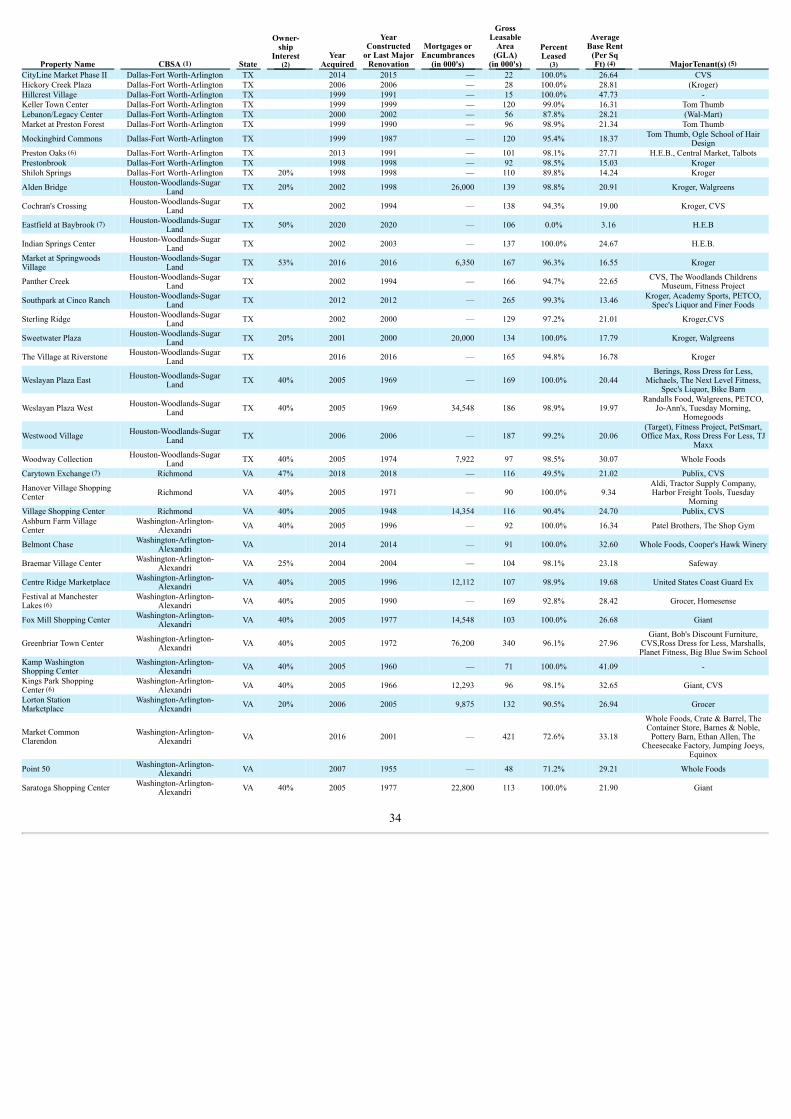
Property Name CBSA (1) State
Owner-ship
Interest(2)
YearAcquired
YearConstructed
or Last MajorRenovation
Mortgages orEncumbrances
(in 000's)
GrossLeasable
Area(GLA)
(in 000's)
PercentLeased
(3)
AverageBase Rent
(Per SqFt) (4) MajorTenant(s) (5)
CityLine Market Phase II Dallas-Fort Worth-Arlington TX 2014 2015 — 22 100.0% 26.64 CVSHickory Creek Plaza Dallas-Fort Worth-Arlington TX 2006 2006 — 28 100.0% 28.81 (Kroger)Hillcrest Village Dallas-Fort Worth-Arlington TX 1999 1991 — 15 100.0% 47.73 -Keller Town Center Dallas-Fort Worth-Arlington TX 1999 1999 — 120 99.0% 16.31 Tom ThumbLebanon/Legacy Center Dallas-Fort Worth-Arlington TX 2000 2002 — 56 87.8% 28.21 (Wal-Mart)Market at Preston Forest Dallas-Fort Worth-Arlington TX 1999 1990 — 96 98.9% 21.34 Tom Thumb
Mockingbird Commons Dallas-Fort Worth-Arlington TX 1999 1987 — 120 95.4% 18.37 Tom Thumb, Ogle School of HairDesign
Preston Oaks (6) Dallas-Fort Worth-Arlington TX 2013 1991 — 101 98.1% 27.71 H.E.B., Central Market, TalbotsPrestonbrook Dallas-Fort Worth-Arlington TX 1998 1998 — 92 98.5% 15.03 KrogerShiloh Springs Dallas-Fort Worth-Arlington TX 20% 1998 1998 — 110 89.8% 14.24 Kroger
Alden Bridge Houston-Woodlands-SugarLand TX 20% 2002 1998 26,000 139 98.8% 20.91 Kroger, Walgreens
Cochran's Crossing Houston-Woodlands-SugarLand TX 2002 1994 — 138 94.3% 19.00 Kroger, CVS
Eastfield at Baybrook (7) Houston-Woodlands-SugarLand TX 50% 2020 2020 — 106 0.0% 3.16 H.E.B
Indian Springs Center Houston-Woodlands-SugarLand TX 2002 2003 — 137 100.0% 24.67 H.E.B.
Market at SpringwoodsVillage Houston-Woodlands-Sugar
Land TX 53% 2016 2016 6,350 167 96.3% 16.55 Kroger
Panther Creek Houston-Woodlands-SugarLand TX 2002 1994 — 166 94.7% 22.65 CVS, The Woodlands Childrens
Museum, Fitness Project
Southpark at Cinco Ranch Houston-Woodlands-SugarLand TX 2012 2012 — 265 99.3% 13.46 Kroger, Academy Sports, PETCO,
Spec's Liquor and Finer Foods
Sterling Ridge Houston-Woodlands-SugarLand TX 2002 2000 — 129 97.2% 21.01 Kroger,CVS
Sweetwater Plaza Houston-Woodlands-SugarLand TX 20% 2001 2000 20,000 134 100.0% 17.79 Kroger, Walgreens
The Village at Riverstone Houston-Woodlands-SugarLand TX 2016 2016 — 165 94.8% 16.78 Kroger
Weslayan Plaza East Houston-Woodlands-SugarLand TX 40% 2005 1969 — 169 100.0% 20.44
Berings, Ross Dress for Less,Michaels, The Next Level Fitness,
Spec's Liquor, Bike Barn
Weslayan Plaza West Houston-Woodlands-SugarLand TX 40% 2005 1969 34,548 186 98.9% 19.97
Randalls Food, Walgreens, PETCO,Jo-Ann's, Tuesday Morning,
Homegoods
Westwood Village Houston-Woodlands-SugarLand TX 2006 2006 — 187 99.2% 20.06
(Target), Fitness Project, PetSmart,Office Max, Ross Dress For Less, TJ
Maxx
Woodway Collection Houston-Woodlands-SugarLand TX 40% 2005 1974 7,922 97 98.5% 30.07 Whole Foods
Carytown Exchange (7) Richmond VA 47% 2018 2018 — 116 49.5% 21.02 Publix, CVS
Hanover Village ShoppingCenter Richmond VA 40% 2005 1971 — 90 100.0% 9.34
Aldi, Tractor Supply Company,Harbor Freight Tools, Tuesday
MorningVillage Shopping Center Richmond VA 40% 2005 1948 14,354 116 90.4% 24.70 Publix, CVSAshburn Farm VillageCenter Washington-Arlington-
Alexandri VA 40% 2005 1996 — 92 100.0% 16.34 Patel Brothers, The Shop Gym
Belmont Chase Washington-Arlington-Alexandri VA 2014 2014 — 91 100.0% 32.60 Whole Foods, Cooper's Hawk Winery
Braemar Village Center Washington-Arlington-Alexandri VA 25% 2004 2004 — 104 98.1% 23.18 Safeway
Centre Ridge Marketplace Washington-Arlington-Alexandri VA 40% 2005 1996 12,112 107 98.9% 19.68 United States Coast Guard Ex
Festival at ManchesterLakes (6) Washington-Arlington-
Alexandri VA 40% 2005 1990 — 169 92.8% 28.42 Grocer, Homesense
Fox Mill Shopping Center Washington-Arlington-Alexandri VA 40% 2005 1977 14,548 103 100.0% 26.68 Giant
Greenbriar Town Center Washington-Arlington-Alexandri VA 40% 2005 1972 76,200 340 96.1% 27.96
Giant, Bob's Discount Furniture,CVS,Ross Dress for Less, Marshalls,Planet Fitness, Big Blue Swim School
Kamp WashingtonShopping Center Washington-Arlington-
Alexandri VA 40% 2005 1960 — 71 100.0% 41.09 -
Kings Park ShoppingCenter (6) Washington-Arlington-
Alexandri VA 40% 2005 1966 12,293 96 98.1% 32.65 Giant, CVS
Lorton StationMarketplace Washington-Arlington-
Alexandri VA 20% 2006 2005 9,875 132 90.5% 26.94 Grocer
Market CommonClarendon Washington-Arlington-
Alexandri VA 2016 2001 — 421 72.6% 33.18
Whole Foods, Crate & Barrel, TheContainer Store, Barnes & Noble,
Pottery Barn, Ethan Allen, TheCheesecake Factory, Jumping Joeys,
Equinox
Point 50 Washington-Arlington-Alexandri VA 2007 1955 — 48 71.2% 29.21 Whole Foods
Saratoga Shopping Center Washington-Arlington-Alexandri VA 40% 2005 1977 22,800 113 100.0% 21.90 Giant
34
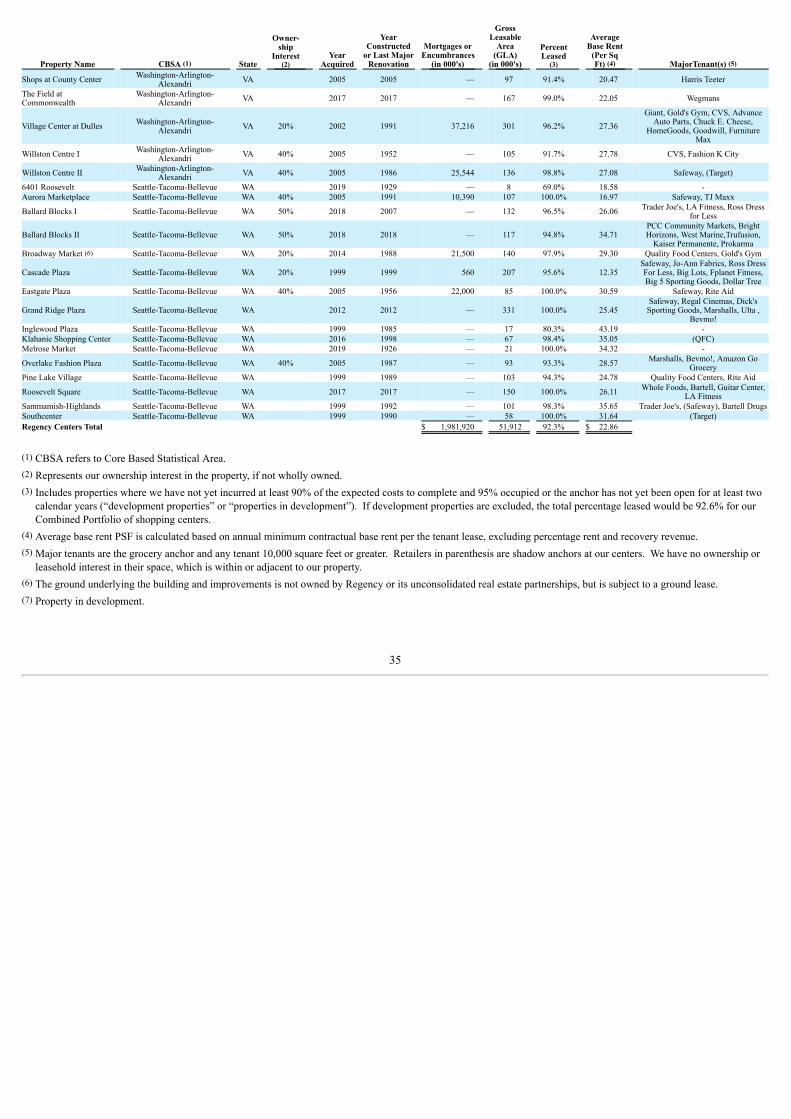
Property Name CBSA (1) State
Owner-ship
Interest(2)
YearAcquired
YearConstructed
or Last MajorRenovation
Mortgages orEncumbrances
(in 000's)
GrossLeasable
Area(GLA)
(in 000's)
PercentLeased
(3)
AverageBase Rent
(Per SqFt) (4) MajorTenant(s) (5)
Shops at County Center Washington-Arlington-Alexandri VA 2005 2005 — 97 91.4% 20.47 Harris Teeter
The Field atCommonwealth Washington-Arlington-
Alexandri VA 2017 2017 — 167 99.0% 22.05 Wegmans
Village Center at Dulles Washington-Arlington-Alexandri VA 20% 2002 1991 37,216 301 96.2% 27.36
Giant, Gold's Gym, CVS, AdvanceAuto Parts, Chuck E. Cheese,
HomeGoods, Goodwill, FurnitureMax
Willston Centre I Washington-Arlington-Alexandri VA 40% 2005 1952 — 105 91.7% 27.78 CVS, Fashion K City
Willston Centre II Washington-Arlington-Alexandri VA 40% 2005 1986 25,544 136 98.8% 27.08 Safeway, (Target)
6401 Roosevelt Seattle-Tacoma-Bellevue WA 2019 1929 — 8 69.0% 18.58 -Aurora Marketplace Seattle-Tacoma-Bellevue WA 40% 2005 1991 10,390 107 100.0% 16.97 Safeway, TJ Maxx
Ballard Blocks I Seattle-Tacoma-Bellevue WA 50% 2018 2007 — 132 96.5% 26.06 Trader Joe's, LA Fitness, Ross Dressfor Less
Ballard Blocks II Seattle-Tacoma-Bellevue WA 50% 2018 2018 — 117 94.8% 34.71 PCC Community Markets, BrightHorizons, West Marine,Trufusion,
Kaiser Permanente, ProkarmaBroadway Market (6) Seattle-Tacoma-Bellevue WA 20% 2014 1988 21,500 140 97.9% 29.30 Quality Food Centers, Gold's Gym
Cascade Plaza Seattle-Tacoma-Bellevue WA 20% 1999 1999 560 207 95.6% 12.35 Safeway, Jo-Ann Fabrics, Ross DressFor Less, Big Lots, Fplanet Fitness,Big 5 Sporting Goods, Dollar Tree
Eastgate Plaza Seattle-Tacoma-Bellevue WA 40% 2005 1956 22,000 85 100.0% 30.59 Safeway, Rite Aid
Grand Ridge Plaza Seattle-Tacoma-Bellevue WA 2012 2012 — 331 100.0% 25.45 Safeway, Regal Cinemas, Dick'sSporting Goods, Marshalls, Ulta ,
Bevmo!Inglewood Plaza Seattle-Tacoma-Bellevue WA 1999 1985 — 17 80.3% 43.19 -Klahanie Shopping Center Seattle-Tacoma-Bellevue WA 2016 1998 — 67 98.4% 35.05 (QFC)Melrose Market Seattle-Tacoma-Bellevue WA 2019 1926 — 21 100.0% 34.32 -
Overlake Fashion Plaza Seattle-Tacoma-Bellevue WA 40% 2005 1987 — 93 93.3% 28.57 Marshalls, Bevmo!, Amazon GoGrocery
Pine Lake Village Seattle-Tacoma-Bellevue WA 1999 1989 — 103 94.3% 24.78 Quality Food Centers, Rite Aid
Roosevelt Square Seattle-Tacoma-Bellevue WA 2017 2017 — 150 100.0% 26.11 Whole Foods, Bartell, Guitar Center,LA Fitness
Sammamish-Highlands Seattle-Tacoma-Bellevue WA 1999 1992 — 101 98.3% 35.65 Trader Joe's, (Safeway), Bartell DrugsSouthcenter Seattle-Tacoma-Bellevue WA 1999 1990 — 58 100.0% 31.64 (Target)Regency Centers Total $ 1,981,920 51,912 92.3% $ 22.86
(1) CBSA refers to Core Based Statistical Area.(2) Represents our ownership interest in the property, if not wholly owned.(3) Includes properties where we have not yet incurred at least 90% of the expected costs to complete and 95% occupied or the anchor has not yet been open for at least two
calendar years (“development properties” or “properties in development”). If development properties are excluded, the total percentage leased would be 92.6% for ourCombined Portfolio of shopping centers.
(4) Average base rent PSF is calculated based on annual minimum contractual base rent per the tenant lease, excluding percentage rent and recovery revenue.(5) Major tenants are the grocery anchor and any tenant 10,000 square feet or greater. Retailers in parenthesis are shadow anchors at our centers. We have no ownership or
leasehold interest in their space, which is within or adjacent to our property.(6) The ground underlying the building and improvements is not owned by Regency or its unconsolidated real estate partnerships, but is subject to a ground lease.(7) Property in development.
35
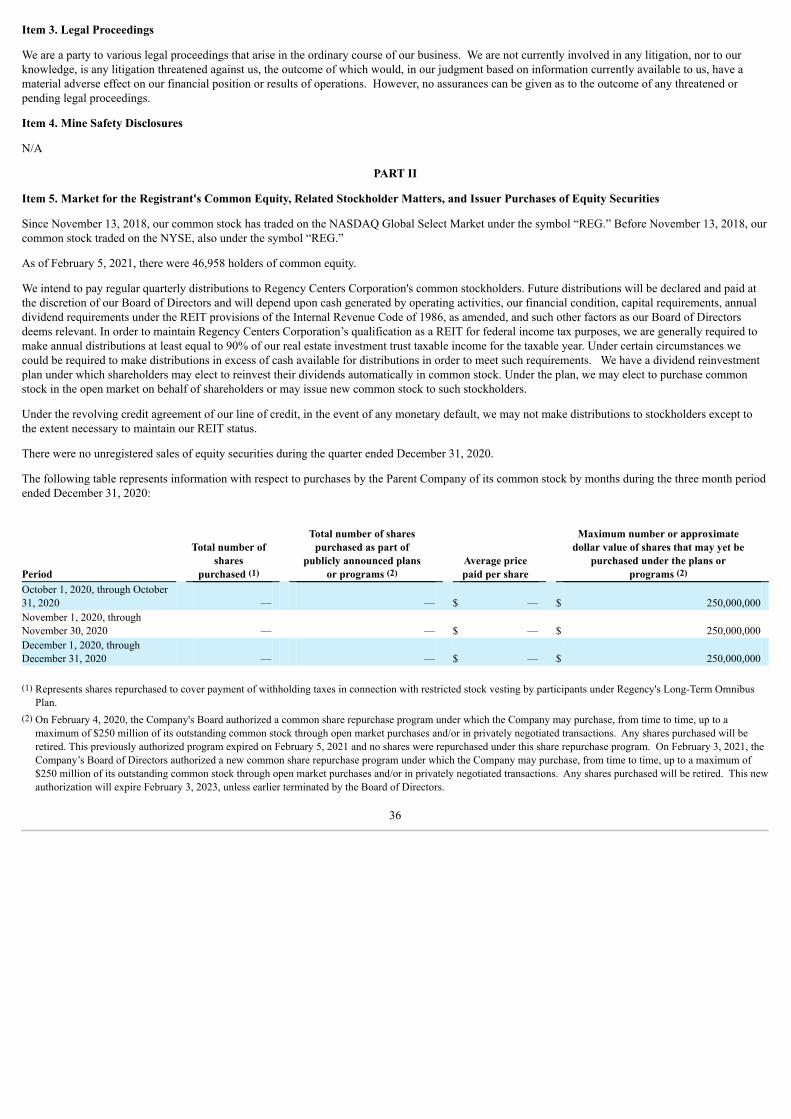
Item 3. Legal Proceedings
We are a party to various legal proceedings that arise in the ordinary course of our business. We are not currently involved in any litigation, nor to ourknowledge, is any litigation threatened against us, the outcome of which would, in our judgment based on information currently available to us, have amaterial adverse effect on our financial position or results of operations. However, no assurances can be given as to the outcome of any threatened orpending legal proceedings.
Item 4. Mine Safety Disclosures
N/A
PART II
Item 5. Market for the Registrant's Common Equity, Related Stockholder Matters, and Issuer Purchases of Equity Securities
Since November 13, 2018, our common stock has traded on the NASDAQ Global Select Market under the symbol “REG.” Before November 13, 2018, ourcommon stock traded on the NYSE, also under the symbol “REG.”
As of February 5, 2021, there were 46,958 holders of common equity.
We intend to pay regular quarterly distributions to Regency Centers Corporation's common stockholders. Future distributions will be declared and paid atthe discretion of our Board of Directors and will depend upon cash generated by operating activities, our financial condition, capital requirements, annualdividend requirements under the REIT provisions of the Internal Revenue Code of 1986, as amended, and such other factors as our Board of Directorsdeems relevant. In order to maintain Regency Centers Corporation’s qualification as a REIT for federal income tax purposes, we are generally required tomake annual distributions at least equal to 90% of our real estate investment trust taxable income for the taxable year. Under certain circumstances wecould be required to make distributions in excess of cash available for distributions in order to meet such requirements. We have a dividend reinvestmentplan under which shareholders may elect to reinvest their dividends automatically in common stock. Under the plan, we may elect to purchase commonstock in the open market on behalf of shareholders or may issue new common stock to such stockholders.
Under the revolving credit agreement of our line of credit, in the event of any monetary default, we may not make distributions to stockholders except tothe extent necessary to maintain our REIT status.
There were no unregistered sales of equity securities during the quarter ended December 31, 2020.
The following table represents information with respect to purchases by the Parent Company of its common stock by months during the three month periodended December 31, 2020:
Period
Total number of
sharespurchased (1)
Total number of sharespurchased as part of
publicly announced plansor programs (2)
Average pricepaid per share
Maximum number or approximatedollar value of shares that may yet be
purchased under the plans orprograms (2)
October 1, 2020, through October31, 2020
—
—
$ —
$ 250,000,000
November 1, 2020, throughNovember 30, 2020
—
—
$ —
$ 250,000,000
December 1, 2020, throughDecember 31, 2020
—
—
$ —
$ 250,000,000
(1) Represents shares repurchased to cover payment of withholding taxes in connection with restricted stock vesting by participants under Regency's Long-Term Omnibus
Plan.(2) On February 4, 2020, the Company's Board authorized a common share repurchase program under which the Company may purchase, from time to time, up to a
maximum of $250 million of its outstanding common stock through open market purchases and/or in privately negotiated transactions. Any shares purchased will beretired. This previously authorized program expired on February 5, 2021 and no shares were repurchased under this share repurchase program. On February 3, 2021, theCompany’s Board of Directors authorized a new common share repurchase program under which the Company may purchase, from time to time, up to a maximum of$250 million of its outstanding common stock through open market purchases and/or in privately negotiated transactions. Any shares purchased will be retired. This newauthorization will expire February 3, 2023, unless earlier terminated by the Board of Directors.
36
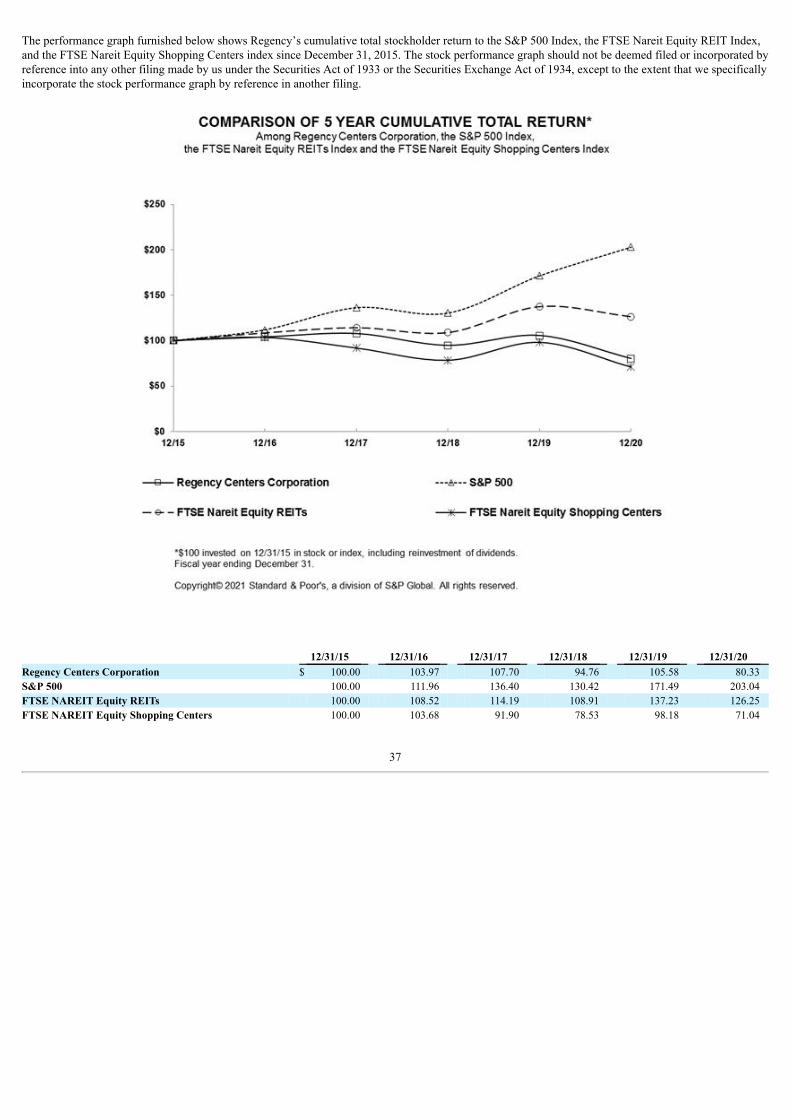
The performance graph furnished below shows Regency’s cumulative total stockholder return to the S&P 500 Index, the FTSE Nareit Equity REIT Index,and the FTSE Nareit Equity Shopping Centers index since December 31, 2015. The stock performance graph should not be deemed filed or incorporated byreference into any other filing made by us under the Securities Act of 1933 or the Securities Exchange Act of 1934, except to the extent that we specificallyincorporate the stock performance graph by reference in another filing.
12/31/15 12/31/16 12/31/17 12/31/18 12/31/19 12/31/20 Regency Centers Corporation $ 100.00 103.97 107.70 94.76 105.58 80.33 S&P 500 100.00 111.96 136.40 130.42 171.49 203.04 FTSE NAREIT Equity REITs 100.00 108.52 114.19 108.91 137.23 126.25 FTSE NAREIT Equity Shopping Centers 100.00 103.68 91.90 78.53 98.18 71.04
37
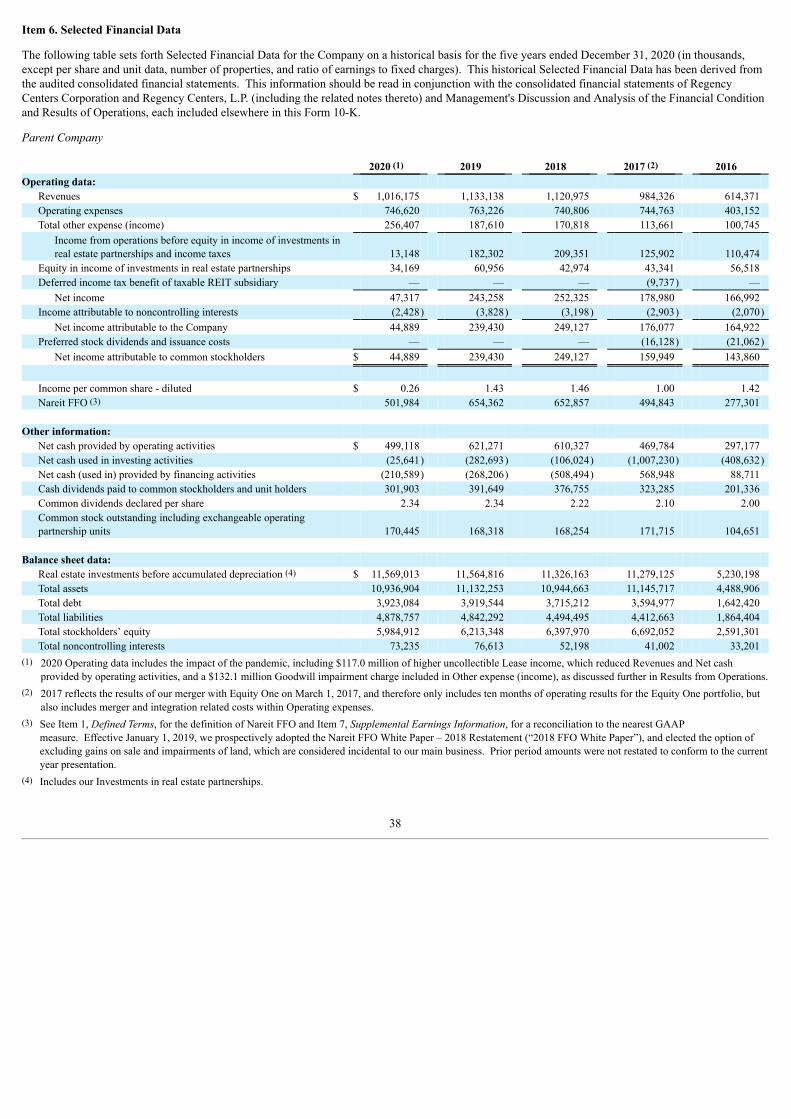
Item 6. Selected Financial Data
The following table sets forth Selected Financial Data for the Company on a historical basis for the five years ended December 31, 2020 (in thousands,except per share and unit data, number of properties, and ratio of earnings to fixed charges). This historical Selected Financial Data has been derived fromthe audited consolidated financial statements. This information should be read in conjunction with the consolidated financial statements of RegencyCenters Corporation and Regency Centers, L.P. (including the related notes thereto) and Management's Discussion and Analysis of the Financial Conditionand Results of Operations, each included elsewhere in this Form 10-K.
Parent Company 2020 (1) 2019 2018 2017 (2) 2016 Operating data:
Revenues $ 1,016,175 1,133,138 1,120,975 984,326 614,371 Operating expenses 746,620 763,226 740,806 744,763 403,152 Total other expense (income) 256,407 187,610 170,818 113,661 100,745
Income from operations before equity in income of investments inreal estate partnerships and income taxes
13,148
182,302
209,351
125,902
110,474
Equity in income of investments in real estate partnerships 34,169 60,956 42,974 43,341 56,518 Deferred income tax benefit of taxable REIT subsidiary — — — (9,737) —
Net income 47,317 243,258 252,325 178,980 166,992 Income attributable to noncontrolling interests (2,428) (3,828) (3,198) (2,903) (2,070)
Net income attributable to the Company 44,889 239,430 249,127 176,077 164,922 Preferred stock dividends and issuance costs — — — (16,128) (21,062)
Net income attributable to common stockholders $ 44,889 239,430 249,127 159,949 143,860
Income per common share - diluted $ 0.26 1.43 1.46 1.00 1.42 Nareit FFO (3) 501,984 654,362 652,857 494,843 277,301
Other information: Net cash provided by operating activities $ 499,118 621,271 610,327 469,784 297,177 Net cash used in investing activities (25,641) (282,693) (106,024) (1,007,230) (408,632)Net cash (used in) provided by financing activities (210,589) (268,206) (508,494) 568,948 88,711 Cash dividends paid to common stockholders and unit holders 301,903 391,649 376,755 323,285 201,336 Common dividends declared per share 2.34 2.34 2.22 2.10 2.00 Common stock outstanding including exchangeable operatingpartnership units
170,445
168,318
168,254
171,715
104,651
Balance sheet data:
Real estate investments before accumulated depreciation (4) $ 11,569,013 11,564,816 11,326,163 11,279,125 5,230,198 Total assets 10,936,904 11,132,253 10,944,663 11,145,717 4,488,906 Total debt 3,923,084 3,919,544 3,715,212 3,594,977 1,642,420 Total liabilities 4,878,757 4,842,292 4,494,495 4,412,663 1,864,404 Total stockholders’ equity 5,984,912 6,213,348 6,397,970 6,692,052 2,591,301 Total noncontrolling interests 73,235 76,613 52,198 41,002 33,201
(1) 2020 Operating data includes the impact of the pandemic, including $117.0 million of higher uncollectible Lease income, which reduced Revenues and Net cashprovided by operating activities, and a $132.1 million Goodwill impairment charge included in Other expense (income), as discussed further in Results from Operations.
(2) 2017 reflects the results of our merger with Equity One on March 1, 2017, and therefore only includes ten months of operating results for the Equity One portfolio, butalso includes merger and integration related costs within Operating expenses.
(3) See Item 1, Defined Terms, for the definition of Nareit FFO and Item 7, Supplemental Earnings Information, for a reconciliation to the nearest GAAPmeasure. Effective January 1, 2019, we prospectively adopted the Nareit FFO White Paper – 2018 Restatement (“2018 FFO White Paper”), and elected the option ofexcluding gains on sale and impairments of land, which are considered incidental to our main business. Prior period amounts were not restated to conform to the currentyear presentation.
(4) Includes our Investments in real estate partnerships.
38
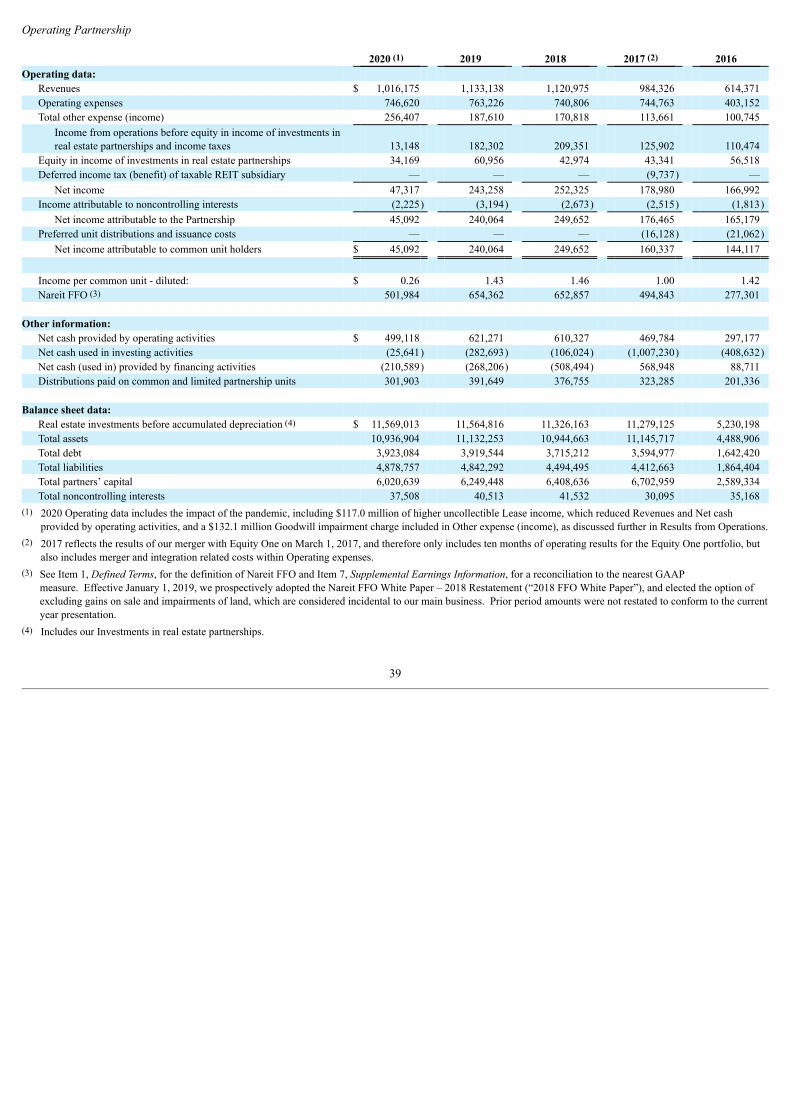
Operating Partnership 2020 (1) 2019 2018 2017 (2) 2016 Operating data:
Revenues $ 1,016,175 1,133,138 1,120,975 984,326 614,371 Operating expenses 746,620 763,226 740,806 744,763 403,152 Total other expense (income) 256,407 187,610 170,818 113,661 100,745
Income from operations before equity in income of investments inreal estate partnerships and income taxes 13,148 182,302 209,351 125,902 110,474
Equity in income of investments in real estate partnerships 34,169 60,956 42,974 43,341 56,518 Deferred income tax (benefit) of taxable REIT subsidiary — — — (9,737) —
Net income 47,317 243,258 252,325 178,980 166,992 Income attributable to noncontrolling interests (2,225) (3,194) (2,673) (2,515) (1,813)
Net income attributable to the Partnership 45,092 240,064 249,652 176,465 165,179 Preferred unit distributions and issuance costs — — — (16,128) (21,062)
Net income attributable to common unit holders $ 45,092 240,064 249,652 160,337 144,117
Income per common unit - diluted: $ 0.26 1.43 1.46 1.00 1.42 Nareit FFO (3) 501,984 654,362 652,857 494,843 277,301
Other information: Net cash provided by operating activities $ 499,118 621,271 610,327 469,784 297,177 Net cash used in investing activities (25,641) (282,693) (106,024) (1,007,230) (408,632)Net cash (used in) provided by financing activities (210,589) (268,206) (508,494) 568,948 88,711 Distributions paid on common and limited partnership units 301,903 391,649 376,755 323,285 201,336
Balance sheet data: Real estate investments before accumulated depreciation (4) $ 11,569,013 11,564,816 11,326,163 11,279,125 5,230,198 Total assets 10,936,904 11,132,253 10,944,663 11,145,717 4,488,906 Total debt 3,923,084 3,919,544 3,715,212 3,594,977 1,642,420 Total liabilities 4,878,757 4,842,292 4,494,495 4,412,663 1,864,404 Total partners’ capital 6,020,639 6,249,448 6,408,636 6,702,959 2,589,334 Total noncontrolling interests 37,508 40,513 41,532 30,095 35,168
(1) 2020 Operating data includes the impact of the pandemic, including $117.0 million of higher uncollectible Lease income, which reduced Revenues and Net cashprovided by operating activities, and a $132.1 million Goodwill impairment charge included in Other expense (income), as discussed further in Results from Operations.
(2) 2017 reflects the results of our merger with Equity One on March 1, 2017, and therefore only includes ten months of operating results for the Equity One portfolio, butalso includes merger and integration related costs within Operating expenses.
(3) See Item 1, Defined Terms, for the definition of Nareit FFO and Item 7, Supplemental Earnings Information, for a reconciliation to the nearest GAAPmeasure. Effective January 1, 2019, we prospectively adopted the Nareit FFO White Paper – 2018 Restatement (“2018 FFO White Paper”), and elected the option ofexcluding gains on sale and impairments of land, which are considered incidental to our main business. Prior period amounts were not restated to conform to the currentyear presentation.
(4) Includes our Investments in real estate partnerships.
39
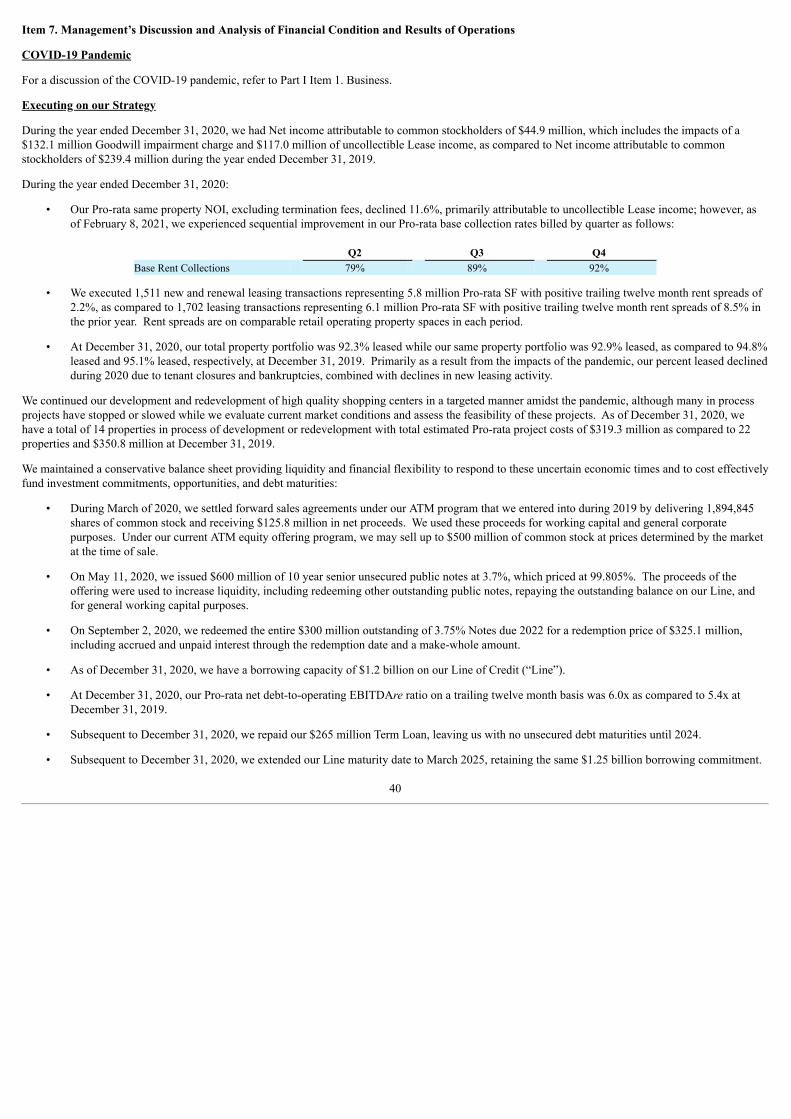
Item 7. Management’s Discussion and Analysis of Financial Condition and Results of Operations
COVID-19 Pandemic
For a discussion of the COVID-19 pandemic, refer to Part I Item 1. Business.
Executing on our Strategy
During the year ended December 31, 2020, we had Net income attributable to common stockholders of $44.9 million, which includes the impacts of a$132.1 million Goodwill impairment charge and $117.0 million of uncollectible Lease income, as compared to Net income attributable to commonstockholders of $239.4 million during the year ended December 31, 2019.
During the year ended December 31, 2020:
• Our Pro-rata same property NOI, excluding termination fees, declined 11.6%, primarily attributable to uncollectible Lease income; however, asof February 8, 2021, we experienced sequential improvement in our Pro-rata base collection rates billed by quarter as follows:
Q2 Q3 Q4 Base Rent Collections 79% 89% 92%
• We executed 1,511 new and renewal leasing transactions representing 5.8 million Pro-rata SF with positive trailing twelve month rent spreads of2.2%, as compared to 1,702 leasing transactions representing 6.1 million Pro-rata SF with positive trailing twelve month rent spreads of 8.5% inthe prior year. Rent spreads are on comparable retail operating property spaces in each period.
• At December 31, 2020, our total property portfolio was 92.3% leased while our same property portfolio was 92.9% leased, as compared to 94.8%leased and 95.1% leased, respectively, at December 31, 2019. Primarily as a result from the impacts of the pandemic, our percent leased declinedduring 2020 due to tenant closures and bankruptcies, combined with declines in new leasing activity.
We continued our development and redevelopment of high quality shopping centers in a targeted manner amidst the pandemic, although many in processprojects have stopped or slowed while we evaluate current market conditions and assess the feasibility of these projects. As of December 31, 2020, wehave a total of 14 properties in process of development or redevelopment with total estimated Pro-rata project costs of $319.3 million as compared to 22properties and $350.8 million at December 31, 2019.
We maintained a conservative balance sheet providing liquidity and financial flexibility to respond to these uncertain economic times and to cost effectivelyfund investment commitments, opportunities, and debt maturities:
• During March of 2020, we settled forward sales agreements under our ATM program that we entered into during 2019 by delivering 1,894,845shares of common stock and receiving $125.8 million in net proceeds. We used these proceeds for working capital and general corporatepurposes. Under our current ATM equity offering program, we may sell up to $500 million of common stock at prices determined by the marketat the time of sale.
• On May 11, 2020, we issued $600 million of 10 year senior unsecured public notes at 3.7%, which priced at 99.805%. The proceeds of theoffering were used to increase liquidity, including redeeming other outstanding public notes, repaying the outstanding balance on our Line, andfor general working capital purposes.
• On September 2, 2020, we redeemed the entire $300 million outstanding of 3.75% Notes due 2022 for a redemption price of $325.1 million,including accrued and unpaid interest through the redemption date and a make-whole amount.
• As of December 31, 2020, we have a borrowing capacity of $1.2 billion on our Line of Credit (“Line”).
• At December 31, 2020, our Pro-rata net debt-to-operating EBITDAre ratio on a trailing twelve month basis was 6.0x as compared to 5.4x atDecember 31, 2019.
• Subsequent to December 31, 2020, we repaid our $265 million Term Loan, leaving us with no unsecured debt maturities until 2024.
• Subsequent to December 31, 2020, we extended our Line maturity date to March 2025, retaining the same $1.25 billion borrowing commitment.
40
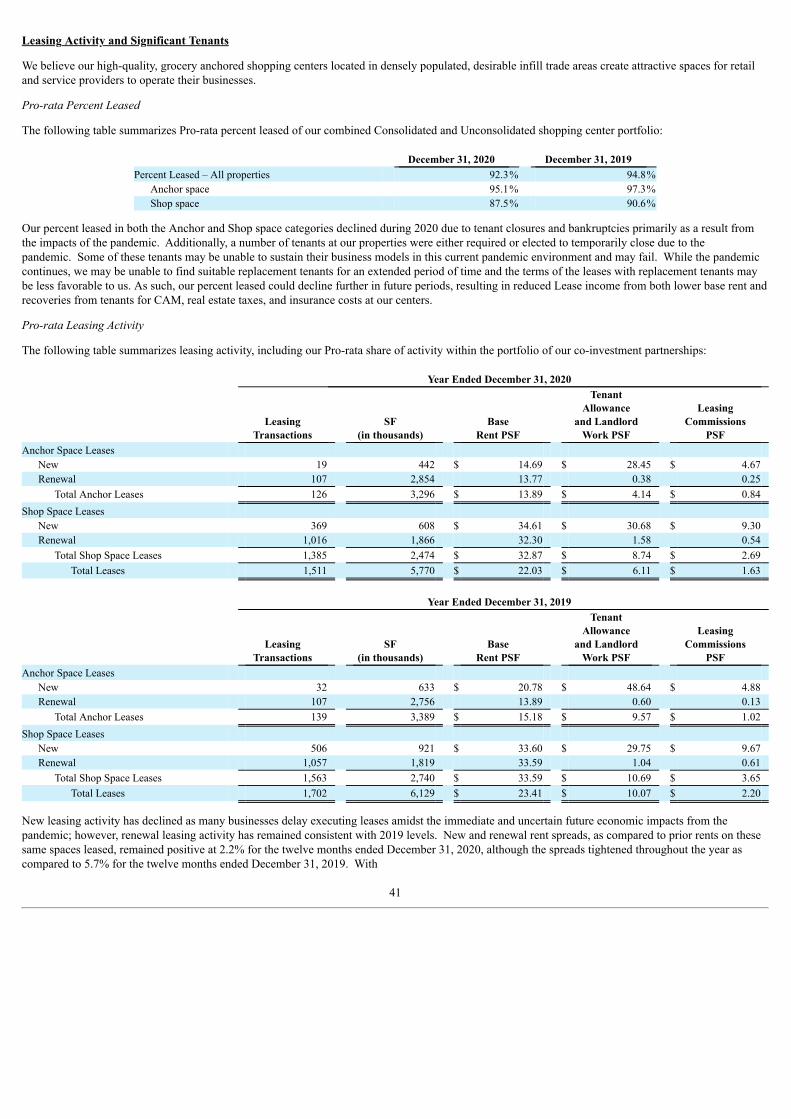
Leasing Activity and Significant Tenants
We believe our high-quality, grocery anchored shopping centers located in densely populated, desirable infill trade areas create attractive spaces for retailand service providers to operate their businesses.
Pro-rata Percent Leased
The following table summarizes Pro-rata percent leased of our combined Consolidated and Unconsolidated shopping center portfolio:
December 31, 2020 December 31, 2019 Percent Leased – All properties 92.3% 94.8%
Anchor space 95.1% 97.3%Shop space 87.5% 90.6%
Our percent leased in both the Anchor and Shop space categories declined during 2020 due to tenant closures and bankruptcies primarily as a result fromthe impacts of the pandemic. Additionally, a number of tenants at our properties were either required or elected to temporarily close due to thepandemic. Some of these tenants may be unable to sustain their business models in this current pandemic environment and may fail. While the pandemiccontinues, we may be unable to find suitable replacement tenants for an extended period of time and the terms of the leases with replacement tenants maybe less favorable to us. As such, our percent leased could decline further in future periods, resulting in reduced Lease income from both lower base rent andrecoveries from tenants for CAM, real estate taxes, and insurance costs at our centers.
Pro-rata Leasing Activity
The following table summarizes leasing activity, including our Pro-rata share of activity within the portfolio of our co-investment partnerships: Year Ended December 31, 2020
Leasing
Transactions SF
(in thousands) Base
Rent PSF
TenantAllowance
and LandlordWork PSF
LeasingCommissions
PSF Anchor Space Leases
New 19 442 $ 14.69 $ 28.45 $ 4.67 Renewal 107 2,854 13.77 0.38 0.25
Total Anchor Leases 126 3,296 $ 13.89 $ 4.14 $ 0.84 Shop Space Leases
New 369 608 $ 34.61 $ 30.68 $ 9.30 Renewal 1,016 1,866 32.30 1.58 0.54
Total Shop Space Leases 1,385 2,474 $ 32.87 $ 8.74 $ 2.69 Total Leases 1,511 5,770 $ 22.03 $ 6.11 $ 1.63
Year Ended December 31, 2019
Leasing
Transactions SF
(in thousands) Base
Rent PSF
TenantAllowance
and LandlordWork PSF
LeasingCommissions
PSF Anchor Space Leases
New 32 633 $ 20.78 $ 48.64 $ 4.88 Renewal 107 2,756 13.89 0.60 0.13
Total Anchor Leases 139 3,389 $ 15.18 $ 9.57 $ 1.02 Shop Space Leases
New 506 921 $ 33.60 $ 29.75 $ 9.67 Renewal 1,057 1,819 33.59 1.04 0.61
Total Shop Space Leases 1,563 2,740 $ 33.59 $ 10.69 $ 3.65 Total Leases 1,702 6,129 $ 23.41 $ 10.07 $ 2.20
New leasing activity has declined as many businesses delay executing leases amidst the immediate and uncertain future economic impacts from thepandemic; however, renewal leasing activity has remained consistent with 2019 levels. New and renewal rent spreads, as compared to prior rents on thesesame spaces leased, remained positive at 2.2% for the twelve months ended December 31, 2020, although the spreads tightened throughout the year ascompared to 5.7% for the twelve months ended December 31, 2019. With
41
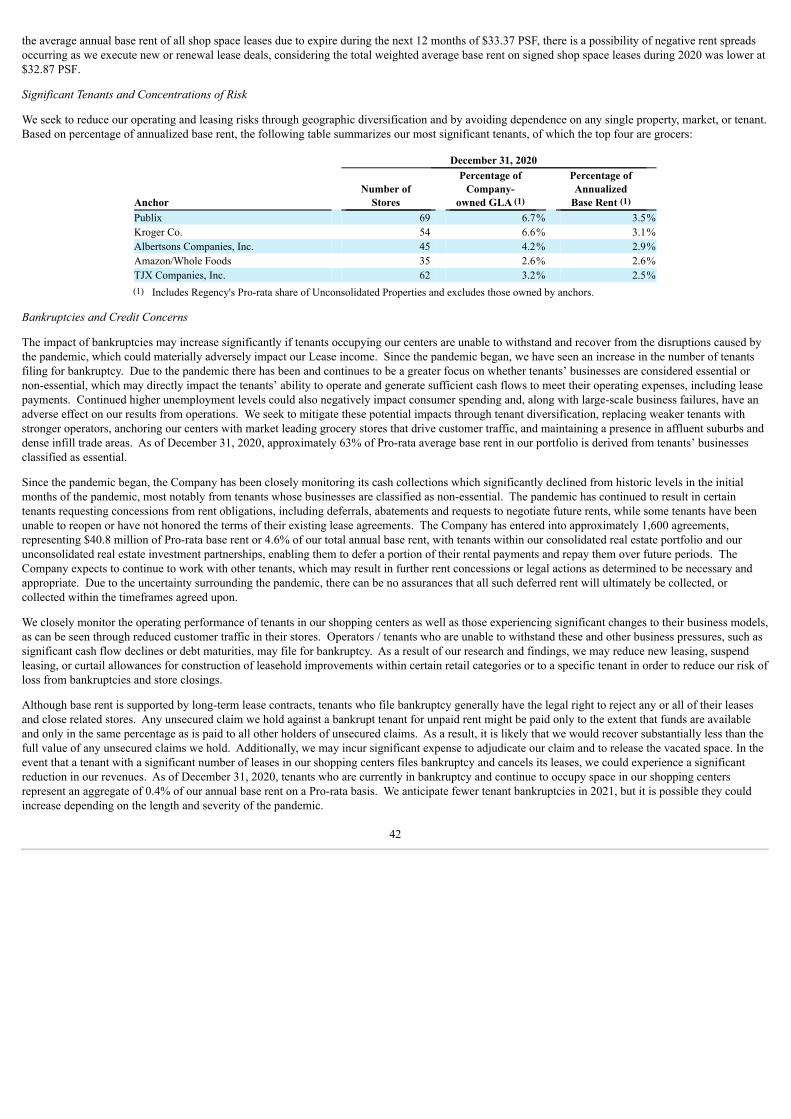
the average annual base rent of all shop space leases due to expire during the next 12 months of $33.37 PSF, there is a possibility of negative rent spreadsoccurring as we execute new or renewal lease deals, considering the total weighted average base rent on signed shop space leases during 2020 was lower at$32.87 PSF.
Significant Tenants and Concentrations of Risk
We seek to reduce our operating and leasing risks through geographic diversification and by avoiding dependence on any single property, market, or tenant.Based on percentage of annualized base rent, the following table summarizes our most significant tenants, of which the top four are grocers:
December 31, 2020
Anchor Number of
Stores
Percentage ofCompany-
owned GLA (1)
Percentage ofAnnualized
Base Rent (1) Publix 69 6.7% 3.5%Kroger Co. 54 6.6% 3.1%Albertsons Companies, Inc. 45 4.2% 2.9%Amazon/Whole Foods 35 2.6% 2.6%TJX Companies, Inc. 62 3.2% 2.5%
(1) Includes Regency's Pro-rata share of Unconsolidated Properties and excludes those owned by anchors.
Bankruptcies and Credit Concerns
The impact of bankruptcies may increase significantly if tenants occupying our centers are unable to withstand and recover from the disruptions caused bythe pandemic, which could materially adversely impact our Lease income. Since the pandemic began, we have seen an increase in the number of tenantsfiling for bankruptcy. Due to the pandemic there has been and continues to be a greater focus on whether tenants’ businesses are considered essential ornon-essential, which may directly impact the tenants’ ability to operate and generate sufficient cash flows to meet their operating expenses, including leasepayments. Continued higher unemployment levels could also negatively impact consumer spending and, along with large-scale business failures, have anadverse effect on our results from operations. We seek to mitigate these potential impacts through tenant diversification, replacing weaker tenants withstronger operators, anchoring our centers with market leading grocery stores that drive customer traffic, and maintaining a presence in affluent suburbs anddense infill trade areas. As of December 31, 2020, approximately 63% of Pro-rata average base rent in our portfolio is derived from tenants’ businessesclassified as essential.
Since the pandemic began, the Company has been closely monitoring its cash collections which significantly declined from historic levels in the initialmonths of the pandemic, most notably from tenants whose businesses are classified as non-essential. The pandemic has continued to result in certaintenants requesting concessions from rent obligations, including deferrals, abatements and requests to negotiate future rents, while some tenants have beenunable to reopen or have not honored the terms of their existing lease agreements. The Company has entered into approximately 1,600 agreements,representing $40.8 million of Pro-rata base rent or 4.6% of our total annual base rent, with tenants within our consolidated real estate portfolio and ourunconsolidated real estate investment partnerships, enabling them to defer a portion of their rental payments and repay them over future periods. TheCompany expects to continue to work with other tenants, which may result in further rent concessions or legal actions as determined to be necessary andappropriate. Due to the uncertainty surrounding the pandemic, there can be no assurances that all such deferred rent will ultimately be collected, orcollected within the timeframes agreed upon.
We closely monitor the operating performance of tenants in our shopping centers as well as those experiencing significant changes to their business models,as can be seen through reduced customer traffic in their stores. Operators / tenants who are unable to withstand these and other business pressures, such assignificant cash flow declines or debt maturities, may file for bankruptcy. As a result of our research and findings, we may reduce new leasing, suspendleasing, or curtail allowances for construction of leasehold improvements within certain retail categories or to a specific tenant in order to reduce our risk ofloss from bankruptcies and store closings.
Although base rent is supported by long-term lease contracts, tenants who file bankruptcy generally have the legal right to reject any or all of their leasesand close related stores. Any unsecured claim we hold against a bankrupt tenant for unpaid rent might be paid only to the extent that funds are availableand only in the same percentage as is paid to all other holders of unsecured claims. As a result, it is likely that we would recover substantially less than thefull value of any unsecured claims we hold. Additionally, we may incur significant expense to adjudicate our claim and to release the vacated space. In theevent that a tenant with a significant number of leases in our shopping centers files bankruptcy and cancels its leases, we could experience a significantreduction in our revenues. As of December 31, 2020, tenants who are currently in bankruptcy and continue to occupy space in our shopping centersrepresent an aggregate of 0.4% of our annual base rent on a Pro-rata basis. We anticipate fewer tenant bankruptcies in 2021, but it is possible they couldincrease depending on the length and severity of the pandemic.
42
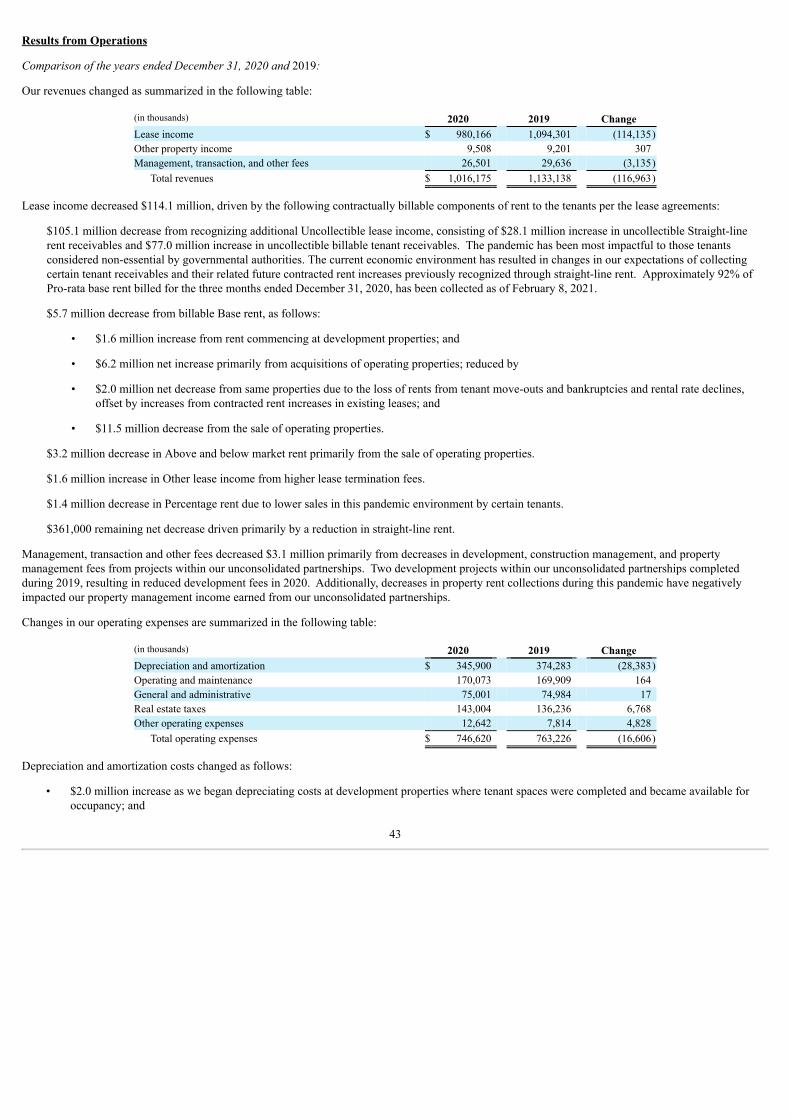
Results from Operations
Comparison of the years ended December 31, 2020 and 2019:
Our revenues changed as summarized in the following table:
(in thousands) 2020 2019 Change Lease income $ 980,166 1,094,301 (114,135)Other property income 9,508 9,201 307 Management, transaction, and other fees 26,501 29,636 (3,135)
Total revenues $ 1,016,175 1,133,138 (116,963)
Lease income decreased $114.1 million, driven by the following contractually billable components of rent to the tenants per the lease agreements:
$105.1 million decrease from recognizing additional Uncollectible lease income, consisting of $28.1 million increase in uncollectible Straight-linerent receivables and $77.0 million increase in uncollectible billable tenant receivables. The pandemic has been most impactful to those tenantsconsidered non-essential by governmental authorities. The current economic environment has resulted in changes in our expectations of collectingcertain tenant receivables and their related future contracted rent increases previously recognized through straight-line rent. Approximately 92% ofPro-rata base rent billed for the three months ended December 31, 2020, has been collected as of February 8, 2021.
$5.7 million decrease from billable Base rent, as follows:
• $1.6 million increase from rent commencing at development properties; and
• $6.2 million net increase primarily from acquisitions of operating properties; reduced by
• $2.0 million net decrease from same properties due to the loss of rents from tenant move-outs and bankruptcies and rental rate declines,offset by increases from contracted rent increases in existing leases; and
• $11.5 million decrease from the sale of operating properties.
$3.2 million decrease in Above and below market rent primarily from the sale of operating properties.
$1.6 million increase in Other lease income from higher lease termination fees.
$1.4 million decrease in Percentage rent due to lower sales in this pandemic environment by certain tenants.
$361,000 remaining net decrease driven primarily by a reduction in straight-line rent.
Management, transaction and other fees decreased $3.1 million primarily from decreases in development, construction management, and propertymanagement fees from projects within our unconsolidated partnerships. Two development projects within our unconsolidated partnerships completedduring 2019, resulting in reduced development fees in 2020. Additionally, decreases in property rent collections during this pandemic have negativelyimpacted our property management income earned from our unconsolidated partnerships.
Changes in our operating expenses are summarized in the following table:
(in thousands) 2020 2019 Change Depreciation and amortization $ 345,900 374,283 (28,383)Operating and maintenance 170,073 169,909 164 General and administrative 75,001 74,984 17 Real estate taxes 143,004 136,236 6,768 Other operating expenses 12,642 7,814 4,828
Total operating expenses $ 746,620 763,226 (16,606)
Depreciation and amortization costs changed as follows:
• $2.0 million increase as we began depreciating costs at development properties where tenant spaces were completed and became available foroccupancy; and
43
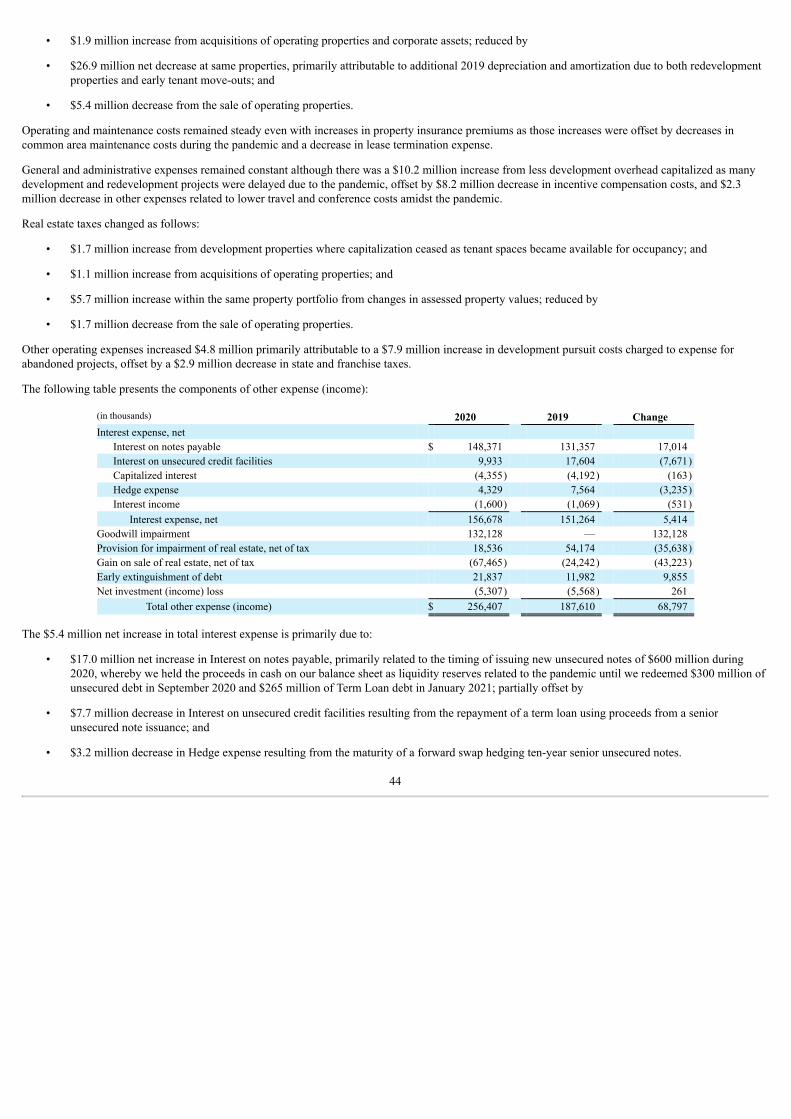
• $1.9 million increase from acquisitions of operating properties and corporate assets; reduced by
• $26.9 million net decrease at same properties, primarily attributable to additional 2019 depreciation and amortization due to both redevelopmentproperties and early tenant move-outs; and
• $5.4 million decrease from the sale of operating properties.
Operating and maintenance costs remained steady even with increases in property insurance premiums as those increases were offset by decreases incommon area maintenance costs during the pandemic and a decrease in lease termination expense.
General and administrative expenses remained constant although there was a $10.2 million increase from less development overhead capitalized as manydevelopment and redevelopment projects were delayed due to the pandemic, offset by $8.2 million decrease in incentive compensation costs, and $2.3million decrease in other expenses related to lower travel and conference costs amidst the pandemic.
Real estate taxes changed as follows:
• $1.7 million increase from development properties where capitalization ceased as tenant spaces became available for occupancy; and
• $1.1 million increase from acquisitions of operating properties; and
• $5.7 million increase within the same property portfolio from changes in assessed property values; reduced by
• $1.7 million decrease from the sale of operating properties.
Other operating expenses increased $4.8 million primarily attributable to a $7.9 million increase in development pursuit costs charged to expense forabandoned projects, offset by a $2.9 million decrease in state and franchise taxes.
The following table presents the components of other expense (income):
(in thousands) 2020 2019 Change Interest expense, net
Interest on notes payable $ 148,371 131,357 17,014 Interest on unsecured credit facilities 9,933 17,604 (7,671)Capitalized interest (4,355) (4,192) (163)Hedge expense 4,329 7,564 (3,235)Interest income (1,600) (1,069) (531)
Interest expense, net 156,678 151,264 5,414 Goodwill impairment 132,128 — 132,128 Provision for impairment of real estate, net of tax 18,536 54,174 (35,638)Gain on sale of real estate, net of tax (67,465) (24,242) (43,223)Early extinguishment of debt 21,837 11,982 9,855 Net investment (income) loss (5,307) (5,568) 261
Total other expense (income) $ 256,407 187,610 68,797
The $5.4 million net increase in total interest expense is primarily due to:
• $17.0 million net increase in Interest on notes payable, primarily related to the timing of issuing new unsecured notes of $600 million during2020, whereby we held the proceeds in cash on our balance sheet as liquidity reserves related to the pandemic until we redeemed $300 million ofunsecured debt in September 2020 and $265 million of Term Loan debt in January 2021; partially offset by
• $7.7 million decrease in Interest on unsecured credit facilities resulting from the repayment of a term loan using proceeds from a seniorunsecured note issuance; and
• $3.2 million decrease in Hedge expense resulting from the maturity of a forward swap hedging ten-year senior unsecured notes.
44
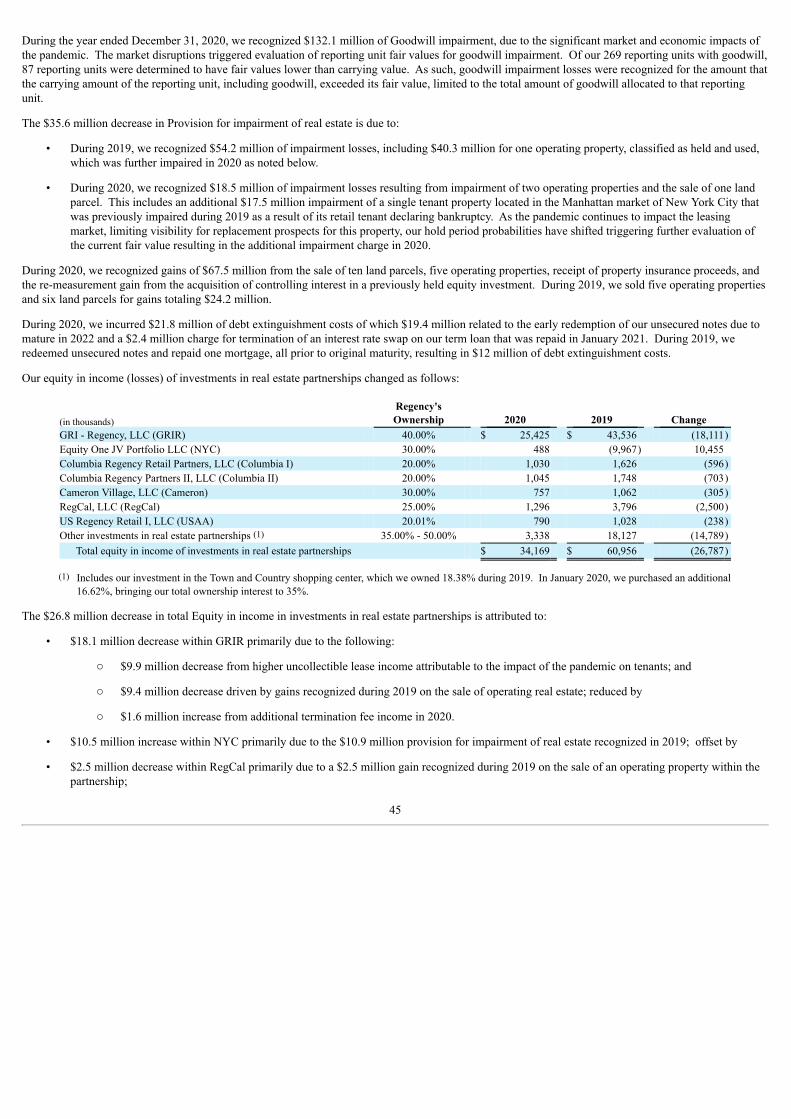
During the year ended December 31, 2020, we recognized $132.1 million of Goodwill impairment, due to the significant market and economic impacts ofthe pandemic. The market disruptions triggered evaluation of reporting unit fair values for goodwill impairment. Of our 269 reporting units with goodwill,87 reporting units were determined to have fair values lower than carrying value. As such, goodwill impairment losses were recognized for the amount thatthe carrying amount of the reporting unit, including goodwill, exceeded its fair value, limited to the total amount of goodwill allocated to that reportingunit.
The $35.6 million decrease in Provision for impairment of real estate is due to:
• During 2019, we recognized $54.2 million of impairment losses, including $40.3 million for one operating property, classified as held and used,which was further impaired in 2020 as noted below.
• During 2020, we recognized $18.5 million of impairment losses resulting from impairment of two operating properties and the sale of one landparcel. This includes an additional $17.5 million impairment of a single tenant property located in the Manhattan market of New York City thatwas previously impaired during 2019 as a result of its retail tenant declaring bankruptcy. As the pandemic continues to impact the leasingmarket, limiting visibility for replacement prospects for this property, our hold period probabilities have shifted triggering further evaluation ofthe current fair value resulting in the additional impairment charge in 2020.
During 2020, we recognized gains of $67.5 million from the sale of ten land parcels, five operating properties, receipt of property insurance proceeds, andthe re-measurement gain from the acquisition of controlling interest in a previously held equity investment. During 2019, we sold five operating propertiesand six land parcels for gains totaling $24.2 million.
During 2020, we incurred $21.8 million of debt extinguishment costs of which $19.4 million related to the early redemption of our unsecured notes due tomature in 2022 and a $2.4 million charge for termination of an interest rate swap on our term loan that was repaid in January 2021. During 2019, weredeemed unsecured notes and repaid one mortgage, all prior to original maturity, resulting in $12 million of debt extinguishment costs.
Our equity in income (losses) of investments in real estate partnerships changed as follows:
(in thousands) Regency'sOwnership 2020 2019 Change
GRI - Regency, LLC (GRIR) 40.00% $ 25,425 $ 43,536 (18,111)Equity One JV Portfolio LLC (NYC) 30.00% 488 (9,967) 10,455 Columbia Regency Retail Partners, LLC (Columbia I) 20.00% 1,030 1,626 (596)Columbia Regency Partners II, LLC (Columbia II) 20.00% 1,045 1,748 (703)Cameron Village, LLC (Cameron) 30.00% 757 1,062 (305)RegCal, LLC (RegCal) 25.00% 1,296 3,796 (2,500)US Regency Retail I, LLC (USAA) 20.01% 790 1,028 (238)Other investments in real estate partnerships (1) 35.00% - 50.00% 3,338 18,127 (14,789)
Total equity in income of investments in real estate partnerships $ 34,169 $ 60,956 (26,787)
(1) Includes our investment in the Town and Country shopping center, which we owned 18.38% during 2019. In January 2020, we purchased an additional16.62%, bringing our total ownership interest to 35%.
The $26.8 million decrease in total Equity in income in investments in real estate partnerships is attributed to:
• $18.1 million decrease within GRIR primarily due to the following:
o $9.9 million decrease from higher uncollectible lease income attributable to the impact of the pandemic on tenants; and
o $9.4 million decrease driven by gains recognized during 2019 on the sale of operating real estate; reduced by
o $1.6 million increase from additional termination fee income in 2020.
• $10.5 million increase within NYC primarily due to the $10.9 million provision for impairment of real estate recognized in 2019; offset by
• $2.5 million decrease within RegCal primarily due to a $2.5 million gain recognized during 2019 on the sale of an operating property within thepartnership;
45
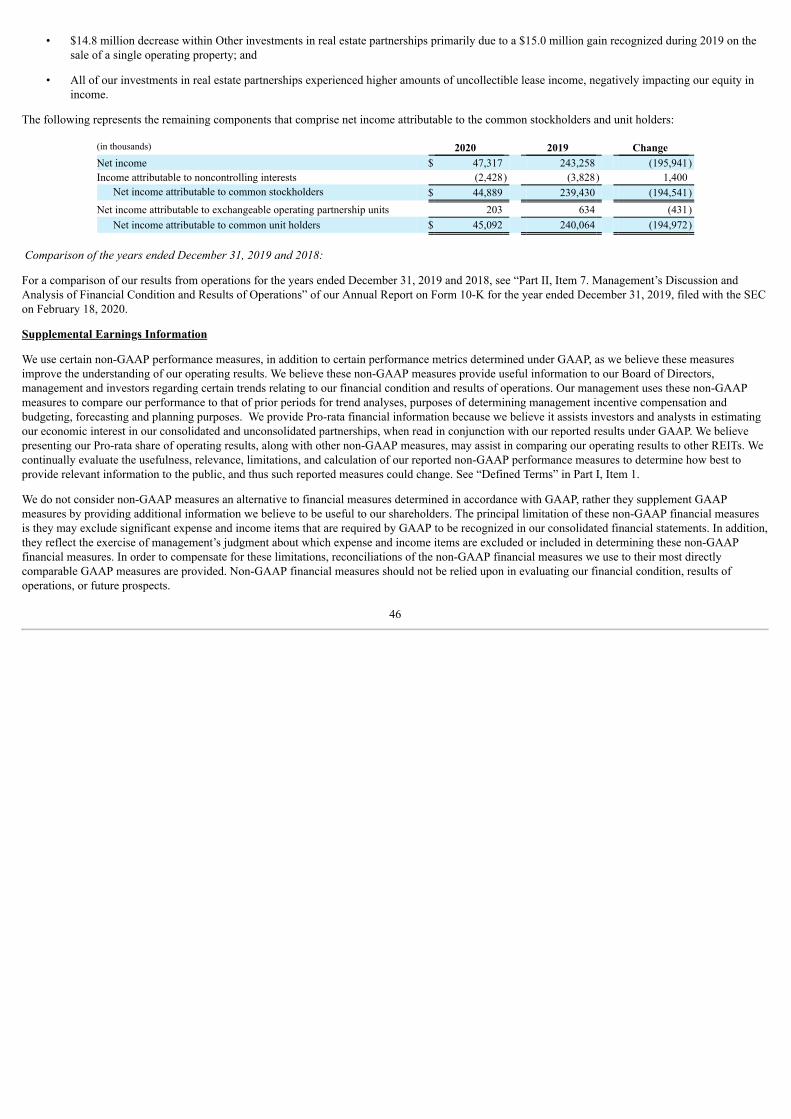
• $14.8 million decrease within Other investments in real estate partnerships primarily due to a $15.0 million gain recognized during 2019 on thesale of a single operating property; and
• All of our investments in real estate partnerships experienced higher amounts of uncollectible lease income, negatively impacting our equity inincome.
The following represents the remaining components that comprise net income attributable to the common stockholders and unit holders:
(in thousands) 2020 2019 Change Net income $ 47,317 243,258 (195,941)Income attributable to noncontrolling interests (2,428) (3,828) 1,400
Net income attributable to common stockholders $ 44,889 239,430 (194,541)Net income attributable to exchangeable operating partnership units 203 634 (431)
Net income attributable to common unit holders $ 45,092 240,064 (194,972)
Comparison of the years ended December 31, 2019 and 2018:
For a comparison of our results from operations for the years ended December 31, 2019 and 2018, see “Part II, Item 7. Management’s Discussion andAnalysis of Financial Condition and Results of Operations” of our Annual Report on Form 10-K for the year ended December 31, 2019, filed with the SECon February 18, 2020.
Supplemental Earnings Information
We use certain non-GAAP performance measures, in addition to certain performance metrics determined under GAAP, as we believe these measuresimprove the understanding of our operating results. We believe these non-GAAP measures provide useful information to our Board of Directors,management and investors regarding certain trends relating to our financial condition and results of operations. Our management uses these non-GAAPmeasures to compare our performance to that of prior periods for trend analyses, purposes of determining management incentive compensation andbudgeting, forecasting and planning purposes. We provide Pro-rata financial information because we believe it assists investors and analysts in estimatingour economic interest in our consolidated and unconsolidated partnerships, when read in conjunction with our reported results under GAAP. We believepresenting our Pro-rata share of operating results, along with other non-GAAP measures, may assist in comparing our operating results to other REITs. Wecontinually evaluate the usefulness, relevance, limitations, and calculation of our reported non-GAAP performance measures to determine how best toprovide relevant information to the public, and thus such reported measures could change. See “Defined Terms” in Part I, Item 1.
We do not consider non-GAAP measures an alternative to financial measures determined in accordance with GAAP, rather they supplement GAAPmeasures by providing additional information we believe to be useful to our shareholders. The principal limitation of these non-GAAP financial measuresis they may exclude significant expense and income items that are required by GAAP to be recognized in our consolidated financial statements. In addition,they reflect the exercise of management’s judgment about which expense and income items are excluded or included in determining these non-GAAPfinancial measures. In order to compensate for these limitations, reconciliations of the non-GAAP financial measures we use to their most directlycomparable GAAP measures are provided. Non-GAAP financial measures should not be relied upon in evaluating our financial condition, results ofoperations, or future prospects.
46
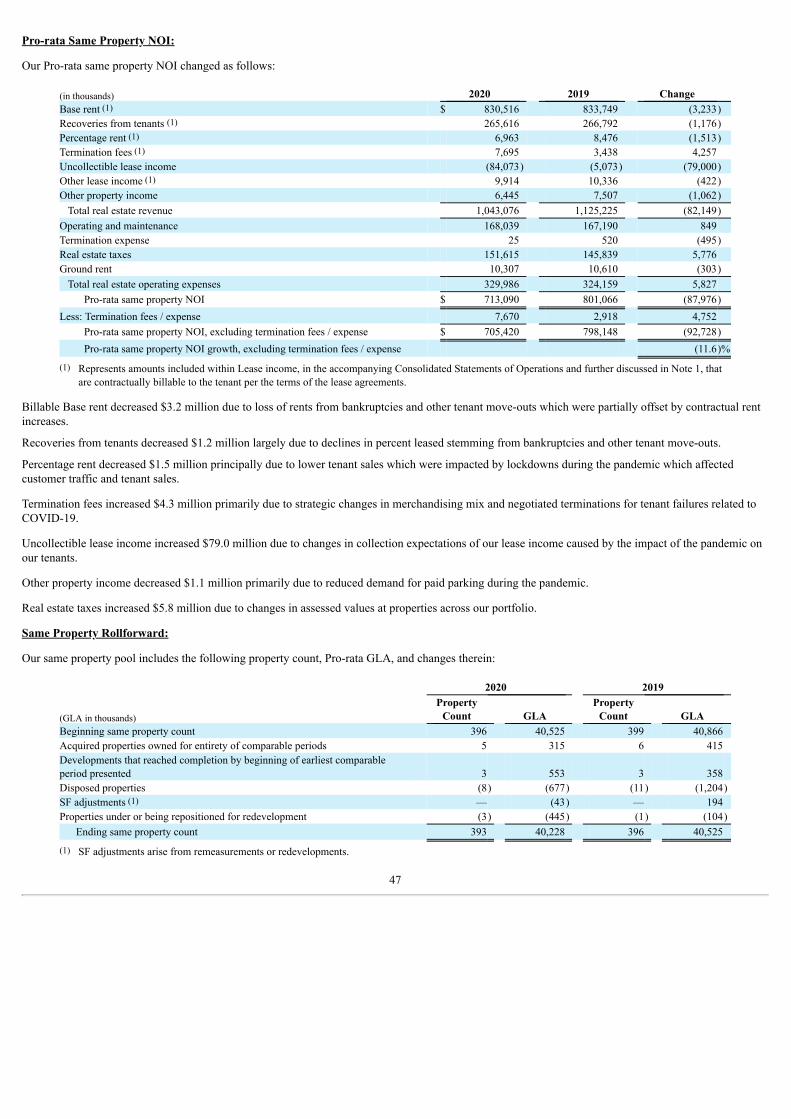
Pro-rata Same Property NOI:
Our Pro-rata same property NOI changed as follows:
(in thousands) 2020 2019 Change Base rent (1) $ 830,516 833,749 (3,233)Recoveries from tenants (1) 265,616 266,792 (1,176)Percentage rent (1) 6,963 8,476 (1,513)Termination fees (1) 7,695 3,438 4,257 Uncollectible lease income (84,073) (5,073) (79,000)Other lease income (1) 9,914 10,336 (422)Other property income 6,445 7,507 (1,062)
Total real estate revenue 1,043,076 1,125,225 (82,149)Operating and maintenance 168,039 167,190 849 Termination expense 25 520 (495)Real estate taxes 151,615 145,839 5,776 Ground rent 10,307 10,610 (303)
Total real estate operating expenses 329,986 324,159 5,827 Pro-rata same property NOI $ 713,090 801,066 (87,976)
Less: Termination fees / expense 7,670 2,918 4,752 Pro-rata same property NOI, excluding termination fees / expense $ 705,420 798,148 (92,728)Pro-rata same property NOI growth, excluding termination fees / expense (11.6)%
(1) Represents amounts included within Lease income, in the accompanying Consolidated Statements of Operations and further discussed in Note 1, thatare contractually billable to the tenant per the terms of the lease agreements.
Billable Base rent decreased $3.2 million due to loss of rents from bankruptcies and other tenant move-outs which were partially offset by contractual rentincreases.
Recoveries from tenants decreased $1.2 million largely due to declines in percent leased stemming from bankruptcies and other tenant move-outs.
Percentage rent decreased $1.5 million principally due to lower tenant sales which were impacted by lockdowns during the pandemic which affectedcustomer traffic and tenant sales.
Termination fees increased $4.3 million primarily due to strategic changes in merchandising mix and negotiated terminations for tenant failures related toCOVID-19.
Uncollectible lease income increased $79.0 million due to changes in collection expectations of our lease income caused by the impact of the pandemic onour tenants.
Other property income decreased $1.1 million primarily due to reduced demand for paid parking during the pandemic.
Real estate taxes increased $5.8 million due to changes in assessed values at properties across our portfolio.
Same Property Rollforward:
Our same property pool includes the following property count, Pro-rata GLA, and changes therein:
2020 2019
(GLA in thousands) Property
Count GLA Property
Count GLA Beginning same property count 396 40,525 399 40,866 Acquired properties owned for entirety of comparable periods 5 315 6 415 Developments that reached completion by beginning of earliest comparableperiod presented 3 553 3 358 Disposed properties (8) (677) (11) (1,204)SF adjustments (1) — (43) — 194 Properties under or being repositioned for redevelopment (3) (445) (1) (104)
Ending same property count 393 40,228 396 40,525
(1) SF adjustments arise from remeasurements or redevelopments.
47
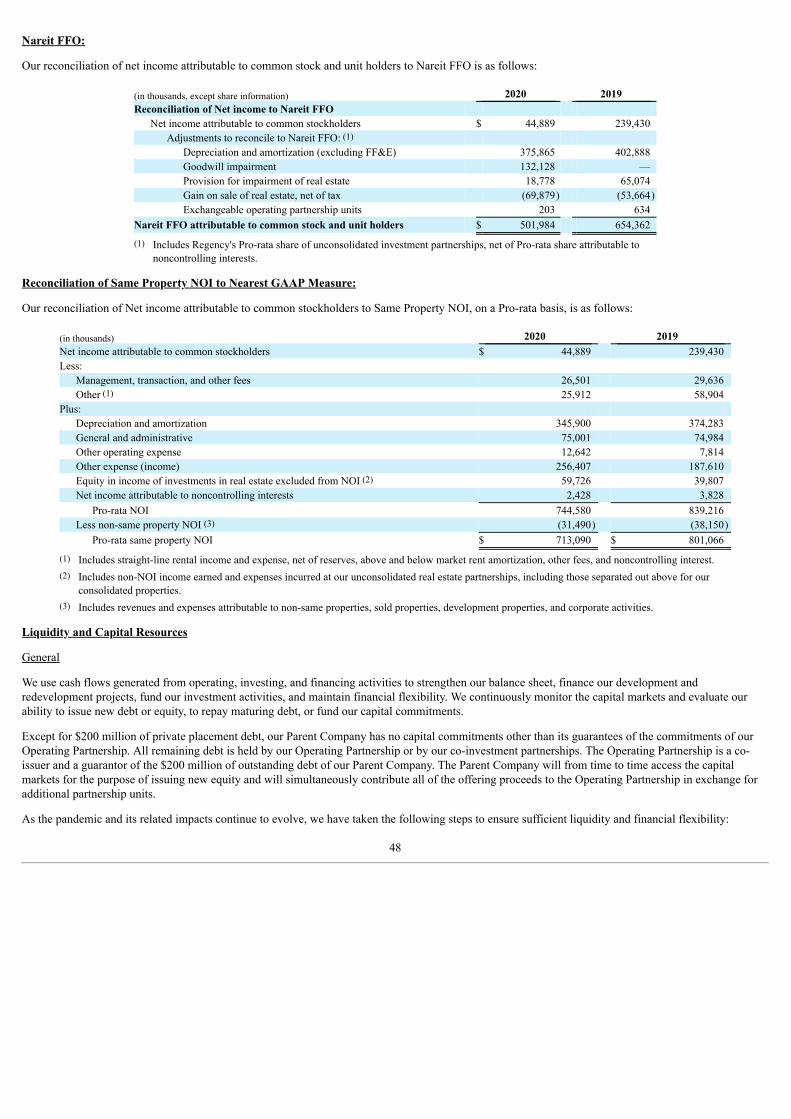
Nareit FFO:
Our reconciliation of net income attributable to common stock and unit holders to Nareit FFO is as follows:
(in thousands, except share information) 2020 2019 Reconciliation of Net income to Nareit FFO
Net income attributable to common stockholders $ 44,889 239,430 Adjustments to reconcile to Nareit FFO: (1)
Depreciation and amortization (excluding FF&E) 375,865 402,888 Goodwill impairment 132,128 — Provision for impairment of real estate 18,778 65,074 Gain on sale of real estate, net of tax (69,879) (53,664)Exchangeable operating partnership units 203 634
Nareit FFO attributable to common stock and unit holders $ 501,984 654,362
(1) Includes Regency's Pro-rata share of unconsolidated investment partnerships, net of Pro-rata share attributable tononcontrolling interests.
Reconciliation of Same Property NOI to Nearest GAAP Measure:
Our reconciliation of Net income attributable to common stockholders to Same Property NOI, on a Pro-rata basis, is as follows:
(in thousands) 2020 2019 Net income attributable to common stockholders $ 44,889 239,430 Less:
Management, transaction, and other fees 26,501 29,636 Other (1) 25,912 58,904
Plus: Depreciation and amortization 345,900 374,283 General and administrative 75,001 74,984 Other operating expense 12,642 7,814 Other expense (income) 256,407 187,610 Equity in income of investments in real estate excluded from NOI (2) 59,726 39,807 Net income attributable to noncontrolling interests 2,428 3,828
Pro-rata NOI 744,580 839,216 Less non-same property NOI (3) (31,490) (38,150)
Pro-rata same property NOI $ 713,090 $ 801,066
(1) Includes straight-line rental income and expense, net of reserves, above and below market rent amortization, other fees, and noncontrolling interest. (2) Includes non-NOI income earned and expenses incurred at our unconsolidated real estate partnerships, including those separated out above for our
consolidated properties.
(3) Includes revenues and expenses attributable to non-same properties, sold properties, development properties, and corporate activities.
Liquidity and Capital Resources
General
We use cash flows generated from operating, investing, and financing activities to strengthen our balance sheet, finance our development andredevelopment projects, fund our investment activities, and maintain financial flexibility. We continuously monitor the capital markets and evaluate ourability to issue new debt or equity, to repay maturing debt, or fund our capital commitments.
Except for $200 million of private placement debt, our Parent Company has no capital commitments other than its guarantees of the commitments of ourOperating Partnership. All remaining debt is held by our Operating Partnership or by our co-investment partnerships. The Operating Partnership is a co-issuer and a guarantor of the $200 million of outstanding debt of our Parent Company. The Parent Company will from time to time access the capitalmarkets for the purpose of issuing new equity and will simultaneously contribute all of the offering proceeds to the Operating Partnership in exchange foradditional partnership units.
As the pandemic and its related impacts continue to evolve, we have taken the following steps to ensure sufficient liquidity and financial flexibility:
48
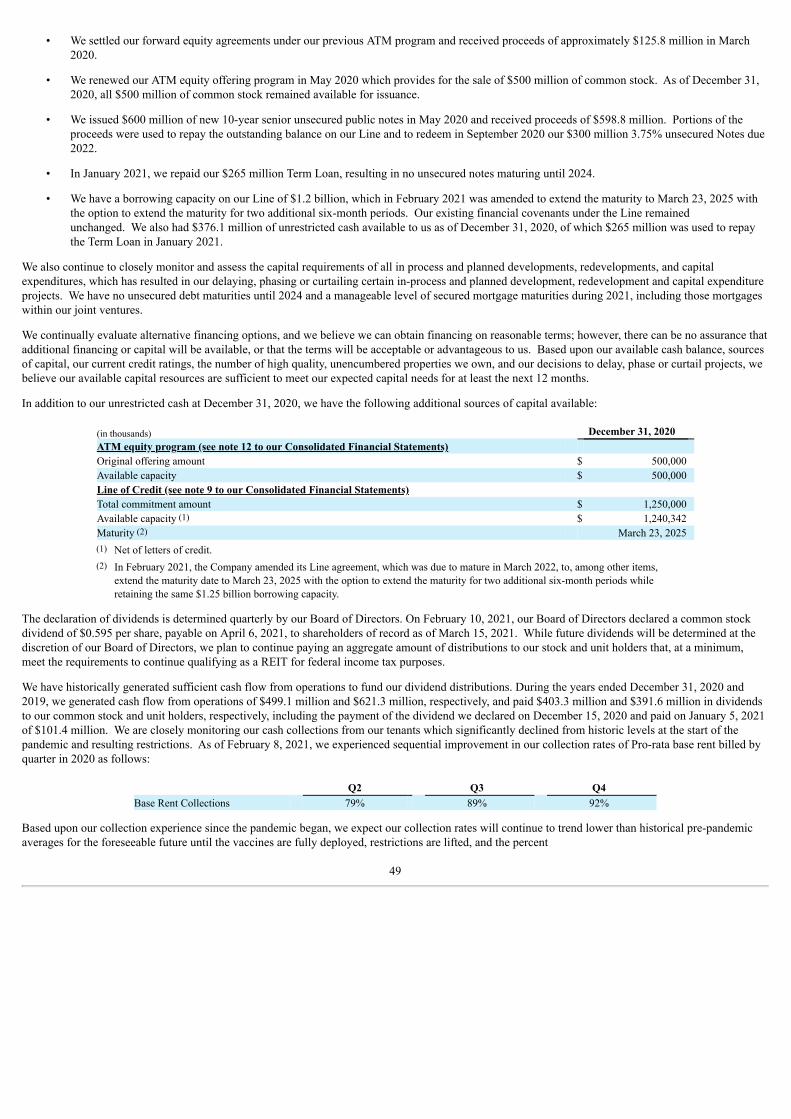
• We settled our forward equity agreements under our previous ATM program and received proceeds of approximately $125.8 million in March2020.
• We renewed our ATM equity offering program in May 2020 which provides for the sale of $500 million of common stock. As of December 31,2020, all $500 million of common stock remained available for issuance.
• We issued $600 million of new 10-year senior unsecured public notes in May 2020 and received proceeds of $598.8 million. Portions of theproceeds were used to repay the outstanding balance on our Line and to redeem in September 2020 our $300 million 3.75% unsecured Notes due2022.
• In January 2021, we repaid our $265 million Term Loan, resulting in no unsecured notes maturing until 2024.
• We have a borrowing capacity on our Line of $1.2 billion, which in February 2021 was amended to extend the maturity to March 23, 2025 withthe option to extend the maturity for two additional six-month periods. Our existing financial covenants under the Line remainedunchanged. We also had $376.1 million of unrestricted cash available to us as of December 31, 2020, of which $265 million was used to repaythe Term Loan in January 2021.
We also continue to closely monitor and assess the capital requirements of all in process and planned developments, redevelopments, and capitalexpenditures, which has resulted in our delaying, phasing or curtailing certain in-process and planned development, redevelopment and capital expenditureprojects. We have no unsecured debt maturities until 2024 and a manageable level of secured mortgage maturities during 2021, including those mortgageswithin our joint ventures.
We continually evaluate alternative financing options, and we believe we can obtain financing on reasonable terms; however, there can be no assurance thatadditional financing or capital will be available, or that the terms will be acceptable or advantageous to us. Based upon our available cash balance, sourcesof capital, our current credit ratings, the number of high quality, unencumbered properties we own, and our decisions to delay, phase or curtail projects, webelieve our available capital resources are sufficient to meet our expected capital needs for at least the next 12 months.
In addition to our unrestricted cash at December 31, 2020, we have the following additional sources of capital available:
(in thousands) December 31, 2020 ATM equity program (see note 12 to our Consolidated Financial Statements) Original offering amount $ 500,000 Available capacity $ 500,000 Line of Credit (see note 9 to our Consolidated Financial Statements) Total commitment amount $ 1,250,000 Available capacity (1) $ 1,240,342 Maturity (2) March 23, 2025
(1) Net of letters of credit. (2) In February 2021, the Company amended its Line agreement, which was due to mature in March 2022, to, among other items,
extend the maturity date to March 23, 2025 with the option to extend the maturity for two additional six-month periods whileretaining the same $1.25 billion borrowing capacity.
The declaration of dividends is determined quarterly by our Board of Directors. On February 10, 2021, our Board of Directors declared a common stockdividend of $0.595 per share, payable on April 6, 2021, to shareholders of record as of March 15, 2021. While future dividends will be determined at thediscretion of our Board of Directors, we plan to continue paying an aggregate amount of distributions to our stock and unit holders that, at a minimum,meet the requirements to continue qualifying as a REIT for federal income tax purposes.
We have historically generated sufficient cash flow from operations to fund our dividend distributions. During the years ended December 31, 2020 and2019, we generated cash flow from operations of $499.1 million and $621.3 million, respectively, and paid $403.3 million and $391.6 million in dividendsto our common stock and unit holders, respectively, including the payment of the dividend we declared on December 15, 2020 and paid on January 5, 2021of $101.4 million. We are closely monitoring our cash collections from our tenants which significantly declined from historic levels at the start of thepandemic and resulting restrictions. As of February 8, 2021, we experienced sequential improvement in our collection rates of Pro-rata base rent billed byquarter in 2020 as follows:
Q2 Q3 Q4 Base Rent Collections 79% 89% 92%
Based upon our collection experience since the pandemic began, we expect our collection rates will continue to trend lower than historical pre-pandemicaverages for the foreseeable future until the vaccines are fully deployed, restrictions are lifted, and the percent
49
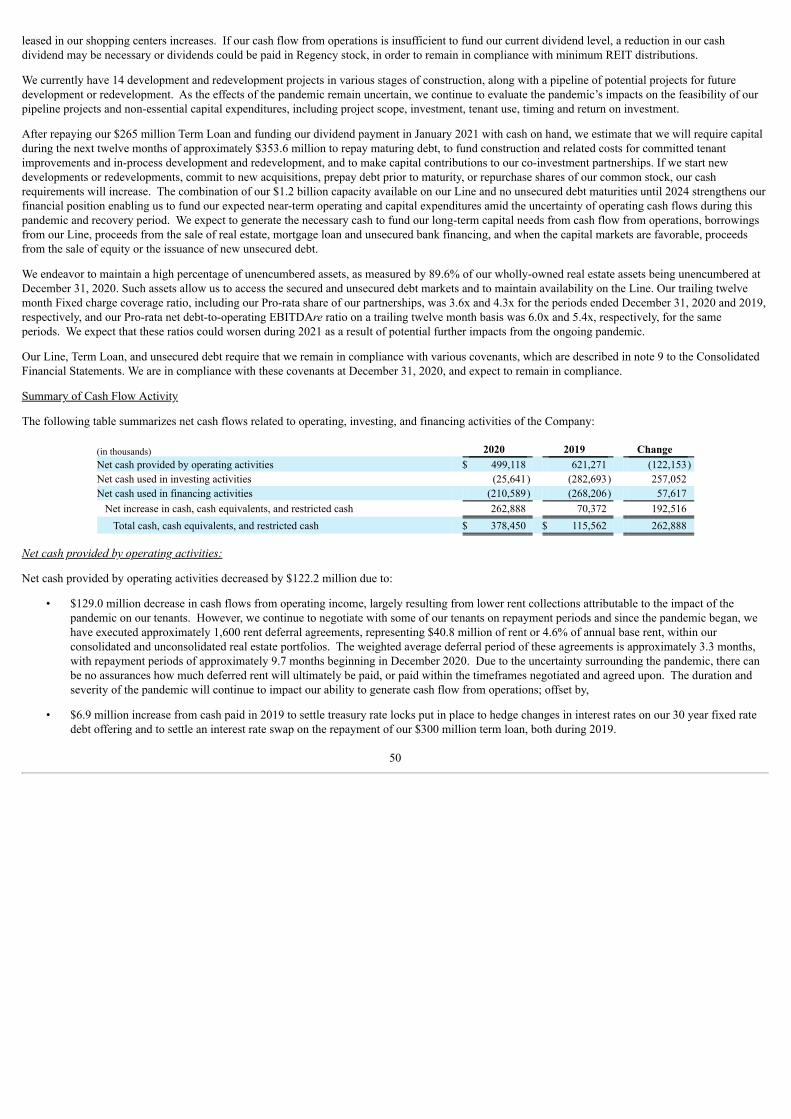
leased in our shopping centers increases. If our cash flow from operations is insufficient to fund our current dividend level, a reduction in our cashdividend may be necessary or dividends could be paid in Regency stock, in order to remain in compliance with minimum REIT distributions.
We currently have 14 development and redevelopment projects in various stages of construction, along with a pipeline of potential projects for futuredevelopment or redevelopment. As the effects of the pandemic remain uncertain, we continue to evaluate the pandemic’s impacts on the feasibility of ourpipeline projects and non-essential capital expenditures, including project scope, investment, tenant use, timing and return on investment.
After repaying our $265 million Term Loan and funding our dividend payment in January 2021 with cash on hand, we estimate that we will require capitalduring the next twelve months of approximately $353.6 million to repay maturing debt, to fund construction and related costs for committed tenantimprovements and in-process development and redevelopment, and to make capital contributions to our co-investment partnerships. If we start newdevelopments or redevelopments, commit to new acquisitions, prepay debt prior to maturity, or repurchase shares of our common stock, our cashrequirements will increase. The combination of our $1.2 billion capacity available on our Line and no unsecured debt maturities until 2024 strengthens ourfinancial position enabling us to fund our expected near-term operating and capital expenditures amid the uncertainty of operating cash flows during thispandemic and recovery period. We expect to generate the necessary cash to fund our long-term capital needs from cash flow from operations, borrowingsfrom our Line, proceeds from the sale of real estate, mortgage loan and unsecured bank financing, and when the capital markets are favorable, proceedsfrom the sale of equity or the issuance of new unsecured debt.
We endeavor to maintain a high percentage of unencumbered assets, as measured by 89.6% of our wholly-owned real estate assets being unencumbered atDecember 31, 2020. Such assets allow us to access the secured and unsecured debt markets and to maintain availability on the Line. Our trailing twelvemonth Fixed charge coverage ratio, including our Pro-rata share of our partnerships, was 3.6x and 4.3x for the periods ended December 31, 2020 and 2019,respectively, and our Pro-rata net debt-to-operating EBITDAre ratio on a trailing twelve month basis was 6.0x and 5.4x, respectively, for the sameperiods. We expect that these ratios could worsen during 2021 as a result of potential further impacts from the ongoing pandemic.
Our Line, Term Loan, and unsecured debt require that we remain in compliance with various covenants, which are described in note 9 to the ConsolidatedFinancial Statements. We are in compliance with these covenants at December 31, 2020, and expect to remain in compliance.
Summary of Cash Flow Activity
The following table summarizes net cash flows related to operating, investing, and financing activities of the Company:
(in thousands) 2020 2019 Change Net cash provided by operating activities $ 499,118 621,271 (122,153)Net cash used in investing activities (25,641) (282,693) 257,052 Net cash used in financing activities (210,589) (268,206) 57,617
Net increase in cash, cash equivalents, and restricted cash 262,888 70,372 192,516 Total cash, cash equivalents, and restricted cash $ 378,450 $ 115,562 262,888
Net cash provided by operating activities:
Net cash provided by operating activities decreased by $122.2 million due to:
• $129.0 million decrease in cash flows from operating income, largely resulting from lower rent collections attributable to the impact of thepandemic on our tenants. However, we continue to negotiate with some of our tenants on repayment periods and since the pandemic began, wehave executed approximately 1,600 rent deferral agreements, representing $40.8 million of rent or 4.6% of annual base rent, within ourconsolidated and unconsolidated real estate portfolios. The weighted average deferral period of these agreements is approximately 3.3 months,with repayment periods of approximately 9.7 months beginning in December 2020. Due to the uncertainty surrounding the pandemic, there canbe no assurances how much deferred rent will ultimately be paid, or paid within the timeframes negotiated and agreed upon. The duration andseverity of the pandemic will continue to impact our ability to generate cash flow from operations; offset by,
• $6.9 million increase from cash paid in 2019 to settle treasury rate locks put in place to hedge changes in interest rates on our 30 year fixed ratedebt offering and to settle an interest rate swap on the repayment of our $300 million term loan, both during 2019.
50
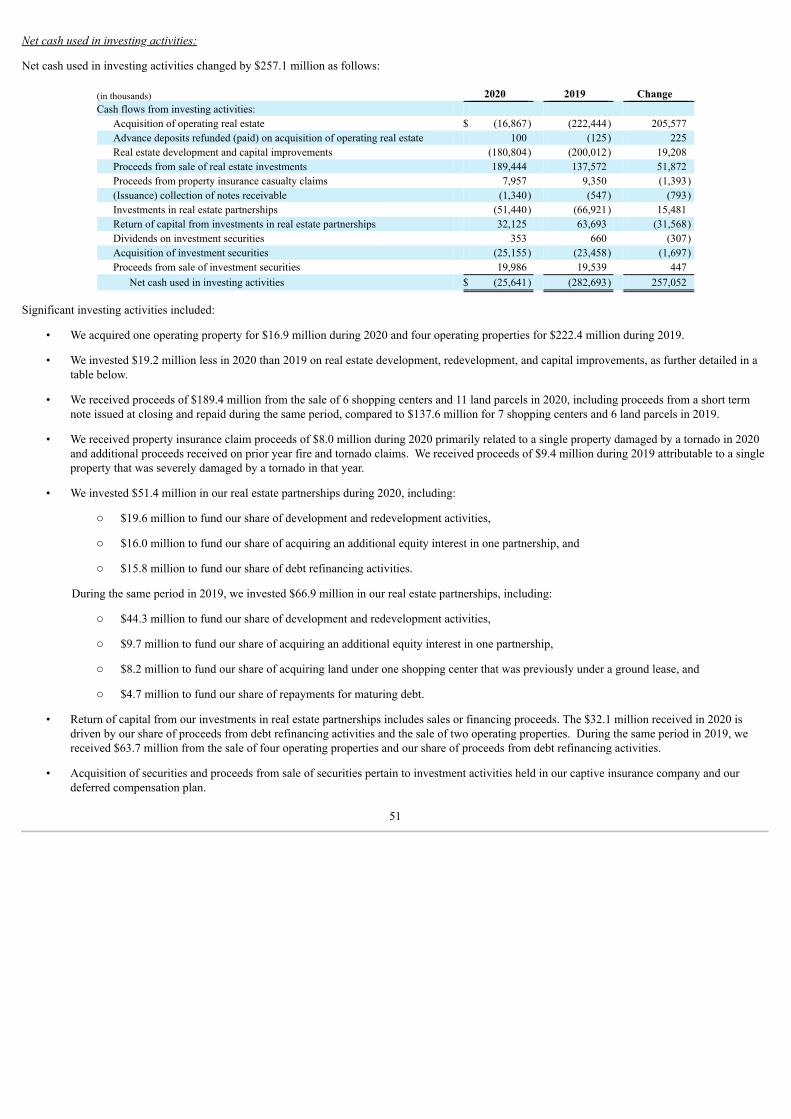
Net cash used in investing activities:
Net cash used in investing activities changed by $257.1 million as follows:
(in thousands) 2020 2019 Change Cash flows from investing activities:
Acquisition of operating real estate $ (16,867) (222,444) 205,577 Advance deposits refunded (paid) on acquisition of operating real estate 100 (125) 225 Real estate development and capital improvements (180,804) (200,012) 19,208 Proceeds from sale of real estate investments 189,444 137,572 51,872 Proceeds from property insurance casualty claims 7,957 9,350 (1,393)(Issuance) collection of notes receivable (1,340) (547) (793)Investments in real estate partnerships (51,440) (66,921) 15,481 Return of capital from investments in real estate partnerships 32,125 63,693 (31,568)Dividends on investment securities 353 660 (307)Acquisition of investment securities (25,155) (23,458) (1,697)Proceeds from sale of investment securities 19,986 19,539 447
Net cash used in investing activities $ (25,641) (282,693) 257,052
Significant investing activities included:
• We acquired one operating property for $16.9 million during 2020 and four operating properties for $222.4 million during 2019.
• We invested $19.2 million less in 2020 than 2019 on real estate development, redevelopment, and capital improvements, as further detailed in atable below.
• We received proceeds of $189.4 million from the sale of 6 shopping centers and 11 land parcels in 2020, including proceeds from a short termnote issued at closing and repaid during the same period, compared to $137.6 million for 7 shopping centers and 6 land parcels in 2019.
• We received property insurance claim proceeds of $8.0 million during 2020 primarily related to a single property damaged by a tornado in 2020and additional proceeds received on prior year fire and tornado claims. We received proceeds of $9.4 million during 2019 attributable to a singleproperty that was severely damaged by a tornado in that year.
• We invested $51.4 million in our real estate partnerships during 2020, including:
o $19.6 million to fund our share of development and redevelopment activities,
o $16.0 million to fund our share of acquiring an additional equity interest in one partnership, and
o $15.8 million to fund our share of debt refinancing activities.
During the same period in 2019, we invested $66.9 million in our real estate partnerships, including:
o $44.3 million to fund our share of development and redevelopment activities,
o $9.7 million to fund our share of acquiring an additional equity interest in one partnership,
o $8.2 million to fund our share of acquiring land under one shopping center that was previously under a ground lease, and
o $4.7 million to fund our share of repayments for maturing debt.
• Return of capital from our investments in real estate partnerships includes sales or financing proceeds. The $32.1 million received in 2020 isdriven by our share of proceeds from debt refinancing activities and the sale of two operating properties. During the same period in 2019, wereceived $63.7 million from the sale of four operating properties and our share of proceeds from debt refinancing activities.
• Acquisition of securities and proceeds from sale of securities pertain to investment activities held in our captive insurance company and ourdeferred compensation plan.
51
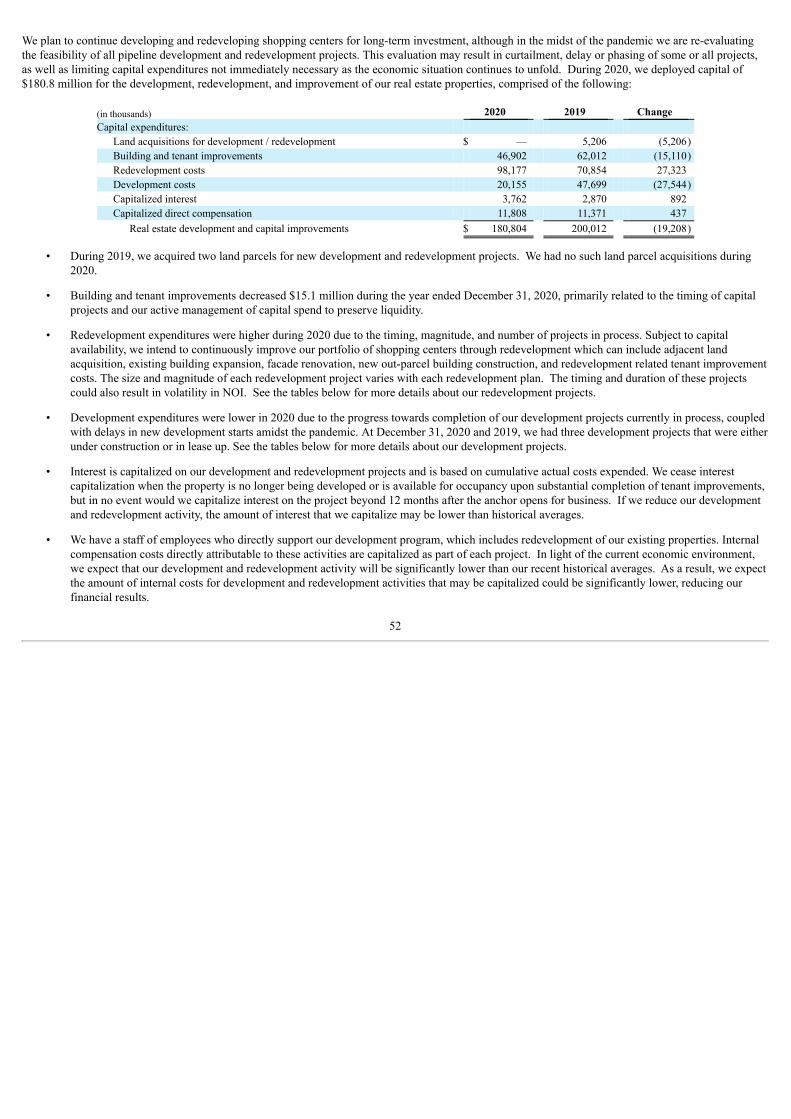
We plan to continue developing and redeveloping shopping centers for long-term investment, although in the midst of the pandemic we are re-evaluatingthe feasibility of all pipeline development and redevelopment projects. This evaluation may result in curtailment, delay or phasing of some or all projects,as well as limiting capital expenditures not immediately necessary as the economic situation continues to unfold. During 2020, we deployed capital of$180.8 million for the development, redevelopment, and improvement of our real estate properties, comprised of the following:
(in thousands) 2020 2019 Change Capital expenditures:
Land acquisitions for development / redevelopment $ — 5,206 (5,206)Building and tenant improvements 46,902 62,012 (15,110)Redevelopment costs 98,177 70,854 27,323 Development costs 20,155 47,699 (27,544)Capitalized interest 3,762 2,870 892 Capitalized direct compensation 11,808 11,371 437
Real estate development and capital improvements $ 180,804 200,012 (19,208)
• During 2019, we acquired two land parcels for new development and redevelopment projects. We had no such land parcel acquisitions during2020.
• Building and tenant improvements decreased $15.1 million during the year ended December 31, 2020, primarily related to the timing of capitalprojects and our active management of capital spend to preserve liquidity.
• Redevelopment expenditures were higher during 2020 due to the timing, magnitude, and number of projects in process. Subject to capitalavailability, we intend to continuously improve our portfolio of shopping centers through redevelopment which can include adjacent landacquisition, existing building expansion, facade renovation, new out-parcel building construction, and redevelopment related tenant improvementcosts. The size and magnitude of each redevelopment project varies with each redevelopment plan. The timing and duration of these projectscould also result in volatility in NOI. See the tables below for more details about our redevelopment projects.
• Development expenditures were lower in 2020 due to the progress towards completion of our development projects currently in process, coupledwith delays in new development starts amidst the pandemic. At December 31, 2020 and 2019, we had three development projects that were eitherunder construction or in lease up. See the tables below for more details about our development projects.
• Interest is capitalized on our development and redevelopment projects and is based on cumulative actual costs expended. We cease interestcapitalization when the property is no longer being developed or is available for occupancy upon substantial completion of tenant improvements,but in no event would we capitalize interest on the project beyond 12 months after the anchor opens for business. If we reduce our developmentand redevelopment activity, the amount of interest that we capitalize may be lower than historical averages.
• We have a staff of employees who directly support our development program, which includes redevelopment of our existing properties. Internalcompensation costs directly attributable to these activities are capitalized as part of each project. In light of the current economic environment,we expect that our development and redevelopment activity will be significantly lower than our recent historical averages. As a result, we expectthe amount of internal costs for development and redevelopment activities that may be capitalized could be significantly lower, reducing ourfinancial results.
52
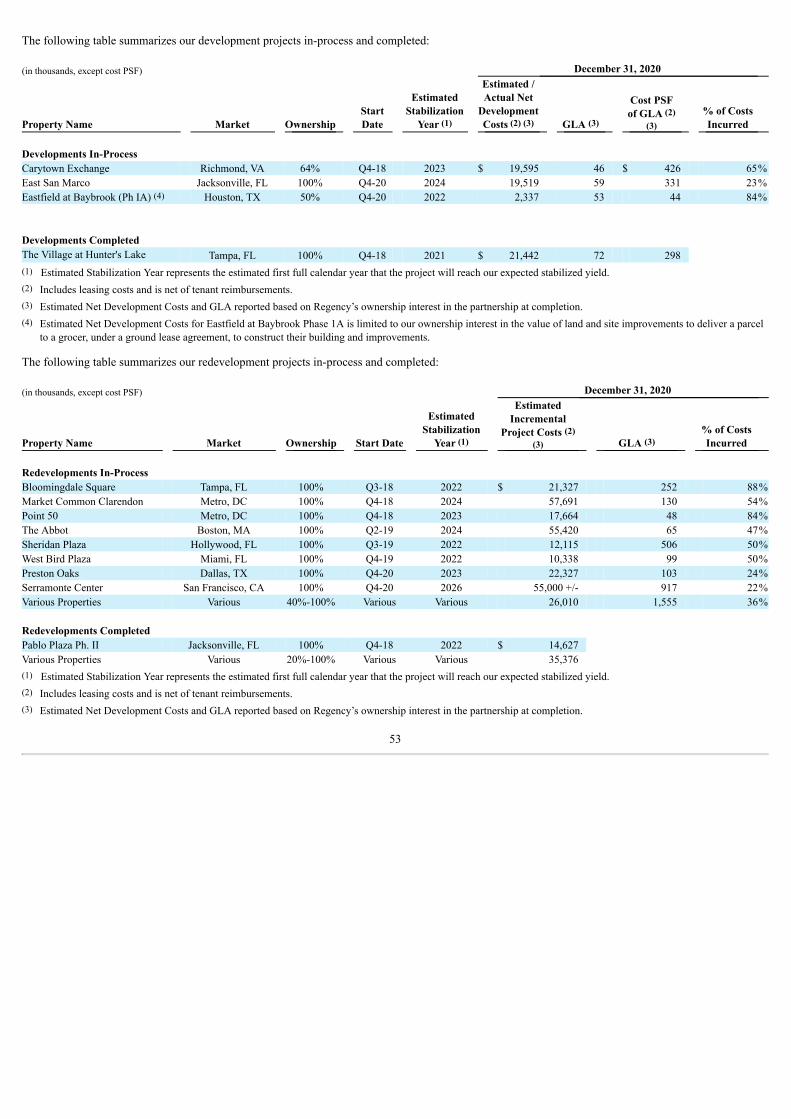
The following table summarizes our development projects in-process and completed: (in thousands, except cost PSF) December 31, 2020
Property Name Market Ownership StartDate
EstimatedStabilization
Year (1)
Estimated /Actual Net
DevelopmentCosts (2) (3) GLA (3)
Cost PSFof GLA (2)
(3) % of CostsIncurred
Developments In-Process Carytown Exchange Richmond, VA 64% Q4-18 2023 $ 19,595 46 $ 426 65%East San Marco Jacksonville, FL 100% Q4-20 2024 19,519 59 331 23%Eastfield at Baybrook (Ph IA) (4) Houston, TX 50% Q4-20 2022 2,337 53 44 84% Developments Completed The Village at Hunter's Lake Tampa, FL 100% Q4-18 2021 $ 21,442 72 298
(1) Estimated Stabilization Year represents the estimated first full calendar year that the project will reach our expected stabilized yield.(2) Includes leasing costs and is net of tenant reimbursements.(3) Estimated Net Development Costs and GLA reported based on Regency’s ownership interest in the partnership at completion.(4) Estimated Net Development Costs for Eastfield at Baybrook Phase 1A is limited to our ownership interest in the value of land and site improvements to deliver a parcel
to a grocer, under a ground lease agreement, to construct their building and improvements.
The following table summarizes our redevelopment projects in-process and completed: (in thousands, except cost PSF) December 31, 2020
Property Name Market Ownership Start Date
EstimatedStabilization
Year (1)
EstimatedIncremental
Project Costs (2)(3) GLA (3)
% of CostsIncurred
Redevelopments In-Process Bloomingdale Square Tampa, FL 100% Q3-18 2022 $ 21,327 252 88%Market Common Clarendon Metro, DC 100% Q4-18 2024 57,691 130 54%Point 50 Metro, DC 100% Q4-18 2023 17,664 48 84%The Abbot Boston, MA 100% Q2-19 2024 55,420 65 47%Sheridan Plaza Hollywood, FL 100% Q3-19 2022 12,115 506 50%West Bird Plaza Miami, FL 100% Q4-19 2022 10,338 99 50%Preston Oaks Dallas, TX 100% Q4-20 2023 22,327 103 24%Serramonte Center San Francisco, CA 100% Q4-20 2026 55,000 +/- 917 22%Various Properties Various 40%-100% Various Various 26,010 1,555 36% Redevelopments Completed Pablo Plaza Ph. II Jacksonville, FL 100% Q4-18 2022 $ 14,627 Various Properties Various 20%-100% Various Various 35,376
(1) Estimated Stabilization Year represents the estimated first full calendar year that the project will reach our expected stabilized yield.(2) Includes leasing costs and is net of tenant reimbursements.(3) Estimated Net Development Costs and GLA reported based on Regency’s ownership interest in the partnership at completion.
53
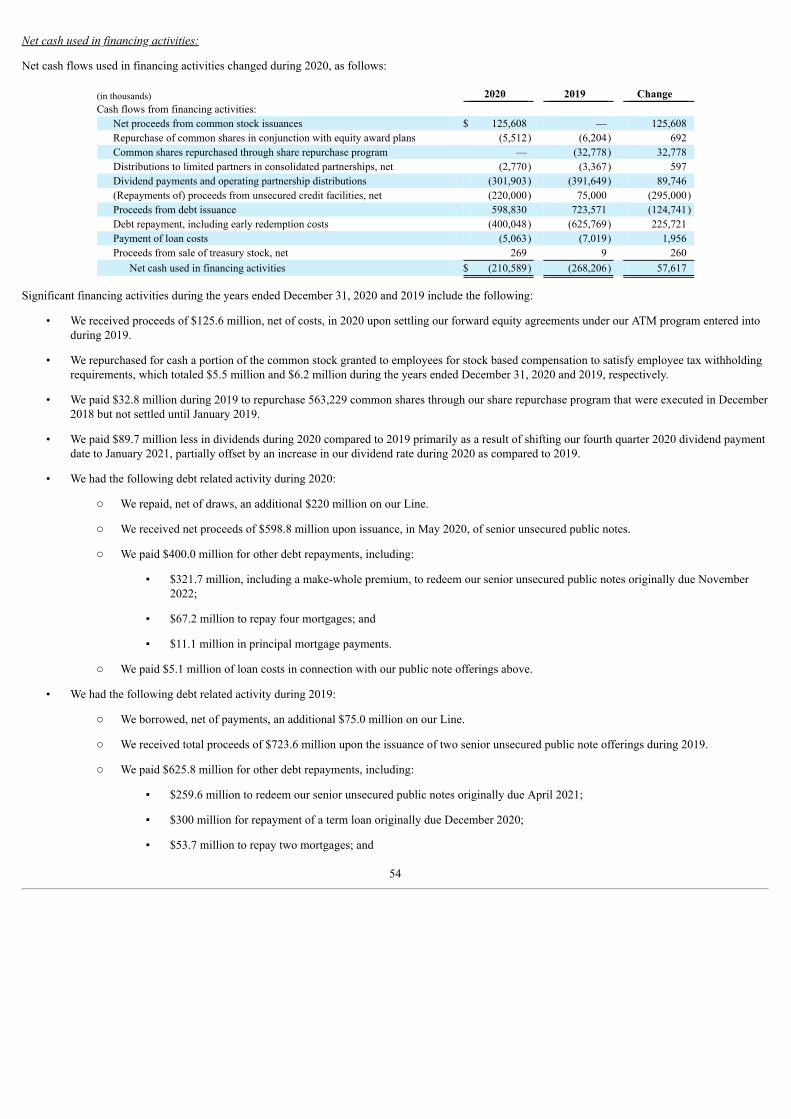
Net cash used in financing activities:
Net cash flows used in financing activities changed during 2020, as follows:
(in thousands) 2020 2019 Change Cash flows from financing activities:
Net proceeds from common stock issuances $ 125,608 — 125,608 Repurchase of common shares in conjunction with equity award plans (5,512) (6,204) 692 Common shares repurchased through share repurchase program — (32,778) 32,778 Distributions to limited partners in consolidated partnerships, net (2,770) (3,367) 597 Dividend payments and operating partnership distributions (301,903) (391,649) 89,746 (Repayments of) proceeds from unsecured credit facilities, net (220,000) 75,000 (295,000)Proceeds from debt issuance 598,830 723,571 (124,741)Debt repayment, including early redemption costs (400,048) (625,769) 225,721 Payment of loan costs (5,063) (7,019) 1,956 Proceeds from sale of treasury stock, net 269 9 260
Net cash used in financing activities $ (210,589) (268,206) 57,617
Significant financing activities during the years ended December 31, 2020 and 2019 include the following:
• We received proceeds of $125.6 million, net of costs, in 2020 upon settling our forward equity agreements under our ATM program entered intoduring 2019.
• We repurchased for cash a portion of the common stock granted to employees for stock based compensation to satisfy employee tax withholdingrequirements, which totaled $5.5 million and $6.2 million during the years ended December 31, 2020 and 2019, respectively.
• We paid $32.8 million during 2019 to repurchase 563,229 common shares through our share repurchase program that were executed in December2018 but not settled until January 2019.
• We paid $89.7 million less in dividends during 2020 compared to 2019 primarily as a result of shifting our fourth quarter 2020 dividend paymentdate to January 2021, partially offset by an increase in our dividend rate during 2020 as compared to 2019.
• We had the following debt related activity during 2020:
o We repaid, net of draws, an additional $220 million on our Line.
o We received net proceeds of $598.8 million upon issuance, in May 2020, of senior unsecured public notes.
o We paid $400.0 million for other debt repayments, including:
▪ $321.7 million, including a make-whole premium, to redeem our senior unsecured public notes originally due November2022;
▪ $67.2 million to repay four mortgages; and
▪ $11.1 million in principal mortgage payments.
o We paid $5.1 million of loan costs in connection with our public note offerings above.
• We had the following debt related activity during 2019:
o We borrowed, net of payments, an additional $75.0 million on our Line.
o We received total proceeds of $723.6 million upon the issuance of two senior unsecured public note offerings during 2019.
o We paid $625.8 million for other debt repayments, including:
▪ $259.6 million to redeem our senior unsecured public notes originally due April 2021;
▪ $300 million for repayment of a term loan originally due December 2020;
▪ $53.7 million to repay two mortgages; and
54
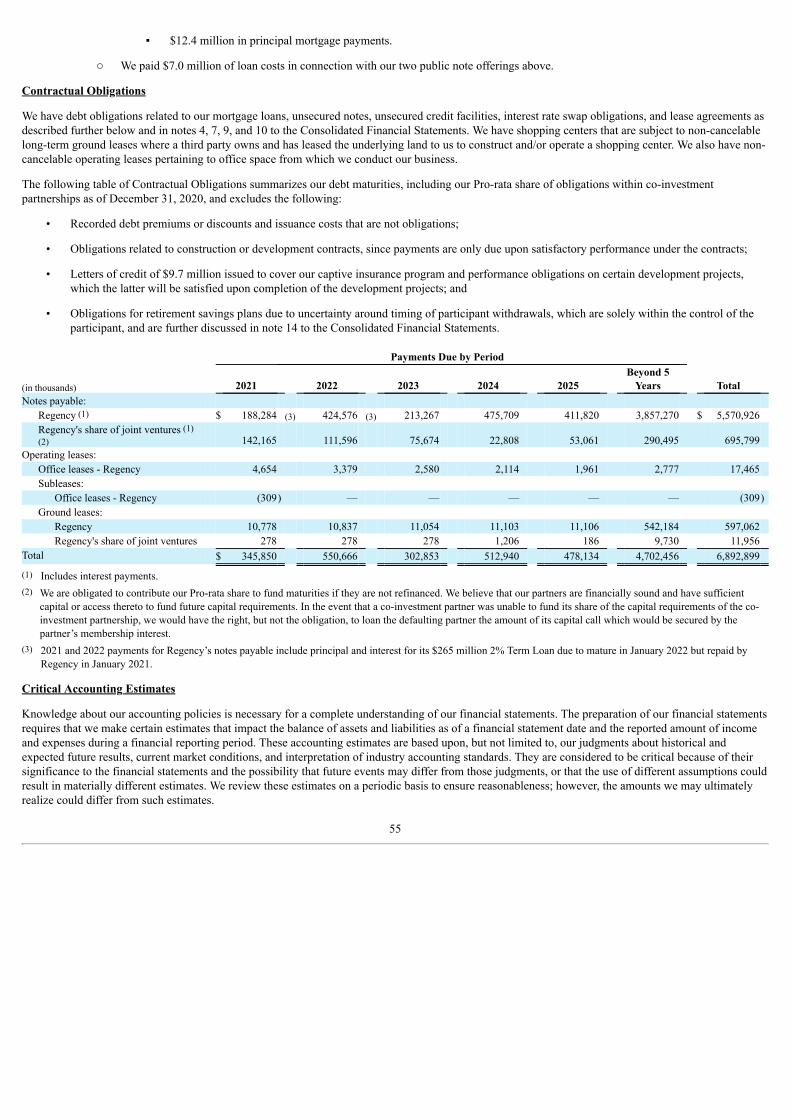
▪ $12.4 million in principal mortgage payments.
o We paid $7.0 million of loan costs in connection with our two public note offerings above.
Contractual Obligations
We have debt obligations related to our mortgage loans, unsecured notes, unsecured credit facilities, interest rate swap obligations, and lease agreements asdescribed further below and in notes 4, 7, 9, and 10 to the Consolidated Financial Statements. We have shopping centers that are subject to non-cancelablelong-term ground leases where a third party owns and has leased the underlying land to us to construct and/or operate a shopping center. We also have non-cancelable operating leases pertaining to office space from which we conduct our business.
The following table of Contractual Obligations summarizes our debt maturities, including our Pro-rata share of obligations within co-investmentpartnerships as of December 31, 2020, and excludes the following:
• Recorded debt premiums or discounts and issuance costs that are not obligations;
• Obligations related to construction or development contracts, since payments are only due upon satisfactory performance under the contracts;
• Letters of credit of $9.7 million issued to cover our captive insurance program and performance obligations on certain development projects,which the latter will be satisfied upon completion of the development projects; and
• Obligations for retirement savings plans due to uncertainty around timing of participant withdrawals, which are solely within the control of theparticipant, and are further discussed in note 14 to the Consolidated Financial Statements.
Payments Due by Period
(in thousands) 2021 2022 2023 2024 2025 Beyond 5
Years Total Notes payable:
Regency (1) $ 188,284 (3) 424,576 (3) 213,267 475,709 411,820 3,857,270 $ 5,570,926 Regency's share of joint ventures (1)(2) 142,165 111,596 75,674 22,808 53,061 290,495 695,799
Operating leases: Office leases - Regency 4,654 3,379 2,580 2,114 1,961 2,777 17,465 Subleases:
Office leases - Regency (309) — — — — — (309)Ground leases:
Regency 10,778 10,837 11,054 11,103 11,106 542,184 597,062 Regency's share of joint ventures 278 278 278 1,206 186 9,730 11,956
Total $ 345,850 550,666 302,853 512,940 478,134 4,702,456 6,892,899
(1) Includes interest payments.(2) We are obligated to contribute our Pro-rata share to fund maturities if they are not refinanced. We believe that our partners are financially sound and have sufficient
capital or access thereto to fund future capital requirements. In the event that a co-investment partner was unable to fund its share of the capital requirements of the co-investment partnership, we would have the right, but not the obligation, to loan the defaulting partner the amount of its capital call which would be secured by thepartner’s membership interest.
(3) 2021 and 2022 payments for Regency’s notes payable include principal and interest for its $265 million 2% Term Loan due to mature in January 2022 but repaid byRegency in January 2021.
Critical Accounting Estimates
Knowledge about our accounting policies is necessary for a complete understanding of our financial statements. The preparation of our financial statementsrequires that we make certain estimates that impact the balance of assets and liabilities as of a financial statement date and the reported amount of incomeand expenses during a financial reporting period. These accounting estimates are based upon, but not limited to, our judgments about historical andexpected future results, current market conditions, and interpretation of industry accounting standards. They are considered to be critical because of theirsignificance to the financial statements and the possibility that future events may differ from those judgments, or that the use of different assumptions couldresult in materially different estimates. We review these estimates on a periodic basis to ensure reasonableness; however, the amounts we may ultimatelyrealize could differ from such estimates.
55
Collectibility of Lease Income
Lease income, which includes base rent, percentage rent, and recoveries from tenants for common area maintenance costs, insurance and real estate taxesare the Company's principal source of revenue. As a result of generating this revenue, we will routinely have accounts receivable due from tenants.
Lease income for operating leases with fixed payment terms is recognized on a straight-line basis over the expected term of the lease for all leases forwhich collectibility is considered probable at the commencement date. At lease commencement, the Company generally expects that collectibility isprobable due to the Company’s credit assessment of tenants and other creditworthiness analysis undertaken before entering into a new lease; therefore,income from most operating leases is initially recognized on a straight-line basis. For operating leases in which collectibility of Lease income is notconsidered probable, Lease income is recognized on a cash basis and all previously recognized and uncollected Lease income is reversed in the period inwhich the Lease income is determined not to be probable of collection. In addition to the lease-specific collectibility assessment, the Company mayrecognize a general reserve, as a reduction to Lease income, for its portfolio of operating lease receivables which are not expected to be fully collectiblebased on the Company’s historical collection experience. Although we estimate uncollectible receivables and provide for them through charges againstincome, actual experience may differ from those estimates.
Real Estate Investments
Acquisition of Real Estate Investments
Upon acquisition of real estate operating properties, the Company estimates the fair value of acquired tangible assets (consisting of land, building, buildingimprovements and tenant improvements) and identified intangible assets and liabilities (consisting of above and below-market leases and in-place leases),assumed debt, and any noncontrolling interest in the acquiree at the date of acquisition, based on evaluation of information and estimates available at thatdate. Based on these estimates, the Company allocates the estimated fair value to the applicable assets and liabilities. Transaction costs associated withasset acquisitions are capitalized, while such costs are expensed for business combinations in the period incurred. Beginning in July 2017, the Companyadopted Accounting Standard Update 2017-01, Business Combinations (Topic 805): Clarifying the Definition of a Business, under which the acquisition ofoperating properties are generally considered asset acquisitions. If, however, the acquisition is determined to be a business combination, any excessconsideration above the fair value allocated to the applicable assets and liabilities results in goodwill. Fair value is determined based on an exit priceapproach, which contemplates the price that would be received to sell an asset or paid to transfer a liability in an orderly transaction between marketparticipants at the measurement date.
The Company's methodology for determining fair value of the acquired tangible and intangible assets and liabilities includes estimating an “as-if vacant”fair value of the physical property, which includes land, building, and improvements. In addition, the Company determines the estimated fair value ofidentifiable intangible assets and liabilities, considering the following categories: (i) value of in-place leases, and (ii) above and below-market value of in-place leases.
The value of in-place leases is estimated based on the value associated with the costs avoided in originating leases compared to the acquired in-place leasesas well as the value associated with lost rental and recovery revenue during the assumed lease-up period. The value of in-place leases is recorded toDepreciation and amortization expense in the Consolidated Statements of Operations over the remaining expected term of the respective leases.
Above-market and below-market in-place lease values for acquired properties are recorded based on the present value of the difference between (i) thecontractual amounts to be paid pursuant to the in-place leases and (ii) management's estimate of fair market lease rates for comparable in-place leases,measured over a period equal to the remaining non-cancelable term of the lease, including below-market renewal options, if applicable. The value ofabove-market leases is amortized as a reduction of Lease income over the remaining terms of the respective leases and the value of below-market leases isaccreted to Lease income over the remaining terms of the respective leases, including below-market renewal options, if applicable.
Changes to these assumptions could result in a different pattern of recognition. If tenants do not remain in their lease through the expected term or exercisean assumed renewal option, there could be a material impact to earnings.
Valuation of Real Estate Investments
In accordance with GAAP, we evaluate our real estate for impairment whenever there are indicators, including property operating performance and generalmarket conditions, that the carrying value of our real estate properties (including any related amortizable intangible assets or liabilities) may not berecoverable. If such indicators occur, we compare the current carrying value of the asset to the estimated undiscounted cash flows that are directlyassociated with the use and ultimate disposition of the asset. Our estimated cash flows are based on several key assumptions, including rental rates,expected leasing activity, costs of tenant improvements, leasing commissions, anticipated hold period, comparable sales information, and assumptionsregarding the residual value upon disposition, including the exit capitalization rate. These key assumptions are subjective in nature and the resultingimpairment, if any, could differ from the actual gain or loss recognized upon ultimate sale in an arm's length transaction. If the carrying value of the assetexceeds the estimated undiscounted cash flows, an impairment loss is recognized equal to the excess of carrying value over fair value.
The fair value of real estate assets is subjective and is determined through comparable sales information and other market data if available, as well as theuse of an income approach such as the direct capitalization method or the discounted cash flow approach. Such
56
cash flow projections consider factors such as expected future operating income, trends and prospects, as well as the effects of demand, competition andother factors, and therefore is subject to management judgment and changes in those factors could impact the determination of fair value. In estimating thefair value of undeveloped land, we generally use market data and comparable sales information. Changes in our disposition strategy or changes in themarketplace may alter the hold period of an asset or asset group, which may result in an impairment loss and such loss could be material to the Company'sfinancial condition or operating performance.
Recent Accounting Pronouncements
See Note 1 to Consolidated Financial Statements.
Environmental Matters
We are subject to numerous environmental laws and regulations as they apply to our shopping centers pertaining primarily to specific chemicals historicallyused by certain current and former dry cleaning tenants, the existence of asbestos in older shopping centers, and the presence of underground petroleumstorage tanks. We believe that the few tenants who currently operate dry cleaning plants or gas stations do so in accordance with current laws andregulations. Generally, we endeavor to require tenants to remove dry cleaning plants from our shopping centers or convert them to more environmentallyfriendly systems, in accordance with the terms of our leases. We also have a blanket environmental insurance policy for third-party liabilities andremediation costs on shopping centers that currently have no known environmental contamination. We have also secured environmental insurance policies,where appropriate, on a relatively small number of specific properties with known contamination, in order to mitigate our environmental risk. We monitorthe shopping centers containing environmental issues and in certain cases voluntarily remediate the sites. We also have legal obligations to remediatecertain sites, and we are in the process of doing so.
As of December 31, 2020, we had accrued liabilities of $8.3 million for our Pro-rata share of environmental remediation, including our Investments in realestate partnerships. We believe that the ultimate remediation of currently known environmental matters will not have a material effect on our financialposition, liquidity, or results of operations. We can give no assurance that existing environmental studies on our shopping centers have revealed allpotential environmental contamination; that our estimate of liabilities will not change as more information becomes available; that any previous owner,occupant or tenant did not create any material environmental condition not known to us; that the current environmental condition of the shopping centerswill not be affected by tenants and occupants, by the condition of nearby properties, or by unrelated third parties; or that changes in applicableenvironmental laws and regulations or their interpretation will not result in additional environmental liability to us.
Off-Balance Sheet Arrangements
We do not have off-balance sheet arrangements, financings, or other relationships with other unconsolidated entities (other than our unconsolidatedinvestment partnerships) or other persons, also known as variable interest entities, not previously discussed. Many of our unconsolidated investmentpartnerships’ operating properties have been financed with non-recourse loans, to which we have no repayment guarantees.
Inflation/Deflation
Inflation has been historically low and has had a minimal impact on the operating performance of our shopping centers; however, inflation may become agreater concern in the future. Substantially all of our long-term leases contain provisions designed to mitigate the adverse impact of inflation, whichrequire tenants to pay their pro-rata share of operating expenses, including common-area maintenance, real estate taxes, insurance and utilities, therebyreducing our exposure to increases in costs and operating expenses resulting from inflation. In addition, many of our leases are for terms of less than tenyears, which permits us to seek increased rents upon re-rental at market rates. However, during deflationary periods or periods of economic weakness,minimum rents and percentage rents may decline as the supply of available retail space exceeds demand and consumer spending declines. Percent leaseddeclines may also result in lower recovery rates of our operating expenses.
57
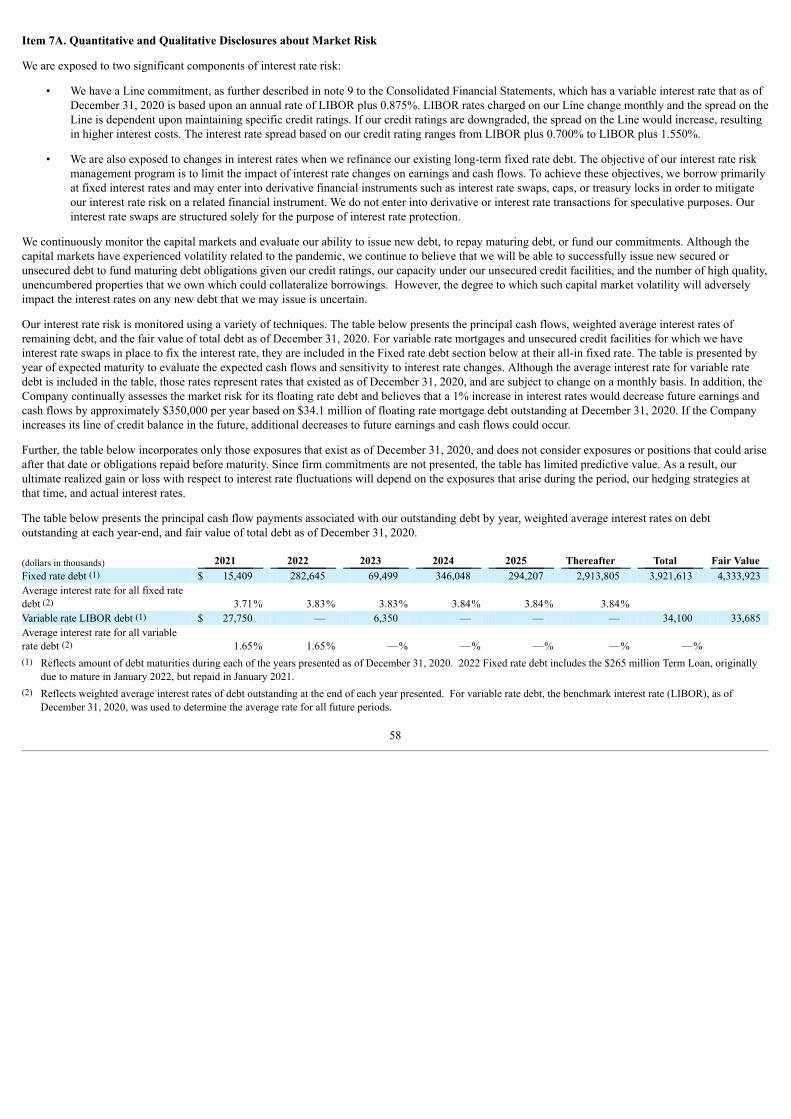
Item 7A. Quantitative and Qualitative Disclosures about Market Risk
We are exposed to two significant components of interest rate risk:
• We have a Line commitment, as further described in note 9 to the Consolidated Financial Statements, which has a variable interest rate that as ofDecember 31, 2020 is based upon an annual rate of LIBOR plus 0.875%. LIBOR rates charged on our Line change monthly and the spread on theLine is dependent upon maintaining specific credit ratings. If our credit ratings are downgraded, the spread on the Line would increase, resultingin higher interest costs. The interest rate spread based on our credit rating ranges from LIBOR plus 0.700% to LIBOR plus 1.550%.
• We are also exposed to changes in interest rates when we refinance our existing long-term fixed rate debt. The objective of our interest rate riskmanagement program is to limit the impact of interest rate changes on earnings and cash flows. To achieve these objectives, we borrow primarilyat fixed interest rates and may enter into derivative financial instruments such as interest rate swaps, caps, or treasury locks in order to mitigateour interest rate risk on a related financial instrument. We do not enter into derivative or interest rate transactions for speculative purposes. Ourinterest rate swaps are structured solely for the purpose of interest rate protection.
We continuously monitor the capital markets and evaluate our ability to issue new debt, to repay maturing debt, or fund our commitments. Although thecapital markets have experienced volatility related to the pandemic, we continue to believe that we will be able to successfully issue new secured orunsecured debt to fund maturing debt obligations given our credit ratings, our capacity under our unsecured credit facilities, and the number of high quality,unencumbered properties that we own which could collateralize borrowings. However, the degree to which such capital market volatility will adverselyimpact the interest rates on any new debt that we may issue is uncertain.
Our interest rate risk is monitored using a variety of techniques. The table below presents the principal cash flows, weighted average interest rates ofremaining debt, and the fair value of total debt as of December 31, 2020. For variable rate mortgages and unsecured credit facilities for which we haveinterest rate swaps in place to fix the interest rate, they are included in the Fixed rate debt section below at their all-in fixed rate. The table is presented byyear of expected maturity to evaluate the expected cash flows and sensitivity to interest rate changes. Although the average interest rate for variable ratedebt is included in the table, those rates represent rates that existed as of December 31, 2020, and are subject to change on a monthly basis. In addition, theCompany continually assesses the market risk for its floating rate debt and believes that a 1% increase in interest rates would decrease future earnings andcash flows by approximately $350,000 per year based on $34.1 million of floating rate mortgage debt outstanding at December 31, 2020. If the Companyincreases its line of credit balance in the future, additional decreases to future earnings and cash flows could occur.
Further, the table below incorporates only those exposures that exist as of December 31, 2020, and does not consider exposures or positions that could ariseafter that date or obligations repaid before maturity. Since firm commitments are not presented, the table has limited predictive value. As a result, ourultimate realized gain or loss with respect to interest rate fluctuations will depend on the exposures that arise during the period, our hedging strategies atthat time, and actual interest rates.
The table below presents the principal cash flow payments associated with our outstanding debt by year, weighted average interest rates on debtoutstanding at each year-end, and fair value of total debt as of December 31, 2020.
(dollars in thousands) 2021 2022 2023 2024 2025 Thereafter Total Fair Value Fixed rate debt (1) $ 15,409 282,645 69,499 346,048 294,207 2,913,805 3,921,613 4,333,923 Average interest rate for all fixed ratedebt (2) 3.71% 3.83% 3.83% 3.84% 3.84% 3.84% Variable rate LIBOR debt (1) $ 27,750 — 6,350 — — — 34,100 33,685 Average interest rate for all variablerate debt (2) 1.65% 1.65% —% —% —% —% —%
(1) Reflects amount of debt maturities during each of the years presented as of December 31, 2020. 2022 Fixed rate debt includes the $265 million Term Loan, originallydue to mature in January 2022, but repaid in January 2021.
(2) Reflects weighted average interest rates of debt outstanding at the end of each year presented. For variable rate debt, the benchmark interest rate (LIBOR), as ofDecember 31, 2020, was used to determine the average rate for all future periods.
58
Item 8. Consolidated Financial Statements and Supplementary Data
Regency Centers Corporation and Regency Centers, L.P.
Index to Financial Statements Reports of Independent Registered Public Accounting Firm 60
Regency Centers Corporation: Consolidated Balance Sheets as of December 31, 2020 and 2019 66Consolidated Statements of Operations for the years ended December 31, 2020, 2019, and 2018 67Consolidated Statements of Comprehensive Income for the years ended December 31, 2020, 2019, and 2018 68Consolidated Statements of Equity for the years ended December 31, 2020, 2019, and 2018 69Consolidated Statements of Cash Flows for the years ended December 31, 2020, 2019, and 2018 71
Regency Centers, L.P.: Consolidated Balance Sheets as of December 31, 2020 and 2019 73Consolidated Statements of Operations for the years ended December 31, 2020, 2019, and 2018 74Consolidated Statements of Comprehensive Income for the years ended December 31, 2020, 2019, and 2018 75Consolidated Statements of Capital for the years ended December 31, 2020, 2019, and 2018 76Consolidated Statements of Cash Flows for the years ended December 31, 2020, 2019, and 2018 78
Notes to Consolidated Financial Statements 80
Financial Statement Schedule Schedule III - Consolidated Real Estate and Accumulated Depreciation - December 31, 2020 115
All other schedules are omitted because of the absence of conditions under which they are required, materiality or because information required therein isshown in the consolidated financial statements or notes thereto.
59
Report of Independent Registered Public Accounting Firm
To the Stockholders and Board of DirectorsRegency Centers Corporation:
Opinion on the Consolidated Financial Statements
We have audited the accompanying consolidated balance sheets of Regency Centers Corporation and subsidiaries (the Company) as of December 31, 2020and 2019, the related consolidated statements of operations, comprehensive income, equity, and cash flows for each of the years in the three-year periodended December 31, 2020, and the related notes and financial statement schedule III – Consolidated Real Estate and Accumulated Depreciation(collectively, the consolidated financial statements). In our opinion, the consolidated financial statements present fairly, in all material respects, thefinancial position of the Company as of December 31, 2020 and 2019, and the results of its operations and its cash flows for each of the years in the three-year period ended December 31, 2020, in conformity with U.S. generally accepted accounting principles.
We also have audited, in accordance with the standards of the Public Company Accounting Oversight Board (United States) (PCAOB), the Company’sinternal control over financial reporting as of December 31, 2020, based on criteria established in Internal Control – Integrated Framework (2013) issuedby the Committee of Sponsoring Organizations of the Treadway Commission, and our report dated February 17, 2021 expressed an unqualified opinion onthe effectiveness of the Company’s internal control over financial reporting.
Change in Accounting Principle
As discussed in Note 1 to the consolidated financial statements, the Company has changed its method of accounting for leases as of January 1, 2019 due tothe adoption of Accounting Standards Codification Topic 842, Leases.
Basis for Opinion
These consolidated financial statements are the responsibility of the Company’s management. Our responsibility is to express an opinion on theseconsolidated financial statements based on our audits. We are a public accounting firm registered with the PCAOB and are required to be independent withrespect to the Company in accordance with the U.S. federal securities laws and the applicable rules and regulations of the Securities and ExchangeCommission and the PCAOB.
We conducted our audits in accordance with the standards of the PCAOB. Those standards require that we plan and perform the audit to obtain reasonableassurance about whether the consolidated financial statements are free of material misstatement, whether due to error or fraud. Our audits includedperforming procedures to assess the risks of material misstatement of the consolidated financial statements, whether due to error or fraud, and performingprocedures that respond to those risks. Such procedures included examining, on a test basis, evidence regarding the amounts and disclosures in theconsolidated financial statements. Our audits also included evaluating the accounting principles used and significant estimates made by management, aswell as evaluating the overall presentation of the consolidated financial statements. We believe that our audits provide a reasonable basis for our opinion.
Critical Audit Matter
The critical audit matter communicated below is a matter arising from the current period audit of the consolidated financial statements that wascommunicated or required to be communicated to the audit committee and that: (1) relates to accounts or disclosures that are material to the consolidatedfinancial statements and (2) involved our especially challenging, subjective, or complex judgments. The communication of a critical audit matter does notalter in any way our opinion on the consolidated financial statements, taken as a whole, and we are not, by communicating the critical audit matter below,providing a separate opinion on the critical audit matter or on the accounts or disclosures to which it relates.
Identification and assessment of real estate property impairment indicators
As discussed in Note 1 to the consolidated financial statements and presented on the consolidated balance sheet, real estate assets, lessaccumulated depreciation was $9.1 billion as of December 31, 2020. The Company evaluates real estate properties for impairment wheneverthere are indicators, including property operating performance and general market conditions, that the carrying value of the real estate propertiesmay not be recoverable.
We identified the identification and assessment of real estate property impairment indicators as a critical audit matter. A high degree of subjectiveauditor judgment was required to evaluate the Company’s judgments regarding the identification and assessment of potential indicators that thecarrying value of the real estate properties may not be recoverable. Changes in assumptions regarding property conditions, occupancy rates, netoperating income and the rate of cash collections from tenants,
60

and anticipated hold periods could have an impact on the determination to further evaluate the real estate properties for impairment.
The following are the primary procedures we performed to address this critical audit matter. We evaluated the design and tested the operatingeffectiveness of certain internal controls related to the critical audit matter, including controls related to the identification and assessment ofpotential indicators of impairment. Using property financial and leasing data, we performed an assessment of changes in occupancy rates, netoperating income and the rate of cash collections for individual real estate properties and compared the results to the Company’s assessment. Inaddition, to identify a change in property condition or a shortened hold period we inquired of Company officials, attended Company quarterlymeetings and inspected documents such as meeting minutes of the Company’s board of directors.
/s/ KPMG LLP
We have served as the Company's auditor since 1993.
Jacksonville, FloridaFebruary 17, 2021
61

Report of Independent Registered Public Accounting Firm
To the Stockholders and Board of DirectorsRegency Centers Corporation:
Opinion on Internal Control Over Financial Reporting
We have audited Regency Centers Corporation’s and subsidiaries’ (the Company) internal control over financial reporting as of December 31, 2020, basedon criteria established in Internal Control – Integrated Framework (2013) issued by the Committee of Sponsoring Organizations of the TreadwayCommission. In our opinion, the Company maintained, in all material respects, effective internal control over financial reporting as of December 31, 2020,based on criteria established in Internal Control – Integrated Framework (2013) issued by the Committee of Sponsoring Organizations of the TreadwayCommission.
We also have audited, in accordance with the standards of the Public Company Accounting Oversight Board (United States) (PCAOB), the consolidatedbalance sheets of the Company as of December 31, 2020 and 2019, the related consolidated statements of operations, comprehensive income, equity, andcash flows for each of the years in the three-year period ended December 31, 2020, and the related notes and financial statement schedule III –Consolidated Real Estate and Accumulated Depreciation (collectively, the consolidated financial statements), and our report dated February 17, 2021expressed an unqualified opinion on those consolidated financial statements.
Basis for Opinion
The Company’s management is responsible for maintaining effective internal control over financial reporting and for its assessment of the effectiveness ofinternal control over financial reporting, included in the accompanying Management’s Report on Internal Control over Financial Reporting. Ourresponsibility is to express an opinion on the Company’s internal control over financial reporting based on our audit. We are a public accounting firmregistered with the PCAOB and are required to be independent with respect to the Company in accordance with the U.S. federal securities laws and theapplicable rules and regulations of the Securities and Exchange Commission and the PCAOB.
We conducted our audit in accordance with the standards of the PCAOB. Those standards require that we plan and perform the audit to obtain reasonableassurance about whether effective internal control over financial reporting was maintained in all material respects. Our audit of internal control overfinancial reporting included obtaining an understanding of internal control over financial reporting, assessing the risk that a material weakness exists, andtesting and evaluating the design and operating effectiveness of internal control based on the assessed risk. Our audit also included performing such otherprocedures as we considered necessary in the circumstances. We believe that our audit provides a reasonable basis for our opinion.
Definition and Limitations of Internal Control Over Financial Reporting
A company’s internal control over financial reporting is a process designed to provide reasonable assurance regarding the reliability of financial reportingand the preparation of financial statements for external purposes in accordance with generally accepted accounting principles. A company’s internal controlover financial reporting includes those policies and procedures that (1) pertain to the maintenance of records that, in reasonable detail, accurately and fairlyreflect the transactions and dispositions of the assets of the company; (2) provide reasonable assurance that transactions are recorded as necessary to permitpreparation of financial statements in accordance with generally accepted accounting principles, and that receipts and expenditures of the company arebeing made only in accordance with authorizations of management and directors of the company; and (3) provide reasonable assurance regardingprevention or timely detection of unauthorized acquisition, use, or disposition of the company’s assets that could have a material effect on the financialstatements.
Because of its inherent limitations, internal control over financial reporting may not prevent or detect misstatements. Also, projections of any evaluation ofeffectiveness to future periods are subject to the risk that controls may become inadequate because of changes in conditions, or that the degree ofcompliance with the policies or procedures may deteriorate.
/s/ KPMG LLP
Jacksonville, FloridaFebruary 17, 2021
62
Report of Independent Registered Public Accounting Firm
The Board of Directors of RegencyCenters Corporation, and thePartners of Regency Centers, L.P.:
Opinion on the Consolidated Financial Statements
We have audited the accompanying consolidated balance sheets of Regency Centers, L.P. and subsidiaries (the Partnership) as of December 31, 2020 and2019, the related consolidated statements of operations, comprehensive income, capital, and cash flows for each of the years in the three-year period endedDecember 31, 2020, and the related notes and financial statement schedule III – Consolidated Real Estate and Accumulated Depreciation (collectively, theconsolidated financial statements). In our opinion, the consolidated financial statements present fairly, in all material respects, the financial position of thePartnership as of December 31, 2020 and 2019, and the results of its operations and its cash flows for each of the years in the three-year period endedDecember 31, 2020, in conformity with U.S. generally accepted accounting principles.
We also have audited, in accordance with the standards of the Public Company Accounting Oversight Board (United States) (PCAOB), the Partnership’sinternal control over financial reporting as of December 31, 2020, based on criteria established in Internal Control – Integrated Framework (2013) issuedby the Committee of Sponsoring Organizations of the Treadway Commission, and our report dated February 17, 2021 expressed an unqualified opinion onthe effectiveness of the Partnership’s internal control over financial reporting.
Change in Accounting Principle
As discussed in Note 1 to the consolidated financial statements, the Partnership has changed its method of accounting for leases as of January 1, 2019 dueto the adoption of Accounting Standards Codification Topic 842, Leases.
Basis for Opinion
These consolidated financial statements are the responsibility of the Partnership’s management. Our responsibility is to express an opinion on theseconsolidated financial statements based on our audits. We are a public accounting firm registered with the PCAOB and are required to be independent withrespect to the Partnership in accordance with the U.S. federal securities laws and the applicable rules and regulations of the Securities and ExchangeCommission and the PCAOB.
We conducted our audits in accordance with the standards of the PCAOB. Those standards require that we plan and perform the audit to obtain reasonableassurance about whether the consolidated financial statements are free of material misstatement, whether due to error or fraud. Our audits includedperforming procedures to assess the risks of material misstatement of the consolidated financial statements, whether due to error or fraud, and performingprocedures that respond to those risks. Such procedures included examining, on a test basis, evidence regarding the amounts and disclosures in theconsolidated financial statements. Our audits also included evaluating the accounting principles used and significant estimates made by management, aswell as evaluating the overall presentation of the consolidated financial statements. We believe that our audits provide a reasonable basis for our opinion.
Critical Audit Matter
The critical audit matter communicated below is a matter arising from the current period audit of the consolidated financial statements that wascommunicated or required to be communicated to the audit committee and that: (1) related to accounts or disclosures that are material to the consolidatedfinancial statements and (2) involved our especially challenging, subjective, or complex judgments. The communication of a critical audit matter does notalter in any way our opinion on the consolidated financial statements, taken as a whole, and we are not, by communicating the critical audit matter below,providing separate a opinion on the critical audit matter or on the accounts or disclosures to which it relates.
Identification and assessment of real estate property impairment indicators
As discussed in Note 1 to the consolidated financial statements and presented on the consolidated balance sheet, real estate assets, lessaccumulated depreciation was $9.1 billion as of December 31, 2020. The Partnership evaluates real estate properties for impairment wheneverthere are indicators, including property operating performance and general market conditions, that the carrying value of the real estate propertiesmay not be recoverable.
We identified the identification and assessment of real estate property impairment indicators as a critical audit matter. A high degree of subjectiveauditor judgment was required to evaluate the Partnership’s judgments regarding the identification and assessment of potential indicators that thecarrying value of the real estate properties may not be recoverable. Changes in
63

assumptions regarding property conditions, occupancy rates, net operating income and the rate of cash collections from tenants, and anticipatedhold periods could have an impact on the determination to further evaluate the real estate properties for impairment.
The following are the primary procedures we performed to address this critical audit matter. We evaluated the design and tested the operatingeffectiveness of certain internal controls related to the critical audit matter, including controls related to the identification and assessment ofpotential indicators of impairment. Using property financial and leasing data, we performed an assessment of changes in occupancy rates, netoperating income and the rate of cash collections for individual real estate properties and compared the results to the Partnership’s assessment. Inaddition, to identify a change in property condition or a shortened hold period we inquired of Partnership officials, attended Partnership quarterlymeetings and inspected documents such as meeting minutes of the general partners’ board of directors.
/s/ KPMG LLP
We have served as the Partnership's auditor since 1998.
Jacksonville, FloridaFebruary 17, 2021
64
Report of Independent Registered Public Accounting Firm
The Board of Directors of RegencyCenters Corporation, and thePartners of Regency Centers, L.P.:
Opinion on Internal Control Over Financial Reporting
We have audited Regency Centers, L.P.’s and subsidiaries’ (the Partnership) internal control over financial reporting as of December 31, 2020, based oncriteria established in Internal Control – Integrated Framework (2013) issued by the Committee of Sponsoring Organizations of the TreadwayCommission. In our opinion, the Partnership maintained, in all material respects, effective internal control over financial reporting as of December 31,2020, based on criteria established in Internal Control – Integrated Framework (2013) issued by the Committee of Sponsoring Organizations of theTreadway Commission.
We also have audited, in accordance with the standards of the Public Company Accounting Oversight Board (United States) (PCAOB), the consolidatedbalance sheets of the Partnership as of December 31, 2020 and 2019, the related consolidated statements of operations, comprehensive income, capital, andcash flows for each of the years in the three-year period ended December 31, 2020, and the related notes and financial statement schedule III –Consolidated Real Estate and Accumulated Depreciation (collectively, the consolidated financial statements), and our report dated February 17, 2021expressed an unqualified opinion on those consolidated financial statements.
Basis for Opinion
The Partnership’s management is responsible for maintaining effective internal control over financial reporting and for its assessment of the effectivenessof internal control over financial reporting, included in the accompanying Management’s Report on Internal Control over Financial Reporting. Ourresponsibility is to express an opinion on the Partnership’s internal control over financial reporting based on our audit. We are a public accounting firmregistered with the PCAOB and are required to be independent with respect to the Partnership in accordance with the U.S. federal securities laws and theapplicable rules and regulations of the Securities and Exchange Commission and the PCAOB.
We conducted our audit in accordance with the standards of the PCAOB. Those standards require that we plan and perform the audit to obtain reasonableassurance about whether effective internal control over financial reporting was maintained in all material respects. Our audit of internal control overfinancial reporting included obtaining an understanding of internal control over financial reporting, assessing the risk that a material weakness exists, andtesting and evaluating the design and operating effectiveness of internal control based on the assessed risk. Our audit also included performing such otherprocedures as we considered necessary in the circumstances. We believe that our audit provides a reasonable basis for our opinion.
Definition and Limitations of Internal Control Over Financial Reporting
A company’s internal control over financial reporting is a process designed to provide reasonable assurance regarding the reliability of financial reportingand the preparation of financial statements for external purposes in accordance with generally accepted accounting principles. A company’s internal controlover financial reporting includes those policies and procedures that (1) pertain to the maintenance of records that, in reasonable detail, accurately and fairlyreflect the transactions and dispositions of the assets of the company; (2) provide reasonable assurance that transactions are recorded as necessary to permitpreparation of financial statements in accordance with generally accepted accounting principles, and that receipts and expenditures of the company arebeing made only in accordance with authorizations of management and directors of the company; and (3) provide reasonable assurance regardingprevention or timely detection of unauthorized acquisition, use, or disposition of the company’s assets that could have a material effect on the financialstatements.
Because of its inherent limitations, internal control over financial reporting may not prevent or detect misstatements. Also, projections of any evaluation ofeffectiveness to future periods are subject to the risk that controls may become inadequate because of changes in conditions, or that the degree ofcompliance with the policies or procedures may deteriorate.
/s/ KPMG LLP
Jacksonville, FloridaFebruary 17, 2021
65
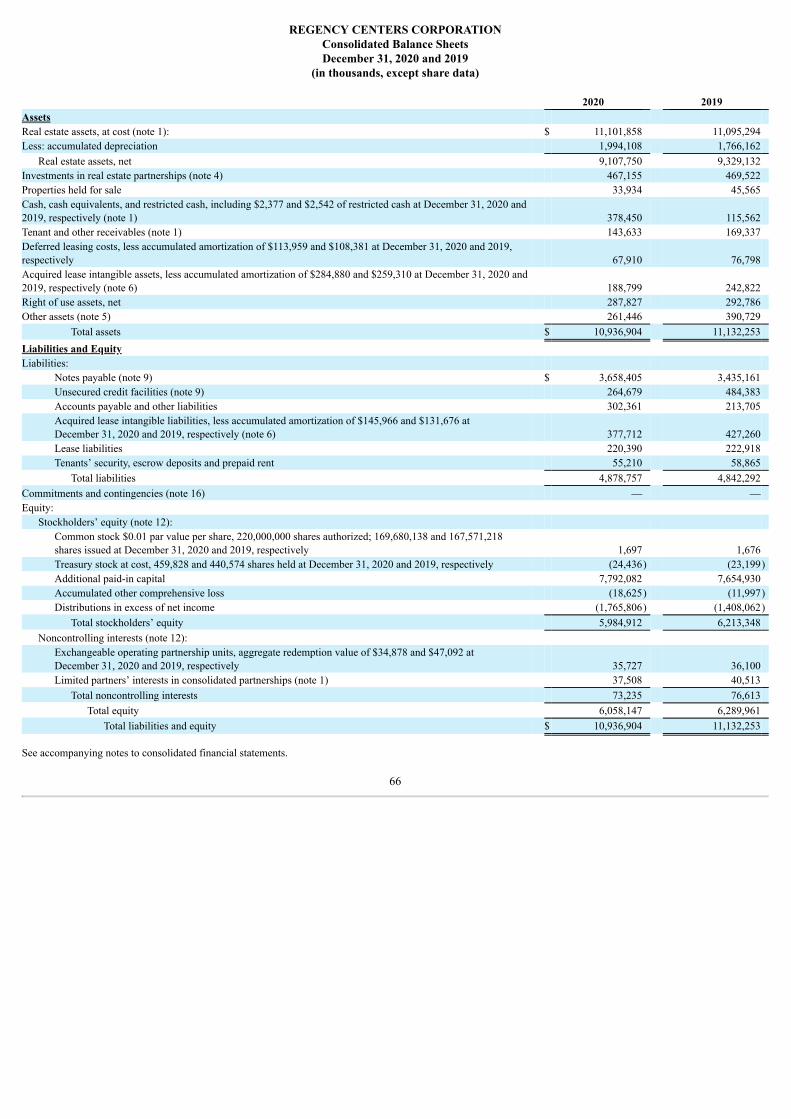
REGENCY CENTERS CORPORATION
Consolidated Balance SheetsDecember 31, 2020 and 2019
(in thousands, except share data)
2020 2019 Assets Real estate assets, at cost (note 1): $ 11,101,858 11,095,294 Less: accumulated depreciation 1,994,108 1,766,162
Real estate assets, net 9,107,750 9,329,132 Investments in real estate partnerships (note 4) 467,155 469,522 Properties held for sale 33,934 45,565 Cash, cash equivalents, and restricted cash, including $2,377 and $2,542 of restricted cash at December 31, 2020 and2019, respectively (note 1) 378,450 115,562 Tenant and other receivables (note 1) 143,633 169,337 Deferred leasing costs, less accumulated amortization of $113,959 and $108,381 at December 31, 2020 and 2019,respectively 67,910 76,798 Acquired lease intangible assets, less accumulated amortization of $284,880 and $259,310 at December 31, 2020 and2019, respectively (note 6) 188,799 242,822 Right of use assets, net 287,827 292,786 Other assets (note 5) 261,446 390,729
Total assets $ 10,936,904 11,132,253 Liabilities and Equity Liabilities:
Notes payable (note 9) $ 3,658,405 3,435,161 Unsecured credit facilities (note 9) 264,679 484,383 Accounts payable and other liabilities 302,361 213,705 Acquired lease intangible liabilities, less accumulated amortization of $145,966 and $131,676 atDecember 31, 2020 and 2019, respectively (note 6) 377,712 427,260 Lease liabilities 220,390 222,918 Tenants’ security, escrow deposits and prepaid rent 55,210 58,865
Total liabilities 4,878,757 4,842,292 Commitments and contingencies (note 16) — — Equity:
Stockholders’ equity (note 12): Common stock $0.01 par value per share, 220,000,000 shares authorized; 169,680,138 and 167,571,218shares issued at December 31, 2020 and 2019, respectively 1,697 1,676 Treasury stock at cost, 459,828 and 440,574 shares held at December 31, 2020 and 2019, respectively (24,436) (23,199)Additional paid-in capital 7,792,082 7,654,930 Accumulated other comprehensive loss (18,625) (11,997)Distributions in excess of net income (1,765,806) (1,408,062)
Total stockholders’ equity 5,984,912 6,213,348 Noncontrolling interests (note 12):
Exchangeable operating partnership units, aggregate redemption value of $34,878 and $47,092 atDecember 31, 2020 and 2019, respectively 35,727 36,100 Limited partners’ interests in consolidated partnerships (note 1) 37,508 40,513
Total noncontrolling interests 73,235 76,613 Total equity 6,058,147 6,289,961
Total liabilities and equity $ 10,936,904 11,132,253
See accompanying notes to consolidated financial statements.
66
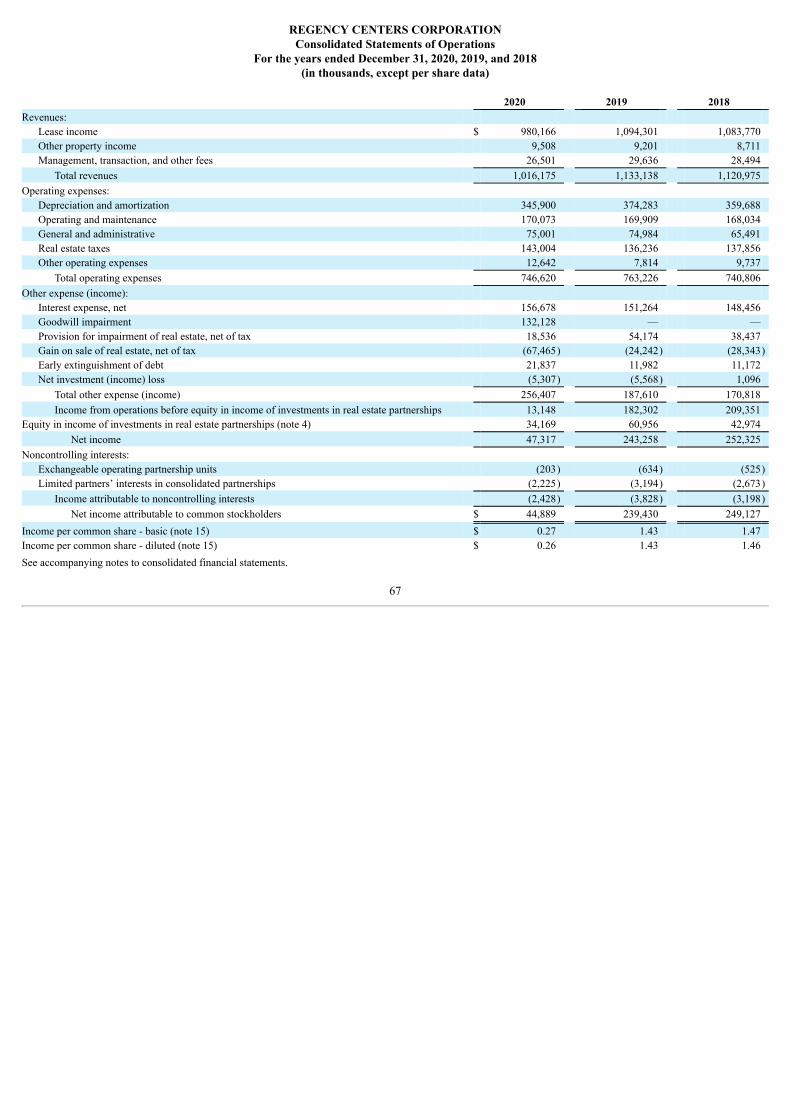
REGENCY CENTERS CORPORATION
Consolidated Statements of OperationsFor the years ended December 31, 2020, 2019, and 2018
(in thousands, except per share data)
2020 2019 2018 Revenues:
Lease income $ 980,166 1,094,301 1,083,770 Other property income 9,508 9,201 8,711 Management, transaction, and other fees 26,501 29,636 28,494
Total revenues 1,016,175 1,133,138 1,120,975 Operating expenses:
Depreciation and amortization 345,900 374,283 359,688 Operating and maintenance 170,073 169,909 168,034 General and administrative 75,001 74,984 65,491 Real estate taxes 143,004 136,236 137,856 Other operating expenses 12,642 7,814 9,737
Total operating expenses 746,620 763,226 740,806 Other expense (income):
Interest expense, net 156,678 151,264 148,456 Goodwill impairment 132,128 — — Provision for impairment of real estate, net of tax 18,536 54,174 38,437 Gain on sale of real estate, net of tax (67,465) (24,242) (28,343)Early extinguishment of debt 21,837 11,982 11,172 Net investment (income) loss (5,307) (5,568) 1,096
Total other expense (income) 256,407 187,610 170,818 Income from operations before equity in income of investments in real estate partnerships 13,148 182,302 209,351
Equity in income of investments in real estate partnerships (note 4) 34,169 60,956 42,974 Net income 47,317 243,258 252,325
Noncontrolling interests: Exchangeable operating partnership units (203) (634) (525)Limited partners’ interests in consolidated partnerships (2,225) (3,194) (2,673)
Income attributable to noncontrolling interests (2,428) (3,828) (3,198)Net income attributable to common stockholders $ 44,889 239,430 249,127
Income per common share - basic (note 15) $ 0.27 1.43 1.47 Income per common share - diluted (note 15) $ 0.26 1.43 1.46
See accompanying notes to consolidated financial statements.
67
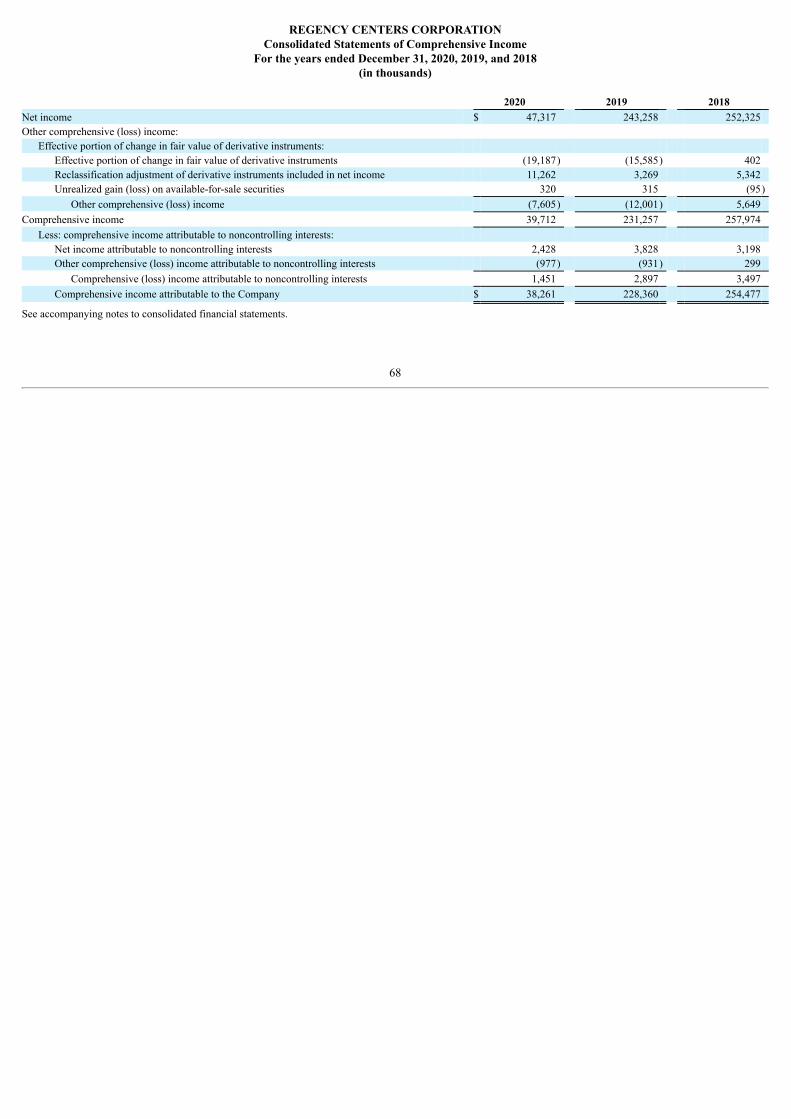
REGENCY CENTERS CORPORATION
Consolidated Statements of Comprehensive IncomeFor the years ended December 31, 2020, 2019, and 2018
(in thousands)
2020 2019 2018 Net income $ 47,317 243,258 252,325 Other comprehensive (loss) income:
Effective portion of change in fair value of derivative instruments: Effective portion of change in fair value of derivative instruments (19,187) (15,585) 402 Reclassification adjustment of derivative instruments included in net income 11,262 3,269 5,342 Unrealized gain (loss) on available-for-sale securities 320 315 (95)
Other comprehensive (loss) income (7,605) (12,001) 5,649 Comprehensive income 39,712 231,257 257,974
Less: comprehensive income attributable to noncontrolling interests: Net income attributable to noncontrolling interests 2,428 3,828 3,198 Other comprehensive (loss) income attributable to noncontrolling interests (977) (931) 299
Comprehensive (loss) income attributable to noncontrolling interests 1,451 2,897 3,497 Comprehensive income attributable to the Company $ 38,261 228,360 254,477
See accompanying notes to consolidated financial statements.
68
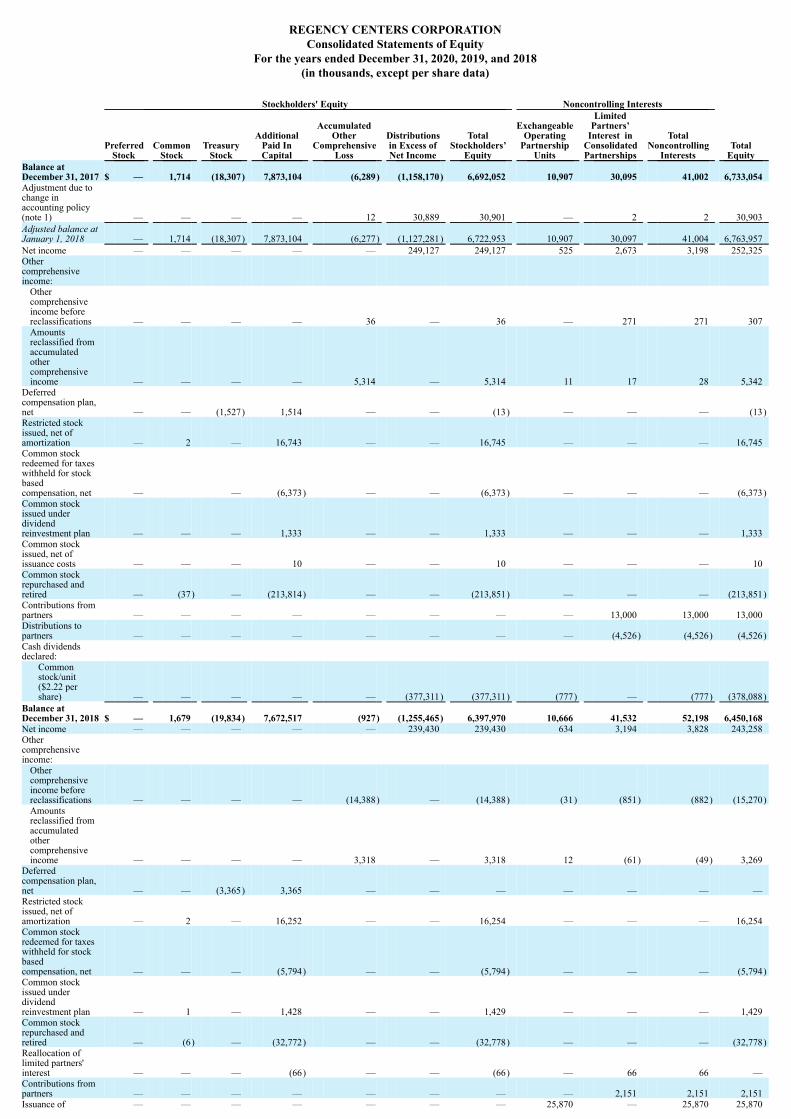
REGENCY CENTERS CORPORATION
Consolidated Statements of EquityFor the years ended December 31, 2020, 2019, and 2018
(in thousands, except per share data)
Stockholders' Equity Noncontrolling Interests
Preferred
Stock Common
Stock Treasury
Stock
AdditionalPaid InCapital
AccumulatedOther
ComprehensiveLoss
Distributionsin Excess ofNet Income
TotalStockholders’
Equity
ExchangeableOperating
PartnershipUnits
LimitedPartners’
Interest inConsolidatedPartnerships
TotalNoncontrolling
Interests Total
Equity Balance atDecember 31, 2017 $ — 1,714 (18,307) 7,873,104 (6,289) (1,158,170) 6,692,052 10,907 30,095 41,002 6,733,054 Adjustment due tochange inaccounting policy(note 1) — — — — 12 30,889 30,901 — 2 2 30,903 Adjusted balance atJanuary 1, 2018 — 1,714 (18,307) 7,873,104 (6,277) (1,127,281) 6,722,953 10,907 30,097 41,004 6,763,957 Net income — — — — — 249,127 249,127 525 2,673 3,198 252,325 Othercomprehensiveincome:
Othercomprehensiveincome beforereclassifications — — — — 36 — 36 — 271 271 307 Amountsreclassified fromaccumulatedothercomprehensiveincome — — — — 5,314 — 5,314 11 17 28 5,342
Deferredcompensation plan,net — — (1,527) 1,514 — — (13) — — — (13)Restricted stockissued, net ofamortization — 2 — 16,743 — — 16,745 — — — 16,745 Common stockredeemed for taxeswithheld for stockbasedcompensation, net — — (6,373) — — (6,373) — — — (6,373)Common stockissued underdividendreinvestment plan — — — 1,333 — — 1,333 — — — 1,333 Common stockissued, net ofissuance costs — — — 10 — — 10 — — — 10 Common stockrepurchased andretired — (37) — (213,814) — — (213,851) — — — (213,851)Contributions frompartners — — — — — — — — 13,000 13,000 13,000 Distributions topartners — — — — — — — — (4,526) (4,526) (4,526)Cash dividendsdeclared:
Commonstock/unit($2.22 pershare) — — — — — (377,311) (377,311) (777) — (777) (378,088)
Balance atDecember 31, 2018 $ — 1,679 (19,834) 7,672,517 (927) (1,255,465) 6,397,970 10,666 41,532 52,198 6,450,168 Net income — — — — — 239,430 239,430 634 3,194 3,828 243,258 Othercomprehensiveincome:
Othercomprehensiveincome beforereclassifications — — — — (14,388) — (14,388) (31) (851) (882) (15,270)Amountsreclassified fromaccumulatedothercomprehensiveincome — — — — 3,318 — 3,318 12 (61) (49) 3,269
Deferredcompensation plan,net — — (3,365) 3,365 — — — — — — — Restricted stockissued, net ofamortization — 2 — 16,252 — — 16,254 — — — 16,254 Common stockredeemed for taxeswithheld for stockbasedcompensation, net — — — (5,794) — — (5,794) — — — (5,794)Common stockissued underdividendreinvestment plan — 1 — 1,428 — — 1,429 — — — 1,429 Common stockrepurchased andretired — (6) — (32,772) — — (32,778) — — — (32,778)Reallocation oflimited partners'interest — — — (66) — — (66) — 66 66 — Contributions frompartners — — — — — — — — 2,151 2,151 2,151 Issuance of — — — — — — — 25,870 — 25,870 25,870

exchangeableoperatingpartnership unitsDistributions topartners — — — — — — — — (5,518) (5,518) (5,518)Cash dividendsdeclared:
Commonstock/unit($2.34 pershare) — — — — — (392,027) (392,027) (1,051) — (1,051) (393,078)
Balance atDecember 31, 2019 $ — 1,676 (23,199) 7,654,930 (11,997) (1,408,062) 6,213,348 36,100 40,513 76,613 6,289,961
69
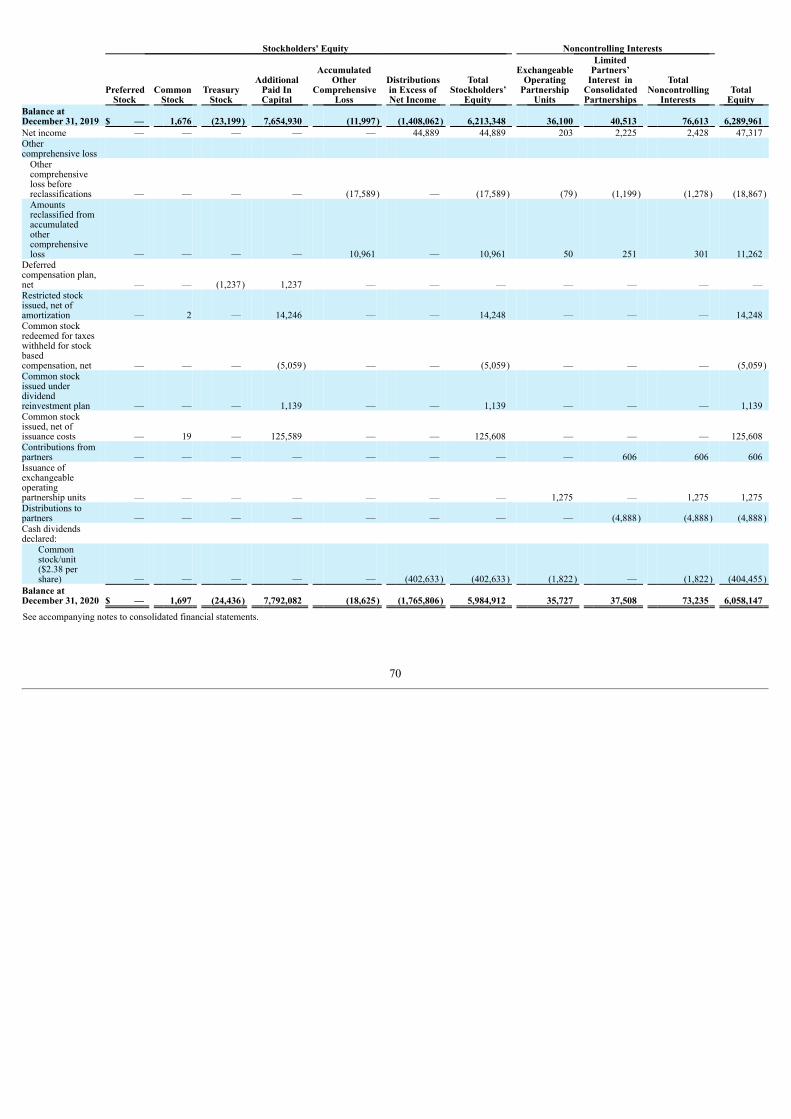
Stockholders' Equity Noncontrolling Interests
Preferred
Stock Common
Stock Treasury
Stock
AdditionalPaid InCapital
AccumulatedOther
ComprehensiveLoss
Distributionsin Excess ofNet Income
TotalStockholders’
Equity
ExchangeableOperating
PartnershipUnits
LimitedPartners’
Interest inConsolidatedPartnerships
TotalNoncontrolling
Interests Total
Equity Balance atDecember 31, 2019 $ — 1,676 (23,199) 7,654,930 (11,997) (1,408,062) 6,213,348 36,100 40,513 76,613 6,289,961 Net income — — — — — 44,889 44,889 203 2,225 2,428 47,317 Othercomprehensive loss
Othercomprehensiveloss beforereclassifications — — — — (17,589) — (17,589) (79) (1,199) (1,278) (18,867)Amountsreclassified fromaccumulatedothercomprehensiveloss — — — — 10,961 — 10,961 50 251 301 11,262
Deferredcompensation plan,net — — (1,237) 1,237 — — — — — — — Restricted stockissued, net ofamortization — 2 — 14,246 — — 14,248 — — — 14,248 Common stockredeemed for taxeswithheld for stockbasedcompensation, net — — — (5,059) — — (5,059) — — — (5,059)Common stockissued underdividendreinvestment plan — — — 1,139 — — 1,139 — — — 1,139 Common stockissued, net ofissuance costs — 19 — 125,589 — — 125,608 — — — 125,608 Contributions frompartners — — — — — — — — 606 606 606 Issuance ofexchangeableoperatingpartnership units — — — — — — — 1,275 — 1,275 1,275 Distributions topartners — — — — — — — — (4,888) (4,888) (4,888)Cash dividendsdeclared:
Commonstock/unit($2.38 pershare) — — — — — (402,633) (402,633) (1,822) — (1,822) (404,455)
Balance atDecember 31, 2020 $ — 1,697 (24,436) 7,792,082 (18,625) (1,765,806) 5,984,912 35,727 37,508 73,235 6,058,147
See accompanying notes to consolidated financial statements.
70
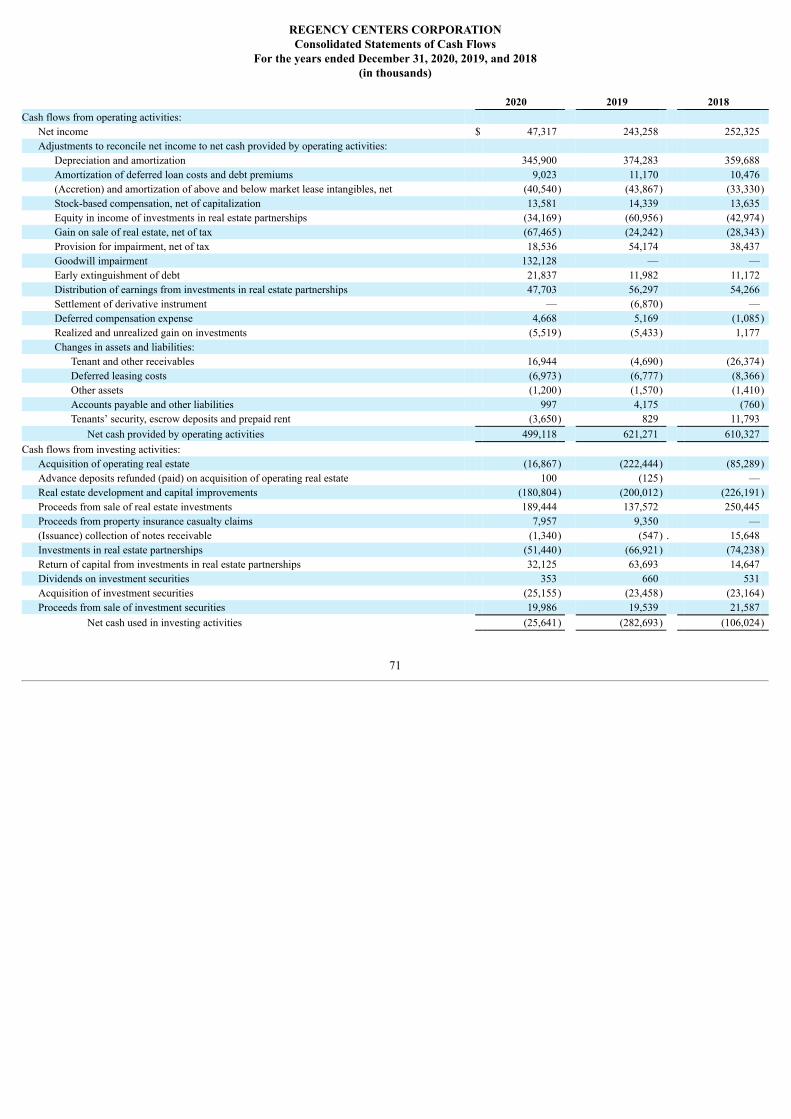
REGENCY CENTERS CORPORATIONConsolidated Statements of Cash Flows
For the years ended December 31, 2020, 2019, and 2018(in thousands)
2020 2019 2018
Cash flows from operating activities: Net income $ 47,317 243,258 252,325 Adjustments to reconcile net income to net cash provided by operating activities:
Depreciation and amortization 345,900 374,283 359,688 Amortization of deferred loan costs and debt premiums 9,023 11,170 10,476 (Accretion) and amortization of above and below market lease intangibles, net (40,540) (43,867) (33,330)Stock-based compensation, net of capitalization 13,581 14,339 13,635 Equity in income of investments in real estate partnerships (34,169) (60,956) (42,974)Gain on sale of real estate, net of tax (67,465) (24,242) (28,343)Provision for impairment, net of tax 18,536 54,174 38,437 Goodwill impairment 132,128 — — Early extinguishment of debt 21,837 11,982 11,172 Distribution of earnings from investments in real estate partnerships 47,703 56,297 54,266 Settlement of derivative instrument — (6,870) — Deferred compensation expense 4,668 5,169 (1,085)Realized and unrealized gain on investments (5,519) (5,433) 1,177 Changes in assets and liabilities:
Tenant and other receivables 16,944 (4,690) (26,374)Deferred leasing costs (6,973) (6,777) (8,366)Other assets (1,200) (1,570) (1,410)Accounts payable and other liabilities 997 4,175 (760)Tenants’ security, escrow deposits and prepaid rent (3,650) 829 11,793
Net cash provided by operating activities 499,118 621,271 610,327 Cash flows from investing activities:
Acquisition of operating real estate (16,867) (222,444) (85,289)Advance deposits refunded (paid) on acquisition of operating real estate 100 (125) — Real estate development and capital improvements (180,804) (200,012) (226,191)Proceeds from sale of real estate investments 189,444 137,572 250,445 Proceeds from property insurance casualty claims 7,957 9,350 — (Issuance) collection of notes receivable (1,340) (547) . 15,648 Investments in real estate partnerships (51,440) (66,921) (74,238)Return of capital from investments in real estate partnerships 32,125 63,693 14,647 Dividends on investment securities 353 660 531 Acquisition of investment securities (25,155) (23,458) (23,164)Proceeds from sale of investment securities 19,986 19,539 21,587
Net cash used in investing activities (25,641) (282,693) (106,024)
71
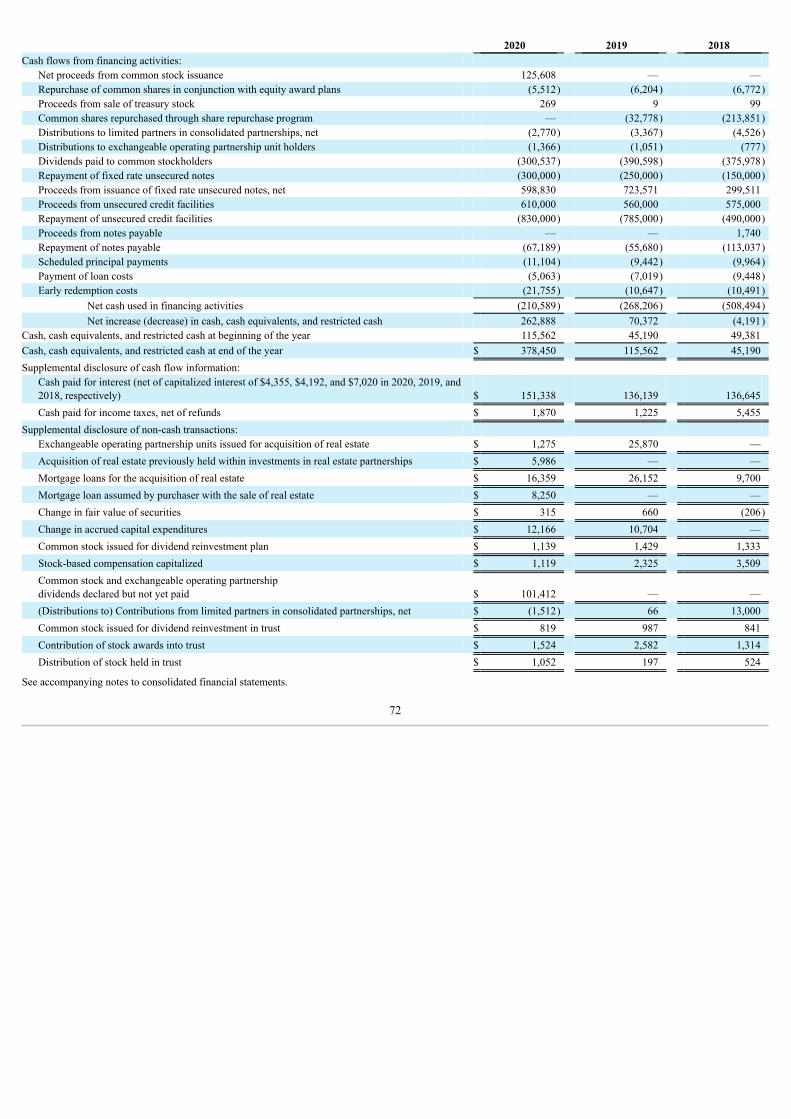
2020 2019 2018 Cash flows from financing activities:
Net proceeds from common stock issuance 125,608 — — Repurchase of common shares in conjunction with equity award plans (5,512) (6,204) (6,772)Proceeds from sale of treasury stock 269 9 99 Common shares repurchased through share repurchase program — (32,778) (213,851)Distributions to limited partners in consolidated partnerships, net (2,770) (3,367) (4,526)Distributions to exchangeable operating partnership unit holders (1,366) (1,051) (777)Dividends paid to common stockholders (300,537) (390,598) (375,978)Repayment of fixed rate unsecured notes (300,000) (250,000) (150,000)Proceeds from issuance of fixed rate unsecured notes, net 598,830 723,571 299,511 Proceeds from unsecured credit facilities 610,000 560,000 575,000 Repayment of unsecured credit facilities (830,000) (785,000) (490,000)Proceeds from notes payable — — 1,740 Repayment of notes payable (67,189) (55,680) (113,037)Scheduled principal payments (11,104) (9,442) (9,964)Payment of loan costs (5,063) (7,019) (9,448)Early redemption costs (21,755) (10,647) (10,491)
Net cash used in financing activities (210,589) (268,206) (508,494)Net increase (decrease) in cash, cash equivalents, and restricted cash 262,888 70,372 (4,191)
Cash, cash equivalents, and restricted cash at beginning of the year 115,562 45,190 49,381 Cash, cash equivalents, and restricted cash at end of the year $ 378,450 115,562 45,190 Supplemental disclosure of cash flow information:
Cash paid for interest (net of capitalized interest of $4,355, $4,192, and $7,020 in 2020, 2019, and2018, respectively) $ 151,338 136,139 136,645 Cash paid for income taxes, net of refunds $ 1,870 1,225 5,455
Supplemental disclosure of non-cash transactions: Exchangeable operating partnership units issued for acquisition of real estate $ 1,275 25,870 — Acquisition of real estate previously held within investments in real estate partnerships $ 5,986 — — Mortgage loans for the acquisition of real estate $ 16,359 26,152 9,700 Mortgage loan assumed by purchaser with the sale of real estate $ 8,250 — — Change in fair value of securities $ 315 660 (206)Change in accrued capital expenditures $ 12,166 10,704 — Common stock issued for dividend reinvestment plan $ 1,139 1,429 1,333 Stock-based compensation capitalized $ 1,119 2,325 3,509 Common stock and exchangeable operating partnershipdividends declared but not yet paid $ 101,412 — — (Distributions to) Contributions from limited partners in consolidated partnerships, net $ (1,512) 66 13,000 Common stock issued for dividend reinvestment in trust $ 819 987 841 Contribution of stock awards into trust $ 1,524 2,582 1,314 Distribution of stock held in trust $ 1,052 197 524
See accompanying notes to consolidated financial statements.
72
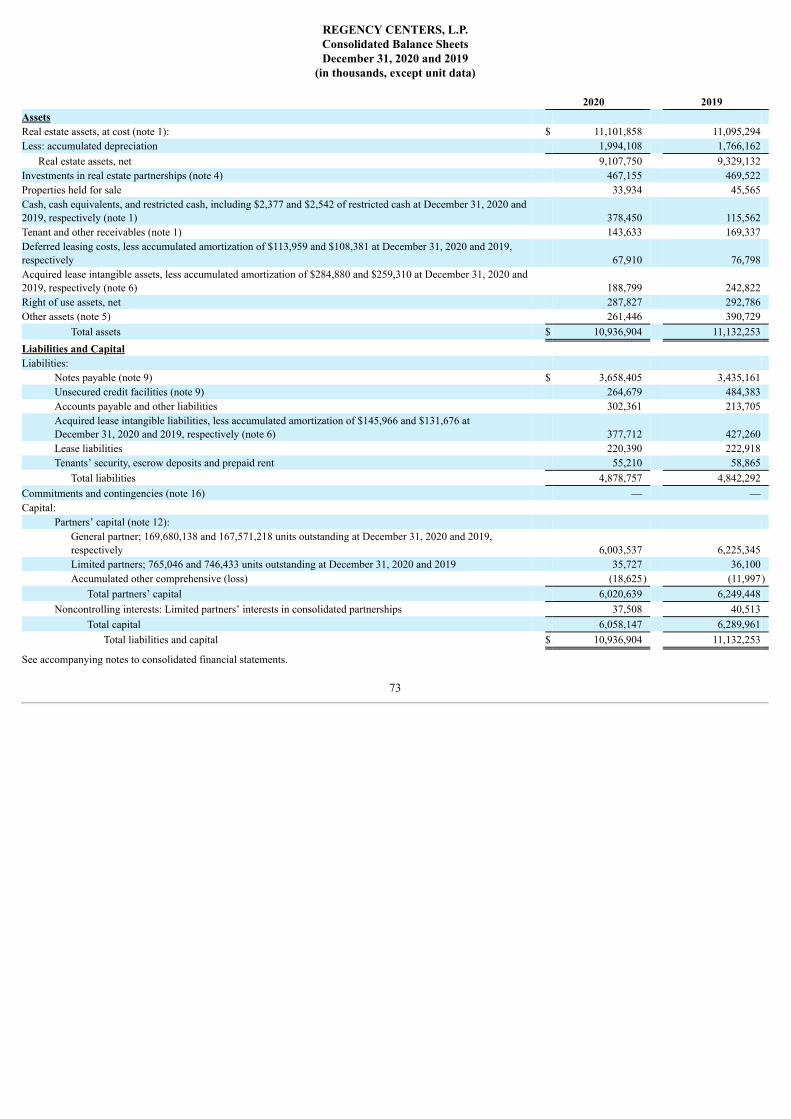
REGENCY CENTERS, L.P.Consolidated Balance SheetsDecember 31, 2020 and 2019
(in thousands, except unit data)
2020 2019 Assets Real estate assets, at cost (note 1): $ 11,101,858 11,095,294 Less: accumulated depreciation 1,994,108 1,766,162
Real estate assets, net 9,107,750 9,329,132 Investments in real estate partnerships (note 4) 467,155 469,522 Properties held for sale 33,934 45,565 Cash, cash equivalents, and restricted cash, including $2,377 and $2,542 of restricted cash at December 31, 2020 and2019, respectively (note 1) 378,450 115,562 Tenant and other receivables (note 1) 143,633 169,337 Deferred leasing costs, less accumulated amortization of $113,959 and $108,381 at December 31, 2020 and 2019,respectively 67,910 76,798 Acquired lease intangible assets, less accumulated amortization of $284,880 and $259,310 at December 31, 2020 and2019, respectively (note 6) 188,799 242,822 Right of use assets, net 287,827 292,786 Other assets (note 5) 261,446 390,729
Total assets $ 10,936,904 11,132,253 Liabilities and Capital Liabilities:
Notes payable (note 9) $ 3,658,405 3,435,161 Unsecured credit facilities (note 9) 264,679 484,383 Accounts payable and other liabilities 302,361 213,705 Acquired lease intangible liabilities, less accumulated amortization of $145,966 and $131,676 atDecember 31, 2020 and 2019, respectively (note 6) 377,712 427,260 Lease liabilities 220,390 222,918 Tenants’ security, escrow deposits and prepaid rent 55,210 58,865
Total liabilities 4,878,757 4,842,292 Commitments and contingencies (note 16) — — Capital:
Partners’ capital (note 12): General partner; 169,680,138 and 167,571,218 units outstanding at December 31, 2020 and 2019,respectively 6,003,537 6,225,345 Limited partners; 765,046 and 746,433 units outstanding at December 31, 2020 and 2019 35,727 36,100 Accumulated other comprehensive (loss) (18,625) (11,997)
Total partners’ capital 6,020,639 6,249,448 Noncontrolling interests: Limited partners’ interests in consolidated partnerships 37,508 40,513
Total capital 6,058,147 6,289,961 Total liabilities and capital $ 10,936,904 11,132,253
See accompanying notes to consolidated financial statements.
73
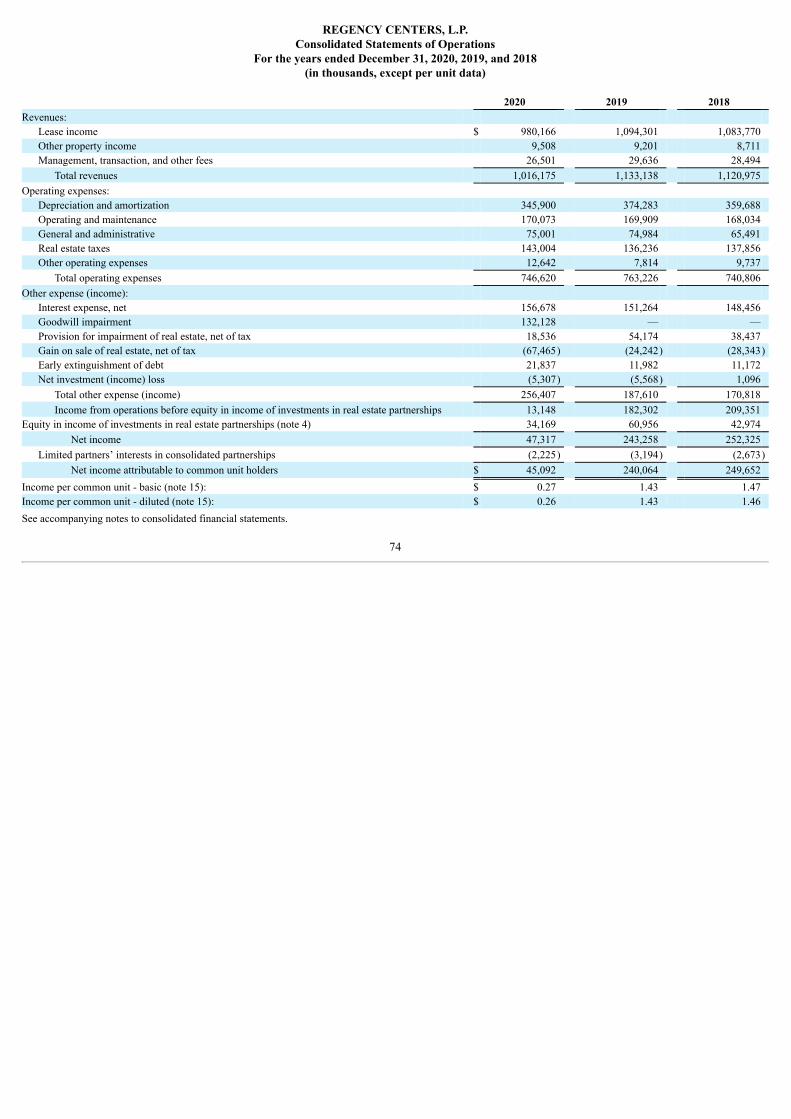
REGENCY CENTERS, L.P.
Consolidated Statements of OperationsFor the years ended December 31, 2020, 2019, and 2018
(in thousands, except per unit data)
2020 2019 2018 Revenues:
Lease income $ 980,166 1,094,301 1,083,770 Other property income 9,508 9,201 8,711 Management, transaction, and other fees 26,501 29,636 28,494
Total revenues 1,016,175 1,133,138 1,120,975 Operating expenses:
Depreciation and amortization 345,900 374,283 359,688 Operating and maintenance 170,073 169,909 168,034 General and administrative 75,001 74,984 65,491 Real estate taxes 143,004 136,236 137,856 Other operating expenses 12,642 7,814 9,737
Total operating expenses 746,620 763,226 740,806 Other expense (income):
Interest expense, net 156,678 151,264 148,456 Goodwill impairment 132,128 — — Provision for impairment of real estate, net of tax 18,536 54,174 38,437 Gain on sale of real estate, net of tax (67,465) (24,242) (28,343)Early extinguishment of debt 21,837 11,982 11,172 Net investment (income) loss (5,307) (5,568) 1,096
Total other expense (income) 256,407 187,610 170,818 Income from operations before equity in income of investments in real estate partnerships 13,148 182,302 209,351
Equity in income of investments in real estate partnerships (note 4) 34,169 60,956 42,974 Net income 47,317 243,258 252,325
Limited partners’ interests in consolidated partnerships (2,225) (3,194) (2,673)Net income attributable to common unit holders $ 45,092 240,064 249,652
Income per common unit - basic (note 15): $ 0.27 1.43 1.47 Income per common unit - diluted (note 15): $ 0.26 1.43 1.46
See accompanying notes to consolidated financial statements.
74
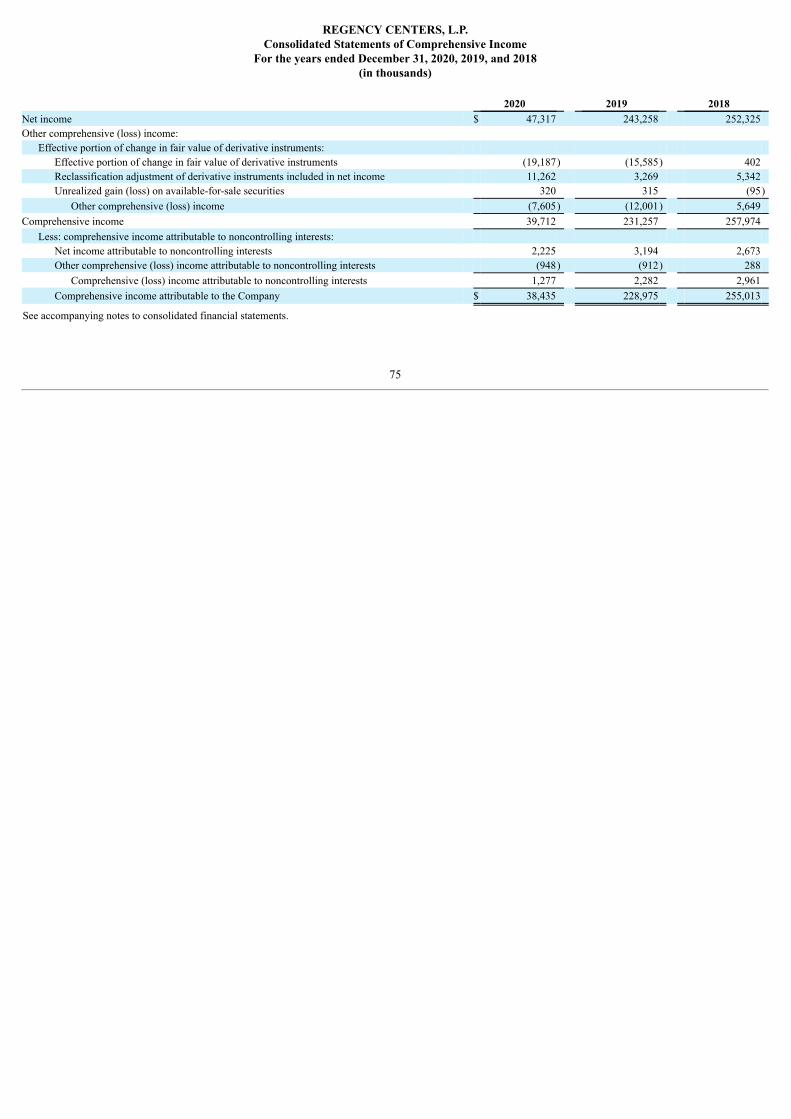
REGENCY CENTERS, L.P.
Consolidated Statements of Comprehensive IncomeFor the years ended December 31, 2020, 2019, and 2018
(in thousands)
2020 2019 2018 Net income $ 47,317 243,258 252,325 Other comprehensive (loss) income:
Effective portion of change in fair value of derivative instruments: Effective portion of change in fair value of derivative instruments (19,187) (15,585) 402 Reclassification adjustment of derivative instruments included in net income 11,262 3,269 5,342 Unrealized gain (loss) on available-for-sale securities 320 315 (95)
Other comprehensive (loss) income (7,605) (12,001) 5,649 Comprehensive income 39,712 231,257 257,974
Less: comprehensive income attributable to noncontrolling interests: Net income attributable to noncontrolling interests 2,225 3,194 2,673 Other comprehensive (loss) income attributable to noncontrolling interests (948) (912) 288
Comprehensive (loss) income attributable to noncontrolling interests 1,277 2,282 2,961 Comprehensive income attributable to the Company $ 38,435 228,975 255,013
See accompanying notes to consolidated financial statements.
75
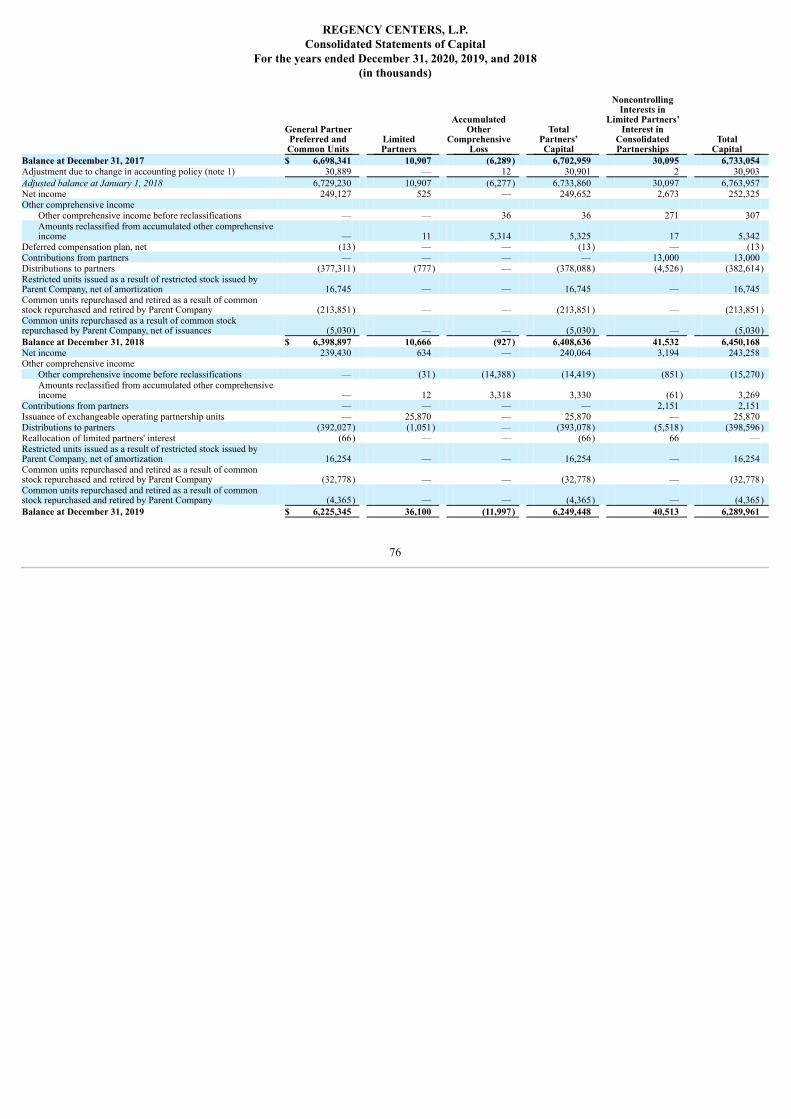
REGENCY CENTERS, L.P.
Consolidated Statements of CapitalFor the years ended December 31, 2020, 2019, and 2018
(in thousands)
General PartnerPreferred andCommon Units
LimitedPartners
AccumulatedOther
ComprehensiveLoss
TotalPartners’Capital
NoncontrollingInterests in
Limited Partners’Interest in
ConsolidatedPartnerships
TotalCapital
Balance at December 31, 2017 $ 6,698,341 10,907 (6,289) 6,702,959 30,095 6,733,054 Adjustment due to change in accounting policy (note 1) 30,889 — 12 30,901 2 30,903 Adjusted balance at January 1, 2018 6,729,230 10,907 (6,277) 6,733,860 30,097 6,763,957 Net income 249,127 525 — 249,652 2,673 252,325 Other comprehensive income
Other comprehensive income before reclassifications — — 36 36 271 307 Amounts reclassified from accumulated other comprehensiveincome — 11 5,314 5,325 17 5,342
Deferred compensation plan, net (13) — — (13) — (13)Contributions from partners — — — — 13,000 13,000 Distributions to partners (377,311) (777) — (378,088) (4,526) (382,614)Restricted units issued as a result of restricted stock issued byParent Company, net of amortization 16,745 — — 16,745 — 16,745 Common units repurchased and retired as a result of commonstock repurchased and retired by Parent Company (213,851) — — (213,851) — (213,851)Common units repurchased as a result of common stockrepurchased by Parent Company, net of issuances (5,030) — — (5,030) — (5,030)Balance at December 31, 2018 $ 6,398,897 10,666 (927) 6,408,636 41,532 6,450,168 Net income 239,430 634 — 240,064 3,194 243,258 Other comprehensive income
Other comprehensive income before reclassifications — (31) (14,388) (14,419) (851) (15,270)Amounts reclassified from accumulated other comprehensiveincome — 12 3,318 3,330 (61) 3,269
Contributions from partners — — — — 2,151 2,151 Issuance of exchangeable operating partnership units — 25,870 — 25,870 — 25,870 Distributions to partners (392,027) (1,051) — (393,078) (5,518) (398,596)Reallocation of limited partners' interest (66) — — (66) 66 — Restricted units issued as a result of restricted stock issued byParent Company, net of amortization 16,254 — — 16,254 — 16,254 Common units repurchased and retired as a result of commonstock repurchased and retired by Parent Company (32,778) — — (32,778) — (32,778)Common units repurchased and retired as a result of commonstock repurchased and retired by Parent Company (4,365) — — (4,365) — (4,365)Balance at December 31, 2019 $ 6,225,345 36,100 (11,997) 6,249,448 40,513 6,289,961
76
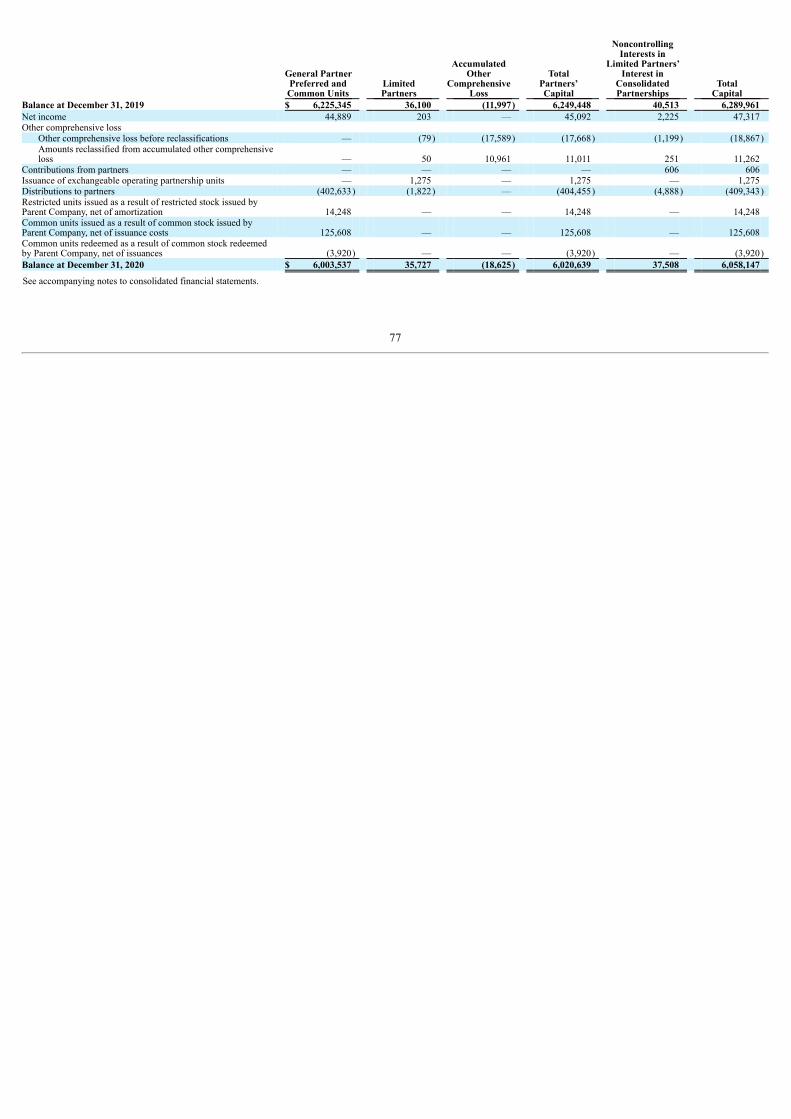
General PartnerPreferred andCommon Units
LimitedPartners
AccumulatedOther
ComprehensiveLoss
TotalPartners’Capital
NoncontrollingInterests in
Limited Partners’Interest in
ConsolidatedPartnerships
TotalCapital
Balance at December 31, 2019 $ 6,225,345 36,100 (11,997) 6,249,448 40,513 6,289,961 Net income 44,889 203 — 45,092 2,225 47,317 Other comprehensive loss
Other comprehensive loss before reclassifications — (79) (17,589) (17,668) (1,199) (18,867)Amounts reclassified from accumulated other comprehensiveloss — 50 10,961 11,011 251 11,262
Contributions from partners — — — — 606 606 Issuance of exchangeable operating partnership units — 1,275 — 1,275 — 1,275 Distributions to partners (402,633) (1,822) — (404,455) (4,888) (409,343)Restricted units issued as a result of restricted stock issued byParent Company, net of amortization 14,248 — — 14,248 — 14,248 Common units issued as a result of common stock issued byParent Company, net of issuance costs 125,608 — — 125,608 — 125,608 Common units redeemed as a result of common stock redeemedby Parent Company, net of issuances (3,920) — — (3,920) — (3,920)Balance at December 31, 2020 $ 6,003,537 35,727 (18,625) 6,020,639 37,508 6,058,147
See accompanying notes to consolidated financial statements.
77
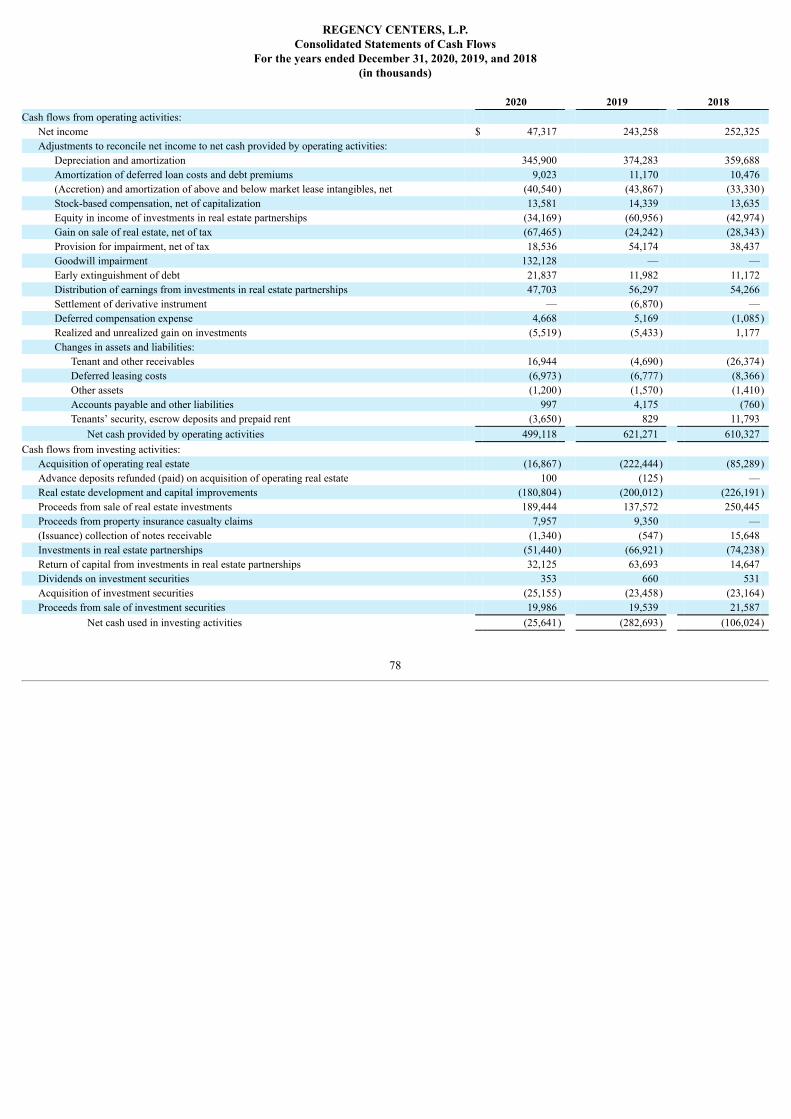
REGENCY CENTERS, L.P.
Consolidated Statements of Cash FlowsFor the years ended December 31, 2020, 2019, and 2018
(in thousands)
2020 2019 2018 Cash flows from operating activities:
Net income $ 47,317 243,258 252,325 Adjustments to reconcile net income to net cash provided by operating activities:
Depreciation and amortization 345,900 374,283 359,688 Amortization of deferred loan costs and debt premiums 9,023 11,170 10,476 (Accretion) and amortization of above and below market lease intangibles, net (40,540) (43,867) (33,330)Stock-based compensation, net of capitalization 13,581 14,339 13,635 Equity in income of investments in real estate partnerships (34,169) (60,956) (42,974)Gain on sale of real estate, net of tax (67,465) (24,242) (28,343)Provision for impairment, net of tax 18,536 54,174 38,437 Goodwill impairment 132,128 — — Early extinguishment of debt 21,837 11,982 11,172 Distribution of earnings from investments in real estate partnerships 47,703 56,297 54,266 Settlement of derivative instrument — (6,870) — Deferred compensation expense 4,668 5,169 (1,085)Realized and unrealized gain on investments (5,519) (5,433) 1,177 Changes in assets and liabilities:
Tenant and other receivables 16,944 (4,690) (26,374)Deferred leasing costs (6,973) (6,777) (8,366)Other assets (1,200) (1,570) (1,410)Accounts payable and other liabilities 997 4,175 (760)Tenants’ security, escrow deposits and prepaid rent (3,650) 829 11,793
Net cash provided by operating activities 499,118 621,271 610,327 Cash flows from investing activities:
Acquisition of operating real estate (16,867) (222,444) (85,289)Advance deposits refunded (paid) on acquisition of operating real estate 100 (125) — Real estate development and capital improvements (180,804) (200,012) (226,191)Proceeds from sale of real estate investments 189,444 137,572 250,445 Proceeds from property insurance casualty claims 7,957 9,350 — (Issuance) collection of notes receivable (1,340) (547) 15,648 Investments in real estate partnerships (51,440) (66,921) (74,238)Return of capital from investments in real estate partnerships 32,125 63,693 14,647 Dividends on investment securities 353 660 531 Acquisition of investment securities (25,155) (23,458) (23,164)Proceeds from sale of investment securities 19,986 19,539 21,587
Net cash used in investing activities (25,641) (282,693) (106,024)
78
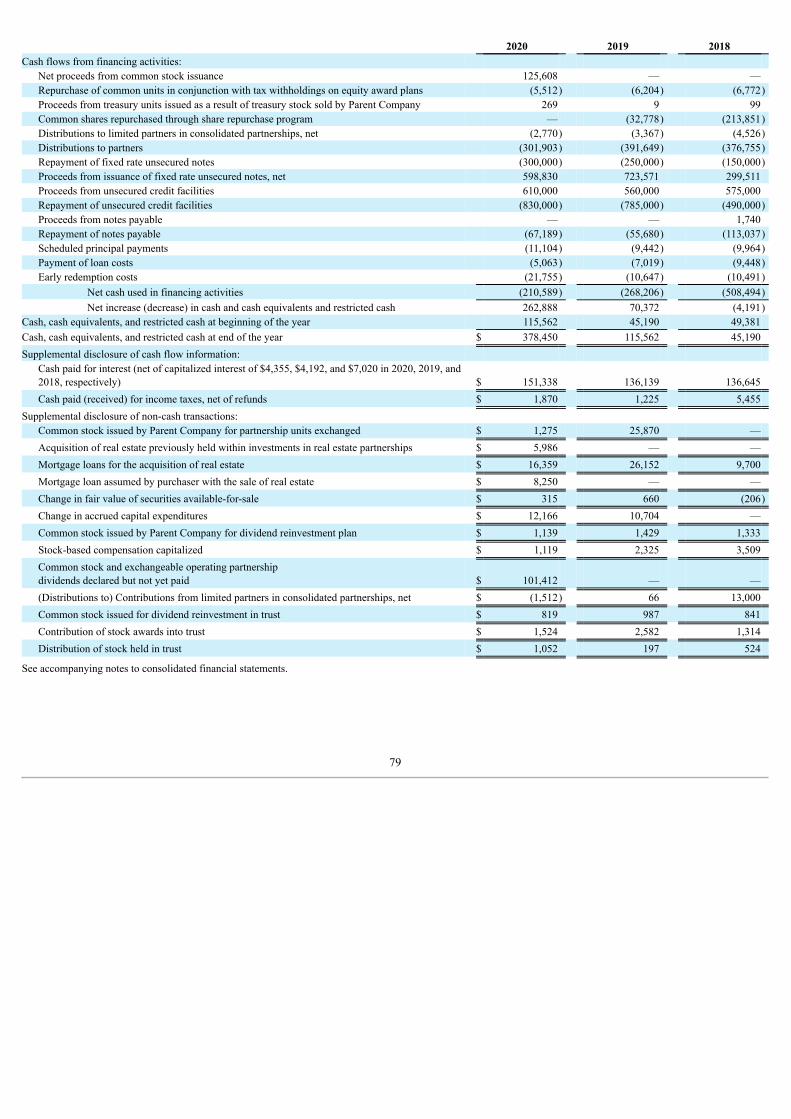
2020 2019 2018 Cash flows from financing activities:
Net proceeds from common stock issuance 125,608 — — Repurchase of common units in conjunction with tax withholdings on equity award plans (5,512) (6,204) (6,772)Proceeds from treasury units issued as a result of treasury stock sold by Parent Company 269 9 99 Common shares repurchased through share repurchase program — (32,778) (213,851)Distributions to limited partners in consolidated partnerships, net (2,770) (3,367) (4,526)Distributions to partners (301,903) (391,649) (376,755)Repayment of fixed rate unsecured notes (300,000) (250,000) (150,000)Proceeds from issuance of fixed rate unsecured notes, net 598,830 723,571 299,511 Proceeds from unsecured credit facilities 610,000 560,000 575,000 Repayment of unsecured credit facilities (830,000) (785,000) (490,000)Proceeds from notes payable — — 1,740 Repayment of notes payable (67,189) (55,680) (113,037)Scheduled principal payments (11,104) (9,442) (9,964)Payment of loan costs (5,063) (7,019) (9,448)Early redemption costs (21,755) (10,647) (10,491)
Net cash used in financing activities (210,589) (268,206) (508,494)Net increase (decrease) in cash and cash equivalents and restricted cash 262,888 70,372 (4,191)
Cash, cash equivalents, and restricted cash at beginning of the year 115,562 45,190 49,381 Cash, cash equivalents, and restricted cash at end of the year $ 378,450 115,562 45,190 Supplemental disclosure of cash flow information:
Cash paid for interest (net of capitalized interest of $4,355, $4,192, and $7,020 in 2020, 2019, and2018, respectively) $ 151,338 136,139 136,645 Cash paid (received) for income taxes, net of refunds $ 1,870 1,225 5,455
Supplemental disclosure of non-cash transactions: Common stock issued by Parent Company for partnership units exchanged $ 1,275 25,870 — Acquisition of real estate previously held within investments in real estate partnerships $ 5,986 — — Mortgage loans for the acquisition of real estate $ 16,359 26,152 9,700 Mortgage loan assumed by purchaser with the sale of real estate $ 8,250 — — Change in fair value of securities available-for-sale $ 315 660 (206)Change in accrued capital expenditures $ 12,166 10,704 — Common stock issued by Parent Company for dividend reinvestment plan $ 1,139 1,429 1,333 Stock-based compensation capitalized $ 1,119 2,325 3,509 Common stock and exchangeable operating partnershipdividends declared but not yet paid $ 101,412 — — (Distributions to) Contributions from limited partners in consolidated partnerships, net $ (1,512) 66 13,000 Common stock issued for dividend reinvestment in trust $ 819 987 841 Contribution of stock awards into trust $ 1,524 2,582 1,314 Distribution of stock held in trust $ 1,052 197 524
See accompanying notes to consolidated financial statements.
79
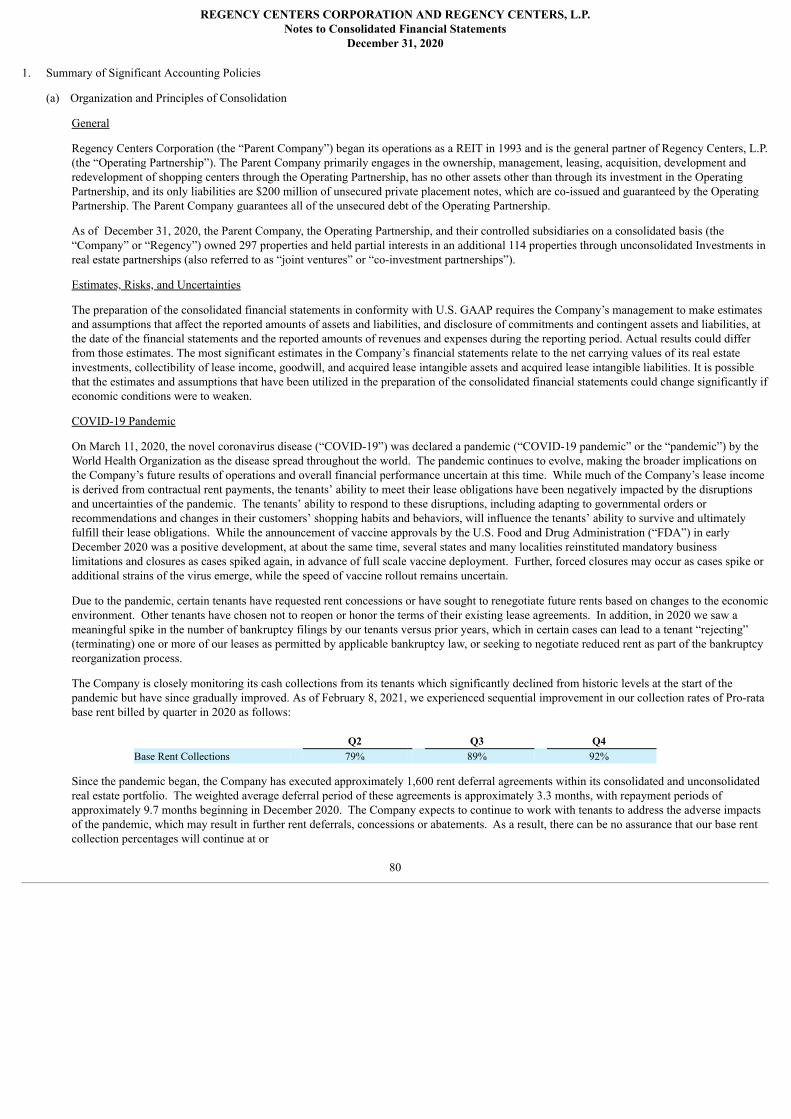
REGENCY CENTERS CORPORATION AND REGENCY CENTERS, L.P.Notes to Consolidated Financial Statements
December 31, 2020
1. Summary of Significant Accounting Policies
(a) Organization and Principles of Consolidation
General
Regency Centers Corporation (the “Parent Company”) began its operations as a REIT in 1993 and is the general partner of Regency Centers, L.P.(the “Operating Partnership”). The Parent Company primarily engages in the ownership, management, leasing, acquisition, development andredevelopment of shopping centers through the Operating Partnership, has no other assets other than through its investment in the OperatingPartnership, and its only liabilities are $200 million of unsecured private placement notes, which are co-issued and guaranteed by the OperatingPartnership. The Parent Company guarantees all of the unsecured debt of the Operating Partnership.
As of December 31, 2020, the Parent Company, the Operating Partnership, and their controlled subsidiaries on a consolidated basis (the“Company” or “Regency”) owned 297 properties and held partial interests in an additional 114 properties through unconsolidated Investments inreal estate partnerships (also referred to as “joint ventures” or “co-investment partnerships”).
Estimates, Risks, and Uncertainties
The preparation of the consolidated financial statements in conformity with U.S. GAAP requires the Company’s management to make estimatesand assumptions that affect the reported amounts of assets and liabilities, and disclosure of commitments and contingent assets and liabilities, atthe date of the financial statements and the reported amounts of revenues and expenses during the reporting period. Actual results could differfrom those estimates. The most significant estimates in the Company’s financial statements relate to the net carrying values of its real estateinvestments, collectibility of lease income, goodwill, and acquired lease intangible assets and acquired lease intangible liabilities. It is possiblethat the estimates and assumptions that have been utilized in the preparation of the consolidated financial statements could change significantly ifeconomic conditions were to weaken.
COVID-19 Pandemic
On March 11, 2020, the novel coronavirus disease (“COVID-19”) was declared a pandemic (“COVID-19 pandemic” or the “pandemic”) by theWorld Health Organization as the disease spread throughout the world. The pandemic continues to evolve, making the broader implications onthe Company’s future results of operations and overall financial performance uncertain at this time. While much of the Company’s lease incomeis derived from contractual rent payments, the tenants’ ability to meet their lease obligations have been negatively impacted by the disruptionsand uncertainties of the pandemic. The tenants’ ability to respond to these disruptions, including adapting to governmental orders orrecommendations and changes in their customers’ shopping habits and behaviors, will influence the tenants’ ability to survive and ultimatelyfulfill their lease obligations. While the announcement of vaccine approvals by the U.S. Food and Drug Administration (“FDA”) in earlyDecember 2020 was a positive development, at about the same time, several states and many localities reinstituted mandatory businesslimitations and closures as cases spiked again, in advance of full scale vaccine deployment. Further, forced closures may occur as cases spike oradditional strains of the virus emerge, while the speed of vaccine rollout remains uncertain.
Due to the pandemic, certain tenants have requested rent concessions or have sought to renegotiate future rents based on changes to the economicenvironment. Other tenants have chosen not to reopen or honor the terms of their existing lease agreements. In addition, in 2020 we saw ameaningful spike in the number of bankruptcy filings by our tenants versus prior years, which in certain cases can lead to a tenant “rejecting”(terminating) one or more of our leases as permitted by applicable bankruptcy law, or seeking to negotiate reduced rent as part of the bankruptcyreorganization process.
The Company is closely monitoring its cash collections from its tenants which significantly declined from historic levels at the start of thepandemic but have since gradually improved. As of February 8, 2021, we experienced sequential improvement in our collection rates of Pro-ratabase rent billed by quarter in 2020 as follows:
Q2 Q3 Q4 Base Rent Collections 79% 89% 92%
Since the pandemic began, the Company has executed approximately 1,600 rent deferral agreements within its consolidated and unconsolidatedreal estate portfolio. The weighted average deferral period of these agreements is approximately 3.3 months, with repayment periods ofapproximately 9.7 months beginning in December 2020. The Company expects to continue to work with tenants to address the adverse impactsof the pandemic, which may result in further rent deferrals, concessions or abatements. As a result, there can be no assurance that our base rentcollection percentages will continue at or
80
REGENCY CENTERS CORPORATION AND REGENCY CENTERS, L.P.Notes to Consolidated Financial Statements
December 31, 2020
above Q4 2020 levels, or that cash flows from operations will be sufficient to sustain and fund the Company’s dividend payments without thebenefit of other sources of capital or changes to its current dividend levels. In the event of a surge in COVID-19 cases or new governmentalrestrictions causing our tenants to reduce their operations or close, our base rent collection percentages and percent leased could decline fromrecent 2020 levels.
New leasing activity declined in 2020 and is expected to remain below 2019 levels into 2021 as businesses delay executing leases amidst theimmediate and uncertain future economic impacts of the pandemic. This, coupled with tenant failures and bankruptcies, may result in decreaseddemand for space in our centers, which could result in pricing pressure on rents. Additionally, if construction of tenant improvements aredelayed due to the impacts of the pandemic, it may take longer before new tenants are able to open and commence rent payments, or attract newtenants.
The pandemic has adversely impacted the Company’s ability to start or complete tenant buildouts, new ground up development, orredevelopment of existing properties. The pandemic has also impacted the Company’s ability to timely source materials for construction and hascaused labor shortages which have impacted its ability to complete construction projects on anticipated schedules. In the event a surge in newcases resulting in additional lockdowns occurs, similar impacts to the Company’s supply chain may arise which could have a material adverseeffect on the Company’s business, financial condition and results of operation. The Company continues to closely monitor its projects, whichhas resulted in prudently delaying, phasing or curtailing certain in-process and planned development, redevelopment and capital expenditureprojects.
The duration and severity of the pandemic across the United States will continue to negatively impact many of the Company’s tenants, and theirability to meet their rent obligations under their lease agreements with the Company. As such, the impact from the pandemic could stillnegatively impact the Company’s results of operations and financial condition in the future.
Our business continuity and disaster recovery plan enabled us to continue operating productively during the pandemic. We have maintained, andexpect to continue to maintain, without interruption, our financial reporting systems as well as our internal controls over our financial reportingand disclosure controls and procedures.
Consolidation
The accompanying consolidated financial statements include the accounts of the Parent Company, the Operating Partnership, its wholly-ownedsubsidiaries, and consolidated partnerships in which the Company has a controlling interest. Investments in real estate partnerships not controlledby the Company are accounted for under the equity method. All significant inter-company balances and transactions are eliminated in theconsolidated financial statements.
The Company consolidates properties that are wholly owned or properties where it owns less than 100%, but which it has control over theactivities most important to the overall success of the partnership. Control is determined using an evaluation based on accounting standardsrelated to the consolidation of variable interest entities (“VIEs”) and voting interest entities. For joint ventures that are determined to be a VIE,the Company consolidates the entity where it is deemed to be the primary beneficiary. Determination of the primary beneficiary is based onwhether an entity has (1) the power to direct the activities of the VIE that most significantly impact the entity’s economic performance, and (2)the obligation to absorb losses of the entity that could potentially be significant to the VIE or the right to receive benefits from the entity thatcould potentially be significant to the VIE.
81
REGENCY CENTERS CORPORATION AND REGENCY CENTERS, L.P.Notes to Consolidated Financial Statements
December 31, 2020
Ownership of the Parent Company
The Parent Company has a single class of common stock outstanding.
Ownership of the Operating Partnership
The Operating Partnership's capital includes general and limited common Partnership Units. As of December 31, 2020, the Parent Companyowned approximately 99.6%, or 169,680,138, of the 170,445,184 outstanding common Partnership Units of the Operating Partnership, with theremaining limited common Partnership Units held by third parties (“Exchangeable operating partnership units” or “EOP units”). Each EOP unitis exchangeable for cash or one share of common stock of the Parent Company, at the discretion of the Parent Company, and the unit holdercannot require redemption in cash or other assets (i.e. registered shares of the Parent). The Parent Company has evaluated the conditions asspecified under Accounting Standards Codification (“ASC”) Topic 480, Distinguishing Liabilities from Equity as it relates to exchangeableoperating partnership units outstanding and concluded that it has the right to satisfy the redemption requirements of the units by deliveringunregistered common stock. Accordingly, the Parent Company classifies EOP units as permanent equity in the accompanying ConsolidatedBalance Sheets and Consolidated Statements of Equity and Comprehensive Income. The Parent Company serves as general partner of theOperating Partnership. The EOP unit holders have limited rights over the Operating Partnership such that they do not have the power to direct theactivities of the Operating Partnership. As such, the Operating Partnership is considered a VIE, and the Parent Company, which consolidates it, isthe primary beneficiary. The Parent Company's only investment is the Operating Partnership. Net income and distributions of the OperatingPartnership are allocable to the general and limited common Partnership Units in accordance with their ownership percentages.
Real Estate Partnerships
Regency has a partial ownership interest in 124 properties through partnerships, of which 10 are consolidated. Regency's partners includeinstitutional investors and other real estate developers and/or operators (the “Partners” or “Limited Partners”). Regency has a variable interest inthese entities through its equity interests. As managing member, Regency maintains the books and records and typically provides leasing andproperty and asset management services to the partnerships. The Partners’ level of involvement in these partnerships varies from protectivedecisions (debt, bankruptcy, selling primary asset(s) of business) to participating involvement such as approving leases, operating budgets, andcapital budgets. The assets of these partnerships are restricted to the use of the partnerships and cannot be used by general creditors of theCompany. And similarly, the obligations of these partnerships can only be settled by the assets of these partnerships or additional contributionsby the partners.
• Those partnerships for which the Partners are involved in the day to day decisions and do not have any other aspects that would causethem to be considered VIEs, are evaluated for consolidation using the voting interest model.
o Those partnerships in which Regency has a controlling financial interest are consolidated and the limited partners’ownership interest and share of net income is recorded as noncontrolling interest.
o Those partnerships in which Regency does not have a controlling financial interest are accounted for using the equitymethod and Regency's ownership interest is recognized through single-line presentation as Investments in real estatepartnerships, in the Consolidated Balance Sheet, and Equity in income of investments in real estate partnerships, in theConsolidated Statements of Operations. Cash distributions of earnings from operations from Investments in real estatepartnerships are presented in Cash flows provided by operating activities in the accompanying Consolidated Statements ofCash Flows. Cash distributions from the sale of a property or loan proceeds received from the placement of debt on aproperty included in Investments in real estate partnerships are presented in Cash flows provided by investing activities inthe accompanying Consolidated Statements of Cash Flows. Distributed proceeds from debt refinancing and real estate salesin excess of Regency's carrying value of its investment has resulted in a negative investment balance for one partnership,which is recorded within Accounts payable and other liabilities in the Consolidated Balance Sheets.
The net difference in the carrying amount of investments in real estate partnerships and the underlying equity in net assets isaccreted to earnings and recorded in Equity in income of investments in real estate partnerships in the accompanyingConsolidated Statements of Operations over the expected useful lives of the properties and other intangible assets, whichrange in lives from 10 to 40 years.
82
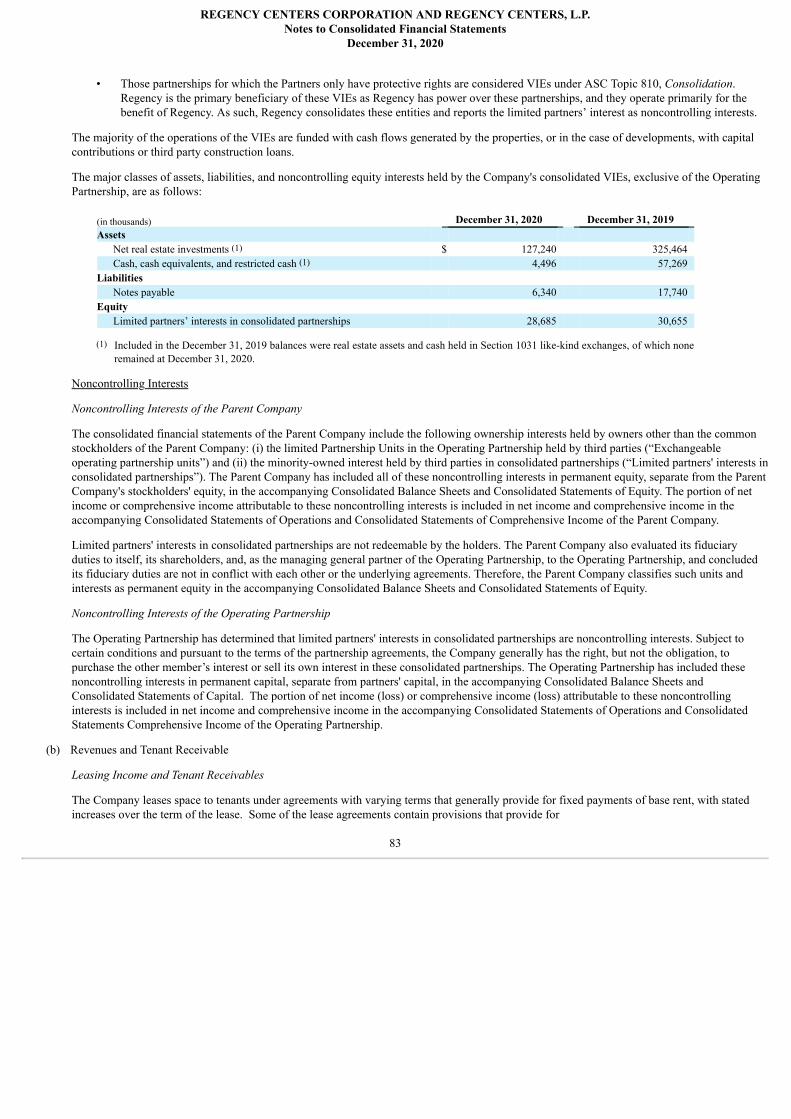
REGENCY CENTERS CORPORATION AND REGENCY CENTERS, L.P.Notes to Consolidated Financial Statements
December 31, 2020
• Those partnerships for which the Partners only have protective rights are considered VIEs under ASC Topic 810, Consolidation.Regency is the primary beneficiary of these VIEs as Regency has power over these partnerships, and they operate primarily for thebenefit of Regency. As such, Regency consolidates these entities and reports the limited partners’ interest as noncontrolling interests.
The majority of the operations of the VIEs are funded with cash flows generated by the properties, or in the case of developments, with capitalcontributions or third party construction loans.
The major classes of assets, liabilities, and noncontrolling equity interests held by the Company's consolidated VIEs, exclusive of the OperatingPartnership, are as follows:
(in thousands) December 31, 2020 December 31, 2019 Assets
Net real estate investments (1) $ 127,240 325,464 Cash, cash equivalents, and restricted cash (1) 4,496 57,269
Liabilities Notes payable 6,340 17,740
Equity Limited partners’ interests in consolidated partnerships 28,685 30,655
(1) Included in the December 31, 2019 balances were real estate assets and cash held in Section 1031 like-kind exchanges, of which noneremained at December 31, 2020.
Noncontrolling Interests
Noncontrolling Interests of the Parent Company
The consolidated financial statements of the Parent Company include the following ownership interests held by owners other than the commonstockholders of the Parent Company: (i) the limited Partnership Units in the Operating Partnership held by third parties (“Exchangeableoperating partnership units”) and (ii) the minority-owned interest held by third parties in consolidated partnerships (“Limited partners' interests inconsolidated partnerships”). The Parent Company has included all of these noncontrolling interests in permanent equity, separate from the ParentCompany's stockholders' equity, in the accompanying Consolidated Balance Sheets and Consolidated Statements of Equity. The portion of netincome or comprehensive income attributable to these noncontrolling interests is included in net income and comprehensive income in theaccompanying Consolidated Statements of Operations and Consolidated Statements of Comprehensive Income of the Parent Company.
Limited partners' interests in consolidated partnerships are not redeemable by the holders. The Parent Company also evaluated its fiduciaryduties to itself, its shareholders, and, as the managing general partner of the Operating Partnership, to the Operating Partnership, and concludedits fiduciary duties are not in conflict with each other or the underlying agreements. Therefore, the Parent Company classifies such units andinterests as permanent equity in the accompanying Consolidated Balance Sheets and Consolidated Statements of Equity.
Noncontrolling Interests of the Operating Partnership
The Operating Partnership has determined that limited partners' interests in consolidated partnerships are noncontrolling interests. Subject tocertain conditions and pursuant to the terms of the partnership agreements, the Company generally has the right, but not the obligation, topurchase the other member’s interest or sell its own interest in these consolidated partnerships. The Operating Partnership has included thesenoncontrolling interests in permanent capital, separate from partners' capital, in the accompanying Consolidated Balance Sheets andConsolidated Statements of Capital. The portion of net income (loss) or comprehensive income (loss) attributable to these noncontrollinginterests is included in net income and comprehensive income in the accompanying Consolidated Statements of Operations and ConsolidatedStatements Comprehensive Income of the Operating Partnership.
(b) Revenues and Tenant Receivable
Leasing Income and Tenant Receivables
The Company leases space to tenants under agreements with varying terms that generally provide for fixed payments of base rent, with statedincreases over the term of the lease. Some of the lease agreements contain provisions that provide for
83
REGENCY CENTERS CORPORATION AND REGENCY CENTERS, L.P.Notes to Consolidated Financial Statements
December 31, 2020
additional rents based on tenants' sales volume (“percentage rent”), which are recognized when the tenants achieve the specified targets asdefined in their lease agreements. Additionally, most lease agreements contain provisions for reimbursement of the tenants' share of actual realestate taxes, insurance and common area maintenance (“CAM”) costs (collectively “Recoverable Costs”) incurred.
Lease terms generally range from three to seven years for tenant space under 10,000 square feet (“Shop Space”) and in excess of five years forspaces greater than 10,000 square feet (“Anchor Space”). Many leases also provide the option for the tenants to extend their lease beyond theinitial term of the lease. If a tenant does not exercise its option or otherwise negotiate to renew, the lease expires and the lease contains anobligation for the tenant to relinquish its space, allowing it to be leased to a new tenant. This generally involves some level of cost to prepare thespace for re-leasing, which is capitalized and depreciated over the shorter of the life of the subsequent lease or the life of the improvement.
On January 1, 2019, the Company adopted the new accounting guidance in Accounting Standards Codification (“ASC”) Topic 842, Leases,including all related Accounting Standard Updates (“ASU”). Prior to that, the Company applied ASC Topic 840, Leases, which required similarstraight line lease income and expense recognition, and allowed initial indirect leasing costs to be deferred, but did not require balance sheetrecognition of Right of use assets or Lease liabilities.
Classification
Under Topic 842, new leases or modifications thereto must be evaluated against specific classification criteria, which, based on thecustomary terms of the Company’s leases, are classified as operating leases, similar to the Company’s lease classification under the previousTopic 840. However, certain longer-term leases (both lessee and lessor leases) may be classified as direct financing or sales type leases,which may result in selling profit and an accelerated pattern of earnings recognition. At December 31, 2020, all of the Company’s leaseswere classified as operating leases. See the pandemic discussion that follows for unique considerations amidst the pandemic.
Recognition and Presentation
CAM is a non-lease component of the lease contract under Topic 842, and therefore recognition for these CAM expenses would beaccounted for under Topic 606, Revenue from Contracts with Customers, and presented separate from Lease income in the ConsolidatedStatements of Operations, based on an allocation of the overall consideration in the lease contract, which is not necessarily the amount thatwould be billable to the tenants for CAM reimbursements per the terms of the lease contract. As the timing and pattern of providing theCAM service to the tenant is the same as the timing and pattern of the tenants' use of the underlying lease asset, the Company elected, aspart of an available practical expedient, to combine CAM with the remaining lease components, along with tenants' reimbursement of realestate taxes and insurance, and recognize them together as Lease income in the accompanying Consolidated Statements of Operations.
Collectibility
Lease income for operating leases with fixed payment terms is recognized on a straight-line basis over the expected term of the lease for allleases for which collectibility is considered probable at the commencement date. At lease commencement, the Company generally expectsthat collectibility of substantially all payments due under the lease is probable due to the Company’s credit checks on tenants and othercreditworthiness analysis undertaken before entering into a new lease; therefore, income from most operating leases is initially recognizedon a straight-line basis. For operating leases in which collectibility of Lease income is not considered probable, Lease income is recognizedon a cash basis and all previously recognized straight-line rent receivables are reversed in the period in which the Lease income isdetermined not to be probable of collection. In addition to the lease-specific collectibility assessment performed under Topic 842, theCompany may also recognize a general reserve, as a reduction to Lease income, for its portfolio of operating lease receivables which are notexpected to be fully collectible based on the Company’s historical collection experience.
The Company estimates the collectibility of the accounts receivable related to base rents, straight-line rents, recoveries from tenants, andother revenue taking into consideration the Company's historical write-off experience, tenant credit-worthiness, current economic trends,and remaining lease terms. Beginning with the adoption of ASC 842, Leases, on January 1, 2019, uncollectible lease income is a directcharge against Lease income. Prior to 2019, uncollectible lease income was recorded in Other operating expenses, while uncollectiblestraight line rent was recorded as a charge to Lease income.
84
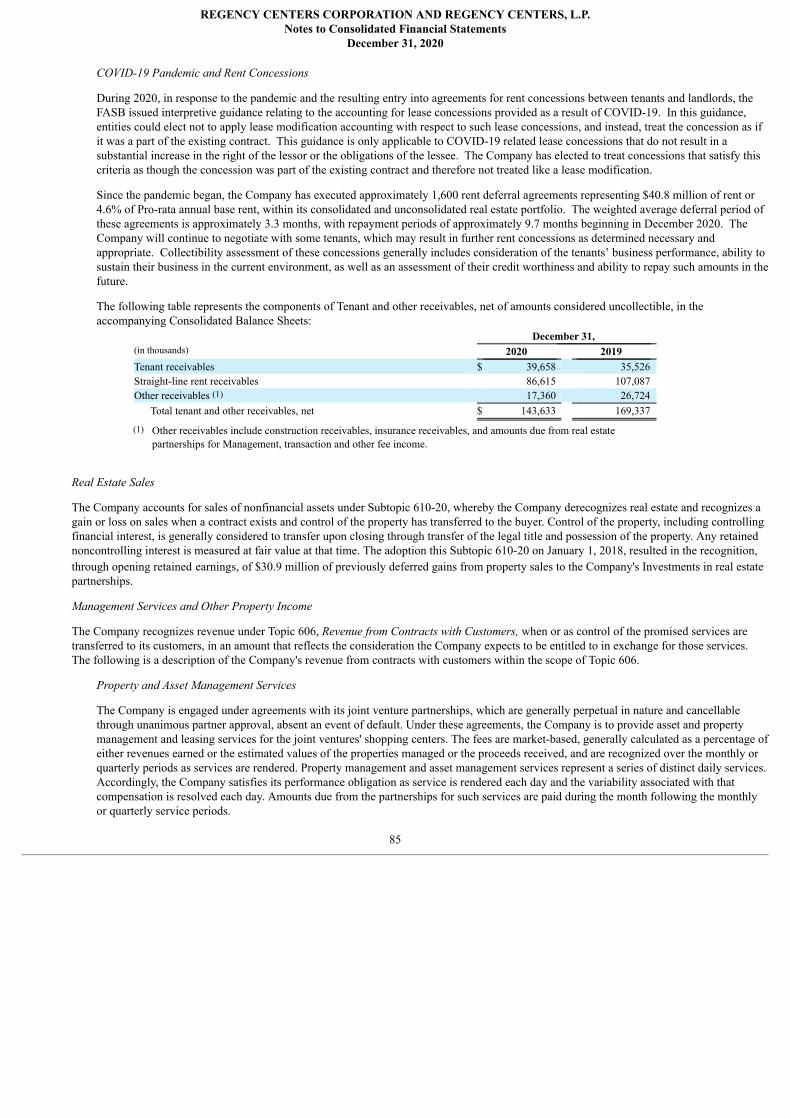
REGENCY CENTERS CORPORATION AND REGENCY CENTERS, L.P.Notes to Consolidated Financial Statements
December 31, 2020
COVID-19 Pandemic and Rent Concessions
During 2020, in response to the pandemic and the resulting entry into agreements for rent concessions between tenants and landlords, theFASB issued interpretive guidance relating to the accounting for lease concessions provided as a result of COVID-19. In this guidance,entities could elect not to apply lease modification accounting with respect to such lease concessions, and instead, treat the concession as ifit was a part of the existing contract. This guidance is only applicable to COVID-19 related lease concessions that do not result in asubstantial increase in the right of the lessor or the obligations of the lessee. The Company has elected to treat concessions that satisfy thiscriteria as though the concession was part of the existing contract and therefore not treated like a lease modification.
Since the pandemic began, the Company has executed approximately 1,600 rent deferral agreements representing $40.8 million of rent or4.6% of Pro-rata annual base rent, within its consolidated and unconsolidated real estate portfolio. The weighted average deferral period ofthese agreements is approximately 3.3 months, with repayment periods of approximately 9.7 months beginning in December 2020. TheCompany will continue to negotiate with some tenants, which may result in further rent concessions as determined necessary andappropriate. Collectibility assessment of these concessions generally includes consideration of the tenants’ business performance, ability tosustain their business in the current environment, as well as an assessment of their credit worthiness and ability to repay such amounts in thefuture.
The following table represents the components of Tenant and other receivables, net of amounts considered uncollectible, in theaccompanying Consolidated Balance Sheets:
December 31, (in thousands) 2020 2019 Tenant receivables $ 39,658 35,526 Straight-line rent receivables 86,615 107,087 Other receivables (1) 17,360 26,724
Total tenant and other receivables, net $ 143,633 169,337
(1) Other receivables include construction receivables, insurance receivables, and amounts due from real estatepartnerships for Management, transaction and other fee income.
Real Estate Sales
The Company accounts for sales of nonfinancial assets under Subtopic 610-20, whereby the Company derecognizes real estate and recognizes again or loss on sales when a contract exists and control of the property has transferred to the buyer. Control of the property, including controllingfinancial interest, is generally considered to transfer upon closing through transfer of the legal title and possession of the property. Any retainednoncontrolling interest is measured at fair value at that time. The adoption this Subtopic 610-20 on January 1, 2018, resulted in the recognition,through opening retained earnings, of $30.9 million of previously deferred gains from property sales to the Company's Investments in real estatepartnerships.
Management Services and Other Property Income
The Company recognizes revenue under Topic 606, Revenue from Contracts with Customers, when or as control of the promised services aretransferred to its customers, in an amount that reflects the consideration the Company expects to be entitled to in exchange for those services.The following is a description of the Company's revenue from contracts with customers within the scope of Topic 606.
Property and Asset Management Services
The Company is engaged under agreements with its joint venture partnerships, which are generally perpetual in nature and cancellablethrough unanimous partner approval, absent an event of default. Under these agreements, the Company is to provide asset and propertymanagement and leasing services for the joint ventures' shopping centers. The fees are market-based, generally calculated as a percentage ofeither revenues earned or the estimated values of the properties managed or the proceeds received, and are recognized over the monthly orquarterly periods as services are rendered. Property management and asset management services represent a series of distinct daily services.Accordingly, the Company satisfies its performance obligation as service is rendered each day and the variability associated with thatcompensation is resolved each day. Amounts due from the partnerships for such services are paid during the month following the monthlyor quarterly service periods.
85
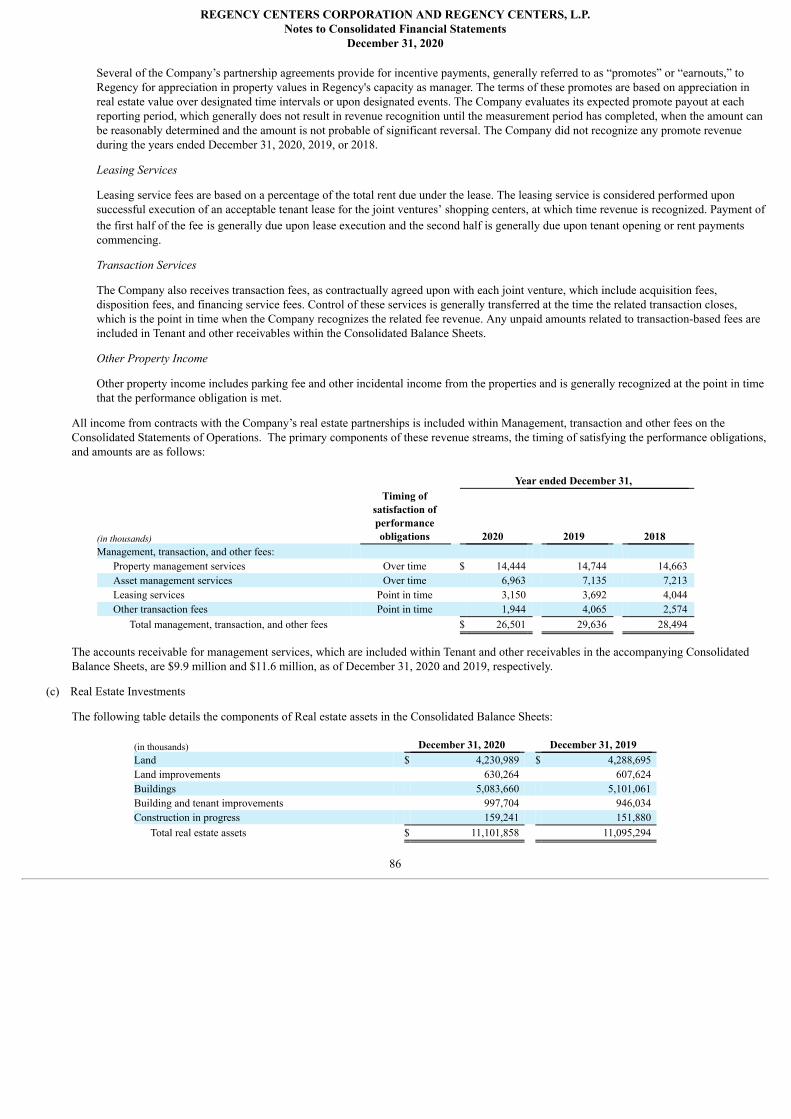
REGENCY CENTERS CORPORATION AND REGENCY CENTERS, L.P.Notes to Consolidated Financial Statements
December 31, 2020
Several of the Company’s partnership agreements provide for incentive payments, generally referred to as “promotes” or “earnouts,” toRegency for appreciation in property values in Regency's capacity as manager. The terms of these promotes are based on appreciation inreal estate value over designated time intervals or upon designated events. The Company evaluates its expected promote payout at eachreporting period, which generally does not result in revenue recognition until the measurement period has completed, when the amount canbe reasonably determined and the amount is not probable of significant reversal. The Company did not recognize any promote revenueduring the years ended December 31, 2020, 2019, or 2018.
Leasing Services
Leasing service fees are based on a percentage of the total rent due under the lease. The leasing service is considered performed uponsuccessful execution of an acceptable tenant lease for the joint ventures’ shopping centers, at which time revenue is recognized. Payment ofthe first half of the fee is generally due upon lease execution and the second half is generally due upon tenant opening or rent paymentscommencing.
Transaction Services
The Company also receives transaction fees, as contractually agreed upon with each joint venture, which include acquisition fees,disposition fees, and financing service fees. Control of these services is generally transferred at the time the related transaction closes,which is the point in time when the Company recognizes the related fee revenue. Any unpaid amounts related to transaction-based fees areincluded in Tenant and other receivables within the Consolidated Balance Sheets.
Other Property Income
Other property income includes parking fee and other incidental income from the properties and is generally recognized at the point in timethat the performance obligation is met.
All income from contracts with the Company’s real estate partnerships is included within Management, transaction and other fees on theConsolidated Statements of Operations. The primary components of these revenue streams, the timing of satisfying the performance obligations,and amounts are as follows:
Year ended December 31,
(in thousands)
Timing ofsatisfaction ofperformanceobligations 2020 2019 2018
Management, transaction, and other fees: Property management services Over time $ 14,444 14,744 14,663 Asset management services Over time 6,963 7,135 7,213 Leasing services Point in time 3,150 3,692 4,044 Other transaction fees Point in time 1,944 4,065 2,574
Total management, transaction, and other fees $ 26,501 29,636 28,494
The accounts receivable for management services, which are included within Tenant and other receivables in the accompanying ConsolidatedBalance Sheets, are $9.9 million and $11.6 million, as of December 31, 2020 and 2019, respectively.
(c) Real Estate Investments
The following table details the components of Real estate assets in the Consolidated Balance Sheets:
(in thousands) December 31, 2020 December 31, 2019 Land $ 4,230,989 $ 4,288,695 Land improvements 630,264 607,624 Buildings 5,083,660 5,101,061 Building and tenant improvements 997,704 946,034 Construction in progress 159,241 151,880
Total real estate assets $ 11,101,858 11,095,294
86
REGENCY CENTERS CORPORATION AND REGENCY CENTERS, L.P.Notes to Consolidated Financial Statements
December 31, 2020
Capitalization and Depreciation
Maintenance and repairs that do not improve or extend the useful lives of the respective assets are recorded in operating and maintenanceexpense.
As part of the leasing process, the Company may provide the lessee with an allowance for the construction of leasehold improvements. Theseleasehold improvements are capitalized and recorded as tenant improvements, and depreciated over the shorter of the useful life of theimprovements or the remaining lease term. If the allowance represents a payment for a purpose other than funding leasehold improvements, or inthe event the Company is not considered the owner of the improvements, the allowance is considered to be a lease incentive and is recognizedover the lease term as a reduction of Lease income. Factors considered during this evaluation include, among other things, who holds legal titleto the improvements as well as other controlling rights provided by the lease agreement and provisions for substantiation of such costs (e.g.unilateral control of the tenant space during the build-out process). Determination of the appropriate accounting for the payment of a tenantallowance is made on a lease-by-lease basis, considering the facts and circumstances of the individual tenant lease.
Depreciation is computed using the straight-line method over estimated useful lives of approximately 15 years for land improvements, 40 yearsfor buildings and improvements, and the shorter of the useful life or the remaining lease term subject to a maximum of 10 years for tenantimprovements, and three to seven years for furniture and equipment.
Development and Redevelopment Costs
Land, buildings, and improvements are recorded at cost. All specifically identifiable costs related to development and redevelopment activitiesare capitalized into Real estate assets in the accompanying Consolidated Balance Sheets, and are included in Construction in progress within theabove table. The capitalized costs include pre-development costs essential to the development or redevelopment of the property, development /redevelopment costs, construction costs, interest costs, real estate taxes, and allocated direct employee costs incurred during the period ofdevelopment or redevelopment.
Pre-development costs represent the costs the Company incurs prior to land acquisition or pursuing a redevelopment including contract deposits,as well as legal, engineering, and other external professional fees related to evaluating the feasibility of developing or redeveloping a shoppingcenter. As of December 31, 2020 and 2019, the Company had nonrefundable deposits and other pre development costs of approximately $25.3million and $17.7 million, respectively. If the Company determines that the development or redevelopment of a particular shopping center is nolonger probable, any related pre-development costs previously capitalized are immediately expensed. During the years ended December 31,2020, 2019, and 2018, the Company expensed pre-development costs of approximately $10.5 million, $2.5 million, and $1.9 million,respectively, in Other operating expenses in the accompanying Consolidated Statements of Operations.
Interest costs are capitalized into each development and redevelopment project based upon applying the Company's weighted average borrowingrate to that portion of the actual development or redevelopment costs expended. The Company discontinues interest and real estate taxcapitalization when the property is no longer being developed or is available for occupancy upon substantial completion of tenant improvements,but in no event would the Company capitalize interest on the project beyond 12 months after substantial completion of the building shell. Duringthe years ended December 31, 2020, 2019, and 2018, the Company capitalized interest of $4.4 million, $4.2 million, and $7.0 million,respectively, on our development and redevelopment projects.
We have a staff of employees directly supporting our development and redevelopment program. All direct internal costs attributable to thesedevelopment activities are capitalized as part of each development and redevelopment project. The capitalization of costs is directly related tothe actual level of development activity occurring. During the years ended December 31, 2020, 2019, and 2018, we capitalized $10.2 million,$20.4 million, and $17.1 million, respectively, of direct internal costs incurred to support our development and redevelopment program.
Acquisitions
The Company generally accounts for operating property acquisitions as asset acquisitions. The Company capitalizes transaction costs associatedwith asset acquisitions and expenses transaction costs associated with business combinations. Both asset acquisitions and business combinationsrequire that the Company recognize and measure the identifiable assets acquired, the liabilities assumed, and any noncontrolling interest in theoperating property acquired (“acquiree”).
The Company's methodology includes estimating an “as-if vacant” fair value of the physical property, which includes land, building, andimprovements. In addition, the Company determines the estimated fair value of identifiable intangible assets and liabilities, considering thefollowing categories: (i) value of in-place leases, and (ii) above and below-market value of in-place leases.
87
REGENCY CENTERS CORPORATION AND REGENCY CENTERS, L.P.Notes to Consolidated Financial Statements
December 31, 2020
The value of in-place leases is estimated based on the value associated with the costs avoided in originating leases compared to the acquired in-place leases as well as the value associated with lost rental and recovery revenue during the assumed lease-up period. The value of in-placeleases is recorded to Depreciation and amortization expense in the Consolidated Statements of Operations over the remaining expected term ofthe respective leases.
Above-market and below-market in-place lease values for acquired properties are recorded based on the present value of the difference between(i) the contractual amounts to be paid pursuant to the in-place leases and (ii) management's estimate of fair market lease rates for comparable in-place leases, measured over a period equal to the remaining non-cancelable term of the lease, including below-market renewal options, ifapplicable. The value of above-market leases is amortized as a reduction of Lease income over the remaining terms of the respective leases andthe value of below-market leases is accreted to Lease income over the remaining terms of the respective leases, including below-market renewaloptions, if applicable. The Company does not assign value to customer relationship intangibles if it has pre-existing business relationships withthe major retailers at the acquired property since they do not provide incremental value over the Company's existing relationships.
Held for Sale
The Company classifies land, an operating property, or a property in development as held-for-sale upon satisfaction of the following criteria: (i)management commits to a plan to sell a property (or group of properties), (ii) the property is available for immediate sale in its present conditionsubject only to terms that are usual and customary for sales of such properties, (iii) an active program to locate a buyer and other actions requiredto complete the plan to sell the property have been initiated, (iv) the sale of the property is probable and transfer of the asset is expected to becompleted within one year, (v) the property is being actively marketed for sale, and (vi) actions required to complete the plan indicate that it isunlikely that significant changes to the plan will be made or that the plan will be withdrawn. Properties held-for-sale are carried at the lower ofcost or fair value less costs to sell.
Impairment
We evaluate whether there are any indicators, including property operating performance and general market conditions, that the value of the realestate properties (including any related amortizable intangible assets or liabilities) may not be recoverable. For those properties with suchindicators, management evaluates recoverability of the property's carrying amount. Through the evaluation, we compare the current carryingvalue of the asset to the estimated undiscounted cash flows that are directly associated with the use and ultimate disposition of the asset. Ourestimated cash flows are based on several key assumptions, including rental rates, expected leasing activity, costs of tenant improvements,leasing commissions, anticipated hold period, and assumptions regarding the residual value upon disposition, including the exit capitalizationrate. These key assumptions are subjective in nature and could differ materially from actual results. Changes in our disposition strategy orchanges in the marketplace may alter the hold period of an asset or asset group which may result in an impairment loss and such loss could bematerial to the Company's financial condition or operating performance. To the extent that the carrying value of the asset exceeds the estimatedundiscounted cash flows, an impairment loss is recognized equal to the excess of carrying value over fair value. If such indicators are notidentified, management will not assess the recoverability of a property's carrying value. If a property previously classified as held and used ischanged to held for sale, the Company estimates fair value, less expected costs to sell, which could cause the Company to determine that theproperty is impaired.
The fair value of real estate assets is subjective and is determined through comparable sales information and other market data if available, orthrough use of an income approach such as the direct capitalization method or the discounted cash flow approach. Such cash flow projectionsconsider factors such as expected future operating income, trends and prospects, as well as the effects of demand, competition and other factors,and therefore is subject to management judgment and changes in those factors could impact the determination of fair value. In estimating the fairvalue of undeveloped land, the Company generally uses market data and comparable sales information.
A loss in value of investments in real estate partnerships under the equity method of accounting, other than a temporary decline, must berecognized in the period in which the loss occurs. If management identifies indicators that the value of the Company's investment in real estatepartnerships may be impaired, it evaluates the investment by calculating the fair value of the investment by discounting estimated future cashflows over the expected term of the investment.
Tax Basis
The net book basis of the Company's real estate assets exceeds the net tax basis by approximately $2.7 billion and $2.8 billion at December 31,2020 and 2019, respectively, primarily due to the tax free merger with Equity One and inheriting lower carryover tax basis.
88
REGENCY CENTERS CORPORATION AND REGENCY CENTERS, L.P.Notes to Consolidated Financial Statements
December 31, 2020
(d) Cash, Cash Equivalents, and Restricted Cash
Any instruments which have an original maturity of 90 days or less when purchased are considered cash equivalents. As of December 31, 2020and 2019, $2.4 million and $2.5 million, respectively, of cash was restricted through escrow agreements and certain mortgage loans.
(e) Other Assets
Goodwill
Goodwill represents the excess of the purchase price consideration from the Equity One merger in 2017 over the fair value of the assets acquiredand liabilities assumed. The Company accounts for goodwill in accordance with ASC Topic 350, Intangibles - Goodwill and Other, and allocatesits goodwill to its reporting units, which have been determined to be at the individual property level. The Company performs an impairmentevaluation of its goodwill at least annually, in November of each year, or more frequently as triggers occur. See note 5.
The goodwill impairment evaluation is completed using either a qualitative or quantitative approach. Under a qualitative approach, theimpairment review for goodwill consists of an assessment of whether it is more-likely-than-not that the reporting unit’s fair value is less than itscarrying value, including goodwill. If a qualitative approach indicates it is more likely-than-not that the estimated carrying value of a reportingunit (including goodwill) exceeds its fair value, or if the Company chooses to bypass the qualitative approach for any reporting unit, theCompany will perform the quantitative approach described below.
The quantitative approach consists of estimating the fair value of each reporting unit using discounted projected future cash flows and comparingthose estimated fair values with the carrying values, which include the allocated goodwill. If the estimated fair value is less than the carryingvalue, the Company would then recognize a goodwill impairment charge for the amount by which the carrying amount exceeds the reportingunit's fair value, not to exceed the total amount of goodwill allocated to that reporting unit.
Investments
The Company determines the appropriate classification of its investments in debt and equity securities at the time of purchase and reevaluatessuch determinations at each balance sheet date. The fair value of securities is determined using quoted market prices.
Debt securities are classified as held to maturity when the Company has the positive intent and ability to hold the securities to maturity. Debtsecurities that are bought and held principally for the purpose of selling them in the near term are classified as trading securities and are reportedat fair value, with unrealized gains and losses recognized through earnings in Investment income in the Consolidated Statements of Operations.Debt securities not classified as held to maturity or as trading, are classified as available-for-sale, and are carried at fair value, with the unrealizedgains and losses, net of tax, included in the determination of comprehensive income and reported in the Consolidated Statements ofComprehensive Income.
Equity securities with readily determinable fair values are measured at fair value with changes in the fair value recognized through net incomeand presented within Investment income in the Consolidated Statements of Operations.
(f) Deferred Leasing Costs
Deferred leasing costs consist of costs associated with leasing the Company's shopping centers, and are presented net of accumulatedamortization. Such costs are amortized over the period through lease expiration. If the lease is terminated early, the remaining leasing costs arewritten off.
The adoption of Topic 842 on January 1, 2019, changed the treatment of leasing costs, such that non-contingent internal leasing and legal costsassociated with leasing activities can no longer be capitalized. The Company, as a lessor, may only defer as initial direct costs the incrementalcosts of a tenant’s operating lease that would not have been incurred if the lease had not been obtained. These costs generally consist of thirdparty broker payments.
(g) Derivative Financial Instruments
The Company manages economic risks, including interest rate, liquidity, and credit risk primarily by managing the amount, sources, and durationof its debt funding and the use of derivative financial instruments. Specifically, the Company enters into derivative financial instruments tomanage exposures that arise from business activities that result in the receipt or future payment of known and uncertain cash amounts, theamount of which are determined by interest rates. The Company's
89
REGENCY CENTERS CORPORATION AND REGENCY CENTERS, L.P.Notes to Consolidated Financial Statements
December 31, 2020
derivative financial instruments are used to manage differences in the amount, timing, and duration of the Company's known or expected cashpayments principally related to the Company's borrowings.
All derivative instruments, whether designated in hedging relationships or not, are recorded on the accompanying Consolidated Balance Sheets attheir fair value. The accounting for changes in the fair value of derivatives depends on the intended use of the derivative, whether the Companyhas elected to designate a derivative in a hedging relationship and apply hedge accounting, and whether the hedging relationship has satisfied thecriteria necessary to apply hedge accounting. Derivatives designated and qualifying as a hedge of the exposure to variability in expected futurecash flows, or other types of forecasted transactions, are considered cash flow hedges. Hedge accounting generally provides for the matching ofthe timing of gain or loss recognition on the hedging instrument with the earnings effect of the hedged forecasted transactions in a cash flowhedge. The Company may enter into derivative contracts that are intended to economically hedge certain risks, even though hedge accountingdoes not apply or the Company elects not to apply hedge accounting.
The Company uses interest rate swaps to mitigate its interest rate risk on a related financial instrument or forecasted transaction, and theCompany designates these interest rate swaps as cash flow hedges. Interest rate swaps designated as cash flow hedges generally involve thereceipt of variable-rate amounts from a counterparty in exchange for the Company making fixed-rate payments over the life of the agreementswithout exchange of the underlying notional amount. The Company may also utilize cash flow hedges to lock U.S. Treasury rates in anticipationof future fixed-rate debt issuances. The gains or losses resulting from changes in fair value of derivatives that qualify as cash flow hedges arerecognized in Accumulated other comprehensive income (loss) (“AOCI”). Upon the settlement of a hedge, gains and losses remaining in AOCIare amortized through earnings over the underlying term of the hedged transaction. The cash receipts or payments related to interest rate swapsare presented in cash flows provided by operating activities in the accompanying Consolidated Statements of Cash Flows.
The Company formally documents all relationships between hedging instruments and hedged items, as well as its risk management objectivesand strategies for undertaking various hedge transactions. The Company assesses, both at inception of the hedge and on an ongoing basis,whether the derivatives that are used in hedging transactions are highly effective in offsetting changes in the cash flows and/or forecasted cashflows of the hedged items.
In assessing the valuation of the hedges, the Company uses standard market conventions and techniques such as discounted cash flow analysis,option pricing models, and termination costs at each balance sheet date. All methods of assessing fair value result in a general approximation ofvalue, and such value may never actually be realized.
(h) Income Taxes
The Parent Company believes it qualifies, and intends to continue to qualify, as a REIT under the Code. As a REIT, the Parent Company willgenerally not be subject to federal income tax, provided that distributions to its stockholders are at least equal to REIT taxable income. Allwholly-owned corporate subsidiaries of the Operating Partnership have elected to be a TRS or qualify as a REIT. The TRS's are subject to federaland state income taxes and file separate tax returns. As a pass through entity, the Operating Partnership generally does not pay taxes, but itstaxable income or loss is reported by its partners, of which the Parent Company, as general partner and approximately 99.6% owner, is allocatedits Pro-rata share of tax attributes.
The Company accounts for income taxes related to its TRS’s under the asset and liability approach, which requires the recognition of the amountof taxes payable or refundable for the current year and deferred tax assets and liabilities for the expected future tax consequences of events thathave been recognized in the financial statements. Under this method, deferred tax assets and liabilities are determined based on the differencesbetween the financial statement and tax basis of assets and liabilities using enacted tax rates in effect for the year in which the differences areexpected to reverse. The Company records net deferred tax assets to the extent it believes it is more likely than not that these assets will berealized. A valuation allowance is recorded to reduce deferred tax assets when it is believed that it is more likely than not that all or some portionof the deferred tax asset will not be realized. The Company considers all available positive and negative evidence, including forecasts of futuretaxable income, the reversal of other existing temporary differences, available net operating loss carryforwards, tax planning strategies and recentand projected results of operations in order to make that determination.
In addition, tax positions are initially recognized in the financial statements when it is more likely than not the position will be sustained uponexamination by the tax authorities. Such tax positions shall initially and subsequently be measured as the largest amount of tax benefit that has agreater than 50% likelihood of being realized upon ultimate settlement with the tax authority assuming full knowledge of the position andrelevant facts. The Company believes that it has appropriate support for the income tax positions taken and to be taken on its tax returns and thatits accruals for tax liabilities are adequate for all open tax years (2016 and forward for federal and state) based on an assessment of many factorsincluding past experience and interpretations of tax laws applied to the facts of each matter.
90
REGENCY CENTERS CORPORATION AND REGENCY CENTERS, L.P.Notes to Consolidated Financial Statements
December 31, 2020
The Coronavirus Aid, Relief, and Economic Security ("CARES") Act was signed into U.S. law on March 27, 2020 and provided an estimated$2.2 trillion to fight the COVID-19 pandemic and stimulate the U.S. economy. The assistance includes tax relief and government loans, grantsand investments for entities in affected industries. The Company is currently evaluating the programs and tax benefits that may apply to itsoperations including the corporate net operating loss carryback, increases in the interest expense limitation, employee retention credit, anddeferrals of both employer payroll taxes and corporate estimated taxes.
(i) Lease Obligations
The Company has certain properties within its consolidated real estate portfolio that are either partially or completely on land subject to groundleases with third parties, which are all classified as operating leases. Accordingly, the Company owns only a long-term leasehold or similarinterest in these properties. The building and improvements constructed on the leased land are capitalized as Real estate assets in theaccompanying Consolidated Balance Sheets and depreciated over the shorter of the useful life of the improvements or the lease term.
In addition, the Company has non-cancelable operating leases pertaining to office space from which it conducts its business. Leaseholdimprovements are capitalized as tenant improvements, included in Other assets in the Consolidated Balance Sheets, and depreciated over theshorter of the useful life of the improvements or the lease term.
Upon the adoption of Topic 842, the Company recognized Lease liabilities on its Consolidated Balance Sheets for its ground and office leases of$225.4 million at January 1, 2019, and corresponding Right of use assets of $297.8 million, net of or including the opening balance for straight-line rent and above / below market ground lease intangibles related to these same ground and office leases. A key input in estimating the Leaseliabilities and resulting Right of use assets is establishing the discount rate in the lease, which since the rates implicit in the lease contracts are notreadily determinable, requires additional inputs for the longer-term ground leases, including market-based interest rates that correspond with theremaining term of the lease, the Company's credit spread, and a securitization adjustment necessary to reflect the collateralized payment termspresent in the lease. This discount rate is applied to the remaining unpaid minimum rental payments for each lease to measure the operatinglease liabilities.
The ground and office lease expenses continue to be recognized on a straight-line basis over the term of the leases, including management'sestimate of expected option renewal periods. For ground leases, the Company generally assumes it will exercise options through the latest optiondate of that shopping center's anchor tenant lease.
(j) Earnings per Share and Unit
Basic earnings per share of common stock and unit are computed based upon the weighted average number of common shares and units,respectively, outstanding during the period. Diluted earnings per share and unit reflect the conversion of obligations and the assumed exercises ofsecurities including the effects of shares issuable under the Company's share-based payment arrangements, if dilutive. Dividends paid on theCompany's share-based compensation awards are not participating securities as they are forfeitable.
(k) Stock-Based Compensation
The Company grants stock-based compensation to its employees and directors. The Company recognizes the cost of stock-based compensationbased on the grant-date fair value of the award, which is expensed over the vesting period.
When the Parent Company issues common stock as compensation, it receives a like number of common units from the Operating Partnership.The Company is committed to contributing to the Operating Partnership all proceeds from the share-based awards granted under the ParentCompany's Long-Term Omnibus Plan (the “Plan”). Accordingly, the Parent Company's ownership in the Operating Partnership will increasebased on the amount of proceeds contributed to the Operating Partnership for the common units it receives. As a result of the issuance ofcommon units to the Parent Company for stock-based compensation, the Operating Partnership records the effect of stock-based compensationfor awards of equity in the Parent Company.
(l) Segment Reporting
The Company's business is investing in retail shopping centers through direct ownership or partnership interests. The Company actively managesits portfolio of retail shopping centers and may from time to time make decisions to sell lower performing properties or developments notmeeting its long-term investment objectives. The proceeds from sales are generally reinvested into higher quality retail shopping centers, throughacquisitions, new developments, or redevelopment of existing centers, which management believes will generate sustainable revenue growth andattractive returns. It is
91
REGENCY CENTERS CORPORATION AND REGENCY CENTERS, L.P.Notes to Consolidated Financial Statements
December 31, 2020
management's intent that all retail shopping centers will be owned or developed for investment purposes; however, the Company may decide tosell all or a portion of a development upon completion. The Company's revenues and net income are generated from the operation of itsinvestment portfolio. The Company also earns fees for services provided to manage and lease retail shopping centers owned through jointventures.
The Company's portfolio is located throughout the United States. Management does not distinguish or group its operations on a geographicalbasis for purposes of allocating resources or capital. The Company reviews operating and financial data for each property on an individual basis;therefore, the Company defines an operating segment as its individual properties. The individual properties have been aggregated into onereportable segment based upon their similarities with regard to both the nature and economics of the centers, tenants and operational processes,as well as long-term average financial performance.
(m) Business Concentration
Grocer anchor tenants represent approximately 20% of Pro-rata annual base rent. No single tenant accounts for 5% or more of revenue and noneof the shopping centers are located outside the United States.
(n) Fair Value of Assets and Liabilities
Fair value is a market-based measurement, not an entity-specific measurement. Therefore, a fair value measurement is determined based on theassumptions that market participants would use in pricing the asset or liability. As a basis for considering market participant assumptions in fairvalue measurements, the Company uses a fair value hierarchy that distinguishes between market participant assumptions based on market dataobtained from independent sources (observable inputs that are classified within Levels 1 and 2 of the hierarchy) and the Company's ownassumptions about market participant assumptions (unobservable inputs classified within Level 3 of the hierarchy). The three levels of inputsused to measure fair value are as follows:
• Level 1 - Quoted prices (unadjusted) in active markets for identical assets or liabilities that the Company has the ability to access.
• Level 2 - Inputs other than quoted prices included in Level 1 that are observable for the asset or liability, either directly or indirectly.
• Level 3 - Unobservable inputs for the asset or liability, which are typically based on the Company's own assumptions, as there is little,if any, related market activity.
The Company also remeasures nonfinancial assets and nonfinancial liabilities, initially measured at fair value in a business combination or othernew basis event, at fair value in subsequent periods if a remeasurement event occurs.
92
REGENCY CENTERS CORPORATION AND REGENCY CENTERS, L.P.Notes to Consolidated Financial Statements
December 31, 2020
(o) Recent Accounting Pronouncements
The following table provides a brief description of recent accounting pronouncements and expected impact on our financial statements:
Standard Description Date of adoption Effect on the financial statements or othersignificant matters
Recently adopted: Accounting StandardUpdates (“ASU”) 2016-13, June 2016, FinancialInstruments - CreditLosses (Topic 326):Measurement of CreditLosses on FinancialInstruments
This ASU replaces the incurred loss impairmentmethodology in current GAAP with amethodology that reflects expected credit lossesand requires consideration of a broader range ofreasonable and supportable information to informcredit loss estimates. This ASU also applies to how the Companyevaluates impairments of any available-for-saledebt securities and any non-operating leasereceivables arising from leases classified as sales-type or direct finance leases.
January 2020
The Company has completed its evaluation andadoption of this standard, which resulted inchanges in evaluating impairment of its available-for-sale debt securities. Declines in fair valuebelow amortized cost resulting from credit relatedfactors will be reflected in earnings, within Netinvestment income in the accompanyingConsolidated Statements of Operations. Changesin value from market related factors continue tobe recognized in Other comprehensive income(“OCI”). The Company’s investments in available-for-saledebt securities are invested in investment gradequality holdings or U.S. government backedsecurities, and are well diversified. During theyear ended December 31, 2020, the Company didnot recognize any allowance for credit loss. Additionally, the Company’s non-operating leasereceivables experienced no credit losses duringthe year ended December 31, 2020, and theCompany has no other financial instruments,such as lease receivables arising from sales-typeor direct finance leases, subject to this ASU.
ASU 2018-19,November 2018:CodificationImprovements to Topic326, FinancialInstruments - CreditLosses
This ASU clarifies that receivables arising fromoperating leases are not within the scope ofSubtopic 326-20. Instead, impairment ofreceivables arising from operating leases shouldbe accounted for in accordance with Topic 842,Leases.
January 2020
The Company has completed its evaluation andadoption of this standard with no additionalchanges in its accounting for operating leases andrelated receivables.
ASU 2018-13, August2018: Fair ValueMeasurements (Topic820): DisclosureFramework - Changesto the DisclosureRequirements for FairValue Measurement
This ASU modifies the disclosure requirementsfor fair value measurements within the scope ofTopic 820, Fair Value Measurements, includingthe removal and modification of certain existingdisclosures, and the additional of newdisclosures.
January 2020
The Company has completed its evaluation andadoption of this new standard. The Companydoes not have any assets or liabilities measured tofair value requiring modified disclosures atDecember 31, 2020. See note 11 for fair valuedisclosures
93
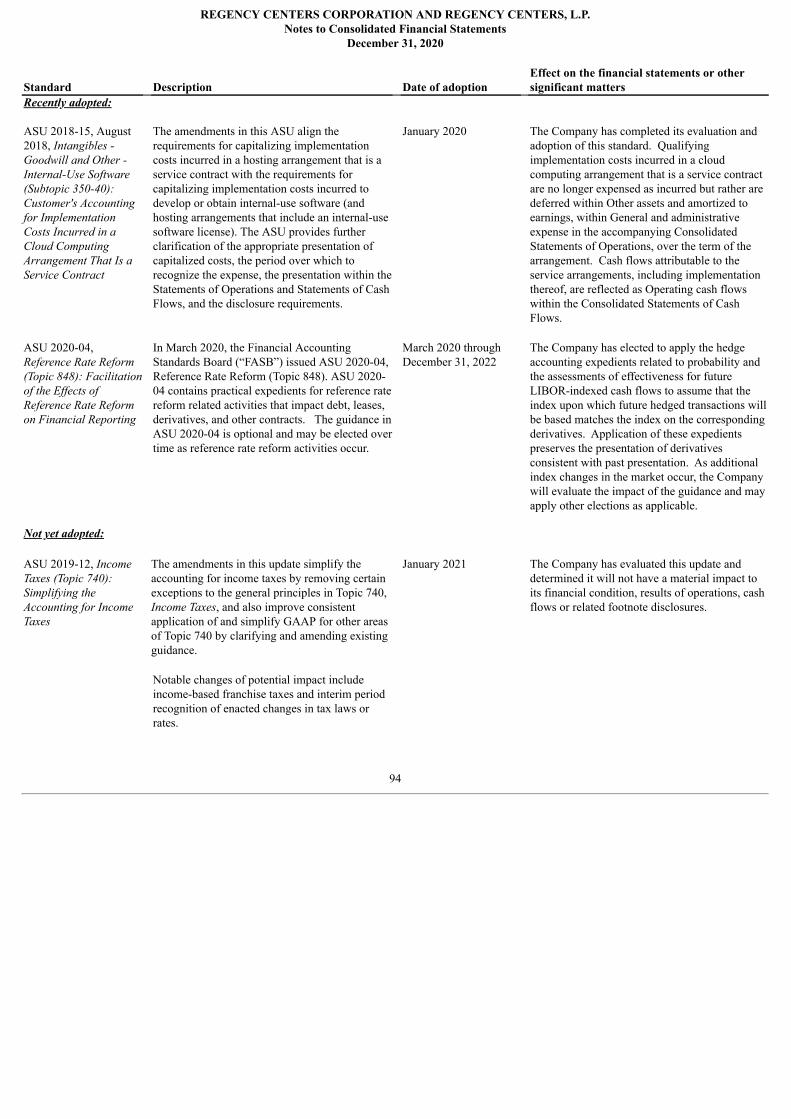
REGENCY CENTERS CORPORATION AND REGENCY CENTERS, L.P.Notes to Consolidated Financial Statements
December 31, 2020
Standard Description Date of adoption Effect on the financial statements or othersignificant matters Recently adopted:
ASU 2018-15, August2018, Intangibles -Goodwill and Other -Internal-Use Software(Subtopic 350-40):Customer's Accountingfor ImplementationCosts Incurred in aCloud ComputingArrangement That Is aService Contract
The amendments in this ASU align therequirements for capitalizing implementationcosts incurred in a hosting arrangement that is aservice contract with the requirements forcapitalizing implementation costs incurred todevelop or obtain internal-use software (andhosting arrangements that include an internal-usesoftware license). The ASU provides furtherclarification of the appropriate presentation ofcapitalized costs, the period over which torecognize the expense, the presentation within theStatements of Operations and Statements of CashFlows, and the disclosure requirements.
January 2020
The Company has completed its evaluation andadoption of this standard. Qualifyingimplementation costs incurred in a cloudcomputing arrangement that is a service contractare no longer expensed as incurred but rather aredeferred within Other assets and amortized toearnings, within General and administrativeexpense in the accompanying ConsolidatedStatements of Operations, over the term of thearrangement. Cash flows attributable to theservice arrangements, including implementationthereof, are reflected as Operating cash flowswithin the Consolidated Statements of CashFlows.
ASU 2020-04,Reference Rate Reform(Topic 848): Facilitationof the Effects ofReference Rate Reformon Financial Reporting
In March 2020, the Financial AccountingStandards Board (“FASB”) issued ASU 2020-04,Reference Rate Reform (Topic 848). ASU 2020-04 contains practical expedients for reference ratereform related activities that impact debt, leases,derivatives, and other contracts. The guidance inASU 2020-04 is optional and may be elected overtime as reference rate reform activities occur.
March 2020 throughDecember 31, 2022
The Company has elected to apply the hedgeaccounting expedients related to probability andthe assessments of effectiveness for futureLIBOR-indexed cash flows to assume that theindex upon which future hedged transactions willbe based matches the index on the correspondingderivatives. Application of these expedientspreserves the presentation of derivativesconsistent with past presentation. As additionalindex changes in the market occur, the Companywill evaluate the impact of the guidance and mayapply other elections as applicable.
Not yet adopted: ASU 2019-12, IncomeTaxes (Topic 740):Simplifying theAccounting for IncomeTaxes
The amendments in this update simplify theaccounting for income taxes by removing certainexceptions to the general principles in Topic 740,Income Taxes, and also improve consistentapplication of and simplify GAAP for other areasof Topic 740 by clarifying and amending existingguidance. Notable changes of potential impact includeincome-based franchise taxes and interim periodrecognition of enacted changes in tax laws orrates.
January 2021
The Company has evaluated this update anddetermined it will not have a material impact toits financial condition, results of operations, cashflows or related footnote disclosures.
94
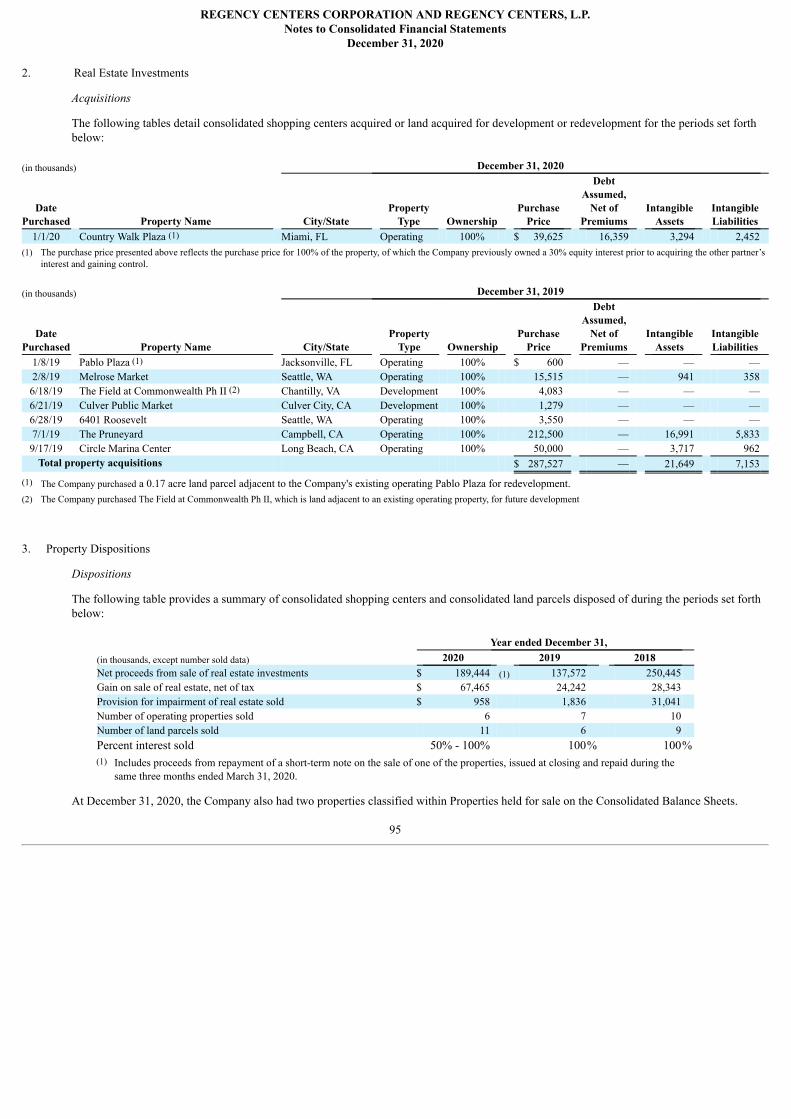
REGENCY CENTERS CORPORATION AND REGENCY CENTERS, L.P.Notes to Consolidated Financial Statements
December 31, 2020
2. Real Estate Investments
Acquisitions
The following tables detail consolidated shopping centers acquired or land acquired for development or redevelopment for the periods set forthbelow:
(in thousands) December 31, 2020
DatePurchased Property Name City/State
PropertyType Ownership
PurchasePrice
DebtAssumed,
Net ofPremiums
IntangibleAssets
IntangibleLiabilities
1/1/20 Country Walk Plaza (1) Miami, FL Operating 100% $ 39,625 16,359 3,294 2,452
(1) The purchase price presented above reflects the purchase price for 100% of the property, of which the Company previously owned a 30% equity interest prior to acquiring the other partner’sinterest and gaining control.
(in thousands) December 31, 2019
DatePurchased Property Name City/State
PropertyType Ownership
PurchasePrice
DebtAssumed,
Net ofPremiums
IntangibleAssets
IntangibleLiabilities
1/8/19 Pablo Plaza (1) Jacksonville, FL Operating 100% $ 600 — — — 2/8/19 Melrose Market Seattle, WA Operating 100% 15,515 — 941 358
6/18/19 The Field at Commonwealth Ph II (2) Chantilly, VA Development 100% 4,083 — — — 6/21/19 Culver Public Market Culver City, CA Development 100% 1,279 — — — 6/28/19 6401 Roosevelt Seattle, WA Operating 100% 3,550 — — — 7/1/19 The Pruneyard Campbell, CA Operating 100% 212,500 — 16,991 5,833
9/17/19 Circle Marina Center Long Beach, CA Operating 100% 50,000 — 3,717 962 Total property acquisitions $ 287,527 — 21,649 7,153
(1) The Company purchased a 0.17 acre land parcel adjacent to the Company's existing operating Pablo Plaza for redevelopment.(2) The Company purchased The Field at Commonwealth Ph II, which is land adjacent to an existing operating property, for future development
3. Property Dispositions
Dispositions
The following table provides a summary of consolidated shopping centers and consolidated land parcels disposed of during the periods set forthbelow:
Year ended December 31,
(in thousands, except number sold data) 2020 2019 2018 Net proceeds from sale of real estate investments $ 189,444 (1) 137,572 250,445 Gain on sale of real estate, net of tax $ 67,465 24,242 28,343 Provision for impairment of real estate sold $ 958 1,836 31,041 Number of operating properties sold 6 7 10 Number of land parcels sold 11 6 9 Percent interest sold 50% - 100% 100% 100%
(1) Includes proceeds from repayment of a short-term note on the sale of one of the properties, issued at closing and repaid during thesame three months ended March 31, 2020.
At December 31, 2020, the Company also had two properties classified within Properties held for sale on the Consolidated Balance Sheets.
95
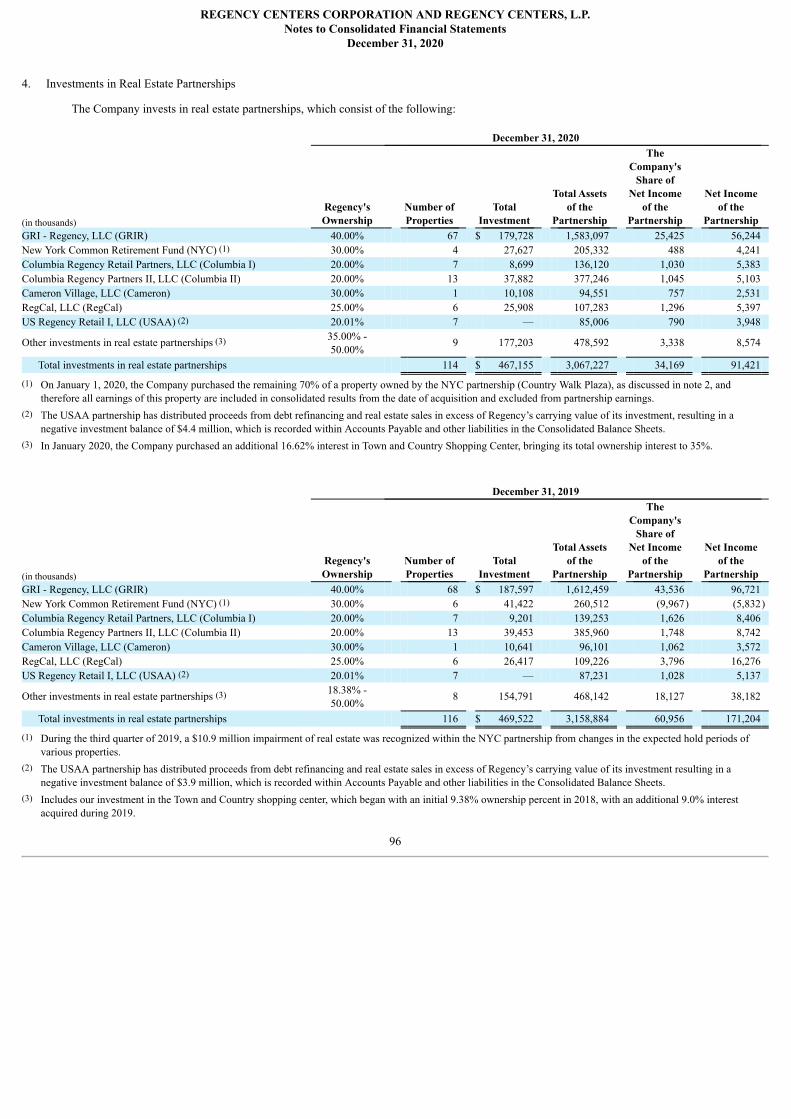
REGENCY CENTERS CORPORATION AND REGENCY CENTERS, L.P.Notes to Consolidated Financial Statements
December 31, 2020
4. Investments in Real Estate Partnerships
The Company invests in real estate partnerships, which consist of the following:
December 31, 2020
(in thousands) Regency'sOwnership
Number ofProperties
TotalInvestment
Total Assetsof the
Partnership
TheCompany's
Share ofNet Income
of thePartnership
Net Incomeof the
Partnership GRI - Regency, LLC (GRIR) 40.00% 67 $ 179,728 1,583,097 25,425 56,244 New York Common Retirement Fund (NYC) (1) 30.00% 4 27,627 205,332 488 4,241 Columbia Regency Retail Partners, LLC (Columbia I) 20.00% 7 8,699 136,120 1,030 5,383 Columbia Regency Partners II, LLC (Columbia II) 20.00% 13 37,882 377,246 1,045 5,103 Cameron Village, LLC (Cameron) 30.00% 1 10,108 94,551 757 2,531 RegCal, LLC (RegCal) 25.00% 6 25,908 107,283 1,296 5,397 US Regency Retail I, LLC (USAA) (2) 20.01% 7 — 85,006 790 3,948
Other investments in real estate partnerships (3) 35.00% -50.00%
9 177,203 478,592 3,338 8,574
Total investments in real estate partnerships 114 $ 467,155 3,067,227 34,169 91,421
(1) On January 1, 2020, the Company purchased the remaining 70% of a property owned by the NYC partnership (Country Walk Plaza), as discussed in note 2, andtherefore all earnings of this property are included in consolidated results from the date of acquisition and excluded from partnership earnings.
(2) The USAA partnership has distributed proceeds from debt refinancing and real estate sales in excess of Regency’s carrying value of its investment, resulting in anegative investment balance of $4.4 million, which is recorded within Accounts Payable and other liabilities in the Consolidated Balance Sheets.
(3) In January 2020, the Company purchased an additional 16.62% interest in Town and Country Shopping Center, bringing its total ownership interest to 35%.
December 31, 2019
(in thousands) Regency'sOwnership
Number ofProperties
TotalInvestment
Total Assetsof the
Partnership
TheCompany's
Share ofNet Income
of thePartnership
Net Incomeof the
Partnership GRI - Regency, LLC (GRIR) 40.00% 68 $ 187,597 1,612,459 43,536 96,721 New York Common Retirement Fund (NYC) (1) 30.00% 6 41,422 260,512 (9,967) (5,832)Columbia Regency Retail Partners, LLC (Columbia I) 20.00% 7 9,201 139,253 1,626 8,406 Columbia Regency Partners II, LLC (Columbia II) 20.00% 13 39,453 385,960 1,748 8,742 Cameron Village, LLC (Cameron) 30.00% 1 10,641 96,101 1,062 3,572 RegCal, LLC (RegCal) 25.00% 6 26,417 109,226 3,796 16,276 US Regency Retail I, LLC (USAA) (2) 20.01% 7 — 87,231 1,028 5,137
Other investments in real estate partnerships (3) 18.38% -50.00%
8 154,791 468,142 18,127 38,182
Total investments in real estate partnerships 116 $ 469,522 3,158,884 60,956 171,204
(1) During the third quarter of 2019, a $10.9 million impairment of real estate was recognized within the NYC partnership from changes in the expected hold periods ofvarious properties.
(2) The USAA partnership has distributed proceeds from debt refinancing and real estate sales in excess of Regency’s carrying value of its investment resulting in anegative investment balance of $3.9 million, which is recorded within Accounts Payable and other liabilities in the Consolidated Balance Sheets.
(3) Includes our investment in the Town and Country shopping center, which began with an initial 9.38% ownership percent in 2018, with an additional 9.0% interestacquired during 2019.
96
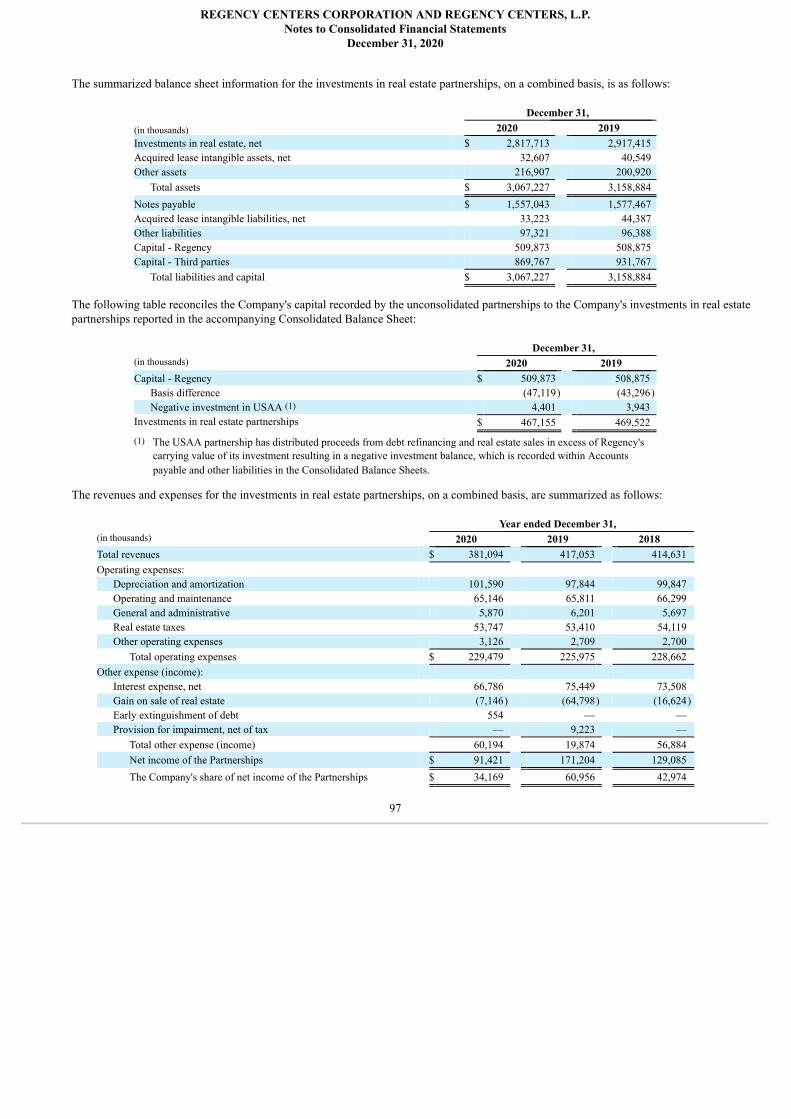
REGENCY CENTERS CORPORATION AND REGENCY CENTERS, L.P.Notes to Consolidated Financial Statements
December 31, 2020
The summarized balance sheet information for the investments in real estate partnerships, on a combined basis, is as follows:
December 31, (in thousands) 2020 2019 Investments in real estate, net $ 2,817,713 2,917,415 Acquired lease intangible assets, net 32,607 40,549 Other assets 216,907 200,920
Total assets $ 3,067,227 3,158,884 Notes payable $ 1,557,043 1,577,467 Acquired lease intangible liabilities, net 33,223 44,387 Other liabilities 97,321 96,388 Capital - Regency 509,873 508,875 Capital - Third parties 869,767 931,767
Total liabilities and capital $ 3,067,227 3,158,884
The following table reconciles the Company's capital recorded by the unconsolidated partnerships to the Company's investments in real estatepartnerships reported in the accompanying Consolidated Balance Sheet:
December 31, (in thousands) 2020 2019 Capital - Regency $ 509,873 508,875
Basis difference (47,119) (43,296)Negative investment in USAA (1) 4,401 3,943
Investments in real estate partnerships $ 467,155 469,522
(1) The USAA partnership has distributed proceeds from debt refinancing and real estate sales in excess of Regency'scarrying value of its investment resulting in a negative investment balance, which is recorded within Accountspayable and other liabilities in the Consolidated Balance Sheets.
The revenues and expenses for the investments in real estate partnerships, on a combined basis, are summarized as follows:
Year ended December 31, (in thousands) 2020 2019 2018 Total revenues $ 381,094 417,053 414,631 Operating expenses:
Depreciation and amortization 101,590 97,844 99,847 Operating and maintenance 65,146 65,811 66,299 General and administrative 5,870 6,201 5,697 Real estate taxes 53,747 53,410 54,119 Other operating expenses 3,126 2,709 2,700
Total operating expenses $ 229,479 225,975 228,662 Other expense (income):
Interest expense, net 66,786 75,449 73,508 Gain on sale of real estate (7,146) (64,798) (16,624)Early extinguishment of debt 554 — — Provision for impairment, net of tax — 9,223 —
Total other expense (income) 60,194 19,874 56,884 Net income of the Partnerships $ 91,421 171,204 129,085 The Company's share of net income of the Partnerships $ 34,169 60,956 42,974
97
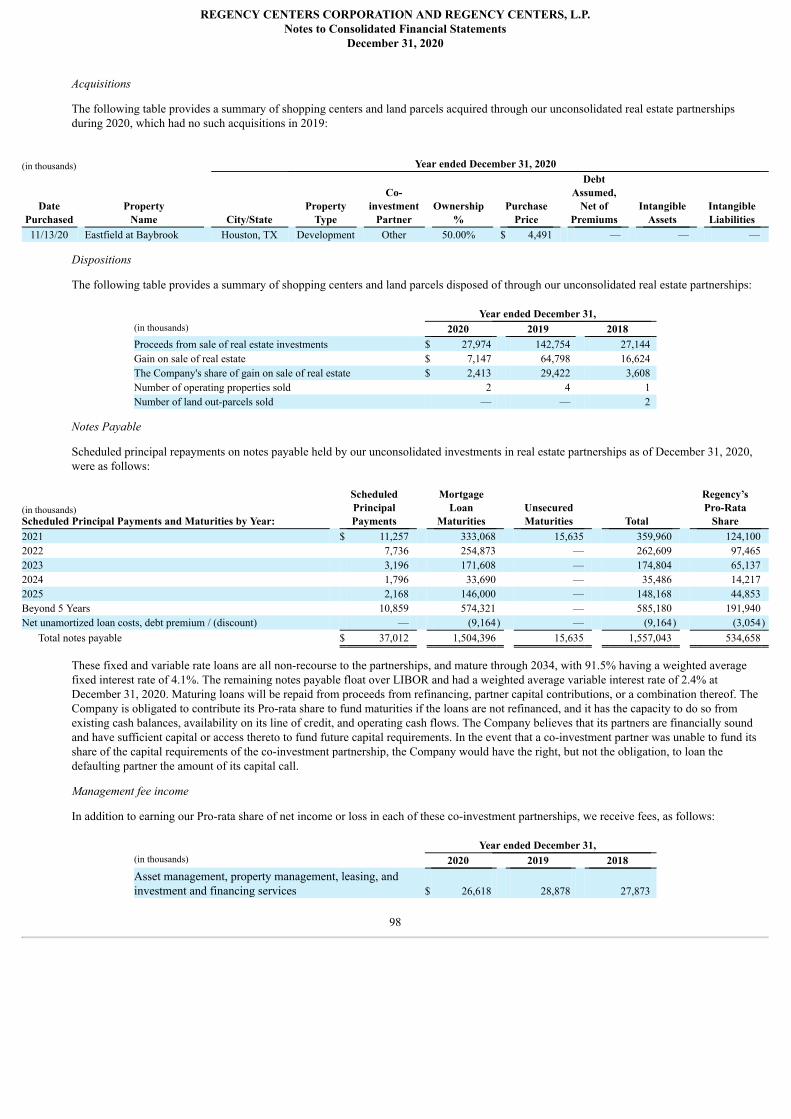
REGENCY CENTERS CORPORATION AND REGENCY CENTERS, L.P.Notes to Consolidated Financial Statements
December 31, 2020
Acquisitions
The following table provides a summary of shopping centers and land parcels acquired through our unconsolidated real estate partnershipsduring 2020, which had no such acquisitions in 2019:
(in thousands) Year ended December 31, 2020
DatePurchased
PropertyName City/State
PropertyType
Co-investment
Partner Ownership
% Purchase
Price
DebtAssumed,
Net ofPremiums
IntangibleAssets
IntangibleLiabilities
11/13/20 Eastfield at Baybrook Houston, TX Development Other 50.00% $ 4,491 — — —
Dispositions
The following table provides a summary of shopping centers and land parcels disposed of through our unconsolidated real estate partnerships:
Year ended December 31, (in thousands) 2020 2019 2018 Proceeds from sale of real estate investments $ 27,974 142,754 27,144 Gain on sale of real estate $ 7,147 64,798 16,624 The Company's share of gain on sale of real estate $ 2,413 29,422 3,608 Number of operating properties sold 2 4 1 Number of land out-parcels sold — — 2
Notes Payable
Scheduled principal repayments on notes payable held by our unconsolidated investments in real estate partnerships as of December 31, 2020,were as follows:
(in thousands)Scheduled Principal Payments and Maturities by Year:
ScheduledPrincipalPayments
MortgageLoan
Maturities UnsecuredMaturities Total
Regency’sPro-Rata
Share 2021 $ 11,257 333,068 15,635 359,960 124,100 2022 7,736 254,873 — 262,609 97,465 2023 3,196 171,608 — 174,804 65,137 2024 1,796 33,690 — 35,486 14,217 2025 2,168 146,000 — 148,168 44,853 Beyond 5 Years 10,859 574,321 — 585,180 191,940 Net unamortized loan costs, debt premium / (discount) — (9,164) — (9,164) (3,054)
Total notes payable $ 37,012 1,504,396 15,635 1,557,043 534,658
These fixed and variable rate loans are all non-recourse to the partnerships, and mature through 2034, with 91.5% having a weighted averagefixed interest rate of 4.1%. The remaining notes payable float over LIBOR and had a weighted average variable interest rate of 2.4% atDecember 31, 2020. Maturing loans will be repaid from proceeds from refinancing, partner capital contributions, or a combination thereof. TheCompany is obligated to contribute its Pro-rata share to fund maturities if the loans are not refinanced, and it has the capacity to do so fromexisting cash balances, availability on its line of credit, and operating cash flows. The Company believes that its partners are financially soundand have sufficient capital or access thereto to fund future capital requirements. In the event that a co-investment partner was unable to fund itsshare of the capital requirements of the co-investment partnership, the Company would have the right, but not the obligation, to loan thedefaulting partner the amount of its capital call.
Management fee income
In addition to earning our Pro-rata share of net income or loss in each of these co-investment partnerships, we receive fees, as follows:
Year ended December 31, (in thousands) 2020 2019 2018 Asset management, property management, leasing, andinvestment and financing services
$ 26,618
28,878
27,873
98
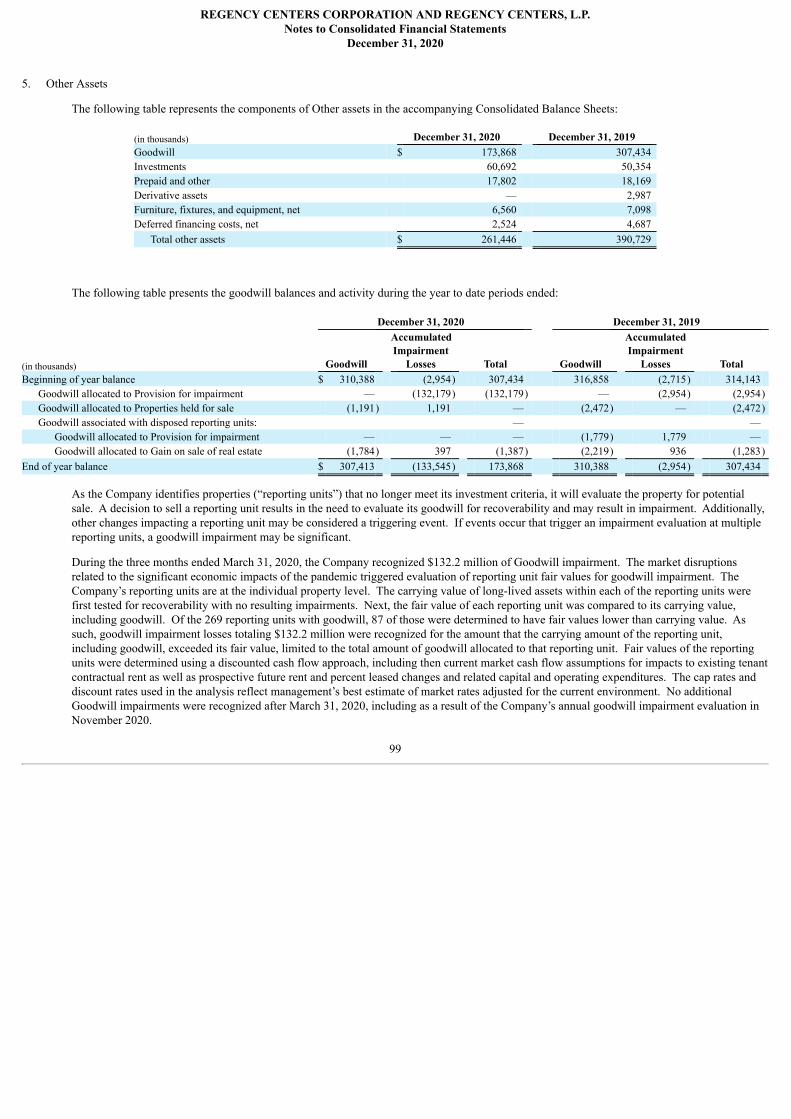
REGENCY CENTERS CORPORATION AND REGENCY CENTERS, L.P.Notes to Consolidated Financial Statements
December 31, 2020
5. Other Assets
The following table represents the components of Other assets in the accompanying Consolidated Balance Sheets:
(in thousands) December 31, 2020 December 31, 2019 Goodwill $ 173,868 307,434 Investments 60,692 50,354 Prepaid and other 17,802 18,169 Derivative assets — 2,987 Furniture, fixtures, and equipment, net 6,560 7,098 Deferred financing costs, net 2,524 4,687
Total other assets $ 261,446 390,729
The following table presents the goodwill balances and activity during the year to date periods ended: December 31, 2020 December 31, 2019
(in thousands) Goodwill
AccumulatedImpairment
Losses Total Goodwill
AccumulatedImpairment
Losses Total Beginning of year balance $ 310,388 (2,954) 307,434 316,858 (2,715) 314,143
Goodwill allocated to Provision for impairment — (132,179) (132,179) — (2,954) (2,954)Goodwill allocated to Properties held for sale (1,191) 1,191 — (2,472) — (2,472)Goodwill associated with disposed reporting units: — —
Goodwill allocated to Provision for impairment — — — (1,779) 1,779 — Goodwill allocated to Gain on sale of real estate (1,784) 397 (1,387) (2,219) 936 (1,283)
End of year balance $ 307,413 (133,545) 173,868 310,388 (2,954) 307,434
As the Company identifies properties (“reporting units”) that no longer meet its investment criteria, it will evaluate the property for potentialsale. A decision to sell a reporting unit results in the need to evaluate its goodwill for recoverability and may result in impairment. Additionally,other changes impacting a reporting unit may be considered a triggering event. If events occur that trigger an impairment evaluation at multiplereporting units, a goodwill impairment may be significant.
During the three months ended March 31, 2020, the Company recognized $132.2 million of Goodwill impairment. The market disruptionsrelated to the significant economic impacts of the pandemic triggered evaluation of reporting unit fair values for goodwill impairment. TheCompany’s reporting units are at the individual property level. The carrying value of long-lived assets within each of the reporting units werefirst tested for recoverability with no resulting impairments. Next, the fair value of each reporting unit was compared to its carrying value,including goodwill. Of the 269 reporting units with goodwill, 87 of those were determined to have fair values lower than carrying value. Assuch, goodwill impairment losses totaling $132.2 million were recognized for the amount that the carrying amount of the reporting unit,including goodwill, exceeded its fair value, limited to the total amount of goodwill allocated to that reporting unit. Fair values of the reportingunits were determined using a discounted cash flow approach, including then current market cash flow assumptions for impacts to existing tenantcontractual rent as well as prospective future rent and percent leased changes and related capital and operating expenditures. The cap rates anddiscount rates used in the analysis reflect management’s best estimate of market rates adjusted for the current environment. No additionalGoodwill impairments were recognized after March 31, 2020, including as a result of the Company’s annual goodwill impairment evaluation inNovember 2020.
99
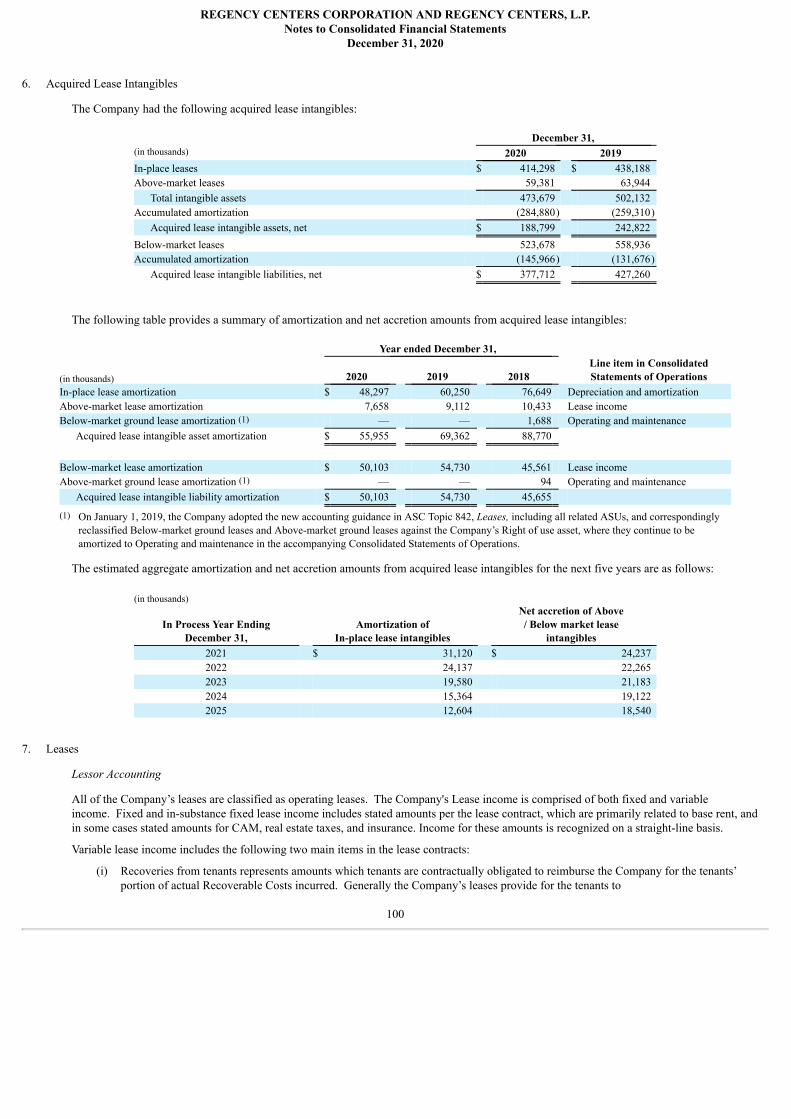
REGENCY CENTERS CORPORATION AND REGENCY CENTERS, L.P.Notes to Consolidated Financial Statements
December 31, 2020
6. Acquired Lease Intangibles
The Company had the following acquired lease intangibles:
December 31, (in thousands) 2020 2019 In-place leases $ 414,298 $ 438,188 Above-market leases 59,381 63,944
Total intangible assets 473,679 502,132 Accumulated amortization (284,880) (259,310)
Acquired lease intangible assets, net $ 188,799 242,822 Below-market leases 523,678 558,936 Accumulated amortization (145,966) (131,676)
Acquired lease intangible liabilities, net $ 377,712 427,260
The following table provides a summary of amortization and net accretion amounts from acquired lease intangibles:
Year ended December 31,
(in thousands) 2020 2019 2018 Line item in ConsolidatedStatements of Operations
In-place lease amortization $ 48,297 60,250 76,649 Depreciation and amortizationAbove-market lease amortization 7,658 9,112 10,433 Lease incomeBelow-market ground lease amortization (1) — — 1,688 Operating and maintenance
Acquired lease intangible asset amortization $ 55,955 69,362 88,770
Below-market lease amortization $ 50,103 54,730 45,561 Lease incomeAbove-market ground lease amortization (1) — — 94 Operating and maintenance
Acquired lease intangible liability amortization $ 50,103 54,730 45,655
(1) On January 1, 2019, the Company adopted the new accounting guidance in ASC Topic 842, Leases, including all related ASUs, and correspondinglyreclassified Below-market ground leases and Above-market ground leases against the Company’s Right of use asset, where they continue to beamortized to Operating and maintenance in the accompanying Consolidated Statements of Operations.
The estimated aggregate amortization and net accretion amounts from acquired lease intangibles for the next five years are as follows:
(in thousands)
In Process Year EndingDecember 31,
Amortization ofIn-place lease intangibles
Net accretion of Above/ Below market lease
intangibles 2021 $ 31,120 $ 24,237 2022 24,137 22,265 2023 19,580 21,183 2024 15,364 19,122 2025 12,604 18,540
7. Leases
Lessor Accounting
All of the Company’s leases are classified as operating leases. The Company's Lease income is comprised of both fixed and variableincome. Fixed and in-substance fixed lease income includes stated amounts per the lease contract, which are primarily related to base rent, andin some cases stated amounts for CAM, real estate taxes, and insurance. Income for these amounts is recognized on a straight-line basis.
Variable lease income includes the following two main items in the lease contracts:
(i) Recoveries from tenants represents amounts which tenants are contractually obligated to reimburse the Company for the tenants’portion of actual Recoverable Costs incurred. Generally the Company’s leases provide for the tenants to
100
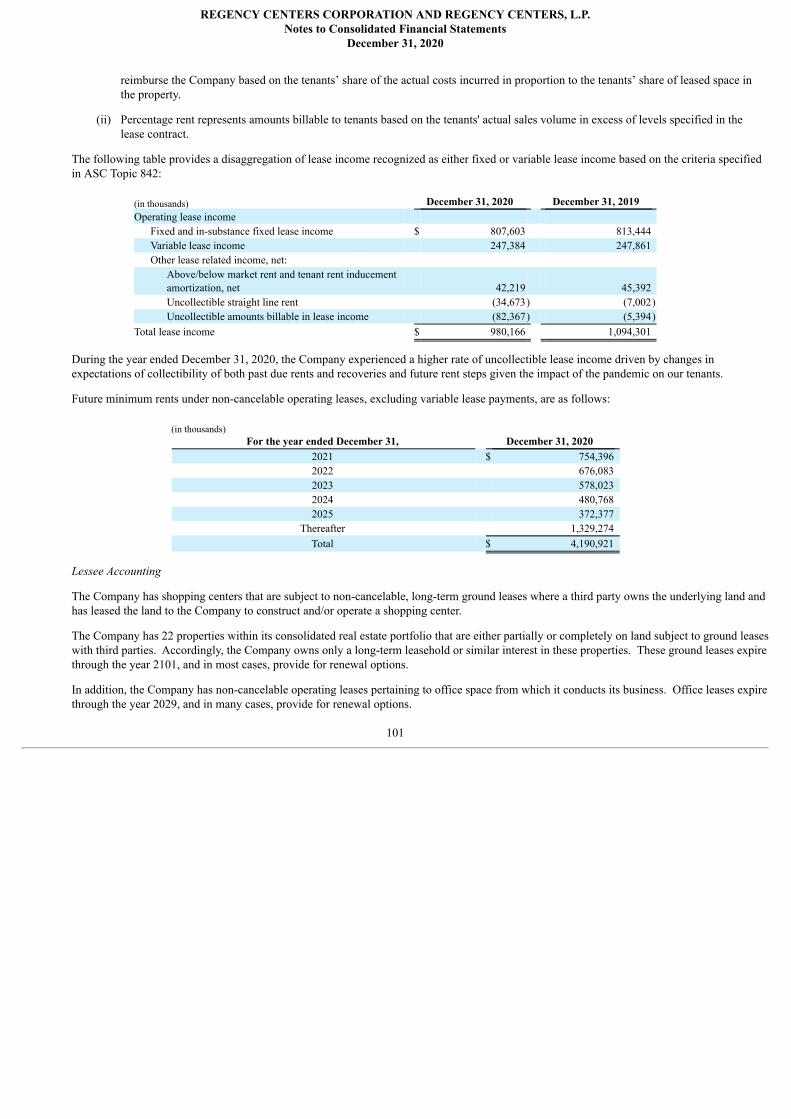
REGENCY CENTERS CORPORATION AND REGENCY CENTERS, L.P.Notes to Consolidated Financial Statements
December 31, 2020
reimburse the Company based on the tenants’ share of the actual costs incurred in proportion to the tenants’ share of leased space inthe property.
(ii) Percentage rent represents amounts billable to tenants based on the tenants' actual sales volume in excess of levels specified in thelease contract.
The following table provides a disaggregation of lease income recognized as either fixed or variable lease income based on the criteria specifiedin ASC Topic 842:
(in thousands) December 31, 2020 December 31, 2019 Operating lease income
Fixed and in-substance fixed lease income $ 807,603 813,444 Variable lease income 247,384 247,861 Other lease related income, net:
Above/below market rent and tenant rent inducementamortization, net 42,219 45,392 Uncollectible straight line rent (34,673) (7,002)Uncollectible amounts billable in lease income (82,367) (5,394)
Total lease income $ 980,166 1,094,301
During the year ended December 31, 2020, the Company experienced a higher rate of uncollectible lease income driven by changes inexpectations of collectibility of both past due rents and recoveries and future rent steps given the impact of the pandemic on our tenants.
Future minimum rents under non-cancelable operating leases, excluding variable lease payments, are as follows:
(in thousands) For the year ended December 31, December 31, 2020
2021 $ 754,396 2022 676,083 2023 578,023 2024 480,768 2025 372,377
Thereafter 1,329,274 Total $ 4,190,921
Lessee Accounting
The Company has shopping centers that are subject to non-cancelable, long-term ground leases where a third party owns the underlying land andhas leased the land to the Company to construct and/or operate a shopping center.
The Company has 22 properties within its consolidated real estate portfolio that are either partially or completely on land subject to ground leaseswith third parties. Accordingly, the Company owns only a long-term leasehold or similar interest in these properties. These ground leases expirethrough the year 2101, and in most cases, provide for renewal options.
In addition, the Company has non-cancelable operating leases pertaining to office space from which it conducts its business. Office leases expirethrough the year 2029, and in many cases, provide for renewal options.
101
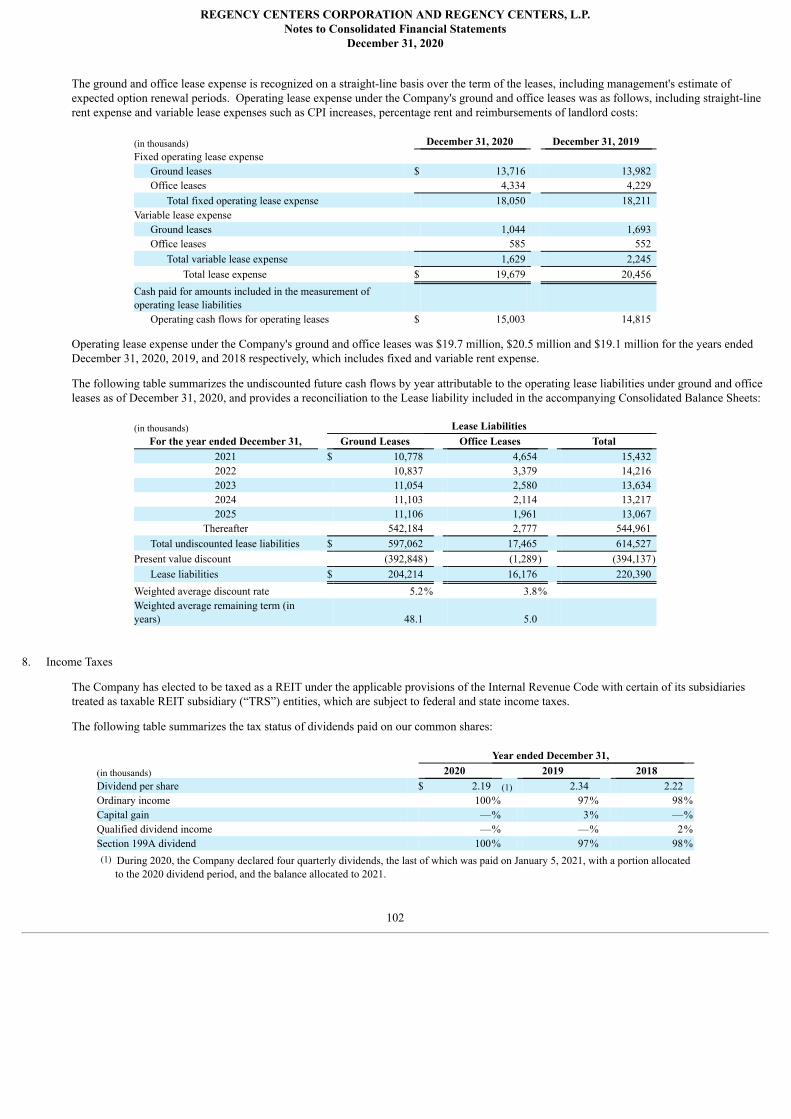
REGENCY CENTERS CORPORATION AND REGENCY CENTERS, L.P.Notes to Consolidated Financial Statements
December 31, 2020
The ground and office lease expense is recognized on a straight-line basis over the term of the leases, including management's estimate ofexpected option renewal periods. Operating lease expense under the Company's ground and office leases was as follows, including straight-linerent expense and variable lease expenses such as CPI increases, percentage rent and reimbursements of landlord costs:
(in thousands) December 31, 2020 December 31, 2019 Fixed operating lease expense
Ground leases $ 13,716 13,982 Office leases 4,334 4,229
Total fixed operating lease expense 18,050 18,211 Variable lease expense
Ground leases 1,044 1,693 Office leases 585 552
Total variable lease expense 1,629 2,245 Total lease expense $ 19,679 20,456
Cash paid for amounts included in the measurement ofoperating lease liabilities
Operating cash flows for operating leases $ 15,003 14,815
Operating lease expense under the Company's ground and office leases was $19.7 million, $20.5 million and $19.1 million for the years endedDecember 31, 2020, 2019, and 2018 respectively, which includes fixed and variable rent expense.
The following table summarizes the undiscounted future cash flows by year attributable to the operating lease liabilities under ground and officeleases as of December 31, 2020, and provides a reconciliation to the Lease liability included in the accompanying Consolidated Balance Sheets:
(in thousands) Lease Liabilities For the year ended December 31, Ground Leases Office Leases Total
2021 $ 10,778 4,654 15,432 2022 10,837 3,379 14,216 2023 11,054 2,580 13,634 2024 11,103 2,114 13,217 2025 11,106 1,961 13,067
Thereafter 542,184 2,777 544,961 Total undiscounted lease liabilities $ 597,062 17,465 614,527
Present value discount (392,848) (1,289) (394,137)Lease liabilities $ 204,214 16,176 220,390
Weighted average discount rate 5.2% 3.8% Weighted average remaining term (inyears) 48.1 5.0
8. Income Taxes
The Company has elected to be taxed as a REIT under the applicable provisions of the Internal Revenue Code with certain of its subsidiariestreated as taxable REIT subsidiary (“TRS”) entities, which are subject to federal and state income taxes.
The following table summarizes the tax status of dividends paid on our common shares:
Year ended December 31, (in thousands) 2020 2019 2018 Dividend per share $ 2.19 (1) 2.34 2.22 Ordinary income 100% 97% 98%Capital gain —% 3% —%Qualified dividend income —% —% 2%Section 199A dividend 100% 97% 98%(1) During 2020, the Company declared four quarterly dividends, the last of which was paid on January 5, 2021, with a portion allocated
to the 2020 dividend period, and the balance allocated to 2021.
102
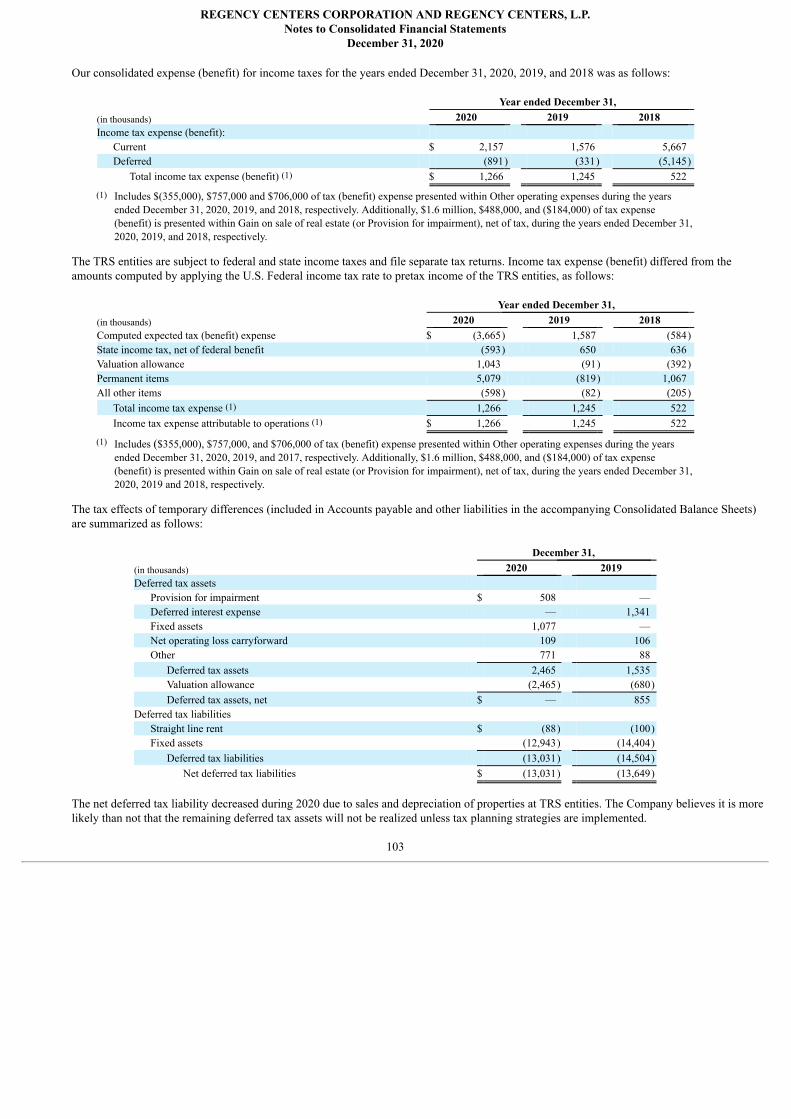
REGENCY CENTERS CORPORATION AND REGENCY CENTERS, L.P.Notes to Consolidated Financial Statements
December 31, 2020
Our consolidated expense (benefit) for income taxes for the years ended December 31, 2020, 2019, and 2018 was as follows:
Year ended December 31, (in thousands) 2020 2019 2018 Income tax expense (benefit):
Current $ 2,157 1,576 5,667 Deferred (891) (331) (5,145)
Total income tax expense (benefit) (1) $ 1,266 1,245 522
(1) Includes $(355,000), $757,000 and $706,000 of tax (benefit) expense presented within Other operating expenses during the yearsended December 31, 2020, 2019, and 2018, respectively. Additionally, $1.6 million, $488,000, and ($184,000) of tax expense(benefit) is presented within Gain on sale of real estate (or Provision for impairment), net of tax, during the years ended December 31,2020, 2019, and 2018, respectively.
The TRS entities are subject to federal and state income taxes and file separate tax returns. Income tax expense (benefit) differed from theamounts computed by applying the U.S. Federal income tax rate to pretax income of the TRS entities, as follows:
Year ended December 31,
(in thousands) 2020 2019 2018 Computed expected tax (benefit) expense $ (3,665) 1,587 (584)State income tax, net of federal benefit (593) 650 636 Valuation allowance 1,043 (91) (392)Permanent items 5,079 (819) 1,067 All other items (598) (82) (205)
Total income tax expense (1) 1,266 1,245 522 Income tax expense attributable to operations (1) $ 1,266 1,245 522
(1) Includes ($355,000), $757,000, and $706,000 of tax (benefit) expense presented within Other operating expenses during the yearsended December 31, 2020, 2019, and 2017, respectively. Additionally, $1.6 million, $488,000, and ($184,000) of tax expense(benefit) is presented within Gain on sale of real estate (or Provision for impairment), net of tax, during the years ended December 31,2020, 2019 and 2018, respectively.
The tax effects of temporary differences (included in Accounts payable and other liabilities in the accompanying Consolidated Balance Sheets)are summarized as follows:
December 31,
(in thousands) 2020 2019 Deferred tax assets
Provision for impairment $ 508 — Deferred interest expense — 1,341 Fixed assets 1,077 — Net operating loss carryforward 109 106 Other 771 88
Deferred tax assets 2,465 1,535 Valuation allowance (2,465) (680)Deferred tax assets, net $ — 855
Deferred tax liabilities Straight line rent $ (88) (100)Fixed assets (12,943) (14,404)
Deferred tax liabilities (13,031) (14,504)Net deferred tax liabilities $ (13,031) (13,649)
The net deferred tax liability decreased during 2020 due to sales and depreciation of properties at TRS entities. The Company believes it is morelikely than not that the remaining deferred tax assets will not be realized unless tax planning strategies are implemented.
103
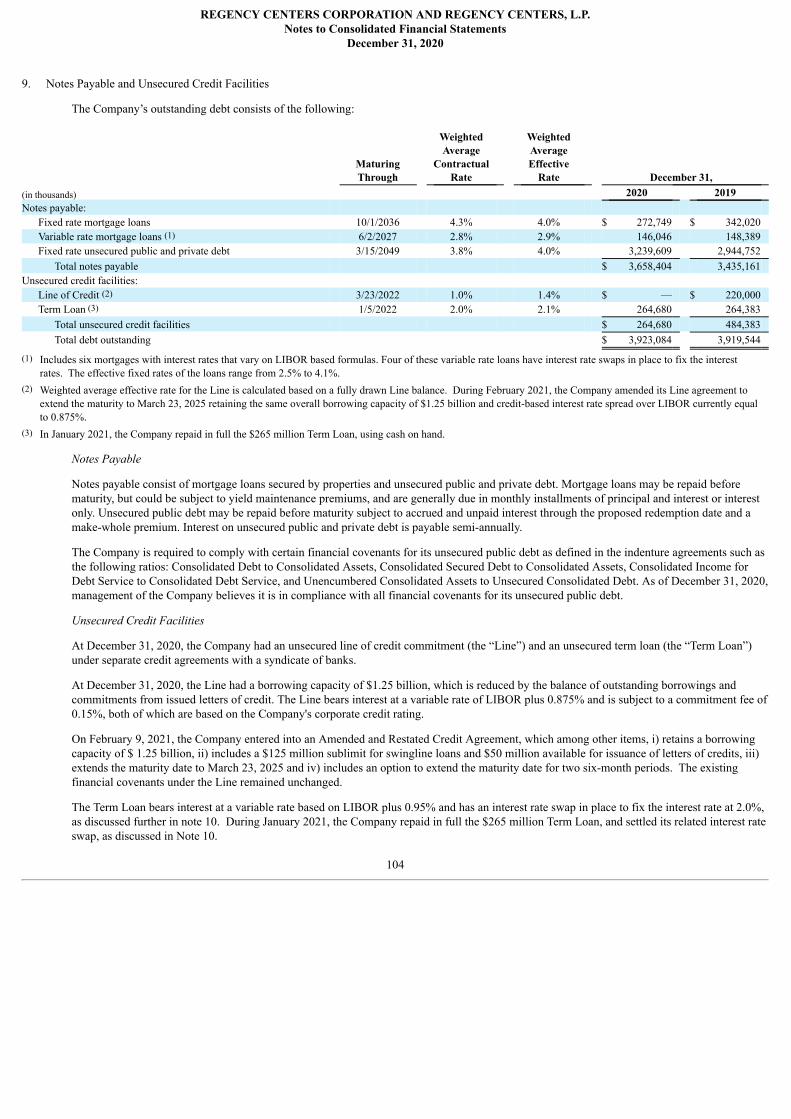
REGENCY CENTERS CORPORATION AND REGENCY CENTERS, L.P.Notes to Consolidated Financial Statements
December 31, 2020
9. Notes Payable and Unsecured Credit Facilities
The Company’s outstanding debt consists of the following:
MaturingThrough
WeightedAverage
ContractualRate
WeightedAverageEffective
Rate December 31, (in thousands) 2020 2019 Notes payable:
Fixed rate mortgage loans 10/1/2036 4.3% 4.0% $ 272,749 $ 342,020 Variable rate mortgage loans (1) 6/2/2027 2.8% 2.9% 146,046 148,389 Fixed rate unsecured public and private debt 3/15/2049 3.8% 4.0% 3,239,609 2,944,752
Total notes payable $ 3,658,404 3,435,161 Unsecured credit facilities:
Line of Credit (2) 3/23/2022 1.0% 1.4% $ — $ 220,000 Term Loan (3) 1/5/2022 2.0% 2.1% 264,680 264,383
Total unsecured credit facilities $ 264,680 484,383 Total debt outstanding $ 3,923,084 3,919,544
(1) Includes six mortgages with interest rates that vary on LIBOR based formulas. Four of these variable rate loans have interest rate swaps in place to fix the interestrates. The effective fixed rates of the loans range from 2.5% to 4.1%.
(2) Weighted average effective rate for the Line is calculated based on a fully drawn Line balance. During February 2021, the Company amended its Line agreement toextend the maturity to March 23, 2025 retaining the same overall borrowing capacity of $1.25 billion and credit-based interest rate spread over LIBOR currently equalto 0.875%.
(3) In January 2021, the Company repaid in full the $265 million Term Loan, using cash on hand.
Notes Payable
Notes payable consist of mortgage loans secured by properties and unsecured public and private debt. Mortgage loans may be repaid beforematurity, but could be subject to yield maintenance premiums, and are generally due in monthly installments of principal and interest or interestonly. Unsecured public debt may be repaid before maturity subject to accrued and unpaid interest through the proposed redemption date and amake-whole premium. Interest on unsecured public and private debt is payable semi-annually.
The Company is required to comply with certain financial covenants for its unsecured public debt as defined in the indenture agreements such asthe following ratios: Consolidated Debt to Consolidated Assets, Consolidated Secured Debt to Consolidated Assets, Consolidated Income forDebt Service to Consolidated Debt Service, and Unencumbered Consolidated Assets to Unsecured Consolidated Debt. As of December 31, 2020,management of the Company believes it is in compliance with all financial covenants for its unsecured public debt.
Unsecured Credit Facilities
At December 31, 2020, the Company had an unsecured line of credit commitment (the “Line”) and an unsecured term loan (the “Term Loan”)under separate credit agreements with a syndicate of banks.
At December 31, 2020, the Line had a borrowing capacity of $1.25 billion, which is reduced by the balance of outstanding borrowings andcommitments from issued letters of credit. The Line bears interest at a variable rate of LIBOR plus 0.875% and is subject to a commitment fee of0.15%, both of which are based on the Company's corporate credit rating.
On February 9, 2021, the Company entered into an Amended and Restated Credit Agreement, which among other items, i) retains a borrowingcapacity of $ 1.25 billion, ii) includes a $125 million sublimit for swingline loans and $50 million available for issuance of letters of credits, iii)extends the maturity date to March 23, 2025 and iv) includes an option to extend the maturity date for two six-month periods. The existingfinancial covenants under the Line remained unchanged.
The Term Loan bears interest at a variable rate based on LIBOR plus 0.95% and has an interest rate swap in place to fix the interest rate at 2.0%,as discussed further in note 10. During January 2021, the Company repaid in full the $265 million Term Loan, and settled its related interest rateswap, as discussed in Note 10.
104
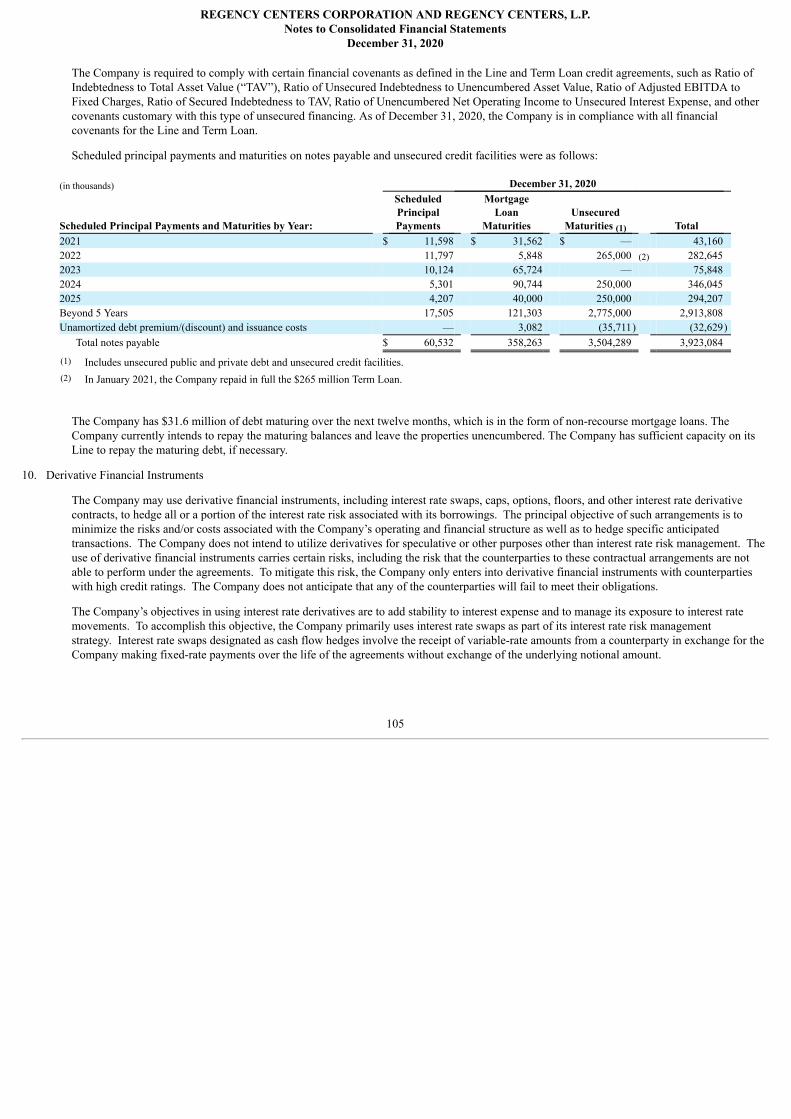
REGENCY CENTERS CORPORATION AND REGENCY CENTERS, L.P.Notes to Consolidated Financial Statements
December 31, 2020
The Company is required to comply with certain financial covenants as defined in the Line and Term Loan credit agreements, such as Ratio ofIndebtedness to Total Asset Value (“TAV”), Ratio of Unsecured Indebtedness to Unencumbered Asset Value, Ratio of Adjusted EBITDA toFixed Charges, Ratio of Secured Indebtedness to TAV, Ratio of Unencumbered Net Operating Income to Unsecured Interest Expense, and othercovenants customary with this type of unsecured financing. As of December 31, 2020, the Company is in compliance with all financialcovenants for the Line and Term Loan.
Scheduled principal payments and maturities on notes payable and unsecured credit facilities were as follows:
(in thousands) December 31, 2020
Scheduled Principal Payments and Maturities by Year:
ScheduledPrincipalPayments
MortgageLoan
Maturities Unsecured
Maturities (1) Total 2021 $ 11,598 $ 31,562 $ — 43,160 2022 11,797 5,848 265,000 (2) 282,645 2023 10,124 65,724 — 75,848 2024 5,301 90,744 250,000 346,045 2025 4,207 40,000 250,000 294,207 Beyond 5 Years 17,505 121,303 2,775,000 2,913,808 Unamortized debt premium/(discount) and issuance costs — 3,082 (35,711) (32,629)
Total notes payable $ 60,532 358,263 3,504,289 3,923,084
(1) Includes unsecured public and private debt and unsecured credit facilities. (2) In January 2021, the Company repaid in full the $265 million Term Loan.
The Company has $31.6 million of debt maturing over the next twelve months, which is in the form of non-recourse mortgage loans. TheCompany currently intends to repay the maturing balances and leave the properties unencumbered. The Company has sufficient capacity on itsLine to repay the maturing debt, if necessary.
10. Derivative Financial Instruments
The Company may use derivative financial instruments, including interest rate swaps, caps, options, floors, and other interest rate derivativecontracts, to hedge all or a portion of the interest rate risk associated with its borrowings. The principal objective of such arrangements is tominimize the risks and/or costs associated with the Company’s operating and financial structure as well as to hedge specific anticipatedtransactions. The Company does not intend to utilize derivatives for speculative or other purposes other than interest rate risk management. Theuse of derivative financial instruments carries certain risks, including the risk that the counterparties to these contractual arrangements are notable to perform under the agreements. To mitigate this risk, the Company only enters into derivative financial instruments with counterpartieswith high credit ratings. The Company does not anticipate that any of the counterparties will fail to meet their obligations.
The Company’s objectives in using interest rate derivatives are to add stability to interest expense and to manage its exposure to interest ratemovements. To accomplish this objective, the Company primarily uses interest rate swaps as part of its interest rate risk managementstrategy. Interest rate swaps designated as cash flow hedges involve the receipt of variable-rate amounts from a counterparty in exchange for theCompany making fixed-rate payments over the life of the agreements without exchange of the underlying notional amount.
105
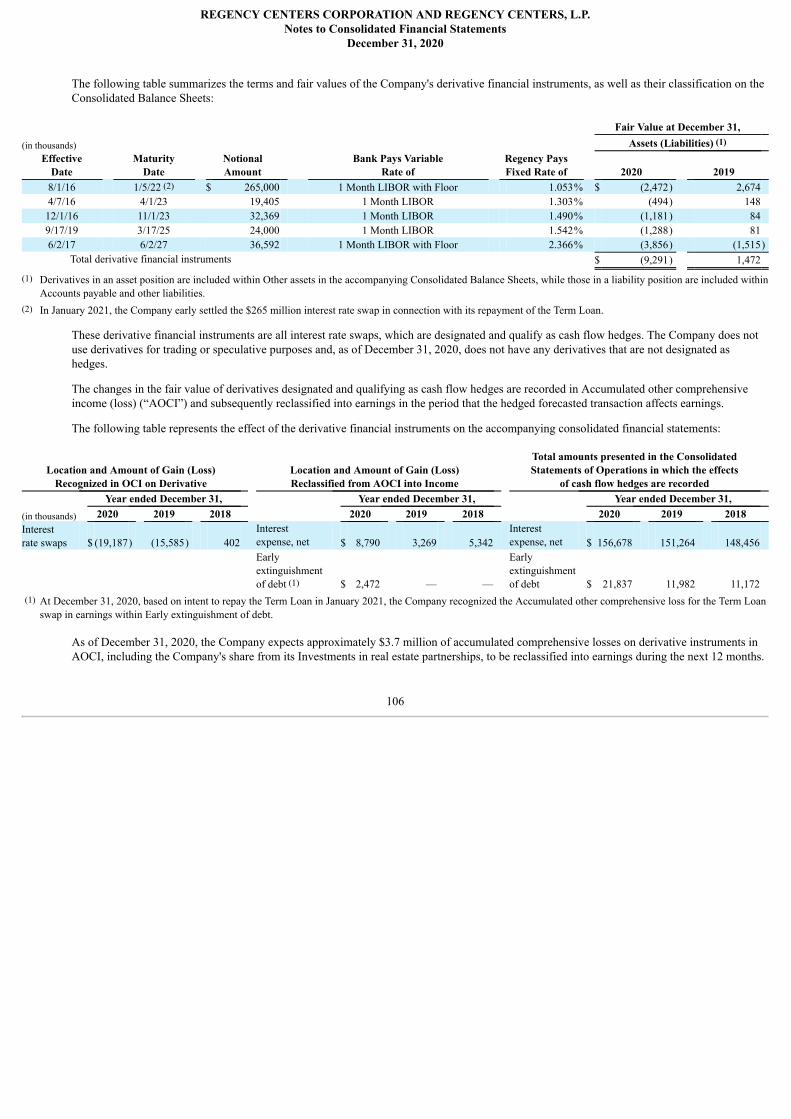
REGENCY CENTERS CORPORATION AND REGENCY CENTERS, L.P.Notes to Consolidated Financial Statements
December 31, 2020
The following table summarizes the terms and fair values of the Company's derivative financial instruments, as well as their classification on theConsolidated Balance Sheets:
Fair Value at December 31,
(in thousands) Assets (Liabilities) (1) Effective
Date Maturity
Date NotionalAmount
Bank Pays VariableRate of
Regency PaysFixed Rate of 2020 2019
8/1/16 1/5/22 (2) $ 265,000 1 Month LIBOR with Floor 1.053% $ (2,472) 2,674 4/7/16 4/1/23 19,405 1 Month LIBOR 1.303% (494) 148 12/1/16 11/1/23 32,369 1 Month LIBOR 1.490% (1,181) 84 9/17/19 3/17/25 24,000 1 Month LIBOR 1.542% (1,288) 81 6/2/17 6/2/27 36,592 1 Month LIBOR with Floor 2.366% (3,856) (1,515)
Total derivative financial instruments $ (9,291) 1,472
(1) Derivatives in an asset position are included within Other assets in the accompanying Consolidated Balance Sheets, while those in a liability position are included withinAccounts payable and other liabilities.
(2) In January 2021, the Company early settled the $265 million interest rate swap in connection with its repayment of the Term Loan.
These derivative financial instruments are all interest rate swaps, which are designated and qualify as cash flow hedges. The Company does notuse derivatives for trading or speculative purposes and, as of December 31, 2020, does not have any derivatives that are not designated ashedges.
The changes in the fair value of derivatives designated and qualifying as cash flow hedges are recorded in Accumulated other comprehensiveincome (loss) (“AOCI”) and subsequently reclassified into earnings in the period that the hedged forecasted transaction affects earnings.
The following table represents the effect of the derivative financial instruments on the accompanying consolidated financial statements:
Location and Amount of Gain (Loss)Recognized in OCI on Derivative
Location and Amount of Gain (Loss)Reclassified from AOCI into Income
Total amounts presented in the ConsolidatedStatements of Operations in which the effects
of cash flow hedges are recorded Year ended December 31, Year ended December 31, Year ended December 31,
(in thousands) 2020 2019 2018 2020 2019 2018 2020 2019 2018 Interestrate swaps $ (19,187) (15,585) 402
Interestexpense, net $ 8,790 3,269 5,342
Interestexpense, net $ 156,678 151,264 148,456
Earlyextinguishmentof debt (1) $ 2,472 — —
Earlyextinguishmentof debt $ 21,837 11,982 11,172
(1) At December 31, 2020, based on intent to repay the Term Loan in January 2021, the Company recognized the Accumulated other comprehensive loss for the Term Loanswap in earnings within Early extinguishment of debt.
As of December 31, 2020, the Company expects approximately $3.7 million of accumulated comprehensive losses on derivative instruments inAOCI, including the Company's share from its Investments in real estate partnerships, to be reclassified into earnings during the next 12 months.
106
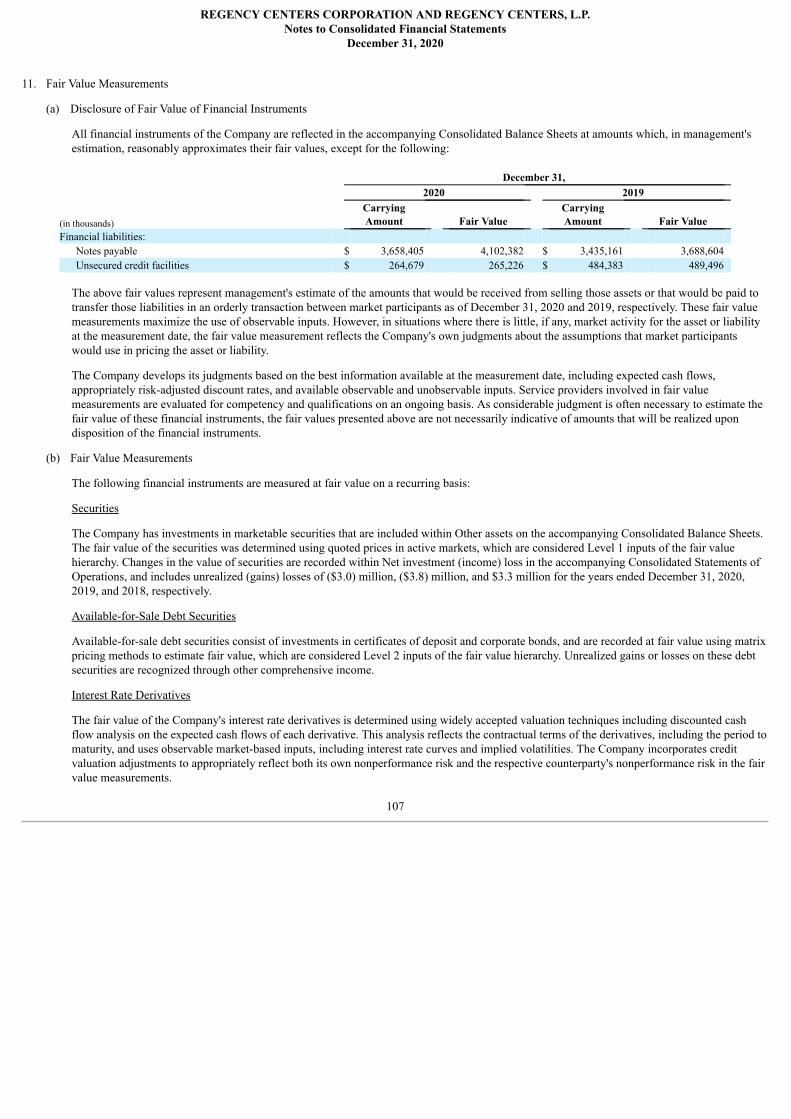
REGENCY CENTERS CORPORATION AND REGENCY CENTERS, L.P.Notes to Consolidated Financial Statements
December 31, 2020
11. Fair Value Measurements
(a) Disclosure of Fair Value of Financial Instruments
All financial instruments of the Company are reflected in the accompanying Consolidated Balance Sheets at amounts which, in management'sestimation, reasonably approximates their fair values, except for the following:
December 31, 2020 2019
(in thousands) CarryingAmount Fair Value
CarryingAmount Fair Value
Financial liabilities: Notes payable $ 3,658,405 4,102,382 $ 3,435,161 3,688,604 Unsecured credit facilities $ 264,679 265,226 $ 484,383 489,496
The above fair values represent management's estimate of the amounts that would be received from selling those assets or that would be paid totransfer those liabilities in an orderly transaction between market participants as of December 31, 2020 and 2019, respectively. These fair valuemeasurements maximize the use of observable inputs. However, in situations where there is little, if any, market activity for the asset or liabilityat the measurement date, the fair value measurement reflects the Company's own judgments about the assumptions that market participantswould use in pricing the asset or liability.
The Company develops its judgments based on the best information available at the measurement date, including expected cash flows,appropriately risk-adjusted discount rates, and available observable and unobservable inputs. Service providers involved in fair valuemeasurements are evaluated for competency and qualifications on an ongoing basis. As considerable judgment is often necessary to estimate thefair value of these financial instruments, the fair values presented above are not necessarily indicative of amounts that will be realized upondisposition of the financial instruments.
(b) Fair Value Measurements
The following financial instruments are measured at fair value on a recurring basis:
Securities
The Company has investments in marketable securities that are included within Other assets on the accompanying Consolidated Balance Sheets.The fair value of the securities was determined using quoted prices in active markets, which are considered Level 1 inputs of the fair valuehierarchy. Changes in the value of securities are recorded within Net investment (income) loss in the accompanying Consolidated Statements ofOperations, and includes unrealized (gains) losses of ($3.0) million, ($3.8) million, and $3.3 million for the years ended December 31, 2020,2019, and 2018, respectively.
Available-for-Sale Debt Securities
Available-for-sale debt securities consist of investments in certificates of deposit and corporate bonds, and are recorded at fair value using matrixpricing methods to estimate fair value, which are considered Level 2 inputs of the fair value hierarchy. Unrealized gains or losses on these debtsecurities are recognized through other comprehensive income.
Interest Rate Derivatives
The fair value of the Company's interest rate derivatives is determined using widely accepted valuation techniques including discounted cashflow analysis on the expected cash flows of each derivative. This analysis reflects the contractual terms of the derivatives, including the period tomaturity, and uses observable market-based inputs, including interest rate curves and implied volatilities. The Company incorporates creditvaluation adjustments to appropriately reflect both its own nonperformance risk and the respective counterparty's nonperformance risk in the fairvalue measurements.
107
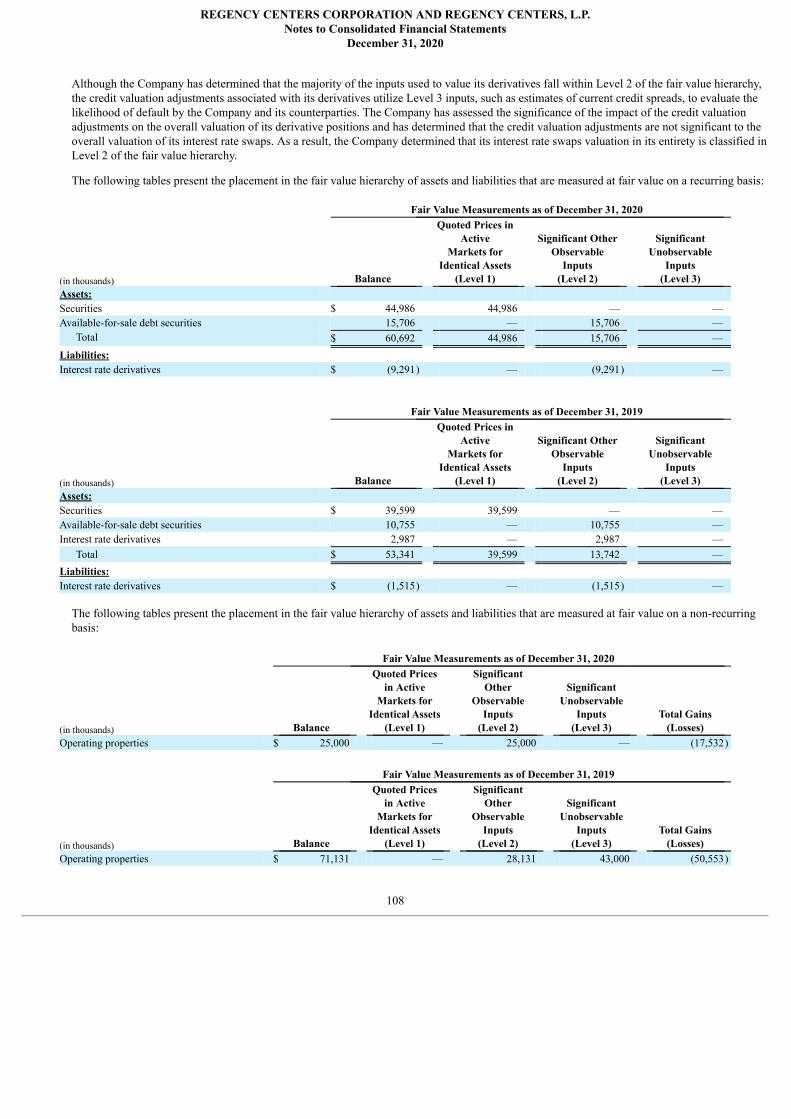
REGENCY CENTERS CORPORATION AND REGENCY CENTERS, L.P.Notes to Consolidated Financial Statements
December 31, 2020
Although the Company has determined that the majority of the inputs used to value its derivatives fall within Level 2 of the fair value hierarchy,the credit valuation adjustments associated with its derivatives utilize Level 3 inputs, such as estimates of current credit spreads, to evaluate thelikelihood of default by the Company and its counterparties. The Company has assessed the significance of the impact of the credit valuationadjustments on the overall valuation of its derivative positions and has determined that the credit valuation adjustments are not significant to theoverall valuation of its interest rate swaps. As a result, the Company determined that its interest rate swaps valuation in its entirety is classified inLevel 2 of the fair value hierarchy.
The following tables present the placement in the fair value hierarchy of assets and liabilities that are measured at fair value on a recurring basis:
Fair Value Measurements as of December 31, 2020
(in thousands) Balance
Quoted Prices inActive
Markets forIdentical Assets
(Level 1)
Significant OtherObservable
Inputs(Level 2)
SignificantUnobservable
Inputs(Level 3)
Assets: Securities $ 44,986 44,986 — — Available-for-sale debt securities 15,706 — 15,706 —
Total $ 60,692 44,986 15,706 — Liabilities: Interest rate derivatives $ (9,291) — (9,291) —
Fair Value Measurements as of December 31, 2019
(in thousands) Balance
Quoted Prices inActive
Markets forIdentical Assets
(Level 1)
Significant OtherObservable
Inputs(Level 2)
SignificantUnobservable
Inputs(Level 3)
Assets: Securities $ 39,599 39,599 — — Available-for-sale debt securities 10,755 — 10,755 — Interest rate derivatives 2,987 — 2,987 —
Total $ 53,341 39,599 13,742 — Liabilities: Interest rate derivatives $ (1,515) — (1,515) —
The following tables present the placement in the fair value hierarchy of assets and liabilities that are measured at fair value on a non-recurringbasis:
Fair Value Measurements as of December 31, 2020
(in thousands) Balance
Quoted Pricesin Active
Markets forIdentical Assets
(Level 1)
SignificantOther
ObservableInputs
(Level 2)
SignificantUnobservable
Inputs(Level 3)
Total Gains(Losses)
Operating properties $ 25,000 — 25,000 — (17,532)
Fair Value Measurements as of December 31, 2019
(in thousands) Balance
Quoted Pricesin Active
Markets forIdentical Assets
(Level 1)
SignificantOther
ObservableInputs
(Level 2)
SignificantUnobservable
Inputs(Level 3)
Total Gains(Losses)
Operating properties $ 71,131 — 28,131 43,000 (50,553)
108
REGENCY CENTERS CORPORATION AND REGENCY CENTERS, L.P.Notes to Consolidated Financial Statements
December 31, 2020
During the years ended December 31, 2020 and 2019, the Company recorded Provision for impairment of $17.5 million and $40.3 million,respectively, on one operating property which is classified as held and used. The property, which is located in the Manhattan market of NewYork City, was impaired during 2019 as a result of a fair value analysis performed based on lease up expectations after its single retail tenantdeclared bankruptcy. As the pandemic continued to impact the leasing market, limiting visibility for replacement prospects for this property, thehold period probabilities shifted triggering further evaluation of the current fair value resulting in the additional impairment charge during thefourth quarter of 2020.
The 2019 fair value was derived using a discounted cash flow model, which included assumptions around redevelopment of the asset to itshighest and best use as a mixed-use project and re-leasing the space. The discount rate of 8.58% and terminal capitalization rate of 4.75% usedin the discounted cash flow model are considered significant inputs and assumptions to estimating the fair value of the property, which isconsidered a Level 3 input per the fair value hierarchy. The 2020 fair value was based on third-party offers for the property and is reflected inthe above Level 2 fair value hierarchy.
During the year ended December 31, 2019, the Company also recorded a $10.2 million Provision for impairment on one operating propertywhich was classified as held and used and resulted in a fair value of $28.1 million. That operating property is classified as held for sale atDecember 31, 2020. The property was remeasured to fair value based on its expected selling price and is reflected in the above Level 2 fairvalue hierarchy.
12. Equity and Capital
Common Stock of the Parent Company
At the Market (“ATM”) Program
Under the Parent Company's ATM equity offering program, the Parent Company may sell up to $500.0 million of common stock at pricesdetermined by the market at the time of sale. There were no shares issued under the ATM equity program during the year ended December 31,2020. As of December 31, 2020, all $500 million of common stock authorized under the ATM program remained available for issuance.
Under a previous ATM equity program which expired on March 31, 2020, the Company sold shares through forward sale agreements, which theCompany settled during March 2020. At settlement, the Company issued 1,894,845 shares of its common stock, receiving $125.8 million of netproceeds which were used for working capital and general corporate purposes.
Share Repurchase Program
On February 4, 2020, the Company's Board authorized a common share repurchase program under which the Company may purchase, from timeto time, up to a maximum of $250 million of shares of its outstanding common stock through open market purchases or in privately negotiatedtransactions. Any shares purchased, if not retired, will be treated as treasury shares. The program is set to expire on February 5, 2021, but may bemodified at the discretion of the Board. The timing and actual number of shares purchased under the program depend upon marketplaceconditions, liquidity needs, and other factors. Through December 31, 2020, no shares have been repurchased under this program.
On February 3, 2021, the Company’s Board authorized a new common share repurchase program under which the Company may purchase, fromtime to time, up to a maximum of $250 million of its outstanding common stock through open market purchases or in privately negotiatedtransactions. Any shares purchased, if not retired, will be treated as treasury shares. This new program is set to expire on February 3, 2023.
Common Units of the Operating Partnership
Common units of the operating partnership are issued or redeemed and retired for each of the shares of Parent Company common stock issued orrepurchased and retired, as described above.
In January 2020, the Operating Partnership issued 18,613 exchangeable operating partnership units, valued at $1.3 million, as partial purchaseprice consideration for the acquisition of an additional 16.62% interest in an operating shopping center.
109
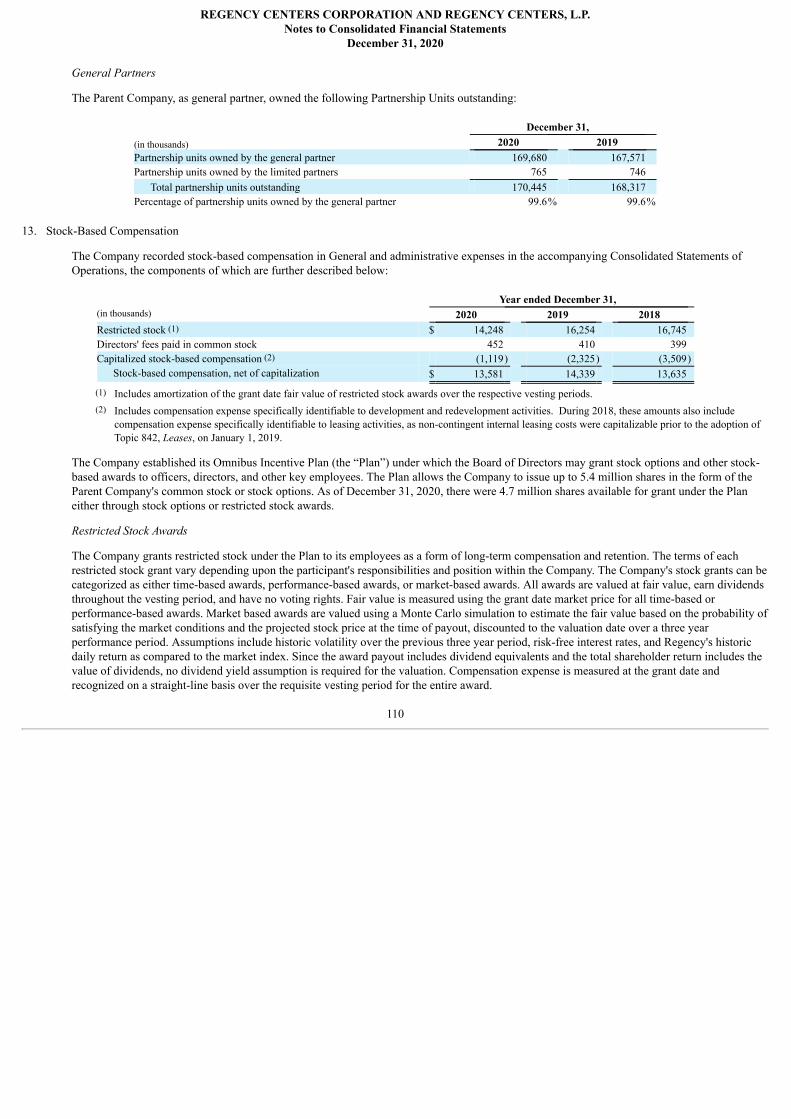
REGENCY CENTERS CORPORATION AND REGENCY CENTERS, L.P.Notes to Consolidated Financial Statements
December 31, 2020
General Partners
The Parent Company, as general partner, owned the following Partnership Units outstanding:
December 31, (in thousands) 2020 2019 Partnership units owned by the general partner 169,680 167,571 Partnership units owned by the limited partners 765 746
Total partnership units outstanding 170,445 168,317 Percentage of partnership units owned by the general partner 99.6% 99.6%
13. Stock-Based Compensation
The Company recorded stock-based compensation in General and administrative expenses in the accompanying Consolidated Statements ofOperations, the components of which are further described below:
Year ended December 31, (in thousands) 2020 2019 2018 Restricted stock (1) $ 14,248 16,254 16,745 Directors' fees paid in common stock 452 410 399 Capitalized stock-based compensation (2) (1,119) (2,325) (3,509)
Stock-based compensation, net of capitalization $ 13,581 14,339 13,635
(1) Includes amortization of the grant date fair value of restricted stock awards over the respective vesting periods. (2) Includes compensation expense specifically identifiable to development and redevelopment activities. During 2018, these amounts also include
compensation expense specifically identifiable to leasing activities, as non-contingent internal leasing costs were capitalizable prior to the adoption ofTopic 842, Leases, on January 1, 2019.
The Company established its Omnibus Incentive Plan (the “Plan”) under which the Board of Directors may grant stock options and other stock-based awards to officers, directors, and other key employees. The Plan allows the Company to issue up to 5.4 million shares in the form of theParent Company's common stock or stock options. As of December 31, 2020, there were 4.7 million shares available for grant under the Planeither through stock options or restricted stock awards.
Restricted Stock Awards
The Company grants restricted stock under the Plan to its employees as a form of long-term compensation and retention. The terms of eachrestricted stock grant vary depending upon the participant's responsibilities and position within the Company. The Company's stock grants can becategorized as either time-based awards, performance-based awards, or market-based awards. All awards are valued at fair value, earn dividendsthroughout the vesting period, and have no voting rights. Fair value is measured using the grant date market price for all time-based orperformance-based awards. Market based awards are valued using a Monte Carlo simulation to estimate the fair value based on the probability ofsatisfying the market conditions and the projected stock price at the time of payout, discounted to the valuation date over a three yearperformance period. Assumptions include historic volatility over the previous three year period, risk-free interest rates, and Regency's historicdaily return as compared to the market index. Since the award payout includes dividend equivalents and the total shareholder return includes thevalue of dividends, no dividend yield assumption is required for the valuation. Compensation expense is measured at the grant date andrecognized on a straight-line basis over the requisite vesting period for the entire award.
110
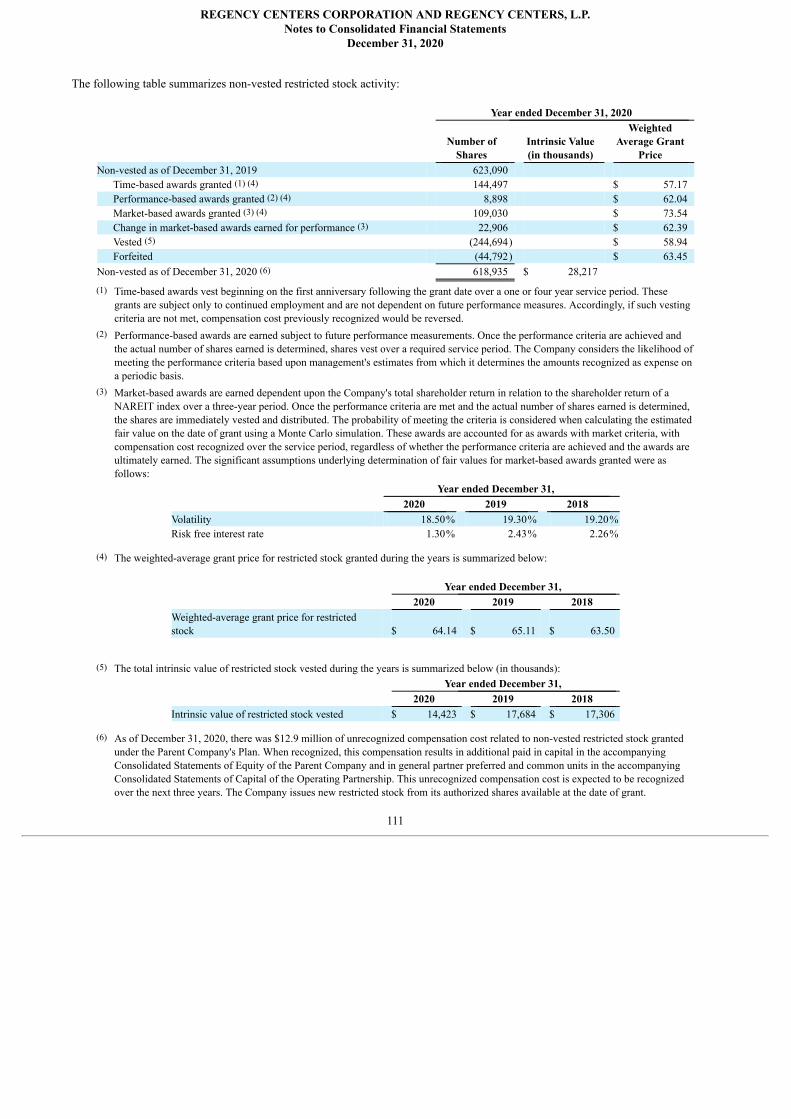
REGENCY CENTERS CORPORATION AND REGENCY CENTERS, L.P.Notes to Consolidated Financial Statements
December 31, 2020
The following table summarizes non-vested restricted stock activity:
Year ended December 31, 2020
Number of
Shares Intrinsic Value(in thousands)
WeightedAverage Grant
Price Non-vested as of December 31, 2019 623,090
Time-based awards granted (1) (4) 144,497 $ 57.17 Performance-based awards granted (2) (4) 8,898 $ 62.04 Market-based awards granted (3) (4) 109,030 $ 73.54 Change in market-based awards earned for performance (3) 22,906 $ 62.39 Vested (5) (244,694) $ 58.94 Forfeited (44,792) $ 63.45
Non-vested as of December 31, 2020 (6) 618,935 $ 28,217
(1) Time-based awards vest beginning on the first anniversary following the grant date over a one or four year service period. Thesegrants are subject only to continued employment and are not dependent on future performance measures. Accordingly, if such vestingcriteria are not met, compensation cost previously recognized would be reversed.
(2) Performance-based awards are earned subject to future performance measurements. Once the performance criteria are achieved andthe actual number of shares earned is determined, shares vest over a required service period. The Company considers the likelihood ofmeeting the performance criteria based upon management's estimates from which it determines the amounts recognized as expense ona periodic basis.
(3) Market-based awards are earned dependent upon the Company's total shareholder return in relation to the shareholder return of aNAREIT index over a three-year period. Once the performance criteria are met and the actual number of shares earned is determined,the shares are immediately vested and distributed. The probability of meeting the criteria is considered when calculating the estimatedfair value on the date of grant using a Monte Carlo simulation. These awards are accounted for as awards with market criteria, withcompensation cost recognized over the service period, regardless of whether the performance criteria are achieved and the awards areultimately earned. The significant assumptions underlying determination of fair values for market-based awards granted were asfollows:
Year ended December 31, 2020 2019 2018 Volatility 18.50% 19.30% 19.20%Risk free interest rate 1.30% 2.43% 2.26%
(4) The weighted-average grant price for restricted stock granted during the years is summarized below:
Year ended December 31, 2020 2019 2018
Weighted-average grant price for restrictedstock $ 64.14 $ 65.11 $ 63.50
(5) The total intrinsic value of restricted stock vested during the years is summarized below (in thousands): Year ended December 31, 2020 2019 2018
Intrinsic value of restricted stock vested $ 14,423 $ 17,684 $ 17,306
(6) As of December 31, 2020, there was $12.9 million of unrecognized compensation cost related to non-vested restricted stock grantedunder the Parent Company's Plan. When recognized, this compensation results in additional paid in capital in the accompanyingConsolidated Statements of Equity of the Parent Company and in general partner preferred and common units in the accompanyingConsolidated Statements of Capital of the Operating Partnership. This unrecognized compensation cost is expected to be recognizedover the next three years. The Company issues new restricted stock from its authorized shares available at the date of grant.
111
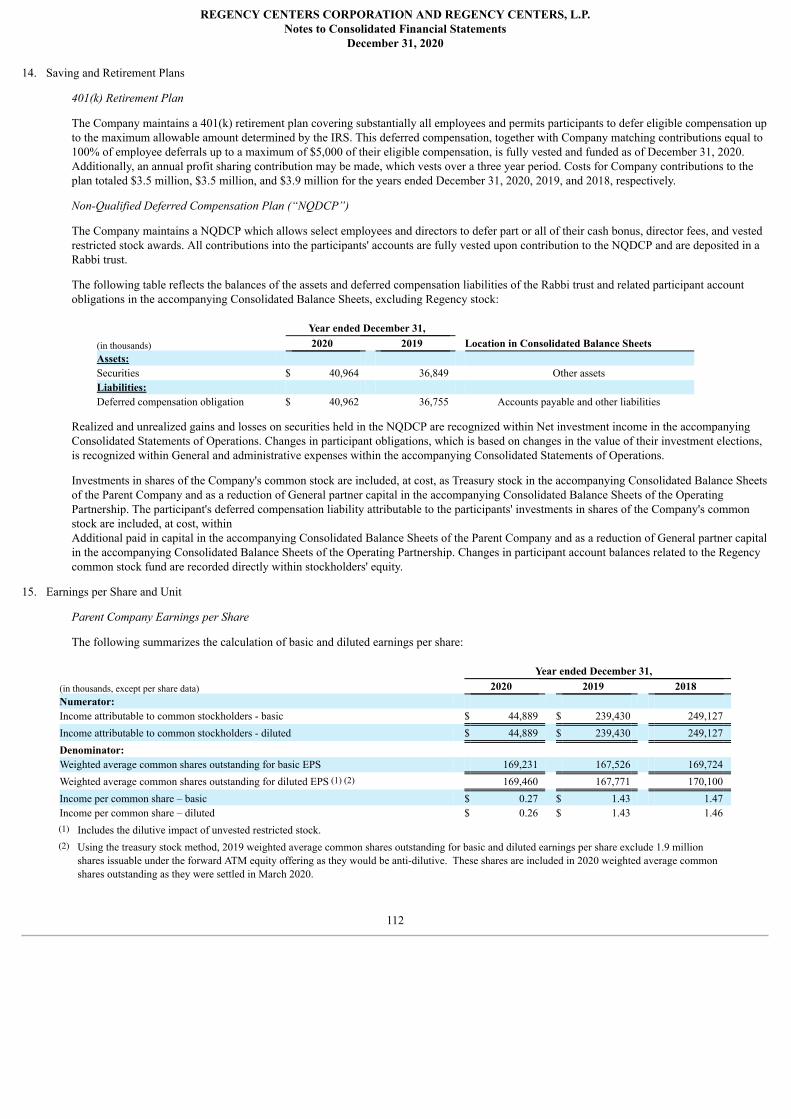
REGENCY CENTERS CORPORATION AND REGENCY CENTERS, L.P.Notes to Consolidated Financial Statements
December 31, 2020
14. Saving and Retirement Plans
401(k) Retirement Plan
The Company maintains a 401(k) retirement plan covering substantially all employees and permits participants to defer eligible compensation upto the maximum allowable amount determined by the IRS. This deferred compensation, together with Company matching contributions equal to100% of employee deferrals up to a maximum of $5,000 of their eligible compensation, is fully vested and funded as of December 31, 2020.Additionally, an annual profit sharing contribution may be made, which vests over a three year period. Costs for Company contributions to theplan totaled $3.5 million, $3.5 million, and $3.9 million for the years ended December 31, 2020, 2019, and 2018, respectively.
Non-Qualified Deferred Compensation Plan (“NQDCP”)
The Company maintains a NQDCP which allows select employees and directors to defer part or all of their cash bonus, director fees, and vestedrestricted stock awards. All contributions into the participants' accounts are fully vested upon contribution to the NQDCP and are deposited in aRabbi trust.
The following table reflects the balances of the assets and deferred compensation liabilities of the Rabbi trust and related participant accountobligations in the accompanying Consolidated Balance Sheets, excluding Regency stock:
Year ended December 31, (in thousands) 2020 2019 Location in Consolidated Balance SheetsAssets: Securities $ 40,964 36,849 Other assetsLiabilities: Deferred compensation obligation $ 40,962 36,755 Accounts payable and other liabilities
Realized and unrealized gains and losses on securities held in the NQDCP are recognized within Net investment income in the accompanyingConsolidated Statements of Operations. Changes in participant obligations, which is based on changes in the value of their investment elections,is recognized within General and administrative expenses within the accompanying Consolidated Statements of Operations.
Investments in shares of the Company's common stock are included, at cost, as Treasury stock in the accompanying Consolidated Balance Sheetsof the Parent Company and as a reduction of General partner capital in the accompanying Consolidated Balance Sheets of the OperatingPartnership. The participant's deferred compensation liability attributable to the participants' investments in shares of the Company's commonstock are included, at cost, within Additional paid in capital in the accompanying Consolidated Balance Sheets of the Parent Company and as a reduction of General partner capitalin the accompanying Consolidated Balance Sheets of the Operating Partnership. Changes in participant account balances related to the Regencycommon stock fund are recorded directly within stockholders' equity.
15. Earnings per Share and Unit
Parent Company Earnings per Share
The following summarizes the calculation of basic and diluted earnings per share:
Year ended December 31, (in thousands, except per share data) 2020 2019 2018 Numerator: Income attributable to common stockholders - basic $ 44,889 $ 239,430 249,127 Income attributable to common stockholders - diluted $ 44,889 $ 239,430 249,127 Denominator: Weighted average common shares outstanding for basic EPS 169,231 167,526 169,724 Weighted average common shares outstanding for diluted EPS (1) (2) 169,460 167,771 170,100 Income per common share – basic $ 0.27 $ 1.43 1.47 Income per common share – diluted $ 0.26 $ 1.43 1.46
(1) Includes the dilutive impact of unvested restricted stock. (2) Using the treasury stock method, 2019 weighted average common shares outstanding for basic and diluted earnings per share exclude 1.9 million
shares issuable under the forward ATM equity offering as they would be anti-dilutive. These shares are included in 2020 weighted average commonshares outstanding as they were settled in March 2020.
112
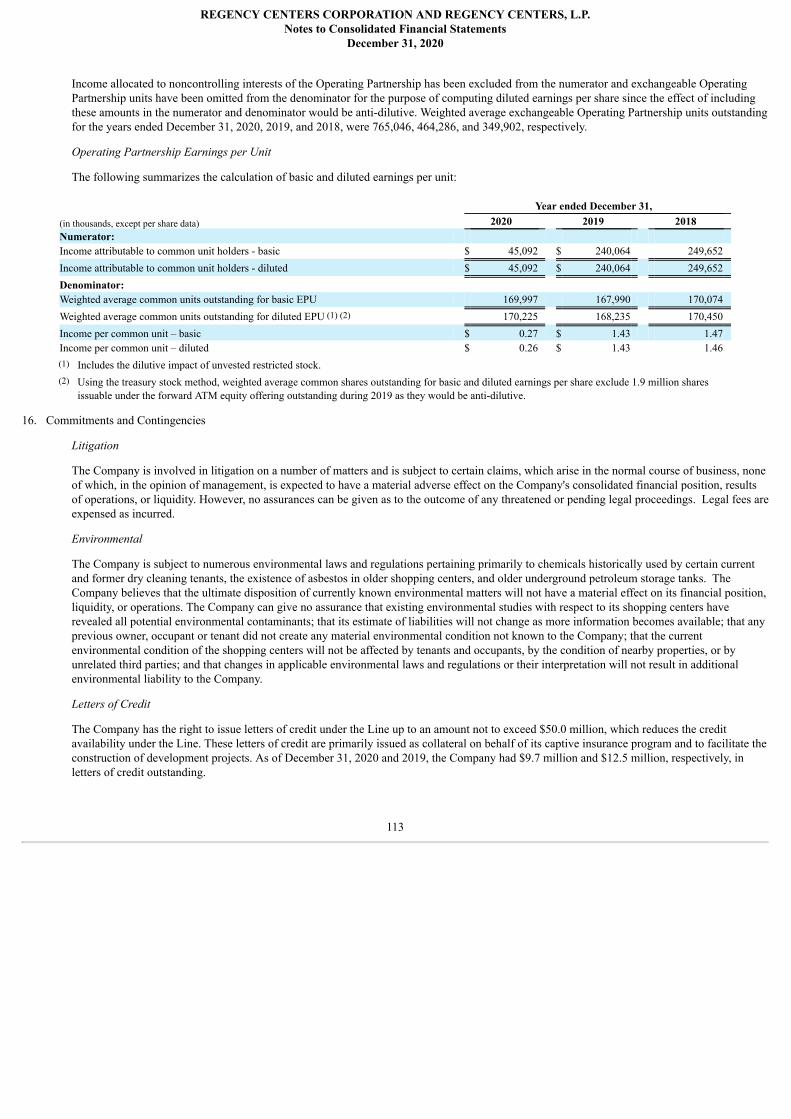
REGENCY CENTERS CORPORATION AND REGENCY CENTERS, L.P.Notes to Consolidated Financial Statements
December 31, 2020
Income allocated to noncontrolling interests of the Operating Partnership has been excluded from the numerator and exchangeable OperatingPartnership units have been omitted from the denominator for the purpose of computing diluted earnings per share since the effect of includingthese amounts in the numerator and denominator would be anti-dilutive. Weighted average exchangeable Operating Partnership units outstandingfor the years ended December 31, 2020, 2019, and 2018, were 765,046, 464,286, and 349,902, respectively.
Operating Partnership Earnings per Unit
The following summarizes the calculation of basic and diluted earnings per unit:
Year ended December 31, (in thousands, except per share data) 2020 2019 2018 Numerator: Income attributable to common unit holders - basic $ 45,092 $ 240,064 249,652 Income attributable to common unit holders - diluted $ 45,092 $ 240,064 249,652 Denominator: Weighted average common units outstanding for basic EPU 169,997 167,990 170,074 Weighted average common units outstanding for diluted EPU (1) (2) 170,225 168,235 170,450 Income per common unit – basic $ 0.27 $ 1.43 1.47 Income per common unit – diluted $ 0.26 $ 1.43 1.46
(1) Includes the dilutive impact of unvested restricted stock. (2) Using the treasury stock method, weighted average common shares outstanding for basic and diluted earnings per share exclude 1.9 million shares
issuable under the forward ATM equity offering outstanding during 2019 as they would be anti-dilutive.
16. Commitments and Contingencies
Litigation
The Company is involved in litigation on a number of matters and is subject to certain claims, which arise in the normal course of business, noneof which, in the opinion of management, is expected to have a material adverse effect on the Company's consolidated financial position, resultsof operations, or liquidity. However, no assurances can be given as to the outcome of any threatened or pending legal proceedings. Legal fees areexpensed as incurred.
Environmental
The Company is subject to numerous environmental laws and regulations pertaining primarily to chemicals historically used by certain currentand former dry cleaning tenants, the existence of asbestos in older shopping centers, and older underground petroleum storage tanks. TheCompany believes that the ultimate disposition of currently known environmental matters will not have a material effect on its financial position,liquidity, or operations. The Company can give no assurance that existing environmental studies with respect to its shopping centers haverevealed all potential environmental contaminants; that its estimate of liabilities will not change as more information becomes available; that anyprevious owner, occupant or tenant did not create any material environmental condition not known to the Company; that the currentenvironmental condition of the shopping centers will not be affected by tenants and occupants, by the condition of nearby properties, or byunrelated third parties; and that changes in applicable environmental laws and regulations or their interpretation will not result in additionalenvironmental liability to the Company.
Letters of Credit
The Company has the right to issue letters of credit under the Line up to an amount not to exceed $50.0 million, which reduces the creditavailability under the Line. These letters of credit are primarily issued as collateral on behalf of its captive insurance program and to facilitate theconstruction of development projects. As of December 31, 2020 and 2019, the Company had $9.7 million and $12.5 million, respectively, inletters of credit outstanding.
113
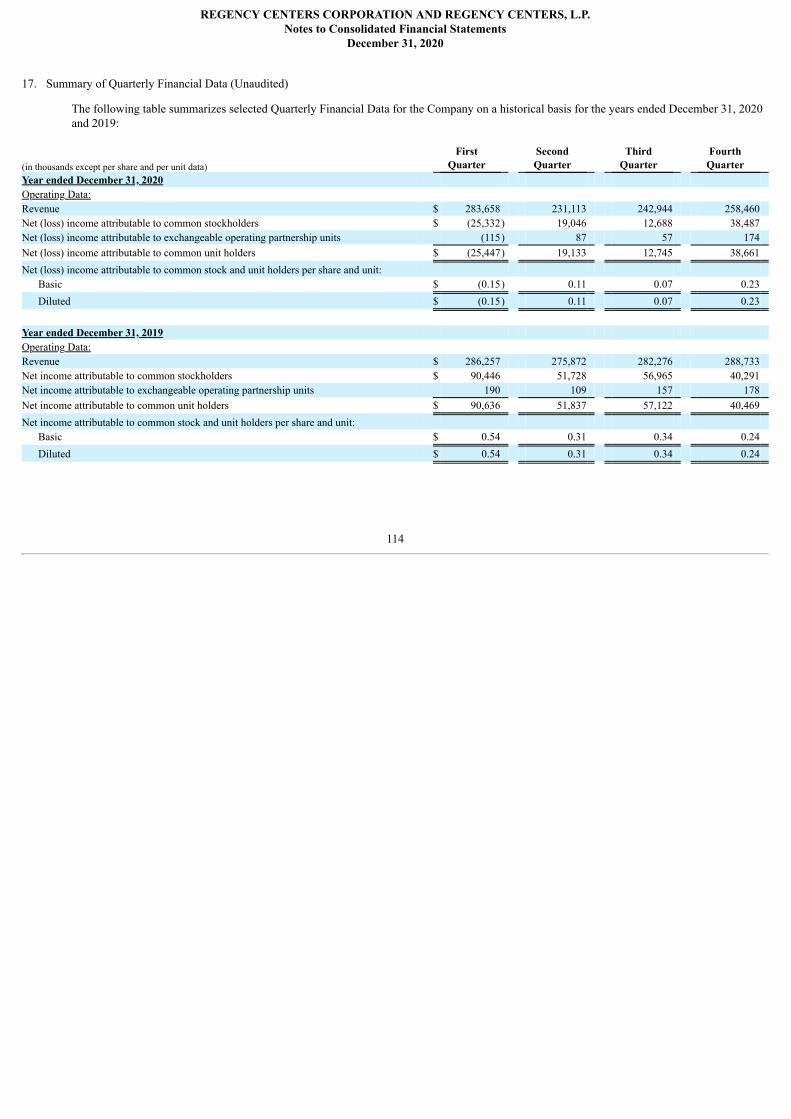
REGENCY CENTERS CORPORATION AND REGENCY CENTERS, L.P.Notes to Consolidated Financial Statements
December 31, 2020
17. Summary of Quarterly Financial Data (Unaudited)
The following table summarizes selected Quarterly Financial Data for the Company on a historical basis for the years ended December 31, 2020and 2019:
(in thousands except per share and per unit data) First
Quarter SecondQuarter
ThirdQuarter
FourthQuarter
Year ended December 31, 2020 Operating Data: Revenue $ 283,658 231,113 242,944 258,460 Net (loss) income attributable to common stockholders $ (25,332) 19,046 12,688 38,487 Net (loss) income attributable to exchangeable operating partnership units (115) 87 57 174 Net (loss) income attributable to common unit holders $ (25,447) 19,133 12,745 38,661 Net (loss) income attributable to common stock and unit holders per share and unit:
Basic $ (0.15) 0.11 0.07 0.23 Diluted $ (0.15) 0.11 0.07 0.23
Year ended December 31, 2019 Operating Data: Revenue $ 286,257 275,872 282,276 288,733 Net income attributable to common stockholders $ 90,446 51,728 56,965 40,291 Net income attributable to exchangeable operating partnership units 190 109 157 178 Net income attributable to common unit holders $ 90,636 51,837 57,122 40,469 Net income attributable to common stock and unit holders per share and unit:
Basic $ 0.54 0.31 0.34 0.24 Diluted $ 0.54 0.31 0.34 0.24
114
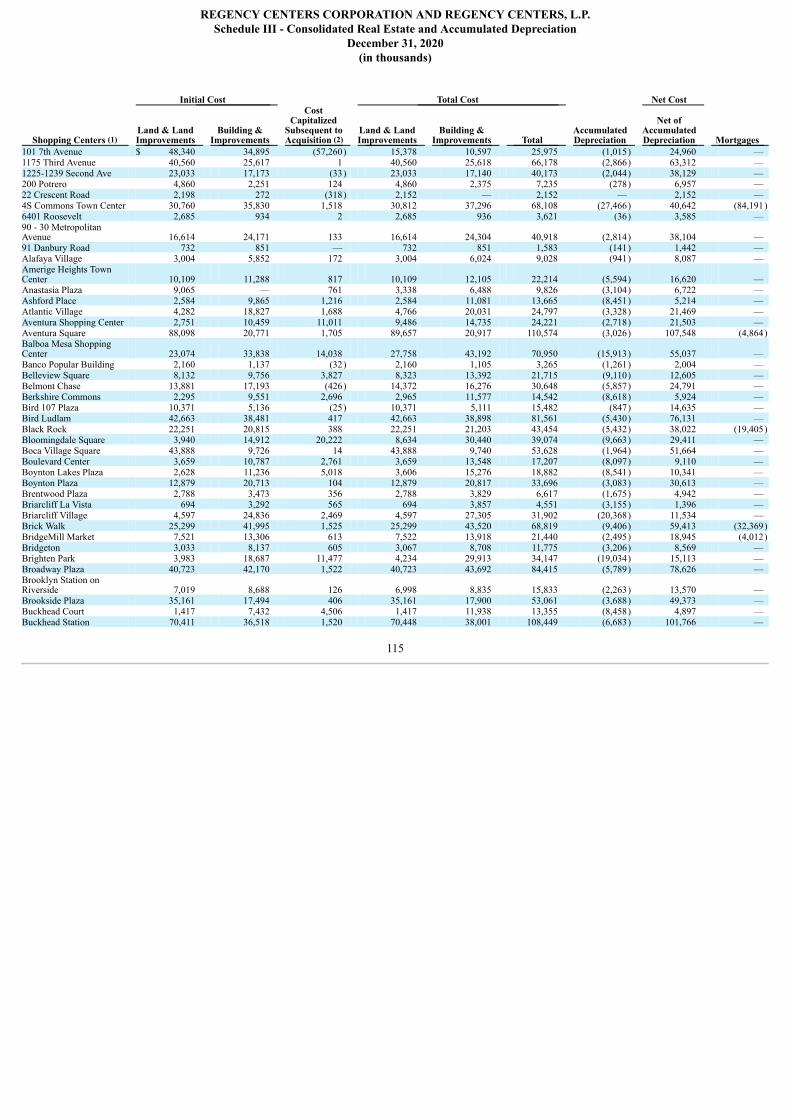
REGENCY CENTERS CORPORATION AND REGENCY CENTERS, L.P.Schedule III - Consolidated Real Estate and Accumulated Depreciation
December 31, 2020(in thousands)
Initial Cost Total Cost Net Cost
Shopping Centers (1) Land & LandImprovements
Building &Improvements
CostCapitalized
Subsequent toAcquisition (2)
Land & LandImprovements
Building &Improvements Total
AccumulatedDepreciation
Net ofAccumulatedDepreciation Mortgages
101 7th Avenue $ 48,340 34,895 (57,260) 15,378 10,597 25,975 (1,015) 24,960 — 1175 Third Avenue 40,560 25,617 1 40,560 25,618 66,178 (2,866) 63,312 — 1225-1239 Second Ave 23,033 17,173 (33) 23,033 17,140 40,173 (2,044) 38,129 — 200 Potrero 4,860 2,251 124 4,860 2,375 7,235 (278) 6,957 — 22 Crescent Road 2,198 272 (318) 2,152 — 2,152 — 2,152 — 4S Commons Town Center 30,760 35,830 1,518 30,812 37,296 68,108 (27,466) 40,642 (84,191)6401 Roosevelt 2,685 934 2 2,685 936 3,621 (36) 3,585 — 90 - 30 MetropolitanAvenue 16,614 24,171 133 16,614 24,304 40,918 (2,814) 38,104 — 91 Danbury Road 732 851 — 732 851 1,583 (141) 1,442 — Alafaya Village 3,004 5,852 172 3,004 6,024 9,028 (941) 8,087 — Amerige Heights TownCenter 10,109 11,288 817 10,109 12,105 22,214 (5,594) 16,620 — Anastasia Plaza 9,065 — 761 3,338 6,488 9,826 (3,104) 6,722 — Ashford Place 2,584 9,865 1,216 2,584 11,081 13,665 (8,451) 5,214 — Atlantic Village 4,282 18,827 1,688 4,766 20,031 24,797 (3,328) 21,469 — Aventura Shopping Center 2,751 10,459 11,011 9,486 14,735 24,221 (2,718) 21,503 — Aventura Square 88,098 20,771 1,705 89,657 20,917 110,574 (3,026) 107,548 (4,864)Balboa Mesa ShoppingCenter 23,074 33,838 14,038 27,758 43,192 70,950 (15,913) 55,037 — Banco Popular Building 2,160 1,137 (32) 2,160 1,105 3,265 (1,261) 2,004 — Belleview Square 8,132 9,756 3,827 8,323 13,392 21,715 (9,110) 12,605 — Belmont Chase 13,881 17,193 (426) 14,372 16,276 30,648 (5,857) 24,791 — Berkshire Commons 2,295 9,551 2,696 2,965 11,577 14,542 (8,618) 5,924 — Bird 107 Plaza 10,371 5,136 (25) 10,371 5,111 15,482 (847) 14,635 — Bird Ludlam 42,663 38,481 417 42,663 38,898 81,561 (5,430) 76,131 — Black Rock 22,251 20,815 388 22,251 21,203 43,454 (5,432) 38,022 (19,405)Bloomingdale Square 3,940 14,912 20,222 8,634 30,440 39,074 (9,663) 29,411 — Boca Village Square 43,888 9,726 14 43,888 9,740 53,628 (1,964) 51,664 — Boulevard Center 3,659 10,787 2,761 3,659 13,548 17,207 (8,097) 9,110 — Boynton Lakes Plaza 2,628 11,236 5,018 3,606 15,276 18,882 (8,541) 10,341 — Boynton Plaza 12,879 20,713 104 12,879 20,817 33,696 (3,083) 30,613 — Brentwood Plaza 2,788 3,473 356 2,788 3,829 6,617 (1,675) 4,942 — Briarcliff La Vista 694 3,292 565 694 3,857 4,551 (3,155) 1,396 — Briarcliff Village 4,597 24,836 2,469 4,597 27,305 31,902 (20,368) 11,534 — Brick Walk 25,299 41,995 1,525 25,299 43,520 68,819 (9,406) 59,413 (32,369)BridgeMill Market 7,521 13,306 613 7,522 13,918 21,440 (2,495) 18,945 (4,012)Bridgeton 3,033 8,137 605 3,067 8,708 11,775 (3,206) 8,569 — Brighten Park 3,983 18,687 11,477 4,234 29,913 34,147 (19,034) 15,113 — Broadway Plaza 40,723 42,170 1,522 40,723 43,692 84,415 (5,789) 78,626 — Brooklyn Station onRiverside 7,019 8,688 126 6,998 8,835 15,833 (2,263) 13,570 — Brookside Plaza 35,161 17,494 406 35,161 17,900 53,061 (3,688) 49,373 — Buckhead Court 1,417 7,432 4,506 1,417 11,938 13,355 (8,458) 4,897 — Buckhead Station 70,411 36,518 1,520 70,448 38,001 108,449 (6,683) 101,766 —
115
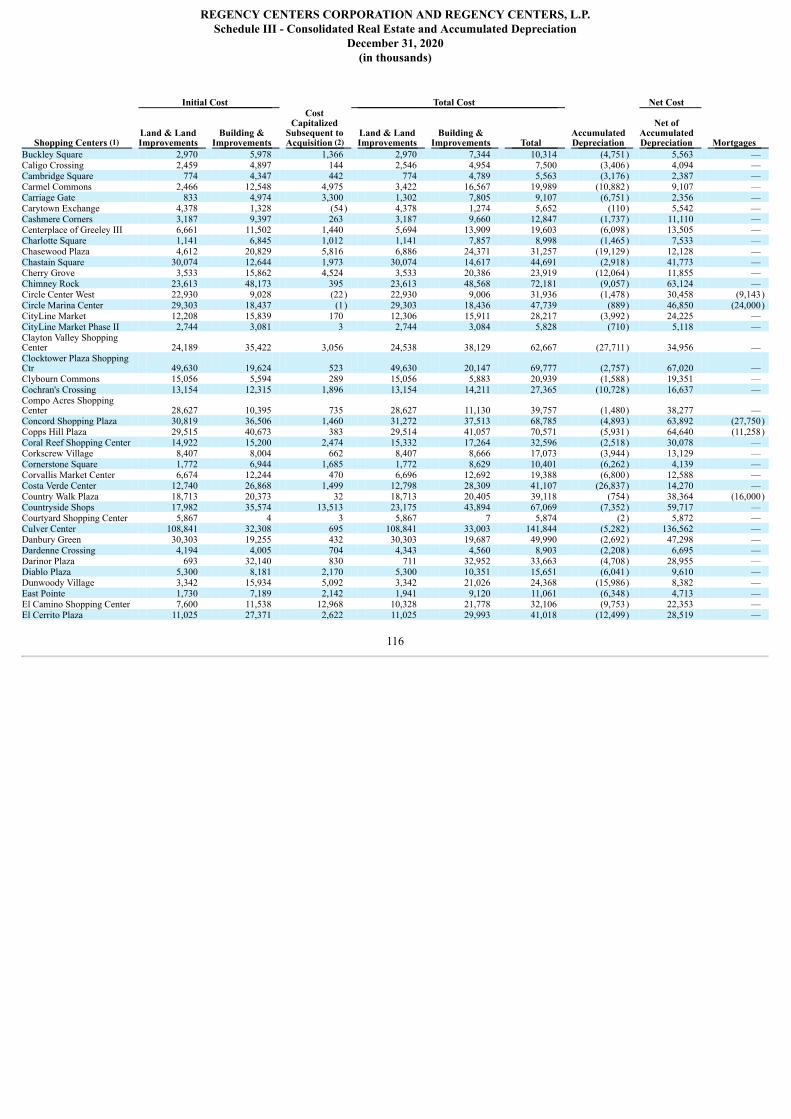
REGENCY CENTERS CORPORATION AND REGENCY CENTERS, L.P.Schedule III - Consolidated Real Estate and Accumulated Depreciation
December 31, 2020(in thousands)
Initial Cost Total Cost Net Cost
Shopping Centers (1) Land & LandImprovements
Building &Improvements
CostCapitalized
Subsequent toAcquisition (2)
Land & LandImprovements
Building &Improvements Total
AccumulatedDepreciation
Net ofAccumulatedDepreciation Mortgages
Buckley Square 2,970 5,978 1,366 2,970 7,344 10,314 (4,751) 5,563 — Caligo Crossing 2,459 4,897 144 2,546 4,954 7,500 (3,406) 4,094 — Cambridge Square 774 4,347 442 774 4,789 5,563 (3,176) 2,387 — Carmel Commons 2,466 12,548 4,975 3,422 16,567 19,989 (10,882) 9,107 — Carriage Gate 833 4,974 3,300 1,302 7,805 9,107 (6,751) 2,356 — Carytown Exchange 4,378 1,328 (54) 4,378 1,274 5,652 (110) 5,542 — Cashmere Corners 3,187 9,397 263 3,187 9,660 12,847 (1,737) 11,110 — Centerplace of Greeley III 6,661 11,502 1,440 5,694 13,909 19,603 (6,098) 13,505 — Charlotte Square 1,141 6,845 1,012 1,141 7,857 8,998 (1,465) 7,533 — Chasewood Plaza 4,612 20,829 5,816 6,886 24,371 31,257 (19,129) 12,128 — Chastain Square 30,074 12,644 1,973 30,074 14,617 44,691 (2,918) 41,773 — Cherry Grove 3,533 15,862 4,524 3,533 20,386 23,919 (12,064) 11,855 — Chimney Rock 23,613 48,173 395 23,613 48,568 72,181 (9,057) 63,124 — Circle Center West 22,930 9,028 (22) 22,930 9,006 31,936 (1,478) 30,458 (9,143)Circle Marina Center 29,303 18,437 (1) 29,303 18,436 47,739 (889) 46,850 (24,000)CityLine Market 12,208 15,839 170 12,306 15,911 28,217 (3,992) 24,225 — CityLine Market Phase II 2,744 3,081 3 2,744 3,084 5,828 (710) 5,118 — Clayton Valley ShoppingCenter 24,189 35,422 3,056 24,538 38,129 62,667 (27,711) 34,956 — Clocktower Plaza ShoppingCtr 49,630 19,624 523 49,630 20,147 69,777 (2,757) 67,020 — Clybourn Commons 15,056 5,594 289 15,056 5,883 20,939 (1,588) 19,351 — Cochran's Crossing 13,154 12,315 1,896 13,154 14,211 27,365 (10,728) 16,637 — Compo Acres ShoppingCenter 28,627 10,395 735 28,627 11,130 39,757 (1,480) 38,277 — Concord Shopping Plaza 30,819 36,506 1,460 31,272 37,513 68,785 (4,893) 63,892 (27,750)Copps Hill Plaza 29,515 40,673 383 29,514 41,057 70,571 (5,931) 64,640 (11,258)Coral Reef Shopping Center 14,922 15,200 2,474 15,332 17,264 32,596 (2,518) 30,078 — Corkscrew Village 8,407 8,004 662 8,407 8,666 17,073 (3,944) 13,129 — Cornerstone Square 1,772 6,944 1,685 1,772 8,629 10,401 (6,262) 4,139 — Corvallis Market Center 6,674 12,244 470 6,696 12,692 19,388 (6,800) 12,588 — Costa Verde Center 12,740 26,868 1,499 12,798 28,309 41,107 (26,837) 14,270 — Country Walk Plaza 18,713 20,373 32 18,713 20,405 39,118 (754) 38,364 (16,000)Countryside Shops 17,982 35,574 13,513 23,175 43,894 67,069 (7,352) 59,717 — Courtyard Shopping Center 5,867 4 3 5,867 7 5,874 (2) 5,872 — Culver Center 108,841 32,308 695 108,841 33,003 141,844 (5,282) 136,562 — Danbury Green 30,303 19,255 432 30,303 19,687 49,990 (2,692) 47,298 — Dardenne Crossing 4,194 4,005 704 4,343 4,560 8,903 (2,208) 6,695 — Darinor Plaza 693 32,140 830 711 32,952 33,663 (4,708) 28,955 — Diablo Plaza 5,300 8,181 2,170 5,300 10,351 15,651 (6,041) 9,610 — Dunwoody Village 3,342 15,934 5,092 3,342 21,026 24,368 (15,986) 8,382 — East Pointe 1,730 7,189 2,142 1,941 9,120 11,061 (6,348) 4,713 — El Camino Shopping Center 7,600 11,538 12,968 10,328 21,778 32,106 (9,753) 22,353 — El Cerrito Plaza 11,025 27,371 2,622 11,025 29,993 41,018 (12,499) 28,519 —
116
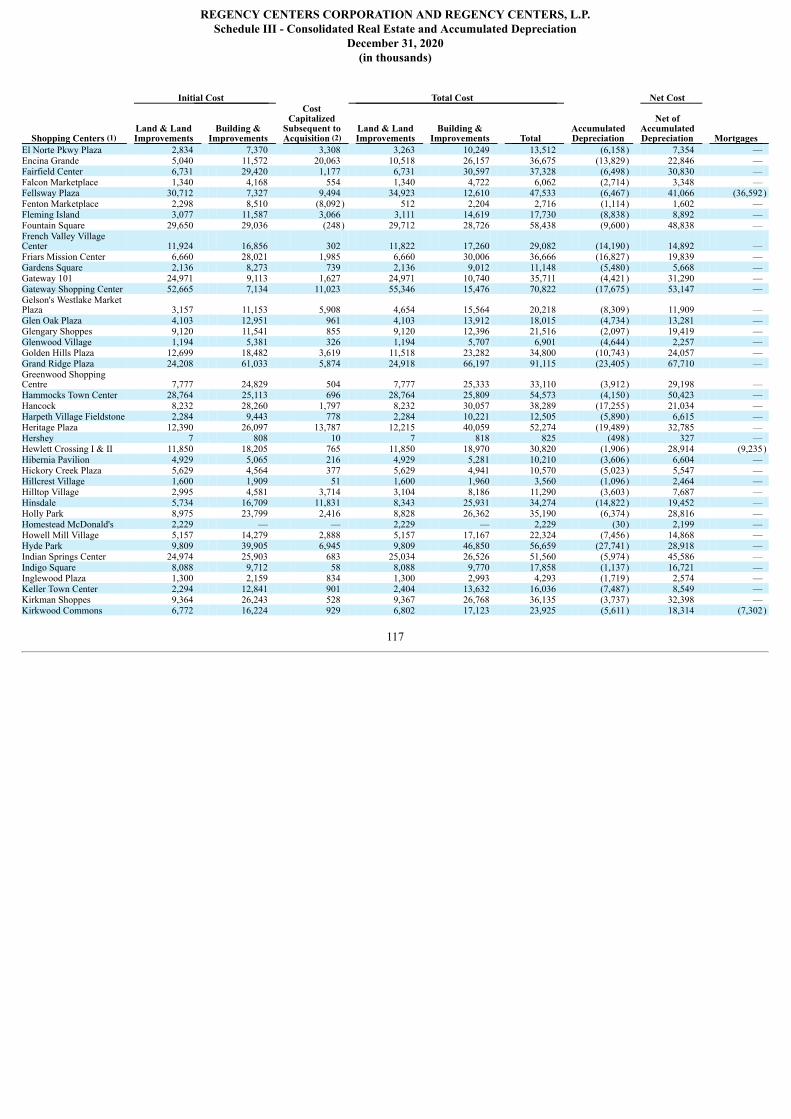
REGENCY CENTERS CORPORATION AND REGENCY CENTERS, L.P.Schedule III - Consolidated Real Estate and Accumulated Depreciation
December 31, 2020(in thousands)
Initial Cost Total Cost Net Cost
Shopping Centers (1) Land & LandImprovements
Building &Improvements
CostCapitalized
Subsequent toAcquisition (2)
Land & LandImprovements
Building &Improvements Total
AccumulatedDepreciation
Net ofAccumulatedDepreciation Mortgages
El Norte Pkwy Plaza 2,834 7,370 3,308 3,263 10,249 13,512 (6,158) 7,354 — Encina Grande 5,040 11,572 20,063 10,518 26,157 36,675 (13,829) 22,846 — Fairfield Center 6,731 29,420 1,177 6,731 30,597 37,328 (6,498) 30,830 — Falcon Marketplace 1,340 4,168 554 1,340 4,722 6,062 (2,714) 3,348 — Fellsway Plaza 30,712 7,327 9,494 34,923 12,610 47,533 (6,467) 41,066 (36,592)Fenton Marketplace 2,298 8,510 (8,092) 512 2,204 2,716 (1,114) 1,602 — Fleming Island 3,077 11,587 3,066 3,111 14,619 17,730 (8,838) 8,892 — Fountain Square 29,650 29,036 (248) 29,712 28,726 58,438 (9,600) 48,838 — French Valley VillageCenter 11,924 16,856 302 11,822 17,260 29,082 (14,190) 14,892 — Friars Mission Center 6,660 28,021 1,985 6,660 30,006 36,666 (16,827) 19,839 — Gardens Square 2,136 8,273 739 2,136 9,012 11,148 (5,480) 5,668 — Gateway 101 24,971 9,113 1,627 24,971 10,740 35,711 (4,421) 31,290 — Gateway Shopping Center 52,665 7,134 11,023 55,346 15,476 70,822 (17,675) 53,147 — Gelson's Westlake MarketPlaza 3,157 11,153 5,908 4,654 15,564 20,218 (8,309) 11,909 — Glen Oak Plaza 4,103 12,951 961 4,103 13,912 18,015 (4,734) 13,281 — Glengary Shoppes 9,120 11,541 855 9,120 12,396 21,516 (2,097) 19,419 — Glenwood Village 1,194 5,381 326 1,194 5,707 6,901 (4,644) 2,257 — Golden Hills Plaza 12,699 18,482 3,619 11,518 23,282 34,800 (10,743) 24,057 — Grand Ridge Plaza 24,208 61,033 5,874 24,918 66,197 91,115 (23,405) 67,710 — Greenwood ShoppingCentre 7,777 24,829 504 7,777 25,333 33,110 (3,912) 29,198 — Hammocks Town Center 28,764 25,113 696 28,764 25,809 54,573 (4,150) 50,423 — Hancock 8,232 28,260 1,797 8,232 30,057 38,289 (17,255) 21,034 — Harpeth Village Fieldstone 2,284 9,443 778 2,284 10,221 12,505 (5,890) 6,615 — Heritage Plaza 12,390 26,097 13,787 12,215 40,059 52,274 (19,489) 32,785 — Hershey 7 808 10 7 818 825 (498) 327 — Hewlett Crossing I & II 11,850 18,205 765 11,850 18,970 30,820 (1,906) 28,914 (9,235)Hibernia Pavilion 4,929 5,065 216 4,929 5,281 10,210 (3,606) 6,604 — Hickory Creek Plaza 5,629 4,564 377 5,629 4,941 10,570 (5,023) 5,547 — Hillcrest Village 1,600 1,909 51 1,600 1,960 3,560 (1,096) 2,464 — Hilltop Village 2,995 4,581 3,714 3,104 8,186 11,290 (3,603) 7,687 — Hinsdale 5,734 16,709 11,831 8,343 25,931 34,274 (14,822) 19,452 — Holly Park 8,975 23,799 2,416 8,828 26,362 35,190 (6,374) 28,816 — Homestead McDonald's 2,229 — — 2,229 — 2,229 (30) 2,199 — Howell Mill Village 5,157 14,279 2,888 5,157 17,167 22,324 (7,456) 14,868 — Hyde Park 9,809 39,905 6,945 9,809 46,850 56,659 (27,741) 28,918 — Indian Springs Center 24,974 25,903 683 25,034 26,526 51,560 (5,974) 45,586 — Indigo Square 8,088 9,712 58 8,088 9,770 17,858 (1,137) 16,721 — Inglewood Plaza 1,300 2,159 834 1,300 2,993 4,293 (1,719) 2,574 — Keller Town Center 2,294 12,841 901 2,404 13,632 16,036 (7,487) 8,549 — Kirkman Shoppes 9,364 26,243 528 9,367 26,768 36,135 (3,737) 32,398 — Kirkwood Commons 6,772 16,224 929 6,802 17,123 23,925 (5,611) 18,314 (7,302)
117
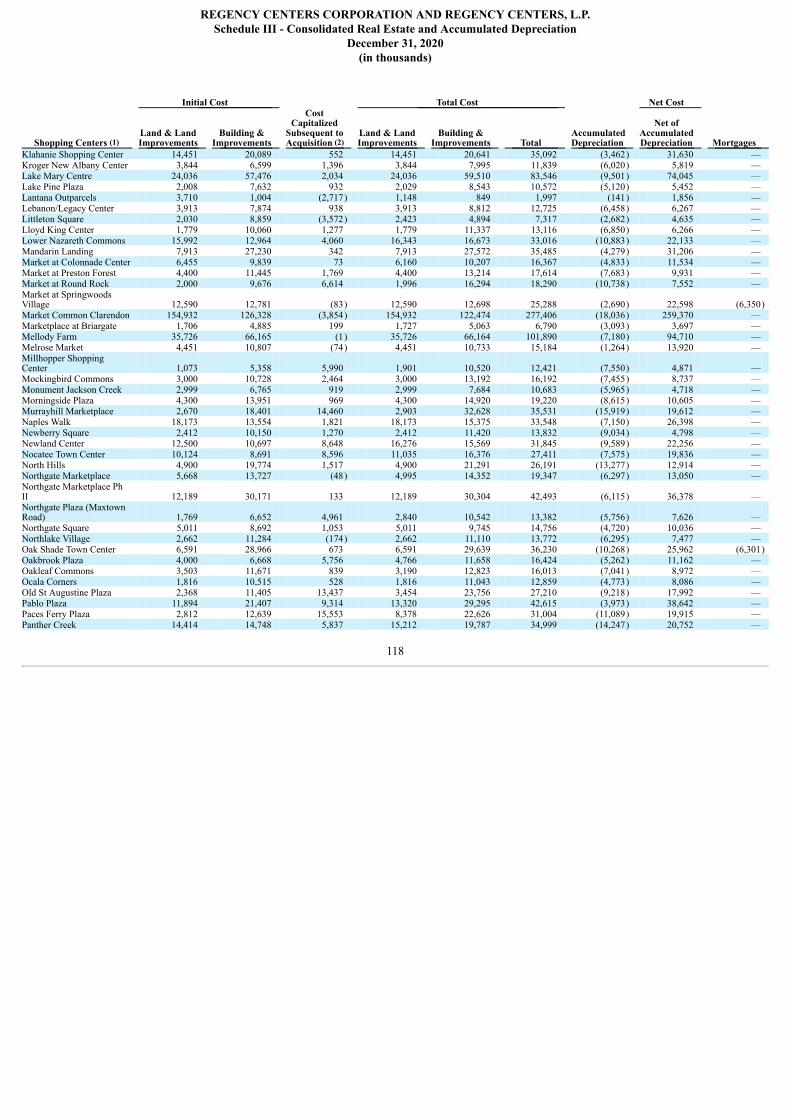
REGENCY CENTERS CORPORATION AND REGENCY CENTERS, L.P.Schedule III - Consolidated Real Estate and Accumulated Depreciation
December 31, 2020(in thousands)
Initial Cost Total Cost Net Cost
Shopping Centers (1) Land & LandImprovements
Building &Improvements
CostCapitalized
Subsequent toAcquisition (2)
Land & LandImprovements
Building &Improvements Total
AccumulatedDepreciation
Net ofAccumulatedDepreciation Mortgages
Klahanie Shopping Center 14,451 20,089 552 14,451 20,641 35,092 (3,462) 31,630 — Kroger New Albany Center 3,844 6,599 1,396 3,844 7,995 11,839 (6,020) 5,819 — Lake Mary Centre 24,036 57,476 2,034 24,036 59,510 83,546 (9,501) 74,045 — Lake Pine Plaza 2,008 7,632 932 2,029 8,543 10,572 (5,120) 5,452 — Lantana Outparcels 3,710 1,004 (2,717) 1,148 849 1,997 (141) 1,856 — Lebanon/Legacy Center 3,913 7,874 938 3,913 8,812 12,725 (6,458) 6,267 — Littleton Square 2,030 8,859 (3,572) 2,423 4,894 7,317 (2,682) 4,635 — Lloyd King Center 1,779 10,060 1,277 1,779 11,337 13,116 (6,850) 6,266 — Lower Nazareth Commons 15,992 12,964 4,060 16,343 16,673 33,016 (10,883) 22,133 — Mandarin Landing 7,913 27,230 342 7,913 27,572 35,485 (4,279) 31,206 — Market at Colonnade Center 6,455 9,839 73 6,160 10,207 16,367 (4,833) 11,534 — Market at Preston Forest 4,400 11,445 1,769 4,400 13,214 17,614 (7,683) 9,931 — Market at Round Rock 2,000 9,676 6,614 1,996 16,294 18,290 (10,738) 7,552 — Market at SpringwoodsVillage 12,590 12,781 (83) 12,590 12,698 25,288 (2,690) 22,598 (6,350)Market Common Clarendon 154,932 126,328 (3,854) 154,932 122,474 277,406 (18,036) 259,370 — Marketplace at Briargate 1,706 4,885 199 1,727 5,063 6,790 (3,093) 3,697 — Mellody Farm 35,726 66,165 (1) 35,726 66,164 101,890 (7,180) 94,710 — Melrose Market 4,451 10,807 (74) 4,451 10,733 15,184 (1,264) 13,920 — Millhopper ShoppingCenter 1,073 5,358 5,990 1,901 10,520 12,421 (7,550) 4,871 — Mockingbird Commons 3,000 10,728 2,464 3,000 13,192 16,192 (7,455) 8,737 — Monument Jackson Creek 2,999 6,765 919 2,999 7,684 10,683 (5,965) 4,718 — Morningside Plaza 4,300 13,951 969 4,300 14,920 19,220 (8,615) 10,605 — Murrayhill Marketplace 2,670 18,401 14,460 2,903 32,628 35,531 (15,919) 19,612 — Naples Walk 18,173 13,554 1,821 18,173 15,375 33,548 (7,150) 26,398 — Newberry Square 2,412 10,150 1,270 2,412 11,420 13,832 (9,034) 4,798 — Newland Center 12,500 10,697 8,648 16,276 15,569 31,845 (9,589) 22,256 — Nocatee Town Center 10,124 8,691 8,596 11,035 16,376 27,411 (7,575) 19,836 — North Hills 4,900 19,774 1,517 4,900 21,291 26,191 (13,277) 12,914 — Northgate Marketplace 5,668 13,727 (48) 4,995 14,352 19,347 (6,297) 13,050 — Northgate Marketplace PhII 12,189 30,171 133 12,189 30,304 42,493 (6,115) 36,378 — Northgate Plaza (MaxtownRoad) 1,769 6,652 4,961 2,840 10,542 13,382 (5,756) 7,626 — Northgate Square 5,011 8,692 1,053 5,011 9,745 14,756 (4,720) 10,036 — Northlake Village 2,662 11,284 (174) 2,662 11,110 13,772 (6,295) 7,477 — Oak Shade Town Center 6,591 28,966 673 6,591 29,639 36,230 (10,268) 25,962 (6,301)Oakbrook Plaza 4,000 6,668 5,756 4,766 11,658 16,424 (5,262) 11,162 — Oakleaf Commons 3,503 11,671 839 3,190 12,823 16,013 (7,041) 8,972 — Ocala Corners 1,816 10,515 528 1,816 11,043 12,859 (4,773) 8,086 — Old St Augustine Plaza 2,368 11,405 13,437 3,454 23,756 27,210 (9,218) 17,992 — Pablo Plaza 11,894 21,407 9,314 13,320 29,295 42,615 (3,973) 38,642 — Paces Ferry Plaza 2,812 12,639 15,553 8,378 22,626 31,004 (11,089) 19,915 — Panther Creek 14,414 14,748 5,837 15,212 19,787 34,999 (14,247) 20,752 —
118
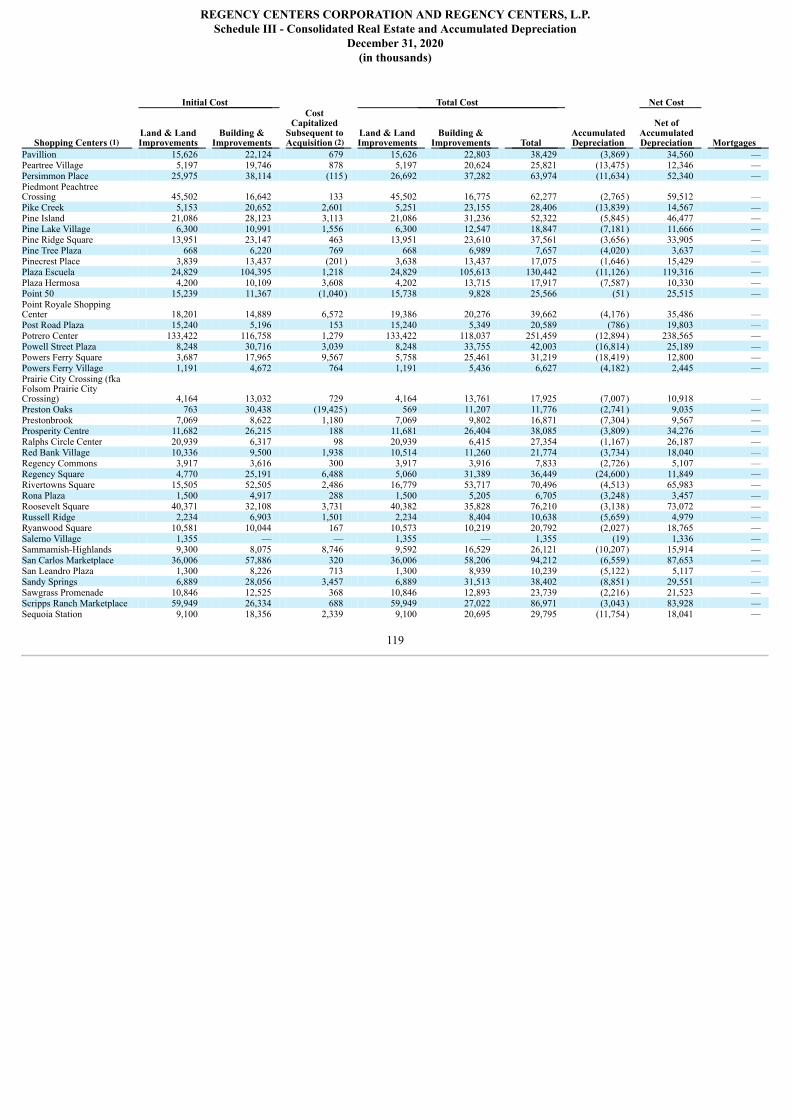
REGENCY CENTERS CORPORATION AND REGENCY CENTERS, L.P.Schedule III - Consolidated Real Estate and Accumulated Depreciation
December 31, 2020(in thousands)
Initial Cost Total Cost Net Cost
Shopping Centers (1) Land & LandImprovements
Building &Improvements
CostCapitalized
Subsequent toAcquisition (2)
Land & LandImprovements
Building &Improvements Total
AccumulatedDepreciation
Net ofAccumulatedDepreciation Mortgages
Pavillion 15,626 22,124 679 15,626 22,803 38,429 (3,869) 34,560 — Peartree Village 5,197 19,746 878 5,197 20,624 25,821 (13,475) 12,346 — Persimmon Place 25,975 38,114 (115) 26,692 37,282 63,974 (11,634) 52,340 — Piedmont PeachtreeCrossing 45,502 16,642 133 45,502 16,775 62,277 (2,765) 59,512 — Pike Creek 5,153 20,652 2,601 5,251 23,155 28,406 (13,839) 14,567 — Pine Island 21,086 28,123 3,113 21,086 31,236 52,322 (5,845) 46,477 — Pine Lake Village 6,300 10,991 1,556 6,300 12,547 18,847 (7,181) 11,666 — Pine Ridge Square 13,951 23,147 463 13,951 23,610 37,561 (3,656) 33,905 — Pine Tree Plaza 668 6,220 769 668 6,989 7,657 (4,020) 3,637 — Pinecrest Place 3,839 13,437 (201) 3,638 13,437 17,075 (1,646) 15,429 — Plaza Escuela 24,829 104,395 1,218 24,829 105,613 130,442 (11,126) 119,316 — Plaza Hermosa 4,200 10,109 3,608 4,202 13,715 17,917 (7,587) 10,330 — Point 50 15,239 11,367 (1,040) 15,738 9,828 25,566 (51) 25,515 — Point Royale ShoppingCenter 18,201 14,889 6,572 19,386 20,276 39,662 (4,176) 35,486 — Post Road Plaza 15,240 5,196 153 15,240 5,349 20,589 (786) 19,803 — Potrero Center 133,422 116,758 1,279 133,422 118,037 251,459 (12,894) 238,565 — Powell Street Plaza 8,248 30,716 3,039 8,248 33,755 42,003 (16,814) 25,189 — Powers Ferry Square 3,687 17,965 9,567 5,758 25,461 31,219 (18,419) 12,800 — Powers Ferry Village 1,191 4,672 764 1,191 5,436 6,627 (4,182) 2,445 — Prairie City Crossing (fkaFolsom Prairie CityCrossing) 4,164 13,032 729 4,164 13,761 17,925 (7,007) 10,918 — Preston Oaks 763 30,438 (19,425) 569 11,207 11,776 (2,741) 9,035 — Prestonbrook 7,069 8,622 1,180 7,069 9,802 16,871 (7,304) 9,567 — Prosperity Centre 11,682 26,215 188 11,681 26,404 38,085 (3,809) 34,276 — Ralphs Circle Center 20,939 6,317 98 20,939 6,415 27,354 (1,167) 26,187 — Red Bank Village 10,336 9,500 1,938 10,514 11,260 21,774 (3,734) 18,040 — Regency Commons 3,917 3,616 300 3,917 3,916 7,833 (2,726) 5,107 — Regency Square 4,770 25,191 6,488 5,060 31,389 36,449 (24,600) 11,849 — Rivertowns Square 15,505 52,505 2,486 16,779 53,717 70,496 (4,513) 65,983 — Rona Plaza 1,500 4,917 288 1,500 5,205 6,705 (3,248) 3,457 — Roosevelt Square 40,371 32,108 3,731 40,382 35,828 76,210 (3,138) 73,072 — Russell Ridge 2,234 6,903 1,501 2,234 8,404 10,638 (5,659) 4,979 — Ryanwood Square 10,581 10,044 167 10,573 10,219 20,792 (2,027) 18,765 — Salerno Village 1,355 — — 1,355 — 1,355 (19) 1,336 — Sammamish-Highlands 9,300 8,075 8,746 9,592 16,529 26,121 (10,207) 15,914 — San Carlos Marketplace 36,006 57,886 320 36,006 58,206 94,212 (6,559) 87,653 — San Leandro Plaza 1,300 8,226 713 1,300 8,939 10,239 (5,122) 5,117 — Sandy Springs 6,889 28,056 3,457 6,889 31,513 38,402 (8,851) 29,551 — Sawgrass Promenade 10,846 12,525 368 10,846 12,893 23,739 (2,216) 21,523 — Scripps Ranch Marketplace 59,949 26,334 688 59,949 27,022 86,971 (3,043) 83,928 — Sequoia Station 9,100 18,356 2,339 9,100 20,695 29,795 (11,754) 18,041 —
119
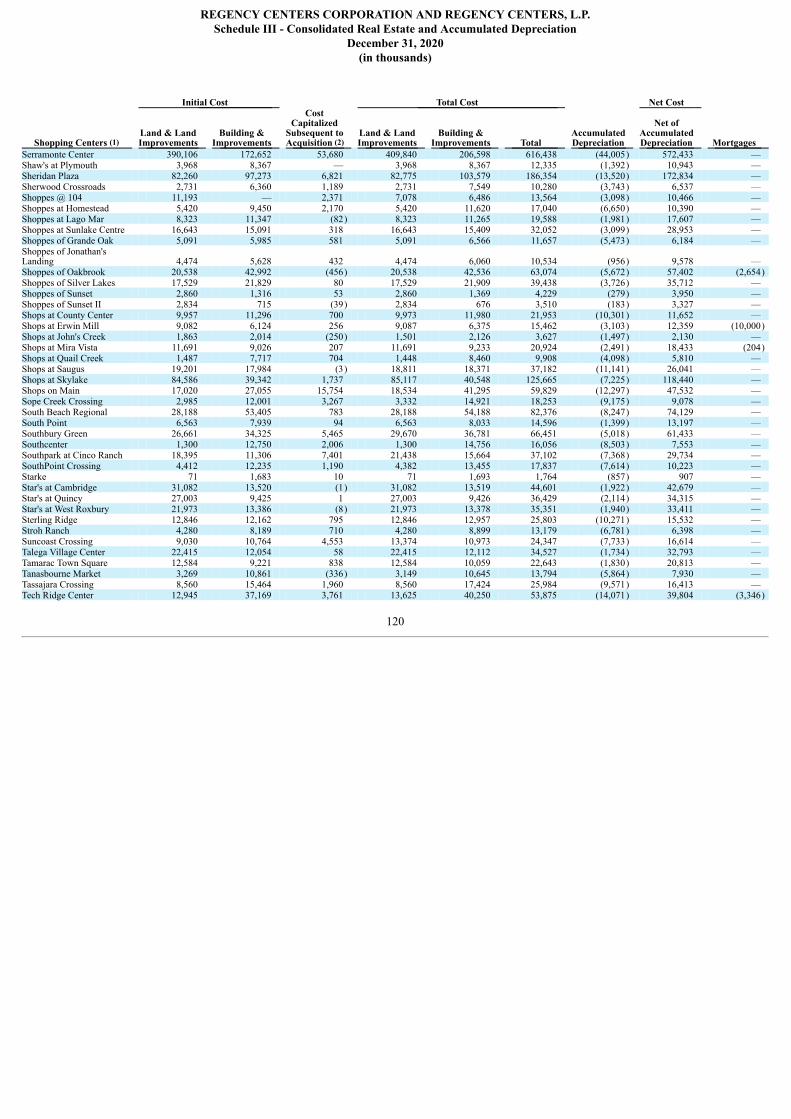
REGENCY CENTERS CORPORATION AND REGENCY CENTERS, L.P.Schedule III - Consolidated Real Estate and Accumulated Depreciation
December 31, 2020(in thousands)
Initial Cost Total Cost Net Cost
Shopping Centers (1) Land & LandImprovements
Building &Improvements
CostCapitalized
Subsequent toAcquisition (2)
Land & LandImprovements
Building &Improvements Total
AccumulatedDepreciation
Net ofAccumulatedDepreciation Mortgages
Serramonte Center 390,106 172,652 53,680 409,840 206,598 616,438 (44,005) 572,433 — Shaw's at Plymouth 3,968 8,367 — 3,968 8,367 12,335 (1,392) 10,943 — Sheridan Plaza 82,260 97,273 6,821 82,775 103,579 186,354 (13,520) 172,834 — Sherwood Crossroads 2,731 6,360 1,189 2,731 7,549 10,280 (3,743) 6,537 — Shoppes @ 104 11,193 — 2,371 7,078 6,486 13,564 (3,098) 10,466 — Shoppes at Homestead 5,420 9,450 2,170 5,420 11,620 17,040 (6,650) 10,390 — Shoppes at Lago Mar 8,323 11,347 (82) 8,323 11,265 19,588 (1,981) 17,607 — Shoppes at Sunlake Centre 16,643 15,091 318 16,643 15,409 32,052 (3,099) 28,953 — Shoppes of Grande Oak 5,091 5,985 581 5,091 6,566 11,657 (5,473) 6,184 — Shoppes of Jonathan'sLanding 4,474 5,628 432 4,474 6,060 10,534 (956) 9,578 — Shoppes of Oakbrook 20,538 42,992 (456) 20,538 42,536 63,074 (5,672) 57,402 (2,654)Shoppes of Silver Lakes 17,529 21,829 80 17,529 21,909 39,438 (3,726) 35,712 — Shoppes of Sunset 2,860 1,316 53 2,860 1,369 4,229 (279) 3,950 — Shoppes of Sunset II 2,834 715 (39) 2,834 676 3,510 (183) 3,327 — Shops at County Center 9,957 11,296 700 9,973 11,980 21,953 (10,301) 11,652 — Shops at Erwin Mill 9,082 6,124 256 9,087 6,375 15,462 (3,103) 12,359 (10,000)Shops at John's Creek 1,863 2,014 (250) 1,501 2,126 3,627 (1,497) 2,130 — Shops at Mira Vista 11,691 9,026 207 11,691 9,233 20,924 (2,491) 18,433 (204)Shops at Quail Creek 1,487 7,717 704 1,448 8,460 9,908 (4,098) 5,810 — Shops at Saugus 19,201 17,984 (3) 18,811 18,371 37,182 (11,141) 26,041 — Shops at Skylake 84,586 39,342 1,737 85,117 40,548 125,665 (7,225) 118,440 — Shops on Main 17,020 27,055 15,754 18,534 41,295 59,829 (12,297) 47,532 — Sope Creek Crossing 2,985 12,001 3,267 3,332 14,921 18,253 (9,175) 9,078 — South Beach Regional 28,188 53,405 783 28,188 54,188 82,376 (8,247) 74,129 — South Point 6,563 7,939 94 6,563 8,033 14,596 (1,399) 13,197 — Southbury Green 26,661 34,325 5,465 29,670 36,781 66,451 (5,018) 61,433 — Southcenter 1,300 12,750 2,006 1,300 14,756 16,056 (8,503) 7,553 — Southpark at Cinco Ranch 18,395 11,306 7,401 21,438 15,664 37,102 (7,368) 29,734 — SouthPoint Crossing 4,412 12,235 1,190 4,382 13,455 17,837 (7,614) 10,223 — Starke 71 1,683 10 71 1,693 1,764 (857) 907 — Star's at Cambridge 31,082 13,520 (1) 31,082 13,519 44,601 (1,922) 42,679 — Star's at Quincy 27,003 9,425 1 27,003 9,426 36,429 (2,114) 34,315 — Star's at West Roxbury 21,973 13,386 (8) 21,973 13,378 35,351 (1,940) 33,411 — Sterling Ridge 12,846 12,162 795 12,846 12,957 25,803 (10,271) 15,532 — Stroh Ranch 4,280 8,189 710 4,280 8,899 13,179 (6,781) 6,398 — Suncoast Crossing 9,030 10,764 4,553 13,374 10,973 24,347 (7,733) 16,614 — Talega Village Center 22,415 12,054 58 22,415 12,112 34,527 (1,734) 32,793 — Tamarac Town Square 12,584 9,221 838 12,584 10,059 22,643 (1,830) 20,813 — Tanasbourne Market 3,269 10,861 (336) 3,149 10,645 13,794 (5,864) 7,930 — Tassajara Crossing 8,560 15,464 1,960 8,560 17,424 25,984 (9,571) 16,413 — Tech Ridge Center 12,945 37,169 3,761 13,625 40,250 53,875 (14,071) 39,804 (3,346)
120
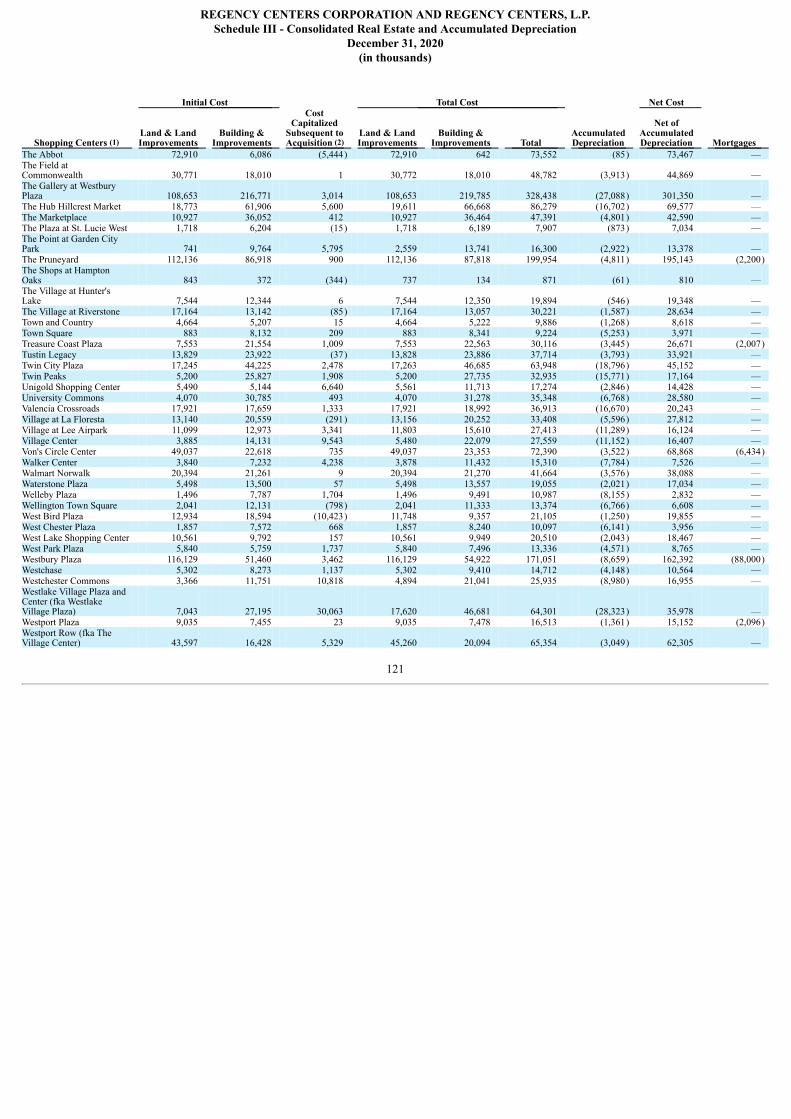
REGENCY CENTERS CORPORATION AND REGENCY CENTERS, L.P.Schedule III - Consolidated Real Estate and Accumulated Depreciation
December 31, 2020(in thousands)
Initial Cost Total Cost Net Cost
Shopping Centers (1) Land & LandImprovements
Building &Improvements
CostCapitalized
Subsequent toAcquisition (2)
Land & LandImprovements
Building &Improvements Total
AccumulatedDepreciation
Net ofAccumulatedDepreciation Mortgages
The Abbot 72,910 6,086 (5,444) 72,910 642 73,552 (85) 73,467 — The Field atCommonwealth 30,771 18,010 1 30,772 18,010 48,782 (3,913) 44,869 — The Gallery at WestburyPlaza 108,653 216,771 3,014 108,653 219,785 328,438 (27,088) 301,350 — The Hub Hillcrest Market 18,773 61,906 5,600 19,611 66,668 86,279 (16,702) 69,577 — The Marketplace 10,927 36,052 412 10,927 36,464 47,391 (4,801) 42,590 — The Plaza at St. Lucie West 1,718 6,204 (15) 1,718 6,189 7,907 (873) 7,034 — The Point at Garden CityPark 741 9,764 5,795 2,559 13,741 16,300 (2,922) 13,378 — The Pruneyard 112,136 86,918 900 112,136 87,818 199,954 (4,811) 195,143 (2,200)The Shops at HamptonOaks 843 372 (344) 737 134 871 (61) 810 — The Village at Hunter'sLake 7,544 12,344 6 7,544 12,350 19,894 (546) 19,348 — The Village at Riverstone 17,164 13,142 (85) 17,164 13,057 30,221 (1,587) 28,634 — Town and Country 4,664 5,207 15 4,664 5,222 9,886 (1,268) 8,618 — Town Square 883 8,132 209 883 8,341 9,224 (5,253) 3,971 — Treasure Coast Plaza 7,553 21,554 1,009 7,553 22,563 30,116 (3,445) 26,671 (2,007)Tustin Legacy 13,829 23,922 (37) 13,828 23,886 37,714 (3,793) 33,921 — Twin City Plaza 17,245 44,225 2,478 17,263 46,685 63,948 (18,796) 45,152 — Twin Peaks 5,200 25,827 1,908 5,200 27,735 32,935 (15,771) 17,164 — Unigold Shopping Center 5,490 5,144 6,640 5,561 11,713 17,274 (2,846) 14,428 — University Commons 4,070 30,785 493 4,070 31,278 35,348 (6,768) 28,580 — Valencia Crossroads 17,921 17,659 1,333 17,921 18,992 36,913 (16,670) 20,243 — Village at La Floresta 13,140 20,559 (291) 13,156 20,252 33,408 (5,596) 27,812 — Village at Lee Airpark 11,099 12,973 3,341 11,803 15,610 27,413 (11,289) 16,124 — Village Center 3,885 14,131 9,543 5,480 22,079 27,559 (11,152) 16,407 — Von's Circle Center 49,037 22,618 735 49,037 23,353 72,390 (3,522) 68,868 (6,434)Walker Center 3,840 7,232 4,238 3,878 11,432 15,310 (7,784) 7,526 — Walmart Norwalk 20,394 21,261 9 20,394 21,270 41,664 (3,576) 38,088 — Waterstone Plaza 5,498 13,500 57 5,498 13,557 19,055 (2,021) 17,034 — Welleby Plaza 1,496 7,787 1,704 1,496 9,491 10,987 (8,155) 2,832 — Wellington Town Square 2,041 12,131 (798) 2,041 11,333 13,374 (6,766) 6,608 — West Bird Plaza 12,934 18,594 (10,423) 11,748 9,357 21,105 (1,250) 19,855 — West Chester Plaza 1,857 7,572 668 1,857 8,240 10,097 (6,141) 3,956 — West Lake Shopping Center 10,561 9,792 157 10,561 9,949 20,510 (2,043) 18,467 — West Park Plaza 5,840 5,759 1,737 5,840 7,496 13,336 (4,571) 8,765 — Westbury Plaza 116,129 51,460 3,462 116,129 54,922 171,051 (8,659) 162,392 (88,000)Westchase 5,302 8,273 1,137 5,302 9,410 14,712 (4,148) 10,564 — Westchester Commons 3,366 11,751 10,818 4,894 21,041 25,935 (8,980) 16,955 — Westlake Village Plaza andCenter (fka WestlakeVillage Plaza) 7,043 27,195 30,063 17,620 46,681 64,301 (28,323) 35,978 — Westport Plaza 9,035 7,455 23 9,035 7,478 16,513 (1,361) 15,152 (2,096)Westport Row (fka TheVillage Center) 43,597 16,428 5,329 45,260 20,094 65,354 (3,049) 62,305 —
121
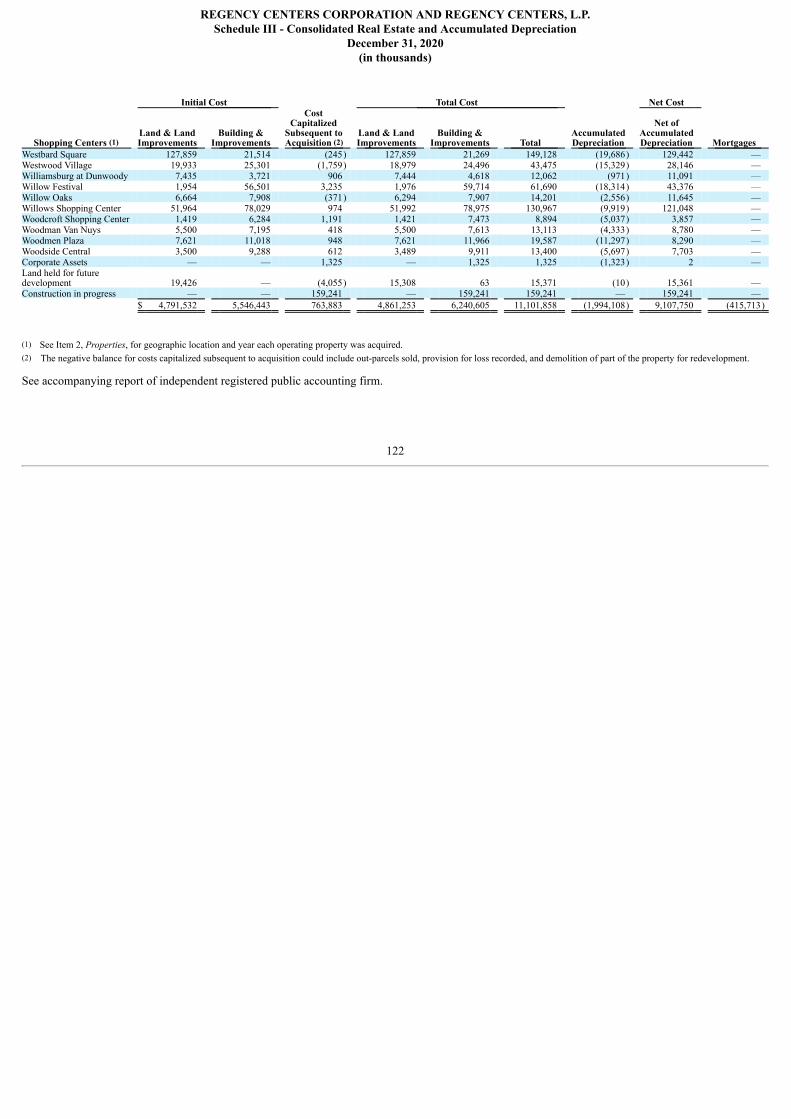
REGENCY CENTERS CORPORATION AND REGENCY CENTERS, L.P.Schedule III - Consolidated Real Estate and Accumulated Depreciation
December 31, 2020(in thousands)
Initial Cost Total Cost Net Cost
Shopping Centers (1) Land & LandImprovements
Building &Improvements
CostCapitalized
Subsequent toAcquisition (2)
Land & LandImprovements
Building &Improvements Total
AccumulatedDepreciation
Net ofAccumulatedDepreciation Mortgages
Westbard Square 127,859 21,514 (245) 127,859 21,269 149,128 (19,686) 129,442 — Westwood Village 19,933 25,301 (1,759) 18,979 24,496 43,475 (15,329) 28,146 — Williamsburg at Dunwoody 7,435 3,721 906 7,444 4,618 12,062 (971) 11,091 — Willow Festival 1,954 56,501 3,235 1,976 59,714 61,690 (18,314) 43,376 — Willow Oaks 6,664 7,908 (371) 6,294 7,907 14,201 (2,556) 11,645 — Willows Shopping Center 51,964 78,029 974 51,992 78,975 130,967 (9,919) 121,048 — Woodcroft Shopping Center 1,419 6,284 1,191 1,421 7,473 8,894 (5,037) 3,857 — Woodman Van Nuys 5,500 7,195 418 5,500 7,613 13,113 (4,333) 8,780 — Woodmen Plaza 7,621 11,018 948 7,621 11,966 19,587 (11,297) 8,290 — Woodside Central 3,500 9,288 612 3,489 9,911 13,400 (5,697) 7,703 — Corporate Assets — — 1,325 — 1,325 1,325 (1,323) 2 — Land held for futuredevelopment 19,426 — (4,055) 15,308 63 15,371 (10) 15,361 — Construction in progress — — 159,241 — 159,241 159,241 — 159,241 — $ 4,791,532 5,546,443 763,883 4,861,253 6,240,605 11,101,858 (1,994,108) 9,107,750 (415,713) (1) See Item 2, Properties, for geographic location and year each operating property was acquired.(2) The negative balance for costs capitalized subsequent to acquisition could include out-parcels sold, provision for loss recorded, and demolition of part of the property for redevelopment.
See accompanying report of independent registered public accounting firm.
122
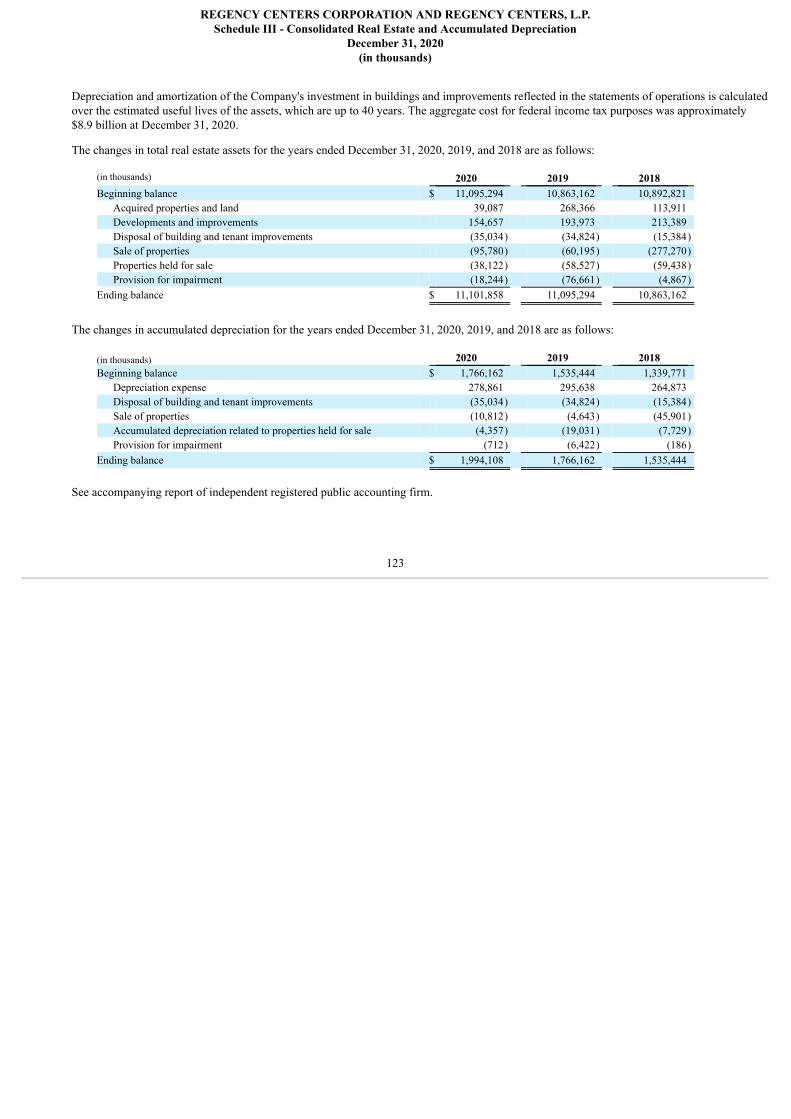
REGENCY CENTERS CORPORATION AND REGENCY CENTERS, L.P.Schedule III - Consolidated Real Estate and Accumulated Depreciation
December 31, 2020(in thousands)
Depreciation and amortization of the Company's investment in buildings and improvements reflected in the statements of operations is calculatedover the estimated useful lives of the assets, which are up to 40 years. The aggregate cost for federal income tax purposes was approximately$8.9 billion at December 31, 2020.
The changes in total real estate assets for the years ended December 31, 2020, 2019, and 2018 are as follows:
(in thousands) 2020 2019 2018 Beginning balance $ 11,095,294 10,863,162 10,892,821
Acquired properties and land 39,087 268,366 113,911 Developments and improvements 154,657 193,973 213,389 Disposal of building and tenant improvements (35,034) (34,824) (15,384)Sale of properties (95,780) (60,195) (277,270)Properties held for sale (38,122) (58,527) (59,438)Provision for impairment (18,244) (76,661) (4,867)
Ending balance $ 11,101,858 11,095,294 10,863,162
The changes in accumulated depreciation for the years ended December 31, 2020, 2019, and 2018 are as follows:
(in thousands) 2020 2019 2018 Beginning balance $ 1,766,162 1,535,444 1,339,771
Depreciation expense 278,861 295,638 264,873 Disposal of building and tenant improvements (35,034) (34,824) (15,384)Sale of properties (10,812) (4,643) (45,901)Accumulated depreciation related to properties held for sale (4,357) (19,031) (7,729)Provision for impairment (712) (6,422) (186)
Ending balance $ 1,994,108 1,766,162 1,535,444
See accompanying report of independent registered public accounting firm.
123
Item 9. Changes in and Disagreements with Accountants on Accounting and Financial Disclosure
None.
Item 9A. Controls and Procedures
Controls and Procedures (Regency Centers Corporation)
Conclusion Regarding the Effectiveness of Disclosure Controls and Procedures
Under the supervision and with the participation of the Parent Company's management, including its chief executive officer and chief financial officer, theParent Company conducted an evaluation of its disclosure controls and procedures, as such term is defined under Rule 13a-15(e) and 15d-15(e)promulgated under the Securities Exchange Act of 1934, as amended (the “Exchange Act”). Based on this evaluation, the Parent Company's chiefexecutive officer and chief financial officer concluded that its disclosure controls and procedures were effective as of the end of the period covered by thisannual report on Form 10-K to ensure information required to be disclosed in the reports filed or submitted under the Exchange Act is recorded, processed,summarized and reported, within the time period specified in the SEC's rules and forms. These disclosure controls and procedures include controls andprocedures designed to ensure that information required to be disclosed by the Parent Company in the reports it files or submits is accumulated andcommunicated to management, including its chief executive officer and chief financial officer, as appropriate, to allow timely decisions regarding requireddisclosure.
Management's Report on Internal Control over Financial Reporting
The Parent Company's management is responsible for establishing and maintaining adequate internal control over financial reporting, as such term isdefined in Exchange Act Rules 13a-15(f) and 15d-15(f). Under the supervision and with the participation of its management, including its chief executiveofficer and chief financial officer, the Parent Company conducted an evaluation of the effectiveness of its internal control over financial reporting based onthe framework in Internal Control - Integrated Framework issued by the Committee of Sponsoring Organizations of the Treadway Commission. Based onits evaluation under the framework in Internal Control - Integrated Framework (2013), the Parent Company's management concluded that its internalcontrol over financial reporting was effective as of December 31, 2020.
KPMG LLP, an independent registered public accounting firm, has audited the consolidated financial statements included in this annual report on Form 10-K and, as part of their audit, has issued a report, included herein, on the effectiveness of the Parent Company's internal control over financial reporting.
The Parent Company's system of internal control over financial reporting was designed to provide reasonable assurance regarding the preparation and fairpresentation of published financial statements in accordance with accounting principles generally accepted in the United States. All internal controlsystems, no matter how well designed, have inherent limitations. Therefore, even those systems determined to be effective can provide only reasonableassurance and may not prevent or detect misstatements. Also, projections of any evaluation of effectiveness to future periods are subject to the risk thatcontrols may become inadequate because of changes in conditions, or that the degree of compliance with the policies or procedures may deteriorate.
Changes in Internal Controls
There have been no changes in the Parent Company's internal controls over financial reporting identified in connection with this evaluation that occurredduring the fourth quarter of 2020 that have materially affected, or are reasonably likely to materially affect, our internal controls over financialreporting. The Parent Company has incorporated the effects of COVID-19 related impacts into our control structure.
Controls and Procedures (Regency Centers, L.P.)
Conclusion Regarding the Effectiveness of Disclosure Controls and Procedures
Under the supervision and with the participation of the Operating Partnership's management, including the chief executive officer and chief financialofficer of its general partner, the Operating Partnership conducted an evaluation of its disclosure controls and procedures, as such term is defined underRule 13a-15(e) and 15d-15(e) promulgated under the Exchange Act. Based on this evaluation, the chief executive officer and chief financial officer of itsgeneral partner concluded that its disclosure controls and procedures were effective as of the end of the period covered by this annual report on Form 10-Kto ensure information required to be disclosed in the reports filed or submitted under the Exchange Act is recorded, processed, summarized and reported,within the time period specified in the SEC's rules and forms. These disclosure controls and procedures include controls and procedures designed to ensurethat information required to be disclosed by the Operating Partnership in the reports it files or submits is accumulated and communicated to management,including the
124
chief executive officer and chief financial officer of its general partner, as appropriate, to allow timely decisions regarding required disclosure.
Management's Report on Internal Control over Financial Reporting
The Operating Partnership's management is responsible for establishing and maintaining adequate internal control over financial reporting, as such term isdefined in Exchange Act Rules 13a-15(f) and 15d-15(f). Under the supervision and with the participation of its management, including the chief executiveofficer and chief financial officer of its general partner, the Operating Partnership conducted an evaluation of the effectiveness of its internal control overfinancial reporting based on the framework in Internal Control - Integrated Framework issued by the Committee of Sponsoring Organizations of theTreadway Commission. Based on its evaluation under the framework in Internal Control - Integrated Framework (2013), the Operating Partnership'smanagement concluded that its internal control over financial reporting was effective as of December 31, 2020.
KPMG LLP, an independent registered public accounting firm, has audited the consolidated financial statements included in this annual report on Form 10-K and, as part of their audit, has issued a report, included herein, on the effectiveness of the Operating Partnership's internal control over financialreporting.
The Operating Partnership's system of internal control over financial reporting was designed to provide reasonable assurance regarding the preparation andfair presentation of published financial statements in accordance with accounting principles generally accepted in the United States. All internal controlsystems, no matter how well designed, have inherent limitations. Therefore, even those systems determined to be effective can provide only reasonableassurance and may not prevent or detect misstatements. Also, projections of any evaluation of effectiveness to future periods are subject to the risk thatcontrols may become inadequate because of changes in conditions, or that the degree of compliance with the policies or procedures may deteriorate.
Changes in Internal Controls
There have been no changes in the Operating Partnership's internal controls over financial reporting identified in connection with this evaluation thatoccurred during the fourth quarter of 2020 that have materially affected, or are reasonably likely to materially affect, our internal controls over financialreporting. The Operating Partnership has incorporated the effects of COVID-19 related impacts into our control structure.
Item 9B. Other Information
Not applicablePART III
Item 10. Directors, Executive Officers, and Corporate Governance
Information concerning our directors, executive officers, and corporate governance is incorporated herein by reference to our definitive proxy statement tobe filed with the Securities and Exchange Commission within 120 days after the end of the fiscal year covered by this Form 10-K with respect to the 2021Annual Meeting of Stockholders. Information regarding executive officers is included in Part I of this Form 10-K as permitted by General Instruction G(3).
Code of Ethics.
We have a code of ethics applicable to our Board of Directors, principal executive officers, principal financial officer, principal accounting officer andpersons performing similar functions. The text of this code of ethics may be found on our web site at www.regencycenters.com. We will post a notice ofany waiver from, or amendment to, any provision of our code of ethics on our web site.
Item 11. Executive Compensation
Incorporated herein by reference to our definitive proxy statement to be filed with the Securities and Exchange Commission within 120 days after the endof the fiscal year covered by this Form 10-K with respect to the 2021 Annual Meeting of Stockholders.
125

Item 12. Security Ownership of Certain Beneficial Owners and Management and Related Stockholder Matters
Equity Compensation Plan Information(as of December 31, 2020)
(a) (b) (c)
Plan Category
Number of securities to beissued upon
exercise of outstandingoptions, warrants
and rights (1)
Weighted-average exerciseprice of outstanding options,
warrants and rights (2)
Number of securitiesremaining available forfuture issuance under
equity compensation plans(excluding securities
reflected in column a) (3) Equity compensation plans approved by security holders — $ — 4,739,687 Equity compensation plans not approved by security holders N/A N/A N/A Total — $ — 4,739,687
(1) This column does not include 618,935 shares that may be issued pursuant to unvested restricted stock and performance share awards.(2) The weighted average exercise price excludes stock rights awards, which we sometimes refer to as unvested restricted stock.(3) The Regency Centers Corporation Omnibus Incentive Plan, (“Omnibus Plan”), as approved by stockholders at our 2019 annual meeting, provides that an aggregate
maximum of 5.6 million shares of our common stock are reserved for issuance under the Omnibus Plan.
Information about security ownership is incorporated herein by reference to our definitive proxy statement to be filed with the Securities and ExchangeCommission within 120 days after the end of the fiscal year covered by this Form 10-K with respect to the 2021 Annual Meeting of Stockholders.
Item 13. Certain Relationships and Related Transactions, and Director Independence
Incorporated herein by reference to our definitive proxy statement to be filed with the Securities and Exchange Commission within 120 days after the endof the fiscal year covered by this Form 10-K with respect to the 2021 Annual Meeting of Stockholders.
Item 14. Principal Accountant Fees and Services
Incorporated herein by reference to our definitive proxy statement to be filed with the Securities and Exchange Commission within 120 days after the endof the fiscal year covered by this Form 10-K with respect to the 2021 Annual Meeting of Stockholders.
126
PART IV
Item 15. Exhibits and Financial Statement Schedules
(a) Financial Statements and Financial Statement Schedules:
Regency Centers Corporation and Regency Centers, L.P. 2020 financial statements and financial statement schedule, together with the reports ofKPMG LLP are listed on the index immediately preceding the financial statements in Item 8, Consolidated Financial Statements andSupplemental Data.
(b) Exhibits:
In reviewing the agreements included as exhibits to this report, please remember they are included to provide you with information regarding their termsand are not intended to provide any other factual or disclosure information about the Company, its subsidiaries or other parties to the agreements. TheAgreements contain representations and warranties by each of the parties to the applicable agreement. These representations and warranties have beenmade solely for the benefit of the other parties to the applicable agreement and:
• should not in all instances be treated as categorical statements of fact, but rather as a way of allocating the risk to one of the parties if thosestatements prove to be inaccurate;
• have been qualified by disclosures that were made to the other party in connection with the negotiation of the applicable agreement, whichdisclosures are not necessarily reflected in the agreement;
• may apply standards of materiality in a way that is different from what may be viewed as material to you or other investors; and
• were made only as of the date of the applicable agreement or such other date or dates as may be specified in the agreement and are subject tomore recent developments.
Accordingly, these representations and warranties may not describe the actual state of affairs as of the date they were made or at any other time. Weacknowledge that, notwithstanding the inclusion of the foregoing cautionary statements, we are responsible for considering whether additional specificdisclosures of material information regarding material contractual provisions are required to make the statements in this report not misleading. Additionalinformation about the Company may be found elsewhere in this report and the Company's other public files, which are available without charge throughthe SEC's website at http://www.sec.gov .
Unless otherwise indicated below, the Commission file number to the exhibit is No. 001-12298.
1. Underwriting Agreement (a) Form of Equity Distribution Agreement dated May 17, 2017 among Regency Centers Corporation, Regency Centers, L.P. and the
parties listed below (incorporated by reference to Exhibit 1.1 to the Company’s Form 8-K filed on May 17, 2017). The EquityDistribution Agreements listed below are substantially identical in all material respects to the Form of Equity Distribution Agreement,except for the identities of the parties, and have not been filed as exhibits to the Company’s 1934 Act reports pursuant to Instruction 2to item 601 of Regulation S-K:
(i) Equity Distribution Agreement dated May 17, 2017 among Regency Centers Corporation, Regency Centers, L.P. and
Wells Fargo Securities, LLC; (ii) Equity Distribution Agreement dated May 17, 2017 among Regency Centers Corporation, Regency Centers, L.P. and
J.P. Morgan Securities LLC; (iii) Equity Distribution Agreement dated May 17, 2017 among Regency Centers Corporation, Regency Centers, L.P. and
Merrill Lynch, Pierce, Fenner & Smith Incorporated; (iv) Equity Distribution Agreement dated May 17, 2017 among Regency Centers Corporation, Regency Centers, L.P. and
BB&T Capital Markets, a division of BB&T Securities, LLC; (v) Equity Distribution Agreement dated May 17, 2017 among Regency Centers Corporation, Regency Centers, L.P. and
BTIG, LLC; (vi) Equity Distribution Agreement dated May 17, 2017 among Regency Centers Corporation, Regency Centers, L.P. and
RBC Capital Markets, LLC;
127
(vii) Equity Distribution Agreement dated May 17, 2017 among Regency Centers Corporation, Regency Centers, L.P. and
SunTrust Robinson Humphrey, Inc.; and (viii) Equity Distribution Agreement dated May 17, 2017 among Regency Centers Corporation, Regency Centers, L.P. and
Mizuho Securities USA LLC. (b) Form of Amendment No. 1 to the Equity Distribution Agreement, dated November 13, 2018 (incorporated by referent to Exhibit 1.1
to the Company’s Form 8-K filed on November 14, 2018). The Amendment No.1 to each of the Equity Distribution Agreements,dated November 13, 2018, and listed in Exhibit 1 (a) are substantially identical in all material respects to the Form of AmendmentNo. 1 to the Equity Distribution Agreement, except for the identities of the parties, and have not been filed as exhibits to theCompany’s 1934 Act reports pursuant to item 601 of Regulation S-K.
(c) Form of Amendment No. 2 to the Equity Distribution Agreement, dated May 8, 2020 (incorporated by reference to Exhibit 1.1 to the
Company’s Form 8-K filed on May 8, 2020). The Amendments No. 2 to each of the Equity Distribution Agreements listed below aresubstantially identical in all material respects to the Form of Amendment No. 2 to the Equity Distribution Agreement, dated May 8,2020, except for the identities of the parties, and have not been filed as exhibits to the Company’s 1934 Act reports pursuant toInstruction 2 to item 601 of Regulation S-K:
(i) Amendment No. 2 to the Equity Distribution Agreement, dated May 8, 2020, among Regency Centers Corporation,Regency Centers, L.P. and Wells Fargo Bank, National Association and Wells Fargo Securities, LLC.
(ii) Amendment No. 2 to the Equity Distribution Agreement, dated May 8, 2020, among Regency Centers Corporation,Regency Centers, L.P. and SunTrust Robinson Humphrey, Inc.
(iii) Amendment No. 2 to the Equity Distribution Agreement, dated May 8, 2020, among Regency Centers Corporation,Regency Centers, L.P. and BTIG, LLC
(iv) Amendment No. 2 to the Equity Distribution Agreement, dated May 8, 2020, among Regency Centers Corporation,Regency Centers, L.P., JPMorgan Chase Bank, National Association and J.P. Morgan Securities LLC
(v) Amendment No. 2 to the Equity Distribution Agreement, dated May 8, 2020, among Regency Centers Corporation,Regency Centers, L.P., Bank of America, N.A. and BofA Securities, Inc.
(d) Amendment No. 2 to the Equity Distribution Agreement, dated May 8, 2020, among Regency Centers Corporation, Regency Centers,L.P., Mizuho Markets Americas LLC and Mizuho Securities USA LLC (incorporated by reference to Exhibit 1.2 to the Company’sForm 8-K filed on May 8, 2020).
(e) Form of Equity Distribution Agreement, dated May 8, 2020 (incorporated by reference to Exhibit 1.3 to the Company’s Form 8-Kfiled on May 8, 2020). The Equity Distribution Agreements listed below are substantially identical in all material respects to theForm of Equity Distribution Agreement, except for the identities of the parties, and have not been filed as exhibits to the Company’s1934 Act reports pursuant to Instruction 2 to item 601 of Regulation S-K:
128
(i) Equity Distribution Agreement, dated May 8, 2020, among Regency Centers Corporation, Regency Centers, L.P. and
Jefferies LLC.
(ii) Equity Distribution Agreement, dated May 8, 2020, among Regency Centers Corporation, Regency Centers, L.P. andSMBC Nikko Securities America, Inc.
(iii) Equity Distribution Agreement, dated May 8, 2020, among Regency Centers Corporation, Regency Centers, L.P. andRegions Securities LLC
(iv) Equity Distribution Agreement, dated May 8, 2020, among Regency Centers Corporation, Regency
Centers, L.P., The Bank of Nova Scotia and Scotia Capital (USA) Inc.
(v) Equity Distribution Agreement, dated May 8, 2020, among Regency Centers Corporation, Regency Centers, L.P., Bankof Montreal and BMO Capital Markets Corp.
(vi) Equity Distribution Agreement, dated May 8, 2020, among Regency Centers Corporation, Regency Centers, L.P., TDSecurities (USA) LLC and The Toronto-Dominion Bank
(f) Form of Forward Master Confirmation, dated May 8, 2020, dated May 8, 2020 (incorporated by reference to Exhibit 1.4 to theCompany’s Form 8-K filed on May 8, 2020). The Forward Master Confirmations listed below are substantially identical in allmaterial respects to the Form of Forward Master Confirmation, except for the identities of the parties, and have not been filed asexhibits to the Company’s 1934 Act reports pursuant to Instruction 2 to item 601 of Regulation S-K:
(i) Forward Master Confirmation, dated May 8, 2020, by and between Regency Centers Corporation and Wells Fargo Bank,National Association and Wells Fargo Securities, LLC.
(ii) Forward Master Confirmation, dated May 8, 2020, by and between Regency Centers Corporation and Bank of America,N.A.
(iii) Forward Master Confirmation, dated May 8, 2020, by and between Regency Centers Corporation and JPMorgan ChaseBank, National Association, New York Branch
(iv Forward Master Confirmation, dated May 8, 2020, by and between Regency Centers Corporation and Bank of Montreal
(v) Forward Master Confirmation, dated May 8, 2020, by and between Regency Centers Corporation and Mizuho MarketsAmericas LLC
(vi) Forward Master Confirmation, dated May 8, 2020, by and between Regency Centers Corporation and Jefferies LLC
(vii) Forward Master Confirmation, dated May 8, 2020, by and between Regency Centers Corporation and The Bank ofNova Scotia
(viii) Forward Master Confirmation, dated May 8, 2020, by and between Regency Centers Corporation and The Toronto-Dominion Bank.
3. Articles of Incorporation and Bylaws (a) Restated Articles of Incorporation of Regency Centers Corporation (amendment is incorporated by reference to Exhibit 3.A to the
Company’s Form 10-Q filed on August 8, 2017). (b) Amended and Restated Bylaws of Regency Centers Corporation (amendment is incorporated by reference to Exhibit 3.B to the
Company’s Form 10-Q filed on August 8, 2017). (c) Fifth Amended and Restated Agreement of Limited Partnership of Regency Centers, L.P. , (incorporated by reference to Exhibit 3(d)
to the Company's Form 10-K filed on February 19, 2014). 4. Instruments Defining Rights of Security Holders (a) See Exhibits 3(a) and 3(b) for provisions of the Articles of Incorporation and Bylaws of the Company defining the rights of security
holders. See Exhibits 3(c) for provisions of the Partnership Agreement of Regency Centers, L.P. defining rights of security holders.
129
(b) Indenture dated December 5, 2001 between Regency Centers, L.P., the guarantors named therein and First Union National Bank, as
trustee (incorporated by reference to Exhibit 4.4 to Regency Centers, L.P.'s Form 8-K filed on December 10, 2001). (i) First Supplemental Indenture dated as of June 5, 2007 among Regency Centers, L.P., the Company as guarantor and
U.S. Bank National Association, as successor to Wachovia Bank, National Association (formerly known as FirstUnion National Bank), as trustee (incorporated by reference to Exhibit 4.1 to Regency Centers, L.P.'s Form 8-K filedon June 5, 2007).
(ii) Second Supplemental Indenture dated as of June 2, 2010 to the Indenture dated as of December 5, 2001 between
Regency Centers, L.P., Regency Centers Corporation, as guarantor, and U.S. Bank National Association, as successorto Wachovia Bank, National Association (formerly known as First Union National Bank), as Trustee (incorporated byreference to Exhibit 4.1 to the Company’s Form 8-K filed on June 3, 2010).
(iii) Third Supplemental Indenture dated as of August 17, 2015 to the Indenture dated as of December 5, 2001 among
Regency Centers, L.P., Regency Centers Corporation, as guarantor, and U.S. Bank, National Association, as trustee(incorporated by reference to Exhibit 4.1 to the Company’s Form 8-K filed on August 18, 2015).
(iv) Fourth Supplemental Indenture dated as of January 26, 2017 among Regency Centers, L.P., Regency Centers
Corporation, as guarantor, and U.S. Bank National Association, as trustee (incorporated by reference to Exhibit 4.1 tothe Company's Form 8-K filed on January 26, 2016).
(v) Fifth Supplemental Indenture dated as of March 6, 2019 among Regency Centers, L.P., Regency Centers Corporation,
as guarantor, and U.S. Bank National Association, as trustee (incorporated by reference to Exhibit 4.1 to theCompany's Form 8-K filed on March 6, 2019).
(vi) Sixth Supplemental Indenture dated as of May 13, 2020 among Regency Centers, L.P., Regency Centers Corporation,
as guarantor, and U.S. Bank National Association, as trustee (incorporated by reference to Exhibit 4.1 to theCompany’s Form 8-K filed on May 13, 2020).
(c) Indenture dated September 9, 1998 between the Company, as successor-by-merger to IRT Property Company, and SunTrust Bank, as
trustee (incorporated by reference to Exhibit 4.2 of Form 8-K filed by IRT Property Company on September 15, 1998). (i) Supplemental Indenture No. 1, dated September 9, 1998, between the Company, as successor-by-merger to IRT
Property Company, and SunTrust Bank, as Trustee (incorporated by reference to Exhibit 4.3 of Form 8-K filed by IRTProperty Company on September 15, 1998).
(ii) Supplemental Indenture No. 2, dated November 1, 1999, between the Company, as successor-by-merger to IRT
Property Company, and SunTrust Bank, as Trustee (incorporated by reference to Exhibit 4.5 of Form 8-K filed by IRTProperty Company on November 12, 1999).
(iii) Supplemental Indenture No. 3, dated February 12, 2003, between the Company and SunTrust Bank, as Trustee
(incorporated by reference to Exhibit 4.2 of Form 8-K filed by Equity One, Inc. on February 20, 2003). (iv) Supplemental Indenture No. 5, dated April 23, 2004, between the Company and SunTrust Bank, as Trustee
(incorporated by reference to Exhibit 4.1 of Form 10-Q filed by Equity One, Inc. on May 10, 2004). (v) Supplemental Indenture No. 6, dated May 20, 2005, between the Company and SunTrust Bank, as Trustee
(incorporated by reference to Exhibit 4.2 of Form 10-Q filed by Equity One, Inc. on August 5, 2005).
(vi) Supplemental Indenture No. 8, dated December 30, 2005, between the Company and SunTrust Bank, as Trustee
(incorporated by reference to Exhibit 4.17 of Form 10-K filed by Equity One, Inc. on March 3, 2006).
130
(vii) Supplemental Indenture No. 13, dated as of October 25, 2012, between the Company and U.S. Bank National
Association, as Trustee (incorporated by reference to Exhibit 4.1 of Form 8-K filed by Equity One, Inc. on October 25,2012).
(viii) Supplemental Indenture No. 14, dated as of March 1, 2017, among Equity One, Inc., Regency Centers Corporation,
Regency Centers, L.P., and U.S. Bank National Association, as successor to Sun Trust Bank, as Trustee (incorporatedby reference to Exhibit 4.1 to the Company’s Form 8-K filed on March 1, 2017).
(ix) Supplemental Indenture No. 15, dated as of July 26, 2017, among Regency Centers Corporation, Regency Centers,
L.P., and U.S. Bank National Association (incorporated by reference to Exhibit 10.1 to the Company’s Form 8-K filedon July 27, 2017).
(d) Assumption Agreement, dated as of March 1, 2017, by Regency Centers Corporation (incorporated by reference to Exhibit 4.2 to the
Company’s Form 8-K filed on March 1, 2017). (e) Description of the Company’s Securities Registered under Section 12 of the Exchange Act. (incorporated by reference to Exhibit 4(e)
to the Company’s Form 10-K filed on February 18, 2020). 10. Material Contracts (~ indicates management contract or compensatory plan) ~(a) Form of Stock Rights Award Agreement (incorporated by reference to Exhibit 10(b) to the Company's Form 10-K filed on March 10,
2006). ~(b) Form of 409A Amendment to Stock Rights Award Agreement (incorporated by reference to Exhibit 10(b)(i) to the Company's Form
10-K filed on March on 17, 2009). ~(c) Form of Nonqualified Stock Option Agreement (incorporated by reference to Exhibit 10(c) to the Company's Form 10-K filed on
March 10, 2006). ~(d) Form of 409A Amendment to Stock Option Agreement (incorporated by reference to Exhibit 10(c)(i) to the Company's Form 10-K
filed on March 17, 2009). ~(e) Amended and Restated Deferred Compensation Plan dated May 6, 2003 (incorporated by reference to Exhibit 10(k) to the Company's
Form 10-K filed on March 12, 2004). ~(f) Regency Centers Corporation 2005 Deferred Compensation Plan (incorporated by reference to Exhibit 10(s) to the Company's Form
8-K filed on December 21, 2004). ~(g) First Amendment to Regency Centers Corporation 2005 Deferred Compensation Plan dated December 2005 (incorporated by
reference to Exhibit 10(q)(i) to the Company's Form 10-K filed on March 10, 2006). ~(h) Second Amendment to the Regency Centers Corporation Amended and Restated Deferred Compensation Plan (incorporated by
reference to Exhibit 10.2 to the Company's Form 8-K filed on June 14, 2011). ~(i) Third Amendment to the Regency Centers Corporation 2005 Deferred Compensation Plan (incorporated by reference to Exhibit 10.1
to the Company's Form 8-K filed on June 14, 2011). ~(j) Regency Centers Corporation Amended and Restated Omnibus Incentive Plan (incorporated by reference to Appendix B to the
Company's 2019 Annual Meeting Proxy Statement filed on March 21, 2019). ~(k) Form of Director/Officer Indemnification Agreement (filed as an Exhibit to Pre-effective Amendment No. 2 to the Company's
registration statement on Form S-11 filed on October 5, 1993 (33-67258), and incorporated by reference). ~(l) 2020 Amended and Restated Severance and Change of Control Agreement dated as of January 1, 2020, by and between the Company
and Michael J. Mas (incorporated by reference to Exhibit 90.1 of the Company's Form 8-K filed on January 7, 2020).
131
~(m) Amended and Restated Severance and Change of Control Agreement dated as of April 27, 2017, by and between the Company and
Martin E. Stein, Jr. (incorporated by reference to Exhibit 10.1 of the Company's Form 10-Q filed on May 10, 2017). ~(n) Form of Amended and Restated Severance and Change of Control Agreement dated as of July 15, 2015 by and between the Company
and Lisa Palmer (incorporated by reference to Exhibit 10.3 of the Company's Form 8-K filed on July 20, 2015). ~(o) Form of Amended and Restated Severance and Change of Control Agreement dated as of July 15, 2015 by and between the Company
and Dan M. Chandler, III (incorporated by reference to Exhibit 10.4 of the Company's Form 8-K filed on July 20, 2015). ~(p) Form of Amended and Restated Severance and Change of Control Agreement dated as of July 15, 2015 by and between the Company
and James D. Thompson (incorporated by reference to Exhibit 10.6 of the Company's Form 8-K filed on July 20, 2015). (q) Fifth Amended and Restated Credit Agreement, dated as of February 9, 2021, by and among Regency Centers, L.P., as borrower,
Regency Centers Corporation, as guarantor, Wells Fargo Bank, National Association, as Administrative Agent, and certain lenderparty thereto (incorporated by reference to Exhibit 4.1 to the Company’s 8-K filed on February 12, 2021).
(r) Second Amended and Restated Limited Liability Company Agreement of Macquarie CountryWide-Regency II, LLC dated as of July
31, 2009 by and among Global Retail Investors, LLC, Regency Centers, L.P. and Macquarie CountryWide (US) No. 2 LLC(incorporated by reference to Exhibit 10.1 to the Company's Form 10-Q filed on November 6, 2009).
(i) Amendment No. 1 to Second Amended and Restate Limited Liability Company Agreement of GRI-Regency, LLC
(formerly Macquarie CountryWide-Regency II, LLC) (incorporated by reference to Exhibit 10.(h)(i) to the Company’sForm 10-K filed March 1, 2011).
21. Subsidiaries of Regency Centers Corporation 22. Subsidiary Guarantors and Issuers of Guaranteed Securities 23. Consents of Independent Accountants 23.1 Consent of KPMG LLP for Regency Centers Corporation and Regency Centers, L.P. 31. Rule 13a-14(a)/15d-14(a) Certifications. 31.1 Rule 13a-14 Certification of Chief Executive Officer for Regency Centers Corporation. 31.2 Rule 13a-14 Certification of Chief Financial Officer for Regency Centers Corporation. 31.3 Rule 13a-14 Certification of Chief Executive Officer for Regency Centers, L.P. 31.4 Rule 13a-14 Certification of Chief Financial Officer for Regency Centers, L.P. 32. Section 1350 Certifications.
The certifications in this exhibit 32 are being furnished solely to accompany this report pursuant to 18 U.S.C. § 1350, and are not being filed forpurposes of Section 18 of the Securities Exchange Act of 1934, as amended, and are not to be incorporated by reference into any of the Company's filings,whether made before or after the date hereof, regardless of any general incorporation language in such filing.
32.1 18 U.S.C. § 1350 Certification of Chief Executive Officer for Regency Centers Corporation. 32.2 18 U.S.C. § 1350 Certification of Chief Financial Officer for Regency Centers Corporation. 32.3 18 U.S.C. § 1350 Certification of Chief Executive Officer for Regency Centers, L.P.
132
32.4 18 U.S.C. § 1350 Certification of Chief Financial Officer for Regency Centers, L.P. 101. Interactive Data Files 101.INS+ Inline XBRL Instance Document - the instance document does not appear in the Interactive Data File because its XBRL tags are
embedded within the Inline XBRL document 101.SCH+ Inline XBRL Taxonomy Extension Schema Document 101.CAL+ Inline XBRL Taxonomy Extension Calculation Linkbase Document 101.DEF+ Inline XBRL Taxonomy Definition Linkbase Document 101.LAB+ Inline XBRL Taxonomy Extension Label Linkbase Document 101.PRE+ Inline XBRL Taxonomy Extension Presentation Linkbase Document 104. Cover Page Interactive Data File (formatted as inline XBRL and contained in Exhibit 101) + Submitted electronically with this Annual Report
Item 16. Form 10-K Summary
None.
133

SIGNATURES
Pursuant to the requirements of Section 13 or 15(d) of the Securities Exchange Act of 1934, the registrant has duly caused this report to be signed on itsbehalf by the undersigned, thereunto duly authorized. February 17, 2021 REGENCY CENTERS CORPORATION By: /s/ Lisa Palmer Lisa Palmer, President and Chief Executive Officer February 17, 2021 REGENCY CENTERS, L.P. By:Regency Centers Corporation, General Partner By:/s/ Lisa Palmer Lisa Palmer, President and Chief Executive Officer Pursuant to the requirements of the Securities Exchange Act of 1934, this report has been signed below by the following persons on behalf of the registrantand in the capacities and on the dates indicated. February 17, 2021 /s/ Martin E. Stein, Jr. Martin E. Stein. Jr., Executive Chairman of the Board
February 17, 2021 /s/ Lisa Palmer Lisa Palmer, President, Chief Executive Officer, and Director
February 17, 2021 /s/ Michael J. Mas
Michael J. Mas, Executive Vice President, Chief Financial Officer (PrincipalFinancial Officer)
February 17, 2021 /s/ J. Christian Leavitt
J. Christian Leavitt, Senior Vice President and Treasurer (PrincipalAccounting Officer)
February 17, 2021 /s/ Joseph Azrack Joseph Azrack, Director
February 17, 2021 /s/ Bryce Blair Bryce Blair, Director
February 17, 2021 /s/ C. Ronald Blankenship C. Ronald Blankenship, Director
February 17, 2021 /s/ Deirdre J. Evens Deirdre J. Evens, Director
February 17, 2021 /s/ Thomas W. Furphy Tom W. Furphy, Director
February 17, 2021 /s/ Karin M. Klein Karin M. Klein, Director
February 17, 2021 /s/ Peter Linneman Peter Linneman, Director
February 17, 2021 /s/ David P. O'Connor David P. O'Connor, Director
February 17, 2021 /s/ Thomas G. Wattles Thomas G. Wattles, Director
134
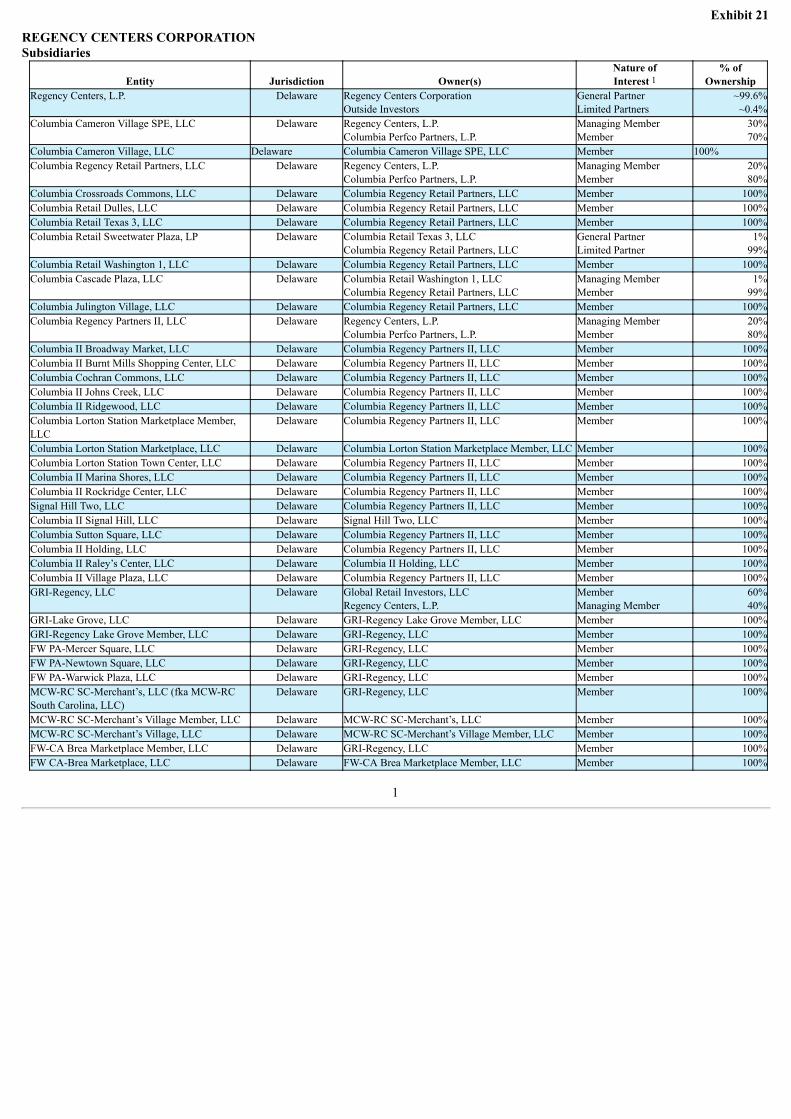
Exhibit 21
REGENCY CENTERS CORPORATIONSubsidiaries
Entity
Jurisdiction
Owner(s)
Nature ofInterest 1
% ofOwnership
Regency Centers, L.P. Delaware Regency Centers CorporationOutside Investors
General PartnerLimited Partners
~99.6%~0.4%
Columbia Cameron Village SPE, LLC Delaware Regency Centers, L.P.Columbia Perfco Partners, L.P.
Managing MemberMember
30%70%
Columbia Cameron Village, LLC Delaware Columbia Cameron Village SPE, LLC Member 100%Columbia Regency Retail Partners, LLC Delaware Regency Centers, L.P.
Columbia Perfco Partners, L.P.Managing MemberMember
20%80%
Columbia Crossroads Commons, LLC Delaware Columbia Regency Retail Partners, LLC Member 100%Columbia Retail Dulles, LLC Delaware Columbia Regency Retail Partners, LLC Member 100%Columbia Retail Texas 3, LLC Delaware Columbia Regency Retail Partners, LLC Member 100%Columbia Retail Sweetwater Plaza, LP Delaware Columbia Retail Texas 3, LLC
Columbia Regency Retail Partners, LLCGeneral PartnerLimited Partner
1%99%
Columbia Retail Washington 1, LLC Delaware Columbia Regency Retail Partners, LLC Member 100%Columbia Cascade Plaza, LLC Delaware Columbia Retail Washington 1, LLC
Columbia Regency Retail Partners, LLCManaging MemberMember
1%99%
Columbia Julington Village, LLC Delaware Columbia Regency Retail Partners, LLC Member 100%Columbia Regency Partners II, LLC Delaware Regency Centers, L.P.
Columbia Perfco Partners, L.P.Managing MemberMember
20%80%
Columbia II Broadway Market, LLC Delaware Columbia Regency Partners II, LLC Member 100%Columbia II Burnt Mills Shopping Center, LLC Delaware Columbia Regency Partners II, LLC Member 100%Columbia Cochran Commons, LLC Delaware Columbia Regency Partners II, LLC Member 100%Columbia II Johns Creek, LLC Delaware Columbia Regency Partners II, LLC Member 100%Columbia II Ridgewood, LLC Delaware Columbia Regency Partners II, LLC Member 100%Columbia Lorton Station Marketplace Member,LLC
Delaware Columbia Regency Partners II, LLC Member 100%
Columbia Lorton Station Marketplace, LLC Delaware Columbia Lorton Station Marketplace Member, LLC Member 100%Columbia Lorton Station Town Center, LLC Delaware Columbia Regency Partners II, LLC Member 100%Columbia II Marina Shores, LLC Delaware Columbia Regency Partners II, LLC Member 100%Columbia II Rockridge Center, LLC Delaware Columbia Regency Partners II, LLC Member 100%Signal Hill Two, LLC Delaware Columbia Regency Partners II, LLC Member 100%Columbia II Signal Hill, LLC Delaware Signal Hill Two, LLC Member 100%Columbia Sutton Square, LLC Delaware Columbia Regency Partners II, LLC Member 100%Columbia II Holding, LLC Delaware Columbia Regency Partners II, LLC Member 100%Columbia II Raley’s Center, LLC Delaware Columbia II Holding, LLC Member 100%Columbia II Village Plaza, LLC Delaware Columbia Regency Partners II, LLC Member 100%GRI-Regency, LLC
Delaware Global Retail Investors, LLCRegency Centers, L.P.
MemberManaging Member
60%40%
GRI-Lake Grove, LLC Delaware GRI-Regency Lake Grove Member, LLC Member 100%GRI-Regency Lake Grove Member, LLC Delaware GRI-Regency, LLC Member 100%FW PA-Mercer Square, LLC Delaware GRI-Regency, LLC Member 100%FW PA-Newtown Square, LLC Delaware GRI-Regency, LLC Member 100%FW PA-Warwick Plaza, LLC Delaware GRI-Regency, LLC Member 100%MCW-RC SC-Merchant’s, LLC (fka MCW-RCSouth Carolina, LLC)
Delaware GRI-Regency, LLC
Member 100%
MCW-RC SC-Merchant’s Village Member, LLC Delaware MCW-RC SC-Merchant’s, LLC Member 100%MCW-RC SC-Merchant’s Village, LLC Delaware MCW-RC SC-Merchant’s Village Member, LLC Member 100%FW-CA Brea Marketplace Member, LLC Delaware GRI-Regency, LLC Member 100%FW CA-Brea Marketplace, LLC Delaware FW-CA Brea Marketplace Member, LLC Member 100%
1
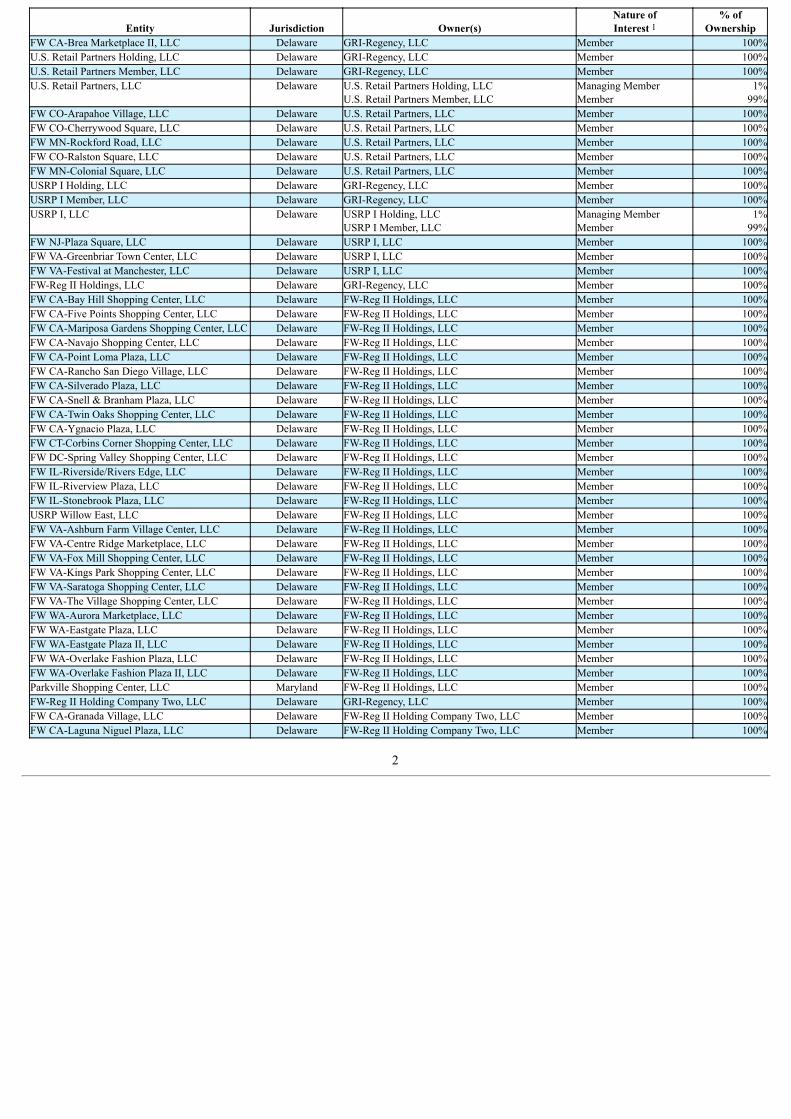
Entity
Jurisdiction
Owner(s)
Nature ofInterest 1
% ofOwnership
FW CA-Brea Marketplace II, LLC Delaware GRI-Regency, LLC Member 100%U.S. Retail Partners Holding, LLC Delaware GRI-Regency, LLC Member 100%U.S. Retail Partners Member, LLC Delaware GRI-Regency, LLC Member 100%U.S. Retail Partners, LLC Delaware U.S. Retail Partners Holding, LLC
U.S. Retail Partners Member, LLCManaging MemberMember
1%99%
FW CO-Arapahoe Village, LLC Delaware U.S. Retail Partners, LLC Member 100%FW CO-Cherrywood Square, LLC Delaware U.S. Retail Partners, LLC Member 100%FW MN-Rockford Road, LLC Delaware U.S. Retail Partners, LLC Member 100%FW CO-Ralston Square, LLC Delaware U.S. Retail Partners, LLC Member 100%FW MN-Colonial Square, LLC Delaware U.S. Retail Partners, LLC Member 100%USRP I Holding, LLC Delaware GRI-Regency, LLC Member 100%USRP I Member, LLC Delaware GRI-Regency, LLC Member 100%USRP I, LLC Delaware USRP I Holding, LLC
USRP I Member, LLCManaging MemberMember
1%99%
FW NJ-Plaza Square, LLC Delaware USRP I, LLC Member 100%FW VA-Greenbriar Town Center, LLC Delaware USRP I, LLC Member 100%FW VA-Festival at Manchester, LLC Delaware USRP I, LLC Member 100%FW-Reg II Holdings, LLC Delaware GRI-Regency, LLC Member 100%FW CA-Bay Hill Shopping Center, LLC Delaware FW-Reg II Holdings, LLC Member 100%FW CA-Five Points Shopping Center, LLC Delaware FW-Reg II Holdings, LLC Member 100%FW CA-Mariposa Gardens Shopping Center, LLC Delaware FW-Reg II Holdings, LLC Member 100%FW CA-Navajo Shopping Center, LLC Delaware FW-Reg II Holdings, LLC Member 100%FW CA-Point Loma Plaza, LLC Delaware FW-Reg II Holdings, LLC Member 100%FW CA-Rancho San Diego Village, LLC Delaware FW-Reg II Holdings, LLC Member 100%FW CA-Silverado Plaza, LLC Delaware FW-Reg II Holdings, LLC Member 100%FW CA-Snell & Branham Plaza, LLC Delaware FW-Reg II Holdings, LLC Member 100%FW CA-Twin Oaks Shopping Center, LLC Delaware FW-Reg II Holdings, LLC Member 100%FW CA-Ygnacio Plaza, LLC Delaware FW-Reg II Holdings, LLC Member 100%FW CT-Corbins Corner Shopping Center, LLC Delaware FW-Reg II Holdings, LLC Member 100%FW DC-Spring Valley Shopping Center, LLC Delaware FW-Reg II Holdings, LLC Member 100%FW IL-Riverside/Rivers Edge, LLC Delaware FW-Reg II Holdings, LLC Member 100%FW IL-Riverview Plaza, LLC Delaware FW-Reg II Holdings, LLC Member 100%FW IL-Stonebrook Plaza, LLC Delaware FW-Reg II Holdings, LLC Member 100%USRP Willow East, LLC Delaware FW-Reg II Holdings, LLC Member 100%FW VA-Ashburn Farm Village Center, LLC Delaware FW-Reg II Holdings, LLC Member 100%FW VA-Centre Ridge Marketplace, LLC Delaware FW-Reg II Holdings, LLC Member 100%FW VA-Fox Mill Shopping Center, LLC Delaware FW-Reg II Holdings, LLC Member 100%FW VA-Kings Park Shopping Center, LLC Delaware FW-Reg II Holdings, LLC Member 100%FW VA-Saratoga Shopping Center, LLC Delaware FW-Reg II Holdings, LLC Member 100%FW VA-The Village Shopping Center, LLC Delaware FW-Reg II Holdings, LLC Member 100%FW WA-Aurora Marketplace, LLC Delaware FW-Reg II Holdings, LLC Member 100%FW WA-Eastgate Plaza, LLC Delaware FW-Reg II Holdings, LLC Member 100%FW WA-Eastgate Plaza II, LLC Delaware FW-Reg II Holdings, LLC Member 100%FW WA-Overlake Fashion Plaza, LLC Delaware FW-Reg II Holdings, LLC Member 100%FW WA-Overlake Fashion Plaza II, LLC Delaware FW-Reg II Holdings, LLC Member 100%Parkville Shopping Center, LLC Maryland FW-Reg II Holdings, LLC Member 100%FW-Reg II Holding Company Two, LLC Delaware GRI-Regency, LLC Member 100%FW CA-Granada Village, LLC Delaware FW-Reg II Holding Company Two, LLC Member 100%FW CA-Laguna Niguel Plaza, LLC Delaware FW-Reg II Holding Company Two, LLC Member 100%
2
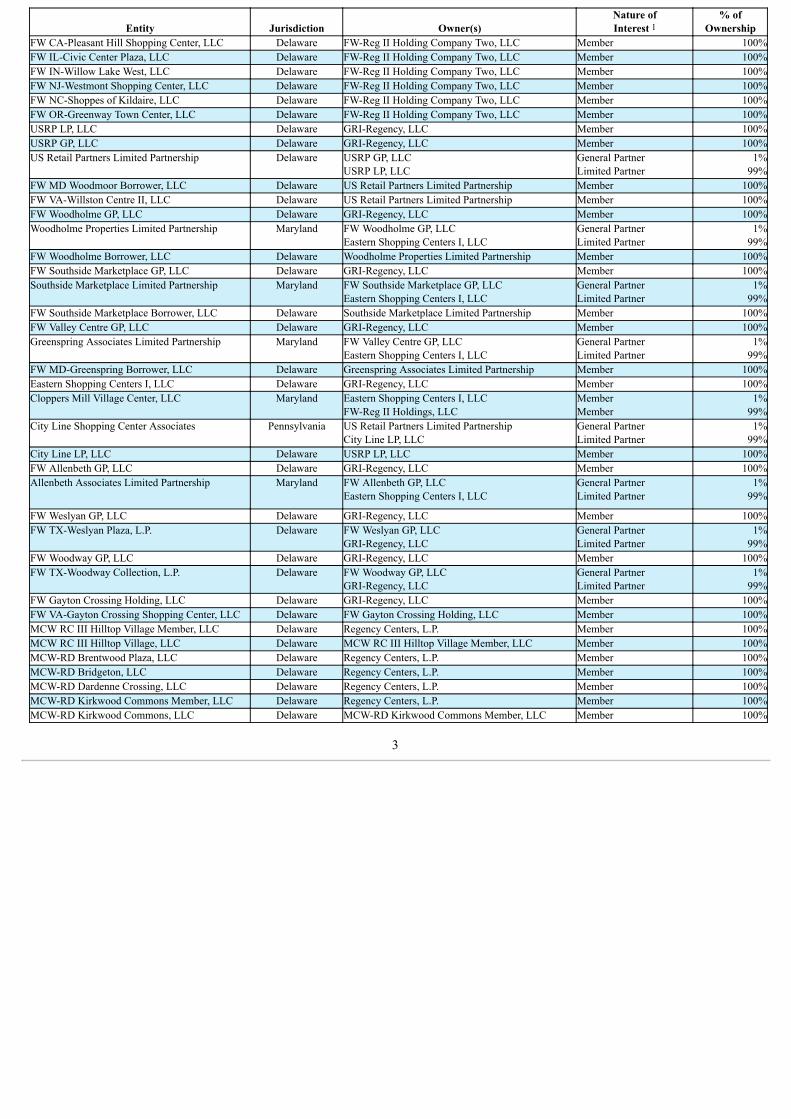
Entity
Jurisdiction
Owner(s)
Nature ofInterest 1
% ofOwnership
FW CA-Pleasant Hill Shopping Center, LLC Delaware FW-Reg II Holding Company Two, LLC Member 100%FW IL-Civic Center Plaza, LLC Delaware FW-Reg II Holding Company Two, LLC Member 100%FW IN-Willow Lake West, LLC Delaware FW-Reg II Holding Company Two, LLC Member 100%FW NJ-Westmont Shopping Center, LLC Delaware FW-Reg II Holding Company Two, LLC Member 100%FW NC-Shoppes of Kildaire, LLC Delaware FW-Reg II Holding Company Two, LLC Member 100%FW OR-Greenway Town Center, LLC Delaware FW-Reg II Holding Company Two, LLC Member 100%USRP LP, LLC Delaware GRI-Regency, LLC Member 100%USRP GP, LLC Delaware GRI-Regency, LLC Member 100%US Retail Partners Limited Partnership Delaware USRP GP, LLC
USRP LP, LLCGeneral PartnerLimited Partner
1%99%
FW MD Woodmoor Borrower, LLC Delaware US Retail Partners Limited Partnership Member 100%FW VA-Willston Centre II, LLC Delaware US Retail Partners Limited Partnership Member 100%FW Woodholme GP, LLC Delaware GRI-Regency, LLC Member 100%Woodholme Properties Limited Partnership Maryland FW Woodholme GP, LLC
Eastern Shopping Centers I, LLCGeneral PartnerLimited Partner
1%99%
FW Woodholme Borrower, LLC Delaware Woodholme Properties Limited Partnership Member 100%FW Southside Marketplace GP, LLC Delaware GRI-Regency, LLC Member 100%Southside Marketplace Limited Partnership Maryland FW Southside Marketplace GP, LLC
Eastern Shopping Centers I, LLCGeneral PartnerLimited Partner
1%99%
FW Southside Marketplace Borrower, LLC Delaware Southside Marketplace Limited Partnership Member 100%FW Valley Centre GP, LLC Delaware GRI-Regency, LLC Member 100%Greenspring Associates Limited Partnership Maryland FW Valley Centre GP, LLC
Eastern Shopping Centers I, LLCGeneral PartnerLimited Partner
1%99%
FW MD-Greenspring Borrower, LLC Delaware Greenspring Associates Limited Partnership Member 100%Eastern Shopping Centers I, LLC Delaware GRI-Regency, LLC Member 100%Cloppers Mill Village Center, LLC Maryland Eastern Shopping Centers I, LLC
FW-Reg II Holdings, LLCMemberMember
1%99%
City Line Shopping Center Associates Pennsylvania US Retail Partners Limited PartnershipCity Line LP, LLC
General PartnerLimited Partner
1%99%
City Line LP, LLC Delaware USRP LP, LLC Member 100%FW Allenbeth GP, LLC Delaware GRI-Regency, LLC Member 100%Allenbeth Associates Limited Partnership Maryland FW Allenbeth GP, LLC
Eastern Shopping Centers I, LLCGeneral PartnerLimited Partner
1%99%
FW Weslyan GP, LLC Delaware GRI-Regency, LLC Member 100%FW TX-Weslyan Plaza, L.P. Delaware FW Weslyan GP, LLC
GRI-Regency, LLCGeneral PartnerLimited Partner
1%99%
FW Woodway GP, LLC Delaware GRI-Regency, LLC Member 100%FW TX-Woodway Collection, L.P. Delaware FW Woodway GP, LLC
GRI-Regency, LLCGeneral PartnerLimited Partner
1%99%
FW Gayton Crossing Holding, LLC Delaware GRI-Regency, LLC Member 100%FW VA-Gayton Crossing Shopping Center, LLC Delaware FW Gayton Crossing Holding, LLC Member 100%MCW RC III Hilltop Village Member, LLC Delaware Regency Centers, L.P. Member 100%MCW RC III Hilltop Village, LLC Delaware MCW RC III Hilltop Village Member, LLC Member 100%MCW-RD Brentwood Plaza, LLC Delaware Regency Centers, L.P. Member 100%MCW-RD Bridgeton, LLC Delaware Regency Centers, L.P. Member 100%MCW-RD Dardenne Crossing, LLC Delaware Regency Centers, L.P. Member 100%MCW-RD Kirkwood Commons Member, LLC Delaware Regency Centers, L.P. Member 100%MCW-RD Kirkwood Commons, LLC Delaware MCW-RD Kirkwood Commons Member, LLC Member 100%
3
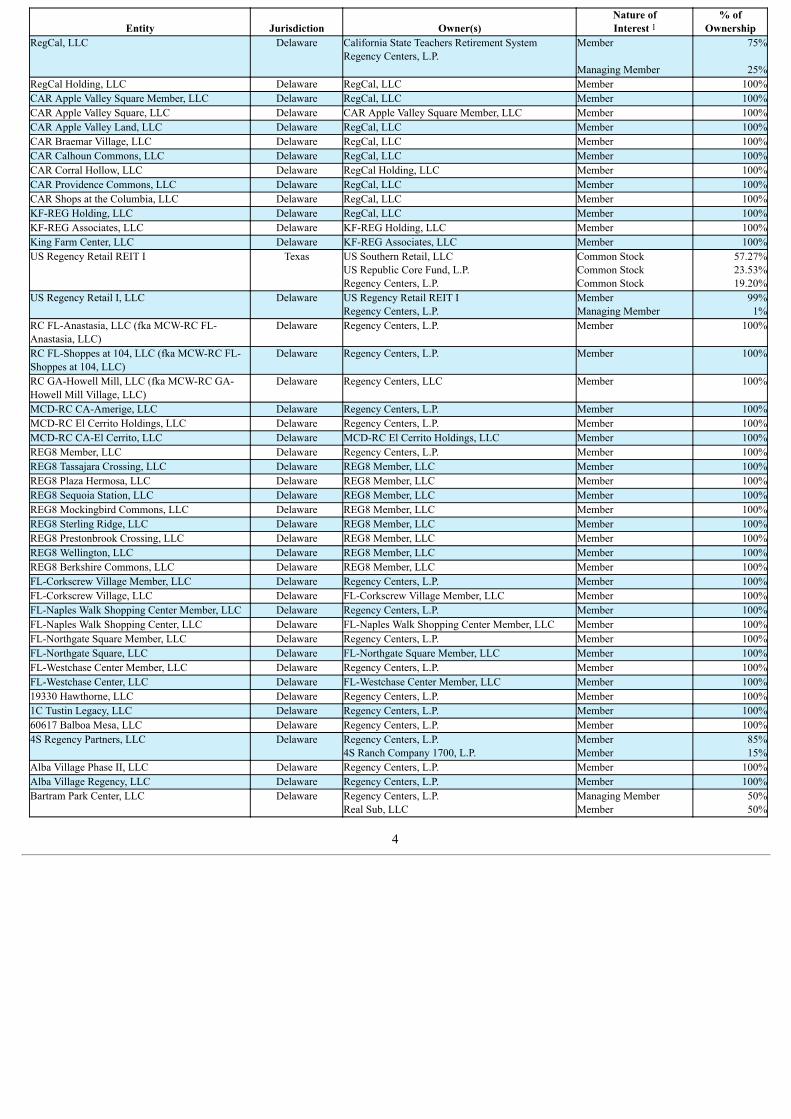
Entity
Jurisdiction
Owner(s)
Nature ofInterest 1
% ofOwnership
RegCal, LLC Delaware California State Teachers Retirement SystemRegency Centers, L.P.
Member Managing Member
75%
25%RegCal Holding, LLC Delaware RegCal, LLC Member 100%CAR Apple Valley Square Member, LLC Delaware RegCal, LLC Member 100%CAR Apple Valley Square, LLC Delaware CAR Apple Valley Square Member, LLC Member 100%CAR Apple Valley Land, LLC Delaware RegCal, LLC Member 100%CAR Braemar Village, LLC Delaware RegCal, LLC Member 100%CAR Calhoun Commons, LLC Delaware RegCal, LLC Member 100%CAR Corral Hollow, LLC Delaware RegCal Holding, LLC Member 100%CAR Providence Commons, LLC Delaware RegCal, LLC Member 100%CAR Shops at the Columbia, LLC Delaware RegCal, LLC Member 100%KF-REG Holding, LLC Delaware RegCal, LLC Member 100%KF-REG Associates, LLC Delaware KF-REG Holding, LLC Member 100%King Farm Center, LLC Delaware KF-REG Associates, LLC Member 100%US Regency Retail REIT I Texas US Southern Retail, LLC
US Republic Core Fund, L.P.Regency Centers, L.P.
Common StockCommon StockCommon Stock
57.27%23.53%19.20%
US Regency Retail I, LLC Delaware US Regency Retail REIT IRegency Centers, L.P.
MemberManaging Member
99%1%
RC FL-Anastasia, LLC (fka MCW-RC FL-Anastasia, LLC)
Delaware Regency Centers, L.P.
Member 100%
RC FL-Shoppes at 104, LLC (fka MCW-RC FL-Shoppes at 104, LLC)
Delaware Regency Centers, L.P.
Member 100%
RC GA-Howell Mill, LLC (fka MCW-RC GA-Howell Mill Village, LLC)
Delaware Regency Centers, LLC Member 100%
MCD-RC CA-Amerige, LLC Delaware Regency Centers, L.P. Member 100%MCD-RC El Cerrito Holdings, LLC Delaware Regency Centers, L.P. Member 100%MCD-RC CA-El Cerrito, LLC Delaware MCD-RC El Cerrito Holdings, LLC Member 100%REG8 Member, LLC Delaware Regency Centers, L.P. Member 100%REG8 Tassajara Crossing, LLC Delaware REG8 Member, LLC Member 100%REG8 Plaza Hermosa, LLC Delaware REG8 Member, LLC Member 100%REG8 Sequoia Station, LLC Delaware REG8 Member, LLC Member 100%REG8 Mockingbird Commons, LLC Delaware REG8 Member, LLC Member 100%REG8 Sterling Ridge, LLC Delaware REG8 Member, LLC Member 100%REG8 Prestonbrook Crossing, LLC Delaware REG8 Member, LLC Member 100%REG8 Wellington, LLC Delaware REG8 Member, LLC Member 100%REG8 Berkshire Commons, LLC Delaware REG8 Member, LLC Member 100%FL-Corkscrew Village Member, LLC Delaware Regency Centers, L.P. Member 100%FL-Corkscrew Village, LLC Delaware FL-Corkscrew Village Member, LLC Member 100%FL-Naples Walk Shopping Center Member, LLC Delaware Regency Centers, L.P. Member 100%FL-Naples Walk Shopping Center, LLC Delaware FL-Naples Walk Shopping Center Member, LLC Member 100%FL-Northgate Square Member, LLC Delaware Regency Centers, L.P. Member 100%FL-Northgate Square, LLC Delaware FL-Northgate Square Member, LLC Member 100%FL-Westchase Center Member, LLC Delaware Regency Centers, L.P. Member 100%FL-Westchase Center, LLC Delaware FL-Westchase Center Member, LLC Member 100%19330 Hawthorne, LLC Delaware Regency Centers, L.P. Member 100%1C Tustin Legacy, LLC Delaware Regency Centers, L.P. Member 100%60617 Balboa Mesa, LLC Delaware Regency Centers, L.P. Member 100%4S Regency Partners, LLC Delaware Regency Centers, L.P.
4S Ranch Company 1700, L.P.MemberMember
85%15%
Alba Village Phase II, LLC Delaware Regency Centers, L.P. Member 100%Alba Village Regency, LLC Delaware Regency Centers, L.P. Member 100%Bartram Park Center, LLC
Delaware Regency Centers, L.P.Real Sub, LLC
Managing MemberMember
50%50%
4
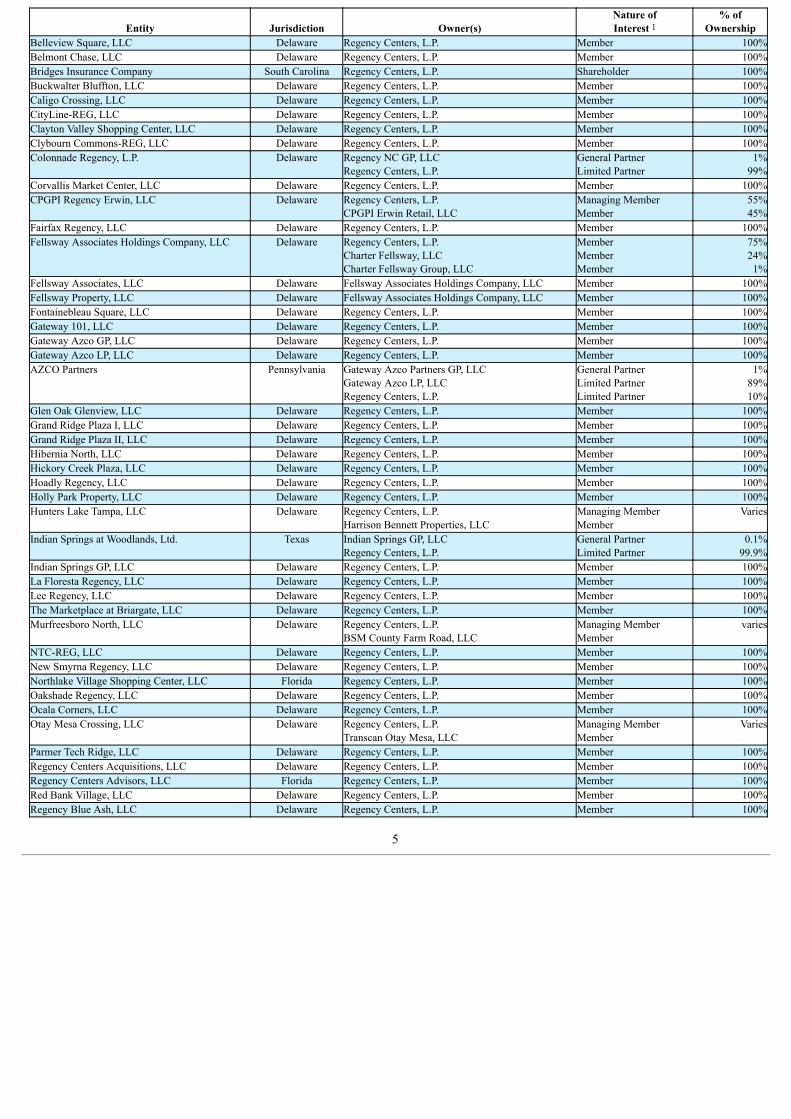
Entity
Jurisdiction
Owner(s)
Nature ofInterest 1
% ofOwnership
Belleview Square, LLC Delaware Regency Centers, L.P. Member 100%Belmont Chase, LLC Delaware Regency Centers, L.P. Member 100%Bridges Insurance Company South Carolina Regency Centers, L.P. Shareholder 100%Buckwalter Bluffton, LLC Delaware Regency Centers, L.P. Member 100%Caligo Crossing, LLC Delaware Regency Centers, L.P. Member 100%CityLine-REG, LLC Delaware Regency Centers, L.P. Member 100%Clayton Valley Shopping Center, LLC Delaware Regency Centers, L.P. Member 100%Clybourn Commons-REG, LLC Delaware Regency Centers, L.P. Member 100%Colonnade Regency, L.P. Delaware Regency NC GP, LLC
Regency Centers, L.P.General PartnerLimited Partner
1%99%
Corvallis Market Center, LLC Delaware Regency Centers, L.P. Member 100%CPGPI Regency Erwin, LLC Delaware Regency Centers, L.P.
CPGPI Erwin Retail, LLCManaging MemberMember
55%45%
Fairfax Regency, LLC Delaware Regency Centers, L.P. Member 100%Fellsway Associates Holdings Company, LLC Delaware Regency Centers, L.P.
Charter Fellsway, LLCCharter Fellsway Group, LLC
MemberMemberMember
75%24%
1%Fellsway Associates, LLC Delaware Fellsway Associates Holdings Company, LLC Member 100%Fellsway Property, LLC Delaware Fellsway Associates Holdings Company, LLC Member 100%Fontainebleau Square, LLC Delaware Regency Centers, L.P. Member 100%Gateway 101, LLC Delaware Regency Centers, L.P. Member 100%Gateway Azco GP, LLC Delaware Regency Centers, L.P. Member 100%Gateway Azco LP, LLC Delaware Regency Centers, L.P. Member 100%AZCO Partners Pennsylvania Gateway Azco Partners GP, LLC
Gateway Azco LP, LLCRegency Centers, L.P.
General PartnerLimited PartnerLimited Partner
1%89%10%
Glen Oak Glenview, LLC Delaware Regency Centers, L.P. Member 100%Grand Ridge Plaza I, LLC Delaware Regency Centers, L.P. Member 100%Grand Ridge Plaza II, LLC Delaware Regency Centers, L.P. Member 100%Hibernia North, LLC Delaware Regency Centers, L.P. Member 100%Hickory Creek Plaza, LLC Delaware Regency Centers, L.P. Member 100%Hoadly Regency, LLC Delaware Regency Centers, L.P. Member 100%Holly Park Property, LLC Delaware Regency Centers, L.P. Member 100%Hunters Lake Tampa, LLC Delaware Regency Centers, L.P.
Harrison Bennett Properties, LLCManaging MemberMember
Varies
Indian Springs at Woodlands, Ltd. Texas Indian Springs GP, LLCRegency Centers, L.P.
General PartnerLimited Partner
0.1%99.9%
Indian Springs GP, LLC Delaware Regency Centers, L.P. Member 100%La Floresta Regency, LLC Delaware Regency Centers, L.P. Member 100%Lee Regency, LLC Delaware Regency Centers, L.P. Member 100%The Marketplace at Briargate, LLC Delaware Regency Centers, L.P. Member 100%Murfreesboro North, LLC Delaware Regency Centers, L.P.
BSM County Farm Road, LLCManaging MemberMember
varies
NTC-REG, LLC Delaware Regency Centers, L.P. Member 100%New Smyrna Regency, LLC Delaware Regency Centers, L.P. Member 100%Northlake Village Shopping Center, LLC Florida Regency Centers, L.P. Member 100%Oakshade Regency, LLC Delaware Regency Centers, L.P. Member 100%Ocala Corners, LLC Delaware Regency Centers, L.P. Member 100%Otay Mesa Crossing, LLC Delaware Regency Centers, L.P.
Transcan Otay Mesa, LLCManaging MemberMember
Varies
Parmer Tech Ridge, LLC Delaware Regency Centers, L.P. Member 100%Regency Centers Acquisitions, LLC Delaware Regency Centers, L.P. Member 100%Regency Centers Advisors, LLC Florida Regency Centers, L.P. Member 100%Red Bank Village, LLC Delaware Regency Centers, L.P. Member 100%Regency Blue Ash, LLC Delaware Regency Centers, L.P. Member 100%
5
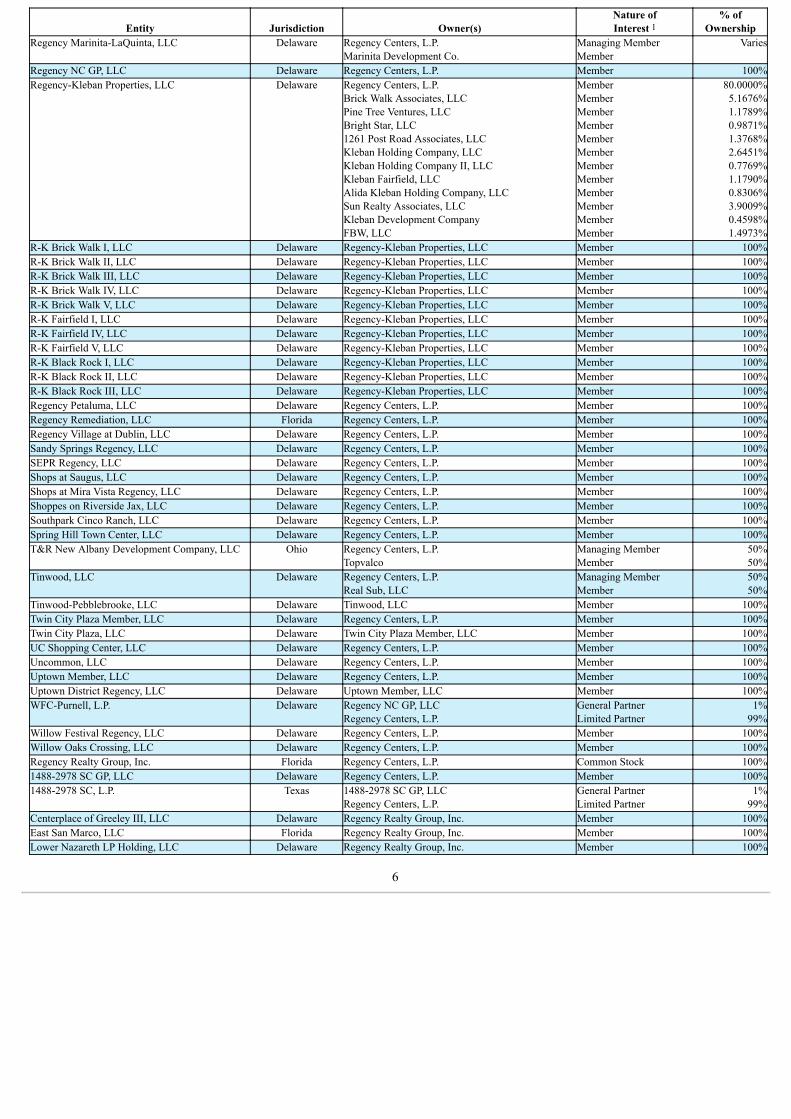
Entity
Jurisdiction
Owner(s)
Nature ofInterest 1
% ofOwnership
Regency Marinita-LaQuinta, LLC Delaware Regency Centers, L.P.Marinita Development Co.
Managing MemberMember
Varies
Regency NC GP, LLC Delaware Regency Centers, L.P. Member 100%Regency-Kleban Properties, LLC Delaware Regency Centers, L.P.
Brick Walk Associates, LLCPine Tree Ventures, LLCBright Star, LLC1261 Post Road Associates, LLCKleban Holding Company, LLCKleban Holding Company II, LLCKleban Fairfield, LLCAlida Kleban Holding Company, LLCSun Realty Associates, LLCKleban Development CompanyFBW, LLC
MemberMemberMemberMemberMemberMemberMemberMemberMemberMemberMemberMember
80.0000%5.1676%1.1789%0.9871%1.3768%2.6451%0.7769%1.1790%0.8306%3.9009%0.4598%1.4973%
R-K Brick Walk I, LLC Delaware Regency-Kleban Properties, LLC Member 100%R-K Brick Walk II, LLC Delaware Regency-Kleban Properties, LLC Member 100%R-K Brick Walk III, LLC Delaware Regency-Kleban Properties, LLC Member 100%R-K Brick Walk IV, LLC Delaware Regency-Kleban Properties, LLC Member 100%R-K Brick Walk V, LLC Delaware Regency-Kleban Properties, LLC Member 100%R-K Fairfield I, LLC Delaware Regency-Kleban Properties, LLC Member 100%R-K Fairfield IV, LLC Delaware Regency-Kleban Properties, LLC Member 100%R-K Fairfield V, LLC Delaware Regency-Kleban Properties, LLC Member 100%R-K Black Rock I, LLC Delaware Regency-Kleban Properties, LLC Member 100%R-K Black Rock II, LLC Delaware Regency-Kleban Properties, LLC Member 100%R-K Black Rock III, LLC Delaware Regency-Kleban Properties, LLC Member 100%Regency Petaluma, LLC Delaware Regency Centers, L.P. Member 100%Regency Remediation, LLC Florida Regency Centers, L.P. Member 100%Regency Village at Dublin, LLC Delaware Regency Centers, L.P. Member 100%Sandy Springs Regency, LLC Delaware Regency Centers, L.P. Member 100%SEPR Regency, LLC Delaware Regency Centers, L.P. Member 100%Shops at Saugus, LLC Delaware Regency Centers, L.P. Member 100%Shops at Mira Vista Regency, LLC Delaware Regency Centers, L.P. Member 100%Shoppes on Riverside Jax, LLC Delaware Regency Centers, L.P. Member 100%Southpark Cinco Ranch, LLC Delaware Regency Centers, L.P. Member 100%Spring Hill Town Center, LLC Delaware Regency Centers, L.P. Member 100%T&R New Albany Development Company, LLC Ohio Regency Centers, L.P.
TopvalcoManaging MemberMember
50%50%
Tinwood, LLC Delaware Regency Centers, L.P.Real Sub, LLC
Managing MemberMember
50%50%
Tinwood-Pebblebrooke, LLC Delaware Tinwood, LLC Member 100%Twin City Plaza Member, LLC Delaware Regency Centers, L.P. Member 100%Twin City Plaza, LLC Delaware Twin City Plaza Member, LLC Member 100%UC Shopping Center, LLC Delaware Regency Centers, L.P. Member 100%Uncommon, LLC Delaware Regency Centers, L.P. Member 100%Uptown Member, LLC Delaware Regency Centers, L.P. Member 100%Uptown District Regency, LLC Delaware Uptown Member, LLC Member 100%WFC-Purnell, L.P. Delaware Regency NC GP, LLC
Regency Centers, L.P.General PartnerLimited Partner
1%99%
Willow Festival Regency, LLC Delaware Regency Centers, L.P. Member 100%Willow Oaks Crossing, LLC Delaware Regency Centers, L.P. Member 100%Regency Realty Group, Inc. Florida Regency Centers, L.P. Common Stock 100%1488-2978 SC GP, LLC Delaware Regency Centers, L.P. Member 100%1488-2978 SC, L.P. Texas 1488-2978 SC GP, LLC
Regency Centers, L.P.General PartnerLimited Partner
1%99%
Centerplace of Greeley III, LLC Delaware Regency Realty Group, Inc. Member 100%East San Marco, LLC Florida Regency Realty Group, Inc. Member 100%Lower Nazareth LP Holding, LLC Delaware Regency Realty Group, Inc. Member 100%
6
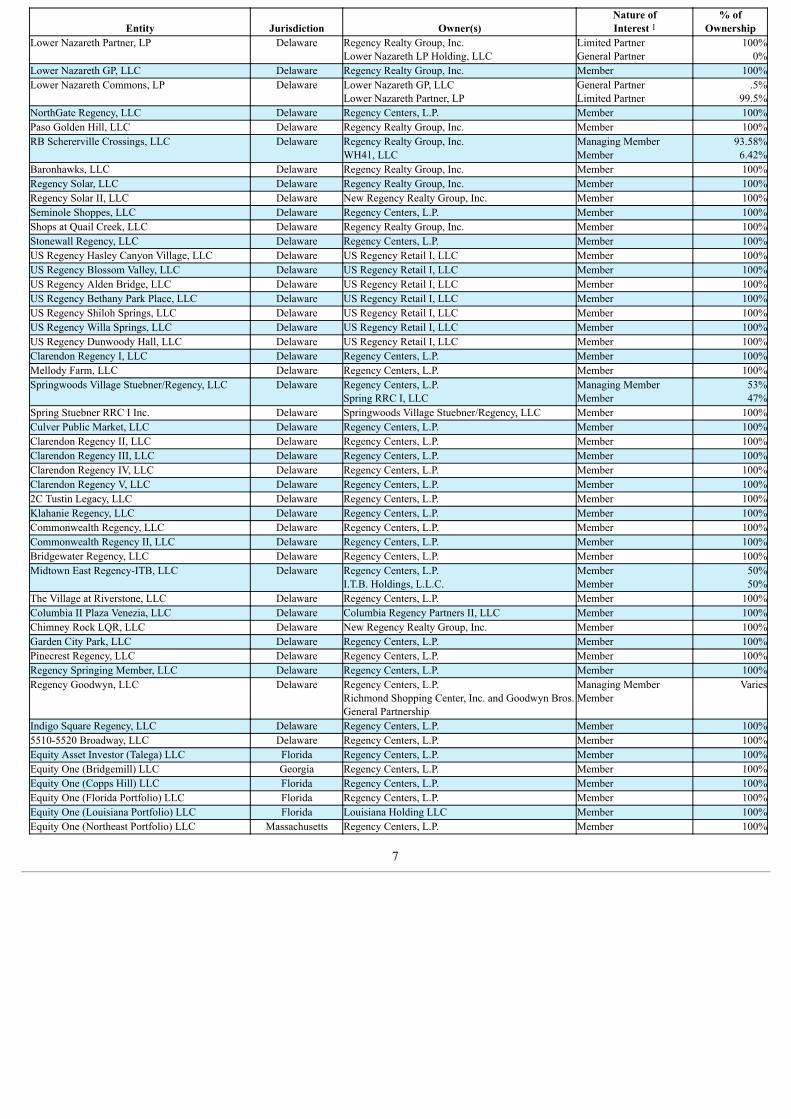
Entity
Jurisdiction
Owner(s)
Nature ofInterest 1
% ofOwnership
Lower Nazareth Partner, LP Delaware Regency Realty Group, Inc.Lower Nazareth LP Holding, LLC
Limited PartnerGeneral Partner
100%0%
Lower Nazareth GP, LLC Delaware Regency Realty Group, Inc. Member 100%Lower Nazareth Commons, LP Delaware Lower Nazareth GP, LLC
Lower Nazareth Partner, LPGeneral PartnerLimited Partner
.5%99.5%
NorthGate Regency, LLC Delaware Regency Centers, L.P. Member 100%Paso Golden Hill, LLC Delaware Regency Realty Group, Inc. Member 100%RB Schererville Crossings, LLC Delaware Regency Realty Group, Inc.
WH41, LLCManaging MemberMember
93.58%6.42%
Baronhawks, LLC Delaware Regency Realty Group, Inc. Member 100%Regency Solar, LLC Delaware Regency Realty Group, Inc. Member 100%Regency Solar II, LLC Delaware New Regency Realty Group, Inc. Member 100%Seminole Shoppes, LLC Delaware Regency Centers, L.P. Member 100%Shops at Quail Creek, LLC Delaware Regency Realty Group, Inc. Member 100%Stonewall Regency, LLC Delaware Regency Centers, L.P. Member 100%US Regency Hasley Canyon Village, LLC Delaware US Regency Retail I, LLC Member 100%US Regency Blossom Valley, LLC Delaware US Regency Retail I, LLC Member 100%US Regency Alden Bridge, LLC Delaware US Regency Retail I, LLC Member 100%US Regency Bethany Park Place, LLC Delaware US Regency Retail I, LLC Member 100%US Regency Shiloh Springs, LLC Delaware US Regency Retail I, LLC Member 100%US Regency Willa Springs, LLC Delaware US Regency Retail I, LLC Member 100%US Regency Dunwoody Hall, LLC Delaware US Regency Retail I, LLC Member 100%Clarendon Regency I, LLC Delaware Regency Centers, L.P. Member 100%Mellody Farm, LLC Delaware Regency Centers, L.P. Member 100%Springwoods Village Stuebner/Regency, LLC Delaware Regency Centers, L.P.
Spring RRC I, LLCManaging MemberMember
53%47%
Spring Stuebner RRC I Inc. Delaware Springwoods Village Stuebner/Regency, LLC Member 100%Culver Public Market, LLC Delaware Regency Centers, L.P. Member 100%Clarendon Regency II, LLC Delaware Regency Centers, L.P. Member 100%Clarendon Regency III, LLC Delaware Regency Centers, L.P. Member 100%Clarendon Regency IV, LLC Delaware Regency Centers, L.P. Member 100%Clarendon Regency V, LLC Delaware Regency Centers, L.P. Member 100%2C Tustin Legacy, LLC Delaware Regency Centers, L.P. Member 100%Klahanie Regency, LLC Delaware Regency Centers, L.P. Member 100%Commonwealth Regency, LLC Delaware Regency Centers, L.P. Member 100%Commonwealth Regency II, LLC Delaware Regency Centers, L.P. Member 100%Bridgewater Regency, LLC Delaware Regency Centers, L.P. Member 100%Midtown East Regency-ITB, LLC Delaware Regency Centers, L.P.
I.T.B. Holdings, L.L.C.MemberMember
50%50%
The Village at Riverstone, LLC Delaware Regency Centers, L.P. Member 100%Columbia II Plaza Venezia, LLC Delaware Columbia Regency Partners II, LLC Member 100%Chimney Rock LQR, LLC Delaware New Regency Realty Group, Inc. Member 100%Garden City Park, LLC Delaware Regency Centers, L.P. Member 100%Pinecrest Regency, LLC Delaware Regency Centers, L.P. Member 100%Regency Springing Member, LLC Delaware Regency Centers, L.P. Member 100%Regency Goodwyn, LLC Delaware Regency Centers, L.P.
Richmond Shopping Center, Inc. and Goodwyn Bros.General Partnership
Managing MemberMember
Varies
Indigo Square Regency, LLC Delaware Regency Centers, L.P. Member 100%5510-5520 Broadway, LLC Delaware Regency Centers, L.P. Member 100%Equity Asset Investor (Talega) LLC Florida Regency Centers, L.P. Member 100%Equity One (Bridgemill) LLC Georgia Regency Centers, L.P. Member 100%Equity One (Copps Hill) LLC Florida Regency Centers, L.P. Member 100%Equity One (Florida Portfolio) LLC Florida Regency Centers, L.P. Member 100%Equity One (Louisiana Portfolio) LLC Florida Louisiana Holding LLC Member 100%Equity One (Northeast Portfolio) LLC Massachusetts Regency Centers, L.P. Member 100%
7
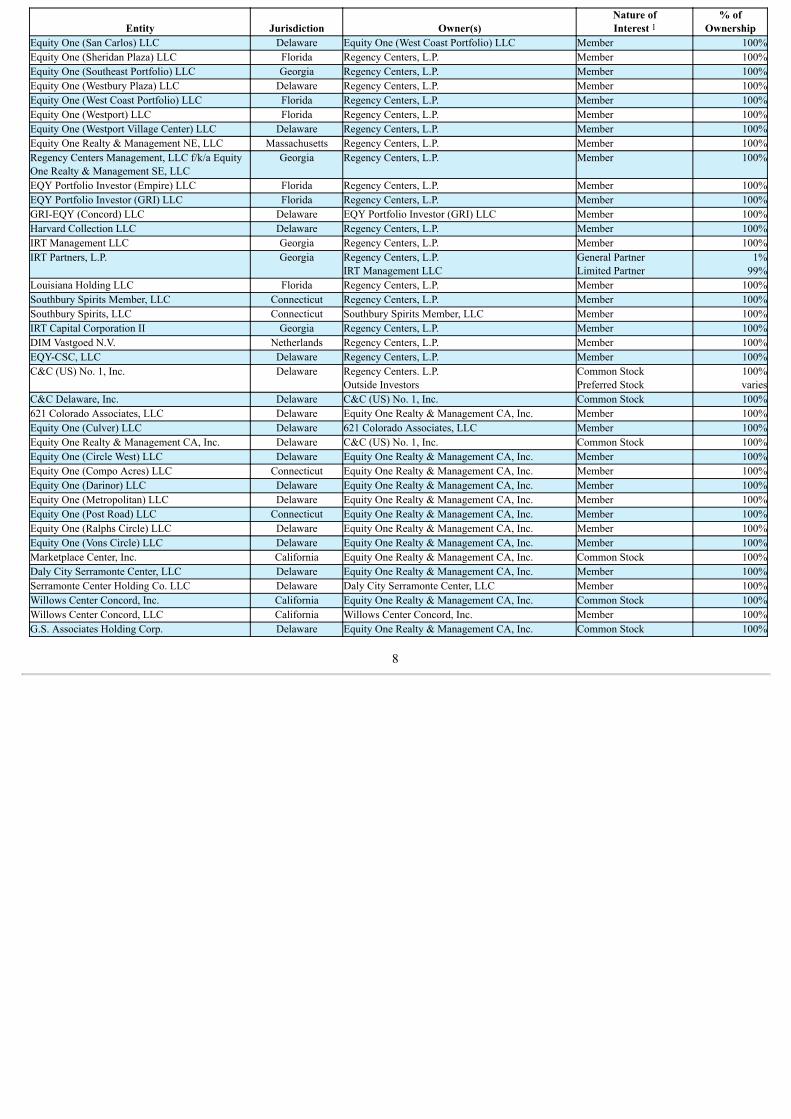
Entity
Jurisdiction
Owner(s)
Nature ofInterest 1
% ofOwnership
Equity One (San Carlos) LLC Delaware Equity One (West Coast Portfolio) LLC Member 100%Equity One (Sheridan Plaza) LLC Florida Regency Centers, L.P. Member 100%Equity One (Southeast Portfolio) LLC Georgia Regency Centers, L.P. Member 100%Equity One (Westbury Plaza) LLC Delaware Regency Centers, L.P. Member 100%Equity One (West Coast Portfolio) LLC Florida Regency Centers, L.P. Member 100%Equity One (Westport) LLC Florida Regency Centers, L.P. Member 100%Equity One (Westport Village Center) LLC Delaware Regency Centers, L.P. Member 100%Equity One Realty & Management NE, LLC Massachusetts Regency Centers, L.P. Member 100%Regency Centers Management, LLC f/k/a EquityOne Realty & Management SE, LLC
Georgia Regency Centers, L.P. Member 100%
EQY Portfolio Investor (Empire) LLC Florida Regency Centers, L.P. Member 100%EQY Portfolio Investor (GRI) LLC Florida Regency Centers, L.P. Member 100%GRI-EQY (Concord) LLC Delaware EQY Portfolio Investor (GRI) LLC Member 100%Harvard Collection LLC Delaware Regency Centers, L.P. Member 100%IRT Management LLC Georgia Regency Centers, L.P. Member 100%IRT Partners, L.P. Georgia Regency Centers, L.P.
IRT Management LLCGeneral PartnerLimited Partner
1%99%
Louisiana Holding LLC Florida Regency Centers, L.P. Member 100%Southbury Spirits Member, LLC Connecticut Regency Centers, L.P. Member 100%Southbury Spirits, LLC Connecticut Southbury Spirits Member, LLC Member 100%IRT Capital Corporation II Georgia Regency Centers, L.P. Member 100%DIM Vastgoed N.V. Netherlands Regency Centers, L.P. Member 100%EQY-CSC, LLC Delaware Regency Centers, L.P. Member 100%C&C (US) No. 1, Inc. Delaware Regency Centers. L.P.
Outside InvestorsCommon StockPreferred Stock
100%varies
C&C Delaware, Inc. Delaware C&C (US) No. 1, Inc. Common Stock 100%621 Colorado Associates, LLC Delaware Equity One Realty & Management CA, Inc. Member 100%Equity One (Culver) LLC Delaware 621 Colorado Associates, LLC Member 100%Equity One Realty & Management CA, Inc. Delaware C&C (US) No. 1, Inc. Common Stock 100%Equity One (Circle West) LLC Delaware Equity One Realty & Management CA, Inc. Member 100%Equity One (Compo Acres) LLC Connecticut Equity One Realty & Management CA, Inc. Member 100%Equity One (Darinor) LLC Delaware Equity One Realty & Management CA, Inc. Member 100%Equity One (Metropolitan) LLC Delaware Equity One Realty & Management CA, Inc. Member 100%Equity One (Post Road) LLC Connecticut Equity One Realty & Management CA, Inc. Member 100%Equity One (Ralphs Circle) LLC Delaware Equity One Realty & Management CA, Inc. Member 100%Equity One (Vons Circle) LLC Delaware Equity One Realty & Management CA, Inc. Member 100%Marketplace Center, Inc. California Equity One Realty & Management CA, Inc. Common Stock 100%Daly City Serramonte Center, LLC Delaware Equity One Realty & Management CA, Inc. Member 100%Serramonte Center Holding Co. LLC Delaware Daly City Serramonte Center, LLC Member 100%Willows Center Concord, Inc. California Equity One Realty & Management CA, Inc. Common Stock 100%Willows Center Concord, LLC California Willows Center Concord, Inc. Member 100%G.S. Associates Holding Corp. Delaware Equity One Realty & Management CA, Inc. Common Stock 100%
8
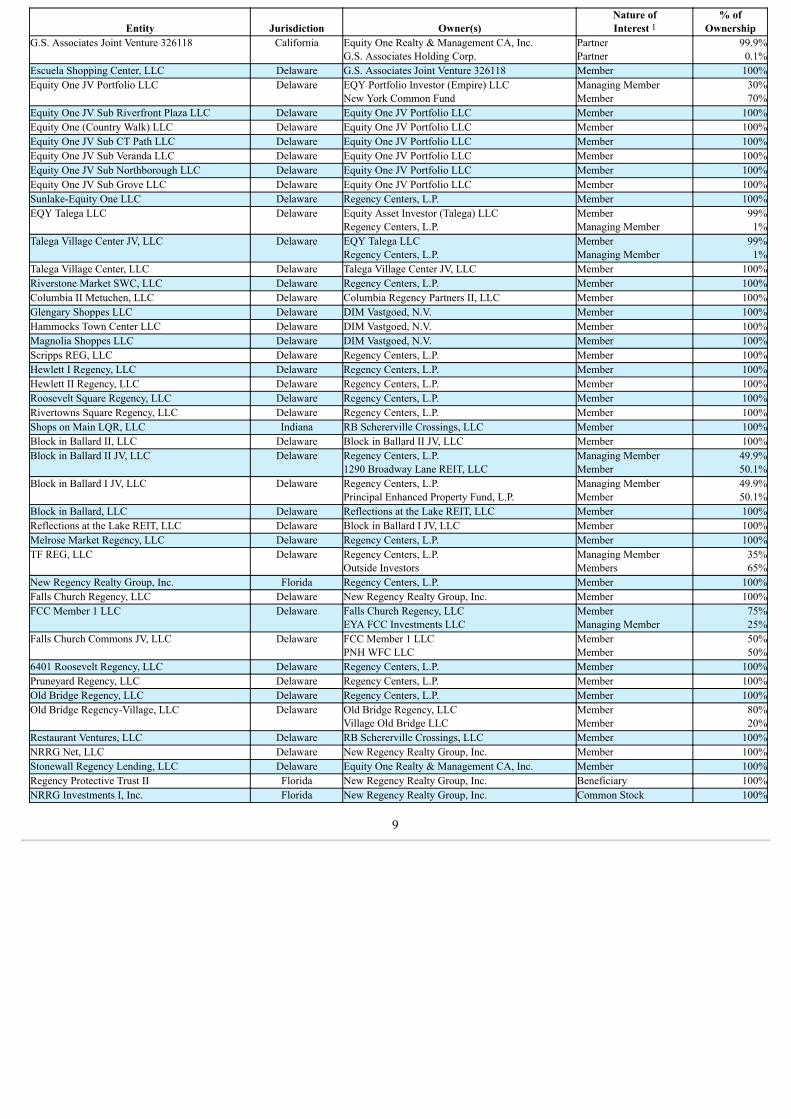
Entity
Jurisdiction
Owner(s)
Nature ofInterest 1
% ofOwnership
G.S. Associates Joint Venture 326118 California Equity One Realty & Management CA, Inc.G.S. Associates Holding Corp.
PartnerPartner
99.9%0.1%
Escuela Shopping Center, LLC Delaware G.S. Associates Joint Venture 326118 Member 100%Equity One JV Portfolio LLC Delaware EQY Portfolio Investor (Empire) LLC
New York Common FundManaging MemberMember
30%70%
Equity One JV Sub Riverfront Plaza LLC Delaware Equity One JV Portfolio LLC Member 100%Equity One (Country Walk) LLC Delaware Equity One JV Portfolio LLC Member 100%Equity One JV Sub CT Path LLC Delaware Equity One JV Portfolio LLC Member 100%Equity One JV Sub Veranda LLC Delaware Equity One JV Portfolio LLC Member 100%Equity One JV Sub Northborough LLC Delaware Equity One JV Portfolio LLC Member 100%Equity One JV Sub Grove LLC Delaware Equity One JV Portfolio LLC Member 100%Sunlake-Equity One LLC Delaware Regency Centers, L.P. Member 100%EQY Talega LLC Delaware Equity Asset Investor (Talega) LLC
Regency Centers, L.P.MemberManaging Member
99%1%
Talega Village Center JV, LLC Delaware EQY Talega LLCRegency Centers, L.P.
MemberManaging Member
99%1%
Talega Village Center, LLC Delaware Talega Village Center JV, LLC Member 100%Riverstone Market SWC, LLC Delaware Regency Centers, L.P. Member 100%Columbia II Metuchen, LLC Delaware Columbia Regency Partners II, LLC Member 100%Glengary Shoppes LLC Delaware DIM Vastgoed, N.V. Member 100%Hammocks Town Center LLC Delaware DIM Vastgoed, N.V. Member 100%Magnolia Shoppes LLC Delaware DIM Vastgoed, N.V. Member 100%Scripps REG, LLC Delaware Regency Centers, L.P. Member 100%Hewlett I Regency, LLC Delaware Regency Centers, L.P. Member 100%Hewlett II Regency, LLC Delaware Regency Centers, L.P. Member 100%Roosevelt Square Regency, LLC Delaware Regency Centers, L.P. Member 100%Rivertowns Square Regency, LLC Delaware Regency Centers, L.P. Member 100%Shops on Main LQR, LLC Indiana RB Schererville Crossings, LLC Member 100%Block in Ballard II, LLC Delaware Block in Ballard II JV, LLC Member 100%Block in Ballard II JV, LLC Delaware Regency Centers, L.P.
1290 Broadway Lane REIT, LLCManaging MemberMember
49.9%50.1%
Block in Ballard I JV, LLC Delaware Regency Centers, L.P.Principal Enhanced Property Fund, L.P.
Managing MemberMember
49.9%50.1%
Block in Ballard, LLC Delaware Reflections at the Lake REIT, LLC Member 100%Reflections at the Lake REIT, LLC Delaware Block in Ballard I JV, LLC Member 100%Melrose Market Regency, LLC Delaware Regency Centers, L.P. Member 100%TF REG, LLC Delaware Regency Centers, L.P.
Outside InvestorsManaging MemberMembers
35%65%
New Regency Realty Group, Inc. Florida Regency Centers, L.P. Member 100%Falls Church Regency, LLC Delaware New Regency Realty Group, Inc. Member 100%FCC Member 1 LLC Delaware Falls Church Regency, LLC
EYA FCC Investments LLCMemberManaging Member
75%25%
Falls Church Commons JV, LLC Delaware FCC Member 1 LLCPNH WFC LLC
MemberMember
50%50%
6401 Roosevelt Regency, LLC Delaware Regency Centers, L.P. Member 100%Pruneyard Regency, LLC Delaware Regency Centers, L.P. Member 100%Old Bridge Regency, LLC Delaware Regency Centers, L.P. Member 100%Old Bridge Regency-Village, LLC Delaware Old Bridge Regency, LLC
Village Old Bridge LLCMemberMember
80%20%
Restaurant Ventures, LLC Delaware RB Schererville Crossings, LLC Member 100%NRRG Net, LLC Delaware New Regency Realty Group, Inc. Member 100%Stonewall Regency Lending, LLC Delaware Equity One Realty & Management CA, Inc. Member 100%Regency Protective Trust II Florida New Regency Realty Group, Inc. Beneficiary 100%NRRG Investments I, Inc. Florida New Regency Realty Group, Inc. Common Stock 100%
9

Entity
Jurisdiction
Owner(s)
Nature ofInterest 1
% ofOwnership
Regency Kensington Bethesda Member, LLC Maryland Regency Centers, L.P.Kensington Bethesda Investor, LLC
MemberMember
50%50%
Regency Kensington Bethesda Owner, LLC Maryland Regency Kensington Bethesda Member, LLC Member 100%Eastfield at Baybrook, LLC Delaware Regency Centers, L.P.
North Eastfield Grocery, LLCMemberMember
50%50%
Eastfield REG, LLC Delaware Regency Centers, L.P. Member 100% (1) Unless otherwise noted, the sole member of all single member limited liability companies is also the managing member or manager of the limited liability company.
10

Exhibit 22
SUBSIDIARY GUARANTORS AND ISSUERS OF GUARANTEED SECURITIES
As of December 31, 2020, Regency Centers Corporation owned approximately 99.6% of the outstanding commonpartnership units of Regency Centers, L.P.
Guaranteed Securities Issuer Guarantor$250 million 3.75% notes due June 15, 2024 Regency Centers, L.P. Regency Centers Corporation$250 million 3.90% notes due November 1,2025
Regency Centers, L.P. Regency Centers Corporation
$100 million 3.81% notes due May 11, 2026 Regency Centers, L.P. Regency Centers Corporation$100 million 3.91% notes due August 11, 2026 Regency Centers, L.P. Regency Centers Corporation$525 million 3.60% notes due February 1, 2027 Regency Centers, L.P. Regency Centers Corporation$300 million 4.125% notes due March 15, 2028 Regency Centers, L.P. Regency Centers Corporation$425 million 2.95% notes due September 15,2029
Regency Centers, L.P. Regency Centers Corporation
$600 million 3.70% notes due June 15, 2030 Regency Centers, L.P. Regency Centers Corporation$425 million 4.40% notes due February 1, 2047 Regency Centers, L.P. Regency Centers Corporation$300 million 4.650% notes due March 15, 2049 Regency Centers, L.P. Regency Centers Corporation
Exhibit 23.1
Consent of Independent Registered Public Accounting Firm
The Board of Directors and PartnersRegency Centers Corporation, andRegency Centers, L.P.:
We consent to the incorporation by reference in the registration statements on Form S-3 ASR (No. 333-237145), Form S-3 (No. 333-125858 and No. 333-202971), and on Form S-8 (No. 333-24971, No.333-55062, No. 333-125857, No. 333-239423, No. 333-231427, No. 333-174662 and No. 333-215241) ofRegency Centers Corporation and on Form S-3 ASR (No. 333-237145-01) of Regency Centers, L.P. of (i) our reports dated February 17, 2021, with respectto the consolidated balance sheets of Regency Centers Corporation as of December 31, 2020 and 2019, the related consolidated statements of operations,comprehensive income, equity, and cash flows for each of the years in the three-year period ended December 31, 2020, and the related notes, (ii) our reportdated February 17, 2021, with respect to the consolidated balance sheets of Regency Centers, L.P. as of December 31, 2020 and 2019, and the relatedconsolidated statements of operations, comprehensive income, capital, and cash flows for each of the years in the three-year period ended December 31,2020, and the related notes, and (iii) the financial statement schedule III – Consolidated Real Estate and Accumulated Depreciation for Regency CentersCorporation and Regency Centers, L.P., (the consolidated Financial Statements) and (iv) our reports on the effectiveness of internal control over financialreporting as of December 31, 2020, for Regency Centers Corporation and Regency Centers L.P., which reports appear in the December 31, 2020, combinedannual report on Form 10-K of Regency Centers Corporation and Regency Centers, L.P.
Our reports on the consolidated Financial Statements refer to a change in the method of accounting for leases.
/s/ KPMG LLP
Jacksonville, FloridaFebruary 17, 2021
Exhibit 31.1
Certification of Chief Executive OfficerPursuant to Section 302 of the Sarbanes-Oxley Act and Rule 13a-14(a)
or 15d-14(a) under the Securities Exchange Act of 1934
I, Lisa Palmer certify that: 1. I have reviewed this Annual Report on Form 10-K of Regency Centers Corporation (“registrant”);
2. Based on my knowledge, this report does not contain any untrue statement of a material fact or omit to state a material fact necessary to make thestatements made, in light of the circumstances under which such statements were made, not misleading with respect to the period covered by thisreport;
3. Based on my knowledge, the financial statements, and other financial information included in this report, fairly present in all material respects thefinancial condition, results of operations and cash flows of the registrant as of, and for, the periods presented in this report;
4. The registrant's other certifying officer and I are responsible for establishing and maintaining disclosure controls and procedures (as defined inExchange Act Rules 13a-15(e) and 15d-15(e)) and internal control over financial reporting (as defined in Exchange Act Rules 13a-15(f) and 15d-15(f)) for the registrant and have:
(a) Designed such disclosure controls and procedures, or caused such disclosure controls and procedures to be designed under oursupervision, to ensure that material information relating to the registrant, including its consolidated subsidiaries, is made known to us byothers within those entities, particularly during the period in which this report is being prepared;
(b) Designed such internal control over financial reporting, or caused such internal control over financial reporting to be designed under oursupervision, to provide reasonable assurance regarding the reliability of financial reporting and the preparation of financial statements forexternal purposes in accordance with generally accepted accounting principles;
(c) Evaluated the effectiveness of the registrant's disclosure controls and procedures and presented in this report our conclusions about theeffectiveness of the disclosure controls and procedures, as of the end of the period covered by this report based on such evaluation; and
(d) Disclosed in this report any change in the registrant's internal control over financial reporting that occurred during the registrant's mostrecent fiscal quarter (the registrant's fourth fiscal quarter in the case of an annual report) that has materially affected, or is reasonably likelyto materially affect, the registrant's internal control over financial reporting; and
5. The registrant's other certifying officer and I have disclosed, based on our most recent evaluation of internal control over financial reporting, to theregistrant's auditors and the audit committee of the registrant's board of directors (or persons performing the equivalent functions):
(a) All significant deficiencies and material weaknesses in the design or operation of internal control over financial reporting which arereasonably likely to adversely affect the registrant's ability to record, process, summarize and report financial information; and
(b) Any fraud, whether or not material, that involves management or other employees who have a significant role in the registrant's internalcontrol over financial reporting.
Date: February 17, 2021 /s/ Lisa PalmerLisa PalmerPresident and Chief Executive Officer

Exhibit 31.2
Certification of Chief Financial OfficerPursuant to Section 302 of the Sarbanes-Oxley Act and Rule 13a-14(a)
or 15d-14(a) under the Securities Exchange Act of 1934
I, Michael J. Mas, certify that: 1. I have reviewed this Annual Report on Form 10-K of Regency Centers Corporation (“registrant”);
2. Based on my knowledge, this report does not contain any untrue statement of a material fact or omit to state a material fact necessary to make thestatements made, in light of the circumstances under which such statements were made, not misleading with respect to the period covered by thisreport;
3. Based on my knowledge, the financial statements, and other financial information included in this report, fairly present in all material respects thefinancial condition, results of operations and cash flows of the registrant as of, and for, the periods presented in this report;
4. The registrant's other certifying officer and I are responsible for establishing and maintaining disclosure controls and procedures (as defined inExchange Act Rules 13a-15(e) and 15d-15(e)) and internal control over financial reporting (as defined in Exchange Act Rules 13a-15(f) and 15d-15(f)) for the registrant and have:
(a) Designed such disclosure controls and procedures, or caused such disclosure controls and procedures to be designed under oursupervision, to ensure that material information relating to the registrant, including its consolidated subsidiaries, is made known to us byothers within those entities, particularly during the period in which this report is being prepared;
(b) Designed such internal control over financial reporting, or caused such internal control over financial reporting to be designed under oursupervision, to provide reasonable assurance regarding the reliability of financial reporting and the preparation of financial statements forexternal purposes in accordance with generally accepted accounting principles;
(c) Evaluated the effectiveness of the registrant's disclosure controls and procedures and presented in this report our conclusions about theeffectiveness of the disclosure controls and procedures, as of the end of the period covered by this report based on such evaluation; and
(d) Disclosed in this report any change in the registrant's internal control over financial reporting that occurred during the registrant's mostrecent fiscal quarter (the registrant's fourth fiscal quarter in the case of an annual report) that has materially affected, or is reasonably likelyto materially affect, the registrant's internal control over financial reporting; and
5. The registrant's other certifying officer and I have disclosed, based on our most recent evaluation of internal control over financial reporting, to theregistrant's auditors and the audit committee of the registrant's board of directors (or persons performing the equivalent functions):
(a) All significant deficiencies and material weaknesses in the design or operation of internal control over financial reporting which arereasonably likely to adversely affect the registrant's ability to record, process, summarize and report financial information; and
(b) Any fraud, whether or not material, that involves management or other employees who have a significant role in the registrant's internalcontrol over financial reporting.
Date: February 17, 2021 /s/ Michael J. MasMichael J. MasExecutive Vice President, Chief FinancialOfficer

Exhibit 31.3
Certification of Chief Executive OfficerPursuant to Section 302 of the Sarbanes-Oxley Act and Rule 13a-14(a)
or 15d-14(a) under the Securities Exchange Act of 1934
I, Lisa Palmer, certify that:
1. I have reviewed this Annual Report on Form 10-K of Regency Centers, L.P. (“registrant”);
2. Based on my knowledge, this report does not contain any untrue statement of a material fact or omit to state a material fact necessary to make thestatements made, in light of the circumstances under which such statements were made, not misleading with respect to the period covered by thisreport;
3. Based on my knowledge, the financial statements, and other financial information included in this report, fairly present in all material respects thefinancial condition, results of operations and cash flows of the registrant as of, and for, the periods presented in this report;
4. The registrant's other certifying officer and I are responsible for establishing and maintaining disclosure controls and procedures (as defined inExchange Act Rules 13a-15(e) and 15d-15(e)) and internal control over financial reporting (as defined in Exchange Act Rules 13a-15(f) and 15d-15(f)) for the registrant and have:
(a) Designed such disclosure controls and procedures, or caused such disclosure controls and procedures to be designed under oursupervision, to ensure that material information relating to the registrant, including its consolidated subsidiaries, is made known to us byothers within those entities, particularly during the period in which this report is being prepared;
(b) Designed such internal control over financial reporting, or caused such internal control over financial reporting to be designed under oursupervision, to provide reasonable assurance regarding the reliability of financial reporting and the preparation of financial statements forexternal purposes in accordance with generally accepted accounting principles;
(c) Evaluated the effectiveness of the registrant's disclosure controls and procedures and presented in this report our conclusions about theeffectiveness of the disclosure controls and procedures, as of the end of the period covered by this report based on such evaluation; and
(d) Disclosed in this report any change in the registrant's internal control over financial reporting that occurred during the registrant's mostrecent fiscal quarter (the registrant's fourth fiscal quarter in the case of an annual report) that has materially affected, or is reasonably likelyto materially affect, the registrant's internal control over financial reporting; and
5. The registrant's other certifying officer and I have disclosed, based on our most recent evaluation of internal control over financial reporting, to theregistrant's auditors and the audit committee of the registrant's board of directors (or persons performing the equivalent functions):
(a) All significant deficiencies and material weaknesses in the design or operation of internal control over financial reporting which arereasonably likely to adversely affect the registrant's ability to record, process, summarize and report financial information; and
(b) Any fraud, whether or not material, that involves management or other employees who have a significant role in the registrant's internalcontrol over financial reporting.
Date: February 17, 2021 /s/ Lisa PalmerLisa PalmerPresident and Chief Executive Officer ofRegency Centers Corporation, generalpartner of registrant
Exhibit 31.4
Certification of Chief Financial OfficerPursuant to Section 302 of the Sarbanes-Oxley Act and Rule 13a-14(a)
or 15d-14(a) under the Securities Exchange Act of 1934
I, Michael J. Mas, certify that:
1. I have reviewed this Annual Report on Form 10-K of Regency Centers, L.P. (“registrant”);
2. Based on my knowledge, this report does not contain any untrue statement of a material fact or omit to state a material fact necessary to make thestatements made, in light of the circumstances under which such statements were made, not misleading with respect to the period covered by thisreport;
3. Based on my knowledge, the financial statements, and other financial information included in this report, fairly present in all material respects thefinancial condition, results of operations and cash flows of the registrant as of, and for, the periods presented in this report;
4. The registrant's other certifying officer and I are responsible for establishing and maintaining disclosure controls and procedures (as defined inExchange Act Rules 13a-15(e) and 15d-15(e)) and internal control over financial reporting (as defined in Exchange Act Rules 13a-15(f) and 15d-15(f)) for the registrant and have:
(a) Designed such disclosure controls and procedures, or caused such disclosure controls and procedures to be designed under oursupervision, to ensure that material information relating to the registrant, including its consolidated subsidiaries, is made known to us byothers within those entities, particularly during the period in which this report is being prepared;
(b) Designed such internal control over financial reporting, or caused such internal control over financial reporting to be designed under oursupervision, to provide reasonable assurance regarding the reliability of financial reporting and the preparation of financial statements forexternal purposes in accordance with generally accepted accounting principles;
(c) Evaluated the effectiveness of the registrant's disclosure controls and procedures and presented in this report our conclusions about theeffectiveness of the disclosure controls and procedures, as of the end of the period covered by this report based on such evaluation; and
(d) Disclosed in this report any change in the registrant's internal control over financial reporting that occurred during the registrant's mostrecent fiscal quarter (the registrant's fourth fiscal quarter in the case of an annual report) that has materially affected, or is reasonably likelyto materially affect, the registrant's internal control over financial reporting; and
5. The registrant's other certifying officer and I have disclosed, based on our most recent evaluation of internal control over financial reporting, to theregistrant's auditors and the audit committee of the registrant's board of directors (or persons performing the equivalent functions):
(a) All significant deficiencies and material weaknesses in the design or operation of internal control over financial reporting which arereasonably likely to adversely affect the registrant's ability to record, process, summarize and report financial information; and
(b) Any fraud, whether or not material, that involves management or other employees who have a significant role in the registrant's internalcontrol over financial reporting.
Date: February 17, 2021 /s/ Michael J. MasMichael J. MasExecutive Vice President, Chief FinancialOfficer of Regency Centers Corporation,general partner of registrant

Exhibit 32.1
Written Statement of the Chief Executive OfficerPursuant to 18 U.S.C. §1350
Solely for the purposes of complying with 18 U.S.C. §1350, I, the undersigned Chief Executive Officer of Regency Centers Corporation , hereby certify,based on my knowledge , that the Annual Report on Form 10-K of Regency Centers Corporation for the year ended December 31, 2020 (the “Report”)fully complies with the requirements of Section 13(a) of the Securities Exchange Act of 1934 and that information contained in the Report fairly presents,in all material respects, the financial condition and results of operations of Regency Centers Corporation.
Date: February 17, 2021 /s/ Lisa PalmerLisa PalmerPresident and Chief Executive Officer

Exhibit 32.2
Written Statement of the Chief Financial OfficerPursuant to 18 U.S.C. §1350
Solely for the purposes of complying with 18 U.S.C. §1350, I, the undersigned Chief Financial Officer of Regency Centers Corporation , hereby certify,based on my knowledge , that the Annual Report on Form 10-K of Regency Centers Corporation for the year ended December 31, 2020 (the “Report”)fully complies with the requirements of Section 13(a) of the Securities Exchange Act of 1934 and that information contained in the Report fairly presents,in all material respects, the financial condition and results of operations of Regency Centers Corporation.
Date: February 17, 2021 /s/ Michael J. MasMichael J. MasExecutive Vice President, Chief Financial Officer

Exhibit 32.3
Written Statement of the Chief Executive OfficerPursuant to 18 U.S.C. §1350
Solely for the purposes of complying with 18 U.S.C. §1350, I, the undersigned Chief Executive Officer of Regency Centers, L.P. , hereby certify, based onmy knowledge , that the Annual Report on Form 10-K of Regency Centers, L.P. for the year ended December 31, 2020 (the “Report”) fully complies withthe requirements of Section 13(a) of the Securities Exchange Act of 1934 and that information contained in the Report fairly presents, in all materialrespects, the financial condition and results of operations of Regency Centers, L.P.
Date: February 17, 2021 /s/ Lisa PalmerLisa PalmerPresident and Chief Executive Officer of Regency CentersCorporation, general partner of registrant

Exhibit 32.4
Written Statement of the Chief Financial OfficerPursuant to 18 U.S.C. §1350
Solely for the purposes of complying with 18 U.S.C. §1350, I, the undersigned Chief Financial Officer of Regency Centers, L.P. , hereby certify, based onmy knowledge , that the Annual Report on Form 10-K of Regency Centers, L.P. for the year ended December 31, 2020 (the “Report”) fully complies withthe requirements of Section 13(a) of the Securities Exchange Act of 1934 and that information contained in the Report fairly presents, in all materialrespects, the financial condition and results of operations of Regency Centers, L.P.
Date: February 17, 2021 /s/ Michael J. MasMichael J. MasExecutive Vice President, Chief Financial Officer of RegencyCenters Corporation, general partner of registrant