Embed Size (px)
Citation preview
o
Remove water
R E P O R T
BOWDENS SILVER PTY LIMITED Bowdens Silver Project Lue, N.S.W. Tailings Storage Facility Preliminary Design May 2020 116217.01 R02 Rev5
R E P O R T

ATC Williams Pty Ltd ABN 64 005 931 288 Melbourne T: +61 3 8587 0900 Perth T: +61 8 9213 1600 Brisbane T: +617 3352 7222 www.atcwilliams.com.au
Document History and Status
Title: Tailings Storage Facility Feasibility Study
Job Number/Extension 116217.01
Document Number: 116217.01R02Rev5
Project Office: Melbourne
File Path: K:\Projects\116\116217 Bowdens Silver Project, Bowdens Silver Pty Limited\Reports\116217.01 R02\116217.01R02Rev4\116217.01R02Rev4.docx
Author: Heather Wardlaw
Reviewer: Keith Seddon
Job Manager: Heather Wardlaw
This Revision distributed To: Hard Copy Electronic Copy
[Client]
ATCW Melbourne Office On network
Copy ______ of _______ __________________ ________________ HEATHER WARDLAW KEITH SEDDON Author Reviewer
Rev. Status Issued to Issue Date Signatures
Author Reviewer
A Draft Issue Anthony McClure 9 May 2018 HW KDS
0 Final Anthony McClure 25 October 2018 HW KDS
1 Rev1 Anthony McClure 29 October 2018 HW KDS
2 Rev 2 Anthony McClure 9 September 2019 HW KDS
3 Rev 3 Anthony McClure 29 November 2019 HW KDS
4 Rev 4 Anthony McClure 6 December 2019 HW KDS
5 Rev 5 Anthony McClure 12 May 2020 HW KDS
IMPORTANT NOTICE
Please refer to our Conditions of Investigation and Report

ATC Williams Pty Ltd ABN 64 005 931 288 Melbourne T: +61 3 8587 0900 Perth T: +61 8 9213 1600 Brisbane T: +617 3352 7222 www.atcwilliams.com.au
CONDITIONS OF INVESTIGATION AND REPORT
Conditions of Report
1. This report has been prepared by us for the purposes stated herein. We do not accept responsibility for the consequences of extrapolation, extension or transference of the findings and recommendations of this report to different sites, cases or conditions.
2. This report is based in part on information which
was provided to us by the client and/or others as outlined in the report and which is not under our control. We do not warrant or guarantee the accuracy of this information.
3. We believe the conclusions and recommendations
contained herein were reasonable and appropriate at the time of issue of the report. However, the user is cautioned that fundamental input assumptions upon which this report is based may change with time. It is the user’s responsibility to ensure that input assumptions remain valid.
4. This report must be read in its entirety. This
notice constitutes an integral part of the report, and must be reproduced with every copy.
5. This report is prepared solely for the use of the
person or company to whom it is addressed. No responsibility or liability to any third party is accepted for any damages howsoever arising out of the use of this report by any third party.
6. Unless specifically agreed otherwise in the
contract of engagement, ATC Williams retains Intellectual Property Rights over the contents of this report. The client is granted a licence to use the report for the purposes for which it was commissioned.
Geotechnical Investigation
7. Geotechnical site investigation necessarily
involves the investigation of the subsurface conditions at a site at a few isolated locations, and the interpretation and extrapolation of those conditions to elsewhere on the site not so investigated. This procedure has been adopted at the site that is the subject of this report and due care and skill has been applied in carrying out and reporting on the work. Thus the findings, conclusions and comments contained in this report represent professional estimates and opinions and are not to be read as facts unless the context makes it clear to the contrary. In general, statements of fact are confined to statements as to what was done and/or what was observed. Other statements have been based on professional judgement.
8. The scope of the work has been planned in the
absence of any fore-knowledge of the site other than that stated in the report. Unless otherwise stated we consider that the number of locations investigated and the depths to which they have been investigated are reasonable bearing in mind the scale and nature of the project, and the defined purpose for which the investigation was undertaken.
9. We do not accept any responsibility for any
variance between the interpreted and extrapolated conditions and those that are revealed by any means subsequently. Specific warning is also given that many factors, either natural or artificial, may render ground conditions different from those which pertained at the time of the investigation. Should there be revealed during the construction or at any other time any apparent difference from subsurface conditions described or assessed in this report, it is strongly recommended that such differences be brought to our attention so that its significance may be assessed and appropriate advice given.
iv
TABLE OF CONTENTS
EXECUTIVE SUMMARY ........................................................................................... IX
1 INTRODUCTION ............................................................................................ 1
2 PROJECT BACKGROUND .................................................................................. 1 2.1 General ............................................................................................. 1 2.2 Option Study ....................................................................................... 1 2.3 Scope of Study .................................................................................... 1
3 SITE CONDITIONS ......................................................................................... 2 3.1 Site Description ................................................................................... 2 3.2 Regional Geology.................................................................................. 2
4 START-UP SCHEDULE ..................................................................................... 2
5 GEOTECHNICAL INVESTIGATION ........................................................................ 2 5.1 General ............................................................................................. 2 5.2 Fieldwork .......................................................................................... 2 5.3 Subsurface Conditions TSF ....................................................................... 3 5.4 Foundation Permeability ......................................................................... 3 5.5 Groundwater....................................................................................... 4 5.6 Construction Materials ........................................................................... 4
5.6.1 Clay ......................................................................................... 4 5.6.2 Rockfill ...................................................................................... 4
6 TAILINGS TESTING ........................................................................................ 4
7 TAILINGS TONNAGE AND DEPOSITION RATE ........................................................... 5
8 DENSITY .................................................................................................... 5
9 DESIGN STANDARDS ...................................................................................... 6
10 DESIGN PHILOSOPHY ..................................................................................... 6
11 CONSEQUENCE CATEGORY .............................................................................. 6
12 DESIGN CRITERIA.......................................................................................... 7 12.1 Introduction ....................................................................................... 7 12.2 Storm Storage ..................................................................................... 7 12.3 Emergency Spillway Design ...................................................................... 7 12.4 Seismic Analysis for Embankment Stability ................................................... 7 12.5 Embankment Stability Factors of Safety ...................................................... 8 12.6 EPA Liner Guidelines ............................................................................. 8

v
13 BEACHING PROFILE DETERMINATION ................................................................... 8 13.1 Tailings Beach Slope Prediction................................................................. 8 13.2 Tailings Discharge Rate .......................................................................... 9 13.3 Prediction Criteria ................................................................................ 9 13.4 Methodology ....................................................................................... 9 13.5 Results of Prediction ........................................................................... 10
14 TAILINGS DEPOSITION STAGING ...................................................................... 11 14.1 Timing ............................................................................................ 11 14.2 TSF Layouts ...................................................................................... 11 14.3 TSF Filling curves ............................................................................... 11
15 TAILINGS DEPOSITION AND LINER REQUIREMENTS ................................................. 12 15.1 General ........................................................................................... 12 15.2 Liner Requirements ............................................................................. 12
16 CONSOLIDATION MODELLING FOR EPA PERMEABILITY EVALUATION ............................. 12 16.1 General ........................................................................................... 12 16.2 Initial Conditions ................................................................................ 12 16.5 Rate of Rise ...................................................................................... 14
17 IMPOUNDMENT LINER DESIGN ......................................................................... 15 17.1 General ........................................................................................... 15 17.2 EPA Benchmark Seepage ....................................................................... 15 17.3 Seepage through the tailings and proposed liner .......................................... 16
17.3.1General ................................................................................... 16 17.3.2Tailings and Clay Liner Properties .................................................... 16 17.3.3Liner Seepage Analysis and Results ................................................... 17
17.4 Impoundment Liner Design .................................................................... 17
18 WATER MANAGEMENT .................................................................................. 18 18.1 General ........................................................................................... 18 18.2 Storm Event Data ............................................................................... 18 18.3 TSF Decant Pond Elevation Results ........................................................... 18
19 STORM STORAGE ........................................................................................ 19 19.1 General ........................................................................................... 19 19.2 Design Storm Storage Allowances ............................................................ 19
20 SPILLWAY DESIGN ....................................................................................... 20
21 EMBANKMENT DETAILS ................................................................................. 20
22 EMBANKMENT DESIGN AND MATERIALS .............................................................. 21 22.1 General ........................................................................................... 21 22.2 Construction Materials ......................................................................... 21 22.3 Foundations ...................................................................................... 23
23 SEEPAGE ................................................................................................. 24 23.1 TSF Foundation Seepage Treatment ......................................................... 24
vi
23.2 Seepage Modelling and Analysis .............................................................. 24 23.3 Seepage Analysis Results and Discussion .................................................... 25
24 STABILITY ANALYSIS .................................................................................... 26 24.1 Overview ......................................................................................... 26 24.2 Loading Cases ................................................................................... 26 24.3 Seismicity Parameters .......................................................................... 27 24.4 Pseudo-Static Stability Methodology ......................................................... 27 24.5 Material Properties ............................................................................. 28 24.6 Phreatic Surface ................................................................................ 29 24.7 Stability Analysis Results....................................................................... 29
24.7.1Design Criteria ........................................................................... 29 24.7.2Results of Analysis ...................................................................... 29
25 SURVEILLANCE AND MONITORING .................................................................... 30
26 DESIGN FOR CLOSURE .................................................................................. 31
27 QUANTITIES .............................................................................................. 32
28 SUMMARY AND CONCLUSIONS ......................................................................... 33
29 RECOMMENDATIONS .................................................................................... 33
30 CLOSURE ................................................................................................. 33

vii
FIGURES
Figure 1 Site Plan Figure 2 Preliminary Geotechnical Investigation Plan Figure 3 TSF Groundwater Monitoring at TSF Figure 4 Stage 1 Plan Figure 5 Stage 2 Plan Figure 6 Stage 3 Plan Figure 7 TSF Tailings Filling Curve Figure 8 Consolidation Modelling - Rowe Cell Tailings Compressibility and Permeability Figure 9 Consolidation Modelling - Tailings Depth versus Time Figure 10 Consolidation Modelling - Dry Density and Permeability Profiles Figure 11 Consolidation Modelling - Excess and Total Pore Water Pressure Profiles Figure 12 Expected Impoundment Liner Seepage Rates Figure 13 TSF Decant Pond Storage Capacity Figure 14 Typical Embankment Section Figure 15 Typical Seepage Collection Section Figure 16 Embankment Layout Plan and Foundation Preparation Figure 17 Typical Monitoring Plan Figure 18 Monitoring Section
APPENDICES
Appendix A Stability Results Appendix B Seepage Results Appendix C Schedule of Quantities
viii
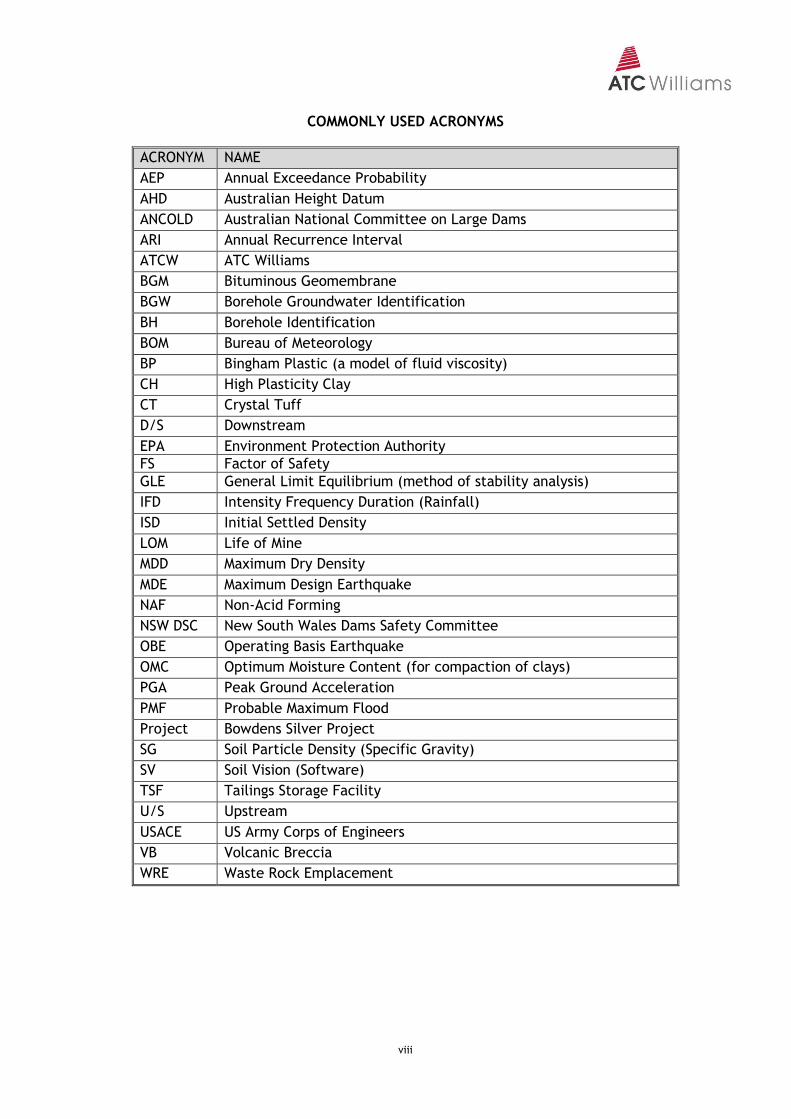
COMMONLY USED ACRONYMS
ACRONYM NAME
AEP Annual Exceedance Probability
AHD Australian Height Datum
ANCOLD Australian National Committee on Large Dams
ARI Annual Recurrence Interval
ATCW ATC Williams
BGM Bituminous Geomembrane
BGW Borehole Groundwater Identification
BH Borehole Identification
BOM Bureau of Meteorology
BP Bingham Plastic (a model of fluid viscosity)
CH High Plasticity Clay
CT Crystal Tuff
D/S Downstream
EPA Environment Protection Authority
FS Factor of Safety
GLE General Limit Equilibrium (method of stability analysis)
IFD Intensity Frequency Duration (Rainfall)
ISD Initial Settled Density
LOM Life of Mine
MDD Maximum Dry Density
MDE Maximum Design Earthquake
NAF Non-Acid Forming
NSW DSC New South Wales Dams Safety Committee
OBE Operating Basis Earthquake
OMC Optimum Moisture Content (for compaction of clays)
PGA Peak Ground Acceleration
PMF Probable Maximum Flood
Project Bowdens Silver Project
SG Soil Particle Density (Specific Gravity)
SV Soil Vision (Software)
TSF Tailings Storage Facility
U/S Upstream
USACE US Army Corps of Engineers
VB Volcanic Breccia
WRE Waste Rock Emplacement
ix
EXECUTIVE SUMMARY
The Project
The Bowdens Silver Project (Project) comprises an open cut Silver Mine on a greenfield site located
2 km to 3 km north-east of Lue. The distance between Lue and the edge of the main open cut pit
is approximately 2.8 km. The closest point of the TSF embankment to Lue is 2km, however, a
substantial ridge is present between the TSF and Lue. The TSF is located in a valley that has its
confluence with Lawsons Creek downstream of Lue and approximately 26 km south-east of Mudgee
in NSW.
The Project would have an operational life of approximately 15 years, with a total dry tonnage of
approximately 30 Mt and a throughput of 2 Mtpa.
Tailings Storage Facility
The Tailings Storage Facility (TSF) for the Project has been designed on the philosophy of a down valley tailings discharge TSF for its practicality and as a cost-effective solution. As the decant pond on the tailings is at the embankment, the embankment has been designed to be a full water retaining structure with both an operating pond of water and tailings against the embankment. The embankment is to be constructed in three stages; the two raises adopt the downstream raise method.
After consideration of three options, the TSF is to be located to the west of the main open cut pit
and processing plant. The embankment for this TSF option lies across the valley of an intermittent
watercourse. Thickened tailings are to be discharged from the head of three valleys forming the
upper portion of the TSF impoundment. The decant pond would form against the embankment at
the south-west side of the TSF. The catchment for the TSF is relatively small at approximately 3.0
km2 with the impounded tailings taking up approximately 1.0 km2 of this area.
As the Project is a greenfield project, the derivation of suitable parameters for this feasibility study
has been based on limited data, and accordingly further studies and testing would be carried out
during detailed design. Following the assessment of two tailings samples (Ignimbrite and Crystal
Tuff (CT)) the CT was adopted to provide the best representation of the tailings to be discharged
into the TSF. The tailings characterisation test work showed that this material is a low plasticity
clay with a particle density of 2.7 t/m3. Later in the design process further test work was carried
out on a Volcanic Breccia (VB) manufactured tailings sample to provide further parameters for a
more detailed design of the impoundment clay liner and an estimate of the seepage beneath the
TSF embankment. The test work on the CT showed that a high-rate thickener would deliver tailings
with a solids concentration in the order of 56% solids. Testing by Graeme Campbell & Associates
(2019) indicated that the tailings would be potentially acid generating.
At the start of deposition, when the rate of rise of the tailings is high, an in-situ density of around
1.35 t/m3 has been estimated. The overall consolidated density of the tailings at the LOM has been
estimated at 1.5 t/m3.
Tailings Beach Slope
The tailings beach slope varies with the number of tailings discharge points as well as other
parameters such as solids content, rheology and discharge rates. Based on experience, the beach
slope would be concave, and the main tailings beach would divide into four parts; upper, middle,
lower and runout. For the start of deposition, assuming a consistent rate of deposition, it is
expected one effective tailings stream would be maintained and the beach slopes are estimated to
x
vary from upper, middle and lower as 1.4 %, 1.0 % and 0.7 % respectively with a run-out of 0.2%.
Considering two tailings streams later in the LOM, the later slopes are estimated to be 1.8%, 1.35%
and 1.0% with a runout of 0.7%.
TSF Embankment
The 56 m maximum height TSF embankment would mainly comprise a combination of rock and
earthfill and would be constructed in three stages. The embankment would include a low
permeability Bituminous Geomembrane (BGM) Liner fitted to the upstream face, a zone of curtain
grouting of the foundations along the upstream toe of the embankment to a nominal depth of 40 m
and a concrete plinth connecting the BGM to the foundation grouting also along the upstream toe
of the embankment.
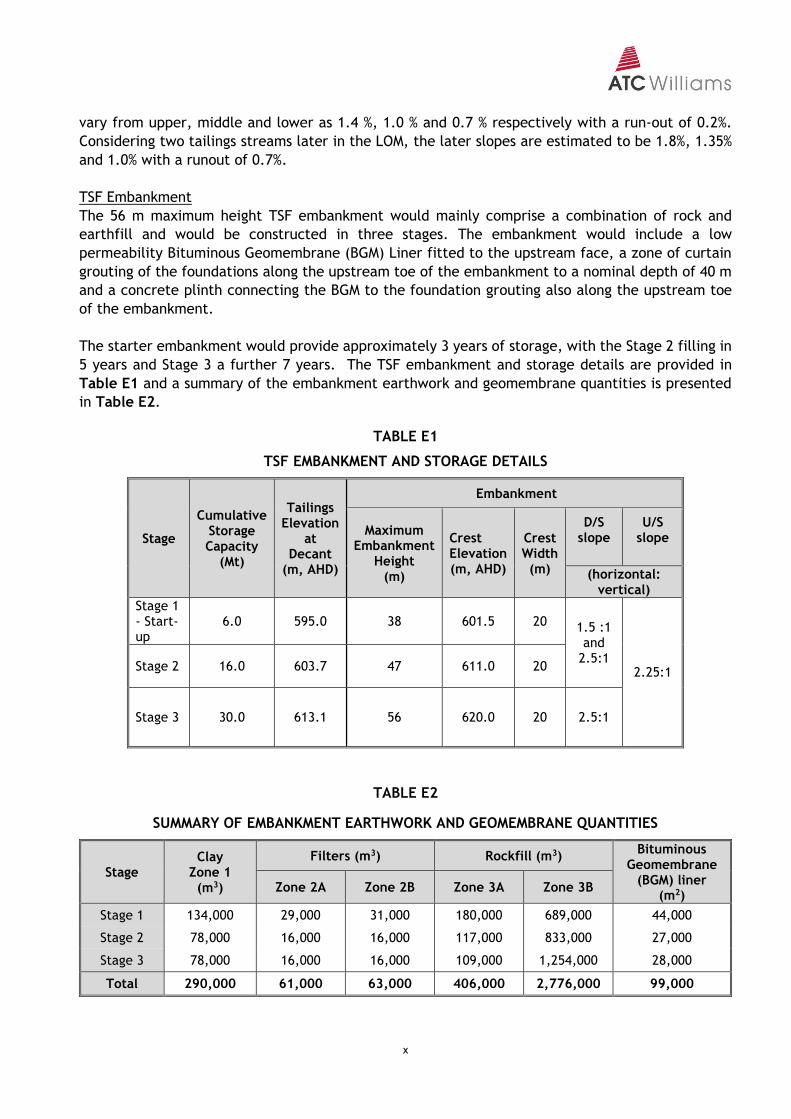
The starter embankment would provide approximately 3 years of storage, with the Stage 2 filling in
5 years and Stage 3 a further 7 years. The TSF embankment and storage details are provided in
Table E1 and a summary of the embankment earthwork and geomembrane quantities is presented
in Table E2.
TABLE E1
TSF EMBANKMENT AND STORAGE DETAILS
Stage
Cumulative Storage Capacity
(Mt)
Tailings Elevation
at Decant
(m, AHD)
Embankment
Maximum Embankment
Height (m)
Crest Elevation (m, AHD)
Crest Width (m)
D/S slope
U/S slope
(horizontal: vertical)
Stage 1 - Start-up
6.0 595.0 38 601.5 20 1.5 :1 and
2.5:1 2.25:1 Stage 2 16.0 603.7 47 611.0 20
Stage 3 30.0
613.1
56 620.0 20 2.5:1
TABLE E2
SUMMARY OF EMBANKMENT EARTHWORK AND GEOMEMBRANE QUANTITIES
Stage Clay
Zone 1 (m3)
Filters (m3) Rockfill (m3) Bituminous
Geomembrane (BGM) liner
(m2) Zone 2A Zone 2B Zone 3A Zone 3B
Stage 1 134,000 29,000 31,000 180,000 689,000 44,000
Stage 2 78,000 16,000 16,000 117,000 833,000 27,000
Stage 3 78,000 16,000 16,000 109,000 1,254,000 28,000
Total 290,000 61,000 63,000 406,000 2,776,000 99,000

xi
Consequence Category
Based on the potential for acid generation and as the TSF is located in a rural environment, the TSF
has been assessed at a Consequence Category of “High C” in accordance with the NSW Dam Safety
Committee Tailings Dam Guidelines.
The embankment crest level has been designed on the basis of a Consequence Category of High C
to contain the expected pond levels obtained from the water balance together with wave run-up
and additional contingency freeboard.
The emergency spillway has been designed for the High C Consequence Category with a 1 in 100,000
AEP for the critical flow.
Decant Pond and Return Water
The decant water accumulating within the TSF would be utilised for processing, with water returned
via a pontoon-mounted pumping station installed within the TSF.
The water balance shows the decant pond level (with a 99% probability of non-exceedance) provides
a volume of around 1.3 Mm3 towards the end of Stage 1, 1.4 Mm3 towards the end of Stage 2 and
1.5 Mm3 two years before the end of LOM. All these volumes are less than the storage capacity of
the decant on the tailings at each stage. The Stage 3 also allows for the storm storage, plus
allowances for wave run-up and additional freeboard based on the ANCOLD guidelines (2012) on top
of the expected maximum operating pond (with 50% probability of non-exceedance) for Stage 3.
The decant pond is however not expected to have capacity to supply all the water required for the
processing plant.
Seepage Management
Within the TSF impoundment, seepage management includes foundation treatment to reduce
seepage within the area below the maximum inundation level. This includes using in-situ clay where
the existing thickness is more than 0.5 m or importing and placing clay where the existing thickness
is less than 0.45 m thick, so as to achieve a compacted clay liner of a minimum depth of 0.45 m.
There would be no additional clay placed outside the area of the maximum inundation level, with
the in-situ clay considered to be adequate.
At the TSF embankment, seepage is constrained by a reinforced Bituminous Geomembrane (BGM)
Liner fitted to the upstream face, a concrete plinth connecting to the nominal 40 m deep foundation
curtain grouting along the upstream toe, as well as a drainage system in the downstream foundation
area of the embankment, draining to a seepage collection system at the embankment downstream
toe. Steady state seepage at the end of LOM is estimated to be less than 3 L/sec. This would be
collected by the seepage collection system, drained to the seepage collection ponds and
subsequently pumped back to the TSF. Further work will be carried out to confirm the assumptions
made in this system during detailed design.
A contingency has been allowed for further foundation treatment and an underdrainage (seepage
interception) system in the area up to 150 m upstream of the embankment beneath the area of the
operating pond. Further work will be carried out to assess the merits of the underdrainage system
during detailed design.

xii
Performance Monitoring
Instrumentation would be installed to monitor groundwater pressures and levels, groundwater
quality, seepage volumes and embankment settlements, along with the routine recording of tailings
discharge tonnages, decant pond levels, and return water volumes.
Seepage monitoring would be undertaken using a combination of vibrating wire piezometers to
measure the pressure gradient across the grout curtain beneath the embankment and standpipes to
allow the collection of water quality samples beyond the seepage collection ponds. Settlement
monitors would also be installed during each raise of the embankment.
Seepage monitoring would be undertaken on a weekly basis along with a record of tailings discharge
tonnages, return water volumes from the seepage pond and the decant as well as water levels on
the tailings and in the seepage collection ponds. Settlement monitors would be surveyed once a
month.
Regular inspections would be made of the TSF facility and an annual audit would be carried out by
a Dams Engineer. Every second year, the audit by the Dams Engineer would be comprehensive
commencing one year after the start of filling.
Closure and Rehabilitation
Closure and rehabilitation studies have been undertaken separately. Generally, the rehabilitation would likely consist of a low flux store and release cover over the tailings. To achieve a self-shedding profile, the final deposition of the tailings would be modified to shift the low point towards the final spillway location. For closure, the spillway invert would be lowered to match the top of the cover. Any material cut from the closure spillway would be used for rehabilitation works such as flattening the embankment or for cover. The closure spillway will be designed for the Probable Maximum Flood (PMF), with suitable erosion protection and energy dissipators. Once tailings deposition ceases and the decant water is removed it is expected that the quantity of seepage would reduce, and the quality would improve. Seepage would be pumped back to a small lined pond on the TSF and then the main open cut pit until the quality has improved to acceptable levels It is expected that the TSF embankment would be flattened in sections on the downstream slope and both this slope and the covered tailings would be revegetated to reduce the potential for erosion.
12 May 2020 Page 1 of 37 116217.01R02Rev5finaltext
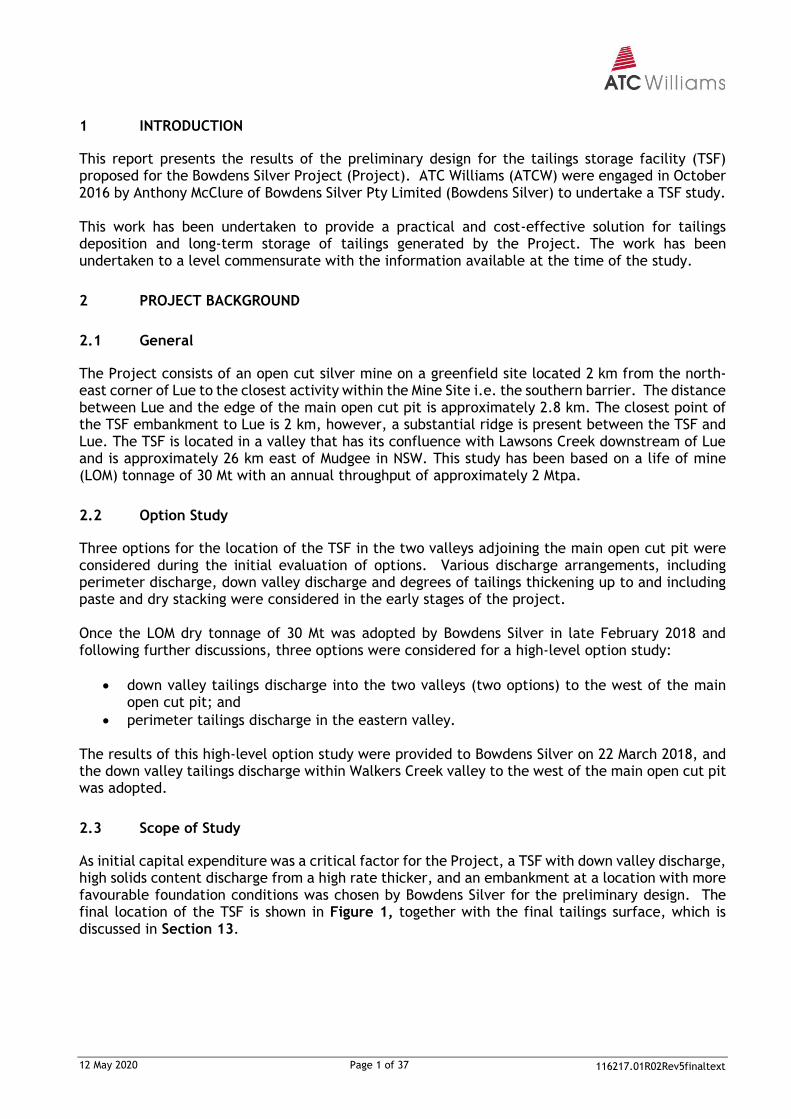
1 INTRODUCTION
This report presents the results of the preliminary design for the tailings storage facility (TSF) proposed for the Bowdens Silver Project (Project). ATC Williams (ATCW) were engaged in October 2016 by Anthony McClure of Bowdens Silver Pty Limited (Bowdens Silver) to undertake a TSF study. This work has been undertaken to provide a practical and cost-effective solution for tailings deposition and long-term storage of tailings generated by the Project. The work has been undertaken to a level commensurate with the information available at the time of the study.
2 PROJECT BACKGROUND
2.1 General
The Project consists of an open cut silver mine on a greenfield site located 2 km from the north-east corner of Lue to the closest activity within the Mine Site i.e. the southern barrier. The distance between Lue and the edge of the main open cut pit is approximately 2.8 km. The closest point of the TSF embankment to Lue is 2 km, however, a substantial ridge is present between the TSF and Lue. The TSF is located in a valley that has its confluence with Lawsons Creek downstream of Lue and is approximately 26 km east of Mudgee in NSW. This study has been based on a life of mine (LOM) tonnage of 30 Mt with an annual throughput of approximately 2 Mtpa.
2.2 Option Study
Three options for the location of the TSF in the two valleys adjoining the main open cut pit were considered during the initial evaluation of options. Various discharge arrangements, including perimeter discharge, down valley discharge and degrees of tailings thickening up to and including paste and dry stacking were considered in the early stages of the project. Once the LOM dry tonnage of 30 Mt was adopted by Bowdens Silver in late February 2018 and following further discussions, three options were considered for a high-level option study:
• down valley tailings discharge into the two valleys (two options) to the west of the main open cut pit; and
• perimeter tailings discharge in the eastern valley. The results of this high-level option study were provided to Bowdens Silver on 22 March 2018, and the down valley tailings discharge within Walkers Creek valley to the west of the main open cut pit was adopted.
2.3 Scope of Study
As initial capital expenditure was a critical factor for the Project, a TSF with down valley discharge, high solids content discharge from a high rate thicker, and an embankment at a location with more favourable foundation conditions was chosen by Bowdens Silver for the preliminary design. The final location of the TSF is shown in Figure 1, together with the final tailings surface, which is discussed in Section 13.
12 May 2020 Page 2 of 37 116217.01R02Rev5finaltext
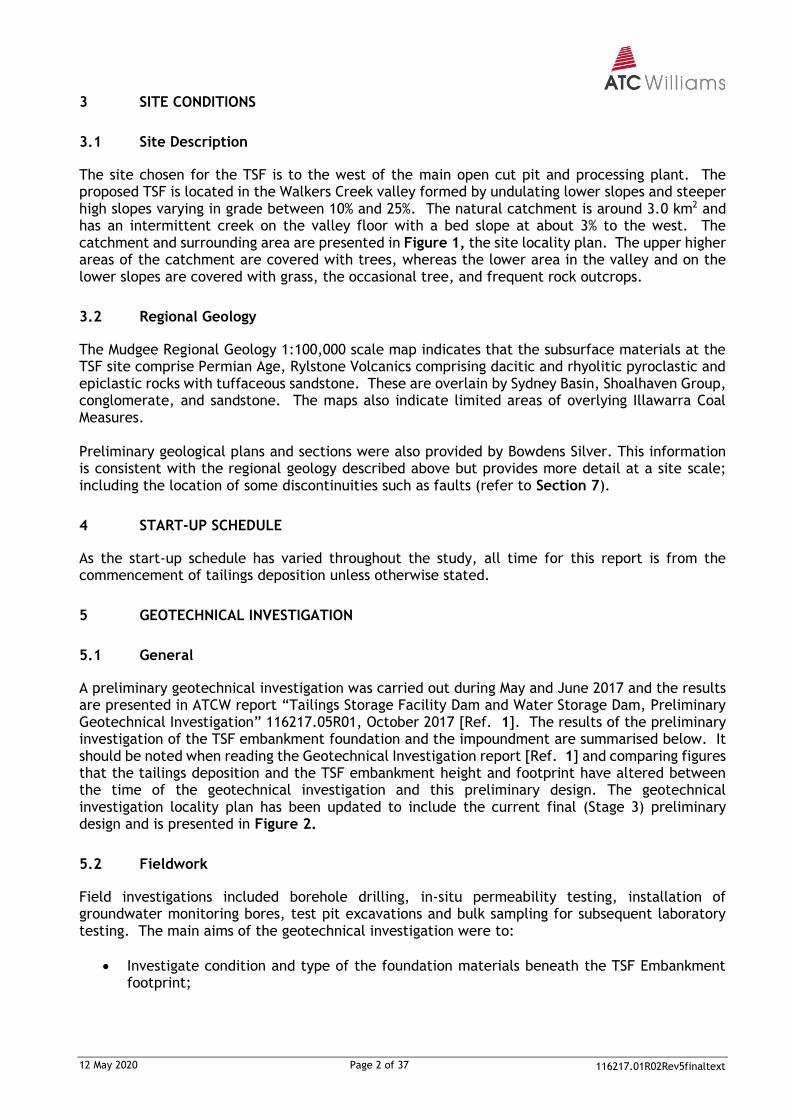
3 SITE CONDITIONS
3.1 Site Description
The site chosen for the TSF is to the west of the main open cut pit and processing plant. The proposed TSF is located in the Walkers Creek valley formed by undulating lower slopes and steeper high slopes varying in grade between 10% and 25%. The natural catchment is around 3.0 km2 and has an intermittent creek on the valley floor with a bed slope at about 3% to the west. The catchment and surrounding area are presented in Figure 1, the site locality plan. The upper higher areas of the catchment are covered with trees, whereas the lower area in the valley and on the lower slopes are covered with grass, the occasional tree, and frequent rock outcrops.
3.2 Regional Geology
The Mudgee Regional Geology 1:100,000 scale map indicates that the subsurface materials at the TSF site comprise Permian Age, Rylstone Volcanics comprising dacitic and rhyolitic pyroclastic and epiclastic rocks with tuffaceous sandstone. These are overlain by Sydney Basin, Shoalhaven Group, conglomerate, and sandstone. The maps also indicate limited areas of overlying Illawarra Coal Measures. Preliminary geological plans and sections were also provided by Bowdens Silver. This information is consistent with the regional geology described above but provides more detail at a site scale; including the location of some discontinuities such as faults (refer to Section 7).
4 START-UP SCHEDULE
As the start-up schedule has varied throughout the study, all time for this report is from the commencement of tailings deposition unless otherwise stated.
5 GEOTECHNICAL INVESTIGATION
5.1 General
A preliminary geotechnical investigation was carried out during May and June 2017 and the results are presented in ATCW report “Tailings Storage Facility Dam and Water Storage Dam, Preliminary Geotechnical Investigation” 116217.05R01, October 2017 [Ref. 1]. The results of the preliminary investigation of the TSF embankment foundation and the impoundment are summarised below. It should be noted when reading the Geotechnical Investigation report [Ref. 1] and comparing figures that the tailings deposition and the TSF embankment height and footprint have altered between the time of the geotechnical investigation and this preliminary design. The geotechnical investigation locality plan has been updated to include the current final (Stage 3) preliminary design and is presented in Figure 2.
5.2 Fieldwork
Field investigations included borehole drilling, in-situ permeability testing, installation of groundwater monitoring bores, test pit excavations and bulk sampling for subsequent laboratory testing. The main aims of the geotechnical investigation were to:
• Investigate condition and type of the foundation materials beneath the TSF Embankment footprint;

12 May 2020 Page 3 of 37 116217.01R02Rev5finaltext
• Estimate the rock mass permeability and identify any high permeability zones where possible;
• Assess topsoil and potential foundation stripping requirements;
• Identify surface conditions within the TSF impoundment; and
• Locate any potential clay borrow areas within the impoundment. The following works located in Figure 2, were carried out:
• Three (3) boreholes were drilled within the footprint of the TSF Embankment to depths that ranged from 25 m to 33 m together with permeability testing (9 packer tests and falling head tests) and the installation of 2 standpipe piezometers at BH2 location;
• Six (6) test pits in the TSF Embankment footprint area were excavated to refusal using a 20 t excavator; and
• Eighteen (18) test pits inside the tailings impoundment area, which could also be potential borrow areas, were excavated to refusal using a 20 t excavator.
During the investigation, samples were extracted for laboratory testing to further identify foundation and potential construction material properties.
5.3 Subsurface Conditions TSF
The investigation for the TSF shows that the topsoil covers the valley in varying thickness between 0.2 m to 0.45 m but generally around 0.25 m. The soils observed beneath the topsoil overlie rock to depths between 0.55 m and 6.8 m. The subsoils below the topsoil vary in general from high plasticity Clay to Clayey Sand and Sandy Clay. The thickness of clay varies. A significant area of Clay, Sandy Clay, and Clayey Sand was found in the northern part of the impoundment in the valley. Some of these clays, the darker brown alluvials/colluvials, are low plasticity and potentially dispersive whereas most of the clay observed on site is medium to high plasticity and non-dispersive. In the Walkers Creek valley, the soil transitions at depth from Clayey materials to more Gravelly Clay and Clayey Gravel, residual to extremely weathered through to moderately weathered rock. It should be noted that the definition of Clay used in this body of work is that outlined in AS1726 (1993), not the recent revision AS1726 (2017), with the intent that the description of Clay in this and any previous site investigations match. The definition of fine-grained material in AS1726 (1993) is 50 % passing 75µm whereas the current standard, AS1726 (2017), is 35 % passing 75µm. This has had little effect on the definition of soils from the TSF site. The hills forming the valley have very little soil cover over the weathered rock. The rock in the footprint of the TSF comprises Tuff and Volcanoclastic Breccia on the west side of the valley with Rhyolite overlying Tuff in the valley and to the east. The rock has some jointing and staining but is generally massive. The rock strength varies from weak to moderate strength in the Rhyolite and moderate to very high strength in the tuff and Volcanoclastic Breccia.
5.4 Foundation Permeability
The foundation conditions at the northern abutment of the TSF embankment include volcanic breccia. The permeability of this section, based on BH1, decreases with depth from 1.7 x 10⁻⁶ m/s at 6.0 m to as low as 1.6 x 10- 10 m/s between 18.0 m and 28.0 m with an overall average of 2.4 x 10⁻⁸ m/s.
12 May 2020 Page 4 of 37 116217.01R02Rev5finaltext
In the valley and the southern abutment of the TSF embankment, the foundations consist of rhyolite and welded tuff which displayed higher permeability. Based on BH2 and BH3, there was no distinct pattern in the permeability changes with depth or position. The permeability varies between 6.9 x 10⁻⁶ m/s and less than 1 x 10⁻¹⁰ m/s in this area.
5.5 Groundwater
The preliminary geotechnical investigation included only one borehole, BH02 (BGW60) in the base of the valley of the proposed TSF embankment drilled to approximately 33 m and completed as a groundwater monitoring bore. The monitoring of the borehole indicated a water level within 1.5 m to 2 m of the surface. To check whether the water was possibly locally perched water in the floor of the valley a second shallow (approximately 5 m deep) borehole, BH 02-2 (BGW61), was drilled beside BH 02. The water levels in BH 02-2 were consistently 1.0 m to 1.5 m lower than the levels in BH 02 up to March 2018 and again from April 2019 onwards. In the intervening period, BH 02-2 on occasion had a higher ground water level than BH02 but most of the time remained lower. This suggests that while the groundwater level is close to the surface in the area, that the higher groundwater levels in BH 02 are possibly associated with a confined aquifer at depth. Further discussions on ground water are discussed in Ref. 2. The results of monitoring these boreholes are presented in Figure 3. The relatively high groundwater level may cause some challenges during construction and some local dewatering may be required.
5.6 Construction Materials
5.6.1 Clay
High plasticity Clay encountered to the north of the impoundment and within the TSF embankment foundation would be used for low permeability (Zone 1) elements in the embankment and Foundation Treatment B material in the impoundment. Other medium to low plasticity Clay, Sandy Clay, Gravelly Clay, Clayey Sand and Clayey Gravel may be identified as suitable for Zone 1 in the embankment. Further investigation and testing would be undertaken to assess the borrow materials and to avoid the use of dispersive clays for borrow.
5.6.2 Rockfill
It is understood that Non-Acid Forming (NAF) rockfill from waste rock would be made available for the construction of the rockfill and filter zones of the TSF. The rockfill would be tested for durability and strength properties during the geotechnical investigation for detailed design. Check testing to confirm that the rock is NAF would also be carried out.
6 TAILINGS TESTING
Tailings testing was carried out in the ATC Williams laboratory on two samples provided in February
2017, Ignimbrite and Crystal Tuff (CT) as well as on a third sample, Volcanic Breccia (VB), in 2019.
These samples had been manufactured for laboratory testing by crushing and grinding exploration
core. The results are provided in our Laboratory Testing Report 116217.04R02 [Ref. 3] and
116217.08R01 [Ref. 4], respectively. Following discussions with Neville Bergin of Neville Bergin
and Associates, and Tony Mathwin of GR Engineering Services, it was agreed that the CT and VB
samples provided the best representation of the tailings to be discharged into the TSF of the testing
currently available. The following laboratory tests were undertaken:
12 May 2020 Page 5 of 37 116217.01R02Rev5finaltext
• Particle Size Distribution (Sieve and Hydrometer)
• Atterberg Limits
• Particle Density (Specific Gravity)
• Segregation Threshold
• Minimum and Maximum Density
• Initial Settled Density
• Shrinkage Limit Density
• Moisture Content / Shear Strength Relationship
• Rheology
• pH
• Conductivity
• Rowe Cell Consolidation
7 TAILINGS TONNAGE AND DEPOSITION RATE
The preliminary design has been based on the deposition of 2 Mt of tailings per annum with a total of 30 Mt deposited over the 15-year LOM. A discharge solids content of 56 % for the tailings has been adopted on the basis of the thickener study carried out by mining equipment supplier Outotec on the CT tailings sample produced for testing in February 2017 [Ref. 5].
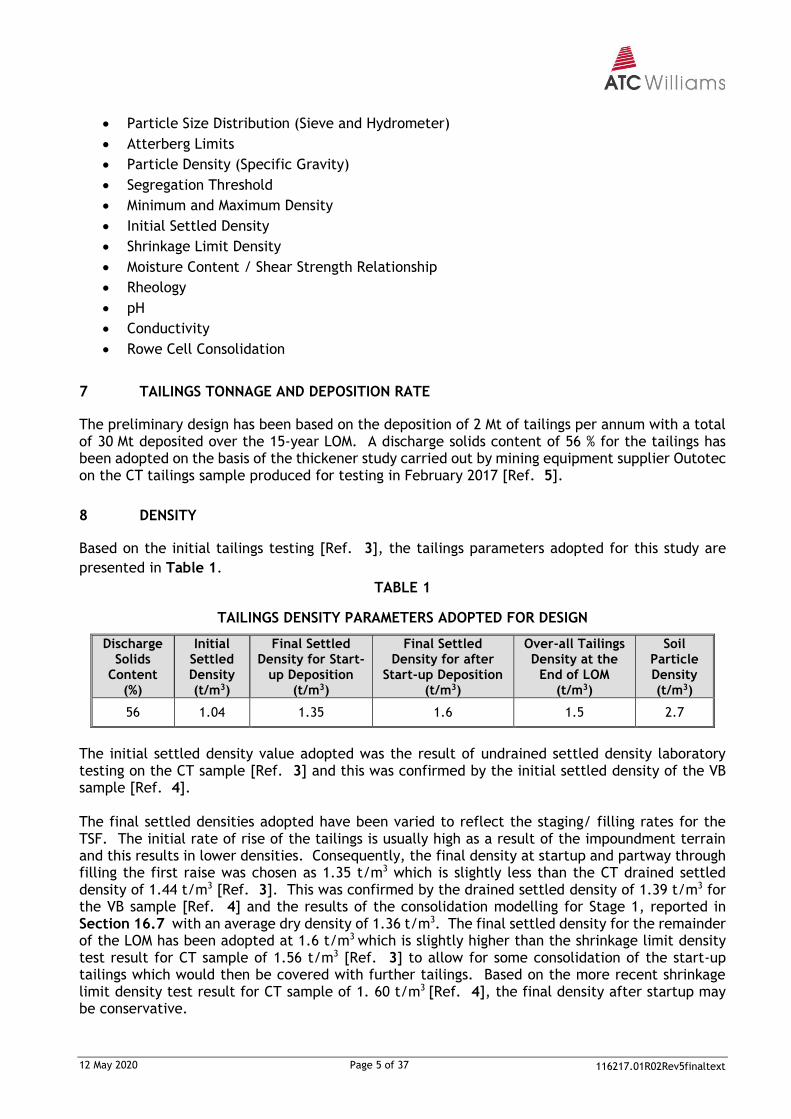
8 DENSITY
Based on the initial tailings testing [Ref. 3], the tailings parameters adopted for this study are
presented in Table 1.
TABLE 1
TAILINGS DENSITY PARAMETERS ADOPTED FOR DESIGN
Discharge Solids
Content (%)
Initial Settled Density (t/m3)
Final Settled Density for Start-
up Deposition (t/m3)
Final Settled Density for after
Start-up Deposition (t/m3)
Over-all Tailings Density at the
End of LOM (t/m3)
Soil Particle Density (t/m3)
56 1.04 1.35 1.6 1.5 2.7
The initial settled density value adopted was the result of undrained settled density laboratory testing on the CT sample [Ref. 3] and this was confirmed by the initial settled density of the VB sample [Ref. 4]. The final settled densities adopted have been varied to reflect the staging/ filling rates for the TSF. The initial rate of rise of the tailings is usually high as a result of the impoundment terrain and this results in lower densities. Consequently, the final density at startup and partway through filling the first raise was chosen as 1.35 t/m3 which is slightly less than the CT drained settled density of 1.44 t/m3 [Ref. 3]. This was confirmed by the drained settled density of 1.39 t/m3 for the VB sample [Ref. 4] and the results of the consolidation modelling for Stage 1, reported in Section 16.7 with an average dry density of 1.36 t/m3. The final settled density for the remainder of the LOM has been adopted at 1.6 t/m3 which is slightly higher than the shrinkage limit density test result for CT sample of 1.56 t/m3 [Ref. 3] to allow for some consolidation of the start-up tailings which would then be covered with further tailings. Based on the more recent shrinkage limit density test result for CT sample of 1. 60 t/m3 [Ref. 4], the final density after startup may be conservative.
12 May 2020 Page 6 of 37 116217.01R02Rev5finaltext
9 DESIGN STANDARDS
The following design standards from both the Australian National Committee on Large Dams Incorporated (ANCOLD) and the New South Wales Dam Safety Committee (NSW DSC) have been considered for the preliminary design of the TSF.
• ANCOLD, “Guidelines on the Consequence Categories for Dams”, October 2012 and revised October 2015 [Ref. 6];
• ANCOLD, “Guidelines on Tailings Dams – Planning, Design, Construction, Operation and Closure”, May 2012 [Ref. 7];
• ANCOLD, “Guidelines on Design of Dams for Earthquake, 1998 [Ref. 8];
• ANCOLD, “Guidelines on Selection of Acceptable Flood Capacity for Dams”, 2000 [Ref. 9];
• NSW DSC, “Consequence Categories for Dams”, DSC3A, May 2014 [Ref. 10];
• NSW DSC, “Acceptable Flood Capacity for Dams”, DSC3B, June 2010 [Ref. 11];
• NSW DSC, “Acceptable Earthquake Capacity for Dams”, DSC3C, June 2010 [Ref. 12];
• NSW DSC, “Tailings Dams”, DSC3F, June 2012 [Ref. 13]; and
• NSW DSC, “General Dam Safety Considerations”, DSC3G, June 2010 [Ref. 14].
10 DESIGN PHILOSOPHY
The TSF for the Project has been designed on the philosophy of a down valley tailings discharge TSF for its practicality for rehabilitation and as a cost-effective solution. As the decant pond on the tailings is at the embankment, the embankment has been designed to maintain both an operating pond of water and tailings against the embankment. The embankment has been designed to be constructed in three stages, the two raises of which both are downstream. As testing by Graeme Campbell & Associates (2019) [Ref. 15] shows that the tailings are potentially acid generating, the deposition of tailings will be controlled in such a way as to only allow the tailings to be exposed for short periods of time before being covered by subsequent deposition. Thus, it is expected that there would be no acid generated from the tailings bleed or runoff during operations.
11 CONSEQUENCE CATEGORY
The consequence category according to the NSW DSC Guidelines for Tailings Dams [Ref. 10] considers any acid-forming tailings to have a consequence category of High C as a minimum where the receiving environment is rural. The ANCOLD guidelines are not as prescriptive. This rating is also considered realistic on the basis that non-itinerate loss of life is not expected and as the emergency spillway has been designed to discharge into Walkers Creek, downstream of the TSF and it is anticipated that any flow from the spillway would enter Walkers Creek and subsequently Lawsons Creek as would any release during a dam break. Therefore, no buildings/residences are known to be situated in the flow path. It is also noted that the TSF is downstream from the village of Lue, approximately 2.0 km in a direct line from the closest point of the TSF embankment. Non-itinerate loss of life is not expected. However, a dam-break tailings run-out study would be carried out during detailed design following the receipt of development consent and once the full site-wide water balance has been confirmed.
12 May 2020 Page 7 of 37 116217.01R02Rev5finaltext
12 DESIGN CRITERIA
12.1 Introduction
Based on the High C consequence category, the accepted fall-back design criteria are as outlined in the sections below.
12.2 Storm Storage
The allowance for the storage of the runoff from a design storm and additional freeboard was estimated using both the ANCOLD (2012) and NSW DSC guidelines as follows: ANCOLD (2012)
1. Storm Storage over the maximum operating pond: a. Minimum Extreme Storage: 1:100 Annual Exceedance Probability (AEP) 72 Hr storm;
and b. Contingency Freeboard: 0.5 m plus 1:10 AEP wave run-up from wind to spillway
invert. Or NSW DSC (Guideline DSC3F)
2. Storm Storage over the maximum operating pond: a. Flood Storage 1:100 AEP 72 hr storm; and b. Operational freeboard of 0.5 m to the crest of the embankment.
Or 3. Total freeboard with critical duration storm with an AEP of 1:100,000 to the crest of the
embankment. Or 4. Environmental Freeboard of 1:100 AEP 72 hr storm to spillway invert.
The most stringent of the above design criteria, i.e. ANCOLD (2012) has been chosen for this preliminary design for each stage of the TSF. The ability to reinstate 1 in 100 AEP 72 hr storm capacity within 7 days of a design storm is also required.
12.3 Emergency Spillway Design
In accordance with the ANCOLD (2012) guidelines, the TSF spillway has been designed for a 1 in 100,000 AEP with an additional allowance for wave run-up.
12.4 Seismic Analysis for Embankment Stability
The following criteria apply: Operating Basis Earthquake (OBE):
1:1,000 AEP earthquake (ANCOLD) Maximum Design Earthquake (MDE):
1:10,000 AEP (ANCOLD) 1:1,000 AEP (NSW DSC – DSC3C) The most stringent of the above design criteria have been chosen for this preliminary design.

12 May 2020 Page 8 of 37 116217.01R02Rev5finaltext
During the process of finalising this report, ANCOLD released the updated Guidelines on Design of Dams for Earthquake (2019) [Ref. 16] and also Revision 1 to the ANCOLD (2012) guidelines [Ref. 17]. This revision allows the maximum design earthquake for High C dams to be reduced to 1:2000 provided a risk assessment is undertaken. This and other changes to the ANCOLD (2012) Tailings Dam guidelines would be adopted in the final design.
12.5 Embankment Stability Factors of Safety
The acceptable factors of safety for stability analysis based on the ANCOLD Guidelines on Tailings Dams [Ref. 7] and the stress state adopted are presented in Table 2 below:
TABLE 2
FACTORS OF SAFETY FOR EMBANKMENT STABILITY
Loading Condition
Recommended Minimum for Tailings Dams
Stress State Adopted for Analysis
Long-term Drained 1.5 Effective Strength
Short-term undrained end of construction upstream
1.3 Consolidated Undrained Strength
OBE* 1.1 Consolidated Undrained Strength
MDE* 1.0-1.1 USACE method of 80% of Consolidated Undrained Strength and 50% of earthquake magnitude*
* Where OBE is the Operating Basis Earthquake and MDE is the Maximum Design Earthquake as outlined in Section 11.4 and USACE is the US Army Corps of Engineers. The use of the pseudo-static analysis for the OBE and MDE along with USACE provision for 80% of the undrained strength and 50% of the earthquake load is appropriate for this preliminary analysis given the level of the study and the information available. This would be reanalysed during detailed design after a site-specific seismic study has been undertaken. A detailed seismic deformation analysis would also be completed.
12.6 EPA Liner Guidelines
It is understood from the correspondence forwarded to Department of Planning by the EPA on 12 December 2016 titled “Tailings Dam Liner Policy”, that the benchmark position for the EPA with regards to protection from seepage is a prescribed clay liner of minimum 1 m thickness and with a maximum permeability of 1 x 10⁻⁹ m/sec, at the base of the storage.
13 BEACHING PROFILE DETERMINATION
13.1 Tailings Beach Slope Prediction
The shape and slope of the tailings beach from the deposition point to the decant pond is referred to as the Beaching Profile and is a fundamental part of the estimation of capacity, embankment sizes, and the way tailings are expected to behave.
12 May 2020 Page 9 of 37 116217.01R02Rev5finaltext
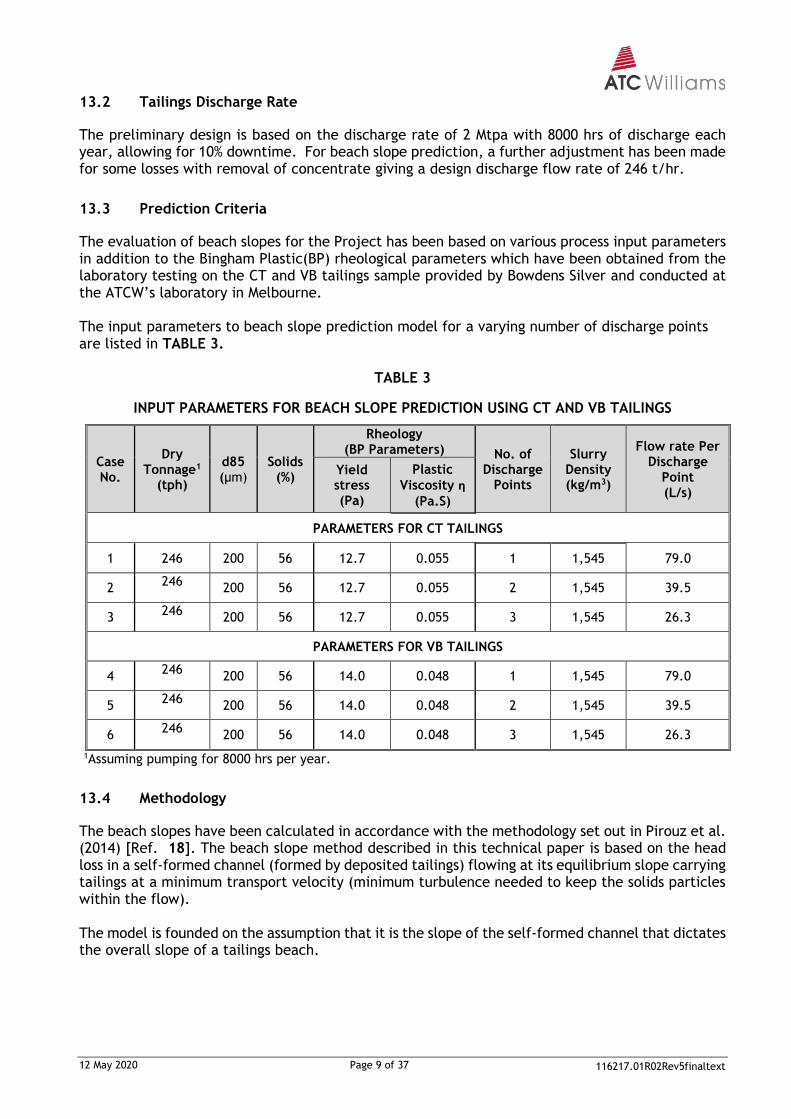
13.2 Tailings Discharge Rate
The preliminary design is based on the discharge rate of 2 Mtpa with 8000 hrs of discharge each year, allowing for 10% downtime. For beach slope prediction, a further adjustment has been made for some losses with removal of concentrate giving a design discharge flow rate of 246 t/hr.
13.3 Prediction Criteria
The evaluation of beach slopes for the Project has been based on various process input parameters in addition to the Bingham Plastic(BP) rheological parameters which have been obtained from the laboratory testing on the CT and VB tailings sample provided by Bowdens Silver and conducted at the ATCW’s laboratory in Melbourne. The input parameters to beach slope prediction model for a varying number of discharge points are listed in TABLE 3.
TABLE 3
INPUT PARAMETERS FOR BEACH SLOPE PREDICTION USING CT AND VB TAILINGS
Case No.
Dry Tonnage1
(tph)
d85 (µm)
Solids (%)
Rheology (BP Parameters) No. of
Discharge Points
Slurry Density (kg/m3)
Flow rate Per Discharge
Point (L/s)
Yield stress (Pa)
Plastic
Viscosity ƞ
(Pa.S)
PARAMETERS FOR CT TAILINGS
1 246 200 56 12.7 0.055 1 1,545 79.0
2 246
200 56 12.7 0.055 2 1,545 39.5
3 246
200 56 12.7 0.055 3 1,545 26.3
PARAMETERS FOR VB TAILINGS
4 246
200 56 14.0 0.048 1 1,545 79.0
5 246
200 56 14.0 0.048 2 1,545 39.5
6 246
200 56 14.0 0.048 3 1,545 26.3
1Assuming pumping for 8000 hrs per year.
13.4 Methodology
The beach slopes have been calculated in accordance with the methodology set out in Pirouz et al. (2014) [Ref. 18]. The beach slope method described in this technical paper is based on the head loss in a self-formed channel (formed by deposited tailings) flowing at its equilibrium slope carrying tailings at a minimum transport velocity (minimum turbulence needed to keep the solids particles within the flow). The model is founded on the assumption that it is the slope of the self-formed channel that dictates the overall slope of a tailings beach.

12 May 2020 Page 10 of 37 116217.01R02Rev5finaltext
13.5 Results of Prediction
All beach slopes exhibit concavity due in part to thickener underflow variability and segregation of the tailings if this occurs. To determine the concavity, the slopes are divided into four parts; the upper section, middle section, lower section and runout. The beach slope predictions of these top three parts are determined at mean minus standard deviation slurry concentration, mean slurry concentration and mean plus standard deviation slurry concentration values. TABLE 4 summarises the findings of the beach slope prediction calculations for a number of discharge points.
TABLE 4
PREDICTED BEACH PROFILE
Case No.
Predicted Beach Slope (%)
Upper Middle Lower
USING CT BP PARAMETERS
1 1.87 1.40 1.05
2 2.63 1.97 1.48
3 3.21 2.41 1.81
USING VB BP PARAMETERS
4 1.92 1.44 1.08
5 2.71 2.03 1.52
6 3.31 2.48 1.86
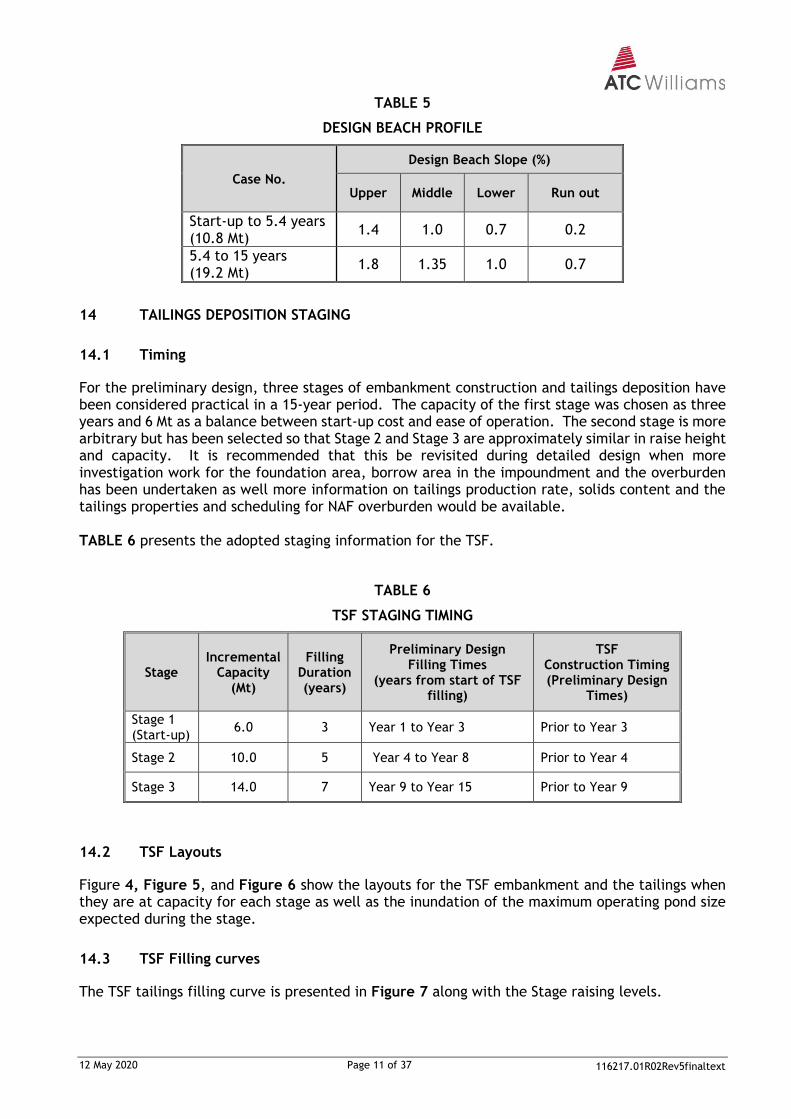
13.6 Design Beach Slope
The analysis above shows the sensitivity of the beach slope to discharge rates. It is proposed that there would be three discharge points in operation, but the facility would have one effective discharge stream for the first 5.4 years when the rate of rise is high. However, for the remainder of the LOM, it is assumed that as generally two separate tailings streams would be maintained at any one time and higher beach slopes are achieved. The design slopes adopted for the two periods of time are as presented in TABLE 5.
It is noted that the beach slopes are slightly conservative for the down-valley discharge and it is important that these beach slope predictions be revisited during detailed design when there are more samples of a wider variety of expected tailings type available for testing. Rheology testing along with beach slope prediction should also be revisited at the start of deposition once the grind and tailings thickener solids concentration becomes consistent.
12 May 2020 Page 11 of 37 116217.01R02Rev5finaltext
TABLE 5
DESIGN BEACH PROFILE
Case No.
Design Beach Slope (%)
Upper Middle Lower Run out
Start-up to 5.4 years (10.8 Mt)
1.4 1.0 0.7 0.2
5.4 to 15 years (19.2 Mt)
1.8 1.35 1.0 0.7
14 TAILINGS DEPOSITION STAGING
14.1 Timing
For the preliminary design, three stages of embankment construction and tailings deposition have been considered practical in a 15-year period. The capacity of the first stage was chosen as three years and 6 Mt as a balance between start-up cost and ease of operation. The second stage is more arbitrary but has been selected so that Stage 2 and Stage 3 are approximately similar in raise height and capacity. It is recommended that this be revisited during detailed design when more investigation work for the foundation area, borrow area in the impoundment and the overburden has been undertaken as well more information on tailings production rate, solids content and the tailings properties and scheduling for NAF overburden would be available. TABLE 6 presents the adopted staging information for the TSF.
TABLE 6
TSF STAGING TIMING
Stage Incremental
Capacity (Mt)
Filling Duration (years)
Preliminary Design Filling Times
(years from start of TSF filling)
TSF Construction Timing (Preliminary Design
Times)
Stage 1 (Start-up)
6.0 3 Year 1 to Year 3 Prior to Year 3
Stage 2 10.0 5 Year 4 to Year 8 Prior to Year 4
Stage 3 14.0 7 Year 9 to Year 15 Prior to Year 9
14.2 TSF Layouts
Figure 4, Figure 5, and Figure 6 show the layouts for the TSF embankment and the tailings when they are at capacity for each stage as well as the inundation of the maximum operating pond size expected during the stage.
14.3 TSF Filling curves
The TSF tailings filling curve is presented in Figure 7 along with the Stage raising levels.
12 May 2020 Page 12 of 37 116217.01R02Rev5finaltext
15 TAILINGS DEPOSITION AND LINER REQUIREMENTS
15.1 General
As the tailings are to be deposited down-valley against the embankment, the rate of rise of tailings would be greatest in the first three years (Stage 1). At its deepest point, approximately 20 m of tailings are to be deposited near the embankment. Because of the rapid rate of rise, consolidation would not be complete at the end of the three years and consequently the permeability would be greater in these years than later when there has been time for further consolidation. Consequently, the impoundment liner has been designed based on the equivalent flux over these three years.
15.2 Liner Requirements
In order to design a clay liner system with equivalence to the EPA 1 m of clay liner with a permeability of 1x10⁻⁹ m/sec the flux of water through 3 to 20 m of tailings was compared to the flux of water over the EPA liner. The permeability of the tailings was determined by consolidation modelling as provided in Section 16.
16 CONSOLIDATION MODELLING FOR EPA PERMEABILITY EVALUATION
16.1 General
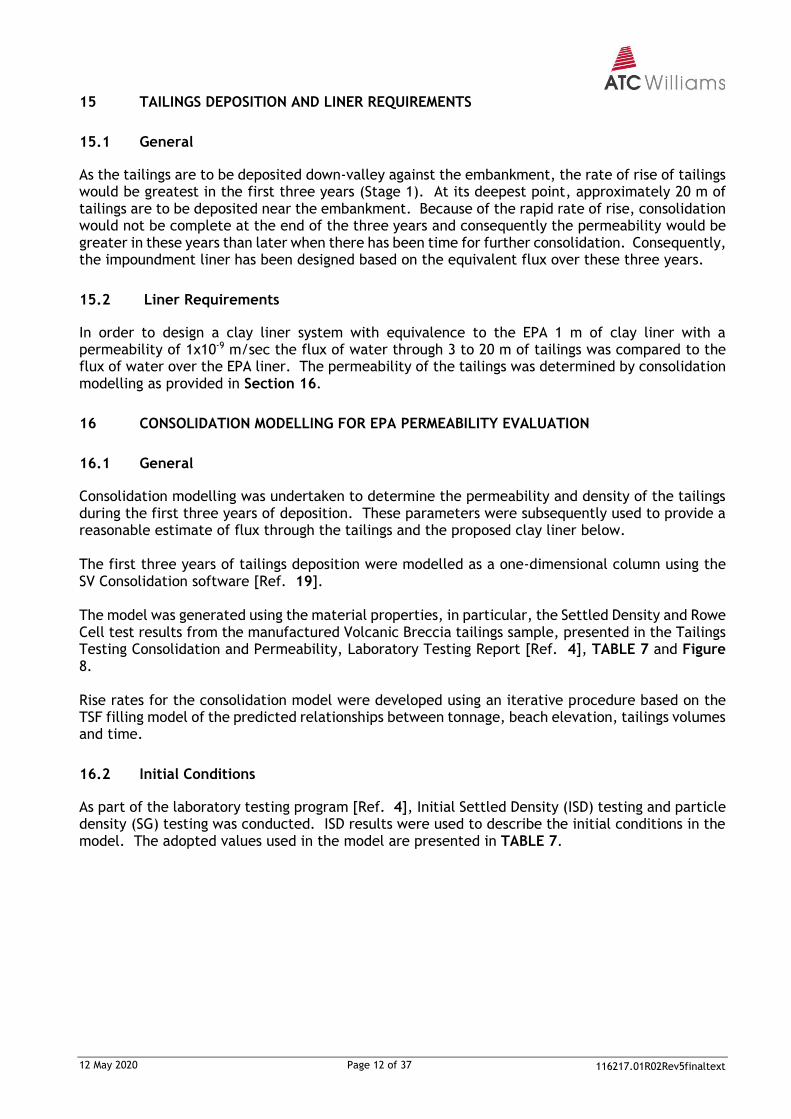
Consolidation modelling was undertaken to determine the permeability and density of the tailings during the first three years of deposition. These parameters were subsequently used to provide a reasonable estimate of flux through the tailings and the proposed clay liner below. The first three years of tailings deposition were modelled as a one-dimensional column using the SV Consolidation software [Ref. 19]. The model was generated using the material properties, in particular, the Settled Density and Rowe Cell test results from the manufactured Volcanic Breccia tailings sample, presented in the Tailings Testing Consolidation and Permeability, Laboratory Testing Report [Ref. 4], TABLE 7 and Figure 8. Rise rates for the consolidation model were developed using an iterative procedure based on the TSF filling model of the predicted relationships between tonnage, beach elevation, tailings volumes and time.
16.2 Initial Conditions
As part of the laboratory testing program [Ref. 4], Initial Settled Density (ISD) testing and particle density (SG) testing was conducted. ISD results were used to describe the initial conditions in the model. The adopted values used in the model are presented in TABLE 7.
12 May 2020 Page 13 of 37 116217.01R02Rev5finaltext
TABLE 7
INITIAL CONDITIONS – MATERIAL PROPERTIES
Material Property Unit Adopted Value
SG t/m3 2.72
ISD Void Ratio (e0)
- 1.61
ISD Dry Density (ρd0)
t/m3 1.04
16.3 Material Compressibility and Permeability Functions
The program SV Consolidation [Ref. 19] couples SV Solid [Ref. 20] and SV Flux [Ref. 21]. The individual software packages require separate input properties to define a material in terms of compressibility (SV Solid [Ref. 20]) and permeability (SV Flux [Ref. 21]). Both properties are defined by Rowe Cell testing. Material compressibility and permeability are defined by power functions, as follows:
Material compressibility power function (Somogyi, 1980) 𝒆 = 𝑨 ∙ 𝝈′𝑩 Equation 1
Material permeability power function (Somogyi, 1980) 𝒌𝒔𝒂𝒕 = 𝑪 ∙ 𝒆𝑫 Equation 2
Where:
𝑒 = 𝑣𝑜𝑖𝑑 𝑟𝑎𝑡𝑖𝑜,
𝜎′ = 𝑒𝑓𝑓𝑒𝑐𝑡𝑖𝑣𝑒 𝑠𝑡𝑟𝑒𝑠𝑠 (𝑘𝑃𝑎),
𝑘𝑠𝑎𝑡 = 𝑠𝑎𝑡𝑢𝑟𝑎𝑡𝑒𝑑 ℎ𝑦𝑑𝑟𝑎𝑢𝑙𝑖𝑐 𝑐𝑜𝑛𝑑𝑢𝑐𝑡𝑖𝑣𝑖𝑡𝑦 (𝑚/𝑠), 𝑎𝑛𝑑
𝐴, 𝐵, 𝐶, 𝐷 = 𝑒𝑥𝑝𝑒𝑟𝑖𝑚𝑒𝑛𝑡𝑎𝑙 𝑐𝑢𝑟𝑣𝑒 𝑓𝑖𝑡𝑡𝑖𝑛𝑔 𝑝𝑎𝑟𝑎𝑚𝑒𝑡𝑒𝑟𝑠 (𝑟𝑒𝑓𝑒𝑟 𝑡𝑜 𝑻𝒂𝒃𝒍𝒆 𝟑).
The experimental parameters; A, B, C and D are derived from the Rowe cell test by applying power functions to the data. These fits are presented in Figure 8 and the resulting experimental parameters are summarised in TABLE 8.
TABLE 8
EXPERIMENTAL PARAMETERS FOR TAILINGS COMPRESSIBILITY AND PERMEABILITY
Tailings Compressibility Tailings Permeability
A B C D
1.3148 -0.128 0.0024 3.2481
16.4 Boundary Conditions
SV Consolidation [Ref. 19] allows the user to define different boundary conditions for the tailings compressibility and permeability. SV Solid [Ref. 20] boundary conditions control the degree of
12 May 2020 Page 14 of 37 116217.01R02Rev5finaltext
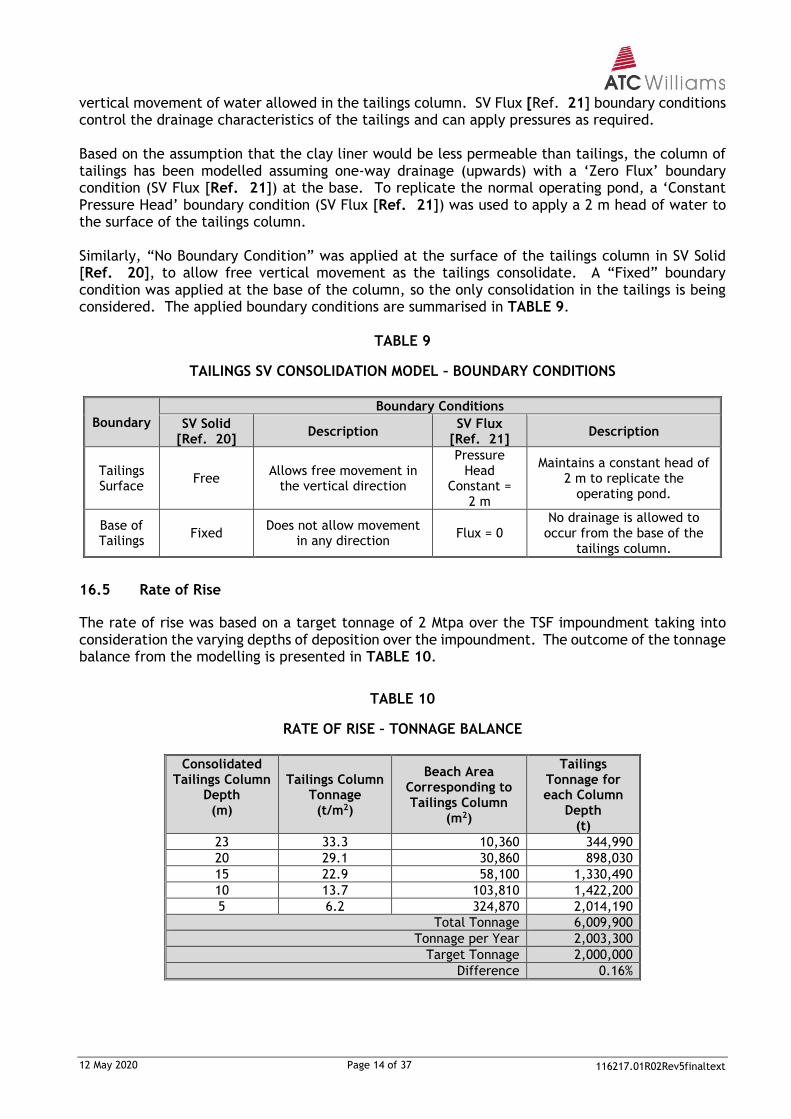
vertical movement of water allowed in the tailings column. SV Flux [Ref. 21] boundary conditions control the drainage characteristics of the tailings and can apply pressures as required. Based on the assumption that the clay liner would be less permeable than tailings, the column of tailings has been modelled assuming one-way drainage (upwards) with a ‘Zero Flux’ boundary condition (SV Flux [Ref. 21]) at the base. To replicate the normal operating pond, a ‘Constant Pressure Head’ boundary condition (SV Flux [Ref. 21]) was used to apply a 2 m head of water to the surface of the tailings column. Similarly, “No Boundary Condition” was applied at the surface of the tailings column in SV Solid [Ref. 20], to allow free vertical movement as the tailings consolidate. A “Fixed” boundary condition was applied at the base of the column, so the only consolidation in the tailings is being considered. The applied boundary conditions are summarised in TABLE 9.
TABLE 9
TAILINGS SV CONSOLIDATION MODEL – BOUNDARY CONDITIONS
Boundary
Boundary Conditions
SV Solid [Ref. 20]
Description SV Flux
[Ref. 21] Description
Tailings Surface
Free Allows free movement in
the vertical direction
Pressure Head
Constant = 2 m
Maintains a constant head of 2 m to replicate the
operating pond.
Base of Tailings
Fixed Does not allow movement
in any direction Flux = 0
No drainage is allowed to occur from the base of the
tailings column.
16.5 Rate of Rise
The rate of rise was based on a target tonnage of 2 Mtpa over the TSF impoundment taking into consideration the varying depths of deposition over the impoundment. The outcome of the tonnage balance from the modelling is presented in TABLE 10.
TABLE 10
RATE OF RISE – TONNAGE BALANCE
Consolidated Tailings Column
Depth (m)
Tailings Column Tonnage
(t/m2)
Beach Area Corresponding to Tailings Column
(m2)
Tailings Tonnage for each Column
Depth (t)
23 33.3 10,360 344,990
20 29.1 30,860 898,030
15 22.9 58,100 1,330,490
10 13.7 103,810 1,422,200
5 6.2 324,870 2,014,190
Total Tonnage 6,009,900
Tonnage per Year 2,003,300
Target Tonnage 2,000,000
Difference 0.16%

12 May 2020 Page 15 of 37 116217.01R02Rev5finaltext
As presented in TABLE 10, the modelled deposition rates closely reflect the target conditions of 2 Mtpa. Based on this, ATCW is satisfied that the adopted filling rates were suitable for developing the model. The adopted filling relationship with time for the first three years of deposition is provided in Figure 9.
16.6 Model Results
The consolidation modelling results are provided in Figure 10 and Figure 11. Figure 10 provides the dry density and permeability results required for seepage modelling and the density check for design. Excess pore water pressure results provided in Figure 11 show that in the first three years of deposition the excess pore water pressure continues to build up as a result of the high rate of rise of the deposited tailings.
16.7 Consolidation during Tailings Deposition
The model shows that the materials consolidate to an average dry density of 1.42 t/m3 by the end of Stage 1 (i.e. after 3 years). After 1 year and 2 years of deposition, the average dry density in the column is 1.27 t/m3 and 1.35 t/m3, respectively. The approximate rate of filling from the consolidation model is also presented in Figure 9. The filling curves presented in Figure 9 indicate that approximately 7.6 m of consolidation occurs during the first 3 years of filling, resulting in a consolidated depth of 20.6 m.
16.8 Permeability during Tailings Deposition
The initial hydraulic conductivity of the tailings at the time of deposition is approximately 1.3 x 10⁻⁷ m/sec. Hydraulic conductivity profiles presented in Figure 10 indicate that the permeability of the tailings at the base of the column would reduce to approximately 1.0 x 10⁻⁸ m/sec after 3 years of the deposition. This is a function of the dry density (or conversely, reduced void ratio) of the tailings increasing with depth as the tailings consolidate. Therefore, the permeability of the tailings gradually decreases from the surface of the tailings (1.3 x 10⁻⁷ m/sec) to the base of the tailings (1.0 x 10⁻⁸ m/sec).
17 IMPOUNDMENT LINER DESIGN
17.1 General
In order to determine an equivalent liner system, the target flux through the equivalent liner was set to be equal to or less than that achieved by the EPA benchmark liner under 20 m of water with free draining material beneath the liner. This depth has been adopted as 20 m of tailings would be deposited in the first three years and this is when the maximum rate of rise of tailings occurs and consequently, the lowest tailings permeabilities are expected.
17.2 EPA Benchmark Seepage
Based on this EPA benchmark, the seepage rate through the prescribed 1 m clay liner with a permeability of 1 x 10⁻⁹ m/sec was calculated. A one-dimensional steady-state analysis was
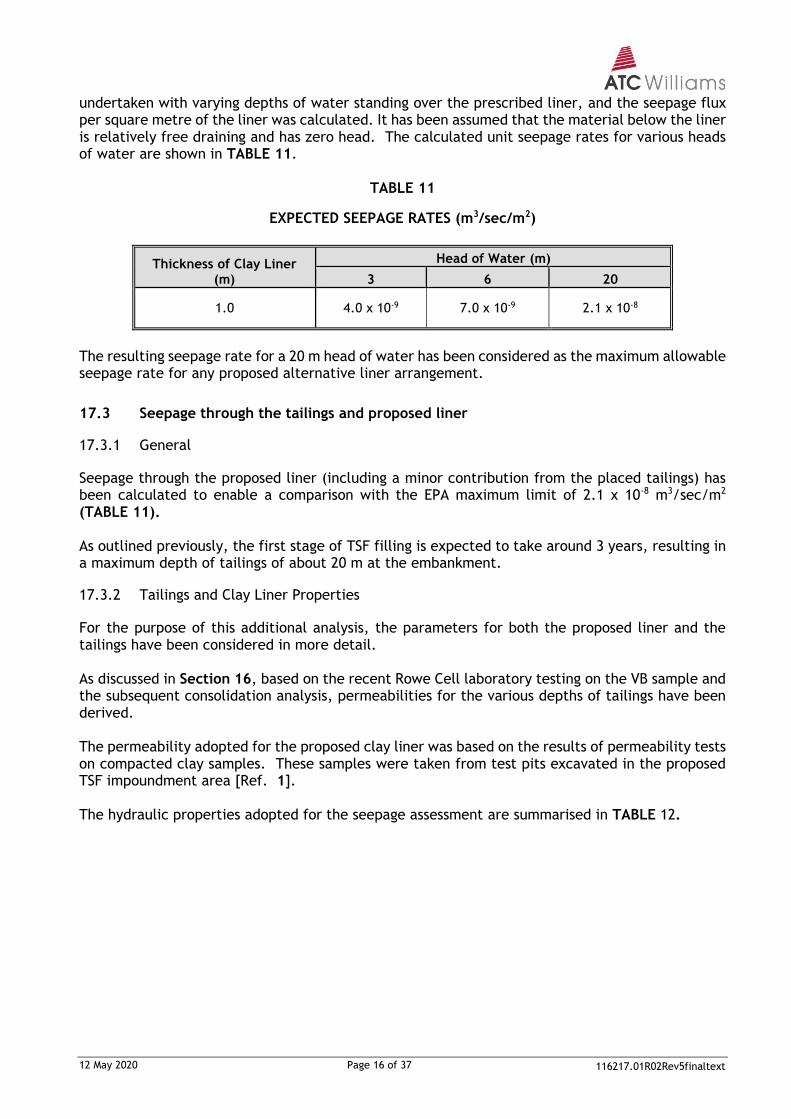
12 May 2020 Page 16 of 37 116217.01R02Rev5finaltext
undertaken with varying depths of water standing over the prescribed liner, and the seepage flux per square metre of the liner was calculated. It has been assumed that the material below the liner is relatively free draining and has zero head. The calculated unit seepage rates for various heads of water are shown in TABLE 11.
TABLE 11
EXPECTED SEEPAGE RATES (m3/sec/m2)
Thickness of Clay Liner (m)
Head of Water (m)
3 6 20
1.0 4.0 x 10⁻⁹ 7.0 x 10⁻⁹ 2.1 x 10⁻⁸
The resulting seepage rate for a 20 m head of water has been considered as the maximum allowable seepage rate for any proposed alternative liner arrangement.
17.3 Seepage through the tailings and proposed liner
17.3.1 General
Seepage through the proposed liner (including a minor contribution from the placed tailings) has been calculated to enable a comparison with the EPA maximum limit of 2.1 x 10⁻⁸ m3/sec/m2 (TABLE 11). As outlined previously, the first stage of TSF filling is expected to take around 3 years, resulting in a maximum depth of tailings of about 20 m at the embankment.
17.3.2 Tailings and Clay Liner Properties
For the purpose of this additional analysis, the parameters for both the proposed liner and the tailings have been considered in more detail. As discussed in Section 16, based on the recent Rowe Cell laboratory testing on the VB sample and the subsequent consolidation analysis, permeabilities for the various depths of tailings have been derived. The permeability adopted for the proposed clay liner was based on the results of permeability tests on compacted clay samples. These samples were taken from test pits excavated in the proposed TSF impoundment area [Ref. 1]. The hydraulic properties adopted for the seepage assessment are summarised in TABLE 12.

12 May 2020 Page 17 of 35 116217.01R02Rev5finaltext
TABLE 12
HYDRAULIC PARAMETERS
17.3.3 Liner Seepage Analysis and Results
For the seepage analysis, it has been assumed that the water level in the tailings is at the top of
the tailings which is the same water depth as analysed for the EPA benchmark liner. It has also
been assumed, conservatively, that there is no water pressure under the liner, i.e. the pressure
head on the underside of the liner is zero.
The estimated unit seepage for a range of thicknesses of foundation clay and depth of tailings are
summarised below in TABLE 13.
TABLE 13
EXPECTED LINER SEEPAGE RATES (m3/sec/m2)
Thickness of Clay (m)
Depth of Tailings (m)
3 6 20
0.45 3.68 x 10⁻⁹ 6.37 x 10⁻⁹ 1.29 x 10⁻⁸
0.70 2.57 x 10⁻⁹ 4.43 x 10⁻⁹ 9.92 x 10⁻⁹
Figure 12 presents the estimated seepage rates for the TSF and shows a comparison with the allowable maximum derived from 1 m clay with a permeability of 1 x 10⁻⁹ m/sec, the EPA benchmark liner (TABLE 11).
17.4 Impoundment Liner Design
It is evident from Figure 12 that the expected seepage rates from the TSF are lower than the maximum allowable seepage rates and consequently it has been proposed to line the impoundment with 0.45 m of clay in all areas of the storage below the maximum possible water level. For comparison, the seepage analysis undertaken, as outlined below in Section 23, indicates that the seepage with the TSF full is equivalent to a unit flux of 6 x 10⁻⁹ m3/sec per m2. This is significantly lower than the target unit flux of 2 x 10⁻⁸ m3/sec per m2. This is because the seepage analysis includes the permeability of the bedrock below the liner.
Material
Average Saturated Hydraulic
Conductivity, k
(m/sec)
Source
Foundation Clay - Compacted 5 x 10⁻¹⁰ Based on in-situ and laboratory testing
Tailings 0-3 m 8 x 10⁻⁸
Consolidation analysis and Rowe Cell
test results for VB sample Tailings 3 -10 m 4 x 10⁻⁸
Tailings 10 – 20 m 2 x 10⁻⁸

12 May 2020 Page 18 of 35 116217.01R02Rev5finaltext
The flux from the preliminary design is less than both the target seepage rate for 20 m of head of water based on the EPA requirements (TABLE 11), the flux expected on the EPA 1 m liner with 6 m of head and the calculated 1D liner seepage with 6 m of tailings and water (TABLE 12) or more. The implication of this is that the overall site (including the effects of low permeability rock foundations) is actually less transmissive than the liner as a stand-alone (which implicitly assumes a permeable underlying layer).
18 WATER MANAGEMENT
18.1 General
The capture and control of water flowing into the TSF and water being taken from the TSF have been considered in a site-wide water balance study undertaken by WRM [Ref. 22]. The results of the water balance together with the runoff from design storms have provided the total storm storage requirement over the tailings, and hence the spillway invert level for the TSF. The spillway routing for the design storm provides the depth of spillway and hence the crest elevation. These designs have been undertaken in accordance with the criteria outlined in Section 12 and are presented in Section 19 and 20.
18.2 Storm Event Data
Based on the IFD curve analysis provided by BOM closest to the TSF site at Latitude -32.6375 degrees and Longitude 149.8375 degrees, the 1:100 AEP, 72 hr storm has a depth of 211 mm of rainfall.
18.3 TSF Decant Pond Elevation Results
The decant pond is situated on the tailings, and as a consequence, the storage rating curve for the decant pond changes with time. The storage rating curves for the decant pond within the embankment are presented in Figure 13 for the following times:
• Immediately following construction and no tailings;
• 3 years and storage of 6 Mt of tailings deposition;
• 8 years and storage of 16 Mt of tailings deposition; and
• 15 years and storage of 30 Mt of tailings deposition.
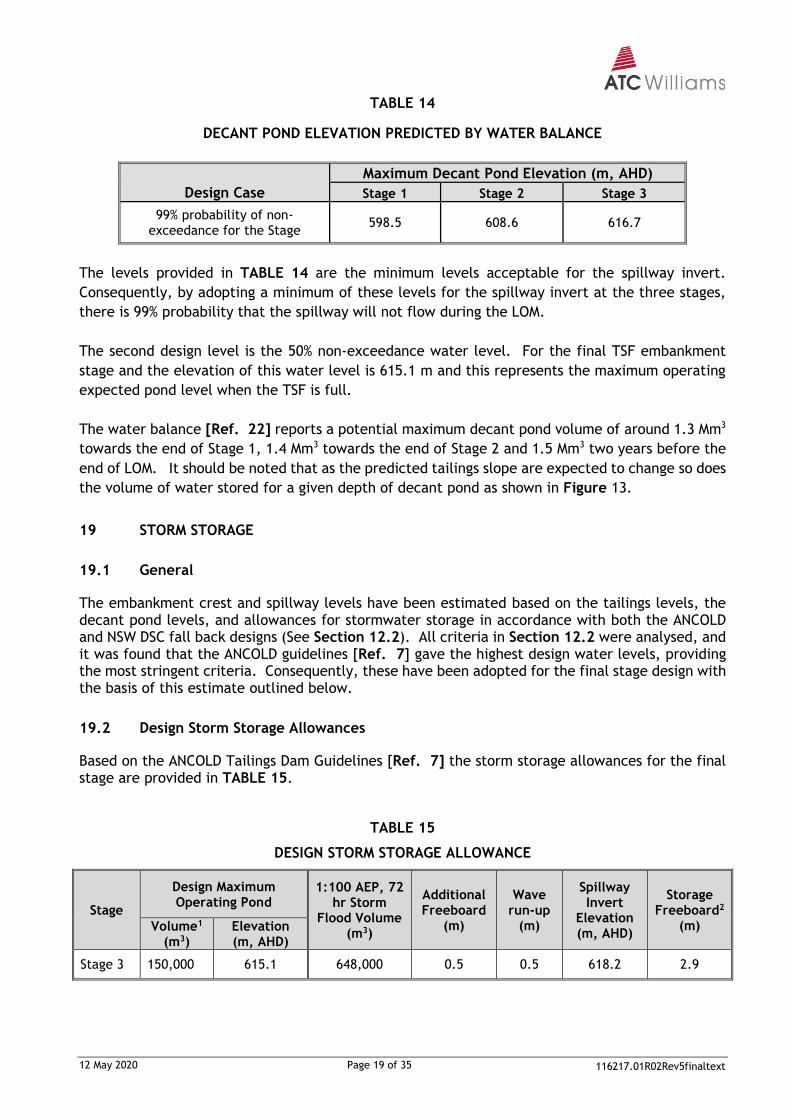
The TSF’s decant pond level would fluctuate both seasonally and annually as the decant level is affected by the requirements of the plant, rainfall and evaporation. The floating pontoon would allow water to be returned to the process plant on an as needs basis when the decant pond is deeper than 2 m. However, towards the end of LOM, an alternate pumping arrangement would be introduced to lower the decant pond to a minimum of 1.0 m and hence optimise the embankment height and reduce the water volume needing to be pumped off the TSF during rehabilitation. With respect to the design of the TSF, the primary use of the water balance results has been to provide water levels in the decant pond. The first of the two design levels have been adopted as follows: The maximum water level estimated in the water balance at each stage of filling (the 99% non-exceedance water level). These levels are provided in TABLE 14.
12 May 2020 Page 19 of 35 116217.01R02Rev5finaltext
TABLE 14
DECANT POND ELEVATION PREDICTED BY WATER BALANCE
Design Case
Maximum Decant Pond Elevation (m, AHD)
Stage 1 Stage 2 Stage 3
99% probability of non-exceedance for the Stage
598.5 608.6 616.7
The levels provided in TABLE 14 are the minimum levels acceptable for the spillway invert.
Consequently, by adopting a minimum of these levels for the spillway invert at the three stages,
there is 99% probability that the spillway will not flow during the LOM.
The second design level is the 50% non-exceedance water level. For the final TSF embankment
stage and the elevation of this water level is 615.1 m and this represents the maximum operating
expected pond level when the TSF is full.
The water balance [Ref. 22] reports a potential maximum decant pond volume of around 1.3 Mm3
towards the end of Stage 1, 1.4 Mm3 towards the end of Stage 2 and 1.5 Mm3 two years before the
end of LOM. It should be noted that as the predicted tailings slope are expected to change so does
the volume of water stored for a given depth of decant pond as shown in Figure 13.
19 STORM STORAGE
19.1 General
The embankment crest and spillway levels have been estimated based on the tailings levels, the decant pond levels, and allowances for stormwater storage in accordance with both the ANCOLD and NSW DSC fall back designs (See Section 12.2). All criteria in Section 12.2 were analysed, and it was found that the ANCOLD guidelines [Ref. 7] gave the highest design water levels, providing the most stringent criteria. Consequently, these have been adopted for the final stage design with the basis of this estimate outlined below.
19.2 Design Storm Storage Allowances
Based on the ANCOLD Tailings Dam Guidelines [Ref. 7] the storm storage allowances for the final stage are provided in TABLE 15.
TABLE 15
DESIGN STORM STORAGE ALLOWANCE
Stage
Design Maximum Operating Pond
1:100 AEP, 72 hr Storm
Flood Volume (m3)
Additional Freeboard
(m)
Wave run-up
(m)
Spillway Invert
Elevation (m, AHD)
Storage Freeboard2
(m) Volume1 (m3)
Elevation (m, AHD)
Stage 3 150,000 615.1 648,000 0.5 0.5 618.2 2.9
12 May 2020 Page 20 of 35 116217.01R02Rev5finaltext
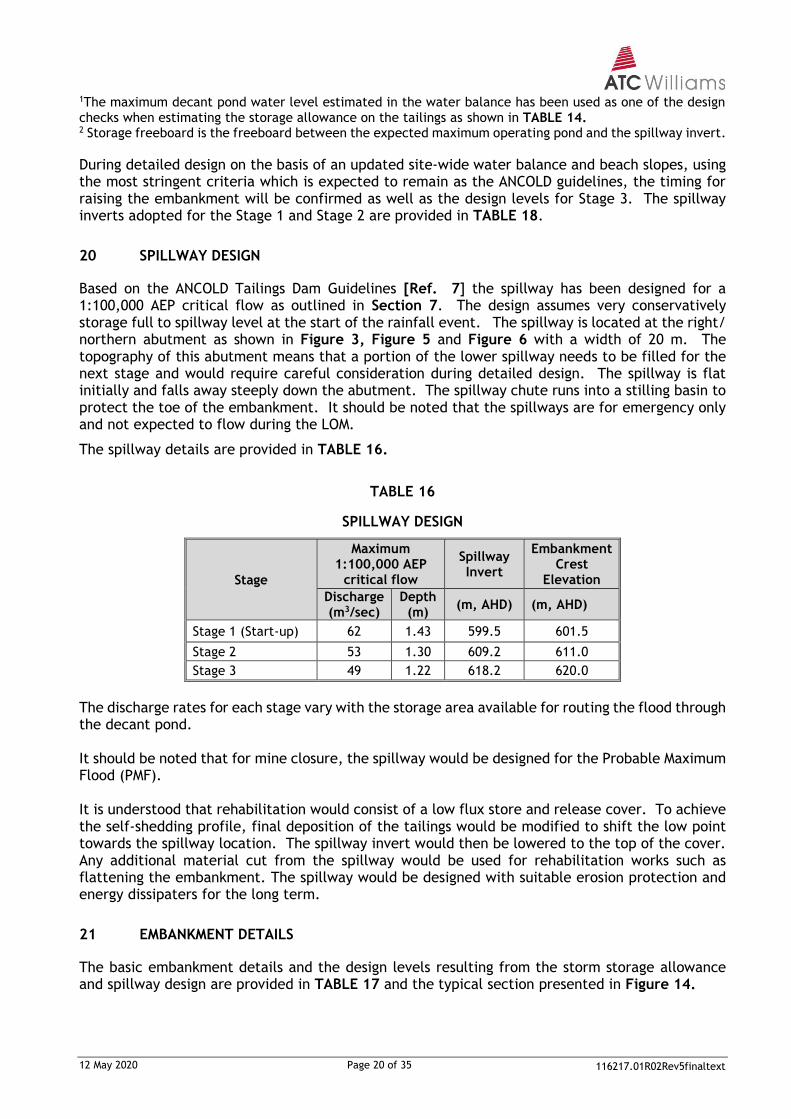
1The maximum decant pond water level estimated in the water balance has been used as one of the design checks when estimating the storage allowance on the tailings as shown in TABLE 14. 2 Storage freeboard is the freeboard between the expected maximum operating pond and the spillway invert.
During detailed design on the basis of an updated site-wide water balance and beach slopes, using the most stringent criteria which is expected to remain as the ANCOLD guidelines, the timing for raising the embankment will be confirmed as well as the design levels for Stage 3. The spillway inverts adopted for the Stage 1 and Stage 2 are provided in TABLE 18.
20 SPILLWAY DESIGN
Based on the ANCOLD Tailings Dam Guidelines [Ref. 7] the spillway has been designed for a 1:100,000 AEP critical flow as outlined in Section 7. The design assumes very conservatively storage full to spillway level at the start of the rainfall event. The spillway is located at the right/ northern abutment as shown in Figure 3, Figure 5 and Figure 6 with a width of 20 m. The topography of this abutment means that a portion of the lower spillway needs to be filled for the next stage and would require careful consideration during detailed design. The spillway is flat initially and falls away steeply down the abutment. The spillway chute runs into a stilling basin to protect the toe of the embankment. It should be noted that the spillways are for emergency only and not expected to flow during the LOM.
The spillway details are provided in TABLE 16.
TABLE 16
SPILLWAY DESIGN
Stage
Maximum 1:100,000 AEP
critical flow
Spillway Invert
Embankment Crest
Elevation
Discharge (m3/sec)
Depth (m)
(m, AHD) (m, AHD)
Stage 1 (Start-up) 62 1.43 599.5 601.5
Stage 2 53 1.30 609.2 611.0
Stage 3 49 1.22 618.2 620.0
The discharge rates for each stage vary with the storage area available for routing the flood through the decant pond. It should be noted that for mine closure, the spillway would be designed for the Probable Maximum Flood (PMF). It is understood that rehabilitation would consist of a low flux store and release cover. To achieve the self-shedding profile, final deposition of the tailings would be modified to shift the low point towards the spillway location. The spillway invert would then be lowered to the top of the cover. Any additional material cut from the spillway would be used for rehabilitation works such as flattening the embankment. The spillway would be designed with suitable erosion protection and energy dissipaters for the long term.
21 EMBANKMENT DETAILS
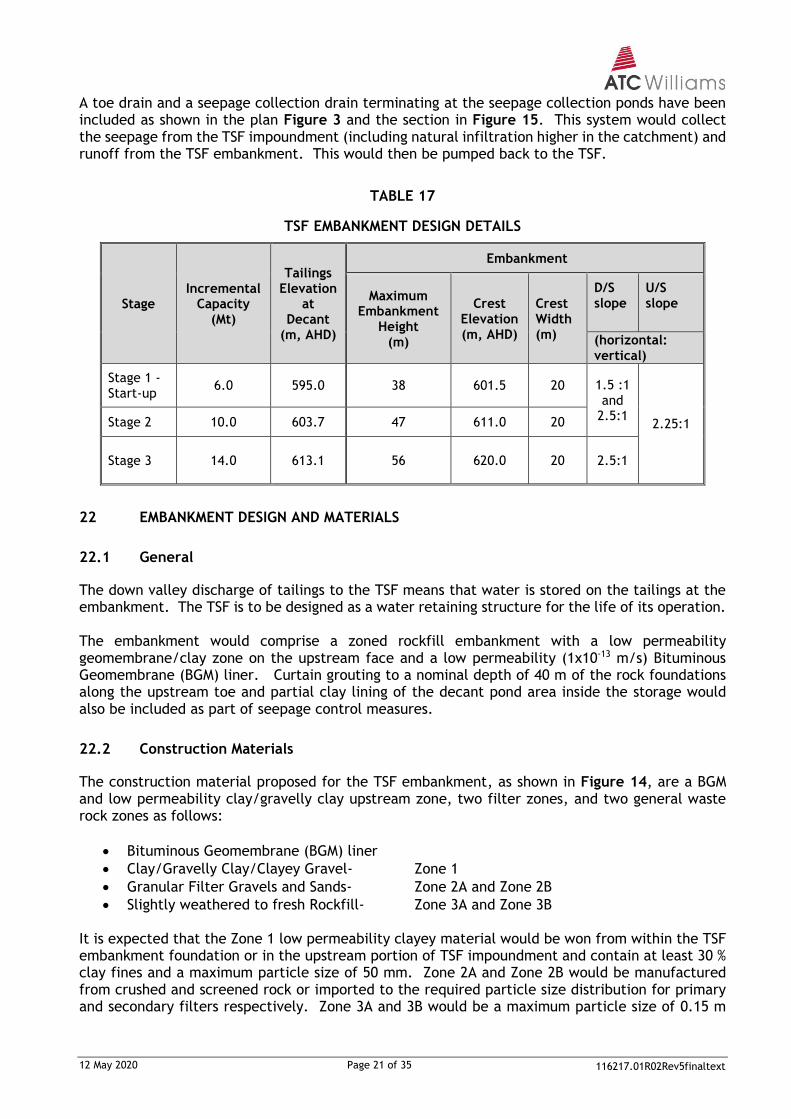
The basic embankment details and the design levels resulting from the storm storage allowance and spillway design are provided in TABLE 17 and the typical section presented in Figure 14.
12 May 2020 Page 21 of 35 116217.01R02Rev5finaltext
A toe drain and a seepage collection drain terminating at the seepage collection ponds have been included as shown in the plan Figure 3 and the section in Figure 15. This system would collect the seepage from the TSF impoundment (including natural infiltration higher in the catchment) and runoff from the TSF embankment. This would then be pumped back to the TSF.
TABLE 17
TSF EMBANKMENT DESIGN DETAILS
Stage Incremental
Capacity (Mt)
Tailings Elevation
at Decant
(m, AHD)
Embankment
Maximum Embankment
Height (m)
Crest Elevation (m, AHD)
Crest Width (m)
D/S slope
U/S slope
(horizontal: vertical)
Stage 1 - Start-up
6.0 595.0 38 601.5 20 1.5 :1 and
2.5:1 2.25:1 Stage 2 10.0 603.7 47 611.0 20
Stage 3 14.0
613.1
56 620.0 20 2.5:1
22 EMBANKMENT DESIGN AND MATERIALS
22.1 General
The down valley discharge of tailings to the TSF means that water is stored on the tailings at the embankment. The TSF is to be designed as a water retaining structure for the life of its operation. The embankment would comprise a zoned rockfill embankment with a low permeability geomembrane/clay zone on the upstream face and a low permeability (1x10-13 m/s) Bituminous Geomembrane (BGM) liner. Curtain grouting to a nominal depth of 40 m of the rock foundations along the upstream toe and partial clay lining of the decant pond area inside the storage would also be included as part of seepage control measures.
22.2 Construction Materials
The construction material proposed for the TSF embankment, as shown in Figure 14, are a BGM and low permeability clay/gravelly clay upstream zone, two filter zones, and two general waste rock zones as follows:
• Bituminous Geomembrane (BGM) liner
• Clay/Gravelly Clay/Clayey Gravel- Zone 1
• Granular Filter Gravels and Sands- Zone 2A and Zone 2B
• Slightly weathered to fresh Rockfill- Zone 3A and Zone 3B It is expected that the Zone 1 low permeability clayey material would be won from within the TSF embankment foundation or in the upstream portion of TSF impoundment and contain at least 30 % clay fines and a maximum particle size of 50 mm. Zone 2A and Zone 2B would be manufactured from crushed and screened rock or imported to the required particle size distribution for primary and secondary filters respectively. Zone 3A and 3B would be a maximum particle size of 0.15 m

12 May 2020 Page 22 of 35 116217.01R02Rev5finaltext
and 0.3 m respectively supplied from the NAF waste rock available from the main open cut pre-strip and any suitable material won during the excavation of the spillway and access road. If any crushing and screening of rock is required it is expected to be undertaken in the 10 ha area immediately southwest of the TSF embankment. The upstream face of the TSF embankment would be lined with a BGM liner which would then be tied into a 40 m deep grout curtain using a concrete plinth to reduce any seepage. The site investigation identified variable rock permeability, so it is expected that it would be necessary to grout the foundations to around 40 m depth with primary, secondary and possibly tertiary grouting to achieve a target permeability of around 10-7 m/sec.
A summary of the earthfill materials required for the embankment zones is provided in TABLE 18 below along with the expected source.
TABLE 18
TSF EMBANKMENT EARTH AND ROCKFILL ZONE MATERIALS
Zone Name Materials Placement and Compaction Source expected
1 Clay
CLAY, sandy CLAY, Clayey SAND (more than 30% passing 75um) and gravelly sandy CLAY
0.2 m (final thickness) horizontal layers, Moisture conditioned to OMC+/- 2% and compact to 98% MDD of standard compaction Maximum particle size 50 mm
Won from embankment foundation excavation and impoundment
2A Filter 2A Gravelly SAND and SAND
0.3 m (final layer thickness) horizontal layers, compact with 3 passes of a 10 t vibrating smooth drum roller Not more than 10% non-plastic fines
External supply or crushed, washed and screened from available NAF waste rock to provide suitable grading.
2B Filter 2B GRAVEL
0.3 m (final layer thickness) horizontal layers, compact with 3 passes of a 10 t vibrating smooth drum roller
External supply or crushed, washed and screened from available NAF waste rock to provide a suitably graded material.
2C Toe Drain GRAVEL
Place loose over geofabric and wrap Maximum particle size 0.05 m
External supply or crushed, washed and screened from available NAF waste rock to provide suitable grading.
3A Rockfill Rock fill
0.3 m (final thickness) horizontal layers. Maximum particle size 0.25 m compact with 6 passes of a 10 t vibrating smooth drum roller
Selected from NAF overburden stripping and WRE 4 km from the site.
3B Rockfill Rockfill
Doze to 0.6 m (final thickness) horizontal layers. Maximum particle size 0.40 m compact with 6 passes of a 10 t vibrating smooth drum roller
Stage 1 supplied in place by 777 mine trucks. Stage 2 and 3 won from WRE 4 km from embankment.

12 May 2020 Page 23 of 35 116217.01R02Rev5finaltext
22.3 Foundations
The foundation treatment for the TSF embankment (Foundation Treatment A), as depicted in Figure 14 and Figure 16, involves stripping the entire footprint to moderately to slightly weathered rock and cleaning the surface of any fine or loose material. The embankment would be grouted to seal up any permeable zones in the embankment foundation, and this would be tied into the BGM liner placed up the upstream face of the embankment. The foundation treatment within the tailings impoundment is divided into the area where the impoundment is above and below the maximum water level as set out in Figure 16. The area where the impoundment is below the maximum water level defines the Foundation Treatment B area. The areas of the impoundment below the maximum water levels (Foundation Treatment B) are to be lined as follows:
• In areas where an adequate thickness of clay exists, a depth of 0.45 m of compacted clay liner would be provided as follows:
o Remove topsoil and any clay required for borrow; o Remove the top 0.3 m of exposed clay; o Rip to a depth of 0.15 m in the natural clay, moisture condition, and compact to 98%
of Standard Compaction; and o Replace the 300mm of clay in two further layers (2 x 150mm). Moisture condition
the clay and compact as previously.
• In areas where clay is a total depth of less than 0.45 m, a total thickness of 0.45m of liner would be provided as follows:
o Remove topsoil and any unsuitable material; o Rip to a depth of 0.15 m in the natural clay (if available), moisture condition, and
compact to 98% of Standard Compaction; and o Place up to three layers (150 mm thick each) of moisture conditioned clay and
compact to 98% of Standard Compaction. Finally, place protective material over the clay to reduce shrinkage cracks from forming, until covered by tailings. This procedure may be carried out in stages ahead of the filling of the storage. The area of the impoundment above the maximum water level would be treated as Foundation Treatment C. This involves ripping, conditioning and compacting the surface stripped of topsoil and any borrow. TABLE 19 summarises these foundation treatments.
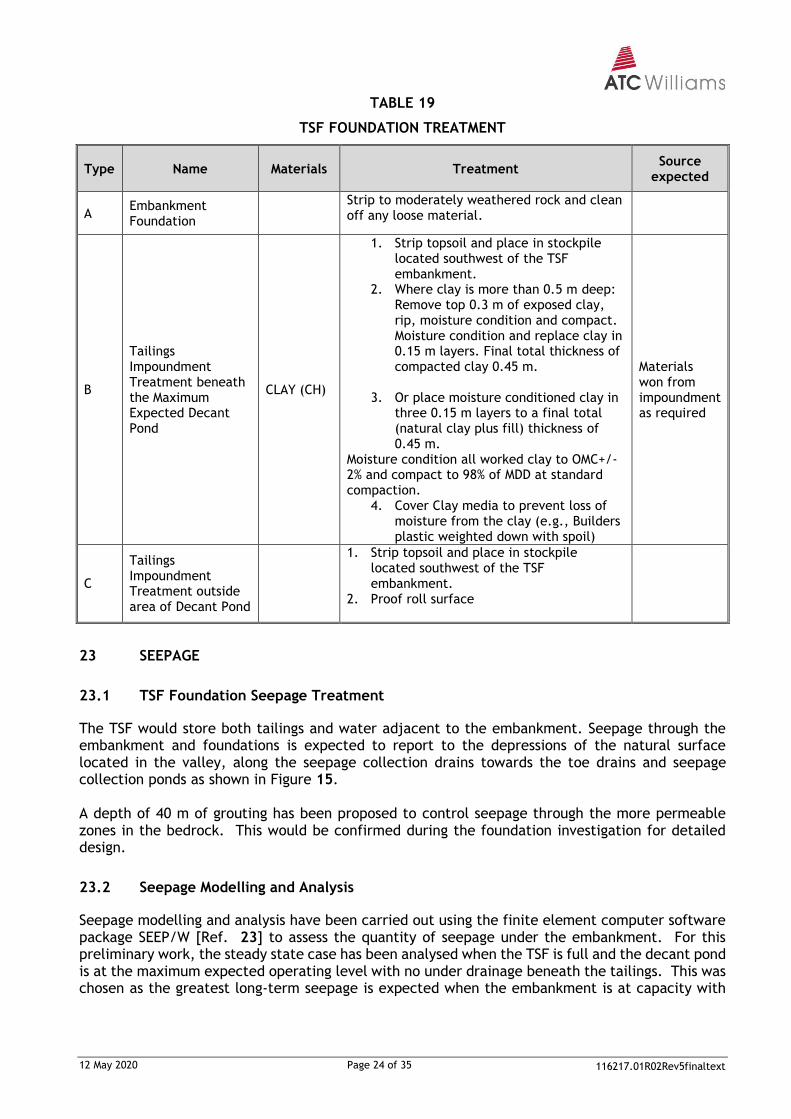
12 May 2020 Page 24 of 35 116217.01R02Rev5finaltext
TABLE 19
TSF FOUNDATION TREATMENT
Type Name Materials Treatment Source
expected
A Embankment Foundation
Strip to moderately weathered rock and clean off any loose material.
B
Tailings Impoundment Treatment beneath the Maximum Expected Decant Pond
CLAY (CH)
1. Strip topsoil and place in stockpile located southwest of the TSF embankment.
2. Where clay is more than 0.5 m deep: Remove top 0.3 m of exposed clay, rip, moisture condition and compact. Moisture condition and replace clay in 0.15 m layers. Final total thickness of compacted clay 0.45 m.
3. Or place moisture conditioned clay in three 0.15 m layers to a final total (natural clay plus fill) thickness of 0.45 m.
Moisture condition all worked clay to OMC+/- 2% and compact to 98% of MDD at standard compaction.
4. Cover Clay media to prevent loss of moisture from the clay (e.g., Builders plastic weighted down with spoil)
Materials won from impoundment as required
C
Tailings Impoundment Treatment outside area of Decant Pond
1. Strip topsoil and place in stockpile located southwest of the TSF embankment.
2. Proof roll surface
23 SEEPAGE
23.1 TSF Foundation Seepage Treatment
The TSF would store both tailings and water adjacent to the embankment. Seepage through the embankment and foundations is expected to report to the depressions of the natural surface located in the valley, along the seepage collection drains towards the toe drains and seepage collection ponds as shown in Figure 15. A depth of 40 m of grouting has been proposed to control seepage through the more permeable zones in the bedrock. This would be confirmed during the foundation investigation for detailed design.
23.2 Seepage Modelling and Analysis
Seepage modelling and analysis have been carried out using the finite element computer software package SEEP/W [Ref. 23] to assess the quantity of seepage under the embankment. For this preliminary work, the steady state case has been analysed when the TSF is full and the decant pond is at the maximum expected operating level with no under drainage beneath the tailings. This was chosen as the greatest long-term seepage is expected when the embankment is at capacity with

12 May 2020 Page 25 of 35 116217.01R02Rev5finaltext
tailings and the elevation of the decant pond is at its maximum as determined by the water balance. For this assessment, this equates to a decant pond elevation of 615.3 m AHD. The permeabilities adopted for the clay, subsoil and rock foundations are based on permeability testing of both in-situ and on remoulded samples in the case of the clays. The permeabilities of the rockfill and sand filters are based on generally accepted values. The permeability of the tailings was based on the VB Sample Rowe Cell test results and consolidation modelling. As the permeability of the tailings is important in the estimation of seepage, particularly in the later years of the LOM and as the tailings tested for this study comprised limited laboratory samples provided by the Project, further testing may be carried out during detailed design. Consequently, the results of the current seepage analysis are subject to confirmation by further work. The permeability coefficients adopted for the analysis based on the results of the geotechnical investigation and typical values for rockfill are set out in TABLE 20.
TABLE 20
PERMEABILITY COEFFICIENTS
Material Type (Zone) Permeability
(m/s)
Clay placed/worked beneath the Decant Pond (0.45 m thick)
5x10⁻¹⁰
Sub-soil (adopt 0.15 m thick) Clay (Zone 1)
1x10⁻⁸ 1x10⁻⁸
Sand Filters (Zone 2A/2B) 1x10⁻⁴
Rockfill (Zone 3A/3B) 1x10⁻⁵
Tailings (Depth 0-3 m) 8x10⁻⁸
Tailings (Depth 3-10 m) 4x10⁻⁸
Tailings (Depth 10-20 m) 2x10⁻⁸
Tailings (Depth 20-45 m) 8x10⁻⁹
Rock Foundations (0 - 50m) 2x10⁻⁶
Rock Foundations (50m – 100m) 4x10⁻⁷
Bituminous Geomembrane 1x10-13
Grout Curtain 5x10⁻⁷
As outlined above, the aim and assumption are that the grout curtain would reduce the higher permeability associated with the zone of fractured rock. Further geotechnical investigation drilling would be required during detailed design to confirm the extent of the fractured rock for the detailed design of the grout curtain.
23.3 Seepage Analysis Results and Discussion
Based on the limited tailings testing and the preliminary geotechnical investigation, the seepage rate based on a 900 m wide flow beneath the Stage 3 Embankment is estimated at about 2 L/s (160 m3/day). The graphical output from SEEP/W is shown in Appendix A.
This seepage would report to the seepage collection system below the embankment rockfill and be collected in two small lined ponds some 50 m by 50 m by 2 m deep. The seepage water together with stormwater runoff from the toe drain would be pumped back to the TSF. The seepage through the foundations would also be monitored as set out in Section 25.1.2. The monitoring would provide data on the presence, depth, and flow direction of groundwater beneath the embankment.
12 May 2020 Page 26 of 35 116217.01R02Rev5finaltext
The standpipe piezometers would also be used to measure the quality of the groundwater alongside the measurement of the quality of the water in the decant to ascertain the extent of seepage from the TSF beyond the seepage collection ponds. If seepage from the decant is detected beyond the seepage collection ponds a seepage interception system would be installed downstream of the seepage collection ponds.
As the parameters adopted for the analysis are dependent on limited testing, further permeability assessment would be carried out during detailed design as follows:
• Detailed tailings testing on a range of typical tailings;
• Detailed geotechnical site investigation as follows: o Embankment foundations to confirm the variation in stripping and the depth of
grouting required; and o Impoundment for clay borrow and seepage conditions.
Because of the limited testing at this preliminary stage of design, it is recommended that a contingency is allowed, in the area of the nominal 2 m decant pond, for further impoundment floor treatment (foundation treatment). The contingency recommended is further foundation treatment in the zone within 150 m of the embankment to reduce the permeability of that area and the inclusion of underdrainage over that foundation treatment and beneath the tailings. The requirement or not for this contingency would become apparent during detailed design.
24 STABILITY ANALYSIS
24.1 Overview
A preliminary design was undertaken for embankment stability under both static and seismic loading conditions. Both upstream and downstream failures were considered. The analyses were conducted for each of the embankment stages, i.e., Stage 1, Stage 2 and Stage 3 embankment sections where the embankment is the highest, which is considered critical for stability. Analyses were carried out using SLOPE/W software [Ref. 24] and employing a GLE (General Limit Equilibrium) approach, which satisfies both force and moment equilibrium.
24.2 Loading Cases
The following loading cases were considered for assessment of embankment stability: 1) End of Construction: Upstream analyses were undertaken for the case when the construction of
each of the stages had been completed.
2) Long-term: Downstream analyses were considered the critical case for the long-term stability for each stage with the phreatic surface at the maximum expected pond level and the tailings at the end of filling.
3) Seismic analysis: Both the MDE and the OBE seismic loadings considered for the downstream embankment slope with the same loading conditions as the long-term. The OBE seismic loading was considered for the upstream slope end of construction case for Stage 1, the critical condition.

12 May 2020 Page 27 of 35 116217.01R02Rev5finaltext
24.3 Seismicity Parameters
As outlined in Section 12.4, the ANCOLD tailings dam guidelines [Ref. 7] defines seismic design for the HIGH C Consequence Category Dam, with two levels of earthquake motion as follows:
• Operating Basis Earthquake: the OBE of a 1:1,000 AEP earthquake is for the purposes of evaluating the serviceability of the dam, rather than its safety. It is an earthquake which could reasonably be expected to occur during the life of the dam, and should only result in minor, easily repairable damage. The dam and appurtenant structures should remain functional after the occurrence of earthquake shaking not exceeding the OBE.
• Maximum Design Earthquake: the MDE 1 in 10,000 AEP earthquake would produce the maximum level of ground motion for which the embankment should be designed or analysed. At the time the design was undertaken this was the minimum requirement that the impounding capacity of the embankments be maintained when subjected to that seismic load. As the ANCOLD guidelines have been updated [Ref. 16] and the minimum requirement reduced, this design may be conservative and would be revisited during detailed design.
No site-specific seismic study has been carried out to date for this preliminary design, but this would be undertaken during detailed design. The earthquake accelerations summarised in the Australian Earthquake Hazard Map [Ref. 25] were adopted for this study. The adopted horizontal peak ground acceleration (PGA) for both the OBE and MDE events are as presented in TABLE 21, where ‘g’ refers to the acceleration due to gravity.
TABLE 21
SUMMARY OF SEISMIC DESIGN CRITERIA AND EARTHQUAKE PARAMETER
Design Event OBE MDE
Average Recurrence Interval 1 in 1,000 years 1 in 10,000 years
Peak Ground Acceleration 0.105 0.30
24.4 Pseudo-Static Stability Methodology
For this preliminary design, pseudo-static analyses were conducted using the specified OBE (serviceability) and MDE (safety) loading cases. MDE analyses were performed using the US Army Corps of Engineers (USACE) screening method [Ref. 26]. For this level of study, the USACE method is an internationally recognised screening tool for seismic instability, applicable to well-constructed embankments not susceptible to liquefaction. The USACE method recommends the use of a seismic coefficient equal to one-half of the peak ground acceleration (PGA) using undrained strength for cohesive materials and drained conditions for free draining granular materials, with a 20 percent strength reduction to allow for strain weakening during the earthquake loading. The design objective was for tolerable predicted deformations under the MDE (safety) criteria. This determination was based upon USACE Screening resultant Factors of Safety (FS) being greater than 1.0, where a USACE screening FS of 1.0 indicates negligible deformations of less than 1 m along the nominal failure “plane” [Ref. 26]. OBE pseudo-static analyses were conducted using conventional, peak strength properties and no reduction factor on the earthquake acceleration, in order to assess the serviceability of the embankments when subjected to an earthquake load which could reasonably be expected during

12 May 2020 Page 28 of 35 116217.01R02Rev5finaltext
their operational lives. In these analyses, an FS greater than 1.0 indicates that there are theoretically no moments during shaking in which deformations occur.
24.5 Material Properties
The soil and rock properties adopted for the analysis were based on the results of the geotechnical investigation [Ref. 1], published literature, established correlations, and previous experience. The properties used in the stability analysis are summarised in TABLE 22. Zone 1 Clay No triaxial test has yet been carried out to evaluate the shear strength of Zone 1 clay. Hence, a preliminary estimate of shear strength for clay has been based on the soil index parameters particle size and plasticity. The undrained shear strength for the clay has conservatively been derived from the curves relating remoulded undrained shear strength to liquidity index established by Skempton and Northey, 1952 [Ref. 27]. The drained shear strength was estimated from the curves relating to friction angle, liquid limit and clay size fraction established by Stark and Eid [Ref. 28]. Zone 2A/2B Filters Significant differences between drained and undrained strength response are not expected for the compacted granular filter materials, nor are they considered susceptible to liquefaction. Consequently, drained strength parameters have been used for Zone 2 filter materials in all stability analyses.
The drained friction angle of 30º for the filters has been conservatively adopted from numerous data sources such as [Ref. 29], which correlate test results for loose to dense, angular gravels and sands. Zone 3A/3B Rockfill Because of the large particle sizes and it is expected essentially well-graded nature of the Zone 3 rockfill materials, significant differences between drained and undrained strength response are not expected. With regard to the shear strength of the rockfill, Leps (1970) [Ref. 30] has shown that the shear strength, as expressed by its friction angle, varies noticeably as the function of the effective normal stress. Leps indicates that the lower bound friction angle for rockfill varies from 360 – 500 for the effective normal stress rage of 10 – 1000 kPa. Conservatively a friction angle of 380 has been adopted for Zone 3A and 3B.

12 May 2020 Page 29 of 35 116217.01R02Rev5finaltext
TABLE 22
ADOPTED SOIL/ROCK STRENGTH PARAMETERS FOR STABILITY ANALYSES
Zone Material
Unit Weight
(kN/m3)
Shear Strength
Drained Parameters Undrained Parameters
c’ (kPa)
Φ’ (degrees)
Su (kPa)
Φ (degrees)
1 Compacted Clay 19 2 28 50 -
2A/2B Sand Filters 18 0 30 0 30
3A/3B Rockfill 22 0 38 0 38
Tailings - 13.2 Strength Ratio (Su/σ’) = 0.25
24.6 Phreatic Surface
It should be noted for the stability analysis it has been assumed that the BGM liner on the upstream surface has a leak causing a phreatic surface to develop in Zone 1. Subsequently, the position of the phreatic surface adopted for the analysis has been estimated on the basis that the embankment Zones 2 and 3 sand and rockfill is relatively free draining. Consequently, the phreatic surface falls sharply away from the active pond level and runs along close to the bedrock surface.
24.7 Stability Analysis Results
24.7.1 Design Criteria
As outlined in Section 12.5, for the purposes of assessing satisfactory performance, the minimum acceptable factor of safety (FS) for the various loading cases are as follows:
• End of Construction FS≥ 1.3
• Static loading for maximum operating pond
FS≥ 1.5
• Seismic Loading OBE for serviceability FS≥ 1.1
• Seismic Loading MDE for safety FS≥ 1.0
24.7.2 Results of Analysis
A summary of the stability analysis results for the TSF static and seismic stability analyses are presented in TABLE 23. The figure numbers in the table refer to the graphical output from SLOPE/W, which are presented in Appendix B. As the embankment crest is 20 m in width, the non-trivial case for failure of the downstream slope was considered to be when over a quarter of the downstream embankment crest would be displaced. However, as these resulting failure surfaces were shallow, a global downstream failure surface was also analysed where at least 50% of the embankment crest and a significant proportion of the downstream face were within the failure zone.

12 May 2020 Page 30 of 35 116217.01R02Rev5finaltext
TABLE 23
SUMMARY OF STABILITY ANALYSES
Load Case Failure Type Factor
of Safety
Allowable Factor of Safety
Figure
Stage 1- Crest Elevation 601.5 m
End of Construction Upstream 1.63 1.3 B1.1
Seismic OBE (pseudo-static analysis) Upstream 1.24 1.1 B1.2
Long-term Static – End of Filling Downstream 1.78 1.5 B1.3
Long-term Static – End of Filling Global Downstream
1.99 1.5 B1.4
Seismic OBE (pseudo-static analysis) Downstream 1.38 1.1 B1.5
Seismic OBE (pseudo-static analysis) Global Downstream
1.51 1.1 B1.6
Seismic MDE - (USACE Method) Downstream 1.02 1.0 B1.7
Stage 2- Crest Elevation 611.0 m
End of Construction Upstream 1.96 1.3 B2.1
Long-term Static – End of Filling Downstream 1.78 1.5 B2.2
Long-term Static – End of Filling Global Downstream
1.98 1.5 B2.3
Seismic OBE (pseudo-static analysis) Downstream 1.38 1.1 B2.4
Seismic OBE (pseudo-static analysis) Global Downstream
1.50 1.1 B2.5
Seismic MDE - (USACE Method) Downstream 1.01 1.0 B2.6
Stage 3 - Crest Elevation 620.0 m
End of Construction Upstream 1.39 1.3 B3.1
Long-term Static – End of Filling Downstream 1.99 1.5 B3.2
Seismic OBE (pseudo-static analysis) Downstream 1.51 1.1 B3.5
Seismic MDE - (USACE Method) Downstream 1.03 1.0 B3.6
The results presented in TABLE 23 indicate that all stages of the Embankment are considered to have adequate FS against static and seismic failures.
25 SURVEILLANCE AND MONITORING
25.1.1 TSF Performance Monitoring
Monitoring the TSF operation would be undertaken to collect the data necessary to evaluate the performance of the TSF with respect to the original design expectations. The data would form the basis of annual surveillance audits, would be used to assess and instigate required maintenance programs, would be used in the detailed design of subsequent stage raises and calibration of the site water balance model.
12 May 2020 Page 31 of 35 116217.01R02Rev5finaltext
Some of the key monitoring items would include the following:
• Routine reconciliation of tailings discharge tonnages and solids concentrations;
• Routine monitoring of tailings beach head and beach toe levels;
• Routine monitoring of water levels and process plant return water rates; and
• Annual field evaluation of tailings beach density and shear strength profiles.
25.1.2 Monitoring – Groundwater and Embankment Settlement
A system of vibrating wire and standpipe piezometers would be installed as set out in Figure 17 and Figure 18, upstream and downstream of the foundation grouting, beneath the embankment, at the toe of the embankment and downstream of the seepage collection ponds. It is proposed that these would be read on a weekly basis. As outlined in Section 23.3, the purpose of these bores would be to provide data on the presence, depth, and flow direction of groundwater beneath the embankment. Water quality testing of the water in the standpipe piezometers and the decant pond would be undertaken on a weekly basis to ascertain the extent of seepage from the TSF beyond the seepage collection ponds. Survey monuments would be installed on the crest of Stage 1, 2 and 3 TSF embankments to monitor settlement of the fill materials. The monuments would be surveyed on a monthly basis.
25.1.3 Surveillance
Surveillance requirements for the TSF would involve routine daily and weekly inspections, as well as mandatory annual audits. The focus of such surveillance would be as follows: Daily Inspections –
Focus on operational issues to do with the TSF, including inspections of the tailings and return water pipelines, tailings discharge point management, decant pond location and decant and return water system operation as well as seepage collection ponds. Weekly Inspections –
Focus on issues that may develop over time and may impact on the safety of the TSF or the environment. These include detailed inspections of the TSF Embankment, all associated structures, tailings beach development and decant pond level, and surveillance of all monitoring installations. 2 Yearly and Annual Audits –
These are conducted by a Dams Engineer and focus on the identification of deficiencies by visual examination of the embankments and all appurtenant structures, as well as a review of all surveillance and monitoring data. Every second year, commencing at the end of the first year of filling, the annual audit is replaced by a comprehensive audit. The comprehensive audit is essentially an annual audit with the addition of the operation of all TSF related equipment for the auditor to observe.
26 DESIGN FOR CLOSURE
The design for closure has being prepared as a separate study (Advisian (2020) [Ref. 31]). Generally, the rehabilitation would likely consist of a low flux store and release cover over the 1.0 km2 of tailings. Once in place, the cover would be revegetated. To achieve a self-shedding profile, final deposition of the tailings would be modified to shift the low point towards the spillway location.
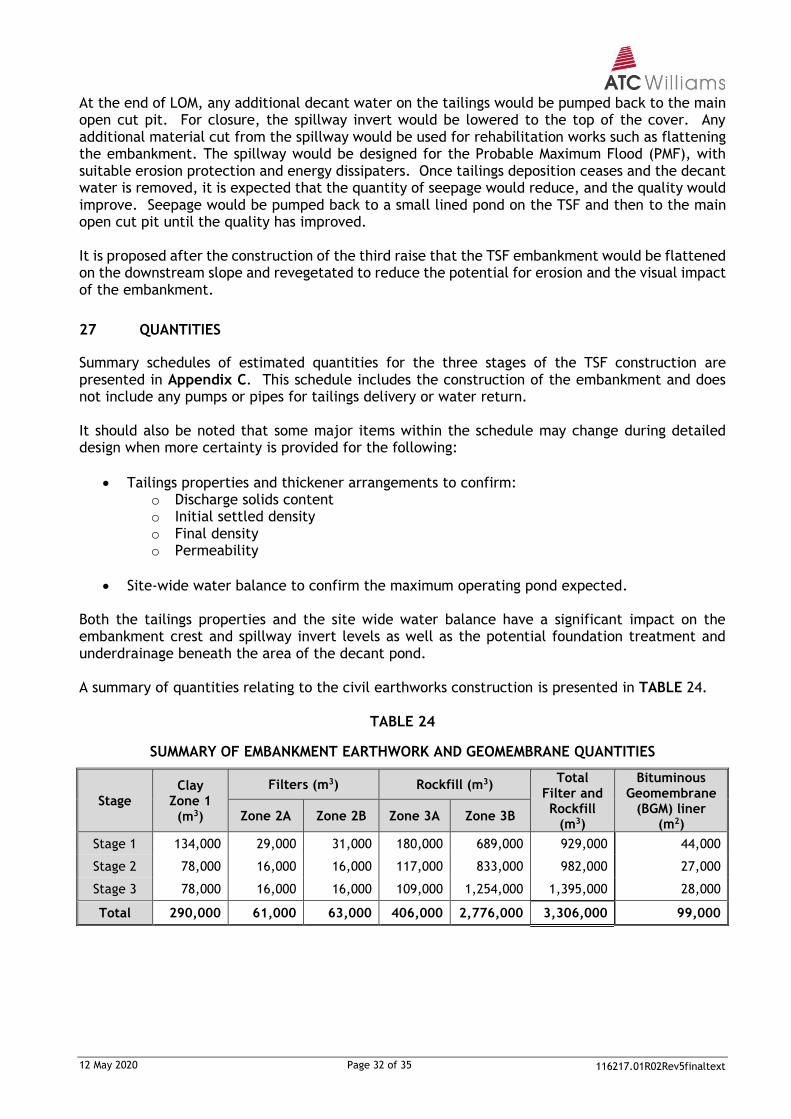
12 May 2020 Page 32 of 35 116217.01R02Rev5finaltext
At the end of LOM, any additional decant water on the tailings would be pumped back to the main open cut pit. For closure, the spillway invert would be lowered to the top of the cover. Any additional material cut from the spillway would be used for rehabilitation works such as flattening the embankment. The spillway would be designed for the Probable Maximum Flood (PMF), with suitable erosion protection and energy dissipaters. Once tailings deposition ceases and the decant water is removed, it is expected that the quantity of seepage would reduce, and the quality would improve. Seepage would be pumped back to a small lined pond on the TSF and then to the main open cut pit until the quality has improved. It is proposed after the construction of the third raise that the TSF embankment would be flattened on the downstream slope and revegetated to reduce the potential for erosion and the visual impact of the embankment.
27 QUANTITIES
Summary schedules of estimated quantities for the three stages of the TSF construction are presented in Appendix C. This schedule includes the construction of the embankment and does not include any pumps or pipes for tailings delivery or water return. It should also be noted that some major items within the schedule may change during detailed design when more certainty is provided for the following:
• Tailings properties and thickener arrangements to confirm: o Discharge solids content o Initial settled density o Final density o Permeability
• Site-wide water balance to confirm the maximum operating pond expected. Both the tailings properties and the site wide water balance have a significant impact on the embankment crest and spillway invert levels as well as the potential foundation treatment and underdrainage beneath the area of the decant pond. A summary of quantities relating to the civil earthworks construction is presented in TABLE 24.
TABLE 24
SUMMARY OF EMBANKMENT EARTHWORK AND GEOMEMBRANE QUANTITIES
Stage Clay
Zone 1 (m3)
Filters (m3) Rockfill (m3) Total
Filter and Rockfill
(m3)
Bituminous Geomembrane
(BGM) liner (m2)
Zone 2A Zone 2B Zone 3A Zone 3B
Stage 1 134,000 29,000 31,000 180,000 689,000 929,000 44,000
Stage 2 78,000 16,000 16,000 117,000 833,000 982,000 27,000
Stage 3 78,000 16,000 16,000 109,000 1,254,000 1,395,000 28,000
Total 290,000 61,000 63,000 406,000 2,776,000 3,306,000 99,000

12 May 2020 Page 33 of 35 116217.01R02Rev5finaltext
28 SUMMARY AND CONCLUSIONS
The preliminary TSF design for 30 Mt of tailings consists of a robust downstream rock and clay fill embankment founded on rock. The TSF embankment would be constructed in three stages. The upstream face of the embankment is covered with a bituminous geomembrane liner connected to a 40 m deep grout curtain to reduce seepage under the TSF embankment. Seepage control is augmented with a 0.45 m clay liner on the impoundment floor to the level of the spillway as well as a seepage collection system beneath the embankment. This seepage collection system discharges to into seepage collection ponds at the downstream toe of the embankment. Any water in the seepage collection pond would then be pumped back to the TSF impoundment. Water in the decant pond on the tailings is returned to the plant for reuse using a floating pontoon pump. An emergency spillway is provided at the TSF abutment for each stage of construction. The preliminary design also includes performance monitoring which entails the installation of instrumentation to monitor groundwater pressures and levels, groundwater quality, seepage volumes and embankment settlements, along with the routine recording of tailings discharge tonnages, decant pond levels, and return water volumes.
29 RECOMMENDATIONS
The following work would need to be undertaken during detailed design:
• Additional Tailings testing;
• Detailed site investigation including borrow investigation for Zone 1, Zone 2 and Zone 3 material;
• Site-specific Seismic Risk study;
• Site-wide water balance;
• Tailings deposition and staging;
• Update Flood storage requirements;
• Dam break analysis;
• Seepage analysis;
• Stability analysis;
• Foundation preparation design;
• Grouting design
• Seepage collection design;
• Underdrainage design (if required); and
• Water recovery system design.
30 CLOSURE
Your attention is drawn to the “Conditions of Report” which appear after the document and history page of this report.
12 May 2020 Page 34 of 35 116217.01R02Rev5finaltext
REFERENCES
Ref. 1 ATC Williams (2017), “Tailings Storage Facility Dam and Water Storage Dam. Preliminary Geotechnical Investigation”, 116217.05 R01, October 2017.
Ref. 2 Jacobs (2020), “Groundwater Impact Assessment”, Specialist Consultant Study Compendium Volume 2, Part 5, Report No. 429/25, May 2020.
Ref. 3 ATC Williams (2017), “Laboratory Testing Report”, 116217.04 R02, April 2017
Ref. 4 ATC Williams (2019), “Bowdens Silver Project, Tailings Testing Consolidation and Permeability”, 116217.08 R01, August 2019.
Ref. 5 Outotec (2017), Thickening Test Report – S474TB Bowdens Silver Project, March 2017.
Ref. 6 ANCOLD, “Guidelines of the Consequence Categories for Dams”, October 2012 and Revised October 2015.
Ref. 7 ANCOLD, “Guidelines on Tailings Dams – Planning, Design, Construction, Operation and Closure”, May 2012.
Ref. 8 ANCOLD, “Guidelines on Design of Dams for Earthquake”, 1998.
Ref. 9 ANCOLD, “Guidelines on Selection of Acceptable Flood Capacity for Dams”, 2000.
Ref. 10 NSW DSC, “Consequence Categories for Dams”, DSC3A, Nov 2015.
Ref. 11 NSW DSC, “Acceptable Flood Capacity for Dams”, DSC3B, June 2010.
Ref. 12 NSW DSC, “Acceptable Earthquake Capacity for Dams”, DSC3C, June 2010.
Ref. 13 NSW DSC, “Tailings Dams”, DSC3F, June 2012.
Ref. 14 NSW DSC, “General Dam Safety Considerations”, DSC3G, June 2010.
Ref. 15 Graeme Campbell & Associates Pty Ltd (2020), “Materials Characterisation Assessment”, Part 3 of the Specialist Consultant Studies Compendium. Prepared on behalf of Bowdens Silver Pty Limited.
Ref. 16 ANCOLD, “Guidelines on Design of Dams for Earthquake”, 2019.
Ref. 17 ANCOLD (2012 Rev1), “Guidelines on Tailings Dams – Planning, Design, Construction, Operation and Closure”, July 2019.
Ref. 18 Pirouz, B., Javadi, S., Seddon, K.D., and Williams M.P.A. (2014) Modified Beach Slope prediction model for non-segregating thickened tailings, in Proceedings 17th International Seminar on Paste and Thickened Tailings (Paste 2014), Vancouver, Canada, pp. 31-46.
Ref. 19 SVOffice (2009), “SVSolid & SVFlux 1D/2D/3D Consolidation Modelling Software (Version 2.4.29)”, Soil Vision Systems Ltd.
Ref. 20 SVOffice (2009), “SV Solid 1D/2D/3D Finite Element Stress Deformation Modelling”, Soil Vision Systems Ltd.
Ref. 21 SVOffice (2009), “SV Flux 1D/2D/3D Saturated/Unsaturated Fine Element Groundwater Seepage Modelling”, Soil Vision Systems Ltd.
Ref. 22 WRM (2020), ‘Bowdens Silver Project Surface Water Assessment’, Specialist Consultant Studies Compendium, 1356-01-R4, 22 November 2019. May 2020.
12 May 2020 Page 35 of 35 116217.01R02Rev5finaltext
Ref. 23 GEO-SLOPE International Ltd (June 2013), “SEEP/W 2012 for Seepage Analysis – Version
8” Calgary, Canada.
Ref. 24 GEO-SLOPE International Ltd (June 2013), “SLOPE/W 2012 for Slope Stability Analysis – Version 8” Calgary, Canada.
Ref. 25 Australian Government, Geoscience Australia (2012), “The 2012 Australian Earthquake Hazard Map”, Record 2012/71.
Ref. 26 Hynes-Griffin M.E., Franklin A.G. (1984), “Rationalizing the Seismic Coefficient Method”, US Army Corps of Engineers.
Ref. 27 Skempton, A. W. and Northey, R.D (1952) “The sensitivity of Clays” Geotechnique 3, No. 1, pp 30-53.
Ref. 28 Stark, T. D. and Hisham T. Eds (April 1997) “Slope Stability Analyses in Fissured Clays” ASCE, Vol. 123 No 4, pp 338.
Ref. 29 Carter, M. & Bentley, S.P. (1991) “Correlations of Soil Properties”, Pentech Press, London.
Ref. 30 Leps, T.M. (1970), “Review of Shearing Strength of Rockfill”, Journal of Soil Mechanics and Foundations Division, SM4, pp. 1159-1170.
Ref. 31 Advisian (2020), “Bowdens Silver Project, TSF and WRE Closure Cover Design ”, May 2020.

F I G U R E S
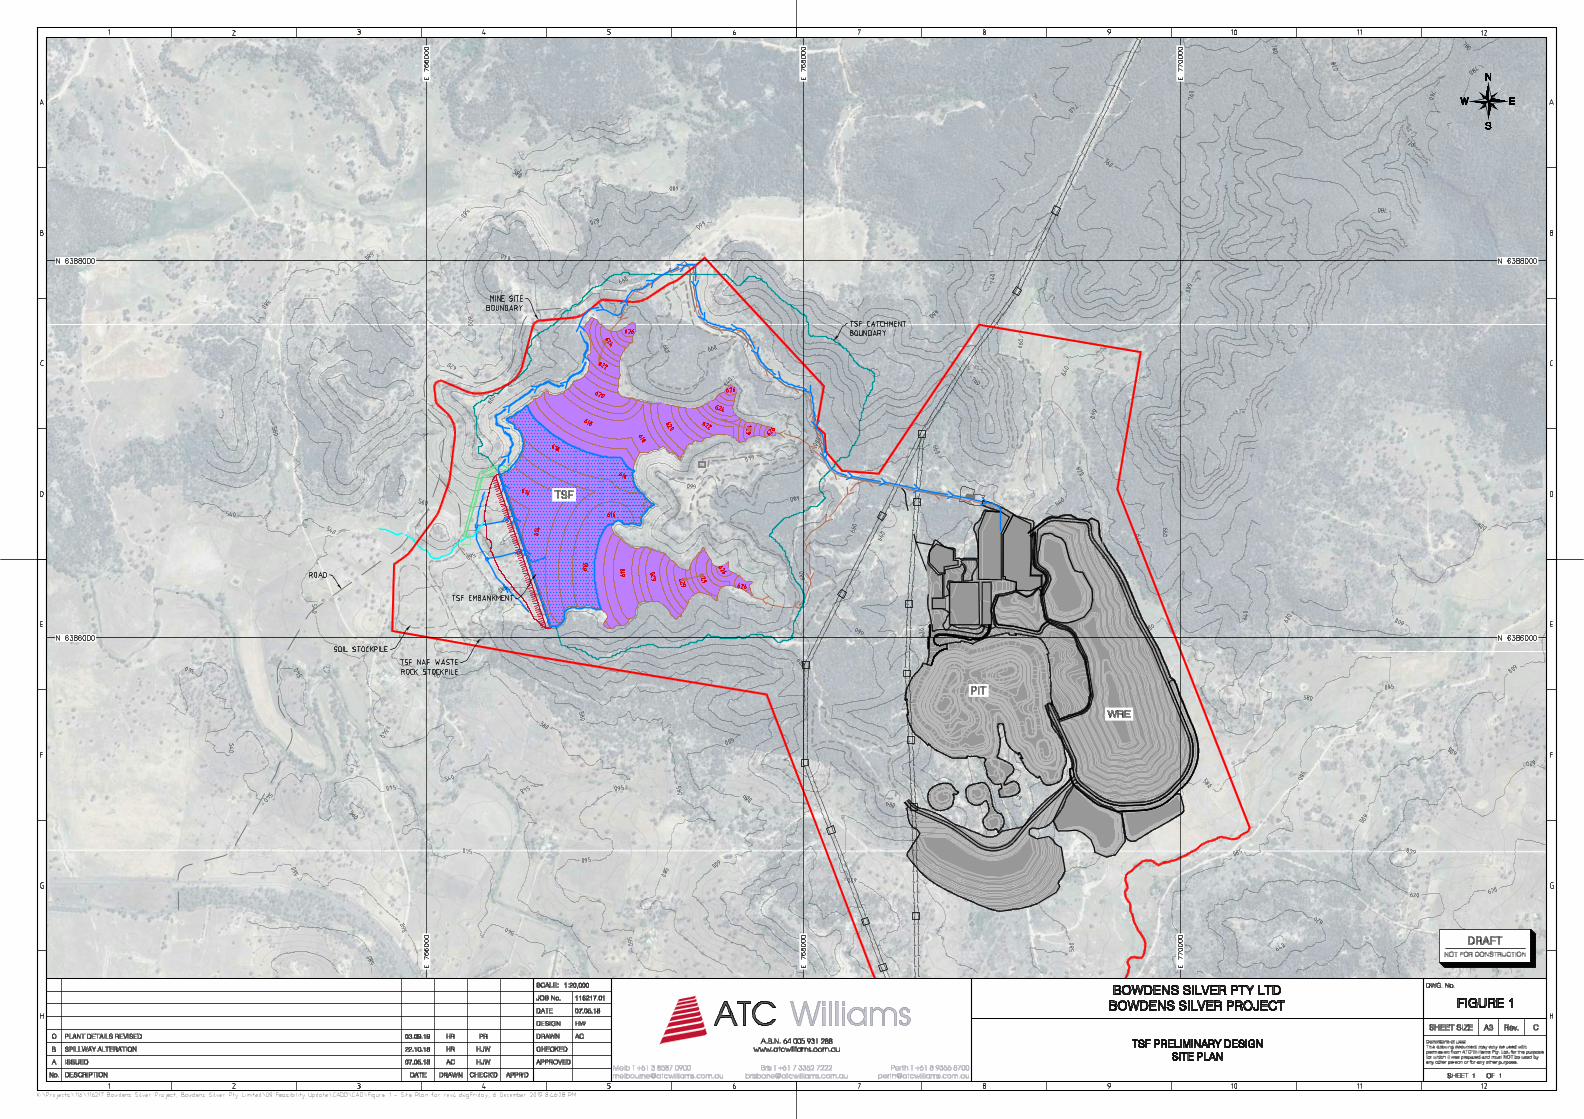
P
P
P
P
P
P
P
P
P
P
P
P
P
P
P
P
P
P
P
P
P
P
P
P
P
P
P
P
P
P
P
P
P
P
P
P
P
P
P
P
P
P
P
PP
PP
PP
PP
PP
PP
PP
PP
PP
PP
P
P
P
P
P
P
P
P
P
P
P
P
P
P
P
P
P
P
P
P
P
P
P
P
P
P
P
P
P
P
P
P
P
P
P
P
P
P
P
P
P
P
P
P
P
P
P
P
P
P
P
P
P
P
P
P
P
P
P
P
P
P
P
P
P
P
P
P
P
P
P
P
P
P
P
P
P
P
P
P
P
P
P
P
P
P
P
P
P
P
P
PP
PP
PP
PP
PP
PP
PP
PP
PP
PP
P
P
P
P
P
P
P
P
P
P
P
P
P
P
P
P
P
P
P
P
P
P
P
P
P
P
P
P
P
P
P
P
P
P
P
P
P
P
P
P
P
P
P
P
P
P
P
P
PP
PP
PP
PP
PP
PP
PP
PP
PP
PP
PP
PP
PP
PP
PP
PP
PP
PP
PP
PP
PP
PP
PP
PP
PP
PP
P
P
P
P
P
P
P
P
P
P
P
P
P
P
P
P
P
P
P
P
P
P
P
P
P
P
P
P
P
P
P
P
P
P
P
P
P
P
P
P
P
P
P
PP
PP
PP
PP
PP
PP
PP
PP
PP
PP
PP
PP
PP
PP
PP
PP
PP
PP
PP
PP
PP
PP
PP
PP
PP
P
P
P
P
P
P
P
P
P
P
P
P
P
P
P
P
P
P
P
P
P
P
P
P
P
P
P
P
P
P
P
P
P
P
P
P
P
P
P
P
P
P
P
P
▲
▲
▲▲
▲▲
▲
▲▲
▲
▲▲
▲
▲▲
▲
▲▲
▲
▲
▲▲
▲
▲
▲▲
▲
▲▲
▲
▲▲
▲
▲
▲
▲▲
▲
▲
▲
▲▲
▲▲
▲
▲
▲
▲
▲
▲
▲
▲
▲▲ ▲
▲ ▲
▲▲
▲
▲
▲
▲
▲
▲▲
▲▲
▲
▲
▲
▲▲
▲
▲
▲▲
▲▲
▲
▲▲
▲
▲▲
▲
▲
▲
▲
▲
▲
▲
▲
▲▲
▲▲
▲
▲
▲
▲▲
▲
▲
▲▲
▲▲
▲▲
▲▲
▲
▲▲
▲▲
▲
▲▲
▲
▲
▲▲
▲▲
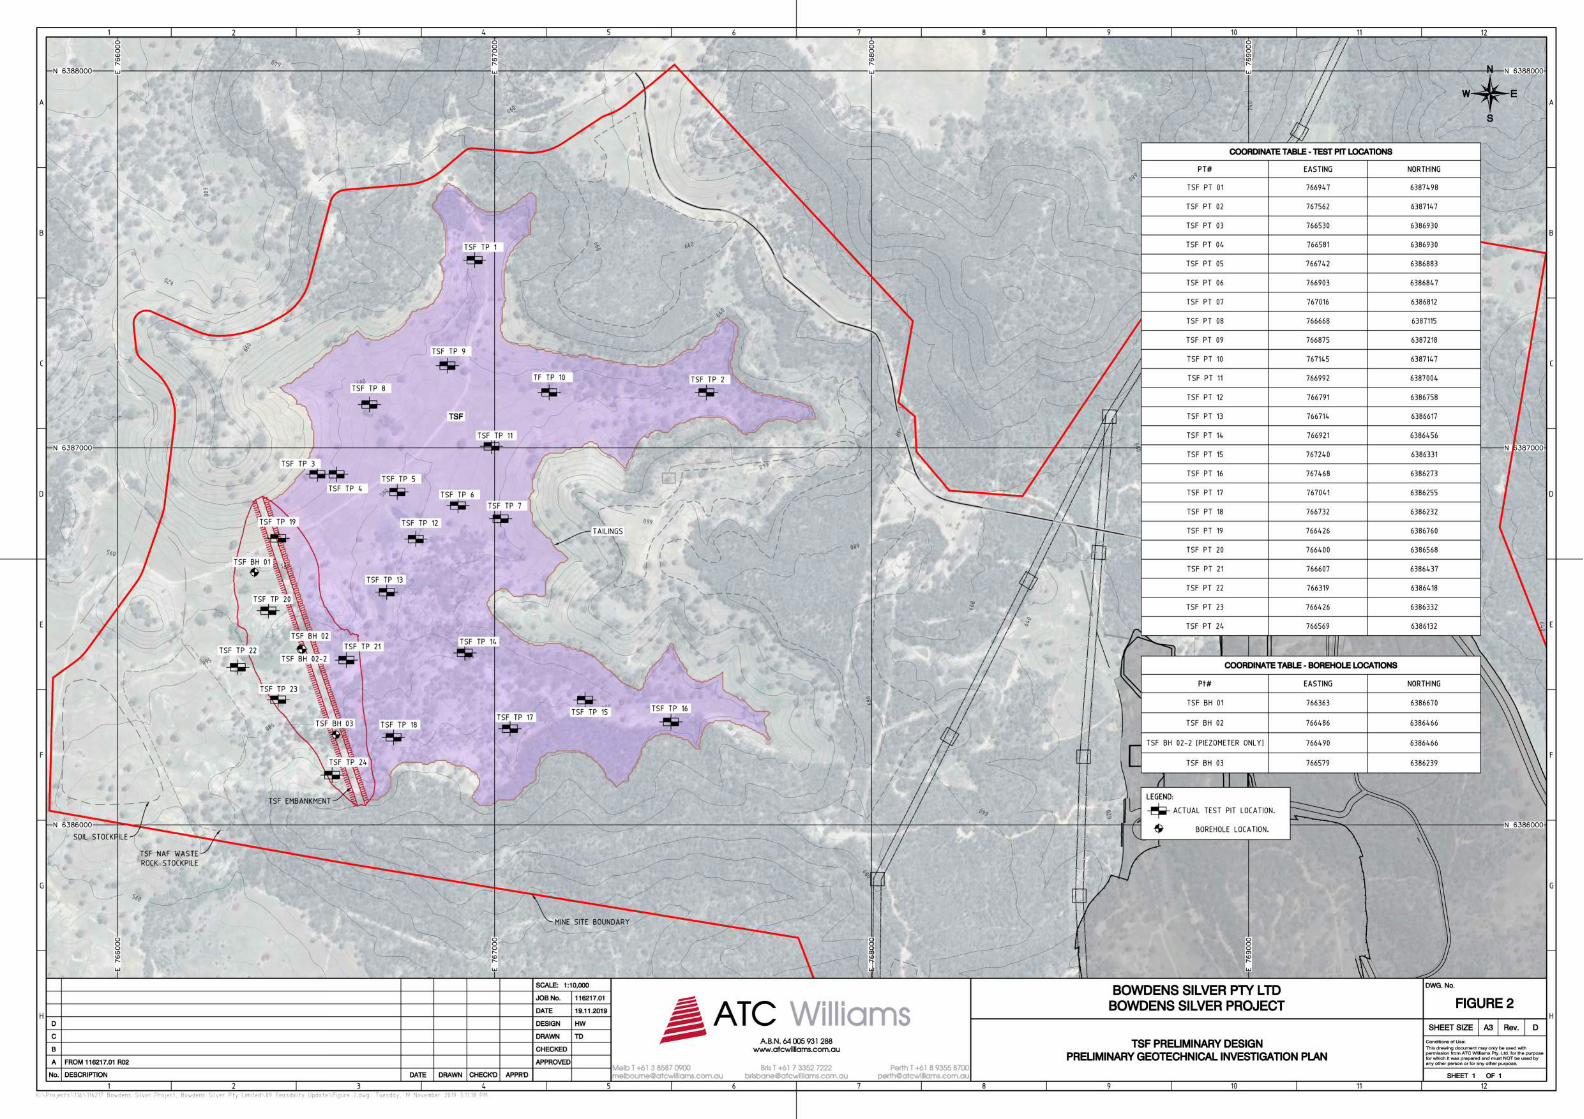

BOWDENS SILVER PTY LTD
BOWDENS SILVER PROJECT
TSF PRELIMINARY DESIGN
Ground Water Monitoring at TSF
Date: 27/11/2019 Job No: 116217.01 FIGURE 3
ATC Williams Pty Ltd222 Beach Road (P.O. Box 5286)
Mordialloc Vic 3195AUSTRALIA
T +61 3 8587 0900 F +61 3 8587 0901
[email protected] www.atcwilliams.com.au
0
0.5
1
1.5
2
2.5
3
3.5
4
4.5
5
1/0
6/2
017
1/0
7/2
017
31/
07/2
017
31/
08/2
017
30/
09/2
017
31/
10/2
017
30/
11/2
017
31/
12/2
017
30/
01/2
018
1/0
3/2
018
1/0
4/2
018
1/0
5/2
018
1/0
6/2
018
1/0
7/2
018
1/0
8/2
018
31/
08/2
018
1/1
0/2
018
31/
10/2
018
30/
11/2
018
31/
12/2
018
30/
01/2
019
2/0
3/2
019
1/0
4/2
019
2/0
5/2
019
1/0
6/2
019
1/0
7/2
019
1/0
8/2
019
31/
08/2
019
1/1
0/2
019
31/
10/2
019
1/1
2/2
019
Dep
th t
o w
ater
(m
)
Date
TSF BH02 (BGW60) TSF BH02-02 (BGW61)
K:\Projects\116\116217 Bowdens Silver Project, Bowdens Silver Pty Limited\09 Feasibility Update\Data and Calcs\Figure update for Rev 3 Preliminary design report\TSF Water Monitoring - DTW.xlsx Figure 2


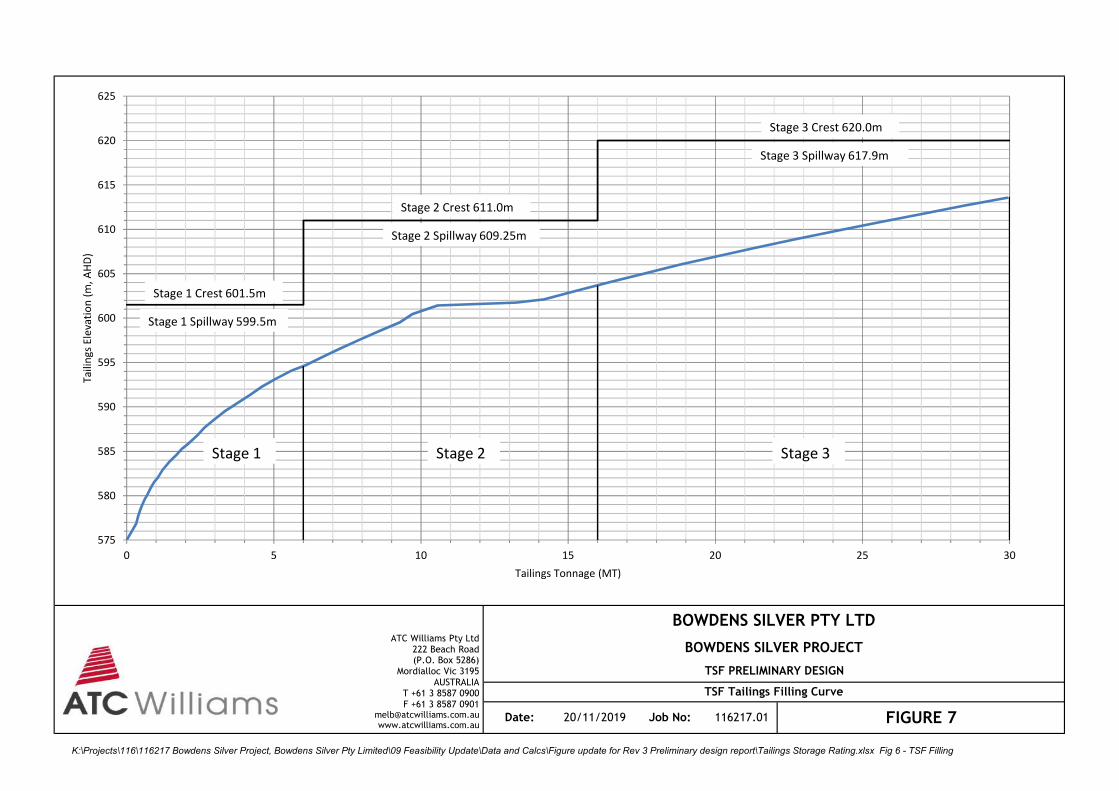
BOWDENS SILVER PTY LTD
BOWDENS SILVER PROJECT
TSF PRELIMINARY DESIGN
TSF Tailings Filling Curve
Date: 20/11/2019 Job No: 116217.01 FIGURE 7
ATC Williams Pty Ltd222 Beach Road (P.O. Box 5286)
Mordialloc Vic 3195AUSTRALIA
T +61 3 8587 0900 F +61 3 8587 0901
[email protected] www.atcwilliams.com.au
575
580
585
590
595
600
605
610
615
620
625
0 5 10 15 20 25 30
Ta
ilin
gs
Ele
va
tio
n (
m,
AH
D)
Tailings Tonnage (MT)
Stage 1 Crest 601.5m
Stage 1 Spillway 599.5m
Stage 2 Crest 611.0m
Stage 2 Spillway 609.25m
Stage 3 Crest 620.0m
Stage 3 Spillway 617.9m
Stage 1 Stage 3Stage 2
K:\Projects\116\116217 Bowdens Silver Project, Bowdens Silver Pty Limited\09 Feasibility Update\Data and Calcs\Figure update for Rev 3 Preliminary design report\Tailings Storage Rating.xlsx Fig 6 - TSF Filling
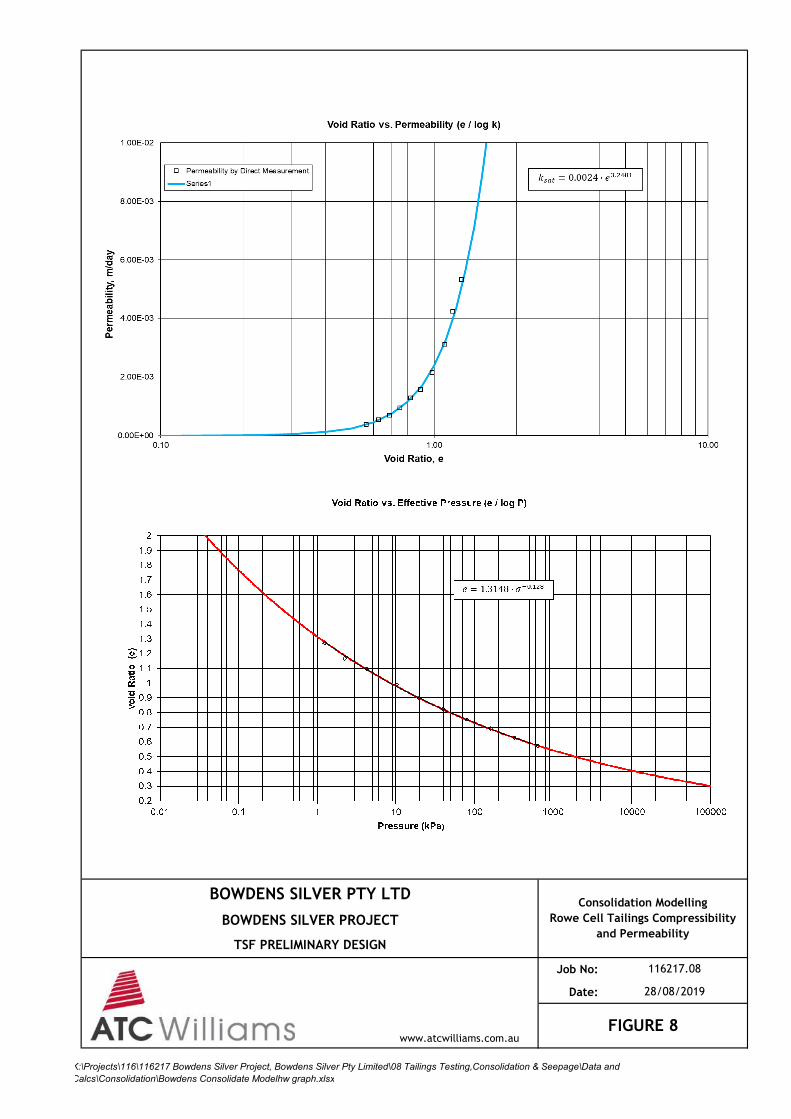
Job No:
Date:
BOWDENS SILVER PROJECT
FIGURE 8
116217.08
28/08/2019
BOWDENS SILVER PTY LTD
TSF PRELIMINARY DESIGN
Consolidation Modelling
Rowe Cell Tailings Compressibility
and Permeability
www.atcwilliams.com.au
K:\Projects\116\116217 Bowdens Silver Project, Bowdens Silver Pty Limited\08 Tailings Testing,Consolidation & Seepage\Data and
Calcs\Consolidation\Bowdens Consolidate Modelhw graph.xlsx

BOWDENS SILVER PTY LTD
BOWDENS SILVER PROJECT
TSF PRELIMINARY DESIGN
Consolidation Modelling - Tailings Depth Versus Time
Date: 23/07/2019 Job No: 116217.08 FIGURE 9
0
2
4
6
8
10
12
14
16
18
20
22
24
26
28
30
0.0 0.5 1.0 1.5 2.0 2.5 3.0
Maxim
um
Colu
mn H
eig
ht
(m)
Year
Consolidated Depth
Modelling start depth at 1.04 t/m3
Time = 1 YearAverage Dry Density = 1.27 t/m3
Consolidated Depth = 12.34 m
Time = 2 YearsAverage Dry Density = 1.35 t/m3
Consolidated Depth = 17.7 m
Time = 3 YearsAverage Dry Density = 1.42 t/m3
Consolidated Depth = 20.6 m
ATC Williams Pty Ltd19 Beach Avenue(P.O. Box 5286)
Mordialloc Vic 3195AUSTRALIA
T +61 3 9590 9222F +61 3 9590 9228
K:\Projects\116\116217 Bowdens Silver Project, Bowdens Silver Pty Limited\09 Feasibility Update\Data and Calcs\Figure update for Rev 3 Preliminary design report\Bowdens Consolidate Modelhw graph.xlsx Figure 8
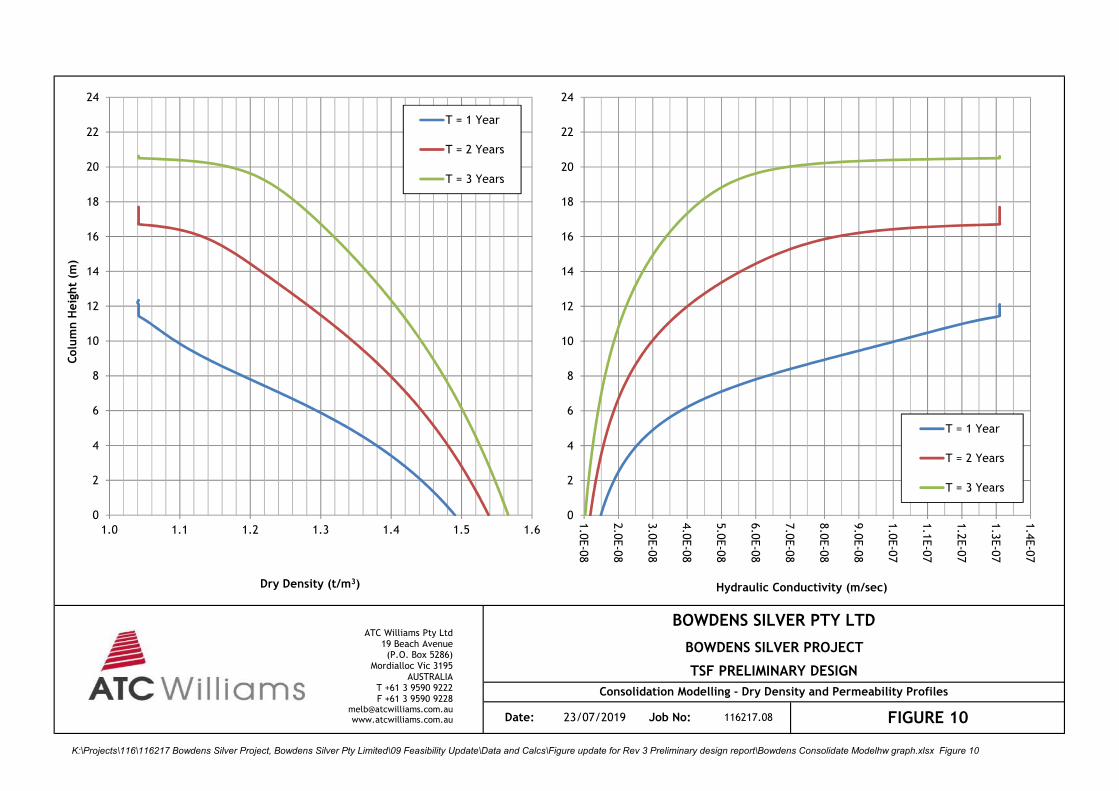
BOWDENS SILVER PTY LTD
BOWDENS SILVER PROJECT
TSF PRELIMINARY DESIGN
Consolidation Modelling - Dry Density and Permeability Profiles
Date: 23/07/2019 Job No: 116217.08 FIGURE 10
ATC Williams Pty Ltd19 Beach Avenue(P.O. Box 5286)
Mordialloc Vic 3195AUSTRALIA
T +61 3 9590 9222F +61 3 9590 9228
0
2
4
6
8
10
12
14
16
18
20
22
24
1.0 1.1 1.2 1.3 1.4 1.5 1.6
Colu
mn H
eig
ht
(m)
Dry Density (t/m3)
T = 1 Year
T = 2 Years
T = 3 Years
0
2
4
6
8
10
12
14
16
18
20
22
24
1.0
E-0
8
2.0
E-0
8
3.0
E-0
8
4.0
E-0
8
5.0
E-0
8
6.0
E-0
8
7.0
E-0
8
8.0
E-0
8
9.0
E-0
8
1.0
E-0
7
1.1
E-0
7
1.2
E-0
7
1.3
E-0
7
1.4
E-0
7
Hydraulic Conductivity (m/sec)
T = 1 Year
T = 2 Years
T = 3 Years
K:\Projects\116\116217 Bowdens Silver Project, Bowdens Silver Pty Limited\09 Feasibility Update\Data and Calcs\Figure update for Rev 3 Preliminary design report\Bowdens Consolidate Modelhw graph.xlsx Figure 10

BOWDENS SILVER PTY LTD
BOWDENS SILVER PROJECT
TSF PRELIMINARY DESIGN
Consolidation Modelling - Excess and Total Pore Water Pressure Profiles
Date: 23/07/2019 Job No: 116217.08 FIGURE 11
ATC Williams Pty Ltd19 Beach Avenue(P.O. Box 5286)
Mordialloc Vic 3195AUSTRALIA
T +61 3 9590 9222F +61 3 9590 9228
0
2
4
6
8
10
12
14
16
18
20
22
24
0 20 40 60 80 100
Colu
mn H
eig
ht
(m)
Excess Pore Water Pressure (kPa)
T = 1 Year
T = 2 Years
T = 3 Years
0 50 100 150 200 250 300 350
Pore Water Pressure (kPa)
T = 1 Year
T = 2 Years
T = 3 Years
K:\Projects\116\116217 Bowdens Silver Project, Bowdens Silver Pty Limited\09 Feasibility Update\Data and Calcs\Figure update for Rev 3 Preliminary design report\Bowdens Consolidate Modelhw graph.xlsx Figure 11

BOWDENS SILVER PTY LTD
BOWDENS SILVER PROJECT
TSF Preliminary Design
Expected Impoundment Liner Seepage Rates
Date: 20/08/2019 Job No: 116217.08 FIGURE 12www.atcwilliams.com.au
1.0E-09
2.0E-09
3.0E-09
4.0E-09
5.0E-09
6.0E-09
7.0E-09
8.0E-09
9.0E-09
1.0E-08
1.1E-08
1.2E-08
1.3E-08
1.4E-08
1.5E-08
1.6E-08
1.7E-08
1.8E-08
1.9E-08
2.0E-08
2.1E-08
2.2E-08
2.3E-08
0 5 10 15 20 25
Seepage (
m3/s/
m2)
Head of Water/Tailings (m)
Maximum Allowable Seepage Rates Seepage Rate - 0.45 m thick clay Seepage Rate - 0.7 m thick clay
K:\Projects\116\116217 Bowdens Silver Project, Bowdens Silver Pty Limited\09 Feasibility Update\Data and Calcs\Figure update for Rev 3 Preliminary design report\Figure 1.xlsx Figure 1
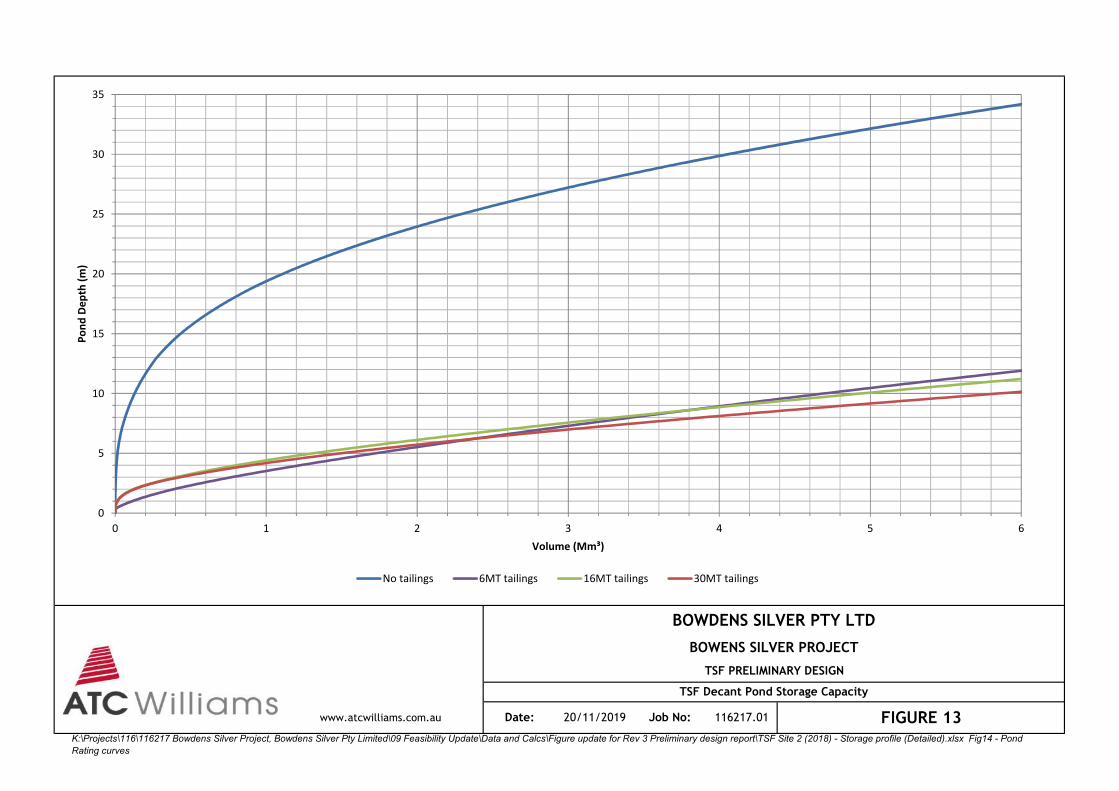
Date: 20/11/2019 Job No: 116217.01 FIGURE 13
BOWDENS SILVER PTY LTD
BOWENS SILVER PROJECT
TSF PRELIMINARY DESIGN
TSF Decant Pond Storage Capacity
www.atcwilliams.com.au
0
5
10
15
20
25
30
35
0 1 2 3 4 5 6
Po
nd
De
pth
(m
)
Volume (Mm³)
No tailings 6MT tailings 16MT tailings 30MT tailings
K:\Projects\116\116217 Bowdens Silver Project, Bowdens Silver Pty Limited\09 Feasibility Update\Data and Calcs\Figure update for Rev 3 Preliminary design report\TSF Site 2 (2018) - Storage profile (Detailed).xlsx Fig14 - Pond
Rating curves

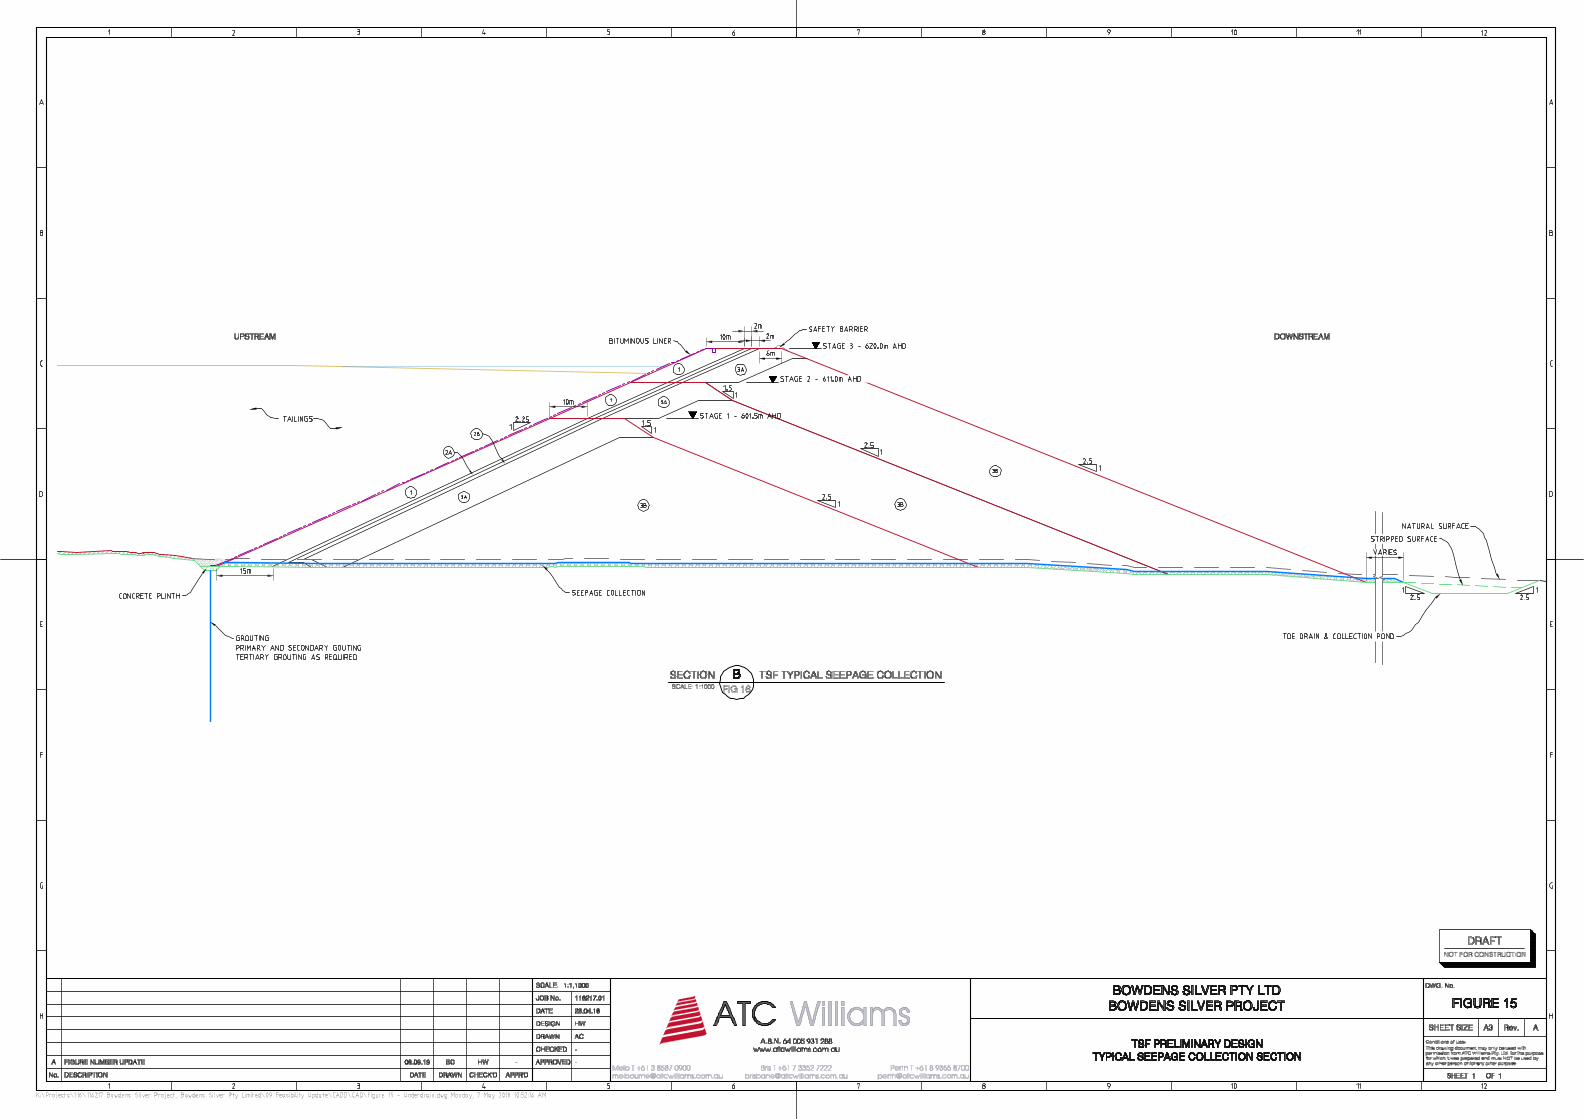
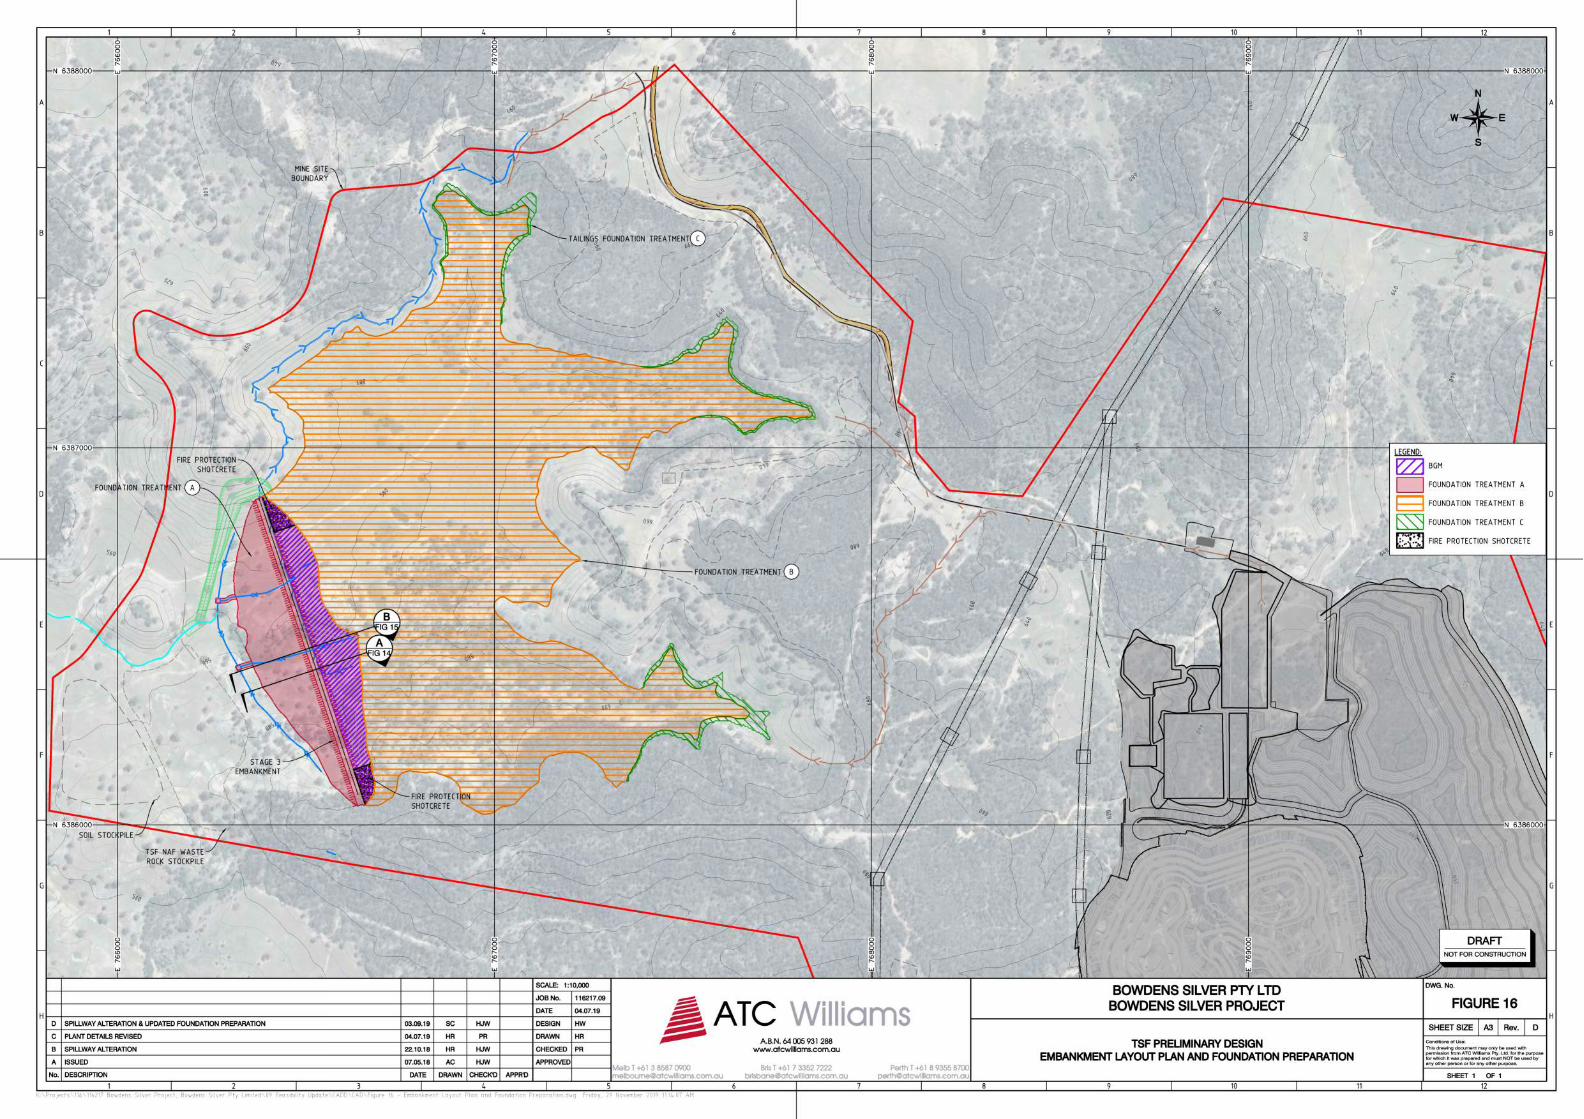
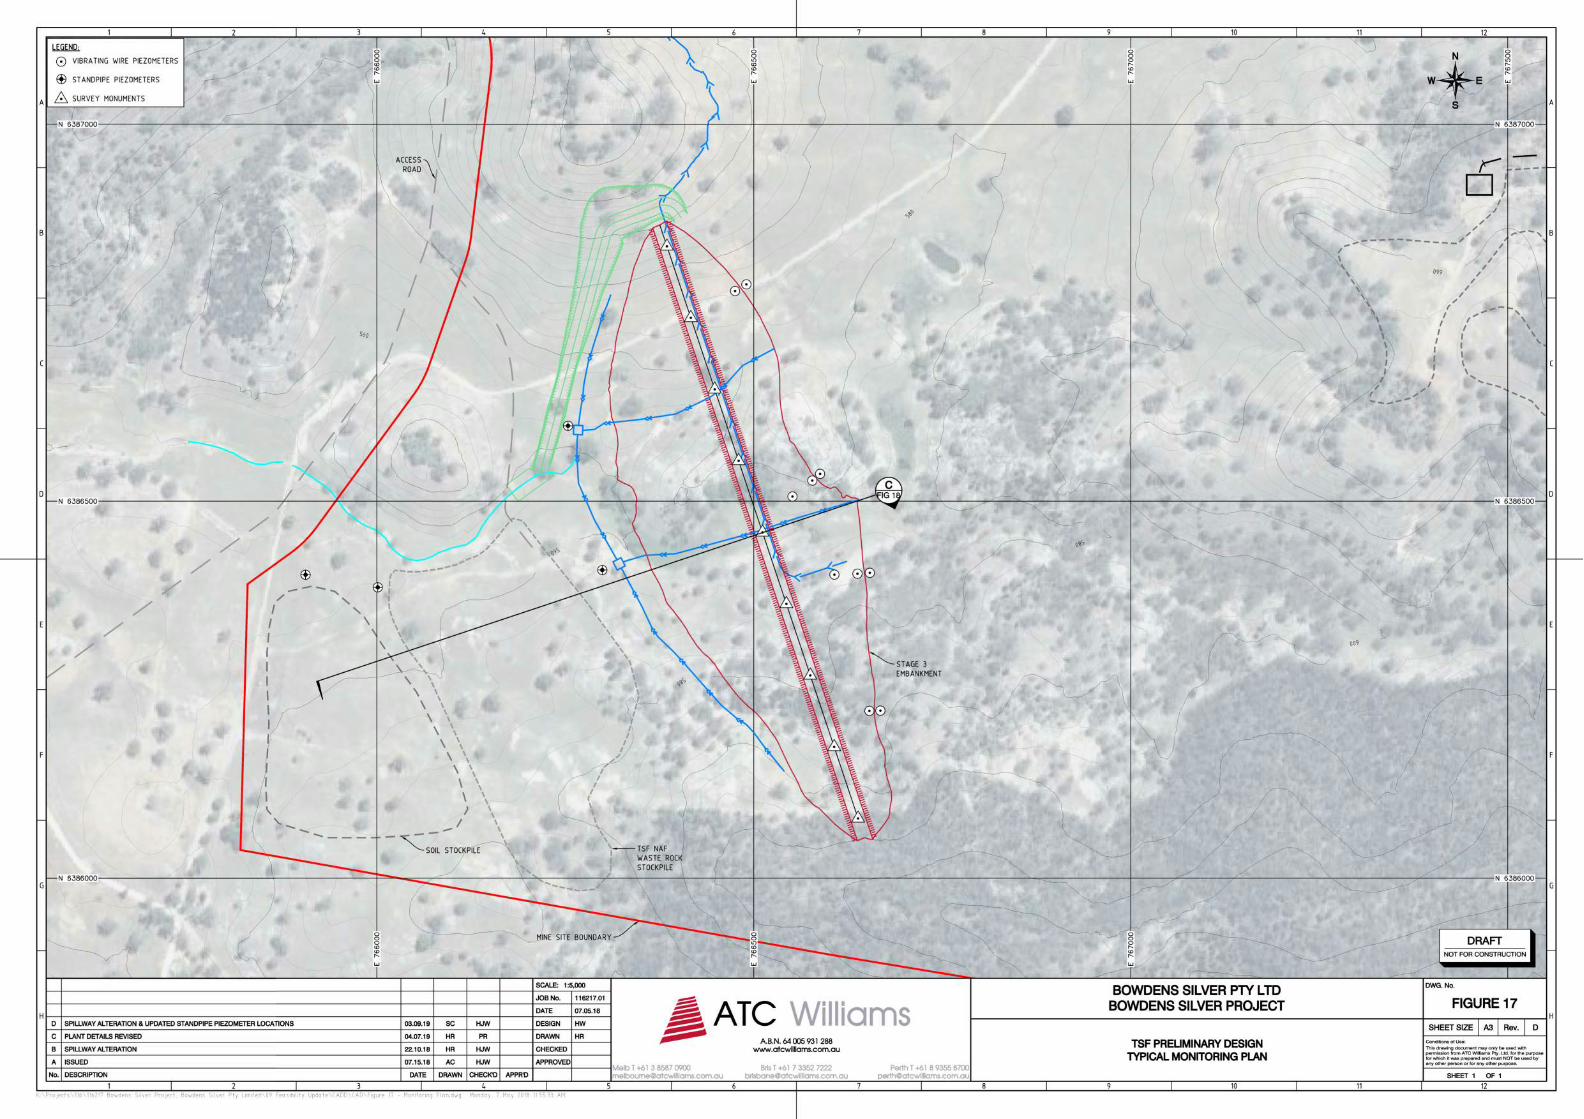


A P P E N D I C E S

A P P E N D I X A
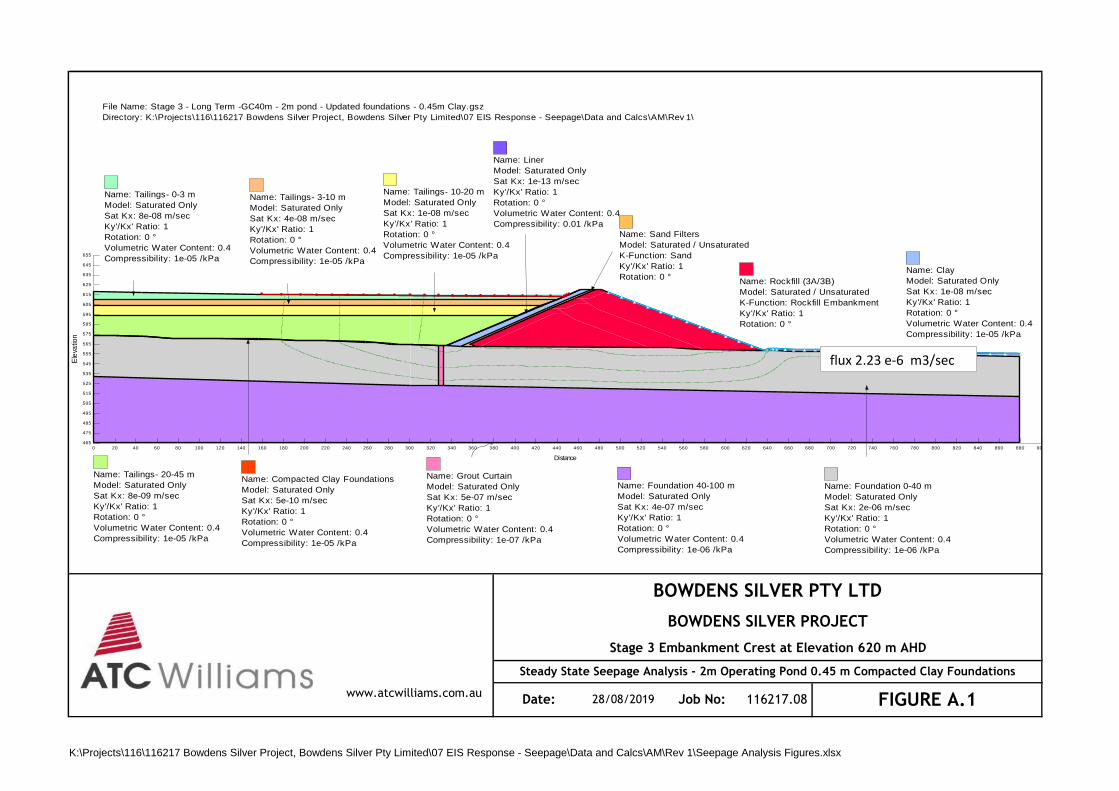
BOWDENS SILVER PTY LTD
BOWDENS SILVER PROJECT
Stage 3 Embankment Crest at Elevation 620 m AHD
Steady State Seepage Analysis - 2m Operating Pond 0.45 m Compacted Clay Foundations
Date: 28/08/2019 Job No: 116217.08 FIGURE A.1www.atcwilliams.com.au
Distance
0 20 40 60 80 100 120 140 160 180 200 220 240 260 280 300 320 340 360 380 400 420 440 460 480 500 520 540 560 580 600 620 640 660 680 700 720 740 760 780 800 820 840 860 880 900
Ele
vatio
n
465
475
485
495
505
515
525
535
545
555
565
575
585
595
605
615
625
635
645
655
File Name: Stage 3 - Long Term -GC40m - 2m pond - Updated foundations - 0.45m Clay.gsz
Directory: K:\Projects\116\116217 Bowdens Silver Project, Bowdens Silver Pty Limited\07 EIS Response - Seepage\Data and Calcs\AM\Rev 1\
Name: Rockfill (3A/3B)
Model: Saturated / Unsaturated
K-Function: Rockfill Embankment
Ky'/Kx' Ratio: 1
Rotation: 0 °
Name: Foundation 0-40 m
Model: Saturated Only
Sat Kx: 2e-06 m/sec
Ky'/Kx' Ratio: 1
Rotation: 0 °
Volumetric Water Content: 0.4
Compressibility: 1e-06 /kPa
Name: Sand Filters
Model: Saturated / Unsaturated
K-Function: Sand
Ky'/Kx' Ratio: 1
Rotation: 0 °Name: Clay
Model: Saturated Only
Sat Kx: 1e-08 m/sec
Ky'/Kx' Ratio: 1
Rotation: 0 °
Volumetric Water Content: 0.4
Compressibility: 1e-05 /kPa
Name: Tailings- 20-45 m
Model: Saturated Only
Sat Kx: 8e-09 m/sec
Ky'/Kx' Ratio: 1
Rotation: 0 °
Volumetric Water Content: 0.4
Compressibility: 1e-05 /kPa
Name: Foundation 40-100 m
Model: Saturated Only
Sat Kx: 4e-07 m/sec
Ky'/Kx' Ratio: 1
Rotation: 0 °
Volumetric Water Content: 0.4
Compressibility: 1e-06 /kPa
Name: Liner
Model: Saturated Only
Sat Kx: 1e-13 m/sec
Ky'/Kx' Ratio: 1
Rotation: 0 °
Volumetric Water Content: 0.4
Compressibility: 0.01 /kPa
Name: Grout Curtain
Model: Saturated Only
Sat Kx: 5e-07 m/sec
Ky'/Kx' Ratio: 1
Rotation: 0 °
Volumetric Water Content: 0.4
Compressibility: 1e-07 /kPa
Name: Compacted Clay Foundations
Model: Saturated Only
Sat Kx: 5e-10 m/sec
Ky'/Kx' Ratio: 1
Rotation: 0 °
Volumetric Water Content: 0.4
Compressibility: 1e-05 /kPa
Name: Tailings- 10-20 m
Model: Saturated Only
Sat Kx: 1e-08 m/sec
Ky'/Kx' Ratio: 1
Rotation: 0 °
Volumetric Water Content: 0.4
Compressibility: 1e-05 /kPa
Name: Tailings- 0-3 m
Model: Saturated Only
Sat Kx: 8e-08 m/sec
Ky'/Kx' Ratio: 1
Rotation: 0 °
Volumetric Water Content: 0.4
Compressibility: 1e-05 /kPa
Name: Tailings- 3-10 m
Model: Saturated Only
Sat Kx: 4e-08 m/sec
Ky'/Kx' Ratio: 1
Rotation: 0 °
Volumetric Water Content: 0.4
Compressibility: 1e-05 /kPa
flux 2.23 e-6 m3/sec
K:\Projects\116\116217 Bowdens Silver Project, Bowdens Silver Pty Limited\07 EIS Response - Seepage\Data and Calcs\AM\Rev 1\Seepage Analysis Figures.xlsx

A P P E N D I X B
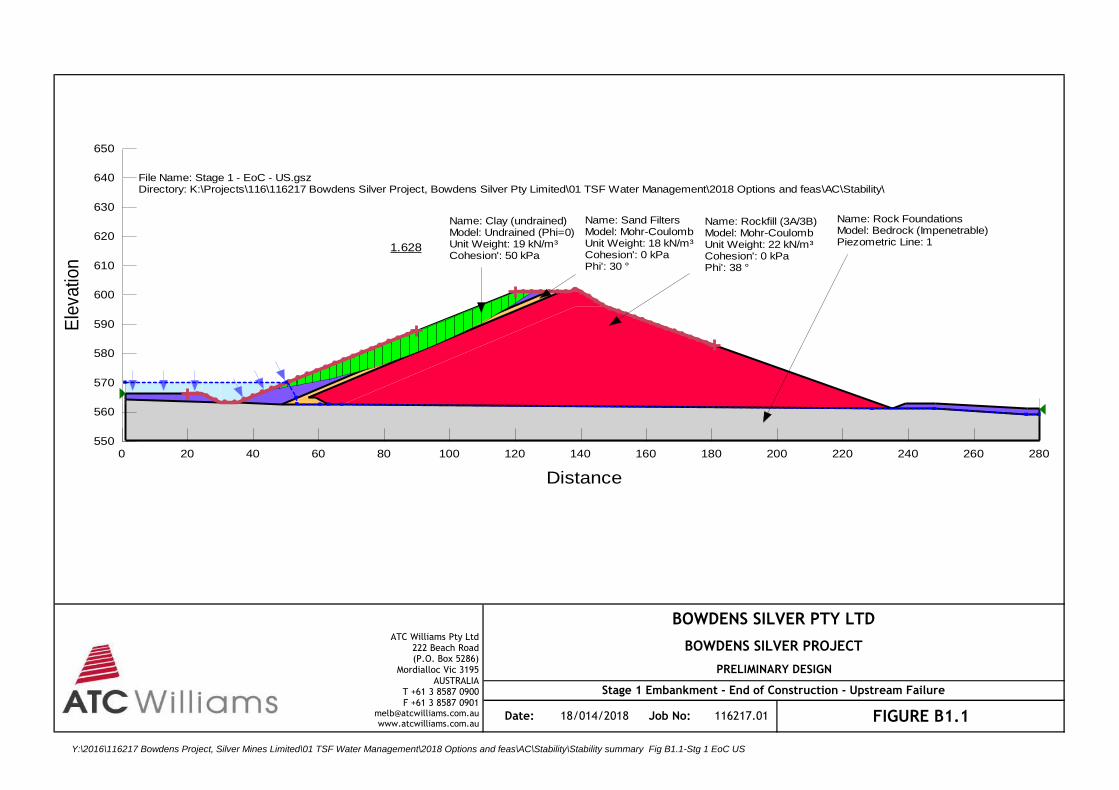
BOWDENS SILVER PTY LTD
BOWDENS SILVER PROJECT
PRELIMINARY DESIGN
Stage 1 Embankment - End of Construction - Upstream Failure
Date: 18/014/2018 Job No: 116217.01 FIGURE B1.1
ATC Williams Pty Ltd222 Beach Road (P.O. Box 5286)
Mordialloc Vic 3195AUSTRALIA
T +61 3 8587 0900 F +61 3 8587 0901
[email protected] www.atcwilliams.com.au
1.628
File Name: Stage 1 - EoC - US.gszDirectory: K:\Projects\116\116217 Bowdens Silver Project, Bowdens Silver Pty Limited\01 TSF Water Management\2018 Options and feas\AC\Stability\
Name: Rockfill (3A/3B) Model: Mohr-Coulomb Unit Weight: 22 kN/m³Cohesion': 0 kPaPhi': 38 °
Name: Clay (undrained) Model: Undrained (Phi=0) Unit Weight: 19 kN/m³Cohesion': 50 kPa
Name: Sand Filters Model: Mohr-Coulomb Unit Weight: 18 kN/m³Cohesion': 0 kPaPhi': 30 °
Name: Rock Foundations Model: Bedrock (Impenetrable) Piezometric Line: 1
Distance
0 20 40 60 80 100 120 140 160 180 200 220 240 260 280
Ele
vatio
n
550
560
570
580
590
600
610
620
630
640
650
Y:\2016\116217 Bowdens Project, Silver Mines Limited\01 TSF Water Management\2018 Options and feas\AC\Stability\Stability summary Fig B1.1-Stg 1 EoC US
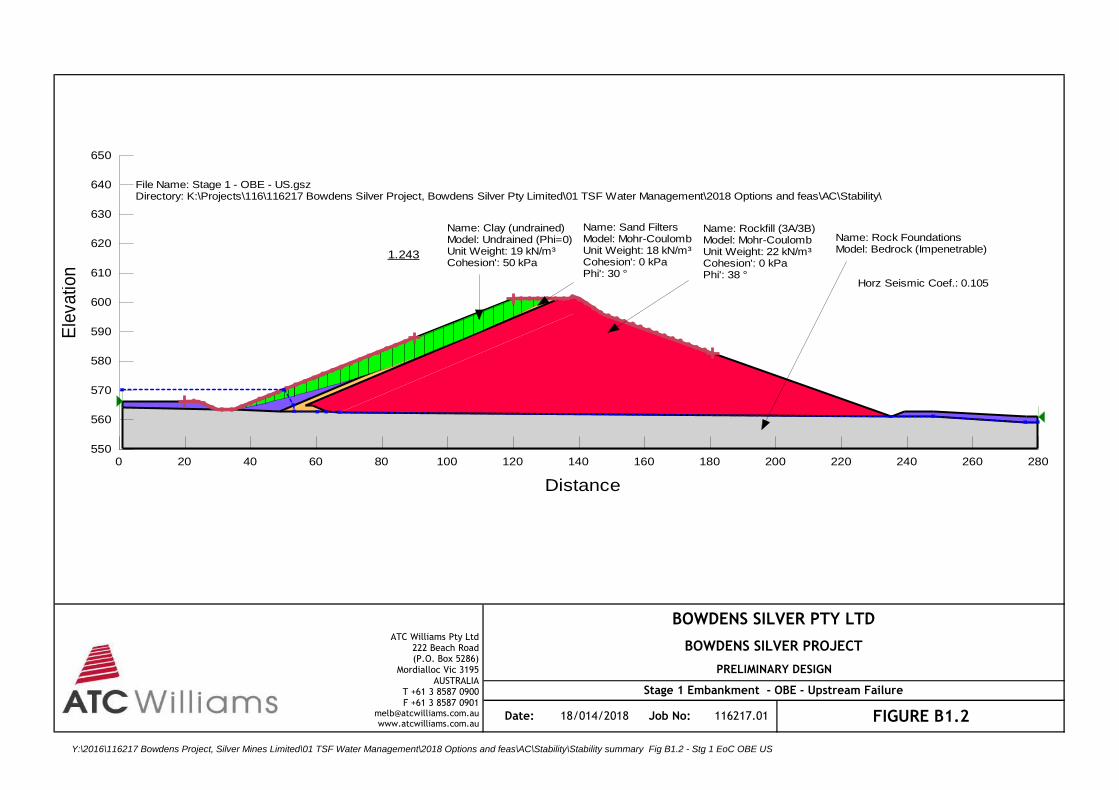
BOWDENS SILVER PTY LTD
BOWDENS SILVER PROJECT
PRELIMINARY DESIGN
Stage 1 Embankment - OBE - Upstream Failure
Date: 18/014/2018 Job No: 116217.01 FIGURE B1.2
ATC Williams Pty Ltd222 Beach Road (P.O. Box 5286)
Mordialloc Vic 3195AUSTRALIA
T +61 3 8587 0900 F +61 3 8587 0901
[email protected] www.atcwilliams.com.au
1.243
File Name: Stage 1 - OBE - US.gszDirectory: K:\Projects\116\116217 Bowdens Silver Project, Bowdens Silver Pty Limited\01 TSF Water Management\2018 Options and feas\AC\Stability\
Name: Rockfill (3A/3B) Model: Mohr-Coulomb Unit Weight: 22 kN/m³Cohesion': 0 kPaPhi': 38 °
Name: Clay (undrained) Model: Undrained (Phi=0) Unit Weight: 19 kN/m³Cohesion': 50 kPa
Name: Sand Filters Model: Mohr-Coulomb Unit Weight: 18 kN/m³Cohesion': 0 kPaPhi': 30 °
Name: Rock Foundations Model: Bedrock (Impenetrable)
Horz Seismic Coef.: 0.105
Distance
0 20 40 60 80 100 120 140 160 180 200 220 240 260 280
Ele
va
tion
550
560
570
580
590
600
610
620
630
640
650
Y:\2016\116217 Bowdens Project, Silver Mines Limited\01 TSF Water Management\2018 Options and feas\AC\Stability\Stability summary Fig B1.2 - Stg 1 EoC OBE US

BOWDENS SILVER PTY LTD
BOWDENS SILVER PROJECT
PRELIMINARY DESIGN
Stage 1 Embankment - Long Term Static Conditions - Local Downstream Failure
Date: 18/014/2018 Job No: 116217.01 FIGURE B1.3
ATC Williams Pty Ltd222 Beach Road (P.O. Box 5286)
Mordialloc Vic 3195AUSTRALIA
T +61 3 8587 0900 F +61 3 8587 0901
[email protected] www.atcwilliams.com.au
1.777
File Name: Stage 1 - Long Term - DS.gszDirectory: K:\Projects\116\116217 Bowdens Silver Project, Bowdens Silver Pty Limited\01 TSF Water Management\2018 Options and feas\AC\Stability\
Name: Rockfill (3A/3B) Model: Mohr-Coulomb Unit Weight: 22 kN/m³Cohesion': 0 kPaPhi': 38 °
Name: Clay (drained) Model: Mohr-Coulomb Unit Weight: 19 kN/m³Cohesion': 2 kPaPhi': 28 °Piezometric Line: 1
Name: Sand Filters Model: Mohr-Coulomb Unit Weight: 18 kN/m³Cohesion': 0 kPaPhi': 30 °
Name: Rock Foundations Model: Bedrock (Impenetrable) Piezometric Line: 1
Name: Tailings Model: S=f(overburden) Unit Weight: 13.24 kN/m³Tau/Sigma Ratio: 0.25 Minimum Strength: 0 Piezometric Line: 1
Distance
0 20 40 60 80 100 120 140 160 180 200 220 240 260 280
Ele
vatio
n
550
560
570
580
590
600
610
620
630
640
650
Y:\2016\116217 Bowdens Project, Silver Mines Limited\01 TSF Water Management\2018 Options and feas\AC\Stability\Stability summary Fig B1.3 - Stg 1 LT LDS

BOWDENS SILVER PTY LTD
BOWDENS SILVER PROJECT
PRELIMINARY DESIGN
Stage 1 Embankment - Long Term Static Conditions - Global Downstream Failure
Date: 18/014/2018 Job No: 116217.01 FIGURE B1.4
ATC Williams Pty Ltd222 Beach Road (P.O. Box 5286)
Mordialloc Vic 3195AUSTRALIA
T +61 3 8587 0900 F +61 3 8587 0901
[email protected] www.atcwilliams.com.au
1.988
File Name: Stage 1 - Long Term - DS.gszDirectory: K:\Projects\116\116217 Bowdens Silver Project, Bowdens Silver Pty Limited\01 TSF Water Management\2018 Options and feas\AC\Stability\
Name: Rockfill (3A/3B) Model: Mohr-Coulomb Unit Weight: 22 kN/m³Cohesion': 0 kPaPhi': 38 °
Name: Clay (drained) Model: Mohr-Coulomb Unit Weight: 19 kN/m³Cohesion': 2 kPaPhi': 28 °Piezometric Line: 1
Name: Sand Filters Model: Mohr-Coulomb Unit Weight: 18 kN/m³Cohesion': 0 kPaPhi': 30 °
Name: Rock Foundations Model: Bedrock (Impenetrable) Piezometric Line: 1
Name: Tailings Model: S=f(overburden) Unit Weight: 13.24 kN/m³Tau/Sigma Ratio: 0.25 Minimum Strength: 0 Piezometric Line: 1
Distance
0 20 40 60 80 100 120 140 160 180 200 220 240 260 280
Ele
vatio
n
550
560
570
580
590
600
610
620
630
640
650
Y:\2016\116217 Bowdens Project, Silver Mines Limited\01 TSF Water Management\2018 Options and feas\AC\Stability\Stability summary Fig B1.4 - Stg 1 LT GDS

BOWDENS SILVER PTY LTD
BOWDENS SILVER PROJECT
PRELIMINARY DESIGN
Stage 1 Embankment - Long Term Conditions - OBE - Local Downstream Failure
Date: 18/014/2018 Job No: 116217.01 FIGURE B1.5
ATC Williams Pty Ltd222 Beach Road (P.O. Box 5286)
Mordialloc Vic 3195AUSTRALIA
T +61 3 8587 0900 F +61 3 8587 0901
[email protected] www.atcwilliams.com.au
1.379
File Name: Stage 1 - OBE - DS.gszDirectory: K:\Projects\116\116217 Bowdens Silver Project, Bowdens Silver Pty Limited\01 TSF Water Management\2018 Options and feas\AC\Stability\
Name: Rockfill (3A/3B) Model: Mohr-Coulomb Unit Weight: 22 kN/m³Cohesion': 0 kPaPhi': 38 °
Name: Clay (undrained) Model: Undrained (Phi=0) Unit Weight: 19 kN/m³Cohesion': 50 kPa
Name: Sand Filters Model: Mohr-Coulomb Unit Weight: 18 kN/m³Cohesion': 0 kPaPhi': 30 °
Name: Rock Foundations Model: Bedrock (Impenetrable) Piezometric Line: 1
Name: Tailings Model: S=f(overburden) Unit Weight: 13.24 kN/m³Tau/Sigma Ratio: 0.25 Minimum Strength: 0 Piezometric Line: 1
Horz Seismic Coef.: 0.105
Distance
0 20 40 60 80 100 120 140 160 180 200 220 240 260 280
Ele
vatio
n
550
560
570
580
590
600
610
620
630
640
650
Y:\2016\116217 Bowdens Project, Silver Mines Limited\01 TSF Water Management\2018 Options and feas\AC\Stability\Stability summary Fig B1.5 - Stg 1 LT OBE LDS
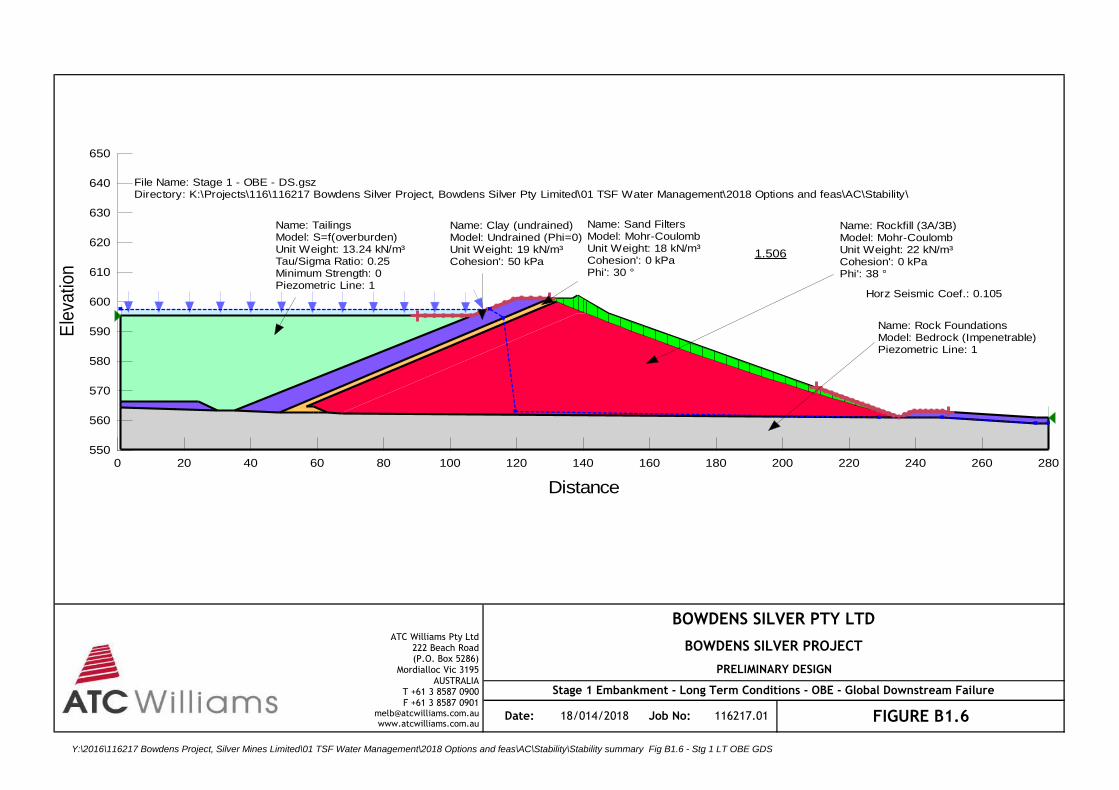
BOWDENS SILVER PTY LTD
BOWDENS SILVER PROJECT
PRELIMINARY DESIGN
Stage 1 Embankment - Long Term Conditions - OBE - Global Downstream Failure
Date: 18/014/2018 Job No: 116217.01 FIGURE B1.6
ATC Williams Pty Ltd222 Beach Road (P.O. Box 5286)
Mordialloc Vic 3195AUSTRALIA
T +61 3 8587 0900 F +61 3 8587 0901
[email protected] www.atcwilliams.com.au
1.506
File Name: Stage 1 - OBE - DS.gszDirectory: K:\Projects\116\116217 Bowdens Silver Project, Bowdens Silver Pty Limited\01 TSF Water Management\2018 Options and feas\AC\Stability\
Name: Rockfill (3A/3B) Model: Mohr-Coulomb Unit Weight: 22 kN/m³Cohesion': 0 kPaPhi': 38 °
Name: Clay (undrained) Model: Undrained (Phi=0) Unit Weight: 19 kN/m³Cohesion': 50 kPa
Name: Sand Filters Model: Mohr-Coulomb Unit Weight: 18 kN/m³Cohesion': 0 kPaPhi': 30 °
Name: Rock Foundations Model: Bedrock (Impenetrable) Piezometric Line: 1
Name: Tailings Model: S=f(overburden) Unit Weight: 13.24 kN/m³Tau/Sigma Ratio: 0.25 Minimum Strength: 0 Piezometric Line: 1
Horz Seismic Coef.: 0.105
Distance
0 20 40 60 80 100 120 140 160 180 200 220 240 260 280
Ele
vatio
n
550
560
570
580
590
600
610
620
630
640
650
Y:\2016\116217 Bowdens Project, Silver Mines Limited\01 TSF Water Management\2018 Options and feas\AC\Stability\Stability summary Fig B1.6 - Stg 1 LT OBE GDS
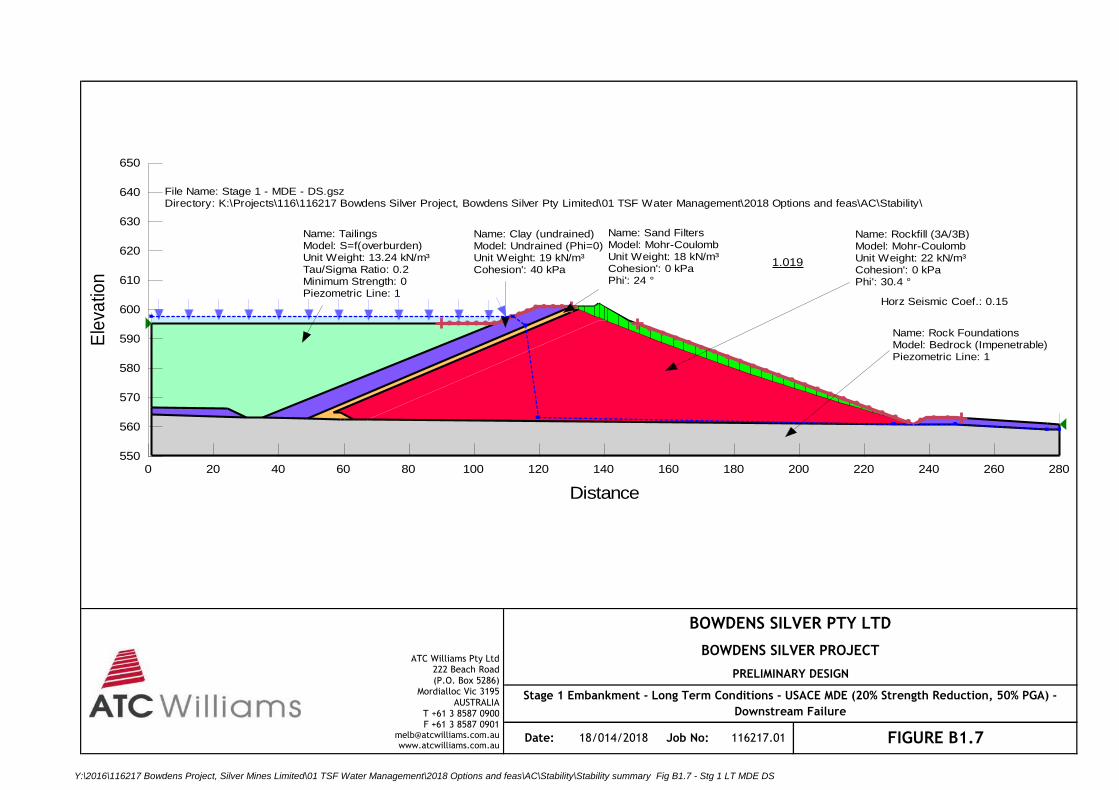
BOWDENS SILVER PTY LTD
BOWDENS SILVER PROJECT
PRELIMINARY DESIGN
Stage 1 Embankment - Long Term Conditions - USACE MDE (20% Strength Reduction, 50% PGA) -
Downstream Failure
Date: 18/014/2018 Job No: 116217.01 FIGURE B1.7
ATC Williams Pty Ltd222 Beach Road (P.O. Box 5286)
Mordialloc Vic 3195AUSTRALIA
T +61 3 8587 0900 F +61 3 8587 0901
[email protected] www.atcwilliams.com.au
1.019
File Name: Stage 1 - MDE - DS.gszDirectory: K:\Projects\116\116217 Bowdens Silver Project, Bowdens Silver Pty Limited\01 TSF Water Management\2018 Options and feas\AC\Stability\
Name: Rockfill (3A/3B) Model: Mohr-Coulomb Unit Weight: 22 kN/m³Cohesion': 0 kPaPhi': 30.4 °
Name: Clay (undrained) Model: Undrained (Phi=0) Unit Weight: 19 kN/m³Cohesion': 40 kPa
Name: Sand Filters Model: Mohr-Coulomb Unit Weight: 18 kN/m³Cohesion': 0 kPaPhi': 24 °
Name: Rock Foundations Model: Bedrock (Impenetrable) Piezometric Line: 1
Name: Tailings Model: S=f(overburden) Unit Weight: 13.24 kN/m³Tau/Sigma Ratio: 0.2 Minimum Strength: 0 Piezometric Line: 1
Horz Seismic Coef.: 0.15
Distance
0 20 40 60 80 100 120 140 160 180 200 220 240 260 280
Ele
vatio
n
550
560
570
580
590
600
610
620
630
640
650
Y:\2016\116217 Bowdens Project, Silver Mines Limited\01 TSF Water Management\2018 Options and feas\AC\Stability\Stability summary Fig B1.7 - Stg 1 LT MDE DS
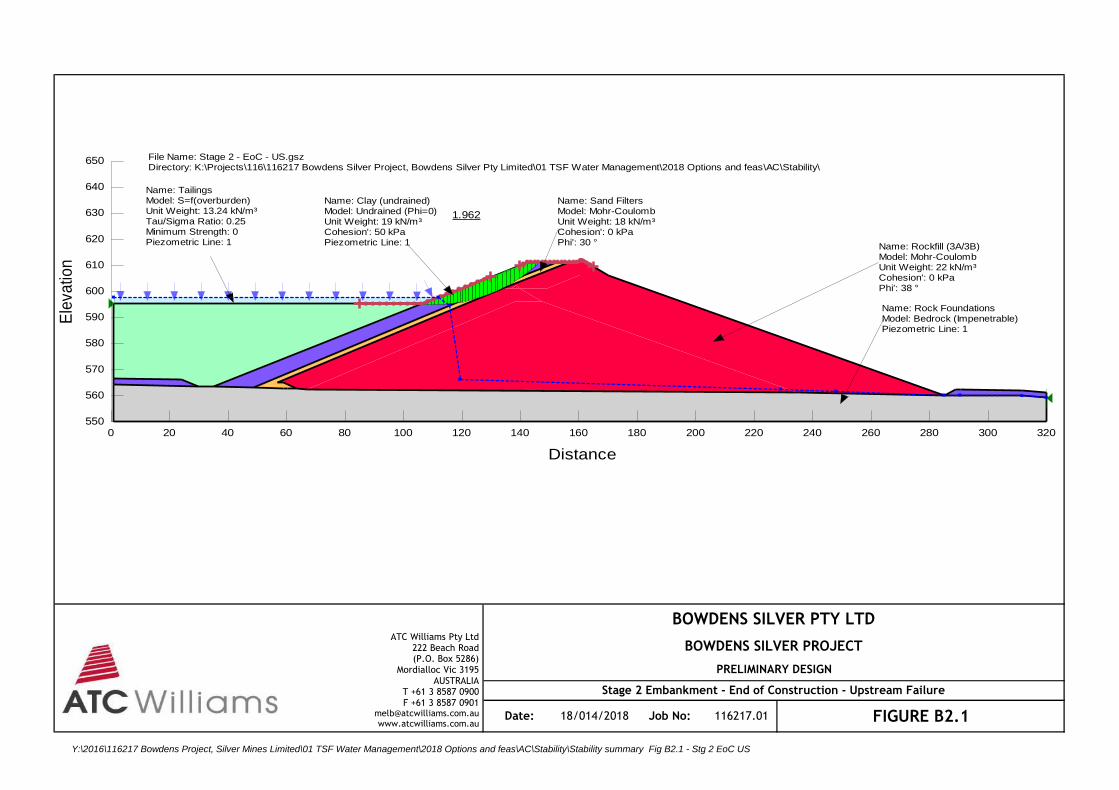
BOWDENS SILVER PTY LTD
BOWDENS SILVER PROJECT
PRELIMINARY DESIGN
Stage 2 Embankment - End of Construction - Upstream Failure
Date: 18/014/2018 Job No: 116217.01 FIGURE B2.1
ATC Williams Pty Ltd222 Beach Road (P.O. Box 5286)
Mordialloc Vic 3195AUSTRALIA
T +61 3 8587 0900 F +61 3 8587 0901
[email protected] www.atcwilliams.com.au
1.962
File Name: Stage 2 - EoC - US.gszDirectory: K:\Projects\116\116217 Bowdens Silver Project, Bowdens Silver Pty Limited\01 TSF Water Management\2018 Options and feas\AC\Stability\
Name: Rockfill (3A/3B) Model: Mohr-Coulomb Unit Weight: 22 kN/m³Cohesion': 0 kPaPhi': 38 °
Name: Clay (undrained) Model: Undrained (Phi=0) Unit Weight: 19 kN/m³Cohesion': 50 kPaPiezometric Line: 1
Name: Sand Filters Model: Mohr-Coulomb Unit Weight: 18 kN/m³Cohesion': 0 kPaPhi': 30 °
Name: Rock Foundations Model: Bedrock (Impenetrable) Piezometric Line: 1
Name: Tailings Model: S=f(overburden) Unit Weight: 13.24 kN/m³Tau/Sigma Ratio: 0.25 Minimum Strength: 0 Piezometric Line: 1
Distance
0 20 40 60 80 100 120 140 160 180 200 220 240 260 280 300 320
Ele
va
tion
550
560
570
580
590
600
610
620
630
640
650
Y:\2016\116217 Bowdens Project, Silver Mines Limited\01 TSF Water Management\2018 Options and feas\AC\Stability\Stability summary Fig B2.1 - Stg 2 EoC US

BOWDENS SILVER PTY LTD
BOWDENS SILVER PROJECT
PRELIMINARY DESIGN
Stage 2 Embankment - Long Term Static Conditions - Local Downstream Failure
Date: 18/014/2018 Job No: 116217.01 FIGURE B2.2
ATC Williams Pty Ltd222 Beach Road (P.O. Box 5286)
Mordialloc Vic 3195AUSTRALIA
T +61 3 8587 0900 F +61 3 8587 0901
[email protected] www.atcwilliams.com.au
1.777
File Name: Stage 2 - Long Term - DS.gszDirectory: K:\Projects\116\116217 Bowdens Silver Project, Bowdens Silver Pty Limited\01 TSF Water Management\2018 Options and feas\AC\Stability\
Name: Rockfill (3A/3B) Model: Mohr-Coulomb Unit Weight: 22 kN/m³Cohesion': 0 kPaPhi': 38 °
Name: Clay (drained) Model: Mohr-Coulomb Unit Weight: 19 kN/m³Cohesion': 2 kPaPhi': 28 °Piezometric Line: 1
Name: Sand Filters Model: Mohr-Coulomb Unit Weight: 18 kN/m³Cohesion': 0 kPaPhi': 30 °
Name: Rock Foundations Model: Bedrock (Impenetrable) Piezometric Line: 1
Name: Tailings Model: S=f(overburden) Unit Weight: 13.24 kN/m³Tau/Sigma Ratio: 0.25 Minimum Strength: 0 Piezometric Line: 1
Distance
0 20 40 60 80 100 120 140 160 180 200 220 240 260 280 300 320
Ele
vatio
n
550
560
570
580
590
600
610
620
630
640
650
Y:\2016\116217 Bowdens Project, Silver Mines Limited\01 TSF Water Management\2018 Options and feas\AC\Stability\Stability summary Fig B2.2 - Stg 2 LT LDS
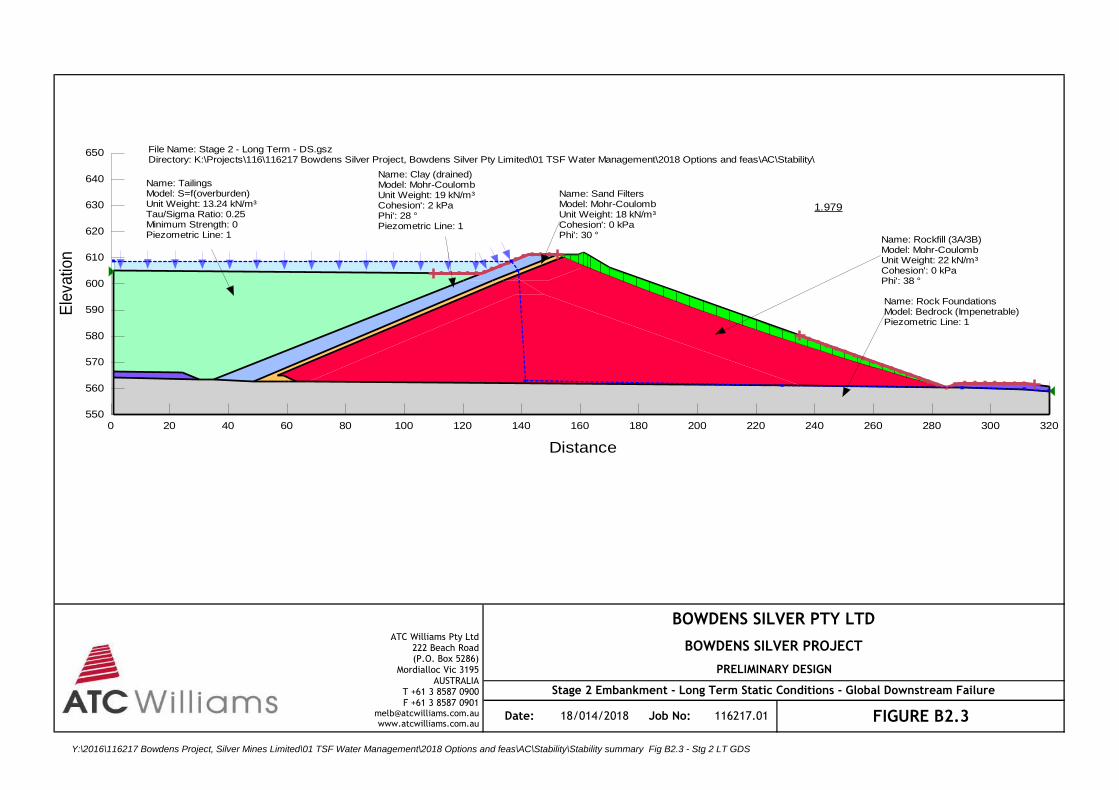
BOWDENS SILVER PTY LTD
BOWDENS SILVER PROJECT
PRELIMINARY DESIGN
Stage 2 Embankment - Long Term Static Conditions - Global Downstream Failure
Date: 18/014/2018 Job No: 116217.01 FIGURE B2.3
ATC Williams Pty Ltd222 Beach Road (P.O. Box 5286)
Mordialloc Vic 3195AUSTRALIA
T +61 3 8587 0900 F +61 3 8587 0901
[email protected] www.atcwilliams.com.au
1.979
File Name: Stage 2 - Long Term - DS.gszDirectory: K:\Projects\116\116217 Bowdens Silver Project, Bowdens Silver Pty Limited\01 TSF Water Management\2018 Options and feas\AC\Stability\
Name: Rockfill (3A/3B) Model: Mohr-Coulomb Unit Weight: 22 kN/m³Cohesion': 0 kPaPhi': 38 °
Name: Clay (drained) Model: Mohr-Coulomb Unit Weight: 19 kN/m³Cohesion': 2 kPaPhi': 28 °Piezometric Line: 1
Name: Sand Filters Model: Mohr-Coulomb Unit Weight: 18 kN/m³Cohesion': 0 kPaPhi': 30 °
Name: Rock Foundations Model: Bedrock (Impenetrable) Piezometric Line: 1
Name: Tailings Model: S=f(overburden) Unit Weight: 13.24 kN/m³Tau/Sigma Ratio: 0.25 Minimum Strength: 0 Piezometric Line: 1
Distance
0 20 40 60 80 100 120 140 160 180 200 220 240 260 280 300 320
Ele
vatio
n
550
560
570
580
590
600
610
620
630
640
650
Y:\2016\116217 Bowdens Project, Silver Mines Limited\01 TSF Water Management\2018 Options and feas\AC\Stability\Stability summary Fig B2.3 - Stg 2 LT GDS

BOWDENS SILVER PTY LTD
BOWDENS SILVER PROJECT
PRELIMINARY DESIGN
Stage 2 Embankment - Long Term Conditions - OBE - Local Downstream Failure
Date: 18/014/2018 Job No: 116217.01 FIGURE B2.4
ATC Williams Pty Ltd222 Beach Road (P.O. Box 5286)
Mordialloc Vic 3195AUSTRALIA
T +61 3 8587 0900 F +61 3 8587 0901
[email protected] www.atcwilliams.com.au
1.379
File Name: Stage 2 - OBE - DS.gszDirectory: K:\Projects\116\116217 Bowdens Silver Project, Bowdens Silver Pty Limited\01 TSF Water Management\2018 Options and feas\AC\Stability\
Name: Rockfill (3A/3B) Model: Mohr-Coulomb Unit Weight: 22 kN/m³Cohesion': 0 kPaPhi': 38 °
Name: Clay (undrained) Model: Undrained (Phi=0) Unit Weight: 19 kN/m³Cohesion': 50 kPa
Name: Sand Filters Model: Mohr-Coulomb Unit Weight: 18 kN/m³Cohesion': 0 kPaPhi': 30 °
Name: Rock Foundations Model: Bedrock (Impenetrable) Piezometric Line: 1
Name: Tailings Model: S=f(overburden) Unit Weight: 13.24 kN/m³Tau/Sigma Ratio: 0.25 Minimum Strength: 0 Piezometric Line: 1
Horz Seismic Coef.: 0.105
Distance
0 20 40 60 80 100 120 140 160 180 200 220 240 260 280 300 320
Ele
vatio
n
550
560
570
580
590
600
610
620
630
640
650
Y:\2016\116217 Bowdens Project, Silver Mines Limited\01 TSF Water Management\2018 Options and feas\AC\Stability\Stability summary Fig B2.4 - Stg 2 LT OBE LDS
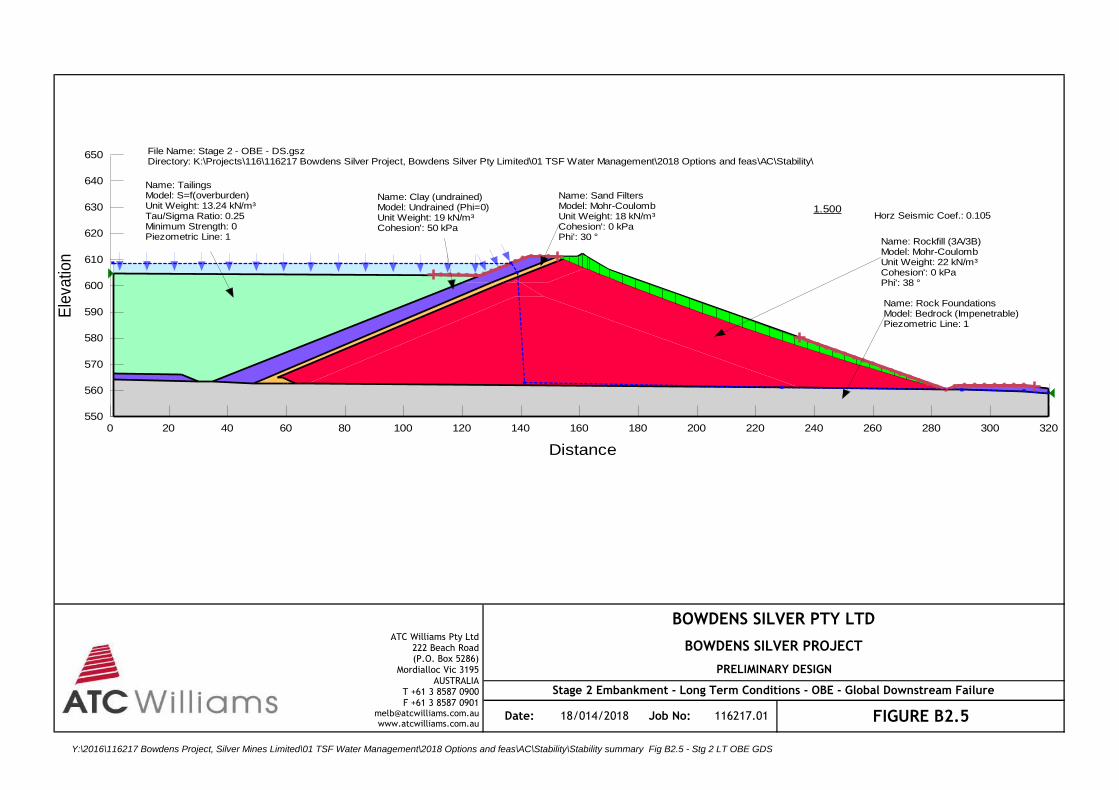
BOWDENS SILVER PTY LTD
BOWDENS SILVER PROJECT
PRELIMINARY DESIGN
Stage 2 Embankment - Long Term Conditions - OBE - Global Downstream Failure
Date: 18/014/2018 Job No: 116217.01 FIGURE B2.5
ATC Williams Pty Ltd222 Beach Road (P.O. Box 5286)
Mordialloc Vic 3195AUSTRALIA
T +61 3 8587 0900 F +61 3 8587 0901
[email protected] www.atcwilliams.com.au
1.500
File Name: Stage 2 - OBE - DS.gszDirectory: K:\Projects\116\116217 Bowdens Silver Project, Bowdens Silver Pty Limited\01 TSF Water Management\2018 Options and feas\AC\Stability\
Name: Rockfill (3A/3B) Model: Mohr-Coulomb Unit Weight: 22 kN/m³Cohesion': 0 kPaPhi': 38 °
Name: Clay (undrained) Model: Undrained (Phi=0) Unit Weight: 19 kN/m³Cohesion': 50 kPa
Name: Sand Filters Model: Mohr-Coulomb Unit Weight: 18 kN/m³Cohesion': 0 kPaPhi': 30 °
Name: Rock Foundations Model: Bedrock (Impenetrable) Piezometric Line: 1
Name: Tailings Model: S=f(overburden) Unit Weight: 13.24 kN/m³Tau/Sigma Ratio: 0.25 Minimum Strength: 0 Piezometric Line: 1
Horz Seismic Coef.: 0.105
Distance
0 20 40 60 80 100 120 140 160 180 200 220 240 260 280 300 320
Ele
vatio
n
550
560
570
580
590
600
610
620
630
640
650
Y:\2016\116217 Bowdens Project, Silver Mines Limited\01 TSF Water Management\2018 Options and feas\AC\Stability\Stability summary Fig B2.5 - Stg 2 LT OBE GDS

BOWDENS SILVER PTY LTD
BOWDENS SILVER PROJECT
PRELIMINARY DESIGN
Stage 2 Embankment - Long Term Conditions - USACE MDE (20% Strength Reduction, 50% PGA) -
Downstream Failure
Date: 18/014/2018 Job No: 116217.01 FIGURE B2.6
ATC Williams Pty Ltd222 Beach Road (P.O. Box 5286)
Mordialloc Vic 3195AUSTRALIA
T +61 3 8587 0900 F +61 3 8587 0901
[email protected] www.atcwilliams.com.au
1.014
File Name: Stage 2 - MDE - DS.gszDirectory: K:\Projects\116\116217 Bowdens Silver Project, Bowdens Silver Pty Limited\01 TSF Water Management\2018 Options and feas\AC\Stability\
Name: Rockfill (3A/3B) Model: Mohr-Coulomb Unit Weight: 22 kN/m³Cohesion': 0 kPaPhi': 30.4 °
Name: Clay (undrained) Model: Undrained (Phi=0) Unit Weight: 19 kN/m³Cohesion': 40 kPa
Name: Sand Filters Model: Mohr-Coulomb Unit Weight: 18 kN/m³Cohesion': 0 kPaPhi': 24 °
Name: Rock Foundations Model: Bedrock (Impenetrable) Piezometric Line: 1
Name: Tailings Model: S=f(overburden) Unit Weight: 13.24 kN/m³Tau/Sigma Ratio: 0.2 Minimum Strength: 0 Piezometric Line: 1
Horz Seismic Coef.: 0.15
Distance
0 20 40 60 80 100 120 140 160 180 200 220 240 260 280 300 320
Ele
vatio
n
550
560
570
580
590
600
610
620
630
640
650
Y:\2016\116217 Bowdens Project, Silver Mines Limited\01 TSF Water Management\2018 Options and feas\AC\Stability\Stability summary Fig B2.6 - Stg 2 MDE DS

BOWDENS SILVER PTY LTD
BOWDENS SILVER PROJECT
PRELIMINARY DESIGN
Stage 3 Embankment - End of Construction - Upstream failure
Date: 18/014/2018 Job No: 116217.01 FIGURE B3.1
ATC Williams Pty Ltd222 Beach Road (P.O. Box 5286)
Mordialloc Vic 3195AUSTRALIA
T +61 3 8587 0900 F +61 3 8587 0901
[email protected] www.atcwilliams.com.au
1.391
File Name: Stage 3 - EoC - US.gszDirectory: K:\Projects\116\116217 Bowdens Silver Project, Bowdens Silver Pty Limited\01 TSF Water Management\2018 Options and feas\AC\Stability\
Name: Rockfill (3A/3B) Model: Mohr-Coulomb Unit Weight: 22 kN/m³Cohesion': 0 kPaPhi': 38 °
Name: Clay (drained) Model: Mohr-Coulomb Unit Weight: 19 kN/m³Cohesion': 2 kPaPhi': 28 °Piezometric Line: 1
Name: Sand Filters Model: Mohr-Coulomb Unit Weight: 18 kN/m³Cohesion': 0 kPaPhi': 30 °
Name: Rock Foundations Model: Bedrock (Impenetrable) Piezometric Line: 1
Name: Tailings Model: S=f(overburden) Unit Weight: 13.24 kN/m³Tau/Sigma Ratio: 0.25 Minimum Strength: 0 Piezometric Line: 1
Distance
0 20 40 60 80 100 120 140 160 180 200 220 240 260 280 300 320 340 360 380 400
Ele
vatio
n
550
560
570
580
590
600
610
620
630
640
650
Y:\2016\116217 Bowdens Project, Silver Mines Limited\01 TSF Water Management\2018 Options and feas\AC\Stability\Stability summary Fig B3.1 - Stg 3 EoC US

BOWDENS SILVER PTY LTD
BOWDENS SILVER PROJECT
PRELIMINARY DESIGN
Stage 3 Embankment - Long Term Static Conditions - Downstream Failure
Date: 18/014/2018 Job No: 116217.01 FIGURE B3.2
ATC Williams Pty Ltd222 Beach Road (P.O. Box 5286)
Mordialloc Vic 3195AUSTRALIA
T +61 3 8587 0900 F +61 3 8587 0901
[email protected] www.atcwilliams.com.au
1.988
File Name: Stage 3 - Long Term - DS.gszDirectory: K:\Projects\116\116217 Bowdens Silver Project, Bowdens Silver Pty Limited\01 TSF Water Management\2018 Options and feas\AC\Stability\
Name: Rockfill (3A/3B) Model: Mohr-Coulomb Unit Weight: 22 kN/m³Cohesion': 0 kPaPhi': 38 °
Name: Clay (drained) Model: Mohr-Coulomb Unit Weight: 19 kN/m³Cohesion': 2 kPaPhi': 28 °Piezometric Line: 1
Name: Sand Filters Model: Mohr-Coulomb Unit Weight: 18 kN/m³Cohesion': 0 kPaPhi': 30 °
Name: Rock Foundations Model: Bedrock (Impenetrable) Piezometric Line: 1
Name: Tailings Model: S=f(overburden) Unit Weight: 13.24 kN/m³Tau/Sigma Ratio: 0.25 Minimum Strength: 0 Piezometric Line: 1
Distance
0 20 40 60 80 100 120 140 160 180 200 220 240 260 280 300 320 340 360 380 400
Ele
vatio
n
550
560
570
580
590
600
610
620
630
640
650
Y:\2016\116217 Bowdens Project, Silver Mines Limited\01 TSF Water Management\2018 Options and feas\AC\Stability\Stability summary Fig B3.2 - Stg 3 LT DS
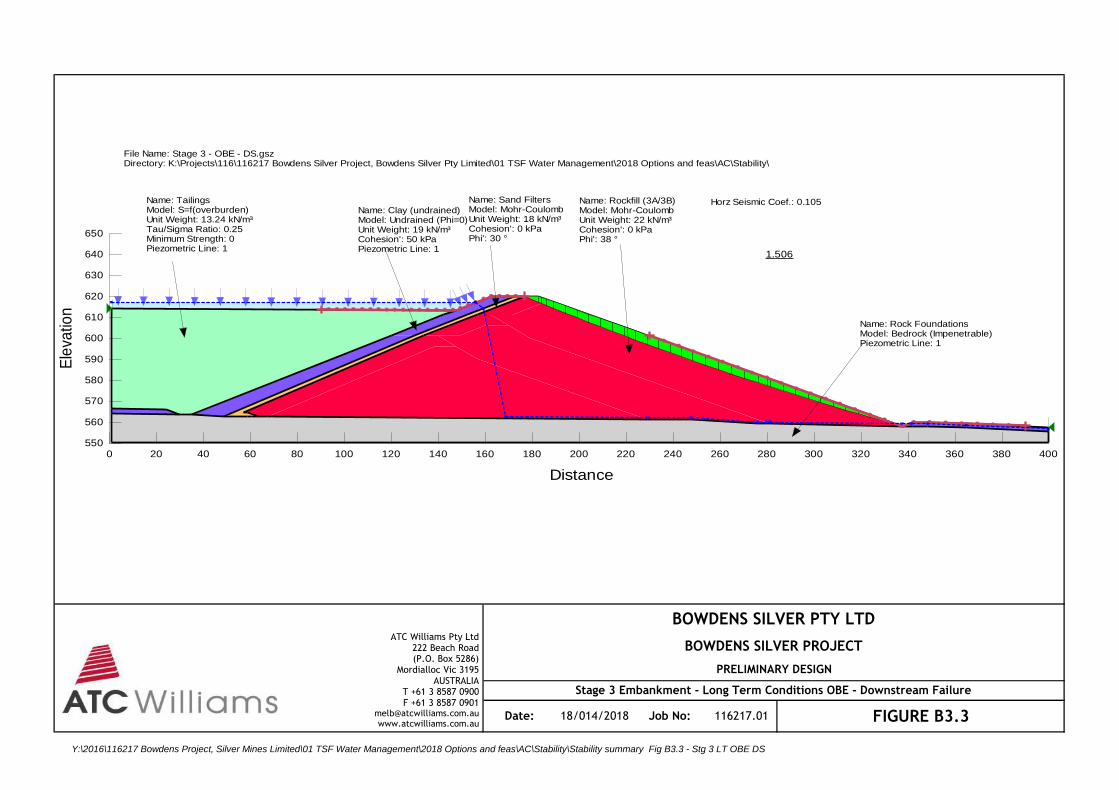
BOWDENS SILVER PTY LTD
BOWDENS SILVER PROJECT
PRELIMINARY DESIGN
Stage 3 Embankment - Long Term Conditions OBE - Downstream Failure
Date: 18/014/2018 Job No: 116217.01 FIGURE B3.3
ATC Williams Pty Ltd222 Beach Road (P.O. Box 5286)
Mordialloc Vic 3195AUSTRALIA
T +61 3 8587 0900 F +61 3 8587 0901
[email protected] www.atcwilliams.com.au
1.506
File Name: Stage 3 - OBE - DS.gszDirectory: K:\Projects\116\116217 Bowdens Silver Project, Bowdens Silver Pty Limited\01 TSF Water Management\2018 Options and feas\AC\Stability\
Name: Rockfill (3A/3B) Model: Mohr-Coulomb Unit Weight: 22 kN/m³Cohesion': 0 kPaPhi': 38 °
Name: Clay (undrained) Model: Undrained (Phi=0) Unit Weight: 19 kN/m³Cohesion': 50 kPaPiezometric Line: 1
Name: Sand Filters Model: Mohr-Coulomb Unit Weight: 18 kN/m³Cohesion': 0 kPaPhi': 30 °
Name: Rock Foundations Model: Bedrock (Impenetrable) Piezometric Line: 1
Name: Tailings Model: S=f(overburden) Unit Weight: 13.24 kN/m³Tau/Sigma Ratio: 0.25 Minimum Strength: 0 Piezometric Line: 1
Horz Seismic Coef.: 0.105
Distance
0 20 40 60 80 100 120 140 160 180 200 220 240 260 280 300 320 340 360 380 400
Ele
vatio
n
550
560
570
580
590
600
610
620
630
640
650
Y:\2016\116217 Bowdens Project, Silver Mines Limited\01 TSF Water Management\2018 Options and feas\AC\Stability\Stability summary Fig B3.3 - Stg 3 LT OBE DS

BOWDENS SILVER PTY LTD
BOWDENS SILVER PROJECT
PRELIMINARY DESIGN
Stage 3 Embankment - Long Term Conditions - USACE MDE (20% Strength Reduction, 50% PGA) -
Downstream Failure
Date: 18/014/2018 Job No: 116217.01 FIGURE B3.4
ATC Williams Pty Ltd222 Beach Road (P.O. Box 5286)
Mordialloc Vic 3195AUSTRALIA
T +61 3 8587 0900 F +61 3 8587 0901
[email protected] www.atcwilliams.com.au
1.033
File Name: Stage 3 - MDE - DS.gszDirectory: K:\Projects\116\116217 Bowdens Silver Project, Bowdens Silver Pty Limited\01 TSF Water Management\2018 Options and feas\AC\Stability\
Name: Rockfill (3A/3B) Model: Mohr-Coulomb Unit Weight: 22 kN/m³Cohesion': 0 kPaPhi': 30.4 °
Name: Clay (undrained) Model: Undrained (Phi=0) Unit Weight: 19 kN/m³Cohesion': 40 kPaPiezometric Line: 1
Name: Sand Filters Model: Mohr-Coulomb Unit Weight: 18 kN/m³Cohesion': 0 kPaPhi': 24 °
Name: Rock Foundations Model: Bedrock (Impenetrable) Piezometric Line: 1
Name: Tailings Model: S=f(overburden) Unit Weight: 13.24 kN/m³Tau/Sigma Ratio: 0.2 Minimum Strength: 0 Piezometric Line: 1
Horz Seismic Coef.: 0.15
Distance
0 20 40 60 80 100 120 140 160 180 200 220 240 260 280 300 320 340 360 380 400
Ele
vatio
n
550
560
570
580
590
600
610
620
630
640
650
Y:\2016\116217 Bowdens Project, Silver Mines Limited\01 TSF Water Management\2018 Options and feas\AC\Stability\Stability summary Fig B3.4 - Stg 3 LT MDE DS

A P P E N D I X C

4 September 2019 Page 1 of 3
Tailings Storage Facility Preliminary Design Appendix C – Schedule of Quantities
APPENDIX C
SCHEDULE OF QUANTITIES – STAGE 1
Description Unit Estimated Quantity
SITE PREPARATION
Establishment Item 1
Clearing and Grubbing m² 1,087,000
Stripping topsoil & placement within 1km m³ 326,000
EMBANKMENT CONSTRUCTION
Foundation Preparation B - Borrow and Compact clay m³ 204,000
Foundation Preparation B - Rip, Condition and Compact clay m² 542,000
Foundation Preparation B2 - Foundation Treatment (Borrow and Compact Clay for B not required)
m² 193,000
Foundation Preparation B2 - Underdrainage m 3,900
Foundation Preparation A - Stripping unsuitable subsoil to stockpile within 500m m³ 5,000
Foundation Preparation A - Stripping to Bedrock to stockpile within 500m m³ 117,000
Foundation Grouting: 40m primary, 30m secondary, 20m Tertiary, 15m Blanket m 22,000
Seepage Collection system (includes Geotextile and Rockfill) m 1,350
Seepage Collection Pond and Toe drain m³ 12,000
Zone 1 (From subsoil stripping) m³ 20,000
Zone 1 (Borrow from within 500m of foundation excavation) m³ 114,000
Zone 2 (Filter placement) m³ 59,000
Zone 3A (Haul from WRE) m³ 180,000
Zone 3B (Haul from Stockpile within 500m) m³ 638,000
Zone 3A + 3B (Spread and Compact) m³ 869,000
LINING
Bituminous Lining m² 44,000
Concrete Fire Protection m² 4,000
SPILLWAY
Spillway Excavation including embankment protection m³ 69,000
Excess Material Haul m³ 67,000
MONITORING
Vibrating Wire Piezometers - Unit Item 23
Vibrating Wire Piezometers - Cabling m 1,350
Standpipe Piezometers - Total Depth m 100
Settlement Monuments
No. 9

4 September 2019 Page 2 of 3
Tailings Storage Facility Preliminary Design Appendix C – Schedule of Quantities
SCHEDULE OF QUANTITIES – STAGE 2
Description Unit Estimated Quantity
SITE PREPARATION
Establishment Item 1
Clearing and Grubbing m² 33,000
Stripping topsoil & placement within 1km m³ 10,000
EMBANKMENT CONSTRUCTION
Foundation Preparation B - Borrow and Compact clay m³ 98,000
Foundation Preparation B - Rip, Condition and Compact clay m² 260,000
Foundation Preparation A - Stripping unsuitable subsoil to stockpile within 500m m³ 2,000
Foundation Preparation A - Stripping to Bedrock to stockpile within 500m m³ 46,000
Zone 1 (From subsoil stripping) m³ 8,000
Zone 1 (Borrow from within 500m of foundation excavation) m³ 68,000
Zone 2 (Filter placement) m³ 31,000
Zone 3A (Haul from WRE) m³ 114,000
Zone 3B (Haul from Stockpile within 500m) m³ 777,000
Zone 3A + 3B (Spread and Compact) m³ 942,000
LINING
Bituminous Lining m² 27,000
Concrete Fire Protection m² 7,000
SPILLWAY
Spillway Excavation including embankment protection m³ 70,000
Excess Material Haul m³ 35,000
MONITORING
Settlement Monuments No. 9
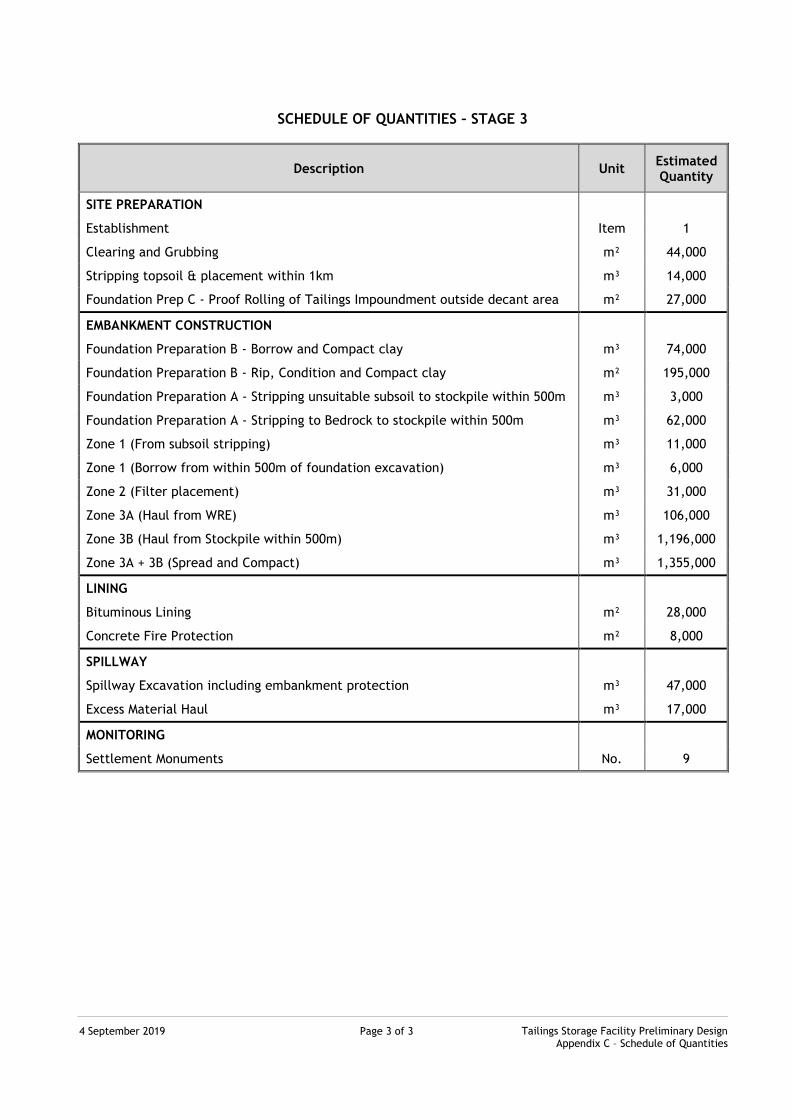
4 September 2019 Page 3 of 3
Tailings Storage Facility Preliminary Design Appendix C – Schedule of Quantities
SCHEDULE OF QUANTITIES – STAGE 3
Description Unit Estimated Quantity
SITE PREPARATION
Establishment Item 1
Clearing and Grubbing m² 44,000
Stripping topsoil & placement within 1km m³ 14,000
Foundation Prep C - Proof Rolling of Tailings Impoundment outside decant area m² 27,000
EMBANKMENT CONSTRUCTION
Foundation Preparation B - Borrow and Compact clay m³ 74,000
Foundation Preparation B - Rip, Condition and Compact clay m² 195,000
Foundation Preparation A - Stripping unsuitable subsoil to stockpile within 500m m³ 3,000
Foundation Preparation A - Stripping to Bedrock to stockpile within 500m m³ 62,000
Zone 1 (From subsoil stripping) m³ 11,000
Zone 1 (Borrow from within 500m of foundation excavation) m³ 6,000
Zone 2 (Filter placement) m³ 31,000
Zone 3A (Haul from WRE) m³ 106,000
Zone 3B (Haul from Stockpile within 500m) m³ 1,196,000
Zone 3A + 3B (Spread and Compact) m³ 1,355,000
LINING
Bituminous Lining m² 28,000
Concrete Fire Protection m² 8,000
SPILLWAY
Spillway Excavation including embankment protection m³ 47,000
Excess Material Haul m³ 17,000
MONITORING
Settlement Monuments No. 9