Embed Size (px)
Citation preview

our teachers
our school
our message
Jefferson SD
Hawkins Elementary
School2014-15
School Accountability Report Card
Published in 2015-16
Christina Orsi Principal
475 Darlene Lane Tracy, CA 95377
Grades: TK-8 Phone: (209) 839-2380
www.jeffersonschooldistrict.com/hawkins
CDS Code: 39-68544-6117618
James W. Bridges, Ed.D., Superintendent • [email protected] • Phone: (209) 836-3388
Jefferson School District • 1219 Whispering Wind Drive Tracy, CA 95377 • www.jeffersonshooldistrict.com
2
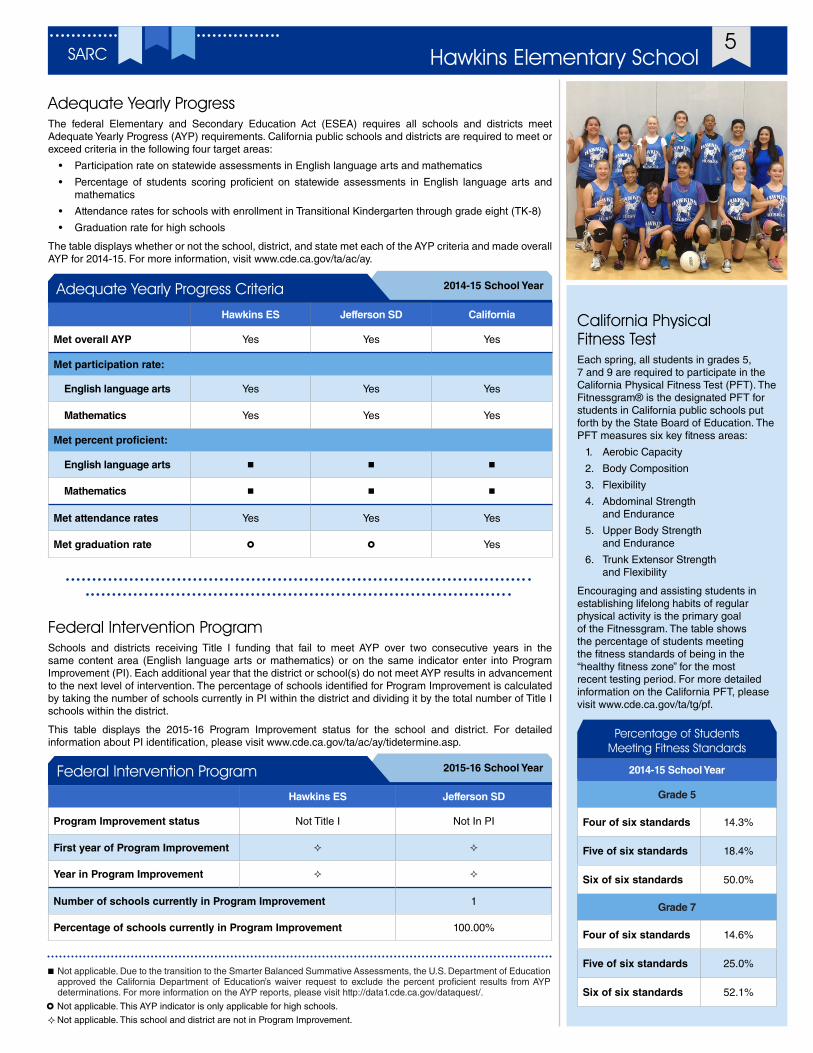
Principal’s MessageTom Hawkins Elementary School is a TK-8 school within the Jefferson School District. Our school is a unique learning community where teachers, parents, students, and administrators enjoy the mutual respect and care essential to growth and learning. Our school is a place where students not only feel cared for and safe, but academically challenged as well. Students develop the knowledge, skills, relationships and character necessary to be successful beyond their school years, and they leave Tom Hawkins prepared to be lifelong learners. We encourage our students to excel in all areas of their development including art, music, leader-ship, character and athletics. Our professional staff is committed to high academic and behavioral standards, assisting students in reaching their goals, and ongoing staff development to enrich their teaching expertise and research based repertoire of teaching practices. Our school faculty members have been working dili-gently toward transitioning to the California State Standards. We are committed to ensuring all of our students are college and career ready and armed with 21st-century skills by infusing technology and digital literacy in all of our classrooms.
What makes Hawkins a unique educational experience is the focus on student-centered events. On the first day of school, students are greeted by the staff with a red-carpet welcome. There are many student events throughout the year, such as Walk/Bike to School Day, Day of the Writer, Spelling Bee, Fun Fridays, dances, Rallies, Fund Run, Jump Rope for Heart, Halloween Parade and Concert, Hawkapalooza Music Festival, Red Ribbon Week, Artist in Residence, Family Science Night, Science and Math Olympiad, Science Fair, Young Mens’ Leadership Group, Talent Show, Read Across America, and College Week. It is our belief that school should foster the passion of students in multiple disciplines beyond academia. We greatly value writing, sci-ence, art, music, leadership and athletics. The Hawkins community greatly values field-trip experiences. All grade levels take at least one field trip per year.
Parental InvolvementParents are encouraged to take active roles in the educational process by participating in various committees such as the School Site Council, Hawkins Parent Faculty Club, the English Learner Advisory Committee, and GATE Committee; by attending monthly board meetings or Back-to-School Night, Open House, or classroom performances; and by volunteering in the classroom and at schoolwide activities. Our goal at Hawkins is to provide parents with many opportunities to become a vital component of the instructional process.
For more information on how to become involved, please visit our school website at www.jeffersonschooldis-trict.com/hawkins, or contact Principal Christina Orsi at (209) 839-2380.
School SafetyProcedures and routines are reviewed with staff, students and parents. Key elements of the plan include providing for the safety and welfare of its students and staff, especially in a disaster situation, and to work cooperatively with other community agencies to prepare for and effectively deal with a disaster situation in our community. Our major goals are to save lives, protect property, and give aid to those in need in the event of a disaster. We hold practice drills monthly to ensure all staff, students and parents are aware of the neces-sary procedures to follow should a disaster or emergency arise. The Safety Committee meets to update and revise the plan.
The school safety plan was last reviewed, updated and discussed with the school faculty in September 2015.
School Mission StatementTom Hawkins Elementary School is composed of a dedicated staff committed to providing the highest stan-dards of education, developing the whole child, providing school safety and continuously striving for improve-ment. The staff and parent community value programs of instruction in art, music, physical education and character and know that all students have individual paths to success. Tom Hawkins students are leaders inside and outside of school and leave the halls of the school prepared for high school and success in the 21st century.
Governing BoardPete Carlson, president
Debbie Wingo, vice president
Dan Wells, clerk
Brian Jackman, member
Jacqueline Thomas, member
District Mission StatementThe mission of the Jefferson
School District is to provide a safe, equitable, engaging and rewarding
environment where students, teachers and parents partner in student programs that emphasize academics, physical fitness
and the arts. The result of this effort is to challenge students to be lifelong learners who are positive and productive citizens, prepared for life beyond Jefferson School District, and also care about education.
School Accountability Report Card
In accordance with state and federal requirements, the School Accountability
Report Card (SARC) is put forth annually by all public schools as a tool
for parents and interested parties to stay informed of the school’s progress, test
scores and achievements.
Public Internet AccessInternet access is available at public libraries and other locations that are publicly accessible (e.g., the Califor-nia State Library). Access to the Internet at libraries and public locations is generally provided on a first-come, first-serve basis. Other use restrictions include the hours of operation, the length of time that a workstation may be used (depending on availability), the types of software programs available at a workstation and the ability to print documents.
“Teamwork Makes the Dream Work!”
3Hawkins Elementary SchoolSARC
“Our school is a unique learning community where teachers, parents, students, and administrators enjoy the mutual
respect and care essential to growth and learning.”
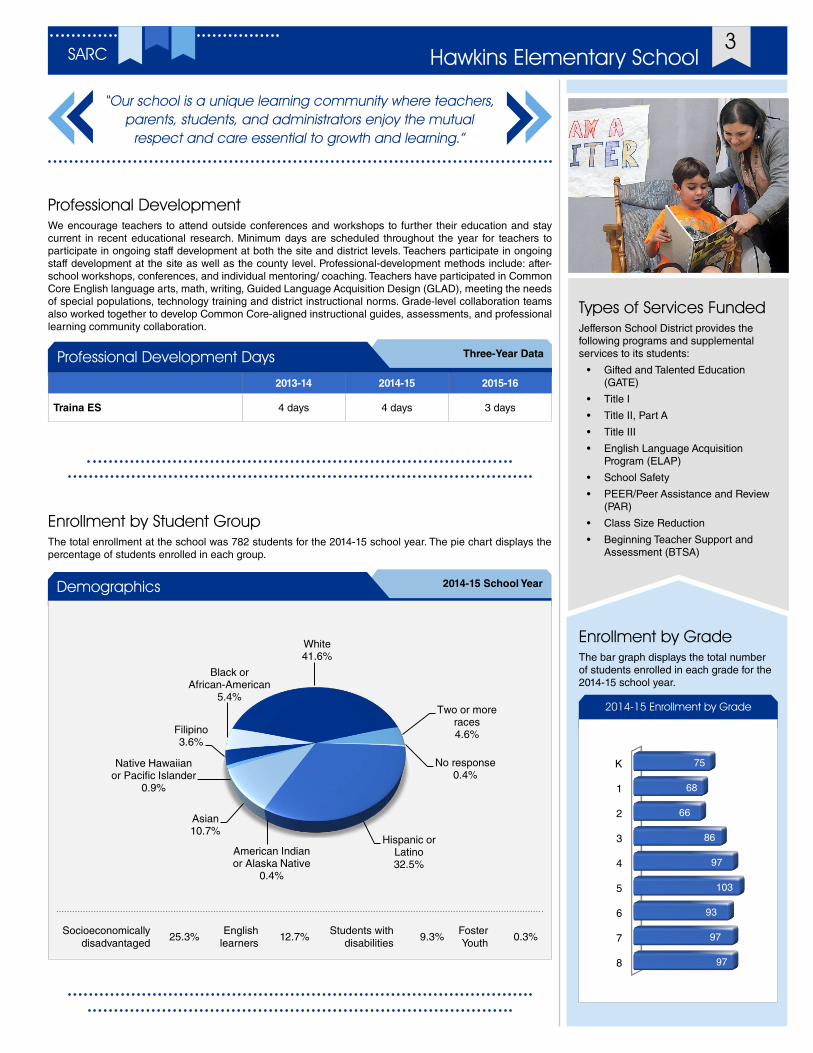
Enrollment by Student GroupThe total enrollment at the school was 782 students for the 2014-15 school year. The pie chart displays the percentage of students enrolled in each group.
2014-15 School YearDemographics
Socioeconomically disadvantaged
25.3%English
learners12.7%
Students with disabilities
9.3%Foster Youth
0.3%
Hispanic or Latino32.5%
American Indian or Alaska Native
0.4%
Asian10.7%
Native Hawaiian or Pacific Islander
0.9%
Filipino3.6%
Black or African-American
5.4%
White41.6%
Two or more races4.6%
No response 0.4%
Three-Year DataProfessional Development Days
2013-14 2014-15 2015-16
Traina ES 4 days 4 days 3 days
Professional DevelopmentWe encourage teachers to attend outside conferences and workshops to further their education and stay current in recent educational research. Minimum days are scheduled throughout the year for teachers to participate in ongoing staff development at both the site and district levels. Teachers participate in ongoing staff development at the site as well as the county level. Professional-development methods include: after-school workshops, conferences, and individual mentoring/ coaching. Teachers have participated in Common Core English language arts, math, writing, Guided Language Acquisition Design (GLAD), meeting the needs of special populations, technology training and district instructional norms. Grade-level collaboration teams also worked together to develop Common Core-aligned instructional guides, assessments, and professional learning community collaboration.
Enrollment by GradeThe bar graph displays the total number of students enrolled in each grade for the 2014-15 school year.
2014-15 Enrollment by Grade
K
1
2
3
4
5
6
7
8
75
68
66
86
97
103
93
97
97
Types of Services FundedJefferson School District provides the following programs and supplemental services to its students:
• Gifted and Talented Education (GATE)
• Title I
• Title II, Part A
• Title III
• English Language Acquisition Program (ELAP)
• School Safety
• PEER/Peer Assistance and Review (PAR)
• Class Size Reduction
• Beginning Teacher Support and Assessment (BTSA)
4
Suspensions and ExpulsionsThis table shows the school, district, and state suspension and expulsion rates for the most recent three-year period. Note: Students are only counted one time, regardless of the number of suspensions.
Suspension and Expulsion Rates
Hawkins ES
12-13 13-14 14-15
Suspension rates 3.7% 3.7% 2.7%
Expulsion rates 0.0% 0.0% 0.0%
Jefferson SD
12-13 13-14 14-15
Suspension rates 4.4% 3.8% 3.5%
Expulsion rates 0.0% 0.0% 0.1%
California
12-13 13-14 14-15
Suspension rates 5.1% 4.4% 3.8%
Expulsion rates 0.1% 0.1% 0.1%
“Our school is a place where students not only feel cared for and safe,
but academically challenged as well.”
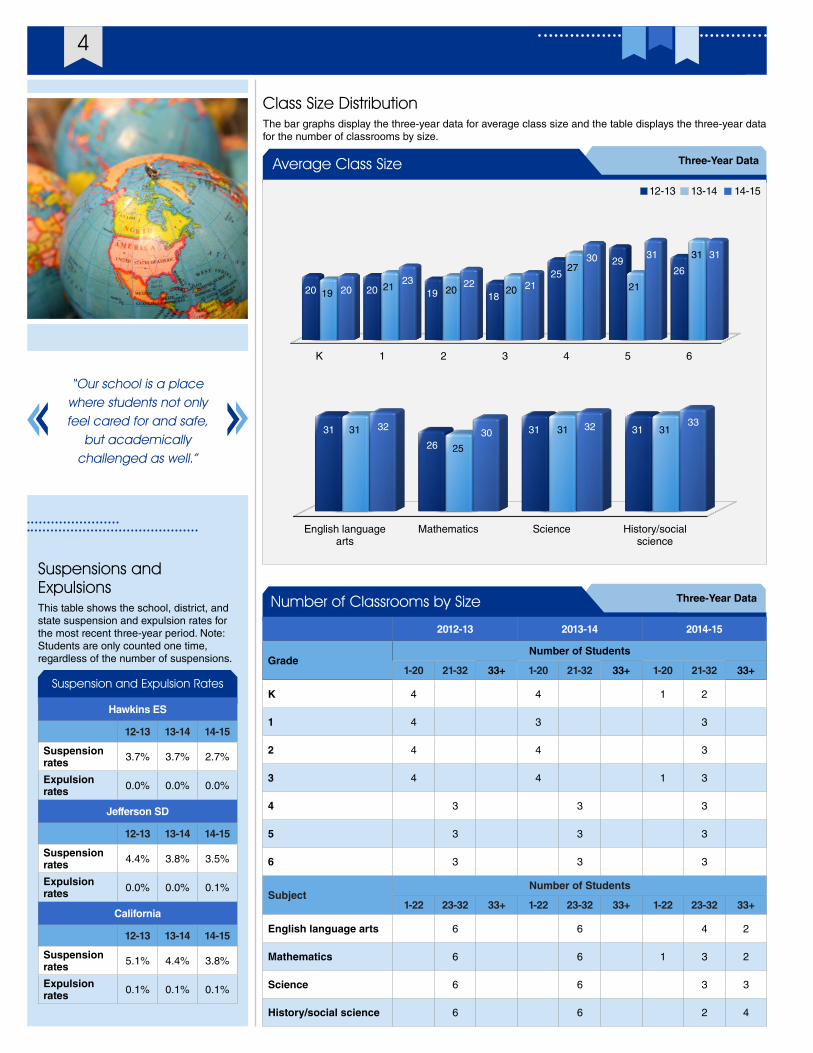
Three-Year DataNumber of Classrooms by Size
2012-13 2013-14 2014-15
GradeNumber of Students
1-20 21-32 33+ 1-20 21-32 33+ 1-20 21-32 33+
K 4 4 1 2
1 4 3 3
2 4 4 3
3 4 4 1 3
4 3 3 3
5 3 3 3
6 3 3 3
SubjectNumber of Students
1-22 23-32 33+ 1-22 23-32 33+ 1-22 23-32 33+
English language arts 6 6 4 2
Mathematics 6 6 1 3 2
Science 6 6 3 3
History/social science 6 6 2 4
Class Size DistributionThe bar graphs display the three-year data for average class size and the table displays the three-year data for the number of classrooms by size.
Three-Year DataAverage Class Size
13-1412-13 14-15
K 1 2 3 4 5 6
20 20 19 18
2529
26
1921 20 20
27
21
31
2023 22 21
30 31 31
English languagearts
Mathematics Science History/socialscience
31
26
31 3131
25
31 313230
32 33
5Hawkins Elementary SchoolSARC
Federal Intervention ProgramSchools and districts receiving Title I funding that fail to meet AYP over two consecutive years in the same content area (English language arts or mathematics) or on the same indicator enter into Program Improvement (PI). Each additional year that the district or school(s) do not meet AYP results in advancement to the next level of intervention. The percentage of schools identified for Program Improvement is calculated by taking the number of schools currently in PI within the district and dividing it by the total number of Title I schools within the district.
This table displays the 2015-16 Program Improvement status for the school and district. For detailed information about PI identification, please visit www.cde.ca.gov/ta/ac/ay/tidetermine.asp.
2015-16 School YearFederal Intervention Program
Hawkins ES Jefferson SD
Program Improvement status Not Title I Not In PI
First year of Program Improvement ² ²
Year in Program Improvement ² ²
Number of schools currently in Program Improvement 1
Percentage of schools currently in Program Improvement 100.00%
Adequate Yearly ProgressThe federal Elementary and Secondary Education Act (ESEA) requires all schools and districts meet Adequate Yearly Progress (AYP) requirements. California public schools and districts are required to meet or exceed criteria in the following four target areas:
• Participation rate on statewide assessments in English language arts and mathematics
• Percentage of students scoring proficient on statewide assessments in English language arts and mathematics
• Attendance rates for schools with enrollment in Transitional Kindergarten through grade eight (TK-8)
• Graduation rate for high schools
The table displays whether or not the school, district, and state met each of the AYP criteria and made overall AYP for 2014-15. For more information, visit www.cde.ca.gov/ta/ac/ay.
2014-15 School YearAdequate Yearly Progress Criteria
Hawkins ES Jefferson SD California
Met overall AYP Yes Yes Yes
Met participation rate:
English language arts Yes Yes Yes
Mathematics Yes Yes Yes
Met percent proficient:
English language arts n n n
Mathematics n n n
Met attendance rates Yes Yes Yes
Met graduation rate � � Yes
²Not applicable. This school and district are not in Program Improvement.
� Not applicable. This AYP indicator is only applicable for high schools.
Not applicable. Due to the transition to the Smarter Balanced Summative Assessments, the U.S. Department of Education approved the California Department of Education’s waiver request to exclude the percent proficient results from AYP determinations. For more information on the AYP reports, please visit http://data1.cde.ca.gov/dataquest/.
n
California Physical Fitness TestEach spring, all students in grades 5, 7 and 9 are required to participate in the California Physical Fitness Test (PFT). The Fitnessgram® is the designated PFT for students in California public schools put forth by the State Board of Education. The PFT measures six key fitness areas:
1. Aerobic Capacity
2. Body Composition
3. Flexibility
4. Abdominal Strength and Endurance
5. Upper Body Strength and Endurance
6. Trunk Extensor Strength and Flexibility
Encouraging and assisting students in establishing lifelong habits of regular physical activity is the primary goal of the Fitnessgram. The table shows the percentage of students meeting the fitness standards of being in the “healthy fitness zone” for the most recent testing period. For more detailed information on the California PFT, please visit www.cde.ca.gov/ta/tg/pf.
Percentage of Students Meeting Fitness Standards
2014-15 School Year
Grade 5
Four of six standards 14.3%
Five of six standards 18.4%
Six of six standards 50.0%
Grade 7
Four of six standards 14.6%
Five of six standards 25.0%
Six of six standards 52.1%
6
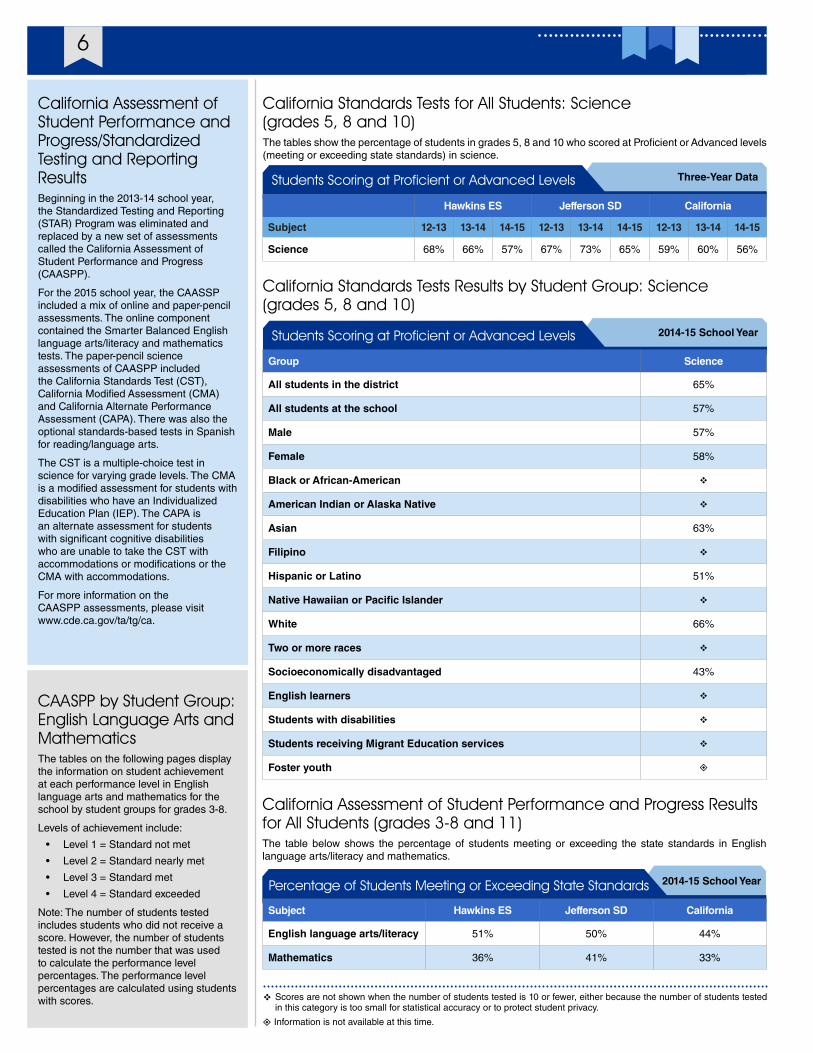
California Standards Tests for All Students: Science (grades 5, 8 and 10)The tables show the percentage of students in grades 5, 8 and 10 who scored at Proficient or Advanced levels (meeting or exceeding state standards) in science.
Three-Year DataStudents Scoring at Proficient or Advanced Levels
Hawkins ES Jefferson SD California
Subject 12-13 13-14 14-15 12-13 13-14 14-15 12-13 13-14 14-15
Science 68% 66% 57% 67% 73% 65% 59% 60% 56%
California Standards Tests Results by Student Group: Science (grades 5, 8 and 10)
2014-15 School YearStudents Scoring at Proficient or Advanced Levels
Group Science
All students in the district 65%
All students at the school 57%
Male 57%
Female 58%
Black or African-American v
American Indian or Alaska Native v
Asian 63%
Filipino v
Hispanic or Latino 51%
Native Hawaiian or Pacific Islander v
White 66%
Two or more races v
Socioeconomically disadvantaged 43%
English learners v
Students with disabilities v
Students receiving Migrant Education services v
Foster youth ±
California Assessment of Student Performance and Progress/Standardized Testing and Reporting Results Beginning in the 2013-14 school year, the Standardized Testing and Reporting (STAR) Program was eliminated and replaced by a new set of assessments called the California Assessment of Student Performance and Progress (CAASPP).
For the 2015 school year, the CAASSP included a mix of online and paper-pencil assessments. The online component contained the Smarter Balanced English language arts/literacy and mathematics tests. The paper-pencil science assessments of CAASPP included the California Standards Test (CST), California Modified Assessment (CMA) and California Alternate Performance Assessment (CAPA). There was also the optional standards-based tests in Spanish for reading/language arts.
The CST is a multiple-choice test in science for varying grade levels. The CMA is a modified assessment for students with disabilities who have an Individualized Education Plan (IEP). The CAPA is an alternate assessment for students with significant cognitive disabilities who are unable to take the CST with accommodations or modifications or the CMA with accommodations.
For more information on the CAASPP assessments, please visit www.cde.ca.gov/ta/tg/ca.
CAASPP by Student Group: English Language Arts and MathematicsThe tables on the following pages display the information on student achievement at each performance level in English language arts and mathematics for the school by student groups for grades 3-8.
Levels of achievement include:
• Level 1 = Standard not met
• Level 2 = Standard nearly met
• Level 3 = Standard met
• Level 4 = Standard exceeded
Note: The number of students tested includes students who did not receive a score. However, the number of students tested is not the number that was used to calculate the performance level percentages. The performance level percentages are calculated using students with scores. v Scores are not shown when the number of students tested is 10 or fewer, either because the number of students tested
in this category is too small for statistical accuracy or to protect student privacy.
California Assessment of Student Performance and Progress Results for All Students (grades 3-8 and 11)The table below shows the percentage of students meeting or exceeding the state standards in English language arts/literacy and mathematics.
2014-15 School YearPercentage of Students Meeting or Exceeding State Standards
Subject Hawkins ES Jefferson SD California
English language arts/literacy 51% 50% 44%
Mathematics 36% 41% 33%
± Information is not available at this time.
7Hawkins Elementary SchoolSARC
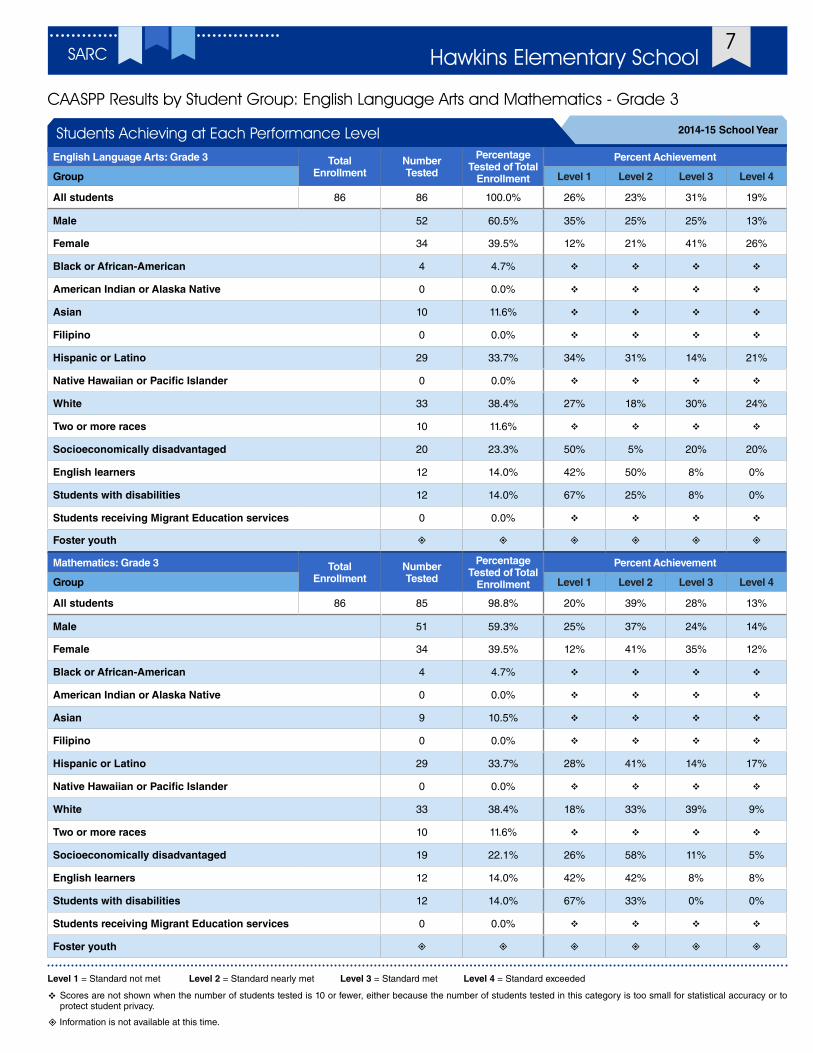
CAASPP Results by Student Group: English Language Arts and Mathematics - Grade 3
Level 1 = Standard not met Level 2 = Standard nearly met Level 3 = Standard met Level 4 = Standard exceeded
v Scores are not shown when the number of students tested is 10 or fewer, either because the number of students tested in this category is too small for statistical accuracy or to protect student privacy.
2014-15 School YearStudents Achieving at Each Performance LevelEnglish Language Arts: Grade 3 Total
EnrollmentNumber Tested
Percentage Tested of Total
Enrollment
Percent Achievement
Group Level 1 Level 2 Level 3 Level 4
All students 86 86 100.0% 26% 23% 31% 19%
Male 52 60.5% 35% 25% 25% 13%
Female 34 39.5% 12% 21% 41% 26%
Black or African-American 4 4.7% v v v v
American Indian or Alaska Native 0 0.0% v v v v
Asian 10 11.6% v v v v
Filipino 0 0.0% v v v v
Hispanic or Latino 29 33.7% 34% 31% 14% 21%
Native Hawaiian or Pacific Islander 0 0.0% v v v v
White 33 38.4% 27% 18% 30% 24%
Two or more races 10 11.6% v v v v
Socioeconomically disadvantaged 20 23.3% 50% 5% 20% 20%
English learners 12 14.0% 42% 50% 8% 0%
Students with disabilities 12 14.0% 67% 25% 8% 0%
Students receiving Migrant Education services 0 0.0% v v v v
Foster youth ± ± ± ± ± ±
Mathematics: Grade 3 Total Enrollment
Number Tested
Percentage Tested of Total
Enrollment
Percent Achievement
Group Level 1 Level 2 Level 3 Level 4
All students 86 85 98.8% 20% 39% 28% 13%
Male 51 59.3% 25% 37% 24% 14%
Female 34 39.5% 12% 41% 35% 12%
Black or African-American 4 4.7% v v v v
American Indian or Alaska Native 0 0.0% v v v v
Asian 9 10.5% v v v v
Filipino 0 0.0% v v v v
Hispanic or Latino 29 33.7% 28% 41% 14% 17%
Native Hawaiian or Pacific Islander 0 0.0% v v v v
White 33 38.4% 18% 33% 39% 9%
Two or more races 10 11.6% v v v v
Socioeconomically disadvantaged 19 22.1% 26% 58% 11% 5%
English learners 12 14.0% 42% 42% 8% 8%
Students with disabilities 12 14.0% 67% 33% 0% 0%
Students receiving Migrant Education services 0 0.0% v v v v
Foster youth ± ± ± ± ± ±
± Information is not available at this time.
8
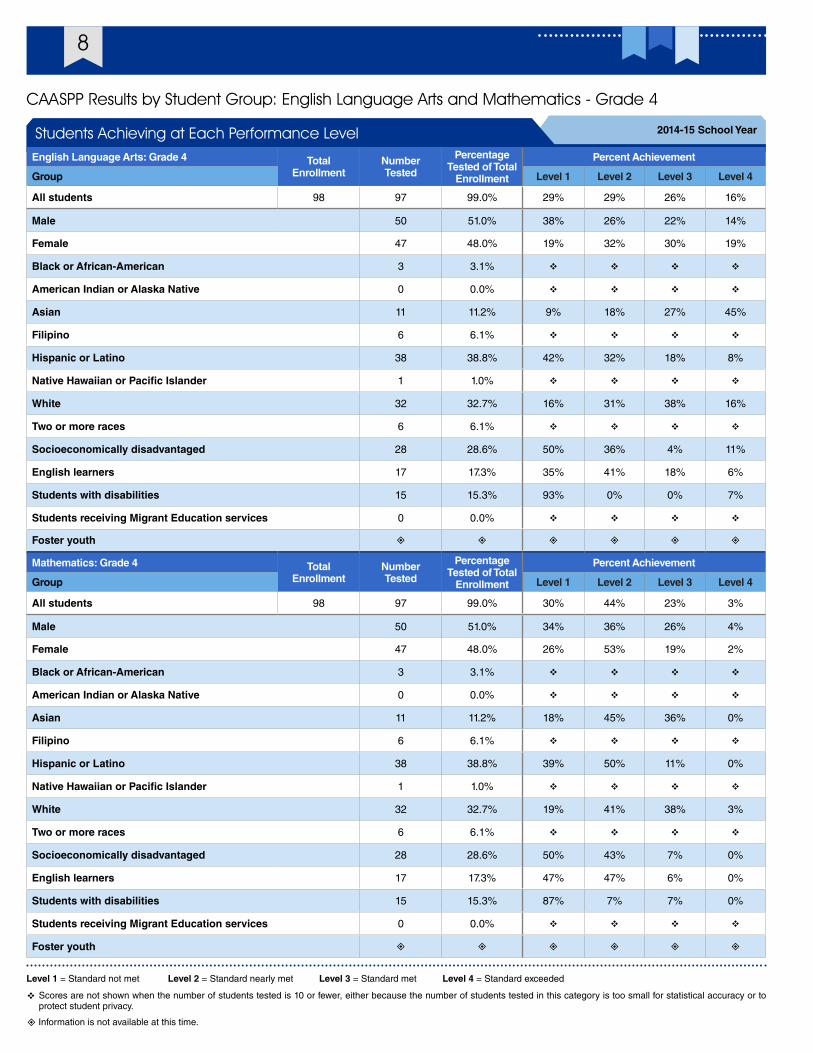
CAASPP Results by Student Group: English Language Arts and Mathematics - Grade 4
Level 1 = Standard not met Level 2 = Standard nearly met Level 3 = Standard met Level 4 = Standard exceeded
v Scores are not shown when the number of students tested is 10 or fewer, either because the number of students tested in this category is too small for statistical accuracy or to protect student privacy.
2014-15 School YearStudents Achieving at Each Performance LevelEnglish Language Arts: Grade 4 Total
EnrollmentNumber Tested
Percentage Tested of Total
Enrollment
Percent Achievement
Group Level 1 Level 2 Level 3 Level 4
All students 98 97 99.0% 29% 29% 26% 16%
Male 50 51.0% 38% 26% 22% 14%
Female 47 48.0% 19% 32% 30% 19%
Black or African-American 3 3.1% v v v v
American Indian or Alaska Native 0 0.0% v v v v
Asian 11 11.2% 9% 18% 27% 45%
Filipino 6 6.1% v v v v
Hispanic or Latino 38 38.8% 42% 32% 18% 8%
Native Hawaiian or Pacific Islander 1 1.0% v v v v
White 32 32.7% 16% 31% 38% 16%
Two or more races 6 6.1% v v v v
Socioeconomically disadvantaged 28 28.6% 50% 36% 4% 11%
English learners 17 17.3% 35% 41% 18% 6%
Students with disabilities 15 15.3% 93% 0% 0% 7%
Students receiving Migrant Education services 0 0.0% v v v v
Foster youth ± ± ± ± ± ±
Mathematics: Grade 4 Total Enrollment
Number Tested
Percentage Tested of Total
Enrollment
Percent Achievement
Group Level 1 Level 2 Level 3 Level 4
All students 98 97 99.0% 30% 44% 23% 3%
Male 50 51.0% 34% 36% 26% 4%
Female 47 48.0% 26% 53% 19% 2%
Black or African-American 3 3.1% v v v v
American Indian or Alaska Native 0 0.0% v v v v
Asian 11 11.2% 18% 45% 36% 0%
Filipino 6 6.1% v v v v
Hispanic or Latino 38 38.8% 39% 50% 11% 0%
Native Hawaiian or Pacific Islander 1 1.0% v v v v
White 32 32.7% 19% 41% 38% 3%
Two or more races 6 6.1% v v v v
Socioeconomically disadvantaged 28 28.6% 50% 43% 7% 0%
English learners 17 17.3% 47% 47% 6% 0%
Students with disabilities 15 15.3% 87% 7% 7% 0%
Students receiving Migrant Education services 0 0.0% v v v v
Foster youth ± ± ± ± ± ±
± Information is not available at this time.
9Hawkins Elementary SchoolSARC
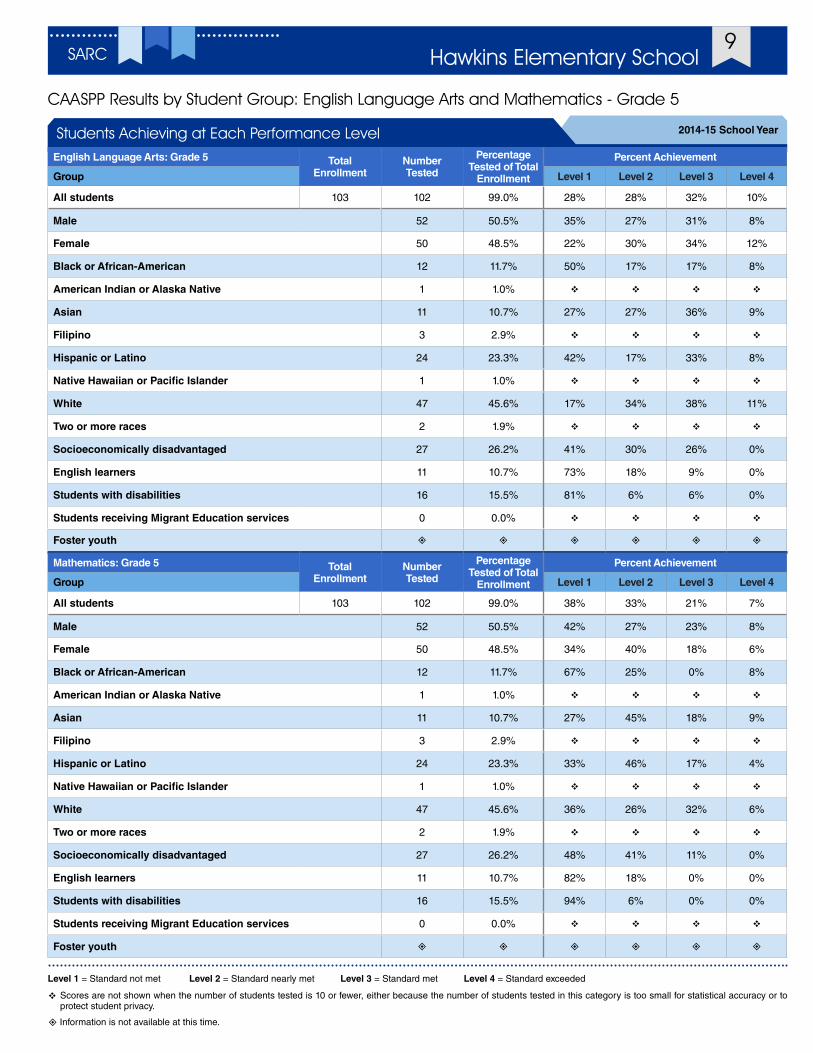
CAASPP Results by Student Group: English Language Arts and Mathematics - Grade 5
Level 1 = Standard not met Level 2 = Standard nearly met Level 3 = Standard met Level 4 = Standard exceeded
v Scores are not shown when the number of students tested is 10 or fewer, either because the number of students tested in this category is too small for statistical accuracy or to protect student privacy.
2014-15 School YearStudents Achieving at Each Performance LevelEnglish Language Arts: Grade 5 Total
EnrollmentNumber Tested
Percentage Tested of Total
Enrollment
Percent Achievement
Group Level 1 Level 2 Level 3 Level 4
All students 103 102 99.0% 28% 28% 32% 10%
Male 52 50.5% 35% 27% 31% 8%
Female 50 48.5% 22% 30% 34% 12%
Black or African-American 12 11.7% 50% 17% 17% 8%
American Indian or Alaska Native 1 1.0% v v v v
Asian 11 10.7% 27% 27% 36% 9%
Filipino 3 2.9% v v v v
Hispanic or Latino 24 23.3% 42% 17% 33% 8%
Native Hawaiian or Pacific Islander 1 1.0% v v v v
White 47 45.6% 17% 34% 38% 11%
Two or more races 2 1.9% v v v v
Socioeconomically disadvantaged 27 26.2% 41% 30% 26% 0%
English learners 11 10.7% 73% 18% 9% 0%
Students with disabilities 16 15.5% 81% 6% 6% 0%
Students receiving Migrant Education services 0 0.0% v v v v
Foster youth ± ± ± ± ± ±
Mathematics: Grade 5 Total Enrollment
Number Tested
Percentage Tested of Total
Enrollment
Percent Achievement
Group Level 1 Level 2 Level 3 Level 4
All students 103 102 99.0% 38% 33% 21% 7%
Male 52 50.5% 42% 27% 23% 8%
Female 50 48.5% 34% 40% 18% 6%
Black or African-American 12 11.7% 67% 25% 0% 8%
American Indian or Alaska Native 1 1.0% v v v v
Asian 11 10.7% 27% 45% 18% 9%
Filipino 3 2.9% v v v v
Hispanic or Latino 24 23.3% 33% 46% 17% 4%
Native Hawaiian or Pacific Islander 1 1.0% v v v v
White 47 45.6% 36% 26% 32% 6%
Two or more races 2 1.9% v v v v
Socioeconomically disadvantaged 27 26.2% 48% 41% 11% 0%
English learners 11 10.7% 82% 18% 0% 0%
Students with disabilities 16 15.5% 94% 6% 0% 0%
Students receiving Migrant Education services 0 0.0% v v v v
Foster youth ± ± ± ± ± ±
± Information is not available at this time.
10
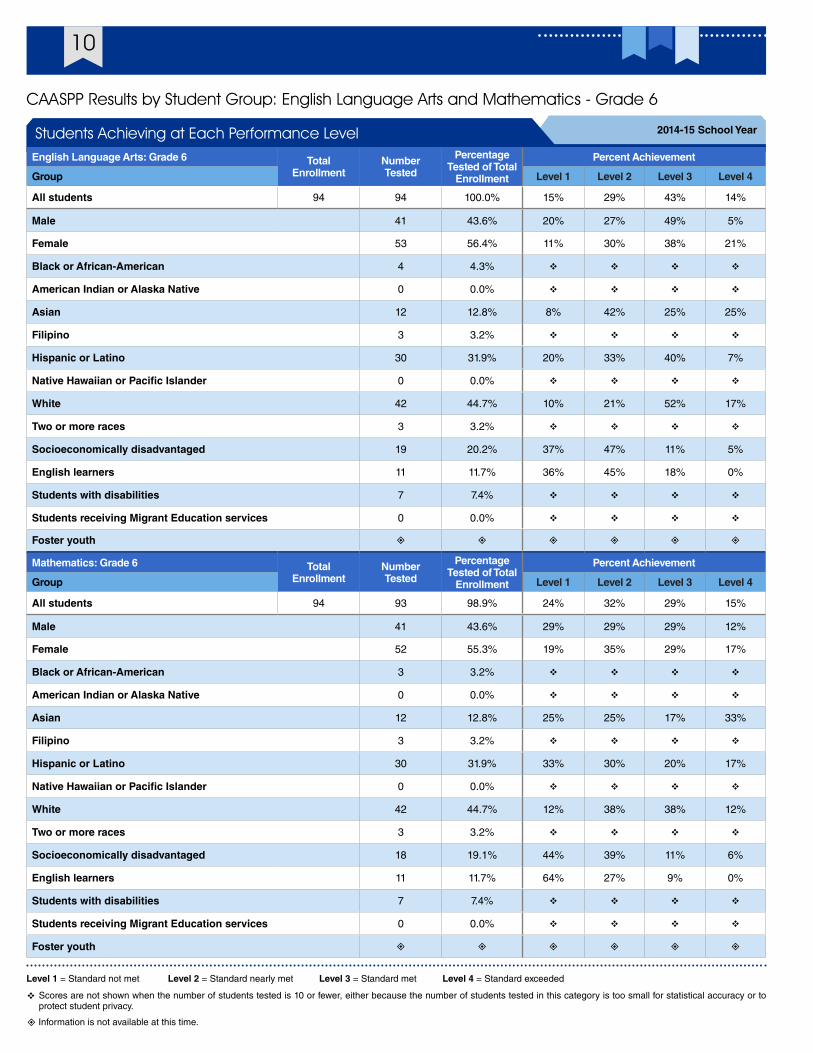
CAASPP Results by Student Group: English Language Arts and Mathematics - Grade 6
Level 1 = Standard not met Level 2 = Standard nearly met Level 3 = Standard met Level 4 = Standard exceeded
v Scores are not shown when the number of students tested is 10 or fewer, either because the number of students tested in this category is too small for statistical accuracy or to protect student privacy.
2014-15 School YearStudents Achieving at Each Performance LevelEnglish Language Arts: Grade 6 Total
EnrollmentNumber Tested
Percentage Tested of Total
Enrollment
Percent Achievement
Group Level 1 Level 2 Level 3 Level 4
All students 94 94 100.0% 15% 29% 43% 14%
Male 41 43.6% 20% 27% 49% 5%
Female 53 56.4% 11% 30% 38% 21%
Black or African-American 4 4.3% v v v v
American Indian or Alaska Native 0 0.0% v v v v
Asian 12 12.8% 8% 42% 25% 25%
Filipino 3 3.2% v v v v
Hispanic or Latino 30 31.9% 20% 33% 40% 7%
Native Hawaiian or Pacific Islander 0 0.0% v v v v
White 42 44.7% 10% 21% 52% 17%
Two or more races 3 3.2% v v v v
Socioeconomically disadvantaged 19 20.2% 37% 47% 11% 5%
English learners 11 11.7% 36% 45% 18% 0%
Students with disabilities 7 7.4% v v v v
Students receiving Migrant Education services 0 0.0% v v v v
Foster youth ± ± ± ± ± ±
Mathematics: Grade 6 Total Enrollment
Number Tested
Percentage Tested of Total
Enrollment
Percent Achievement
Group Level 1 Level 2 Level 3 Level 4
All students 94 93 98.9% 24% 32% 29% 15%
Male 41 43.6% 29% 29% 29% 12%
Female 52 55.3% 19% 35% 29% 17%
Black or African-American 3 3.2% v v v v
American Indian or Alaska Native 0 0.0% v v v v
Asian 12 12.8% 25% 25% 17% 33%
Filipino 3 3.2% v v v v
Hispanic or Latino 30 31.9% 33% 30% 20% 17%
Native Hawaiian or Pacific Islander 0 0.0% v v v v
White 42 44.7% 12% 38% 38% 12%
Two or more races 3 3.2% v v v v
Socioeconomically disadvantaged 18 19.1% 44% 39% 11% 6%
English learners 11 11.7% 64% 27% 9% 0%
Students with disabilities 7 7.4% v v v v
Students receiving Migrant Education services 0 0.0% v v v v
Foster youth ± ± ± ± ± ±
± Information is not available at this time.
11Hawkins Elementary SchoolSARC
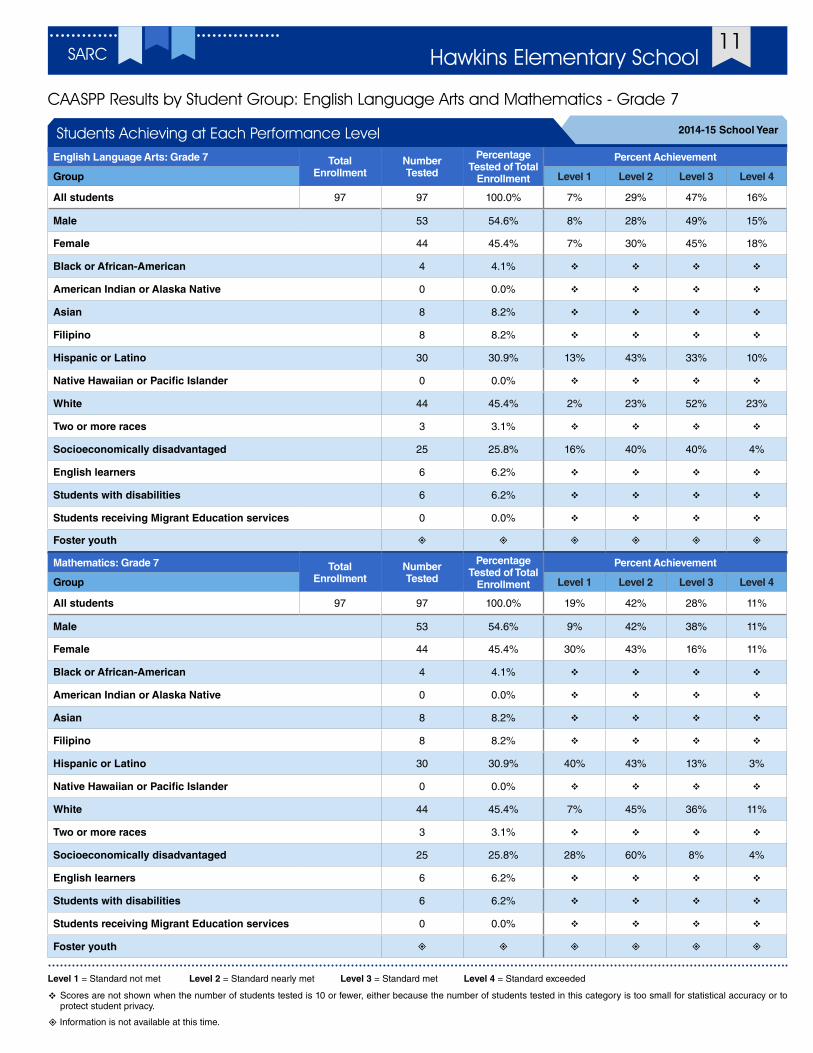
CAASPP Results by Student Group: English Language Arts and Mathematics - Grade 7
Level 1 = Standard not met Level 2 = Standard nearly met Level 3 = Standard met Level 4 = Standard exceeded
v Scores are not shown when the number of students tested is 10 or fewer, either because the number of students tested in this category is too small for statistical accuracy or to protect student privacy.
2014-15 School YearStudents Achieving at Each Performance LevelEnglish Language Arts: Grade 7 Total
EnrollmentNumber Tested
Percentage Tested of Total
Enrollment
Percent Achievement
Group Level 1 Level 2 Level 3 Level 4
All students 97 97 100.0% 7% 29% 47% 16%
Male 53 54.6% 8% 28% 49% 15%
Female 44 45.4% 7% 30% 45% 18%
Black or African-American 4 4.1% v v v v
American Indian or Alaska Native 0 0.0% v v v v
Asian 8 8.2% v v v v
Filipino 8 8.2% v v v v
Hispanic or Latino 30 30.9% 13% 43% 33% 10%
Native Hawaiian or Pacific Islander 0 0.0% v v v v
White 44 45.4% 2% 23% 52% 23%
Two or more races 3 3.1% v v v v
Socioeconomically disadvantaged 25 25.8% 16% 40% 40% 4%
English learners 6 6.2% v v v v
Students with disabilities 6 6.2% v v v v
Students receiving Migrant Education services 0 0.0% v v v v
Foster youth ± ± ± ± ± ±
Mathematics: Grade 7 Total Enrollment
Number Tested
Percentage Tested of Total
Enrollment
Percent Achievement
Group Level 1 Level 2 Level 3 Level 4
All students 97 97 100.0% 19% 42% 28% 11%
Male 53 54.6% 9% 42% 38% 11%
Female 44 45.4% 30% 43% 16% 11%
Black or African-American 4 4.1% v v v v
American Indian or Alaska Native 0 0.0% v v v v
Asian 8 8.2% v v v v
Filipino 8 8.2% v v v v
Hispanic or Latino 30 30.9% 40% 43% 13% 3%
Native Hawaiian or Pacific Islander 0 0.0% v v v v
White 44 45.4% 7% 45% 36% 11%
Two or more races 3 3.1% v v v v
Socioeconomically disadvantaged 25 25.8% 28% 60% 8% 4%
English learners 6 6.2% v v v v
Students with disabilities 6 6.2% v v v v
Students receiving Migrant Education services 0 0.0% v v v v
Foster youth ± ± ± ± ± ±
± Information is not available at this time.
12
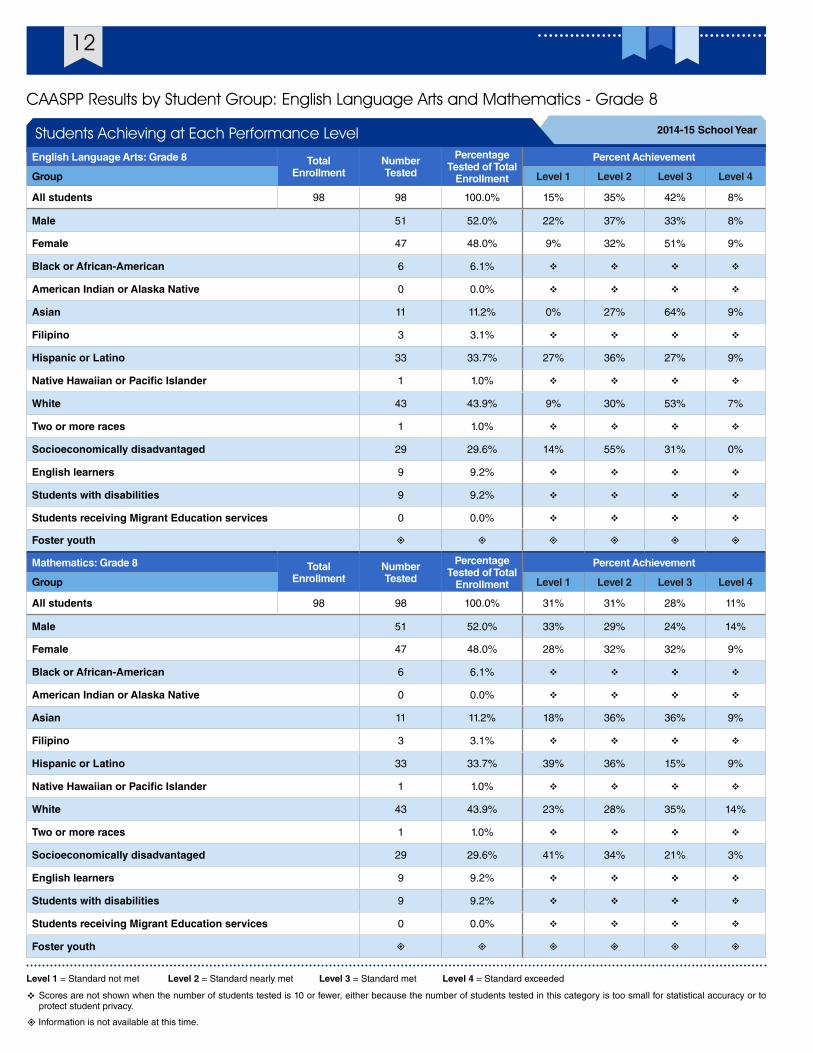
CAASPP Results by Student Group: English Language Arts and Mathematics - Grade 8
Level 1 = Standard not met Level 2 = Standard nearly met Level 3 = Standard met Level 4 = Standard exceeded
v Scores are not shown when the number of students tested is 10 or fewer, either because the number of students tested in this category is too small for statistical accuracy or to protect student privacy.
2014-15 School YearStudents Achieving at Each Performance LevelEnglish Language Arts: Grade 8 Total
EnrollmentNumber Tested
Percentage Tested of Total
Enrollment
Percent Achievement
Group Level 1 Level 2 Level 3 Level 4
All students 98 98 100.0% 15% 35% 42% 8%
Male 51 52.0% 22% 37% 33% 8%
Female 47 48.0% 9% 32% 51% 9%
Black or African-American 6 6.1% v v v v
American Indian or Alaska Native 0 0.0% v v v v
Asian 11 11.2% 0% 27% 64% 9%
Filipino 3 3.1% v v v v
Hispanic or Latino 33 33.7% 27% 36% 27% 9%
Native Hawaiian or Pacific Islander 1 1.0% v v v v
White 43 43.9% 9% 30% 53% 7%
Two or more races 1 1.0% v v v v
Socioeconomically disadvantaged 29 29.6% 14% 55% 31% 0%
English learners 9 9.2% v v v v
Students with disabilities 9 9.2% v v v v
Students receiving Migrant Education services 0 0.0% v v v v
Foster youth ± ± ± ± ± ±
Mathematics: Grade 8 Total Enrollment
Number Tested
Percentage Tested of Total
Enrollment
Percent Achievement
Group Level 1 Level 2 Level 3 Level 4
All students 98 98 100.0% 31% 31% 28% 11%
Male 51 52.0% 33% 29% 24% 14%
Female 47 48.0% 28% 32% 32% 9%
Black or African-American 6 6.1% v v v v
American Indian or Alaska Native 0 0.0% v v v v
Asian 11 11.2% 18% 36% 36% 9%
Filipino 3 3.1% v v v v
Hispanic or Latino 33 33.7% 39% 36% 15% 9%
Native Hawaiian or Pacific Islander 1 1.0% v v v v
White 43 43.9% 23% 28% 35% 14%
Two or more races 1 1.0% v v v v
Socioeconomically disadvantaged 29 29.6% 41% 34% 21% 3%
English learners 9 9.2% v v v v
Students with disabilities 9 9.2% v v v v
Students receiving Migrant Education services 0 0.0% v v v v
Foster youth ± ± ± ± ± ±
± Information is not available at this time.
13Hawkins Elementary SchoolSARC
• Systems: Gas systems and pipes, sewer, mechanical systems (heating, ventilation and air-conditioning)
• Interior: Interior surfaces (floors, ceilings, walls and window casings)
• Cleanliness: Pest/vermin control, overall cleanliness (school grounds, buildings, rooms and common areas)
• Electrical: Electrical systems (interior and exterior)
• Restrooms/fountains: Restrooms, sinks and drinking fountains (interior and exterior)
• Safety: Fire-safety equipment, emergency systems, hazardous materials (interior and exterior)
• Structural: Structural condition, roofs
• External: Windows/doors/gates/fences, playgrounds/school grounds
School Facility Items Inspected The table shows the results of the school’s most recent inspection using the Facility Inspection Tool (FIT) or equivalent school form. The following is a list of items inspected.
School FacilitiesContinued from left
Hazard and safety awareness helps to provide a secure, peaceful and clean envi-ronment for the school community.
The school safety plan identifies proce-dures to follow during emergencies and natural disasters. Emergency drills are conducted on a regular basis.
At Tom Hawkins Elementary School, every effort is made to ensure students are monitored while on campus throughout the school day. Yard supervisors, teach-ers, site administrators and school staff provide supervision for students before and during school. All visitors must sign in at the office and receive proper authoriza-tion to be on campus and must display their visitor passes at all times. Classroom volunteers must attain tuberculosis clear-ance.
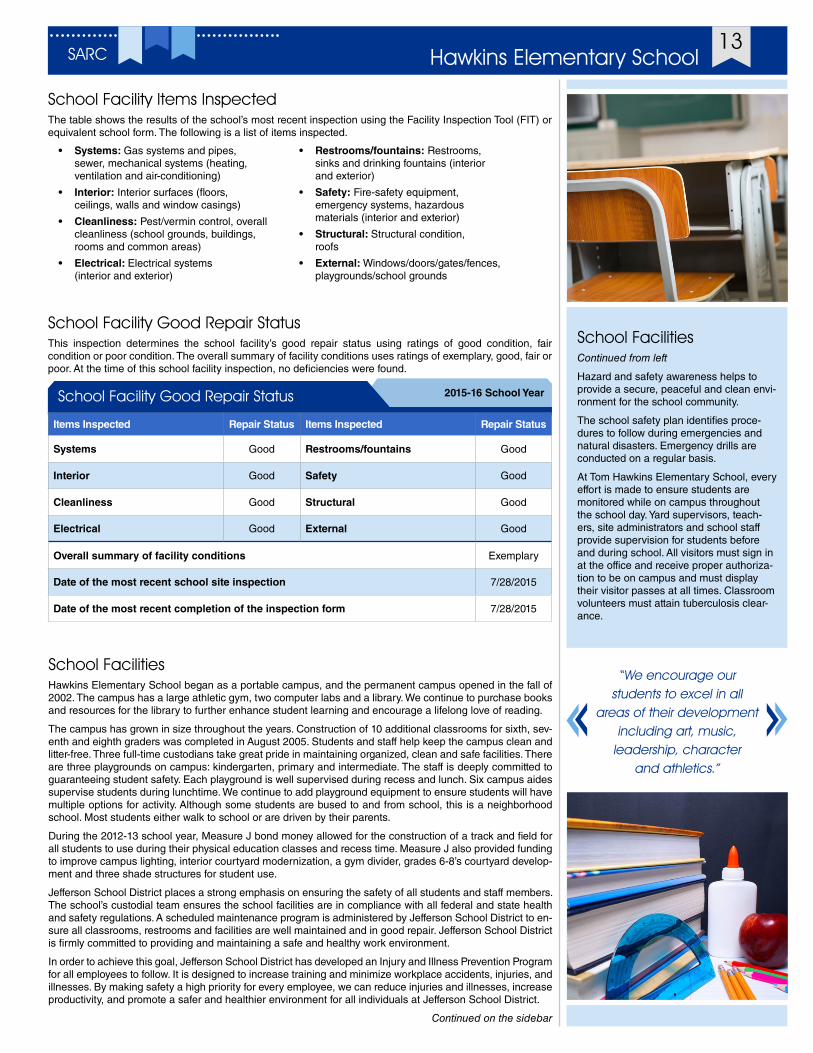
School FacilitiesHawkins Elementary School began as a portable campus, and the permanent campus opened in the fall of 2002. The campus has a large athletic gym, two computer labs and a library. We continue to purchase books and resources for the library to further enhance student learning and encourage a lifelong love of reading.
The campus has grown in size throughout the years. Construction of 10 additional classrooms for sixth, sev-enth and eighth graders was completed in August 2005. Students and staff help keep the campus clean and litter-free. Three full-time custodians take great pride in maintaining organized, clean and safe facilities. There are three playgrounds on campus: kindergarten, primary and intermediate. The staff is deeply committed to guaranteeing student safety. Each playground is well supervised during recess and lunch. Six campus aides supervise students during lunchtime. We continue to add playground equipment to ensure students will have multiple options for activity. Although some students are bused to and from school, this is a neighborhood school. Most students either walk to school or are driven by their parents.
During the 2012-13 school year, Measure J bond money allowed for the construction of a track and field for all students to use during their physical education classes and recess time. Measure J also provided funding to improve campus lighting, interior courtyard modernization, a gym divider, grades 6-8’s courtyard develop-ment and three shade structures for student use.
Jefferson School District places a strong emphasis on ensuring the safety of all students and staff members. The school’s custodial team ensures the school facilities are in compliance with all federal and state health and safety regulations. A scheduled maintenance program is administered by Jefferson School District to en-sure all classrooms, restrooms and facilities are well maintained and in good repair. Jefferson School District is firmly committed to providing and maintaining a safe and healthy work environment.
In order to achieve this goal, Jefferson School District has developed an Injury and Illness Prevention Program for all employees to follow. It is designed to increase training and minimize workplace accidents, injuries, and illnesses. By making safety a high priority for every employee, we can reduce injuries and illnesses, increase productivity, and promote a safer and healthier environment for all individuals at Jefferson School District.
Continued on the sidebar
School Facility Good Repair Status This inspection determines the school facility’s good repair status using ratings of good condition, fair condition or poor condition. The overall summary of facility conditions uses ratings of exemplary, good, fair or poor. At the time of this school facility inspection, no deficiencies were found.
2015-16 School YearSchool Facility Good Repair Status
Items Inspected Repair Status Items Inspected Repair Status
Systems Good Restrooms/fountains Good
Interior Good Safety Good
Cleanliness Good Structural Good
Electrical Good External Good
Overall summary of facility conditions Exemplary
Date of the most recent school site inspection 7/28/2015
Date of the most recent completion of the inspection form 7/28/2015
“We encourage our students to excel in all
areas of their development including art, music,
leadership, character and athletics.”
14
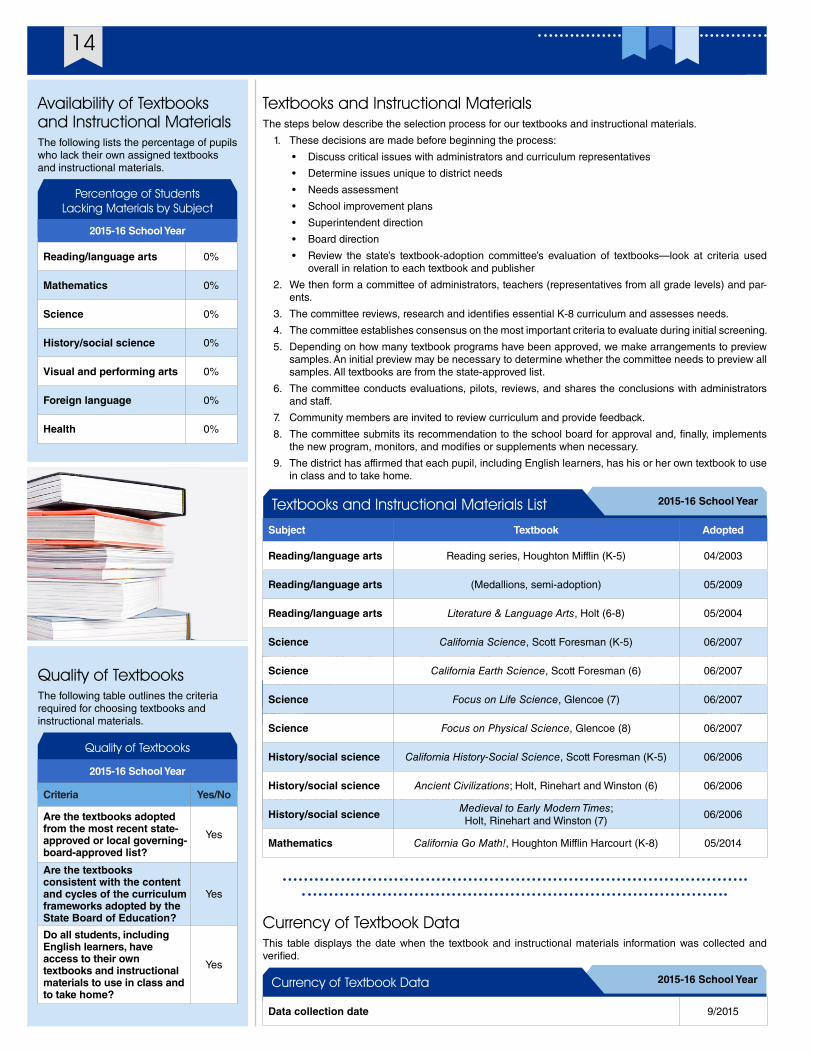
Quality of TextbooksThe following table outlines the criteria required for choosing textbooks and instructional materials.
2015-16 School YearQuality of Textbooks
Criteria Yes/No
Are the textbooks adopted from the most recent state-approved or local governing-board-approved list?
Are the textbooks consistent with the content and cycles of the curriculum frameworks adopted by the State Board of Education?
Do all students, including English learners, have access to their own textbooks and instructional materials to use in class and to take home?
Availability of Textbooks and Instructional MaterialsThe following lists the percentage of pupils who lack their own assigned textbooks and instructional materials.
Percentage of Students Lacking Materials by Subject
2015-16 School Year
Reading/language arts 0%
Mathematics 0%
Science 0%
History/social science 0%
Visual and performing arts 0%
Foreign language 0%
Health 0%
Currency of Textbook DataThis table displays the date when the textbook and instructional materials information was collected and verified.
2015-16 School YearCurrency of Textbook Data
Data collection date 9/2015
Textbooks and Instructional MaterialsThe steps below describe the selection process for our textbooks and instructional materials.
1. These decisions are made before beginning the process:
• Discuss critical issues with administrators and curriculum representatives
• Determine issues unique to district needs
• Needs assessment
• School improvement plans
• Superintendent direction
• Board direction
• Review the state’s textbook-adoption committee’s evaluation of textbooks—look at criteria used overall in relation to each textbook and publisher
2. We then form a committee of administrators, teachers (representatives from all grade levels) and par-ents.
3. The committee reviews, research and identifies essential K-8 curriculum and assesses needs.
4. The committee establishes consensus on the most important criteria to evaluate during initial screening.
5. Depending on how many textbook programs have been approved, we make arrangements to preview samples. An initial preview may be necessary to determine whether the committee needs to preview all samples. All textbooks are from the state-approved list.
6. The committee conducts evaluations, pilots, reviews, and shares the conclusions with administrators and staff.
7. Community members are invited to review curriculum and provide feedback.
8. The committee submits its recommendation to the school board for approval and, finally, implements the new program, monitors, and modifies or supplements when necessary.
9. The district has affirmed that each pupil, including English learners, has his or her own textbook to use in class and to take home.
2015-16 School YearTextbooks and Instructional Materials List
Subject Textbook Adopted
Reading/language arts Reading series, Houghton Mifflin (K-5) 04/2003
Reading/language arts (Medallions, semi-adoption) 05/2009
Reading/language arts Literature & Language Arts, Holt (6-8) 05/2004
Science California Science, Scott Foresman (K-5) 06/2007
Science California Earth Science, Scott Foresman (6) 06/2007
Science Focus on Life Science, Glencoe (7) 06/2007
Science Focus on Physical Science, Glencoe (8) 06/2007
History/social science California History-Social Science, Scott Foresman (K-5) 06/2006
History/social science Ancient Civilizations; Holt, Rinehart and Winston (6) 06/2006
History/social science Medieval to Early Modern Times; Holt, Rinehart and Winston (7)
06/2006
Mathematics California Go Math!, Houghton Mifflin Harcourt (K-8) 05/2014
Quality of TextbooksThe following table outlines the criteria required for choosing textbooks and instructional materials.
Quality of Textbooks
2015-16 School Year
Criteria Yes/No
Are the textbooks adopted from the most recent state-approved or local governing-board-approved list?
Yes
Are the textbooks consistent with the content and cycles of the curriculum frameworks adopted by the State Board of Education?
Yes
Do all students, including English learners, have access to their own textbooks and instructional materials to use in class and to take home?
Yes
15Hawkins Elementary SchoolSARC
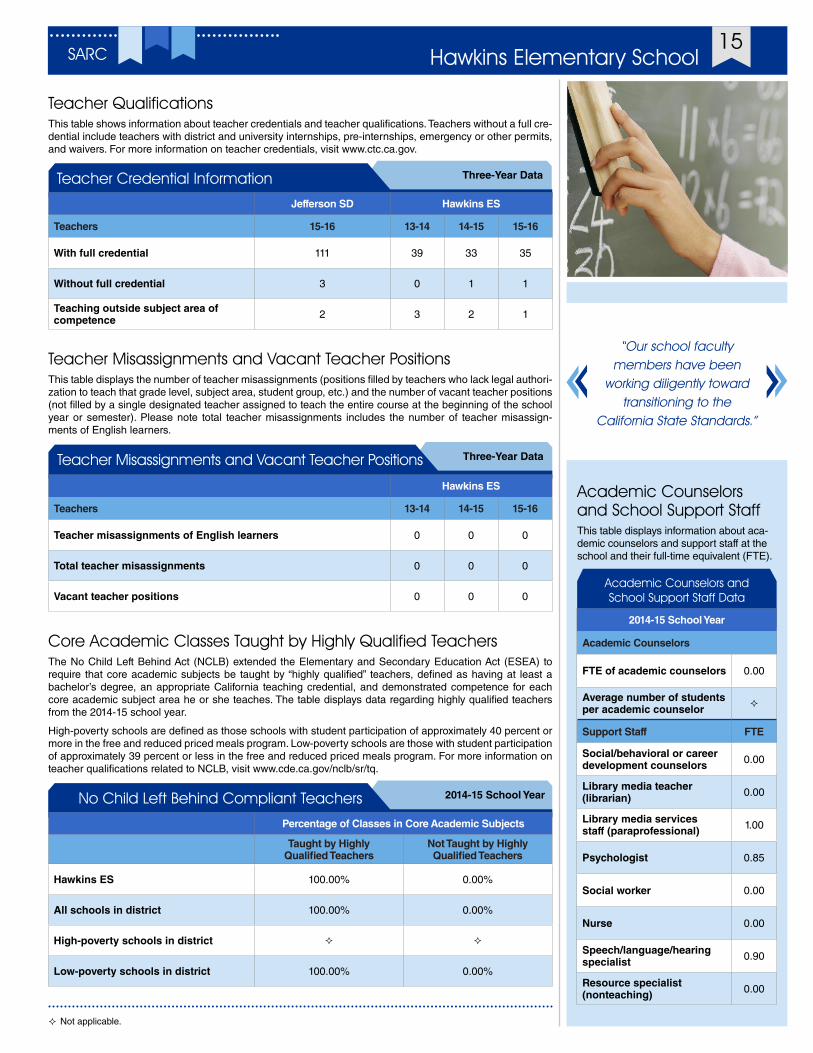
Teacher QualificationsThis table shows information about teacher credentials and teacher qualifications. Teachers without a full cre-dential include teachers with district and university internships, pre-internships, emergency or other permits, and waivers. For more information on teacher credentials, visit www.ctc.ca.gov.
Three-Year DataTeacher Credential Information
Jefferson SD Hawkins ES
Teachers 15-16 13-14 14-15 15-16
With full credential 111 39 33 35
Without full credential 3 0 1 1
Teaching outside subject area of competence 2 3 2 1
Teacher Misassignments and Vacant Teacher PositionsThis table displays the number of teacher misassignments (positions filled by teachers who lack legal authori-zation to teach that grade level, subject area, student group, etc.) and the number of vacant teacher positions (not filled by a single designated teacher assigned to teach the entire course at the beginning of the school year or semester). Please note total teacher misassignments includes the number of teacher misassign-ments of English learners.
Three-Year DataTeacher Misassignments and Vacant Teacher Positions
Hawkins ES
Teachers 13-14 14-15 15-16
Teacher misassignments of English learners 0 0 0
Total teacher misassignments 0 0 0
Vacant teacher positions 0 0 0
Core Academic Classes Taught by Highly Qualified TeachersThe No Child Left Behind Act (NCLB) extended the Elementary and Secondary Education Act (ESEA) to require that core academic subjects be taught by “highly qualified” teachers, defined as having at least a bachelor’s degree, an appropriate California teaching credential, and demonstrated competence for each core academic subject area he or she teaches. The table displays data regarding highly qualified teachers from the 2014-15 school year.
High-poverty schools are defined as those schools with student participation of approximately 40 percent or more in the free and reduced priced meals program. Low-poverty schools are those with student participation of approximately 39 percent or less in the free and reduced priced meals program. For more information on teacher qualifications related to NCLB, visit www.cde.ca.gov/nclb/sr/tq.
2014-15 School YearNo Child Left Behind Compliant Teachers
Percentage of Classes in Core Academic Subjects
Taught by Highly Qualified Teachers
Not Taught by Highly Qualified Teachers
Hawkins ES 100.00% 0.00%
All schools in district 100.00% 0.00%
High-poverty schools in district ² ²
Low-poverty schools in district 100.00% 0.00%
² Not applicable.
“Our school faculty members have been
working diligently toward transitioning to the
California State Standards.”
Academic Counselors and School Support StaffThis table displays information about aca-demic counselors and support staff at the school and their full-time equivalent (FTE).
Academic Counselors and School Support Staff Data
2014-15 School Year
Academic Counselors
FTE of academic counselors 0.00
Average number of students per academic counselor ²
Support Staff FTE
Social/behavioral or career development counselors 0.00
Library media teacher (librarian) 0.00
Library media services staff (paraprofessional) 1.00
Psychologist 0.85
Social worker 0.00
Nurse 0.00
Speech/language/hearing specialist 0.90
Resource specialist (nonteaching) 0.00
16
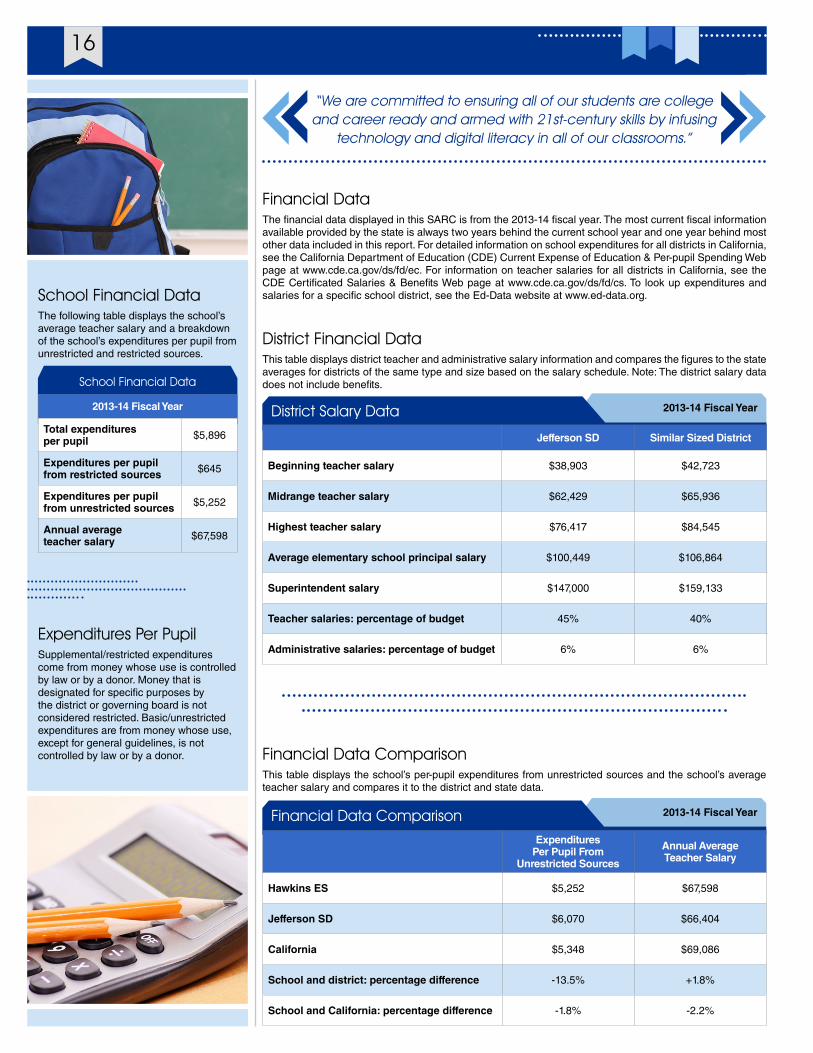
Financial Data The financial data displayed in this SARC is from the 2013-14 fiscal year. The most current fiscal information available provided by the state is always two years behind the current school year and one year behind most other data included in this report. For detailed information on school expenditures for all districts in California, see the California Department of Education (CDE) Current Expense of Education & Per-pupil Spending Web page at www.cde.ca.gov/ds/fd/ec. For information on teacher salaries for all districts in California, see the CDE Certificated Salaries & Benefits Web page at www.cde.ca.gov/ds/fd/cs. To look up expenditures and salaries for a specific school district, see the Ed-Data website at www.ed-data.org.
School Financial Data
2013-14 Fiscal Year
Total expenditures per pupil $5,896
Expenditures per pupil from restricted sources $645
Expenditures per pupil from unrestricted sources $5,252
Annual average teacher salary $67,598
School Financial DataThe following table displays the school’s average teacher salary and a breakdown of the school’s expenditures per pupil from unrestricted and restricted sources.
Expenditures Per PupilSupplemental/restricted expenditures come from money whose use is controlled by law or by a donor. Money that is designated for specific purposes by the district or governing board is not considered restricted. Basic/unrestricted expenditures are from money whose use, except for general guidelines, is not controlled by law or by a donor. Financial Data Comparison
This table displays the school’s per-pupil expenditures from unrestricted sources and the school’s average teacher salary and compares it to the district and state data.
2013-14 Fiscal YearFinancial Data ComparisonExpenditures
Per Pupil From Unrestricted Sources
Annual Average Teacher Salary
Hawkins ES $5,252 $67,598
Jefferson SD $6,070 $66,404
California $5,348 $69,086
School and district: percentage difference -13.5% +1.8%
School and California: percentage difference -1.8% -2.2%
District Financial DataThis table displays district teacher and administrative salary information and compares the figures to the state averages for districts of the same type and size based on the salary schedule. Note: The district salary data does not include benefits.
2013-14 Fiscal YearDistrict Salary Data
Jefferson SD Similar Sized District
Beginning teacher salary $38,903 $42,723
Midrange teacher salary $62,429 $65,936
Highest teacher salary $76,417 $84,545
Average elementary school principal salary $100,449 $106,864
Superintendent salary $147,000 $159,133
Teacher salaries: percentage of budget 45% 40%
Administrative salaries: percentage of budget 6% 6%
“We are committed to ensuring all of our students are college and career ready and armed with 21st-century skills by infusing
technology and digital literacy in all of our classrooms.”
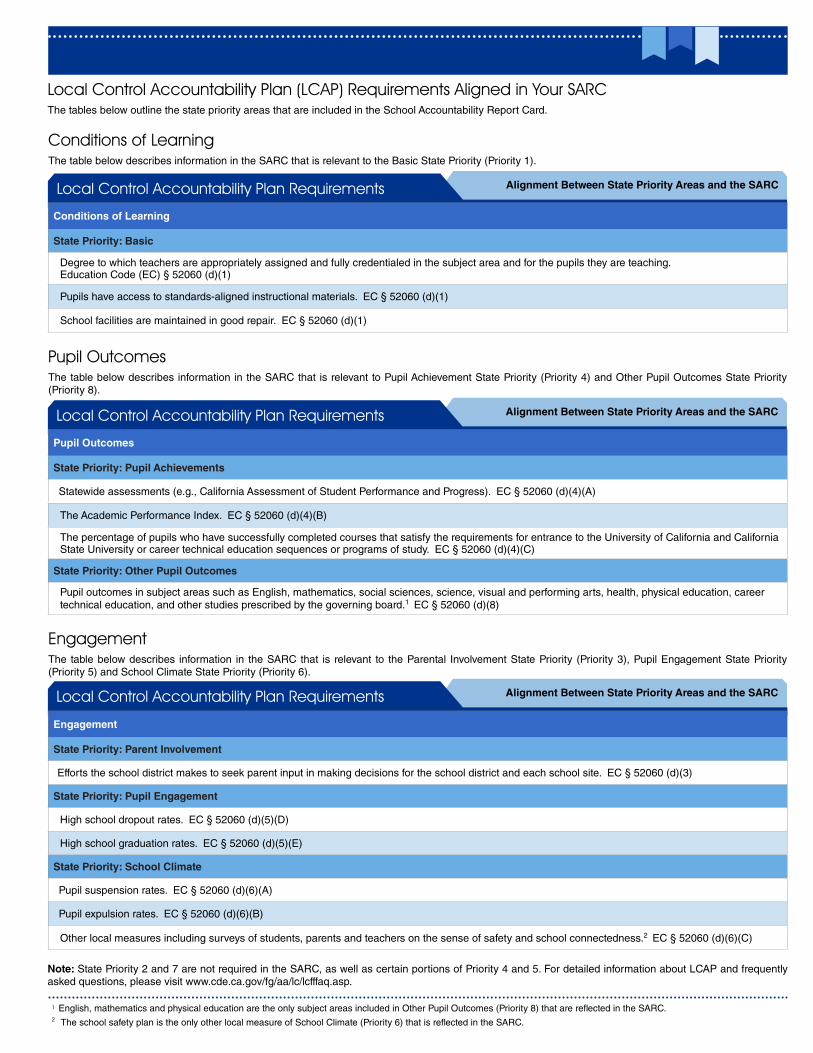
Local Control Accountability Plan (LCAP) Requirements Aligned in Your SARCThe tables below outline the state priority areas that are included in the School Accountability Report Card.
Note: State Priority 2 and 7 are not required in the SARC, as well as certain portions of Priority 4 and 5. For detailed information about LCAP and frequently asked questions, please visit www.cde.ca.gov/fg/aa/lc/lcfffaq.asp.
Conditions of LearningThe table below describes information in the SARC that is relevant to the Basic State Priority (Priority 1).
Alignment Between State Priority Areas and the SARCLocal Control Accountability Plan Requirements
Conditions of Learning
State Priority: Basic
Degree to which teachers are appropriately assigned and fully credentialed in the subject area and for the pupils they are teaching. Education Code (EC) § 52060 (d)(1)
Pupils have access to standards-aligned instructional materials. EC § 52060 (d)(1)
School facilities are maintained in good repair. EC § 52060 (d)(1)
Pupil OutcomesThe table below describes information in the SARC that is relevant to Pupil Achievement State Priority (Priority 4) and Other Pupil Outcomes State Priority (Priority 8).
Alignment Between State Priority Areas and the SARCLocal Control Accountability Plan Requirements
Pupil Outcomes
State Priority: Pupil Achievements
Statewide assessments (e.g., California Assessment of Student Performance and Progress). EC § 52060 (d)(4)(A)
The Academic Performance Index. EC § 52060 (d)(4)(B)
The percentage of pupils who have successfully completed courses that satisfy the requirements for entrance to the University of California and California State University or career technical education sequences or programs of study. EC § 52060 (d)(4)(C)
State Priority: Other Pupil Outcomes
Pupil outcomes in subject areas such as English, mathematics, social sciences, science, visual and performing arts, health, physical education, career technical education, and other studies prescribed by the governing board.1 EC § 52060 (d)(8)
EngagementThe table below describes information in the SARC that is relevant to the Parental Involvement State Priority (Priority 3), Pupil Engagement State Priority (Priority 5) and School Climate State Priority (Priority 6).
English, mathematics and physical education are the only subject areas included in Other Pupil Outcomes (Priority 8) that are reflected in the SARC. 1
The school safety plan is the only other local measure of School Climate (Priority 6) that is reflected in the SARC.2
Alignment Between State Priority Areas and the SARCLocal Control Accountability Plan Requirements
Engagement
State Priority: Parent Involvement
Efforts the school district makes to seek parent input in making decisions for the school district and each school site. EC § 52060 (d)(3)
State Priority: Pupil Engagement
High school dropout rates. EC § 52060 (d)(5)(D)
High school graduation rates. EC § 52060 (d)(5)(E)
State Priority: School Climate
Pupil suspension rates. EC § 52060 (d)(6)(A)
Pupil expulsion rates. EC § 52060 (d)(6)(B)
Other local measures including surveys of students, parents and teachers on the sense of safety and school connectedness.2 EC § 52060 (d)(6)(C)
Hawkins Elementary School SARC
Data for this year’s SARC was provided by the California Department of Education (CDE), school and district offices. For additional information on California schools and districts and comparisons of the school to the district, the county and the state, please visit DataQuest at http://data1.cde.ca.gov/dataquest. DataQuest is an online resource that provides reports for accountability, test data, enrollment, graduates, dropouts, course enrollments, staffing and data regarding English learners. Per Education Code Section 35256, each school district shall make hard copies of its annually updated report card available, upon request, on or before February 1 of each year.
All data accurate as of December 2015.
School Accountability Report Card
PubliShed by:
www.sia-us.com | 800.487.9234