Embed Size (px)
Citation preview

our teachers
our school
our message
Norris SD
Veterans Elementary
School2014-15
School Accountability Report Card
Published in 2015-16
Russelyn Sullivan Principal
6301 Old Farm Road Bakersfield, CA 93312
Grades: TK-6 Phone: (661) 387-7050
www.norris.k12.ca.us
CDS Code: 15-63693-0113738
Para español, visita: www.norris.k12.ca.us
Kelly Miller, Superintendent • [email protected] • Phone: (661) 387-7000
Norris School District • 6940 Calloway Drive Bakersfield, CA 93314 • www.norris.k12.ca.us

2Veterans Elementary SchoolSARC
Principal’s MessageVeterans Elementary is the newest school in the Norris School District, opening in 2007. Our beautiful cam-pus is located at 6301 Old Farm Road. Our name, Veterans Elementary, was chosen to honor the men and women who have fought to protect our freedom. Forty-one teachers serve 1,045 students. Support services include a resource specialist, reading resource teacher, speech and language teacher, resource specialist aide, reading resource aide, behavioral aide, full-time library aide, part-time library aide, and a bilingual aide. We share the services of a district psychologist, nurse, two physical-education teachers, band instructor and two vocal music teachers with our other three elementary campuses. Our student population is relatively homogeneous with primarily middle-class families who are highly involved in their children’s education.
Veterans Elementary is committed to meeting the needs of all our students. Teachers and staff are dedicated to providing each student the opportunity to achieve his or her highest potential. We strive to provide a school where students and staff are recognized for their achievements, feel safe in their surroundings, and are treated fairly. Veterans Elementary utilizes a standards-based curriculum. Our self-contained classrooms have daily schedules that reflect and exceed the recommended state guidelines for instructional minutes. All our textbooks meet state requirements. All of our teachers are highly qualified and have received training in the evaluation and implementation of Common Core instruction and utilize research-based strategies in the delivery of the curriculum. Our teachers are skilled at evaluating and monitoring student progress through district benchmark testing, reading screenings and observation. They differentiate the curriculum to meet the diverse needs of our students. Students are recognized at our quarterly Outstanding Eagle Awards assem-blies and are offered a variety of activities to meet their individual needs, talents and interests.
Parental InvolvementOur Parent Teacher Club (PTC) provides support for many activities at our school. Each year the PTC sup-ports Fall Festival, Grandparent’s Day, May Dinner, Veterans Day Celebration, Book Fairs, a Mother/Son Bingo Night, a Father/Daughter Dance, and a Donation Drive. In addition to helping plan and organize these activities, they financially support our school by funding assemblies, assisting with technology purchases and purchasing learning materials. Their support enriches our students’ school experiences.
Veterans Elementary prides itself in having such strong parental support. We encourage parents/guardians to serve as volunteers in our school and attend student performances and school meetings.
We have many parents who generously donate hours of their service to the classroom and library each year. Their support is vital to the education of our students.
The School Site Council (SSC) is another opportunity for parents to participate in the school organization. The SSC consists of parents, teachers, classified staff and the principal. The SSC meets monthly to oversee the School/Library Improvement Program (SLIP) budget and discuss the ongoing needs of the school. Each year, the SSC develops a plan to utilize SLIP funds to meet the needs of the student population and continu-ally monitors the plan throughout the school year. At the end of the year, the SSC evaluates the plan and makes recommendations for the next school year based on its findings.
For more information on how to become involved, contact PTC President Carie King at (661) 387-7050.
School Accountability Report Card
In accordance with state and federal requirements, the
School Accountability Report Card (SARC) is put forth annually by all public schools as a tool for parents
and interested parties to stay informed of the school’s progress, test
scores and achievements.
District Mission StatementThe education philosophy of the
Norris School District is built on the following principles:
A belief in the worth and dignity of each and every person
• A respect for knowledge and a strong
commitment to provide quality educational opportunities for each of our students
•A conviction that democratic
societies have more to offer than totalitarian societies
•A faith in reason and in an orderly solution of conflict
•A belief in the protection of personal liberties within the limits of the law
•A belief that our success as an
educational institution is measured primarily by the success and achievement of our students
Governing BoardJeff Stone, President
Jim Bowles, Member
Sue Dodgin, Member
John Genter, Member
Cy Silver, Clerk
School SafetyThe Veterans Elementary staff is very conscientious about the safety of our students. Monthly emergency drills (fire drills and/or duck-and-cover drills) are scheduled. District and school site Safety Committee meet-ings are held on a monthly basis to discuss all aspects of safety on our campuses. The school safety plan is revised yearly, taking into account staff changes as well as content revisions. Safety is a top priority at our school, and the plan is dedicated to the ongoing enhancement of school safety. Our custodial staff works dili-gently to ensure high standards of cleanliness in the cafeteria, bathrooms, and grounds. The lead custodian, on a monthly basis, inspects playground and classroom facilities and equipment. Our school safety commit-tee also inspects the classroom facilities on a regular basis.
Disaster preparedness is accomplished by training the staff to respond to natural disaster or evacuations due to potential hazards. Many of the staff members are trained in first aid and CPR procedures along with triage, search and rescue, and student security in the event of an emergency. Student and staff safety training is done on an ongoing basis through in-services, fire and earthquake drills.
Veterans Elementary is part of the Kern County Substance Abuse Prevention Education Partnership. Teach-ers are trained for Caring Schools Community and Crisis Prevention Institute. Our school also participates in Red Ribbon Week.
To maintain campus security, all visitors on campus must check in at the office and wear identification badg-es. After the tardy bell rings, all campus entrances are locked. Until dismissal times, the gates remain locked for the safety of our students. At Veterans, we work together to instill the importance of keeping and maintain-ing a positive, safe environment for our children.
The school safety plan was last reviewed, updated and discussed with the school faculty in August 2015.

3Veterans Elementary SchoolSARC
Three-Year DataProfessional Development Days
2013-14 2014-15 2015-16
Veterans ES 5 days 5 days 5 days
Professional DevelopmentThe district staff-development program focuses on topics that assist each of our schools in becoming a better and safer place for students to learn and grow.
Last year, the board approved additional professional development days from three to five days. These ad-ditional days are four half-days (one each quarter). These additional days are for professional development with are to aid with our new Common Core curriculum as well as collaboration among each grade level. All days provide in-service opportunities for the certificated staff, the district used one buyback day and one day during the week before school, four minimum-day afternoons, after-school meetings, and out-of-district conferences and workshops. Topics covered include the following:
• Classroom Walkthrough Institute
• Best practices in group instruction
• Organizing for the Learning Center Model
• Aligning instruction with Common Core State Standards
• Using technology to assist instruction
• Rick Morris classroom management
• Using technology to communicate with parents
• Crisis prevention training
• CPR/first aid
• Rigorous Curriculum Design
• Best Practices in classroom management
• “Ready Readers” training
• Common Core State Standards training
• Adolescent brain development
• CPR/first aid
• Use of antimicrobial
• Use of material-safety data sheets
• Child-abuse reporting
• Ongoing bus-driver training
• Strategies for classroom aides (special educa-tion and bilingual aides)
• Child nutrition
Teachers new to the Norris School District also take part in a one-day in-service to familiarize them with the district mission, expectations and procedures. Teachers new to the teaching profession participate in the Beginning Teacher Support and Assessment (BTSA) program. In this program, new teachers are paired with experienced teachers who function as support providers for them. BTSA is a two-year program.
Additionally, all teachers in the district receive training in blood-borne pathogens, universal precautions, child-abuse reporting and sexual harassment. Other professional growth opportunities are made available to staff in a variety of in-service and conference offerings. These programs are offered by the Kern County Super-intendent of Schools Office or other professional organizations. Many teachers continue their professional training through various graduate-school programs offered in the area.
The classified staff were involved with in-service training which included the following:
Types of Services Funded• Class Size Reduction program in kindergarten and grades 1, 2 and 3
• School/Library Improvement Program to supplement the educational program for students in TK/kin-dergarten and grades 1-8
• Learning Center (special education and other students requiring supported education); special-educa-tion services include speech therapy and occupational therapy for qualifying students. Students need-ing a more restrictive learning environment are served in one of the three district Special Day Classes
• Resource teachers supported by the district general fund to help primary students learn to read (these teachers work in the Learning Center with general-education students)
• Economic Impact Aid (EIA) to assist English learners
• BTSA to assist teachers new to the teaching profession
• Counseling program for middle-school students
• Homework Club for students who need additional academic assistance
• North of the River Recreation and Park District sponsors the district’s after-school sports programs
• Opportunity Program to serve as a possible in-school alternative for students suspended from school
“Our name, Veterans Elementary, was chosen to honor the men and women who have
fought to protect our freedom.”
“The Veterans Elementary staff is very conscientious
about the safety of our students.”

4Veterans Elementary SchoolSARC
Enrollment by Student GroupThe total enrollment at the school was 1,005 students for the 2014-15 school year. The pie chart displays the percentage of students enrolled in each group.
2014-15 School YearDemographics
Socioeconomically disadvantaged
15.2%English
learners1.8%
Students with disabilities
1.0%Foster Youth
0.6%
Three-Year DataNumber of Classrooms by Size
2012-13 2013-14 2014-15
GradeNumber of Students
1-20 21-32 33+ 1-20 21-32 33+ 1-20 21-32 33+
K 6 6 6
1 5 6 6
2 5 6 8
3 4 5 6
4 4 5 5
5 4 4 5
6 5 4
Suspensions and ExpulsionsThis table shows the school, district, and state suspension and expulsion rates for the most recent three-year period. Note: Students are only counted one time, regardless of the number of suspensions.
Suspension and Expulsion Rates
Veterans ES
12-13 13-14 14-15
Suspension rates 0.0% 2.8% 0.0%
Expulsion rates 0.0% 0.0% 0.0%
Norris SD
12-13 13-14 14-15
Suspension rates 1.1% 11.6% 0.0%
Expulsion rates 0.0% 0.2% 0.0%
California
12-13 13-14 14-15
Suspension rates 5.1% 4.4% 3.8%
Expulsion rates 0.1% 0.1% 0.1%
Hispanic or Latino26.1%
American Indian or Alaska Native
1.2%
Asian2.4%
Native Hawaiian or Pacific Islander
0.2%Filipino3.0%Black or
African-American0.6%
White57.8%
Two or more races4.2%
No response 4.6%
Class Size DistributionThe bar graph displays the three-year data for average class size and the table displays the three-year data for the number of classrooms by size.
Three-Year DataAverage Class Size
13-1412-13 14-15
K 1 2 3 4 5 6
2628 28
3027
32
23
2824
2925
282524 22 23
2529
2629
Enrollment by GradeThe bar graph displays the total number of students enrolled in each grade for the 2014-15 school year.
2014-15 Enrollment by Grade
K
1
2
3
4
5
6
139
145
176
151
147
131
116

5Veterans Elementary SchoolSARC
Federal Intervention ProgramSchools and districts receiving Title I funding that fail to meet AYP over two consecutive years in the same content area (English language arts or mathematics) or on the same indicator enter into Program Improvement (PI). Each additional year that the district or school(s) do not meet AYP results in advancement to the next level of intervention. The percentage of schools identified for Program Improvement is calculated by taking the number of schools currently in PI within the district and dividing it by the total number of Title I schools within the district.
This table displays the 2015-16 Program Improvement status for the school and district. For detailed information about PI identification, please visit www.cde.ca.gov/ta/ac/ay/tidetermine.asp.
2015-16 School YearFederal Intervention Program
Veterans ES Norris SD
Program Improvement status Not Title I Not Title I
First year of Program Improvement ² ²
Year in Program Improvement ² ²
Number of Title I schools currently in Program Improvement 0
Percentage of Title I schools currently in Program Improvement 0.00%
California Physical Fitness TestEach spring, all students in grades 5, 7 and 9 are required to participate in the California Physical Fitness Test (PFT). The Fitnessgram® is the designated PFT for students in California public schools put forth by the State Board of Education. The PFT measures six key fitness areas:
1. Aerobic Capacity
2. Body Composition
3. Flexibility
4. Abdominal Strength and Endurance
5. Upper Body Strength and Endurance
6. Trunk Extensor Strength and Flexibility
Encouraging and assisting students in establishing lifelong habits of regular physical activity is the primary goal of the Fitnessgram. The table shows the percentage of students meeting the fitness standards of being in the “healthy fitness zone” for the most recent testing period. For more detailed information on the California PFT, please visit www.cde.ca.gov/ta/tg/pf.
Percentage of Students Meeting Fitness Standards
2014-15 School Year
Grade 5
Four of six standards 16.0%
Five of six standards 15.3%
Six of six standards 67.2%
Adequate Yearly ProgressThe federal Elementary and Secondary Education Act (ESEA) requires all schools and districts meet Ad-equate Yearly Progress (AYP) requirements. California public schools and districts are required to meet or exceed criteria in the following four target areas:
• Participation rate on statewide assessments in English language arts and mathematics
• Percentage of students scoring proficient on statewide assessments in English language arts and mathematics
• Attendance rates for schools with enrollment in Transitional Kindergarten through grade eight (TK-8)
• Graduation rate for high schools
The table displays whether or not the school, district, and state met each of the AYP criteria and made overall AYP for 2014-15. For more information, visit www.cde.ca.gov/ta/ac/ay.
2014-15 School YearAdequate Yearly Progress Criteria
Veterans ES Norris SD California
Met overall AYP Yes Yes Yes
Met participation rate:
English language arts Yes Yes Yes
Mathematics Yes Yes Yes
Met percent proficient:
English language arts n n n
Mathematics n n n
Met attendance rates Yes Yes Yes
Met graduation rate � � Yes
²Not applicable. The school and district are not in Program Improvement.� Not applicable. This AYP indicator is only applicable for high schools.
Not applicable. Due to the transition to the Smarter Balanced Summative Assessments, the U.S. Department of Education approved the California Department of Education’s waiver request to exclude the percent proficient results from AYP determinations. For more information on the AYP reports, please visit http://data1.cde.ca.gov/dataquest/.
n
6Veterans Elementary SchoolSARC
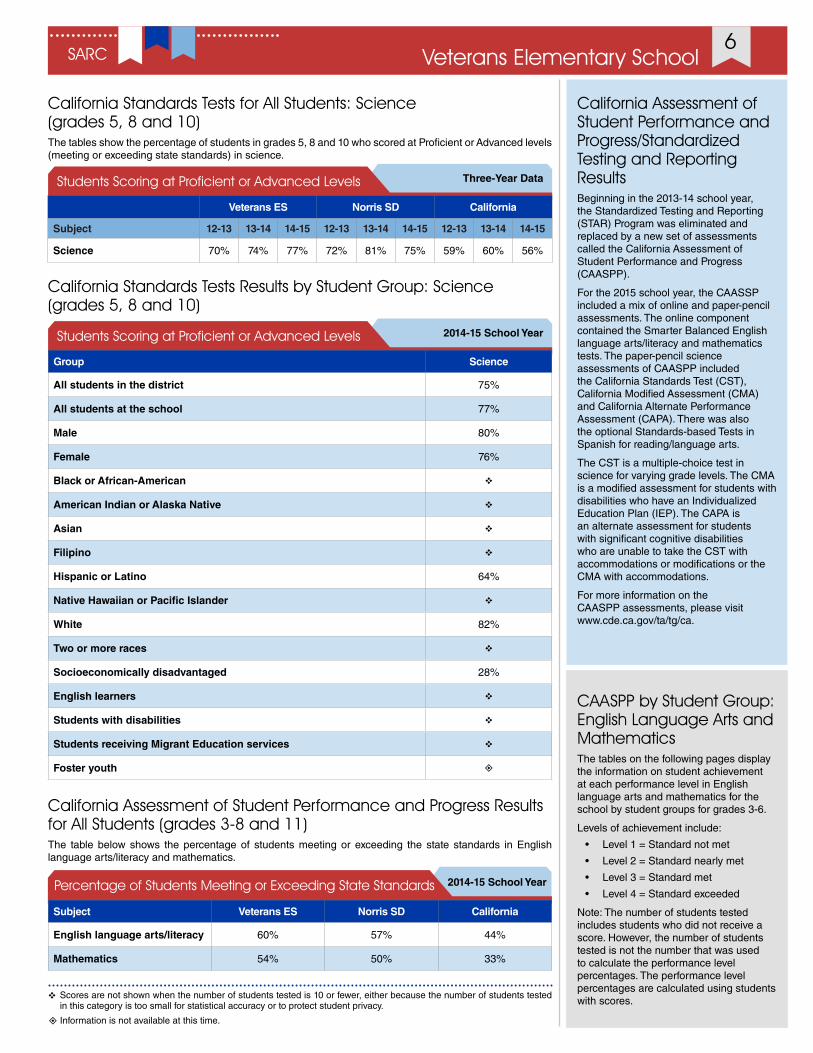
California Standards Tests for All Students: Science (grades 5, 8 and 10)The tables show the percentage of students in grades 5, 8 and 10 who scored at Proficient or Advanced levels (meeting or exceeding state standards) in science.
Three-Year DataStudents Scoring at Proficient or Advanced Levels
Veterans ES Norris SD California
Subject 12-13 13-14 14-15 12-13 13-14 14-15 12-13 13-14 14-15
Science 70% 74% 77% 72% 81% 75% 59% 60% 56%
California Standards Tests Results by Student Group: Science (grades 5, 8 and 10)
2014-15 School YearStudents Scoring at Proficient or Advanced Levels
Group Science
All students in the district 75%
All students at the school 77%
Male 80%
Female 76%
Black or African-American v
American Indian or Alaska Native v
Asian v
Filipino v
Hispanic or Latino 64%
Native Hawaiian or Pacific Islander v
White 82%
Two or more races v
Socioeconomically disadvantaged 28%
English learners v
Students with disabilities v
Students receiving Migrant Education services v
Foster youth ±
California Assessment of Student Performance and Progress/Standardized Testing and Reporting Results Beginning in the 2013-14 school year, the Standardized Testing and Reporting (STAR) Program was eliminated and replaced by a new set of assessments called the California Assessment of Student Performance and Progress (CAASPP).
For the 2015 school year, the CAASSP included a mix of online and paper-pencil assessments. The online component contained the Smarter Balanced English language arts/literacy and mathematics tests. The paper-pencil science assessments of CAASPP included the California Standards Test (CST), California Modified Assessment (CMA) and California Alternate Performance Assessment (CAPA). There was also the optional Standards-based Tests in Spanish for reading/language arts.
The CST is a multiple-choice test in science for varying grade levels. The CMA is a modified assessment for students with disabilities who have an Individualized Education Plan (IEP). The CAPA is an alternate assessment for students with significant cognitive disabilities who are unable to take the CST with accommodations or modifications or the CMA with accommodations.
For more information on the CAASPP assessments, please visit www.cde.ca.gov/ta/tg/ca.
CAASPP by Student Group: English Language Arts and MathematicsThe tables on the following pages display the information on student achievement at each performance level in English language arts and mathematics for the school by student groups for grades 3-6.
Levels of achievement include:
• Level 1 = Standard not met
• Level 2 = Standard nearly met
• Level 3 = Standard met
• Level 4 = Standard exceeded
Note: The number of students tested includes students who did not receive a score. However, the number of students tested is not the number that was used to calculate the performance level percentages. The performance level percentages are calculated using students with scores.v Scores are not shown when the number of students tested is 10 or fewer, either because the number of students tested
in this category is too small for statistical accuracy or to protect student privacy.
± Information is not available at this time.
California Assessment of Student Performance and Progress Results for All Students (grades 3-8 and 11)The table below shows the percentage of students meeting or exceeding the state standards in English language arts/literacy and mathematics.
2014-15 School YearPercentage of Students Meeting or Exceeding State Standards
Subject Veterans ES Norris SD California
English language arts/literacy 60% 57% 44%
Mathematics 54% 50% 33%

7Veterans Elementary SchoolSARC
CAASPP Results by Student Group: English Language Arts and Mathematics - Grade 3
Level 1 = Standard not met Level 2 = Standard nearly met Level 3 = Standard met Level 4 = Standard exceeded
v Scores are not shown when the number of students tested is 10 or fewer, either because the number of students tested in this category is too small for statistical accuracy or to protect student privacy.
2014-15 School YearStudents Achieving at Each Performance LevelEnglish Language Arts: Grade 3 Total
EnrollmentNumber Tested
Percentage Tested of Total
Enrollment
Percent Achievement
Group Level 1 Level 2 Level 3 Level 4
All students 154 146 94.8% 15% 27% 29% 28%
Male 66 42.9% 18% 27% 26% 29%
Female 80 51.9% 13% 28% 33% 28%
Black or African-American 0 0.0% v v v v
American Indian or Alaska Native 4 2.6% v v v v
Asian 4 2.6% v v v v
Filipino 6 3.9% v v v v
Hispanic or Latino 36 23.4% 19% 31% 25% 25%
Native Hawaiian or Pacific Islander 0 0.0% v v v v
White 78 50.6% 13% 31% 27% 29%
Two or more races 3 1.9% v v v v
Socioeconomically disadvantaged 23 14.9% 35% 39% 13% 13%
English learners 2 1.3% v v v v
Students with disabilities 0 0.0% v v v v
Students receiving Migrant Education services 0 0.0% v v v v
Foster youth ± ± ± ± ± ±
Mathematics: Grade 3 Total Enrollment
Number Tested
Percentage Tested of Total
Enrollment
Percent Achievement
Group Level 1 Level 2 Level 3 Level 4
All students 154 145 94.2% 14% 21% 44% 21%
Male 65 42.2% 17% 17% 42% 25%
Female 80 51.9% 11% 25% 46% 18%
Black or African-American 0 0.0% v v v v
American Indian or Alaska Native 4 2.6% v v v v
Asian 4 2.6% v v v v
Filipino 6 3.9% v v v v
Hispanic or Latino 36 23.4% 14% 25% 42% 19%
Native Hawaiian or Pacific Islander 0 0.0% v v v v
White 77 50.0% 14% 23% 44% 18%
Two or more races 3 1.9% v v v v
Socioeconomically disadvantaged 23 14.9% 26% 30% 30% 13%
English learners 2 1.3% v v v v
Students with disabilities 0 0.0% v v v v
Students receiving Migrant Education services 0 0.0% v v v v
Foster youth ± ± ± ± ± ±
± Information is not available at this time.

8Veterans Elementary SchoolSARC
CAASPP Results by Student Group: English Language Arts and Mathematics - Grade 4
Level 1 = Standard not met Level 2 = Standard nearly met Level 3 = Standard met Level 4 = Standard exceeded
v Scores are not shown when the number of students tested is 10 or fewer, either because the number of students tested in this category is too small for statistical accuracy or to protect student privacy.
2014-15 School YearStudents Achieving at Each Performance LevelEnglish Language Arts: Grade 4 Total
EnrollmentNumber Tested
Percentage Tested of Total
Enrollment
Percent Achievement
Group Level 1 Level 2 Level 3 Level 4
All students 152 147 96.7% 24% 17% 27% 32%
Male 68 44.7% 24% 21% 28% 28%
Female 79 52.0% 24% 14% 27% 35%
Black or African-American 2 1.3% v v v v
American Indian or Alaska Native 1 0.7% v v v v
Asian 3 2.0% v v v v
Filipino 3 2.0% v v v v
Hispanic or Latino 38 25.0% 34% 11% 29% 26%
Native Hawaiian or Pacific Islander 1 0.7% v v v v
White 86 56.6% 22% 23% 24% 30%
Two or more races 11 7.2% 9% 0% 45% 45%
Socioeconomically disadvantaged 28 18.4% 54% 14% 21% 11%
English learners 2 1.3% v v v v
Students with disabilities 0 0.0% v v v v
Students receiving Migrant Education services 0 0.0% v v v v
Foster youth ± ± ± ± ± ±
Mathematics: Grade 4 Total Enrollment
Number Tested
Percentage Tested of Total
Enrollment
Percent Achievement
Group Level 1 Level 2 Level 3 Level 4
All students 152 147 96.7% 19% 29% 31% 20%
Male 68 44.7% 16% 26% 35% 22%
Female 79 52.0% 22% 32% 28% 19%
Black or African-American 2 1.3% v v v v
American Indian or Alaska Native 1 0.7% v v v v
Asian 3 2.0% v v v v
Filipino 3 2.0% v v v v
Hispanic or Latino 38 25.0% 24% 32% 32% 13%
Native Hawaiian or Pacific Islander 1 0.7% v v v v
White 86 56.6% 19% 29% 35% 17%
Two or more races 11 7.2% 9% 45% 0% 45%
Socioeconomically disadvantaged 28 18.4% 43% 32% 21% 4%
English learners 2 1.3% v v v v
Students with disabilities 0 0.0% v v v v
Students receiving Migrant Education services 0 0.0% v v v v
Foster youth ± ± ± ± ± ±
± Information is not available at this time.

9Veterans Elementary SchoolSARC
CAASPP Results by Student Group: English Language Arts and Mathematics - Grade 5
Level 1 = Standard not met Level 2 = Standard nearly met Level 3 = Standard met Level 4 = Standard exceeded
v Scores are not shown when the number of students tested is 10 or fewer, either because the number of students tested in this category is too small for statistical accuracy or to protect student privacy.
2014-15 School YearStudents Achieving at Each Performance LevelEnglish Language Arts: Grade 5 Total
EnrollmentNumber Tested
Percentage Tested of Total
Enrollment
Percent Achievement
Group Level 1 Level 2 Level 3 Level 4
All students 134 131 97.8% 15% 16% 45% 24%
Male 62 46.3% 18% 23% 39% 21%
Female 69 51.5% 13% 10% 51% 26%
Black or African-American 1 0.7% v v v v
American Indian or Alaska Native 0 0.0% v v v v
Asian 5 3.7% v v v v
Filipino 3 2.2% v v v v
Hispanic or Latino 38 28.4% 18% 18% 45% 18%
Native Hawaiian or Pacific Islander 0 0.0% v v v v
White 75 56.0% 15% 17% 45% 23%
Two or more races 7 5.2% v v v v
Socioeconomically disadvantaged 15 11.2% 47% 7% 40% 7%
English learners 3 2.2% v v v v
Students with disabilities 0 0.0% v v v v
Students receiving Migrant Education services 0 0.0% v v v v
Foster youth ± ± ± ± ± ±
Mathematics: Grade 5 Total Enrollment
Number Tested
Percentage Tested of Total
Enrollment
Percent Achievement
Group Level 1 Level 2 Level 3 Level 4
All students 134 131 97.8% 13% 38% 23% 26%
Male 62 46.3% 8% 44% 23% 26%
Female 69 51.5% 17% 33% 23% 26%
Black or African-American 1 0.7% v v v v
American Indian or Alaska Native 0 0.0% v v v v
Asian 5 3.7% v v v v
Filipino 3 2.2% v v v v
Hispanic or Latino 38 28.4% 16% 39% 24% 21%
Native Hawaiian or Pacific Islander 0 0.0% v v v v
White 75 56.0% 12% 40% 21% 27%
Two or more races 7 5.2% v v v v
Socioeconomically disadvantaged 15 11.2% 53% 33% 13% 0%
English learners 3 2.2% v v v v
Students with disabilities 0 0.0% v v v v
Students receiving Migrant Education services 0 0.0% v v v v
Foster youth ± ± ± ± ± ±
± Information is not available at this time.

10Veterans Elementary SchoolSARC
CAASPP Results by Student Group: English Language Arts and Mathematics - Grade 6
Level 1 = Standard not met Level 2 = Standard nearly met Level 3 = Standard met Level 4 = Standard exceeded
v Scores are not shown when the number of students tested is 10 or fewer, either because the number of students tested in this category is too small for statistical accuracy or to protect student privacy.
2014-15 School YearStudents Achieving at Each Performance LevelEnglish Language Arts: Grade 6 Total
EnrollmentNumber Tested
Percentage Tested of Total
Enrollment
Percent Achievement
Group Level 1 Level 2 Level 3 Level 4
All students 116 114 98.3% 18% 26% 36% 20%
Male 57 49.1% 23% 28% 37% 12%
Female 57 49.1% 12% 25% 35% 28%
Black or African-American 1 0.9% v v v v
American Indian or Alaska Native 2 1.7% v v v v
Asian 4 3.4% v v v v
Filipino 5 4.3% v v v v
Hispanic or Latino 31 26.7% 32% 29% 19% 19%
Native Hawaiian or Pacific Islander 1 0.9% v v v v
White 64 55.2% 14% 25% 42% 19%
Two or more races 4 3.4% v v v v
Socioeconomically disadvantaged 22 19.0% 36% 41% 14% 9%
English learners 1 0.9% v v v v
Students with disabilities 1 0.9% v v v v
Students receiving Migrant Education services 0 0.0% v v v v
Foster youth ± ± ± ± ± ±
Mathematics: Grade 6 Total Enrollment
Number Tested
Percentage Tested of Total
Enrollment
Percent Achievement
Group Level 1 Level 2 Level 3 Level 4
All students 116 114 98.3% 18% 33% 19% 29%
Male 57 49.1% 18% 37% 21% 25%
Female 57 49.1% 19% 30% 18% 33%
Black or African-American 1 0.9% v v v v
American Indian or Alaska Native 2 1.7% v v v v
Asian 4 3.4% v v v v
Filipino 5 4.3% v v v v
Hispanic or Latino 31 26.7% 32% 45% 3% 19%
Native Hawaiian or Pacific Islander 1 0.9% v v v v
White 64 55.2% 14% 30% 28% 28%
Two or more races 4 3.4% v v v v
Socioeconomically disadvantaged 22 19.0% 41% 41% 5% 14%
English learners 1 0.9% v v v v
Students with disabilities 1 0.9% v v v v
Students receiving Migrant Education services 0 0.0% v v v v
Foster youth ± ± ± ± ± ±
± Information is not available at this time.

11Veterans Elementary SchoolSARC
Quality of TextbooksThe following table outlines the criteria required for choosing textbooks and instructional materials.
2015-16 School YearQuality of Textbooks
Criteria Yes/No
Are the textbooks adopted from the most recent state-approved or local governing-board-approved list? Yes
Are the textbooks consistent with the content and cycles of the curriculum frameworks adopted by the State Board of Education? Yes
Do all students, including English learners, have access to their own textbooks and instructional materials to use in class and to take home? Yes
Availability of Textbooks and Instructional MaterialsThe following lists the percentage of pupils who lack their own assigned textbooks and instructional materials.
Percentage of Students Lacking Materials by Subject
2015-16 School Year
Reading/language arts 0%
Mathematics 0%
Science 0%
History/social science 0%
Visual and performing arts 0%
Foreign language 0%
Health 0%
Our student population is relatively homogeneous with primarily middle-class
families who are highly involved in their
children’s education.”
Textbooks and Instructional MaterialsTextbooks are selected through a district committee process. Representative teachers and parents from each school in the district serve on the committee. This committee meets and evaluates the textbooks. The commit-tee narrows the selection to two publishers. The final decision is based on the recommendations of the entire staff. The associate superintendent then takes the recommendation to the Board of Trustees for final approval. During the 2008-09 school year, Macmillan/McGraw-Hill Treasures Series was adopted for kindergarten and grades 1-5. However, due to budget constraints, materials for kindergarten were purchased for the 2009-10 school year, and materials for grades 1-5 will be purchased for the 2010-11 school year. The Pearson Litera-ture: Reading and Language Program was adopted during the 2008-09 school year for grades 6-8 and were purchased for use beginning in the 2010-11 school year.
Every student has a textbook for each area of the curriculum, and may take them home when necessary. Each student has access to his or her own copy of the standards-aligned, state-adopted textbooks approved by the State Board of Education, and access to all instructional materials in the core curricular areas of read-ing/language arts, math, science and history/social science.
2015-16 School YearTextbooks and Instructional Materials List
Subject Textbook Adopted
English Language Arts California Treasures, Macmillan/McGraw-Hill (TK-5) 2009
English Language Arts Pearson Literature for California (6) 2009
Mathematics Go Math!, Houghton Mifflin (TK) pilot 2010
Mathematics Math Expressions, Houghton Mifflin (K-5) 2014
Mathematics California Middle School Math, McGraw-Hill (6) 2014
Science Scott Foresman (TK-5) 2007
Science Prentice Hall (6) 2007
History/social science Scott Foresman (K-5) 2006
History/social science Holt, Rinehart and Winston (6) 2006
Currency of Textbook DataThis table displays the date when the textbook and instructional materials information was collected and verified.
2015-16 School YearCurrency of Textbook Data
Data collection date 10/2015
12Veterans Elementary SchoolSARC
• Systems: Gas systems and pipes, sewer, mechanical systems (heating, ventilation and air-conditioning)
• Interior: Interior surfaces (floors, ceilings, walls and window casings)
• Cleanliness: Pest/vermin control, overall cleanliness (school grounds, buildings, rooms and common areas)
• Electrical: Electrical systems (interior and exterior)
• Restrooms/fountains: Restrooms, sinks and drinking fountains (interior and exterior)
• Safety: Fire-safety equipment, emergency systems, hazardous materials (interior and exterior)
• Structural: Structural condition, roofs
• External: Windows/doors/gates/fences, playgrounds/school grounds
School Facility Items Inspected The table shows the results of the school’s most recent inspection using the Facility Inspection Tool (FIT) or equivalent school form. The following is a list of items inspected.
School Facility Good Repair Status This inspection determines the school facility’s good repair status using ratings of good condition, fair condition or poor condition. The overall summary of facility conditions uses ratings of exemplary, good, fair or poor. At the time of this school facility inspection, no deficiencies were found.
2015-16 School YearSchool Facility Good Repair Status
Items Inspected Repair Status Items Inspected Repair Status
Systems Good Restrooms/fountains Good
Interior Good Safety Good
Cleanliness Good Structural Good
Electrical Good External Good
Overall summary of facility conditions Exemplary
Date of the most recent school site inspection 8/1/2015
Date of the most recent completion of the inspection form 8/1/2015
“Veterans Elementary is committed to meeting the needs of all our students.”
“Teachers and staff are dedicated to providing each student the opportunity to
achieve his or her highest potential.”
School FacilitiesVeterans Elementary is a new school that opened in the 2007-08 school year. The district and site custodial and grounds personnel maintain the site in an optimal manner. The entire staff takes great pride in keeping the facilities in peak condition. The rooms are equipped with plenty of storage space, large television moni-tors, whiteboards, a voice-amplification system, overhead projectors and computers.
Our technology is very advanced, and we have a full-time technology coordinator who works for the district and services all school sites. We have advanced technology, with teachers and students participating in In-ternet research, working on iPads, making PowerPoint presentations, using email, simple word processing, reading programs, and skill games for educational enhancement.
Our library is outstanding and houses thousands of books for students as well as a technology lab. This is a wonderful atmosphere where students and adults are able to check out books, participate in weekly story time, as well as do independent work and research. The technology center houses 30 computers with a large monitor that the teacher is able to use for teaching and demonstrating. The teacher workstation allows the teacher to monitor and control all of the student computers.
The library aide plays an integral role on our campus and is full of enthusiasm and knowledge about authors and books. We like to think of our library as the hub of our school.
Public Internet AccessInternet access is available at public libraries and other locations that are publicly accessible (e.g., the California State Library). Access to the Internet at libraries and public locations is generally provided on a first-come, first-serve basis. Other use restrictions include the hours of operation, the length of time that a workstation may be used (depending on availability), the types of software programs available at a workstation and the ability to print documents.

13Veterans Elementary SchoolSARC
Teacher QualificationsThis table shows information about teacher credentials and teacher qualifications. Teachers without a full cre-dential include teachers with district and university internships, pre-internships, emergency or other permits, and waivers. For more information on teacher credentials, visit www.ctc.ca.gov.
Three-Year DataTeacher Credential Information
Norris SD Veterans ES
Teachers 15-16 13-14 14-15 15-16
With full credential 178 39 42 45
Without full credential 4 0 0 0
Teaching outside subject area of competence (with full credential) 0 0 0 0
Teacher Misassignments and Vacant Teacher PositionsThis table displays the number of teacher misassignments (positions filled by teachers who lack legal authori-zation to teach that grade level, subject area, student group, etc.) and the number of vacant teacher positions (not filled by a single designated teacher assigned to teach the entire course at the beginning of the school year or semester). Please note total teacher misassignments includes the number of teacher misassign-ments of English learners.
Three-Year DataTeacher Misassignments and Vacant Teacher Positions
Veterans ES
Teachers 13-14 14-15 15-16
Teacher misassignments of English learners 0 0 0
Total teacher misassignments 0 0 0
Vacant teacher positions 0 0 0
Core Academic Classes Taught by Highly Qualified TeachersThe No Child Left Behind Act (NCLB) extended the Elementary and Secondary Education Act (ESEA) to require that core academic subjects be taught by “highly qualified” teachers, defined as having at least a bachelor’s degree, an appropriate California teaching credential, and demonstrated competence for each core academic subject area he or she teaches. The table displays data regarding highly qualified teachers from the 2014-15 school year.
High-poverty schools are defined as those schools with student participation of approximately 40 percent or more in the free and reduced-priced meals program. Low-poverty schools are those with student participation of approximately 39 percent or less in the free and reduced-priced meals program. For more information on teacher qualifications related to NCLB, visit www.cde.ca.gov/nclb/sr/tq.
2014-15 School YearNo Child Left Behind Compliant Teachers
Percentage of Classes in Core Academic Subjects
Taught by Highly Qualified Teachers
Not Taught by Highly Qualified Teachers
Veterans ES 100.00% 0.00%
All schools in district 100.00% 0.00%
High-poverty schools in district ² ²
Low-poverty schools in district 100.00% 0.00%
“We strive to provide a school where students and staff are recognized
for their achievements, feel safe in their surroundings,
and are treated fairly.”
Academic Counselors and School Support StaffThis table displays information about aca-demic counselors and support staff at the school and their full-time equivalent (FTE).
Academic Counselors and School Support Staff Data
2014-15 School Year
Academic Counselors
FTE of academic counselors 0.0
Average number of students per academic counselor ²
Support Staff FTE
Social/behavioral or career development counselors 0.0
Library media teacher (librarian) 0.0
Library media services staff (paraprofessional) 1.5
Psychologist 0.5
Social worker 0.0
Nurse 0.2
Speech/language/hearing specialist 1.0
Resource specialist (nonteaching) 0.0
² Not applicable.

2013-14 School Accountability Report Card
14Veterans Elementary School
Data for this year’s SARC was provided by the California Department of Education (CDE), school and district offices. For additional information on California schools and districts and comparisons of the school to the district, the county and the state, please visit DataQuest at http://data1.cde.ca.gov/dataquest. DataQuest is an online resource that provides reports for accountability, test data, enrollment, graduates, dropouts, course enrollments, staffing and data regarding English learners. Per Education Code Section 35256, each school district shall make hard copies of its annually updated report card available, upon request, on or before February 1 of each year.
All data accurate as of December 2015.
School Accountability Report Card
Published by:
www.sia-us.com | 800.487.9234
SARC
School Financial Data
2013-14 Fiscal Year
Total expenditures per pupil $4,004
Expenditures per pupil from restricted sources $1,208
Expenditures per pupil from unrestricted sources $2,796
Annual average teacher salary $57,436
School Financial DataThe following table displays the school’s average teacher salary and a breakdown of the school’s expenditures per pupil from unrestricted and restricted sources.
Expenditures Per PupilSupplemental/restricted expenditures come from money whose use is controlled by law or by a donor. Money that is designated for specific purposes by the district or governing board is not considered restricted. Basic/unrestricted expenditures are from money whose use, except for general guidelines, is not controlled by law or by a donor.
Financial Data The financial data displayed in this SARC is from the 2013-14 fiscal year. The most current fiscal information available provided by the state is always two years behind the current school year and one year behind most other data included in this report. For detailed information on school expenditures for all districts in California, see the California Department of Education (CDE) Current Expense of Education & Per-pupil Spending Web page at www.cde.ca.gov/ds/fd/ec. For information on teacher salaries for all districts in California, see the CDE Certificated Salaries & Benefits Web page at www.cde.ca.gov/ds/fd/cs. To look up expenditures and salaries for a specific school district, see the Ed-Data website at www.ed-data.org.
District Financial DataThis table displays district teacher and administrative salary information and compares the figures to the state averages for districts of the same type and size based on the salary schedule. Note: The district salary data does not include benefits.
2013-14 Fiscal YearDistrict Salary Data
Norris SD Similar Sized District
Beginning teacher salary ± $42,723
Midrange teacher salary ± $65,936
Highest teacher salary ± $84,545
Average elementary school principal salary ± $106,864
Average middle school principal salary ± $110,494
Average high school principal salary ± $103,499
Superintendent salary ± $159,133
Teacher salaries: percentage of budget 41% 40%
Administrative salaries: percentage of budget 5% 6%
Financial Data ComparisonThis table displays the school’s per-pupil expenditures from unrestricted sources and the school’s average teacher salary and compares it to the district and state data.
2013-14 Fiscal YearFinancial Data ComparisonExpenditures
Per Pupil From Unrestricted Sources
Annual Average Teacher Salary
Veterans ES $2,796 $57,436
Norris SD $4,425 $61,095
California $5,348 $69,086
School and district: percentage difference -36.8% -6.0%
School and California: percentage difference -47.7% -16.9%
± Information is not available.

1
2
Local Control Accountability Plan (LCAP) Requirements Aligned in Your SARCThe tables below outline the state priority areas that are included in the School Accountability Report Card.
Note: State Priority 2 and 7 are not required in the SARC, as well as certain portions of Priority 4 and 5. For detailed information about LCAP and frequently asked questions, please visit www.cde.ca.gov/fg/aa/lc/lcfffaq.asp.
Conditions of LearningThe table below describes information in the SARC that is relevant to the Basic State Priority (Priority 1).
Alignment Between State Priority Areas and the SARCLocal Control Accountability Plan Requirements
Conditions of Learning
State Priority: Basic
Degree to which teachers are appropriately assigned and fully credentialed in the subject area and for the pupils they are teaching. Education Code (EC) § 52060 (d)(1)
Pupils have access to standards-aligned instructional materials. EC § 52060 (d)(1)
School facilities are maintained in good repair. EC § 52060 (d)(1)
Pupil OutcomesThe table below describes information in the SARC that is relevant to Pupil Achievement State Priority (Priority 4) and Other Pupil Outcomes State Priority (Priority 8).
Local Control Accountability Plan Requirements
Pupil Outcomes
State Priority: Pupil Achievements
Statewide assessments (e.g., California Assessment of Student Performance and Progress). EC § 52060 (d)(4)(A)
The Academic Performance Index. EC § 52060 (d)(4)(B)
The percentage of pupils who have successfully completed courses that satisfy the requirements for entrance to the University of California and California State University, or career technical education sequences or programs of study. EC § 52060 (d)(4)(C)
State Priority: Other Pupil Outcomes
Pupil outcomes in subject areas such as English, mathematics, social sciences, science, visual and performing arts, health, physical education, career technical education, and other studies prescribed by the governing board.1 EC § 52060 (d)(8)
English, mathematics and physical education are the only subject areas included in Other Pupil Outcomes (Priority 8) that are reflected in the SARC. 1
The school safety plan is the only other local measure of School Climate (Priority 6) that is reflected in the SARC.2
EngagementThe table below describes information in the SARC that is relevant to the Parental Involvement State Priority (Priority 3), Pupil Engagement State Priority (Priority 5) and School Climate State Priority (Priority 6).
Alignment Between State Priority Areas and the SARCLocal Control Accountability Plan Requirements
Engagement
State Priority: Parent Involvement
Efforts the school district makes to seek parent input in making decisions for the school district and each school site. EC § 52060 (d)(3)
State Priority: Pupil Engagement
High school dropout rates. EC § 52060 (d)(5)(D)
High school graduation rates. EC § 52060 (d)(5)(E)
State Priority: School Climate
Pupil suspension rates. EC § 52060 (d)(6)(A)
Pupil expulsion rates. EC § 52060 (d)(6)(B)
Other local measures including surveys of students, parents and teachers on the sense of safety and school connectedness.2 EC § 52060 (d)(6)(C)
Alignment Between State Priority Areas and the SARC