Embed Size (px)
Citation preview


Prepared by the Chairman’s Staff of the Joint Economic Committee
TABLE OF CONTENTS
EXECUTIVE SUMMARY 1
STATE-BY-STATE SNAPSHOTS 3
Alabama 3 Alaska 5 Arizona 7 Arkansas 9 California 11 Colorado 13 Connecticut 15 Delaware 17 District of Columbia 19 Florida 21 Georgia 23 Hawaii 25 Idaho 27 Illinois 29 Indiana 31 Iowa 33 Kansas 35 Kentucky 37 Louisiana 39 Maine 41 Maryland 43 Massachusetts 45 Michigan 47 Minnesota 49 Mississippi 51 Missouri 53 Montana 55 Nebraska 57 Nevada 59 New Hampshire 61 New Jersey 63 New Mexico 65 New York 67 North Carolina 69 North Dakota 71 Ohio 73 Oklahoma 75 Oregon 77
U.S. Congress Joint Economic Committee
Understanding the Economy: State-by-State Snapshots

Prepared by the Chairman’s Staff of the Joint Economic Committee
Pennsylvania 79 Rhode Island 81 South Carolina 83 South Dakota 85 Tennessee 87 Texas 89 Utah 91 Vermont 93 Virginia 95 Washington 97 West Virginia 99 Wisconsin 101 Wyoming 103 CHART OF NET JOB LOSS AND UNEMPLOYMENT RATE ACROSS THE UNITED STATES 105 POST-9/11 AND TOTAL VETERANS' UNEMPLOYMENT RATES BY STATE 107
SOURCES 108

1 Prepared by the Chairman's Staff of the Joint Economic Committee
U.S. Congress Joint Economic Committee
Understanding the Economy: State-by-State Snapshots
Executive Summary
This is the 14th edition of state-by-state snapshots issued by the Joint Economic Committee
during the 112th Congress and includes state-level data through January 2012.
This month’s report shows that nearly four of five states gained private-sector jobs in January.
Nationally, 285,000 private-sector positions were added in the U.S. during the month. Overall,
the economic picture has continued to brighten in the first months of 2012, with the
momentum from the 4th quarter of 2011 carrying over into the first quarter of the new year.
ISM readings for January and February marked the 30th and 31st consecutive months,
respectively, of expansion in the manufacturing sector. Retail sales grew by 1.1 percent in
February, following a gain of 0.6 percent in January.
Against this national backdrop, this report highlights progress at the state level in creating
private-sector jobs and reducing unemployment and tracks the employment gains in key
sectors, including manufacturing and professional and business services.
Additionally, the report includes new data from BLS showing the 2011 average unemployment
rates for Post-9/11 veterans (those who have been on active duty since September 2001) and
for all veterans. Post-9/11 veterans faced higher unemployment rates than the overall veteran
population in 41 states and the District of Columbia. Post-9/11 veterans in Oregon had the
highest unemployment rate (24.1 percent). Oregon also had the largest difference between
the Post-9/11 unemployment rate (24.1 percent) and the overall veteran-unemployment rate
(11.5 percent) – a gap of 12.6 percentage points. Nationally, Post-9/11 veterans had an
average unemployment rate in 2011 almost 4 percentage points higher than overall veteran-
unemployment rate, 12.1 percent vs. 8.3 percent.
Other report highlights include:
Thirty-nine states added private-sector jobs in January. Texas (73,800) had the largest
private-sector gains, accounting for more than one quarter of all private-sector jobs
added in the United States, followed by New York (45,500) and Ohio (32,700). In the
past 12 months, 46 states and the District of Columbia gained private-sector jobs, with
Texas (332,600), California (167,500) and New York (136,700) recording the largest
gains. Seven other states (Georgia, Michigan, Florida, Ohio, Pennsylvania, North
Carolina and Washington) posted private-sector job gains exceeding 50,000 jobs each.
Only Mississippi and Rhode Island lost private-sector positions over the past 12 months,

Prepared by the Chairman's Staff of the Joint Economic Committee 2
while Alaska and Delaware saw no change. From January 2011 - January 2012, North
Dakota (7.4 percent), Texas (3.9 percent) and the District of Columbia (2.9 percent) had
the largest percentage gains in private-sector employment.
Forty-five states and the District of Columbia saw their unemployment rates decline in
January, with fourteen states recording statistically significant decreases. Mississippi
and Missouri (-0.5 percentage point each) experienced the largest decreases. In the
past 12 months, Michigan reported the largest decline in the unemployment rate (-1.9
percentage points), followed by Utah (-1.8 percentage points). Twenty other states
recorded statistically significant declines over the past year. Nevada (12.7 percent) had
the highest unemployment rate in January, followed by California and Rhode Island
(10.9 percent each). North Dakota had the lowest unemployment rate (3.2 percent).
The national unemployment rate during the month was 8.3 percent, down from 9.1
percent a year earlier.
Manufacturing employment expanded in 39 states in January. The largest gains were in
Michigan (16,300), followed by Missouri (4,300) and New Jersey (4,000). In the past 12
months, eight states – Michigan, Texas, Ohio, Indiana, Washington, Iowa, South Carolina
and Illinois– each added more than 10,000 manufacturing positions.
Thirty-four states added jobs in the professional and business services sector in January.
New York (18,400), Texas (18,100) and Arizona (9,400) posted the largest increases. In
the past year, 44 states and the District of Columbia have added professional and
business services jobs, with Texas, California and New York recording the largest gains.
In the last year, 614,000 jobs were added in the professional and business services
sector.
Thirty-eight states added jobs in the leisure and hospitality sector during January. Texas
(17,100), Ohio (6,800) and New York (6,600) saw the largest gains. In the past 12
months, 34 states and the District of Columbia added leisure and hospitality jobs. During
this period, 372,000 leisure and hospitality jobs were added.
###

U.S. Congress Joint Economic Committee
Economic Overview And Outlook: AlabamaJobs
◙
◙
◙
◙
Employment
◙
◙
Earnings
◙
◙
Housing
◙
◙
◙
◙
◙
Prepared by the Chairman's Staff of the Joint Economic Committee 3
Including January, the private sector has gained jobs nationwide for 23 consecutive months.
Within the South census region, which includes Alabama, sales of new single-family homes totaled 188,000 units in January 2012, an increase of 9.3 percent from December. Sales of existing single-family homes increased 2.7 percent to 1,540,000 units (at seasonally adjusted annual rates) from December to January 2012.
* For Alabama-specific labor sector statistics, please refer to the Alabama office: http://www2.dir.state.al.us/
As the economy continues its emergence from the Great Recession, service-providing industries are projected to add the most jobs between 2010 and 2020. The largest gains over this period are expected to occur in the healthcare and social assistance, professional and business services, and retail trade sectors. Job gains in the goods-producing sector of the economy will be led by the construction and mining industries while the number of manufacturing jobs is expected to fall.
In Alabama, private sector employment fell by 9.5 percent from January 2008 to February 2010. Since February 2010, private sector employment has grown by 1.0 percent.
In Alabama, employees in the construction, information services, and professional and business services sectors faced the largest job losses (as a percent of employment within an industry) over the recession. Since the beginning of 2010, the following sectors in Alabama have experienced the greatest employment increases: professional and business services; education and health services; and other services.*
The unemployment rate in Alabama was 7.8 percent in January 2012, up 4.1 percentage points from December 2007, but down from its most recent peak of 10.6 percent in December 2009.169,000 Alabama residents were counted among the unemployed in Alabama during January 2012.
Between the start of the recession in the 4th quarter of 2007 and the 3rd quarter of 2009, inflation-adjusted total personal income in the United States declined 4.6 percent. Most recently, in the 3rd quarter of 2011, total personal income is 0.2 percent below its 4th quarter of 2007 level.
Real per capita personal income (in 2005 $) in Alabama was $30,086.90 in the 3rd quarter of 2011, up from $29,689.60 in the 3rd quarter of 2009.
After peaking in the first quarter of 2007, national home prices declined by 16.6 percent over 17 quarters. Between the second quarter of 2011 and the fourth quarter of 2011, the most recent quarter, national home prices have risen by 1.4 percent. In Alabama, home prices fell by 8.8 percent over 9 quarters from their peak in the first quarter of 2009. Since the second quarter of 2011, home prices in Alabama have risen by 1.7 percent.
As of the 4th quarter of 2011, 1.9 percent of all mortgages, including 6.1 percent of subprime mortgages, were in foreclosure in Alabama. Housing starts in Alabama totaled 11,950 units (seasonally adjusted annual rate) in January 2012, an increase of 10.2 percent from December.
The median price of single-family homes in Alabama was $128,969 in the second quarter of 2010, compared to $180,176 nationwide.
-30.0
-25.0
-20.0
-15.0
-10.0
-5.0
0.0
5.0
10.0
15.0
2008 2009 2010 2011
Job
Ch
ange
s (0
00
)
Source: Bureau of Labor Statistics, Establishment Survey.
Alabama Monthly Change in Private Payrolls January 2008 - January 2012

How Does Alabama Compare To Other States?
State Quick Facts
Alabama United StatesUnemployment Rates …………………………………………..January 2009 8.0% 7.8%
January 2010 10.5% 9.7%January 2011 9.3% 9.1%January 2012 7.8% 8.3%
Percent of Population Who Are Veterans ……………….2011 10.3% 9.4%
All Veterans' Unemployment Rate ……………… 2011 6.0% 8.3%Post-9/11 Veterans' Unemployment Rate………. 2011 11.0% 12.1%
Median Household Income ………………………………..2007 44,388$ 52,823$ (2010 $) 2010 40,976$ 49,445$
Poverty Rate ………………………………………………………………..2007 14.5% 12.5%2010 17.3% 15.1%
No Health Insurance ………………………………………….2007 12.0% 15.3%2010 15.4% 16.3%
4 Prepared by the Chairman's Staff of the Joint Economic Committee
The current unemployment rate (measured along the horizontal axis) serves as a gauge of current labor market conditions faced by residents, while the proportion of jobs lost within Alabama since the start of the recession (shown along the vertical axis) measures the toll the recession took on the job supply in Alabama.
States falling in the upper right quadrant have lost a disproportionate share of jobs, relative to the total United States, and have unemployment rates higher than the national unemployment rate. States falling in the lower left quadrant have unemployment rates job losses (or even gains) lower than the national average.
Workers across the country were hard hit during the Great Recession. Although labor markets in many states have started recovering, employment in most states still remains below pre-recession levels. The chart below allows you to compare Alabama to other states using two metrics.
United States
Alabama
-15.0%
-10.0%
-5.0%
0.0%
5.0%
10.0%
15.0%
3.0% 5.0% 7.0% 9.0% 11.0% 13.0% 15.0%
Net
Jo
b L
oss
Sin
ce T
he
Rec
essi
on
Beg
an
Current Unemployment Rate Unemployment rate below national rate;
Job losses smaller than US total
Unemployment rate below national rate; Job losses larger than US total
Unemployment rate above national rate; Job losses smaller than US total
Unemployment rate above national rate; Job losses larger than US total
United States: 8.3% Unemployment; Job losses totaling 4.0%
Alabama: 7.8% Unemployment; Job losses totaling 7.6%

U.S. Congress Joint Economic Committee
Economic Overview And Outlook: AlaskaJobs
◙
◙
◙
◙
Employment
◙
◙
Earnings
◙
◙
Housing
◙
◙
◙
◙
◙
Prepared by the Chairman's Staff of the Joint Economic Committee 5
Including January, the private sector has gained jobs nationwide for 23 consecutive months.
Within the West census region, which includes Alaska, sales of new single-family homes totaled 76,000 units in January 2012, a decrease of 10.6 percent from December. Sales of existing single-family homes increased 9.0 percent to 1,090,000 units (at seasonally adjusted annual rates) from December to January 2012.
* For Alaska-specific labor sector statistics, please refer to the Alaska office: http://almis.labor.state.ak.us/
As the economy continues its emergence from the Great Recession, service-providing industries are projected to add the most jobs between 2010 and 2020. The largest gains over this period are expected to occur in the healthcare and social assistance, professional and business services, and retail trade sectors. Job gains in the goods-producing sector of the economy will be led by the construction and mining industries while the number of manufacturing jobs is expected to fall.
In Alaska, private sector employment fell by 0.8 percent from January 2008 to February 2010. Since February 2010, private sector employment has grown by 2.6 percent.
In Alaska, employees in the construction, manufacturing, and information services sectors faced the largest job losses (as a percent of employment within an industry) over the recession. Since the beginning of 2010, the following sectors in Alaska have experienced the greatest employment increases: education and health services; mining; and leisure and hospitality.*
The unemployment rate in Alaska was 7.2 percent in January 2012, up 1.0 percentage point from December 2007, but down from its most recent peak of 8.2 percent in January 2010.27,000 Alaska residents were counted among the unemployed in Alaska during January 2012.
Between the start of the recession in the 4th quarter of 2007 and the 3rd quarter of 2009, inflation-adjusted total personal income in the United States declined 4.6 percent. Most recently, in the 3rd quarter of 2011, total personal income is 0.2 percent below its 4th quarter of 2007 level.
Real per capita personal income (in 2005 $) in Alaska was $38,948.10 in the 3rd quarter of 2011, down from $39,385.30 in the 3rd quarter of 2009.
After peaking in the first quarter of 2007, national home prices declined by 16.6 percent over 17 quarters. Between the second quarter of 2011 and the fourth quarter of 2011, the most recent quarter, national home prices have risen by 1.4 percent. In Alaska, home prices have risen by 0.2 percent above the previous peak set in the second quarter of 2007.
As of the 4th quarter of 2011, 1.1 percent of all mortgages, including 3.6 percent of subprime mortgages, were in foreclosure in Alaska. Housing starts in Alaska totaled 590 units (seasonally adjusted annual rate) in January 2012, an increase of 96.7 percent from December.
The median price of single-family homes in Alaska was $241,750 in the second quarter of 2010, compared to $180,176 nationwide.
-3.0
-2.0
-1.0
0.0
1.0
2.0
3.0
4.0
2008 2009 2010 2011
Job
Ch
ange
s (0
00
)
Source: Bureau of Labor Statistics, Establishment Survey.
Alaska Monthly Change in Private Payrolls January 2008 - January 2012

How Does Alaska Compare To Other States?
State Quick Facts
Alaska United StatesUnemployment Rates …………………………………………..January 2009 7.0% 7.8%
January 2010 8.2% 9.7%January 2011 7.8% 9.1%January 2012 7.2% 8.3%
Percent of Population Who Are Veterans ……………….2011 14.8% 9.4%
All Veterans' Unemployment Rate ……………… 2011 6.1% 8.3%Post-9/11 Veterans' Unemployment Rate………. 2011 2.9% 12.1%
Median Household Income ………………………………..2007 66,241$ 52,823$ (2010 $) 2010 58,198$ 49,445$
Poverty Rate ………………………………………………………………..2007 7.6% 12.5%2010 12.4% 15.1%
No Health Insurance ………………………………………….2007 18.2% 15.3%2010 18.0% 16.3%
6 Prepared by the Chairman's Staff of the Joint Economic Committee
The current unemployment rate (measured along the horizontal axis) serves as a gauge of current labor market conditions faced by residents, while the proportion of jobs lost within Alaska since the start of the recession (shown along the vertical axis) measures the toll the recession took on the job supply in Alaska.
States falling in the upper right quadrant have lost a disproportionate share of jobs, relative to the total United States, and have unemployment rates higher than the national unemployment rate. States falling in the lower left quadrant have unemployment rates job losses (or even gains) lower than the national average.
Workers across the country were hard hit during the Great Recession. Although labor markets in many states have started recovering, employment in most states still remains below pre-recession levels. The chart below allows you to compare Alaska to other states using two metrics.
United States
Alaska
-15.0%
-10.0%
-5.0%
0.0%
5.0%
10.0%
15.0%
3.0% 5.0% 7.0% 9.0% 11.0% 13.0% 15.0%
Net
Jo
b L
oss
Sin
ce T
he
Rec
essi
on
Beg
an
Current Unemployment Rate Unemployment rate below national rate;
Job losses smaller than US total
Unemployment rate below national rate; Job losses larger than US total
Unemployment rate above national rate; Job losses smaller than US total
Unemployment rate above national rate; Job losses larger than US total
United States: 8.3% Unemployment; Job losses totaling 4.0%
Alaska: 7.2% Unemployment; Job gains totaling 2.7%

U.S. Congress Joint Economic Committee
Economic Overview And Outlook: ArizonaJobs
◙
◙
◙
◙
Employment
◙
◙
Earnings
◙
◙
Housing
◙
◙
◙
◙
◙
Prepared by the Chairman's Staff of the Joint Economic Committee 7
Including January, the private sector has gained jobs nationwide for 23 consecutive months.
Within the West census region, which includes Arizona, sales of new single-family homes totaled 76,000 units in January 2012, a decrease of 10.6 percent from December. Sales of existing single-family homes increased 9.0 percent to 1,090,000 units (at seasonally adjusted annual rates) from December to January 2012.
* For Arizona-specific labor sector statistics, please refer to the Arizona office: http://www.workforce.az.gov/
As the economy continues its emergence from the Great Recession, service-providing industries are projected to add the most jobs between 2010 and 2020. The largest gains over this period are expected to occur in the healthcare and social assistance, professional and business services, and retail trade sectors. Job gains in the goods-producing sector of the economy will be led by the construction and mining industries while the number of manufacturing jobs is expected to fall.
In Arizona, private sector employment fell by 12.5 percent from January 2008 to February 2010. Since February 2010, private sector employment has grown by 2.8 percent.
In Arizona, employees in the construction, mining, and manufacturing sectors faced the largest job losses (as a percent of employment within an industry) over the recession. Since the beginning of 2010, the following sectors in Arizona have experienced the greatest employment increases: education and health services; mining; and leisure and hospitality.*
The unemployment rate in Arizona was 8.7 percent in January 2012, up 4.6 percentage points from December 2007, but down from its most recent peak of 10.8 percent in March 2010.263,000 Arizona residents were counted among the unemployed in Arizona during January 2012.
Between the start of the recession in the 4th quarter of 2007 and the 3rd quarter of 2009, inflation-adjusted total personal income in the United States declined 4.6 percent. Most recently, in the 3rd quarter of 2011, total personal income is 0.2 percent below its 4th quarter of 2007 level.
Real per capita personal income (in 2005 $) in Arizona was $31,260.20 in the 3rd quarter of 2011, up from $30,711.90 in the 3rd quarter of 2009.
After peaking in the first quarter of 2007, national home prices declined by 16.6 percent over 17 quarters. Between the second quarter of 2011 and the fourth quarter of 2011, the most recent quarter, national home prices have risen by 1.4 percent. In Arizona, home prices fell by 45 percent over 18 quarters from their peak in the fourth quarter of 2006. Since the second quarter of 2011, home prices in Arizona have risen by 3.8 percent.
As of the 4th quarter of 2011, 3.7 percent of all mortgages, including 10.4 percent of subprime mortgages, were in foreclosure in Arizona. Housing starts in Arizona totaled 20,750 units (seasonally adjusted annual rate) in January 2012, an increase of 84.6 percent from December.
The median price of single-family homes in Arizona was $147,669 in the second quarter of 2010, compared to $180,176 nationwide.
-30.0
-25.0
-20.0
-15.0
-10.0
-5.0
0.0
5.0
10.0
15.0
20.0
2008 2009 2010 2011
Job
Ch
ange
s (0
00
)
Source: Bureau of Labor Statistics, Establishment Survey.
Arizona Monthly Change in Private Payrolls January 2008 - January 2012

How Does Arizona Compare To Other States?
State Quick Facts
Arizona United StatesUnemployment Rates …………………………………………..January 2009 8.3% 7.8%
January 2010 10.8% 9.7%January 2011 9.9% 9.1%January 2012 8.7% 8.3%
Percent of Population Who Are Veterans ……………….2011 11.4% 9.4%
All Veterans' Unemployment Rate ……………… 2011 7.5% 8.3%Post-9/11 Veterans' Unemployment Rate………. 2011 7.6% 12.1%
Median Household Income ………………………………..2007 49,649$ 52,823$ (2010 $) 2010 47,279$ 49,445$
Poverty Rate ………………………………………………………………..2007 14.3% 12.5%2010 18.6% 15.1%
No Health Insurance ………………………………………….2007 18.3% 15.3%2010 19.1% 16.3%
8 Prepared by the Chairman's Staff of the Joint Economic Committee
The current unemployment rate (measured along the horizontal axis) serves as a gauge of current labor market conditions faced by residents, while the proportion of jobs lost within Arizona since the start of the recession (shown along the vertical axis) measures the toll the recession took on the job supply in Arizona.
States falling in the upper right quadrant have lost a disproportionate share of jobs, relative to the total United States, and have unemployment rates higher than the national unemployment rate. States falling in the lower left quadrant have unemployment rates job losses (or even gains) lower than the national average.
Workers across the country were hard hit during the Great Recession. Although labor markets in many states have started recovering, employment in most states still remains below pre-recession levels. The chart below allows you to compare Arizona to other states using two metrics.
United States
Arizona
-15.0%
-10.0%
-5.0%
0.0%
5.0%
10.0%
15.0%
3.0% 5.0% 7.0% 9.0% 11.0% 13.0% 15.0%
Net
Jo
b L
oss
Sin
ce T
he
Rec
essi
on
Beg
an
Current Unemployment Rate Unemployment rate below national rate;
Job losses smaller than US total
Unemployment rate below national rate; Job losses larger than US total
Unemployment rate above national rate; Job losses smaller than US total
Unemployment rate above national rate; Job losses larger than US total
United States: 8.3% Unemployment; Job losses totaling 4.0%
Arizona: 8.7% Unemployment; Job losses totaling 9.3%

U.S. Congress Joint Economic Committee
Economic Overview And Outlook: ArkansasJobs
◙
◙
◙
◙
Employment
◙
◙
Earnings
◙
◙
Housing
◙
◙
◙
◙
◙
Prepared by the Chairman's Staff of the Joint Economic Committee 9
Including January, the private sector has gained jobs nationwide for 23 consecutive months.
Within the South census region, which includes Arkansas, sales of new single-family homes totaled 188,000 units in January 2012, an increase of 9.3 percent from December. Sales of existing single-family homes increased 2.7 percent to 1,540,000 units (at seasonally adjusted annual rates) from December to January 2012.
* For Arkansas-specific labor sector statistics, please refer to the Arkansas office: http://www.discoverarkansas.net/
As the economy continues its emergence from the Great Recession, service-providing industries are projected to add the most jobs between 2010 and 2020. The largest gains over this period are expected to occur in the healthcare and social assistance, professional and business services, and retail trade sectors. Job gains in the goods-producing sector of the economy will be led by the construction and mining industries while the number of manufacturing jobs is expected to fall.
In Arkansas, private sector employment fell by 6.1 percent from January 2008 to February 2010. Since February 2010, private sector employment has grown by 1.3 percent.
In Arkansas, employees in the manufacturing, construction, and information services sectors faced the largest job losses (as a percent of employment within an industry) over the recession. Since the beginning of 2010, the following sectors in Arkansas have experienced the greatest employment increases: mining; trade, transportation and utilities; and leisure and hospitality.*
The unemployment rate in Arkansas was 7.6 percent in January 2012, up 2.5 percentage points from December 2007, but down from its most recent peak of 8.2 percent in July 2011.105,000 Arkansas residents were counted among the unemployed in Arkansas during January 2012.
Between the start of the recession in the 4th quarter of 2007 and the 3rd quarter of 2009, inflation-adjusted total personal income in the United States declined 4.6 percent. Most recently, in the 3rd quarter of 2011, total personal income is 0.2 percent below its 4th quarter of 2007 level.
Real per capita personal income (in 2005 $) in Arkansas was $29,190.00 in the 3rd quarter of 2011, up from $29,022.90 in the 3rd quarter of 2009.
After peaking in the first quarter of 2007, national home prices declined by 16.6 percent over 17 quarters. Between the second quarter of 2011 and the fourth quarter of 2011, the most recent quarter, national home prices have risen by 1.4 percent. In Arkansas, home prices fell by 5.6 percent over 9 quarters from their peak in the first quarter of 2009. Since the second quarter of 2011, home prices in Arkansas have risen by 1.1 percent.
As of the 4th quarter of 2011, 2.0 percent of all mortgages, including 6.0 percent of subprime mortgages, were in foreclosure in Arkansas. Housing starts in Arkansas totaled 4,950 units (seasonally adjusted annual rate) in January 2012, an increase of 60.7 percent from December.
The median price of single-family homes in Arkansas was $120,560 in the second quarter of 2010, compared to $180,176 nationwide.
-8.0
-6.0
-4.0
-2.0
0.0
2.0
4.0
6.0
8.0
10.0
12.0
2008 2009 2010 2011
Job
Ch
ange
s (0
00
)
Source: Bureau of Labor Statistics, Establishment Survey.
Arkansas Monthly Change in Private Payrolls January 2008 - January 2012

How Does Arkansas Compare To Other States?
State Quick Facts
Arkansas United StatesUnemployment Rates …………………………………………..January 2009 6.8% 7.8%
January 2010 7.9% 9.7%January 2011 8.1% 9.1%January 2012 7.6% 8.3%
Percent of Population Who Are Veterans ……………….2011 10.5% 9.4%
All Veterans' Unemployment Rate ……………… 2011 8.5% 8.3%Post-9/11 Veterans' Unemployment Rate………. 2011 4.3% 12.1%
Median Household Income ………………………………..2007 42,898$ 52,823$ (2010 $) 2010 38,571$ 49,445$
Poverty Rate ………………………………………………………………..2007 13.8% 12.5%2010 15.5% 15.1%
No Health Insurance ………………………………………….2007 16.1% 15.3%2010 18.7% 16.3%
10 Prepared by the Chairman's Staff of the Joint Economic Committee
The current unemployment rate (measured along the horizontal axis) serves as a gauge of current labor market conditions faced by residents, while the proportion of jobs lost within Arkansas since the start of the recession (shown along the vertical axis) measures the toll the recession took on the job supply in Arkansas.
States falling in the upper right quadrant have lost a disproportionate share of jobs, relative to the total United States, and have unemployment rates higher than the national unemployment rate. States falling in the lower left quadrant have unemployment rates job losses (or even gains) lower than the national average.
Workers across the country were hard hit during the Great Recession. Although labor markets in many states have started recovering, employment in most states still remains below pre-recession levels. The chart below allows you to compare Arkansas to other states using two metrics.
United States Arkansas
-15.0%
-10.0%
-5.0%
0.0%
5.0%
10.0%
15.0%
3.0% 5.0% 7.0% 9.0% 11.0% 13.0% 15.0%
Net
Jo
b L
oss
Sin
ce T
he
Rec
essi
on
Beg
an
Current Unemployment Rate Unemployment rate below national rate;
Job losses smaller than US total
Unemployment rate below national rate; Job losses larger than US total
Unemployment rate above national rate; Job losses smaller than US total
Unemployment rate above national rate; Job losses larger than US total
United States: 8.3% Unemployment; Job losses totaling 4.0%
Arkansas: 7.6% Unemployment; Job losses totaling 3.5%

U.S. Congress Joint Economic Committee
Economic Overview And Outlook: CaliforniaJobs
◙
◙
◙
◙
Employment
◙
◙
Earnings
◙
◙
Housing
◙
◙
◙
◙
◙
Prepared by the Chairman's Staff of the Joint Economic Committee 11
Including January, the private sector has gained jobs nationwide for 23 consecutive months.
Within the West census region, which includes California, sales of new single-family homes totaled 76,000 units in January 2012, a decrease of 10.6 percent from December. Sales of existing single-family homes increased 9.0 percent to 1,090,000 units (at seasonally adjusted annual rates) from December to January 2012.
* For California-specific labor sector statistics, please refer to the California office: http://www.labormarketinfo.edd.ca.gov/
As the economy continues its emergence from the Great Recession, service-providing industries are projected to add the most jobs between 2010 and 2020. The largest gains over this period are expected to occur in the healthcare and social assistance, professional and business services, and retail trade sectors. Job gains in the goods-producing sector of the economy will be led by the construction and mining industries while the number of manufacturing jobs is expected to fall.
In California, private sector employment fell by 9.8 percent from January 2008 to February 2010. Since February 2010, private sector employment has grown by 3.3 percent.
In California, employees in the construction, manufacturing, and financial activities sectors faced the largest job losses (as a percent of employment within an industry) over the recession. Since the beginning of 2010, the following sectors in California have experienced the greatest employment increases: mining; professional and business services; and leisure and hospitality.*
The unemployment rate in California was 10.9 percent in January 2012, up 5.1 percentage points from December 2007, but down from its most recent peak of 12.4 percent in October 2010.2,020,000 California residents were counted among the unemployed in California during January 2012.
Between the start of the recession in the 4th quarter of 2007 and the 3rd quarter of 2009, inflation-adjusted total personal income in the United States declined 4.6 percent. Most recently, in the 3rd quarter of 2011, total personal income is 0.2 percent below its 4th quarter of 2007 level.
Real per capita personal income (in 2005 $) in California was $38,757.70 in the 3rd quarter of 2011, up from $37,482.20 in the 3rd quarter of 2009.
After peaking in the first quarter of 2007, national home prices declined by 16.6 percent over 17 quarters. Between the second quarter of 2011 and the fourth quarter of 2011, the most recent quarter, national home prices have risen by 1.4 percent. In California, home prices fell by 37.3 percent over 19 quarters from their peak in the third quarter of 2006. Since the second quarter of 2011, home prices in California have risen by 0.3 percent.
As of the 4th quarter of 2011, 3.5 percent of all mortgages, including 11.0 percent of subprime mortgages, were in foreclosure in California. Housing starts in California totaled 36,470 units (seasonally adjusted annual rate) in January 2012, a decrease of 33.1 percent from December.
The median price of single-family homes in California was $330,037 in the second quarter of 2010, compared to $180,176 nationwide.
-200.0
-150.0
-100.0
-50.0
0.0
50.0
100.0
2008 2009 2010 2011
Job
Ch
ange
s (0
00
)
Source: Bureau of Labor Statistics, Establishment Survey.
California Monthly Change in Private Payrolls January 2008 - January 2012

How Does California Compare To Other States?
State Quick Facts
California United StatesUnemployment Rates …………………………………………..January 2009 9.7% 7.8%
January 2010 12.3% 9.7%January 2011 12.1% 9.1%January 2012 10.9% 8.3%
Percent of Population Who Are Veterans ……………….2011 6.9% 9.4%
All Veterans' Unemployment Rate ……………… 2011 11.0% 8.3%Post-9/11 Veterans' Unemployment Rate………. 2011 20.0% 12.1%
Median Household Income ………………………………..2007 58,608$ 52,823$ (2010 $) 2010 54,459$ 49,445$
Poverty Rate ………………………………………………………………..2007 12.7% 12.5%2010 16.3% 15.1%
No Health Insurance ………………………………………….2007 18.2% 15.3%2010 19.4% 16.3%
12 Prepared by the Chairman's Staff of the Joint Economic Committee
The current unemployment rate (measured along the horizontal axis) serves as a gauge of current labor market conditions faced by residents, while the proportion of jobs lost within California since the start of the recession (shown along the vertical axis) measures the toll the recession took on the job supply in California.
States falling in the upper right quadrant have lost a disproportionate share of jobs, relative to the total United States, and have unemployment rates higher than the national unemployment rate. States falling in the lower left quadrant have unemployment rates job losses (or even gains) lower than the national average.
Workers across the country were hard hit during the Great Recession. Although labor markets in many states have started recovering, employment in most states still remains below pre-recession levels. The chart below allows you to compare California to other states using two metrics.
United States
California
-15.0%
-10.0%
-5.0%
0.0%
5.0%
10.0%
15.0%
3.0% 5.0% 7.0% 9.0% 11.0% 13.0% 15.0%
Net
Jo
b L
oss
Sin
ce T
he
Rec
essi
on
Beg
an
Current Unemployment Rate Unemployment rate below national rate;
Job losses smaller than US total
Unemployment rate below national rate; Job losses larger than US total
Unemployment rate above national rate; Job losses smaller than US total
Unemployment rate above national rate; Job losses larger than US total
United States: 8.3% Unemployment; Job losses totaling 4.0%
California: 10.9% Unemployment; Job losses totaling 6.7%

U.S. Congress Joint Economic Committee
Economic Overview And Outlook: ColoradoJobs
◙
◙
◙
◙
Employment
◙
◙
Earnings
◙
◙
Housing
◙
◙
◙
◙
◙
Prepared by the Chairman's Staff of the Joint Economic Committee 13
Including January, the private sector has gained jobs nationwide for 23 consecutive months.
Within the West census region, which includes Colorado, sales of new single-family homes totaled 76,000 units in January 2012, a decrease of 10.6 percent from December. Sales of existing single-family homes increased 9.0 percent to 1,090,000 units (at seasonally adjusted annual rates) from December to January 2012.
* For Colorado-specific labor sector statistics, please refer to the Colorado office: http://lmigateway.coworkforce.com/lmigateway/gsipub/index.asp?docid=363
As the economy continues its emergence from the Great Recession, service-providing industries are projected to add the most jobs between 2010 and 2020. The largest gains over this period are expected to occur in the healthcare and social assistance, professional and business services, and retail trade sectors. Job gains in the goods-producing sector of the economy will be led by the construction and mining industries while the number of manufacturing jobs is expected to fall.
In Colorado, private sector employment fell by 7.7 percent from January 2008 to February 2010. Since February 2010, private sector employment has grown by 3.9 percent.
In Colorado, employees in the construction, manufacturing, and mining sectors faced the largest job losses (as a percent of employment within an industry) over the recession. Since the beginning of 2010, the following sectors in Colorado have experienced the greatest employment increases: mining; leisure and hospitality; and professional and business services.*
The unemployment rate in Colorado was 7.8 percent in January 2012, up 3.7 percentage points from December 2007, but down from its most recent peak of 9.0 percent in November 2010.213,000 Colorado residents were counted among the unemployed in Colorado during January 2012.
Between the start of the recession in the 4th quarter of 2007 and the 3rd quarter of 2009, inflation-adjusted total personal income in the United States declined 4.6 percent. Most recently, in the 3rd quarter of 2011, total personal income is 0.2 percent below its 4th quarter of 2007 level.
Real per capita personal income (in 2005 $) in Colorado was $38,309.20 in the 3rd quarter of 2011, up from $37,399.40 in the 3rd quarter of 2009.
After peaking in the first quarter of 2007, national home prices declined by 16.6 percent over 17 quarters. Between the second quarter of 2011 and the fourth quarter of 2011, the most recent quarter, national home prices have risen by 1.4 percent. In Colorado, home prices fell by 8.5 percent over 13 quarters from their peak in the first quarter of 2008. Since the second quarter of 2011, home prices in Colorado have risen by 1.8 percent.
As of the 4th quarter of 2011, 2.0 percent of all mortgages, including 7.4 percent of subprime mortgages, were in foreclosure in Colorado. Housing starts in Colorado totaled 17,050 units (seasonally adjusted annual rate) in January 2012, an increase of 42.7 percent from December.
The median price of single-family homes in Colorado was $217,558 in the second quarter of 2010, compared to $180,176 nationwide.
-25.0
-20.0
-15.0
-10.0
-5.0
0.0
5.0
10.0
15.0
20.0
25.0
2008 2009 2010 2011
Job
Ch
ange
s (0
00
)
Source: Bureau of Labor Statistics, Establishment Survey.
Colorado Monthly Change in Private Payrolls January 2008 - January 2012

How Does Colorado Compare To Other States?
State Quick Facts
Colorado United StatesUnemployment Rates …………………………………………..January 2009 6.6% 7.8%
January 2010 8.8% 9.7%January 2011 8.8% 9.1%January 2012 7.8% 8.3%
Percent of Population Who Are Veterans ……………….2011 10.2% 9.4%
All Veterans' Unemployment Rate ……………… 2011 9.5% 8.3%Post-9/11 Veterans' Unemployment Rate………. 2011 10.2% 12.1%
Median Household Income ………………………………..2007 64,293$ 52,823$ (2010 $) 2010 60,442$ 49,445$
Poverty Rate ………………………………………………………………..2007 9.8% 12.5%2010 12.2% 15.1%
No Health Insurance ………………………………………….2007 16.4% 15.3%2010 13.0% 16.3%
14 Prepared by the Chairman's Staff of the Joint Economic Committee
The current unemployment rate (measured along the horizontal axis) serves as a gauge of current labor market conditions faced by residents, while the proportion of jobs lost within Colorado since the start of the recession (shown along the vertical axis) measures the toll the recession took on the job supply in Colorado.
States falling in the upper right quadrant have lost a disproportionate share of jobs, relative to the total United States, and have unemployment rates higher than the national unemployment rate. States falling in the lower left quadrant have unemployment rates job losses (or even gains) lower than the national average.
Workers across the country were hard hit during the Great Recession. Although labor markets in many states have started recovering, employment in most states still remains below pre-recession levels. The chart below allows you to compare Colorado to other states using two metrics.
United States Colorado
-15.0%
-10.0%
-5.0%
0.0%
5.0%
10.0%
15.0%
3.0% 5.0% 7.0% 9.0% 11.0% 13.0% 15.0%
Net
Jo
b L
oss
Sin
ce T
he
Rec
essi
on
Beg
an
Current Unemployment Rate Unemployment rate below national rate;
Job losses smaller than US total
Unemployment rate below national rate; Job losses larger than US total
Unemployment rate above national rate; Job losses smaller than US total
Unemployment rate above national rate; Job losses larger than US total
United States: 8.3% Unemployment; Job losses totaling 4.0%
Colorado: 7.8% Unemployment; Job losses totaling 2.8%

U.S. Congress Joint Economic Committee
Economic Overview And Outlook: ConnecticutJobs
◙
◙
◙
◙
Employment
◙
◙
Earnings
◙
◙
Housing
◙
◙
◙
◙
◙
Prepared by the Chairman's Staff of the Joint Economic Committee 15
Including January, the private sector has gained jobs nationwide for 23 consecutive months.
Within the Northeast census region, which includes Connecticut, sales of new single-family homes totaled 20,000 units in January 2012, an increase of 11.1 percent from December. Sales of existing single-family homes increased 4.2 percent to 500,000 units (at seasonally adjusted annual rates) from December to January 2012.
* For Connecticut-specific labor sector statistics, please refer to the Connecticut office: http://www1.ctdol.state.ct.us/lmi/
As the economy continues its emergence from the Great Recession, service-providing industries are projected to add the most jobs between 2010 and 2020. The largest gains over this period are expected to occur in the healthcare and social assistance, professional and business services, and retail trade sectors. Job gains in the goods-producing sector of the economy will be led by the construction and mining industries while the number of manufacturing jobs is expected to fall.
In Connecticut, private sector employment fell by 7.5 percent from January 2008 to February 2010. Since February 2010, private sector employment has grown by 3.3 percent.
In Connecticut, employees in the construction, professional and business services, and manufacturing sectors faced the largest job losses (as a percent of employment within an industry) over the recession. Since the beginning of 2010, the following sectors in Connecticut have experienced the greatest employment increases: education and health services; leisure and hospitality; and professional and business services.*
The unemployment rate in Connecticut was 8.0 percent in January 2012, up 3.1 percentage points from December 2007, but down from its most recent peak of 9.4 percent in December 2010.152,000 Connecticut residents were counted among the unemployed in Connecticut during January 2012.
Between the start of the recession in the 4th quarter of 2007 and the 3rd quarter of 2009, inflation-adjusted total personal income in the United States declined 4.6 percent. Most recently, in the 3rd quarter of 2011, total personal income is 0.2 percent below its 4th quarter of 2007 level.
Real per capita personal income (in 2005 $) in Connecticut was $50,274.20 in the 3rd quarter of 2011, up from $48,528.20 in the 3rd quarter of 2009.
After peaking in the first quarter of 2007, national home prices declined by 16.6 percent over 17 quarters. Between the second quarter of 2011 and the fourth quarter of 2011, the most recent quarter, national home prices have risen by 1.4 percent. In Connecticut, home prices fell by 15.5 percent over 17 quarters from their peak in the first quarter of 2007. Since the second quarter of 2011, home prices in Connecticut have risen by 1.3 percent.
As of the 4th quarter of 2011, 5.1 percent of all mortgages, including 19.1 percent of subprime mortgages, were in foreclosure in Connecticut. Housing starts in Connecticut totaled 2,200 units (seasonally adjusted annual rate) in January 2012, a decrease of 23.3 percent from December.
The median price of single-family homes in Connecticut was $266,845 in the second quarter of 2010, compared to $180,176 nationwide.
-20.0
-15.0
-10.0
-5.0
0.0
5.0
10.0
15.0
2008 2009 2010 2011
Job
Ch
ange
s (0
00
)
Source: Bureau of Labor Statistics, Establishment Survey.
Connecticut Monthly Change in Private Payrolls January 2008 - January 2012

How Does Connecticut Compare To Other States?
State Quick Facts
Connecticut United StatesUnemployment Rates …………………………………………..January 2009 7.0% 7.8%
January 2010 9.1% 9.7%January 2011 9.3% 9.1%January 2012 8.0% 8.3%
Percent of Population Who Are Veterans ……………….2011 8.0% 9.4%
All Veterans' Unemployment Rate ……………… 2011 9.4% 8.3%Post-9/11 Veterans' Unemployment Rate………. 2011 8.7% 12.1%
Median Household Income ………………………………..2007 67,448$ 52,823$ (2010 $) 2010 66,452$ 49,445$
Poverty Rate ………………………………………………………………..2007 8.9% 12.5%2010 8.3% 15.1%
No Health Insurance ………………………………………….2007 9.4% 15.3%2010 11.0% 16.3%
16 Prepared by the Chairman's Staff of the Joint Economic Committee
The current unemployment rate (measured along the horizontal axis) serves as a gauge of current labor market conditions faced by residents, while the proportion of jobs lost within Connecticut since the start of the recession (shown along the vertical axis) measures the toll the recession took on the job supply in Connecticut.
States falling in the upper right quadrant have lost a disproportionate share of jobs, relative to the total United States, and have unemployment rates higher than the national unemployment rate. States falling in the lower left quadrant have unemployment rates job losses (or even gains) lower than the national average.
Workers across the country were hard hit during the Great Recession. Although labor markets in many states have started recovering, employment in most states still remains below pre-recession levels. The chart below allows you to compare Connecticut to other states using two metrics.
United States
Connecticut
-15.0%
-10.0%
-5.0%
0.0%
5.0%
10.0%
15.0%
3.0% 5.0% 7.0% 9.0% 11.0% 13.0% 15.0%
Net
Jo
b L
oss
Sin
ce T
he
Rec
essi
on
Beg
an
Current Unemployment Rate Unemployment rate below national rate;
Job losses smaller than US total
Unemployment rate below national rate; Job losses larger than US total
Unemployment rate above national rate; Job losses smaller than US total
Unemployment rate above national rate; Job losses larger than US total
United States: 8.3% Unemployment; Job losses totaling 4.0%
Connecticut: 8.0% Unemployment; Job losses totaling 4.4%

U.S. Congress Joint Economic Committee
Economic Overview And Outlook: DelawareJobs
◙
◙
◙
◙
Employment
◙
◙
Earnings
◙
◙
Housing
◙
◙
◙
◙
◙
Prepared by the Chairman's Staff of the Joint Economic Committee 17
Including January, the private sector has gained jobs nationwide for 23 consecutive months.
Within the South census region, which includes Delaware, sales of new single-family homes totaled 188,000 units in January 2012, an increase of 9.3 percent from December. Sales of existing single-family homes increased 2.7 percent to 1,540,000 units (at seasonally adjusted annual rates) from December to January 2012.
* For Delaware-specific labor sector statistics, please refer to the Delaware office: http://www.delawareworks.com/oolmi/Information/Publications.aspx
As the economy continues its emergence from the Great Recession, service-providing industries are projected to add the most jobs between 2010 and 2020. The largest gains over this period are expected to occur in the healthcare and social assistance, professional and business services, and retail trade sectors. Job gains in the goods-producing sector of the economy will be led by the construction and mining industries while the number of manufacturing jobs is expected to fall.
In Delaware, private sector employment fell by 8.9 percent from January 2008 to February 2010. Since February 2010, private sector employment has grown by 2.7 percent.
In Delaware, employees in the construction, trade, transportation and utilities, and professional and business services sectors faced the largest job losses (as a percent of employment within an industry) over the recession. Since the beginning of 2010, the following sectors in Delaware have experienced the greatest employment increases: education and health services; leisure and hospitality; and trade, transportation and utilities.*
The unemployment rate in Delaware was 7.0 percent in January 2012, up 3.2 percentage points from December 2007, but down from its most recent peak of 8.5 percent in January 2010.31,000 Delaware residents were counted among the unemployed in Delaware during January 2012.
Between the start of the recession in the 4th quarter of 2007 and the 3rd quarter of 2009, inflation-adjusted total personal income in the United States declined 4.6 percent. Most recently, in the 3rd quarter of 2011, total personal income is 0.2 percent below its 4th quarter of 2007 level.
Real per capita personal income (in 2005 $) in Delaware was $36,097.70 in the 3rd quarter of 2011, up from $35,086.10 in the 3rd quarter of 2009.
After peaking in the first quarter of 2007, national home prices declined by 16.6 percent over 17 quarters. Between the second quarter of 2011 and the fourth quarter of 2011, the most recent quarter, national home prices have risen by 1.4 percent. In Delaware, home prices fell by 17.7 percent over 17 quarters from their peak in the second quarter of 2007. Since the third quarter of 2011, home prices in Delaware have risen by 1.5 percent.
As of the 4th quarter of 2011, 4.0 percent of all mortgages, including 14.3 percent of subprime mortgages, were in foreclosure in Delaware. Housing starts in Delaware totaled 4,370 units (seasonally adjusted annual rate) in January 2012, an increase of 42.3 percent from December.
The median price of single-family homes in Delaware was $216,902 in the second quarter of 2010, compared to $180,176 nationwide.
-5.0
-4.0
-3.0
-2.0
-1.0
0.0
1.0
2.0
3.0
4.0
2008 2009 2010 2011
Job
Ch
ange
s (0
00
)
Source: Bureau of Labor Statistics, Establishment Survey.
Delaware Monthly Change in Private Payrolls January 2008 - January 2012

How Does Delaware Compare To Other States?
State Quick Facts
Delaware United StatesUnemployment Rates …………………………………………..January 2009 6.9% 7.8%
January 2010 8.5% 9.7%January 2011 7.5% 9.1%January 2012 7.0% 8.3%
Percent of Population Who Are Veterans ……………….2011 11.0% 9.4%
All Veterans' Unemployment Rate ……………… 2011 7.6% 8.3%Post-9/11 Veterans' Unemployment Rate………. 2011 4.3% 12.1%
Median Household Income ………………………………..2007 57,404$ 52,823$ (2010 $) 2010 55,269$ 49,445$
Poverty Rate ………………………………………………………………..2007 9.3% 12.5%2010 12.1% 15.1%
No Health Insurance ………………………………………….2007 11.2% 15.3%2010 11.3% 16.3%
18 Prepared by the Chairman's Staff of the Joint Economic Committee
The current unemployment rate (measured along the horizontal axis) serves as a gauge of current labor market conditions faced by residents, while the proportion of jobs lost within Delaware since the start of the recession (shown along the vertical axis) measures the toll the recession took on the job supply in Delaware.
States falling in the upper right quadrant have lost a disproportionate share of jobs, relative to the total United States, and have unemployment rates higher than the national unemployment rate. States falling in the lower left quadrant have unemployment rates job losses (or even gains) lower than the national average.
Workers across the country were hard hit during the Great Recession. Although labor markets in many states have started recovering, employment in most states still remains below pre-recession levels. The chart below allows you to compare Delaware to other states using two metrics.
United States
Delaware
-15.0%
-10.0%
-5.0%
0.0%
5.0%
10.0%
15.0%
3.0% 5.0% 7.0% 9.0% 11.0% 13.0% 15.0%
Net
Jo
b L
oss
Sin
ce T
he
Rec
essi
on
Beg
an
Current Unemployment Rate Unemployment rate below national rate;
Job losses smaller than US total
Unemployment rate below national rate; Job losses larger than US total
Unemployment rate above national rate; Job losses smaller than US total
Unemployment rate above national rate; Job losses larger than US total
United States: 8.3% Unemployment; Job losses totaling 4.0%
Delaware: 7.0% Unemployment; Job losses totaling 5.1%

U.S. Congress Joint Economic Committee
Economic Overview And Outlook: The District Of ColumbiaJobs
◙
◙
◙
◙
Employment
◙
◙
Earnings
◙
◙
Housing
◙
◙
◙
◙
◙
Prepared by the Chairman's Staff of the Joint Economic Committee 19
Including January, the private sector has gained jobs nationwide for 23 consecutive months.
Within the South census region, which includes the District of Columbia, sales of new single-family homes totaled 188,000 units in January 2012, an increase of 9.3 percent from December. Sales of existing single-family homes increased 2.7 percent to 1,540,000 units (at seasonally adjusted annual rates) from December to January 2012.
* For District of Columbia-specific labor sector statistics, please refer to the District of Columbia office: http://www.does.dc.gov/does/cwp/view,a,1233,q,538030.asp
As the economy continues its emergence from the Great Recession, service-providing industries are projected to add the most jobs between 2010 and 2020. The largest gains over this period are expected to occur in the healthcare and social assistance, professional and business services, and retail trade sectors. Job gains in the goods-producing sector of the economy will be led by the construction and mining industries while the number of manufacturing jobs is expected to fall.
In the District of Columbia, private sector employment fell by 1.5 percent from January 2008 to February 2010. Since February 2010, private sector employment has grown by 6.1 percent.
In the District of Columbia, employees in the information services, financial activities, and construction sectors faced the largest job losses (as a percent of employment within an industry) over the recession. Since the beginning of 2010, the following sectors in the District of Columbia have experienced the greatest employment increases: construction; education and health services; and other services.*
The unemployment rate in the District of Columbia was 9.9 percent in January 2012, up 4.3 percentage points from December 2007, but down from its most recent peak of 10.5 percent in August 2011.
34,000 District of Columbia residents were counted among the unemployed in District of Columbia during January 2012.
Between the start of the recession in the 4th quarter of 2007 and the 3rd quarter of 2009, inflation-adjusted total personal income in the United States declined 4.6 percent. Most recently, in the 3rd quarter of 2011, total personal income is 0.2 percent below its 4th quarter of 2007 level.
Real per capita personal income (in 2005 $) in the District of Columbia was $62,913.10 in the 3rd quarter of 2011, up from $61,261.40 in the 3rd quarter of 2009.
After peaking in the first quarter of 2007, national home prices declined by 16.6 percent over 17 quarters. Between the second quarter of 2011 and the fourth quarter of 2011, the most recent quarter, national home prices have risen by 1.4 percent. In District of Columbia, home prices fell by 10.8 percent over 10 quarters from their peak in the first quarter of 2007. Since the third quarter of 2009, home prices in District of Columbia have risen by 3.9 percent.
As of the 4th quarter of 2011, 3.2 percent of all mortgages, including 12.4 percent of subprime mortgages, were in foreclosure in the District of Columbia. Housing starts in the District of Columbia totaled 460 units (seasonally adjusted annual rate) in January 2012, a decrease of 91.5 percent from December.
The median price of single-family homes in the District of Columbia was $404,380 in the second quarter of 2010, compared to $180,176 nationwide.
-15.0
-10.0
-5.0
0.0
5.0
10.0
15.0
20.0
2008 2009 2010 2011
Job
Ch
ange
s (0
00
)
Source: Bureau of Labor Statistics, Establishment Survey.
District of Columbia Monthly Change in Private Payrolls January 2008 - January 2012

How Does The District Of Columbia Compare To The States?
District Quick Facts
District of Columbia United StatesUnemployment Rates …………………………………………..January 2009 8.4% 7.8%
January 2010 10.5% 9.7%January 2011 10.0% 9.1%January 2012 9.9% 8.3%
Percent of Population Who Are Veterans ……………….2011 5.9% 9.4%
All Veterans' Unemployment Rate ……………… 2011 10.1% 8.3%Post-9/11 Veterans' Unemployment Rate………. 2011 12.4% 12.1%
Median Household Income ………………………………..2007 53,401$ 52,823$ (2010 $) 2010 55,528$ 49,445$
Poverty Rate ………………………………………………………………..2007 18.0% 12.5%2010 19.9% 15.1%
No Health Insurance ………………………………………….2007 9.5% 15.3%2010 12.5% 16.3%
20 Prepared by the Chairman's Staff of the Joint Economic Committee
The current unemployment rate (measured along the horizontal axis) serves as a gauge of current labor market conditions faced by residents, while the proportion of jobs lost within the District of Columbia since the start of the recession (shown along the vertical axis) measures the toll the recession took on the job supply in the District of Columbia.
States falling in the upper right quadrant have lost a disproportionate share of jobs, relative to the total United States, and have unemployment rates higher than the national unemployment rate. States falling in the lower left quadrant have unemployment rates job losses (or even gains) lower than the national average.
Workers across the country were hard hit during the Great Recession. Although labor markets in many states have started recovering, employment in most states still remains below pre-recession levels. The chart below allows you to compare the District of Columbia to the states using two metrics.
United States
District of Columbia
-15.0%
-10.0%
-5.0%
0.0%
5.0%
10.0%
15.0%
3.0% 5.0% 7.0% 9.0% 11.0% 13.0% 15.0%
Net
Jo
b L
oss
Sin
ce T
he
Rec
essi
on
Beg
an
Current Unemployment Rate Unemployment rate below national rate;
Job losses smaller than US total
Unemployment rate below national rate; Job losses larger than US total
Unemployment rate above national rate; Job losses smaller than US total
Unemployment rate above national rate; Job losses larger than US total
United States: 8.3% Unemployment; Job losses totaling 4.0%
District of Columbia: 9.9% Unemployment; Job gains totaling 4.5%

U.S. Congress Joint Economic Committee
Economic Overview And Outlook: FloridaJobs
◙
◙
◙
◙
Employment
◙
◙
Earnings
◙
◙
Housing
◙
◙
◙
◙
◙
Prepared by the Chairman's Staff of the Joint Economic Committee 21
Including January, the private sector has gained jobs nationwide for 23 consecutive months.
Within the South census region, which includes Florida, sales of new single-family homes totaled 188,000 units in January 2012, an increase of 9.3 percent from December. Sales of existing single-family homes increased 2.7 percent to 1,540,000 units (at seasonally adjusted annual rates) from December to January 2012.
* For Florida-specific labor sector statistics, please refer to the Florida office: http://www.labormarketinfo.com/
As the economy continues its emergence from the Great Recession, service-providing industries are projected to add the most jobs between 2010 and 2020. The largest gains over this period are expected to occur in the healthcare and social assistance, professional and business services, and retail trade sectors. Job gains in the goods-producing sector of the economy will be led by the construction and mining industries while the number of manufacturing jobs is expected to fall.
In Florida, private sector employment fell by 10.9 percent from January 2008 to February 2010. Since February 2010, private sector employment has grown by 2.7 percent.
In Florida, employees in the construction, manufacturing, and professional and business services sectors faced the largest job losses (as a percent of employment within an industry) over the recession. Since the beginning of 2010, the following sectors in Florida have experienced the greatest employment increases: professional and business services; leisure and hospitality; and trade, transportation and utilities.*
The unemployment rate in Florida was 9.6 percent in January 2012, up 4.9 percentage points from December 2007, but down from its most recent peak of 11.4 percent in February 2010.894,000 Florida residents were counted among the unemployed in Florida during January 2012.
Between the start of the recession in the 4th quarter of 2007 and the 3rd quarter of 2009, inflation-adjusted total personal income in the United States declined 4.6 percent. Most recently, in the 3rd quarter of 2011, total personal income is 0.2 percent below its 4th quarter of 2007 level.
Real per capita personal income (in 2005 $) in Florida was $34,499.60 in the 3rd quarter of 2011, up from $33,822.60 in the 3rd quarter of 2009.
After peaking in the first quarter of 2007, national home prices declined by 16.6 percent over 17 quarters. Between the second quarter of 2011 and the fourth quarter of 2011, the most recent quarter, national home prices have risen by 1.4 percent. In Florida, home prices fell by 42.3 percent over 18 quarters from their peak in the fourth quarter of 2006. Since the second quarter of 2011, home prices in Florida have risen by 1.9 percent.
As of the 4th quarter of 2011, 14.3 percent of all mortgages, including 32.9 percent of subprime mortgages, were in foreclosure in Florida. Housing starts in Florida totaled 63,910 units (seasonally adjusted annual rate) in January 2012, an increase of 27.1 percent from December.
The median price of single-family homes in Florida was $144,501 in the second quarter of 2010, compared to $180,176 nationwide.
-80.0
-60.0
-40.0
-20.0
0.0
20.0
40.0
60.0
2008 2009 2010 2011
Job
Ch
ange
s (0
00
)
Source: Bureau of Labor Statistics, Establishment Survey.
Florida Monthly Change in Private Payrolls January 2008 - January 2012

How Does Florida Compare To Other States?
State Quick Facts
Florida United StatesUnemployment Rates …………………………………………..January 2009 8.7% 7.8%
January 2010 11.4% 9.7%January 2011 10.9% 9.1%January 2012 9.6% 8.3%
Percent of Population Who Are Veterans ……………….2011 10.9% 9.4%
All Veterans' Unemployment Rate ……………… 2011 9.3% 8.3%Post-9/11 Veterans' Unemployment Rate………. 2011 12.5% 12.1%
Median Household Income ………………………………..2007 48,155$ 52,823$ (2010 $) 2010 44,243$ 49,445$
Poverty Rate ………………………………………………………………..2007 12.5% 12.5%2010 16.0% 15.1%
No Health Insurance ………………………………………….2007 20.2% 15.3%2010 20.8% 16.3%
22 Prepared by the Chairman's Staff of the Joint Economic Committee
The current unemployment rate (measured along the horizontal axis) serves as a gauge of current labor market conditions faced by residents, while the proportion of jobs lost within Florida since the start of the recession (shown along the vertical axis) measures the toll the recession took on the job supply in Florida.
States falling in the upper right quadrant have lost a disproportionate share of jobs, relative to the total United States, and have unemployment rates higher than the national unemployment rate. States falling in the lower left quadrant have unemployment rates job losses (or even gains) lower than the national average.
Workers across the country were hard hit during the Great Recession. Although labor markets in many states have started recovering, employment in most states still remains below pre-recession levels. The chart below allows you to compare Florida to other states using two metrics.
United States
Florida
-15.0%
-10.0%
-5.0%
0.0%
5.0%
10.0%
15.0%
3.0% 5.0% 7.0% 9.0% 11.0% 13.0% 15.0%
Net
Jo
b L
oss
Sin
ce T
he
Rec
essi
on
Beg
an
Current Unemployment Rate Unemployment rate below national rate;
Job losses smaller than US total
Unemployment rate below national rate; Job losses larger than US total
Unemployment rate above national rate; Job losses smaller than US total
Unemployment rate above national rate; Job losses larger than US total
United States: 8.3% Unemployment; Job losses totaling 4.0%
Florida: 9.6% Unemployment; Job losses totaling 8.2%

U.S. Congress Joint Economic Committee
Economic Overview And Outlook: GeorgiaJobs
◙
◙
◙
◙
Employment
◙
◙
Earnings
◙
◙
Housing
◙
◙
◙
◙
◙
Prepared by the Chairman's Staff of the Joint Economic Committee 23
Including January, the private sector has gained jobs nationwide for 23 consecutive months.
Within the South census region, which includes Georgia, sales of new single-family homes totaled 188,000 units in January 2012, an increase of 9.3 percent from December. Sales of existing single-family homes increased 2.7 percent to 1,540,000 units (at seasonally adjusted annual rates) from December to January 2012.
* For Georgia-specific labor sector statistics, please refer to the Georgia office: http://explorer.dol.state.ga.us/
As the economy continues its emergence from the Great Recession, service-providing industries are projected to add the most jobs between 2010 and 2020. The largest gains over this period are expected to occur in the healthcare and social assistance, professional and business services, and retail trade sectors. Job gains in the goods-producing sector of the economy will be led by the construction and mining industries while the number of manufacturing jobs is expected to fall.
In Georgia, private sector employment fell by 9.8 percent from January 2008 to February 2010. Since February 2010, private sector employment has grown by 3.7 percent.
In Georgia, employees in the construction, manufacturing, and professional and business services sectors faced the largest job losses (as a percent of employment within an industry) over the recession. Since the beginning of 2010, the following sectors in Georgia have experienced the greatest employment increases: professional and business services; education and health services; and trade, transportation and utilities.*
The unemployment rate in Georgia was 9.2 percent in January 2012, up 4.1 percentage points from December 2007, but down from its most recent peak of 10.5 percent in January 2010.437,000 Georgia residents were counted among the unemployed in Georgia during January 2012.
Between the start of the recession in the 4th quarter of 2007 and the 3rd quarter of 2009, inflation-adjusted total personal income in the United States declined 4.6 percent. Most recently, in the 3rd quarter of 2011, total personal income is 0.2 percent below its 4th quarter of 2007 level.
Real per capita personal income (in 2005 $) in Georgia was $31,418.40 in the 3rd quarter of 2011, up from $30,956.30 in the 3rd quarter of 2009.
After peaking in the first quarter of 2007, national home prices declined by 16.6 percent over 17 quarters. Between the second quarter of 2011 and the fourth quarter of 2011, the most recent quarter, national home prices have risen by 1.4 percent. In Georgia, home prices fell by 19.3 percent over 13 quarters from their peak in the first quarter of 2008. Since the second quarter of 2011, home prices in Georgia have risen by 0.5 percent.
As of the 4th quarter of 2011, 3.1 percent of all mortgages, including 8.3 percent of subprime mortgages, were in foreclosure in Georgia. Housing starts in Georgia totaled 22,910 units (seasonally adjusted annual rate) in January 2012, an increase of 58.1 percent from December.
The median price of single-family homes in Georgia was $129,446 in the second quarter of 2010, compared to $180,176 nationwide.
-40.0
-30.0
-20.0
-10.0
0.0
10.0
20.0
30.0
40.0
2008 2009 2010 2011
Job
Ch
ange
s (0
00
)
Source: Bureau of Labor Statistics, Establishment Survey.
Georgia Monthly Change in Private Payrolls January 2008 - January 2012

How Does Georgia Compare To Other States?
State Quick Facts
Georgia United StatesUnemployment Rates …………………………………………..January 2009 8.5% 7.8%
January 2010 10.5% 9.7%January 2011 10.1% 9.1%January 2012 9.2% 8.3%
Percent of Population Who Are Veterans ……………….2011 10.1% 9.4%
All Veterans' Unemployment Rate ……………… 2011 9.0% 8.3%Post-9/11 Veterans' Unemployment Rate………. 2011 14.2% 12.1%
Median Household Income ………………………………..2007 51,149$ 52,823$ (2010 $) 2010 44,108$ 49,445$
Poverty Rate ………………………………………………………………..2007 13.6% 12.5%2010 18.7% 15.1%
No Health Insurance ………………………………………….2007 17.5% 15.3%2010 19.4% 16.3%
24 Prepared by the Chairman's Staff of the Joint Economic Committee
The current unemployment rate (measured along the horizontal axis) serves as a gauge of current labor market conditions faced by residents, while the proportion of jobs lost within Georgia since the start of the recession (shown along the vertical axis) measures the toll the recession took on the job supply in Georgia.
States falling in the upper right quadrant have lost a disproportionate share of jobs, relative to the total United States, and have unemployment rates higher than the national unemployment rate. States falling in the lower left quadrant have unemployment rates job losses (or even gains) lower than the national average.
Workers across the country were hard hit during the Great Recession. Although labor markets in many states have started recovering, employment in most states still remains below pre-recession levels. The chart below allows you to compare Georgia to other states using two metrics.
United States
Georgia
-15.0%
-10.0%
-5.0%
0.0%
5.0%
10.0%
15.0%
3.0% 5.0% 7.0% 9.0% 11.0% 13.0% 15.0%
Net
Jo
b L
oss
Sin
ce T
he
Rec
essi
on
Beg
an
Current Unemployment Rate Unemployment rate below national rate;
Job losses smaller than US total
Unemployment rate below national rate; Job losses larger than US total
Unemployment rate above national rate; Job losses smaller than US total
Unemployment rate above national rate; Job losses larger than US total
United States: 8.3% Unemployment; Job losses totaling 4.0%
Georgia: 9.2% Unemployment; Job losses totaling 5.6%
U.S. Congress Joint Economic Committee
Economic Overview And Outlook: HawaiiJobs
◙
◙
◙
◙
Employment
◙
◙
Earnings
◙
◙
Housing
◙
◙
◙
◙
◙
Prepared by the Chairman's Staff of the Joint Economic Committee 25
Including January, the private sector has gained jobs nationwide for 23 consecutive months.
Within the West census region, which includes Hawaii, sales of new single-family homes totaled 76,000 units in January 2012, a decrease of 10.6 percent from December. Sales of existing single-family homes increased 9.0 percent to 1,090,000 units (at seasonally adjusted annual rates) from December to January 2012.
* For Hawaii-specific labor sector statistics, please refer to the Hawaii office: http://hawaii.gov/labor/
As the economy continues its emergence from the Great Recession, service-providing industries are projected to add the most jobs between 2010 and 2020. The largest gains over this period are expected to occur in the healthcare and social assistance, professional and business services, and retail trade sectors. Job gains in the goods-producing sector of the economy will be led by the construction and mining industries while the number of manufacturing jobs is expected to fall.
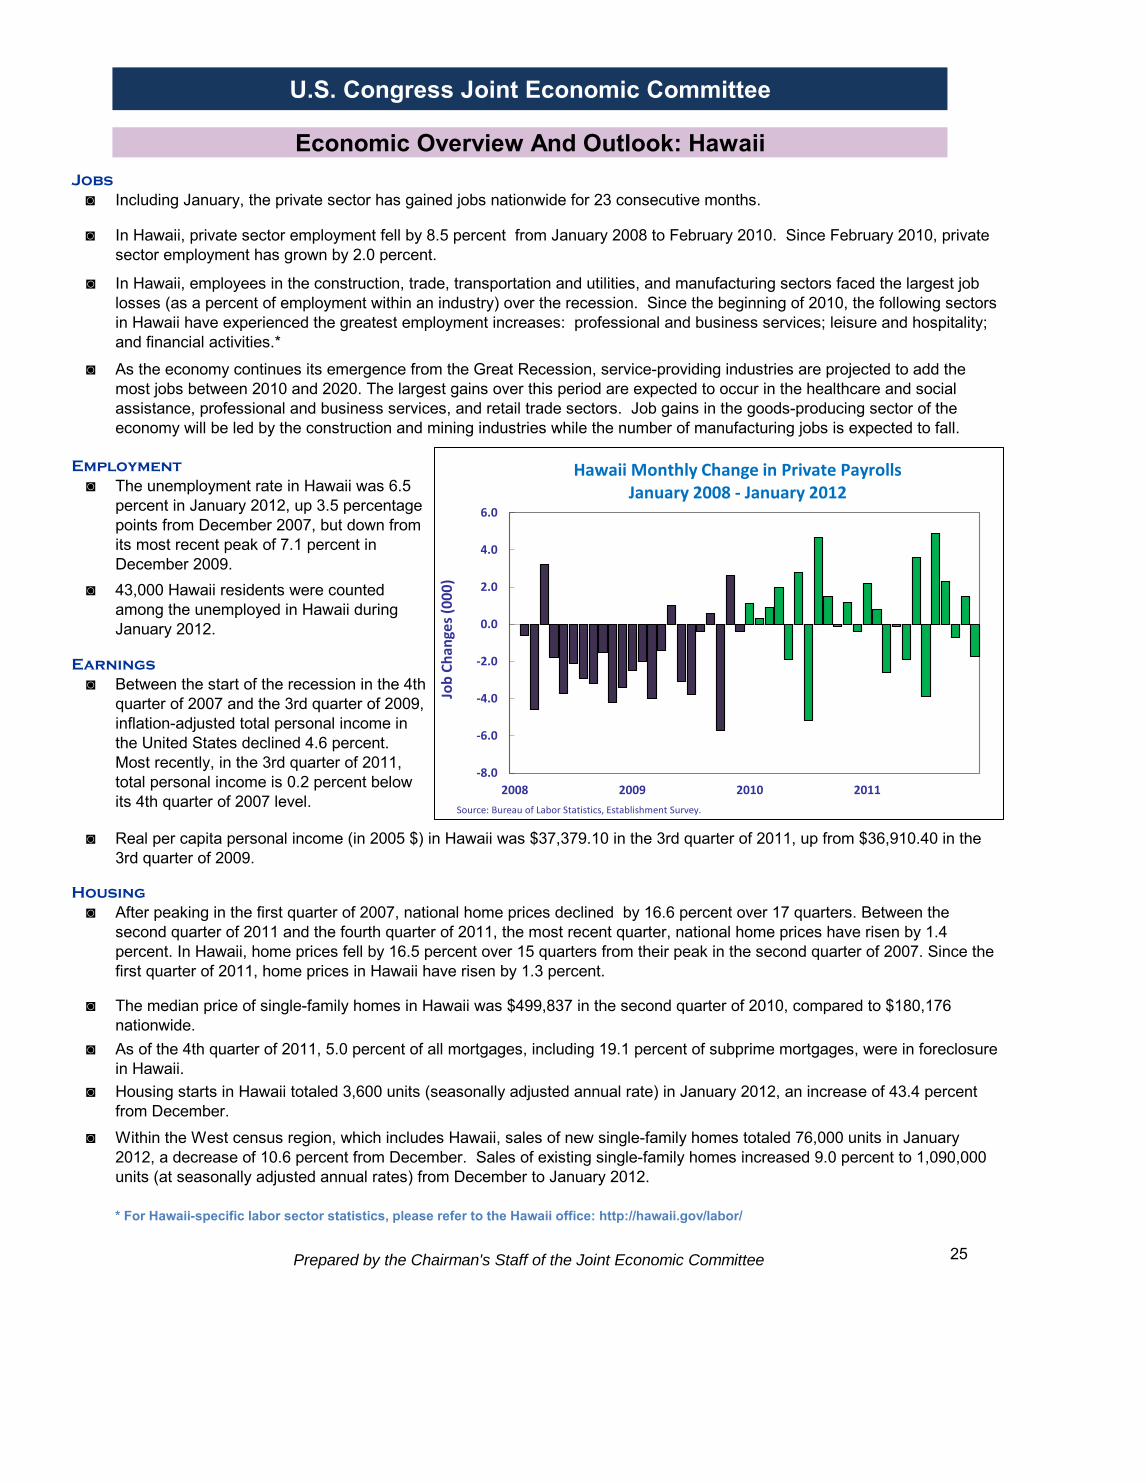
In Hawaii, private sector employment fell by 8.5 percent from January 2008 to February 2010. Since February 2010, private sector employment has grown by 2.0 percent.
In Hawaii, employees in the construction, trade, transportation and utilities, and manufacturing sectors faced the largest job losses (as a percent of employment within an industry) over the recession. Since the beginning of 2010, the following sectors in Hawaii have experienced the greatest employment increases: professional and business services; leisure and hospitality; and financial activities.*
The unemployment rate in Hawaii was 6.5 percent in January 2012, up 3.5 percentage points from December 2007, but down from its most recent peak of 7.1 percent in December 2009.43,000 Hawaii residents were counted among the unemployed in Hawaii during January 2012.
Between the start of the recession in the 4th quarter of 2007 and the 3rd quarter of 2009, inflation-adjusted total personal income in the United States declined 4.6 percent. Most recently, in the 3rd quarter of 2011, total personal income is 0.2 percent below its 4th quarter of 2007 level.
Real per capita personal income (in 2005 $) in Hawaii was $37,379.10 in the 3rd quarter of 2011, up from $36,910.40 in the 3rd quarter of 2009.
After peaking in the first quarter of 2007, national home prices declined by 16.6 percent over 17 quarters. Between the second quarter of 2011 and the fourth quarter of 2011, the most recent quarter, national home prices have risen by 1.4 percent. In Hawaii, home prices fell by 16.5 percent over 15 quarters from their peak in the second quarter of 2007. Since the first quarter of 2011, home prices in Hawaii have risen by 1.3 percent.
As of the 4th quarter of 2011, 5.0 percent of all mortgages, including 19.1 percent of subprime mortgages, were in foreclosure in Hawaii. Housing starts in Hawaii totaled 3,600 units (seasonally adjusted annual rate) in January 2012, an increase of 43.4 percent from December.
The median price of single-family homes in Hawaii was $499,837 in the second quarter of 2010, compared to $180,176 nationwide.
-8.0
-6.0
-4.0
-2.0
0.0
2.0
4.0
6.0
2008 2009 2010 2011
Job
Ch
ange
s (0
00
)
Source: Bureau of Labor Statistics, Establishment Survey.
Hawaii Monthly Change in Private Payrolls January 2008 - January 2012

How Does Hawaii Compare To Other States?
State Quick Facts
Hawaii United StatesUnemployment Rates …………………………………………..January 2009 6.1% 7.8%
January 2010 7.0% 9.7%January 2011 6.7% 9.1%January 2012 6.5% 8.3%
Percent of Population Who Are Veterans ……………….2011 11.0% 9.4%
All Veterans' Unemployment Rate ……………… 2011 8.3% 8.3%Post-9/11 Veterans' Unemployment Rate………. 2011 8.5% 12.1%
Median Household Income ………………………………..2007 67,323$ 52,823$ (2010 $) 2010 58,507$ 49,445$
Poverty Rate ………………………………………………………………..2007 7.5% 12.5%2010 12.1% 15.1%
No Health Insurance ………………………………………….2007 7.5% 15.3%2010 7.7% 16.3%
26 Prepared by the Chairman's Staff of the Joint Economic Committee
The current unemployment rate (measured along the horizontal axis) serves as a gauge of current labor market conditions faced by residents, while the proportion of jobs lost within Hawaii since the start of the recession (shown along the vertical axis) measures the toll the recession took on the job supply in Hawaii.
States falling in the upper right quadrant have lost a disproportionate share of jobs, relative to the total United States, and have unemployment rates higher than the national unemployment rate. States falling in the lower left quadrant have unemployment rates job losses (or even gains) lower than the national average.
Workers across the country were hard hit during the Great Recession. Although labor markets in many states have started recovering, employment in most states still remains below pre-recession levels. The chart below allows you to compare Hawaii to other states using two metrics.
United States
Hawaii
-15.0%
-10.0%
-5.0%
0.0%
5.0%
10.0%
15.0%
3.0% 5.0% 7.0% 9.0% 11.0% 13.0% 15.0%
Net
Jo
b L
oss
Sin
ce T
he
Rec
essi
on
Beg
an
Current Unemployment Rate Unemployment rate below national rate;
Job losses smaller than US total
Unemployment rate below national rate; Job losses larger than US total
Unemployment rate above national rate; Job losses smaller than US total
Unemployment rate above national rate; Job losses larger than US total
United States: 8.3% Unemployment; Job losses totaling 4.0%
Hawaii: 6.5% Unemployment; Job losses totaling 5.3%

U.S. Congress Joint Economic Committee
Economic Overview And Outlook: IdahoJobs
◙
◙
◙
◙
Employment
◙
◙
Earnings
◙
◙
Housing
◙
◙
◙
◙
◙
Prepared by the Chairman's Staff of the Joint Economic Committee 27
Including January, the private sector has gained jobs nationwide for 23 consecutive months.
Within the West census region, which includes Idaho, sales of new single-family homes totaled 76,000 units in January 2012, a decrease of 10.6 percent from December. Sales of existing single-family homes increased 9.0 percent to 1,090,000 units (at seasonally adjusted annual rates) from December to January 2012.
* For Idaho-specific labor sector statistics, please refer to the Idaho office: http://labor.idaho.gov/dnn/Default.aspx?tabid=696&AspxAutoDetectCookieSupport=1
As the economy continues its emergence from the Great Recession, service-providing industries are projected to add the most jobs between 2010 and 2020. The largest gains over this period are expected to occur in the healthcare and social assistance, professional and business services, and retail trade sectors. Job gains in the goods-producing sector of the economy will be led by the construction and mining industries while the number of manufacturing jobs is expected to fall.
In Idaho, private sector employment fell by 9.9 percent from January 2008 to February 2010. Since February 2010, private sector employment has grown by 3.1 percent.
In Idaho, employees in the mining, construction, and manufacturing sectors faced the largest job losses (as a percent of employment within an industry) over the recession. Since the beginning of 2010, the following sectors in Idaho have experienced the greatest employment increases: mining; manufacturing; and education and health services.*
The unemployment rate in Idaho was 8.1 percent in January 2012, up 4.7 percentage points from December 2007, but down from its most recent peak of 8.9 percent in July 2011.
63,000 Idaho residents were counted among the unemployed in Idaho during January 2012.
Between the start of the recession in the 4th quarter of 2007 and the 3rd quarter of 2009, inflation-adjusted total personal income in the United States declined 4.6 percent. Most recently, in the 3rd quarter of 2011, total personal income is 0.2 percent below its 4th quarter of 2007 level.
Real per capita personal income (in 2005 $) in Idaho was $29,076.30 in the 3rd quarter of 2011, up from $28,223.60 in the 3rd quarter of 2009.
After peaking in the first quarter of 2007, national home prices declined by 16.6 percent over 17 quarters. Between the second quarter of 2011 and the fourth quarter of 2011, the most recent quarter, national home prices have risen by 1.4 percent. In Idaho, home prices fell by 25.6 percent over 13 quarters from their peak in the first quarter of 2008. Since the second quarter of 2011, home prices in Idaho have risen by 3.6 percent.
As of the 4th quarter of 2011, 2.8 percent of all mortgages, including 9.6 percent of subprime mortgages, were in foreclosure in Idaho. Housing starts in Idaho totaled 5,550 units (seasonally adjusted annual rate) in January 2012, an increase of 115.1 percent from December.
The median price of single-family homes in Idaho was $140,436 in the second quarter of 2010, compared to $180,176 nationwide.
-8.0
-6.0
-4.0
-2.0
0.0
2.0
4.0
2008 2009 2010 2011
Job
Ch
ange
s (0
00
)
Source: Bureau of Labor Statistics, Establishment Survey.
Idaho Monthly Change in Private Payrolls January 2008 - January 2012
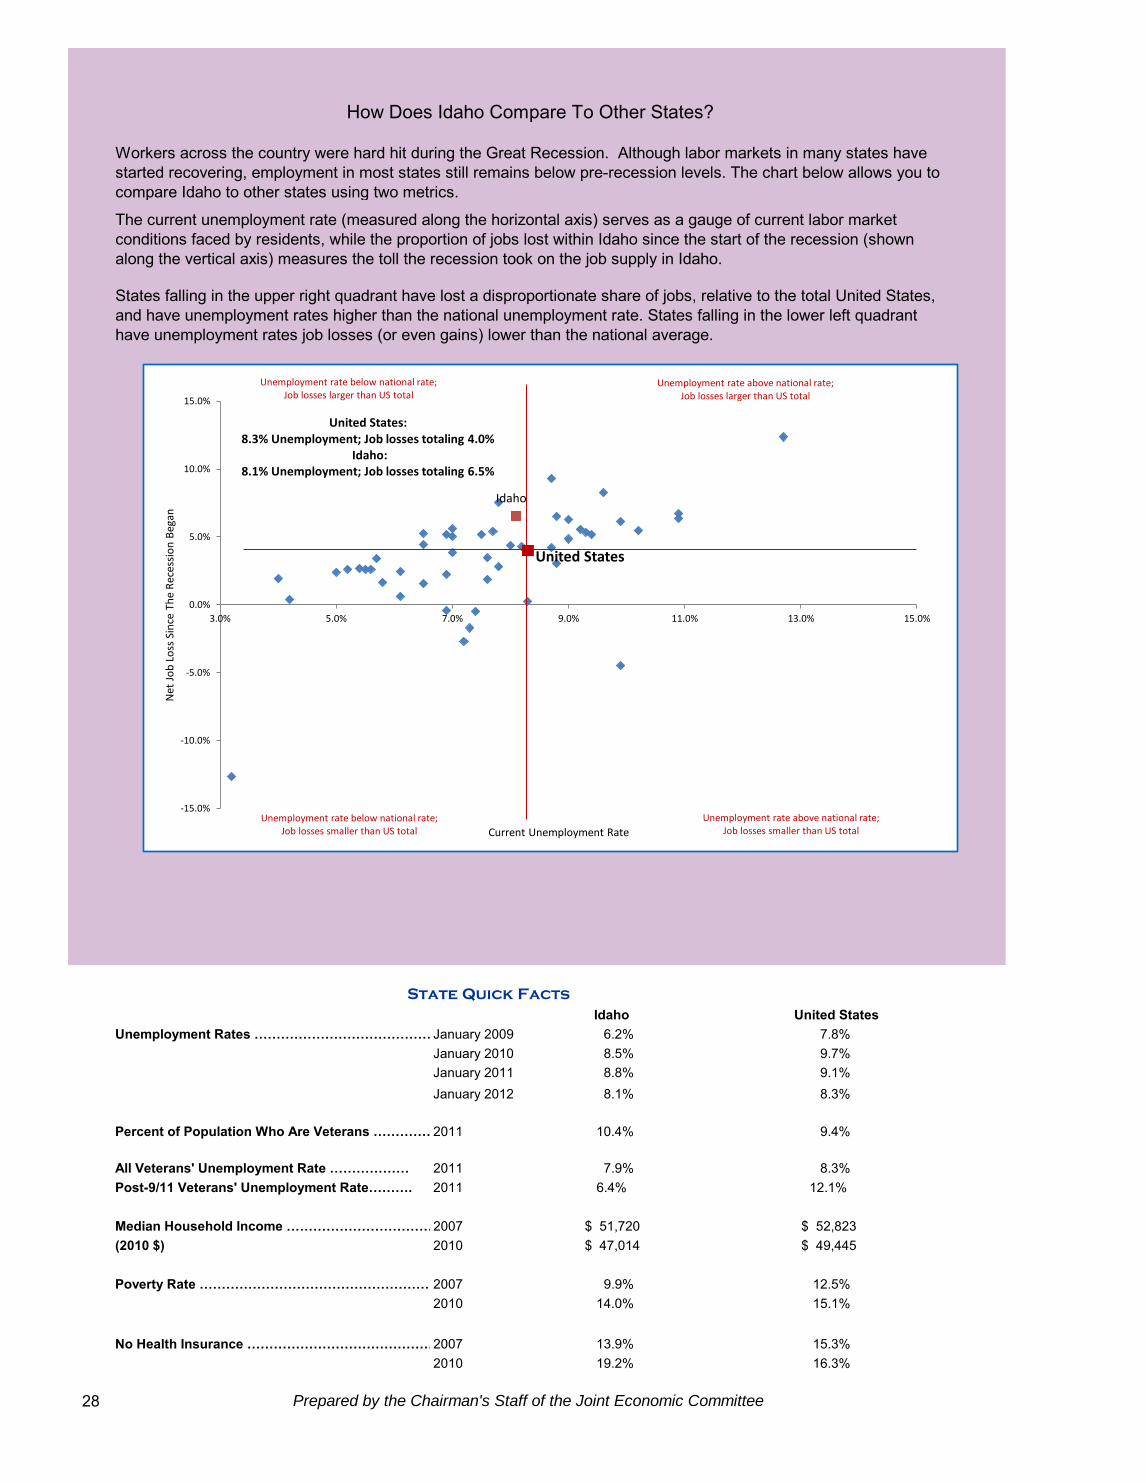
How Does Idaho Compare To Other States?
State Quick Facts
Idaho United StatesUnemployment Rates …………………………………………..January 2009 6.2% 7.8%
January 2010 8.5% 9.7%January 2011 8.8% 9.1%January 2012 8.1% 8.3%
Percent of Population Who Are Veterans ……………….2011 10.4% 9.4%
All Veterans' Unemployment Rate ……………… 2011 7.9% 8.3%Post-9/11 Veterans' Unemployment Rate………. 2011 6.4% 12.1%
Median Household Income ………………………………..2007 51,720$ 52,823$ (2010 $) 2010 47,014$ 49,445$
Poverty Rate ………………………………………………………………..2007 9.9% 12.5%2010 14.0% 15.1%
No Health Insurance ………………………………………….2007 13.9% 15.3%2010 19.2% 16.3%
28 Prepared by the Chairman's Staff of the Joint Economic Committee
The current unemployment rate (measured along the horizontal axis) serves as a gauge of current labor market conditions faced by residents, while the proportion of jobs lost within Idaho since the start of the recession (shown along the vertical axis) measures the toll the recession took on the job supply in Idaho.
States falling in the upper right quadrant have lost a disproportionate share of jobs, relative to the total United States, and have unemployment rates higher than the national unemployment rate. States falling in the lower left quadrant have unemployment rates job losses (or even gains) lower than the national average.
Workers across the country were hard hit during the Great Recession. Although labor markets in many states have started recovering, employment in most states still remains below pre-recession levels. The chart below allows you to compare Idaho to other states using two metrics.
United States
Idaho
-15.0%
-10.0%
-5.0%
0.0%
5.0%
10.0%
15.0%
3.0% 5.0% 7.0% 9.0% 11.0% 13.0% 15.0%
Net
Jo
b L
oss
Sin
ce T
he
Rec
essi
on
Beg
an
Current Unemployment Rate Unemployment rate below national rate;
Job losses smaller than US total
Unemployment rate below national rate; Job losses larger than US total
Unemployment rate above national rate; Job losses smaller than US total
Unemployment rate above national rate; Job losses larger than US total
United States: 8.3% Unemployment; Job losses totaling 4.0%
Idaho: 8.1% Unemployment; Job losses totaling 6.5%

U.S. Congress Joint Economic Committee
Economic Overview And Outlook: IllinoisJobs
◙
◙
◙
◙
Employment
◙
◙
Earnings
◙
◙
Housing
◙
◙
◙
◙
◙
Prepared by the Chairman's Staff of the Joint Economic Committee 29
Including January, the private sector has gained jobs nationwide for 23 consecutive months.
Within the Midwest census region, which includes Illinois, sales of new single-family homes totaled 37,000 units in January 2012, a decrease of 24.5 percent from December. Sales of existing single-family homes remained steady at 920,000 units (at seasonally adjusted annual rates) from December to January 2012.
* For Illinois-specific labor sector statistics, please refer to the Illinois office: http://lmi.ides.state.il.us/pressreleases.htm
As the economy continues its emergence from the Great Recession, service-providing industries are projected to add the most jobs between 2010 and 2020. The largest gains over this period are expected to occur in the healthcare and social assistance, professional and business services, and retail trade sectors. Job gains in the goods-producing sector of the economy will be led by the construction and mining industries while the number of manufacturing jobs is expected to fall.
In Illinois, private sector employment fell by 7.9 percent from January 2008 to February 2010. Since February 2010, private sector employment has grown by 2.4 percent.
In Illinois, employees in the construction, manufacturing, and professional and business services sectors faced the largest job losses (as a percent of employment within an industry) over the recession. Since the beginning of 2010, the following sectors in Illinois have experienced the greatest employment increases: mining; professional and business services; and manufacturing.*
The unemployment rate in Illinois was 9.4 percent in January 2012, up 3.9 percentage points from December 2007, but down from its most recent peak of 11.4 percent in January 2010.620,000 Illinois residents were counted among the unemployed in Illinois during January 2012.
Between the start of the recession in the 4th quarter of 2007 and the 3rd quarter of 2009, inflation-adjusted total personal income in the United States declined 4.6 percent. Most recently, in the 3rd quarter of 2011, total personal income is 0.2 percent below its 4th quarter of 2007 level.
Real per capita personal income (in 2005 $) in Illinois was $38,589.70 in the 3rd quarter of 2011, up from $37,266.40 in the 3rd quarter of 2009.
After peaking in the first quarter of 2007, national home prices declined by 16.6 percent over 17 quarters. Between the second quarter of 2011 and the fourth quarter of 2011, the most recent quarter, national home prices have risen by 1.4 percent. In Illinois, home prices fell by 17.2 percent over 17 quarters from their peak in the first quarter of 2007. Since the second quarter of 2011, home prices in Illinois have risen by 1.2 percent.
As of the 4th quarter of 2011, 7.4 percent of all mortgages, including 20.9 percent of subprime mortgages, were in foreclosure in Illinois. Housing starts in Illinois totaled 8,460 units (seasonally adjusted annual rate) in January 2012, a decrease of 67.2 percent from December.
The median price of single-family homes in Illinois was $152,387 in the second quarter of 2010, compared to $180,176 nationwide.
-60.0
-50.0
-40.0
-30.0
-20.0
-10.0
0.0
10.0
20.0
30.0
2008 2009 2010 2011
Job
Ch
ange
s (0
00
)
Source: Bureau of Labor Statistics, Establishment Survey.
Illinois Monthly Change in Private Payrolls January 2008 - January 2012

How Does Illinois Compare To Other States?
State Quick Facts
Illinois United StatesUnemployment Rates …………………………………………..January 2009 8.0% 7.8%
January 2010 11.4% 9.7%January 2011 9.4% 9.1%January 2012 9.4% 8.3%
Percent of Population Who Are Veterans ……………….2011 7.8% 9.4%
All Veterans' Unemployment Rate ……………… 2011 8.1% 8.3%Post-9/11 Veterans' Unemployment Rate………. 2011 9.5% 12.1%
Median Household Income ………………………………..2007 55,213$ 52,823$ (2010 $) 2010 50,761$ 49,445$
Poverty Rate ………………………………………………………………..2007 10.0% 12.5%2010 14.1% 15.1%
No Health Insurance ………………………………………….2007 13.4% 15.3%2010 14.8% 16.3%
30 Prepared by the Chairman's Staff of the Joint Economic Committee
The current unemployment rate (measured along the horizontal axis) serves as a gauge of current labor market conditions faced by residents, while the proportion of jobs lost within Illinois since the start of the recession (shown along the vertical axis) measures the toll the recession took on the job supply in Illinois.
States falling in the upper right quadrant have lost a disproportionate share of jobs, relative to the total United States, and have unemployment rates higher than the national unemployment rate. States falling in the lower left quadrant have unemployment rates job losses (or even gains) lower than the national average.
Workers across the country were hard hit during the Great Recession. Although labor markets in many states have started recovering, employment in most states still remains below pre-recession levels. The chart below allows you to compare Illinois to other states using two metrics.
United States
Illinois
-15.0%
-10.0%
-5.0%
0.0%
5.0%
10.0%
15.0%
3.0% 5.0% 7.0% 9.0% 11.0% 13.0% 15.0%
Net
Jo
b L
oss
Sin
ce T
he
Rec
essi
on
Beg
an
Current Unemployment Rate Unemployment rate below national rate;
Job losses smaller than US total
Unemployment rate below national rate; Job losses larger than US total
Unemployment rate above national rate; Job losses smaller than US total
Unemployment rate above national rate; Job losses larger than US total
United States: 8.3% Unemployment; Job losses totaling 4.0%
Illinois: 9.4% Unemployment; Job losses totaling 5.1%

U.S. Congress Joint Economic Committee
Economic Overview And Outlook: IndianaJobs
◙
◙
◙
◙
Employment
◙
◙
Earnings
◙
◙
Housing
◙
◙
◙
◙
◙
Prepared by the Chairman's Staff of the Joint Economic Committee 31
Including January, the private sector has gained jobs nationwide for 23 consecutive months.
Within the Midwest census region, which includes Indiana, sales of new single-family homes totaled 37,000 units in January 2012, a decrease of 24.5 percent from December. Sales of existing single-family homes remained steady at 920,000 units (at seasonally adjusted annual rates) from December to January 2012.
* For Indiana-specific labor sector statistics, please refer to the Indiana office: http://www.hoosierdata.in.gov/
As the economy continues its emergence from the Great Recession, service-providing industries are projected to add the most jobs between 2010 and 2020. The largest gains over this period are expected to occur in the healthcare and social assistance, professional and business services, and retail trade sectors. Job gains in the goods-producing sector of the economy will be led by the construction and mining industries while the number of manufacturing jobs is expected to fall.
In Indiana, private sector employment fell by 8.5 percent from January 2008 to February 2010. Since February 2010, private sector employment has grown by 4.3 percent.
In Indiana, employees in the manufacturing, construction, and professional and business services sectors faced the largest job losses (as a percent of employment within an industry) over the recession. Since the beginning of 2010, the following sectors in Indiana have experienced the greatest employment increases: professional and business services; construction; and manufacturing.*
The unemployment rate in Indiana was 8.7 percent in January 2012, up 4.1 percentage points from December 2007, but down from its most recent peak of 10.8 percent in July 2009.279,000 Indiana residents were counted among the unemployed in Indiana during January 2012.
Between the start of the recession in the 4th quarter of 2007 and the 3rd quarter of 2009, inflation-adjusted total personal income in the United States declined 4.6 percent. Most recently, in the 3rd quarter of 2011, total personal income is 0.2 percent below its 4th quarter of 2007 level.
Real per capita personal income (in 2005 $) in Indiana was $30,972.10 in the 3rd quarter of 2011, up from $30,297.20 in the 3rd quarter of 2009.
After peaking in the first quarter of 2007, national home prices declined by 16.6 percent over 17 quarters. Between the second quarter of 2011 and the fourth quarter of 2011, the most recent quarter, national home prices have risen by 1.4 percent. In Indiana, home prices fell by 6.1 percent over 13 quarters from their peak in the first quarter of 2008. Since the second quarter of 2011, home prices in Indiana have risen by 2.0 percent.
As of the 4th quarter of 2011, 4.9 percent of all mortgages, including 13.1 percent of subprime mortgages, were in foreclosure in Indiana. Housing starts in Indiana totaled 11,340 units (seasonally adjusted annual rate) in January 2012, a decrease of 50.9 percent from December.
The median price of single-family homes in Indiana was $113,416 in the second quarter of 2010, compared to $180,176 nationwide.
-50.0
-40.0
-30.0
-20.0
-10.0
0.0
10.0
20.0
2008 2009 2010 2011
Job
Ch
ange
s (0
00
)
Source: Bureau of Labor Statistics, Establishment Survey.
Indiana Monthly Change in Private Payrolls January 2008 - January 2012

How Does Indiana Compare To Other States?
State Quick Facts
Indiana United StatesUnemployment Rates …………………………………………..January 2009 8.9% 7.8%
January 2010 10.6% 9.7%January 2011 9.0% 9.1%January 2012 8.7% 8.3%
Percent of Population Who Are Veterans ……………….2011 10.5% 9.4%
All Veterans' Unemployment Rate ……………… 2011 7.6% 8.3%Post-9/11 Veterans' Unemployment Rate………. 2011 15.7% 12.1%
Median Household Income ………………………………..2007 49,900$ 52,823$ (2010 $) 2010 46,322$ 49,445$
Poverty Rate ………………………………………………………………..2007 11.8% 12.5%2010 16.3% 15.1%
No Health Insurance ………………………………………….2007 11.4% 15.3%2010 13.4% 16.3%
32 Prepared by the Chairman's Staff of the Joint Economic Committee
The current unemployment rate (measured along the horizontal axis) serves as a gauge of current labor market conditions faced by residents, while the proportion of jobs lost within Indiana since the start of the recession (shown along the vertical axis) measures the toll the recession took on the job supply in Indiana.
States falling in the upper right quadrant have lost a disproportionate share of jobs, relative to the total United States, and have unemployment rates higher than the national unemployment rate. States falling in the lower left quadrant have unemployment rates job losses (or even gains) lower than the national average.
Workers across the country were hard hit during the Great Recession. Although labor markets in many states have started recovering, employment in most states still remains below pre-recession levels. The chart below allows you to compare Indiana to other states using two metrics.
United States
Indiana
-15.0%
-10.0%
-5.0%
0.0%
5.0%
10.0%
15.0%
3.0% 5.0% 7.0% 9.0% 11.0% 13.0% 15.0%
Net
Jo
b L
oss
Sin
ce T
he
Rec
essi
on
Beg
an
Current Unemployment Rate Unemployment rate below national rate;
Job losses smaller than US total
Unemployment rate below national rate; Job losses larger than US total
Unemployment rate above national rate; Job losses smaller than US total
Unemployment rate above national rate; Job losses larger than US total
United States: 8.3% Unemployment; Job losses totaling 4.0%
Indiana: 8.7% Unemployment; Job losses totaling 4.2%

U.S. Congress Joint Economic Committee
Economic Overview And Outlook: IowaJobs
◙
◙
◙
◙
Employment
◙
◙
Earnings
◙
◙
Housing
◙
◙
◙
◙
◙
Prepared by the Chairman's Staff of the Joint Economic Committee 33
Including January, the private sector has gained jobs nationwide for 23 consecutive months.
Within the Midwest census region, which includes Iowa, sales of new single-family homes totaled 37,000 units in January 2012, a decrease of 24.5 percent from December. Sales of existing single-family homes remained steady at 920,000 units (at seasonally adjusted annual rates) from December to January 2012.
* For Iowa-specific labor sector statistics, please refer to the Iowa office: http://www.iowaworkforce.org/
As the economy continues its emergence from the Great Recession, service-providing industries are projected to add the most jobs between 2010 and 2020. The largest gains over this period are expected to occur in the healthcare and social assistance, professional and business services, and retail trade sectors. Job gains in the goods-producing sector of the economy will be led by the construction and mining industries while the number of manufacturing jobs is expected to fall.
In Iowa, private sector employment fell by 5.0 percent from January 2008 to February 2010. Since February 2010, private sector employment has grown by 2.1 percent.
In Iowa, employees in the manufacturing, construction, and information services sectors faced the largest job losses (as a percent of employment within an industry) over the recession. Since the beginning of 2010, the following sectors in Iowa have experienced the greatest employment increases: manufacturing; professional and business services; and construction.*
The unemployment rate in Iowa was 5.4 percent in January 2012, up 1.5 percentage points from December 2007, but down from its most recent peak of 6.3 percent in November 2010.90,000 Iowa residents were counted among the unemployed in Iowa during January 2012.
Between the start of the recession in the 4th quarter of 2007 and the 3rd quarter of 2009, inflation-adjusted total personal income in the United States declined 4.6 percent. Most recently, in the 3rd quarter of 2011, total personal income is 0.2 percent below its 4th quarter of 2007 level.
Real per capita personal income (in 2005 $) in Iowa was $34,944.80 in the 3rd quarter of 2011, up from $33,814.80 in the 3rd quarter of 2009.
After peaking in the first quarter of 2007, national home prices declined by 16.6 percent over 17 quarters. Between the second quarter of 2011 and the fourth quarter of 2011, the most recent quarter, national home prices have risen by 1.4 percent. In Iowa, home prices fell by 1.9 percent over 9 quarters from their peak in the first quarter of 2009. Since the second quarter of 2011, home prices in Iowa have risen by 1.7 percent.
As of the 4th quarter of 2011, 2.8 percent of all mortgages, including 12.3 percent of subprime mortgages, were in foreclosure in Iowa. Housing starts in Iowa totaled 5,600 units (seasonally adjusted annual rate) in January 2012, a decrease of 54.5 percent from December.
The median price of single-family homes in Iowa was $118,036 in the second quarter of 2010, compared to $180,176 nationwide.
-15.0
-10.0
-5.0
0.0
5.0
10.0
2008 2009 2010 2011
Job
Ch
ange
s (0
00
)
Source: Bureau of Labor Statistics, Establishment Survey.
Iowa Monthly Change in Private Payrolls January 2008 - January 2012

How Does Iowa Compare To Other States?
State Quick Facts
Iowa United StatesUnemployment Rates …………………………………………..January 2009 6.1% 7.8%
January 2010 6.3% 9.7%January 2011 6.1% 9.1%January 2012 5.4% 8.3%
Percent of Population Who Are Veterans ……………….2011 10.2% 9.4%
All Veterans' Unemployment Rate ……………… 2011 6.4% 8.3%Post-9/11 Veterans' Unemployment Rate………. 2011 11.8% 12.1%
Median Household Income ………………………………..2007 51,430$ 52,823$ (2010 $) 2010 49,177$ 49,445$
Poverty Rate ………………………………………………………………..2007 8.9% 12.5%2010 10.3% 15.1%
No Health Insurance ………………………………………….2007 9.3% 15.3%2010 12.3% 16.3%
34 Prepared by the Chairman's Staff of the Joint Economic Committee
The current unemployment rate (measured along the horizontal axis) serves as a gauge of current labor market conditions faced by residents, while the proportion of jobs lost within Iowa since the start of the recession (shown along the vertical axis) measures the toll the recession took on the job supply in Iowa.
States falling in the upper right quadrant have lost a disproportionate share of jobs, relative to the total United States, and have unemployment rates higher than the national unemployment rate. States falling in the lower left quadrant have unemployment rates job losses (or even gains) lower than the national average.
Workers across the country were hard hit during the Great Recession. Although labor markets in many states have started recovering, employment in most states still remains below pre-recession levels. The chart below allows you to compare Iowa to other states using two metrics.
United States Iowa
-15.0%
-10.0%
-5.0%
0.0%
5.0%
10.0%
15.0%
3.0% 5.0% 7.0% 9.0% 11.0% 13.0% 15.0%
Net
Jo
b L
oss
Sin
ce T
he
Rec
essi
on
Beg
an
Current Unemployment Rate Unemployment rate below national rate;
Job losses smaller than US total
Unemployment rate below national rate; Job losses larger than US total
Unemployment rate above national rate; Job losses smaller than US total
Unemployment rate above national rate; Job losses larger than US total
United States: 8.3% Unemployment; Job losses totaling 4.0%
Iowa: 5.4% Unemployment; Job losses totaling 2.7%

U.S. Congress Joint Economic Committee
Economic Overview And Outlook: KansasJobs
◙
◙
◙
◙
Employment
◙
◙
Earnings
◙
◙
Housing
◙
◙
◙
◙
◙
Prepared by the Chairman's Staff of the Joint Economic Committee 35
Including January, the private sector has gained jobs nationwide for 23 consecutive months.
Within the Midwest census region, which includes Kansas, sales of new single-family homes totaled 37,000 units in January 2012, a decrease of 24.5 percent from December. Sales of existing single-family homes remained steady at 920,000 units (at seasonally adjusted annual rates) from December to January 2012.
* For Kansas-specific labor sector statistics, please refer to the Kansas office: http://www.dol.ks.gov/lmis/lmis.html
As the economy continues its emergence from the Great Recession, service-providing industries are projected to add the most jobs between 2010 and 2020. The largest gains over this period are expected to occur in the healthcare and social assistance, professional and business services, and retail trade sectors. Job gains in the goods-producing sector of the economy will be led by the construction and mining industries while the number of manufacturing jobs is expected to fall.
In Kansas, private sector employment fell by 6.4 percent from January 2008 to February 2010. Since February 2010, private sector employment has grown by 3.3 percent.
In Kansas, employees in the mining, manufacturing, and information services sectors faced the largest job losses (as a percent of employment within an industry) over the recession. Since the beginning of 2010, the following sectors in Kansas have experienced the greatest employment increases: professional and business services; mining; and construction.*
The unemployment rate in Kansas was 6.1 percent in January 2012, up 2.1 percentage points from December 2007, but down from its most recent peak of 7.6 percent in August 2009.92,000 Kansas residents were counted among the unemployed in Kansas during January 2012.
Between the start of the recession in the 4th quarter of 2007 and the 3rd quarter of 2009, inflation-adjusted total personal income in the United States declined 4.6 percent. Most recently, in the 3rd quarter of 2011, total personal income is 0.2 percent below its 4th quarter of 2007 level.
Real per capita personal income (in 2005 $) in Kansas was $35,352.20 in the 3rd quarter of 2011, up from $34,702.40 in the 3rd quarter of 2009.
After peaking in the first quarter of 2007, national home prices declined by 16.6 percent over 17 quarters. Between the second quarter of 2011 and the fourth quarter of 2011, the most recent quarter, national home prices have risen by 1.4 percent. In Kansas, home prices fell by 4.2 percent over 9 quarters from their peak in the first quarter of 2009. Since the second quarter of 2011, home prices in Kansas have risen by 2.3 percent.
As of the 4th quarter of 2011, 2.4 percent of all mortgages, including 7.9 percent of subprime mortgages, were in foreclosure in Kansas. Housing starts in Kansas totaled 4,300 units (seasonally adjusted annual rate) in January 2012, a decrease of 30.9 percent from December.
The median price of single-family homes in Kansas was $118,687 in the second quarter of 2010, compared to $180,176 nationwide.
-15.0
-10.0
-5.0
0.0
5.0
10.0
15.0
2008 2009 2010 2011
Job
Ch
ange
s (0
00
)
Source: Bureau of Labor Statistics, Establishment Survey.
Kansas Monthly Change in Private Payrolls January 2008 - January 2012

How Does Kansas Compare To Other States?
State Quick Facts
Kansas United StatesUnemployment Rates …………………………………………..January 2009 6.3% 7.8%
January 2010 7.3% 9.7%January 2011 6.9% 9.1%January 2012 6.1% 8.3%
Percent of Population Who Are Veterans ……………….2011 10.9% 9.4%
All Veterans' Unemployment Rate ……………… 2011 6.1% 8.3%Post-9/11 Veterans' Unemployment Rate………. 2011 11.5% 12.1%
Median Household Income ………………………………..2007 50,998$ 52,823$ (2010 $) 2010 46,229$ 49,445$
Poverty Rate ………………………………………………………………..2007 11.7% 12.5%2010 14.3% 15.1%
No Health Insurance ………………………………………….2007 12.7% 15.3%2010 12.7% 16.3%
36 Prepared by the Chairman's Staff of the Joint Economic Committee
The current unemployment rate (measured along the horizontal axis) serves as a gauge of current labor market conditions faced by residents, while the proportion of jobs lost within Kansas since the start of the recession (shown along the vertical axis) measures the toll the recession took on the job supply in Kansas.
States falling in the upper right quadrant have lost a disproportionate share of jobs, relative to the total United States, and have unemployment rates higher than the national unemployment rate. States falling in the lower left quadrant have unemployment rates job losses (or even gains) lower than the national average.
Workers across the country were hard hit during the Great Recession. Although labor markets in many states have started recovering, employment in most states still remains below pre-recession levels. The chart below allows you to compare Kansas to other states using two metrics.
United States Kansas
-15.0%
-10.0%
-5.0%
0.0%
5.0%
10.0%
15.0%
3.0% 5.0% 7.0% 9.0% 11.0% 13.0% 15.0%
Net
Jo
b L
oss
Sin
ce T
he
Rec
essi
on
Beg
an
Current Unemployment Rate Unemployment rate below national rate;
Job losses smaller than US total
Unemployment rate below national rate; Job losses larger than US total
Unemployment rate above national rate; Job losses smaller than US total
Unemployment rate above national rate; Job losses larger than US total
United States: 8.3% Unemployment; Job losses totaling 4.0%
Kansas: 6.1% Unemployment; Job losses totaling 2.4%

U.S. Congress Joint Economic Committee
Economic Overview And Outlook: KentuckyJobs
◙
◙
◙
◙
Employment
◙
◙
Earnings
◙
◙
Housing
◙
◙
◙
◙
◙
Prepared by the Chairman's Staff of the Joint Economic Committee 37
Including January, the private sector has gained jobs nationwide for 23 consecutive months.
Within the South census region, which includes Kentucky, sales of new single-family homes totaled 188,000 units in January 2012, an increase of 9.3 percent from December. Sales of existing single-family homes increased 2.7 percent to 1,540,000 units (at seasonally adjusted annual rates) from December to January 2012.
* For Kentucky-specific labor sector statistics, please refer to the Kentucky office: http://www.workforcekentucky.ky.gov/
As the economy continues its emergence from the Great Recession, service-providing industries are projected to add the most jobs between 2010 and 2020. The largest gains over this period are expected to occur in the healthcare and social assistance, professional and business services, and retail trade sectors. Job gains in the goods-producing sector of the economy will be led by the construction and mining industries while the number of manufacturing jobs is expected to fall.
In Kentucky, private sector employment fell by 8.0 percent from January 2008 to February 2010. Since February 2010, private sector employment has grown by 4.3 percent.
In Kentucky, employees in the manufacturing, construction, and information services sectors faced the largest job losses (as a percent of employment within an industry) over the recession. Since the beginning of 2010, the following sectors in Kentucky have experienced the greatest employment increases: professional and business services; leisure and hospitality; and manufacturing.*
The unemployment rate in Kentucky was 8.8 percent in January 2012, up 3.2 percentage points from December 2007, but down from its most recent peak of 10.7 percent in January 2010.182,000 Kentucky residents were counted among the unemployed in Kentucky during January 2012.
Between the start of the recession in the 4th quarter of 2007 and the 3rd quarter of 2009, inflation-adjusted total personal income in the United States declined 4.6 percent. Most recently, in the 3rd quarter of 2011, total personal income is 0.2 percent below its 4th quarter of 2007 level.
Real per capita personal income (in 2005 $) in Kentucky was $29,280.00 in the 3rd quarter of 2011, up from $29,145.90 in the 3rd quarter of 2009.
After peaking in the first quarter of 2007, national home prices declined by 16.6 percent over 17 quarters. Between the second quarter of 2011 and the fourth quarter of 2011, the most recent quarter, national home prices have risen by 1.4 percent. In Kentucky, home prices fell by 3.1 percent over 9 quarters from their peak in the first quarter of 2009. Since the second quarter of 2011, home prices in Kentucky have risen by 0.9 percent.
As of the 4th quarter of 2011, 4.0 percent of all mortgages, including 12.9 percent of subprime mortgages, were in foreclosure in Kentucky. Housing starts in Kentucky totaled 5,960 units (seasonally adjusted annual rate) in January 2012, an increase of 9.8 percent from December.
The median price of single-family homes in Kentucky was $130,344 in the second quarter of 2010, compared to $180,176 nationwide.
-25.0
-20.0
-15.0
-10.0
-5.0
0.0
5.0
10.0
15.0
2008 2009 2010 2011
Job
Ch
ange
s (0
00
)
Source: Bureau of Labor Statistics, Establishment Survey.
Kentucky Monthly Change in Private Payrolls January 2008 - January 2012

How Does Kentucky Compare To Other States?
State Quick Facts
Kentucky United StatesUnemployment Rates …………………………………………..January 2009 8.9% 7.8%
January 2010 10.7% 9.7%January 2011 9.9% 9.1%January 2012 8.8% 8.3%
Percent of Population Who Are Veterans ……………….2011 10.0% 9.4%
All Veterans' Unemployment Rate ……………… 2011 9.5% 8.3%Post-9/11 Veterans' Unemployment Rate………. 2011 7.6% 12.1%
Median Household Income ………………………………..2007 41,486$ 52,823$ (2010 $) 2010 41,236$ 49,445$
Poverty Rate ………………………………………………………………..2007 15.5% 12.5%2010 17.7% 15.1%
No Health Insurance ………………………………………….2007 13.6% 15.3%2010 14.9% 16.3%
38 Prepared by the Chairman's Staff of the Joint Economic Committee
The current unemployment rate (measured along the horizontal axis) serves as a gauge of current labor market conditions faced by residents, while the proportion of jobs lost within Kentucky since the start of the recession (shown along the vertical axis) measures the toll the recession took on the job supply in Kentucky.
States falling in the upper right quadrant have lost a disproportionate share of jobs, relative to the total United States, and have unemployment rates higher than the national unemployment rate. States falling in the lower left quadrant have unemployment rates job losses (or even gains) lower than the national average.
Workers across the country were hard hit during the Great Recession. Although labor markets in many states have started recovering, employment in most states still remains below pre-recession levels. The chart below allows you to compare Kentucky to other states using two metrics.
United States Kentucky
-15.0%
-10.0%
-5.0%
0.0%
5.0%
10.0%
15.0%
3.0% 5.0% 7.0% 9.0% 11.0% 13.0% 15.0%
Net
Jo
b L
oss
Sin
ce T
he
Rec
essi
on
Beg
an
Current Unemployment Rate Unemployment rate below national rate;
Job losses smaller than US total
Unemployment rate below national rate; Job losses larger than US total
Unemployment rate above national rate; Job losses smaller than US total
Unemployment rate above national rate; Job losses larger than US total
United States: 8.3% Unemployment; Job losses totaling 4.0%
Kentucky: 8.8% Unemployment; Job losses totaling 3.0%

U.S. Congress Joint Economic Committee
Economic Overview And Outlook: LouisianaJobs
◙
◙
◙
◙
Employment
◙
◙
Earnings
◙
◙
Housing
◙
◙
◙
◙
◙
Prepared by the Chairman's Staff of the Joint Economic Committee 39
Including January, the private sector has gained jobs nationwide for 23 consecutive months.
Within the South census region, which includes Louisiana, sales of new single-family homes totaled 188,000 units in January 2012, an increase of 9.3 percent from December. Sales of existing single-family homes increased 2.7 percent to 1,540,000 units (at seasonally adjusted annual rates) from December to January 2012.
* For Louisiana-specific labor sector statistics, please refer to the Louisiana office: http://www.laworks.net/LaborMarketInfo/LMI_MainMenu.asp
As the economy continues its emergence from the Great Recession, service-providing industries are projected to add the most jobs between 2010 and 2020. The largest gains over this period are expected to occur in the healthcare and social assistance, professional and business services, and retail trade sectors. Job gains in the goods-producing sector of the economy will be led by the construction and mining industries while the number of manufacturing jobs is expected to fall.
In Louisiana, private sector employment fell by 4.2 percent from January 2008 to February 2010. Since February 2010, private sector employment has grown by 5.1 percent.
In Louisiana, employees in the information services, manufacturing, and professional and business services sectors faced the largest job losses (as a percent of employment within an industry) over the recession. Since the beginning of 2010, the following sectors in Louisiana have experienced the greatest employment increases: education and health services; mining; and professional and business services.*
The unemployment rate in Louisiana was 6.9 percent in January 2012, up 3.2 percentage points from December 2007, but down from its most recent peak of 7.9 percent in November 2010.142,000 Louisiana residents were counted among the unemployed in Louisiana during January 2012.
Between the start of the recession in the 4th quarter of 2007 and the 3rd quarter of 2009, inflation-adjusted total personal income in the United States declined 4.6 percent. Most recently, in the 3rd quarter of 2011, total personal income is 0.2 percent below its 4th quarter of 2007 level.
Real per capita personal income (in 2005 $) in Louisiana was $33,442.40 in the 3rd quarter of 2011, up from $32,719.30 in the 3rd quarter of 2009.
After peaking in the first quarter of 2007, national home prices declined by 16.6 percent over 17 quarters. Between the second quarter of 2011 and the fourth quarter of 2011, the most recent quarter, national home prices have risen by 1.4 percent. In Louisiana, home prices fell by 3.5 percent over 9 quarters from their peak in the first quarter of 2009. Since the second quarter of 2011, home prices in Louisiana have risen by 1.1 percent.
As of the 4th quarter of 2011, 3.5 percent of all mortgages, including 11.6 percent of subprime mortgages, were in foreclosure in Louisiana. Housing starts in Louisiana totaled 12,150 units (seasonally adjusted annual rate) in January 2012, an increase of 6.4 percent from December.
The median price of single-family homes in Louisiana was $152,413 in the second quarter of 2010, compared to $180,176 nationwide.
-25.0
-20.0
-15.0
-10.0
-5.0
0.0
5.0
10.0
15.0
20.0
2008 2009 2010 2011
Job
Ch
ange
s (0
00
)
Source: Bureau of Labor Statistics, Establishment Survey.
Louisiana Monthly Change in Private Payrolls January 2008 - January 2012

How Does Louisiana Compare To Other States?
State Quick Facts
Louisiana United StatesUnemployment Rates …………………………………………..January 2009 5.7% 7.8%
January 2010 6.9% 9.7%January 2011 7.7% 9.1%January 2012 6.9% 8.3%
Percent of Population Who Are Veterans ……………….2011 9.4% 9.4%
All Veterans' Unemployment Rate ……………… 2011 4.2% 8.3%Post-9/11 Veterans' Unemployment Rate………. 2011 10.3% 12.1%
Median Household Income ………………………………..2007 43,443$ 52,823$ (2010 $) 2010 39,443$ 49,445$
Poverty Rate ………………………………………………………………..2007 16.1% 12.5%2010 21.6% 15.1%
No Health Insurance ………………………………………….2007 18.5% 15.3%2010 20.0% 16.3%
40 Prepared by the Chairman's Staff of the Joint Economic Committee
The current unemployment rate (measured along the horizontal axis) serves as a gauge of current labor market conditions faced by residents, while the proportion of jobs lost within Louisiana since the start of the recession (shown along the vertical axis) measures the toll the recession took on the job supply in Louisiana.
States falling in the upper right quadrant have lost a disproportionate share of jobs, relative to the total United States, and have unemployment rates higher than the national unemployment rate. States falling in the lower left quadrant have unemployment rates job losses (or even gains) lower than the national average.
Workers across the country were hard hit during the Great Recession. Although labor markets in many states have started recovering, employment in most states still remains below pre-recession levels. The chart below allows you to compare Louisiana to other states using two metrics.
United States
Louisiana
-15.0%
-10.0%
-5.0%
0.0%
5.0%
10.0%
15.0%
3.0% 5.0% 7.0% 9.0% 11.0% 13.0% 15.0%
Net
Jo
b L
oss
Sin
ce T
he
Rec
essi
on
Beg
an
Current Unemployment Rate Unemployment rate below national rate;
Job losses smaller than US total
Unemployment rate below national rate; Job losses larger than US total
Unemployment rate above national rate; Job losses smaller than US total
Unemployment rate above national rate; Job losses larger than US total
United States: 8.3% Unemployment; Job losses totaling 4.0%
Louisiana: 6.9% Unemployment; Job gains totaling 0.4%

U.S. Congress Joint Economic Committee
Economic Overview And Outlook: MaineJobs
◙
◙
◙
◙
Employment
◙
◙
Earnings
◙
◙
Housing
◙
◙
◙
◙
◙
Prepared by the Chairman's Staff of the Joint Economic Committee 41
Including January, the private sector has gained jobs nationwide for 23 consecutive months.
Within the Northeast census region, which includes Maine, sales of new single-family homes totaled 20,000 units in January 2012, an increase of 11.1 percent from December. Sales of existing single-family homes increased 4.2 percent to 500,000 units (at seasonally adjusted annual rates) from December to January 2012.
* For Maine-specific labor sector statistics, please refer to the Maine office: http://www.state.me.us/labor/
As the economy continues its emergence from the Great Recession, service-providing industries are projected to add the most jobs between 2010 and 2020. The largest gains over this period are expected to occur in the healthcare and social assistance, professional and business services, and retail trade sectors. Job gains in the goods-producing sector of the economy will be led by the construction and mining industries while the number of manufacturing jobs is expected to fall.
In Maine, private sector employment fell by 5.4 percent from January 2008 to February 2010. Since February 2010, private sector employment has grown by 1.2 percent.
In Maine, employees in the mining, construction, and manufacturing sectors faced the largest job losses (as a percent of employment within an industry) over the recession. Since the beginning of 2010, the following sectors in Maine have experienced the greatest employment increases: mining; construction; and professional and business services.*
The unemployment rate in Maine was 7.0 percent in January 2012, up 2.2 percentage points from December 2007, but down from its most recent peak of 8.4 percent in March 2010.50,000 Maine residents were counted among the unemployed in Maine during January 2012.
Between the start of the recession in the 4th quarter of 2007 and the 3rd quarter of 2009, inflation-adjusted total personal income in the United States declined 4.6 percent. Most recently, in the 3rd quarter of 2011, total personal income is 0.2 percent below its 4th quarter of 2007 level.
Real per capita personal income (in 2005 $) in Maine was $33,138.90 in the 3rd quarter of 2011, up from $32,958.40 in the 3rd quarter of 2009.
After peaking in the first quarter of 2007, national home prices declined by 16.6 percent over 17 quarters. Between the second quarter of 2011 and the fourth quarter of 2011, the most recent quarter, national home prices have risen by 1.4 percent. In Maine, home prices fell by 11.1 percent over 13 quarters from their peak in the first quarter of 2008. Since the second quarter of 2011, home prices in Maine have risen by 1.9 percent.
As of the 4th quarter of 2011, 5.9 percent of all mortgages, including 19.3 percent of subprime mortgages, were in foreclosure in Maine. Housing starts in Maine totaled 2,020 units (seasonally adjusted annual rate) in January 2012, an increase of 40.3 percent from December.
The median price of single-family homes in Maine was $175,175 in the second quarter of 2010, compared to $180,176 nationwide.
-6.0
-4.0
-2.0
0.0
2.0
4.0
6.0
2008 2009 2010 2011
Job
Ch
ange
s (0
00
)
Source: Bureau of Labor Statistics, Establishment Survey.
Maine Monthly Change in Private Payrolls January 2008 - January 2012

How Does Maine Compare To Other States?
State Quick Facts
Maine United StatesUnemployment Rates …………………………………………..January 2009 7.3% 7.8%
January 2010 8.4% 9.7%January 2011 8.0% 9.1%January 2012 7.0% 8.3%
Percent of Population Who Are Veterans ……………….2011 12.8% 9.4%
All Veterans' Unemployment Rate ……………… 2011 7.5% 8.3%Post-9/11 Veterans' Unemployment Rate………. 2011 8.7% 12.1%
Median Household Income ………………………………..2007 50,363$ 52,823$ (2010 $) 2010 48,133$ 49,445$
Poverty Rate ………………………………………………………………..2007 10.9% 12.5%2010 12.5% 15.1%
No Health Insurance ………………………………………….2007 8.8% 15.3%2010 9.4% 16.3%
42 Prepared by the Chairman's Staff of the Joint Economic Committee
The current unemployment rate (measured along the horizontal axis) serves as a gauge of current labor market conditions faced by residents, while the proportion of jobs lost within Maine since the start of the recession (shown along the vertical axis) measures the toll the recession took on the job supply in Maine.
States falling in the upper right quadrant have lost a disproportionate share of jobs, relative to the total United States, and have unemployment rates higher than the national unemployment rate. States falling in the lower left quadrant have unemployment rates job losses (or even gains) lower than the national average.
Workers across the country were hard hit during the Great Recession. Although labor markets in many states have started recovering, employment in most states still remains below pre-recession levels. The chart below allows you to compare Maine to other states using two metrics.
United States
Maine
-15.0%
-10.0%
-5.0%
0.0%
5.0%
10.0%
15.0%
3.0% 5.0% 7.0% 9.0% 11.0% 13.0% 15.0%
Net
Jo
b L
oss
Sin
ce T
he
Rec
essi
on
Beg
an
Current Unemployment Rate Unemployment rate below national rate;
Job losses smaller than US total
Unemployment rate below national rate; Job losses larger than US total
Unemployment rate above national rate; Job losses smaller than US total
Unemployment rate above national rate; Job losses larger than US total
United States: 8.3% Unemployment; Job losses totaling 4.0%
Maine: 7.0% Unemployment; Job losses totaling 3.8%

U.S. Congress Joint Economic Committee
Economic Overview And Outlook: MarylandJobs
◙
◙
◙
◙
Employment
◙
◙
Earnings
◙
◙
Housing
◙
◙
◙
◙
◙
Prepared by the Chairman's Staff of the Joint Economic Committee 43
Including January, the private sector has gained jobs nationwide for 23 consecutive months.
Within the South census region, which includes Maryland, sales of new single-family homes totaled 188,000 units in January 2012, an increase of 9.3 percent from December. Sales of existing single-family homes increased 2.7 percent to 1,540,000 units (at seasonally adjusted annual rates) from December to January 2012.
* For Maryland-specific labor sector statistics, please refer to the Maryland office: http://www.dllr.maryland.gov/lmi/
As the economy continues its emergence from the Great Recession, service-providing industries are projected to add the most jobs between 2010 and 2020. The largest gains over this period are expected to occur in the healthcare and social assistance, professional and business services, and retail trade sectors. Job gains in the goods-producing sector of the economy will be led by the construction and mining industries while the number of manufacturing jobs is expected to fall.
In Maryland, private sector employment fell by 7.2 percent from January 2008 to February 2010. Since February 2010, private sector employment has grown by 4.3 percent.
In Maryland, employees in the construction, information services, and manufacturing sectors faced the largest job losses (as a percent of employment within an industry) over the recession. Since the beginning of 2010, the following sectors in Maryland have experienced the greatest employment increases: education and health services; professional and business services; and leisure and hospitality.*
The unemployment rate in Maryland was 6.5 percent in January 2012, up 3.2 percentage points from December 2007, but down from its most recent peak of 8.0 percent in March 2010.200,000 Maryland residents were counted among the unemployed in Maryland during January 2012.
Between the start of the recession in the 4th quarter of 2007 and the 3rd quarter of 2009, inflation-adjusted total personal income in the United States declined 4.6 percent. Most recently, in the 3rd quarter of 2011, total personal income is 0.2 percent below its 4th quarter of 2007 level.
Real per capita personal income (in 2005 $) in Maryland was $44,431.50 in the 3rd quarter of 2011, up from $43,465.30 in the 3rd quarter of 2009.
After peaking in the first quarter of 2007, national home prices declined by 16.6 percent over 17 quarters. Between the second quarter of 2011 and the fourth quarter of 2011, the most recent quarter, national home prices have risen by 1.4 percent. In Maryland, home prices fell by 22.9 percent over 16 quarters from their peak in the second quarter of 2007. Since the second quarter of 2011, home prices in Maryland have risen by 2.0 percent.
As of the 4th quarter of 2011, 4.0 percent of all mortgages, including 13.5 percent of subprime mortgages, were in foreclosure in Maryland. Housing starts in Maryland totaled 12,220 units (seasonally adjusted annual rate) in January 2012, a decrease of 38.1 percent from December.
The median price of single-family homes in Maryland was $256,411 in the second quarter of 2010, compared to $180,176 nationwide.
-40.0
-30.0
-20.0
-10.0
0.0
10.0
20.0
30.0
40.0
2008 2009 2010 2011
Job
Ch
ange
s (0
00
)
Source: Bureau of Labor Statistics, Establishment Survey.
Maryland Monthly Change in Private Payrolls January 2008 - January 2012

How Does Maryland Compare To Other States?
State Quick Facts
Maryland United StatesUnemployment Rates …………………………………………..January 2009 6.3% 7.8%
January 2010 8.0% 9.7%January 2011 7.3% 9.1%January 2012 6.5% 8.3%
Percent of Population Who Are Veterans ……………….2011 9.7% 9.4%
All Veterans' Unemployment Rate ……………… 2011 5.9% 8.3%Post-9/11 Veterans' Unemployment Rate………. 2011 8.9% 12.1%
Median Household Income ………………………………..2007 69,014$ 52,823$ (2010 $) 2010 64,025$ 49,445$
Poverty Rate ………………………………………………………………..2007 8.8% 12.5%2010 10.8% 15.1%
No Health Insurance ………………………………………….2007 13.7% 15.3%2010 13.1% 16.3%
44 Prepared by the Chairman's Staff of the Joint Economic Committee
The current unemployment rate (measured along the horizontal axis) serves as a gauge of current labor market conditions faced by residents, while the proportion of jobs lost within Maryland since the start of the recession (shown along the vertical axis) measures the toll the recession took on the job supply in Maryland.
States falling in the upper right quadrant have lost a disproportionate share of jobs, relative to the total United States, and have unemployment rates higher than the national unemployment rate. States falling in the lower left quadrant have unemployment rates job losses (or even gains) lower than the national average.
Workers across the country were hard hit during the Great Recession. Although labor markets in many states have started recovering, employment in most states still remains below pre-recession levels. The chart below allows you to compare Maryland to other states using two metrics.
United States Maryland
-15.0%
-10.0%
-5.0%
0.0%
5.0%
10.0%
15.0%
3.0% 5.0% 7.0% 9.0% 11.0% 13.0% 15.0%
Net
Jo
b L
oss
Sin
ce T
he
Rec
essi
on
Beg
an
Current Unemployment Rate Unemployment rate below national rate;
Job losses smaller than US total
Unemployment rate below national rate; Job losses larger than US total
Unemployment rate above national rate; Job losses smaller than US total
Unemployment rate above national rate; Job losses larger than US total
United States: 8.3% Unemployment; Job losses totaling 4.0%
Maryland: 6.5% Unemployment; Job losses totaling 1.5%

U.S. Congress Joint Economic Committee
Economic Overview And Outlook: MassachusettsJobs
◙
◙
◙
◙
Employment
◙
◙
Earnings
◙
◙
Housing
◙
◙
◙
◙
◙
Prepared by the Chairman's Staff of the Joint Economic Committee 45
Including January, the private sector has gained jobs nationwide for 23 consecutive months.
Within the Northeast census region, which includes Massachusetts, sales of new single-family homes totaled 20,000 units in January 2012, an increase of 11.1 percent from December. Sales of existing single-family homes increased 4.2 percent to 500,000 units (at seasonally adjusted annual rates) from December to January 2012.* For Massachusetts-specific labor sector statistics, please refer to the Massachusetts office: http://www.mass.gov/?pageID=elwdagencylanding&L=4&L0=Home&L1=Government&L2=EOLWD+Data+and+Statistics&L3=Labor+Market+Information&sid=Elwd
As the economy continues its emergence from the Great Recession, service-providing industries are projected to add the most jobs between 2010 and 2020. The largest gains over this period are expected to occur in the healthcare and social assistance, professional and business services, and retail trade sectors. Job gains in the goods-producing sector of the economy will be led by the construction and mining industries while the number of manufacturing jobs is expected to fall.
In Massachusetts, private sector employment fell by 4.4 percent from January 2008 to February 2010. Since February 2010, private sector employment has grown by 1.8 percent.
In Massachusetts, employees in the construction, mining, and manufacturing sectors faced the largest job losses (as a percent of employment within an industry) over the recession. Since the beginning of 2010, the following sectors in Massachusetts have experienced the greatest employment increases: professional and business services; other services; and leisure and hospitality.*
The unemployment rate in Massachusetts was 6.9 percent in January 2012, up 2.4 percentage points from December 2007, but down from its most recent peak of 8.7 percent in February 2010.238,000 Massachusetts residents were counted among the unemployed in Massachusetts during January 2012.
Between the start of the recession in the 4th quarter of 2007 and the 3rd quarter of 2009, inflation-adjusted total personal income in the United States declined 4.6 percent. Most recently, in the 3rd quarter of 2011, total personal income is 0.2 percent below its 4th quarter of 2007 level.
Real per capita personal income (in 2005 $) in Massachusetts was $46,783.80 in the 3rd quarter of 2011, up from $45,286.20 in the 3rd quarter of 2009.
After peaking in the first quarter of 2007, national home prices declined by 16.6 percent over 17 quarters. Between the second quarter of 2011 and the fourth quarter of 2011, the most recent quarter, national home prices have risen by 1.4 percent. In Massachusetts, home prices fell by 14.9 percent over 21 quarters from their peak in the first quarter of 2006. Since the second quarter of 2011, home prices in Massachusetts have risen by 0.8 percent.
As of the 4th quarter of 2011, 3.0 percent of all mortgages, including 12.3 percent of subprime mortgages, were in foreclosure in Massachusetts. Housing starts in Massachusetts totaled 6,140 units (seasonally adjusted annual rate) in January 2012, a decrease of 39.4 percent from December.
The median price of single-family homes in Massachusetts was $306,363 in the second quarter of 2010, compared to $180,176 nationwide.
-35.0
-30.0
-25.0
-20.0
-15.0
-10.0
-5.0
0.0
5.0
10.0
15.0
20.0
2008 2009 2010 2011
Job
Ch
ange
s (0
00
)
Source: Bureau of Labor Statistics, Establishment Survey.
Massachusetts Monthly Change in Private Payrolls January 2008 - January 2012

How Does Massachusetts Compare To Other States?
State Quick Facts
Massachusetts United StatesUnemployment Rates …………………………………………..January 2009 7.0% 7.8%
January 2010 8.7% 9.7%January 2011 7.8% 9.1%January 2012 6.9% 8.3%
Percent of Population Who Are Veterans ……………….2011 7.9% 9.4%
All Veterans' Unemployment Rate ……………… 2011 9.5% 8.3%Post-9/11 Veterans' Unemployment Rate………. 2011 7.0% 12.1%
Median Household Income ………………………………..2007 61,477$ 52,823$ (2010 $) 2010 61,333$ 49,445$
Poverty Rate ………………………………………………………………..2007 11.2% 12.5%2010 10.6% 15.1%
No Health Insurance ………………………………………….2007 5.4% 15.3%2010 5.6% 16.3%
46 Prepared by the Chairman's Staff of the Joint Economic Committee
The current unemployment rate (measured along the horizontal axis) serves as a gauge of current labor market conditions faced by residents, while the proportion of jobs lost within Massachusetts since the start of the recession (shown along the vertical axis) measures the toll the recession took on the job supply in Massachusetts.
States falling in the upper right quadrant have lost a disproportionate share of jobs, relative to the total United States, and have unemployment rates higher than the national unemployment rate. States falling in the lower left quadrant have unemployment rates job losses (or even gains) lower than the national average.
Workers across the country were hard hit during the Great Recession. Although labor markets in many states have started recovering, employment in most states still remains below pre-recession levels. The chart below allows you to compare Massachusetts to other states using two metrics.
United States Massachusetts
-15.0%
-10.0%
-5.0%
0.0%
5.0%
10.0%
15.0%
3.0% 5.0% 7.0% 9.0% 11.0% 13.0% 15.0%
Net
Jo
b L
oss
Sin
ce T
he
Rec
essi
on
Beg
an
Current Unemployment Rate Unemployment rate below national rate;
Job losses smaller than US total
Unemployment rate below national rate; Job losses larger than US total
Unemployment rate above national rate; Job losses smaller than US total
Unemployment rate above national rate; Job losses larger than US total
United States: 8.3% Unemployment; Job losses totaling 4.0%
Massachusetts: 6.9% Unemployment; Job losses totaling 2.3%

U.S. Congress Joint Economic Committee
Economic Overview And Outlook: MichiganJobs
◙
◙
◙
◙
Employment
◙
◙
Earnings
◙
◙
Housing
◙
◙
◙
◙
◙
Prepared by the Chairman's Staff of the Joint Economic Committee 47
Including January, the private sector has gained jobs nationwide for 23 consecutive months.
Within the Midwest census region, which includes Michigan, sales of new single-family homes totaled 37,000 units in January 2012, a decrease of 24.5 percent from December. Sales of existing single-family homes remained steady at 920,000 units (at seasonally adjusted annual rates) from December to January 2012.
* For Michigan-specific labor sector statistics, please refer to the Michigan office: http://www.milmi.org/
As the economy continues its emergence from the Great Recession, service-providing industries are projected to add the most jobs between 2010 and 2020. The largest gains over this period are expected to occur in the healthcare and social assistance, professional and business services, and retail trade sectors. Job gains in the goods-producing sector of the economy will be led by the construction and mining industries while the number of manufacturing jobs is expected to fall.
In Michigan, private sector employment fell by 11.1 percent from January 2008 to February 2010. Since February 2010, private sector employment has grown by 5.3 percent.
In Michigan, employees in the manufacturing, construction, and professional and business services sectors faced the largest job losses (as a percent of employment within an industry) over the recession. Since the beginning of 2010, the following sectors in Michigan have experienced the greatest employment increases: manufacturing; professional and business services; and mining.*
The unemployment rate in Michigan was 9.0 percent in January 2012, up 1.8 percentage points from December 2007, but down from its most recent peak of 14.2 percent in August 2009.417,000 Michigan residents were counted among the unemployed in Michigan during January 2012.
Between the start of the recession in the 4th quarter of 2007 and the 3rd quarter of 2009, inflation-adjusted total personal income in the United States declined 4.6 percent. Most recently, in the 3rd quarter of 2011, total personal income is 0.2 percent below its 4th quarter of 2007 level.
Real per capita personal income (in 2005 $) in Michigan was $31,855.70 in the 3rd quarter of 2011, up from $30,458.80 in the 3rd quarter of 2009.
After peaking in the first quarter of 2007, national home prices declined by 16.6 percent over 17 quarters. Between the second quarter of 2011 and the fourth quarter of 2011, the most recent quarter, national home prices have risen by 1.4 percent. In Michigan, home prices fell by 26.6 percent over 23 quarters from their peak in the third quarter of 2005. Since the second quarter of 2011, home prices in Michigan have risen by 3.6 percent.
As of the 4th quarter of 2011, 3.2 percent of all mortgages, including 7.5 percent of subprime mortgages, were in foreclosure in Michigan. Housing starts in Michigan totaled 9,260 units (seasonally adjusted annual rate) in January 2012, a decrease of 34.5 percent from December.
The median price of single-family homes in Michigan was $96,398 in the second quarter of 2010, compared to $180,176 nationwide.
-120.0
-100.0
-80.0
-60.0
-40.0
-20.0
0.0
20.0
40.0
2008 2009 2010 2011
Job
Ch
ange
s (0
00
)
Source: Bureau of Labor Statistics, Establishment Survey.
Michigan Monthly Change in Private Payrolls January 2008 - January 2012

How Does Michigan Compare To Other States?
State Quick Facts
Michigan United StatesUnemployment Rates …………………………………………..January 2009 11.3% 7.8%
January 2010 13.8% 9.7%January 2011 10.9% 9.1%January 2012 9.0% 8.3%
Percent of Population Who Are Veterans ……………….2011 8.6% 9.4%
All Veterans' Unemployment Rate ……………… 2011 11.3% 8.3%Post-9/11 Veterans' Unemployment Rate………. 2011 14.4% 12.1%
Median Household Income ………………………………..2007 51,916$ 52,823$ (2010 $) 2010 46,441$ 49,445$
Poverty Rate ………………………………………………………………..2007 10.8% 12.5%2010 15.5% 15.1%
No Health Insurance ………………………………………….2007 11.6% 15.3%2010 13.0% 16.3%
48 Prepared by the Chairman's Staff of the Joint Economic Committee
The current unemployment rate (measured along the horizontal axis) serves as a gauge of current labor market conditions faced by residents, while the proportion of jobs lost within Michigan since the start of the recession (shown along the vertical axis) measures the toll the recession took on the job supply in Michigan.
States falling in the upper right quadrant have lost a disproportionate share of jobs, relative to the total United States, and have unemployment rates higher than the national unemployment rate. States falling in the lower left quadrant have unemployment rates job losses (or even gains) lower than the national average.
Workers across the country were hard hit during the Great Recession. Although labor markets in many states have started recovering, employment in most states still remains below pre-recession levels. The chart below allows you to compare Michigan to other states using two metrics.
United States
Michigan
-15.0%
-10.0%
-5.0%
0.0%
5.0%
10.0%
15.0%
3.0% 5.0% 7.0% 9.0% 11.0% 13.0% 15.0%
Net
Jo
b L
oss
Sin
ce T
he
Rec
essi
on
Beg
an
Current Unemployment Rate Unemployment rate below national rate;
Job losses smaller than US total
Unemployment rate below national rate; Job losses larger than US total
Unemployment rate above national rate; Job losses smaller than US total
Unemployment rate above national rate; Job losses larger than US total
United States: 8.3% Unemployment; Job losses totaling 4.0%
Michigan: 9.0% Unemployment; Job losses totaling 6.3%

U.S. Congress Joint Economic Committee
Economic Overview And Outlook: MinnesotaJobs
◙
◙
◙
◙
Employment
◙
◙
Earnings
◙
◙
Housing
◙
◙
◙
◙
◙
Prepared by the Chairman's Staff of the Joint Economic Committee 49
Including January, the private sector has gained jobs nationwide for 23 consecutive months.
Within the Midwest census region, which includes Minnesota, sales of new single-family homes totaled 37,000 units in January 2012, a decrease of 24.5 percent from December. Sales of existing single-family homes remained steady at 920,000 units (at seasonally adjusted annual rates) from December to January 2012.
* For Minnesota-specific labor sector statistics, please refer to the Minnesota office: http://www.positivelyminnesota.com/Data_Publications/Data/
As the economy continues its emergence from the Great Recession, service-providing industries are projected to add the most jobs between 2010 and 2020. The largest gains over this period are expected to occur in the healthcare and social assistance, professional and business services, and retail trade sectors. Job gains in the goods-producing sector of the economy will be led by the construction and mining industries while the number of manufacturing jobs is expected to fall.
In Minnesota, private sector employment fell by 6.4 percent from January 2008 to February 2010. Since February 2010, private sector employment has grown by 3.8 percent.
In Minnesota, employees in the mining, construction, and manufacturing sectors faced the largest job losses (as a percent of employment within an industry) over the recession. Since the beginning of 2010, the following sectors in Minnesota have experienced the greatest employment increases: mining; professional and business services; and manufacturing.*
The unemployment rate in Minnesota was 5.6 percent in January 2012, up 0.8 percentage point from December 2007, but down from its most recent peak of 8.3 percent in June 2009.166,000 Minnesota residents were counted among the unemployed in Minnesota during January 2012.
Between the start of the recession in the 4th quarter of 2007 and the 3rd quarter of 2009, inflation-adjusted total personal income in the United States declined 4.6 percent. Most recently, in the 3rd quarter of 2011, total personal income is 0.2 percent below its 4th quarter of 2007 level.
Real per capita personal income (in 2005 $) in Minnesota was $39,322.30 in the 3rd quarter of 2011, up from $37,482.00 in the 3rd quarter of 2009.
After peaking in the first quarter of 2007, national home prices declined by 16.6 percent over 17 quarters. Between the second quarter of 2011 and the fourth quarter of 2011, the most recent quarter, national home prices have risen by 1.4 percent. In Minnesota, home prices fell by 19.6 percent over 17 quarters from their peak in the first quarter of 2007. Since the second quarter of 2011, home prices in Minnesota have risen by 2.3 percent.
As of the 4th quarter of 2011, 2.6 percent of all mortgages, including 11.2 percent of subprime mortgages, were in foreclosure in Minnesota. Housing starts in Minnesota totaled 12,060 units (seasonally adjusted annual rate) in January 2012, a decrease of 33.4 percent from December.
The median price of single-family homes in Minnesota was $164,105 in the second quarter of 2010, compared to $180,176 nationwide.
-30.0
-20.0
-10.0
0.0
10.0
20.0
30.0
40.0
2008 2009 2010 2011
Job
Ch
ange
s (0
00
)
Source: Bureau of Labor Statistics, Establishment Survey.
Minnesota Monthly Change in Private Payrolls January 2008 - January 2012

How Does Minnesota Compare To Other States?
State Quick Facts
Minnesota United StatesUnemployment Rates …………………………………………..January 2009 7.4% 7.8%
January 2010 7.7% 9.7%January 2011 6.8% 9.1%January 2012 5.6% 8.3%
Percent of Population Who Are Veterans ……………….2011 9.9% 9.4%
All Veterans' Unemployment Rate ……………… 2011 5.9% 8.3%Post-9/11 Veterans' Unemployment Rate………. 2011 11.7% 12.1%
Median Household Income ………………………………..2007 61,051$ 52,823$ (2010 $) 2010 52,554$ 49,445$
Poverty Rate ………………………………………………………………..2007 9.3% 12.5%2010 10.5% 15.1%
No Health Insurance ………………………………………….2007 8.3% 15.3%2010 9.8% 16.3%
50 Prepared by the Chairman's Staff of the Joint Economic Committee
The current unemployment rate (measured along the horizontal axis) serves as a gauge of current labor market conditions faced by residents, while the proportion of jobs lost within Minnesota since the start of the recession (shown along the vertical axis) measures the toll the recession took on the job supply in Minnesota.
States falling in the upper right quadrant have lost a disproportionate share of jobs, relative to the total United States, and have unemployment rates higher than the national unemployment rate. States falling in the lower left quadrant have unemployment rates job losses (or even gains) lower than the national average.
Workers across the country were hard hit during the Great Recession. Although labor markets in many states have started recovering, employment in most states still remains below pre-recession levels. The chart below allows you to compare Minnesota to other states using two metrics.
United States Minnesota
-15.0%
-10.0%
-5.0%
0.0%
5.0%
10.0%
15.0%
3.0% 5.0% 7.0% 9.0% 11.0% 13.0% 15.0%
Net
Jo
b L
oss
Sin
ce T
he
Rec
essi
on
Beg
an
Current Unemployment Rate Unemployment rate below national rate;
Job losses smaller than US total
Unemployment rate below national rate; Job losses larger than US total
Unemployment rate above national rate; Job losses smaller than US total
Unemployment rate above national rate; Job losses larger than US total
United States: 8.3% Unemployment; Job losses totaling 4.0%
Minnesota: 5.6% Unemployment; Job losses totaling 2.6%

U.S. Congress Joint Economic Committee
Economic Overview And Outlook: MississippiJobs
◙
◙
◙
◙
Employment
◙
◙
Earnings
◙
◙
Housing
◙
◙
◙
◙
◙
Prepared by the Chairman's Staff of the Joint Economic Committee 51
Including January, the private sector has gained jobs nationwide for 23 consecutive months.
Within the South census region, which includes Mississippi, sales of new single-family homes totaled 188,000 units in January 2012, an increase of 9.3 percent from December. Sales of existing single-family homes increased 2.7 percent to 1,540,000 units (at seasonally adjusted annual rates) from December to January 2012.
* For Mississippi-specific labor sector statistics, please refer to the Mississippi office: http://mdes.ms.gov/Home/LMI/LMIPublications/publicationmain.html
As the economy continues its emergence from the Great Recession, service-providing industries are projected to add the most jobs between 2010 and 2020. The largest gains over this period are expected to occur in the healthcare and social assistance, professional and business services, and retail trade sectors. Job gains in the goods-producing sector of the economy will be led by the construction and mining industries while the number of manufacturing jobs is expected to fall.
In Mississippi, private sector employment fell by 8.7 percent from January 2008 to February 2010. Since February 2010, private sector employment has grown by 0.9 percent.
In Mississippi, employees in the manufacturing, construction, and mining sectors faced the largest job losses (as a percent of employment within an industry) over the recession. Since the beginning of 2010, the following sectors in Mississippi have experienced the greatest employment increases: mining; professional and business services; and education and health services.*
The unemployment rate in Mississippi was 9.9 percent in January 2012, up 3.8 percentage points from December 2007, but down from its most recent peak of 10.9 percent in September 2011.134,000 Mississippi residents were counted among the unemployed in Mississippi during January 2012.
Between the start of the recession in the 4th quarter of 2007 and the 3rd quarter of 2009, inflation-adjusted total personal income in the United States declined 4.6 percent. Most recently, in the 3rd quarter of 2011, total personal income is 0.2 percent below its 4th quarter of 2007 level.
Real per capita personal income (in 2005 $) in Mississippi was $27,930.30 in the 3rd quarter of 2011, up from $27,249.40 in the 3rd quarter of 2009.
After peaking in the first quarter of 2007, national home prices declined by 16.6 percent over 17 quarters. Between the second quarter of 2011 and the fourth quarter of 2011, the most recent quarter, national home prices have risen by 1.4 percent. In Mississippi, home prices fell by 7.4 percent over 12 quarters from their peak in the first quarter of 2008. Since the first quarter of 2011, home prices in Mississippi have risen by 1.5 percent.
As of the 4th quarter of 2011, 3.5 percent of all mortgages, including 9.4 percent of subprime mortgages, were in foreclosure in Mississippi. Housing starts in Mississippi totaled 4,840 units (seasonally adjusted annual rate) in January 2012, an increase of 54.1 percent from December.
The median price of single-family homes in Mississippi was $126,484 in the second quarter of 2010, compared to $180,176 nationwide.
-10.0
-8.0
-6.0
-4.0
-2.0
0.0
2.0
4.0
6.0
8.0
2008 2009 2010 2011
Job
Ch
ange
s (0
00
)
Source: Bureau of Labor Statistics, Establishment Survey.
Mississippi Monthly Change in Private Payrolls January 2008 - January 2012

How Does Mississippi Compare To Other States?
State Quick Facts
Mississippi United StatesUnemployment Rates …………………………………………..January 2009 8.0% 7.8%
January 2010 10.9% 9.7%January 2011 10.5% 9.1%January 2012 9.9% 8.3%
Percent of Population Who Are Veterans ……………….2011 8.8% 9.4%
All Veterans' Unemployment Rate ……………… 2011 9.7% 8.3%Post-9/11 Veterans' Unemployment Rate………. 2011 10.5% 12.1%
Median Household Income ………………………………..2007 39,201$ 52,823$ (2010 $) 2010 37,985$ 49,445$
Poverty Rate ………………………………………………………………..2007 22.6% 12.5%2010 22.7% 15.1%
No Health Insurance ………………………………………….2007 18.8% 15.3%2010 21.1% 16.3%
52 Prepared by the Chairman's Staff of the Joint Economic Committee
The current unemployment rate (measured along the horizontal axis) serves as a gauge of current labor market conditions faced by residents, while the proportion of jobs lost within Mississippi since the start of the recession (shown along the vertical axis) measures the toll the recession took on the job supply in Mississippi.
States falling in the upper right quadrant have lost a disproportionate share of jobs, relative to the total United States, and have unemployment rates higher than the national unemployment rate. States falling in the lower left quadrant have unemployment rates job losses (or even gains) lower than the national average.
Workers across the country were hard hit during the Great Recession. Although labor markets in many states have started recovering, employment in most states still remains below pre-recession levels. The chart below allows you to compare Mississippi to other states using two metrics.
United States
Mississippi
-15.0%
-10.0%
-5.0%
0.0%
5.0%
10.0%
15.0%
3.0% 5.0% 7.0% 9.0% 11.0% 13.0% 15.0%
Net
Jo
b L
oss
Sin
ce T
he
Rec
essi
on
Beg
an
Current Unemployment Rate Unemployment rate below national rate;
Job losses smaller than US total
Unemployment rate below national rate; Job losses larger than US total
Unemployment rate above national rate; Job losses smaller than US total
Unemployment rate above national rate; Job losses larger than US total
United States: 8.3% Unemployment; Job losses totaling 4.0%
Mississippi: 9.9% Unemployment; Job losses totaling 6.1%

U.S. Congress Joint Economic Committee
Economic Overview And Outlook: MissouriJobs
◙
◙
◙
◙
Employment
◙
◙
Earnings
◙
◙
Housing
◙
◙
◙
◙
◙
Prepared by the Chairman's Staff of the Joint Economic Committee 53
Including January, the private sector has gained jobs nationwide for 23 consecutive months.
Within the Midwest census region, which includes Missouri, sales of new single-family homes totaled 37,000 units in January 2012, a decrease of 24.5 percent from December. Sales of existing single-family homes remained steady at 920,000 units (at seasonally adjusted annual rates) from December to January 2012.
* For Missouri-specific labor sector statistics, please refer to the Missouri office: http://www.labor.mo.gov/
As the economy continues its emergence from the Great Recession, service-providing industries are projected to add the most jobs between 2010 and 2020. The largest gains over this period are expected to occur in the healthcare and social assistance, professional and business services, and retail trade sectors. Job gains in the goods-producing sector of the economy will be led by the construction and mining industries while the number of manufacturing jobs is expected to fall.
In Missouri, private sector employment fell by 7.1 percent from January 2008 to February 2010. Since February 2010, private sector employment has grown by 1.0 percent.
In Missouri, employees in the mining, construction, and manufacturing sectors faced the largest job losses (as a percent of employment within an industry) over the recession. Since the beginning of 2010, the following sectors in Missouri have experienced the greatest employment increases: professional and business services; manufacturing; and education and health services.*
The unemployment rate in Missouri was 7.5 percent in January 2012, up 2.2 percentage points from December 2007, but down from its most recent peak of 9.7 percent in August 2009.228,000 Missouri residents were counted among the unemployed in Missouri during January 2012.
Between the start of the recession in the 4th quarter of 2007 and the 3rd quarter of 2009, inflation-adjusted total personal income in the United States declined 4.6 percent. Most recently, in the 3rd quarter of 2011, total personal income is 0.2 percent below its 4th quarter of 2007 level.
Real per capita personal income (in 2005 $) in Missouri was $33,325.50 in the 3rd quarter of 2011, up from $32,961.00 in the 3rd quarter of 2009.
After peaking in the first quarter of 2007, national home prices declined by 16.6 percent over 17 quarters. Between the second quarter of 2011 and the fourth quarter of 2011, the most recent quarter, national home prices have risen by 1.4 percent. In Missouri, home prices fell by 9.2 percent over 13 quarters from their peak in the first quarter of 2008. Since the second quarter of 2011, home prices in Missouri have risen by 2.0 percent.
As of the 4th quarter of 2011, 2.0 percent of all mortgages, including 6.6 percent of subprime mortgages, were in foreclosure in Missouri. Housing starts in Missouri totaled 11,180 units (seasonally adjusted annual rate) in January 2012, an increase of 3.6 percent from December.
The median price of single-family homes in Missouri was $123,754 in the second quarter of 2010, compared to $180,176 nationwide.
-20.0
-15.0
-10.0
-5.0
0.0
5.0
10.0
15.0
20.0
25.0
2008 2009 2010 2011
Job
Ch
ange
s (0
00
)
Source: Bureau of Labor Statistics, Establishment Survey.
Missouri Monthly Change in Private Payrolls January 2008 - January 2012

How Does Missouri Compare To Other States?
State Quick Facts
Missouri United StatesUnemployment Rates …………………………………………..January 2009 8.6% 7.8%
January 2010 9.5% 9.7%January 2011 9.0% 9.1%January 2012 7.5% 8.3%
Percent of Population Who Are Veterans ……………….2011 11.0% 9.4%
All Veterans' Unemployment Rate ……………… 2011 7.2% 8.3%Post-9/11 Veterans' Unemployment Rate………. 2011 9.2% 12.1%
Median Household Income ………………………………..2007 48,377$ 52,823$ (2010 $) 2010 46,184$ 49,445$
Poverty Rate ………………………………………………………………..2007 12.8% 12.5%2010 14.8% 15.1%
No Health Insurance ………………………………………….2007 12.6% 15.3%2010 14.0% 16.3%
54 Prepared by the Chairman's Staff of the Joint Economic Committee
The current unemployment rate (measured along the horizontal axis) serves as a gauge of current labor market conditions faced by residents, while the proportion of jobs lost within Missouri since the start of the recession (shown along the vertical axis) measures the toll the recession took on the job supply in Missouri.
States falling in the upper right quadrant have lost a disproportionate share of jobs, relative to the total United States, and have unemployment rates higher than the national unemployment rate. States falling in the lower left quadrant have unemployment rates job losses (or even gains) lower than the national average.
Workers across the country were hard hit during the Great Recession. Although labor markets in many states have started recovering, employment in most states still remains below pre-recession levels. The chart below allows you to compare Missouri to other states using two metrics.
United States
Missouri
-15.0%
-10.0%
-5.0%
0.0%
5.0%
10.0%
15.0%
3.0% 5.0% 7.0% 9.0% 11.0% 13.0% 15.0%
Net
Jo
b L
oss
Sin
ce T
he
Rec
essi
on
Beg
an
Current Unemployment Rate Unemployment rate below national rate;
Job losses smaller than US total
Unemployment rate below national rate; Job losses larger than US total
Unemployment rate above national rate; Job losses smaller than US total
Unemployment rate above national rate; Job losses larger than US total
United States: 8.3% Unemployment; Job losses totaling 4.0%
Missouri: 7.5% Unemployment; Job losses totaling 5.2%
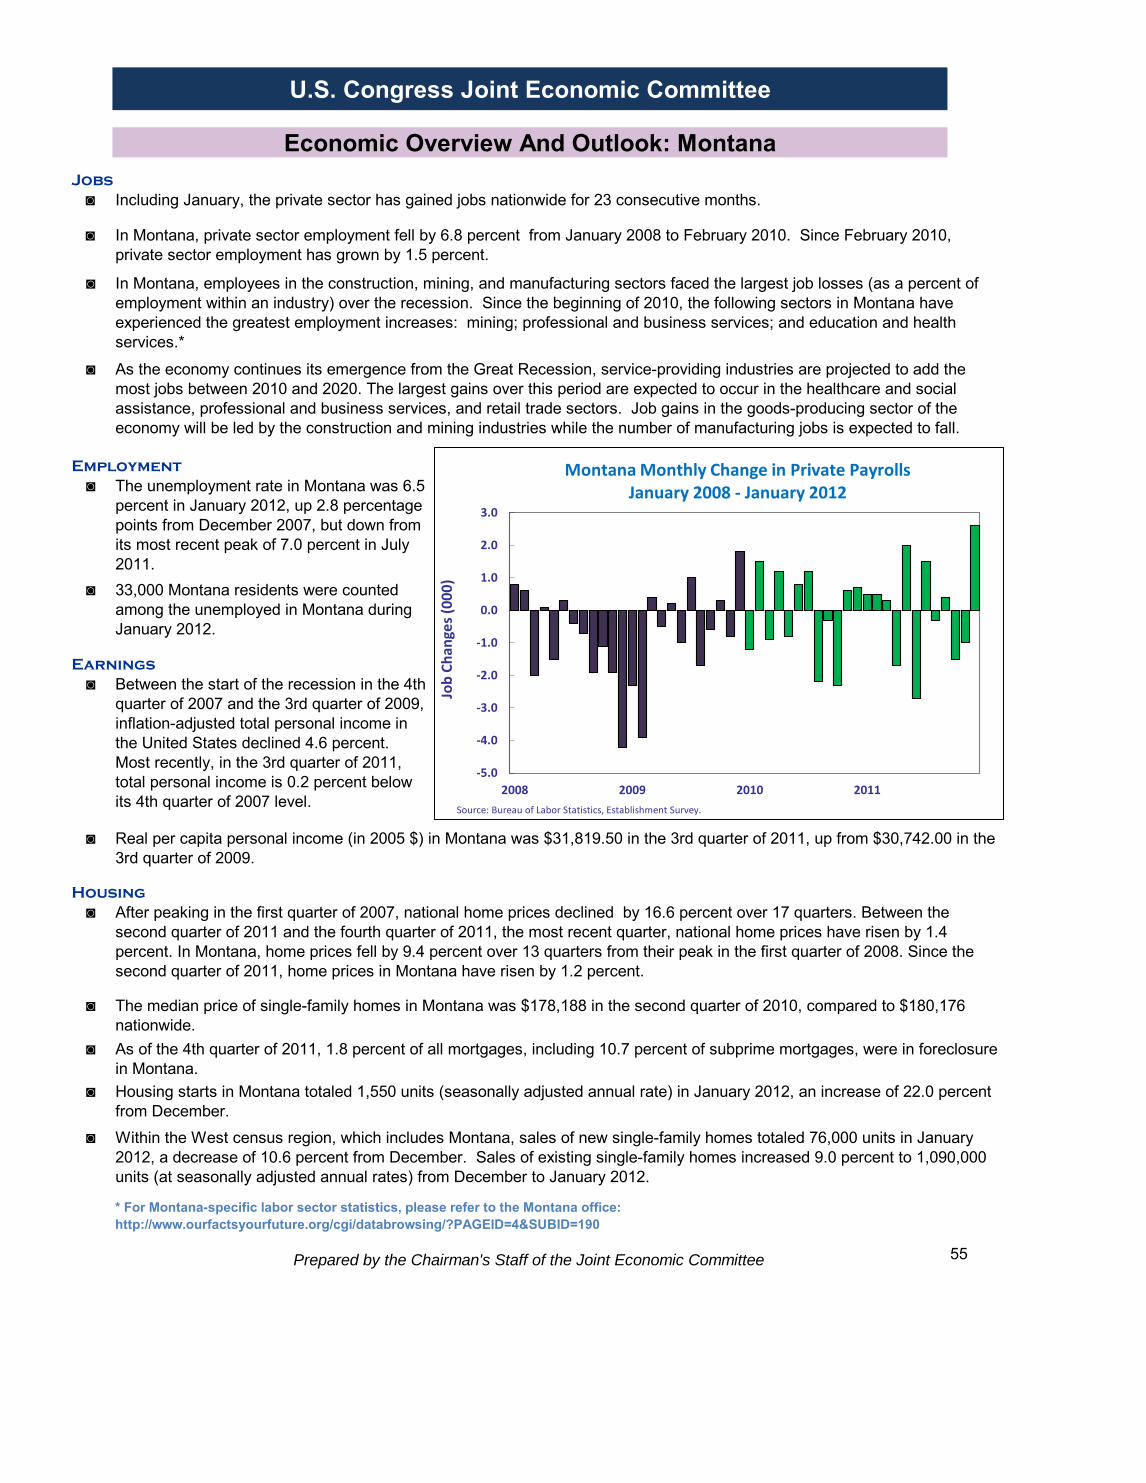
U.S. Congress Joint Economic Committee
Economic Overview And Outlook: MontanaJobs
◙
◙
◙
◙
Employment
◙
◙
Earnings
◙
◙
Housing
◙
◙
◙
◙
◙
Prepared by the Chairman's Staff of the Joint Economic Committee 55
Including January, the private sector has gained jobs nationwide for 23 consecutive months.
Within the West census region, which includes Montana, sales of new single-family homes totaled 76,000 units in January 2012, a decrease of 10.6 percent from December. Sales of existing single-family homes increased 9.0 percent to 1,090,000 units (at seasonally adjusted annual rates) from December to January 2012.
* For Montana-specific labor sector statistics, please refer to the Montana office: http://www.ourfactsyourfuture.org/cgi/databrowsing/?PAGEID=4&SUBID=190
As the economy continues its emergence from the Great Recession, service-providing industries are projected to add the most jobs between 2010 and 2020. The largest gains over this period are expected to occur in the healthcare and social assistance, professional and business services, and retail trade sectors. Job gains in the goods-producing sector of the economy will be led by the construction and mining industries while the number of manufacturing jobs is expected to fall.
In Montana, private sector employment fell by 6.8 percent from January 2008 to February 2010. Since February 2010, private sector employment has grown by 1.5 percent.
In Montana, employees in the construction, mining, and manufacturing sectors faced the largest job losses (as a percent of employment within an industry) over the recession. Since the beginning of 2010, the following sectors in Montana have experienced the greatest employment increases: mining; professional and business services; and education and health services.*
The unemployment rate in Montana was 6.5 percent in January 2012, up 2.8 percentage points from December 2007, but down from its most recent peak of 7.0 percent in July 2011.33,000 Montana residents were counted among the unemployed in Montana during January 2012.
Between the start of the recession in the 4th quarter of 2007 and the 3rd quarter of 2009, inflation-adjusted total personal income in the United States declined 4.6 percent. Most recently, in the 3rd quarter of 2011, total personal income is 0.2 percent below its 4th quarter of 2007 level.
Real per capita personal income (in 2005 $) in Montana was $31,819.50 in the 3rd quarter of 2011, up from $30,742.00 in the 3rd quarter of 2009.
After peaking in the first quarter of 2007, national home prices declined by 16.6 percent over 17 quarters. Between the second quarter of 2011 and the fourth quarter of 2011, the most recent quarter, national home prices have risen by 1.4 percent. In Montana, home prices fell by 9.4 percent over 13 quarters from their peak in the first quarter of 2008. Since the second quarter of 2011, home prices in Montana have risen by 1.2 percent.
As of the 4th quarter of 2011, 1.8 percent of all mortgages, including 10.7 percent of subprime mortgages, were in foreclosure in Montana. Housing starts in Montana totaled 1,550 units (seasonally adjusted annual rate) in January 2012, an increase of 22.0 percent from December.
The median price of single-family homes in Montana was $178,188 in the second quarter of 2010, compared to $180,176 nationwide.
-5.0
-4.0
-3.0
-2.0
-1.0
0.0
1.0
2.0
3.0
2008 2009 2010 2011
Job
Ch
ange
s (0
00
)
Source: Bureau of Labor Statistics, Establishment Survey.
Montana Monthly Change in Private Payrolls January 2008 - January 2012

How Does Montana Compare To Other States?
State Quick Facts
Montana United StatesUnemployment Rates …………………………………………..January 2009 5.3% 7.8%
January 2010 6.7% 9.7%January 2011 6.9% 9.1%January 2012 6.5% 8.3%
Percent of Population Who Are Veterans ……………….2011 13.5% 9.4%
All Veterans' Unemployment Rate ……………… 2011 7.8% 8.3%Post-9/11 Veterans' Unemployment Rate………. 2011 17.5% 12.1%
Median Household Income ………………………………..2007 45,906$ 52,823$ (2010 $) 2010 41,467$ 49,445$
Poverty Rate ………………………………………………………………..2007 13.0% 12.5%2010 14.0% 15.1%
No Health Insurance ………………………………………….2007 15.6% 15.3%2010 18.1% 16.3%
56 Prepared by the Chairman's Staff of the Joint Economic Committee
The current unemployment rate (measured along the horizontal axis) serves as a gauge of current labor market conditions faced by residents, while the proportion of jobs lost within Montana since the start of the recession (shown along the vertical axis) measures the toll the recession took on the job supply in Montana.
States falling in the upper right quadrant have lost a disproportionate share of jobs, relative to the total United States, and have unemployment rates higher than the national unemployment rate. States falling in the lower left quadrant have unemployment rates job losses (or even gains) lower than the national average.
Workers across the country were hard hit during the Great Recession. Although labor markets in many states have started recovering, employment in most states still remains below pre-recession levels. The chart below allows you to compare Montana to other states using two metrics.
United States
Montana
-15.0%
-10.0%
-5.0%
0.0%
5.0%
10.0%
15.0%
3.0% 5.0% 7.0% 9.0% 11.0% 13.0% 15.0%
Net
Jo
b L
oss
Sin
ce T
he
Rec
essi
on
Beg
an
Current Unemployment Rate Unemployment rate below national rate;
Job losses smaller than US total
Unemployment rate below national rate; Job losses larger than US total
Unemployment rate above national rate; Job losses smaller than US total
Unemployment rate above national rate; Job losses larger than US total
United States: 8.3% Unemployment; Job losses totaling 4.0%
Montana: 6.5% Unemployment; Job losses totaling 4.4%

U.S. Congress Joint Economic Committee
Economic Overview And Outlook: NebraskaJobs
◙
◙
◙
◙
Employment
◙
◙
Earnings
◙
◙
Housing
◙
◙
◙
◙
◙
Prepared by the Chairman's Staff of the Joint Economic Committee 57
Including January, the private sector has gained jobs nationwide for 23 consecutive months.
Within the Midwest census region, which includes Nebraska, sales of new single-family homes totaled 37,000 units in January 2012, a decrease of 24.5 percent from December. Sales of existing single-family homes remained steady at 920,000 units (at seasonally adjusted annual rates) from December to January 2012.
* For Nebraska-specific labor sector statistics, please refer to the Nebraska office: http://www.dol.nebraska.gov/
As the economy continues its emergence from the Great Recession, service-providing industries are projected to add the most jobs between 2010 and 2020. The largest gains over this period are expected to occur in the healthcare and social assistance, professional and business services, and retail trade sectors. Job gains in the goods-producing sector of the economy will be led by the construction and mining industries while the number of manufacturing jobs is expected to fall.
In Nebraska, private sector employment fell by 4.4 percent from January 2008 to February 2010. Since February 2010, private sector employment has grown by 1.1 percent.
In Nebraska, employees in the manufacturing, information services, and construction sectors faced the largest job losses (as a percent of employment within an industry) over the recession. Since the beginning of 2010, the following sectors in Nebraska have experienced the greatest employment increases: professional and business services; manufacturing; and education and health services.*
The unemployment rate in Nebraska was 4.0 percent in January 2012, up 1.0 percentage point from December 2007, but down from its most recent peak of 4.9 percent in February 2010.41,000 Nebraska residents were counted among the unemployed in Nebraska during January 2012.
Between the start of the recession in the 4th quarter of 2007 and the 3rd quarter of 2009, inflation-adjusted total personal income in the United States declined 4.6 percent. Most recently, in the 3rd quarter of 2011, total personal income is 0.2 percent below its 4th quarter of 2007 level.
Real per capita personal income (in 2005 $) in Nebraska was $36,346.60 in the 3rd quarter of 2011, up from $35,081.60 in the 3rd quarter of 2009.
After peaking in the first quarter of 2007, national home prices declined by 16.6 percent over 17 quarters. Between the second quarter of 2011 and the fourth quarter of 2011, the most recent quarter, national home prices have risen by 1.4 percent. In Nebraska, home prices fell by 2.5 percent over 8 quarters from their peak in the first quarter of 2008. Since the first quarter of 2010, home prices in Nebraska have risen by 1.9 percent.
As of the 4th quarter of 2011, 1.6 percent of all mortgages, including 7.8 percent of subprime mortgages, were in foreclosure in Nebraska. Housing starts in Nebraska totaled 4,670 units (seasonally adjusted annual rate) in January 2012, a decrease of 37.5 percent from December.
The median price of single-family homes in Nebraska was $120,415 in the second quarter of 2010, compared to $180,176 nationwide.
-8.0
-6.0
-4.0
-2.0
0.0
2.0
4.0
6.0
2008 2009 2010 2011
Job
Ch
ange
s (0
00
)
Source: Bureau of Labor Statistics, Establishment Survey.
Nebraska Monthly Change in Private Payrolls January 2008 - January 2012

How Does Nebraska Compare To Other States?
State Quick Facts
Nebraska United StatesUnemployment Rates …………………………………………..January 2009 4.0% 7.8%
January 2010 4.9% 9.7%January 2011 4.5% 9.1%January 2012 4.0% 8.3%
Percent of Population Who Are Veterans ……………….2011 10.1% 9.4%
All Veterans' Unemployment Rate ……………… 2011 3.9% 8.3%Post-9/11 Veterans' Unemployment Rate………. 2011 11.0% 12.1%
Median Household Income ………………………………..2007 51,709$ 52,823$ (2010 $) 2010 52,728$ 49,445$
Poverty Rate ………………………………………………………………..2007 9.9% 12.5%2010 10.2% 15.1%
No Health Insurance ………………………………………….2007 13.2% 15.3%2010 13.3% 16.3%
58 Prepared by the Chairman's Staff of the Joint Economic Committee
The current unemployment rate (measured along the horizontal axis) serves as a gauge of current labor market conditions faced by residents, while the proportion of jobs lost within Nebraska since the start of the recession (shown along the vertical axis) measures the toll the recession took on the job supply in Nebraska.
States falling in the upper right quadrant have lost a disproportionate share of jobs, relative to the total United States, and have unemployment rates higher than the national unemployment rate. States falling in the lower left quadrant have unemployment rates job losses (or even gains) lower than the national average.
Workers across the country were hard hit during the Great Recession. Although labor markets in many states have started recovering, employment in most states still remains below pre-recession levels. The chart below allows you to compare Nebraska to other states using two metrics.
United States Nebraska
-15.0%
-10.0%
-5.0%
0.0%
5.0%
10.0%
15.0%
3.0% 5.0% 7.0% 9.0% 11.0% 13.0% 15.0%
Net
Jo
b L
oss
Sin
ce T
he
Rec
essi
on
Beg
an
Current Unemployment Rate Unemployment rate below national rate;
Job losses smaller than US total
Unemployment rate below national rate; Job losses larger than US total
Unemployment rate above national rate; Job losses smaller than US total
Unemployment rate above national rate; Job losses larger than US total
United States: 8.3% Unemployment; Job losses totaling 4.0%
Nebraska: 4.0% Unemployment; Job losses totaling 1.9%

U.S. Congress Joint Economic Committee
Economic Overview And Outlook: NevadaJobs
◙
◙
◙
◙
Employment
◙
◙
Earnings
◙
◙
Housing
◙
◙
◙
◙
◙
Prepared by the Chairman's Staff of the Joint Economic Committee 59
Including January, the private sector has gained jobs nationwide for 23 consecutive months.
Within the West census region, which includes Nevada, sales of new single-family homes totaled 76,000 units in January 2012, a decrease of 10.6 percent from December. Sales of existing single-family homes increased 9.0 percent to 1,090,000 units (at seasonally adjusted annual rates) from December to January 2012.
* For Nevada-specific labor sector statistics, please refer to the Nevada office: http://www.nevadaworkforce.com/
As the economy continues its emergence from the Great Recession, service-providing industries are projected to add the most jobs between 2010 and 2020. The largest gains over this period are expected to occur in the healthcare and social assistance, professional and business services, and retail trade sectors. Job gains in the goods-producing sector of the economy will be led by the construction and mining industries while the number of manufacturing jobs is expected to fall.
In Nevada, private sector employment fell by 14.8 percent from January 2008 to February 2010. Since February 2010, private sector employment has grown by 2.5 percent.
In Nevada, employees in the construction, manufacturing, and professional and business services sectors faced the largest job losses (as a percent of employment within an industry) over the recession. Since the beginning of 2010, the following sectors in Nevada have experienced the greatest employment increases: mining; leisure and hospitality; and education and health services.*
The unemployment rate in Nevada was 12.7 percent in January 2012, up 7.5 percentage points from December 2007, but down from its most recent peak of 14.0 percent in October 2010.175,000 Nevada residents were counted among the unemployed in Nevada during January 2012.
Between the start of the recession in the 4th quarter of 2007 and the 3rd quarter of 2009, inflation-adjusted total personal income in the United States declined 4.6 percent. Most recently, in the 3rd quarter of 2011, total personal income is 0.2 percent below its 4th quarter of 2007 level.
Real per capita personal income (in 2005 $) in Nevada was $33,249.80 in the 3rd quarter of 2011, up from $32,943.50 in the 3rd quarter of 2009.
After peaking in the first quarter of 2007, national home prices declined by 16.6 percent over 17 quarters. Between the second quarter of 2011 and the fourth quarter of 2011, the most recent quarter, national home prices have risen by 1.4 percent. In Nevada, home prices fell by 53.8 percent over 20 quarters from their peak in the third quarter of 2006. Since the third quarter of 2011, home prices in Nevada have risen by 0.2 percent.
As of the 4th quarter of 2011, 7.0 percent of all mortgages, including 16.9 percent of subprime mortgages, were in foreclosure in Nevada. Housing starts in Nevada totaled 7,380 units (seasonally adjusted annual rate) in January 2012, an increase of 33.2 percent from December.
The median price of single-family homes in Nevada was $153,364 in the second quarter of 2010, compared to $180,176 nationwide.
-20.0
-15.0
-10.0
-5.0
0.0
5.0
10.0
2008 2009 2010 2011
Job
Ch
ange
s (0
00
)
Source: Bureau of Labor Statistics, Establishment Survey.
Nevada Monthly Change in Private Payrolls January 2008 - January 2012

How Does Nevada Compare To Other States?
State Quick Facts
Nevada United StatesUnemployment Rates …………………………………………..January 2009 9.6% 7.8%
January 2010 13.4% 9.7%January 2011 13.8% 9.1%January 2012 12.7% 8.3%
Percent of Population Who Are Veterans ……………….2011 11.1% 9.4%
All Veterans' Unemployment Rate ……………… 2011 13.2% 8.3%Post-9/11 Veterans' Unemployment Rate………. 2011 18.9% 12.1%
Median Household Income ………………………………..2007 56,845$ 52,823$ (2010 $) 2010 51,525$ 49,445$
Poverty Rate ………………………………………………………………..2007 9.7% 12.5%2010 16.4% 15.1%
No Health Insurance ………………………………………….2007 17.2% 15.3%2010 21.3% 16.3%
60 Prepared by the Chairman's Staff of the Joint Economic Committee
The current unemployment rate (measured along the horizontal axis) serves as a gauge of current labor market conditions faced by residents, while the proportion of jobs lost within Nevada since the start of the recession (shown along the vertical axis) measures the toll the recession took on the job supply in Nevada.
States falling in the upper right quadrant have lost a disproportionate share of jobs, relative to the total United States, and have unemployment rates higher than the national unemployment rate. States falling in the lower left quadrant have unemployment rates job losses (or even gains) lower than the national average.
Workers across the country were hard hit during the Great Recession. Although labor markets in many states have started recovering, employment in most states still remains below pre-recession levels. The chart below allows you to compare Nevada to other states using two metrics.
United States
Nevada
-15.0%
-10.0%
-5.0%
0.0%
5.0%
10.0%
15.0%
3.0% 5.0% 7.0% 9.0% 11.0% 13.0% 15.0%
Net
Jo
b L
oss
Sin
ce T
he
Rec
essi
on
Beg
an
Current Unemployment Rate Unemployment rate below national rate;
Job losses smaller than US total
Unemployment rate below national rate; Job losses larger than US total
Unemployment rate above national rate; Job losses smaller than US total
Unemployment rate above national rate; Job losses larger than US total
United States: 8.3% Unemployment; Job losses totaling 4.0%
Nevada: 12.7% Unemployment; Job losses totaling 12.4%
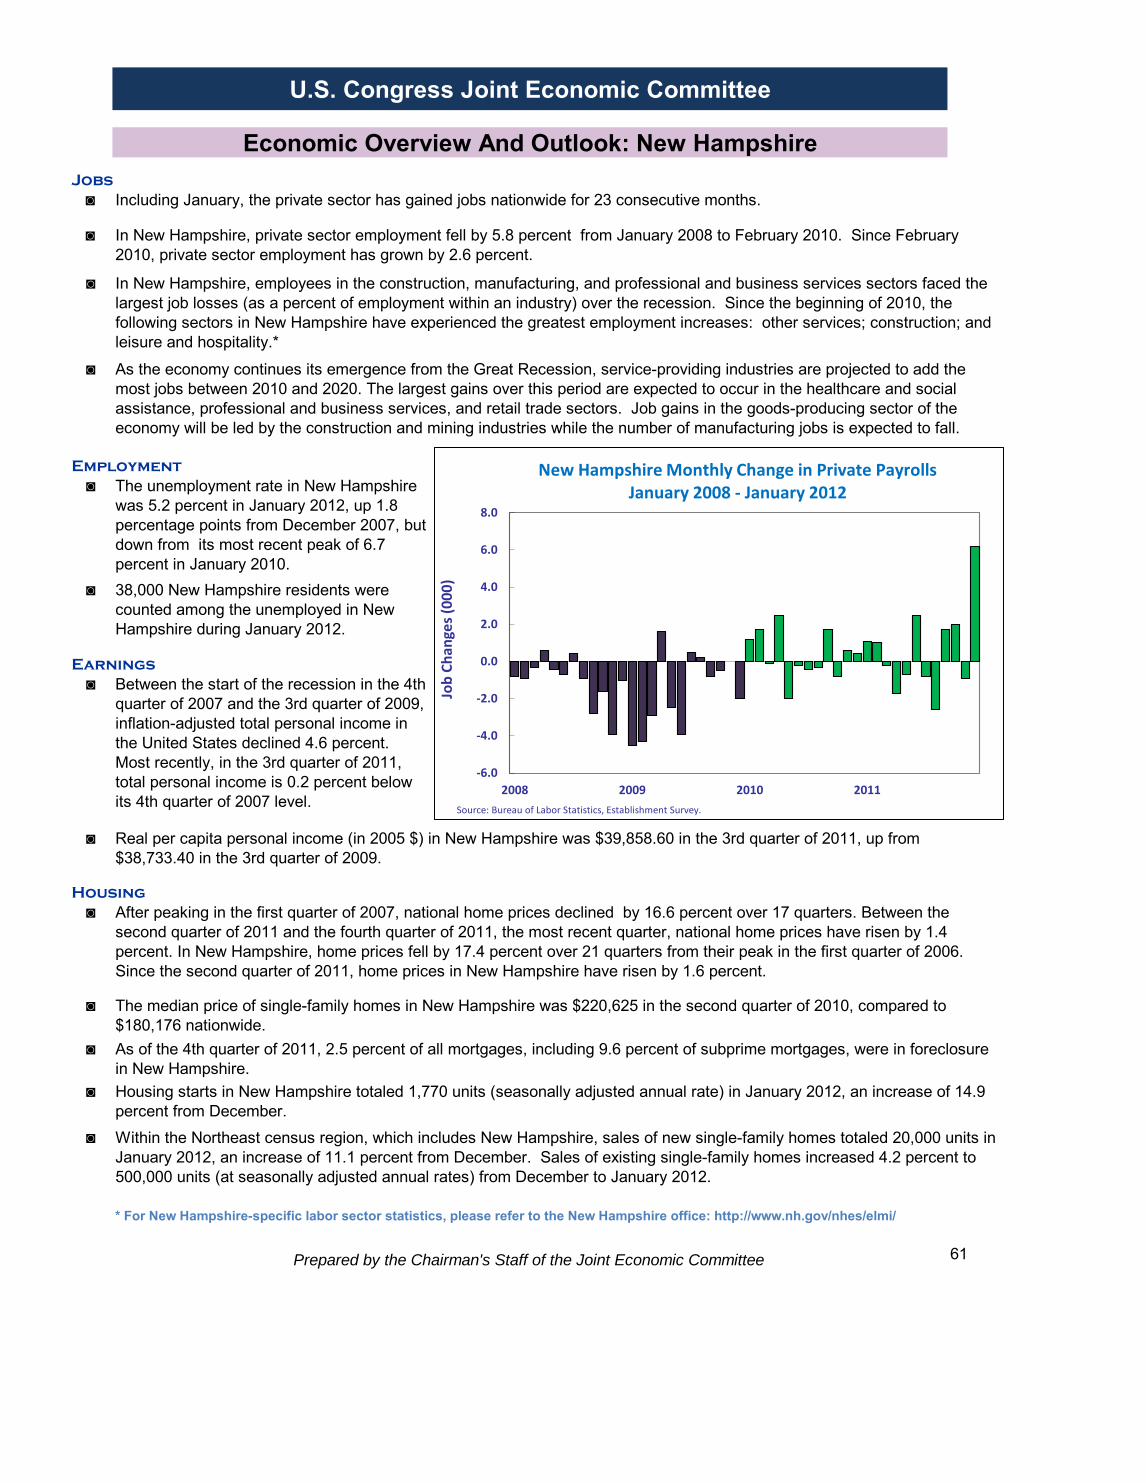
U.S. Congress Joint Economic Committee
Economic Overview And Outlook: New HampshireJobs
◙
◙
◙
◙
Employment
◙
◙
Earnings
◙
◙
Housing
◙
◙
◙
◙
◙
Prepared by the Chairman's Staff of the Joint Economic Committee 61
Including January, the private sector has gained jobs nationwide for 23 consecutive months.
Within the Northeast census region, which includes New Hampshire, sales of new single-family homes totaled 20,000 units in January 2012, an increase of 11.1 percent from December. Sales of existing single-family homes increased 4.2 percent to 500,000 units (at seasonally adjusted annual rates) from December to January 2012.
* For New Hampshire-specific labor sector statistics, please refer to the New Hampshire office: http://www.nh.gov/nhes/elmi/
As the economy continues its emergence from the Great Recession, service-providing industries are projected to add the most jobs between 2010 and 2020. The largest gains over this period are expected to occur in the healthcare and social assistance, professional and business services, and retail trade sectors. Job gains in the goods-producing sector of the economy will be led by the construction and mining industries while the number of manufacturing jobs is expected to fall.
In New Hampshire, private sector employment fell by 5.8 percent from January 2008 to February 2010. Since February 2010, private sector employment has grown by 2.6 percent.
In New Hampshire, employees in the construction, manufacturing, and professional and business services sectors faced the largest job losses (as a percent of employment within an industry) over the recession. Since the beginning of 2010, the following sectors in New Hampshire have experienced the greatest employment increases: other services; construction; and leisure and hospitality.*
The unemployment rate in New Hampshire was 5.2 percent in January 2012, up 1.8 percentage points from December 2007, but down from its most recent peak of 6.7 percent in January 2010.38,000 New Hampshire residents were counted among the unemployed in New Hampshire during January 2012.
Between the start of the recession in the 4th quarter of 2007 and the 3rd quarter of 2009, inflation-adjusted total personal income in the United States declined 4.6 percent. Most recently, in the 3rd quarter of 2011, total personal income is 0.2 percent below its 4th quarter of 2007 level.
Real per capita personal income (in 2005 $) in New Hampshire was $39,858.60 in the 3rd quarter of 2011, up from $38,733.40 in the 3rd quarter of 2009.
After peaking in the first quarter of 2007, national home prices declined by 16.6 percent over 17 quarters. Between the second quarter of 2011 and the fourth quarter of 2011, the most recent quarter, national home prices have risen by 1.4 percent. In New Hampshire, home prices fell by 17.4 percent over 21 quarters from their peak in the first quarter of 2006. Since the second quarter of 2011, home prices in New Hampshire have risen by 1.6 percent.
As of the 4th quarter of 2011, 2.5 percent of all mortgages, including 9.6 percent of subprime mortgages, were in foreclosure in New Hampshire. Housing starts in New Hampshire totaled 1,770 units (seasonally adjusted annual rate) in January 2012, an increase of 14.9 percent from December.
The median price of single-family homes in New Hampshire was $220,625 in the second quarter of 2010, compared to $180,176 nationwide.
-6.0
-4.0
-2.0
0.0
2.0
4.0
6.0
8.0
2008 2009 2010 2011
Job
Ch
ange
s (0
00
)
Source: Bureau of Labor Statistics, Establishment Survey.
New Hampshire Monthly Change in Private Payrolls January 2008 - January 2012

How Does New Hampshire Compare To Other States?
State Quick Facts
New Hampshire United StatesUnemployment Rates …………………………………………..January 2009 5.2% 7.8%
January 2010 6.7% 9.7%January 2011 5.6% 9.1%January 2012 5.2% 8.3%
Percent of Population Who Are Veterans ……………….2011 11.4% 9.4%
All Veterans' Unemployment Rate ……………… 2011 4.3% 8.3%Post-9/11 Veterans' Unemployment Rate………. 2011 8.9% 12.1%
Median Household Income ………………………………..2007 71,060$ 52,823$ (2010 $) 2010 66,707$ 49,445$
Poverty Rate ………………………………………………………………..2007 5.8% 12.5%2010 6.6% 15.1%
No Health Insurance ………………………………………….2007 10.5% 15.3%2010 10.3% 16.3%
62 Prepared by the Chairman's Staff of the Joint Economic Committee
The current unemployment rate (measured along the horizontal axis) serves as a gauge of current labor market conditions faced by residents, while the proportion of jobs lost within New Hampshire since the start of the recession (shown along the vertical axis) measures the toll the recession took on the job supply in New Hampshire.
States falling in the upper right quadrant have lost a disproportionate share of jobs, relative to the total United States, and have unemployment rates higher than the national unemployment rate. States falling in the lower left quadrant have unemployment rates job losses (or even gains) lower than the national average.
Workers across the country were hard hit during the Great Recession. Although labor markets in many states have started recovering, employment in most states still remains below pre-recession levels. The chart below allows you to compare New Hampshire to other states using two metrics.
United States New Hampshire
-15.0%
-10.0%
-5.0%
0.0%
5.0%
10.0%
15.0%
3.0% 5.0% 7.0% 9.0% 11.0% 13.0% 15.0%
Net
Jo
b L
oss
Sin
ce T
he
Rec
essi
on
Beg
an
Current Unemployment Rate Unemployment rate below national rate;
Job losses smaller than US total
Unemployment rate below national rate; Job losses larger than US total
Unemployment rate above national rate; Job losses smaller than US total
Unemployment rate above national rate; Job losses larger than US total
United States: 8.3% Unemployment; Job losses totaling 4.0%
New Hampshire: 5.2% Unemployment; Job losses totaling 2.6%

U.S. Congress Joint Economic Committee
Economic Overview And Outlook: New JerseyJobs
◙
◙
◙
◙
Employment
◙
◙
Earnings
◙
◙
Housing
◙
◙
◙
◙
◙
Prepared by the Chairman's Staff of the Joint Economic Committee 63
Including January, the private sector has gained jobs nationwide for 23 consecutive months.
Within the Northeast census region, which includes New Jersey, sales of new single-family homes totaled 20,000 units in January 2012, an increase of 11.1 percent from December. Sales of existing single-family homes increased 4.2 percent to 500,000 units (at seasonally adjusted annual rates) from December to January 2012.
* For New Jersey-specific labor sector statistics, please refer to the New Jersey office: http://lwd.dol.state.nj.us/labor/lpa/LMI_index.html
As the economy continues its emergence from the Great Recession, service-providing industries are projected to add the most jobs between 2010 and 2020. The largest gains over this period are expected to occur in the healthcare and social assistance, professional and business services, and retail trade sectors. Job gains in the goods-producing sector of the economy will be led by the construction and mining industries while the number of manufacturing jobs is expected to fall.
In New Jersey, private sector employment fell by 7.2 percent from January 2008 to February 2010. Since February 2010, private sector employment has grown by 2.1 percent.
In New Jersey, employees in the construction, manufacturing, and mining sectors faced the largest job losses (as a percent of employment within an industry) over the recession. Since the beginning of 2010, the following sectors in New Jersey have experienced the greatest employment increases: other services; education and health services; and professional and business services.*
The unemployment rate in New Jersey was 9.0 percent in January 2012, up 4.4 percentage points from December 2007, but down from its most recent peak of 9.7 percent in April 2010.412,000 New Jersey residents were counted among the unemployed in New Jersey during January 2012.
Between the start of the recession in the 4th quarter of 2007 and the 3rd quarter of 2009, inflation-adjusted total personal income in the United States declined 4.6 percent. Most recently, in the 3rd quarter of 2011, total personal income is 0.2 percent below its 4th quarter of 2007 level.
Real per capita personal income (in 2005 $) in New Jersey was $46,232.60 in the 3rd quarter of 2011, up from $45,231.80 in the 3rd quarter of 2009.
After peaking in the first quarter of 2007, national home prices declined by 16.6 percent over 17 quarters. Between the second quarter of 2011 and the fourth quarter of 2011, the most recent quarter, national home prices have risen by 1.4 percent. In New Jersey, home prices fell by 17.6 percent over 18 quarters from their peak in the first quarter of 2007. Since the third quarter of 2011, home prices in New Jersey have risen by 0.1 percent.
As of the 4th quarter of 2011, 8.2 percent of all mortgages, including 29.1 percent of subprime mortgages, were in foreclosure in New Jersey. Housing starts in New Jersey totaled 13,590 units (seasonally adjusted annual rate) in January 2012, a decrease of 6.4 percent from December.
The median price of single-family homes in New Jersey was $282,633 in the second quarter of 2010, compared to $180,176 nationwide.
-25.0
-20.0
-15.0
-10.0
-5.0
0.0
5.0
10.0
15.0
20.0
2008 2009 2010 2011
Job
Ch
ange
s (0
00
)
Source: Bureau of Labor Statistics, Establishment Survey.
New Jersey Monthly Change in Private Payrolls January 2008 - January 2012

How Does New Jersey Compare To Other States?
State Quick Facts
New Jersey United StatesUnemployment Rates …………………………………………..January 2009 7.4% 7.8%
January 2010 9.7% 9.7%January 2011 9.4% 9.1%January 2012 9.0% 8.3%
Percent of Population Who Are Veterans ……………….2011 6.5% 9.4%
All Veterans' Unemployment Rate ……………… 2011 10.7% 8.3%Post-9/11 Veterans' Unemployment Rate………. 2011 7.2% 12.1%
Median Household Income ………………………………..2007 63,628$ 52,823$ (2010 $) 2010 63,540$ 49,445$
Poverty Rate ………………………………………………………………..2007 8.7% 12.5%2010 10.7% 15.1%
No Health Insurance ………………………………………….2007 15.8% 15.3%2010 15.4% 16.3%
64 Prepared by the Chairman's Staff of the Joint Economic Committee
The current unemployment rate (measured along the horizontal axis) serves as a gauge of current labor market conditions faced by residents, while the proportion of jobs lost within New Jersey since the start of the recession (shown along the vertical axis) measures the toll the recession took on the job supply in New Jersey.
States falling in the upper right quadrant have lost a disproportionate share of jobs, relative to the total United States, and have unemployment rates higher than the national unemployment rate. States falling in the lower left quadrant have unemployment rates job losses (or even gains) lower than the national average.
Workers across the country were hard hit during the Great Recession. Although labor markets in many states have started recovering, employment in most states still remains below pre-recession levels. The chart below allows you to compare New Jersey to other states using two metrics.
United States
New Jersey
-15.0%
-10.0%
-5.0%
0.0%
5.0%
10.0%
15.0%
3.0% 5.0% 7.0% 9.0% 11.0% 13.0% 15.0%
Net
Jo
b L
oss
Sin
ce T
he
Rec
essi
on
Beg
an
Current Unemployment Rate Unemployment rate below national rate;
Job losses smaller than US total
Unemployment rate below national rate; Job losses larger than US total
Unemployment rate above national rate; Job losses smaller than US total
Unemployment rate above national rate; Job losses larger than US total
United States: 8.3% Unemployment; Job losses totaling 4.0%
New Jersey: 9.0% Unemployment; Job losses totaling 4.8%

U.S. Congress Joint Economic Committee
Economic Overview And Outlook: New MexicoJobs
◙
◙
◙
◙
Employment
◙
◙
Earnings
◙
◙
Housing
◙
◙
◙
◙
◙
Prepared by the Chairman's Staff of the Joint Economic Committee 65
Including January, the private sector has gained jobs nationwide for 23 consecutive months.
Within the West census region, which includes New Mexico, sales of new single-family homes totaled 76,000 units in January 2012, a decrease of 10.6 percent from December. Sales of existing single-family homes increased 9.0 percent to 1,090,000 units (at seasonally adjusted annual rates) from December to January 2012.
* For New Mexico-specific labor sector statistics, please refer to the New Mexico office: http://www.dws.state.nm.us/dws-lmi.html
As the economy continues its emergence from the Great Recession, service-providing industries are projected to add the most jobs between 2010 and 2020. The largest gains over this period are expected to occur in the healthcare and social assistance, professional and business services, and retail trade sectors. Job gains in the goods-producing sector of the economy will be led by the construction and mining industries while the number of manufacturing jobs is expected to fall.
In New Mexico, private sector employment fell by 7.0 percent from January 2008 to February 2010. Since February 2010, private sector employment has grown by 1.0 percent.
In New Mexico, employees in the construction, manufacturing, and mining sectors faced the largest job losses (as a percent of employment within an industry) over the recession. Since the beginning of 2010, the following sectors in New Mexico have experienced the greatest employment increases: mining; education and health services; and leisure and hospitality.*
The unemployment rate in New Mexico was 7.0 percent in January 2012, up 3.4 percentage points from December 2007, but down from its most recent peak of 8.0 percent in October 2010.65,000 New Mexico residents were counted among the unemployed in New Mexico during January 2012.
Between the start of the recession in the 4th quarter of 2007 and the 3rd quarter of 2009, inflation-adjusted total personal income in the United States declined 4.6 percent. Most recently, in the 3rd quarter of 2011, total personal income is 0.2 percent below its 4th quarter of 2007 level.
Real per capita personal income (in 2005 $) in New Mexico was $30,032.00 in the 3rd quarter of 2011, up from $29,476.10 in the 3rd quarter of 2009.
After peaking in the first quarter of 2007, national home prices declined by 16.6 percent over 17 quarters. Between the second quarter of 2011 and the fourth quarter of 2011, the most recent quarter, national home prices have risen by 1.4 percent. In New Mexico, home prices fell by 13.1 percent over 13 quarters from their peak in the first quarter of 2008. Since the second quarter of 2011, home prices in New Mexico have risen by 0.5 percent.
As of the 4th quarter of 2011, 4.0 percent of all mortgages, including 12.6 percent of subprime mortgages, were in foreclosure in New Mexico. Housing starts in New Mexico totaled 4,860 units (seasonally adjusted annual rate) in January 2012, an increase of 69.9 percent from December.
The median price of single-family homes in New Mexico was $161,176 in the second quarter of 2010, compared to $180,176 nationwide.
-14.0
-12.0
-10.0
-8.0
-6.0
-4.0
-2.0
0.0
2.0
4.0
6.0
8.0
2008 2009 2010 2011
Job
Ch
ange
s (0
00
)
Source: Bureau of Labor Statistics, Establishment Survey.
New Mexico Monthly Change in Private Payrolls January 2008 - January 2012

How Does New Mexico Compare To Other States?
State Quick Facts
New Mexico United StatesUnemployment Rates …………………………………………..January 2009 5.7% 7.8%
January 2010 7.9% 9.7%January 2011 7.7% 9.1%January 2012 7.0% 8.3%
Percent of Population Who Are Veterans ……………….2011 11.8% 9.4%
All Veterans' Unemployment Rate ……………… 2011 8.0% 8.3%Post-9/11 Veterans' Unemployment Rate………. 2011 8.9% 12.1%
Median Household Income ………………………………..2007 46,643$ 52,823$ (2010 $) 2010 45,098$ 49,445$
Poverty Rate ………………………………………………………………..2007 14.0% 12.5%2010 18.6% 15.1%
No Health Insurance ………………………………………….2007 22.5% 15.3%2010 21.6% 16.3%
66 Prepared by the Chairman's Staff of the Joint Economic Committee
The current unemployment rate (measured along the horizontal axis) serves as a gauge of current labor market conditions faced by residents, while the proportion of jobs lost within New Mexico since the start of the recession (shown along the vertical axis) measures the toll the recession took on the job supply in New Mexico.
States falling in the upper right quadrant have lost a disproportionate share of jobs, relative to the total United States, and have unemployment rates higher than the national unemployment rate. States falling in the lower left quadrant have unemployment rates job losses (or even gains) lower than the national average.
Workers across the country were hard hit during the Great Recession. Although labor markets in many states have started recovering, employment in most states still remains below pre-recession levels. The chart below allows you to compare New Mexico to other states using two metrics.
United States
New Mexico
-15.0%
-10.0%
-5.0%
0.0%
5.0%
10.0%
15.0%
3.0% 5.0% 7.0% 9.0% 11.0% 13.0% 15.0%
Net
Jo
b L
oss
Sin
ce T
he
Rec
essi
on
Beg
an
Current Unemployment Rate Unemployment rate below national rate;
Job losses smaller than US total
Unemployment rate below national rate; Job losses larger than US total
Unemployment rate above national rate; Job losses smaller than US total
Unemployment rate above national rate; Job losses larger than US total
United States: 8.3% Unemployment; Job losses totaling 4.0%
New Mexico: 7.0% Unemployment; Job losses totaling 5.6%
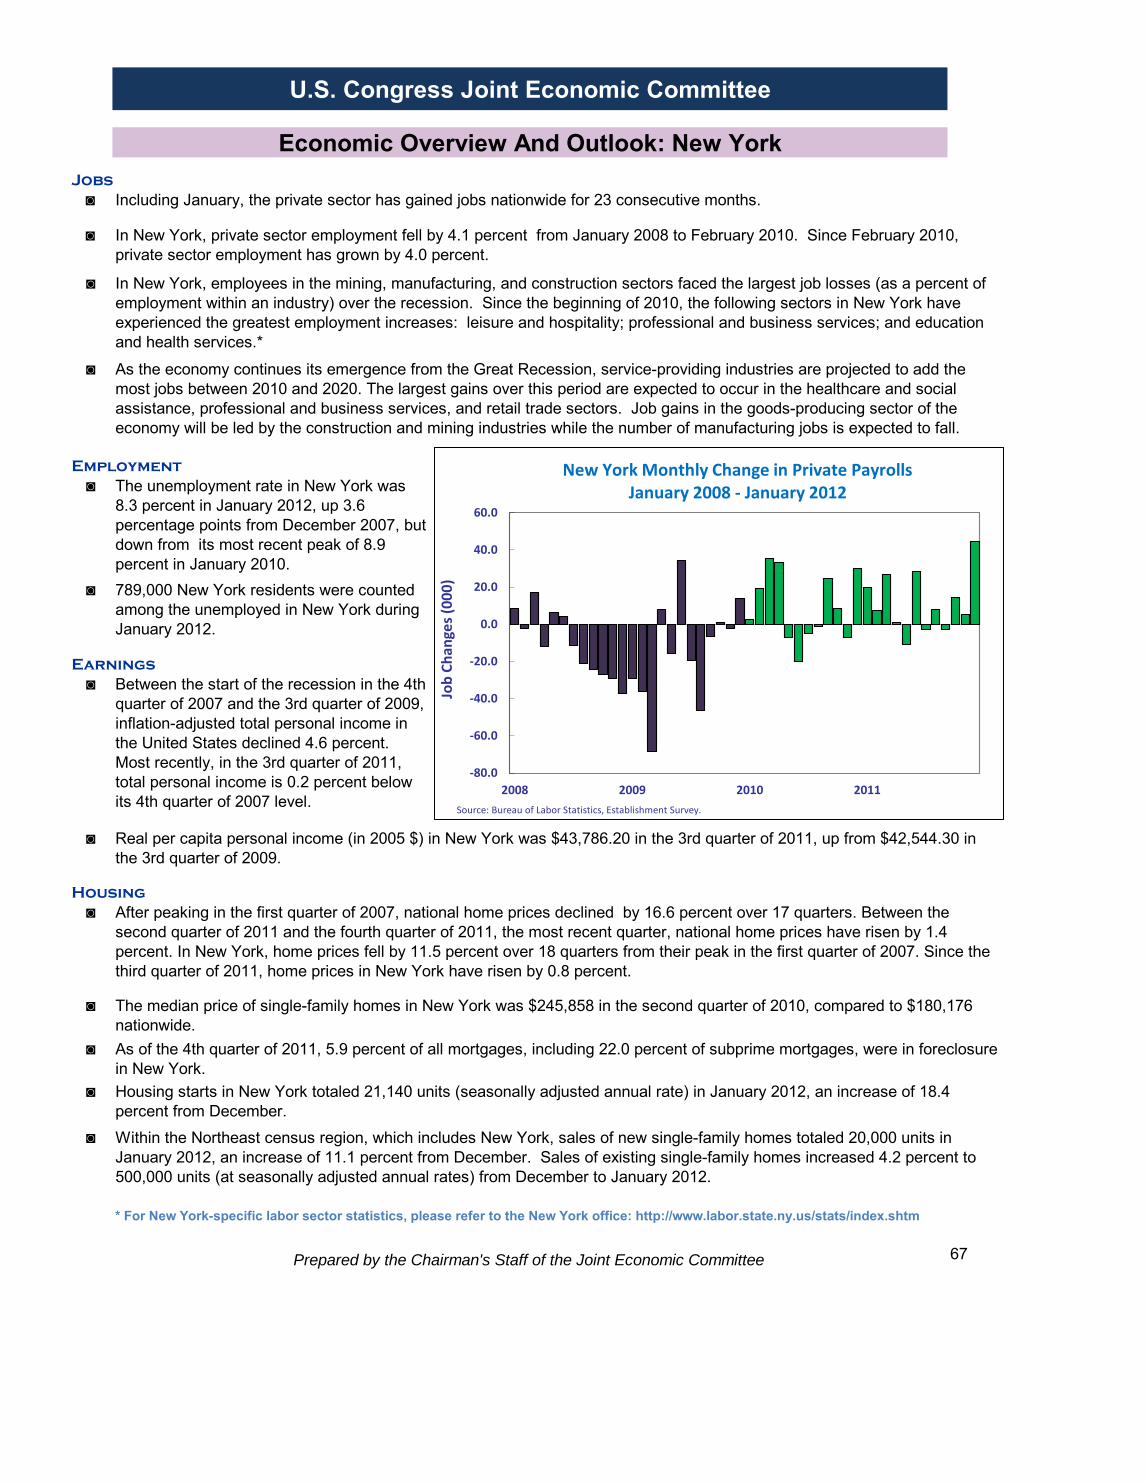
U.S. Congress Joint Economic Committee
Economic Overview And Outlook: New YorkJobs
◙
◙
◙
◙
Employment
◙
◙
Earnings
◙
◙
Housing
◙
◙
◙
◙
◙
Prepared by the Chairman's Staff of the Joint Economic Committee 67
Including January, the private sector has gained jobs nationwide for 23 consecutive months.
Within the Northeast census region, which includes New York, sales of new single-family homes totaled 20,000 units in January 2012, an increase of 11.1 percent from December. Sales of existing single-family homes increased 4.2 percent to 500,000 units (at seasonally adjusted annual rates) from December to January 2012.
* For New York-specific labor sector statistics, please refer to the New York office: http://www.labor.state.ny.us/stats/index.shtm
As the economy continues its emergence from the Great Recession, service-providing industries are projected to add the most jobs between 2010 and 2020. The largest gains over this period are expected to occur in the healthcare and social assistance, professional and business services, and retail trade sectors. Job gains in the goods-producing sector of the economy will be led by the construction and mining industries while the number of manufacturing jobs is expected to fall.
In New York, private sector employment fell by 4.1 percent from January 2008 to February 2010. Since February 2010, private sector employment has grown by 4.0 percent.
In New York, employees in the mining, manufacturing, and construction sectors faced the largest job losses (as a percent of employment within an industry) over the recession. Since the beginning of 2010, the following sectors in New York have experienced the greatest employment increases: leisure and hospitality; professional and business services; and education and health services.*
The unemployment rate in New York was 8.3 percent in January 2012, up 3.6 percentage points from December 2007, but down from its most recent peak of 8.9 percent in January 2010.789,000 New York residents were counted among the unemployed in New York during January 2012.
Between the start of the recession in the 4th quarter of 2007 and the 3rd quarter of 2009, inflation-adjusted total personal income in the United States declined 4.6 percent. Most recently, in the 3rd quarter of 2011, total personal income is 0.2 percent below its 4th quarter of 2007 level.
Real per capita personal income (in 2005 $) in New York was $43,786.20 in the 3rd quarter of 2011, up from $42,544.30 in the 3rd quarter of 2009.
After peaking in the first quarter of 2007, national home prices declined by 16.6 percent over 17 quarters. Between the second quarter of 2011 and the fourth quarter of 2011, the most recent quarter, national home prices have risen by 1.4 percent. In New York, home prices fell by 11.5 percent over 18 quarters from their peak in the first quarter of 2007. Since the third quarter of 2011, home prices in New York have risen by 0.8 percent.
As of the 4th quarter of 2011, 5.9 percent of all mortgages, including 22.0 percent of subprime mortgages, were in foreclosure in New York. Housing starts in New York totaled 21,140 units (seasonally adjusted annual rate) in January 2012, an increase of 18.4 percent from December.
The median price of single-family homes in New York was $245,858 in the second quarter of 2010, compared to $180,176 nationwide.
-80.0
-60.0
-40.0
-20.0
0.0
20.0
40.0
60.0
2008 2009 2010 2011
Job
Ch
ange
s (0
00
)
Source: Bureau of Labor Statistics, Establishment Survey.
New York Monthly Change in Private Payrolls January 2008 - January 2012

How Does New York Compare To Other States?
State Quick Facts
New York United StatesUnemployment Rates …………………………………………..January 2009 7.1% 7.8%
January 2010 8.9% 9.7%January 2011 8.2% 9.1%January 2012 8.3% 8.3%
Percent of Population Who Are Veterans ……………….2011 6.6% 9.4%
All Veterans' Unemployment Rate ……………… 2011 7.7% 8.3%Post-9/11 Veterans' Unemployment Rate………. 2011 16.7% 12.1%
Median Household Income ………………………………..2007 51,468$ 52,823$ (2010 $) 2010 49,826$ 49,445$
Poverty Rate ………………………………………………………………..2007 14.5% 12.5%2010 16.0% 15.1%
No Health Insurance ………………………………………….2007 13.2% 15.3%2010 15.0% 16.3%
68 Prepared by the Chairman's Staff of the Joint Economic Committee
The current unemployment rate (measured along the horizontal axis) serves as a gauge of current labor market conditions faced by residents, while the proportion of jobs lost within New York since the start of the recession (shown along the vertical axis) measures the toll the recession took on the job supply in New York.
States falling in the upper right quadrant have lost a disproportionate share of jobs, relative to the total United States, and have unemployment rates higher than the national unemployment rate. States falling in the lower left quadrant have unemployment rates job losses (or even gains) lower than the national average.
Workers across the country were hard hit during the Great Recession. Although labor markets in many states have started recovering, employment in most states still remains below pre-recession levels. The chart below allows you to compare New York to other states using two metrics.
United States
New York
-15.0%
-10.0%
-5.0%
0.0%
5.0%
10.0%
15.0%
3.0% 5.0% 7.0% 9.0% 11.0% 13.0% 15.0%
Net
Jo
b L
oss
Sin
ce T
he
Rec
essi
on
Beg
an
Current Unemployment Rate Unemployment rate below national rate;
Job losses smaller than US total
Unemployment rate below national rate; Job losses larger than US total
Unemployment rate above national rate; Job losses smaller than US total
Unemployment rate above national rate; Job losses larger than US total
United States: 8.3% Unemployment; Job losses totaling 4.0%
New York: 8.3% Unemployment; Job losses totaling 0.3%

U.S. Congress Joint Economic Committee
Economic Overview And Outlook: North CarolinaJobs
◙
◙
◙
◙
Employment
◙
◙
Earnings
◙
◙
Housing
◙
◙
◙
◙
◙
Prepared by the Chairman's Staff of the Joint Economic Committee 69
Including January, the private sector has gained jobs nationwide for 23 consecutive months.
Within the South census region, which includes North Carolina, sales of new single-family homes totaled 188,000 units in January 2012, an increase of 9.3 percent from December. Sales of existing single-family homes increased 2.7 percent to 1,540,000 units (at seasonally adjusted annual rates) from December to January 2012.
* For North Carolina-specific labor sector statistics, please refer to the North Carolina office: http://www.ncesc1.com/lmi/default.asp
As the economy continues its emergence from the Great Recession, service-providing industries are projected to add the most jobs between 2010 and 2020. The largest gains over this period are expected to occur in the healthcare and social assistance, professional and business services, and retail trade sectors. Job gains in the goods-producing sector of the economy will be led by the construction and mining industries while the number of manufacturing jobs is expected to fall.
In North Carolina, private sector employment fell by 9.6 percent from January 2008 to February 2010. Since February 2010, private sector employment has grown by 3.3 percent.
In North Carolina, employees in the construction, manufacturing, and mining sectors faced the largest job losses (as a percent of employment within an industry) over the recession. Since the beginning of 2010, the following sectors in North Carolina have experienced the greatest employment increases: professional and business services; trade, transportation and utilities; and leisure and hospitality.*
The unemployment rate in North Carolina was 10.2 percent in January 2012, up 5.2 percentage points from December 2007, but down from its most recent peak of 11.4 percent in February 2010.476,000 North Carolina residents were counted among the unemployed in North Carolina during January 2012.
Between the start of the recession in the 4th quarter of 2007 and the 3rd quarter of 2009, inflation-adjusted total personal income in the United States declined 4.6 percent. Most recently, in the 3rd quarter of 2011, total personal income is 0.2 percent below its 4th quarter of 2007 level.
Real per capita personal income (in 2005 $) in North Carolina was $31,411.00 in the 3rd quarter of 2011, up from $31,082.90 in the 3rd quarter of 2009.
After peaking in the first quarter of 2007, national home prices declined by 16.6 percent over 17 quarters. Between the second quarter of 2011 and the fourth quarter of 2011, the most recent quarter, national home prices have risen by 1.4 percent. In North Carolina, home prices fell by 9.9 percent over 9 quarters from their peak in the first quarter of 2009. Since the second quarter of 2011, home prices in North Carolina have risen by 0.6 percent.
As of the 4th quarter of 2011, 3.1 percent of all mortgages, including 10.2 percent of subprime mortgages, were in foreclosure in North Carolina. Housing starts in North Carolina totaled 54,370 units (seasonally adjusted annual rate) in January 2012, an increase of 77.2 percent from December.
The median price of single-family homes in North Carolina was $154,481 in the second quarter of 2010, compared to $180,176 nationwide.
-60.0
-50.0
-40.0
-30.0
-20.0
-10.0
0.0
10.0
20.0
30.0
40.0
2008 2009 2010 2011
Job
Ch
ange
s (0
00
)
Source: Bureau of Labor Statistics, Establishment Survey.
North Carolina Monthly Change in Private Payrolls January 2008 - January 2012

How Does North Carolina Compare To Other States?
State Quick Facts
North Carolina United StatesUnemployment Rates …………………………………………..January 2009 9.0% 7.8%
January 2010 11.4% 9.7%January 2011 10.5% 9.1%January 2012 10.2% 8.3%
Percent of Population Who Are Veterans ……………….2011 11.0% 9.4%
All Veterans' Unemployment Rate ……………… 2011 7.1% 8.3%Post-9/11 Veterans' Unemployment Rate………. 2011 8.9% 12.1%
Median Household Income ………………………………..2007 45,757$ 52,823$ (2010 $) 2010 43,753$ 49,445$
Poverty Rate ………………………………………………………………..2007 15.5% 12.5%2010 17.4% 15.1%
No Health Insurance ………………………………………….2007 16.4% 15.3%2010 17.0% 16.3%
70 Prepared by the Chairman's Staff of the Joint Economic Committee
The current unemployment rate (measured along the horizontal axis) serves as a gauge of current labor market conditions faced by residents, while the proportion of jobs lost within North Carolina since the start of the recession (shown along the vertical axis) measures the toll the recession took on the job supply in North Carolina.
States falling in the upper right quadrant have lost a disproportionate share of jobs, relative to the total United States, and have unemployment rates higher than the national unemployment rate. States falling in the lower left quadrant have unemployment rates job losses (or even gains) lower than the national average.
Workers across the country were hard hit during the Great Recession. Although labor markets in many states have started recovering, employment in most states still remains below pre-recession levels. The chart below allows you to compare North Carolina to other states using two metrics.
United States
North Carolina
-15.0%
-10.0%
-5.0%
0.0%
5.0%
10.0%
15.0%
3.0% 5.0% 7.0% 9.0% 11.0% 13.0% 15.0%
Net
Jo
b L
oss
Sin
ce T
he
Rec
essi
on
Beg
an
Current Unemployment Rate Unemployment rate below national rate;
Job losses smaller than US total
Unemployment rate below national rate; Job losses larger than US total
Unemployment rate above national rate; Job losses smaller than US total
Unemployment rate above national rate; Job losses larger than US total
United States: 8.3% Unemployment; Job losses totaling 4.0%
North Carolina: 10.2% Unemployment; Job losses totaling 5.4%

U.S. Congress Joint Economic Committee
Economic Overview And Outlook: North DakotaJobs
◙
◙
◙
◙
Employment
◙
◙
Earnings
◙
◙
Housing
◙
◙
◙
◙
◙
Prepared by the Chairman's Staff of the Joint Economic Committee 71
Including January, the private sector has gained jobs nationwide for 23 consecutive months.
Within the Midwest census region, which includes North Dakota, sales of new single-family homes totaled 37,000 units in January 2012, a decrease of 24.5 percent from December. Sales of existing single-family homes remained steady at 920,000 units (at seasonally adjusted annual rates) from December to January 2012.
* For North Dakota-specific labor sector statistics, please refer to the North Dakota office: http://www.jobsnd.com/
As the economy continues its emergence from the Great Recession, service-providing industries are projected to add the most jobs between 2010 and 2020. The largest gains over this period are expected to occur in the healthcare and social assistance, professional and business services, and retail trade sectors. Job gains in the goods-producing sector of the economy will be led by the construction and mining industries while the number of manufacturing jobs is expected to fall.
In North Dakota, private sector employment rose by 0.8 percent from January 2008 to February 2010. Since February 2010, private sector employment has grown by 13.4 percent.
In North Dakota, employees in the manufacturing, professional and business services, and information services sectors faced the largest job losses (as a percent of employment within an industry) over the recession. Since the beginning of 2010, the following sectors in North Dakota have experienced the greatest employment increases: mining; construction; and trade, transportation and utilities.*
The unemployment rate in North Dakota was 3.2 percent in January 2012, up 0.2 percentage point from December 2007, but down from its most recent peak of 4.2 percent in May 2009.12,000 North Dakota residents were counted among the unemployed in North Dakota during January 2012.
Between the start of the recession in the 4th quarter of 2007 and the 3rd quarter of 2009, inflation-adjusted total personal income in the United States declined 4.6 percent. Most recently, in the 3rd quarter of 2011, total personal income is 0.2 percent below its 4th quarter of 2007 level.
Real per capita personal income (in 2005 $) in North Dakota was $40,336.80 in the 3rd quarter of 2011, up from $36,397.80 in the 3rd quarter of 2009.
After peaking in the first quarter of 2007, national home prices declined by 16.6 percent over 17 quarters. Between the second quarter of 2011 and the fourth quarter of 2011, the most recent quarter, national home prices have risen by 1.4 percent. In North Dakota, home prices have risen by 1.1 percent above the previous peak set in the third quarter of 2011.
As of the 4th quarter of 2011, 1.1 percent of all mortgages, including 9.8 percent of subprime mortgages, were in foreclosure in North Dakota. Housing starts in North Dakota totaled 2,630 units (seasonally adjusted annual rate) in January 2012, a decrease of 53.1 percent from December.
The median price of single-family homes in North Dakota was $133,473 in the second quarter of 2010, compared to $180,176 nationwide.
-3.0
-2.0
-1.0
0.0
1.0
2.0
3.0
4.0
5.0
2008 2009 2010 2011
Job
Ch
ange
s (0
00
)
Source: Bureau of Labor Statistics, Establishment Survey.
North Dakota Monthly Change in Private Payrolls January 2008 - January 2012

How Does North Dakota Compare To Other States?
State Quick Facts
North Dakota United StatesUnemployment Rates …………………………………………..January 2009 3.9% 7.8%
January 2010 4.0% 9.7%January 2011 3.6% 9.1%January 2012 3.2% 8.3%
Percent of Population Who Are Veterans ……………….2011 10.6% 9.4%
All Veterans' Unemployment Rate ……………… 2011 2.0% 8.3%Post-9/11 Veterans' Unemployment Rate………. 2011 2.7% 12.1%
Median Household Income ………………………………..2007 49,639$ 52,823$ (2010 $) 2010 51,380$ 49,445$
Poverty Rate ………………………………………………………………..2007 9.3% 12.5%2010 12.2% 15.1%
No Health Insurance ………………………………………….2007 10.0% 15.3%2010 13.1% 16.3%
72 Prepared by the Chairman's Staff of the Joint Economic Committee
The current unemployment rate (measured along the horizontal axis) serves as a gauge of current labor market conditions faced by residents, while the proportion of jobs lost within North Dakota since the start of the recession (shown along the vertical axis) measures the toll the recession took on the job supply in North Dakota.
States falling in the upper right quadrant have lost a disproportionate share of jobs, relative to the total United States, and have unemployment rates higher than the national unemployment rate. States falling in the lower left quadrant have unemployment rates job losses (or even gains) lower than the national average.
Workers across the country were hard hit during the Great Recession. Although labor markets in many states have started recovering, employment in most states still remains below pre-recession levels. The chart below allows you to compare North Dakota to other states using two metrics.
United States
North Dakota
-15.0%
-10.0%
-5.0%
0.0%
5.0%
10.0%
15.0%
3.0% 5.0% 7.0% 9.0% 11.0% 13.0% 15.0%
Net
Jo
b L
oss
Sin
ce T
he
Rec
essi
on
Beg
an
Current Unemployment Rate Unemployment rate below national rate;
Job losses smaller than US total
Unemployment rate below national rate; Job losses larger than US total
Unemployment rate above national rate; Job losses smaller than US total
Unemployment rate above national rate; Job losses larger than US total
United States: 8.3% Unemployment; Job losses totaling 4.0%
North Dakota: 3.2% Unemployment; Job gains totaling 12.7%

U.S. Congress Joint Economic Committee
Economic Overview And Outlook: OhioJobs
◙
◙
◙
◙
Employment
◙
◙
Earnings
◙
◙
Housing
◙
◙
◙
◙
◙
Prepared by the Chairman's Staff of the Joint Economic Committee 73
Including January, the private sector has gained jobs nationwide for 23 consecutive months.
Within the Midwest census region, which includes Ohio, sales of new single-family homes totaled 37,000 units in January 2012, a decrease of 24.5 percent from December. Sales of existing single-family homes remained steady at 920,000 units (at seasonally adjusted annual rates) from December to January 2012.
* For Ohio-specific labor sector statistics, please refer to the Ohio office: http://lmi.state.oh.us/data.htm
As the economy continues its emergence from the Great Recession, service-providing industries are projected to add the most jobs between 2010 and 2020. The largest gains over this period are expected to occur in the healthcare and social assistance, professional and business services, and retail trade sectors. Job gains in the goods-producing sector of the economy will be led by the construction and mining industries while the number of manufacturing jobs is expected to fall.
In Ohio, private sector employment fell by 8.7 percent from January 2008 to February 2010. Since February 2010, private sector employment has grown by 3.3 percent.
In Ohio, employees in the manufacturing, construction, and professional and business services sectors faced the largest job losses (as a percent of employment within an industry) over the recession. Since the beginning of 2010, the following sectors in Ohio have experienced the greatest employment increases: professional and business services; manufacturing; and mining.*
The unemployment rate in Ohio was 7.7 percent in January 2012, up 2.0 percentage points from December 2007, but down from its most recent peak of 10.6 percent in January 2010.447,000 Ohio residents were counted among the unemployed in Ohio during January 2012.
Between the start of the recession in the 4th quarter of 2007 and the 3rd quarter of 2009, inflation-adjusted total personal income in the United States declined 4.6 percent. Most recently, in the 3rd quarter of 2011, total personal income is 0.2 percent below its 4th quarter of 2007 level.
Real per capita personal income (in 2005 $) in Ohio was $33,027.10 in the 3rd quarter of 2011, up from $31,977.00 in the 3rd quarter of 2009.
After peaking in the first quarter of 2007, national home prices declined by 16.6 percent over 17 quarters. Between the second quarter of 2011 and the fourth quarter of 2011, the most recent quarter, national home prices have risen by 1.4 percent. In Ohio, home prices fell by 10.2 percent over 17 quarters from their peak in the first quarter of 2007. Since the second quarter of 2011, home prices in Ohio have risen by 1.9 percent.
As of the 4th quarter of 2011, 4.9 percent of all mortgages, including 12.5 percent of subprime mortgages, were in foreclosure in Ohio. Housing starts in Ohio totaled 22,250 units (seasonally adjusted annual rate) in January 2012, a decrease of 33.0 percent from December.
The median price of single-family homes in Ohio was $113,730 in the second quarter of 2010, compared to $180,176 nationwide.
-60.0
-50.0
-40.0
-30.0
-20.0
-10.0
0.0
10.0
20.0
30.0
40.0
2008 2009 2010 2011
Job
Ch
ange
s (0
00
)
Source: Bureau of Labor Statistics, Establishment Survey.
Ohio Monthly Change in Private Payrolls January 2008 - January 2012

How Does Ohio Compare To Other States?
State Quick Facts
Ohio United StatesUnemployment Rates …………………………………………..January 2009 8.6% 7.8%
January 2010 10.6% 9.7%January 2011 9.0% 9.1%January 2012 7.7% 8.3%
Percent of Population Who Are Veterans ……………….2011 10.0% 9.4%
All Veterans' Unemployment Rate ……………… 2011 10.7% 8.3%Post-9/11 Veterans' Unemployment Rate………. 2011 19.4% 12.1%
Median Household Income ………………………………..2007 51,631$ 52,823$ (2010 $) 2010 46,093$ 49,445$
Poverty Rate ………………………………………………………………..2007 12.8% 12.5%2010 15.3% 15.1%
No Health Insurance ………………………………………….2007 11.7% 15.3%2010 13.7% 16.3%
74 Prepared by the Chairman's Staff of the Joint Economic Committee
The current unemployment rate (measured along the horizontal axis) serves as a gauge of current labor market conditions faced by residents, while the proportion of jobs lost within Ohio since the start of the recession (shown along the vertical axis) measures the toll the recession took on the job supply in Ohio.
States falling in the upper right quadrant have lost a disproportionate share of jobs, relative to the total United States, and have unemployment rates higher than the national unemployment rate. States falling in the lower left quadrant have unemployment rates job losses (or even gains) lower than the national average.
Workers across the country were hard hit during the Great Recession. Although labor markets in many states have started recovering, employment in most states still remains below pre-recession levels. The chart below allows you to compare Ohio to other states using two metrics.
United States
Ohio
-15.0%
-10.0%
-5.0%
0.0%
5.0%
10.0%
15.0%
3.0% 5.0% 7.0% 9.0% 11.0% 13.0% 15.0%
Net
Jo
b L
oss
Sin
ce T
he
Rec
essi
on
Beg
an
Current Unemployment Rate Unemployment rate below national rate;
Job losses smaller than US total
Unemployment rate below national rate; Job losses larger than US total
Unemployment rate above national rate; Job losses smaller than US total
Unemployment rate above national rate; Job losses larger than US total
United States: 8.3% Unemployment; Job losses totaling 4.0%
Ohio: 7.7% Unemployment; Job losses totaling 5.4%

U.S. Congress Joint Economic Committee
Economic Overview And Outlook: OklahomaJobs
◙
◙
◙
◙
Employment
◙
◙
Earnings
◙
◙
Housing
◙
◙
◙
◙
◙
Prepared by the Chairman's Staff of the Joint Economic Committee 75
Including January, the private sector has gained jobs nationwide for 23 consecutive months.
Within the South census region, which includes Oklahoma, sales of new single-family homes totaled 188,000 units in January 2012, an increase of 9.3 percent from December. Sales of existing single-family homes increased 2.7 percent to 1,540,000 units (at seasonally adjusted annual rates) from December to January 2012.
* For Oklahoma-specific labor sector statistics, please refer to the Oklahoma office: http://www.ok.gov/oesc_web/Services/Find_Labor_Market_Statistics/
As the economy continues its emergence from the Great Recession, service-providing industries are projected to add the most jobs between 2010 and 2020. The largest gains over this period are expected to occur in the healthcare and social assistance, professional and business services, and retail trade sectors. Job gains in the goods-producing sector of the economy will be led by the construction and mining industries while the number of manufacturing jobs is expected to fall.
In Oklahoma, private sector employment fell by 7.0 percent from January 2008 to February 2010. Since February 2010, private sector employment has grown by 4.8 percent.
In Oklahoma, employees in the manufacturing, mining, and professional and business services sectors faced the largest job losses (as a percent of employment within an industry) over the recession. Since the beginning of 2010, the following sectors in Oklahoma have experienced the greatest employment increases: mining; manufacturing; and professional and business services.*
The unemployment rate in Oklahoma was 6.1 percent in January 2012, up 2.5 percentage points from December 2007, but down from its most recent peak of 7.2 percent in February 2010.109,000 Oklahoma residents were counted among the unemployed in Oklahoma during January 2012.
Between the start of the recession in the 4th quarter of 2007 and the 3rd quarter of 2009, inflation-adjusted total personal income in the United States declined 4.6 percent. Most recently, in the 3rd quarter of 2011, total personal income is 0.2 percent below its 4th quarter of 2007 level.
Real per capita personal income (in 2005 $) in Oklahoma was $32,459.80 in the 3rd quarter of 2011, up from $30,625.10 in the 3rd quarter of 2009.
After peaking in the first quarter of 2007, national home prices declined by 16.6 percent over 17 quarters. Between the second quarter of 2011 and the fourth quarter of 2011, the most recent quarter, national home prices have risen by 1.4 percent. In Oklahoma, home prices fell by 3.1 percent over 10 quarters from their peak in the first quarter of 2009. Since the third quarter of 2011, home prices in Oklahoma have risen by 1.7 percent.
As of the 4th quarter of 2011, 3.2 percent of all mortgages, including 10.1 percent of subprime mortgages, were in foreclosure in Oklahoma. Housing starts in Oklahoma totaled 10,330 units (seasonally adjusted annual rate) in January 2012, an increase of 37.5 percent from December.
The median price of single-family homes in Oklahoma was $118,771 in the second quarter of 2010, compared to $180,176 nationwide.
-20.0
-15.0
-10.0
-5.0
0.0
5.0
10.0
15.0
2008 2009 2010 2011
Job
Ch
ange
s (0
00
)
Source: Bureau of Labor Statistics, Establishment Survey.
Oklahoma Monthly Change in Private Payrolls January 2008 - January 2012

How Does Oklahoma Compare To Other States?
State Quick Facts
Oklahoma United StatesUnemployment Rates …………………………………………..January 2009 5.2% 7.8%
January 2010 7.2% 9.7%January 2011 6.2% 9.1%January 2012 6.1% 8.3%
Percent of Population Who Are Veterans ……………….2011 11.4% 9.4%
All Veterans' Unemployment Rate ……………… 2011 5.3% 8.3%Post-9/11 Veterans' Unemployment Rate………. 2011 8.9% 12.1%
Median Household Income ………………………………..2007 45,444$ 52,823$ (2010 $) 2010 43,400$ 49,445$
Poverty Rate ………………………………………………………………..2007 13.4% 12.5%2010 16.3% 15.1%
No Health Insurance ………………………………………….2007 17.8% 15.3%2010 17.0% 16.3%
76 Prepared by the Chairman's Staff of the Joint Economic Committee
The current unemployment rate (measured along the horizontal axis) serves as a gauge of current labor market conditions faced by residents, while the proportion of jobs lost within Oklahoma since the start of the recession (shown along the vertical axis) measures the toll the recession took on the job supply in Oklahoma.
States falling in the upper right quadrant have lost a disproportionate share of jobs, relative to the total United States, and have unemployment rates higher than the national unemployment rate. States falling in the lower left quadrant have unemployment rates job losses (or even gains) lower than the national average.
Workers across the country were hard hit during the Great Recession. Although labor markets in many states have started recovering, employment in most states still remains below pre-recession levels. The chart below allows you to compare Oklahoma to other states using two metrics.
United States
Oklahoma
-15.0%
-10.0%
-5.0%
0.0%
5.0%
10.0%
15.0%
3.0% 5.0% 7.0% 9.0% 11.0% 13.0% 15.0%
Net
Jo
b L
oss
Sin
ce T
he
Rec
essi
on
Beg
an
Current Unemployment Rate Unemployment rate below national rate;
Job losses smaller than US total
Unemployment rate below national rate; Job losses larger than US total
Unemployment rate above national rate; Job losses smaller than US total
Unemployment rate above national rate; Job losses larger than US total
United States: 8.3% Unemployment; Job losses totaling 4.0%
Oklahoma: 6.1% Unemployment; Job losses totaling 0.6%

U.S. Congress Joint Economic Committee
Economic Overview And Outlook: OregonJobs
◙
◙
◙
◙
Employment
◙
◙
Earnings
◙
◙
Housing
◙
◙
◙
◙
◙
Prepared by the Chairman's Staff of the Joint Economic Committee 77
Including January, the private sector has gained jobs nationwide for 23 consecutive months.
Within the West census region, which includes Oregon, sales of new single-family homes totaled 76,000 units in January 2012, a decrease of 10.6 percent from December. Sales of existing single-family homes increased 9.0 percent to 1,090,000 units (at seasonally adjusted annual rates) from December to January 2012.
* For Oregon-specific labor sector statistics, please refer to the Oregon office: http://www.qualityinfo.org/olmisj/OlmisZine
As the economy continues its emergence from the Great Recession, service-providing industries are projected to add the most jobs between 2010 and 2020. The largest gains over this period are expected to occur in the healthcare and social assistance, professional and business services, and retail trade sectors. Job gains in the goods-producing sector of the economy will be led by the construction and mining industries while the number of manufacturing jobs is expected to fall.
In Oregon, private sector employment fell by 10.4 percent from January 2008 to February 2010. Since February 2010, private sector employment has grown by 3.0 percent.
In Oregon, employees in the construction, mining, and manufacturing sectors faced the largest job losses (as a percent of employment within an industry) over the recession. Since the beginning of 2010, the following sectors in Oregon have experienced the greatest employment increases: mining; education and health services; and professional and business services.*
The unemployment rate in Oregon was 8.8 percent in January 2012, up 3.6 percentage points from December 2007, but down from its most recent peak of 11.6 percent in June 2009.176,000 Oregon residents were counted among the unemployed in Oregon during January 2012.
Between the start of the recession in the 4th quarter of 2007 and the 3rd quarter of 2009, inflation-adjusted total personal income in the United States declined 4.6 percent. Most recently, in the 3rd quarter of 2011, total personal income is 0.2 percent below its 4th quarter of 2007 level.
Real per capita personal income (in 2005 $) in Oregon was $33,205.70 in the 3rd quarter of 2011, up from $32,249.90 in the 3rd quarter of 2009.
After peaking in the first quarter of 2007, national home prices declined by 16.6 percent over 17 quarters. Between the second quarter of 2011 and the fourth quarter of 2011, the most recent quarter, national home prices have risen by 1.4 percent. In Oregon, home prices fell by 23.6 percent over 14 quarters from their peak in the fourth quarter of 2007. Since the second quarter of 2011, home prices in Oregon have risen by 1.9 percent.
As of the 4th quarter of 2011, 3.6 percent of all mortgages, including 14.5 percent of subprime mortgages, were in foreclosure in Oregon. Housing starts in Oregon totaled 11,050 units (seasonally adjusted annual rate) in January 2012, an increase of 50.8 percent from December.
The median price of single-family homes in Oregon was $206,977 in the second quarter of 2010, compared to $180,176 nationwide.
-20.0
-15.0
-10.0
-5.0
0.0
5.0
10.0
2008 2009 2010 2011
Job
Ch
ange
s (0
00
)
Source: Bureau of Labor Statistics, Establishment Survey.
Oregon Monthly Change in Private Payrolls January 2008 - January 2012

How Does Oregon Compare To Other States?
State Quick Facts
Oregon United StatesUnemployment Rates …………………………………………..January 2009 9.9% 7.8%
January 2010 11.0% 9.7%January 2011 9.9% 9.1%January 2012 8.8% 8.3%
Percent of Population Who Are Veterans ……………….2011 10.8% 9.4%
All Veterans' Unemployment Rate ……………… 2011 11.5% 8.3%Post-9/11 Veterans' Unemployment Rate………. 2011 24.1% 12.1%
Median Household Income ………………………………..2007 52,826$ 52,823$ (2010 $) 2010 50,526$ 49,445$
Poverty Rate ………………………………………………………………..2007 12.8% 12.5%2010 14.2% 15.1%
No Health Insurance ………………………………………….2007 16.8% 15.3%2010 16.2% 16.3%
78 Prepared by the Chairman's Staff of the Joint Economic Committee
The current unemployment rate (measured along the horizontal axis) serves as a gauge of current labor market conditions faced by residents, while the proportion of jobs lost within Oregon since the start of the recession (shown along the vertical axis) measures the toll the recession took on the job supply in Oregon.
States falling in the upper right quadrant have lost a disproportionate share of jobs, relative to the total United States, and have unemployment rates higher than the national unemployment rate. States falling in the lower left quadrant have unemployment rates job losses (or even gains) lower than the national average.
Workers across the country were hard hit during the Great Recession. Although labor markets in many states have started recovering, employment in most states still remains below pre-recession levels. The chart below allows you to compare Oregon to other states using two metrics.
United States
Oregon
-15.0%
-10.0%
-5.0%
0.0%
5.0%
10.0%
15.0%
3.0% 5.0% 7.0% 9.0% 11.0% 13.0% 15.0%
Net
Jo
b L
oss
Sin
ce T
he
Rec
essi
on
Beg
an
Current Unemployment Rate Unemployment rate below national rate;
Job losses smaller than US total
Unemployment rate below national rate; Job losses larger than US total
Unemployment rate above national rate; Job losses smaller than US total
Unemployment rate above national rate; Job losses larger than US total
United States: 8.3% Unemployment; Job losses totaling 4.0%
Oregon: 8.8% Unemployment; Job losses totaling 6.5%

U.S. Congress Joint Economic Committee
Economic Overview And Outlook: PennsylvaniaJobs
◙
◙
◙
◙
Employment
◙
◙
Earnings
◙
◙
Housing
◙
◙
◙
◙
◙
Prepared by the Chairman's Staff of the Joint Economic Committee 79
Including January, the private sector has gained jobs nationwide for 23 consecutive months.
Within the Northeast census region, which includes Pennsylvania, sales of new single-family homes totaled 20,000 units in January 2012, an increase of 11.1 percent from December. Sales of existing single-family homes increased 4.2 percent to 500,000 units (at seasonally adjusted annual rates) from December to January 2012.
* For Pennsylvania-specific labor sector statistics, please refer to the Pennsylvania office: http://www.paworkstats.state.pa.us/
As the economy continues its emergence from the Great Recession, service-providing industries are projected to add the most jobs between 2010 and 2020. The largest gains over this period are expected to occur in the healthcare and social assistance, professional and business services, and retail trade sectors. Job gains in the goods-producing sector of the economy will be led by the construction and mining industries while the number of manufacturing jobs is expected to fall.
In Pennsylvania, private sector employment fell by 5.1 percent from January 2008 to February 2010. Since February 2010, private sector employment has grown by 3.3 percent.
In Pennsylvania, employees in the construction, manufacturing, and information services sectors faced the largest job losses (as a percent of employment within an industry) over the recession. Since the beginning of 2010, the following sectors in Pennsylvania have experienced the greatest employment increases: mining; construction; and leisure and hospitality.*
The unemployment rate in Pennsylvania was 7.6 percent in January 2012, up 3.0 percentage points from December 2007, but down from its most recent peak of 8.7 percent in March 2010.485,000 Pennsylvania residents were counted among the unemployed in Pennsylvania during January 2012.
Between the start of the recession in the 4th quarter of 2007 and the 3rd quarter of 2009, inflation-adjusted total personal income in the United States declined 4.6 percent. Most recently, in the 3rd quarter of 2011, total personal income is 0.2 percent below its 4th quarter of 2007 level.
Real per capita personal income (in 2005 $) in Pennsylvania was $36,942.40 in the 3rd quarter of 2011, up from $35,791.50 in the 3rd quarter of 2009.
After peaking in the first quarter of 2007, national home prices declined by 16.6 percent over 17 quarters. Between the second quarter of 2011 and the fourth quarter of 2011, the most recent quarter, national home prices have risen by 1.4 percent. In Pennsylvania, home prices fell by 7.2 percent over 14 quarters from their peak in the first quarter of 2008. Since the third quarter of 2011, home prices in Pennsylvania have risen by 0.4 percent.
As of the 4th quarter of 2011, 3.4 percent of all mortgages, including 12.0 percent of subprime mortgages, were in foreclosure in Pennsylvania. Housing starts in Pennsylvania totaled 19,940 units (seasonally adjusted annual rate) in January 2012, an increase of 60.8 percent from December.
The median price of single-family homes in Pennsylvania was $153,439 in the second quarter of 2010, compared to $180,176 nationwide.
-40.0
-30.0
-20.0
-10.0
0.0
10.0
20.0
30.0
2008 2009 2010 2011
Job
Ch
ange
s (0
00
)
Source: Bureau of Labor Statistics, Establishment Survey.
Pennsylvania Monthly Change in Private Payrolls January 2008 - January 2012

How Does Pennsylvania Compare To Other States?
State Quick Facts
Pennsylvania United StatesUnemployment Rates …………………………………………..January 2009 6.8% 7.8%
January 2010 8.6% 9.7%January 2011 8.0% 9.1%January 2012 7.6% 8.3%
Percent of Population Who Are Veterans ……………….2011 10.1% 9.4%
All Veterans' Unemployment Rate ……………… 2011 7.3% 8.3%Post-9/11 Veterans' Unemployment Rate………. 2011 9.0% 12.1%
Median Household Income ………………………………..2007 50,934$ 52,823$ (2010 $) 2010 48,460$ 49,445$
Poverty Rate ………………………………………………………………..2007 10.4% 12.5%2010 12.2% 15.1%
No Health Insurance ………………………………………….2007 9.5% 15.3%2010 11.0% 16.3%
80 Prepared by the Chairman's Staff of the Joint Economic Committee
The current unemployment rate (measured along the horizontal axis) serves as a gauge of current labor market conditions faced by residents, while the proportion of jobs lost within Pennsylvania since the start of the recession (shown along the vertical axis) measures the toll the recession took on the job supply in Pennsylvania.
States falling in the upper right quadrant have lost a disproportionate share of jobs, relative to the total United States, and have unemployment rates higher than the national unemployment rate. States falling in the lower left quadrant have unemployment rates job losses (or even gains) lower than the national average.
Workers across the country were hard hit during the Great Recession. Although labor markets in many states have started recovering, employment in most states still remains below pre-recession levels. The chart below allows you to compare Pennsylvania to other states using two metrics.
United States Pennsylvania
-15.0%
-10.0%
-5.0%
0.0%
5.0%
10.0%
15.0%
3.0% 5.0% 7.0% 9.0% 11.0% 13.0% 15.0%
Net
Jo
b L
oss
Sin
ce T
he
Rec
essi
on
Beg
an
Current Unemployment Rate Unemployment rate below national rate;
Job losses smaller than US total
Unemployment rate below national rate; Job losses larger than US total
Unemployment rate above national rate; Job losses smaller than US total
Unemployment rate above national rate; Job losses larger than US total
United States: 8.3% Unemployment; Job losses totaling 4.0%
Pennsylvania: 7.6% Unemployment; Job losses totaling 1.9%

U.S. Congress Joint Economic Committee
Economic Overview And Outlook: Rhode IslandJobs
◙
◙
◙
◙
Employment
◙
◙
Earnings
◙
◙
Housing
◙
◙
◙
◙
◙
Prepared by the Chairman's Staff of the Joint Economic Committee 81
Including January, the private sector has gained jobs nationwide for 23 consecutive months.
Within the Northeast census region, which includes Rhode Island, sales of new single-family homes totaled 20,000 units in January 2012, an increase of 11.1 percent from December. Sales of existing single-family homes increased 4.2 percent to 500,000 units (at seasonally adjusted annual rates) from December to January 2012.
* For Rhode Island-specific labor sector statistics, please refer to the Rhode Island office: http://www.dlt.ri.gov/lmi/news/lfrelease.htm
As the economy continues its emergence from the Great Recession, service-providing industries are projected to add the most jobs between 2010 and 2020. The largest gains over this period are expected to occur in the healthcare and social assistance, professional and business services, and retail trade sectors. Job gains in the goods-producing sector of the economy will be led by the construction and mining industries while the number of manufacturing jobs is expected to fall.
In Rhode Island, private sector employment fell by 6.8 percent from January 2008 to February 2010. Since February 2010, private sector employment has grown by 0.6 percent.
In Rhode Island, employees in the construction, manufacturing, and trade, transportation and utilities sectors faced the largest job losses (as a percent of employment within an industry) over the recession. Since the beginning of 2010, the following sectors in Rhode Island have experienced the greatest employment increases: professional and business services; education and health services; and manufacturing.*
The unemployment rate in Rhode Island was 10.9 percent in January 2012, up 4.9 percentage points from December 2007, but down from its most recent peak of 11.9 percent in January 2010.61,000 Rhode Island residents were counted among the unemployed in Rhode Island during January 2012.
Between the start of the recession in the 4th quarter of 2007 and the 3rd quarter of 2009, inflation-adjusted total personal income in the United States declined 4.6 percent. Most recently, in the 3rd quarter of 2011, total personal income is 0.2 percent below its 4th quarter of 2007 level.
Real per capita personal income (in 2005 $) in Rhode Island was $38,501.80 in the 3rd quarter of 2011, up from $37,111.10 in the 3rd quarter of 2009.
After peaking in the first quarter of 2007, national home prices declined by 16.6 percent over 17 quarters. Between the second quarter of 2011 and the fourth quarter of 2011, the most recent quarter, national home prices have risen by 1.4 percent. In Rhode Island, home prices fell by 23.2 percent over 20 quarters from their peak in the second quarter of 2006. Since the second quarter of 2011, home prices in Rhode Island have risen by 0.7 percent.
As of the 4th quarter of 2011, 3.6 percent of all mortgages, including 12.4 percent of subprime mortgages, were in foreclosure in Rhode Island. Housing starts in Rhode Island totaled 700 units (seasonally adjusted annual rate) in January 2012, an increase of 11.1 percent from December.
The median price of single-family homes in Rhode Island was $230,354 in the second quarter of 2010, compared to $180,176 nationwide.
-5.0
-4.0
-3.0
-2.0
-1.0
0.0
1.0
2.0
3.0
2008 2009 2010 2011
Job
Ch
ange
s (0
00
)
Source: Bureau of Labor Statistics, Establishment Survey.
Rhode Island Monthly Change in Private Payrolls January 2008 - January 2012

How Does Rhode Island Compare To Other States?
State Quick Facts
Rhode Island United StatesUnemployment Rates …………………………………………..January 2009 9.7% 7.8%
January 2010 11.9% 9.7%January 2011 11.4% 9.1%January 2012 10.9% 8.3%
Percent of Population Who Are Veterans ……………….2011 8.7% 9.4%
All Veterans' Unemployment Rate ……………… 2011 14.6% 8.3%Post-9/11 Veterans' Unemployment Rate………. 2011 16.8% 12.1%
Median Household Income ………………………………..2007 57,005$ 52,823$ (2010 $) 2010 51,914$ 49,445$
Poverty Rate ………………………………………………………………..2007 9.5% 12.5%2010 13.6% 15.1%
No Health Insurance ………………………………………….2007 10.8% 15.3%2010 11.4% 16.3%
82 Prepared by the Chairman's Staff of the Joint Economic Committee
The current unemployment rate (measured along the horizontal axis) serves as a gauge of current labor market conditions faced by residents, while the proportion of jobs lost within Rhode Island since the start of the recession (shown along the vertical axis) measures the toll the recession took on the job supply in Rhode Island.
States falling in the upper right quadrant have lost a disproportionate share of jobs, relative to the total United States, and have unemployment rates higher than the national unemployment rate. States falling in the lower left quadrant have unemployment rates job losses (or even gains) lower than the national average.
Workers across the country were hard hit during the Great Recession. Although labor markets in many states have started recovering, employment in most states still remains below pre-recession levels. The chart below allows you to compare Rhode Island to other states using two metrics.
United States
Rhode Island
-15.0%
-10.0%
-5.0%
0.0%
5.0%
10.0%
15.0%
3.0% 5.0% 7.0% 9.0% 11.0% 13.0% 15.0%
Net
Jo
b L
oss
Sin
ce T
he
Rec
essi
on
Beg
an
Current Unemployment Rate Unemployment rate below national rate;
Job losses smaller than US total
Unemployment rate below national rate; Job losses larger than US total
Unemployment rate above national rate; Job losses smaller than US total
Unemployment rate above national rate; Job losses larger than US total
United States: 8.3% Unemployment; Job losses totaling 4.0%
Rhode Island: 10.9% Unemployment; Job losses totaling 6.4%

U.S. Congress Joint Economic Committee
Economic Overview And Outlook: South CarolinaJobs
◙
◙
◙
◙
Employment
◙
◙
Earnings
◙
◙
Housing
◙
◙
◙
◙
◙
Prepared by the Chairman's Staff of the Joint Economic Committee 83
Including January, the private sector has gained jobs nationwide for 23 consecutive months.
Within the South census region, which includes South Carolina, sales of new single-family homes totaled 188,000 units in January 2012, an increase of 9.3 percent from December. Sales of existing single-family homes increased 2.7 percent to 1,540,000 units (at seasonally adjusted annual rates) from December to January 2012.
* For South Carolina-specific labor sector statistics, please refer to the South Carolina office: http://www.sces.org/lmi/news/news.asp
As the economy continues its emergence from the Great Recession, service-providing industries are projected to add the most jobs between 2010 and 2020. The largest gains over this period are expected to occur in the healthcare and social assistance, professional and business services, and retail trade sectors. Job gains in the goods-producing sector of the economy will be led by the construction and mining industries while the number of manufacturing jobs is expected to fall.
In South Carolina, private sector employment fell by 10.1 percent from January 2008 to February 2010. Since February 2010, private sector employment has grown by 4.1 percent.
In South Carolina, employees in the construction, manufacturing, and professional and business services sectors faced the largest job losses (as a percent of employment within an industry) over the recession. Since the beginning of 2010, the following sectors in South Carolina have experienced the greatest employment increases: professional and business services; manufacturing; and leisure and hospitality.*
The unemployment rate in South Carolina was 9.3 percent in January 2012, up 3.8 percentage points from December 2007, but down from its most recent peak of 12.0 percent in December 2009.200,000 South Carolina residents were counted among the unemployed in South Carolina during January 2012.
Between the start of the recession in the 4th quarter of 2007 and the 3rd quarter of 2009, inflation-adjusted total personal income in the United States declined 4.6 percent. Most recently, in the 3rd quarter of 2011, total personal income is 0.2 percent below its 4th quarter of 2007 level.
Real per capita personal income (in 2005 $) in South Carolina was $29,340.50 in the 3rd quarter of 2011, up from $28,727.90 in the 3rd quarter of 2009.
After peaking in the first quarter of 2007, national home prices declined by 16.6 percent over 17 quarters. Between the second quarter of 2011 and the fourth quarter of 2011, the most recent quarter, national home prices have risen by 1.4 percent. In South Carolina, home prices fell by 10.9 percent over 13 quarters from their peak in the first quarter of 2008. Since the second quarter of 2011, home prices in South Carolina have risen by 1.4 percent.
As of the 4th quarter of 2011, 4.6 percent of all mortgages, including 13.5 percent of subprime mortgages, were in foreclosure in South Carolina. Housing starts in South Carolina totaled 18,330 units (seasonally adjusted annual rate) in January 2012, a decrease of 5.0 percent from December.
The median price of single-family homes in South Carolina was $135,855 in the second quarter of 2010, compared to $180,176 nationwide.
-25.0
-20.0
-15.0
-10.0
-5.0
0.0
5.0
10.0
15.0
20.0
2008 2009 2010 2011
Job
Ch
ange
s (0
00
)
Source: Bureau of Labor Statistics, Establishment Survey.
South Carolina Monthly Change in Private Payrolls January 2008 - January 2012

How Does South Carolina Compare To Other States?
State Quick Facts
South Carolina United StatesUnemployment Rates …………………………………………..January 2009 10.0% 7.8%
January 2010 11.9% 9.7%January 2011 10.6% 9.1%January 2012 9.3% 8.3%
Percent of Population Who Are Veterans ……………….2011 10.5% 9.4%
All Veterans' Unemployment Rate ……………… 2011 7.3% 8.3%Post-9/11 Veterans' Unemployment Rate………. 2011 13.2% 12.1%
Median Household Income ………………………………..2007 46,493$ 52,823$ (2010 $) 2010 41,709$ 49,445$
Poverty Rate ………………………………………………………………..2007 14.1% 12.5%2010 17.0% 15.1%
No Health Insurance ………………………………………….2007 16.4% 15.3%2010 20.6% 16.3%
84 Prepared by the Chairman's Staff of the Joint Economic Committee
The current unemployment rate (measured along the horizontal axis) serves as a gauge of current labor market conditions faced by residents, while the proportion of jobs lost within South Carolina since the start of the recession (shown along the vertical axis) measures the toll the recession took on the job supply in South Carolina.
States falling in the upper right quadrant have lost a disproportionate share of jobs, relative to the total United States, and have unemployment rates higher than the national unemployment rate. States falling in the lower left quadrant have unemployment rates job losses (or even gains) lower than the national average.
Workers across the country were hard hit during the Great Recession. Although labor markets in many states have started recovering, employment in most states still remains below pre-recession levels. The chart below allows you to compare South Carolina to other states using two metrics.
United States
South Carolina
-15.0%
-10.0%
-5.0%
0.0%
5.0%
10.0%
15.0%
3.0% 5.0% 7.0% 9.0% 11.0% 13.0% 15.0%
Net
Jo
b L
oss
Sin
ce T
he
Rec
essi
on
Beg
an
Current Unemployment Rate Unemployment rate below national rate;
Job losses smaller than US total
Unemployment rate below national rate; Job losses larger than US total
Unemployment rate above national rate; Job losses smaller than US total
Unemployment rate above national rate; Job losses larger than US total
United States: 8.3% Unemployment; Job losses totaling 4.0%
South Carolina: 9.3% Unemployment; Job losses totaling 5.4%

U.S. Congress Joint Economic Committee
Economic Overview And Outlook: South DakotaJobs
◙
◙
◙
◙
Employment
◙
◙
Earnings
◙
◙
Housing
◙
◙
◙
◙
◙
Prepared by the Chairman's Staff of the Joint Economic Committee 85
Including January, the private sector has gained jobs nationwide for 23 consecutive months.
Within the Midwest census region, which includes South Dakota, sales of new single-family homes totaled 37,000 units in January 2012, a decrease of 24.5 percent from December. Sales of existing single-family homes remained steady at 920,000 units (at seasonally adjusted annual rates) from December to January 2012.
* For South Dakota-specific labor sector statistics, please refer to the South Dakota office: http://dol.sd.gov/lmic/menu_labor_force.aspx
As the economy continues its emergence from the Great Recession, service-providing industries are projected to add the most jobs between 2010 and 2020. The largest gains over this period are expected to occur in the healthcare and social assistance, professional and business services, and retail trade sectors. Job gains in the goods-producing sector of the economy will be led by the construction and mining industries while the number of manufacturing jobs is expected to fall.
In South Dakota, private sector employment fell by 3.9 percent from January 2008 to February 2010. Since February 2010, private sector employment has grown by 2.0 percent.
In South Dakota, employees in the manufacturing, construction, and information services sectors faced the largest job losses (as a percent of employment within an industry) over the recession. Since the beginning of 2010, the following sectors in South Dakota have experienced the greatest employment increases: manufacturing; professional and business services; and education and health services.*
The unemployment rate in South Dakota was 4.2 percent in January 2012, up 1.5 percentage points from December 2007, but down from its most recent peak of 5.3 percent in February 2010.19,000 South Dakota residents were counted among the unemployed in South Dakota during January 2012.
Between the start of the recession in the 4th quarter of 2007 and the 3rd quarter of 2009, inflation-adjusted total personal income in the United States declined 4.6 percent. Most recently, in the 3rd quarter of 2011, total personal income is 0.2 percent below its 4th quarter of 2007 level.
Real per capita personal income (in 2005 $) in South Dakota was $36,172.70 in the 3rd quarter of 2011, up from $34,870.10 in the 3rd quarter of 2009.
After peaking in the first quarter of 2007, national home prices declined by 16.6 percent over 17 quarters. Between the second quarter of 2011 and the fourth quarter of 2011, the most recent quarter, national home prices have risen by 1.4 percent. In South Dakota, home prices fell by 2.6 percent over 4 quarters from their peak in the first quarter of 2009. Since the first quarter of 2010, home prices in South Dakota have risen by 1.9 percent.
As of the 4th quarter of 2011, 1.8 percent of all mortgages, including 12.6 percent of subprime mortgages, were in foreclosure in South Dakota. Housing starts in South Dakota totaled 2,880 units (seasonally adjusted annual rate) in January 2012, an increase of 53.2 percent from December.
The median price of single-family homes in South Dakota was $156,243 in the second quarter of 2010, compared to $180,176 nationwide.
-5.0
-4.0
-3.0
-2.0
-1.0
0.0
1.0
2.0
3.0
4.0
2008 2009 2010 2011
Job
Ch
ange
s (0
00
)
Source: Bureau of Labor Statistics, Establishment Survey.
South Dakota Monthly Change in Private Payrolls January 2008 - January 2012

How Does South Dakota Compare To Other States?
State Quick Facts
South Dakota United StatesUnemployment Rates …………………………………………..January 2009 4.8% 7.8%
January 2010 5.3% 9.7%January 2011 5.0% 9.1%January 2012 4.2% 8.3%
Percent of Population Who Are Veterans ……………….2011 12.1% 9.4%
All Veterans' Unemployment Rate ……………… 2011 4.1% 8.3%Post-9/11 Veterans' Unemployment Rate………. 2011 6.6% 12.1%
Median Household Income ………………………………..2007 48,811$ 52,823$ (2010 $) 2010 45,669$ 49,445$
Poverty Rate ………………………………………………………………..2007 9.4% 12.5%2010 13.2% 15.1%
No Health Insurance ………………………………………….2007 10.1% 15.3%2010 13.0% 16.3%
86 Prepared by the Chairman's Staff of the Joint Economic Committee
The current unemployment rate (measured along the horizontal axis) serves as a gauge of current labor market conditions faced by residents, while the proportion of jobs lost within South Dakota since the start of the recession (shown along the vertical axis) measures the toll the recession took on the job supply in South Dakota.
States falling in the upper right quadrant have lost a disproportionate share of jobs, relative to the total United States, and have unemployment rates higher than the national unemployment rate. States falling in the lower left quadrant have unemployment rates job losses (or even gains) lower than the national average.
Workers across the country were hard hit during the Great Recession. Although labor markets in many states have started recovering, employment in most states still remains below pre-recession levels. The chart below allows you to compare South Dakota to other states using two metrics.
United States
South Dakota
-15.0%
-10.0%
-5.0%
0.0%
5.0%
10.0%
15.0%
3.0% 5.0% 7.0% 9.0% 11.0% 13.0% 15.0%
Net
Jo
b L
oss
Sin
ce T
he
Rec
essi
on
Beg
an
Current Unemployment Rate Unemployment rate below national rate;
Job losses smaller than US total
Unemployment rate below national rate; Job losses larger than US total
Unemployment rate above national rate; Job losses smaller than US total
Unemployment rate above national rate; Job losses larger than US total
United States: 8.3% Unemployment; Job losses totaling 4.0%
South Dakota: 4.2% Unemployment; Job losses totaling 0.4%
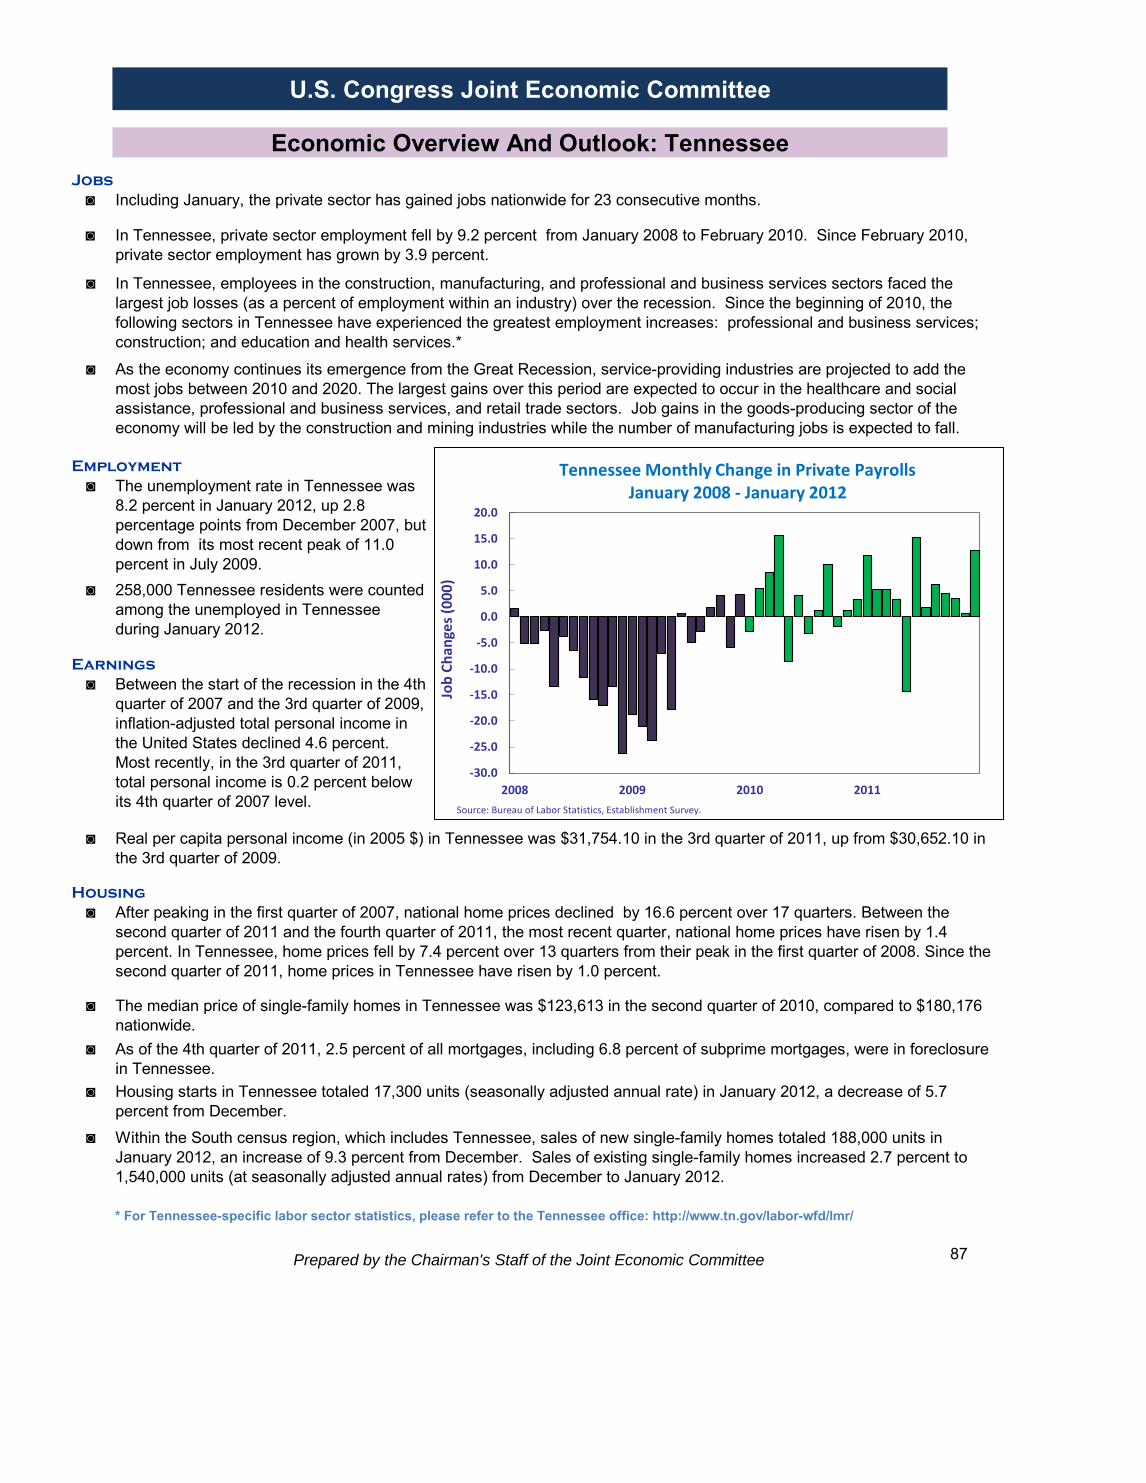
U.S. Congress Joint Economic Committee
Economic Overview And Outlook: TennesseeJobs
◙
◙
◙
◙
Employment
◙
◙
Earnings
◙
◙
Housing
◙
◙
◙
◙
◙
Prepared by the Chairman's Staff of the Joint Economic Committee 87
Including January, the private sector has gained jobs nationwide for 23 consecutive months.
Within the South census region, which includes Tennessee, sales of new single-family homes totaled 188,000 units in January 2012, an increase of 9.3 percent from December. Sales of existing single-family homes increased 2.7 percent to 1,540,000 units (at seasonally adjusted annual rates) from December to January 2012.
* For Tennessee-specific labor sector statistics, please refer to the Tennessee office: http://www.tn.gov/labor-wfd/lmr/
As the economy continues its emergence from the Great Recession, service-providing industries are projected to add the most jobs between 2010 and 2020. The largest gains over this period are expected to occur in the healthcare and social assistance, professional and business services, and retail trade sectors. Job gains in the goods-producing sector of the economy will be led by the construction and mining industries while the number of manufacturing jobs is expected to fall.
In Tennessee, private sector employment fell by 9.2 percent from January 2008 to February 2010. Since February 2010, private sector employment has grown by 3.9 percent.
In Tennessee, employees in the construction, manufacturing, and professional and business services sectors faced the largest job losses (as a percent of employment within an industry) over the recession. Since the beginning of 2010, the following sectors in Tennessee have experienced the greatest employment increases: professional and business services; construction; and education and health services.*
The unemployment rate in Tennessee was 8.2 percent in January 2012, up 2.8 percentage points from December 2007, but down from its most recent peak of 11.0 percent in July 2009.258,000 Tennessee residents were counted among the unemployed in Tennessee during January 2012.
Between the start of the recession in the 4th quarter of 2007 and the 3rd quarter of 2009, inflation-adjusted total personal income in the United States declined 4.6 percent. Most recently, in the 3rd quarter of 2011, total personal income is 0.2 percent below its 4th quarter of 2007 level.
Real per capita personal income (in 2005 $) in Tennessee was $31,754.10 in the 3rd quarter of 2011, up from $30,652.10 in the 3rd quarter of 2009.
After peaking in the first quarter of 2007, national home prices declined by 16.6 percent over 17 quarters. Between the second quarter of 2011 and the fourth quarter of 2011, the most recent quarter, national home prices have risen by 1.4 percent. In Tennessee, home prices fell by 7.4 percent over 13 quarters from their peak in the first quarter of 2008. Since the second quarter of 2011, home prices in Tennessee have risen by 1.0 percent.
As of the 4th quarter of 2011, 2.5 percent of all mortgages, including 6.8 percent of subprime mortgages, were in foreclosure in Tennessee. Housing starts in Tennessee totaled 17,300 units (seasonally adjusted annual rate) in January 2012, a decrease of 5.7 percent from December.
The median price of single-family homes in Tennessee was $123,613 in the second quarter of 2010, compared to $180,176 nationwide.
-30.0
-25.0
-20.0
-15.0
-10.0
-5.0
0.0
5.0
10.0
15.0
20.0
2008 2009 2010 2011
Job
Ch
ange
s (0
00
)
Source: Bureau of Labor Statistics, Establishment Survey.
Tennessee Monthly Change in Private Payrolls January 2008 - January 2012

How Does Tennessee Compare To Other States?
State Quick Facts
Tennessee United StatesUnemployment Rates …………………………………………..January 2009 9.1% 7.8%
January 2010 10.5% 9.7%January 2011 9.5% 9.1%January 2012 8.2% 8.3%
Percent of Population Who Are Veterans ……………….2011 10.6% 9.4%
All Veterans' Unemployment Rate ……………… 2011 10.9% 8.3%Post-9/11 Veterans' Unemployment Rate………. 2011 17.9% 12.1%
Median Household Income ………………………………..2007 43,319$ 52,823$ (2010 $) 2010 38,686$ 49,445$
Poverty Rate ………………………………………………………………..2007 14.8% 12.5%2010 16.7% 15.1%
No Health Insurance ………………………………………….2007 14.4% 15.3%2010 14.7% 16.3%
88 Prepared by the Chairman's Staff of the Joint Economic Committee
The current unemployment rate (measured along the horizontal axis) serves as a gauge of current labor market conditions faced by residents, while the proportion of jobs lost within Tennessee since the start of the recession (shown along the vertical axis) measures the toll the recession took on the job supply in Tennessee.
States falling in the upper right quadrant have lost a disproportionate share of jobs, relative to the total United States, and have unemployment rates higher than the national unemployment rate. States falling in the lower left quadrant have unemployment rates job losses (or even gains) lower than the national average.
Workers across the country were hard hit during the Great Recession. Although labor markets in many states have started recovering, employment in most states still remains below pre-recession levels. The chart below allows you to compare Tennessee to other states using two metrics.
United States
Tennessee
-15.0%
-10.0%
-5.0%
0.0%
5.0%
10.0%
15.0%
3.0% 5.0% 7.0% 9.0% 11.0% 13.0% 15.0%
Net
Jo
b L
oss
Sin
ce T
he
Rec
essi
on
Beg
an
Current Unemployment Rate Unemployment rate below national rate;
Job losses smaller than US total
Unemployment rate below national rate; Job losses larger than US total
Unemployment rate above national rate; Job losses smaller than US total
Unemployment rate above national rate; Job losses larger than US total
United States: 8.3% Unemployment; Job losses totaling 4.0%
Tennessee: 8.2% Unemployment; Job losses totaling 4.3%

U.S. Congress Joint Economic Committee
Economic Overview And Outlook: TexasJobs
◙
◙
◙
◙
Employment
◙
◙
Earnings
◙
◙
Housing
◙
◙
◙
◙
◙
Prepared by the Chairman's Staff of the Joint Economic Committee 89
Including January, the private sector has gained jobs nationwide for 23 consecutive months.
Within the South census region, which includes Texas, sales of new single-family homes totaled 188,000 units in January 2012, an increase of 9.3 percent from December. Sales of existing single-family homes increased 2.7 percent to 1,540,000 units (at seasonally adjusted annual rates) from December to January 2012.
* For Texas-specific labor sector statistics, please refer to the Texas office: http://www.tracer2.com/?PAGEID=133
As the economy continues its emergence from the Great Recession, service-providing industries are projected to add the most jobs between 2010 and 2020. The largest gains over this period are expected to occur in the healthcare and social assistance, professional and business services, and retail trade sectors. Job gains in the goods-producing sector of the economy will be led by the construction and mining industries while the number of manufacturing jobs is expected to fall.
In Texas, private sector employment fell by 4.5 percent from January 2008 to February 2010. Since February 2010, private sector employment has grown by 6.4 percent.
In Texas, employees in the construction, manufacturing, and mining sectors faced the largest job losses (as a percent of employment within an industry) over the recession. Since the beginning of 2010, the following sectors in Texas have experienced the greatest employment increases: mining; professional and business services; and leisure and hospitality.*
The unemployment rate in Texas was 7.3 percent in January 2012, up 2.9 percentage points from December 2007, but down from its most recent peak of 8.2 percent in December 2010.912,000 Texas residents were counted among the unemployed in Texas during January 2012.
Between the start of the recession in the 4th quarter of 2007 and the 3rd quarter of 2009, inflation-adjusted total personal income in the United States declined 4.6 percent. Most recently, in the 3rd quarter of 2011, total personal income is 0.2 percent below its 4th quarter of 2007 level.
Real per capita personal income (in 2005 $) in Texas was $34,470.70 in the 3rd quarter of 2011, up from $32,883.50 in the 3rd quarter of 2009.
After peaking in the first quarter of 2007, national home prices declined by 16.6 percent over 17 quarters. Between the second quarter of 2011 and the fourth quarter of 2011, the most recent quarter, national home prices have risen by 1.4 percent. In Texas, home prices fell by 3.7 percent over 9 quarters from their peak in the first quarter of 2009. Since the second quarter of 2011, home prices in Texas have risen by 1.2 percent.
As of the 4th quarter of 2011, 1.8 percent of all mortgages, including 7.3 percent of subprime mortgages, were in foreclosure in Texas. Housing starts in Texas totaled 119,820 units (seasonally adjusted annual rate) in January 2012, an increase of 16.3 percent from December.
The median price of single-family homes in Texas was $134,854 in the second quarter of 2010, compared to $180,176 nationwide.
-80.0
-60.0
-40.0
-20.0
0.0
20.0
40.0
60.0
80.0
2008 2009 2010 2011
Job
Ch
ange
s (0
00
)
Source: Bureau of Labor Statistics, Establishment Survey.
Texas Monthly Change in Private Payrolls January 2008 - January 2012

How Does Texas Compare To Other States?
State Quick Facts
Texas United StatesUnemployment Rates …………………………………………..January 2009 6.3% 7.8%
January 2010 8.2% 9.7%January 2011 8.1% 9.1%January 2012 7.3% 8.3%
Percent of Population Who Are Veterans ……………….2011 8.8% 9.4%
All Veterans' Unemployment Rate ……………… 2011 7.2% 8.3%Post-9/11 Veterans' Unemployment Rate………. 2011 13.5% 12.1%
Median Household Income ………………………………..2007 48,427$ 52,823$ (2010 $) 2010 47,464$ 49,445$
Poverty Rate ………………………………………………………………..2007 16.5% 12.5%2010 18.4% 15.1%
No Health Insurance ………………………………………….2007 25.2% 15.3%2010 24.6% 16.3%
90 Prepared by the Chairman's Staff of the Joint Economic Committee
The current unemployment rate (measured along the horizontal axis) serves as a gauge of current labor market conditions faced by residents, while the proportion of jobs lost within Texas since the start of the recession (shown along the vertical axis) measures the toll the recession took on the job supply in Texas.
States falling in the upper right quadrant have lost a disproportionate share of jobs, relative to the total United States, and have unemployment rates higher than the national unemployment rate. States falling in the lower left quadrant have unemployment rates job losses (or even gains) lower than the national average.
Workers across the country were hard hit during the Great Recession. Although labor markets in many states have started recovering, employment in most states still remains below pre-recession levels. The chart below allows you to compare Texas to other states using two metrics.
United States
Texas
-15.0%
-10.0%
-5.0%
0.0%
5.0%
10.0%
15.0%
3.0% 5.0% 7.0% 9.0% 11.0% 13.0% 15.0%
Net
Jo
b L
oss
Sin
ce T
he
Rec
essi
on
Beg
an
Current Unemployment Rate Unemployment rate below national rate;
Job losses smaller than US total
Unemployment rate below national rate; Job losses larger than US total
Unemployment rate above national rate; Job losses smaller than US total
Unemployment rate above national rate; Job losses larger than US total
United States: 8.3% Unemployment; Job losses totaling 4.0%
Texas: 7.3% Unemployment; Job gains totaling 1.7%

U.S. Congress Joint Economic Committee
Economic Overview And Outlook: UtahJobs
◙
◙
◙
◙
Employment
◙
◙
Earnings
◙
◙
Housing
◙
◙
◙
◙
◙
Prepared by the Chairman's Staff of the Joint Economic Committee 91
Including January, the private sector has gained jobs nationwide for 23 consecutive months.
Within the West census region, which includes Utah, sales of new single-family homes totaled 76,000 units in January 2012, a decrease of 10.6 percent from December. Sales of existing single-family homes increased 9.0 percent to 1,090,000 units (at seasonally adjusted annual rates) from December to January 2012.
* For Utah-specific labor sector statistics, please refer to the Utah office: http://jobs.utah.gov/opencms/wi/pubs/une/
As the economy continues its emergence from the Great Recession, service-providing industries are projected to add the most jobs between 2010 and 2020. The largest gains over this period are expected to occur in the healthcare and social assistance, professional and business services, and retail trade sectors. Job gains in the goods-producing sector of the economy will be led by the construction and mining industries while the number of manufacturing jobs is expected to fall.
In Utah, private sector employment fell by 9.1 percent from January 2008 to February 2010. Since February 2010, private sector employment has grown by 4.7 percent.
In Utah, employees in the construction, manufacturing, and professional and business services sectors faced the largest job losses (as a percent of employment within an industry) over the recession. Since the beginning of 2010, the following sectors in Utah have experienced the greatest employment increases: mining; professional and business services; and education and health services.*
The unemployment rate in Utah was 5.7 percent in January 2012, up 2.9 percentage points from December 2007, but down from its most recent peak of 8.3 percent in January 2010.76,000 Utah residents were counted among the unemployed in Utah during January 2012.
Between the start of the recession in the 4th quarter of 2007 and the 3rd quarter of 2009, inflation-adjusted total personal income in the United States declined 4.6 percent. Most recently, in the 3rd quarter of 2011, total personal income is 0.2 percent below its 4th quarter of 2007 level.
Real per capita personal income (in 2005 $) in Utah was $29,255.60 in the 3rd quarter of 2011, up from $28,839.70 in the 3rd quarter of 2009.
After peaking in the first quarter of 2007, national home prices declined by 16.6 percent over 17 quarters. Between the second quarter of 2011 and the fourth quarter of 2011, the most recent quarter, national home prices have risen by 1.4 percent. In Utah, home prices fell by 20.7 percent over 14 quarters from their peak in the fourth quarter of 2007. Since the second quarter of 2011, home prices in Utah have risen by 2.3 percent.
As of the 4th quarter of 2011, 2.5 percent of all mortgages, including 9.8 percent of subprime mortgages, were in foreclosure in Utah. Housing starts in Utah totaled 11,080 units (seasonally adjusted annual rate) in January 2012, an increase of 36.8 percent from December.
The median price of single-family homes in Utah was $194,147 in the second quarter of 2010, compared to $180,176 nationwide.
-15.0
-10.0
-5.0
0.0
5.0
10.0
2008 2009 2010 2011
Job
Ch
ange
s (0
00
)
Source: Bureau of Labor Statistics, Establishment Survey.
Utah Monthly Change in Private Payrolls January 2008 - January 2012
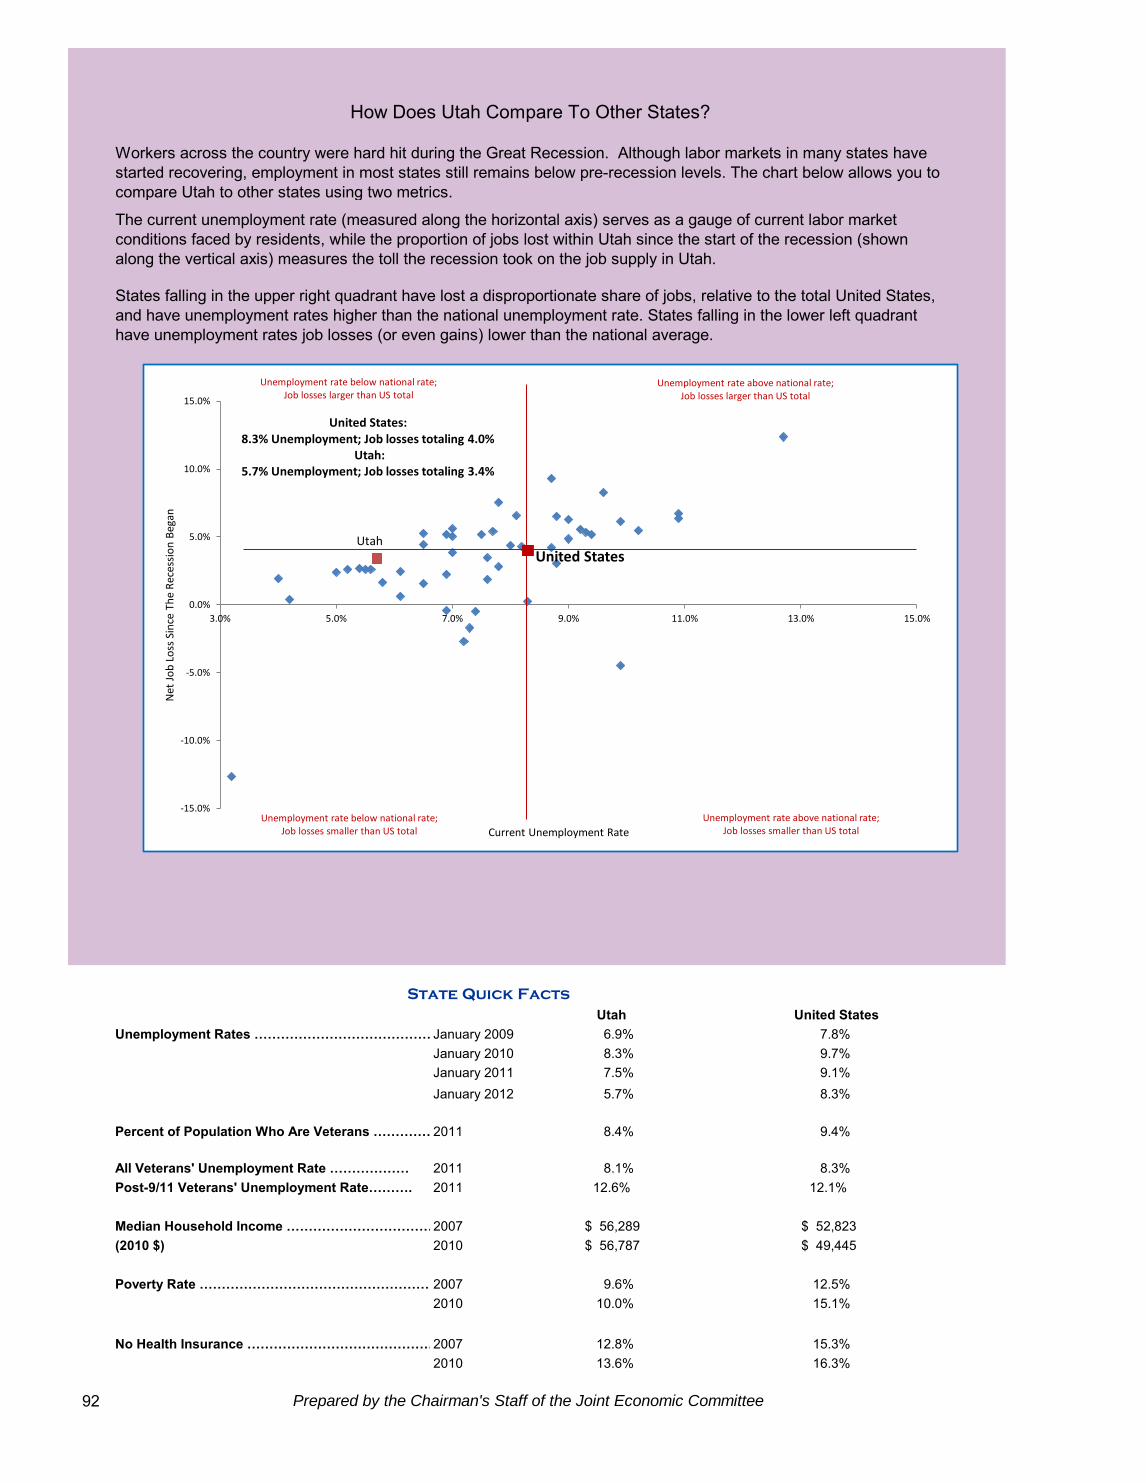
How Does Utah Compare To Other States?
State Quick Facts
Utah United StatesUnemployment Rates …………………………………………..January 2009 6.9% 7.8%
January 2010 8.3% 9.7%January 2011 7.5% 9.1%January 2012 5.7% 8.3%
Percent of Population Who Are Veterans ……………….2011 8.4% 9.4%
All Veterans' Unemployment Rate ……………… 2011 8.1% 8.3%Post-9/11 Veterans' Unemployment Rate………. 2011 12.6% 12.1%
Median Household Income ………………………………..2007 56,289$ 52,823$ (2010 $) 2010 56,787$ 49,445$
Poverty Rate ………………………………………………………………..2007 9.6% 12.5%2010 10.0% 15.1%
No Health Insurance ………………………………………….2007 12.8% 15.3%2010 13.6% 16.3%
92 Prepared by the Chairman's Staff of the Joint Economic Committee
The current unemployment rate (measured along the horizontal axis) serves as a gauge of current labor market conditions faced by residents, while the proportion of jobs lost within Utah since the start of the recession (shown along the vertical axis) measures the toll the recession took on the job supply in Utah.
States falling in the upper right quadrant have lost a disproportionate share of jobs, relative to the total United States, and have unemployment rates higher than the national unemployment rate. States falling in the lower left quadrant have unemployment rates job losses (or even gains) lower than the national average.
Workers across the country were hard hit during the Great Recession. Although labor markets in many states have started recovering, employment in most states still remains below pre-recession levels. The chart below allows you to compare Utah to other states using two metrics.
United States Utah
-15.0%
-10.0%
-5.0%
0.0%
5.0%
10.0%
15.0%
3.0% 5.0% 7.0% 9.0% 11.0% 13.0% 15.0%
Net
Jo
b L
oss
Sin
ce T
he
Rec
essi
on
Beg
an
Current Unemployment Rate Unemployment rate below national rate;
Job losses smaller than US total
Unemployment rate below national rate; Job losses larger than US total
Unemployment rate above national rate; Job losses smaller than US total
Unemployment rate above national rate; Job losses larger than US total
United States: 8.3% Unemployment; Job losses totaling 4.0%
Utah: 5.7% Unemployment; Job losses totaling 3.4%

U.S. Congress Joint Economic Committee
Economic Overview And Outlook: VermontJobs
◙
◙
◙
◙
Employment
◙
◙
Earnings
◙
◙
Housing
◙
◙
◙
◙
◙
Prepared by the Chairman's Staff of the Joint Economic Committee 93
Including January, the private sector has gained jobs nationwide for 23 consecutive months.
Within the Northeast census region, which includes Vermont, sales of new single-family homes totaled 20,000 units in January 2012, an increase of 11.1 percent from December. Sales of existing single-family homes increased 4.2 percent to 500,000 units (at seasonally adjusted annual rates) from December to January 2012.
* For Vermont-specific labor sector statistics, please refer to the Vermont office: http://www.vtlmi.info/
As the economy continues its emergence from the Great Recession, service-providing industries are projected to add the most jobs between 2010 and 2020. The largest gains over this period are expected to occur in the healthcare and social assistance, professional and business services, and retail trade sectors. Job gains in the goods-producing sector of the economy will be led by the construction and mining industries while the number of manufacturing jobs is expected to fall.
In Vermont, private sector employment fell by 5.1 percent from January 2008 to February 2010. Since February 2010, private sector employment has grown by 3.1 percent.
In Vermont, employees in the construction, manufacturing, and trade, transportation and utilities sectors faced the largest job losses (as a percent of employment within an industry) over the recession. Since the beginning of 2010, the following sectors in Vermont have experienced the greatest employment increases: professional and business services; construction; and education and health services.*
The unemployment rate in Vermont was 5.0 percent in January 2012, up 0.9 percentage point from December 2007, but down from its most recent peak of 7.2 percent in June 2009.18,000 Vermont residents were counted among the unemployed in Vermont during January 2012.
Between the start of the recession in the 4th quarter of 2007 and the 3rd quarter of 2009, inflation-adjusted total personal income in the United States declined 4.6 percent. Most recently, in the 3rd quarter of 2011, total personal income is 0.2 percent below its 4th quarter of 2007 level.
Real per capita personal income (in 2005 $) in Vermont was $36,672.40 in the 3rd quarter of 2011, up from $35,448.90 in the 3rd quarter of 2009.
After peaking in the first quarter of 2007, national home prices declined by 16.6 percent over 17 quarters. Between the second quarter of 2011 and the fourth quarter of 2011, the most recent quarter, national home prices have risen by 1.4 percent. In Vermont, home prices fell by 4.6 percent over 13 quarters from their peak in the first quarter of 2008. Since the second quarter of 2011, home prices in Vermont have risen by 1.5 percent.
As of the 4th quarter of 2011, 3.8 percent of all mortgages, including 19.7 percent of subprime mortgages, were in foreclosure in Vermont. Housing starts in Vermont totaled 510 units (seasonally adjusted annual rate) in January 2012, a decrease of 68.3 percent from December.
The median price of single-family homes in Vermont was $203,970 in the second quarter of 2010, compared to $180,176 nationwide.
-3.0
-2.0
-1.0
0.0
1.0
2.0
3.0
4.0
2008 2009 2010 2011
Job
Ch
ange
s (0
00
)
Source: Bureau of Labor Statistics, Establishment Survey.
Vermont Monthly Change in Private Payrolls January 2008 - January 2012

How Does Vermont Compare To Other States?
State Quick Facts
Vermont United StatesUnemployment Rates …………………………………………..January 2009 6.2% 7.8%
January 2010 6.8% 9.7%January 2011 6.0% 9.1%January 2012 5.0% 8.3%
Percent of Population Who Are Veterans ……………….2011 9.7% 9.4%
All Veterans' Unemployment Rate ……………… 2011 4.7% 8.3%Post-9/11 Veterans' Unemployment Rate………. 2011 8.3% 12.1%
Median Household Income ………………………………..2007 49,833$ 52,823$ (2010 $) 2010 55,942$ 49,445$
Poverty Rate ………………………………………………………………..2007 9.9% 12.5%2010 10.8% 15.1%
No Health Insurance ………………………………………….2007 11.2% 15.3%2010 9.5% 16.3%
94 Prepared by the Chairman's Staff of the Joint Economic Committee
The current unemployment rate (measured along the horizontal axis) serves as a gauge of current labor market conditions faced by residents, while the proportion of jobs lost within Vermont since the start of the recession (shown along the vertical axis) measures the toll the recession took on the job supply in Vermont.
States falling in the upper right quadrant have lost a disproportionate share of jobs, relative to the total United States, and have unemployment rates higher than the national unemployment rate. States falling in the lower left quadrant have unemployment rates job losses (or even gains) lower than the national average.
Workers across the country were hard hit during the Great Recession. Although labor markets in many states have started recovering, employment in most states still remains below pre-recession levels. The chart below allows you to compare Vermont to other states using two metrics.
United States Vermont
-15.0%
-10.0%
-5.0%
0.0%
5.0%
10.0%
15.0%
3.0% 5.0% 7.0% 9.0% 11.0% 13.0% 15.0%
Net
Jo
b L
oss
Sin
ce T
he
Rec
essi
on
Beg
an
Current Unemployment Rate Unemployment rate below national rate;
Job losses smaller than US total
Unemployment rate below national rate; Job losses larger than US total
Unemployment rate above national rate; Job losses smaller than US total
Unemployment rate above national rate; Job losses larger than US total
United States: 8.3% Unemployment; Job losses totaling 4.0%
Vermont: 5.0% Unemployment; Job losses totaling 2.4%

U.S. Congress Joint Economic Committee
Economic Overview And Outlook: VirginiaJobs
◙
◙
◙
◙
Employment
◙
◙
Earnings
◙
◙
Housing
◙
◙
◙
◙
◙
Prepared by the Chairman's Staff of the Joint Economic Committee 95
Including January, the private sector has gained jobs nationwide for 23 consecutive months.
Within the South census region, which includes Virginia, sales of new single-family homes totaled 188,000 units in January 2012, an increase of 9.3 percent from December. Sales of existing single-family homes increased 2.7 percent to 1,540,000 units (at seasonally adjusted annual rates) from December to January 2012.
* For Virginia-specific labor sector statistics, please refer to the Virginia office: http://www.vawc.virginia.gov/analyzer/default.asp
As the economy continues its emergence from the Great Recession, service-providing industries are projected to add the most jobs between 2010 and 2020. The largest gains over this period are expected to occur in the healthcare and social assistance, professional and business services, and retail trade sectors. Job gains in the goods-producing sector of the economy will be led by the construction and mining industries while the number of manufacturing jobs is expected to fall.
In Virginia, private sector employment fell by 6.3 percent from January 2008 to February 2010. Since February 2010, private sector employment has grown by 3.3 percent.
In Virginia, employees in the construction, manufacturing, and information services sectors faced the largest job losses (as a percent of employment within an industry) over the recession. Since the beginning of 2010, the following sectors in Virginia have experienced the greatest employment increases: mining; financial activities; and education and health services.*
The unemployment rate in Virginia was 5.8 percent in January 2012, up 2.5 percentage points from December 2007, but down from its most recent peak of 7.3 percent in January 2010.254,000 Virginia residents were counted among the unemployed in Virginia during January 2012.
Between the start of the recession in the 4th quarter of 2007 and the 3rd quarter of 2009, inflation-adjusted total personal income in the United States declined 4.6 percent. Most recently, in the 3rd quarter of 2011, total personal income is 0.2 percent below its 4th quarter of 2007 level.
Real per capita personal income (in 2005 $) in Virginia was $39,773.90 in the 3rd quarter of 2011, up from $39,247.40 in the 3rd quarter of 2009.
After peaking in the first quarter of 2007, national home prices declined by 16.6 percent over 17 quarters. Between the second quarter of 2011 and the fourth quarter of 2011, the most recent quarter, national home prices have risen by 1.4 percent. In Virginia, home prices fell by 14.9 percent over 16 quarters from their peak in the second quarter of 2007. Since the second quarter of 2011, home prices in Virginia have risen by 1.9 percent.
As of the 4th quarter of 2011, 1.8 percent of all mortgages, including 7.7 percent of subprime mortgages, were in foreclosure in Virginia. Housing starts in Virginia totaled 23,110 units (seasonally adjusted annual rate) in January 2012, an increase of 17.9 percent from December.
The median price of single-family homes in Virginia was $229,420 in the second quarter of 2010, compared to $180,176 nationwide.
-30.0
-20.0
-10.0
0.0
10.0
20.0
30.0
2008 2009 2010 2011
Job
Ch
ange
s (0
00
)
Source: Bureau of Labor Statistics, Establishment Survey.
Virginia Monthly Change in Private Payrolls January 2008 - January 2012

How Does Virginia Compare To Other States?
State Quick Facts
Virginia United StatesUnemployment Rates …………………………………………..January 2009 5.8% 7.8%
January 2010 7.3% 9.7%January 2011 6.4% 9.1%January 2012 5.8% 8.3%
Percent of Population Who Are Veterans ……………….2011 13.9% 9.4%
All Veterans' Unemployment Rate ……………… 2011 5.4% 8.3%Post-9/11 Veterans' Unemployment Rate………. 2011 6.2% 12.1%
Median Household Income ………………………………..2007 62,211$ 52,823$ (2010 $) 2010 60,363$ 49,445$
Poverty Rate ………………………………………………………………..2007 8.6% 12.5%2010 10.7% 15.1%
No Health Insurance ………………………………………….2007 14.8% 15.3%2010 14.1% 16.3%
96 Prepared by the Chairman's Staff of the Joint Economic Committee
The current unemployment rate (measured along the horizontal axis) serves as a gauge of current labor market conditions faced by residents, while the proportion of jobs lost within Virginia since the start of the recession (shown along the vertical axis) measures the toll the recession took on the job supply in Virginia.
States falling in the upper right quadrant have lost a disproportionate share of jobs, relative to the total United States, and have unemployment rates higher than the national unemployment rate. States falling in the lower left quadrant have unemployment rates job losses (or even gains) lower than the national average.
Workers across the country were hard hit during the Great Recession. Although labor markets in many states have started recovering, employment in most states still remains below pre-recession levels. The chart below allows you to compare Virginia to other states using two metrics.
United States Virginia
-15.0%
-10.0%
-5.0%
0.0%
5.0%
10.0%
15.0%
3.0% 5.0% 7.0% 9.0% 11.0% 13.0% 15.0%
Net
Jo
b L
oss
Sin
ce T
he
Rec
essi
on
Beg
an
Current Unemployment Rate Unemployment rate below national rate;
Job losses smaller than US total
Unemployment rate below national rate; Job losses larger than US total
Unemployment rate above national rate; Job losses smaller than US total
Unemployment rate above national rate; Job losses larger than US total
United States: 8.3% Unemployment; Job losses totaling 4.0%
Virginia: 5.8% Unemployment; Job losses totaling 1.7%

U.S. Congress Joint Economic Committee
Economic Overview And Outlook: WashingtonJobs
◙
◙
◙
◙
Employment
◙
◙
Earnings
◙
◙
Housing
◙
◙
◙
◙
◙
Prepared by the Chairman's Staff of the Joint Economic Committee 97
Including January, the private sector has gained jobs nationwide for 23 consecutive months.
Within the West census region, which includes Washington, sales of new single-family homes totaled 76,000 units in January 2012, a decrease of 10.6 percent from December. Sales of existing single-family homes increased 9.0 percent to 1,090,000 units (at seasonally adjusted annual rates) from December to January 2012.
* For Washington-specific labor sector statistics, please refer to the Washington office: http://www.workforceexplorer.com/
As the economy continues its emergence from the Great Recession, service-providing industries are projected to add the most jobs between 2010 and 2020. The largest gains over this period are expected to occur in the healthcare and social assistance, professional and business services, and retail trade sectors. Job gains in the goods-producing sector of the economy will be led by the construction and mining industries while the number of manufacturing jobs is expected to fall.
In Washington, private sector employment fell by 8.5 percent from January 2008 to February 2010. Since February 2010, private sector employment has grown by 3.9 percent.
In Washington, employees in the mining, construction, and manufacturing sectors faced the largest job losses (as a percent of employment within an industry) over the recession. Since the beginning of 2010, the following sectors in Washington have experienced the greatest employment increases: manufacturing; professional and business services; and mining.*
The unemployment rate in Washington was 8.3 percent in January 2012, up 3.7 percentage points from December 2007, but down from its most recent peak of 10.2 percent in March 2010.291,000 Washington residents were counted among the unemployed in Washington during January 2012.
Between the start of the recession in the 4th quarter of 2007 and the 3rd quarter of 2009, inflation-adjusted total personal income in the United States declined 4.6 percent. Most recently, in the 3rd quarter of 2011, total personal income is 0.2 percent below its 4th quarter of 2007 level.
Real per capita personal income (in 2005 $) in Washington was $38,581.50 in the 3rd quarter of 2011, up from $37,903.00 in the 3rd quarter of 2009.
After peaking in the first quarter of 2007, national home prices declined by 16.6 percent over 17 quarters. Between the second quarter of 2011 and the fourth quarter of 2011, the most recent quarter, national home prices have risen by 1.4 percent. In Washington, home prices fell by 21.9 percent over 14 quarters from their peak in the fourth quarter of 2007. Since the second quarter of 2011, home prices in Washington have risen by 0.9 percent.
As of the 4th quarter of 2011, 2.1 percent of all mortgages, including 9.2 percent of subprime mortgages, were in foreclosure in Washington. Housing starts in Washington totaled 19,620 units (seasonally adjusted annual rate) in January 2012, an increase of 14.7 percent from December.
The median price of single-family homes in Washington was $248,555 in the second quarter of 2010, compared to $180,176 nationwide.
-40.0
-30.0
-20.0
-10.0
0.0
10.0
20.0
2008 2009 2010 2011
Job
Ch
ange
s (0
00
)
Source: Bureau of Labor Statistics, Establishment Survey.
Washington Monthly Change in Private Payrolls January 2008 - January 2012

How Does Washington Compare To Other States?
State Quick Facts
Washington United StatesUnemployment Rates …………………………………………..January 2009 7.7% 7.8%
January 2010 10.2% 9.7%January 2011 9.6% 9.1%January 2012 8.3% 8.3%
Percent of Population Who Are Veterans ……………….2011 12.5% 9.4%
All Veterans' Unemployment Rate ……………… 2011 10.0% 8.3%Post-9/11 Veterans' Unemployment Rate………. 2011 13.9% 12.1%
Median Household Income ………………………………..2007 61,075$ 52,823$ (2010 $) 2010 56,253$ 49,445$
Poverty Rate ………………………………………………………………..2007 10.2% 12.5%2010 11.5% 15.1%
No Health Insurance ………………………………………….2007 11.3% 15.3%2010 13.8% 16.3%
98 Prepared by the Chairman's Staff of the Joint Economic Committee
The current unemployment rate (measured along the horizontal axis) serves as a gauge of current labor market conditions faced by residents, while the proportion of jobs lost within Washington since the start of the recession (shown along the vertical axis) measures the toll the recession took on the job supply in Washington.
States falling in the upper right quadrant have lost a disproportionate share of jobs, relative to the total United States, and have unemployment rates higher than the national unemployment rate. States falling in the lower left quadrant have unemployment rates job losses (or even gains) lower than the national average.
Workers across the country were hard hit during the Great Recession. Although labor markets in many states have started recovering, employment in most states still remains below pre-recession levels. The chart below allows you to compare Washington to other states using two metrics.
United States
Washington
-15.0%
-10.0%
-5.0%
0.0%
5.0%
10.0%
15.0%
3.0% 5.0% 7.0% 9.0% 11.0% 13.0% 15.0%
Net
Jo
b L
oss
Sin
ce T
he
Rec
essi
on
Beg
an
Current Unemployment Rate Unemployment rate below national rate;
Job losses smaller than US total
Unemployment rate below national rate; Job losses larger than US total
Unemployment rate above national rate; Job losses smaller than US total
Unemployment rate above national rate; Job losses larger than US total
United States: 8.3% Unemployment; Job losses totaling 4.0%
Washington: 8.3% Unemployment; Job losses totaling 3.9%

U.S. Congress Joint Economic Committee
Economic Overview And Outlook: West VirginiaJobs
◙
◙
◙
◙
Employment
◙
◙
Earnings
◙
◙
Housing
◙
◙
◙
◙
◙
Prepared by the Chairman's Staff of the Joint Economic Committee 99
Including January, the private sector has gained jobs nationwide for 23 consecutive months.
Within the South census region, which includes West Virginia, sales of new single-family homes totaled 188,000 units in January 2012, an increase of 9.3 percent from December. Sales of existing single-family homes increased 2.7 percent to 1,540,000 units (at seasonally adjusted annual rates) from December to January 2012.
* For West Virginia-specific labor sector statistics, please refer to the West Virginia office: http://www.workforcewv.org/lmi/
As the economy continues its emergence from the Great Recession, service-providing industries are projected to add the most jobs between 2010 and 2020. The largest gains over this period are expected to occur in the healthcare and social assistance, professional and business services, and retail trade sectors. Job gains in the goods-producing sector of the economy will be led by the construction and mining industries while the number of manufacturing jobs is expected to fall.
In West Virginia, private sector employment fell by 4.8 percent from January 2008 to February 2010. Since February 2010, private sector employment has grown by 3.6 percent.
In West Virginia, employees in the manufacturing, construction, and trade, transportation and utilities sectors faced the largest job losses (as a percent of employment within an industry) over the recession. Since the beginning of 2010, the following sectors in West Virginia have experienced the greatest employment increases: mining; leisure and hospitality; and professional and business services.*
The unemployment rate in West Virginia was 7.4 percent in January 2012, up 3.3 percentage points from December 2007, but down from its most recent peak of 8.5 percent in November 2010.59,000 West Virginia residents were counted among the unemployed in West Virginia during January 2012.
Between the start of the recession in the 4th quarter of 2007 and the 3rd quarter of 2009, inflation-adjusted total personal income in the United States declined 4.6 percent. Most recently, in the 3rd quarter of 2011, total personal income is 0.2 percent below its 4th quarter of 2007 level.
Real per capita personal income (in 2005 $) in West Virginia was $29,044.80 in the 3rd quarter of 2011, up from $28,211.60 in the 3rd quarter of 2009.
After peaking in the first quarter of 2007, national home prices declined by 16.6 percent over 17 quarters. Between the second quarter of 2011 and the fourth quarter of 2011, the most recent quarter, national home prices have risen by 1.4 percent. In West Virginia, home prices fell by 5.9 percent over 13 quarters from their peak in the first quarter of 2008. Since the second quarter of 2011, home prices in West Virginia have risen by 2.6 percent.
As of the 4th quarter of 2011, 2.1 percent of all mortgages, including 6.8 percent of subprime mortgages, were in foreclosure in West Virginia. Housing starts in West Virginia totaled 1,010 units (seasonally adjusted annual rate) in January 2012, a decrease of 61.9 percent from December.
The median price of single-family homes in West Virginia was $129,369 in the second quarter of 2010, compared to $180,176 nationwide.
-8.0
-6.0
-4.0
-2.0
0.0
2.0
4.0
6.0
8.0
10.0
2008 2009 2010 2011
Job
Ch
ange
s (0
00
)
Source: Bureau of Labor Statistics, Establishment Survey.
West Virginia Monthly Change in Private Payrolls January 2008 - January 2012

How Does West Virginia Compare To Other States?
State Quick Facts
West Virginia United StatesUnemployment Rates …………………………………………..January 2009 5.7% 7.8%
January 2010 8.5% 9.7%January 2011 8.3% 9.1%January 2012 7.4% 8.3%
Percent of Population Who Are Veterans ……………….2011 11.6% 9.4%
All Veterans' Unemployment Rate ……………… 2011 7.7% 8.3%Post-9/11 Veterans' Unemployment Rate………. 2011 8.9% 12.1%
Median Household Income ………………………………..2007 44,261$ 52,823$ (2010 $) 2010 42,839$ 49,445$
Poverty Rate ………………………………………………………………..2007 14.8% 12.5%2010 16.9% 15.1%
No Health Insurance ………………………………………….2007 14.1% 15.3%2010 13.5% 16.3%
100 Prepared by the Chairman's Staff of the Joint Economic Committee
The current unemployment rate (measured along the horizontal axis) serves as a gauge of current labor market conditions faced by residents, while the proportion of jobs lost within West Virginia since the start of the recession (shown along the vertical axis) measures the toll the recession took on the job supply in West Virginia.
States falling in the upper right quadrant have lost a disproportionate share of jobs, relative to the total United States, and have unemployment rates higher than the national unemployment rate. States falling in the lower left quadrant have unemployment rates job losses (or even gains) lower than the national average.
Workers across the country were hard hit during the Great Recession. Although labor markets in many states have started recovering, employment in most states still remains below pre-recession levels. The chart below allows you to compare West Virginia to other states using two metrics.
United States
West Virginia
-15.0%
-10.0%
-5.0%
0.0%
5.0%
10.0%
15.0%
3.0% 5.0% 7.0% 9.0% 11.0% 13.0% 15.0%
Net
Jo
b L
oss
Sin
ce T
he
Rec
essi
on
Beg
an
Current Unemployment Rate Unemployment rate below national rate;
Job losses smaller than US total
Unemployment rate below national rate; Job losses larger than US total
Unemployment rate above national rate; Job losses smaller than US total
Unemployment rate above national rate; Job losses larger than US total
United States: 8.3% Unemployment; Job losses totaling 4.0%
West Virginia: 7.4% Unemployment; Job gains totaling 0.5%

U.S. Congress Joint Economic Committee
Economic Overview And Outlook: WisconsinJobs
◙
◙
◙
◙
Employment
◙
◙
Earnings
◙
◙
Housing
◙
◙
◙
◙
◙
Prepared by the Chairman's Staff of the Joint Economic Committee 101
Including January, the private sector has gained jobs nationwide for 23 consecutive months.
Within the Midwest census region, which includes Wisconsin, sales of new single-family homes totaled 37,000 units in January 2012, a decrease of 24.5 percent from December. Sales of existing single-family homes remained steady at 920,000 units (at seasonally adjusted annual rates) from December to January 2012.
* For Wisconsin-specific labor sector statistics, please refer to the Wisconsin office: http://www.dwd.state.wi.us/oea/
As the economy continues its emergence from the Great Recession, service-providing industries are projected to add the most jobs between 2010 and 2020. The largest gains over this period are expected to occur in the healthcare and social assistance, professional and business services, and retail trade sectors. Job gains in the goods-producing sector of the economy will be led by the construction and mining industries while the number of manufacturing jobs is expected to fall.
In Wisconsin, private sector employment fell by 6.8 percent from January 2008 to February 2010. Since February 2010, private sector employment has grown by 1.4 percent.
In Wisconsin, employees in the construction, mining, and manufacturing sectors faced the largest job losses (as a percent of employment within an industry) over the recession. Since the beginning of 2010, the following sectors in Wisconsin have experienced the greatest employment increases: mining; professional and business services; and manufacturing.*
The unemployment rate in Wisconsin was 6.9 percent in January 2012, up 2.4 percentage points from December 2007, but down from its most recent peak of 9.2 percent in January 2010.210,000 Wisconsin residents were counted among the unemployed in Wisconsin during January 2012.
Between the start of the recession in the 4th quarter of 2007 and the 3rd quarter of 2009, inflation-adjusted total personal income in the United States declined 4.6 percent. Most recently, in the 3rd quarter of 2011, total personal income is 0.2 percent below its 4th quarter of 2007 level.
Real per capita personal income (in 2005 $) in Wisconsin was $34,904.70 in the 3rd quarter of 2011, up from $33,669.50 in the 3rd quarter of 2009.
After peaking in the first quarter of 2007, national home prices declined by 16.6 percent over 17 quarters. Between the second quarter of 2011 and the fourth quarter of 2011, the most recent quarter, national home prices have risen by 1.4 percent. In Wisconsin, home prices fell by 9.4 percent over 13 quarters from their peak in the first quarter of 2008. Since the second quarter of 2011, home prices in Wisconsin have risen by 1.5 percent.
As of the 4th quarter of 2011, 3.5 percent of all mortgages, including 15.5 percent of subprime mortgages, were in foreclosure in Wisconsin. Housing starts in Wisconsin totaled 7,370 units (seasonally adjusted annual rate) in January 2012, a decrease of 45.0 percent from December.
The median price of single-family homes in Wisconsin was $153,935 in the second quarter of 2010, compared to $180,176 nationwide.
-30.0
-25.0
-20.0
-15.0
-10.0
-5.0
0.0
5.0
10.0
15.0
2008 2009 2010 2011
Job
Ch
ange
s (0
00
)
Source: Bureau of Labor Statistics, Establishment Survey.
Wisconsin Monthly Change in Private Payrolls January 2008 - January 2012

How Does Wisconsin Compare To Other States?
State Quick Facts
Wisconsin United StatesUnemployment Rates …………………………………………..January 2009 7.2% 7.8%
January 2010 9.2% 9.7%January 2011 7.7% 9.1%January 2012 6.9% 8.3%
Percent of Population Who Are Veterans ……………….2011 10.1% 9.4%
All Veterans' Unemployment Rate ……………… 2011 8.9% 8.3%Post-9/11 Veterans' Unemployment Rate………. 2011 9.7% 12.1%
Median Household Income ………………………………..2007 53,921$ 52,823$ (2010 $) 2010 50,522$ 49,445$
Poverty Rate ………………………………………………………………..2007 11.0% 12.5%2010 9.9% 15.1%
No Health Insurance ………………………………………….2007 8.2% 15.3%2010 9.4% 16.3%
102 Prepared by the Chairman's Staff of the Joint Economic Committee
The current unemployment rate (measured along the horizontal axis) serves as a gauge of current labor market conditions faced by residents, while the proportion of jobs lost within Wisconsin since the start of the recession (shown along the vertical axis) measures the toll the recession took on the job supply in Wisconsin.
States falling in the upper right quadrant have lost a disproportionate share of jobs, relative to the total United States, and have unemployment rates higher than the national unemployment rate. States falling in the lower left quadrant have unemployment rates job losses (or even gains) lower than the national average.
Workers across the country were hard hit during the Great Recession. Although labor markets in many states have started recovering, employment in most states still remains below pre-recession levels. The chart below allows you to compare Wisconsin to other states using two metrics.
United States
Wisconsin
-15.0%
-10.0%
-5.0%
0.0%
5.0%
10.0%
15.0%
3.0% 5.0% 7.0% 9.0% 11.0% 13.0% 15.0%
Net
Jo
b L
oss
Sin
ce T
he
Rec
essi
on
Beg
an
Current Unemployment Rate Unemployment rate below national rate;
Job losses smaller than US total
Unemployment rate below national rate; Job losses larger than US total
Unemployment rate above national rate; Job losses smaller than US total
Unemployment rate above national rate; Job losses larger than US total
United States: 8.3% Unemployment; Job losses totaling 4.0%
Wisconsin: 6.9% Unemployment; Job losses totaling 5.2%

U.S. Congress Joint Economic Committee
Economic Overview And Outlook: WyomingJobs
◙
◙
◙
◙
Employment
◙
◙
Earnings
◙
◙
Housing
◙
◙
◙
◙
◙
Prepared by the Chairman's Staff of the Joint Economic Committee 103
Including January, the private sector has gained jobs nationwide for 23 consecutive months.
Within the West census region, which includes Wyoming, sales of new single-family homes totaled 76,000 units in January 2012, a decrease of 10.6 percent from December. Sales of existing single-family homes increased 9.0 percent to 1,090,000 units (at seasonally adjusted annual rates) from December to January 2012.
* For Wyoming-specific labor sector statistics, please refer to the Wyoming office: http://wydoe.state.wy.us/lmi/bls.htm
As the economy continues its emergence from the Great Recession, service-providing industries are projected to add the most jobs between 2010 and 2020. The largest gains over this period are expected to occur in the healthcare and social assistance, professional and business services, and retail trade sectors. Job gains in the goods-producing sector of the economy will be led by the construction and mining industries while the number of manufacturing jobs is expected to fall.
In Wyoming, private sector employment fell by 8.2 percent from January 2008 to February 2010. Since February 2010, private sector employment has grown by 2.3 percent.
In Wyoming, employees in the construction, manufacturing, and mining sectors faced the largest job losses (as a percent of employment within an industry) over the recession. Since the beginning of 2010, the following sectors in Wyoming have experienced the greatest employment increases: mining; other services; and professional and business services.*
The unemployment rate in Wyoming was 5.5 percent in January 2012, up 2.9 percentage points from December 2007, but down from its most recent peak of 7.5 percent in January 2010.17,000 Wyoming residents were counted among the unemployed in Wyoming during January 2012.
Between the start of the recession in the 4th quarter of 2007 and the 3rd quarter of 2009, inflation-adjusted total personal income in the United States declined 4.6 percent. Most recently, in the 3rd quarter of 2011, total personal income is 0.2 percent below its 4th quarter of 2007 level.
Real per capita personal income (in 2005 $) in Wyoming was $40,786.40 in the 3rd quarter of 2011, up from $38,643.20 in the 3rd quarter of 2009.
After peaking in the first quarter of 2007, national home prices declined by 16.6 percent over 17 quarters. Between the second quarter of 2011 and the fourth quarter of 2011, the most recent quarter, national home prices have risen by 1.4 percent. In Wyoming, home prices fell by 6.9 percent over 12 quarters from their peak in the second quarter of 2008. Since the second quarter of 2011, home prices in Wyoming have risen by 1.8 percent.
As of the 4th quarter of 2011, 1.0 percent of all mortgages, including 6.3 percent of subprime mortgages, were in foreclosure in Wyoming. Housing starts in Wyoming totaled 1,450 units (seasonally adjusted annual rate) in January 2012, an increase of 107.1 percent from December.
The median price of single-family homes in Wyoming was $183,202 in the second quarter of 2010, compared to $180,176 nationwide.
-4.0
-3.0
-2.0
-1.0
0.0
1.0
2.0
2008 2009 2010 2011
Job
Ch
ange
s (0
00
)
Source: Bureau of Labor Statistics, Establishment Survey.
Wyoming Monthly Change in Private Payrolls January 2008 - January 2012

How Does Wyoming Compare To Other States?
State Quick Facts
Wyoming United StatesUnemployment Rates …………………………………………..January 2009 4.2% 7.8%
January 2010 7.5% 9.7%January 2011 6.3% 9.1%January 2012 5.5% 8.3%
Percent of Population Who Are Veterans ……………….2011 13.6% 9.4%
All Veterans' Unemployment Rate ……………… 2011 4.6% 8.3%Post-9/11 Veterans' Unemployment Rate………. 2011 4.3% 12.1%
Median Household Income ………………………………..2007 51,257$ 52,823$ (2010 $) 2010 52,359$ 49,445$
Poverty Rate ………………………………………………………………..2007 10.9% 12.5%2010 9.6% 15.1%
No Health Insurance ………………………………………….2007 13.6% 15.3%2010 17.3% 16.3%
104 Prepared by the Chairman's Staff of the Joint Economic Committee
The current unemployment rate (measured along the horizontal axis) serves as a gauge of current labor market conditions faced by residents, while the proportion of jobs lost within Wyoming since the start of the recession (shown along the vertical axis) measures the toll the recession took on the job supply in Wyoming.
States falling in the upper right quadrant have lost a disproportionate share of jobs, relative to the total United States, and have unemployment rates higher than the national unemployment rate. States falling in the lower left quadrant have unemployment rates job losses (or even gains) lower than the national average.
Workers across the country were hard hit during the Great Recession. Although labor markets in many states have started recovering, employment in most states still remains below pre-recession levels. The chart below allows you to compare Wyoming to other states using two metrics.
United States Wyoming
-15.0%
-10.0%
-5.0%
0.0%
5.0%
10.0%
15.0%
3.0% 5.0% 7.0% 9.0% 11.0% 13.0% 15.0%
Net
Jo
b L
oss
Sin
ce T
he
Rec
essi
on
Beg
an
Current Unemployment Rate Unemployment rate below national rate;
Job losses smaller than US total
Unemployment rate below national rate; Job losses larger than US total
Unemployment rate above national rate; Job losses smaller than US total
Unemployment rate above national rate; Job losses larger than US total
United States: 8.3% Unemployment; Job losses totaling 4.0%
Wyoming: 5.5% Unemployment; Job losses totaling 2.6%

Prepared by the Chairman’s staff of the Joint Economic Committee
105
EXPLANATION OF NET JOB LOSS AND UNEMPLOYMENT RATE CHART
The chart on the following page shows a comparison of the current (January 2011) unemployment rate and cumulative nonfarm job losses (as a percent of total employment) in each state and the District of Columbia versus the national average. States that appear in the upper right quadrant are experiencing unemployment rates higher than the national average and cumulative job losses greater than the national average. Most of these states were dependent on manufacturing and construction. States in the lower left quadrant are experiencing lower unemployment rates and smaller job losses than the national average. States in the upper left quadrant experienced net job losses greater than the national average but have a current unemployment rate lower than the national average. Those states all started the recession with unemployment rates less than the national average. Negative job losses correspond to job creation. North Dakota, Alaska, Texas, and the District of Columbia have experienced net job creation since the recession’s onset. Expanded employment in the mining and logging sector has contributed to job creation in North Dakota, Alaska, and Texas. In addition, Alaska, Texas, and the District of Columbia have experienced gains in both the education and health services sector and the leisure and hospitality sector since the recession began. Despite these job gains, the unemployment rate in the District of Columbia is currently higher than the national average. The higher unemployment rate in District of Columbia is partly due to a higher unemployment rate before the recession began – the unemployment rate was 5.7 percent in November 2007, above the national average of 4.7 percent. It is likely, given the small size of the District of Columbia, that jobs created in the District of Columbia are filled by Virginia and Maryland residents.
U.S. Congress Joint Economic Committee
Understanding the Economy: State-by-State Snapshots

Prepared by the Chairman’s staff of the Joint Economic Committee
106
AK
AL
AR
AZ
CA
CO
CT
DC
DE
FL
GA
HI
IA
ID
ILIN
KSKY
LA
MA
MD
ME
MI
MN
MO
MS
MT
NC
ND
NE
NH
NJ
NM
NV
NY
OH
OK
OR
PA
RISC
SD
TN
TX
UT
VA
VTW
A
WI
WV
WY
Uni
ted
Stat
es
-15.
0%
-12.
0%
-9.0
%
-6.0
%
-3.0
%
0.0%
3.0%
6.0%
9.0%
12.0
%
15.0
%
3.0%
5.0%
7.0%
9.0%
11.0
%13
.0%
15.0
%
Net Job Loss This Recession
Curr
ent U
nem
ploy
men
t Rat
e
Net
Job
Loss
from
Rec
essi
on's
Ons
et a
nd Ja
nuar
y 20
12 U
nem
ploy
men
t Rat
e
Une
mpl
oym
ent r
ate
belo
w n
atio
nal r
ate;
Jo
b lo
sses
smal
ler t
han
US
tota
l
Uni
ted
Stat
es:
8.3%
Une
mpl
oym
ent;
Job
loss
es to
talin
g 4.
0%
Une
mpl
oym
ent r
ate
belo
w n
atio
nal r
ate;
Job
loss
es la
rger
than
US
tota
l U
nem
ploy
men
t rat
e ab
ove
natio
nal r
ate;
Jo
b lo
sses
larg
er th
an U
S to
tal
Une
mpl
oym
ent r
ate
abov
e na
tiona
l rat
e;
Jo
b lo
sses
smal
ler t
han
US
tota
l
Prep
ared
by
the
Chai
rman
'sst
aff o
f the
Join
t Eco
nom
ic C
omm
ittee
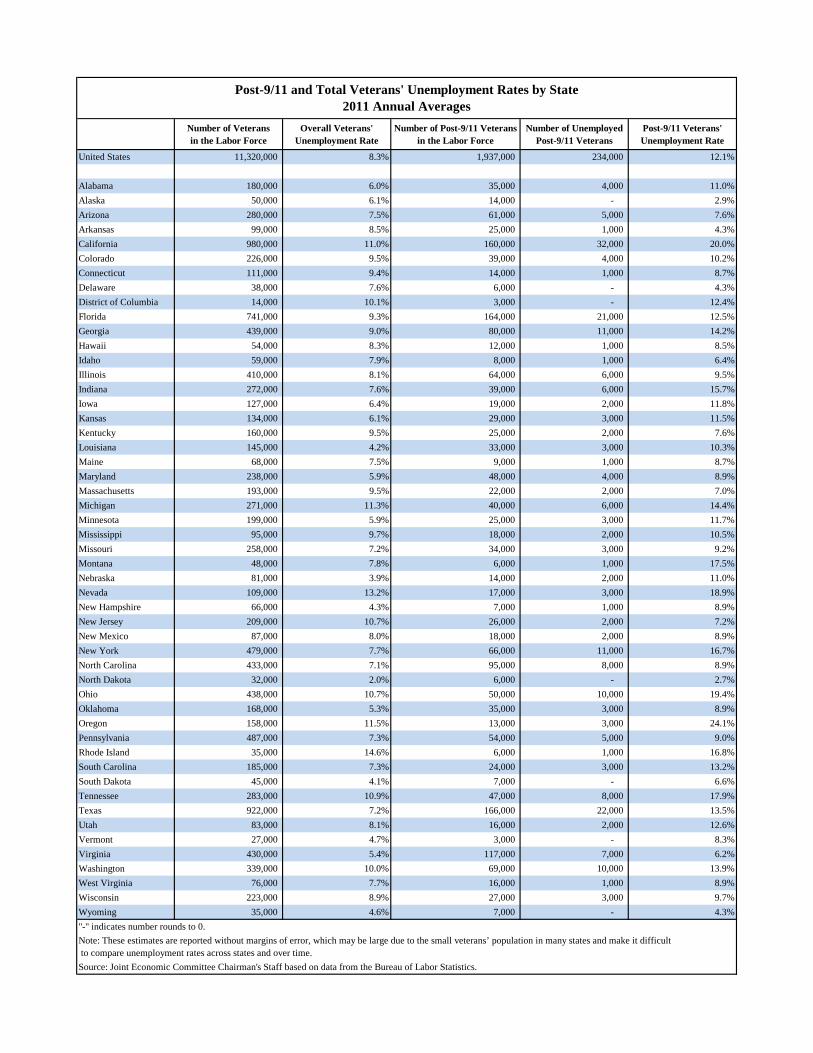
Number of Veteransin the Labor Force
Overall Veterans' Unemployment Rate
Number of Post-9/11 Veterans in the Labor Force
Number of Unemployed Post-9/11 Veterans
Post-9/11 Veterans' Unemployment Rate
United States 11,320,000 8.3% 1,937,000 234,000 12.1%
Alabama 180,000 6.0% 35,000 4,000 11.0%Alaska 50,000 6.1% 14,000 - 2.9%Arizona 280,000 7.5% 61,000 5,000 7.6%Arkansas 99,000 8.5% 25,000 1,000 4.3%California 980,000 11.0% 160,000 32,000 20.0%Colorado 226,000 9.5% 39,000 4,000 10.2%Connecticut 111,000 9.4% 14,000 1,000 8.7%Delaware 38,000 7.6% 6,000 - 4.3%District of Columbia 14,000 10.1% 3,000 - 12.4%Florida 741,000 9.3% 164,000 21,000 12.5%Georgia 439,000 9.0% 80,000 11,000 14.2%Hawaii 54,000 8.3% 12,000 1,000 8.5%Idaho 59,000 7.9% 8,000 1,000 6.4%Illinois 410,000 8.1% 64,000 6,000 9.5%Indiana 272,000 7.6% 39,000 6,000 15.7%Iowa 127,000 6.4% 19,000 2,000 11.8%Kansas 134,000 6.1% 29,000 3,000 11.5%Kentucky 160,000 9.5% 25,000 2,000 7.6%Louisiana 145,000 4.2% 33,000 3,000 10.3%Maine 68,000 7.5% 9,000 1,000 8.7%Maryland 238,000 5.9% 48,000 4,000 8.9%Massachusetts 193,000 9.5% 22,000 2,000 7.0%Michigan 271,000 11.3% 40,000 6,000 14.4%Minnesota 199,000 5.9% 25,000 3,000 11.7%Mississippi 95,000 9.7% 18,000 2,000 10.5%Missouri 258,000 7.2% 34,000 3,000 9.2%Montana 48,000 7.8% 6,000 1,000 17.5%Nebraska 81,000 3.9% 14,000 2,000 11.0%Nevada 109,000 13.2% 17,000 3,000 18.9%New Hampshire 66,000 4.3% 7,000 1,000 8.9%New Jersey 209,000 10.7% 26,000 2,000 7.2%New Mexico 87,000 8.0% 18,000 2,000 8.9%New York 479,000 7.7% 66,000 11,000 16.7%North Carolina 433,000 7.1% 95,000 8,000 8.9%North Dakota 32,000 2.0% 6,000 - 2.7%Ohio 438,000 10.7% 50,000 10,000 19.4%Oklahoma 168,000 5.3% 35,000 3,000 8.9%Oregon 158,000 11.5% 13,000 3,000 24.1%Pennsylvania 487,000 7.3% 54,000 5,000 9.0%Rhode Island 35,000 14.6% 6,000 1,000 16.8%South Carolina 185,000 7.3% 24,000 3,000 13.2%South Dakota 45,000 4.1% 7,000 - 6.6%Tennessee 283,000 10.9% 47,000 8,000 17.9%Texas 922,000 7.2% 166,000 22,000 13.5%Utah 83,000 8.1% 16,000 2,000 12.6%Vermont 27,000 4.7% 3,000 - 8.3%Virginia 430,000 5.4% 117,000 7,000 6.2%Washington 339,000 10.0% 69,000 10,000 13.9%West Virginia 76,000 7.7% 16,000 1,000 8.9%Wisconsin 223,000 8.9% 27,000 3,000 9.7%Wyoming 35,000 4.6% 7,000 - 4.3%"-" indicates number rounds to 0.
Source: Joint Economic Committee Chairman's Staff based on data from the Bureau of Labor Statistics.
Post-9/11 and Total Veterans' Unemployment Rates by State2011 Annual Averages
Note: These estimates are reported without margins of error, which may be large due to the small veterans’ population in many states and make it difficult to compare unemployment rates across states and over time.

Prepared by the Chairman’s Staff of the Joint Economic Committee 108
SOURCES FOR STATE FACT SHEETS
JOBS Bureau of Labor Statistics, Current Employment Statistics. Henderson, Richard., "Industry employment and output projections to 2020.," Monthly Labor Review. January 2012. Available at http://www.bls.gov/opub/mlr/2012/01/art4full.pdf EMPLOYMENT Bureau of Labor Statistics, Local Area Unemployment Statistics. EARNINGS Bureau of Economic Analysis. Inflation adjustment calculations produced by Haver Analytics. HOUSING Federal Housing and Finance Agency House Price Index. For the 50 States Plus DC, not seasonally adjusted. Federal Housing Finance Agency, Median Price of Single-Family Homes by State. Mortgage Bankers Association, National Delinquency Survey. U.S. Census Bureau and Bank of Tokyo-Mitsubishi UFJ, Housing Starts. U.S. Census Bureau and the Department of Housing and Urban Development, New Residential Sales. National Association of Realtors, Economics and Research Division, Home Sales series. How Does Your State Compare To Other States Bureau of Labor Statistics, Local Area Unemployment Statistics. Bureau of Labor Statistics, Current Employment Statistics. State Quick Facts State Unemployment Rates Bureau of Labor Statistics, Local Area Unemployment Statistics.
U.S. Congress Joint Economic Committee
Understanding the Economy: State-by-State Snapshots
109 Prepared by the Chairman’s Staff of the Joint Economic Committee
U.S. Unemployment Rates Bureau of Labor Statistics, Current Population Survey. Median Household Income U.S. Census Bureau, Income, Poverty, and Health Insurance Coverage in the United States: 2010, Issued September 2011. Data are in 2010 dollars. Poverty Rate U.S. Census Bureau, Income, Poverty, and Health Insurance Coverage in the United States: 2010, Issued September 2011. No Health Insurance U.S. Census Bureau, Income, Poverty, and Health Insurance Coverage in the United States: 2010, Issued September 2011. Percent of Population Who Are Veterans U.S. Census Bureau, Current Population Survey 2011. . Veterans' Unemployment Rate U.S. Census Bureau, Current Population Survey, 2011. Post-9/11 Veterans' Unemployment Rate U.S. Census Bureau, Current Population Survey, 2011.
------------------------------------------------------------------------
Note: Most of the data used to create each state-by-state snapshot was accessed through Haver Analytics.