Embed Size (px)
Citation preview
RTI
Follow-Up Activity 2
Graphing 101
RTIGraphing 101
Follow-up activity to consider the benefits and cons of ….
– Graphing by hand,
– Graphing with excel
– Using web-based data management system
RTIGraphing
Graphing is an essential part of PM
Without graphic displays, the decision making process is difficult
Teacher graphing vs. Student graphing
RTIHow to Develop Graphs
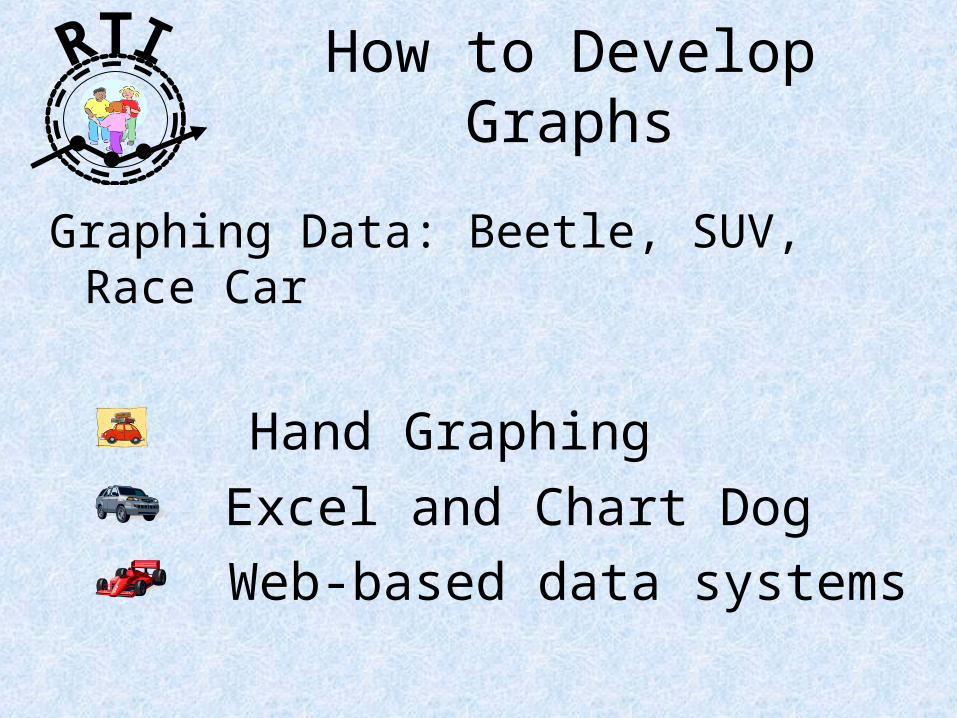
Graphing Data: Beetle, SUV, Race Car
Hand Graphing
Excel and Chart Dog
Web-based data systems
RTI Hand Graphing
Goal 44
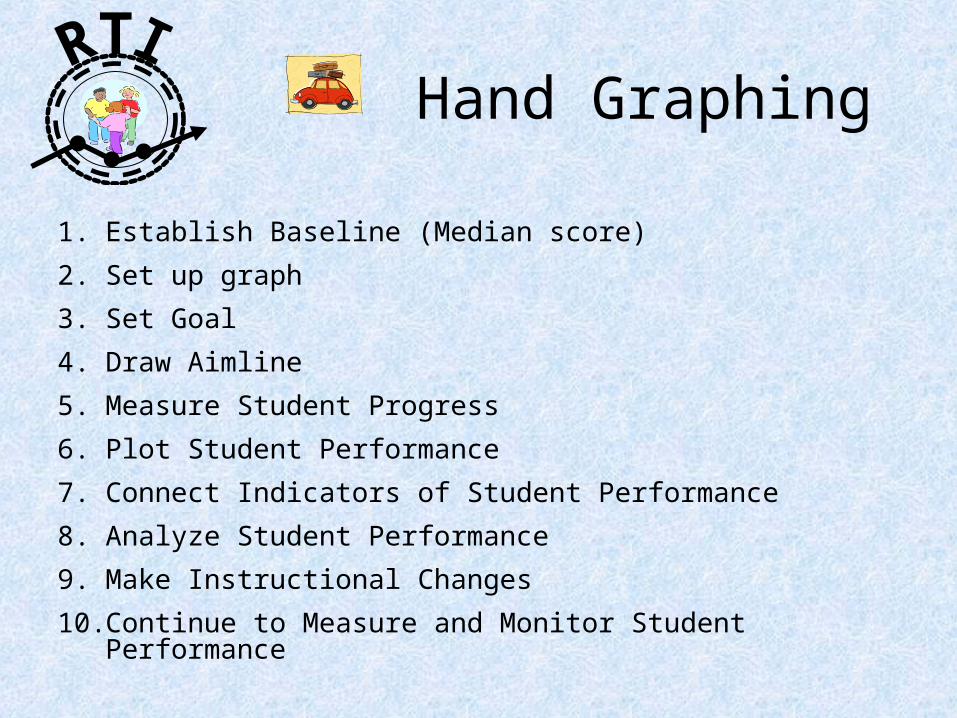
RTI Hand Graphing
1. Establish Baseline (Median score)
2. Set up graph
3. Set Goal
4. Draw Aimline
5. Measure Student Progress
6. Plot Student Performance
7. Connect Indicators of Student Performance
8. Analyze Student Performance
9. Make Instructional Changes
10. Continue to Measure and Monitor Student Performance
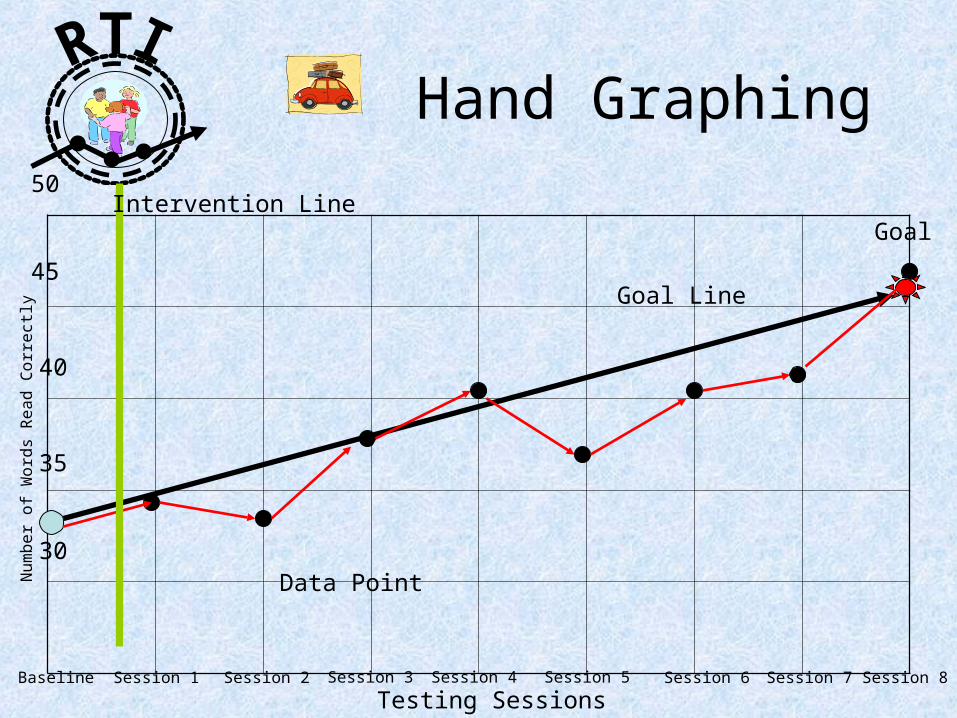
RTI Hand Graphing
Testing SessionsBaseline Session 1 Session 3Session 2 Session 4 Session 6Session 5 Session 7 Session 8
Nu
mb
er
of
Wo
rds
Re
ad
Co
rre
ctly
30
35
40
45
50
Goal Line
Goal
Data Point
Intervention Line
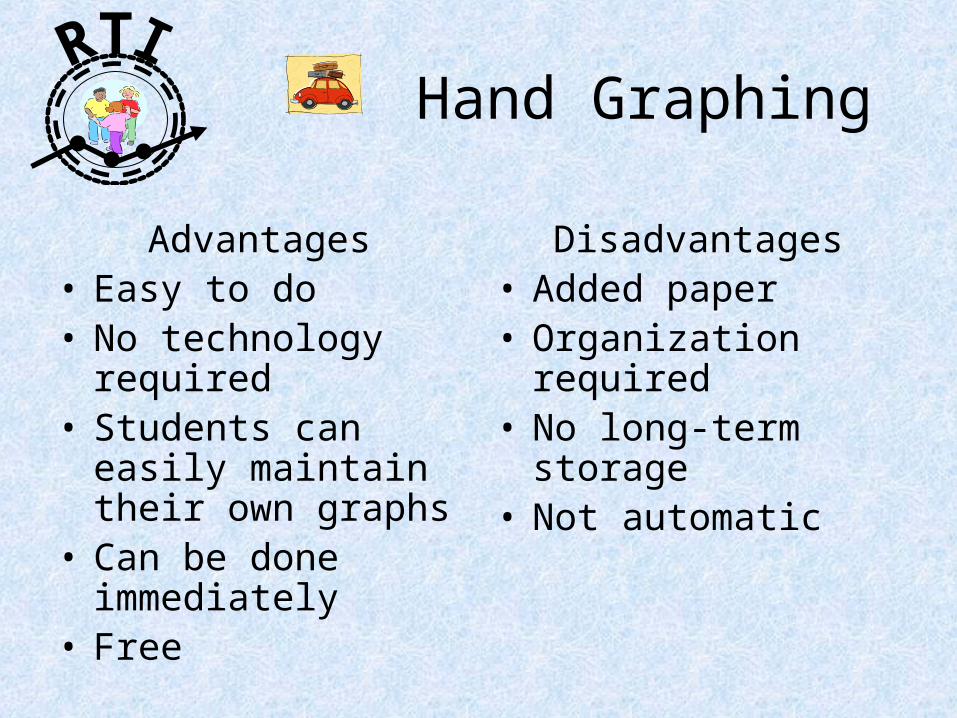
RTI Hand Graphing
Advantages• Easy to do• No technology
required• Students can easily
maintain their own graphs
• Can be done immediately
• Free
Disadvantages• Added paper• Organization required• No long-term storage• Not automatic
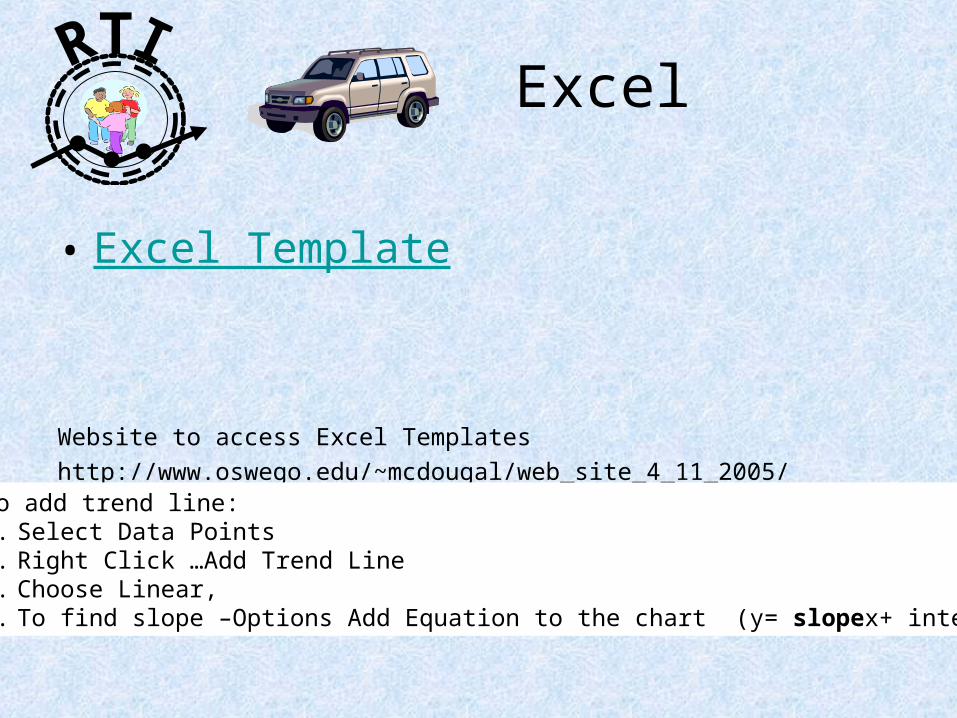
RTIExcel
• Excel Template
Website to access Excel Templates
http://www.oswego.edu/~mcdougal/web_site_4_11_2005/index.html
To add trend line:1. Select Data Points2. Right Click …Add Trend Line3. Choose Linear, 4. To find slope –Options Add Equation to the chart (y= slopex+ intercept)
RTIChart Dog
• Tool at www.interventioncentral.org
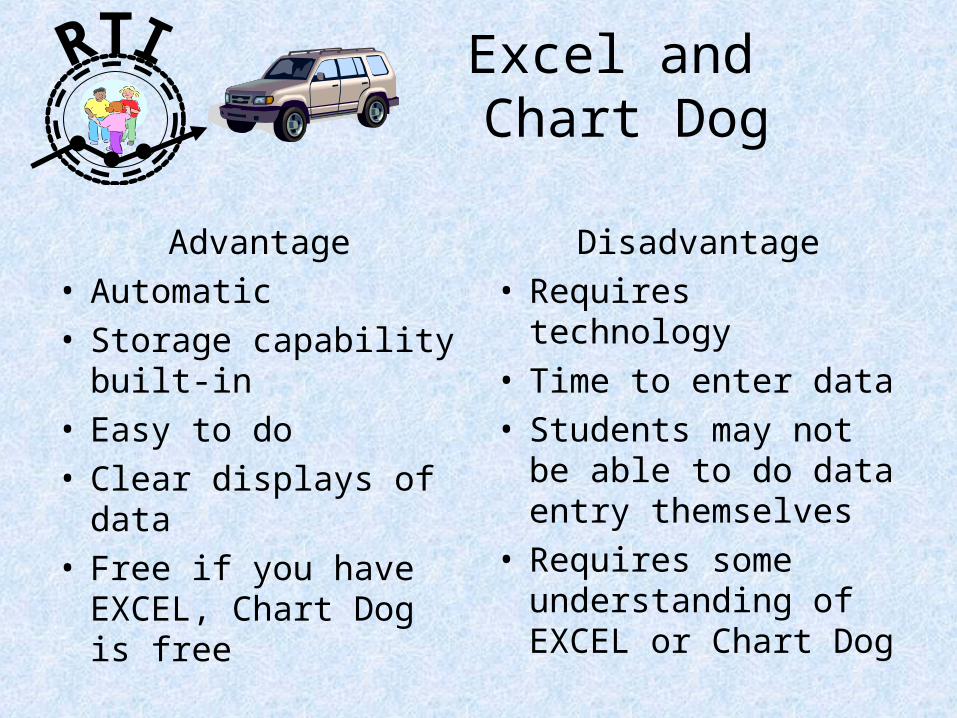
RTI Excel and Chart Dog
Advantage• Automatic• Storage capability
built-in• Easy to do• Clear displays of data• Free if you have
EXCEL, Chart Dog is free
Disadvantage• Requires technology• Time to enter data• Students may not be
able to do data entry themselves
• Requires some understanding of EXCEL or Chart Dog
RTI
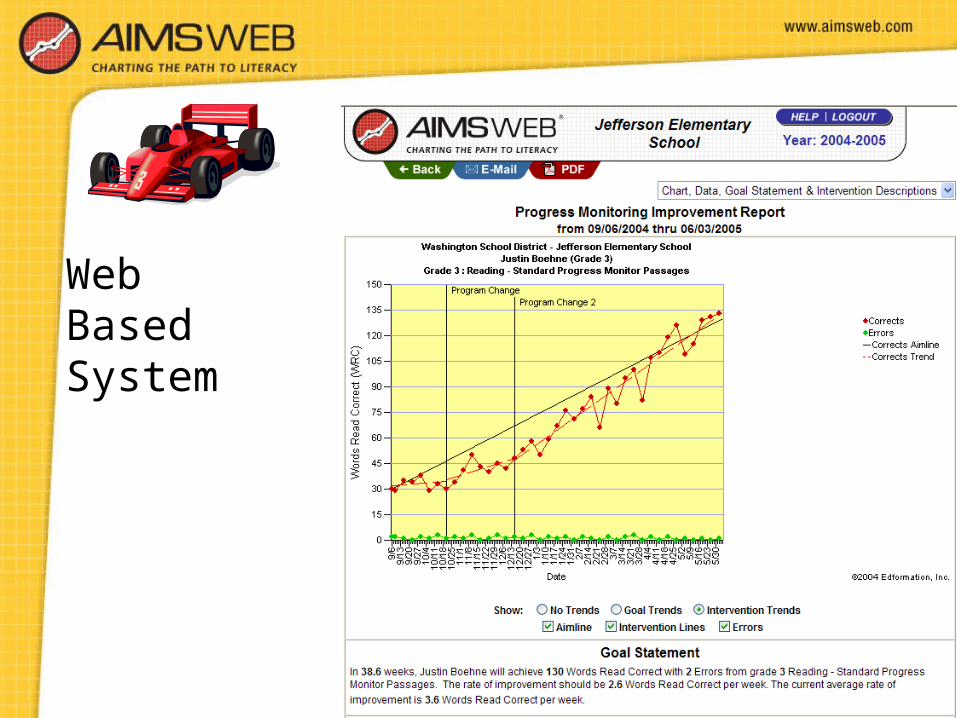
Web Based System
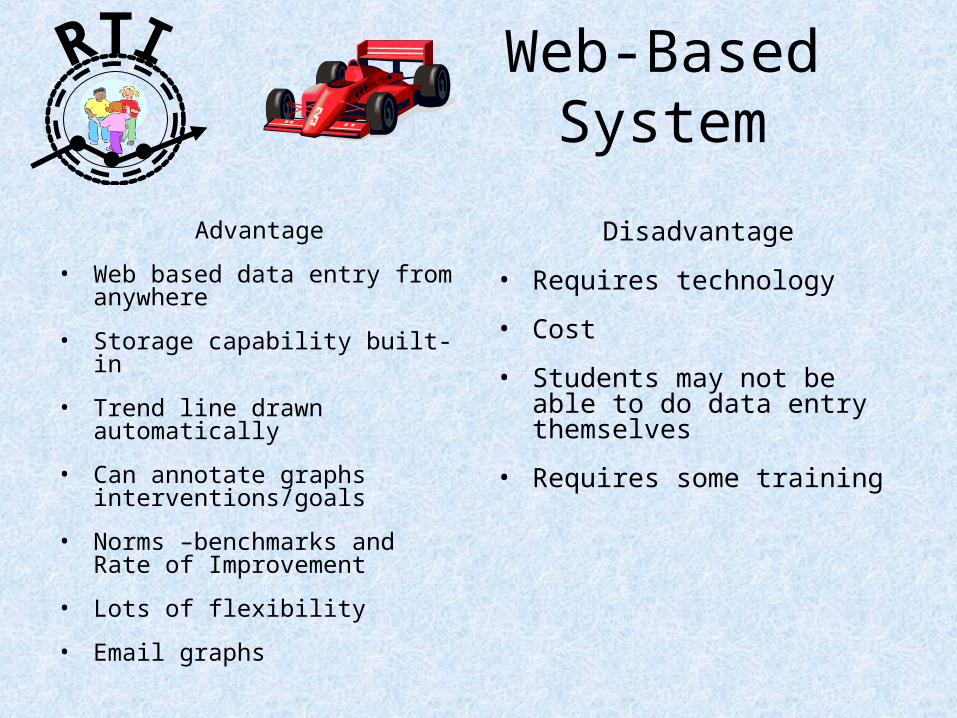
RTI Web-Based System
Advantage
• Web based data entry from anywhere
• Storage capability built-in
• Trend line drawn automatically
• Can annotate graphs interventions/goals
• Norms –benchmarks and Rate of Improvement
• Lots of flexibility
• Email graphs
Disadvantage
• Requires technology
• Cost
• Students may not be able to do data entry themselves
• Requires some training
RTI Graphing and Data Management:
What about our school/district?
1. What do we have in place to graph and manage data?
2. What challenges do we have with graphing and managing data?
3. What do we recommend for graphing and managing data?
4. What steps need to be taken?– Access to materials/technology– Professional Development