Embed Size (px)
Citation preview

SEPTEMBER 30, 2018
RIDLEY
TERMINALS
INC. 2018 Q3 REPORT

RIDLEY TERMINALS INC. Q3 2018 Report For the nine months ended September 30, 2018
1
Table of Contents MANAGEMENT’S DISCUSSION & ANALYSIS .......................................................................... 2
Forward-looking Statements ..................................................................................................... 2 Business Environment ............................................................................................................... 2 Cash Flows ................................................................................................................................ 5 Outlook ...................................................................................................................................... 5 Statement of Financial Position ................................................................................................. 7 Statement of Comprehensive Income ....................................................................................... 8 Statement of Changes in Equity ................................................................................................ 9 Statement of Cash Flows ........................................................................................................ 10
NOTES TO THE FINANCIAL STATEMENTS ............................................................................ 11
1 – Significant changes in the current reporting period ........................................................... 11 2 – Basis of Presentation ........................................................................................................ 11 3 – Significant Accounting Policies .......................................................................................... 12 4 – Investments ....................................................................................................................... 17 5 – Accounts Receivable ......................................................................................................... 17 6 – Inventory ............................................................................................................................ 18 7 – Pension Benefits ............................................................................................................... 18 8 – Property, Plant and Equipment.......................................................................................... 20 9 – Long-Term Debt ................................................................................................................ 21 10 – Deferred Revenue ........................................................................................................... 21 11 – Asset Retirement Obligation ............................................................................................ 21 12 – Sub-lease ........................................................................................................................ 22 13 – Commitments .................................................................................................................. 22 14 – Related Parties ................................................................................................................ 22 15 – Subsequent Events ......................................................................................................... 23
DIRECTORY ............................................................................................................................... 24

RIDLEY TERMINALS INC. Q3 2018 Report For the nine months ended September 30, 2018
2
MANAGEMENT’S DISCUSSION & ANALYSIS Forward-looking Statements Certain statements in this report are forward-looking statements and are not historical facts. Inherent in these forward-looking statements are risks and uncertainties beyond the control or the ability of the Company to predict. Readers are cautioned that future results may vary materially from any results stated or inferred by forward-looking statements contained herein. Business Environment Ridley Terminal Inc. (RTI) has generated $33,727,000 in net operating profit during the first nine months of 2018, compared to $14,084,000 for the same period in 2017. Continued growth in rail and vessel handling volumes are the drivers behind such strong economic results. Total rail and shipping volumes, which are measured in tonnes, for the nine month period are 6,771,073 and 6,734,019 respectively (2017: 5,595,951 and 5,634,272). International coal markets have remained strong, as demand for metallurgical coal is high due to the requirements in India and North Asia. Steel makers continue to secure raw materials, as margins remain high. The approaching winter season is encouraging restocking of coking coal. Imports into both China and India are increasing steadily which has meant the supply of premium coal has struggled to keep up with demand. In the domestic market, volumes are expected to grow during the remainder of 2018 and well into 2019. This growth is supported by Conuma’s Willow Creek Mine which opened during the third quarter of 2018. In addition, Coalspur’s Vista mine complex is scheduled for commercial operation in 2019. The Ridley Island Propane Export Terminal (RIPET) is currently on track to begin operations on April 1, 2019. RIPET is located on lands provided by RTI, through a sub-lease arrangement. This quarter was also characterized by two significant events. The renewal of the sale process and a major equipment failure. In August 2018, the federal government re-announced the sale of Ridley Terminals Inc. Subsequent to the sale renewal, the federal government has also announced that upon the completion of the sale, a 10% share in RTI will be transferred to the Lax Kwa’alaams Band and the Metlakatla First Nation. The equipment failure occurred to a stacker reclaimer on site. This piece of equipment receives incoming coal from a conveyor to stack in coal piles or reclaim previously stacked coal from a yard for loading onto a vessel. As such, it is a key piece of coal handling equipment. The boom of the machine failed while reclaiming coal. No one was injured in this incident. Since the time of the event, management has engaged additional equipment and machinery in order to eliminate any impact on service capabilities to clients. Through these mitigation strategies, handling volumes have not been affected. At the time of writing this report, it appears that the boom of the stacker reclaimer is significantly damaged. Management is currently undertaking several engineering studies to determine the best options available although management cannot reasonably estimate the cost of damage at this time. However, it
RIDLEY TERMINALS INC. Q3 2018 Report For the nine months ended September 30, 2018
3
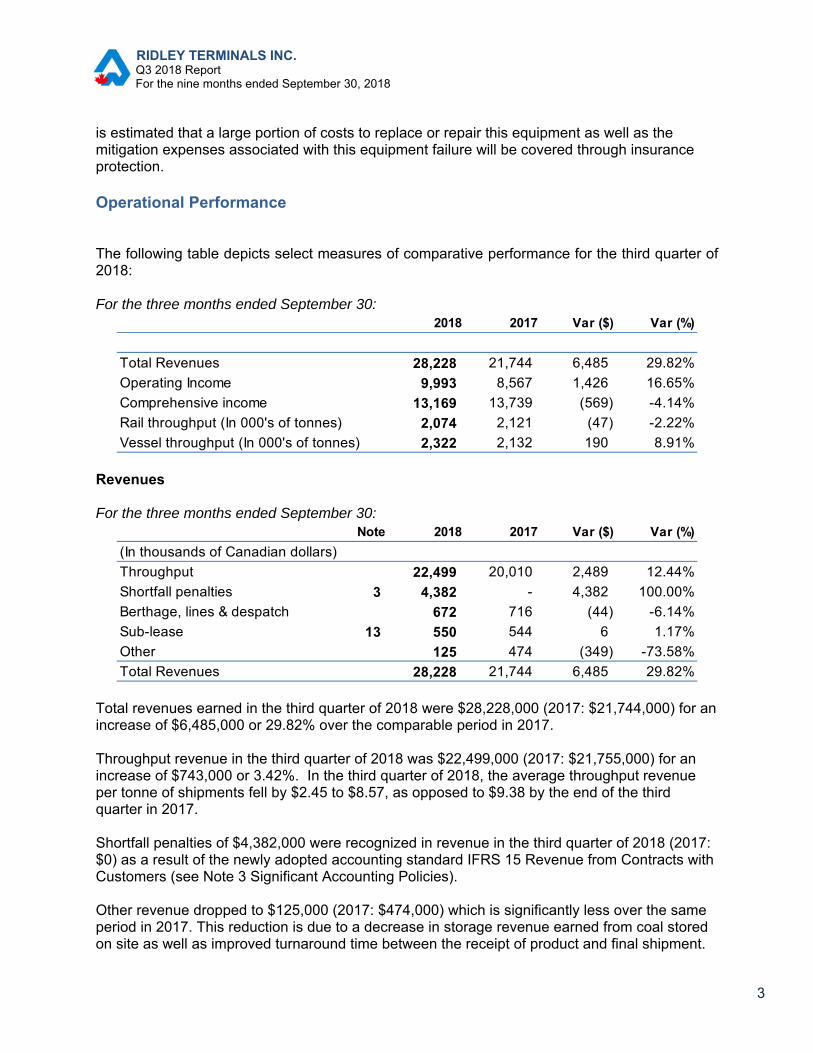
is estimated that a large portion of costs to replace or repair this equipment as well as the mitigation expenses associated with this equipment failure will be covered through insurance protection. Operational Performance The following table depicts select measures of comparative performance for the third quarter of 2018: For the three months ended September 30:
Revenues For the three months ended September 30:
Total revenues earned in the third quarter of 2018 were $28,228,000 (2017: $21,744,000) for an increase of $6,485,000 or 29.82% over the comparable period in 2017. Throughput revenue in the third quarter of 2018 was $22,499,000 (2017: $21,755,000) for an increase of $743,000 or 3.42%. In the third quarter of 2018, the average throughput revenue per tonne of shipments fell by $2.45 to $8.57, as opposed to $9.38 by the end of the third quarter in 2017. Shortfall penalties of $4,382,000 were recognized in revenue in the third quarter of 2018 (2017: $0) as a result of the newly adopted accounting standard IFRS 15 Revenue from Contracts with Customers (see Note 3 Significant Accounting Policies). Other revenue dropped to $125,000 (2017: $474,000) which is significantly less over the same period in 2017. This reduction is due to a decrease in storage revenue earned from coal stored on site as well as improved turnaround time between the receipt of product and final shipment.
2018 2017 Var ($) Var (%)
Total Revenues 28,228 21,744 6,485 29.82%
Operating Income 9,993 8,567 1,426 16.65%
Comprehensive income 13,169 13,739 (569) -4.14%
Rail throughput (In 000's of tonnes) 2,074 2,121 (47) -2.22%
Vessel throughput (In 000's of tonnes) 2,322 2,132 190 8.91%
Note 2018 2017 Var ($) Var (%)
(In thousands of Canadian dollars)
Throughput 22,499 20,010 2,489 12.44%
Shortfall penalties 3 4,382 - 4,382 100.00%
Berthage, lines & despatch 672 716 (44) -6.14%
Sub-lease 13 550 544 6 1.17%
Other 125 474 (349) -73.58%
Total Revenues 28,228 21,744 6,485 29.82%

RIDLEY TERMINALS INC. Q3 2018 Report For the nine months ended September 30, 2018
4
Sub-lease revenue remained constant at $550,000 (2017: $544,000) resulting in a minor increase of $6,000 or 1.17% over the same quarter in 2017. Coal volumes accounted for 87% of total terminal shipments in the third quarter of 2018, with petroleum coke covering the balance at 13%. A total of 26 vessels loaded product at RTI during the third quarter of 2018 compared to 25 vessels in the same period in 2017. Average vessel cargo volumes remained relatively unchanged compared to the same quarter in 2017. Operating Expenses For the quarter ended September 30: (in thousands of Canadian Dollars)
Expenses during the third quarter of 2018 totaled $18,236,000 (2017: $13,176,000) for an increase of $5,059,000 or 38.40% over the prior year’s third quarter. Salaries, wages and benefits overall for the quarter increased to $5,236,000 from $4,645,000 in the same quarter of 2017, for an increase of $591,000 or 12.74%. In the third quarter of 2018, salaries, wages and benefits comprised 28.71% of total expenses. Lease rental expenses during the third quarter of 2018 were $3,554,000 compared to $3,321,000 in the third quarter of 2017, for an increase of $233,000 or 7.03%. In the third quarter of 2018, lease rental expenses comprised 19.49% of total recurring expenses.
$5,236
$3,554
$3,162
$3,030
$1,417$982
$462
$257$74
$62
Salaries, wages & benefits
Lease rental
Equipment, ops & maintenance
Depreciation
Contract & professional services
General & administration
Site utilities
Demurrage
Other
Finance costs
Q3 2018

RIDLEY TERMINALS INC. Q3 2018 Report For the nine months ended September 30, 2018
5
Depreciation expenses rose to $3,030,000 from $1,794,000 in the same quarter of 2017, for an increase of $1,236,000 or 68.85%. This increase in depreciation is a direct result of the asset impairment reversal of $89,740,000 at December 31st, 2017. As the value of PPE was increased, depreciation has therefore increased. During this third quarter of 2018, depreciation expense comprised 16.62% of total recurring expenses. Contract and professional services remained similar to the same quarter of 2017. The third quarter of 2018 totaled $1,417,000 compared to $1,397,000 in 2017 for an increase of $20,000 or 1.41%. Typically, a result of continued commercial and diversification initiatives, outlays in regards to professional services vary from year to year. In the third quarter of 2018, contract and professional service expenses comprised 7.78% of total expenses. Equipment, operations and maintenance expenses saw a large increase in the third quarter of the current year when compared to both the prior quarter as well as the same quarter in the previous year. These costs increased to $3,162,000 in the third quarter (2017: $537,000), for an increase of $2,624,000 or 488.70%. A large portion of the increase is related to the boom failure on the stacker reclaimer. General and administration expenses for the third quarter of 2018 were $982,000 compared to $863,000 in the same quarter of 2017, for an increase of $119,000 or 13.77%. Two contributing factors to this increase were the commencement of rent payments for the Vancouver office as well as an increase to computer software licenses. Site utilities rose to $462,000 from $428,000 in the third quarter of 2018, for an increase of $34,000 or 8.00%. In the third quarter of 2018, site utilities expenses comprised 2.53% of total recurring expenses. Demurrage for the quarter totaled $257,000 (2017: $0). These charges were a result of vessel loading delays while upgrades were being completed on the berth. Cash Flows Cash flows from operating activities amounted to $40,290,000 at the end of Q3 (2017: $50,676,000) for an decrease of $10,386,000 or 20%. This decrease is due to a combination of reduced cash receipts from customers and increased cash payment for salaries, wages and benefits plus suppliers over 2017. Cash used to invest in property, plant and equipment during the first nine months of 2017 resulted in a total outlay of $1,894,000 (2017: an outlay of $966,000) due to planned capital project activity. RTI made no cash investments during 2018 (2017: an outlay of $20,283,000). The only activity for cash flows used in terms or financing was to regular debt repayments. Outlook At September 30, 2018, RTI had working capital available of $170,243,000 (December 31, 2017: $125,437,000) for an increase of $ 44,806,000 or 35.72% and a current ratio of 7.53 (December 31, 2017: 5.77). This increase in working capital was primarily due to increased

RIDLEY TERMINALS INC. Q3 2018 Report For the nine months ended September 30, 2018
6
throughput at the terminal. Management is pleased to maintain sufficient cash to discharge all liabilities and is moving forward with an investment strategy at the time of publishing this report. AltaGas Ltd. continues construction of their LPG Export Facility and with the expectation that the facility will be operational on April 1, 2019. While AltaGas Ltd. operates independently, RTI will assist with the arrival and departures of LPG rail cars and vessels. During the current period, Management continues to forecast moderate growth in volumes handled at the terminal. Forecasted coal and petcoke shipments during the 2018 year are estimated at 8.8 million tonnes, with an increase to 14.3 million tonnes by 2021. Of note, shipments that fall below a customer’s guaranteed minimum trigger a shortfall payment to RTI, which can be rebated back to the customer in a future period, once they reach that current periods’ obligations. For 2018, forecasted shipments remain slightly shy of their guaranteed levels, and RTI anticipates recognizing a modest amount of shortfall revenue during 2018. However, it is important to note that management cannot reasonably estimate the cost of damage and to which degree this will effect throughput volumes for 2018 at this time. As always, management continues to strive for greater efficiency, growth, and productivity. It is with continued confidence that we present RTI’s 2018 Q3 Financial Report. Additional information relating to Ridley Terminals is available on RTI’s website at www.rti.ca. On behalf of the Directors, (Signed) “Marc Dulude” Marc Dulude President and COO November 23, 2018

RIDLEY TERMINALS INC. Q3 2018 Report For the nine months ended September 30, 2018
7
Statement of Financial Position (In thousands of Canadian dollars)
Approved on behalf of the Board: (Signed) “Name” (Signed) “Name” Michael McPhie Shiva Dean Board Chair Audit Committee Chair
September 30 December 31
Note 2018 2017
$ $ASSETS
Current assetsCash 161,765 126,611
Short-term investments 4 20,425 -
Accounts receivable 5 5,661 18,218
Inventory 6 7,458 6,578
Prepaid expenses 1,005 322
196,314 151,729
Non-current assetsLong-term investments 2,500 22,733
Pension benefit asset 7 6,253 2,820
Property, plant and equipment 8 246,643 253,130
255,396 278,683
451,710 430,412 LIABILITIES
Current liabilitiesAccounts payable and other liabilities 10,634 11,024
Current portion of long-term debt 9 7,677 7,508
Current portion of deferred revenue 10 7,760 7,760
26,071 26,292
Non-current liabilitiesDeferred revenue 10 56,012 68,264
Asset retirement obligation 11 7,023 6,869
Other liabilities 171 181
Long-term debt 9 - 5,779
63,206 81,093
89,277 107,385 SHAREHOLDER'S EQUITY
Capital stock 136,042 136,042
Contributed surplus 64,000 64,000
Retained earnings 162,391 122,985
362,433 323,027
451,710 430,412

RIDLEY TERMINALS INC. Q3 2018 Report For the nine months ended September 30, 2018
8
Statement of Comprehensive Income For the period ended September 30 (In thousands of Canadian dollars)
The accompanying notes are an integral part of these condensed financial statements.
Note 2018 2017 2018 2017
$ $ $ $
REVENUES
Throughput 22,499 20,010 69,496 51,204
Shortfall penalties 3 4,382 - 9,837 -
Berthage, lines & despatch 672 716 2,173 1,723
Sub-lease 12 550 544 1,656 1,256
Other 125 474 457 1,333
Net Asset Impairment Reversal - - -
28,228 21,744 83,619 55,516
EXPENSES
Salaries, wages and benefits 5,236 4,645 16,351 14,297
Lease rental 13 3,554 3,321 10,431 9,749
Depreciation 8 3,030 1,795 8,881 5,419
Contract and professional services 1,417 1,397 4,448 4,405
Equipment, operations & maintenance 8 3,162 537 4,620 2,616
General and administration 982 863 2,926 2,765
Site utilities 462 428 1,585 1,492
Finance costs 62 120 224 387
Other 74 71 155 241
Demurrage 257 - 271 50
Management services - - - 11
18,236 13,177 49,892 41,432
NET OPERATING INCOME 9,993 8,567 33,727 14,084
Interest income 747 370 1,910 967
Net foreign exchange gain (loss) (26) (31) 23 (61) NET INCOME 10,714 8,906 35,660 14,990 OTHER COMPREHENSIVE INCOME (LOSS)
Defined benefit plan gains (losses) 7 2,455 4,833 3,746 (416) TOTAL COMPREHENSIVE INCOME 13,169 13,739 39,406 14,574
Nine months ended September 30,
Three months ended September 30,
RIDLEY TERMINALS INC. Q3 2018 Report For the nine months ended September 30, 2018
9
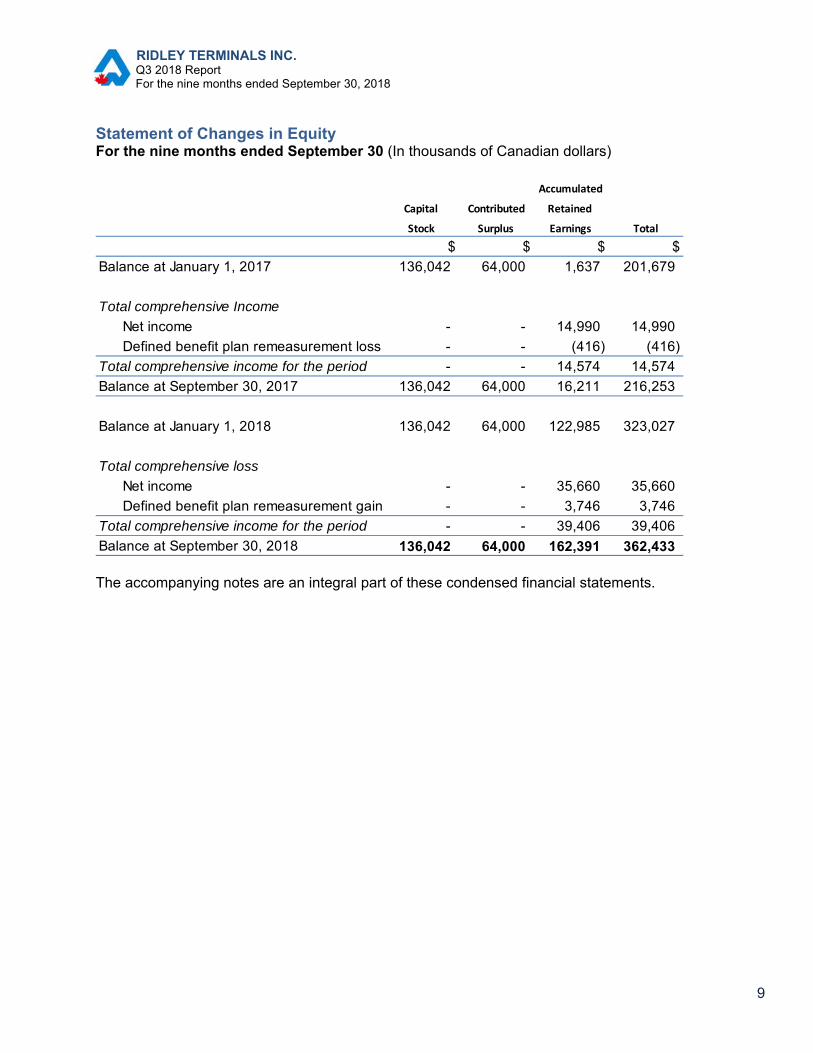
Statement of Changes in Equity For the nine months ended September 30 (In thousands of Canadian dollars)
The accompanying notes are an integral part of these condensed financial statements.
Accumulated
Capital Contributed Retained
Stock Surplus Earnings Total
$ $ $ $
Balance at January 1, 2017 136,042 64,000 1,637 201,679
Total comprehensive Income
Net income - - 14,990 14,990
Defined benefit plan remeasurement loss - - (416) (416)
Total comprehensive income for the period - - 14,574 14,574
Balance at September 30, 2017 136,042 64,000 16,211 216,253
Balance at January 1, 2018 136,042 64,000 122,985 323,027
Total comprehensive loss
Net income - - 35,660 35,660
Defined benefit plan remeasurement gain - - 3,746 3,746
Total comprehensive income for the period - - 39,406 39,406
Balance at September 30, 2018 136,042 64,000 162,391 362,433

RIDLEY TERMINALS INC. Q3 2018 Report For the nine months ended September 30, 2018
10
Statement of Cash Flows For the nine months ended September 30 (In thousands of Canadian dollars)
The accompanying notes are an integral part of these condensed financial statements.
Note 2018 2017
$ $
OPERATING ACTIVITIES
Cash receipts from customers 81,046 64,680
Cash receipts from sub-lessee 12 - 25,000
Interest received 1,909 968
Cash paid for salaries, wages and benefits (16,242) (13,024)
Defined benefit & defined contribution plan 7 (1,022) (2,874)
Cash paid to suppliers (12,958) (11,481)
Cash paid for lease rental (12,443) (12,593)
Cash flows from operating activities 40,290 50,676
INVESTNG ACTIVITIES
Cash paid to purchase property, plant and equipment (1,894) (966)
Cash paid to purchase investments - 307
Cash flows received from (used in) investing activities (1,894) (659) FINANCING ACTIVITIES
Repayment of long-term debt (5,610) (5,448)
Financing costs paid (155) (387)
Cash flows used in financing activities (5,765) (5,835)
Net increase (decrease) in cash and cash equivalents 32,631 44,182
Cash and cash equivalents, beginning of the year 129,111 76,080
Effect of exchange rate fluctuations on cash held 23 (61)
Cash and cash equivalents, end of the quarter 161,765 120,201

RIDLEY TERMINALS INC. Q3 2018 Report For the nine months ended September 30, 2018
11
NOTES TO THE FINANCIAL STATEMENTS 1 – Significant changes in the current reporting period The financial position and performance of RTI was particularly affected by the following events and transactions during the three months ended September 30st, 2018:
Stacker Reclaimer Boom failure (refer to notes 8 and 15) With the adoption of IFRS 15 Revenue from Contracts with Customers an additional
shortfall payment was recognized in the period ending September 30th, 2018 Long term debt was extinguished and short term debt repayments will continue until
August of 2019 (no new debt was created) For a more detailed discussion about the Company’s performance and financial
position, refer to Management’s Discussion & Analysis on pages 2 to 6 of the Q3 2018 Report
2 – Basis of Presentation Statement of Compliance These unaudited condensed consolidated interim financial statements have been prepared in accordance with International Accounting Standards (IAS) 34 Interim Financial Reporting. Selected explanatory notes are included to explain events and transactions that are significant to an understanding of the changes in financial position and performance since the last annual financial statements as at and for the year ended December 31, 2017. These unaudited condensed interim financial statements do not include all of the information required for full annual financial statements prepared in accordance with International Financial Reporting Standards (IFRS). Therefore, these interim financial statements should be read in conjunction with the annual financial statements for the year ended December 31st, 2017. These interim financial statements were authorized for issue by the Board on November 30th, 2018.

RIDLEY TERMINALS INC. Q3 2018 Report For the nine months ended September 30, 2018
12
3 – Significant Accounting Policies Except as described below, these financial statements have been prepared using the significant accounting policies and methods consistent with those applied in the Annual Report for the year ended December 31, 2017. RTI has initially adopted IFRS 15 Revenue from Contracts with Customers and IFRS 9 Financial Instruments from January 1, 2018. The adoption of the new standards does not have a material effect on RTI’s financial statements. The new accounting policies, set out below, have been applied from January 1, 2018 and will be reflected in the financial statements as at and for the year ending December 31, 2018. IFRS 15, Revenue from Contracts with Customers (“IFRS 15”)
a) IFRS 15 – Impact of Adoption Effective January 1, 2018, the Company adopted IFRS 15 which replaced IAS 18 Revenue and a number of revenue related standards and interpretations. IFRS 15 contains a single model that applies to contracts with customers and two approaches to recognizing revenue: at a point in time or over time. The model features a contract-based five-step analysis of transactions to determine whether, how much and when revenue is recognized. New estimates and judgmental thresholds have also been introduced, which may affect the amount and/or timing of revenue recognized. In addition, the standard requires certain contract acquisition costs to be recorded as an asset and amortized into expenses over time. The Company adopted IFRS 15 using the modified retrospective approach as follows: (a) on a retrospective basis, with the cumulative effect of the standard being recognized at the date of initial application (January 1, 2018), with no restatement of prior year financial statements and (b) applying IFRS 15 only to contracts not completed as of January 1, 2018. There was no cumulative transition effect recognized on January 1, 2018 as a result of adopting IFRS 15. The adoption of this standard did not impact the measurement of revenue generated from the provision of services to customers, such as throughput revenue. However, it impacted the recognition of revenues related to shortfall penalties – a non-cash transaction that is offset by deferred revenue (a contract liability). Shortfall penalties recognized for the three- and nine-months ended September 30, 2018 were $4,382,000 and $9,837,000 respectively (September 30, 2017 - $0).
b) IFRS 15 – Accounting policies (i) Throughput revenue Throughput revenue is earned for unloading customers’ bulk materials from rail cars and loading those materials on to ships. Total throughput revenue is determined by multiplying a customer’s contracted throughput rate by the number of tonnes handled. Revenue is recognized as follows: For contracts where billing is expected to correspond directly with the value to the customer
of the Company’s performance completed to date, the Company applies the practical expedient allowing it to recognize revenue when it has the right to invoice the customer.

RIDLEY TERMINALS INC. Q3 2018 Report For the nine months ended September 30, 2018
13
For contracts where billings are not expected to correspond with the value of performance
completed to date, the Company will measure progress for throughput services based on tonnes loaded and unloaded.
Customer deposits are payments made by customers in consideration for a contractual obligation of the Company to supply throughput capacity in future periods. These payments are classified as deferred revenue (a contract liability) and recognized as throughput revenue as described above or when the customer relinquishes its contractual rights. Customer options are payments made by customers for the right to make a deposit and reserve throughput capacity in future periods. These payments are classified as deferred revenue (a contract liability). If an option lapses, it is recognized as throughput revenue. If an option is exercised, the option payment is deemed to be part of the total consideration received for the reserved throughput capacity, and the option payment is recognized as throughput revenue as described above. Customer deposits and options do not have a significant financing component since the customer has paid for the throughput capacity services in advance and the timing of the throughput is at the discretion of the customer. (ii) Shortfall penalties Customer contracts that include shortfall penalties require customers to process a minimum volume of bulk materials each contract year and incur a shortfall penalty should this minimum not be attained. Actual shortfall invoices for penalties are issued when incurred. Some contracts allow customers to apply the penalty to throughput charges in future years when the minimum volume required per the contract is exceeded in those years. Revenue is recognized as follows: For contracts that do not allow a customer to apply the penalty in future years, shortfall
penalties are recognized as revenue when incurred. If a contract allows a customer to apply the penalty to throughput charges in future years,
the penalty amount is recognized in deferred revenue (a contract liability). Deferred amounts received are recognized as revenue when excess volume to recover shortfall amounts is no longer practicably feasible.
The penalty does not include a significant financing component.
(iii) Berthage, lines and dispatch Berthage is earned for docking and undocking ships at the Company’s berth and is
recognized as revenue when the service is performed.
Lines revenue is earned for securing ships to the Company’s berth during vessel loading and is recognized as revenue when the ships are secured.

RIDLEY TERMINALS INC. Q3 2018 Report For the nine months ended September 30, 2018
14
Despatch revenue is an incentive payment earned by loading ships faster than the stipulated standard timeframe and is recognized as revenue when the Company is entitled to the payment. The Company does not include the incentive payment as part of the total throughput contract price.
(iv) Other Other revenue includes revenue related to storage fees and other miscellaneous revenue earned by the Company. This revenue is recognized when related services are performed. IFRS 9, Financial Instruments (“IFRS 9”)
a) IFRS 9 – Impact of Adoption Effective January 1, 2018, the Company adopted IFRS 9, which replaced the multiple classification and measurement models in IAS 39 Financial Instruments: Recognition and Measurement, with a single model that has two classification categories: amortized cost and fair value. IFRS 9 also replaced the incurred loss impairment model in IAS 39 with a forward-looking expected credit loss impairment model. The Company adopted IFRS 9 on a retrospective basis without restatement of prior periods. The adoption of IFRS 9 did not have an impact on the financial statements given the nature of the Company's operations and the types of financial instruments that it currently holds. There was no cumulative transition effect recognized on January 1, 2018 as a result of adopting IFRS 9. The table below includes the categories of financial assets and liabilities determined in accordance with IAS 39 that are now classified as subsequently measured at amortized cost under IFRS 9. There were no changes to the original carrying amounts determined in accordance with IAS 39 as at January 1, 2018.
Original classification
under IAS 39 New classification
under IFRS 9 Carrying
Amount IAS 39 Carrying
Amount IFRS 9 (In thousands of Canadian dollars) $ $
Cash and cash equivalents
Fair value through profit/loss Amortized cost
126,611 126,611
Accounts receivable Loans and receivables Amortized cost 18,218 18,218
Investments Loans and receivables Amortized cost 22,733 22,733
Accounts payable and accrued liabilities
Amortized cost Amortized cost
11,024 11,024
Long‐term debt Amortized cost Amortized cost 13,287 13,287
The application of the expected credit loss model to determine the allowance for doubtful accounts resulted in no change to the opening balance of accounts receivable at January 1, 2018.

RIDLEY TERMINALS INC. Q3 2018 Report For the nine months ended September 30, 2018
15
b) IFRS 9 – Accounting policies (i) Financial Assets Classification The Company’s financial assets include:
cash and cash equivalents, short-term and long-term investments, and accounts receivable,
These financial assets are classified as subsequently measured at amortized cost. The Company’s business model is to hold the assets to collect the contractual cash flows. The investments are comprised of fixed-term guaranteed investments that provide guaranteed principal and interest payments on specified dates. Measurement At initial recognition, the Company measures its financial assets at fair value plus any transaction costs that are directly attributable to the acquisition of the financial asset. The investments and accounts receivable are subsequently measured at amortized cost using the effective interest rate EIR) method, less impairment. Amortized cost is calculated by taking into account any discount or premium on acquisition and fees or costs that are an integral part of the EIR. The EIR amortization is included in interest income in the statement of comprehensive income. The losses arising from impairment are recognized in net operating profit or loss in the statement of comprehensive income. Impairment The Company recognizes loss allowances where the expected credit losses result from all possible default events over the expected life of a financial asset. For trade receivables, the Company applies the simplified approach permitted by IFRS 9, which requires expected lifetime losses to be recognized from initial recognition of the receivables. Derecognition A financial asset is primarily derecognized when the rights to receive cash flows from the asset have expired, or the Company has transferred its rights to receive cash flows from the asset and has transferred substantially all the risks and rewards of the asset. (ii) Financial Liabilities Initial recognition and measurement The Company’s financial liabilities include accounts payable and other liabilities, and long-term debt. Financial liabilities are recognized initially at fair value and, in the case of long-term debt and payables, net of directly attributable transaction costs.

RIDLEY TERMINALS INC. Q3 2018 Report For the nine months ended September 30, 2018
16
Subsequent measurement After initial recognition, the long-term debt is subsequently measured at amortized cost using the EIR method. Gains and losses are recognized in net operating profit or loss in the statement of comprehensive income when liabilities are derecognized. Amortized cost is calculated by taking into account any discount or premium on acquisition and fees or costs that are an integral part of the EIR. The EIR amortization is included as finance costs in the statement of comprehensive income. Derecognition A financial liability is derecognized when the obligation under the liability is discharged or cancelled, or expires. Accounting Standards Issued But Not Yet Effective IFRS 16: Leases
In January 2016, the IASB issued IFRS 16 Leases, which supersedes IAS 17 Leases. IFRS 16 establishes principles for the recognition, measurement, presentation and disclosure of leases. The standard establishes a single model for lessees to recognize and measure leases on-balance sheet as right-of-use assets and liabilities for future payments. Lessor accounting remains largely unchanged, with the exception of subleases, and retains the finance and operating lease distinctions. The standard requires lessees to recognize assets and liabilities for all leases unless the lease term is 12 months or less or the underlying asset has a low value. IFRS 16 is effective for annual periods beginning on or after January 1, 2019 with earlier adoption permitted. The Company is currently evaluating the impact of IFRS 16 on its financial statements and does not intend to early adopt the standard. The Company anticipates the adoption of IFRS 16 to have an impact on the financial statements, however, the extent of the anticipated impact is not known at this time. Specifically, the Company has two lease agreements, whereby the Company is a lessee and an intermediate lessor, that will be impacted by the adoption of IFRS 16 as follows: 1. Head-Lease (lessee): The Company leases land from the Prince Rupert Port Authority
(PRPA) for its terminal facility. The thirty-year lease term expires on March 31, 2039 and has a renewal option for an additional twenty years to 2059. Under the lease agreement with the PRPA, the Company is required to make minimum annual rent payments based on the yearly minimum tonnes processed at a rate of $0.65 per tonne (CPI adjusted per year based on the lease year ending March 31st). The lease is currently classified as an operating lease under IAS 17. The Company has not yet determined the impact to the financial statements of the head-lease.
2. Sub-lease (intermediate lessor): The Company has sub-leased a portion of the land it leases from the PRPA to AltaGas (sub-lessee). The sub-lease began in 2017 and expires in 2039, with an option to renew the sub-lease for an additional 20 years to 2059. The option to

RIDLEY TERMINALS INC. Q3 2018 Report For the nine months ended September 30, 2018
17
renew is at the discretion of the sub-lessee. The Company has received advances from the sublesee that are recognized as deferred revenue. Refer to Note 11 Deferred Revenue and Note 13 Sub-lease for further details. The sublease is currently classified as an operating lease under IAS 17. Under IFRS 16, the sublease will be classified as a finance lease or an operating lease by reference to the right-of-use asset arising from the head lease (described in 1. above). The Company has not yet determined the impact to the financial statements of the sublease.
The following significant implementation matters related to the adoption of IFRS 16 will be addressed throughout the remainder of 2018:
the transition approach that the Company will apply; the practical expedients that the Company may choose; and the recognition, measurement, presentation and disclosures for the head-lease and
sublease described above. The Company does not anticipate any significant system or process changes as a result of the adoption of IFRS 16. The Company expects to disclose more detailed information, including the transition approach, the practical expedients applied and the estimated quantitative financial effects, in the financial statements for the year ended December 31, 2018. 4 – Investments Investments held in GICs maturing on February 12th with an interest rate of 1.3% are included in current assets. There were no changes to investments during the period. 5 – Accounts Receivable
The allowance for doubtful accounts is related to a receivable is due from one customer that over a year past due. Other accounts receivable consists of net recoverable GST and miscellaneous receivables.
September 30 December 31
2018 2017
(In thousands of Canadian dollars) $ $
Trade 5,252 17,770
Allowance for doubtful accounts (160) (160)
Net trade receivable 5,092 17,610
Other 569 608
Total accounts receivable 5,661 18,218

RIDLEY TERMINALS INC. Q3 2018 Report For the nine months ended September 30, 2018
18
6 – Inventory The amount expensed as a result of write-downs of inventory to net realizable value during the quarter was $0 and the total for the year-to-date period ended September 30th was $2,400 (2017: $140 and $4,770 respectively). The amount of inventory expensed during the quarter was $59,000 (2017: $217,000). 7 – Pension Benefits Defined Contribution Pension Plan The defined contribution plan expenses for the quarter and nine-months ended September 30, 2018 were $93,400 and $284,800 respectively (2017: $75,900 and $233,700 respectively). Defined Benefit Pension Plan The movement in the defined benefit obligation over the quarter is as follows:
September 30 December 31
(In thousands of Canadian dollars) 2018 2017
Defined benefit obligations, beginning of period 75,738 67,674
Current service costs 1,777 2,164
Past service costs - -
Interest expense 2,048 2,706
Benefits paid by the plan (1,512) (1,837)
Contributions by plan participants 372 424
Remeasurements -
- Effect of changes in demographic assumptions - -
- Effect of changes in financial assumptions (4,464) 5,239
- Effect of experience adjustments - (632)
Defined benefit obligations, end of period 73,959 75,738

RIDLEY TERMINALS INC. Q3 2018 Report For the nine months ended September 30, 2018
19
The movement in the fair value of plan assets over the quarter is as follows:
The (asset) liability in the statement of financial position is summarized below:
September 30 December 31
(In thousands of Canadian dollars) 2018 2017
Fair value of plan assets, beginning of year 78,558 70,924
Interest income 2,170 2,892
Contributions by the Company 1,460 3,151
Contributions by plan participants 372 424
Benefits paid by the plan (1,512) (1,837)
Administrative expenses paid from plan assets (118) (157)
Return on plan assets (excluding interest income) (718) 3,161
Fair value of plan assets, end of year 80,212 78,558
September 30 December 31
(In thousands of Canadian dollars) 2018 2017
Defined benefit obligations 73,959 75,738
Fair value of plan assets (80,212) (78,558)
Net (asset) liability (6,253) (2,820)

RIDLEY TERMINALS INC. Q3 2018 Report For the nine months ended September 30, 2018
20
8 – Property, Plant and Equipment
During the period, there were no major changes in property, plant and equipment. Depreciation for the quarter was $3,030,000 (2017: $1,795,000). This increase in depreciation is a direct result from the impairment reversal as at December 31, 2017. During the quarter, the Company recognized $880,000 (2017: $0) of additional expenditures in the amount of Terminal Facility assets from construction activity. As mentioned earlier in the report, the boom of a stacker reclaimer (SR301) failed while reclaiming coal. As the SR301 was an original piece of equipment, the total asset was almost fully depreciated at the time of the event, therefore no impairment of the boom was necessary. The costs incurred related to the SR301 failure during the reporting period was $2,247,000. However, management expects a portion of these costs to be reversed and capitalized as they relate to boom repair or replacement.
Enclosed Wood Machinery Office
Terminal Sulphur Dry Bulk Pellet and Equipment
Facility Terminal Storage Terminal Equipment and Furniture Total
(In thousands of Canadian dollars) $ $ $ $ $ $ $
Cost
Balance at December 31, 2016 465,875 - 3,855 909 10,693 2,794 484,126
Additions 915 - - - 25 45 985
Disposals (42) - - - - - (42)
Balance at December 31, 2017 466,748 - 3,855 909 10,718 2,839 485,069
Additions 2,319 - - - - 74 2,393
Disposals (104) - - - - - (104)
Balance at September 30, 2018 468,963 - 3,855 909 10,718 2,913 487,359
Accumulated Depreciation and Impairment Losses
Balance at December 31, 2016 303,318 - - 909 7,537 2,565 314,329
Depreciation for the year 6,943 - - - 352 55 7,350
Disposals (88,785) - - - (955) - (89,740)
Balance at December 31, 2017 221,476 - - 909 6,934 2,620 231,939
Depreciation for the year-to-date 8,183 - - - 563 31 8,777
Disposals - - - - - - -
Balance at September 30, 2018 229,659 - - 909 7,497 2,651 240,716
Carrying Amounts
At December 31, 2017 245,272 - - - 3,784 219 253,130
At September 30, 2018 239,304 - 3,855 - 3,221 263 246,643

RIDLEY TERMINALS INC. Q3 2018 Report For the nine months ended September 30, 2018
21
9 – Long-Term Debt As at September 30, 2018, estimated principal repayments on outstanding long-term debt are as follows:
The final scheduled payment occurs in August of 2019. Fair value approximates carrying values since the debt is repayable within one year. 10 – Deferred Revenue
11 – Asset Retirement Obligation
During the quarter, there were no changes made in estimates or assumptions relating to the Asset Retirement Obligation.
(In thousands of Canadian dollars) $
1,898
5,779
Total 7,677
2018
2019
September 30
2018 2018 2018 2018
Opening Additions Reductions Ending
(In thousands of Canadian dollars) $ $ $ $ $
Deposits 13,224 - - 759 12,465
Shortfall penalties 16,044 - 9,837 - 6,207
Sub-lease 46,756 - 1,656 - 45,100
76,024 - 11,493 759 63,772
2018 Shortfall penalties &
Sublease Revenue Recognized
September 30 December 31
2018 2017
(In thousands of Canadian dollars) $ $
Balance, beginning of year 6,869 7,199
Reclass to deferred revenue - (546)
Accretion expense 154 216
Balance, end of year 7,023 6,869

RIDLEY TERMINALS INC. Q3 2018 Report For the nine months ended September 30, 2018
22
12 – Sub-lease The Company has recognized the amounts already received as sub-lease deferred revenue (Note 10), and is recognizing revenue on a straight-line basis over the initial lease period. The expected amounts to be recognized in revenue over the term of the sub-lease are as follows:
In the quarter ending September 30th 2018, $550,000 (2017: $544,000) was recognized in sub-lease revenue. 13 – Commitments Lease Rental For the quarter ended September 30, 2018, the Company made $1,651,000 (2017: $1,489,000) in lease payments to PRPA, out of $14,216,000 in minimum rent due for the contract year (2018: $13,294,000). 14 – Related Parties Government of Canada The Company is related to all Government of Canada departments, agencies and Crown corporations. The lease agreement with the PRPA (Note 13) is a related party transaction.
(In thousands of Canadian dollars)
Total 55,108
2018 550
2019 2,576
2020 2,701
2021 2,701
2022 2,701
Subsequent years 43,879

RIDLEY TERMINALS INC. Q3 2018 Report For the nine months ended September 30, 2018
23
Key Management Compensation The compensation for key management, which includes the Company’s directors and current President and COO, in respect of employee services is as follows:
Each of the Company’s directors is appointed to office by the Governor in Council. Each appointment contains an Order in Council for authority to pay, which establishes an annual retainer and per diem rate. The President and COO is appointed by the Company’s Board of Directors, who authorize compensation and benefits. 15 – Subsequent Events Stacker Reclaimer Boom Failure - Insurance Advance Payment Offer During the third quarter of 2018, RTI’s insurance underwriter made a conditional advance payment offer of $2,000,000 to help offset a portion of the expenses associated with the equipment failure. This offer was conditional on the detailed submission of initial expenses as well as acceptance of the offer. Subsequent to September 30, 2018, upon submission of a detailed expense listing, the insurance underwriter revised their advance payment offer to $5,000,000, which RTI has accepted. The Company recognizes the insurance advance payment in net income when it becomes receivable, which is when the Company has an unconditional legal right to receive the payment. This amount will be recognized in net income as partial insurance proceeds within the final quarter of 2018. It is important to note that this advance payment does not reflect or impact the total cost of the insurance claim in any way. It is understood by all parties that this advance payment is to assist with cash requirements of RTI. Multiple Car Derailment On the morning of October 31st, 2018 a rail incident occurred at RTI whereby up to 8 rail cars were significantly damaged. It is important to note that management cannot reasonably estimate the cost of damage at this time. Throughput volumes were not affected by the derailment.
September 30 September 30
2018 2017
(In thousands of Canadian dollars) $ $
Wages, bonus and short-term benefits 460 356
Post-employment benefits 28 28
488 384

RIDLEY TERMINALS INC. Q3 2018 Report For the nine months ended September 30, 2018
24
DIRECTORY Directors Corporate Secretary Senior Management Liza Aboud Rebecca Rock Dennis Blake Businessperson Vancouver, BC Senior Manager Burnaby, BC Cordell Dixon, CPA,CMA David E.G. Bromley Officers Senior Controller Businessperson West Vancouver, BC Michael McPhie Chairman Corporate Affairs Shiva Dean* Businessperson Marc Dulude Colin Metcalfe St. Albert, AB President & COO VP of Corp. Affairs Gillian Kirk Businessperson Port Coquitlam, BC Melanie MacKay Businessperson Richmond, BC Catherine Wade Businessperson Delta, BC * Chair of Audit Committee
Legal Counsel For further information McMillan LLP please contact: Vancouver, BC Jennifer Robb, CPA,CMA External Auditors Controller The Office of the Telephone 250 627-3542 Auditor General of Canada Facsimile 250 624-2389 Vancouver, BC E-mail [email protected] www.rti.ca Or write to: Ridley Terminals Inc. P.O. Bag 8000 Prince Rupert, BC V8J 4H3