Embed Size (px)
Citation preview
H:\Files\TGOLD\11048\Integrated Discharge Permit\R17 Permit Application Narrative.Docx\\12/11/17\065 12/11/17\7:28 AM
INTEGRATED DISCHARGE PERMIT APPLICATION NARRATIVE
BLACK BUTTE COPPER PROJECT
MEAGHER COUNTY, MONTANA
Submitted by:
Tintina Montana, Inc. Black Butte Copper Project
P.O. Box 431 White Sulphur Springs, MT 59645
406-547-3466
Prepared by:
Hydrometrics, Inc. 3020 Bozeman Ave. Helena, MT 59601
December 2017
H:\Files\TGOLD\11048\Integrated Discharge Permit\R17 Permit Application Narrative.Docx\\12/11/17\065
ii 12/11/17\7:28 AM
TABLE OF CONTENTS
LIST OF TABLES ...........................................................................................................iii
LIST OF FIGURES .........................................................................................................iv
LIST OF APPENDICES ..................................................................................................v
1.0 INTRODUCTION .....................................................................................................1-1
1.1 INTEGRATED PERMIT APPLICATION STRUCTURE ...........................1-1
1.2 BRIEF PROJECT BACKGROUND .............................................................1-2
2.0 FORMS AND FOOTNOTES ....................................................................................2-1
2.1 FOOTNOTES FOR FORM 1 ........................................................................2-1
2.2 FOOTNOTES FOR FORM 2D .....................................................................2-2
2.3 FOOTNOTES FOR FORM 2F ......................................................................2-3
3.0 PERMIT TO DISCHARGE PROCESS WASTEWATER – NEW SOURCE .........3-1
3.1 ALLUVIAL OUTFALL DESCRIPTIONS ...................................................3-1
3.2 RECEIVING WATERS.................................................................................3-5
3.2.1 Receiving Water Quality .................................................................3-7
3.2.2 Receiving Water Flows ...................................................................3-10
3.3 SITE WATER MANAGEMENT ..................................................................3-11
3.3.1 Technology Based Effluent Limitation Guidelines (ELGs) ...........3-14
3.4 WATER TREATMENT ................................................................................3-18
3.4.1 Raw Water Quality .........................................................................3-18
3.4.2 Selected Water Treatment System ..................................................3-22
3.4.3 Treated Effluent Water Quality ......................................................3-23
3.5 NONDEGRADATION ANALYSIS .............................................................3-23
3.5.1 Water Protection Classification ......................................................3-24
3.5.2 Nonsignificance Criteria and Analysis ...........................................3-24
4.0 STORM WATER.......................................................................................................4-1
4.1 STORM WATER OUTFALL DESCRIPTIONS ..........................................4-1
4.2 OUTFALL FLOW CALCULATIONS .........................................................4-4
4.3 STORM WATER QUALITY ........................................................................4-4
4.4 DRAINAGE CONTROL ...............................................................................4-6
H:\Files\TGOLD\11048\Integrated Discharge Permit\R17 Permit Application Narrative.Docx\\12/11/17\065
iii 12/11/17\7:28 AM
4.5 EROSION CONTROL METHODS AND BEST MANAGEMENT
PRACTICES (BMPs) .................................................................................4-10
4.5.1 Specific Construction BMPs ...........................................................4-12
5.0 WATER RESOURCE AND COMPLIANCE MONITORING ................................5-1
5.1 OPERATIONAL WATER RESOURCE MONITORING PLAN ................5-1
5.2 WATER TREATMENT PLANT EFFLUENT COMPLIANCE
MONITORING ...........................................................................................5-4
5.3 TRIGGER LEVEL VALUES FOR IMPLEMENTATION OF
MITIGATIONS AND DEQ NOTIFICATIONS ........................................5-5
6.0 SAGE GROUSE ........................................................................................................6-1
7.0 CERTIFICATION AND SIGNATORY PAGE ........................................................7-1
8.0 REFERENCES ..........................................................................................................8-1
LIST OF TABLES
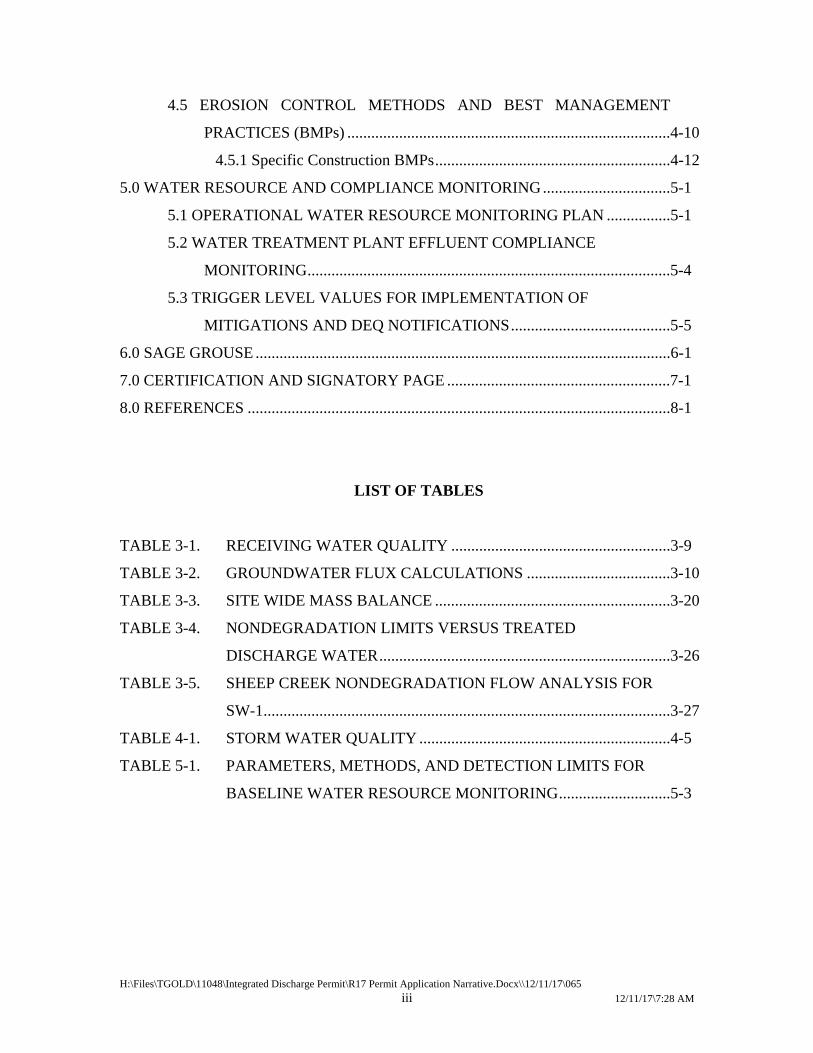
TABLE 3-1. RECEIVING WATER QUALITY .......................................................3-9
TABLE 3-2. GROUNDWATER FLUX CALCULATIONS ....................................3-10
TABLE 3-3. SITE WIDE MASS BALANCE ...........................................................3-20
TABLE 3-4. NONDEGRADATION LIMITS VERSUS TREATED
DISCHARGE WATER .........................................................................3-26
TABLE 3-5. SHEEP CREEK NONDEGRADATION FLOW ANALYSIS FOR
SW-1 ......................................................................................................3-27
TABLE 4-1. STORM WATER QUALITY ...............................................................4-5
TABLE 5-1. PARAMETERS, METHODS, AND DETECTION LIMITS FOR
BASELINE WATER RESOURCE MONITORING ............................5-3
H:\Files\TGOLD\11048\Integrated Discharge Permit\R17 Permit Application Narrative.Docx\\12/11/17\065
iv 12/11/17\7:28 AM
LIST OF FIGURES
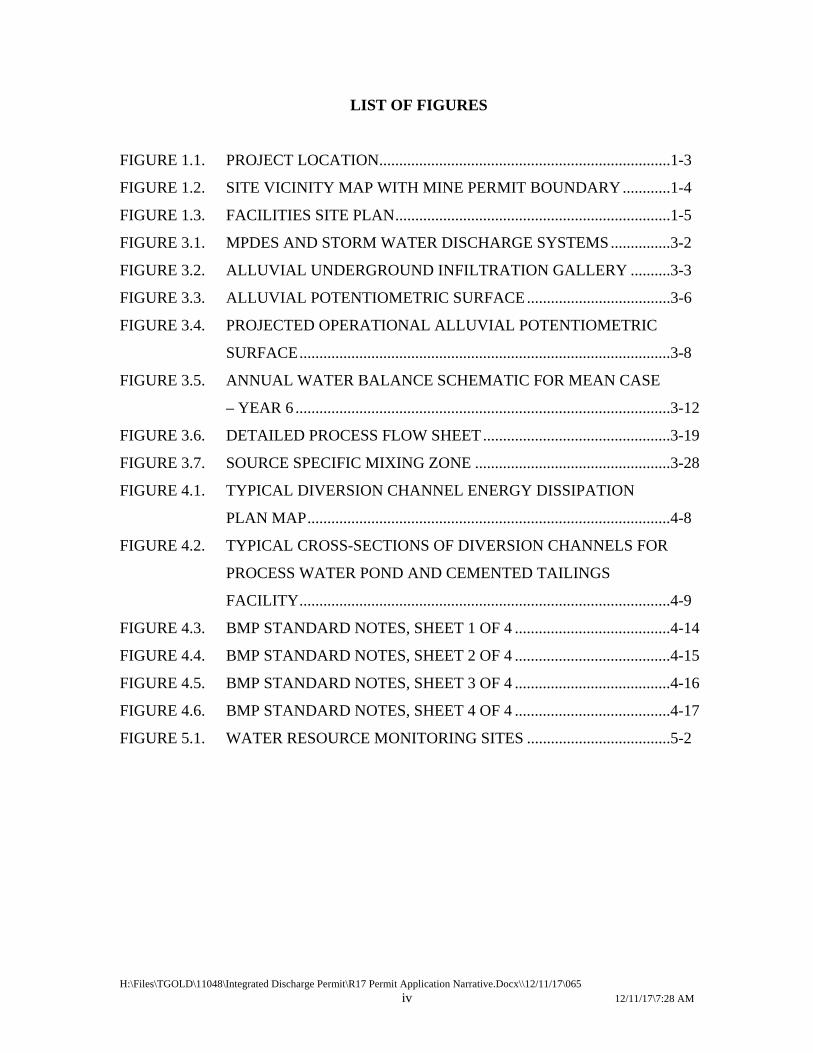
FIGURE 1.1. PROJECT LOCATION .........................................................................1-3
FIGURE 1.2. SITE VICINITY MAP WITH MINE PERMIT BOUNDARY ............1-4
FIGURE 1.3. FACILITIES SITE PLAN .....................................................................1-5
FIGURE 3.1. MPDES AND STORM WATER DISCHARGE SYSTEMS ...............3-2
FIGURE 3.2. ALLUVIAL UNDERGROUND INFILTRATION GALLERY ..........3-3
FIGURE 3.3. ALLUVIAL POTENTIOMETRIC SURFACE ....................................3-6
FIGURE 3.4. PROJECTED OPERATIONAL ALLUVIAL POTENTIOMETRIC
SURFACE .............................................................................................3-8
FIGURE 3.5. ANNUAL WATER BALANCE SCHEMATIC FOR MEAN CASE
– YEAR 6 ..............................................................................................3-12
FIGURE 3.6. DETAILED PROCESS FLOW SHEET ...............................................3-19
FIGURE 3.7. SOURCE SPECIFIC MIXING ZONE .................................................3-28
FIGURE 4.1. TYPICAL DIVERSION CHANNEL ENERGY DISSIPATION
PLAN MAP ...........................................................................................4-8
FIGURE 4.2. TYPICAL CROSS-SECTIONS OF DIVERSION CHANNELS FOR
PROCESS WATER POND AND CEMENTED TAILINGS
FACILITY .............................................................................................4-9
FIGURE 4.3. BMP STANDARD NOTES, SHEET 1 OF 4 .......................................4-14
FIGURE 4.4. BMP STANDARD NOTES, SHEET 2 OF 4 .......................................4-15
FIGURE 4.5. BMP STANDARD NOTES, SHEET 3 OF 4 .......................................4-16
FIGURE 4.6. BMP STANDARD NOTES, SHEET 4 OF 4 .......................................4-17
FIGURE 5.1. WATER RESOURCE MONITORING SITES ....................................5-2
H:\Files\TGOLD\11048\Integrated Discharge Permit\R17 Permit Application Narrative.Docx\\12/11/17\065
v 12/11/17\7:28 AM
LIST OF APPENDICES
APPENDIX A APPLICATION FORM 1, FORM 2D, AND FORM 2C
APPENDIX B WATER TREATMENT MODELING
APPENDIX C BLACK BUTTE MINE METEOROLOGICAL MONITORING
TEMPERATURE DATA
APPENDIX D APPLICATION FOR SOURCE SPECIFIC MIXING ZONE IN
SURFACE WATER FOR TOTAL NITROGEN
APPENDIX E INFILTRATION STUDY REPORT
APPENDIX F NUMERIC GROUNDWATER MODEL REPORT
APPENDIX G RECEIVING WATER QUALITY DATA AND STATISTICAL
ANALYSIS
APPENDIX H SAFETY DATA SHEETS
APPENDIX I NONDEGRADATION CRITERIA CALCULATIONS
APPENDIX J STORM WATER FLOW CALCULATIONS AND SEDCAD
OUTPUT
APPENDIX K WATER RESOURCES MONITORING FIELD SAMPLING AND
ANALYSIS PLAN
H:\Files\TGOLD\11048\Integrated Discharge Permit\R17 Permit Application Narrative.Docx\\12/11/17\065
1-1 12/11/17\7:28 AM
INTEGRATED DISCHARGE PERMIT APPLICATION NARRATIVE
BLACK BUTTE COPPER PROJECT
MEAGHER COUNTY, MONTANA
1.0 INTRODUCTION
Tintina Montana, Inc. is submitting this application for an ‘Integrated’ Montana Pollutant
Discharge Elimination System (MPDES) permit for a new discharge associated with its
Black Butte Copper Project (Project). The ‘Integrated’ permit includes discharges from
treated water from the mining and milling processes (MPDES) and storm water associated
with industrial activities (Industrial Storm Water). This narrative provides additional details
to support the information provided in the integrated permit application forms.
1.1 INTEGRATED PERMIT APPLICATION STRUCTURE
Tintina is submitting the MPDES permit and Storm Water permit as an ‘Integrated’
discharge application package at the request of the Department of Environmental Quality
(DEQ), Water Protection Bureau. This ‘Integrated’ discharge application is for a new
discharge permit which includes the following forms:
MT DEQ Form 1, including topographic coverage of the area and activities of interest
(Appendix A; Figures 1.2, 1.3, and 3.1).
U.S. Environmental Protection Agency (EPA) Form 2D (New Dischargers of Process
Wastewater), including a water flow diagram for processes at the Black Butte Copper
Project (Appendix A; Figure 3.5) and effluent characterization (Table 3-4).
DEQ Form 2F (Storm Water Associated with Industrial Activity), including site maps
depicting the facility, outfall locations and drainage areas, and other relevant
information as required by Form 2F (Appendix A; Figures 1.3 and 3.1).
H:\Files\TGOLD\11048\Integrated Discharge Permit\R17 Permit Application Narrative.Docx\\12/11/17\065
1-2 12/11/17\7:28 AM
In addition to the forms listed above, Tintina is submitting this permit narrative to provide
additional information on the proposed outfalls and hydrologic setting associated with each
outfall. Much of the narrative is a summary of the Mine Operating Permit (MOP)
Application, Revision 3 (Tintina, 2017) for the Project that was deemed complete and
compliant by the DEQ Hard Rock Mining Bureau. This narrative includes multiple
appendices that were used in the MOP application where they directly pertain to this
integrated permit. The reader should refer to the MOP for greater detail on some supporting
topics; recommended sections and/or appendices are referenced for the reader’s convenience.
1.2 BRIEF PROJECT BACKGROUND
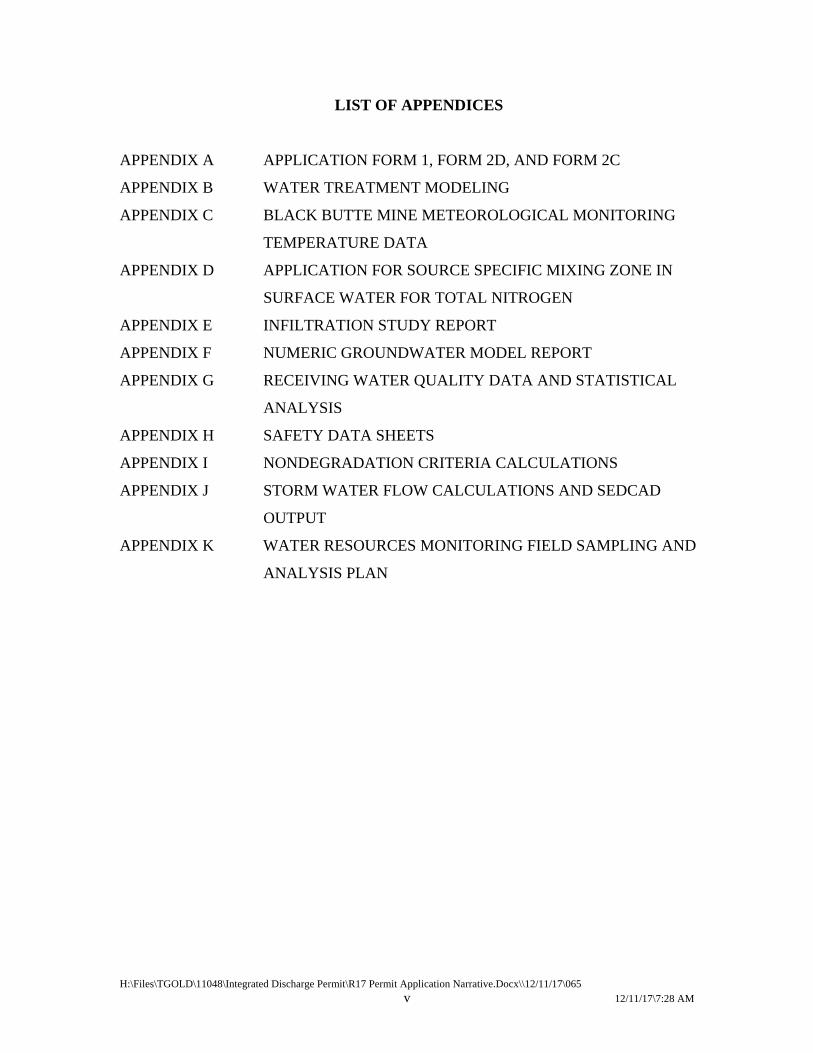
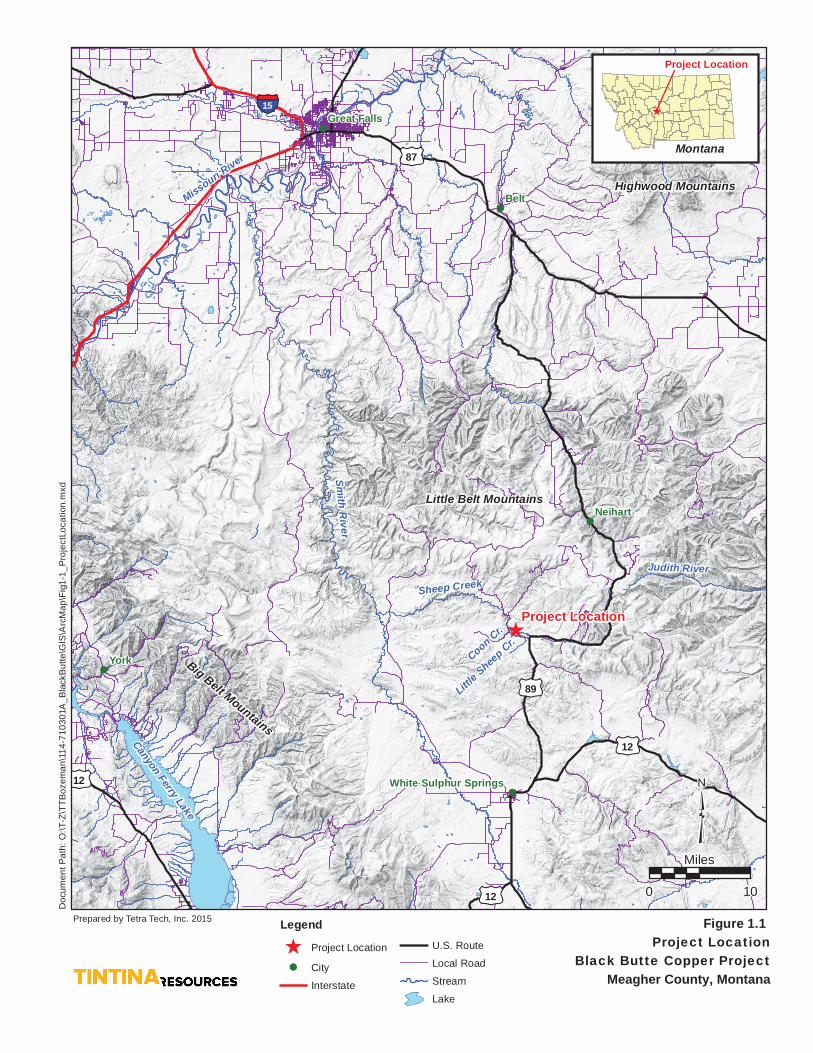
Tintina Montana, Inc. (Tintina) a wholly owned subsidiary of Tintina Resources, Inc.,
proposes to develop and operate a new underground mine and mill at its Black Butte Copper
Project located 15 miles (24 km) north of White Sulphur Springs in Meagher County,
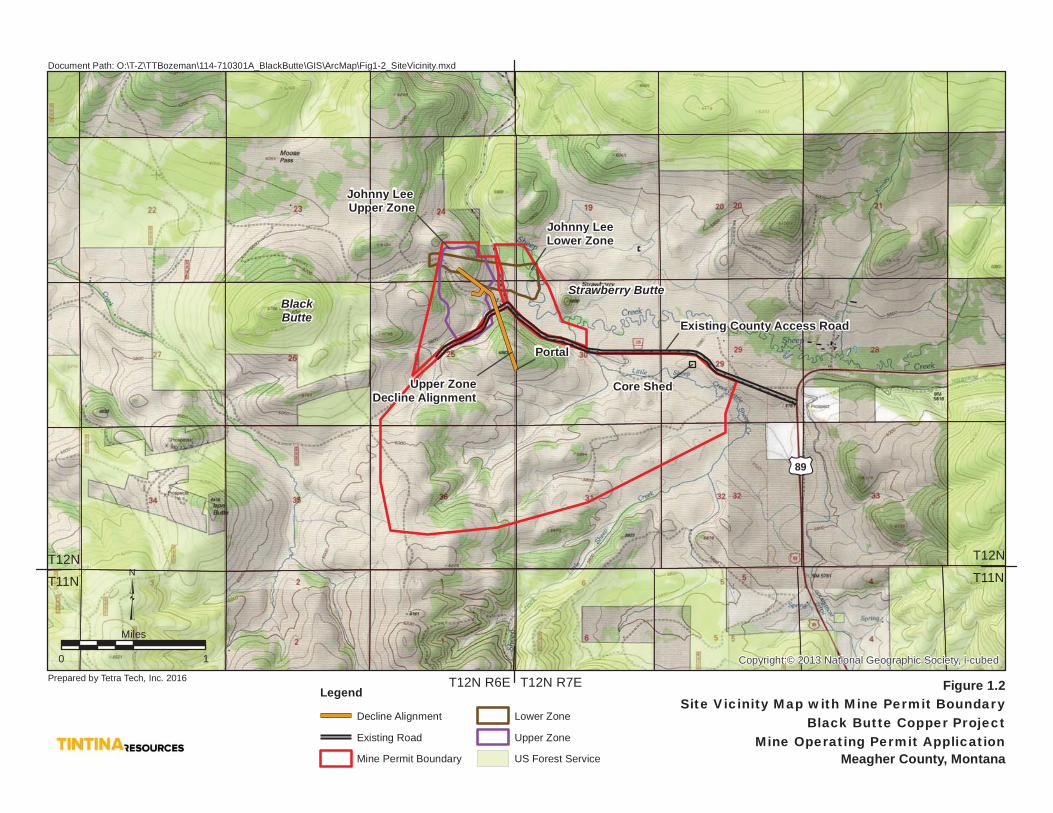
Montana (Figure 1.1). The proposed mine permit area is located in Sections 24, 25, and 36
in Township 12N, Range 6E, and in Sections 19, 29, 30, 31, and 32 in Township 12N, Range
7E (Figure 1.2). The Project will produce and ship copper concentrate mined from both the
upper and lower sulfide zones of the Johnny Lee copper deposit. All operations will occur
within the Mine Permit Boundary encompassing 1,888 acres (763.9 hectares (ha)) of
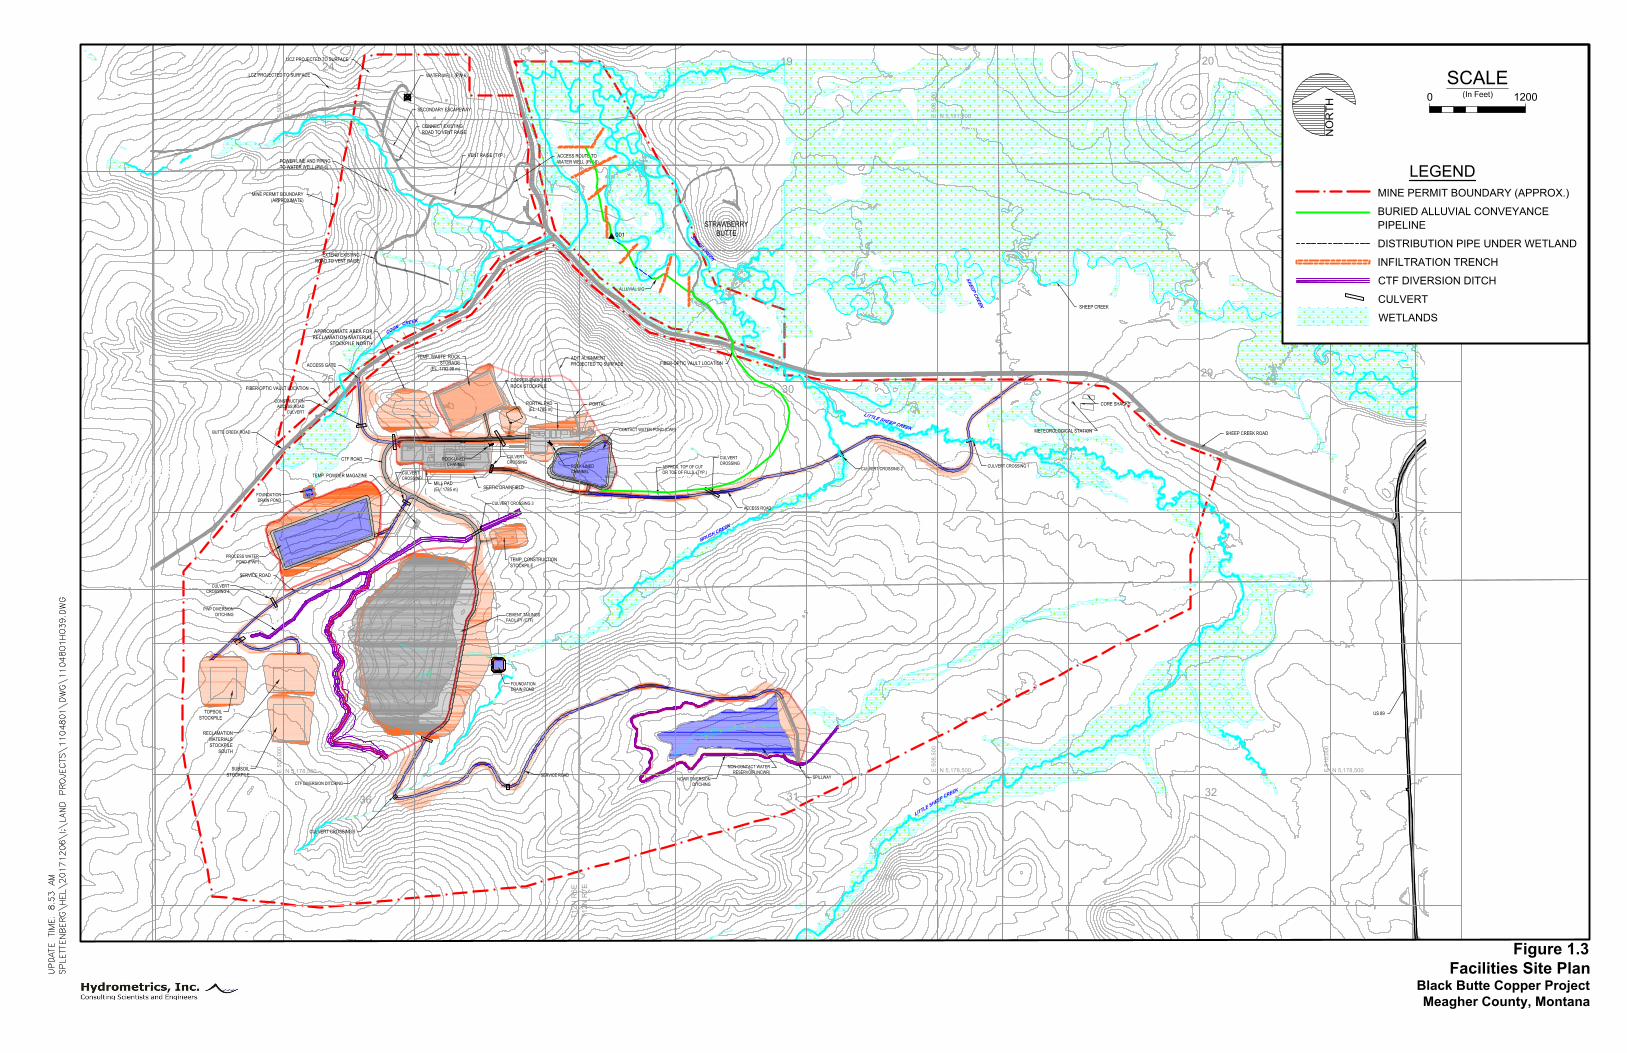
privately owned ranch land under lease to Tintina (Figure 1.2). Total surface disturbance
required for construction and operation of all mine related facilities and access roads (Figure
1.3) comprises 295.9 acres (119.7 ha).
Tintina has been conducting exploration activities in the Project area since 2010. Numerous
hydrogeologic investigations and ongoing baseline water resource monitoring have been
conducted since 2011 under the exploration permit (see Appendix B of MOP for additional
detail). The current baseline water resource monitoring program consists of monthly,
quarterly, and annual monitoring of surface waters, groundwater, springs, and seeps.
The DEQ Hard Rock Mining Bureau issued a Draft Operating Permit (No. 00188) for the
Project on September 18, 2017. The Project is currently in the beginning stages of the
Montana Environmental Policy Act (MEPA) evaluation which will include a review of the
Draft Operating Permit, this integrated discharge permit, and other required permits.
!
!
!
!
!
^
Highwood Mountains
Little Belt Mountains
Canyon Ferry Lake
Big Belt Mountains
£¤12
Smith R
iver
Judith River
Missouri River
Project Location
Little Shee
p Cr.
Sheep Creek
Coon Cr.
£¤12
York
Belt
Neihart
Great Falls
White Sulphur Springs
§̈¦15
£¤89
£¤12
£¤87
³0 10
Miles
Figure 1.1
Project LocationBlack Butte Copper Project
Meagher County, Montana
^
Montana
Project Location
Legend
^ Project Location
! City
Interstate
U.S. Route
Local Road
Stream
Lake
Do
cum
en
t P
ath
: O
:\T
-Z\T
TB
oze
ma
n\1
14
-71
03
01A
_B
lack
Bu
tte
\GIS
\Arc
Ma
p\F
ig1
-1_
Pro
ject
Loca
tion
.mxd
Prepared by Tetra Tech, Inc. 2015
Johnny LeeLower Zone
Johnny Lee Upper Zone
Core Shed
Portal
Existing County Access Road
Strawberry ButteBlackButte
£¤89
Upper ZoneDecline Alignment
Copyright:© 2013 National Geographic Society, i-cubed
Figure 1.2
Site Vicinity Map with Mine Permit BoundaryBlack Butte Copper Project
Mine Operating Permit Application
³0 1
Miles
Meagher County, Montana
Legend
Decline Alignment
Existing Road
Mine Permit Boundary
Lower Zone
Upper Zone
US Forest Service
Document Path: O:\T-Z\TTBozeman\114-710301A_BlackButte\GIS\ArcMap\Fig1-2_SiteVicinity.mxd
Prepared by Tetra Tech, Inc. 2016
T12N
T11N
T12N
T11N
T12N R6E T12N R7E
DRY
WATER TANK
5,000 GAL
OFFICE
SHOP
PARKING
WPDSL
LAYDOWN
AREA
WATER WELL
EQUIP
PRKG
CO
NE
X
PASTE PLANT
TRUCK SHOP COMPLEX
W.T.P.
THICKENER
MOBILE GEN
SETS
BATCH
PLANT
OFF/WASH
DRY
CONC.
THICKENER
CONC.
STORAGE
PROCESS
PLANT
FLY ASH/SLAG SILOS
DIESEL STORAGE 50kL CAP.
CONTAINMENT BERM
REFUELING STA
PROC. WAT. TANKFRESH/FIRE WAT. TANK
POTABLE WAT. TANK
SURGE BIN
EMERGENCYGENSETS
CONVEYOR
SUB
STATION
RECLAMATIONMATERIALSSTOCKPILE
SOUTH
WATER WELL (PW-6)
FIBER-OPTIC VAULT LOCATION
PORTALPORTAL PAD(EL. 1785 m)
ADIT ALIGNMENTPROJECTED TO SURFACE
NON-CONTACT WATERRESERVOIR (NCWR)
CEMENT TAILINGSFACILITY (CTF)
CTF DIVERSION DITCHING
FIBER-OPTIC VAULT LOCATION
CONTACT WATER POND (CWP)
POWER LINE AND PIPINGTO WATER WELL (PW-6)
TOPSOILSTOCKPILE
SUBSOILSTOCKPILE
APPROX. TOP OF CUTOR TOE OF FILLS (TYP.)
VENT RAISE (TYP.)
CULVERT CROSSING 5
CULVERTCROSSING 4
CULVERT CROSSING 1CULVERT CROSSING 2
ACCESS ROAD
PROCESS WATERPOND (PWP)
SERVICE ROAD
CONSTRUCTIONACCESS ROAD
CULVERT
ACCESS GATE
CULVERT CROSSING 3
COPPER-ENRICHEDROCK STOCKPILE
TEMP. WASTE ROCKSTORAGE
(EL. 1792.98 m)
MILL PAD(EL. 1785 m)
EXTEND EXISTINGROAD TO VENT RAISE
CONNECT EXISTINGROAD TO VENT RAISE
NCWR DIVERSIONDITCHING
SERVICE ROAD
PWP DIVERSIONDITCHING
APPROXIMATE AREA FORRECLAMATION MATERIAL
STOCKPILE NORTH
TEMP. POWDER MAGAZINE
FOUNDATIONDRAIN POND
FOUNDATIONDRAIN POND
CORE SHACKS
SPILLWAY
US 89
CTF ROAD
MINE PERMIT BOUNDARY(APPROXIMATE)
N 5,178,500E 5
10
,0
00
N 5,181,000E 5
08
,5
00
N 5,178,500E 5
08
,5
00
N 5,181,000E 5
06
,0
00
N 5,178,500E 5
06
,0
00
SEPTIC DRAINFIELD
METEOROLOGICAL STATION
SHEEP CREEK
SHEEP CREEK ROADBUTTE CREEK ROAD
SECONDARY ESCAPEWAYN 5,181,000E
5
10
,0
00
2019
24
29
30
25
36
31
32
T1
2N
R
6E
T1
2N
R
7E
ACCESS ROUTE TOWATER WELL (PW-6)
STRAWBERRYBUTTE
TEMP. CONSTRUCTIONSTOCKPILE
UCZ PROJECTED TO SURFACE
LCZ PROJECTED TO SURFACE
CULVERTCROSSING
CULVERTCROSSING
ROCK-LINEDCHANNEL ROCK-LINED
CHANNEL
ALLUVIAL UIG
B
R
U
S
H
C
R
E
E
K
L
I
T
T
L
E
S
H
E
E
P
S
H
E
E
P
C
R
E
E
K
S
H
E
E
P
C
R
E
E
K
L
IT
T
L
E
S
H
E
E
P
C
R
E
E
K
C
O
O
N
C
R
E
E
K
CULVERTCROSSING
C
R
E
E
K
001
NO
RT
H
LEGEND
MINE PERMIT BOUNDARY (APPROX.)
BURIED ALLUVIAL CONVEYANCE
PIPELINE
DISTRIBUTION PIPE UNDER WETLAND
INFILTRATION TRENCH
CTF DIVERSION DITCH
CULVERT
WETLANDS
Facilities Site Plan
Black Butte Copper Project
Meagher County, Montana
Figure 1.3
SCALE
0
(In Feet)
1200
H:\Files\TGOLD\11048\Integrated Discharge Permit\R17 Permit Application Narrative.Docx\\12/11/17\065
2-1 12/11/17\7:28 AM
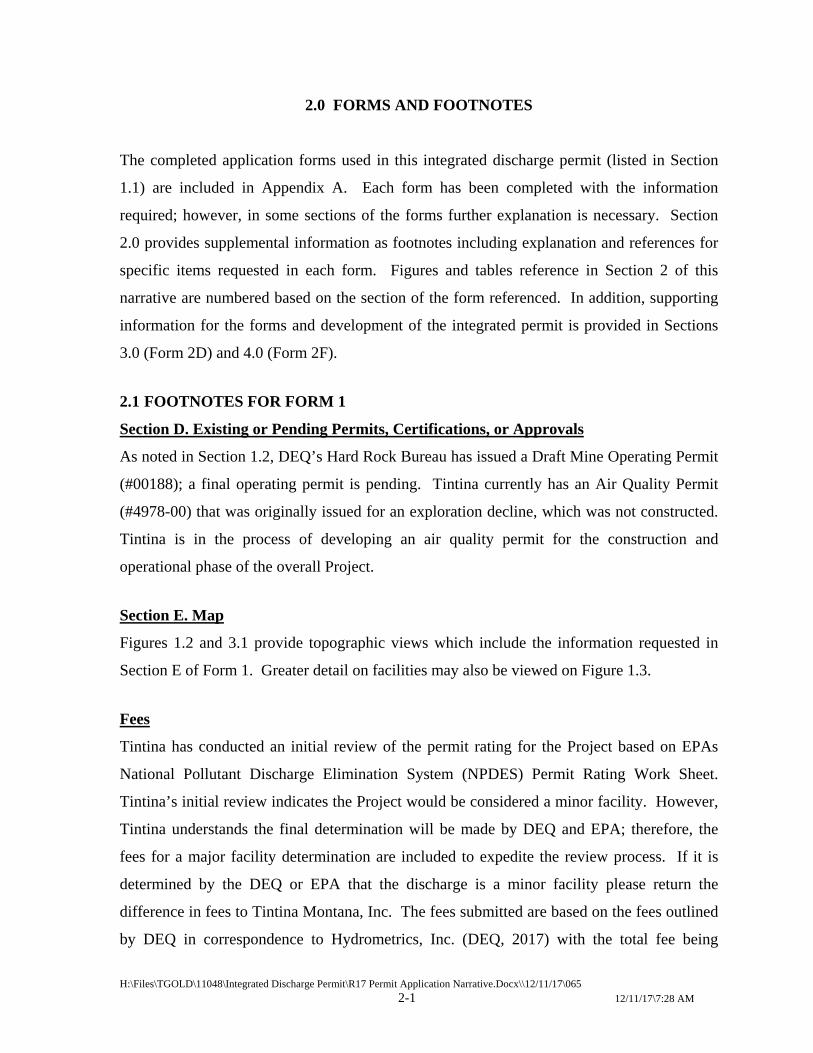
2.0 FORMS AND FOOTNOTES
The completed application forms used in this integrated discharge permit (listed in Section
1.1) are included in Appendix A. Each form has been completed with the information
required; however, in some sections of the forms further explanation is necessary. Section
2.0 provides supplemental information as footnotes including explanation and references for
specific items requested in each form. Figures and tables reference in Section 2 of this
narrative are numbered based on the section of the form referenced. In addition, supporting
information for the forms and development of the integrated permit is provided in Sections
3.0 (Form 2D) and 4.0 (Form 2F).
2.1 FOOTNOTES FOR FORM 1
Section D. Existing or Pending Permits, Certifications, or Approvals
As noted in Section 1.2, DEQ’s Hard Rock Bureau has issued a Draft Mine Operating Permit
(#00188); a final operating permit is pending. Tintina currently has an Air Quality Permit
(#4978-00) that was originally issued for an exploration decline, which was not constructed.
Tintina is in the process of developing an air quality permit for the construction and
operational phase of the overall Project.
Section E. Map
Figures 1.2 and 3.1 provide topographic views which include the information requested in
Section E of Form 1. Greater detail on facilities may also be viewed on Figure 1.3.
Fees
Tintina has conducted an initial review of the permit rating for the Project based on EPAs
National Pollutant Discharge Elimination System (NPDES) Permit Rating Work Sheet.
Tintina’s initial review indicates the Project would be considered a minor facility. However,
Tintina understands the final determination will be made by DEQ and EPA; therefore, the
fees for a major facility determination are included to expedite the review process. If it is
determined by the DEQ or EPA that the discharge is a minor facility please return the
difference in fees to Tintina Montana, Inc. The fees submitted are based on the fees outlined
by DEQ in correspondence to Hydrometrics, Inc. (DEQ, 2017) with the total fee being
H:\Files\TGOLD\11048\Integrated Discharge Permit\R17 Permit Application Narrative.Docx\\12/11/17\065
2-2 12/11/17\7:28 AM
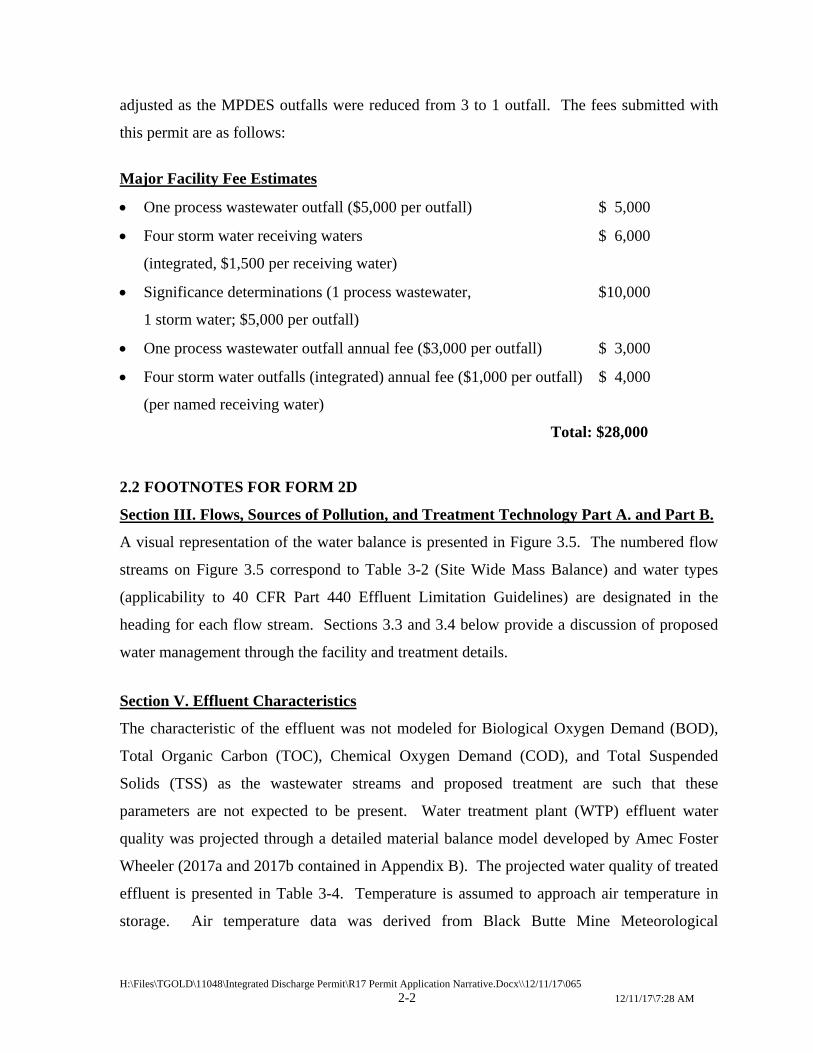
adjusted as the MPDES outfalls were reduced from 3 to 1 outfall. The fees submitted with
this permit are as follows:
Major Facility Fee Estimates
One process wastewater outfall ($5,000 per outfall) $ 5,000
Four storm water receiving waters $ 6,000
(integrated, $1,500 per receiving water)
Significance determinations (1 process wastewater, $10,000
1 storm water; $5,000 per outfall)
One process wastewater outfall annual fee ($3,000 per outfall) $ 3,000
Four storm water outfalls (integrated) annual fee ($1,000 per outfall) $ 4,000
(per named receiving water)
Total: $28,000
2.2 FOOTNOTES FOR FORM 2D
Section III. Flows, Sources of Pollution, and Treatment Technology Part A. and Part B.
A visual representation of the water balance is presented in Figure 3.5. The numbered flow
streams on Figure 3.5 correspond to Table 3-2 (Site Wide Mass Balance) and water types
(applicability to 40 CFR Part 440 Effluent Limitation Guidelines) are designated in the
heading for each flow stream. Sections 3.3 and 3.4 below provide a discussion of proposed
water management through the facility and treatment details.
Section V. Effluent Characteristics
The characteristic of the effluent was not modeled for Biological Oxygen Demand (BOD),
Total Organic Carbon (TOC), Chemical Oxygen Demand (COD), and Total Suspended
Solids (TSS) as the wastewater streams and proposed treatment are such that these
parameters are not expected to be present. Water treatment plant (WTP) effluent water
quality was projected through a detailed material balance model developed by Amec Foster
Wheeler (2017a and 2017b contained in Appendix B). The projected water quality of treated
effluent is presented in Table 3-4. Temperature is assumed to approach air temperature in
storage. Air temperature data was derived from Black Butte Mine Meteorological
H:\Files\TGOLD\11048\Integrated Discharge Permit\R17 Permit Application Narrative.Docx\\12/11/17\065
2-3 12/11/17\7:28 AM
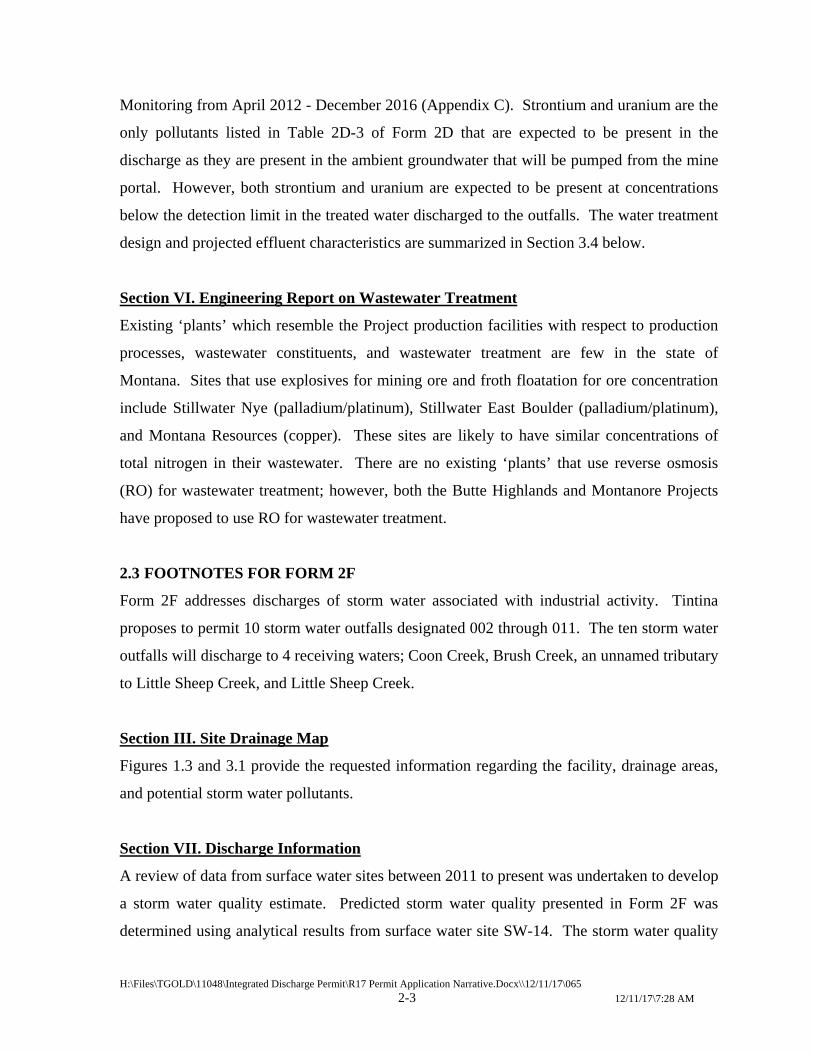
Monitoring from April 2012 - December 2016 (Appendix C). Strontium and uranium are the
only pollutants listed in Table 2D-3 of Form 2D that are expected to be present in the
discharge as they are present in the ambient groundwater that will be pumped from the mine
portal. However, both strontium and uranium are expected to be present at concentrations
below the detection limit in the treated water discharged to the outfalls. The water treatment
design and projected effluent characteristics are summarized in Section 3.4 below.
Section VI. Engineering Report on Wastewater Treatment
Existing ‘plants’ which resemble the Project production facilities with respect to production
processes, wastewater constituents, and wastewater treatment are few in the state of
Montana. Sites that use explosives for mining ore and froth floatation for ore concentration
include Stillwater Nye (palladium/platinum), Stillwater East Boulder (palladium/platinum),
and Montana Resources (copper). These sites are likely to have similar concentrations of
total nitrogen in their wastewater. There are no existing ‘plants’ that use reverse osmosis
(RO) for wastewater treatment; however, both the Butte Highlands and Montanore Projects
have proposed to use RO for wastewater treatment.
2.3 FOOTNOTES FOR FORM 2F
Form 2F addresses discharges of storm water associated with industrial activity. Tintina
proposes to permit 10 storm water outfalls designated 002 through 011. The ten storm water
outfalls will discharge to 4 receiving waters; Coon Creek, Brush Creek, an unnamed tributary
to Little Sheep Creek, and Little Sheep Creek.
Section III. Site Drainage Map
Figures 1.3 and 3.1 provide the requested information regarding the facility, drainage areas,
and potential storm water pollutants.
Section VII. Discharge Information
A review of data from surface water sites between 2011 to present was undertaken to develop
a storm water quality estimate. Predicted storm water quality presented in Form 2F was
determined using analytical results from surface water site SW-14. The storm water quality

H:\Files\TGOLD\11048\Integrated Discharge Permit\R17 Permit Application Narrative.Docx\\12/11/17\065
2-4 12/11/17\7:28 AM
was estimated by removing the groundwater component from a high flow storm event as
compared to a low flow sampling event. Estimated storm water quality is shown in Table
4-1.
H:\Files\TGOLD\11048\Integrated Discharge Permit\R17 Permit Application Narrative.Docx\\12/11/17\065
3-1 12/11/17\7:28 AM
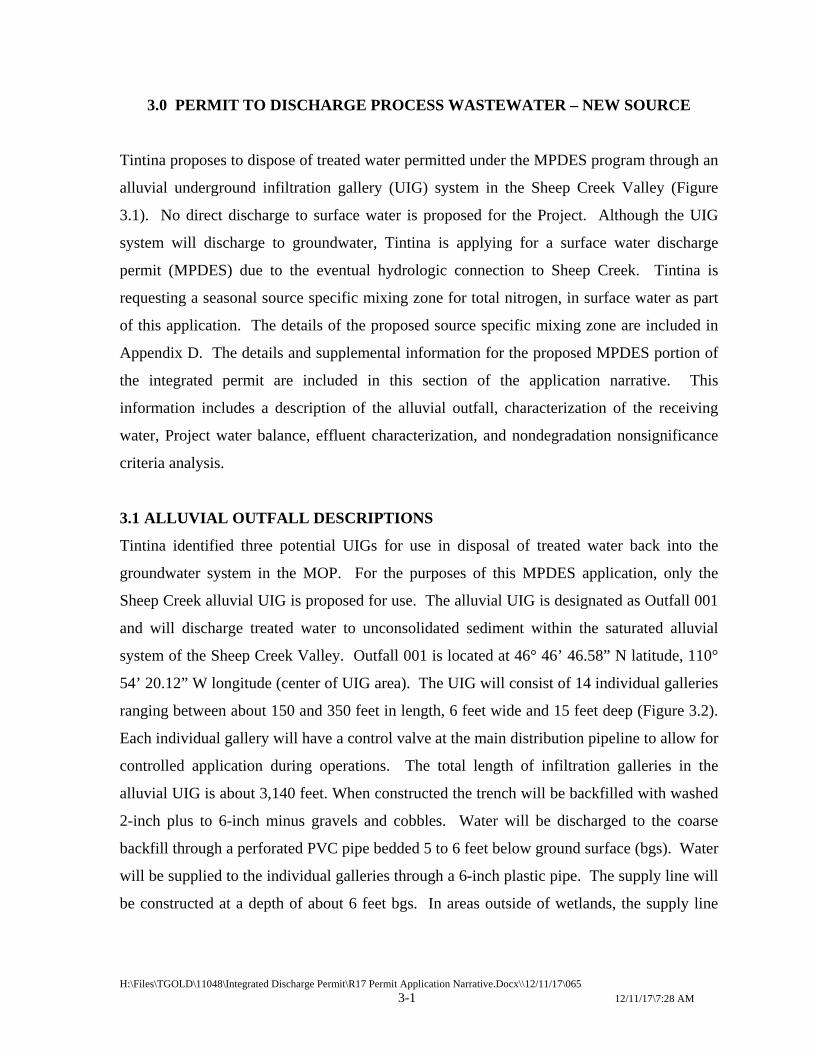
3.0 PERMIT TO DISCHARGE PROCESS WASTEWATER – NEW SOURCE
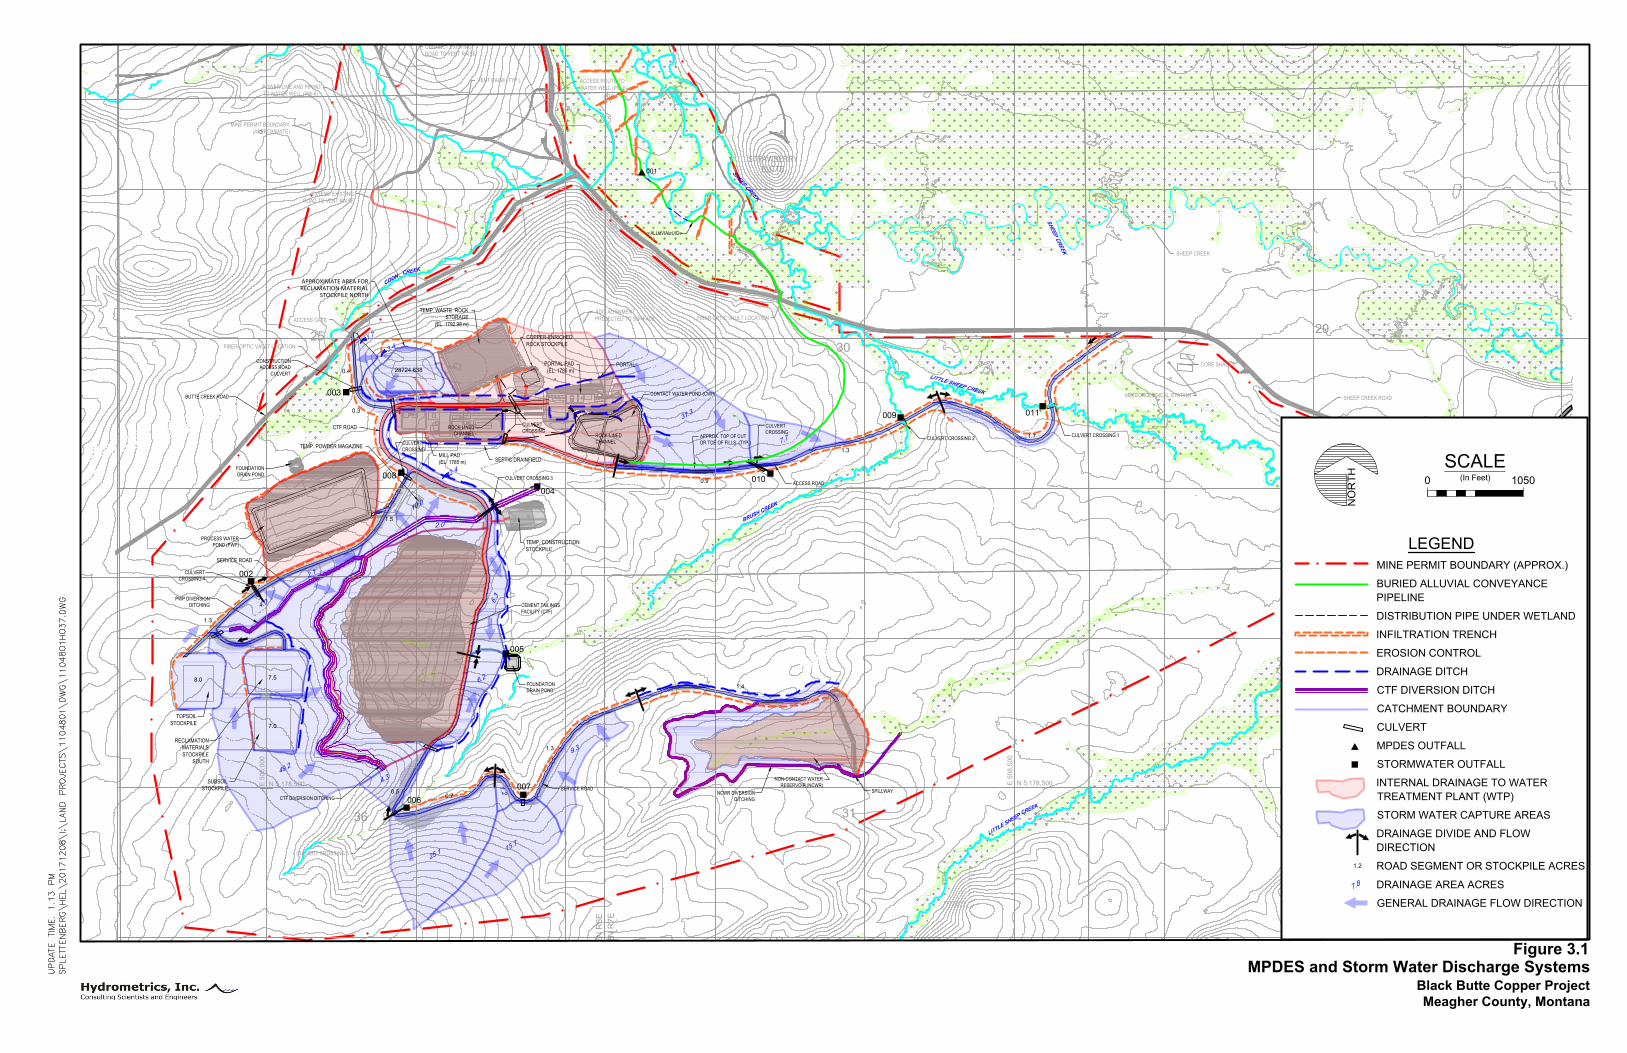
Tintina proposes to dispose of treated water permitted under the MPDES program through an
alluvial underground infiltration gallery (UIG) system in the Sheep Creek Valley (Figure
3.1). No direct discharge to surface water is proposed for the Project. Although the UIG
system will discharge to groundwater, Tintina is applying for a surface water discharge
permit (MPDES) due to the eventual hydrologic connection to Sheep Creek. Tintina is
requesting a seasonal source specific mixing zone for total nitrogen, in surface water as part
of this application. The details of the proposed source specific mixing zone are included in
Appendix D. The details and supplemental information for the proposed MPDES portion of
the integrated permit are included in this section of the application narrative. This
information includes a description of the alluvial outfall, characterization of the receiving
water, Project water balance, effluent characterization, and nondegradation nonsignificance
criteria analysis.
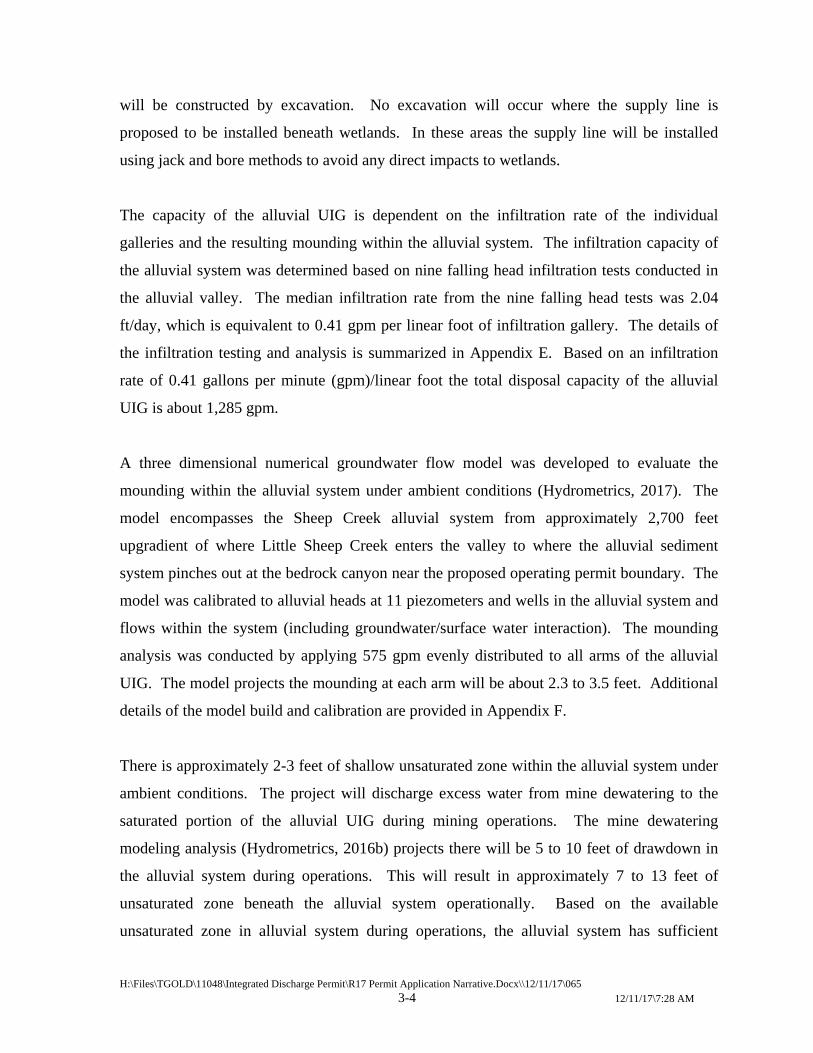
3.1 ALLUVIAL OUTFALL DESCRIPTIONS
Tintina identified three potential UIGs for use in disposal of treated water back into the
groundwater system in the MOP. For the purposes of this MPDES application, only the
Sheep Creek alluvial UIG is proposed for use. The alluvial UIG is designated as Outfall 001
and will discharge treated water to unconsolidated sediment within the saturated alluvial
system of the Sheep Creek Valley. Outfall 001 is located at 46° 46’ 46.58” N latitude, 110°
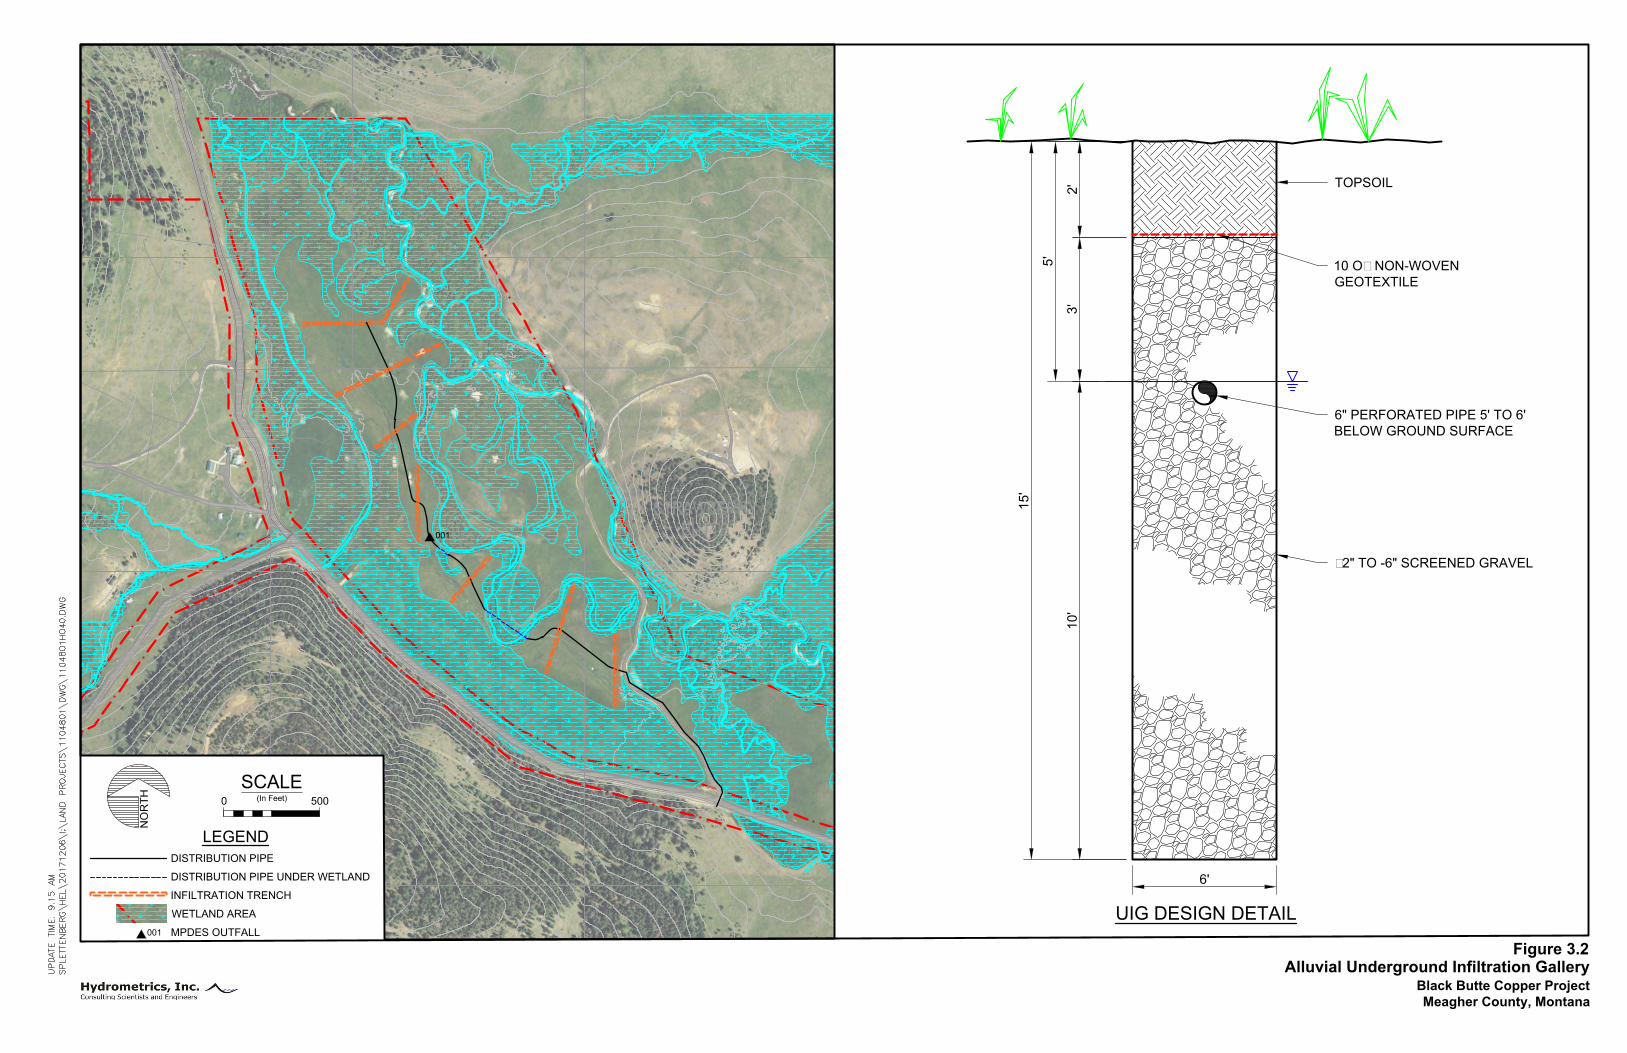
54’ 20.12” W longitude (center of UIG area). The UIG will consist of 14 individual galleries
ranging between about 150 and 350 feet in length, 6 feet wide and 15 feet deep (Figure 3.2).
Each individual gallery will have a control valve at the main distribution pipeline to allow for
controlled application during operations. The total length of infiltration galleries in the
alluvial UIG is about 3,140 feet. When constructed the trench will be backfilled with washed
2-inch plus to 6-inch minus gravels and cobbles. Water will be discharged to the coarse
backfill through a perforated PVC pipe bedded 5 to 6 feet below ground surface (bgs). Water
will be supplied to the individual galleries through a 6-inch plastic pipe. The supply line will
be constructed at a depth of about 6 feet bgs. In areas outside of wetlands, the supply line
DRY
WATER TANK
5,000 GAL
OFFICE
SHOP
PARKING
WPDSL
LAYDOWN
AREA
WATER WELL
EQUIP
PRKG
CO
NE
X
PASTE PLANT
TRUCK SHOP COMPLEX
W.T.P.
THICKENER
MOBILE GEN
SETS
BATCH
PLANT
OFF/WASHDRY
CONC.
THICKENER
CONC.
STORAGE
PROCESS
PLANT
FLY ASH/SLAG SILOS
DIESEL STORAGE 50kL CAP.CONTAINMENT BERM
REFUELING STA
PROC. WAT. TANKFRESH/FIRE WAT. TANK
POTABLE WAT. TANK
SURGE BIN
EMERGENCYGENSETS
CONVEYOR
SUB
STATION
RECLAMATIONMATERIALSSTOCKPILE
SOUTH
FIBER-OPTIC VAULT LOCATION
PORTALPORTAL PAD(EL. 1785 m)
ADIT ALIGNMENTPROJECTED TO SURFACE
NON-CONTACT WATERRESERVOIR (NCWR)
CEMENT TAILINGSFACILITY (CTF)
CTF DIVERSION DITCHING
FIBER-OPTIC VAULT LOCATION
CONTACT WATER POND (CWP)
POWER LINE AND PIPINGTO WATER WELL (PW-6)
TOPSOILSTOCKPILE
SUBSOILSTOCKPILE
APPROX. TOP OF CUTOR TOE OF FILLS (TYP.)
VENT RAISE (TYP.)
CULVERT CROSSING 5
CULVERTCROSSING 4
CULVERT CROSSING 1CULVERT CROSSING 2
ACCESS ROAD
PROCESS WATERPOND (PWP)
SERVICE ROAD
CONSTRUCTIONACCESS ROAD
CULVERT
ACCESS GATE
CULVERT CROSSING 3
COPPER-ENRICHEDROCK STOCKPILE
TEMP. WASTE ROCKSTORAGE
(EL. 1792.98 m)
MILL PAD(EL. 1785 m)
EXTEND EXISTINGROAD TO VENT RAISE
CONNECT EXISTINGROAD TO VENT RAISE
NCWR DIVERSIONDITCHING
SERVICE ROAD
PWP DIVERSIONDITCHING
APPROXIMATE AREA FORRECLAMATION MATERIAL
STOCKPILE NORTH
TEMP. POWDER MAGAZINE
FOUNDATIONDRAIN POND
FOUNDATIONDRAIN POND
CORE SHACKS
SPILLWAY
US 89
CTF ROAD
MINE PERMIT BOUNDARY(APPROXIMATE)
N 5,178,500E 5
10
,0
00
N 5,178,500E 5
08
,5
00
N 5,178,500E 5
06
,0
00
SEPTIC DRAINFIELD
METEOROLOGICAL STATION
SHEEP CREEK
SHEEP CREEK ROADBUTTE CREEK ROAD
29
30
25
36
31
32
T12N
R
6E
T12N
R
7E
ACCESS ROUTE TOWATER WELL (PW-6)
STRAWBERRYBUTTE
TEMP. CONSTRUCTIONSTOCKPILE
CULVERTCROSSING
CULVERTCROSSING
ROCK-LINEDCHANNEL ROCK-LINED
CHANNEL
ALLUVIAL UIG
B
R
U
S
H
C
R
E
E
K
L
I
T
T
L
E
S
H
E
E
P
S
H
E
E
P
C
R
E
E
K
S
H
E
E
P
C
R
E
E
K
L
IT
T
L
E
S
H
E
E
P
C
R
E
E
K
004
002
007
006
003
009
010
005
C
O
O
N
C
R
E
E
K
2
5
.
1
1
5
.
7
1
.
2
9
.
3
4
.
3
4
9
.
2
1.4
1.3
0.7
28724.638
1.3
4
.
0
2
.
1
6
.
3
1.5
2
.
4
1
.
7
8.0
7.5
7.0
3
1
.
3
1.3
1.7
1
0
.
0
2.0
0.9
7
.
7
0.3
0.4
0.5
6
.
2
3
.
4
CULVERTCROSSING
C
R
E
E
K
008
011
001
NO
RT
H
LEGEND
MINE PERMIT BOUNDARY (APPROX.)
BURIED ALLUVIAL CONVEYANCE
PIPELINE
DISTRIBUTION PIPE UNDER WETLAND
INFILTRATION TRENCH
EROSION CONTROL
DRAINAGE DITCH
CTF DIVERSION DITCH
CATCHMENT BOUNDARY
CULVERT
MPDES OUTFALL
STORMWATER OUTFALL
INTERNAL DRAINAGE TO WATER
TREATMENT PLANT (WTP)
STORM WATER CAPTURE AREAS
DRAINAGE DIVIDE AND FLOW
DIRECTION
ROAD SEGMENT OR STOCKPILE ACRES
DRAINAGE AREA ACRES
GENERAL DRAINAGE FLOW DIRECTION
MPDES and Storm Water Discharge Systems
Black Butte Copper Project
Meagher County, Montana
Figure 3.1
7
.
8
1.2
SCALE
0
(In Feet)
1050
19
STRAWBERRYBUTTE
S
H
E
E
P
C
R
E
E
K
001
NO
RT
H
LEGEND
DISTRIBUTION PIPE
DISTRIBUTION PIPE UNDER WETLAND
INFILTRATION TRENCH
WETLAND AREA
MPDES OUTFALL
Alluvial Underground Infiltration Gallery
Black Butte Copper Project
Meagher County, Montana
Figure 3.2
2'
3'
10'
+2" TO -6" SCREENED GRAVEL
10 OZ NON-WOVEN
GEOTEXTILE
TOPSOIL
5'
15'
6" PERFORATED PIPE 5' TO 6'
BELOW GROUND SURFACE
UIG DESIGN DETAIL
6'
001
SCALE
0
(In Feet)
500
H:\Files\TGOLD\11048\Integrated Discharge Permit\R17 Permit Application Narrative.Docx\\12/11/17\065
3-4 12/11/17\7:28 AM
will be constructed by excavation. No excavation will occur where the supply line is
proposed to be installed beneath wetlands. In these areas the supply line will be installed
using jack and bore methods to avoid any direct impacts to wetlands.
The capacity of the alluvial UIG is dependent on the infiltration rate of the individual
galleries and the resulting mounding within the alluvial system. The infiltration capacity of
the alluvial system was determined based on nine falling head infiltration tests conducted in
the alluvial valley. The median infiltration rate from the nine falling head tests was 2.04
ft/day, which is equivalent to 0.41 gpm per linear foot of infiltration gallery. The details of
the infiltration testing and analysis is summarized in Appendix E. Based on an infiltration
rate of 0.41 gallons per minute (gpm)/linear foot the total disposal capacity of the alluvial
UIG is about 1,285 gpm.
A three dimensional numerical groundwater flow model was developed to evaluate the
mounding within the alluvial system under ambient conditions (Hydrometrics, 2017). The
model encompasses the Sheep Creek alluvial system from approximately 2,700 feet
upgradient of where Little Sheep Creek enters the valley to where the alluvial sediment
system pinches out at the bedrock canyon near the proposed operating permit boundary. The
model was calibrated to alluvial heads at 11 piezometers and wells in the alluvial system and
flows within the system (including groundwater/surface water interaction). The mounding
analysis was conducted by applying 575 gpm evenly distributed to all arms of the alluvial
UIG. The model projects the mounding at each arm will be about 2.3 to 3.5 feet. Additional
details of the model build and calibration are provided in Appendix F.
There is approximately 2-3 feet of shallow unsaturated zone within the alluvial system under
ambient conditions. The project will discharge excess water from mine dewatering to the
saturated portion of the alluvial UIG during mining operations. The mine dewatering
modeling analysis (Hydrometrics, 2016b) projects there will be 5 to 10 feet of drawdown in
the alluvial system during operations. This will result in approximately 7 to 13 feet of
unsaturated zone beneath the alluvial system operationally. Based on the available
unsaturated zone in alluvial system during operations, the alluvial system has sufficient
H:\Files\TGOLD\11048\Integrated Discharge Permit\R17 Permit Application Narrative.Docx\\12/11/17\065
3-5 12/11/17\7:28 AM
capacity for the UIG to discharge the maximum discharge rate, without risking discharge at
the surface.
Discharge of treated effluent in the alluvial system may have transit times of hundreds of
days prior to discharging to Sheep Creek proper. Travel times in the alluvial aquifer is
highly dependent on surface water flows and potential dewatering interaction associated with
dewatering in the mine workings.
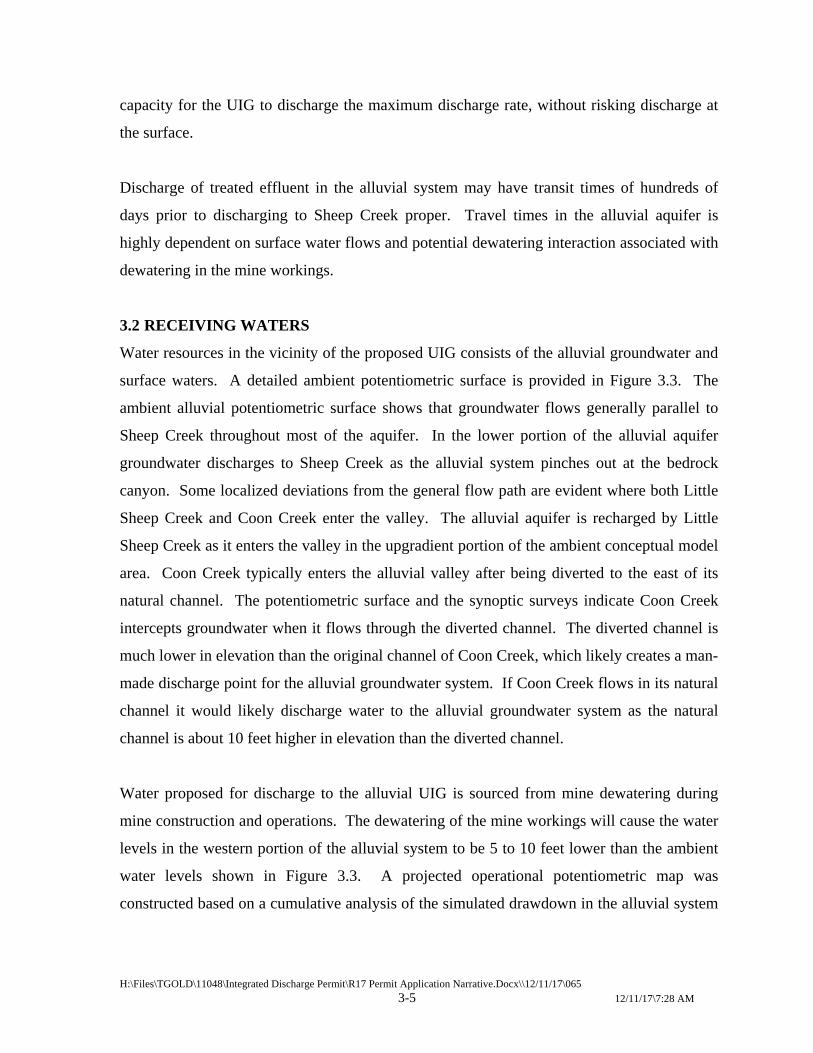
3.2 RECEIVING WATERS
Water resources in the vicinity of the proposed UIG consists of the alluvial groundwater and
surface waters. A detailed ambient potentiometric surface is provided in Figure 3.3. The
ambient alluvial potentiometric surface shows that groundwater flows generally parallel to
Sheep Creek throughout most of the aquifer. In the lower portion of the alluvial aquifer
groundwater discharges to Sheep Creek as the alluvial system pinches out at the bedrock
canyon. Some localized deviations from the general flow path are evident where both Little
Sheep Creek and Coon Creek enter the valley. The alluvial aquifer is recharged by Little
Sheep Creek as it enters the valley in the upgradient portion of the ambient conceptual model
area. Coon Creek typically enters the alluvial valley after being diverted to the east of its
natural channel. The potentiometric surface and the synoptic surveys indicate Coon Creek
intercepts groundwater when it flows through the diverted channel. The diverted channel is
much lower in elevation than the original channel of Coon Creek, which likely creates a man-
made discharge point for the alluvial groundwater system. If Coon Creek flows in its natural
channel it would likely discharge water to the alluvial groundwater system as the natural
channel is about 10 feet higher in elevation than the diverted channel.
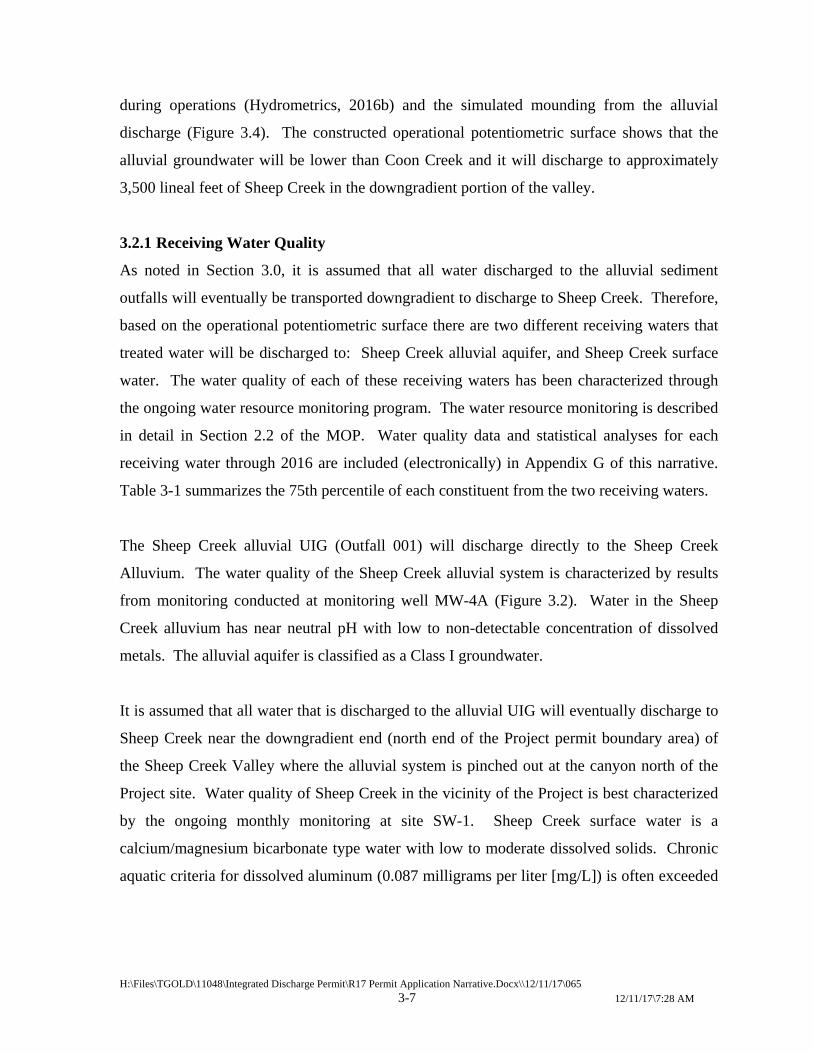
Water proposed for discharge to the alluvial UIG is sourced from mine dewatering during
mine construction and operations. The dewatering of the mine workings will cause the water
levels in the western portion of the alluvial system to be 5 to 10 feet lower than the ambient
water levels shown in Figure 3.3. A projected operational potentiometric map was
constructed based on a cumulative analysis of the simulated drawdown in the alluvial system

PZ-8
5614.40
PZ-11R
5611.34
PZ-3
5612.62
PZ-5
5596.58
PZ-1
5627.18
PZ-2
5610.68
PZ-14
5619.67
PZ-9
5631.64
PZ-13
5628.84
MW-4A
5607.09
PZ-15
5609.76
SC-1
5629.11
SC-2
5627.17
SC-3
5618.34
SC-4
5610.89
SC-5
5606.58
SC-6
5598.19
SC-7
5600.48
SC-8
5590.51
CC-1
5590.02
CC-2
5600.63
CC-3
5608.58
CC-4
5605.73
CC-5
5609.89
CC-6
5613.55
5
6
3
0
5
6
2
8
5
6
2
6
5
6
2
4
5
6
2
2
5
6
2
0
5
6
1
6
5
6
1
8
5
6
1
4
5
6
1
0
5
6
0
6
5
6
0
2
5
6
1
2
5
6
1
4
5
6
0
8
5
6
0
4
5
6
0
0
5
5
9
8
5
5
9
4
5
5
9
6
5
5
9
2
NO
RT
H
LEGEND
GROUNDWATER MONITORING
POINT
POTENTIOMETRIC CONTOUR
(ELEVATION IN FEET)
Alluvial Potentiometric Surface
Black Butte Copper Project
Meagher County, Montana
Figure 3.3
5
6
2
6
PZ-1
SCALE
0
(In Feet)
800
H:\Files\TGOLD\11048\Integrated Discharge Permit\R17 Permit Application Narrative.Docx\\12/11/17\065
3-7 12/11/17\7:28 AM
during operations (Hydrometrics, 2016b) and the simulated mounding from the alluvial
discharge (Figure 3.4). The constructed operational potentiometric surface shows that the
alluvial groundwater will be lower than Coon Creek and it will discharge to approximately
3,500 lineal feet of Sheep Creek in the downgradient portion of the valley.
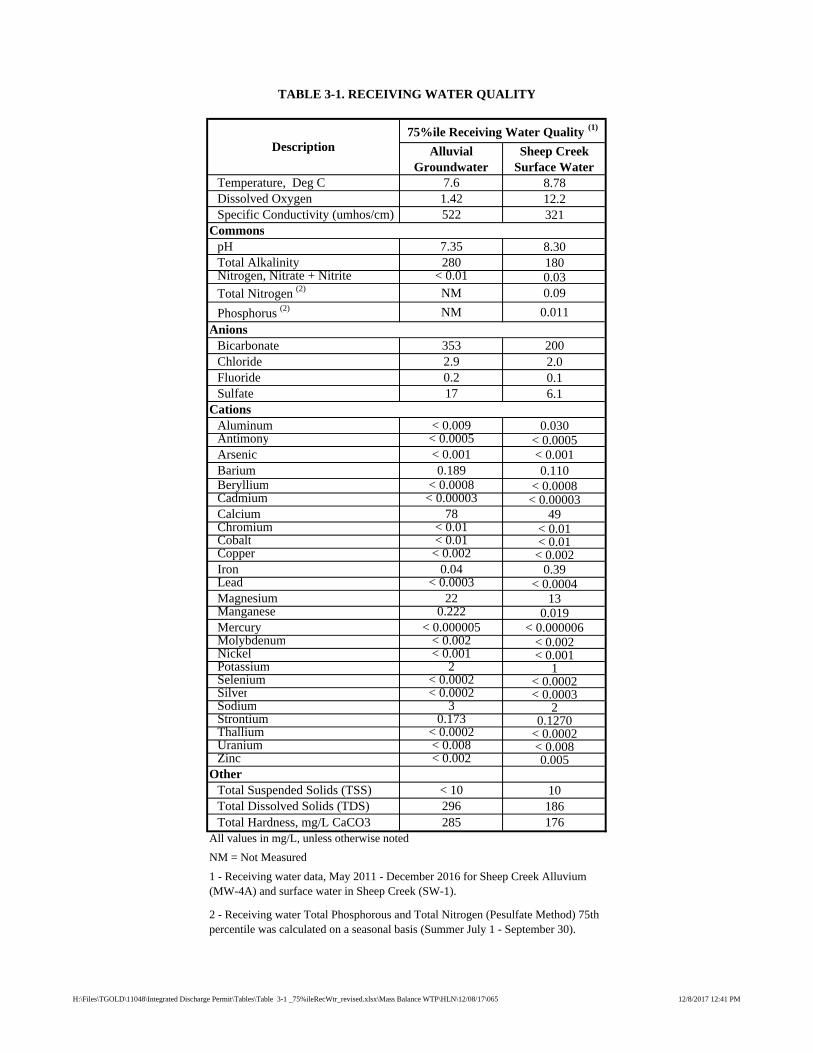
3.2.1 Receiving Water Quality
As noted in Section 3.0, it is assumed that all water discharged to the alluvial sediment
outfalls will eventually be transported downgradient to discharge to Sheep Creek. Therefore,
based on the operational potentiometric surface there are two different receiving waters that
treated water will be discharged to: Sheep Creek alluvial aquifer, and Sheep Creek surface
water. The water quality of each of these receiving waters has been characterized through
the ongoing water resource monitoring program. The water resource monitoring is described
in detail in Section 2.2 of the MOP. Water quality data and statistical analyses for each
receiving water through 2016 are included (electronically) in Appendix G of this narrative.
Table 3-1 summarizes the 75th percentile of each constituent from the two receiving waters.
The Sheep Creek alluvial UIG (Outfall 001) will discharge directly to the Sheep Creek
Alluvium. The water quality of the Sheep Creek alluvial system is characterized by results
from monitoring conducted at monitoring well MW-4A (Figure 3.2). Water in the Sheep
Creek alluvium has near neutral pH with low to non-detectable concentration of dissolved
metals. The alluvial aquifer is classified as a Class I groundwater.
It is assumed that all water that is discharged to the alluvial UIG will eventually discharge to
Sheep Creek near the downgradient end (north end of the Project permit boundary area) of
the Sheep Creek Valley where the alluvial system is pinched out at the canyon north of the
Project site. Water quality of Sheep Creek in the vicinity of the Project is best characterized
by the ongoing monthly monitoring at site SW-1. Sheep Creek surface water is a
calcium/magnesium bicarbonate type water with low to moderate dissolved solids. Chronic
aquatic criteria for dissolved aluminum (0.087 milligrams per liter [mg/L]) is often exceeded
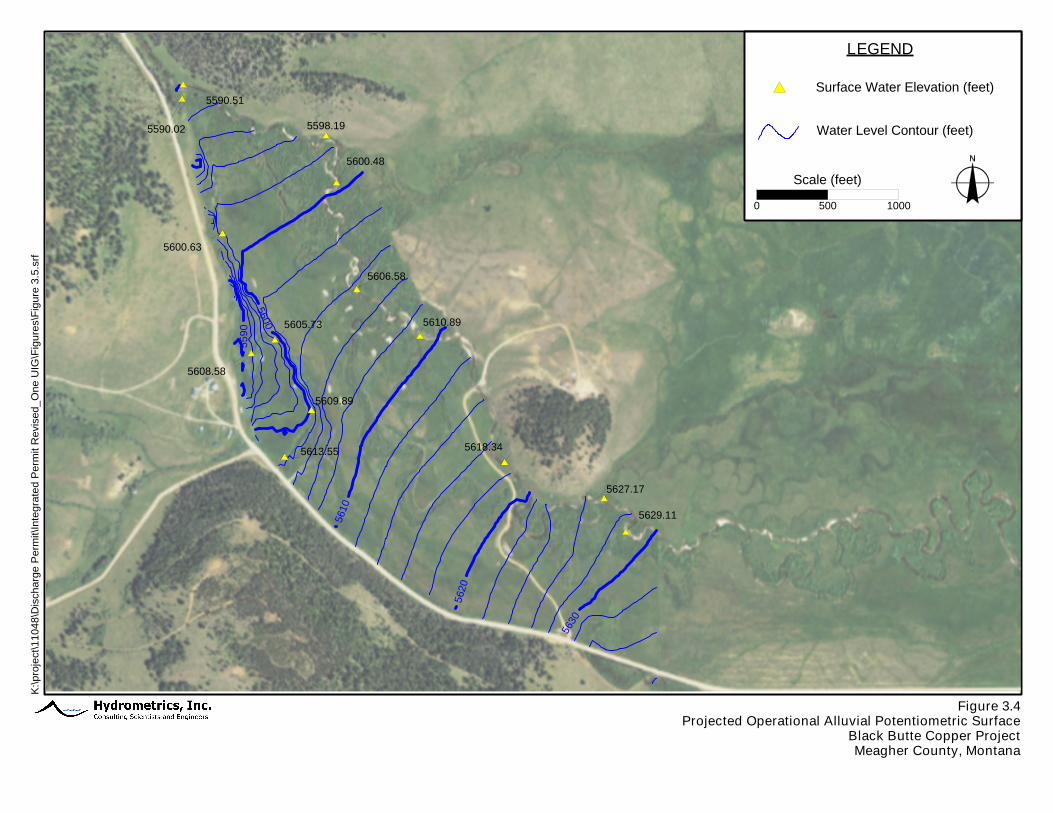
Figure 3.4Projected Operational Alluvial Potentiometric Surface
Black Butte Copper ProjectMeagher County, Montana
5590
5600
5610
5620
5630
5629.11
5627.17
5618.34
5610.89
5606.58
5598.19
5600.48
5590.51
5590.02
5600.63
5608.58
5605.73
5609.89
5613.55
LEGEND
0 500 1000
Surface Water Elevation (feet)
Water Level Contour (feet)
Scale (feet)
K:\p
roje
ct\1
1048
\Dis
char
ge P
erm
it\In
tegr
ated
Per
mit
Rev
ised
_One
UIG
\Fig
ures
\Fig
ure
3.5.
srf
Alluvial Groundwater
Sheep Creek Surface Water
Temperature, Deg C 7.6 8.78Dissolved Oxygen 1.42 12.2Specific Conductivity (umhos/cm) 522 321
CommonspH 7.35 8.30Total Alkalinity 280 180Nitrogen, Nitrate + Nitrite < 0.01 0.03Total Nitrogen (2) NM 0.09
Phosphorus (2) NM 0.011Anions
Bicarbonate 353 200Chloride 2.9 2.0Fluoride 0.2 0.1Sulfate 17 6.1
CationsAluminum < 0.009 0.030Antimony < 0.0005 < 0.0005Arsenic < 0.001 < 0.001Barium 0.189 0.110Beryllium < 0.0008 < 0.0008Cadmium < 0.00003 < 0.00003Calcium 78 49Chromium < 0.01 < 0.01Cobalt < 0.01 < 0.01Copper < 0.002 < 0.002Iron 0.04 0.39Lead < 0.0003 < 0.0004Magnesium 22 13Manganese 0.222 0.019Mercury < 0.000005 < 0.000006Molybdenum < 0.002 < 0.002Nickel < 0.001 < 0.001Potassium 2 1Selenium < 0.0002 < 0.0002Silver < 0.0002 < 0.0003Sodium 3 2Strontium 0.173 0.1270Thallium < 0.0002 < 0.0002Uranium < 0.008 < 0.008Zinc < 0.002 0.005
OtherTotal Suspended Solids (TSS) < 10 10Total Dissolved Solids (TDS) 296 186Total Hardness, mg/L CaCO3 285 176
All values in mg/L, unless otherwise noted
NM = Not Measured
Description75%ile Receiving Water Quality (1)
TABLE 3-1. RECEIVING WATER QUALITY
2 - Receiving water Total Phosphorous and Total Nitrogen (Pesulfate Method) 75th percentile was calculated on a seasonal basis (Summer July 1 - September 30).
1 - Receiving water data, May 2011 - December 2016 for Sheep Creek Alluvium (MW-4A) and surface water in Sheep Creek (SW-1).
H:\Files\TGOLD\11048\Integrated Discharge Permit\Tables\Table 3-1 _75%ileRecWtr_revised.xlsx\Mass Balance WTP\HLN\12/08/17\065 12/8/2017 12:41 PM
H:\Files\TGOLD\11048\Integrated Discharge Permit\R17 Permit Application Narrative.Docx\\12/11/17\065
3-10 12/11/17\7:28 AM
during periods of high runoff in Sheep Creek. Nutrients are relatively low, with total
nitrogen (persulfate method) being below the nutrient criteria during the summer months
(<0.04 to 0.15 mg/L).
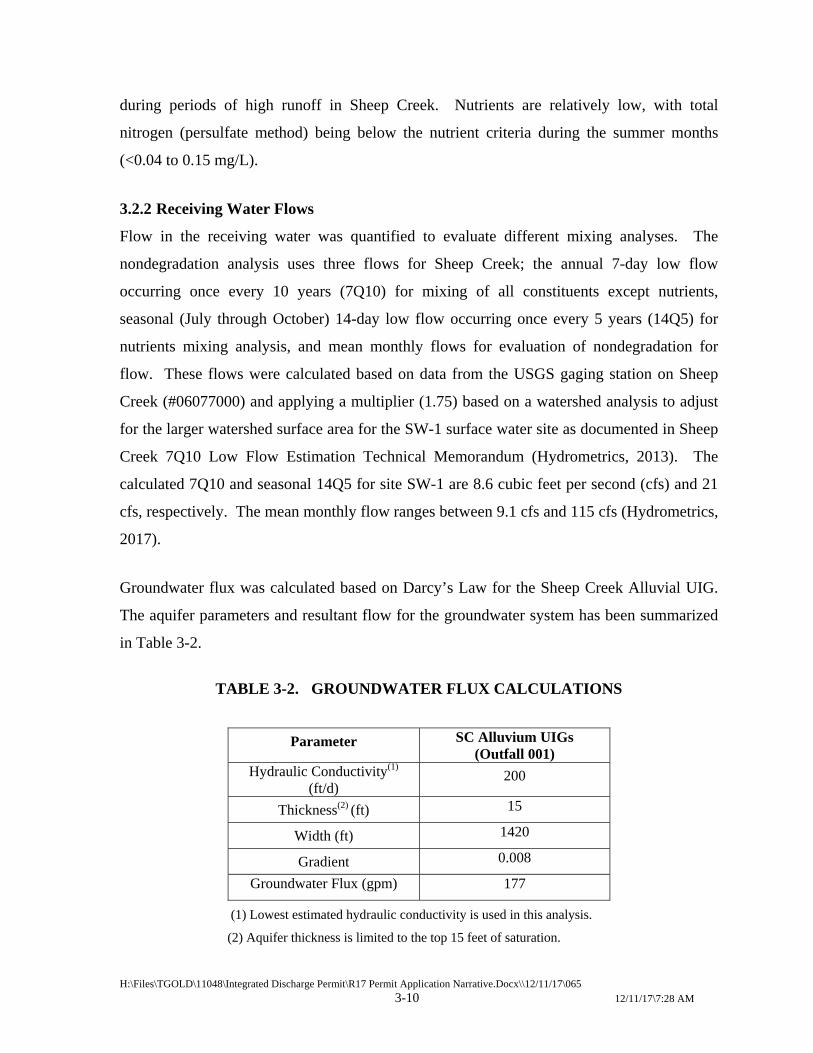
3.2.2 Receiving Water Flows
Flow in the receiving water was quantified to evaluate different mixing analyses. The
nondegradation analysis uses three flows for Sheep Creek; the annual 7-day low flow
occurring once every 10 years (7Q10) for mixing of all constituents except nutrients,
seasonal (July through October) 14-day low flow occurring once every 5 years (14Q5) for
nutrients mixing analysis, and mean monthly flows for evaluation of nondegradation for
flow. These flows were calculated based on data from the USGS gaging station on Sheep
Creek (#06077000) and applying a multiplier (1.75) based on a watershed analysis to adjust
for the larger watershed surface area for the SW-1 surface water site as documented in Sheep
Creek 7Q10 Low Flow Estimation Technical Memorandum (Hydrometrics, 2013). The
calculated 7Q10 and seasonal 14Q5 for site SW-1 are 8.6 cubic feet per second (cfs) and 21
cfs, respectively. The mean monthly flow ranges between 9.1 cfs and 115 cfs (Hydrometrics,
2017).
Groundwater flux was calculated based on Darcy’s Law for the Sheep Creek Alluvial UIG.
The aquifer parameters and resultant flow for the groundwater system has been summarized
in Table 3-2.
TABLE 3-2. GROUNDWATER FLUX CALCULATIONS
Parameter SC Alluvium UIGs (Outfall 001)
Hydraulic Conductivity(1) (ft/d)
200
Thickness(2) (ft) 15
Width (ft) 1420
Gradient 0.008
Groundwater Flux (gpm) 177
(1) Lowest estimated hydraulic conductivity is used in this analysis.
(2) Aquifer thickness is limited to the top 15 feet of saturation.

H:\Files\TGOLD\11048\Integrated Discharge Permit\R17 Permit Application Narrative.Docx\\12/11/17\065
3-11 12/11/17\7:28 AM
3.3 SITE WATER MANAGEMENT
With the exception of the Public Water Supply (PWS) well, Tintina’s only source of water
for use in mining and milling activities will be from groundwater inflow into the open mine
workings. Water diverted through the portal will be used for the water needs for
underground mining, the mill, tailings paste plant, and smaller miscellaneous uses (dust
suppression, ice abatement, equipment wash bays, etc.). Mill water requirements and
miscellaneous freshwater requirements (truck wash, dust control, etc.) were quantified by
Tetra Tech based on the milling process and production rates of the mine.
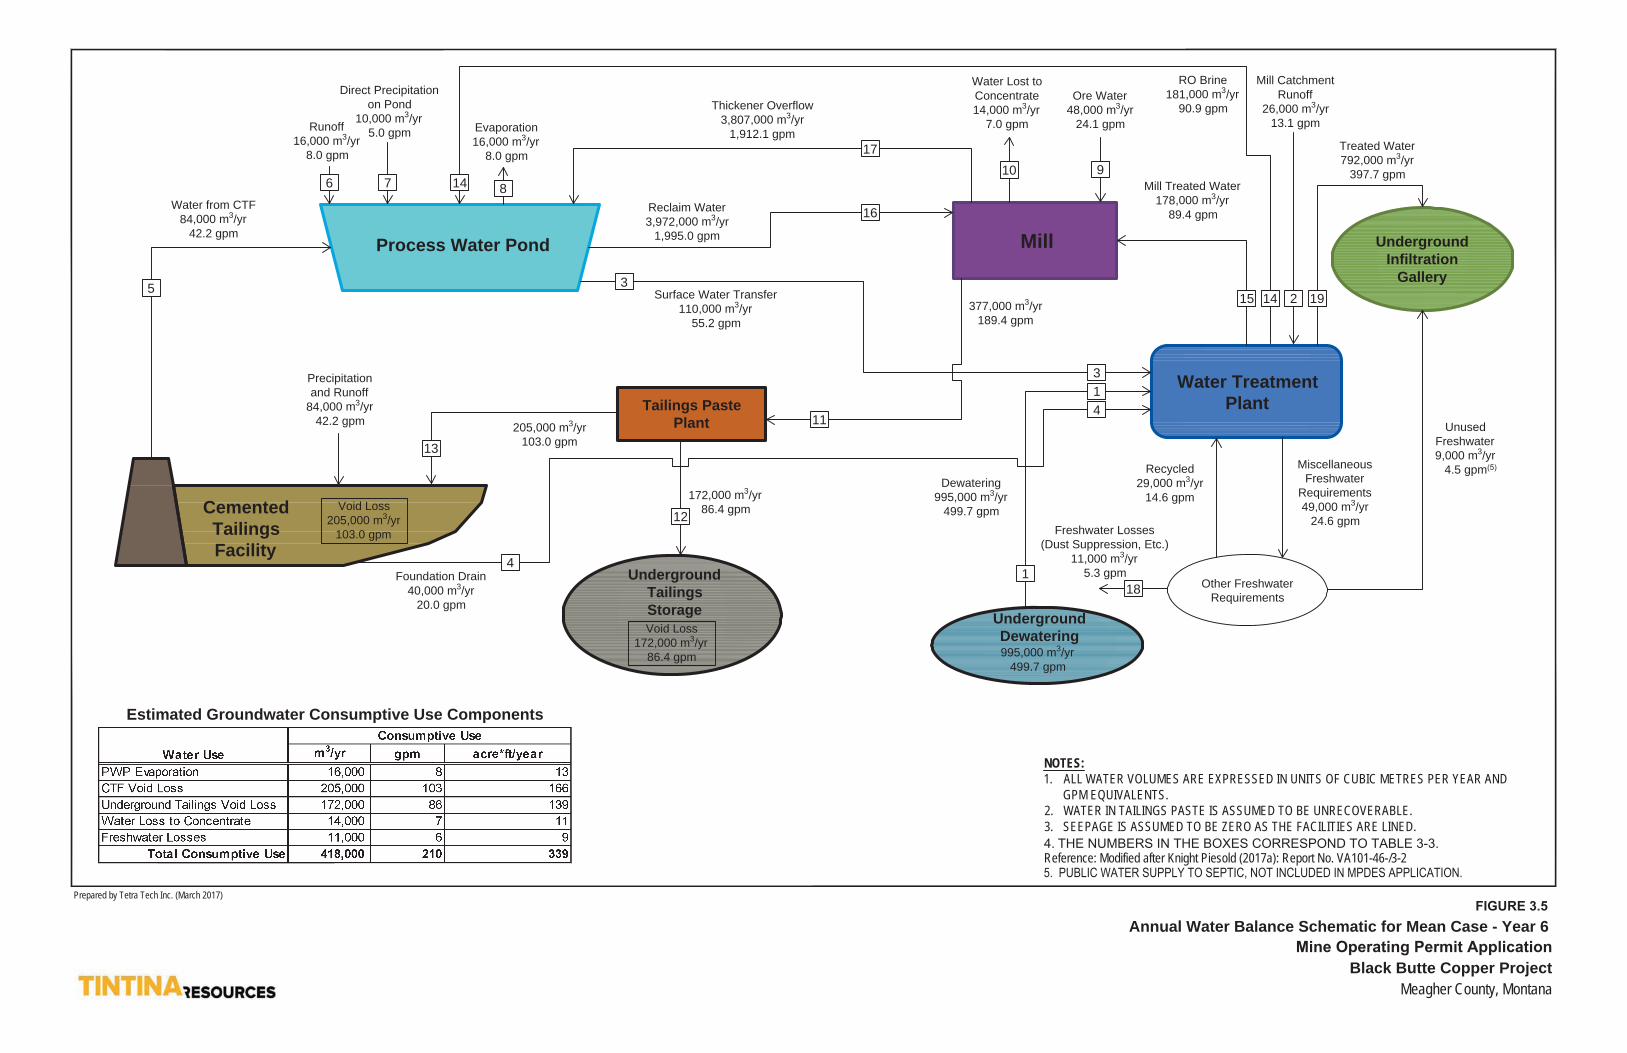
An operational water balance model was developed using the GoldSim modeling software to
assess mean hydrologic characteristics and variability of flows for all of the proposed
facilities (Knight Piésold, 2017, Appendix L of MOP). Figure 3.5 shows a schematic of the
average annual water balance for the Project. The volume of water in the Cemented Tailings
Facility (CTF), Process Water Pond (PWP), and water reporting to the Contact Water Pond
(“Mill Catchment Runoff,” in the water balance model) were estimated on a monthly basis
over 15 years (including two years for pre-production and 13 years of operations).
Meteorological parameters for the model were developed using site specific data in
conjunction with regional data (Bison Engineering, 2012 through 2016). The water balance
model uses the mean monthly precipitation and evaporation values as inputs for each year.
These account for rain and snow accumulation, snowmelt, evapotranspiration, and resulting
run-off. The surface area was calculated for each time-step using the Depth-Area-Capacity
data for the facility. Below is a summary of the proposed water management plan for the
Project.
Prior to mill startup, water will be diverted from the portal and stored in the PWP to provide
sufficient water for startup of the mill (65 acre-ft). The operational water storage for the
PWP will range between 103 to 162 acre-ft. There is an additional 162 acre-ft of capacity
built into the PWP to allow for storage of water from a probable maximum flood (PMF)
storm event.
172,000 m3/yr86.4 gpm
205,000 m3/yr103.0 gpm
Water from CTF84,000 m3/yr
42.2 gpm
Direct Precipitationon Pond
10,000 m3/yr5.0 gpm Evaporation
16,000 m3/yr8.0 gpm
Thickener Overflow3,807,000 m3/yr
1,912.1 gpm
Reclaim Water3,972,000 m3/yr
1,995.0 gpm
Surface Water Transfer110,000 m3/yr
55.2 gpm
Water Lost toConcentrate14,000 m3/yr
7.0 gpm
Ore Water48,000 m3/yr
24.1 gpm
Mill CatchmentRunoff
26,000 m3/yr13.1 gpm
Mill Treated Water178,000 m3/yr
89.4 gpm
Treated Water792,000 m3/yr
397.7 gpm
377,000 m3/yr189.4 gpm
Dewatering995,000 m3/yr
499.7 gpm
Recycled29,000 m3/yr
14.6 gpm
Freshwater Losses(Dust Suppression, Etc.)
11,000 m3/yr5.3 gpm
MiscellaneousFreshwater
Requirements49,000 m3/yr
24.6 gpm
UnusedFreshwater9,000 m3/yr
4.5 gpm(5)
Void Loss205,000 m3/yr
103.0 gpm
Other FreshwaterRequirements
Runoff16,000 m3/yr
8.0 gpm
Precipitationand Runoff
84,000 m3/yr42.2 gpm
UndergroundInfiltration
Gallery
Water TreatmentPlant
CementedTailingsFacility
Process Water Pond Mill
UndergroundDewatering
UndergroundTailingsStorage
Tailings PastePlant
NOTES:1. ALL WATER VOLUMES ARE EXPRESSED IN UNITS OF CUBIC METRES PER YEAR AND
GPM EQUIVALENTS.2. WATER IN TAILINGS PASTE IS ASSUMED TO BE UNRECOVERABLE.3. SEEPAGE IS ASSUMED TO BE ZERO AS THE FACILITIES ARE LINED.
3-3 Reference: Modified after Knight Piesold (2017a): Report No. VA101-46-/3-25. PUBLIC WATER SUPPLY TO SEPTIC, NOT INCLUDED IN MPDES APPLICATION.
Estimated Groundwater Consumptive Use Components
Foundation Drain40,000 m3/yr
20.0 gpm
RO Brine181,000 m3/yr
90.9 gpm
3
1
411
4
12
118
5
13
910
3
81476
15 2 1914
Void Loss172,000 m3/yr
86.4 gpm 995,000 m3/yr499.7 gpm
16
17
FIGURE 3.5 Annual Water Balance Schematic for Mean Case - Year 6
Black Butte Copper ProjectMeagher County, Montana
Prepared by Tetra Tech Inc. (March 2017)
H:\Files\TGOLD\11048\Integrated Discharge Permit\R17 Permit Application Narrative.Docx\\12/11/17\065
3-13 12/11/17\7:28 AM
Once the minimal operational water volume is stored in the PWP and the mill goes on line,
water will typically be diverted from the portal to the WTP. Only during times of low water
storage in the PWP will water be directly diverted from the portal to the PWP. The mill
design is based upon industry standard processing methods that will separate and concentrate
the copper minerals. When operating the mill at design capacity the milling process requires
the largest quantity of water for the Project with 1,995 gpm coming from the PWP, 24 gpm
from water entrained in the ore, and 89 gpm from the WTP. The water management plan
recycles more than 90% of the water used in the mill by returning it back to the PWP for
future use. Water will be added to the PWP from the RO reject (brine) at an average annual
rate of 91 gpm. Precipitation that falls on the CTF (42.2 gpm) will be diverted to the PWP;
an additional 13 gpm of precipitation will be captured in the PWP. To avoid excess water in
the PWP, water will be diverted from the PWP to the WTP at a volume equal to the sum of
precipitation on the CTF and precipitation captured in the PWP. Groundwater retained in the
ore after mining will be mixed with water from the PWP during the grinding process.
Treated water reporting to the mill will be used for pump gland water and other ancillary
processes in the mill.
Water will be diverted from the mill circuit for other uses, which include water that is
retained in the copper concentrate that leaves the facility (7 gpm) and 189 gpm that is
required for wetting the tailings in the paste plant. Water used in the tailings paste plant is
used to mix the tailings with cement and other binders for deposition in the CTF and as paste
backfill in the underground mine workings. Tailings deposited in the underground workings
will be mixed with approximately 4% cement/binders and the tailings deposited in the CTF
will be mixed with 0.5 to 2% cement/binders. The water needs for the paste plant are based
on appropriate mixtures to allow for the tailings to be pumped to the underground workings
or CTF. It is assumed that the water in the tailings/cement mixture will be bound in the
tailings once the cemented tailings set up and there will not be any or only minimal discharge
of water from the tailings/cement mixtures.
Approximately 20 gpm will be diverted from the WTP to be used for miscellaneous
freshwater requirements. These include but are not limited to dust suppression, ice
H:\Files\TGOLD\11048\Integrated Discharge Permit\R17 Permit Application Narrative.Docx\\12/11/17\065
3-14 12/11/17\7:28 AM
abatement, and equipment washing. It should be noted that this 20 gpm does not include the
4.5 gpm of unused freshwater that is associated with the PWS system (see notes on Figure
3.5). Approximately 14.6 gpm of the miscellaneous uses will be collected and recycled back
to the WTP and 5.3 gpm will be consumed through dust suppression, ice abatement, etc.
Water will also be used for underground activities (e.g., drilling) at a rate of 150 gpm;
however, after the initial startup of the WTP 100% of water used underground will be
collected in the underground sumps and pumped back to the surface and recycled through the
WTP and/or become part of the discharge to the MPDES outfalls. For this reason, the
underground water use was not included in the water balance developed by Knight Piésold.
The water balance shows that the average discharge to the MPDES outfall will be 398 gpm.
The WTP is designed to handle 1.5 times the projected average flow rate to account for
higher dewatering rates that may occur during dewatering of larger volume storage areas in
the ore body and/or resulting from seasonal fluctuations. The maximum flow rate that will
be discharged to the MPDES outfall is 575 gpm.
3.3.1 Technology Based Effluent Limitation Guidelines (ELGs)
Effluent discharged under the Project will be subject to 40 CFR 440 Subpart J Copper, Lead,
Zinc, Gold, Silver, and Molybdenum ore’s subcategory; specifically Section 104.00 new
source performance standards (NSPS) and Subpart L General Provisions, Section 440.130.
These sections describe technology based effluent standards for discharge of waters
generated on site and the disposition of those waters. Section 440.104 states in part:
“…any new source subject to this subsection must achieve the following NSPS
representing the degree of effluent reduction attainable by the application of the best
available demonstrated technology (BADT)”.
H:\Files\TGOLD\11048\Integrated Discharge Permit\R17 Permit Application Narrative.Docx\\12/11/17\065
3-15 12/11/17\7:28 AM
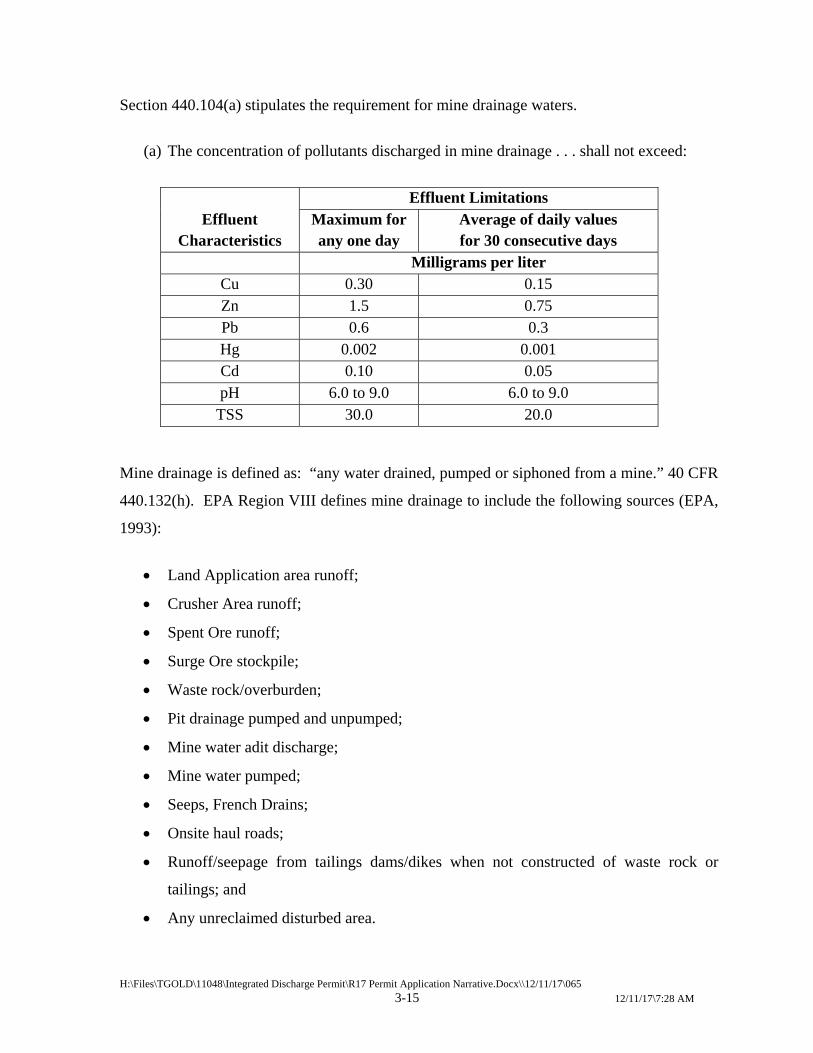
Section 440.104(a) stipulates the requirement for mine drainage waters.
(a) The concentration of pollutants discharged in mine drainage . . . shall not exceed:
Effluent Characteristics
Effluent Limitations Maximum for any one day
Average of daily values for 30 consecutive days
Milligrams per liter Cu 0.30 0.15 Zn 1.5 0.75 Pb 0.6 0.3 Hg 0.002 0.001 Cd 0.10 0.05 pH 6.0 to 9.0 6.0 to 9.0
TSS 30.0 20.0
Mine drainage is defined as: “any water drained, pumped or siphoned from a mine.” 40 CFR
440.132(h). EPA Region VIII defines mine drainage to include the following sources (EPA,
1993):
Land Application area runoff;
Crusher Area runoff;
Spent Ore runoff;
Surge Ore stockpile;
Waste rock/overburden;
Pit drainage pumped and unpumped;
Mine water adit discharge;
Mine water pumped;
Seeps, French Drains;
Onsite haul roads;
Runoff/seepage from tailings dams/dikes when not constructed of waste rock or
tailings; and
Any unreclaimed disturbed area.
H:\Files\TGOLD\11048\Integrated Discharge Permit\R17 Permit Application Narrative.Docx\\12/11/17\065
3-16 12/11/17\7:28 AM
Section 440.104(b)(1) stipulated the disposition of process waters. (b)(1) . . . there shall be no discharge of process wastewater to navigable waters (emphasis
added) from mills that use the froth-flotation process alone, or in conjunction with other
processes, for the beneficiation of copper . . .“A general ‘Process Wastewater’ definition is
provided in 40 CFR 122.2 which states: any water which, during manufacturing or
processing, comes in direct contact with or results from the production or use of any raw
material, intermediate product, finished product, byproduct, or waste product.” (EPA, 2011).
EPA Region VIII further defines process wastewater to include the following sources (EPA,
1993):
Tailings impoundments/pile;
Heap Leach Pile runoff/ seepage;
Pregnant Pond;
Polishing Pond; and
Concentrate Pile (product storage).
Tintina is not proposing to discharge treated or untreated volumes of process wastewater
from the froth flotation process to navigable waters as described in the ELG. Tintina is
proposing to discharge treated wastewater as follows: First, all wastewater will be treated by
advanced RO process to remove parameters of concern (POC), and second, all treated
effluent will be discharged to the groundwater system via alluvial infiltration trenches
(UIGs). The PWP volume is balanced when precipitation that falls on the CTF and PWP is
diverted back to the WTP prior to discharge. A greater volume of water is discharged from
the WTP back to the mill and PWP via the mill treated water stream and RO Brine makeup
water.
As provided in 40 CFR 440.104 (b)(2)(i), Tintina will treat and process a comparable volume
of wastewater and discharge that volume via the infiltration galleries. 40 CFR
440.104(B)(2)(i) states: “In the event that the annual precipitation falling on the treatment
facility and the drainage area contributing surface runoff to the treatment facility exceeds the
H:\Files\TGOLD\11048\Integrated Discharge Permit\R17 Permit Application Narrative.Docx\\12/11/17\065
3-17 12/11/17\7:28 AM
annual evaporation, a volume of water equal to the difference…may be discharged subject to
the limitations set forth in paragraph (a) of this section.”
Subpart L (General Provisions) furthers this allowance in 40 CFR 440.131 (a) Combined
Waste Streams. “In the event that waste streams from various subparts or segments of
subparts in part 440 are combined for treatment and discharge, the quantity and concentration
of each pollutant or pollutant property in the combined discharge that is subject to effluent
limitations shall not exceed the quantity and concentration of each pollutant or pollutant
property that could have been discharged had each waste stream been treated separately. In
addition, the discharge flow from the combined discharge shall not exceed the volume that
could have been discharged had each waste stream been treated separately.” This part allows
for a comparable volume of process wastewater (which includes precipitation, storm water,
and mine drainage waters which have come in contact with process wastewater) to be treated
and discharged.
Wastewater treatment was designed to maintain effluent concentrations below NSPS effluent
limitations. The water treatment process would use a double-pass RO system with clarifier
pre-treatment and a post-treatment polishing (buffer addition) phase as described in Section
3.4. The effluent will also not exceed the estimated maximum allowable effluent
concentrations based on nondegradation criteria. (The Nondegradation Analysis for MPDES
Outfall 001 is described in Section 3.5.) Furthermore, Tintina has aggressively sought out
and implemented a number of process variations and modifications to facility siting and
construction to reduce the risks to human health and the environment. One such process
variation employed will be use of cemented paste tailings (both underground and in the CTF)
as an alternative to a classical sub-aqueous tailings impoundment. Therefore, the potential
risk associated with dam failure and discharge water originating from process water stored on
the CTF is minimized.
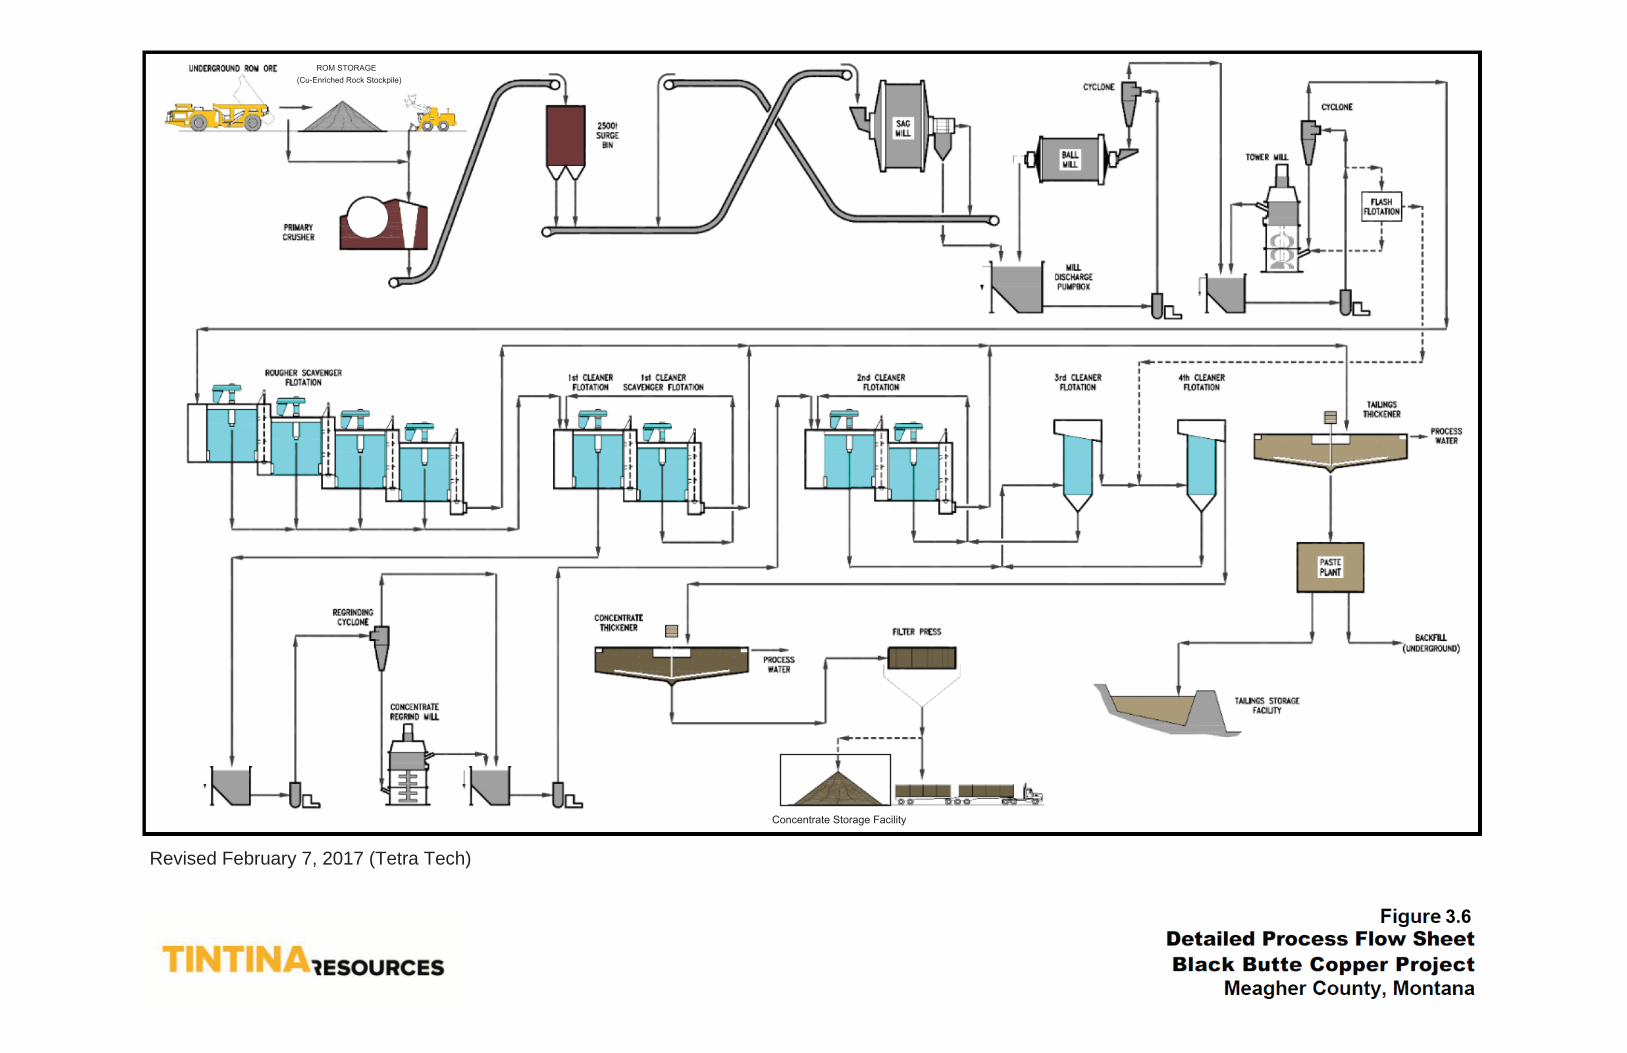
The Project will use a flotation process to recover and upgrade copper values in order to
produce a saleable copper concentrate. Copper will be recovered from the flotation circuit in
a froth and transferred to subsequent upgrading stages and dewatering within the processing

H:\Files\TGOLD\11048\Integrated Discharge Permit\R17 Permit Application Narrative.Docx\\12/11/17\065
3-18 12/11/17\7:28 AM
plant. The reagents proposed for use in this process are common for copper flotation. They
include sodium isopropyl xanthate (SIPX) and Aerophine 3418A as copper mineral
collectors, and methyl isobutyl carbinol (MIBC) as a frothing agent. The pH will be
managed by the use of lime, added at various points in the process, with a flotation process,
pH typically in the range of 10 to 11.5 standard units. This reagent list may be modified
operationally to optimize copper recovery. Safety Data Sheets (SDS) for reagents are
contained in Appendix H.
3.4 WATER TREATMENT
Tintina evaluated the need and the potential methods for water treatment at the Project site.
The basis of design for water treatment incorporates the planned development of the Project,
the water budget for the Project, the characteristics of the water that requires management,
and the effluent treatment goals. Figure 3.6 provides a schematic of critical portions of the
water flow-path at the Project site.
Water will require management during three phases of the mine life cycle: Construction
Phase, Operational Phase, and Closure Phase. These three phases of mine life will have the
same effluent goals. However, the water sources, flow rates, influent water quality, and
facilities available for disposal of treatment residuals will vary. Section 3.7.3 of the MOP
application describes the screening process used for assembling and evaluating water
treatment alternatives, and the proposed water treatment processes for various stages of the
life cycle of the mine. The following is a brief summary of that discussion.
3.4.1 Raw Water Quality
The raw water quality of the many sources used to estimate the water quality of the WTP
influent during operations were derived from geochemical modeling of water quality for the
underground mine dewatering, PWP, and CTF, along with estimated water quality for rain
water and the mill catchment runoff. A visual representation of the water balance is
presented in Figure 3.5. The numbered flow streams on Figure 3.5 correspond to those of
Table 3-3 (Site Wide Mass Balance) and water types (applicability to 40 CFR Part 440
3.6
ROM STORAGE(Cu-Enriched Rock Stockpile)
Revised February 7, 2017 (Tetra Tech)
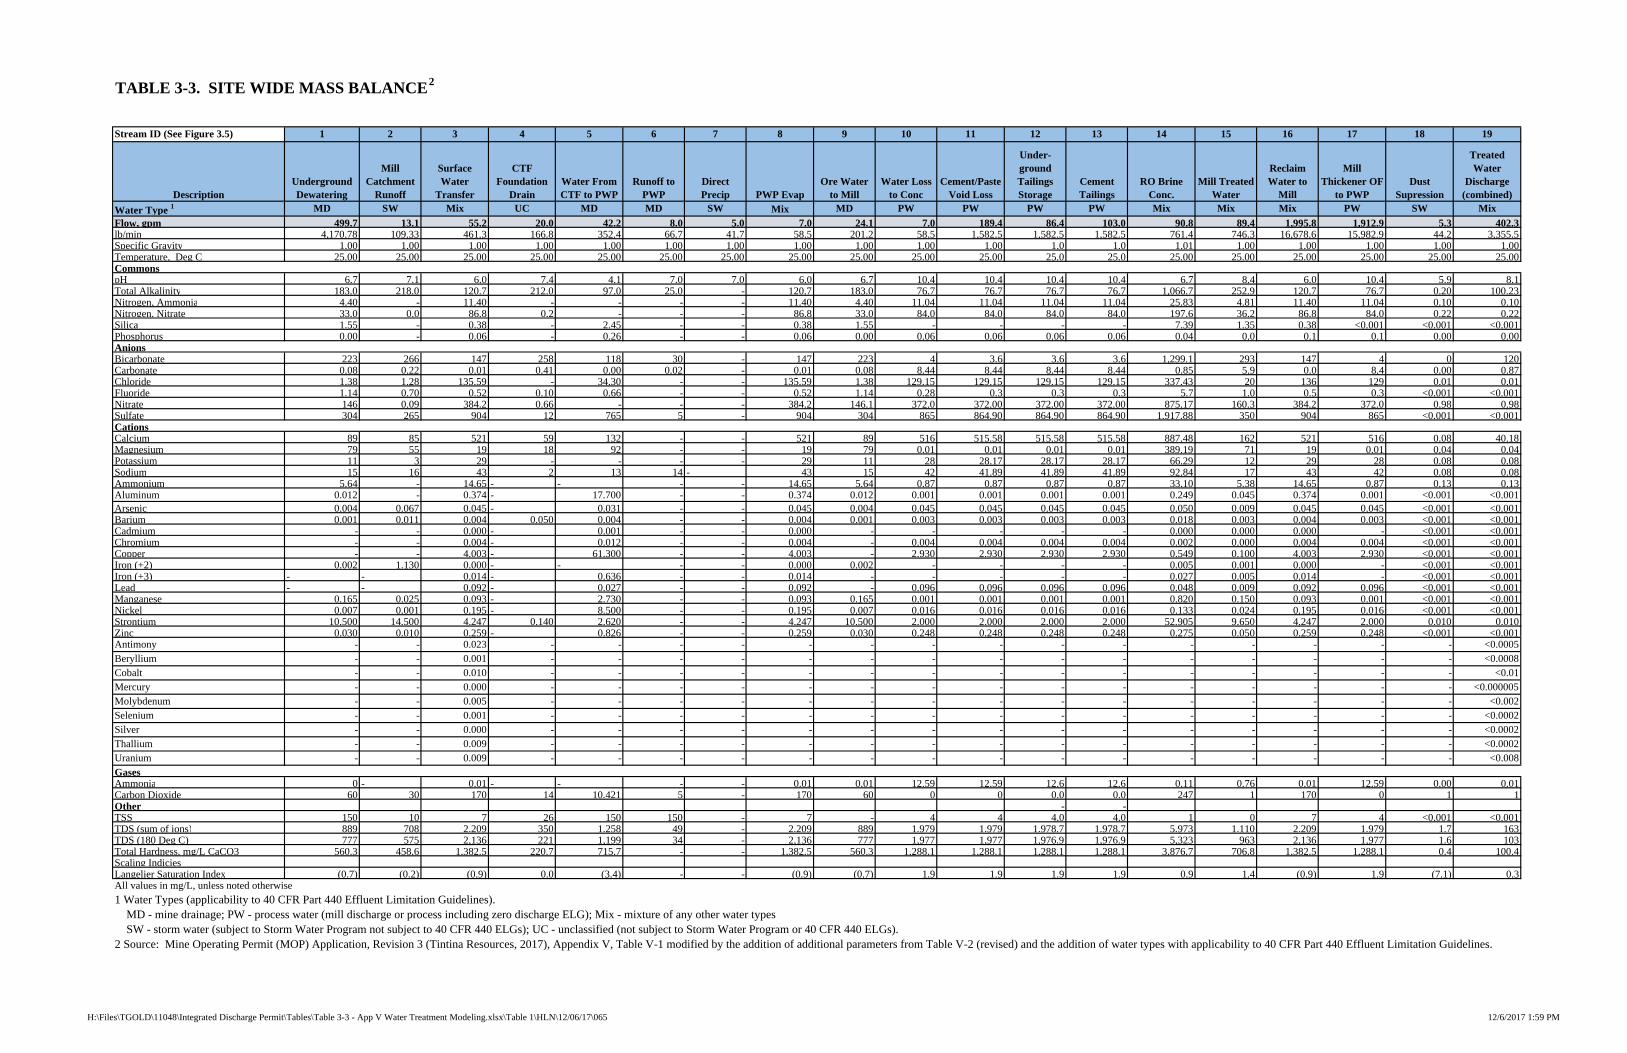
TABLE 3-3. SITE WIDE MASS BALANCE2
Stream ID (See Figure 3.5) 1 2 3 4 5 6 7 8 9 10 11 12 13 14 15 16 17 18 19
DescriptionUnderground Dewatering
Mill Catchment
Runoff
Surface Water
Transfer
CTFFoundation
DrainWater From CTF to PWP
Runoff to PWP
Direct Precip PWP Evap
Ore Water to Mill
Water Loss to Conc
Cement/Paste Void Loss
Under- ground Tailings Storage
Cement Tailings
RO Brine Conc.
Mill Treated Water
Reclaim Water to
Mill
Mill Thickener OF
to PWPDust
Supression
Treated Water
Discharge (combined)
Water Type 1 MD SW Mix UC MD MD SW Mix MD PW PW PW PW Mix Mix Mix PW SW Mix
Flow, gpm 499.7 13.1 55.2 20.0 42.2 8.0 5.0 7.0 24.1 7.0 189.4 86.4 103.0 90.8 89.4 1,995.8 1,912.9 5.3 402.3lb/min 4,170.78 109.33 461.3 166.8 352.4 66.7 41.7 58.5 201.2 58.5 1,582.5 1,582.5 1,582.5 761.4 746.3 16,678.6 15,982.9 44.2 3,355.5Specific Gravity 1.00 1.00 1.00 1.00 1.00 1.00 1.00 1.00 1.00 1.00 1.00 1.0 1.0 1.01 1.00 1.00 1.00 1.00 1.00Temperature, Deg C 25.00 25.00 25.00 25.00 25.00 25.00 25.00 25.00 25.00 25.00 25.00 25.0 25.0 25.00 25.00 25.00 25.00 25.00 25.00
pH 6.7 7.1 6.0 7.4 4.1 7.0 7.0 6.0 6.7 10.4 10.4 10.4 10.4 6.7 8.4 6.0 10.4 5.9 8.1Total Alkalinity 183.0 218.0 120.7 212.0 97.0 25.0 - 120.7 183.0 76.7 76.7 76.7 76.7 1,066.7 252.9 120.7 76.7 0.20 100.23Nitrogen, Ammonia 4.40 - 11.40 - - - - 11.40 4.40 11.04 11.04 11.04 11.04 25.83 4.81 11.40 11.04 0.10 0.10Nitrogen, Nitrate 33.0 0.0 86.8 0.2 - - - 86.8 33.0 84.0 84.0 84.0 84.0 197.6 36.2 86.8 84.0 0.22 0.22Silica 1.55 - 0.38 - 2.45 - - 0.38 1.55 - - - - 7.39 1.35 0.38 <0.001 <0.001 <0.001Phosphorus 0.00 - 0.06 - 0.26 - - 0.06 0.00 0.06 0.06 0.06 0.06 0.04 0.0 0.1 0.1 0.00 0.00
Bicarbonate 223 266 147 258 118 30 - 147 223 4 3.6 3.6 3.6 1,299.1 293 147 4 0 120Carbonate 0.08 0.22 0.01 0.41 0.00 0.02 - 0.01 0.08 8.44 8.44 8.44 8.44 0.85 5.9 0.0 8.4 0.00 0.87Chloride 1.38 1.28 135.59 - 34.30 - - 135.59 1.38 129.15 129.15 129.15 129.15 337.43 20 136 129 0.01 0.01Fluoride 1.14 0.70 0.52 0.10 0.66 - - 0.52 1.14 0.28 0.3 0.3 0.3 5.7 1.0 0.5 0.3 <0.001 <0.001Nitrate 146 0.09 384.2 0.66 - - - 384.2 146.1 372.0 372.00 372.00 372.00 875.17 160.3 384.2 372.0 0.98 0.98Sulfate 304 265 904 12 765 5 - 904 304 865 864.90 864.90 864.90 1,917.88 350 904 865 <0.001 <0.001
Calcium 89 85 521 59 132 - - 521 89 516 515.58 515.58 515.58 887.48 162 521 516 0.08 40.18Magnesium 79 55 19 18 92 - - 19 79 0.01 0.01 0.01 0.01 389.19 71 19 0.01 0.04 0.04Potassium 11 3 29 - - - - 29 11 28 28.17 28.17 28.17 66.29 12 29 28 0.08 0.08Sodium 15 16 43 2 13 14 - 43 15 42 41.89 41.89 41.89 92.84 17 43 42 0.08 0.08Ammonium 5.64 - 14.65 - - - - 14.65 5.64 0.87 0.87 0.87 0.87 33.10 5.38 14.65 0.87 0.13 0.13Aluminum 0.012 - 0.374 - 17.700 - - 0.374 0.012 0.001 0.001 0.001 0.001 0.249 0.045 0.374 0.001 <0.001 <0.001Arsenic 0.004 0.067 0.045 - 0.031 - - 0.045 0.004 0.045 0.045 0.045 0.045 0.050 0.009 0.045 0.045 <0.001 <0.001Barium 0.001 0.011 0.004 0.050 0.004 - - 0.004 0.001 0.003 0.003 0.003 0.003 0.018 0.003 0.004 0.003 <0.001 <0.001Cadmium - - 0.000 - 0.001 - - 0.000 - - - - - 0.000 0.000 0.000 - <0.001 <0.001Chromium - - 0.004 - 0.012 - - 0.004 - 0.004 0.004 0.004 0.004 0.002 0.000 0.004 0.004 <0.001 <0.001Copper - - 4.003 - 61.300 - - 4.003 - 2.930 2.930 2.930 2.930 0.549 0.100 4.003 2.930 <0.001 <0.001Iron (+2) 0.002 1.130 0.000 - - - - 0.000 0.002 - - - - 0.005 0.001 0.000 - <0.001 <0.001Iron (+3) - - 0.014 - 0.636 - - 0.014 - - - - - 0.027 0.005 0.014 - <0.001 <0.001Lead - - 0.092 - 0.027 - - 0.092 - 0.096 0.096 0.096 0.096 0.048 0.009 0.092 0.096 <0.001 <0.001Manganese 0.165 0.025 0.093 - 2.730 - - 0.093 0.165 0.001 0.001 0.001 0.001 0.820 0.150 0.093 0.001 <0.001 <0.001Nickel 0.007 0.001 0.195 - 8.500 - - 0.195 0.007 0.016 0.016 0.016 0.016 0.133 0.024 0.195 0.016 <0.001 <0.001Strontium 10.500 14.500 4.247 0.140 2.620 - - 4.247 10.500 2.000 2.000 2.000 2.000 52.905 9.650 4.247 2.000 0.010 0.010Zinc 0.030 0.010 0.259 - 0.826 - - 0.259 0.030 0.248 0.248 0.248 0.248 0.275 0.050 0.259 0.248 <0.001 <0.001Antimony - - 0.023 - - - - - - - - - - - - - - - <0.0005Beryllium - - 0.001 - - - - - - - - - - - - - - - <0.0008Cobalt - - 0.010 - - - - - - - - - - - - - - - <0.01Mercury - - 0.000 - - - - - - - - - - - - - - - <0.000005Molybdenum - - 0.005 - - - - - - - - - - - - - - - <0.002Selenium - - 0.001 - - - - - - - - - - - - - - - <0.0002Silver - - 0.000 - - - - - - - - - - - - - - - <0.0002Thallium - - 0.009 - - - - - - - - - - - - - - - <0.0002Uranium - - 0.009 - - - - - - - - - - - - - - - <0.008
Ammonia 0 - 0.01 - - - - 0.01 0.01 12.59 12.59 12.6 12.6 0.11 0.76 0.01 12.59 0.00 0.01Carbon Dioxide 60 30 170 14 10,421 5 - 170 60 0 0 0.0 0.0 247 1 170 0 1 1Other - -TSS 150 10 7 26 150 150 - 7 - 4 4 4.0 4.0 1 0 7 4 <0.001 <0.001TDS (sum of ions) 889 708 2,209 350 1,258 49 - 2,209 889 1,979 1,979 1,978.7 1,978.7 5,973 1,110 2,209 1,979 1.7 163TDS (180 Deg C) 777 575 2,136 221 1,199 34 - 2,136 777 1,977 1,977 1,976.9 1,976.9 5,323 963 2,136 1,977 1.6 103Total Hardness, mg/L CaCO3 560.3 458.6 1,382.5 220.7 715.7 - - 1,382.5 560.3 1,288.1 1,288.1 1,288.1 1,288.1 3,876.7 706.8 1,382.5 1,288.1 0.4 100.4Scaling IndiciesLangelier Saturation Index (0.7) (0.2) (0.9) 0.0 (3.4) - - (0.9) (0.7) 1.9 1.9 1.9 1.9 0.9 1.4 (0.9) 1.9 (7.1) 0.3All values in mg/L, unless noted otherwise
1 Water Types (applicability to 40 CFR Part 440 Effluent Limitation Guidelines). MD - mine drainage; PW - process water (mill discharge or process including zero discharge ELG); Mix - mixture of any other water types SW - storm water (subject to Storm Water Program not subject to 40 CFR 440 ELGs); UC - unclassified (not subject to Storm Water Program or 40 CFR 440 ELGs).
Commons
Anions
Cations
Gases
2 Source: Mine Operating Permit (MOP) Application, Revision 3 (Tintina Resources, 2017), Appendix V, Table V-1 modified by the addition of additional parameters from Table V-2 (revised) and the addition of water types with applicability to 40 CFR Part 440 Effluent Limitation Guidelines.
H:\Files\TGOLD\11048\Integrated Discharge Permit\Tables\Table 3-3 - App V Water Treatment Modeling.xlsx\Table 1\HLN\12/06/17\065 12/6/2017 1:59 PM
H:\Files\TGOLD\11048\Integrated Discharge Permit\R17 Permit Application Narrative.Docx\\12/11/17\065
3-21 12/11/17\7:28 AM
Effluent Limitation Guidelines) are designated in the heading for each flow stream. The
source and/or assumptions of the raw water quality used for each stream are summarized
below:
Geochemical model of water quality for underground dewatering was used for Mine
Dewatering (1) and Ore Water quality (i.e., moisture and/or pore water in the copper-
enriched rock) sent to the Mill (9);
Geochemical model of CTF Sump was used for Water from CTF to PWP (5);
Geochemical model of PWP was used for Surface Water Transfer (3); Water Loss to
Concentrate (10), and Cemented Paste Void Loss (13), with exception of the nitrate
concentration which was based on mass balance modeling;
Water from the CTF foundation drain pond to the PWP (4) or the WTP; the average
water quality from MW-12 was used for the water originating from CTF Foundation
Drain Pond;
Estimated water qualities for the Mill Catchment Runoff (2) is conservatively based
on average water quality of the Upper Copper Zone (UCZ); and
Water quality for Net Runoff to the PWP (6) was assumed to be similar to rain water
with a small amount of dissolved salts.
POC for each phase were established by comparing the expected raw water quality to the
estimated maximum allowable effluent concentrations (EMAECs). The EMAECs were
established from the nondegradation and mixing analysis which is summarized in Section
3.5. The POC that need to be addressed by water treatment systems during the Construction,
Operations, and Closure Phases are similar, but differ slightly due to the different mixtures of
raw water sources.
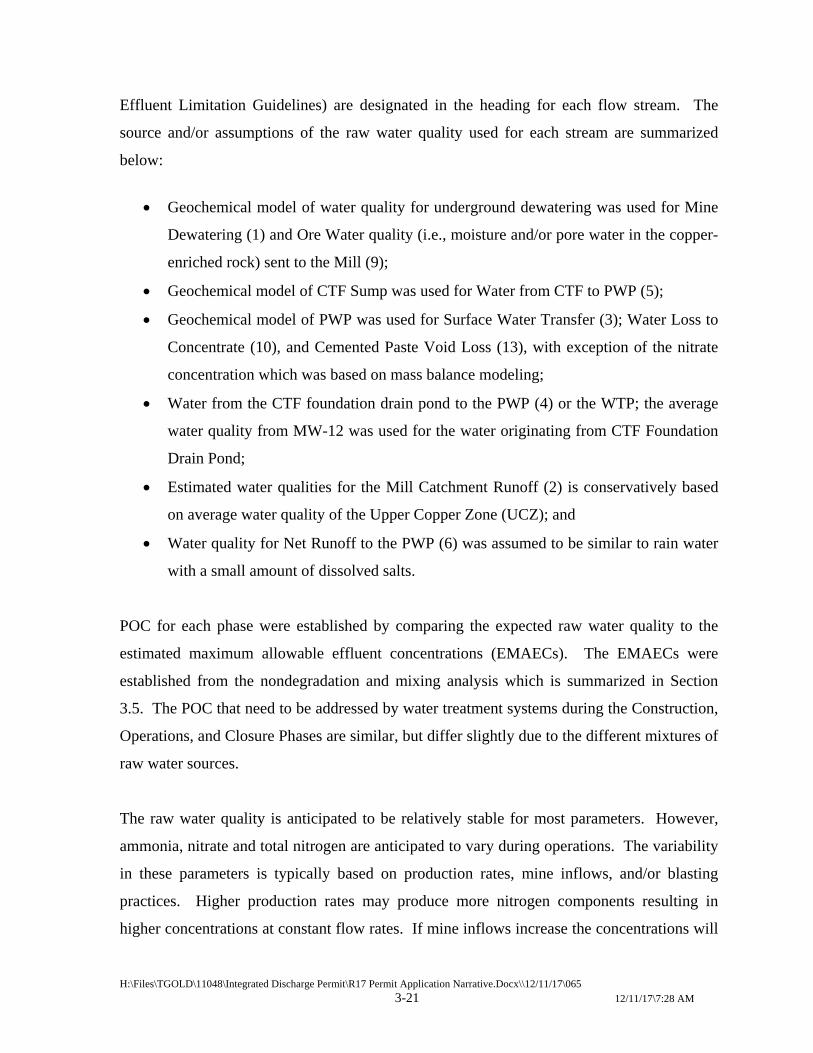
The raw water quality is anticipated to be relatively stable for most parameters. However,
ammonia, nitrate and total nitrogen are anticipated to vary during operations. The variability
in these parameters is typically based on production rates, mine inflows, and/or blasting
practices. Higher production rates may produce more nitrogen components resulting in
higher concentrations at constant flow rates. If mine inflows increase the concentrations will
H:\Files\TGOLD\11048\Integrated Discharge Permit\R17 Permit Application Narrative.Docx\\12/11/17\065
3-22 12/11/17\7:28 AM
likely decrease. Using Best Management Practices (BMPs) for blasting underground will be
a large factor in maintaining low concentrations of nitrogen components in the raw water
quality. A multiplied safety factor of 1.75 was applied to the average ammonia and
nitrate/nitrite concentrations of the underground dewatering water quality to account for
variabilities in nitrogen concentrations.
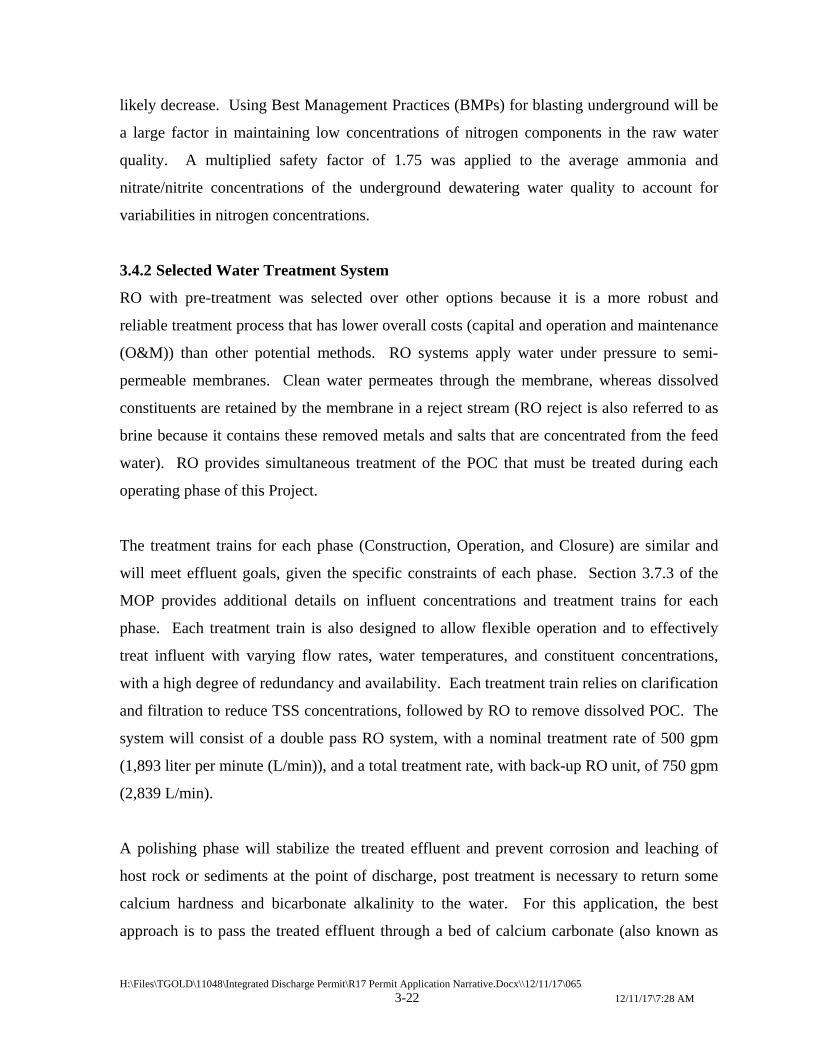
3.4.2 Selected Water Treatment System
RO with pre-treatment was selected over other options because it is a more robust and
reliable treatment process that has lower overall costs (capital and operation and maintenance
(O&M)) than other potential methods. RO systems apply water under pressure to semi-
permeable membranes. Clean water permeates through the membrane, whereas dissolved
constituents are retained by the membrane in a reject stream (RO reject is also referred to as
brine because it contains these removed metals and salts that are concentrated from the feed
water). RO provides simultaneous treatment of the POC that must be treated during each
operating phase of this Project.
The treatment trains for each phase (Construction, Operation, and Closure) are similar and
will meet effluent goals, given the specific constraints of each phase. Section 3.7.3 of the
MOP provides additional details on influent concentrations and treatment trains for each
phase. Each treatment train is also designed to allow flexible operation and to effectively
treat influent with varying flow rates, water temperatures, and constituent concentrations,
with a high degree of redundancy and availability. Each treatment train relies on clarification
and filtration to reduce TSS concentrations, followed by RO to remove dissolved POC. The
system will consist of a double pass RO system, with a nominal treatment rate of 500 gpm
(1,893 liter per minute (L/min)), and a total treatment rate, with back-up RO unit, of 750 gpm
(2,839 L/min).
A polishing phase will stabilize the treated effluent and prevent corrosion and leaching of
host rock or sediments at the point of discharge, post treatment is necessary to return some
calcium hardness and bicarbonate alkalinity to the water. For this application, the best
approach is to pass the treated effluent through a bed of calcium carbonate (also known as
H:\Files\TGOLD\11048\Integrated Discharge Permit\R17 Permit Application Narrative.Docx\\12/11/17\065
3-23 12/11/17\7:28 AM
calcite) or suitable alternative media, prior to discharge. Post treatment will only be applied
to water that is diverted to the outfalls. The water that will receive post treatment is equal to
the influx to the WTP minus the mill treated water and RO Brine (180 gpm). Post treatment
will add both calcium and alkalinity (as carbonate) to the water which provides a dual benefit
of raising the Langelier Saturation Index (LSI), a measure of “aggressiveness,” to dissolve
constituents, above zero while adding buffering capacity to the water. Adding buffering
capacity will also result in a more limited range of pH changes in the treated effluent.
3.4.3 Treated Effluent Water Quality
The quality of the water treatment effluent was determined using an iterative site wide
material balance model to determine mixed water quality of the water treatment influent.
The data from the material balance was used in a final analysis of the RO system. The final
treated effluent water quality was simulated using RO vendor software from Dow Process
and Water Solutions. The vendor software modeled the full-scale design of a two pass RO
system at both 10 and 25 degrees Celsius. Additional modeling was conducted to optimize
antiscalants and the Vibratory Shear Enhanced Processing (VSEP) treatment phase. See
Appendix B for additional details on the WTP modeling. At the anticipated RO system
recovery of 81.7%, 92 gpm (346 L/min) of RO reject and 408 gpm (1,548 L/min) of
permeate (treated effluent) will be produced. Treated effluent from the RO system was
determined through modeling (Amec Foster Wheeler, 2017a and 2017b [contained in
Appendix B]). As noted in Section 3.4.1, concentrations of the nitrogen components
(ammonia and nitrate/nitrite) were increased by 1.75 times the average influent concentration
during evaluations as a safety factor. This results in a maximum total nitrogen concentration
in the WTP effluent of 0.57 mg/L. Projected WTP effluent is shown in Table 3-3.
3.5 NONDEGRADATION ANALYSIS
The proposed underground copper mine will generate water from mine dewatering, process
water, and other minor sources. Once treated, the combined water will be reused or
discharged to state waters through infiltration to groundwater. As a new discharge, the level
of treatment required by the Project is determined by the nondegradation statute (75-5-303
Montana Code Annotated MCA) and rule (Administrative Rules of Montana (ARM) 17.30

H:\Files\TGOLD\11048\Integrated Discharge Permit\R17 Permit Application Narrative.Docx\\12/11/17\065
3-24 12/11/17\7:28 AM
Subchapter 7) for nonsignificant activities. With the overarching purpose to identify the
water quality needed to prevent effects to all current and anticipated beneficial uses in
groundwater and surface water.
3.5.1 Water Protection Classification
The groundwater system within the alluvial UIG is high-quality waters. Sheep Creek surface
water is listed on the 2016 303(d) list of impaired waters because aquatic life and primary
contact recreation uses are not supported due to water quality exceedances of dissolved
aluminum and bacterial concentration. While Sheep Creek does not meet the above
definition of a high-quality water for these parameters, it supports all other uses and meets
the definition of high-quality waters for other beneficial uses.
3.5.2 Nonsignificance Criteria and Analysis
Subchapter 7 of ARM 17.30 Rule 715 identifies the process for application of significance
criteria for new or increased sources. Dependent on how each discharged parameter is
classified and the condition of the surface water, certain increases are not considered
significant and may be allowed by statute and rule. The nondegradation rules to evaluate
increases in the receiving waters are summarized below:
Carcinogenic parameters and those with bioconcentration factors greater than 300 –
no increases are allowed in the receiving water.
Toxic parameters – increases are allowed up to the trigger value contained in Circular
DEQ-7. If changes in water quality are greater than the trigger value, the change is
not significant if the resulting concentration at the edge of a mixing zone does not
exceed 15% of the lowest applicable standard.
Harmful and nutrient parameters – changes in water quality at the edge of a mixing
zone are allowed when the existing concentration in the receiving water is less than
40% of the applicable standard and the water quality change outside a mixing zone is
less than 10% of the applicable water quality standard.
Changes in the quantity of surface water – increases or decreases in surface water
flows that are less than 15% of the mean monthly flow or less than 10% of the seven-
H:\Files\TGOLD\11048\Integrated Discharge Permit\R17 Permit Application Narrative.Docx\\12/11/17\065
3-25 12/11/17\7:28 AM
day ten-year low flow (7Q10). Nonsignificance criteria are not applied to quantity of
groundwater discharges.
Nitrate – changes in the concentration of nitrate in groundwater will not exceed 7.5
mg/L.
Narrative standards – changes in water quality will not have a measurable effect on
beneficial uses or cause measurable changes in aquatic life or ecological integrity.
Nonsignificance criteria were calculated based on the 75th percentile of each constituent from
the receiving water quality data (Table 3-1). For parameters that were less than detect, the
detection limit was used as the concentration. Table 3-4 summarizes the calculated
nondegradation nonsignificance criteria for each receiving water in comparison to the
projected effluent water quality. All of the potential pollutants that may be in the water
treatment effluent are below the nondegradation nonsignificance criteria of the alluvial
groundwater system. Total nitrogen, during the growing season, is the only pollutant that is
projected to be above the surface water nondegradation nonsignificance criteria.
Nondegradation criteria for flow are summarized in Table 3-5. The nondegradation
nonsignificance criteria calculations are shown in Appendix I.
Total nitrogen, after its initial mixing with groundwater will remain above the
nondegradation nonsignificance criteria for surface water in Sheep Creek. Therefore, Tintina
is requesting a source specific mixing zone in surface water for total nitrogen during the
months of July through September.
The proposed surface water mixing zone is shown in Figure 3.7 and is approximately 3,500
feet long. The source specific mixing zone starts at 46046’50.02” N latitude 110054’7.31” W
longitude and ends at 46047’7.71” N latitude 110054’35.72” W longitude, or at the
confluence of Coon Creek with Sheep Creek. This reach of Sheep Creek represents the
gaining reach prior to the canyon mouth where alluvial sediment pinches out at the canyon
mouth. Based on the diffuse nature of the groundwater infiltration into Sheep Creek (0.24
gpm per linear foot of mixing zone) mixing will be evaluated with the entire 14Q5 (9,140
gpm - ARM 17.30.516(3)(e)). A request for a source specific mixing zone in Sheep Creek is
provided in Appendix D.
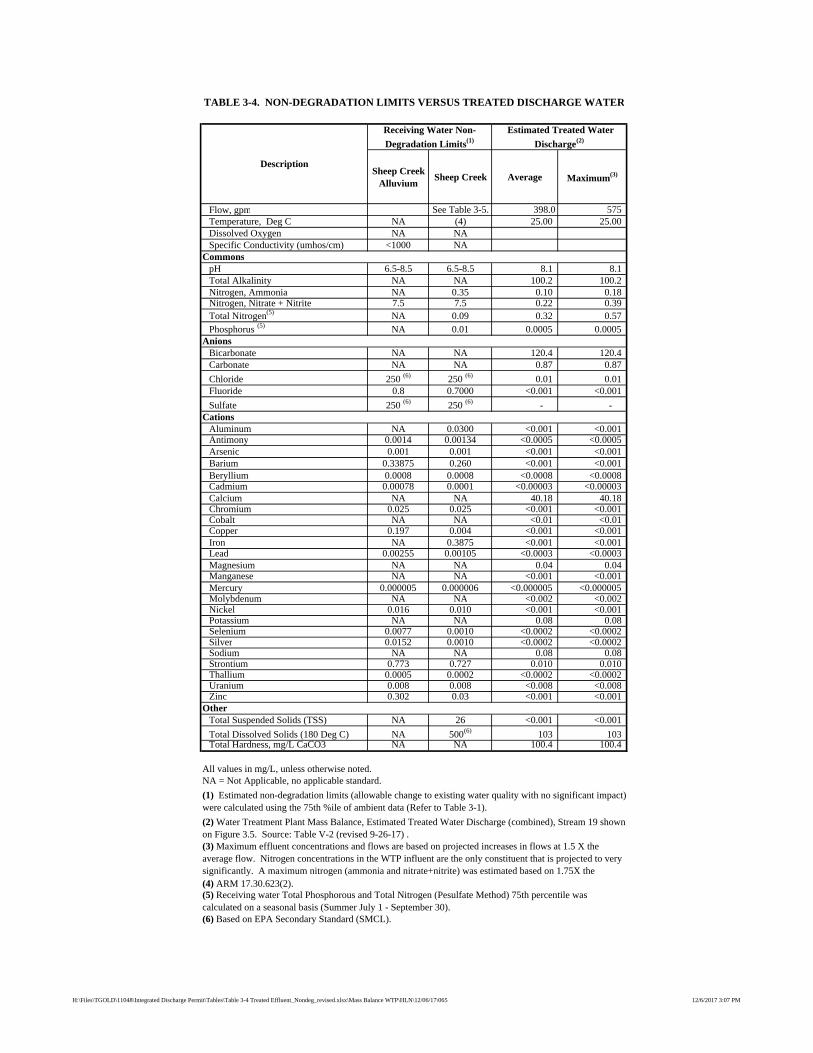
Sheep Creek Alluvium
Sheep Creek Average Maximum(3)
Flow, gpm See Table 3-5. 398.0 575 Temperature, Deg C NA (4) 25.00 25.00 Dissolved Oxygen NA NASpecific Conductivity (umhos/cm) <1000 NA
CommonspH 6.5-8.5 6.5-8.5 8.1 8.1 Total Alkalinity NA NA 100.2 100.2 Nitrogen, Ammonia NA 0.35 0.10 0.18 Nitrogen, Nitrate + Nitrite 7.5 7.5 0.22 0.39 Total Nitrogen(5) NA 0.09 0.32 0.57 Phosphorus (5) NA 0.01 0.0005 0.0005
AnionsBicarbonate NA NA 120.4 120.4 Carbonate NA NA 0.87 0.87
Chloride 250 (6) 250 (6) 0.01 0.01 Fluoride 0.8 0.7000 <0.001 <0.001
Sulfate 250 (6) 250 (6) - - Cations
Aluminum NA 0.0300 <0.001 <0.001Antimony 0.0014 0.00134 <0.0005 <0.0005Arsenic 0.001 0.001 <0.001 <0.001Barium 0.33875 0.260 <0.001 <0.001Beryllium 0.0008 0.0008 <0.0008 <0.0008Cadmium 0.00078 0.0001 <0.00003 <0.00003Calcium NA NA 40.18 40.18 Chromium 0.025 0.025 <0.001 <0.001Cobalt NA NA <0.01 <0.01Copper 0.197 0.004 <0.001 <0.001Iron NA 0.3875 <0.001 <0.001Lead 0.00255 0.00105 <0.0003 <0.0003Magnesium NA NA 0.04 0.04 Manganese NA NA <0.001 <0.001Mercury 0.000005 0.000006 <0.000005 <0.000005Molybdenum NA NA <0.002 <0.002Nickel 0.016 0.010 <0.001 <0.001Potassium NA NA 0.08 0.08 Selenium 0.0077 0.0010 <0.0002 <0.0002Silver 0.0152 0.0010 <0.0002 <0.0002Sodium NA NA 0.08 0.08 Strontium 0.773 0.727 0.010 0.010 Thallium 0.0005 0.0002 <0.0002 <0.0002Uranium 0.008 0.008 <0.008 <0.008Zinc 0.302 0.03 <0.001 <0.001
OtherTotal Suspended Solids (TSS) NA 26 <0.001 <0.001
Total Dissolved Solids (180 Deg C) NA 500(6) 103 103 Total Hardness, mg/L CaCO3 NA NA 100.4 100.4
All values in mg/L, unless otherwise noted.NA = Not Applicable, no applicable standard.
(6) Based on EPA Secondary Standard (SMCL).
TABLE 3-4. NON-DEGRADATION LIMITS VERSUS TREATED DISCHARGE WATER
(5) Receiving water Total Phosphorous and Total Nitrogen (Pesulfate Method) 75th percentile was calculated on a seasonal basis (Summer July 1 - September 30).
(1) Estimated non-degradation limits (allowable change to existing water quality with no significant impact) were calculated using the 75th %ile of ambient data (Refer to Table 3-1).
(2) Water Treatment Plant Mass Balance, Estimated Treated Water Discharge (combined), Stream 19 shown on Figure 3.5. Source: Table V-2 (revised 9-26-17) .
Estimated Treated Water
Discharge(2)
(4) ARM 17.30.623(2).
Description
(3) Maximum effluent concentrations and flows are based on projected increases in flows at 1.5 X the average flow. Nitrogen concentrations in the WTP influent are the only constituent that is projected to very significantly. A maximum nitrogen (ammonia and nitrate+nitrite) was estimated based on 1.75X the
Receiving Water Non-
Degradation Limits(1)
H:\Files\TGOLD\11048\Integrated Discharge Permit\Tables\Table 3-4 Treated Effluent_Nondeg_revised.xlsx\Mass Balance WTP\HLN\12/06/17\065 12/6/2017 3:07 PM
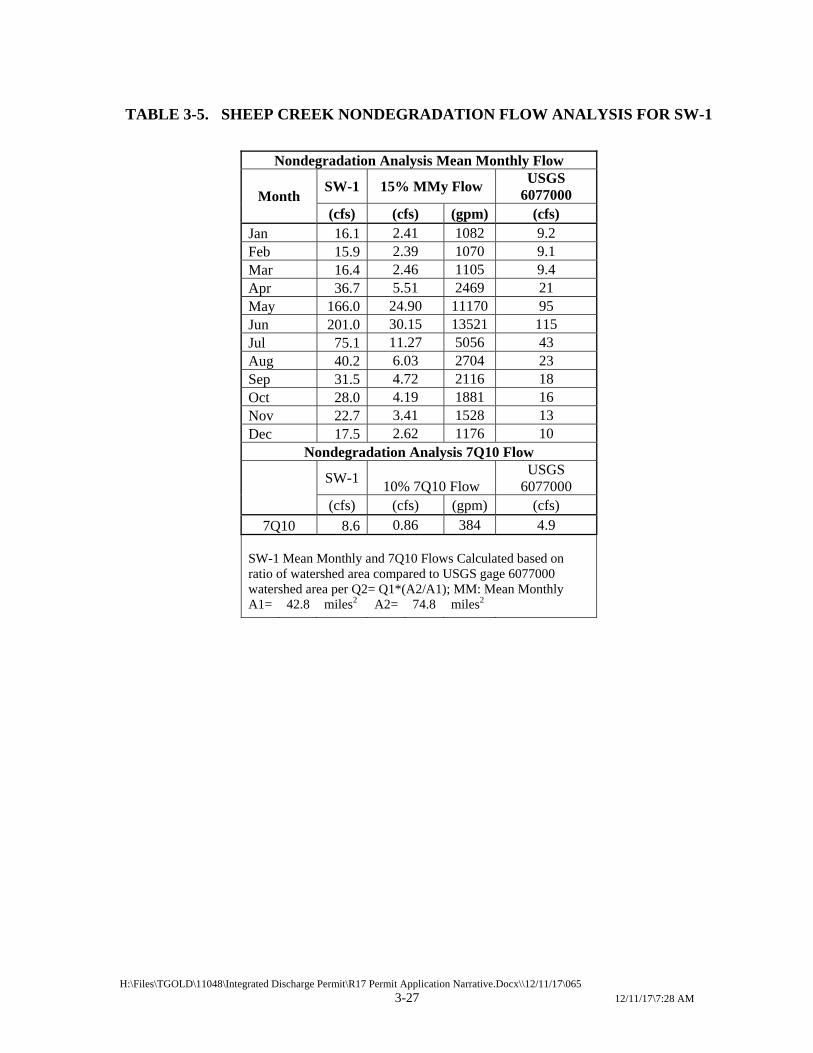
H:\Files\TGOLD\11048\Integrated Discharge Permit\R17 Permit Application Narrative.Docx\\12/11/17\065
3-27 12/11/17\7:28 AM
TABLE 3-5. SHEEP CREEK NONDEGRADATION FLOW ANALYSIS FOR SW-1
Nondegradation Analysis Mean Monthly Flow
Month SW-1 15% MMy Flow
USGS 6077000
(cfs) (cfs) (gpm) (cfs) Jan 16.1 2.41 1082 9.2 Feb 15.9 2.39 1070 9.1 Mar 16.4 2.46 1105 9.4 Apr 36.7 5.51 2469 21 May 166.0 24.90 11170 95 Jun 201.0 30.15 13521 115 Jul 75.1 11.27 5056 43 Aug 40.2 6.03 2704 23 Sep 31.5 4.72 2116 18 Oct 28.0 4.19 1881 16 Nov 22.7 3.41 1528 13 Dec 17.5 2.62 1176 10
Nondegradation Analysis 7Q10 Flow
SW-1 10% 7Q10 Flow
USGS 6077000
(cfs) (cfs) (gpm) (cfs)
7Q10 8.6 0.86 384 4.9 SW-1 Mean Monthly and 7Q10 Flows Calculated based on ratio of watershed area compared to USGS gage 6077000 watershed area per Q2= Q1*(A2/A1); MM: Mean Monthly A1= 42.8 miles2 A2= 74.8 miles2
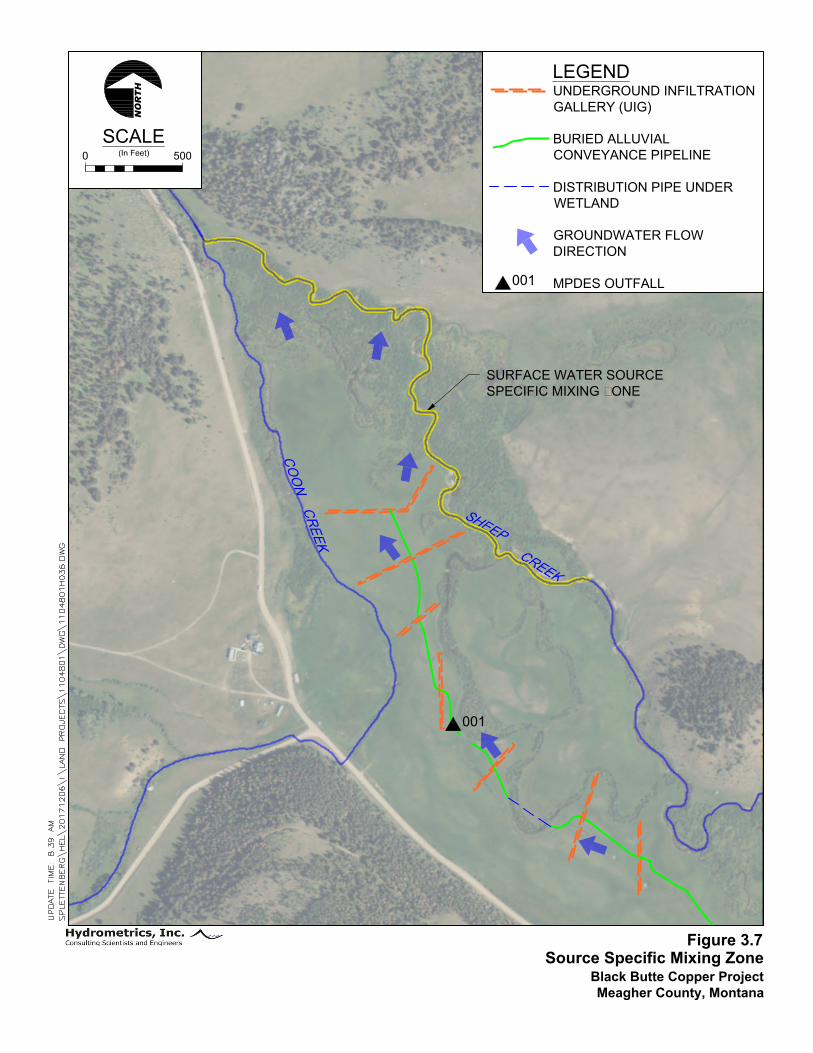
SURFACE WATER SOURCE
SPECIFIC MIXING ZONE
C
O
O
N
C
R
E
E
K
S
H
E
E
P
C
R
E
E
K
001
Source Specific Mixing Zone
Black Butte Copper Project
Meagher County, Montana
Figure 3.7
NO
RT
HSCALE
0
(In Feet)
500
LEGEND
UNDERGROUND INFILTRATION
GALLERY (UIG)
BURIED ALLUVIAL
CONVEYANCE PIPELINE
DISTRIBUTION PIPE UNDER
WETLAND
GROUNDWATER FLOW
DIRECTION
MPDES OUTFALL
001

H:\Files\TGOLD\11048\Integrated Discharge Permit\R17 Permit Application Narrative.Docx\\12/11/17\065
3-29 12/11/17\7:28 AM
As noted in Section 3.2, although groundwater discharges to Coon Creek under ambient
conditions, the dewatering modeling analysis shows there will be approximately 10 feet of
unsaturated soils (as a result of mine dewatering) in the vicinity of Coon Creek during
operations. The maximum mounding from the discharge is projected to be 3.5 feet;
therefore, there will still be about 6.5 feet of unsaturated zone beneath Coon Creek. Since
groundwater will not discharge to Coon Creek during operations, a mixing zone is not being
requested for this surface water resource.
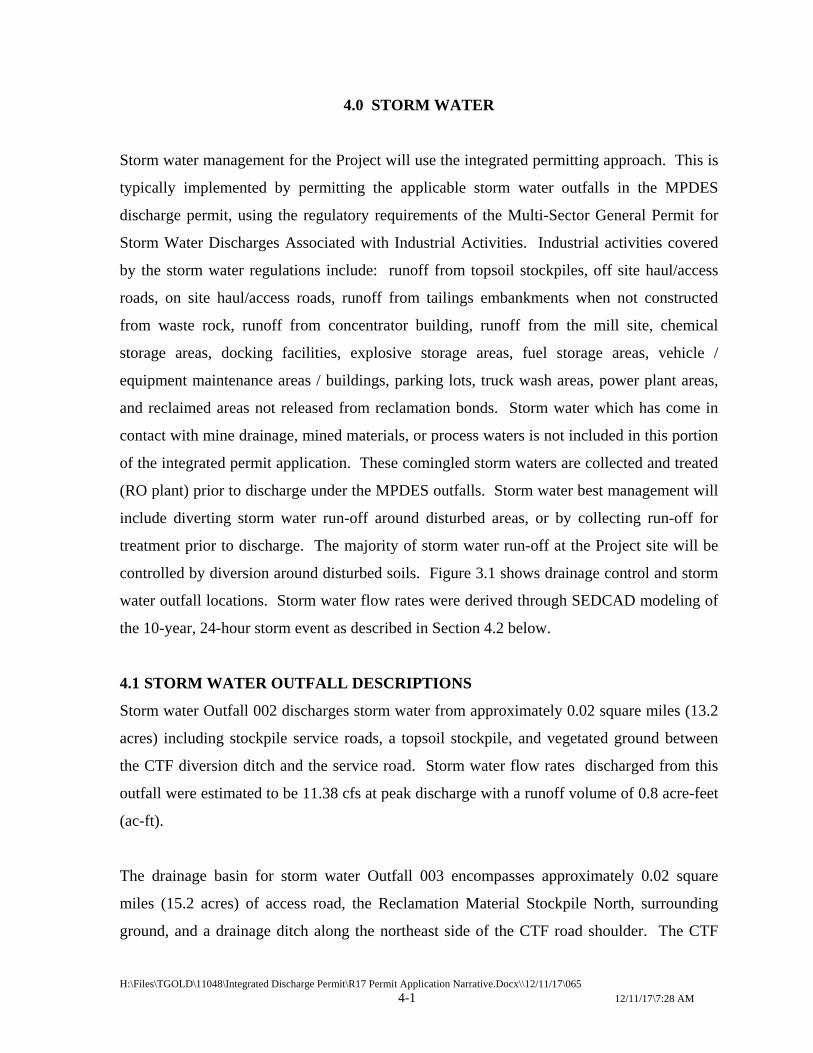
H:\Files\TGOLD\11048\Integrated Discharge Permit\R17 Permit Application Narrative.Docx\\12/11/17\065
4-1 12/11/17\7:28 AM
4.0 STORM WATER
Storm water management for the Project will use the integrated permitting approach. This is
typically implemented by permitting the applicable storm water outfalls in the MPDES
discharge permit, using the regulatory requirements of the Multi-Sector General Permit for
Storm Water Discharges Associated with Industrial Activities. Industrial activities covered
by the storm water regulations include: runoff from topsoil stockpiles, off site haul/access
roads, on site haul/access roads, runoff from tailings embankments when not constructed
from waste rock, runoff from concentrator building, runoff from the mill site, chemical
storage areas, docking facilities, explosive storage areas, fuel storage areas, vehicle /
equipment maintenance areas / buildings, parking lots, truck wash areas, power plant areas,
and reclaimed areas not released from reclamation bonds. Storm water which has come in
contact with mine drainage, mined materials, or process waters is not included in this portion
of the integrated permit application. These comingled storm waters are collected and treated
(RO plant) prior to discharge under the MPDES outfalls. Storm water best management will
include diverting storm water run-off around disturbed areas, or by collecting run-off for
treatment prior to discharge. The majority of storm water run-off at the Project site will be
controlled by diversion around disturbed soils. Figure 3.1 shows drainage control and storm
water outfall locations. Storm water flow rates were derived through SEDCAD modeling of
the 10-year, 24-hour storm event as described in Section 4.2 below.
4.1 STORM WATER OUTFALL DESCRIPTIONS
Storm water Outfall 002 discharges storm water from approximately 0.02 square miles (13.2
acres) including stockpile service roads, a topsoil stockpile, and vegetated ground between
the CTF diversion ditch and the service road. Storm water flow rates discharged from this
outfall were estimated to be 11.38 cfs at peak discharge with a runoff volume of 0.8 acre-feet
(ac-ft).
The drainage basin for storm water Outfall 003 encompasses approximately 0.02 square
miles (15.2 acres) of access road, the Reclamation Material Stockpile North, surrounding
ground, and a drainage ditch along the northeast side of the CTF road shoulder. The CTF

H:\Files\TGOLD\11048\Integrated Discharge Permit\R17 Permit Application Narrative.Docx\\12/11/17\065
4-2 12/11/17\7:28 AM
road will not be regulated under this storm water action; discharge from the CTF road will be
collected and processed through the WTP under the MPDES program. The reclamation
stockpile materials will largely come from the waste rock storage (WRS) basin excavation.
The north reclamation materials will be used in year two or three to mostly reclaim the WRS
facility, but materials will also be used in closure to reclaim the other northern mine
facilities. Peak flow rates from this outfall were estimated to be 19.2 cfs, and a runoff
volume of 1.0 ac-ft from a 10-year, 24-hour storm event.
The total area discharging to Outfall 004 will be approximately 0.10 square miles (65.7
acres). Outfall 004 discharge will primarily be comprised of storm water drainage from
vegetated and undisturbed ground to the west and northwest of the CTF that flows into the
CTF Diversion Ditch. Runoff from a service road (south of PWP), subsoil stockpile and the
Reclamation Materials Stockpile South (materials coming from the CTF basin excavation)
will also flow to the CTF Diversion Ditch via a drainage ditch constructed along the east side
of the stockpiles. The southern reclamation material stockpile will be used for various mine
closure requirements, but principally for the closure cover on the CTF and closure of the
southern mine facilities. Peak flow rates from this outfall were estimated to be 35.53 cfs, and
a runoff volume of 2.8 ac-ft from a 10-year, 24-hour storm event.
Storm water Outfall 005 discharges water from approximately 0.02 square miles (13.0 acres).
Discharge will primarily originate along the CTF embankment (constructed from non-waste
rock materials) east of the CTF road. Discharge will include portions of native land and a
service road south of the CTF. A diversion ditch collects runoff from the drainage area and
directs flow to Outfall 005. Peak flow rates discharged from this outfall were estimated to be
11.99 cfs with a total runoff volume of 0.8 ac-ft.
There is an area of sheet flow passing under the service road to the north of Outfall 006.
Run-on from undisturbed ground and a small section of service road will flow through a
culvert and be dispersed through an energy dissipater to the east.
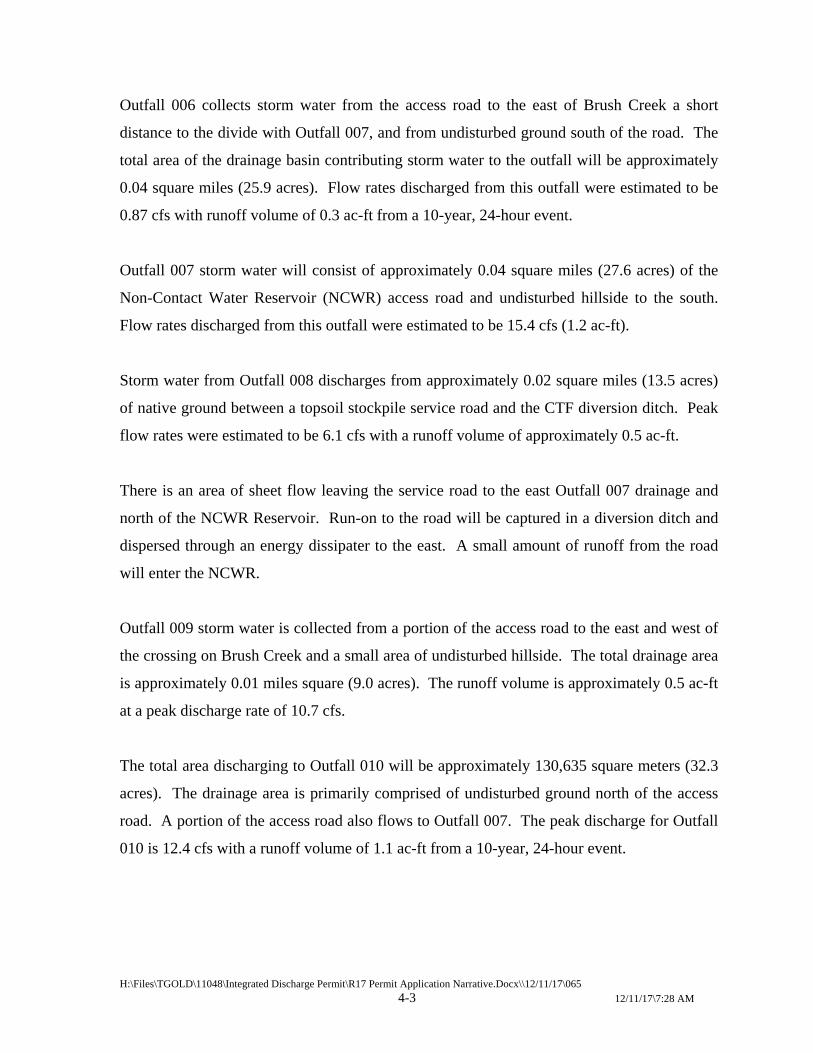
H:\Files\TGOLD\11048\Integrated Discharge Permit\R17 Permit Application Narrative.Docx\\12/11/17\065
4-3 12/11/17\7:28 AM
Outfall 006 collects storm water from the access road to the east of Brush Creek a short
distance to the divide with Outfall 007, and from undisturbed ground south of the road. The
total area of the drainage basin contributing storm water to the outfall will be approximately
0.04 square miles (25.9 acres). Flow rates discharged from this outfall were estimated to be
0.87 cfs with runoff volume of 0.3 ac-ft from a 10-year, 24-hour event.
Outfall 007 storm water will consist of approximately 0.04 square miles (27.6 acres) of the
Non-Contact Water Reservoir (NCWR) access road and undisturbed hillside to the south.
Flow rates discharged from this outfall were estimated to be 15.4 cfs (1.2 ac-ft).
Storm water from Outfall 008 discharges from approximately 0.02 square miles (13.5 acres)
of native ground between a topsoil stockpile service road and the CTF diversion ditch. Peak
flow rates were estimated to be 6.1 cfs with a runoff volume of approximately 0.5 ac-ft.
There is an area of sheet flow leaving the service road to the east Outfall 007 drainage and
north of the NCWR Reservoir. Run-on to the road will be captured in a diversion ditch and
dispersed through an energy dissipater to the east. A small amount of runoff from the road
will enter the NCWR.
Outfall 009 storm water is collected from a portion of the access road to the east and west of
the crossing on Brush Creek and a small area of undisturbed hillside. The total drainage area
is approximately 0.01 miles square (9.0 acres). The runoff volume is approximately 0.5 ac-ft
at a peak discharge rate of 10.7 cfs.
The total area discharging to Outfall 010 will be approximately 130,635 square meters (32.3
acres). The drainage area is primarily comprised of undisturbed ground north of the access
road. A portion of the access road also flows to Outfall 007. The peak discharge for Outfall
010 is 12.4 cfs with a runoff volume of 1.1 ac-ft from a 10-year, 24-hour event.
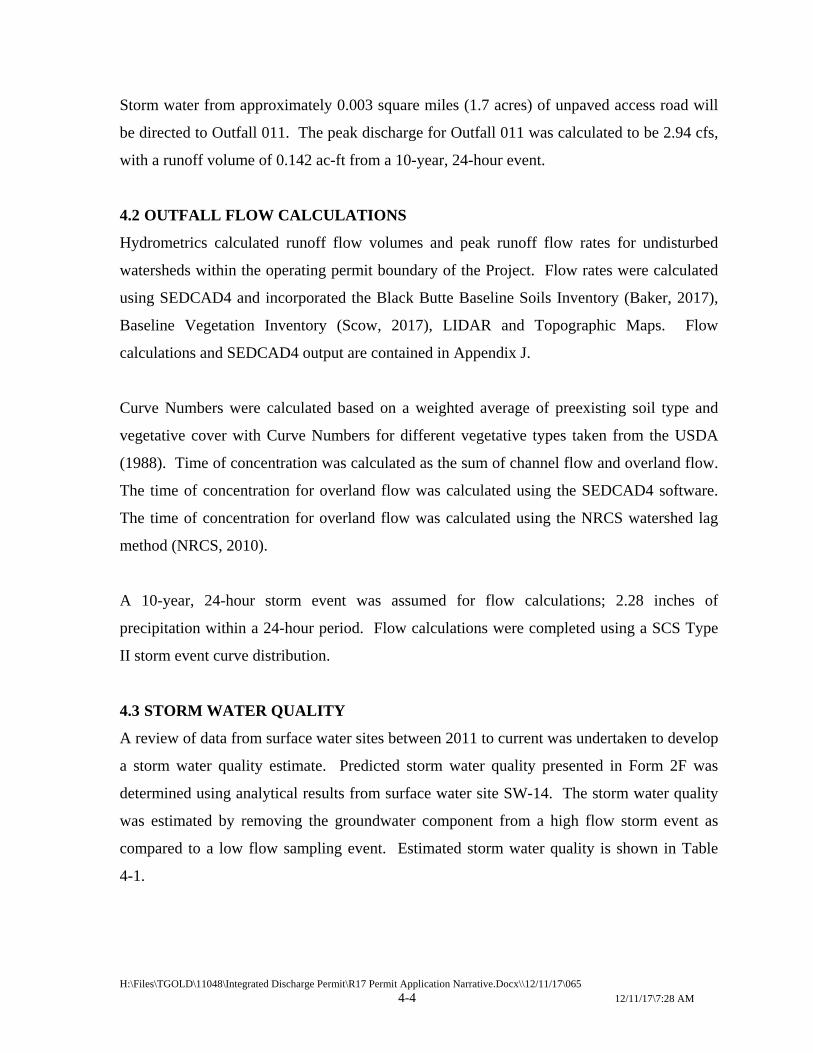
H:\Files\TGOLD\11048\Integrated Discharge Permit\R17 Permit Application Narrative.Docx\\12/11/17\065
4-4 12/11/17\7:28 AM
Storm water from approximately 0.003 square miles (1.7 acres) of unpaved access road will
be directed to Outfall 011. The peak discharge for Outfall 011 was calculated to be 2.94 cfs,
with a runoff volume of 0.142 ac-ft from a 10-year, 24-hour event.
4.2 OUTFALL FLOW CALCULATIONS
Hydrometrics calculated runoff flow volumes and peak runoff flow rates for undisturbed
watersheds within the operating permit boundary of the Project. Flow rates were calculated
using SEDCAD4 and incorporated the Black Butte Baseline Soils Inventory (Baker, 2017),
Baseline Vegetation Inventory (Scow, 2017), LIDAR and Topographic Maps. Flow
calculations and SEDCAD4 output are contained in Appendix J.
Curve Numbers were calculated based on a weighted average of preexisting soil type and
vegetative cover with Curve Numbers for different vegetative types taken from the USDA
(1988). Time of concentration was calculated as the sum of channel flow and overland flow.
The time of concentration for overland flow was calculated using the SEDCAD4 software.
The time of concentration for overland flow was calculated using the NRCS watershed lag
method (NRCS, 2010).
A 10-year, 24-hour storm event was assumed for flow calculations; 2.28 inches of
precipitation within a 24-hour period. Flow calculations were completed using a SCS Type
II storm event curve distribution.
4.3 STORM WATER QUALITY
A review of data from surface water sites between 2011 to current was undertaken to develop
a storm water quality estimate. Predicted storm water quality presented in Form 2F was
determined using analytical results from surface water site SW-14. The storm water quality
was estimated by removing the groundwater component from a high flow storm event as
compared to a low flow sampling event. Estimated storm water quality is shown in Table
4-1.
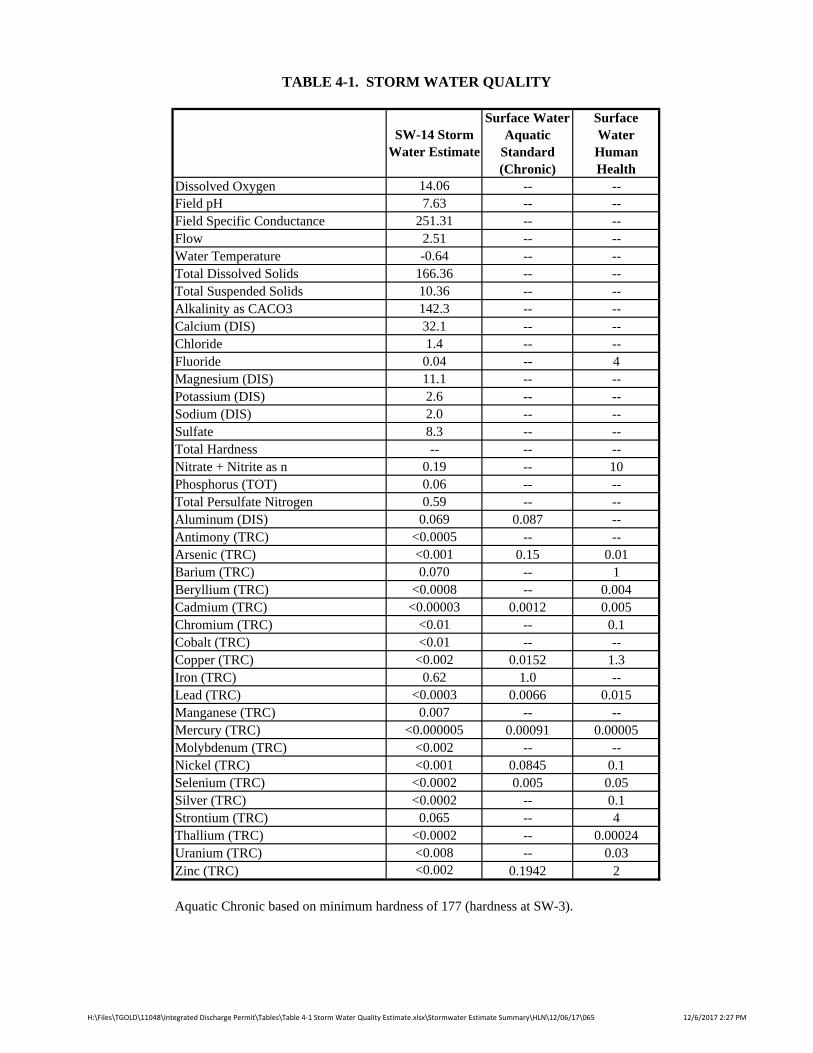
Dissolved Oxygen 14.06 -- --Field pH 7.63 -- --Field Specific Conductance 251.31 -- --Flow 2.51 -- --Water Temperature -0.64 -- --Total Dissolved Solids 166.36 -- --Total Suspended Solids 10.36 -- --Alkalinity as CACO3 142.3 -- --Calcium (DIS) 32.1 -- --Chloride 1.4 -- --Fluoride 0.04 -- 4Magnesium (DIS) 11.1 -- --Potassium (DIS) 2.6 -- --Sodium (DIS) 2.0 -- --Sulfate 8.3 -- --Total Hardness -- -- --Nitrate + Nitrite as n 0.19 -- 10Phosphorus (TOT) 0.06 -- --Total Persulfate Nitrogen 0.59 -- --Aluminum (DIS) 0.069 0.087 --Antimony (TRC) <0.0005 -- --Arsenic (TRC) <0.001 0.15 0.01Barium (TRC) 0.070 -- 1Beryllium (TRC) <0.0008 -- 0.004Cadmium (TRC) <0.00003 0.0012 0.005Chromium (TRC) <0.01 -- 0.1Cobalt (TRC) <0.01 -- --Copper (TRC) <0.002 0.0152 1.3Iron (TRC) 0.62 1.0 --Lead (TRC) <0.0003 0.0066 0.015Manganese (TRC) 0.007 -- --Mercury (TRC) <0.000005 0.00091 0.00005Molybdenum (TRC) <0.002 -- --Nickel (TRC) <0.001 0.0845 0.1Selenium (TRC) <0.0002 0.005 0.05Silver (TRC) <0.0002 -- 0.1Strontium (TRC) 0.065 -- 4Thallium (TRC) <0.0002 -- 0.00024Uranium (TRC) <0.008 -- 0.03Zinc (TRC) <0.002 0.1942 2
Aquatic Chronic based on minimum hardness of 177 (hardness at SW-3).
SW-14 Storm Water Estimate
Surface Water Aquatic
Standard (Chronic)
Surface Water Human Health
TABLE 4-1. STORM WATER QUALITY
H:\Files\TGOLD\11048\Integrated Discharge Permit\Tables\Table 4‐1 Storm Water Quality Estimate.xlsx\Stormwater Estimate Summary\HLN\12/06/17\065 12/6/2017 2:27 PM
H:\Files\TGOLD\11048\Integrated Discharge Permit\R17 Permit Application Narrative.Docx\\12/11/17\065
4-6 12/11/17\7:28 AM
4.4 DRAINAGE CONTROL
During Tintina’s preparation of a Storm Water Pollution Prevention Plan (SWPPP), a water
control and a storm water management plan will be prepared and implemented at the site to
prevent commingling of unaffected water with water affected by construction activities and
later by mining and milling. This plan will also develop controls for run-off from the site and
adjacent areas. Figure 3.1 displays general storm water controls for the site.
Diversion structures will consist of drainage ditches or swales, spreaders, sediment traps,
rock berms, straw wattles, and slash windrows. Drainage structures will be sized to safely
convey the 24-hour, 100-year storm event. Interceptor or major diversion ditches will be
installed uphill from the WRS, portal pad, mill facility, PWP, and CTF (Figure 3.1) to
intercept non-contact water drainage, and convey it to existing drainage outfalls.
All storm water controls will be constructed prior to, or in conjunction with, soil removal and
stockpiling. Storm water controls are passive systems that require regular inspection for
areas of erosion and sediment build-up in the slash windrow or sediment traps. With proper
maintenance and inspection, each storm water control will remain in place until completion
of the construction phase, and where required throughout the operational stages of the
Project. Many BMPs will remain in place through mine closure and until subsequent
stabilization and revegetation of disturbed areas is complete.
A surface water diversion ditch around the upper sides and side slopes of disturbed areas will
be used to divert clean storm water from the disturbed facility areas within the site. The
diversion ditches reduce the amount of run-off contributing to the mine facilities by diverting
their respective upstream catchments. This reduces the capacity required in the facilities to
meet storm water probable maximum precipitation (PMP) and PMF storage requirements of
22 inches (560 mm) and 33.46 inches (850 mm), respectively. Diversion ditches also reduce
the overall consumptive use and reduces flow impacts downstream of the Project.
H:\Files\TGOLD\11048\Integrated Discharge Permit\R17 Permit Application Narrative.Docx\\12/11/17\065
4-7 12/11/17\7:28 AM
Energy dissipation features or spreaders (Figure 4.1) will be constructed where the surface
water diversion outlets meet undisturbed ground. The spreaders will convert the flow
concentrated in the diversion ditch to sheet flow and discharge it over an erosion blanketed
lip to an undisturbed area at non-erosive velocities. The spreaders will be located such that
the discharge water will not be collected by the down-slope berms or concentrated in down-
slope channels. If site conditions determine that the spreaders are not appropriate for the site,
down-slope drainage channels and energy dissipating outlets or infiltration basins will be
specified. Sediment carried from diversions around facilities by storm water run-off will be
periodically removed from the ditches and sump(s) collection drains or infiltration basins and
stored for use in reclamation on the sub-soil or reclamation materials stockpiles as
appropriate. Water captured in the toe ditches surrounding the waste rock pads will be
directed through HDPE lined ditches or pipelines to the contact water pond for subsequent
treatment before discharge.
Run-on drainage ditches would be cut / fill ditches much like diversion channels, but smaller.
Drainage control is sized for the 10-year, 24-hour event peak flow. Culverts will have inlet /
outlet protection to prevent scour.
The Storm Water Discharge System Map (Figure 3.1) shows the general location of surface
water, run-on ditches, and run-off ditches developed for the Project’s construction areas,
mine site and its supporting facilities. Typical cross-sections of diversion ditches are
illustrated on Figure 4.2 from the CTF and PWP areas. A SWPPP will be developed for the
Project site illustrating the final layout with respect to storm water management. The
SWPPP will be updated as needed to accurately reflect actual site BMPs conditions.
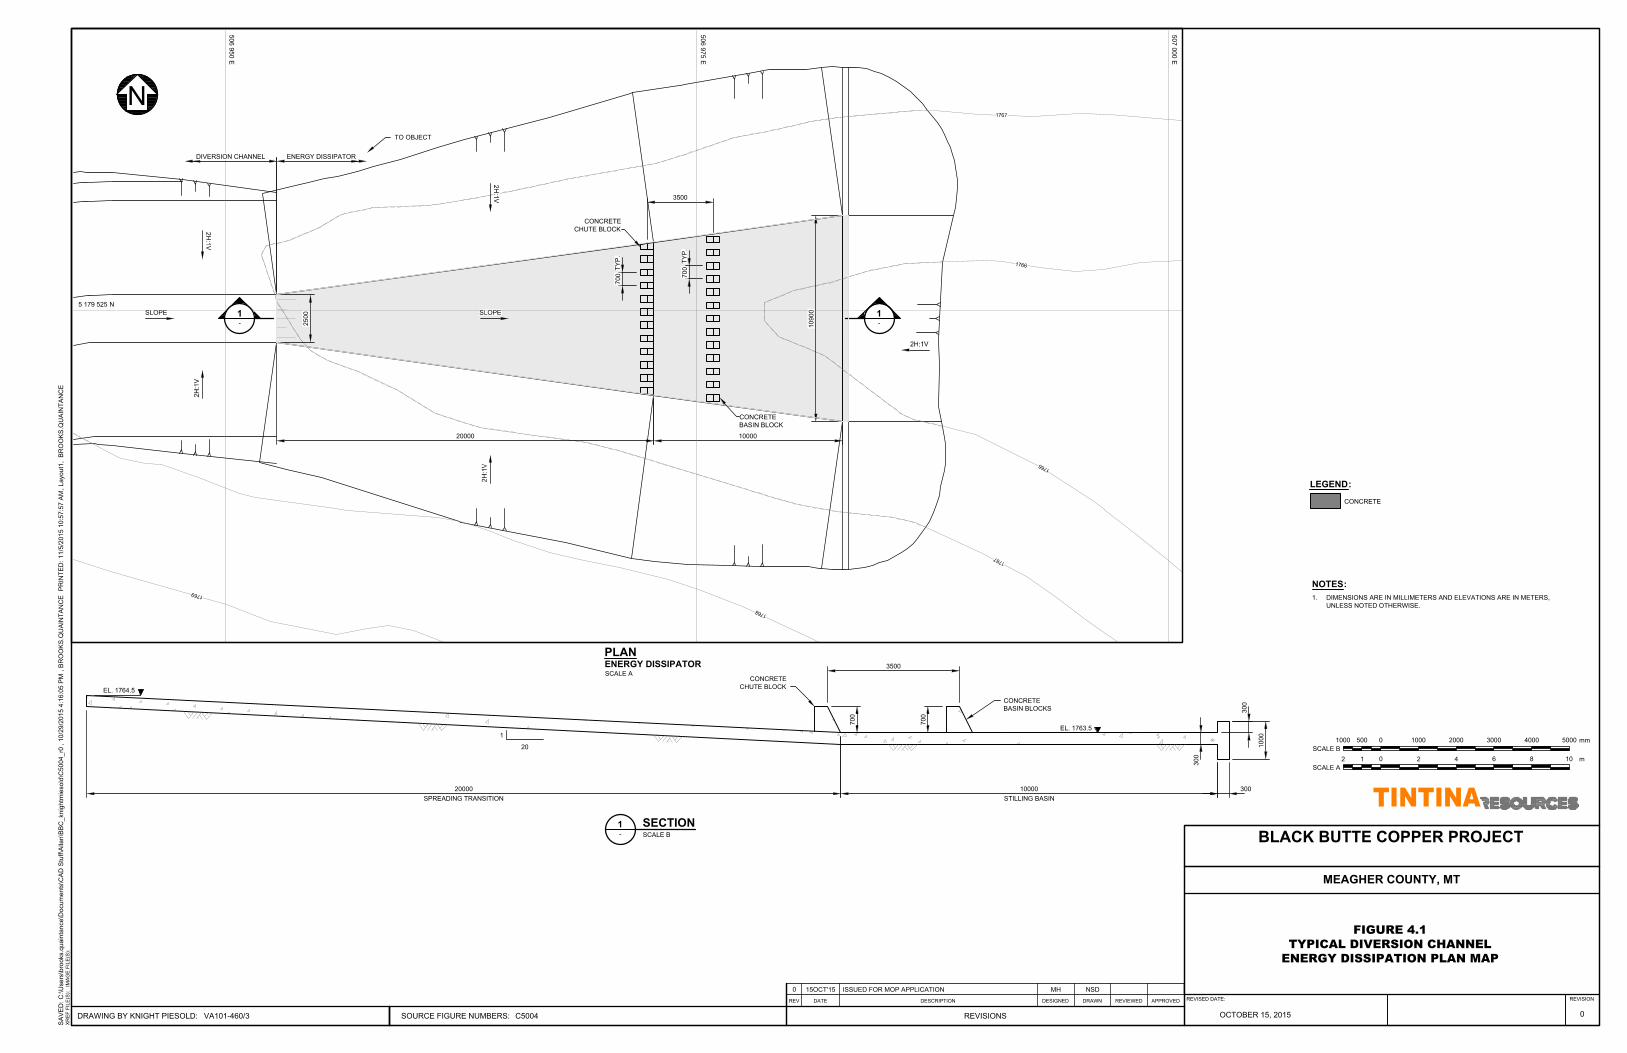
N
2500
20000 10000
10900
3500
700
700
TY
P.
TY
P.
ENERGY DISSIPATOR
5 179 525 N
506 950
E
506 975
E
507 000
E
DIVERSION CHANNEL
TO OBJECT
CONCRETE
CHUTE BLOCK
20000
SPREADING TRANSITION
10000
STILLING BASIN
300
300
300
1000
3500
700
700
1
20
SECTION1
-
SCALE B
EL. 1764.5
EL. 1763.5
CONCRETE
BASIN BLOCKS
CONCRETE
CHUTE BLOCK
5001000 1000 2000 3000 4000 5000 mm0
SCALE B
NOTES:
1. DIMENSIONS ARE IN MILLIMETERS AND ELEVATIONS ARE IN METERS,
UNLESS NOTED OTHERWISE.
0 15OCT'15 ISSUED FOR MOP APPLICATION MH NSD
m12 2 4 6 8 100
SCALE A
PLAN
ENERGY DISSIPATOR
SCALE A
CONCRETE
LEGEND:
DRAWING BY KNIGHT PIESOLD:
REV DATE
REVISED DATE: REVISION
DESCRIPTION DRAWN
REVISIONS
DESIGNED REVIEWED APPROVED
SA
VE
D: C
:\U
sers\brooks.quaintance\D
ocum
ents\C
AD
S
tuff\A
llan\B
BC
_knightm
iesold\C
5004_r0
, 10/29/2015 4:16:05 P
M , B
RO
OK
S.Q
UA
IN
TA
NC
E P
RIN
TE
D: 11/5/2015 10:57:57 A
M, Layout1
, B
RO
OK
S.Q
UA
IN
TA
NC
E
XR
EF
F
IL
E(S
): IM
AG
E F
IL
E(S
):
SOURCE FIGURE NUMBERS:
MEAGHER COUNTY, MT
BLACK BUTTE COPPER PROJECT
FIGURE 4.1TYPICAL DIVERSION CHANNEL
ENERGY DISSIPATION PLAN MAP
VA101-460/3 C5004
0
OCTOBER 15, 2015
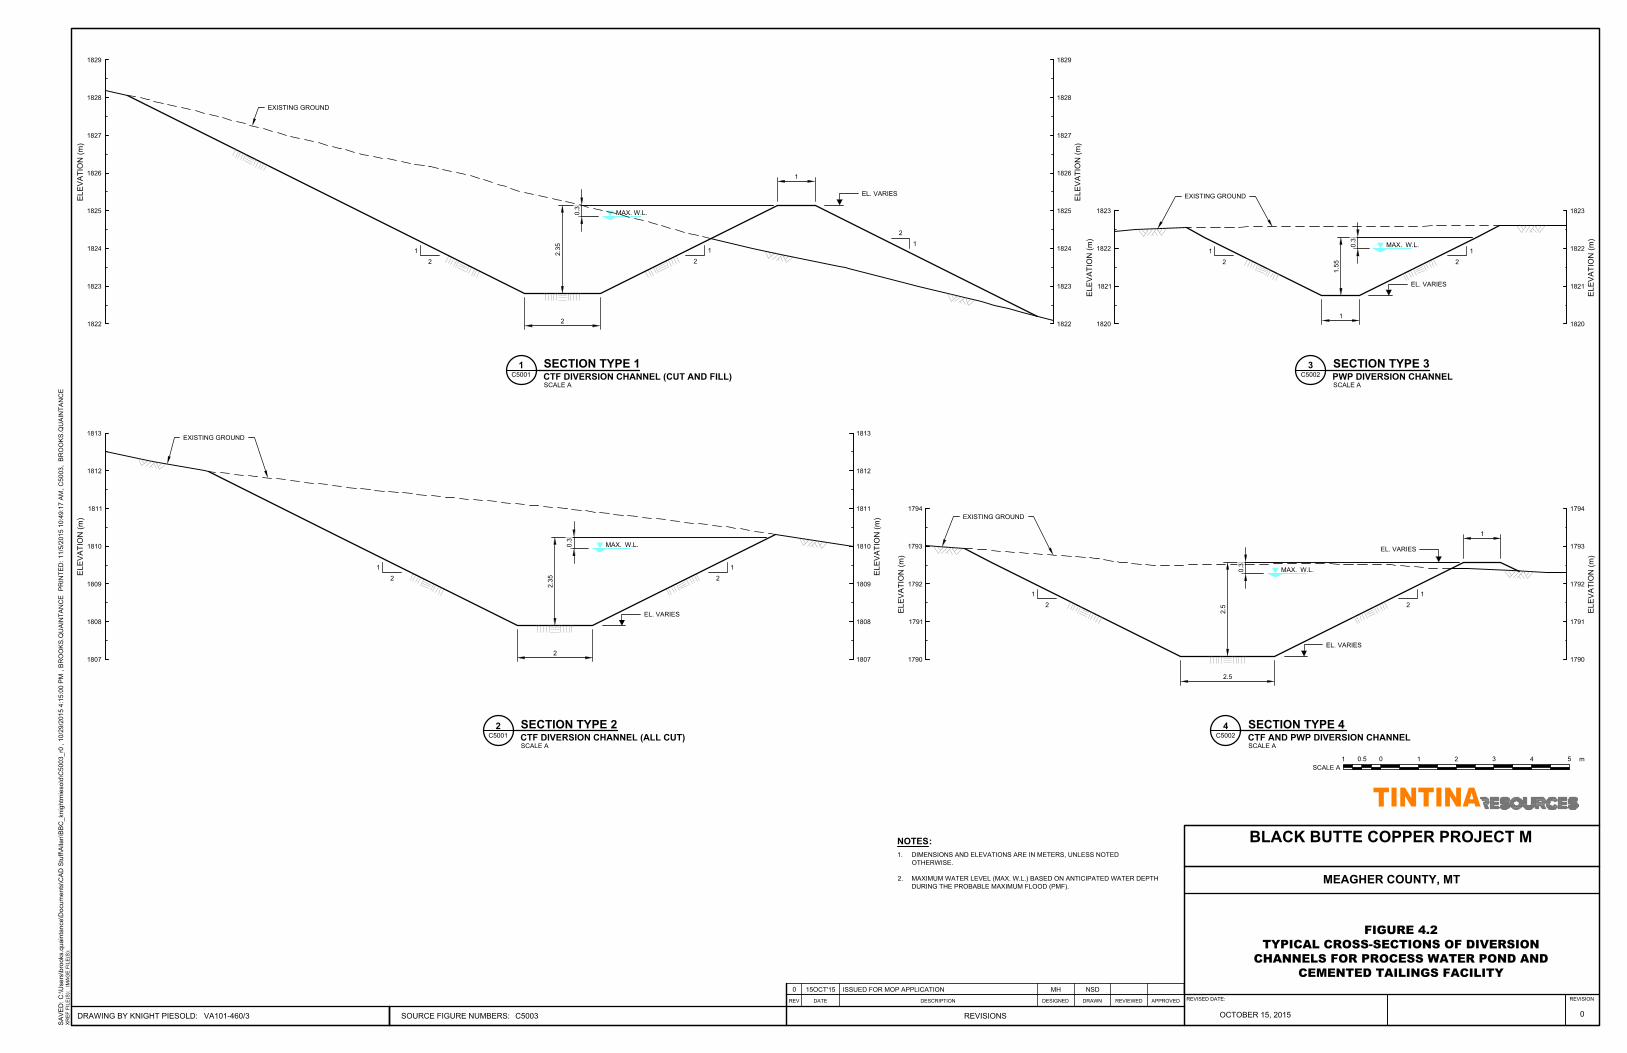
EL. VARIES
MAX. W.L.
EXISTING GROUND
2
1
2
2.35
2
1
2
2.35
MAX. W.L.
2
1
2
1
SECTION TYPE 11
C5001
CTF DIVERSION CHANNEL (CUT AND FILL)
SCALE A
SECTION TYPE 22
C5001
CTF DIVERSION CHANNEL (ALL CUT)
SCALE A
EXISTING GROUND
0.3
0.3
EL
EV
AT
IO
N (m
)
1822
1823
1824
1825
1826
1827
1828
EL
EV
AT
IO
N (m
)
1822
1823
1824
1825
1826
1827
1828
2
1
1
EL
EV
AT
IO
N (m
)
1807
1808
1809
1810
1811
1812
1813
EL
EV
AT
IO
N (m
)
1807
1808
1809
1810
1811
1812
1813
EL
EV
AT
IO
N (m
)
EL
EV
AT
IO
N (m
)
1820
1821
1822
1823
1820
1821
1822
1823
EL
EV
AT
IO
N (m
)
EL
EV
AT
IO
N (m
)
1790
1791
1792
1793
1794
1790
1791
1792
1793
1794
1
1.55
2
1
2
1
SECTION TYPE 33
C5002
PWP DIVERSION CHANNEL
SCALE A
EXISTING GROUND
MAX. W.L.
0.3
2.5
2.5
2
1
2
1
MAX. W.L.
0.3
1
EL. VARIES
SECTION TYPE 44
C5002
CTF AND PWP DIVERSION CHANNEL
SCALE A
EXISTING GROUND
EL. VARIES
EL. VARIES
EL. VARIES
1829 1829
m00.51 1 2 3 4 5
SCALE A
NOTES:
1. DIMENSIONS AND ELEVATIONS ARE IN METERS, UNLESS NOTED
OTHERWISE.
2. MAXIMUM WATER LEVEL (MAX. W.L.) BASED ON ANTICIPATED WATER DEPTH
DURING THE PROBABLE MAXIMUM FLOOD (PMF).
0 15OCT'15 ISSUED FOR MOP APPLICATION MH NSD
DRAWING BY KNIGHT PIESOLD:
REV DATE
REVISED DATE: REVISION
DESCRIPTION DRAWN
REVISIONS
DESIGNED REVIEWED APPROVED
SA
VE
D: C
:\U
sers\brooks.quaintance\D
ocum
ents\C
AD
S
tuff\A
llan\B
BC
_knightm
iesold\C
5003_r0
, 10/29/2015 4:15:00 P
M , B
RO
OK
S.Q
UA
IN
TA
NC
E P
RIN
TE
D: 11/5/2015 10:49:17 A
M, C
5003
, B
RO
OK
S.Q
UA
IN
TA
NC
E
XR
EF
F
IL
E(S
): IM
AG
E F
IL
E(S
):
SOURCE FIGURE NUMBERS:
MEAGHER COUNTY, MT
BLACK BUTTE COPPER PROJECT M
FIGURE 4.2TYPICAL CROSS-SECTIONS OF DIVERSION
CHANNELS FOR PROCESS WATER POND AND CEMENTED TAILINGS FACILITY
VA101-460/3 C5003
0
OCTOBER 15, 2015
H:\Files\TGOLD\11048\Integrated Discharge Permit\R17 Permit Application Narrative.Docx\\12/11/17\065
4-10 12/11/17\7:28 AM
4.5 EROSION CONTROL METHODS AND BEST MANAGEMENT PRACTICES
(BMPs)
During the construction, operations, and closure phases, a number of erosion control
techniques, methods, or features will be used. The bulleted list that follows identifies and
defines them.
Vegetation Management and Revegetation - Natural vegetation is one of the best and
most cost effective methods of reducing the potential for erosion and sedimentation
by keeping soil secure and providing ground cover to reduce raindrop velocities.
Mulching - This is the application of a uniform protective layer of straw, wood fiber,
wood chips, or other acceptable material on the soil surface of a seeded area to allow
for the immediate protection of the seed bed during revegetation. Mulching can be
used in areas that require temporary or permanent covers.
Rolled Erosion Control Products - Tintina will use products that consist of primarily
organic materials composed of two layers of coarse mesh with a central layer of
permeable fibres. These are used to cover un-vegetated cut or fill slopes when
vegetation or mulching alone may be unsuccessful.
Slope Roughening - Cut and fill slopes can be roughened with tracked machinery or
other means to reduce run-off velocities, increase water infiltration rates, and helps
facilitate future revegetation. It is simple, inexpensive, and provides immediate short-
term erosion control for bare soil where vegetative cover is not yet established.
Recontouring - This method can reduce the effect of erosion by shortening the length
of the accumulation and movement of water as well as decreasing the angle of the
erosional slope. Recontouring is easily planned and constructed on site.
Silt Fencing - This is a perimeter control type BMP used to intercept sheet flow run-
off in conjunction with other BMPs. Typical silt fencing comprises a geotextile
fabric partially buried in the ground (on the disturbed side of the fence) and anchored
to posts driven into the ground. It promotes sediment control by filtering water that
passes through the fabric and increases short term retention time, allowing suspended
sediments to settle. Silt fences will be placed parallel to slope contours in order to
maximize ponding efficiency.
H:\Files\TGOLD\11048\Integrated Discharge Permit\R17 Permit Application Narrative.Docx\\12/11/17\065
4-11 12/11/17\7:28 AM
Temporary Sediment Traps and Sediment Basins - A sediment trap / basin is a
temporary structure used to detain run-off from small drainage areas (generally < 5
acres) to allow sediment to settle out. A sediment trap / basin can be created by
excavating a basin, utilizing an existing depression, or constructing a small dam on a
slight slope downward from the work area.
Filter Bags - Filter bags are generally constructed from a sturdy non-woven geotextile
capable of filtering particles larger than 150 microns. Filter bags are typically
installed at the discharge end of pumped diversions, via fabric flange fittings, and
remove fine grained materials before discharging to the environment.
Flocculants - Flocculation systems are installed in sediment control ponds and use
chemical or natural additives (e.g., corn starch, chitosan, guar gum, etc.) to accelerate
the natural settling process as sediment-laden water flows through the pond. These
systems reduce the required pond retention time.
Collection Ditches - A collection ditch intercepts contact water run-off from disturbed
areas and diverts it to a stabilized area where it can be effectively managed. Coarse
non-acid generating rock and equipment to build ditches and dams will be easily
obtained on site, and require little further maintenance, making them effective
improvements. Contact water will be collected in HPDE lined ditches and routed to
the CWP for storage and treatment prior to discharge.
Diversion Ditches - Diversion ditches are constructed up-gradient of disturbed areas
to intercept clean surface water run-off and discharge it through a stabilized outlet
designed to handle the expected run-off velocities and flows from the ditch without
scouring.
Culverts - Culverts are used in tandem with collection or diversion ditches to pass
water flow beneath disturbed areas, typically roadways, to prevent the erosion of
these constructed structures.
Water Bars - Water bars serve to reduce sheet flow and surface erosion of areas of
exposed soil and/or roads by diverting run-off towards a stable vegetated area or
collection ditch. Water bars may require regular maintenance when subjected to
frequent traffic crossings.
H:\Files\TGOLD\11048\Integrated Discharge Permit\R17 Permit Application Narrative.Docx\\12/11/17\065
4-12 12/11/17\7:28 AM
4.5.1 Specific Construction BMPs
Erosion control BMPs will be implemented prior to and during construction at the Project.
Erosion control BMPs reduce erosion by stabilizing exposed soil, or by reducing surface run-
off flow velocities. There are generally two types of erosion control BMPs:
Source control BMPs for protection of exposed surfaces; and
Conveyance BMPs for control of run-off.
Examples of BMPs that will be implemented are included in “Water Quality BMPs for
Montana Forests” (MSU Extension Service, 2001). The BMPs listed below will likely be
used to minimize erosion, sedimentation, and to control surface and storm water run-off at
the Project site.
1. Staged development to allow “green-up” or re-establishment of vegetation and
minimize erosive areas.
2. Suspension of construction dirt work during periods of heaviest precipitation and run-
off to minimize soil disturbance and erosion.
3. Restrict vehicular and equipment access to construction areas, or provide working
surfaces / pads.
4. Minimize clearing of rights-of-way and stripping of building sites.
5. Physically mark clearing boundaries on the construction site.
6. Hydroseed or revegetate cut and fill slopes and disturbed natural slopes as early as
possible.
7. Use mulches and other organic stabilizers to minimize erosion until vegetation is
established on sensitive areas or soils.
8. Plan seeding and planting to allow establishment before end of growing season.
9. Isolate cleared areas and building sites with diversion channels, ditches, and swales to
redirect run-off.
10. Retain natural drainage patterns wherever possible.
11. Install run-off diversions that are primarily located at surface facilities and separate
contact storm water and non-contact storm water.
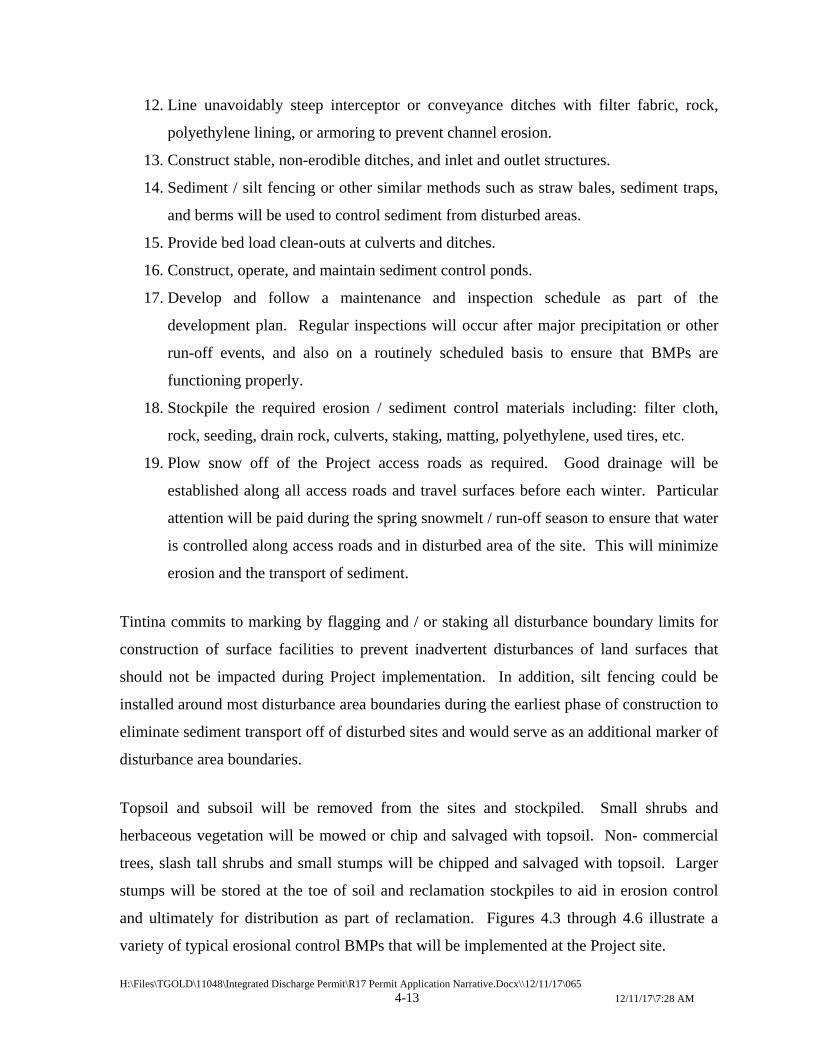
H:\Files\TGOLD\11048\Integrated Discharge Permit\R17 Permit Application Narrative.Docx\\12/11/17\065
4-13 12/11/17\7:28 AM
12. Line unavoidably steep interceptor or conveyance ditches with filter fabric, rock,
polyethylene lining, or armoring to prevent channel erosion.
13. Construct stable, non-erodible ditches, and inlet and outlet structures.
14. Sediment / silt fencing or other similar methods such as straw bales, sediment traps,
and berms will be used to control sediment from disturbed areas.
15. Provide bed load clean-outs at culverts and ditches.
16. Construct, operate, and maintain sediment control ponds.
17. Develop and follow a maintenance and inspection schedule as part of the
development plan. Regular inspections will occur after major precipitation or other
run-off events, and also on a routinely scheduled basis to ensure that BMPs are
functioning properly.
18. Stockpile the required erosion / sediment control materials including: filter cloth,
rock, seeding, drain rock, culverts, staking, matting, polyethylene, used tires, etc.
19. Plow snow off of the Project access roads as required. Good drainage will be
established along all access roads and travel surfaces before each winter. Particular
attention will be paid during the spring snowmelt / run-off season to ensure that water
is controlled along access roads and in disturbed area of the site. This will minimize
erosion and the transport of sediment.
Tintina commits to marking by flagging and / or staking all disturbance boundary limits for
construction of surface facilities to prevent inadvertent disturbances of land surfaces that
should not be impacted during Project implementation. In addition, silt fencing could be
installed around most disturbance area boundaries during the earliest phase of construction to
eliminate sediment transport off of disturbed sites and would serve as an additional marker of
disturbance area boundaries.
Topsoil and subsoil will be removed from the sites and stockpiled. Small shrubs and
herbaceous vegetation will be mowed or chip and salvaged with topsoil. Non- commercial
trees, slash tall shrubs and small stumps will be chipped and salvaged with topsoil. Larger
stumps will be stored at the toe of soil and reclamation stockpiles to aid in erosion control
and ultimately for distribution as part of reclamation. Figures 4.3 through 4.6 illustrate a
variety of typical erosional control BMPs that will be implemented at the Project site.
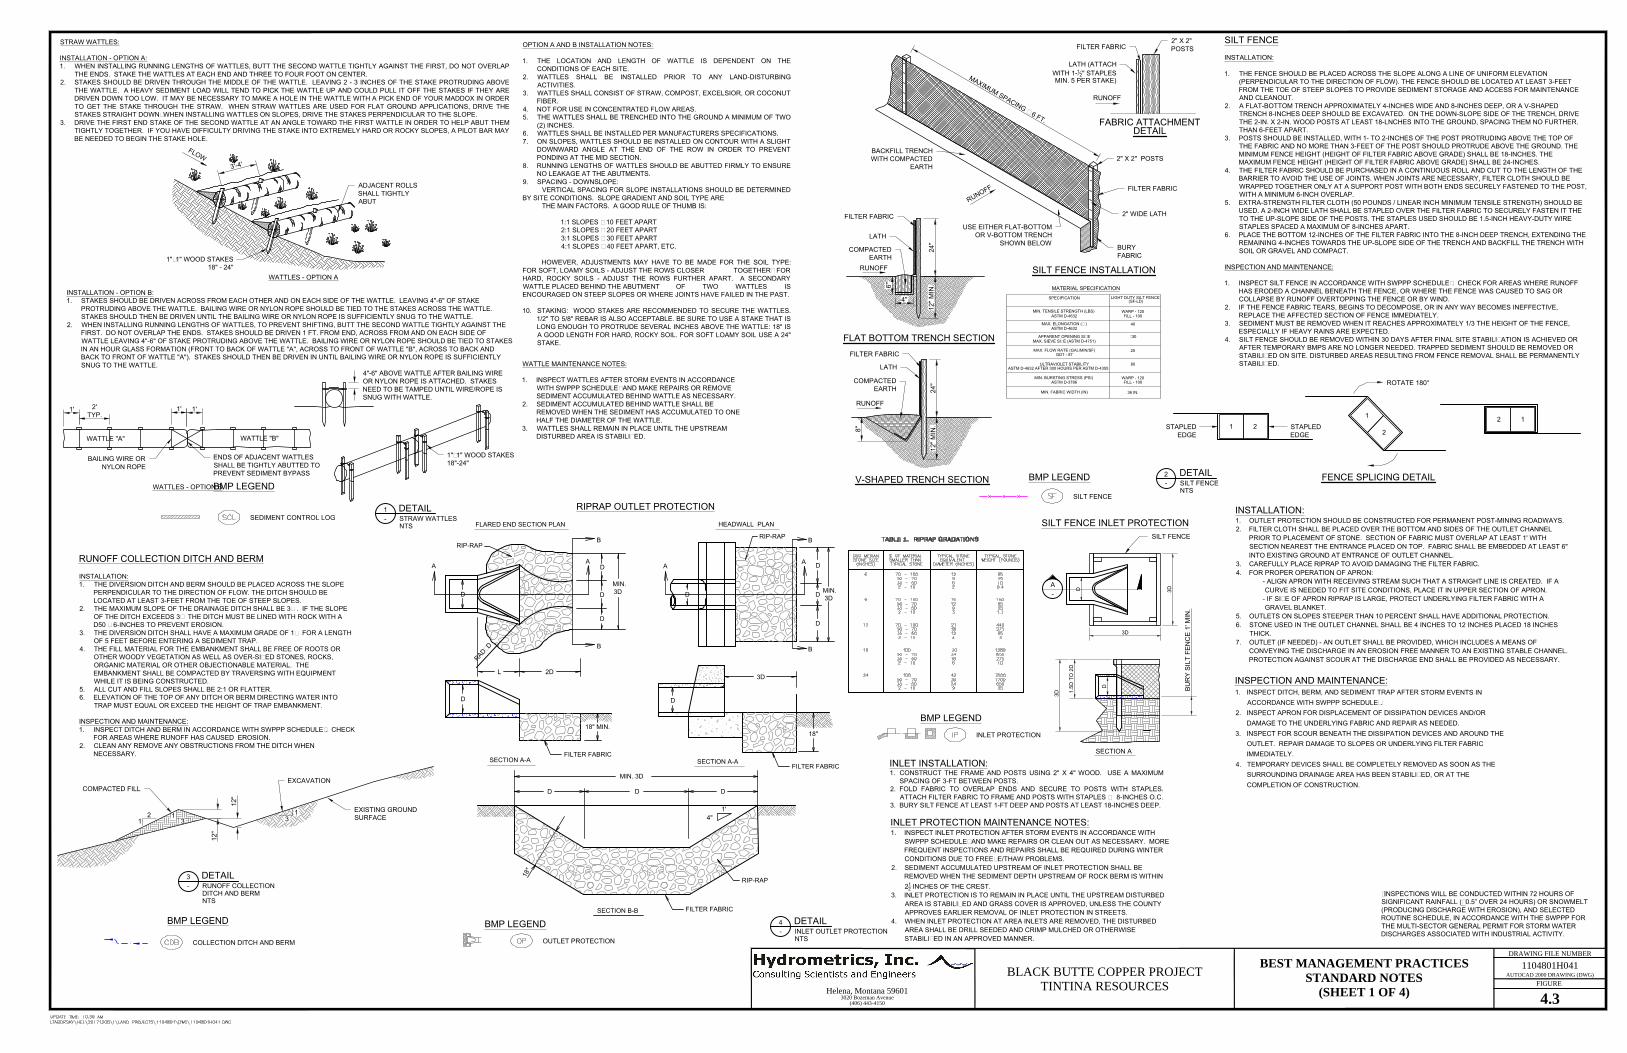
WATTLES - OPTION A
F
L
O
W
3
'-4
'
STRAW WATTLES:
INSTALLATION - OPTION A:
1. WHEN INSTALLING RUNNING LENGTHS OF WATTLES, BUTT THE SECOND WATTLE TIGHTLY AGAINST THE FIRST, DO NOT OVERLAP
THE ENDS. STAKE THE WATTLES AT EACH END AND THREE TO FOUR FOOT ON CENTER.
2. STAKES SHOULD BE DRIVEN THROUGH THE MIDDLE OF THE WATTLE. LEAVING 2 - 3 INCHES OF THE STAKE PROTRUDING ABOVE
THE WATTLE. A HEAVY SEDIMENT LOAD WILL TEND TO PICK THE WATTLE UP AND COULD PULL IT OFF THE STAKES IF THEY ARE
DRIVEN DOWN TOO LOW. IT MAY BE NECESSARY TO MAKE A HOLE IN THE WATTLE WITH A PICK END OF YOUR MADDOX IN ORDER
TO GET THE STAKE THROUGH THE STRAW. WHEN STRAW WATTLES ARE USED FOR FLAT GROUND APPLICATIONS, DRIVE THE
STAKES STRAIGHT DOWN; WHEN INSTALLING WATTLES ON SLOPES, DRIVE THE STAKES PERPENDICULAR TO THE SLOPE.
3. DRIVE THE FIRST END STAKE OF THE SECOND WATTLE AT AN ANGLE TOWARD THE FIRST WATTLE IN ORDER TO HELP ABUT THEM
TIGHTLY TOGETHER. IF YOU HAVE DIFFICULTY DRIVING THE STAKE INTO EXTREMELY HARD OR ROCKY SLOPES, A PILOT BAR MAY
BE NEEDED TO BEGIN THE STAKE HOLE.
WATTLE "A"WATTLE "B"
1'
2'
TYP.
1'1'
WATTLES - OPTION B
INSTALLATION - OPTION B:
1. STAKES SHOULD BE DRIVEN ACROSS FROM EACH OTHER AND ON EACH SIDE OF THE WATTLE. LEAVING 4"-6" OF STAKE
PROTRUDING ABOVE THE WATTLE. BAILING WIRE OR NYLON ROPE SHOULD BE TIED TO THE STAKES ACROSS THE WATTLE.
STAKES SHOULD THEN BE DRIVEN UNTIL THE BAILING WIRE OR NYLON ROPE IS SUFFICIENTLY SNUG TO THE WATTLE.
2. WHEN INSTALLING RUNNING LENGTHS OF WATTLES, TO PREVENT SHIFTING, BUTT THE SECOND WATTLE TIGHTLY AGAINST THE
FIRST. DO NOT OVERLAP THE ENDS. STAKES SHOULD BE DRIVEN 1 FT. FROM END, ACROSS FROM AND ON EACH SIDE OF
WATTLE LEAVING 4"-6" OF STAKE PROTRUDING ABOVE THE WATTLE. BAILING WIRE OR NYLON ROPE SHOULD BE TIED TO STAKES
IN AN HOUR GLASS FORMATION (FRONT TO BACK OF WATTLE "A", ACROSS TO FRONT OF WATTLE "B", ACROSS TO BACK AND
BACK TO FRONT OF WATTLE "A"). STAKES SHOULD THEN BE DRIVEN IN UNTIL BAILING WIRE OR NYLON ROPE IS SUFFICIENTLY
SNUG TO THE WATTLE.
OPTION A AND B INSTALLATION NOTES:
1. THE LOCATION AND LENGTH OF WATTLE IS DEPENDENT ON THE
CONDITIONS OF EACH SITE.
2. WATTLES SHALL BE INSTALLED PRIOR TO ANY LAND-DISTURBING
ACTIVITIES.
3. WATTLES SHALL CONSIST OF STRAW, COMPOST, EXCELSIOR, OR COCONUT
FIBER.
4. NOT FOR USE IN CONCENTRATED FLOW AREAS.
5. THE WATTLES SHALL BE TRENCHED INTO THE GROUND A MINIMUM OF TWO
(2) INCHES.
6. WATTLES SHALL BE INSTALLED PER MANUFACTURERS SPECIFICATIONS.
7. ON SLOPES, WATTLES SHOULD BE INSTALLED ON CONTOUR WITH A SLIGHT
DOWNWARD ANGLE AT THE END OF THE ROW IN ORDER TO PREVENT
PONDING AT THE MID SECTION.
8. RUNNING LENGTHS OF WATTLES SHOULD BE ABUTTED FIRMLY TO ENSURE
NO LEAKAGE AT THE ABUTMENTS.
9. SPACING - DOWNSLOPE:
VERTICAL SPACING FOR SLOPE INSTALLATIONS SHOULD BE DETERMINED
BY SITE CONDITIONS. SLOPE GRADIENT AND SOIL TYPE ARE
THE MAIN FACTORS. A GOOD RULE OF THUMB IS:
1:1 SLOPES = 10 FEET APART
2:1 SLOPES = 20 FEET APART
3:1 SLOPES = 30 FEET APART
4:1 SLOPES = 40 FEET APART, ETC.
HOWEVER, ADJUSTMENTS MAY HAVE TO BE MADE FOR THE SOIL TYPE:
FOR SOFT, LOAMY SOILS - ADJUST THE ROWS CLOSER TOGETHER; FOR
HARD, ROCKY SOILS - ADJUST THE ROWS FURTHER APART. A SECONDARY
WATTLE PLACED BEHIND THE ABUTMENT OF TWO WATTLES IS
ENCOURAGED ON STEEP SLOPES OR WHERE JOINTS HAVE FAILED IN THE PAST.
10. STAKING: WOOD STAKES ARE RECOMMENDED TO SECURE THE WATTLES.
1/2" TO 5/8" REBAR IS ALSO ACCEPTABLE. BE SURE TO USE A STAKE THAT IS
LONG ENOUGH TO PROTRUDE SEVERAL INCHES ABOVE THE WATTLE: 18" IS
A GOOD LENGTH FOR HARD, ROCKY SOIL. FOR SOFT LOAMY SOIL USE A 24"
STAKE.
ADJACENT ROLLS
SHALL TIGHTLY
ABUT
1"x1" WOOD STAKES
18" - 24"
BAILING WIRE OR
NYLON ROPE
ENDS OF ADJACENT WATTLES
SHALL BE TIGHTLY ABUTTED TO
PREVENT SEDIMENT BYPASS
4"-6" ABOVE WATTLE AFTER BAILING WIRE
OR NYLON ROPE IS ATTACHED. STAKES
NEED TO BE TAMPED UNTIL WIRE/ROPE IS
SNUG WITH WATTLE.
0"
1"x1" WOOD STAKES
18"-24"
WATTLE MAINTENANCE NOTES:
1. INSPECT WATTLES AFTER STORM EVENTS IN ACCORDANCE
WITH SWPPP SCHEDULE* AND MAKE REPAIRS OR REMOVE
SEDIMENT ACCUMULATED BEHIND WATTLE AS NECESSARY.
2. SEDIMENT ACCUMULATED BEHIND WATTLE SHALL BE
REMOVED WHEN THE SEDIMENT HAS ACCUMULATED TO ONE
HALF THE DIAMETER OF THE WATTLE.
3. WATTLES SHALL REMAIN IN PLACE UNTIL THE UPSTREAM
DISTURBED AREA IS STABILIZED.
M
A
X
I
M
U
M
S
P
A
C
I
N
G
=
6
F
T
.
R
U
N
O
F
F
SILT FENCE INSTALLATION
FLAT BOTTOM TRENCH SECTION
V-SHAPED TRENCH SECTION
FABRIC ATTACHMENT
MATERIAL SPECIFICATION
LIGHT DUTY SILT FENCE SPECIFICATION
WARP - 120MIN. TENSILE STRENGTH (LBS)
FILL - 100ASTM D-4632
40MAX. ELONGATION (%)
ASTM D-4632
#30APPARENT OPENING SIZE
MAX. SIEVE SIZE (ASTM D-4751)
25MAX. FLOW RATE (GAL/MIN/SF)
GDT - 87
80ULTRAVIOLET STABILITY
ASTM D-4632 AFTER 300 HOURS PER ASTM D-4355
WARP - 120MIN. BURSTING STRESS (PSI)
FILL - 100ASTM D-3786
36 IN.MIN. FABRIC WIDTH (IN)
(SF-LD)
BURY
FABRIC
USE EITHER FLAT-BOTTOM
OR V-BOTTOM TRENCH
SHOWN BELOW
BACKFILL TRENCH
WITH COMPACTED
EARTH
2" WIDE LATH
FILTER FABRIC
2" X 2" POSTS
RUNOFF
24
"1
2" M
IN
.
8"
FILTER FABRIC
LATH
COMPACTED
EARTH
RUNOFF
FILTER FABRIC
2" X 2"
POSTS
LATH (ATTACH
WITH 1-
1
2
" STAPLES
MIN. 5 PER STAKE)
RUNOFF
24
"1
2" M
IN
.
6"
4"
FILTER FABRIC
LATH
COMPACTED
EARTH
DETAIL
SILT FENCE
INSTALLATION:
1. THE FENCE SHOULD BE PLACED ACROSS THE SLOPE ALONG A LINE OF UNIFORM ELEVATION
(PERPENDICULAR TO THE DIRECTION OF FLOW). THE FENCE SHOULD BE LOCATED AT LEAST 3-FEET
FROM THE TOE OF STEEP SLOPES TO PROVIDE SEDIMENT STORAGE AND ACCESS FOR MAINTENANCE
AND CLEANOUT.
2. A FLAT-BOTTOM TRENCH APPROXIMATELY 4-INCHES WIDE AND 8-INCHES DEEP, OR A V-SHAPED
TRENCH 8-INCHES DEEP SHOULD BE EXCAVATED. ON THE DOWN-SLOPE SIDE OF THE TRENCH, DRIVE
THE 2-IN. X 2-IN. WOOD POSTS AT LEAST 18-LNCHES INTO THE GROUND, SPACING THEM NO FURTHER.
THAN 6-FEET APART.
3. POSTS SHOULD BE INSTALLED, WITH 1- TO 2-INCHES OF THE POST PROTRUDING ABOVE THE TOP OF
THE FABRIC AND NO MORE THAN 3-FEET OF THE POST SHOULD PROTRUDE ABOVE THE GROUND. THE
MINIMUM FENCE HEIGHT (HEIGHT OF FILTER FABRIC ABOVE GRADE) SHALL BE 18-INCHES. THE
MAXIMUM FENCE HEIGHT (HEIGHT OF FILTER FABRIC ABOVE GRADE) SHALL BE 24-INCHES.
4. THE FILTER FABRIC SHOULD BE PURCHASED IN A CONTINUOUS ROLL AND CUT TO THE LENGTH OF THE
BARRIER TO AVOID THE USE OF JOINTS. WHEN JOINTS ARE NECESSARY, FILTER CLOTH SHOULD BE
WRAPPED TOGETHER ONLY AT A SUPPORT POST WITH BOTH ENDS SECURELY FASTENED TO THE POST,
WITH A MINIMUM 6-INCH OVERLAP.
5. EXTRA-STRENGTH FILTER CLOTH (50 POUNDS / LINEAR INCH MINIMUM TENSILE STRENGTH) SHOULD BE
USED. A 2-INCH WIDE LATH SHALL BE STAPLED OVER THE FILTER FABRIC TO SECURELY FASTEN IT THE
TO THE UP-SLOPE SIDE OF THE POSTS. THE STAPLES USED SHOULD BE 1.5-INCH HEAVY-DUTY WIRE
STAPLES SPACED A MAXIMUM OF 8-INCHES APART.
6. PLACE THE BOTTOM 12-INCHES OF THE FILTER FABRIC INTO THE 8-INCH DEEP TRENCH, EXTENDING THE
REMAINING 4-INCHES TOWARDS THE UP-SLOPE SIDE OF THE TRENCH AND BACKFILL THE TRENCH WITH
SOIL OR GRAVEL AND COMPACT.
INSPECTION AND MAINTENANCE:
1. INSPECT SILT FENCE IN ACCORDANCE WITH SWPPP SCHEDULE*. CHECK FOR AREAS WHERE RUNOFF
HAS ERODED A CHANNEL BENEATH THE FENCE, OR WHERE THE FENCE WAS CAUSED TO SAG OR
COLLAPSE BY RUNOFF OVERTOPPING THE FENCE OR BY WIND.
2. IF THE FENCE FABRIC TEARS, BEGINS TO DECOMPOSE, OR IN ANY WAY BECOMES INEFFECTIVE,
REPLACE THE AFFECTED SECTION OF FENCE IMMEDIATELY.
3. SEDIMENT MUST BE REMOVED WHEN IT REACHES APPROXIMATELY 1/3 THE HEIGHT OF THE FENCE,
ESPECIALLY IF HEAVY RAINS ARE EXPECTED.
4. SILT FENCE SHOULD BE REMOVED WITHIN 30 DAYS AFTER FINAL SITE STABILIZATION IS ACHIEVED OR
AFTER TEMPORARY BMPS ARE NO LONGER NEEDED. TRAPPED SEDIMENT SHOULD BE REMOVED OR
STABILIZED ON SITE. DISTURBED AREAS RESULTING FROM FENCE REMOVAL SHALL BE PERMANENTLY
STABILIZED.
1 2
1
2
2 1
FENCE SPLICING DETAIL
ROTATE 180°
STAPLED
EDGE
STAPLED
EDGE
1 3
2
1
3
1
EXISTING GROUND
SURFACE
12
"
12
"
EXCAVATION
COMPACTED FILL
RUNOFF COLLECTION DITCH AND BERM
INSTALLATION:
1. THE DIVERSION DITCH AND BERM SHOULD BE PLACED ACROSS THE SLOPE
PERPENDICULAR TO THE DIRECTION OF FLOW. THE DITCH SHOULD BE
LOCATED AT LEAST 3-FEET FROM THE TOE OF STEEP SLOPES.
2. THE MAXIMUM SLOPE OF THE DRAINAGE DITCH SHALL BE 3%. IF THE SLOPE
OF THE DITCH EXCEEDS 3% THE DITCH MUST BE LINED WITH ROCK WITH A
D50 = 6-INCHES TO PREVENT EROSION.
3. THE DIVERSION DITCH SHALL HAVE A MAXIMUM GRADE OF 1% FOR A LENGTH
OF 5 FEET BEFORE ENTERING A SEDIMENT TRAP.
4. THE FILL MATERIAL FOR THE EMBANKMENT SHALL BE FREE OF ROOTS OR
OTHER WOODY VEGETATION AS WELL AS OVER-SIZED STONES, ROCKS,
ORGANIC MATERIAL OR OTHER OBJECTIONABLE MATERIAL. THE
EMBANKMENT SHALL BE COMPACTED BY TRAVERSING WITH EQUIPMENT
WHILE IT IS BEING CONSTRUCTED.
5. ALL CUT AND FILL SLOPES SHALL BE 2:1 OR FLATTER.
6. ELEVATION OF THE TOP OF ANY DITCH OR BERM DIRECTING WATER INTO
TRAP MUST EQUAL OR EXCEED THE HEIGHT OF TRAP EMBANKMENT.
INSPECTION AND MAINTENANCE:
1. INSPECT DITCH AND BERM IN ACCORDANCE WITH SWPPP SCHEDULE*. CHECK
FOR AREAS WHERE RUNOFF HAS CAUSED EROSION.
2. CLEAN ANY REMOVE ANY OBSTRUCTIONS FROM THE DITCH WHEN
NECESSARY.
4"
1'
RIP-RAP
1
8
"
SECTION B-B
DDD
MIN. 3D
18"
18" MIN.
HEADWALL PLAN
RIP-RAP
3D
MIN.
3D
D
D
D
B
B
D
A
A
D
SECTION A-A
D
SECTION A-A
2DL
R
A
D
=
D
FLARED END SECTION PLAN
RIP-RAP
3D
MIN.
D
D
D
B
B
D
A
A
FILTER FABRIC
FILTER FABRIC
FILTER FABRIC
RIPRAP OUTLET PROTECTION
SECTION A
SILT FENCE INLET PROTECTION
SILT FENCE
D
3D
3D
1.5
D T
O 2D
BU
RY
S
ILT
F
EN
CE
1' M
IN
.
D
3D
INLET INSTALLATION:
1. CONSTRUCT THE FRAME AND POSTS USING 2" X 4" WOOD. USE A MAXIMUM
SPACING OF 3-FT BETWEEN POSTS.
2. FOLD FABRIC TO OVERLAP ENDS AND SECURE TO POSTS WITH STAPLES.
ATTACH FILTER FABRIC TO FRAME AND POSTS WITH STAPLES @ 8-INCHES O.C.
3. BURY SILT FENCE AT LEAST 1-FT DEEP AND POSTS AT LEAST 18-INCHES DEEP.
A
-
SEDIMENT CONTROL LOG
SILT FENCE
INLET PROTECTION
INSPECTION AND MAINTENANCE:
1. INSPECT DITCH, BERM, AND SEDIMENT TRAP AFTER STORM EVENTS IN
ACCORDANCE WITH SWPPP SCHEDULE*.
2. INSPECT APRON FOR DISPLACEMENT OF DISSIPATION DEVICES AND/OR
DAMAGE TO THE UNDERLYING FABRIC AND REPAIR AS NEEDED.
3. INSPECT FOR SCOUR BENEATH THE DISSIPATION DEVICES AND AROUND THE
OUTLET. REPAIR DAMAGE TO SLOPES OR UNDERLYING FILTER FABRIC
IMMEDIATELY.
4. TEMPORARY DEVICES SHALL BE COMPLETELY REMOVED AS SOON AS THE
SURROUNDING DRAINAGE AREA HAS BEEN STABILIZED, OR AT THE
COMPLETION OF CONSTRUCTION.
INSTALLATION:
1. OUTLET PROTECTION SHOULD BE CONSTRUCTED FOR PERMANENT POST-MINING ROADWAYS.
2. FILTER CLOTH SHALL BE PLACED OVER THE BOTTOM AND SIDES OF THE OUTLET CHANNEL
PRIOR TO PLACEMENT OF STONE. SECTION OF FABRIC MUST OVERLAP AT LEAST 1' WITH
SECTION NEAREST THE ENTRANCE PLACED ON TOP. FABRIC SHALL BE EMBEDDED AT LEAST 6"
INTO EXISTING GROUND AT ENTRANCE OF OUTLET CHANNEL.
3. CAREFULLY PLACE RIPRAP TO AVOID DAMAGING THE FILTER FABRIC.
4. FOR PROPER OPERATION OF APRON:
- ALIGN APRON WITH RECEIVING STREAM SUCH THAT A STRAIGHT LINE IS CREATED. IF A
CURVE IS NEEDED TO FIT SITE CONDITIONS, PLACE IT IN UPPER SECTION OF APRON.
- IF SIZE OF APRON RIPRAP IS LARGE, PROTECT UNDERLYING FILTER FABRIC WITH A
GRAVEL BLANKET.
5. OUTLETS ON SLOPES STEEPER THAN 10 PERCENT SHALL HAVE ADDITIONAL PROTECTION.
6. STONE USED IN THE OUTLET CHANNEL SHALL BE 4 INCHES TO 12 INCHES PLACED 18 INCHES
THICK.
7. OUTLET (IF NEEDED) - AN OUTLET SHALL BE PROVIDED, WHICH INCLUDES A MEANS OF
CONVEYING THE DISCHARGE IN AN EROSION FREE MANNER TO AN EXISTING STABLE CHANNEL.
PROTECTION AGAINST SCOUR AT THE DISCHARGE END SHALL BE PROVIDED AS NECESSARY.
INLET PROTECTION MAINTENANCE NOTES:
1. INSPECT INLET PROTECTION AFTER STORM EVENTS IN ACCORDANCE WITH
SWPPP SCHEDULE* AND MAKE REPAIRS OR CLEAN OUT AS NECESSARY. MORE
FREQUENT INSPECTIONS AND REPAIRS SHALL BE REQUIRED DURING WINTER
CONDITIONS DUE TO FREEZE/THAW PROBLEMS.
2. SEDIMENT ACCUMULATED UPSTREAM OF INLET PROTECTION SHALL BE
REMOVED WHEN THE SEDIMENT DEPTH UPSTREAM OF ROCK BERM IS WITHIN
2
1
2
INCHES OF THE CREST.
3. INLET PROTECTION IS TO REMAIN IN PLACE UNTIL THE UPSTREAM DISTURBED
AREA IS STABILIZED AND GRASS COVER IS APPROVED, UNLESS THE COUNTY
APPROVES EARLIER REMOVAL OF INLET PROTECTION IN STREETS.
4. WHEN INLET PROTECTION AT AREA INLETS ARE REMOVED, THE DISTURBED
AREA SHALL BE DRILL SEEDED AND CRIMP MULCHED OR OTHERWISE
STABILIZED IN AN APPROVED MANNER.
COLLECTION DITCH AND BERM
OUTLET PROTECTION
DETAIL
STRAW WATTLES
NTS
1
-
DETAIL
SILT FENCE
NTS
2
-
DETAIL
RUNOFF COLLECTION
DITCH AND BERM
NTS
3
-
DETAIL
INLET OUTLET PROTECTION
NTS
4
-
BMP LEGEND
BMP LEGEND
BMP LEGEND
BMP LEGEND
BMP LEGEND
DRAWING FILE NUMBER
3020 Bozeman Avenue(406) 443-4150
Helena, Montana 59601FIGURE
AUTOCAD 2000 DRAWING (DWG)BEST MANAGEMENT PRACTICES
STANDARD NOTES(SHEET 1 OF 4)
BLACK BUTTE COPPER PROJECTTINTINA RESOURCES
1104801H041
4.3
*INSPECTIONS WILL BE CONDUCTED WITHIN 72 HOURS OF
SIGNIFICANT RAINFALL (>0.5” OVER 24 HOURS) OR SNOWMELT
(PRODUCING DISCHARGE WITH EROSION), AND SELECTED
ROUTINE SCHEDULE, IN ACCORDANCE WITH THE SWPPP FOR
THE MULTI-SECTOR GENERAL PERMIT FOR STORM WATER
DISCHARGES ASSOCIATED WITH INDUSTRIAL ACTIVITY.
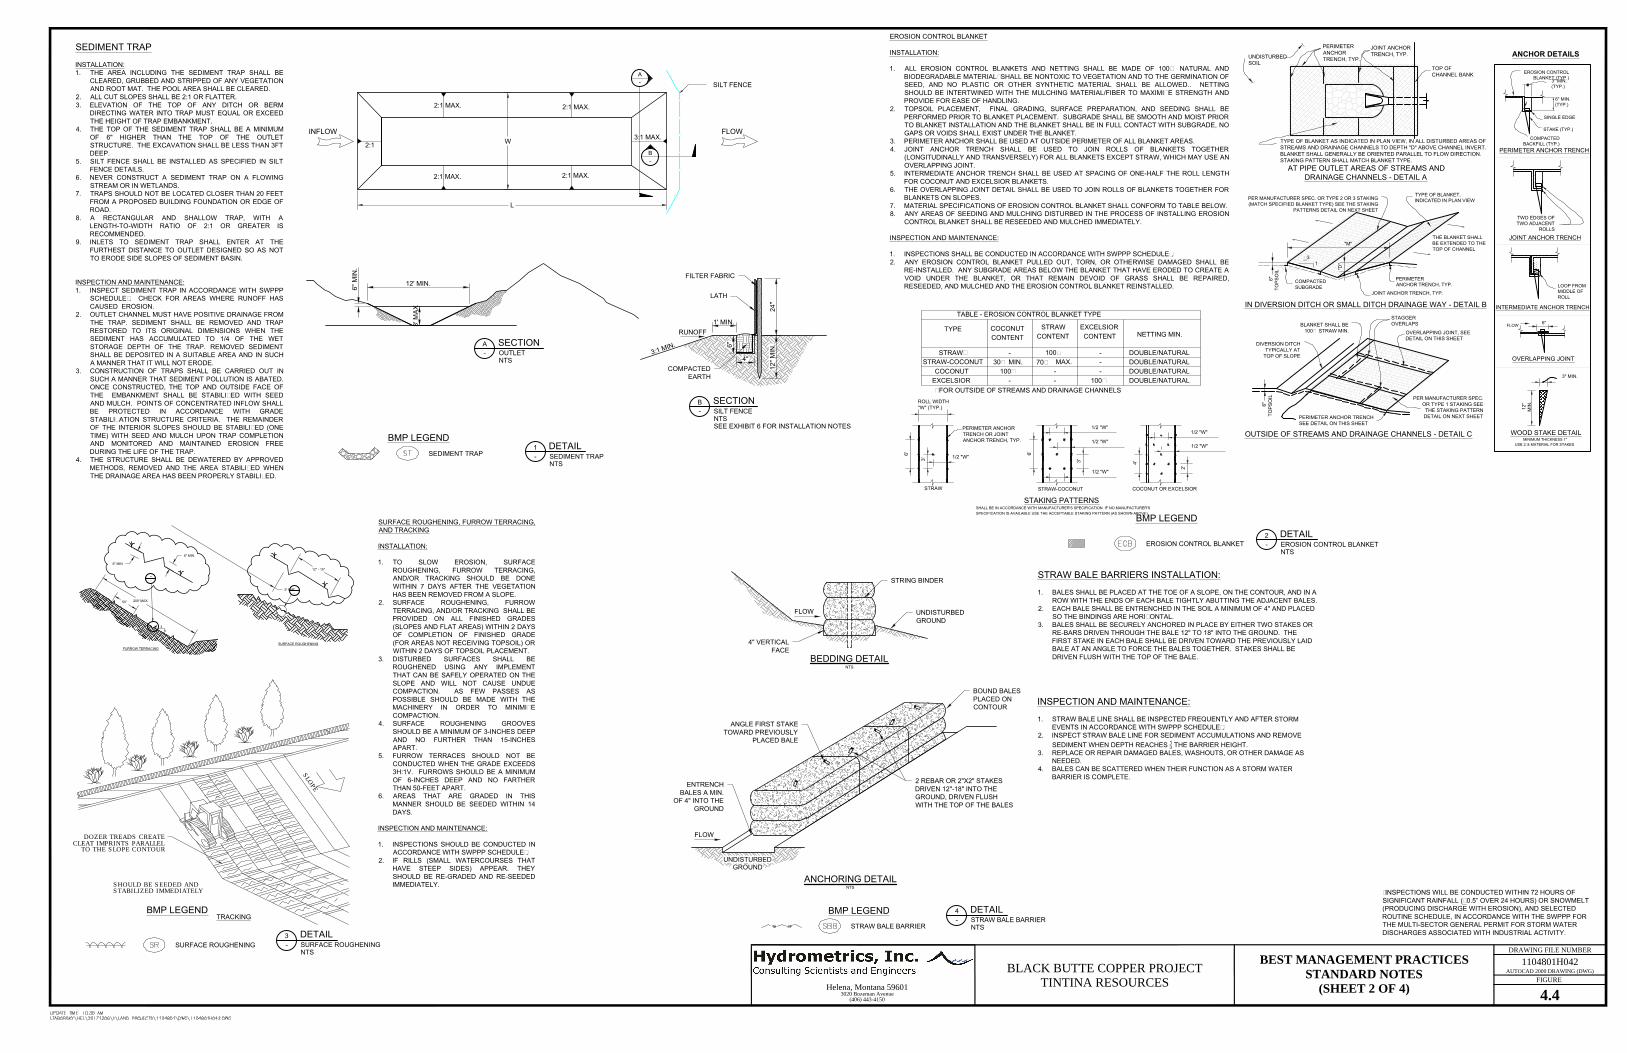
SEDIMENT TRAP
INSTALLATION:
1. THE AREA INCLUDING THE SEDIMENT TRAP SHALL BE
CLEARED, GRUBBED AND STRIPPED OF ANY VEGETATION
AND ROOT MAT. THE POOL AREA SHALL BE CLEARED.
2. ALL CUT SLOPES SHALL BE 2:1 OR FLATTER.
3. ELEVATION OF THE TOP OF ANY DITCH OR BERM
DIRECTING WATER INTO TRAP MUST EQUAL OR EXCEED
THE HEIGHT OF TRAP EMBANKMENT.
4. THE TOP OF THE SEDIMENT TRAP SHALL BE A MINIMUM
OF 6" HIGHER THAN THE TOP OF THE OUTLET
STRUCTURE. THE EXCAVATION SHALL BE LESS THAN 3FT
DEEP.
5. SILT FENCE SHALL BE INSTALLED AS SPECIFIED IN SILT
FENCE DETAILS.
6. NEVER CONSTRUCT A SEDIMENT TRAP ON A FLOWING
STREAM OR IN WETLANDS.
7. TRAPS SHOULD NOT BE LOCATED CLOSER THAN 20 FEET
FROM A PROPOSED BUILDING FOUNDATION OR EDGE OF
ROAD.
8. A RECTANGULAR AND SHALLOW TRAP, WITH A
LENGTH-TO-WIDTH RATIO OF 2:1 OR GREATER IS
RECOMMENDED.
9. INLETS TO SEDIMENT TRAP SHALL ENTER AT THE
FURTHEST DISTANCE TO OUTLET DESIGNED SO AS NOT
TO ERODE SIDE SLOPES OF SEDIMENT BASIN.
INSPECTION AND MAINTENANCE:
1. INSPECT SEDIMENT TRAP IN ACCORDANCE WITH SWPPP
SCHEDULE*. CHECK FOR AREAS WHERE RUNOFF HAS
CAUSED EROSION.
2. OUTLET CHANNEL MUST HAVE POSITIVE DRAINAGE FROM
THE TRAP. SEDIMENT SHALL BE REMOVED AND TRAP
RESTORED TO ITS ORIGINAL DIMENSIONS WHEN THE
SEDIMENT HAS ACCUMULATED TO 1/4 OF THE WET
STORAGE DEPTH OF THE TRAP. REMOVED SEDIMENT
SHALL BE DEPOSITED IN A SUITABLE AREA AND IN SUCH
A MANNER THAT IT WILL NOT ERODE.
3. CONSTRUCTION OF TRAPS SHALL BE CARRIED OUT IN
SUCH A MANNER THAT SEDIMENT POLLUTION IS ABATED.
ONCE CONSTRUCTED, THE TOP AND OUTSIDE FACE OF
THE EMBANKMENT SHALL BE STABILIZED WITH SEED
AND MULCH. POINTS OF CONCENTRATED INFLOW SHALL
BE PROTECTED IN ACCORDANCE WITH GRADE
STABILIZATION STRUCTURE CRITERIA. THE REMAINDER
OF THE INTERIOR SLOPES SHOULD BE STABILIZED (ONE
TIME) WITH SEED AND MULCH UPON TRAP COMPLETION
AND MONITORED AND MAINTAINED EROSION FREE
DURING THE LIFE OF THE TRAP.
4. THE STRUCTURE SHALL BE DEWATERED BY APPROVED
METHODS, REMOVED AND THE AREA STABILIZED WHEN
THE DRAINAGE AREA HAS BEEN PROPERLY STABILIZED.
FLOWINFLOW
B
-
W
L
2:1 MAX.
2:1 MAX.
2:1 MAX.
2:1 MAX.
2:1
3:1 MAX.
A
-
SILT FENCE
RUNOFF
24"
12" M
IN
.
6"
4"
FILTER FABRIC
LATH
COMPACTED
EARTH
1' MIN.
3
:
1
M
I
N
.
12' MIN.
6" M
IN
.
3' M
AX
AT PIPE OUTLET AREAS OF STREAMS AND
DRAINAGE CHANNELS - DETAIL A
IN DIVERSION DITCH OR SMALL DITCH DRAINAGE WAY - DETAIL B
OUTSIDE OF STREAMS AND DRAINAGE CHANNELS - DETAIL C
ANCHOR DETAILS
PERIMETER ANCHOR TRENCH
JOINT ANCHOR TRENCH
INTERMEDIATE ANCHOR TRENCH
OVERLAPPING JOINT
WOOD STAKE DETAIL
MINIMUM THICKNESS 1"
USE 2x4 MATERIAL FOR STAKES
JOINT ANCHOR
TRENCH, TYP.
PERIMETER
ANCHOR
TRENCH, TYP.
TOP OF
CHANNEL BANK
TYPE OF BLANKET AS INDICATED IN PLAN VIEW, IN ALL DISTURBED AREAS OF
STREAMS AND DRAINAGE CHANNELS TO DEPTH "D" ABOVE CHANNEL INVERT.
BLANKET SHALL GENERALLY BE ORIENTED PARALLEL TO FLOW DIRECTION.
STAKING PATTERN SHALL MATCH BLANKET TYPE.
UNDISTURBED
SOIL
TYPE OF BLANKET,
INDICATED IN PLAN VIEW
PER MANUFACTURER SPEC. OR TYPE 2 OR 3 STAKING
(MATCH SPECIFIED BLANKET TYPE) SEE THE STAKING
PATTERNS DETAIL ON NEXT SHEET
PERIMETER
ANCHOR TRENCH, TYP.
JOINT ANCHOR TRENCH, TYP.
COMPACTED
SUBGRADE
1
>3
THE BLANKET SHALL
BE EXTENDED TO THE
TOP OF CHANNEL
"D
"
6"
TO
PS
OIL
"M"
OVERLAPPING JOINT, SEE
DETAIL ON THIS SHEET
STAGGER
OVERLAPS
PERIMETER ANCHOR TRENCH
SEE DETAIL ON THIS SHEET
PER MANUFACTURER SPEC.
OR TYPE 1 STAKING SEE
THE STAKING PATTERN
DETAIL ON NEXT SHEET
BLANKET SHALL BE
100% STRAW MIN.
DIVERSION DITCH
TYPICALLY AT
TOP OF SLOPE
6"
TO
PS
OIL
6" MIN.
(TYP.)
3" MIN.
(TYP.)
SINGLE EDGE
EROSION CONTROL
BLANKET (TYP.)
COMPACTED
BACKFILL (TYP.)
STAKE (TYP.)
TWO EDGES OF
TWO ADJACENT
ROLLS
LOOP FROM
MIDDLE OF
ROLL
FLOW
6"
3" MIN.
12"
MIN
.
STAKING PATTERNS
SHALL BE IN ACCORDANCE WITH MANUFACTURER'S SPECIFICATION. IF NO MANUFACTURER'S
SPECIFICATION IS AVAILABLE USE THE ACCEPTABLE STAKING PATTERN (AS SHOWN ABOVE)
PERIMETER ANCHOR
TRENCH OR JOINT
ANCHOR TRENCH, TYP.
STRAW-COCONUT COCONUT OR EXCELSIOR
STRAW
ROLL WIDTH
"W" (TYP.)
6'
3'
1/2 "W"
1/2 "W"
1/2 "W"
1/2 "W"
1/2 "W"
1/2 "W"
6'
4'
3'
2'
TABLE - EROSION CONTROL BLANKET TYPE
TYPE
STRAW*
STRAW-COCONUT
EXCELSIOR
COCONUT
CONTENT
-
30% MIN.
-
STRAW
CONTENT
100%
-
NETTING MIN.
DOUBLE/NATURAL
100%
-
-
EXCELSIOR
CONTENT
COCONUT --100%
* FOR OUTSIDE OF STREAMS AND DRAINAGE CHANNELS
DOUBLE/NATURAL
DOUBLE/NATURAL
DOUBLE/NATURAL
MAX.70%
EROSION CONTROL BLANKET
INSTALLATION:
1. ALL EROSION CONTROL BLANKETS AND NETTING SHALL BE MADE OF 100% NATURAL AND
BIODEGRADABLE MATERIAL; SHALL BE NONTOXIC TO VEGETATION AND TO THE GERMINATION OF
SEED, AND NO PLASTIC OR OTHER SYNTHETIC MATERIAL SHALL BE ALLOWED.. NETTING
SHOULD BE INTERTWINED WITH THE MULCHING MATERIAL/FIBER TO MAXIMIZE STRENGTH AND
PROVIDE FOR EASE OF HANDLING.
2. TOPSOIL PLACEMENT, FINAL GRADING, SURFACE PREPARATION, AND SEEDING SHALL BE
PERFORMED PRIOR TO BLANKET PLACEMENT. SUBGRADE SHALL BE SMOOTH AND MOIST PRIOR
TO BLANKET INSTALLATION AND THE BLANKET SHALL BE IN FULL CONTACT WITH SUBGRADE, NO
GAPS OR VOIDS SHALL EXIST UNDER THE BLANKET.
3. PERIMETER ANCHOR SHALL BE USED AT OUTSIDE PERIMETER OF ALL BLANKET AREAS.
4. JOINT ANCHOR TRENCH SHALL BE USED TO JOIN ROLLS OF BLANKETS TOGETHER
(LONGITUDINALLY AND TRANSVERSELY) FOR ALL BLANKETS EXCEPT STRAW, WHICH MAY USE AN
OVERLAPPING JOINT.
5. INTERMEDIATE ANCHOR TRENCH SHALL BE USED AT SPACING OF ONE-HALF THE ROLL LENGTH
FOR COCONUT AND EXCELSIOR BLANKETS.
6. THE OVERLAPPING JOINT DETAIL SHALL BE USED TO JOIN ROLLS OF BLANKETS TOGETHER FOR
BLANKETS ON SLOPES.
7. MATERIAL SPECIFICATIONS OF EROSION CONTROL BLANKET SHALL CONFORM TO TABLE BELOW.
8. ANY AREAS OF SEEDING AND MULCHING DISTURBED IN THE PROCESS OF INSTALLING EROSION
CONTROL BLANKET SHALL BE RESEEDED AND MULCHED IMMEDIATELY.
INSPECTION AND MAINTENANCE:
1. INSPECTIONS SHALL BE CONDUCTED IN ACCORDANCE WITH SWPPP SCHEDULE*.
2. ANY EROSION CONTROL BLANKET PULLED OUT, TORN, OR OTHERWISE DAMAGED SHALL BE
RE-INSTALLED. ANY SUBGRADE AREAS BELOW THE BLANKET THAT HAVE ERODED TO CREATE A
VOID UNDER THE BLANKET, OR THAT REMAIN DEVOID OF GRASS SHALL BE REPAIRED,
RESEEDED, AND MULCHED AND THE EROSION CONTROL BLANKET REINSTALLED.
DOZER TREADS CREATE
CLEAT IMPRINTS PARALLEL
TO THE SLOPE CONTOUR
SHOULD BE SEEDED AND
STABILIZED IMMEDIATELY
S
L
O
P
E
TRACKING
SURFACE ROUGHENING, FURROW TERRACING,
AND TRACKING
INSTALLATION:
1. TO SLOW EROSION, SURFACE
ROUGHENING, FURROW TERRACING,
AND/OR TRACKING SHOULD BE DONE
WITHIN 7 DAYS AFTER THE VEGETATION
HAS BEEN REMOVED FROM A SLOPE.
2. SURFACE ROUGHENING, FURROW
TERRACING, AND/OR TRACKING SHALL BE
PROVIDED ON ALL FINISHED GRADES
(SLOPES AND FLAT AREAS) WITHIN 2 DAYS
OF COMPLETION OF FINISHED GRADE
(FOR AREAS NOT RECEIVING TOPSOIL) OR
WITHIN 2 DAYS OF TOPSOIL PLACEMENT.
3. DISTURBED SURFACES SHALL BE
ROUGHENED USING ANY IMPLEMENT
THAT CAN BE SAFELY OPERATED ON THE
SLOPE AND WILL NOT CAUSE UNDUE
COMPACTION. AS FEW PASSES AS
POSSIBLE SHOULD BE MADE WITH THE
MACHINERY IN ORDER TO MINIMIZE
COMPACTION.
4. SURFACE ROUGHENING GROOVES
SHOULD BE A MINIMUM OF 3-INCHES DEEP
AND NO FURTHER THAN 15-INCHES
APART.
5. FURROW TERRACES SHOULD NOT BE
CONDUCTED WHEN THE GRADE EXCEEDS
3H:1V. FURROWS SHOULD BE A MINIMUM
OF 6-INCHES DEEP AND NO FARTHER
THAN 50-FEET APART.
6. AREAS THAT ARE GRADED IN THIS
MANNER SHOULD BE SEEDED WITHIN 14
DAYS.
INSPECTION AND MAINTENANCE:
1. INSPECTIONS SHOULD BE CONDUCTED IN
ACCORDANCE WITH SWPPP SCHEDULE*.
2. IF RILLS (SMALL WATERCOURSES THAT
HAVE STEEP SIDES) APPEAR. THEY
SHOULD BE RE-GRADED AND RE-SEEDED
IMMEDIATELY.
1
3
12" - 15"
3" MIN.
--
-
6" MIN.
6" MIN.
200' MAX.
50'
--
-
SURFACE ROUGHENING
FURROW TERRACING
STRING BINDER
UNDISTURBED
GROUND
FLOW
4" VERTICAL
FACE
NTS
BEDDING DETAIL
BOUND BALES
PLACED ON
CONTOUR
2 REBAR OR 2"X2" STAKES
DRIVEN 12"-18" INTO THE
GROUND, DRIVEN FLUSH
WITH THE TOP OF THE BALES
ANGLE FIRST STAKE
TOWARD PREVIOUSLY
PLACED BALE
ENTRENCH
BALES A MIN.
OF 4" INTO THE
GROUND
FLOW
UNDISTURBED
GROUND
NTS
ANCHORING DETAIL
STRAW BALE BARRIERS INSTALLATION:
1. BALES SHALL BE PLACED AT THE TOE OF A SLOPE, ON THE CONTOUR, AND IN A
ROW WITH THE ENDS OF EACH BALE TIGHTLY ABUTTING THE ADJACENT BALES.
2. EACH BALE SHALL BE ENTRENCHED IN THE SOIL A MINIMUM OF 4" AND PLACED
SO THE BINDINGS ARE HORIZONTAL.
3. BALES SHALL BE SECURELY ANCHORED IN PLACE BY EITHER TWO STAKES OR
RE-BARS DRIVEN THROUGH THE BALE 12" TO 18" INTO THE GROUND. THE
FIRST STAKE IN EACH BALE SHALL BE DRIVEN TOWARD THE PREVIOUSLY LAID
BALE AT AN ANGLE TO FORCE THE BALES TOGETHER. STAKES SHALL BE
DRIVEN FLUSH WITH THE TOP OF THE BALE.
INSPECTION AND MAINTENANCE:
1. STRAW BALE LINE SHALL BE INSPECTED FREQUENTLY AND AFTER STORM
EVENTS IN ACCORDANCE WITH SWPPP SCHEDULE*.
2. INSPECT STRAW BALE LINE FOR SEDIMENT ACCUMULATIONS AND REMOVE
SEDIMENT WHEN DEPTH REACHES
1
3
THE BARRIER HEIGHT.
3. REPLACE OR REPAIR DAMAGED BALES, WASHOUTS, OR OTHER DAMAGE AS
NEEDED.
4. BALES CAN BE SCATTERED WHEN THEIR FUNCTION AS A STORM WATER
BARRIER IS COMPLETE.
SEDIMENT TRAP
EROSION CONTROL BLANKET
SURFACE ROUGHENING
STRAW BALE BARRIER
SECTION
OUTLET
NTS
A
-
SECTION
SILT FENCE
NTS
SEE EXHIBIT 6 FOR INSTALLATION NOTES
B
-
DETAIL
SEDIMENT TRAP
NTS
1
-
DETAIL
EROSION CONTROL BLANKET
NTS
2
-
DETAIL
SURFACE ROUGHENING
NTS
3
-
DETAIL
STRAW BALE BARRIER
NTS
4
-
BMP LEGEND
BMP LEGEND
BMP LEGENDBMP LEGEND
DRAWING FILE NUMBER
3020 Bozeman Avenue(406) 443-4150
Helena, Montana 59601FIGURE
AUTOCAD 2000 DRAWING (DWG)BEST MANAGEMENT PRACTICES
STANDARD NOTES(SHEET 2 OF 4)
BLACK BUTTE COPPER PROJECTTINTINA RESOURCES
1104801H042
4.4
*INSPECTIONS WILL BE CONDUCTED WITHIN 72 HOURS OF
SIGNIFICANT RAINFALL (>0.5” OVER 24 HOURS) OR SNOWMELT
(PRODUCING DISCHARGE WITH EROSION), AND SELECTED
ROUTINE SCHEDULE, IN ACCORDANCE WITH THE SWPPP FOR
THE MULTI-SECTOR GENERAL PERMIT FOR STORM WATER
DISCHARGES ASSOCIATED WITH INDUSTRIAL ACTIVITY.
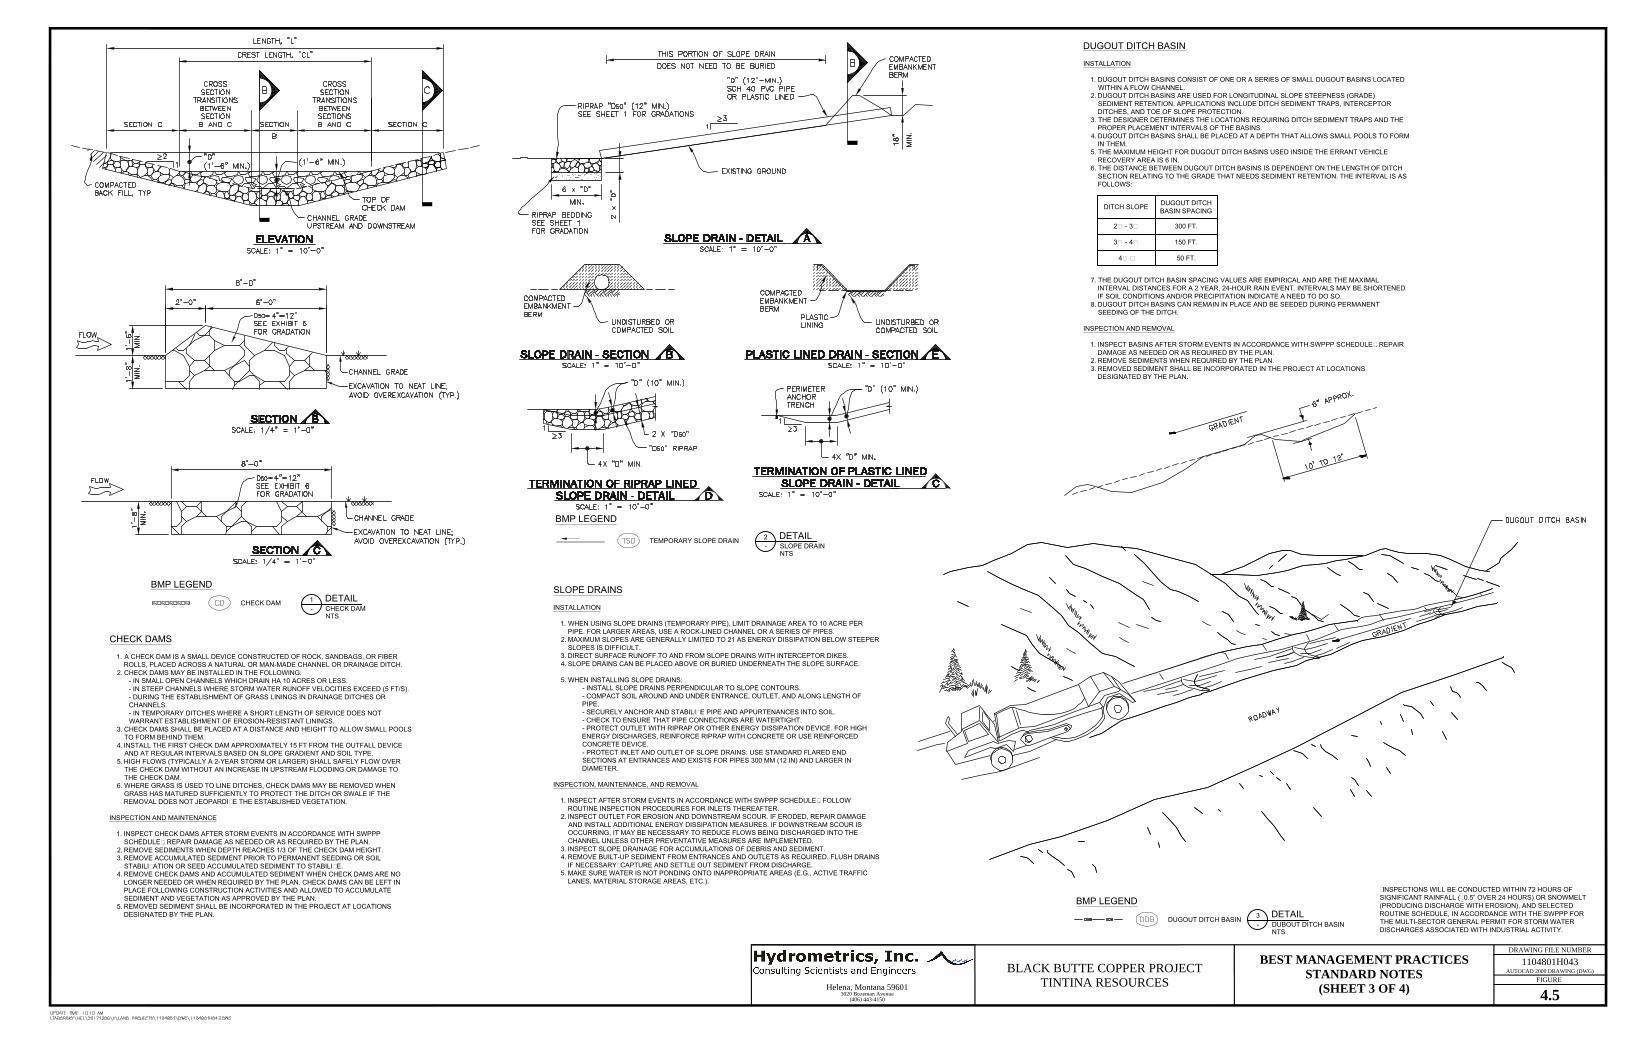
CHECK DAM
DUGOUT DITCH BASIN
TEMPORARY SLOPE DRAIN
DETAIL
CHECK DAM
NTS
1
-
BMP LEGEND
DETAIL
SLOPE DRAIN
NTS
2
-
DETAIL
DUBOUT DITCH BASIN
NTS
3
-
BMP LEGEND
BMP LEGEND
DUGOUT DITCH BASIN
INSTALLATION
1. DUGOUT DITCH BASINS CONSIST OF ONE OR A SERIES OF SMALL DUGOUT BASINS LOCATED
WITHIN A FLOW CHANNEL.
2. DUGOUT DITCH BASINS ARE USED FOR LONGITUDINAL SLOPE STEEPNESS (GRADE)
SEDIMENT RETENTION. APPLICATIONS INCLUDE DITCH SEDIMENT TRAPS, INTERCEPTOR
DITCHES, AND TOE OF SLOPE PROTECTION.
3. THE DESIGNER DETERMINES THE LOCATIONS REQUIRING DITCH SEDIMENT TRAPS AND THE
PROPER PLACEMENT INTERVALS OF THE BASINS.
4. DUGOUT DITCH BASINS SHALL BE PLACED AT A DEPTH THAT ALLOWS SMALL POOLS TO FORM
IN THEM.
5. THE MAXIMUM HEIGHT FOR DUGOUT DITCH BASINS USED INSIDE THE ERRANT VEHICLE
RECOVERY AREA IS 6 IN.
6. THE DISTANCE BETWEEN DUGOUT DITCH BASINS IS DEPENDENT ON THE LENGTH OF DITCH
SECTION RELATING TO THE GRADE THAT NEEDS SEDIMENT RETENTION. THE INTERVAL IS AS
FOLLOWS:
7. THE DUGOUT DITCH BASIN SPACING VALUES ARE EMPIRICAL AND ARE THE MAXIMAL
INTERVAL DISTANCES FOR A 2 YEAR, 24-HOUR RAIN EVENT. INTERVALS MAY BE SHORTENED
IF SOIL CONDITIONS AND/OR PRECIPITATION INDICATE A NEED TO DO SO.
8. DUGOUT DITCH BASINS CAN REMAIN IN PLACE AND BE SEEDED DURING PERMANENT
SEEDING OF THE DITCH.
INSPECTION AND REMOVAL
1. INSPECT BASINS AFTER STORM EVENTS IN ACCORDANCE WITH SWPPP SCHEDULE*. REPAIR
DAMAGE AS NEEDED OR AS REQUIRED BY THE PLAN.
2. REMOVE SEDIMENTS WHEN REQUIRED BY THE PLAN.
3. REMOVED SEDIMENT SHALL BE INCORPORATED IN THE PROJECT AT LOCATIONS
DESIGNATED BY THE PLAN.
DITCH SLOPE
DUGOUT DITCH
BASIN SPACING
2% - 3% 300 FT.
3% - 4% 150 FT.
4% + 50 FT.
SLOPE DRAINS
INSTALLATION
1. WHEN USING SLOPE DRAINS (TEMPORARY PIPE), LIMIT DRAINAGE AREA TO 10 ACRE PER
PIPE. FOR LARGER AREAS, USE A ROCK-LINED CHANNEL OR A SERIES OF PIPES.
2. MAXIMUM SLOPES ARE GENERALLY LIMITED TO 21 AS ENERGY DISSIPATION BELOW STEEPER
SLOPES IS DIFFICULT.
3. DIRECT SURFACE RUNOFF TO AND FROM SLOPE DRAINS WITH INTERCEPTOR DIKES.
4. SLOPE DRAINS CAN BE PLACED ABOVE OR BURIED UNDERNEATH THE SLOPE SURFACE.
5. WHEN INSTALLING SLOPE DRAINS:
- INSTALL SLOPE DRAINS PERPENDICULAR TO SLOPE CONTOURS.
- COMPACT SOIL AROUND AND UNDER ENTRANCE, OUTLET, AND ALONG LENGTH OF
PIPE.
- SECURELY ANCHOR AND STABILIZE PIPE AND APPURTENANCES INTO SOIL.
- CHECK TO ENSURE THAT PIPE CONNECTIONS ARE WATERTIGHT.
- PROTECT OUTLET WITH RIPRAP OR OTHER ENERGY DISSIPATION DEVICE. FOR HIGH
ENERGY DISCHARGES, REINFORCE RIPRAP WITH CONCRETE OR USE REINFORCED
CONCRETE DEVICE.
- PROTECT INLET AND OUTLET OF SLOPE DRAINS: USE STANDARD FLARED END
SECTIONS AT ENTRANCES AND EXISTS FOR PIPES 300 MM (12 IN) AND LARGER IN
DIAMETER.
INSPECTION, MAINTENANCE, AND REMOVAL
1. INSPECT AFTER STORM EVENTS IN ACCORDANCE WITH SWPPP SCHEDULE*. FOLLOW
ROUTINE INSPECTION PROCEDURES FOR INLETS THEREAFTER.
2. INSPECT OUTLET FOR EROSION AND DOWNSTREAM SCOUR. IF ERODED, REPAIR DAMAGE
AND INSTALL ADDITIONAL ENERGY DISSIPATION MEASURES. IF DOWNSTREAM SCOUR IS
OCCURRING, IT MAY BE NECESSARY TO REDUCE FLOWS BEING DISCHARGED INTO THE
CHANNEL UNLESS OTHER PREVENTATIVE MEASURES ARE IMPLEMENTED.
3. INSPECT SLOPE DRAINAGE FOR ACCUMULATIONS OF DEBRIS AND SEDIMENT.
4. REMOVE BUILT-UP SEDIMENT FROM ENTRANCES AND OUTLETS AS REQUIRED. FLUSH DRAINS
IF NECESSARY; CAPTURE AND SETTLE OUT SEDIMENT FROM DISCHARGE.
5. MAKE SURE WATER IS NOT PONDING ONTO INAPPROPRIATE AREAS (E.G., ACTIVE TRAFFIC
LANES, MATERIAL STORAGE AREAS, ETC.).
CHECK DAMS
1. A CHECK DAM IS A SMALL DEVICE CONSTRUCTED OF ROCK, SANDBAGS, OR FIBER
ROLLS, PLACED ACROSS A NATURAL OR MAN-MADE CHANNEL OR DRAINAGE DITCH.
2. CHECK DAMS MAY BE INSTALLED IN THE FOLLOWING:
- IN SMALL OPEN CHANNELS WHICH DRAIN HA 10 ACRES OR LESS.
- IN STEEP CHANNELS WHERE STORM WATER RUNOFF VELOCITIES EXCEED (5 FT/S).
- DURING THE ESTABLISHMENT OF GRASS LININGS IN DRAINAGE DITCHES OR
CHANNELS.
- IN TEMPORARY DITCHES WHERE A SHORT LENGTH OF SERVICE DOES NOT
WARRANT ESTABLISHMENT OF EROSION-RESISTANT LININGS.
3. CHECK DAMS SHALL BE PLACED AT A DISTANCE AND HEIGHT TO ALLOW SMALL POOLS
TO FORM BEHIND THEM.
4. INSTALL THE FIRST CHECK DAM APPROXIMATELY 15 FT FROM THE OUTFALL DEVICE
AND AT REGULAR INTERVALS BASED ON SLOPE GRADIENT AND SOIL TYPE.
5. HIGH FLOWS (TYPICALLY A 2-YEAR STORM OR LARGER) SHALL SAFELY FLOW OVER
THE CHECK DAM WITHOUT AN INCREASE IN UPSTREAM FLOODING OR DAMAGE TO
THE CHECK DAM.
6. WHERE GRASS IS USED TO LINE DITCHES, CHECK DAMS MAY BE REMOVED WHEN
GRASS HAS MATURED SUFFICIENTLY TO PROTECT THE DITCH OR SWALE IF THE
REMOVAL DOES NOT JEOPARDIZE THE ESTABLISHED VEGETATION.
INSPECTION AND MAINTENANCE
1. INSPECT CHECK DAMS AFTER STORM EVENTS IN ACCORDANCE WITH SWPPP
SCHEDULE*. REPAIR DAMAGE AS NEEDED OR AS REQUIRED BY THE PLAN.
2. REMOVE SEDIMENTS WHEN DEPTH REACHES 1/3 OF THE CHECK DAM HEIGHT.
3. REMOVE ACCUMULATED SEDIMENT PRIOR TO PERMANENT SEEDING OR SOIL
STABILIZATION OR SEED ACCUMULATED SEDIMENT TO STABILIZE.
4. REMOVE CHECK DAMS AND ACCUMULATED SEDIMENT WHEN CHECK DAMS ARE NO
LONGER NEEDED OR WHEN REQUIRED BY THE PLAN. CHECK DAMS CAN BE LEFT IN
PLACE FOLLOWING CONSTRUCTION ACTIVITIES AND ALLOWED TO ACCUMULATE
SEDIMENT AND VEGETATION AS APPROVED BY THE PLAN.
5. REMOVED SEDIMENT SHALL BE INCORPORATED IN THE PROJECT AT LOCATIONS
DESIGNATED BY THE PLAN.
DRAWING FILE NUMBER
3020 Bozeman Avenue(406) 443-4150
Helena, Montana 59601FIGURE
AUTOCAD 2000 DRAWING (DWG)BEST MANAGEMENT PRACTICES
STANDARD NOTES(SHEET 3 OF 4)
BLACK BUTTE COPPER PROJECTTINTINA RESOURCES
1104801H043
4.5
*INSPECTIONS WILL BE CONDUCTED WITHIN 72 HOURS OF
SIGNIFICANT RAINFALL (>0.5” OVER 24 HOURS) OR SNOWMELT
(PRODUCING DISCHARGE WITH EROSION), AND SELECTED
ROUTINE SCHEDULE, IN ACCORDANCE WITH THE SWPPP FOR
THE MULTI-SECTOR GENERAL PERMIT FOR STORM WATER
DISCHARGES ASSOCIATED WITH INDUSTRIAL ACTIVITY.
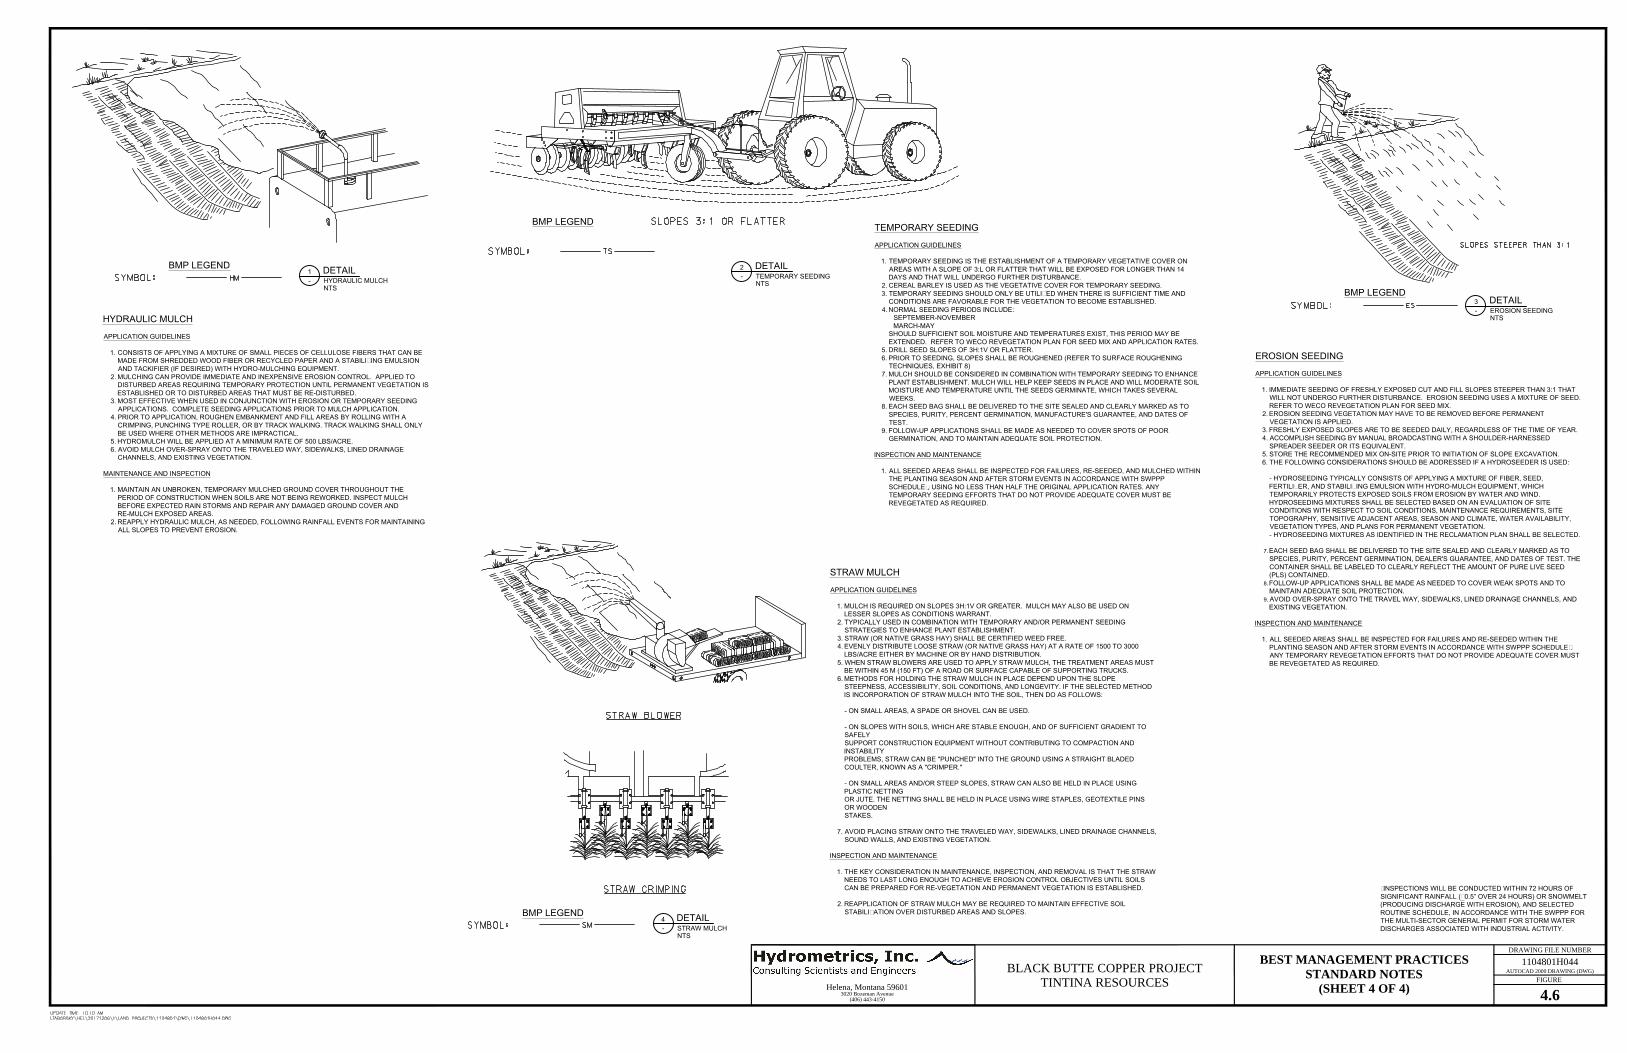
TEMPORARY SEEDING
APPLICATION GUIDELINES
1. TEMPORARY SEEDING IS THE ESTABLISHMENT OF A TEMPORARY VEGETATIVE COVER ON
AREAS WITH A SLOPE OF 3:L OR FLATTER THAT WILL BE EXPOSED FOR LONGER THAN 14
DAYS AND THAT WILL UNDERGO FURTHER DISTURBANCE.
2. CEREAL BARLEY IS USED AS THE VEGETATIVE COVER FOR TEMPORARY SEEDING.
3. TEMPORARY SEEDING SHOULD ONLY BE UTILIZED WHEN THERE IS SUFFICIENT TIME AND
CONDITIONS ARE FAVORABLE FOR THE VEGETATION TO BECOME ESTABLISHED.
4. NORMAL SEEDING PERIODS INCLUDE:
SEPTEMBER-NOVEMBER
MARCH-MAY
SHOULD SUFFICIENT SOIL MOISTURE AND TEMPERATURES EXIST, THIS PERIOD MAY BE
EXTENDED. REFER TO WECO REVEGETATION PLAN FOR SEED MIX AND APPLICATION RATES.
5. DRILL SEED SLOPES OF 3H:1V OR FLATTER.
6. PRIOR TO SEEDING, SLOPES SHALL BE ROUGHENED (REFER TO SURFACE ROUGHENING
TECHNIQUES, EXHIBIT 8)
7. MULCH SHOULD BE CONSIDERED IN COMBINATION WITH TEMPORARY SEEDING TO ENHANCE
PLANT ESTABLISHMENT. MULCH WILL HELP KEEP SEEDS IN PLACE AND WILL MODERATE SOIL
MOISTURE AND TEMPERATURE UNTIL THE SEEDS GERMINATE, WHICH TAKES SEVERAL
WEEKS.
8. EACH SEED BAG SHALL BE DELIVERED TO THE SITE SEALED AND CLEARLY MARKED AS TO
SPECIES, PURITY, PERCENT GERMINATION, MANUFACTURE'S GUARANTEE, AND DATES OF
TEST.
9. FOLLOW-UP APPLICATIONS SHALL BE MADE AS NEEDED TO COVER SPOTS OF POOR
GERMINATION, AND TO MAINTAIN ADEQUATE SOIL PROTECTION.
INSPECTION AND MAINTENANCE
1. ALL SEEDED AREAS SHALL BE INSPECTED FOR FAILURES, RE-SEEDED, AND MULCHED WITHIN
THE PLANTING SEASON AND AFTER STORM EVENTS IN ACCORDANCE WITH SWPPP
SCHEDULE*, USING NO LESS THAN HALF THE ORIGINAL APPLICATION RATES. ANY
TEMPORARY SEEDING EFFORTS THAT DO NOT PROVIDE ADEQUATE COVER MUST BE
REVEGETATED AS REQUIRED.
EROSION SEEDING
APPLICATION GUIDELINES
1. IMMEDIATE SEEDING OF FRESHLY EXPOSED CUT AND FILL SLOPES STEEPER THAN 3:1 THAT
WILL NOT UNDERGO FURTHER DISTURBANCE. EROSION SEEDING USES A MIXTURE OF SEED.
REFER TO WECO REVEGETATION PLAN FOR SEED MIX.
2. EROSION SEEDING VEGETATION MAY HAVE TO BE REMOVED BEFORE PERMANENT
VEGETATION IS APPLIED.
3. FRESHLY EXPOSED SLOPES ARE TO BE SEEDED DAILY, REGARDLESS OF THE TIME OF YEAR.
4. ACCOMPLISH SEEDING BY MANUAL BROADCASTING WITH A SHOULDER-HARNESSED
SPREADER SEEDER OR ITS EQUIVALENT.
5. STORE THE RECOMMENDED MIX ON-SITE PRIOR TO INITIATION OF SLOPE EXCAVATION.
6. THE FOLLOWING CONSIDERATIONS SHOULD BE ADDRESSED IF A HYDROSEEDER IS USED:
- HYDROSEEDING TYPICALLY CONSISTS OF APPLYING A MIXTURE OF FIBER, SEED,
FERTILIZER, AND STABILIZING EMULSION WITH HYDRO-MULCH EQUIPMENT, WHICH
TEMPORARILY PROTECTS EXPOSED SOILS FROM EROSION BY WATER AND WIND.
HYDROSEEDING MIXTURES SHALL BE SELECTED BASED ON AN EVALUATION OF SITE
CONDITIONS WITH RESPECT TO SOIL CONDITIONS, MAINTENANCE REQUIREMENTS, SITE
TOPOGRAPHY, SENSITIVE ADJACENT AREAS, SEASON AND CLIMATE, WATER AVAILABILITY,
VEGETATION TYPES, AND PLANS FOR PERMANENT VEGETATION.
- HYDROSEEDING MIXTURES AS IDENTIFIED IN THE RECLAMATION PLAN SHALL BE SELECTED.
7.EACH SEED BAG SHALL BE DELIVERED TO THE SITE SEALED AND CLEARLY MARKED AS TO
SPECIES, PURITY, PERCENT GERMINATION, DEALER'S GUARANTEE, AND DATES OF TEST. THE
CONTAINER SHALL BE LABELED TO CLEARLY REFLECT THE AMOUNT OF PURE LIVE SEED
(PLS) CONTAINED.
8.FOLLOW-UP APPLICATIONS SHALL BE MADE AS NEEDED TO COVER WEAK SPOTS AND TO
MAINTAIN ADEQUATE SOIL PROTECTION.
9. AVOID OVER-SPRAY ONTO THE TRAVEL WAY, SIDEWALKS, LINED DRAINAGE CHANNELS, AND
EXISTING VEGETATION.
INSPECTION AND MAINTENANCE
1. ALL SEEDED AREAS SHALL BE INSPECTED FOR FAILURES AND RE-SEEDED WITHIN THE
PLANTING SEASON AND AFTER STORM EVENTS IN ACCORDANCE WITH SWPPP SCHEDULE*.
ANY TEMPORARY REVEGETATION EFFORTS THAT DO NOT PROVIDE ADEQUATE COVER MUST
BE REVEGETATED AS REQUIRED.
HYDRAULIC MULCH
APPLICATION GUIDELINES
1. CONSISTS OF APPLYING A MIXTURE OF SMALL PIECES OF CELLULOSE FIBERS THAT CAN BE
MADE FROM SHREDDED WOOD FIBER OR RECYCLED PAPER AND A STABILIZING EMULSION
AND TACKIFIER (IF DESIRED) WITH HYDRO-MULCHING EQUIPMENT.
2. MULCHING CAN PROVIDE IMMEDIATE AND INEXPENSIVE EROSION CONTROL. APPLIED TO
DISTURBED AREAS REQUIRING TEMPORARY PROTECTION UNTIL PERMANENT VEGETATION IS
ESTABLISHED OR TO DISTURBED AREAS THAT MUST BE RE-DISTURBED.
3. MOST EFFECTIVE WHEN USED IN CONJUNCTION WITH EROSION OR TEMPORARY SEEDING
APPLICATIONS. COMPLETE SEEDING APPLICATIONS PRIOR TO MULCH APPLICATION.
4. PRIOR TO APPLICATION, ROUGHEN EMBANKMENT AND FILL AREAS BY ROLLING WITH A
CRIMPING, PUNCHING TYPE ROLLER, OR BY TRACK WALKING. TRACK WALKING SHALL ONLY
BE USED WHERE OTHER METHODS ARE IMPRACTICAL.
5. HYDROMULCH WILL BE APPLIED AT A MINIMUM RATE OF 500 LBS/ACRE.
6. AVOID MULCH OVER-SPRAY ONTO THE TRAVELED WAY, SIDEWALKS, LINED DRAINAGE
CHANNELS, AND EXISTING VEGETATION.
MAINTENANCE AND INSPECTION
1. MAINTAIN AN UNBROKEN, TEMPORARY MULCHED GROUND COVER THROUGHOUT THE
PERIOD OF CONSTRUCTION WHEN SOILS ARE NOT BEING REWORKED. INSPECT MULCH
BEFORE EXPECTED RAIN STORMS AND REPAIR ANY DAMAGED GROUND COVER AND
RE-MULCH EXPOSED AREAS.
2. REAPPLY HYDRAULIC MULCH, AS NEEDED, FOLLOWING RAINFALL EVENTS FOR MAINTAINING
ALL SLOPES TO PREVENT EROSION.
STRAW MULCH
APPLICATION GUIDELINES
1. MULCH IS REQUIRED ON SLOPES 3H:1V OR GREATER. MULCH MAY ALSO BE USED ON
LESSER SLOPES AS CONDITIONS WARRANT.
2. TYPICALLY USED IN COMBINATION WITH TEMPORARY AND/OR PERMANENT SEEDING
STRATEGIES TO ENHANCE PLANT ESTABLISHMENT.
3. STRAW (OR NATIVE GRASS HAY) SHALL BE CERTIFIED WEED FREE.
4. EVENLY DISTRIBUTE LOOSE STRAW (OR NATIVE GRASS HAY) AT A RATE OF 1500 TO 3000
LBS/ACRE EITHER BY MACHINE OR BY HAND DISTRIBUTION.
5. WHEN STRAW BLOWERS ARE USED TO APPLY STRAW MULCH, THE TREATMENT AREAS MUST
BE WITHIN 45 M (150 FT) OF A ROAD OR SURFACE CAPABLE OF SUPPORTING TRUCKS.
6. METHODS FOR HOLDING THE STRAW MULCH IN PLACE DEPEND UPON THE SLOPE
STEEPNESS, ACCESSIBILITY, SOIL CONDITIONS, AND LONGEVITY. IF THE SELECTED METHOD
IS INCORPORATION OF STRAW MULCH INTO THE SOIL, THEN DO AS FOLLOWS:
- ON SMALL AREAS, A SPADE OR SHOVEL CAN BE USED.
- ON SLOPES WITH SOILS, WHICH ARE STABLE ENOUGH, AND OF SUFFICIENT GRADIENT TO
SAFELY
SUPPORT CONSTRUCTION EQUIPMENT WITHOUT CONTRIBUTING TO COMPACTION AND
INSTABILITY
PROBLEMS, STRAW CAN BE "PUNCHED" INTO THE GROUND USING A STRAIGHT BLADED
COULTER, KNOWN AS A "CRIMPER."
- ON SMALL AREAS AND/OR STEEP SLOPES, STRAW CAN ALSO BE HELD IN PLACE USING
PLASTIC NETTING
OR JUTE. THE NETTING SHALL BE HELD IN PLACE USING WIRE STAPLES, GEOTEXTILE PINS
OR WOODEN
STAKES.
7. AVOID PLACING STRAW ONTO THE TRAVELED WAY, SIDEWALKS, LINED DRAINAGE CHANNELS,
SOUND WALLS, AND EXISTING VEGETATION.
INSPECTION AND MAINTENANCE
1. THE KEY CONSIDERATION IN MAINTENANCE, INSPECTION, AND REMOVAL IS THAT THE STRAW
NEEDS TO LAST LONG ENOUGH TO ACHIEVE EROSION CONTROL OBJECTIVES UNTIL SOILS
CAN BE PREPARED FOR RE-VEGETATION AND PERMANENT VEGETATION IS ESTABLISHED.
2. REAPPLICATION OF STRAW MULCH MAY BE REQUIRED TO MAINTAIN EFFECTIVE SOIL
STABILIZATION OVER DISTURBED AREAS AND SLOPES.
DETAIL
HYDRAULIC MULCH
NTS
1
-
BMP LEGEND
DETAIL
EROSION SEEDING
NTS
3
-
BMP LEGEND
DETAIL
TEMPORARY SEEDING
NTS
2
-
BMP LEGEND
DETAIL
STRAW MULCH
NTS
4
-
BMP LEGEND
DRAWING FILE NUMBER
3020 Bozeman Avenue(406) 443-4150
Helena, Montana 59601FIGURE
AUTOCAD 2000 DRAWING (DWG)BEST MANAGEMENT PRACTICES
STANDARD NOTES(SHEET 4 OF 4)
BLACK BUTTE COPPER PROJECTTINTINA RESOURCES
1104801H044
4.6
*INSPECTIONS WILL BE CONDUCTED WITHIN 72 HOURS OF
SIGNIFICANT RAINFALL (>0.5” OVER 24 HOURS) OR SNOWMELT
(PRODUCING DISCHARGE WITH EROSION), AND SELECTED
ROUTINE SCHEDULE, IN ACCORDANCE WITH THE SWPPP FOR
THE MULTI-SECTOR GENERAL PERMIT FOR STORM WATER
DISCHARGES ASSOCIATED WITH INDUSTRIAL ACTIVITY.
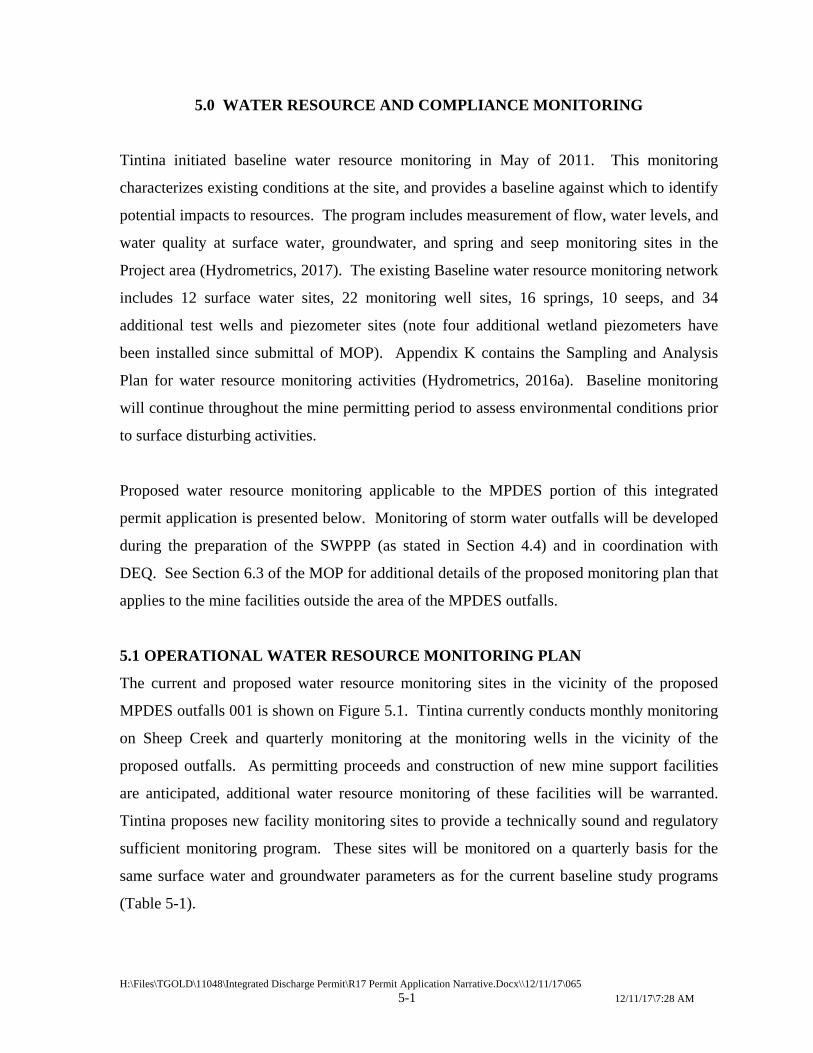
H:\Files\TGOLD\11048\Integrated Discharge Permit\R17 Permit Application Narrative.Docx\\12/11/17\065
5-1 12/11/17\7:28 AM
5.0 WATER RESOURCE AND COMPLIANCE MONITORING
Tintina initiated baseline water resource monitoring in May of 2011. This monitoring
characterizes existing conditions at the site, and provides a baseline against which to identify
potential impacts to resources. The program includes measurement of flow, water levels, and
water quality at surface water, groundwater, and spring and seep monitoring sites in the
Project area (Hydrometrics, 2017). The existing Baseline water resource monitoring network
includes 12 surface water sites, 22 monitoring well sites, 16 springs, 10 seeps, and 34
additional test wells and piezometer sites (note four additional wetland piezometers have
been installed since submittal of MOP). Appendix K contains the Sampling and Analysis
Plan for water resource monitoring activities (Hydrometrics, 2016a). Baseline monitoring
will continue throughout the mine permitting period to assess environmental conditions prior
to surface disturbing activities.
Proposed water resource monitoring applicable to the MPDES portion of this integrated
permit application is presented below. Monitoring of storm water outfalls will be developed
during the preparation of the SWPPP (as stated in Section 4.4) and in coordination with
DEQ. See Section 6.3 of the MOP for additional details of the proposed monitoring plan that
applies to the mine facilities outside the area of the MPDES outfalls.
5.1 OPERATIONAL WATER RESOURCE MONITORING PLAN
The current and proposed water resource monitoring sites in the vicinity of the proposed
MPDES outfalls 001 is shown on Figure 5.1. Tintina currently conducts monthly monitoring
on Sheep Creek and quarterly monitoring at the monitoring wells in the vicinity of the
proposed outfalls. As permitting proceeds and construction of new mine support facilities
are anticipated, additional water resource monitoring of these facilities will be warranted.
Tintina proposes new facility monitoring sites to provide a technically sound and regulatory
sufficient monitoring program. These sites will be monitored on a quarterly basis for the
same surface water and groundwater parameters as for the current baseline study programs
(Table 5-1).
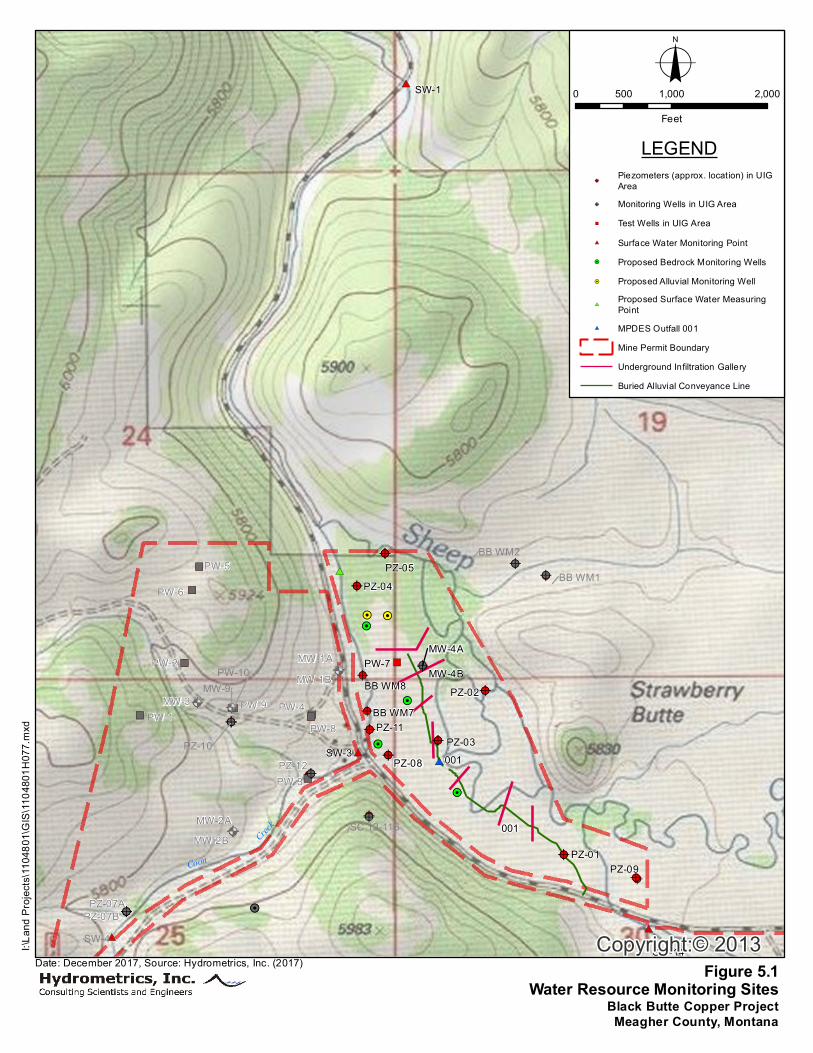
#*
!H
!H
!H
!H
!H
#*#*
#*
#*
@?
@?
@?
@?
@?
@?
@?
@?
@?
@?
@?
@?@?
@?
@?
@?
@?
#*
")
")
")
")
")
")
")")")
")
@?
@?
@?@?
@?
@?@?
@?
@?
@?
@?
@?
@?
@?
@?
@?
@?@?
@?
@?
@?
@?
@?
@A
@A
")
")
")
")
")
")")")
")
@A
@A
@A@A
@A
@?@?
@?
@?
!H
@A
!H !H
PW-8PW-9 PW-4
PW-2
PW-1
PW-3
PW-5
PW-7
PW-6
PW-10MW-9
MW-7
MW-8
MW-3
MW-4B
MW-4A
MW-2A
MW-1AMW-1B
MW-2B
MW-6A/6B
MW-14
SC15-194
SC15-198
PZ-11
PZ-12PZ-10
PZ-09
PZ-08
PZ-05PZ-04
PZ-02
PZ-01
PZ-07APZ-07B
PZ-03
001
001
SW-3
SW-14
SW-6
SW-4
SW-1
BB WM5
BB WM6
BB WM7
BB WM8
BB WM2
BB WM1
SC 12-116
001
Copyright:© 2013
Coon
I:\Lan
d Proj
ects\
1104
801\G
IS\11
0480
1H07
7.mxd
Water Resource Monitoring SitesBlack Butte Copper ProjectMeagher County, Montana
Creek
Figure 5.1Date: December 2017, Source: Hydrometrics, Inc. (2017)
LEGEND@?
Piezometers (approx. location) in UIGArea
@? Monitoring Wells in UIG Area") Test Wells in UIG Area#* Surface Water Monitoring Point!H Proposed Bedrock Monitoring Wells!H Proposed Alluvial Monitoring Well
#*Proposed Surface Water MeasuringPoint
#* MPDES Outfall 001Mine Permit BoundaryUnderground Infiltration GalleryBuried Alluvial Conveyance Line
o0 1,000 2,000500
Feet
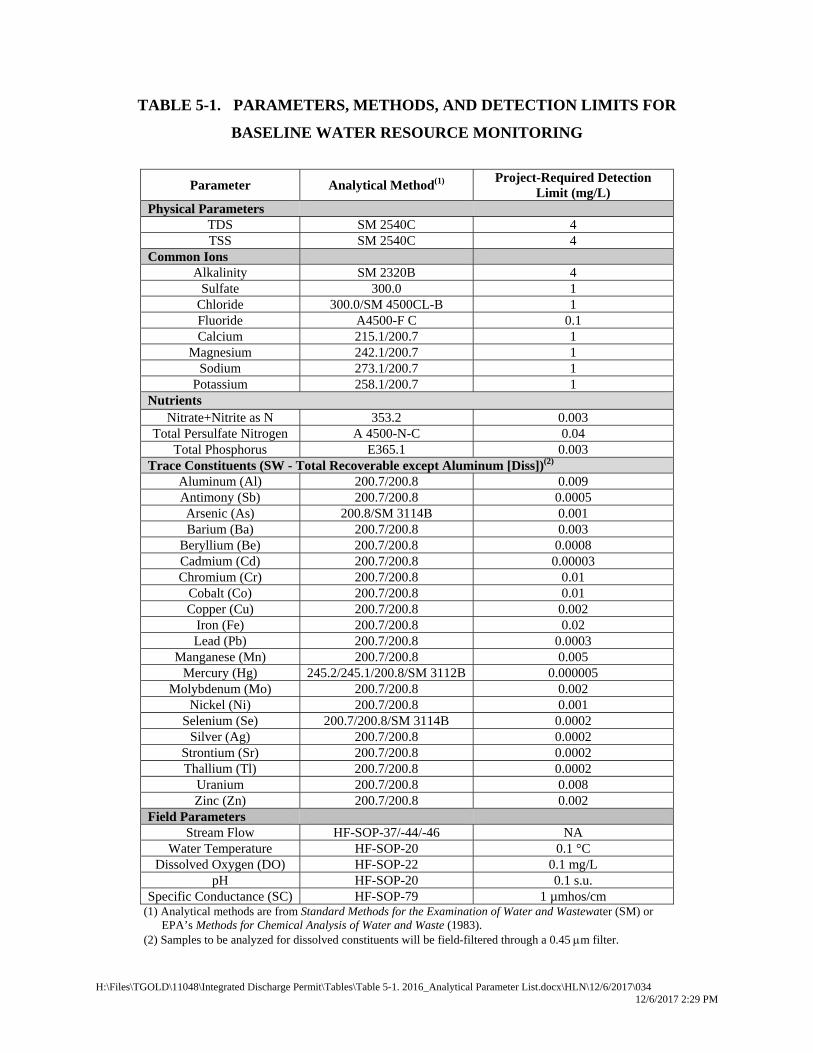
H:\Files\TGOLD\11048\Integrated Discharge Permit\Tables\Table 5-1. 2016_Analytical Parameter List.docx\HLN\12/6/2017\034 12/6/2017 2:29 PM
TABLE 5-1. PARAMETERS, METHODS, AND DETECTION LIMITS FOR
BASELINE WATER RESOURCE MONITORING
Parameter Analytical Method(1) Project-Required Detection
Limit (mg/L) Physical Parameters
TDS SM 2540C 4 TSS SM 2540C 4
Common Ions Alkalinity SM 2320B 4
Sulfate 300.0 1 Chloride 300.0/SM 4500CL-B 1 Fluoride A4500-F C 0.1 Calcium 215.1/200.7 1
Magnesium 242.1/200.7 1 Sodium 273.1/200.7 1
Potassium 258.1/200.7 1 Nutrients
Nitrate+Nitrite as N 353.2 0.003 Total Persulfate Nitrogen A 4500-N-C 0.04
Total Phosphorus E365.1 0.003 Trace Constituents (SW - Total Recoverable except Aluminum [Diss])(2)
Aluminum (Al) 200.7/200.8 0.009 Antimony (Sb) 200.7/200.8 0.0005 Arsenic (As) 200.8/SM 3114B 0.001 Barium (Ba) 200.7/200.8 0.003
Beryllium (Be) 200.7/200.8 0.0008 Cadmium (Cd) 200.7/200.8 0.00003 Chromium (Cr) 200.7/200.8 0.01
Cobalt (Co) 200.7/200.8 0.01 Copper (Cu) 200.7/200.8 0.002
Iron (Fe) 200.7/200.8 0.02 Lead (Pb) 200.7/200.8 0.0003
Manganese (Mn) 200.7/200.8 0.005 Mercury (Hg) 245.2/245.1/200.8/SM 3112B 0.000005
Molybdenum (Mo) 200.7/200.8 0.002 Nickel (Ni) 200.7/200.8 0.001
Selenium (Se) 200.7/200.8/SM 3114B 0.0002 Silver (Ag) 200.7/200.8 0.0002
Strontium (Sr) 200.7/200.8 0.0002 Thallium (Tl) 200.7/200.8 0.0002
Uranium 200.7/200.8 0.008 Zinc (Zn) 200.7/200.8 0.002
Field Parameters Stream Flow HF-SOP-37/-44/-46 NA
Water Temperature HF-SOP-20 0.1 °C Dissolved Oxygen (DO) HF-SOP-22 0.1 mg/L
pH HF-SOP-20 0.1 s.u. Specific Conductance (SC) HF-SOP-79 1 µmhos/cm
(1) Analytical methods are from Standard Methods for the Examination of Water and Wastewater (SM) or EPA’s Methods for Chemical Analysis of Water and Waste (1983).
(2) Samples to be analyzed for dissolved constituents will be field-filtered through a 0.45 m filter.
H:\Files\TGOLD\11048\Integrated Discharge Permit\R17 Permit Application Narrative.Docx\\12/11/17\065
5-4 12/11/17\7:28 AM
Existing piezometers will service the alluvial infiltration gallery. During operations
underground infiltration gallery site will be visually inspected to ensure that surface ponding,
seep and spring development, and surface water run-off is not occurring. The piezometers
water levels will be used to track groundwater mounding and to avoid soil saturation. It is
expected that monthly adjustments will be required to the amount / time water is applied to
each arm of the UIG. Because the mine discharge rate is expected to be low during the initial
first two year of development (<300 gpm), there will be an opportunity to better understand
and calibrate infiltration rates and cell rotation using piezometer water level measurements of
soil saturation. Piezometers in Outfall 001) will be monitored monthly, and areas with active
discharge will initially be monitored weekly until such time that DEQ determines sampling
frequency can be decreased. Two additional groundwater monitoring wells are proposed in
the Sheep Creek alluvial system as part of this MPDES permit. These wells will be sited 500
feet down gradient from the last UIG in the alluvial system. These wells will be completed
and screened across first water contact and monitored at the frequency necessary to
determine permit compliance.
Tintina has been conducting water resource monitoring at two upgradient sites and one
downgradient site on Sheep Creek since 2011. There is about six years of baseline data
(monthly since 2012) at the downgradient site (SW-1) on Sheep Creek, which includes a
gaging station to collect continuous streamflow measurements. Tintina proposes to use site
SW-1 to monitor surface water quality downgradient of the proposed mixing zone. This site
is appropriate as there is a robust baseline dataset already established and there are no
tributaries between the proposed mixing zone and Sheep Creek.
5.2 WATER TREATMENT PLANT EFFLUENT COMPLIANCE MONITORING
Tintina proposes to conduct compliance monitoring of the end of the WTP after the polishing
phase and prior to entering the pipeline to the MPDES Outfalls. In the MOP application, the
compliance monitoring schedule for the water treatment effluent was initially proposed to be
at a weekly basis in the MOP. Tintina would like to work with DEQ-WPB to establish a
more comprehensive compliance monitoring program to establish detailed schedule that may
vary for specific parameters.

H:\Files\TGOLD\11048\Integrated Discharge Permit\R17 Permit Application Narrative.Docx\\12/11/17\065
5-5 12/11/17\7:28 AM
5.3 TRIGGER LEVEL VALUES FOR IMPLEMENTATION OF MITIGATIONS
AND DEQ NOTIFICATIONS
Tintina will notify DEQ within 48 hours if any of the monitoring results indicate an operating
condition outside the permitted effluent limits. If a preliminary laboratory report showing
that a contaminant has exceeded local background non-degradation criteria for groundwater
at any of the groundwater monitoring sites is received, Tintina will notify DEQ within 48
hours and submit a corrective action plan for addressing the exceedance.

H:\Files\TGOLD\11048\Integrated Discharge Permit\R17 Permit Application Narrative.Docx\\12/11/17\065
6-1 12/11/17\7:28 AM
6.0 SAGE GROUSE
The greater sage-grouse (sage-grouse) is considered to be a sagebrush-dependent species
(e.g., Connelly et al., 2011). There are known sage-grouse leks (display sites) 10 to 13 miles
from the Project area, but there are no known occurrences recorded within 10 miles
(MTNHP, 2015).
H:\Files\TGOLD\11048\Integrated Discharge Permit\R17 Permit Application Narrative.Docx\\12/11/17\065
8-1 12/11/17\7:28 AM
8.0 REFERENCES
Amec Foster Wheeler, 2017a. Technical Memo: Water Treatment Plant Modeling for Black Butte Copper Project. May 2, 2017. In Appendix V of the MOP application document (Revision 3, July 14, 2017).
Amec Foster Wheeler, 2017b. Technical Memo: Projected Removal of Trace Metals in RO
System, Tintina Montana Mine Operating Permit. September 26, 2017. In Appendix B of the 2017 Integrated Discharge Permit application narrative.
Baker, C., 2017. Baseline Soils Report Black Butte Copper Project. Helena, MT 59604:
WESTECH Environmental Services. In Appendix E of the MOP application document (Revision 3, July 14, 2017).
Bison Engineering, 2012 through 2016. Quarterly Reports of daily data from the second
quarter of 2012 to the second quarter of 2016. In Appendix A (A-1) of the MOP application document (Revision 3, July 14, 2017).
Connelly, J.W., E.T. Rinkes and C.E. Braun. 2011. Characteristics of greater sage grouse
habitats. In S.T. Knick and J.W. Connelly (eds.). Greater sage grouse: ecology and conservation of landscape species and its habitats. Cooper Ornith. Soc., Univ. California Press.
DEQ, 2017. Pre-application meeting follow-up; Montana Pollutant Discharge Elimination
System (MPDES) for Tintina Montana Black Butte Copper Project. Correspondence to Jim Lloyd, Hydrometrics, Inc. from Rainie DeVaney, DEQ Water Protection Bureau. September 18, 2017.
EPA, 1993. Metal Mining ELG Applicability. Appendix C of the Montana Department of
Environmental Quality Multi-Sector General Permit for Storm Water Discharges Associated with Industrial Activity. EPA Region VIII May 18, 1993.
EPA, 2011. EPA 820-R-10-025, Ore Mining Dressing Preliminary Study Report Sept 2011 Hydrometrics, Inc., 2013. Sheep Creek 7Q10 Low Flow Estimation Technical Memorandum. Hydrometrics, Inc., 2016a. Water Resources Monitoring Field Sampling and Analysis Plan,
Black Butte Copper Project. June 2016. Hydrometrics, Inc., 2016b. Groundwater Modeling Assessment for the Black Butte Copper
Project Meagher County MT. Report prepared for Tintina Montana, Inc. November 2015 (revised June 2016). 136 p. and Appendix A. In Appendix M of the MOP application document (Revision 3, July 14, 2017).
H:\Files\TGOLD\11048\Integrated Discharge Permit\R17 Permit Application Narrative.Docx\\12/11/17\065
8-2 12/11/17\7:28 AM
Hydrometrics, Inc., 2017. Baseline Water Resources Monitoring and Hydrogeologic Investigations Report, Tintina Resources Black Butte Copper Project. Revised Report Dated March 14, 2017. Original report dated August 2015. 200p. Appendices A and B (electronic databases). In Appendix B of the MOP application document (Revision 3, July 14, 2017).
Knight Piésold Consulting, 2017. Black Butte Copper Project Water Balance – Surface
Water transfer to Water Treatment Plant, Memorandum prepared for Tintina Resources, Inc. revised on, July 6, 2017. 7 p. File No. VA 101-00460/03-A.01. In Appendix L of the MOP application document (Revision 3, July 14, 2017).
MSU Extension Service, 2001. Water Quality BMPs for Montana Forests. Montana Natural Heritage Program (MTNHP) and Montana Fish, Wildlife and Parks (FWP),
2015. Animal Species of Concern report, Meagher County. Available at: http://mtnhp.org/SpeciesOfConcern/?AorP=a.
NRCS, 2010. National Engineering Handbook. 210-VI-NEH, May 2010. Scow, K.. 2017. Baseline Vegetation Inventory Black Butte Project. Helena, MT: WESTech
Environmental Services. Appendix H of the MOP application document (Revision 3, July 14, 2017).
Tintina Montana, Inc., 2017. Mine Operating Permit Application Black Butte Copper
Project, Meagher County, Montana. Revision 3: July 14, 2017. USDA, 1988. Urban Hydrology for Small Watersheds. Washington, DC: US Department
of Agriculture Conservation Engineering Division.

H:\Files\TGOLD\11048\Integrated Discharge Permit\R17 Permit Application Narrative.Docx\\12/11/17\065 12/11/17\7:28 AM
APPENDIX A
APPLICATION FORM 1, FORM 2D, AND FORM 2C
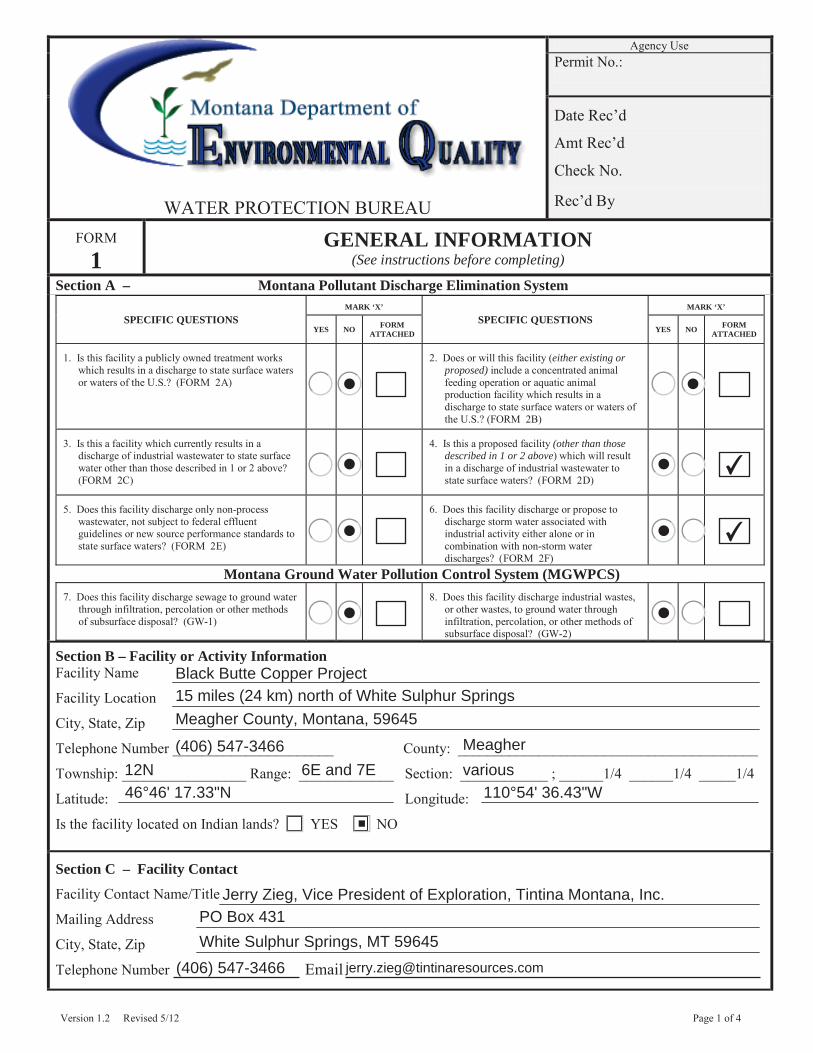
1GENERAL INFORMATION
(See instructions before completing)
Section A – Montana Pollutant Discharge Elimination System
SPECIFIC QUESTIONSMARK ‘X’
SPECIFIC QUESTIONSMARK ‘X’
YES NOFORM
ATTACHEDYES NO
FORM ATTACHED
either existing or proposed)
(other than thosedescribed in 1 or 2 above
Montana Ground Water Pollution Control System (MGWPCS)
Section B – Facility or Activity Information
Section C – Facility Contact
✔
✔
Black Butte Copper Project15 miles (24 km) north of White Sulphur Springs
Meagher County, Montana, 59645
(406) 547-3466 Meagher
12N 6E and 7E various
46°46' 17.33"N 110°54' 36.43"W
■
Jerry Zieg, Vice President of Exploration, Tintina Montana, Inc.PO Box 431
White Sulphur Springs, MT 59645
(406) 547-3466 [email protected]
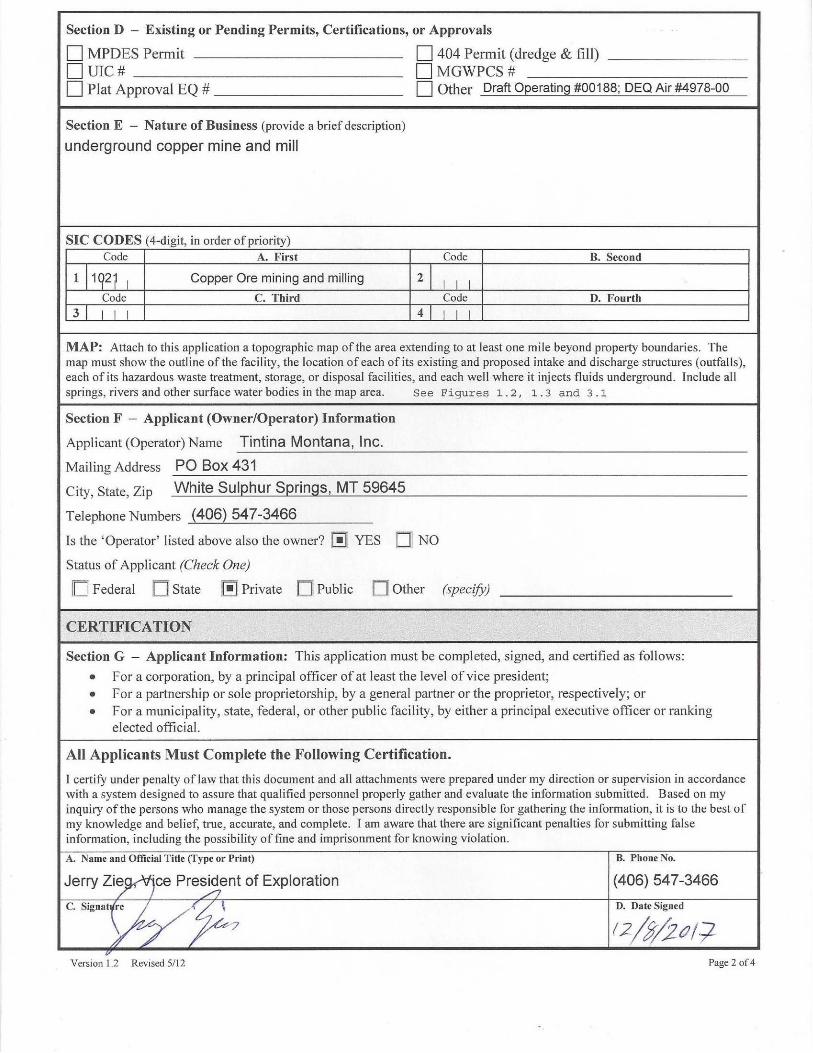
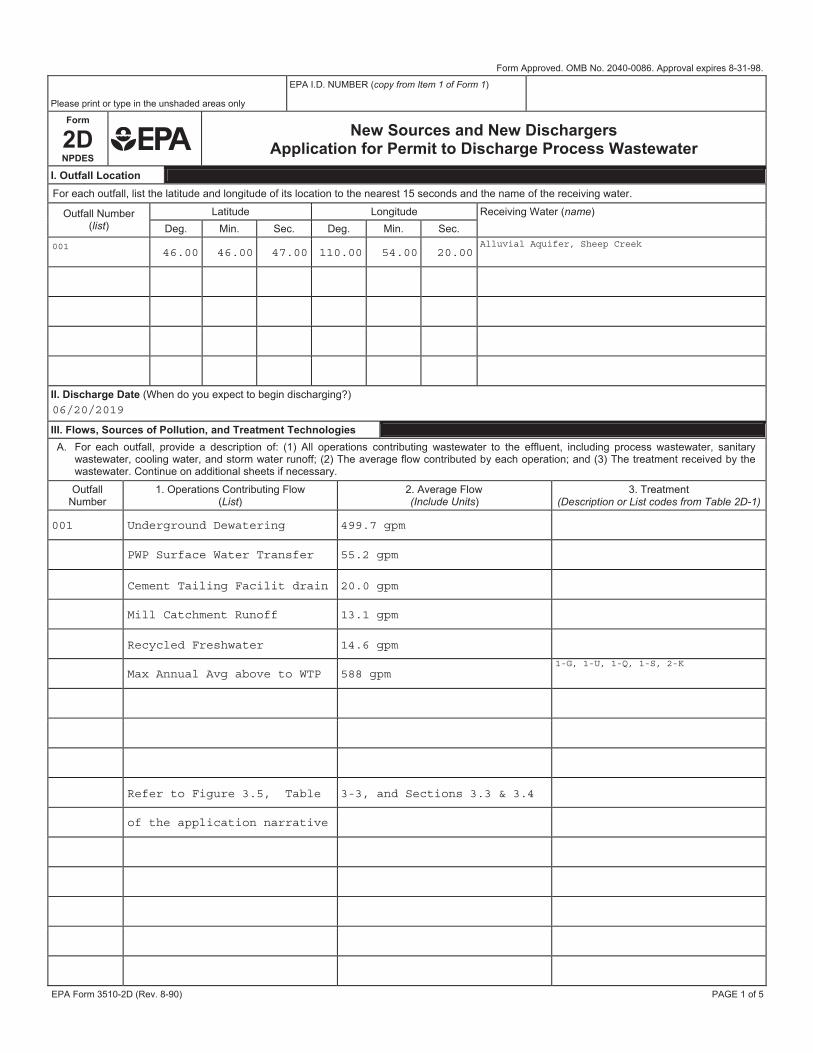
Form Approved. OMB No. 2040-0086. Approval expires 8-31-98.
Please print or type in the unshaded areas only
EPA I.D. NUMBER (copy from Item 1 of Form 1)
Form
2D NPDES
New Sources and New Dischargers
Application for Permit to Discharge Process Wastewater I. Outfall Location For each outfall, list the latitude and longitude of its location to the nearest 15 seconds and the name of the receiving water.
Latitude Longitude Outfall Number (list) Deg. Min. Sec. Deg. Min. Sec.
Receiving Water (name)
II. Discharge Date (When do you expect to begin discharging?)
III. Flows, Sources of Pollution, and Treatment Technologies A. For each outfall, provide a description of: (1) All operations contributing wastewater to the effluent, including process wastewater, sanitary
wastewater, cooling water, and storm water runoff; (2) The average flow contributed by each operation; and (3) The treatment received by the wastewater. Continue on additional sheets if necessary. Outfall
Number 1. Operations Contributing Flow
(List) 2. Average Flow (Include Units)
3. Treatment (Description or List codes from Table 2D-1)
EPA Form 3510-2D (Rev. 8-90) PAGE 1 of 5
00146.00 46.00 47.00 110.00 54.00 20.00
Alluvial Aquifer, Sheep Creek
06/20/2019
001 Underground Dewatering 499.7 gpm
PWP Surface Water Transfer 55.2 gpm
Cement Tailing Facilit drain 20.0 gpm
Mill Catchment Runoff 13.1 gpm
Recycled Freshwater 14.6 gpm
Max Annual Avg above to WTP 588 gpm1-G, 1-U, 1-Q, 1-S, 2-K
Refer to Figure 3.5, Table 3-3, and Sections 3.3 & 3.4
of the application narrative
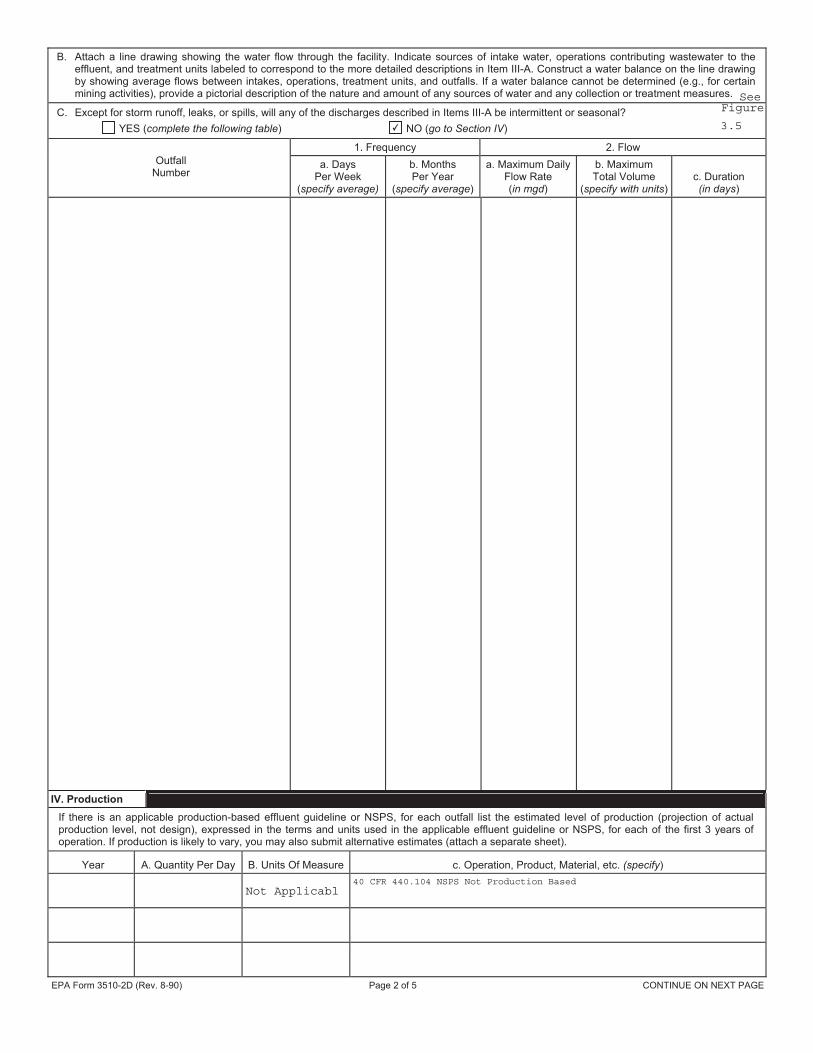
B. Attach a line drawing showing the water flow through the facility. Indicate sources of intake water, operations contributing wastewater to the effluent, and treatment units labeled to correspond to the more detailed descriptions in Item III-A. Construct a water balance on the line drawing by showing average flows between intakes, operations, treatment units, and outfalls. If a water balance cannot be determined (e.g., for certain mining activities), provide a pictorial description of the nature and amount of any sources of water and any collection or treatment measures.
C. Except for storm runoff, leaks, or spills, will any of the discharges described in Items III-A be intermittent or seasonal? YES (complete the following table) NO (go to Section IV)
1. Frequency 2. Flow Outfall
Number a. Days
Per Week (specify average)
b. Months Per Year
(specify average)
a. Maximum Daily Flow Rate (in mgd)
b. Maximum Total Volume
(specify with units)c. Duration (in days)
IV. Production
If there is an applicable production-based effluent guideline or NSPS, for each outfall list the estimated level of production (projection of actual production level, not design), expressed in the terms and units used in the applicable effluent guideline or NSPS, for each of the first 3 years of operation. If production is likely to vary, you may also submit alternative estimates (attach a separate sheet).
Year A. Quantity Per Day B. Units Of Measure c. Operation, Product, Material, etc. (specify)
EPA Form 3510-2D (Rev. 8-90) Page 2 of 5 CONTINUE ON NEXT PAGE
SeeFigure
3.5✔
40 CFR 440.104 NSPS Not Production BasedNot Applicabl
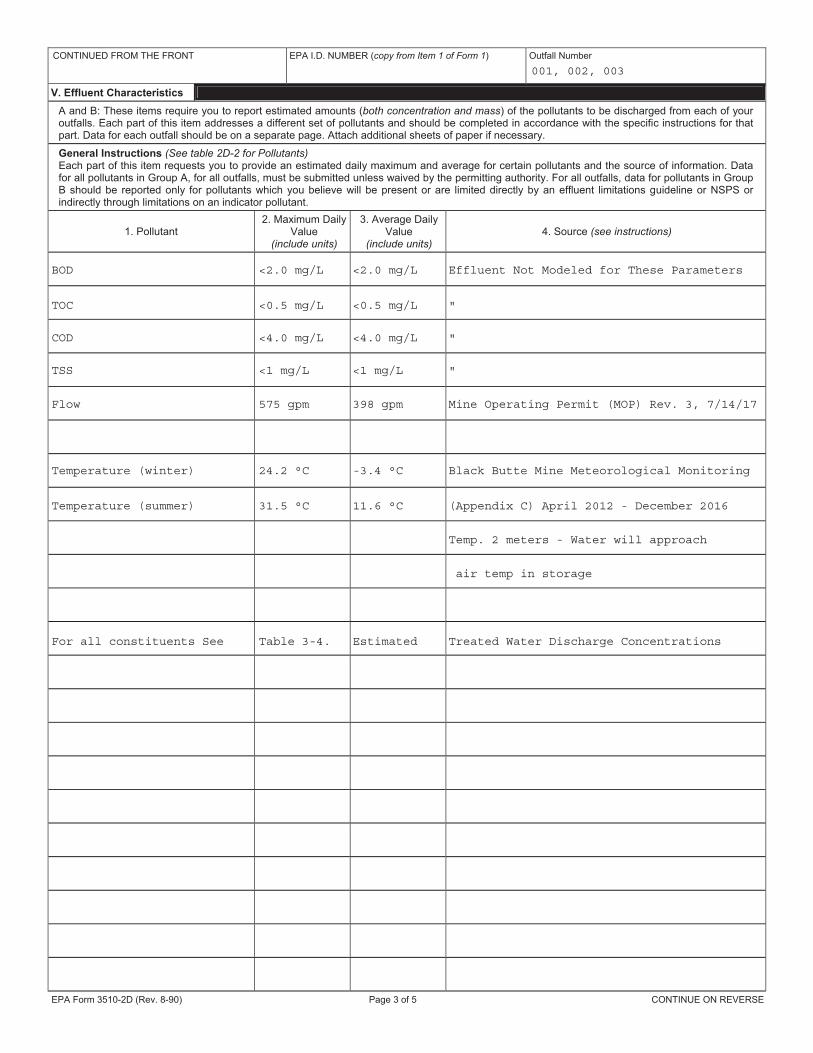
CONTINUED FROM THE FRONT
EPA I.D. NUMBER (copy from Item 1 of Form 1) Outfall Number
V. Effluent Characteristics A and B: These items require you to report estimated amounts (both concentration and mass) of the pollutants to be discharged from each of your outfalls. Each part of this item addresses a different set of pollutants and should be completed in accordance with the specific instructions for that part. Data for each outfall should be on a separate page. Attach additional sheets of paper if necessary. General Instructions (See table 2D-2 for Pollutants) Each part of this item requests you to provide an estimated daily maximum and average for certain pollutants and the source of information. Data for all pollutants in Group A, for all outfalls, must be submitted unless waived by the permitting authority. For all outfalls, data for pollutants in Group B should be reported only for pollutants which you believe will be present or are limited directly by an effluent limitations guideline or NSPS or indirectly through limitations on an indicator pollutant.
1. Pollutant 2. Maximum Daily
Value (include units)
3. Average Daily Value
(include units) 4. Source (see instructions)
EPA Form 3510-2D (Rev. 8-90) Page 3 of 5 CONTINUE ON REVERSE
001, 002, 003
BOD <2.0 mg/L <2.0 mg/L Effluent Not Modeled for These Parameters
TOC <0.5 mg/L <0.5 mg/L "
COD <4.0 mg/L <4.0 mg/L "
TSS <1 mg/L <1 mg/L "
Flow 575 gpm 398 gpm Mine Operating Permit (MOP) Rev. 3, 7/14/17
Temperature (winter) 24.2 °C -3.4 °C Black Butte Mine Meteorological Monitoring
Temperature (summer) 31.5 °C 11.6 °C (Appendix C) April 2012 - December 2016
Temp. 2 meters - Water will approach
air temp in storage
For all constituents See Table 3-4. Estimated Treated Water Discharge Concentrations
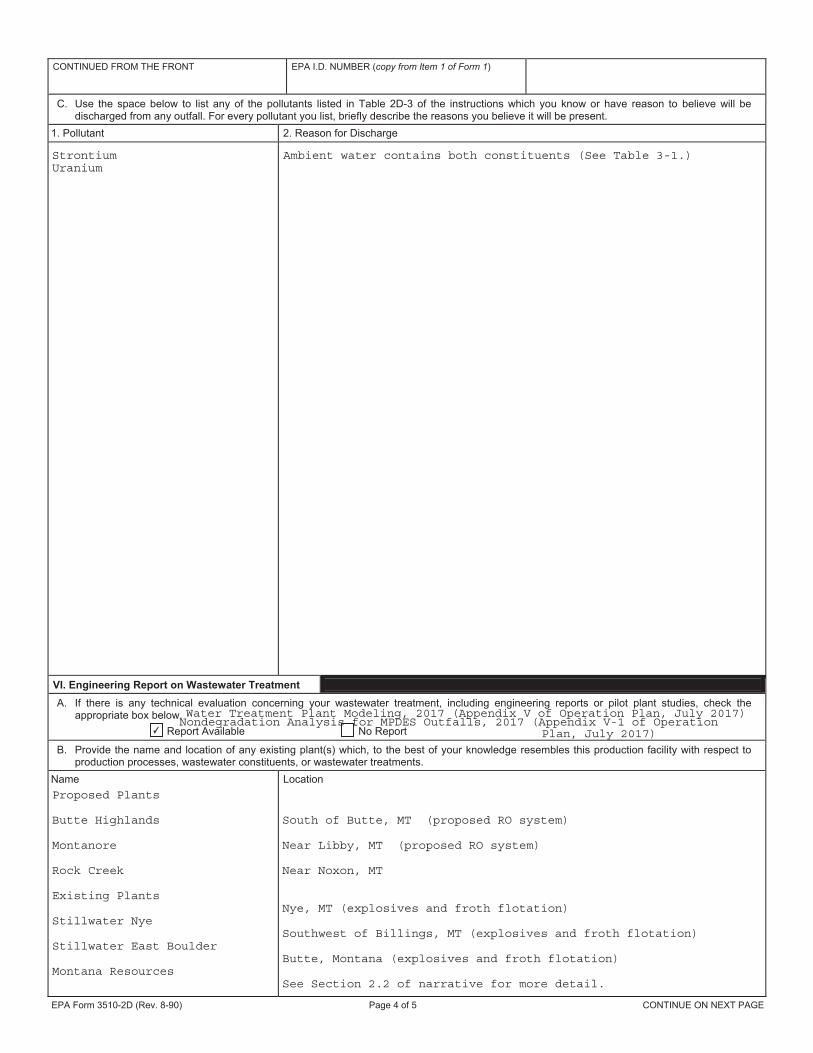
CONTINUED FROM THE FRONT EPA I.D. NUMBER (copy from Item 1 of Form 1)
C. Use the space below to list any of the pollutants listed in Table 2D-3 of the instructions which you know or have reason to believe will be discharged from any outfall. For every pollutant you list, briefly describe the reasons you believe it will be present.
1. Pollutant 2. Reason for Discharge
VI. Engineering Report on Wastewater Treatment A. If there is any technical evaluation concerning your wastewater treatment, including engineering reports or pilot plant studies, check the
appropriate box below. Report Available No Report
B. Provide the name and location of any existing plant(s) which, to the best of your knowledge resembles this production facility with respect to production processes, wastewater constituents, or wastewater treatments.
Name Location
EPA Form 3510-2D (Rev. 8-90) Page 4 of 5 CONTINUE ON NEXT PAGE
Water Treatment Plant Modeling, 2017 (Appendix V of Operation Plan, July 2017)Nondegradation Analysis for MPDES Outfalls, 2017 (Appendix V-1 of Operation
Plan, July 2017)
StrontiumUranium
Ambient water contains both constituents (See Table 3-1.)
✔
Proposed Plants
Butte Highlands
Montanore
Rock Creek
Existing Plants
Stillwater Nye
Stillwater East Boulder
Montana Resources
South of Butte, MT (proposed RO system)
Near Libby, MT (proposed RO system)
Near Noxon, MT
Nye, MT (explosives and froth flotation)
Southwest of Billings, MT (explosives and froth flotation)
Butte, Montana (explosives and froth flotation)
See Section 2.2 of narrative for more detail.
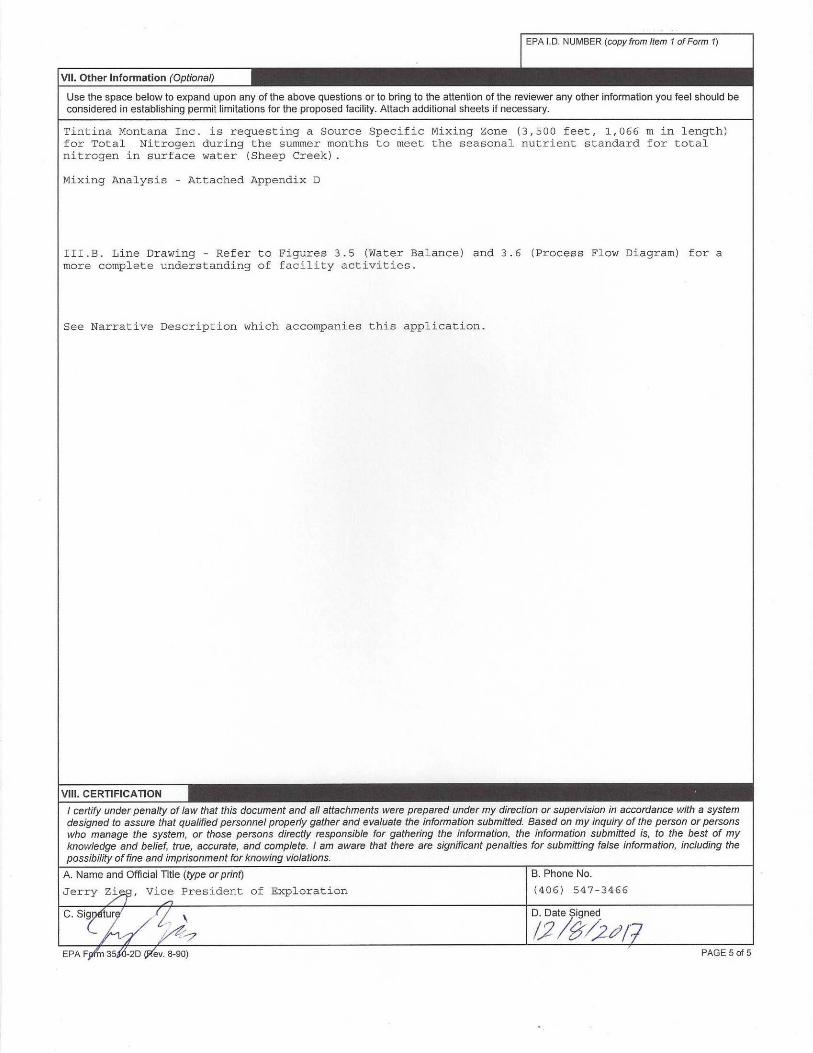
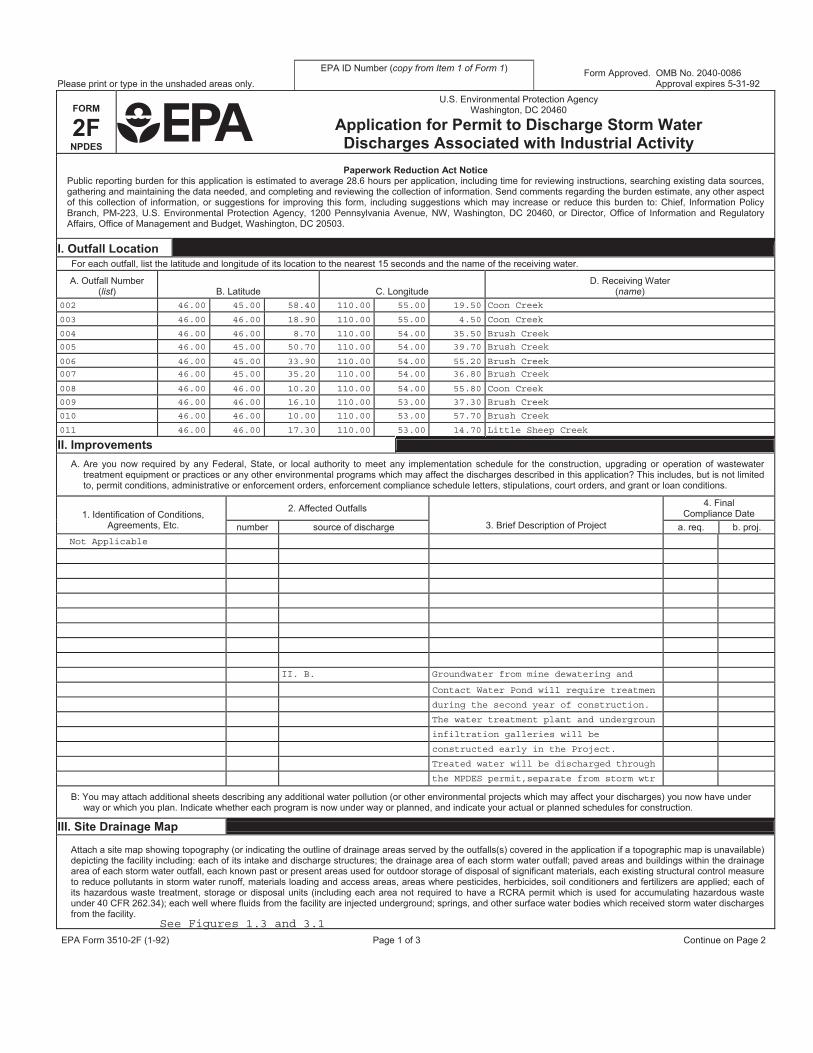
Please print or type in the unshaded areas only.
EPA ID Number (copy from Item 1 of Form 1) Form Approved. OMB No. 2040-0086 Approval expires 5-31-92
FORM
2F NPDES
U.S. Environmental Protection Agency Washington, DC 20460
Application for Permit to Discharge Storm Water Discharges Associated with Industrial Activity Paperwork Reduction Act Notice
Public reporting burden for this application is estimated to average 28.6 hours per application, including time for reviewing instructions, searching existing data sources, gathering and maintaining the data needed, and completing and reviewing the collection of information. Send comments regarding the burden estimate, any other aspect of this collection of information, or suggestions for improving this form, including suggestions which may increase or reduce this burden to: Chief, Information Policy Branch, PM-223, U.S. Environmental Protection Agency, 1200 Pennsylvania Avenue, NW, Washington, DC 20460, or Director, Office of Information and Regulatory Affairs, Office of Management and Budget, Washington, DC 20503.
I. Outfall Location For each outfall, list the latitude and longitude of its location to the nearest 15 seconds and the name of the receiving water.
A. Outfall Number (list) B. Latitude C. Longitude
D. Receiving Water (name)
II. Improvements
A. Are you now required by any Federal, State, or local authority to meet any implementation schedule for the construction, upgrading or operation of wastewater treatment equipment or practices or any other environmental programs which may affect the discharges described in this application? This includes, but is not limited to, permit conditions, administrative or enforcement orders, enforcement compliance schedule letters, stipulations, court orders, and grant or loan conditions.
2. Affected Outfalls 4. Final Compliance Date 1. Identification of Conditions,
Agreements, Etc. number source of discharge 3. Brief Description of Project a. req. b. proj.
B: You may attach additional sheets describing any additional water pollution (or other environmental projects which may affect your discharges) you now have under way or which you plan. Indicate whether each program is now under way or planned, and indicate your actual or planned schedules for construction.
III. Site Drainage Map
Attach a site map showing topography (or indicating the outline of drainage areas served by the outfalls(s) covered in the application if a topographic map is unavailable) depicting the facility including: each of its intake and discharge structures; the drainage area of each storm water outfall; paved areas and buildings within the drainage area of each storm water outfall, each known past or present areas used for outdoor storage of disposal of significant materials, each existing structural control measure to reduce pollutants in storm water runoff, materials loading and access areas, areas where pesticides, herbicides, soil conditioners and fertilizers are applied; each of its hazardous waste treatment, storage or disposal units (including each area not required to have a RCRA permit which is used for accumulating hazardous waste under 40 CFR 262.34); each well where fluids from the facility are injected underground; springs, and other surface water bodies which received storm water discharges from the facility.
EPA Form 3510-2F (1-92) Page 1 of 3 Continue on Page 2
See Figures 1.3 and 3.1
002 46.00 45.00 58.40 110.00 55.00 19.50 Coon Creek
003 46.00 46.00 18.90 110.00 55.00 4.50 Coon Creek
004 46.00 46.00 8.70 110.00 54.00 35.50 Brush Creek
005 46.00 45.00 50.70 110.00 54.00 39.70 Brush Creek
006 46.00 45.00 33.90 110.00 54.00 55.20 Brush Creek007 46.00 45.00 35.20 110.00 54.00 36.80 Brush Creek
008 46.00 46.00 10.20 110.00 54.00 55.80 Coon Creek
009 46.00 46.00 16.10 110.00 53.00 37.30 Brush Creek
010 46.00 46.00 10.00 110.00 53.00 57.70 Brush Creek
011 46.00 46.00 17.30 110.00 53.00 14.70 Little Sheep Creek
Not Applicable
II. B. Groundwater from mine dewatering and
Contact Water Pond will require treatmen
during the second year of construction.
The water treatment plant and undergroun
infiltration galleries will be
constructed early in the Project.
Treated water will be discharged through
the MPDES permit,separate from storm wtr
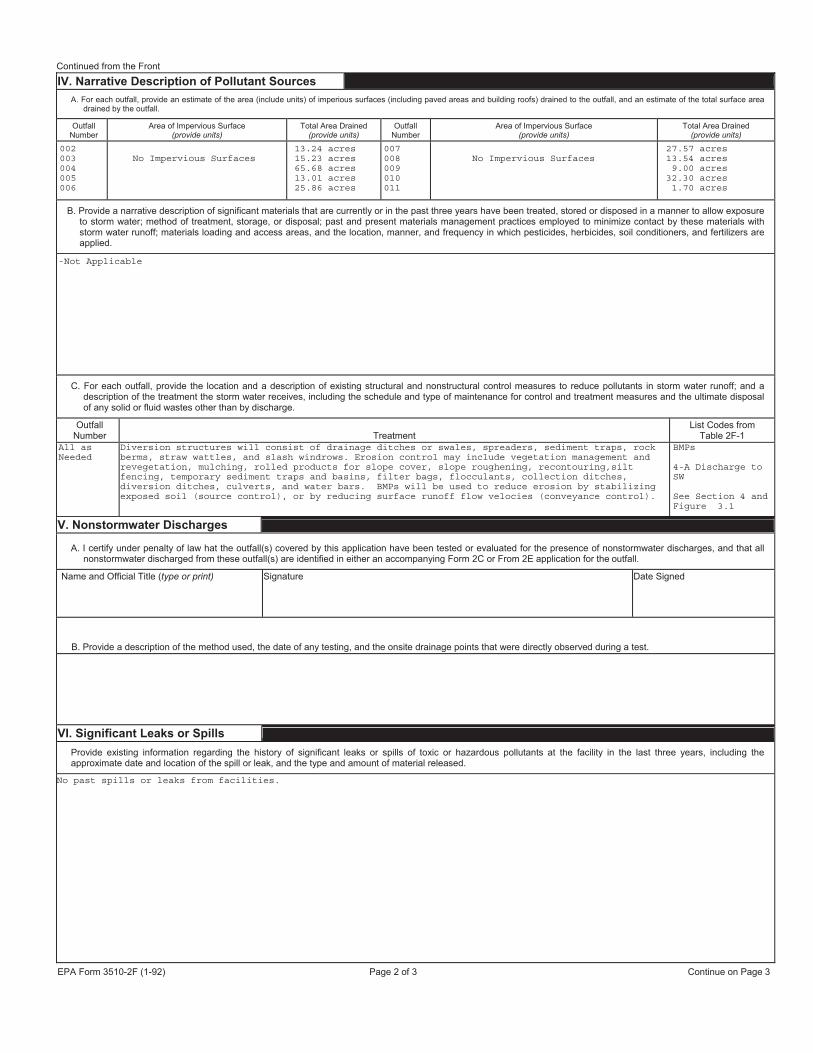
Continued from the Front
IV. Narrative Description of Pollutant Sources
A. For each outfall, provide an estimate of the area (include units) of imperious surfaces (including paved areas and building roofs) drained to the outfall, and an estimate of the total surface area drained by the outfall.
Outfall Number
Area of Impervious Surface (provide units)
Total Area Drained (provide units)
Outfall Number
Area of Impervious Surface (provide units)
Total Area Drained (provide units)
B. Provide a narrative description of significant materials that are currently or in the past three years have been treated, stored or disposed in a manner to allow exposure to storm water; method of treatment, storage, or disposal; past and present materials management practices employed to minimize contact by these materials with storm water runoff; materials loading and access areas, and the location, manner, and frequency in which pesticides, herbicides, soil conditioners, and fertilizers are applied.
C. For each outfall, provide the location and a description of existing structural and nonstructural control measures to reduce pollutants in storm water runoff; and a description of the treatment the storm water receives, including the schedule and type of maintenance for control and treatment measures and the ultimate disposal of any solid or fluid wastes other than by discharge.
Outfall Number Treatment
List Codes from Table 2F-1
V. Nonstormwater Discharges
A. I certify under penalty of law hat the outfall(s) covered by this application have been tested or evaluated for the presence of nonstormwater discharges, and that all nonstormwater discharged from these outfall(s) are identified in either an accompanying Form 2C or From 2E application for the outfall.
Name and Official Title (type or print) Signature Date Signed
B. Provide a description of the method used, the date of any testing, and the onsite drainage points that were directly observed during a test.
VI. Significant Leaks or Spills
Provide existing information regarding the history of significant leaks or spills of toxic or hazardous pollutants at the facility in the last three years, including the approximate date and location of the spill or leak, and the type and amount of material released.
EPA Form 3510-2F (1-92) Page 2 of 3 Continue on Page 3
002003004005006
No Impervious Surfaces 13.24 acres 15.23 acres 65.68 acres 13.01 acres 25.86 acres
007008009010011
No Impervious Surfaces 27.57 acres 13.54 acres9.00 acres
32.30 acres1.70 acres
-Not Applicable
All asNeeded
Diversion structures will consist of drainage ditches or swales, spreaders, sediment traps, rockberms, straw wattles, and slash windrows. Erosion control may include vegetation management andrevegetation, mulching, rolled products for slope cover, slope roughening, recontouring,siltfencing, temporary sediment traps and basins, filter bags, flocculants, collection ditches,diversion ditches, culverts, and water bars. BMPs will be used to reduce erosion by stabilizingexposed soil (source control), or by reducing surface runoff flow velocies (conveyance control).
BMPs
4-A Discharge toSW
See Section 4 andFigure 3.1
No past spills or leaks from facilities.
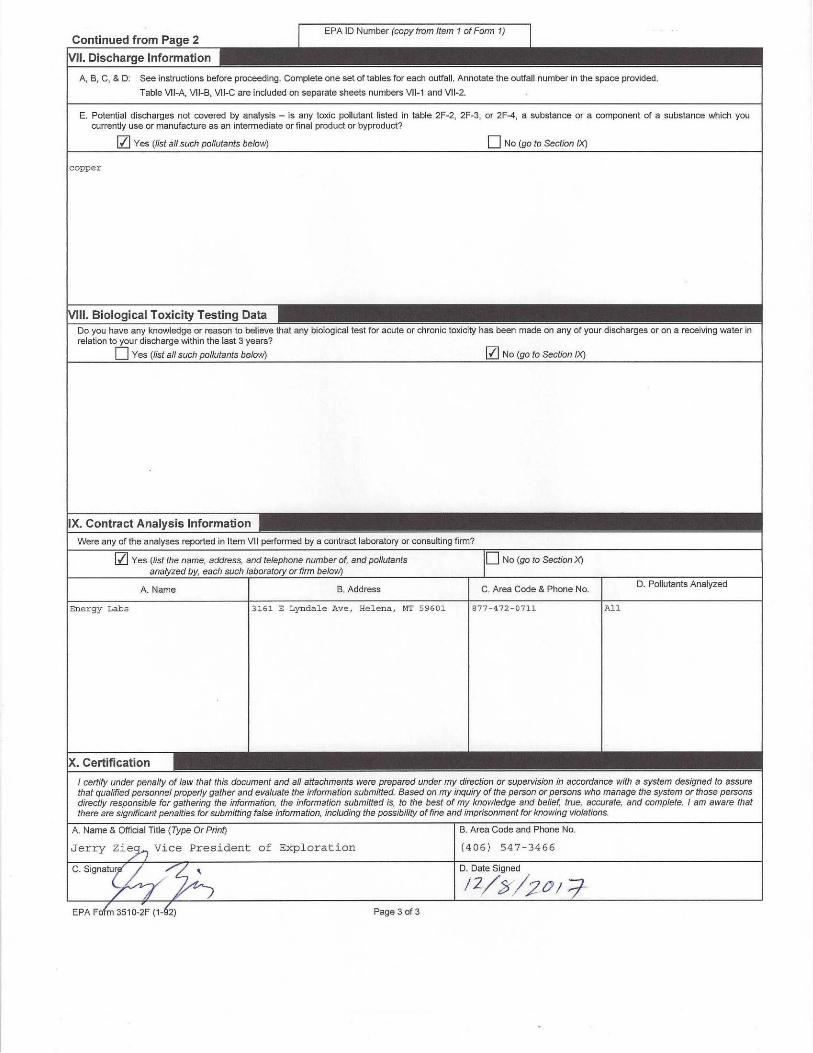
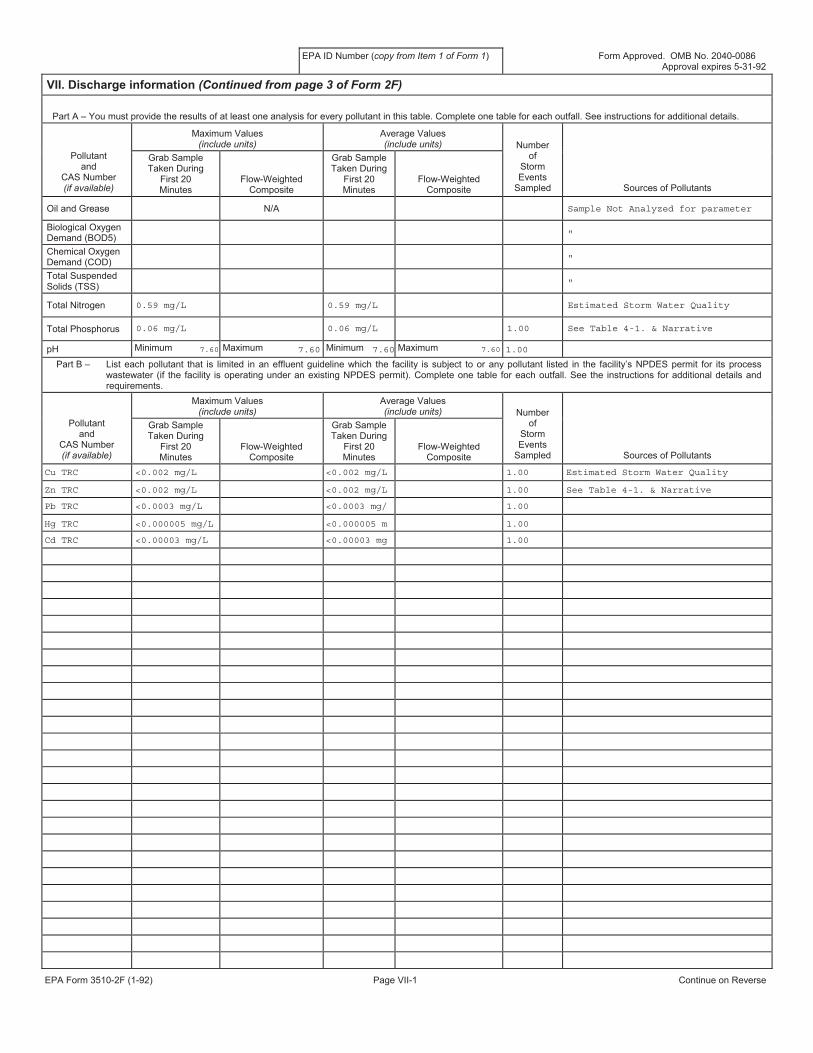
EPA ID Number (copy from Item 1 of Form 1) Form Approved. OMB No. 2040-0086 Approval expires 5-31-92
VII. Discharge information (Continued from page 3 of Form 2F)
Part A – You must provide the results of at least one analysis for every pollutant in this table. Complete one table for each outfall. See instructions for additional details.
Maximum Values (include units)
Average Values (include units)
Pollutant and
CAS Number (if available)
Grab Sample Taken During
First 20 Minutes
Flow-Weighted Composite
Grab Sample Taken During
First 20 Minutes
Flow-Weighted Composite
Number of
Storm Events
Sampled Sources of Pollutants
Oil and Grease N/A Biological Oxygen Demand (BOD5) Chemical Oxygen Demand (COD) Total Suspended Solids (TSS)
Total Nitrogen
Total Phosphorus pH Minimum Maximum Minimum Maximum
Part B – List each pollutant that is limited in an effluent guideline which the facility is subject to or any pollutant listed in the facility’s NPDES permit for its process wastewater (if the facility is operating under an existing NPDES permit). Complete one table for each outfall. See the instructions for additional details and requirements.
Maximum Values (include units)
Average Values (include units)
Pollutant and
CAS Number (if available)
Grab Sample Taken During
First 20 Minutes
Flow-Weighted Composite
Grab Sample Taken During
First 20 Minutes
Flow-Weighted Composite
Number of
Storm Events
Sampled Sources of Pollutants
EPA Form 3510-2F (1-92) Page VII-1 Continue on Reverse
Sample Not Analyzed for parameter
"
"
"
0.59 mg/L 0.59 mg/L Estimated Storm Water Quality
0.06 mg/L 0.06 mg/L 1.00 See Table 4-1. & Narrative
7.60 7.60 7.60 7.60 1.00
Cu TRC <0.002 mg/L <0.002 mg/L 1.00 Estimated Storm Water Quality
Zn TRC <0.002 mg/L <0.002 mg/L 1.00 See Table 4-1. & Narrative
Pb TRC <0.0003 mg/L <0.0003 mg/ 1.00
Hg TRC <0.000005 mg/L <0.000005 m 1.00
Cd TRC <0.00003 mg/L <0.00003 mg 1.00
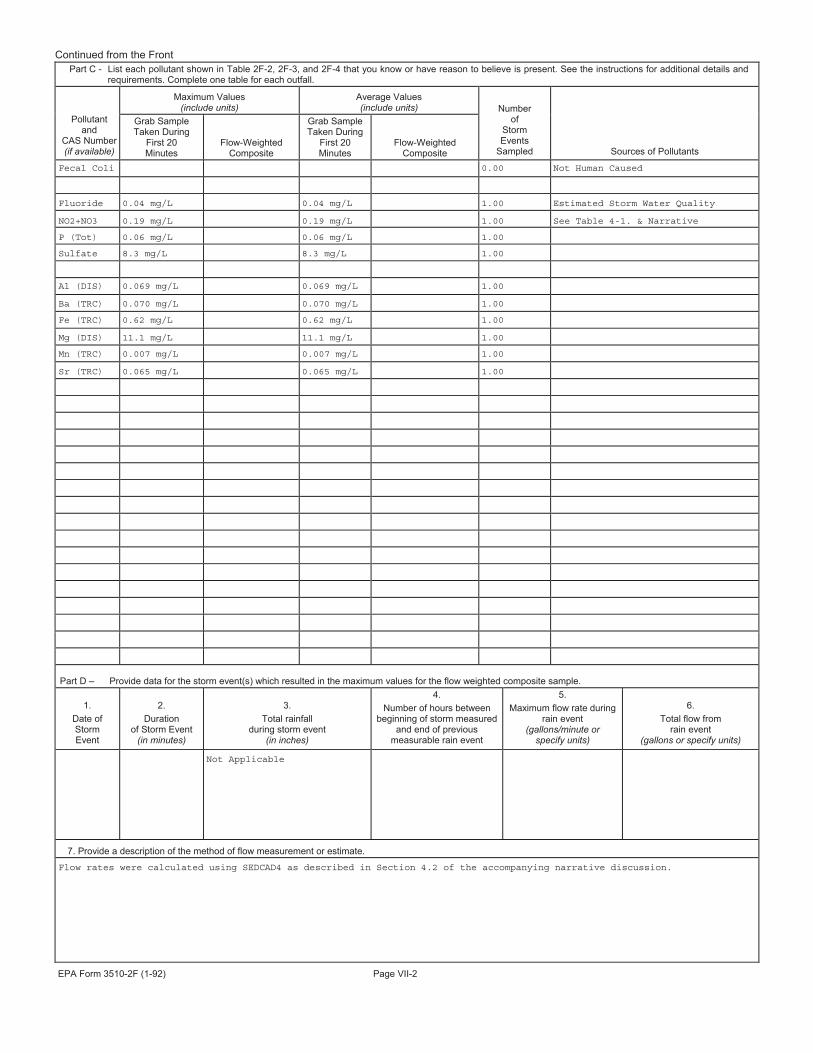
Continued from the Front Part C - List each pollutant shown in Table 2F-2, 2F-3, and 2F-4 that you know or have reason to believe is present. See the instructions for additional details and
requirements. Complete one table for each outfall.
Maximum Values (include units)
Average Values (include units)
Pollutant and
CAS Number (if available)
Grab Sample Taken During
First 20 Minutes
Flow-Weighted Composite
Grab Sample Taken During
First 20 Minutes
Flow-Weighted Composite
Number of
Storm Events
Sampled Sources of Pollutants
Part D – Provide data for the storm event(s) which resulted in the maximum values for the flow weighted composite sample.
1. Date of Storm Event
2. Duration
of Storm Event (in minutes)
3. Total rainfall
during storm event (in inches)
4. Number of hours between
beginning of storm measured and end of previous
measurable rain event
5. Maximum flow rate during
rain event (gallons/minute or
specify units)
6. Total flow from
rain event (gallons or specify units)
7. Provide a description of the method of flow measurement or estimate.
EPA Form 3510-2F (1-92) Page VII-2
Fecal Coli 0.00 Not Human Caused
Fluoride 0.04 mg/L 0.04 mg/L 1.00 Estimated Storm Water Quality
NO2+NO3 0.19 mg/L 0.19 mg/L 1.00 See Table 4-1. & Narrative
P (Tot) 0.06 mg/L 0.06 mg/L 1.00
Sulfate 8.3 mg/L 8.3 mg/L 1.00
Al (DIS) 0.069 mg/L 0.069 mg/L 1.00
Ba (TRC) 0.070 mg/L 0.070 mg/L 1.00
Fe (TRC) 0.62 mg/L 0.62 mg/L 1.00
Mg (DIS) 11.1 mg/L 11.1 mg/L 1.00
Mn (TRC) 0.007 mg/L 0.007 mg/L 1.00
Sr (TRC) 0.065 mg/L 0.065 mg/L 1.00
Not Applicable
Flow rates were calculated using SEDCAD4 as described in Section 4.2 of the accompanying narrative discussion.
H:\Files\TGOLD\11048\Integrated Discharge Permit\R17 Permit Application Narrative.Docx\\12/11/17\065 12/11/17\7:28 AM
APPENDIX B
WATER TREATMENT MODELING
Black Butte Copper Project Mine Operating Permit Application (Revision 3)
APPENDIX V: Water Treatment Modeling
Tintina Montana, Inc. July 2017
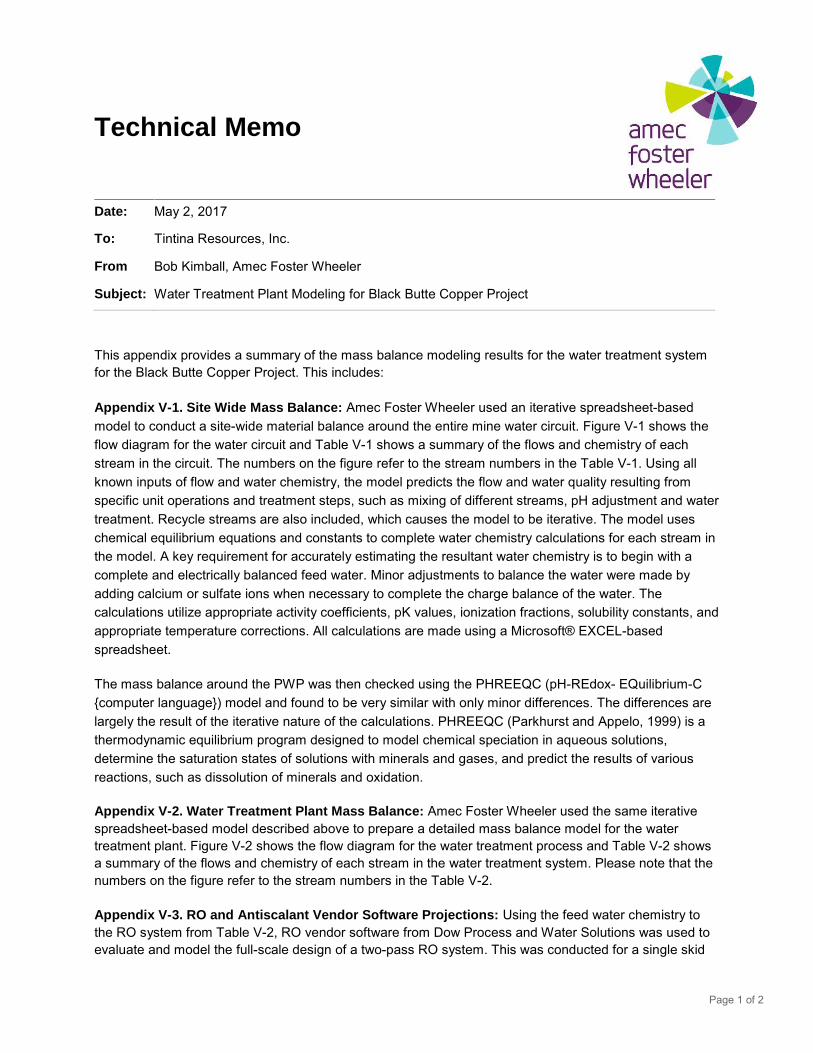
Page 1 of 2
Technical Memo
Date: May 2, 2017
To: Tintina Resources, Inc.
From Bob Kimball, Amec Foster Wheeler
Subject: Water Treatment Plant Modeling for Black Butte Copper Project
This appendix provides a summary of the mass balance modeling results for the water treatment systemfor the Black Butte Copper Project. This includes:
Appendix V-1. Site Wide Mass Balance: Amec Foster Wheeler used an iterative spreadsheet-basedmodel to conduct a site-wide material balance around the entire mine water circuit. Figure V-1 shows theflow diagram for the water circuit and Table V-1 shows a summary of the flows and chemistry of eachstream in the circuit. The numbers on the figure refer to the stream numbers in the Table V-1. Using allknown inputs of flow and water chemistry, the model predicts the flow and water quality resulting fromspecific unit operations and treatment steps, such as mixing of different streams, pH adjustment and watertreatment. Recycle streams are also included, which causes the model to be iterative. The model useschemical equilibrium equations and constants to complete water chemistry calculations for each stream inthe model. A key requirement for accurately estimating the resultant water chemistry is to begin with acomplete and electrically balanced feed water. Minor adjustments to balance the water were made byadding calcium or sulfate ions when necessary to complete the charge balance of the water. Thecalculations utilize appropriate activity coefficients, pK values, ionization fractions, solubility constants, andappropriate temperature corrections. All calculations are made using a Microsoft® EXCEL-basedspreadsheet.
The mass balance around the PWP was then checked using the PHREEQC (pH-REdox- EQuilibrium-C{computer language}) model and found to be very similar with only minor differences. The differences arelargely the result of the iterative nature of the calculations. PHREEQC (Parkhurst and Appelo, 1999) is athermodynamic equilibrium program designed to model chemical speciation in aqueous solutions,determine the saturation states of solutions with minerals and gases, and predict the results of variousreactions, such as dissolution of minerals and oxidation.
Appendix V-2. Water Treatment Plant Mass Balance: Amec Foster Wheeler used the same iterativespreadsheet-based model described above to prepare a detailed mass balance model for the watertreatment plant. Figure V-2 shows the flow diagram for the water treatment process and Table V-2 showsa summary of the flows and chemistry of each stream in the water treatment system. Please note that thenumbers on the figure refer to the stream numbers in the Table V-2.
Appendix V-3. RO and Antiscalant Vendor Software Projections: Using the feed water chemistry tothe RO system from Table V-2, RO vendor software from Dow Process and Water Solutions was used toevaluate and model the full-scale design of a two-pass RO system. This was conducted for a single skid

at both 10 Deg C and 25 Deg C to calculated the anticipated operating pressures, fluxes, brine waterquality and effluent water quality produced by the RO system. The selected membrane and overallconfiguration was selected and optimized to achieve all discharge limits, especially for total nitrogen. Inaddition, vendor software from Avista Chemical was used to evaluate various antiscalants for use in theRO system to minimize/prevent membrane scaling. The software uses the feed water chemistry and ROconfiguration to predict the type of dosage of antiscalant required to ensure that sparingly soluble salts donot exceed their solubility limits. This analysis was conducted at the two operating temperatures. Theresults of this analysis show that a small dose of Vitec 3000 will prevent salts from precipitating in themembrane system.
Appendix V-4. VSEP Vendor Software Projections: VSEP software was used to perform a similarevaluation on RO concentrate. The results of vendor software in this section shows the designconfiguration, operating pressure, and water quality of the final brine concentrate and treated effluent.

APPENDIX V-1
Overall Site Material Balance
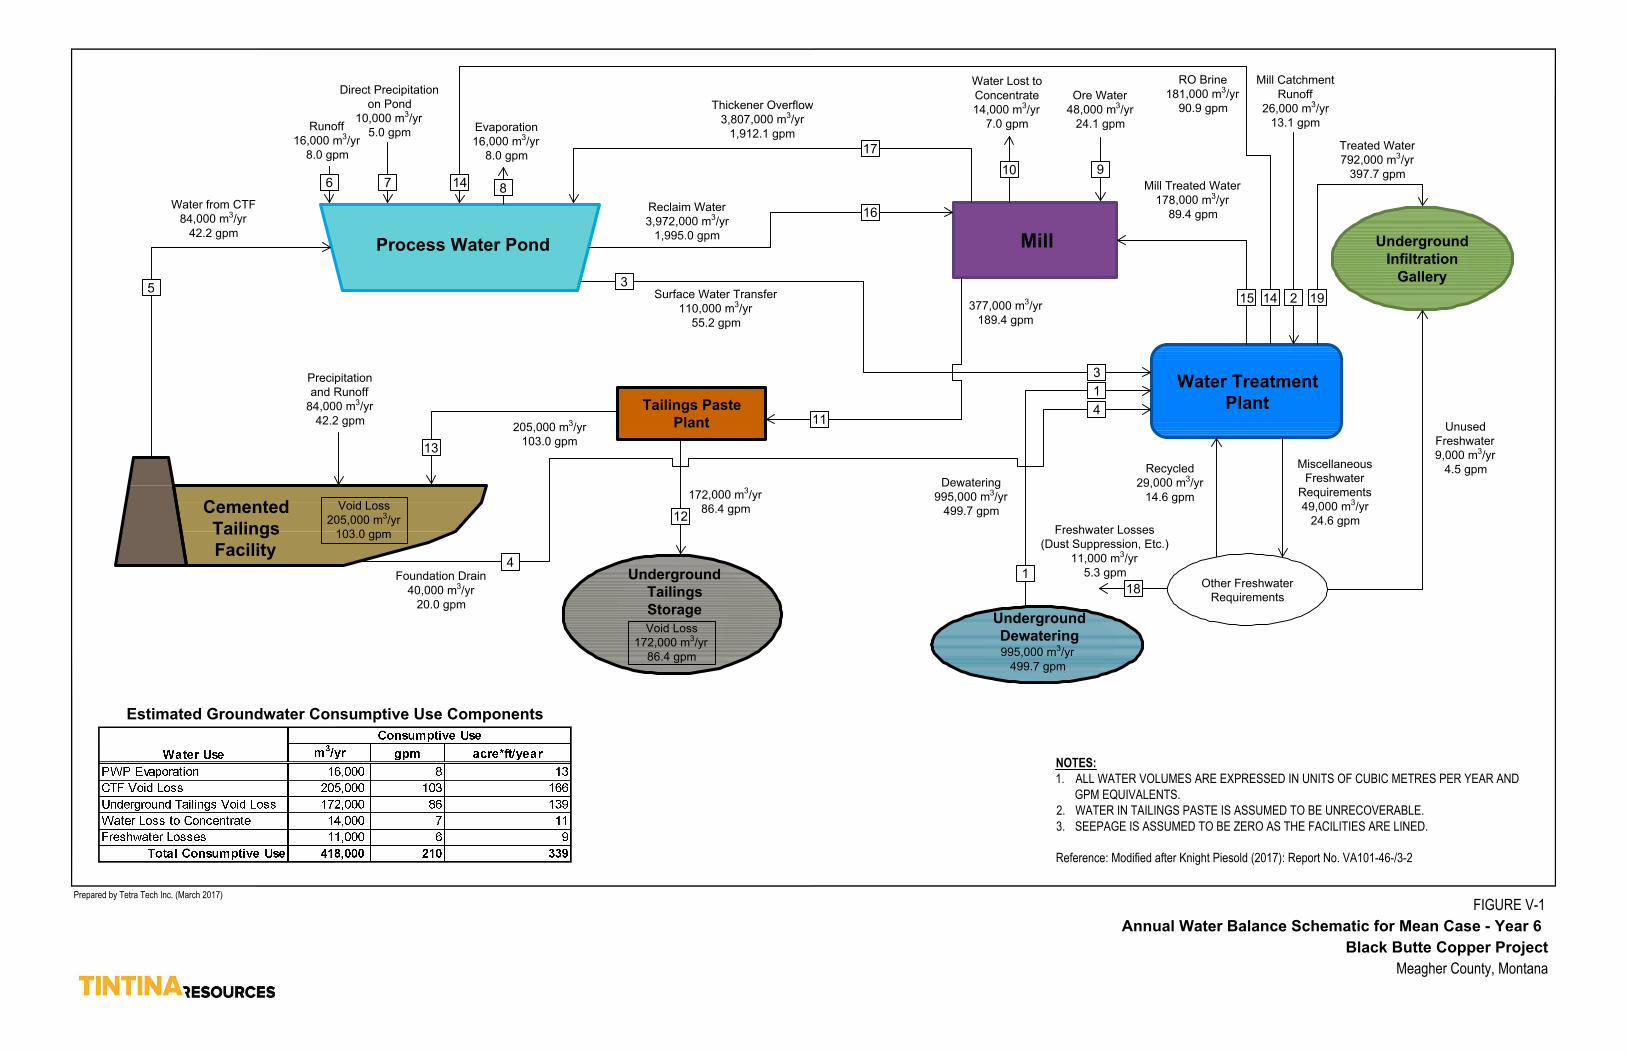
172,000 m
3
/yr
86.4 gpm
205,000 m
3
/yr
103.0 gpm
Water from CTF
84,000 m
3
/yr
42.2 gpm
Direct Precipitation
on Pond
10,000 m
3
/yr
5.0 gpm
Evaporation
16,000 m
3
/yr
8.0 gpm
Thickener Overflow
3,807,000 m
3
/yr
1,912.1 gpm
Reclaim Water
3,972,000 m
3
/yr
1,995.0 gpm
Surface Water Transfer
110,000 m
3
/yr
55.2 gpm
Water Lost to
Concentrate
14,000 m
3
/yr
7.0 gpm
Ore Water
48,000 m
3
/yr
24.1 gpm
Mill Catchment
Runoff
26,000 m
3
/yr
13.1 gpm
Mill Treated Water
178,000 m
3
/yr
89.4 gpm
Treated Water
792,000 m
3
/yr
397.7 gpm
377,000 m
3
/yr
189.4 gpm
Dewatering
995,000 m
3
/yr
499.7 gpm
Recycled
29,000 m
3
/yr
14.6 gpm
Freshwater Losses
(Dust Suppression, Etc.)
11,000 m
3
/yr
5.3 gpm
Miscellaneous
Freshwater
Requirements
49,000 m
3
/yr
24.6 gpm
Unused
Freshwater
9,000 m
3
/yr
4.5 gpm
Void Loss
205,000 m
3
/yr
103.0 gpm
Other Freshwater
Requirements
Runoff
16,000 m
3
/yr
8.0 gpm
Precipitation
and Runoff
84,000 m
3
/yr
42.2 gpm
Underground
Infiltration
Gallery
Water Treatment
Plant
Cemented
Tailings
Facility
Process Water Pond
Mill
Underground
Dewatering
Underground
Tailings
Storage
Tailings Paste
Plant
NOTES:1. ALL WATER VOLUMES ARE EXPRESSED IN UNITS OF CUBIC METRES PER YEAR AND
GPM EQUIVALENTS.2. WATER IN TAILINGS PASTE IS ASSUMED TO BE UNRECOVERABLE.3. SEEPAGE IS ASSUMED TO BE ZERO AS THE FACILITIES ARE LINED.
Reference: Modified after Knight Piesold (2017): Report No. VA101-46-/3-2
Estimated Groundwater Consumptive Use Components
Foundation Drain
40,000 m
3
/yr
20.0 gpm
RO Brine
181,000 m
3
/yr
90.9 gpm
3
1
4
11
4
12
1
18
5
13
910
3
8
1476
15 2 1914
Void Loss
172,000 m
3
/yr
86.4 gpm
995,000 m
3
/yr
499.7 gpm
16
17
FIGURE V-1Annual Water Balance Schematic for Mean Case - Year 6
Black Butte Copper Project
Meagher County, Montana
Prepared by Tetra Tech Inc. (March 2017)
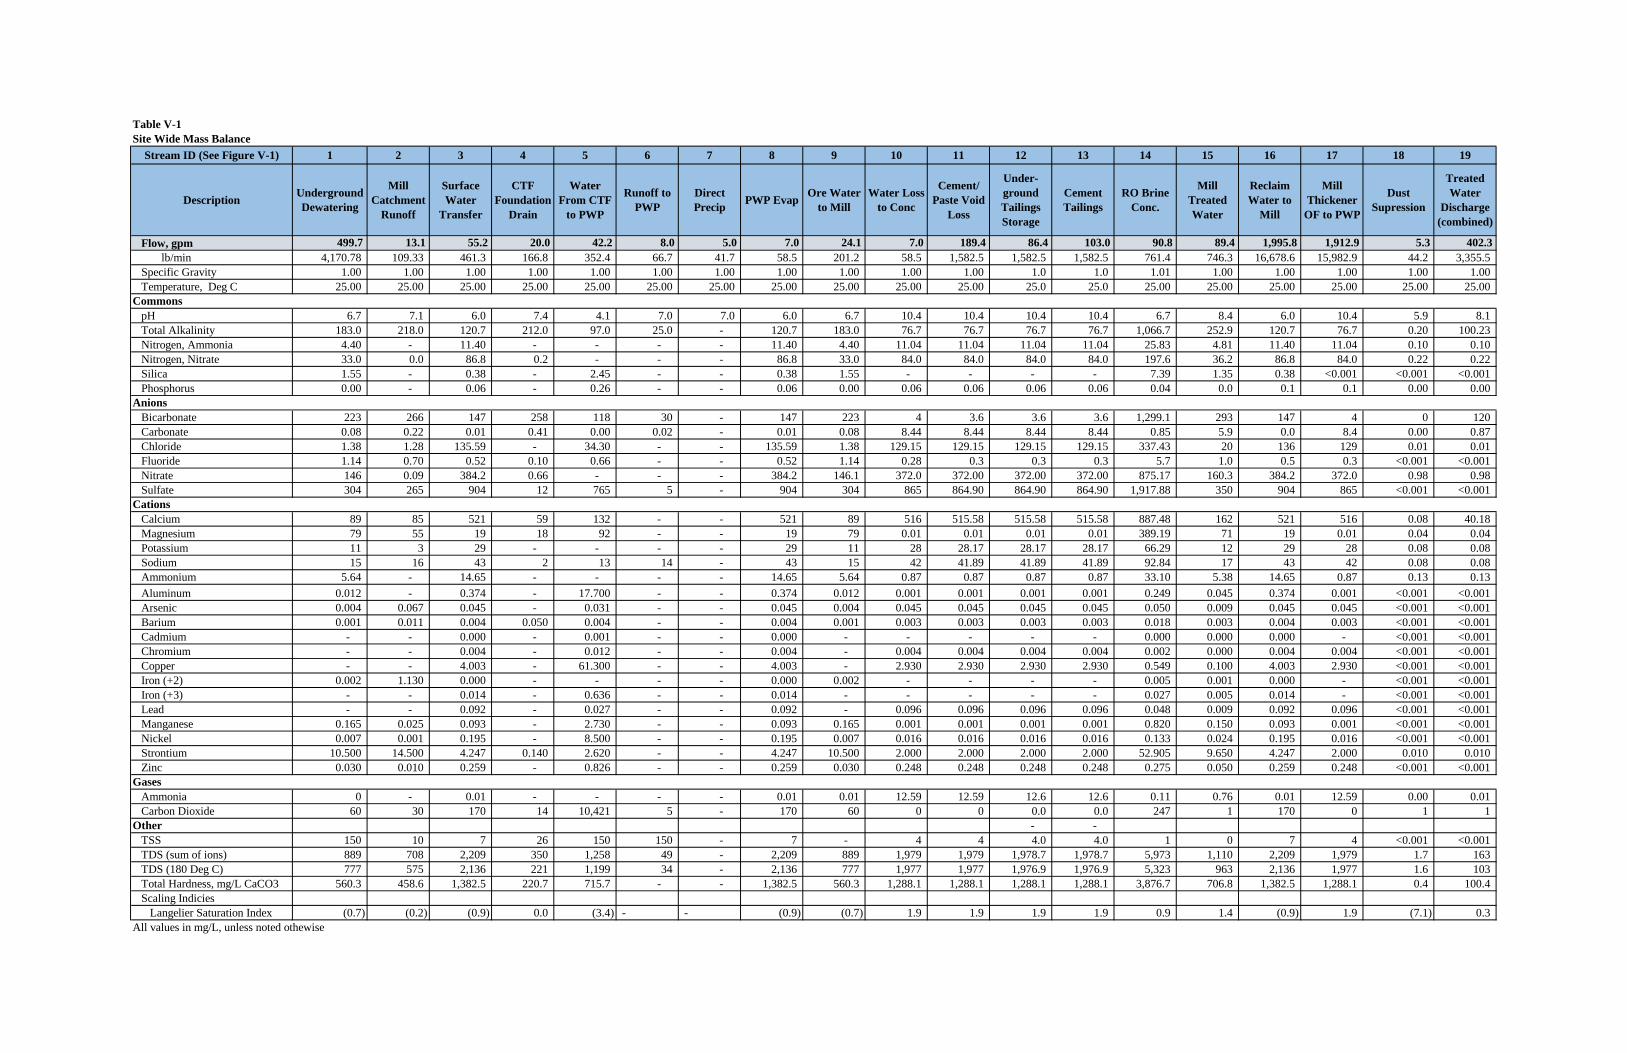
Table V-1Site Wide Mass Balance
Stream ID (See Figure V-1) 1 2 3 4 5 6 7 8 9 10 11 12 13 14 15 16 17 18 19
DescriptionUndergroundDewatering
MillCatchment
Runoff
SurfaceWater
Transfer
CTFFoundation
Drain
WaterFrom CTF
to PWP
Runoff toPWP
DirectPrecip
PWP EvapOre Water
to MillWater Loss
to Conc
Cement/Paste Void
Loss
Under-groundTailingsStorage
CementTailings
RO BrineConc.
MillTreatedWater
ReclaimWater to
Mill
MillThickener
OF to PWP
DustSupression
TreatedWater
Discharge(combined)
Flow, gpm 499.7 13.1 55.2 20.0 42.2 8.0 5.0 7.0 24.1 7.0 189.4 86.4 103.0 90.8 89.4 1,995.8 1,912.9 5.3 402.3 lb/min 4,170.78 109.33 461.3 166.8 352.4 66.7 41.7 58.5 201.2 58.5 1,582.5 1,582.5 1,582.5 761.4 746.3 16,678.6 15,982.9 44.2 3,355.5
Specific Gravity 1.00 1.00 1.00 1.00 1.00 1.00 1.00 1.00 1.00 1.00 1.00 1.0 1.0 1.01 1.00 1.00 1.00 1.00 1.00Temperature, Deg C 25.00 25.00 25.00 25.00 25.00 25.00 25.00 25.00 25.00 25.00 25.00 25.0 25.0 25.00 25.00 25.00 25.00 25.00 25.00
CommonspH 6.7 7.1 6.0 7.4 4.1 7.0 7.0 6.0 6.7 10.4 10.4 10.4 10.4 6.7 8.4 6.0 10.4 5.9 8.1Total Alkalinity 183.0 218.0 120.7 212.0 97.0 25.0 - 120.7 183.0 76.7 76.7 76.7 76.7 1,066.7 252.9 120.7 76.7 0.20 100.23Nitrogen, Ammonia 4.40 - 11.40 - - - - 11.40 4.40 11.04 11.04 11.04 11.04 25.83 4.81 11.40 11.04 0.10 0.10Nitrogen, Nitrate 33.0 0.0 86.8 0.2 - - - 86.8 33.0 84.0 84.0 84.0 84.0 197.6 36.2 86.8 84.0 0.22 0.22Silica 1.55 - 0.38 - 2.45 - - 0.38 1.55 - - - - 7.39 1.35 0.38 <0.001 <0.001 <0.001Phosphorus 0.00 - 0.06 - 0.26 - - 0.06 0.00 0.06 0.06 0.06 0.06 0.04 0.0 0.1 0.1 0.00 0.00
AnionsBicarbonate 223 266 147 258 118 30 - 147 223 4 3.6 3.6 3.6 1,299.1 293 147 4 0 120Carbonate 0.08 0.22 0.01 0.41 0.00 0.02 - 0.01 0.08 8.44 8.44 8.44 8.44 0.85 5.9 0.0 8.4 0.00 0.87Chloride 1.38 1.28 135.59 - 34.30 - - 135.59 1.38 129.15 129.15 129.15 129.15 337.43 20 136 129 0.01 0.01Fluoride 1.14 0.70 0.52 0.10 0.66 - - 0.52 1.14 0.28 0.3 0.3 0.3 5.7 1.0 0.5 0.3 <0.001 <0.001Nitrate 146 0.09 384.2 0.66 - - - 384.2 146.1 372.0 372.00 372.00 372.00 875.17 160.3 384.2 372.0 0.98 0.98Sulfate 304 265 904 12 765 5 - 904 304 865 864.90 864.90 864.90 1,917.88 350 904 865 <0.001 <0.001
CationsCalcium 89 85 521 59 132 - - 521 89 516 515.58 515.58 515.58 887.48 162 521 516 0.08 40.18Magnesium 79 55 19 18 92 - - 19 79 0.01 0.01 0.01 0.01 389.19 71 19 0.01 0.04 0.04Potassium 11 3 29 - - - - 29 11 28 28.17 28.17 28.17 66.29 12 29 28 0.08 0.08Sodium 15 16 43 2 13 14 - 43 15 42 41.89 41.89 41.89 92.84 17 43 42 0.08 0.08Ammonium 5.64 - 14.65 - - - - 14.65 5.64 0.87 0.87 0.87 0.87 33.10 5.38 14.65 0.87 0.13 0.13
Aluminum 0.012 - 0.374 - 17.700 - - 0.374 0.012 0.001 0.001 0.001 0.001 0.249 0.045 0.374 0.001 <0.001 <0.001Arsenic 0.004 0.067 0.045 - 0.031 - - 0.045 0.004 0.045 0.045 0.045 0.045 0.050 0.009 0.045 0.045 <0.001 <0.001Barium 0.001 0.011 0.004 0.050 0.004 - - 0.004 0.001 0.003 0.003 0.003 0.003 0.018 0.003 0.004 0.003 <0.001 <0.001Cadmium - - 0.000 - 0.001 - - 0.000 - - - - - 0.000 0.000 0.000 - <0.001 <0.001Chromium - - 0.004 - 0.012 - - 0.004 - 0.004 0.004 0.004 0.004 0.002 0.000 0.004 0.004 <0.001 <0.001Copper - - 4.003 - 61.300 - - 4.003 - 2.930 2.930 2.930 2.930 0.549 0.100 4.003 2.930 <0.001 <0.001Iron (+2) 0.002 1.130 0.000 - - - - 0.000 0.002 - - - - 0.005 0.001 0.000 - <0.001 <0.001Iron (+3) - - 0.014 - 0.636 - - 0.014 - - - - - 0.027 0.005 0.014 - <0.001 <0.001Lead - - 0.092 - 0.027 - - 0.092 - 0.096 0.096 0.096 0.096 0.048 0.009 0.092 0.096 <0.001 <0.001Manganese 0.165 0.025 0.093 - 2.730 - - 0.093 0.165 0.001 0.001 0.001 0.001 0.820 0.150 0.093 0.001 <0.001 <0.001Nickel 0.007 0.001 0.195 - 8.500 - - 0.195 0.007 0.016 0.016 0.016 0.016 0.133 0.024 0.195 0.016 <0.001 <0.001Strontium 10.500 14.500 4.247 0.140 2.620 - - 4.247 10.500 2.000 2.000 2.000 2.000 52.905 9.650 4.247 2.000 0.010 0.010Zinc 0.030 0.010 0.259 - 0.826 - - 0.259 0.030 0.248 0.248 0.248 0.248 0.275 0.050 0.259 0.248 <0.001 <0.001
GasesAmmonia 0 - 0.01 - - - - 0.01 0.01 12.59 12.59 12.6 12.6 0.11 0.76 0.01 12.59 0.00 0.01Carbon Dioxide 60 30 170 14 10,421 5 - 170 60 0 0 0.0 0.0 247 1 170 0 1 1
Other - -TSS 150 10 7 26 150 150 - 7 - 4 4 4.0 4.0 1 0 7 4 <0.001 <0.001TDS (sum of ions) 889 708 2,209 350 1,258 49 - 2,209 889 1,979 1,979 1,978.7 1,978.7 5,973 1,110 2,209 1,979 1.7 163TDS (180 Deg C) 777 575 2,136 221 1,199 34 - 2,136 777 1,977 1,977 1,976.9 1,976.9 5,323 963 2,136 1,977 1.6 103Total Hardness, mg/L CaCO3 560.3 458.6 1,382.5 220.7 715.7 - - 1,382.5 560.3 1,288.1 1,288.1 1,288.1 1,288.1 3,876.7 706.8 1,382.5 1,288.1 0.4 100.4Scaling Indicies
Langelier Saturation Index (0.7) (0.2) (0.9) 0.0 (3.4) - - (0.9) (0.7) 1.9 1.9 1.9 1.9 0.9 1.4 (0.9) 1.9 (7.1) 0.3All values in mg/L, unless noted othewise
APPENDIX V-2
Water Treatment Plant Material Balance (Operational Phase)
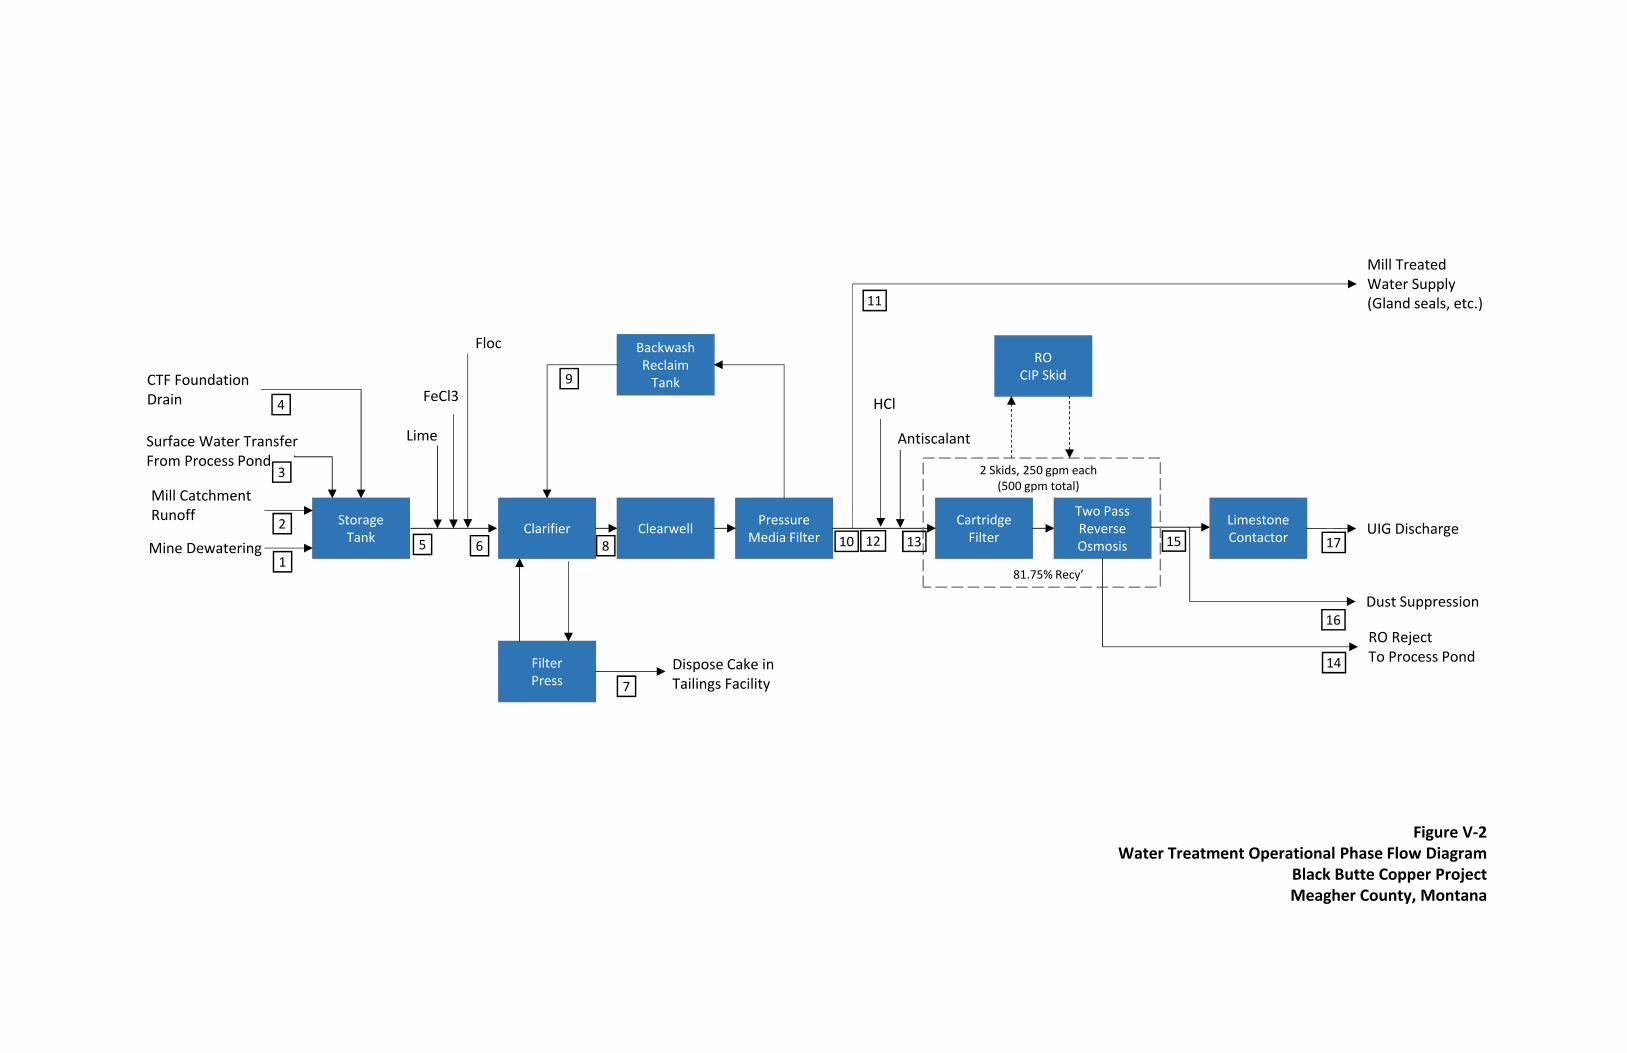
StorageTank Clarifier Clearwell Pressure
Media Filter
Two PassReverseOsmosis
CartridgeFilter
LimestoneContactor UIG Discharge
Mine Dewatering
BackwashReclaim
Tank
FilterPress
Dispose Cake inTailings Facility
ROCIP Skid
FeCl3
Floc
HCl
Antiscalant
Mill CatchmentRunoff
Surface Water TransferFrom Process Pond
RO RejectTo Process Pond
Mill TreatedWater Supply(Gland seals, etc.)
81.75% Recy’
CTF FoundationDrain
Dust Suppression
2 Skids, 250 gpm each(500 gpm total)
Figure V-2Water Treatment Operational Phase Flow Diagram
Black Butte Copper ProjectMeagher County, Montana
Lime
2
3
4
5 6
7
8
9
10
11
12 13
14
115
16
17
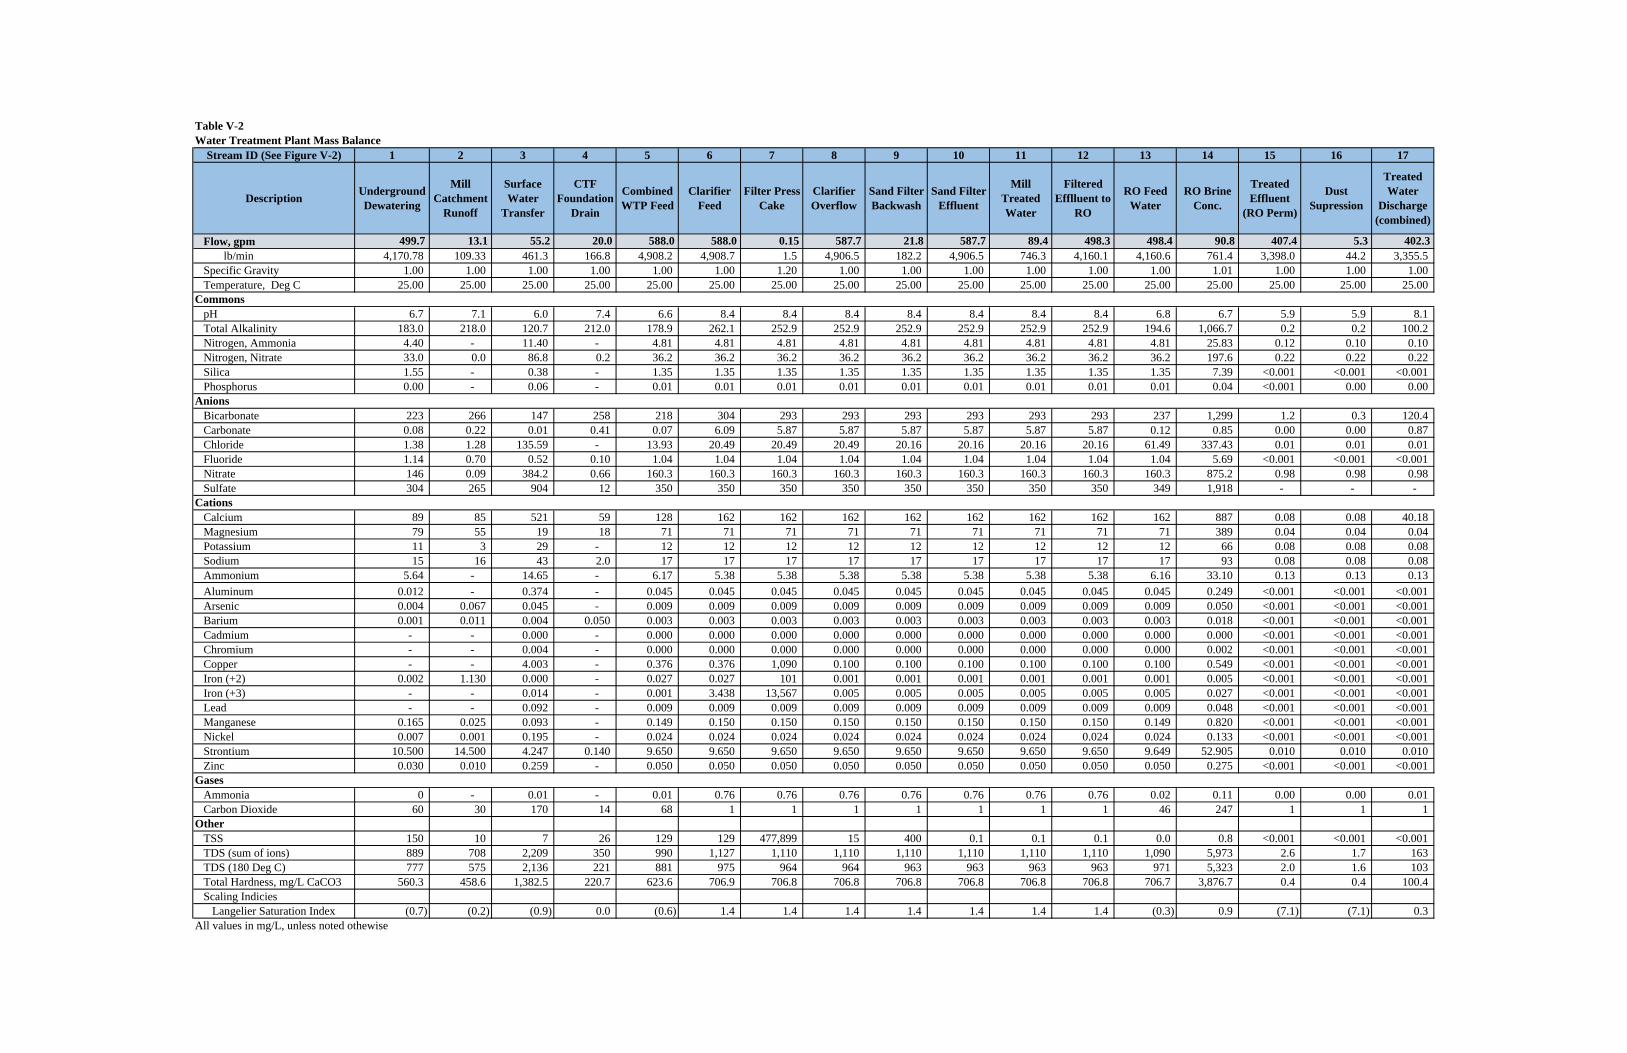
Table V-2Water Treatment Plant Mass Balance
Stream ID (See Figure V-2) 1 2 3 4 5 6 7 8 9 10 11 12 13 14 15 16 17
DescriptionUndergroundDewatering
MillCatchment
Runoff
SurfaceWater
Transfer
CTFFoundation
Drain
CombinedWTP Feed
ClarifierFeed
Filter PressCake
ClarifierOverflow
Sand FilterBackwash
Sand FilterEffluent
MillTreatedWater
FilteredEfflluent to
RO
RO FeedWater
RO BrineConc.
TreatedEffluent
(RO Perm)
DustSupression
TreatedWater
Discharge(combined)
Flow, gpm 499.7 13.1 55.2 20.0 588.0 588.0 0.15 587.7 21.8 587.7 89.4 498.3 498.4 90.8 407.4 5.3 402.3 lb/min 4,170.78 109.33 461.3 166.8 4,908.2 4,908.7 1.5 4,906.5 182.2 4,906.5 746.3 4,160.1 4,160.6 761.4 3,398.0 44.2 3,355.5
Specific Gravity 1.00 1.00 1.00 1.00 1.00 1.00 1.20 1.00 1.00 1.00 1.00 1.00 1.00 1.01 1.00 1.00 1.00Temperature, Deg C 25.00 25.00 25.00 25.00 25.00 25.00 25.00 25.00 25.00 25.00 25.00 25.00 25.00 25.00 25.00 25.00 25.00
CommonspH 6.7 7.1 6.0 7.4 6.6 8.4 8.4 8.4 8.4 8.4 8.4 8.4 6.8 6.7 5.9 5.9 8.1Total Alkalinity 183.0 218.0 120.7 212.0 178.9 262.1 252.9 252.9 252.9 252.9 252.9 252.9 194.6 1,066.7 0.2 0.2 100.2Nitrogen, Ammonia 4.40 - 11.40 - 4.81 4.81 4.81 4.81 4.81 4.81 4.81 4.81 4.81 25.83 0.12 0.10 0.10Nitrogen, Nitrate 33.0 0.0 86.8 0.2 36.2 36.2 36.2 36.2 36.2 36.2 36.2 36.2 36.2 197.6 0.22 0.22 0.22Silica 1.55 - 0.38 - 1.35 1.35 1.35 1.35 1.35 1.35 1.35 1.35 1.35 7.39 <0.001 <0.001 <0.001Phosphorus 0.00 - 0.06 - 0.01 0.01 0.01 0.01 0.01 0.01 0.01 0.01 0.01 0.04 <0.001 0.00 0.00
AnionsBicarbonate 223 266 147 258 218 304 293 293 293 293 293 293 237 1,299 1.2 0.3 120.4Carbonate 0.08 0.22 0.01 0.41 0.07 6.09 5.87 5.87 5.87 5.87 5.87 5.87 0.12 0.85 0.00 0.00 0.87Chloride 1.38 1.28 135.59 - 13.93 20.49 20.49 20.49 20.16 20.16 20.16 20.16 61.49 337.43 0.01 0.01 0.01Fluoride 1.14 0.70 0.52 0.10 1.04 1.04 1.04 1.04 1.04 1.04 1.04 1.04 1.04 5.69 <0.001 <0.001 <0.001Nitrate 146 0.09 384.2 0.66 160.3 160.3 160.3 160.3 160.3 160.3 160.3 160.3 160.3 875.2 0.98 0.98 0.98Sulfate 304 265 904 12 350 350 350 350 350 350 350 350 349 1,918 - - -
CationsCalcium 89 85 521 59 128 162 162 162 162 162 162 162 162 887 0.08 0.08 40.18Magnesium 79 55 19 18 71 71 71 71 71 71 71 71 71 389 0.04 0.04 0.04Potassium 11 3 29 - 12 12 12 12 12 12 12 12 12 66 0.08 0.08 0.08Sodium 15 16 43 2.0 17 17 17 17 17 17 17 17 17 93 0.08 0.08 0.08Ammonium 5.64 - 14.65 - 6.17 5.38 5.38 5.38 5.38 5.38 5.38 5.38 6.16 33.10 0.13 0.13 0.13
Aluminum 0.012 - 0.374 - 0.045 0.045 0.045 0.045 0.045 0.045 0.045 0.045 0.045 0.249 <0.001 <0.001 <0.001Arsenic 0.004 0.067 0.045 - 0.009 0.009 0.009 0.009 0.009 0.009 0.009 0.009 0.009 0.050 <0.001 <0.001 <0.001Barium 0.001 0.011 0.004 0.050 0.003 0.003 0.003 0.003 0.003 0.003 0.003 0.003 0.003 0.018 <0.001 <0.001 <0.001Cadmium - - 0.000 - 0.000 0.000 0.000 0.000 0.000 0.000 0.000 0.000 0.000 0.000 <0.001 <0.001 <0.001Chromium - - 0.004 - 0.000 0.000 0.000 0.000 0.000 0.000 0.000 0.000 0.000 0.002 <0.001 <0.001 <0.001Copper - - 4.003 - 0.376 0.376 1,090 0.100 0.100 0.100 0.100 0.100 0.100 0.549 <0.001 <0.001 <0.001Iron (+2) 0.002 1.130 0.000 - 0.027 0.027 101 0.001 0.001 0.001 0.001 0.001 0.001 0.005 <0.001 <0.001 <0.001Iron (+3) - - 0.014 - 0.001 3.438 13,567 0.005 0.005 0.005 0.005 0.005 0.005 0.027 <0.001 <0.001 <0.001Lead - - 0.092 - 0.009 0.009 0.009 0.009 0.009 0.009 0.009 0.009 0.009 0.048 <0.001 <0.001 <0.001Manganese 0.165 0.025 0.093 - 0.149 0.150 0.150 0.150 0.150 0.150 0.150 0.150 0.149 0.820 <0.001 <0.001 <0.001Nickel 0.007 0.001 0.195 - 0.024 0.024 0.024 0.024 0.024 0.024 0.024 0.024 0.024 0.133 <0.001 <0.001 <0.001Strontium 10.500 14.500 4.247 0.140 9.650 9.650 9.650 9.650 9.650 9.650 9.650 9.650 9.649 52.905 0.010 0.010 0.010Zinc 0.030 0.010 0.259 - 0.050 0.050 0.050 0.050 0.050 0.050 0.050 0.050 0.050 0.275 <0.001 <0.001 <0.001
GasesAmmonia 0 - 0.01 - 0.01 0.76 0.76 0.76 0.76 0.76 0.76 0.76 0.02 0.11 0.00 0.00 0.01Carbon Dioxide 60 30 170 14 68 1 1 1 1 1 1 1 46 247 1 1 1
OtherTSS 150 10 7 26 129 129 477,899 15 400 0.1 0.1 0.1 0.0 0.8 <0.001 <0.001 <0.001TDS (sum of ions) 889 708 2,209 350 990 1,127 1,110 1,110 1,110 1,110 1,110 1,110 1,090 5,973 2.6 1.7 163TDS (180 Deg C) 777 575 2,136 221 881 975 964 964 963 963 963 963 971 5,323 2.0 1.6 103Total Hardness, mg/L CaCO3 560.3 458.6 1,382.5 220.7 623.6 706.9 706.8 706.8 706.8 706.8 706.8 706.8 706.7 3,876.7 0.4 0.4 100.4Scaling Indicies
Langelier Saturation Index (0.7) (0.2) (0.9) 0.0 (0.6) 1.4 1.4 1.4 1.4 1.4 1.4 1.4 (0.3) 0.9 (7.1) (7.1) 0.3All values in mg/L, unless noted othewise

APPENDIX V-3
Reverse Osmosis and Antiscalant Model Outputs (Operational Phase)
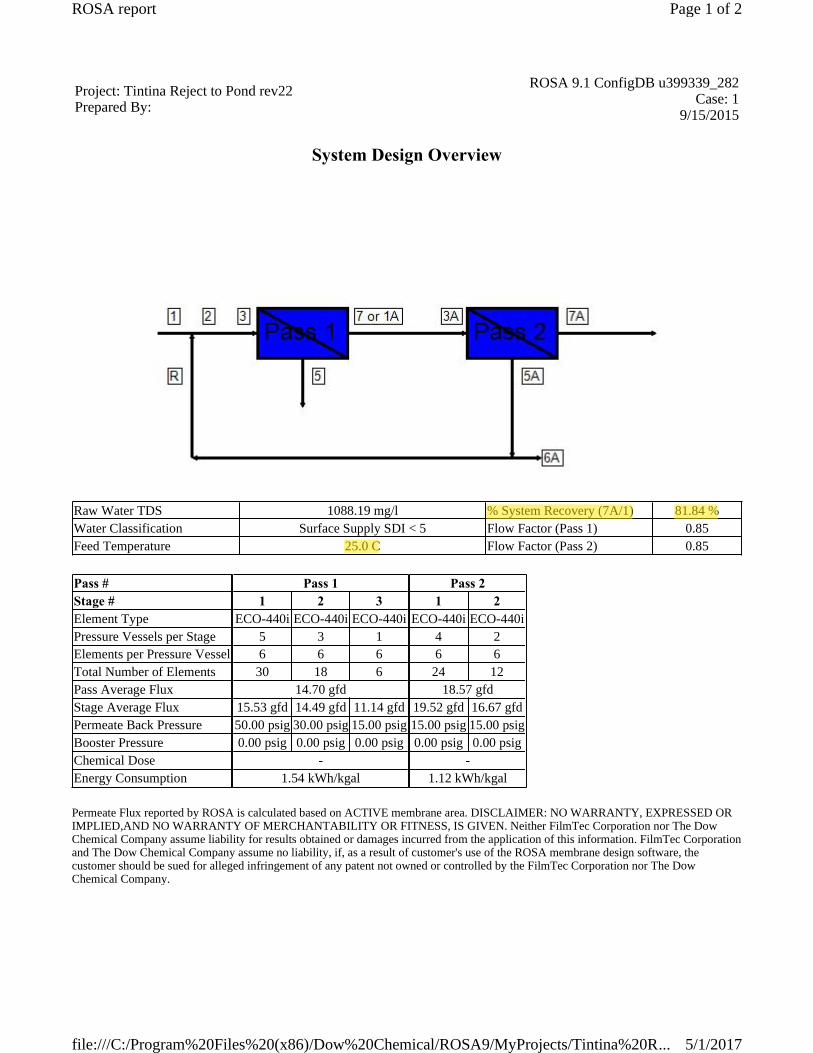
System Design Overview
Permeate Flux reported by ROSA is calculated based on ACTIVE membrane area. DISCLAIMER: NO WARRANTY, EXPRESSED ORIMPLIED,AND NO WARRANTY OF MERCHANTABILITY OR FITNESS, IS GIVEN. Neither FilmTec Corporation nor The DowChemical Company assume liability for results obtained or damages incurred from the application of this information. FilmTec Corporationand The Dow Chemical Company assume no liability, if, as a result of customer's use of the ROSA membrane design software, thecustomer should be sued for alleged infringement of any patent not owned or controlled by the FilmTec Corporation nor The DowChemical Company.
Project: Tintina Reject to Pond rev22Prepared By:
ROSA 9.1 ConfigDB u399339_282Case: 1
9/15/2015
Raw Water TDS 1088.19 mg/l % System Recovery (7A/1) 81.84 %Water Classification Surface Supply SDI < 5 Flow Factor (Pass 1) 0.85Feed Temperature 25.0 C Flow Factor (Pass 2) 0.85
Pass #Stage #Element TypePressure Vessels per StageElements per Pressure VesselTotal Number of ElementsPass Average FluxStage Average FluxPermeate Back PressureBooster PressureChemical DoseEnergy Consumption
Pass 11 2 3
ECO-440i ECO-440i ECO-440i5 3 16 6 6
30 18 614.70 gfd
15.53 gfd 14.49 gfd 11.14 gfd50.00 psig 30.00 psig 15.00 psig0.00 psig 0.00 psig 0.00 psig
-1.54 kWh/kgal
Pass 21 2
ECO-440i ECO-440i4 26 6
24 1218.57 gfd
19.52 gfd 16.67 gfd15.00 psig 15.00 psig0.00 psig 0.00 psig
-1.12 kWh/kgal
Page 1 of 2ROSA report
5/1/2017file:///C:/Program%20Files%20(x86)/Dow%20Chemical/ROSA9/MyProjects/Tintina%20R...
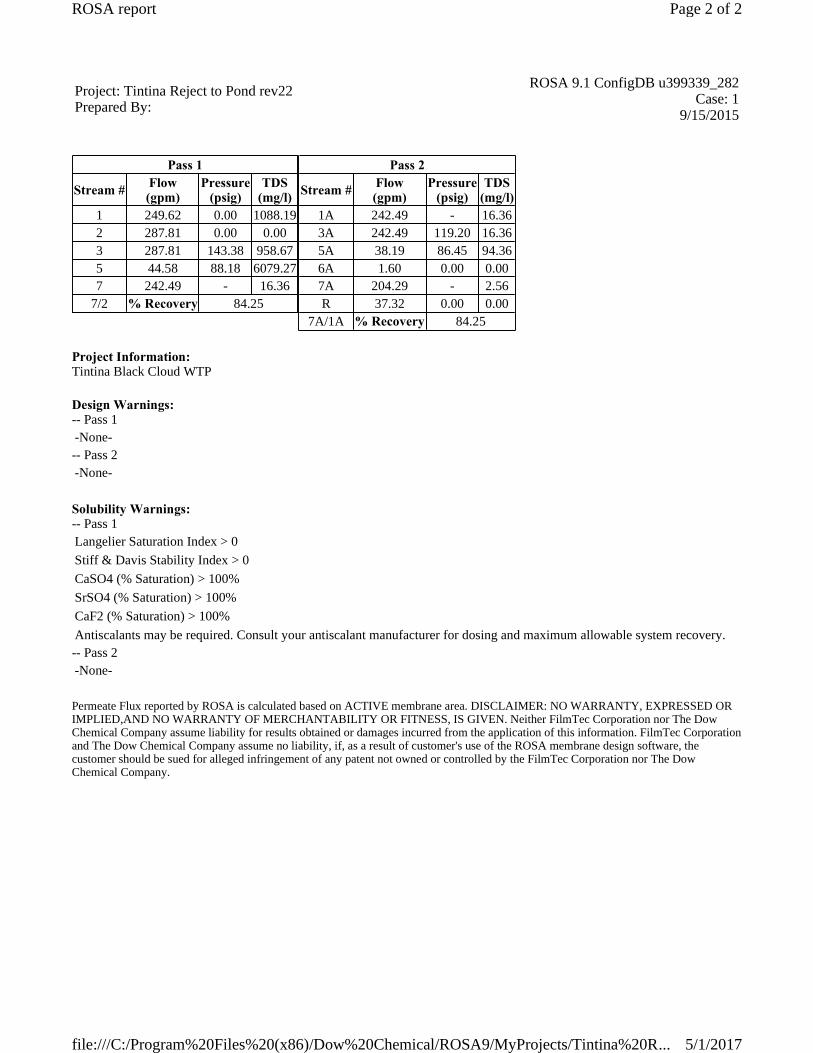
Project Information:Tintina Black Cloud WTP
Design Warnings:-- Pass 1
-- Pass 2
Solubility Warnings:-- Pass 1
-- Pass 2
Permeate Flux reported by ROSA is calculated based on ACTIVE membrane area. DISCLAIMER: NO WARRANTY, EXPRESSED ORIMPLIED,AND NO WARRANTY OF MERCHANTABILITY OR FITNESS, IS GIVEN. Neither FilmTec Corporation nor The DowChemical Company assume liability for results obtained or damages incurred from the application of this information. FilmTec Corporationand The Dow Chemical Company assume no liability, if, as a result of customer's use of the ROSA membrane design software, thecustomer should be sued for alleged infringement of any patent not owned or controlled by the FilmTec Corporation nor The DowChemical Company.
Project: Tintina Reject to Pond rev22Prepared By:
ROSA 9.1 ConfigDB u399339_282Case: 1
9/15/2015
Pass 1
Stream # Flow(gpm)
Pressure(psig)
TDS(mg/l)
1 249.62 0.00 1088.192 287.81 0.00 0.003 287.81 143.38 958.675 44.58 88.18 6079.277 242.49 - 16.36
7/2 % Recovery 84.25
Pass 2
Stream # Flow(gpm)
Pressure(psig)
TDS(mg/l)
1A 242.49 - 16.363A 242.49 119.20 16.365A 38.19 86.45 94.366A 1.60 0.00 0.007A 204.29 - 2.56R 37.32 0.00 0.00
7A/1A % Recovery 84.25
-None-
-None-
Langelier Saturation Index > 0Stiff & Davis Stability Index > 0CaSO4 (% Saturation) > 100%SrSO4 (% Saturation) > 100%CaF2 (% Saturation) > 100%Antiscalants may be required. Consult your antiscalant manufacturer for dosing and maximum allowable system recovery.
-None-
Page 2 of 2ROSA report
5/1/2017file:///C:/Program%20Files%20(x86)/Dow%20Chemical/ROSA9/MyProjects/Tintina%20R...

Project Information: Tintina Black Cloud WTP
Case-specific: Temp = 25 C 50% Capacity x 2 81.75% Recovery Reject to Paste Plant
System Details -- Pass 1
*Permeate Flux reported by ROSA is calculated based on ACTIVE membrane area. DISCLAIMER: NO WARRANTY, EXPRESSED OR IMPLIED, ANDNO WARRANTY OF MERCHANTABILITY OR FITNESS FOR A PARTICULAR PURPOSE, IS GIVEN. Neither FilmTec Corporation nor The DowChemical Company assume any obligation or liability for results obtained or damages incurred from the application of this information. Because useconditions and applicable laws may differ from one location to another and may change with time, customer is responsible for determining whether productsare appropriate for customer’s use. FilmTec Corporation and The Dow Chemical Company assume no liability, if, as a result of customer's use of the ROSAmembrane design software, the customer should be sued for alleged infringement of any patent not owned or controlled by the FilmTec Corporation nor TheDow Chemical Company.
Reverse Osmosis System Analysis for FILMTEC™ Membranes ROSA 9.1 ConfigDB u399339_282Project: Tintina Reject to Pond rev22 Case: 1, 9/15/2015
Feed Flow to Stage 1 287.81 gpm Pass 1 Permeate Flow 242.49 gpm Osmotic Pressure:Raw Water Flow to System 249.62 gpm Pass 1 Recovery 84.25 % Feed 0.00 psigFeed Pressure 143.38 psig Feed Temperature 25.0 C Concentrate 32.15 psigFlow Factor 0.85 Feed TDS 0.00 mg/l Average 16.08 psigChem. Dose None Number of Elements 54 Average NDP 109.37 psigTotal Active Area 23760.00 ft² Average Pass 1 Flux 14.70 gfd Power 22.38 kWWater Classification: Surface Supply SDI < 5 Specific Energy 1.54 kWh/kgalSystem Recovery 81.84 % Conc. Flow from Pass 2 38.19 gpm
Stage Element #PV #EleFeedFlow
(gpm)
FeedPress(psig)
RecircFlow
(gpm)
ConcFlow
(gpm)
ConcPress(psig)
PermFlow
(gpm)
AvgFlux(gfd)
PermPress(psig)
BoostPress(psig)
PermTDS
(mg/l)1 ECO-440i 5 6 287.81 138.38 0.00 144.71 125.40 142.36 15.53 50.00 0.00 7.602 ECO-440i 3 6 144.71 120.40 0.00 65.00 110.52 79.71 14.49 30.00 0.00 21.613 ECO-440i 1 6 65.00 105.52 0.00 44.58 88.18 20.42 11.14 15.00 0.00 58.38
Pass Streams(mg/l as Ion)
Name FeedAdjusted Feed Concentrate Permeate
Initial After Recycles Stage 1 Stage 2 Stage 3 Stage 1 Stage 2 Stage 3 TotalNH4+ + NH3 6.13 6.15 5.65 11.04 23.82 33.97 0.22 0.61 1.65 0.47K 12.00 12.00 10.85 21.29 46.47 66.81 0.24 0.75 2.09 0.56Na 17.00 17.00 15.31 30.07 65.80 94.78 0.30 0.93 2.53 0.70Mg 71.00 71.00 62.28 123.26 273.29 397.34 0.29 0.91 2.49 0.68Ca 162.00 162.00 142.08 281.21 623.55 906.62 0.65 2.04 5.61 1.52Sr 9.65 9.65 8.46 16.75 37.14 54.00 0.04 0.12 0.33 0.09Ba 0.00 0.00 0.00 0.00 0.00 0.00 0.00 0.00 0.00 0.00CO3 0.16 0.16 0.12 0.56 3.46 8.16 0.00 0.00 0.00 0.00HCO3 237.00 237.00 208.69 412.09 908.07 1312.76 2.04 4.34 10.98 3.43NO3 160.10 160.10 144.59 283.75 619.85 891.63 3.13 9.67 26.56 7.25Cl 61.00 61.00 53.39 105.74 234.71 341.49 0.18 0.57 1.61 0.43F 1.00 1.00 0.88 1.74 3.85 5.60 0.00 0.01 0.04 0.01SO4 349.75 349.75 305.15 604.83 1344.46 1958.29 0.52 1.66 4.49 1.23SiO2 1.40 1.40 1.22 2.42 5.38 7.84 0.00 0.01 0.02 0.01Boron 0.00 0.00 0.00 0.00 0.00 0.00 0.00 0.00 0.00 0.00CO2 43.33 43.33 43.36 43.56 44.85 46.86 42.85 43.56 45.34 43.38TDS 1088.19 1088.21 958.67 1894.74 4189.83 6079.27 7.60 21.61 58.38 16.36pH 6.80 6.80 6.75 7.00 7.27 7.37 4.89 5.20 5.57 5.10
Page 1 of 5ROSA Detailed Report
5/1/2017file:///C:/Program%20Files%20(x86)/Dow%20Chemical/ROSA9/MyProjects/Tintina%20R...

Design Warnings -- Pass 1
Solubility Warnings -- Pass 1
Stage Details -- Pass 1
Permeate Flux reported by ROSA is calculated based on ACTIVE membrane area. DISCLAIMER: NO WARRANTY, EXPRESSED OR IMPLIED, ANDNO WARRANTY OF MERCHANTABILITY OR FITNESS FOR A PARTICULAR PURPOSE, IS GIVEN. Neither FilmTec Corporation nor The DowChemical Company assume any obligation or liability for results obtained or damages incurred from the application of this information. Because useconditions and applicable laws may differ from one location to another and may change with time, customer is responsible for determining whether productsare appropriate for customer’s use. FilmTec Corporation and The Dow Chemical Company assume no liability, if, as a result of customer's use of the ROSAmembrane design software, the customer should be sued for alleged infringement of any patent not owned or controlled by the FilmTec Corporation nor TheDow Chemical Company.
Reverse Osmosis System Analysis for FILMTEC™ Membranes ROSA 9.1 ConfigDB u399339_282Project: Tintina Reject to Pond rev22 Case: 1, 9/15/2015
-None-
Langelier Saturation Index > 0Stiff & Davis Stability Index > 0CaSO4 (% Saturation) > 100%SrSO4 (% Saturation) > 100%CaF2 (% Saturation) > 100%Antiscalants may be required. Consult your antiscalant manufacturer for dosing and maximum allowable system recovery.
Stage 1 Element Recovery Perm Flow(gpm)
Perm TDS(mg/l)
Feed Flow(gpm)
Feed TDS(mg/l)
Feed Press(psig)
1 0.09 5.21 5.03 57.41 958.67 138.382 0.10 5.00 5.78 52.20 1053.95 135.453 0.10 4.81 6.71 47.20 1165.00 132.864 0.11 4.64 7.91 42.40 1296.35 130.575 0.12 4.48 9.48 37.76 1454.57 128.586 0.13 4.34 11.60 33.28 1649.21 126.86
Stage 2 Element Recovery Perm Flow(gpm)
Perm TDS(mg/l)
Feed Flow(gpm)
Feed TDS(mg/l)
Feed Press(psig)
1 0.11 5.13 11.78 48.24 1894.74 120.402 0.11 4.87 14.40 43.11 2118.80 118.063 0.12 4.60 17.93 38.23 2386.87 116.034 0.13 4.31 22.82 33.63 2710.93 114.285 0.14 4.00 29.71 29.32 3106.24 112.806 0.14 3.65 39.68 25.32 3591.85 111.55
Stage 3 Element Recovery Perm Flow(gpm)
Perm TDS(mg/l)
Feed Flow(gpm)
Feed TDS(mg/l)
Feed Press(psig)
1 0.06 4.11 39.60 65.00 4189.83 105.522 0.06 3.80 46.31 60.89 4469.75 102.043 0.06 3.52 54.14 57.08 4764.20 98.824 0.06 3.25 63.24 53.57 5072.92 95.855 0.06 2.99 73.82 50.32 5395.53 93.106 0.06 2.75 86.06 47.33 5731.27 90.55
Page 2 of 5ROSA Detailed Report
5/1/2017file:///C:/Program%20Files%20(x86)/Dow%20Chemical/ROSA9/MyProjects/Tintina%20R...
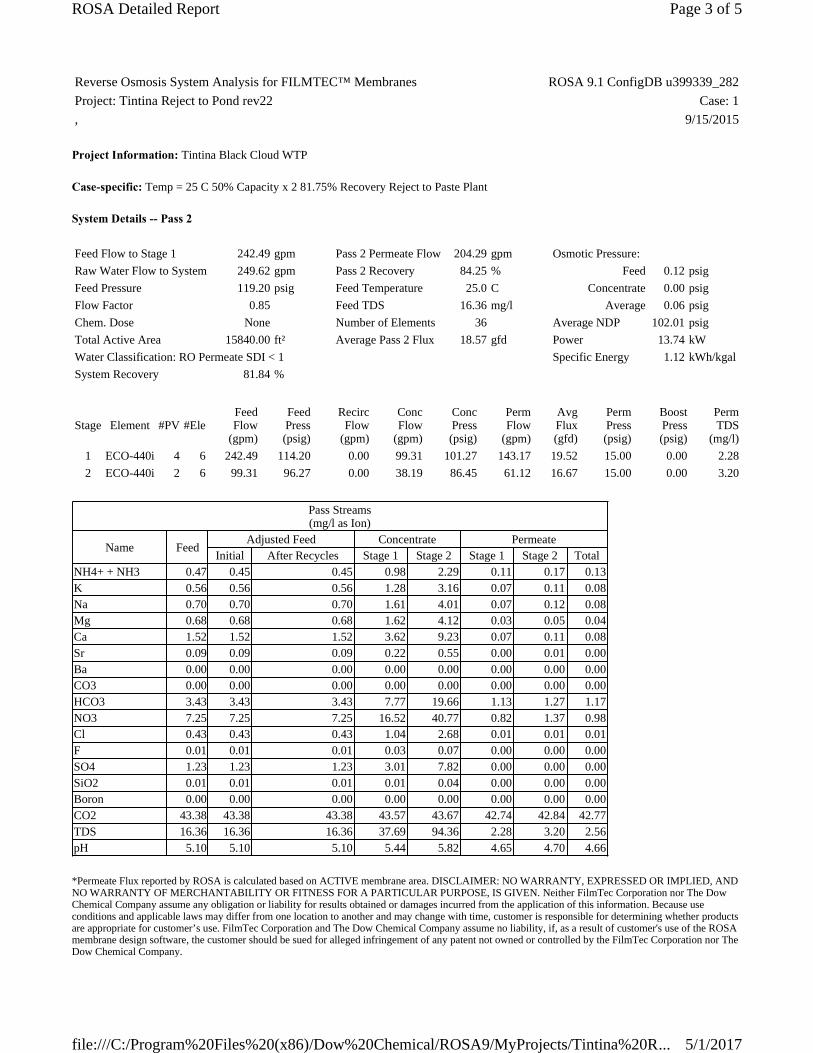
Project Information: Tintina Black Cloud WTP
Case-specific: Temp = 25 C 50% Capacity x 2 81.75% Recovery Reject to Paste Plant
System Details -- Pass 2
*Permeate Flux reported by ROSA is calculated based on ACTIVE membrane area. DISCLAIMER: NO WARRANTY, EXPRESSED OR IMPLIED, ANDNO WARRANTY OF MERCHANTABILITY OR FITNESS FOR A PARTICULAR PURPOSE, IS GIVEN. Neither FilmTec Corporation nor The DowChemical Company assume any obligation or liability for results obtained or damages incurred from the application of this information. Because useconditions and applicable laws may differ from one location to another and may change with time, customer is responsible for determining whether productsare appropriate for customer’s use. FilmTec Corporation and The Dow Chemical Company assume no liability, if, as a result of customer's use of the ROSAmembrane design software, the customer should be sued for alleged infringement of any patent not owned or controlled by the FilmTec Corporation nor TheDow Chemical Company.
Reverse Osmosis System Analysis for FILMTEC™ Membranes ROSA 9.1 ConfigDB u399339_282Project: Tintina Reject to Pond rev22 Case: 1, 9/15/2015
Feed Flow to Stage 1 242.49 gpm Pass 2 Permeate Flow 204.29 gpm Osmotic Pressure:Raw Water Flow to System 249.62 gpm Pass 2 Recovery 84.25 % Feed 0.12 psigFeed Pressure 119.20 psig Feed Temperature 25.0 C Concentrate 0.00 psigFlow Factor 0.85 Feed TDS 16.36 mg/l Average 0.06 psigChem. Dose None Number of Elements 36 Average NDP 102.01 psigTotal Active Area 15840.00 ft² Average Pass 2 Flux 18.57 gfd Power 13.74 kWWater Classification: RO Permeate SDI < 1 Specific Energy 1.12 kWh/kgalSystem Recovery 81.84 %
Stage Element #PV #EleFeedFlow
(gpm)
FeedPress(psig)
RecircFlow
(gpm)
ConcFlow
(gpm)
ConcPress(psig)
PermFlow
(gpm)
AvgFlux(gfd)
PermPress(psig)
BoostPress(psig)
PermTDS
(mg/l)1 ECO-440i 4 6 242.49 114.20 0.00 99.31 101.27 143.17 19.52 15.00 0.00 2.282 ECO-440i 2 6 99.31 96.27 0.00 38.19 86.45 61.12 16.67 15.00 0.00 3.20
Pass Streams(mg/l as Ion)
Name FeedAdjusted Feed Concentrate Permeate
Initial After Recycles Stage 1 Stage 2 Stage 1 Stage 2 TotalNH4+ + NH3 0.47 0.45 0.45 0.98 2.29 0.11 0.17 0.13K 0.56 0.56 0.56 1.28 3.16 0.07 0.11 0.08Na 0.70 0.70 0.70 1.61 4.01 0.07 0.12 0.08Mg 0.68 0.68 0.68 1.62 4.12 0.03 0.05 0.04Ca 1.52 1.52 1.52 3.62 9.23 0.07 0.11 0.08Sr 0.09 0.09 0.09 0.22 0.55 0.00 0.01 0.00Ba 0.00 0.00 0.00 0.00 0.00 0.00 0.00 0.00CO3 0.00 0.00 0.00 0.00 0.00 0.00 0.00 0.00HCO3 3.43 3.43 3.43 7.77 19.66 1.13 1.27 1.17NO3 7.25 7.25 7.25 16.52 40.77 0.82 1.37 0.98Cl 0.43 0.43 0.43 1.04 2.68 0.01 0.01 0.01F 0.01 0.01 0.01 0.03 0.07 0.00 0.00 0.00SO4 1.23 1.23 1.23 3.01 7.82 0.00 0.00 0.00SiO2 0.01 0.01 0.01 0.01 0.04 0.00 0.00 0.00Boron 0.00 0.00 0.00 0.00 0.00 0.00 0.00 0.00CO2 43.38 43.38 43.38 43.57 43.67 42.74 42.84 42.77TDS 16.36 16.36 16.36 37.69 94.36 2.28 3.20 2.56pH 5.10 5.10 5.10 5.44 5.82 4.65 4.70 4.66
Page 3 of 5ROSA Detailed Report
5/1/2017file:///C:/Program%20Files%20(x86)/Dow%20Chemical/ROSA9/MyProjects/Tintina%20R...
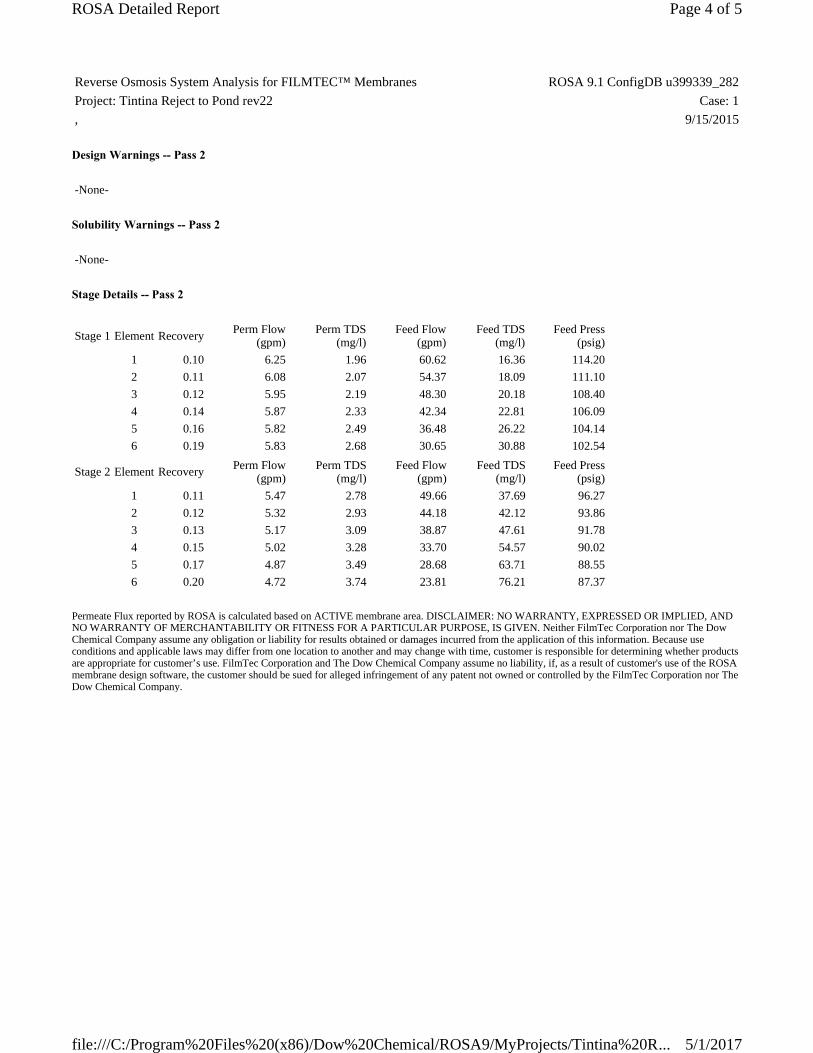
Design Warnings -- Pass 2
Solubility Warnings -- Pass 2
Stage Details -- Pass 2
Permeate Flux reported by ROSA is calculated based on ACTIVE membrane area. DISCLAIMER: NO WARRANTY, EXPRESSED OR IMPLIED, ANDNO WARRANTY OF MERCHANTABILITY OR FITNESS FOR A PARTICULAR PURPOSE, IS GIVEN. Neither FilmTec Corporation nor The DowChemical Company assume any obligation or liability for results obtained or damages incurred from the application of this information. Because useconditions and applicable laws may differ from one location to another and may change with time, customer is responsible for determining whether productsare appropriate for customer’s use. FilmTec Corporation and The Dow Chemical Company assume no liability, if, as a result of customer's use of the ROSAmembrane design software, the customer should be sued for alleged infringement of any patent not owned or controlled by the FilmTec Corporation nor TheDow Chemical Company.
Reverse Osmosis System Analysis for FILMTEC™ Membranes ROSA 9.1 ConfigDB u399339_282Project: Tintina Reject to Pond rev22 Case: 1, 9/15/2015
-None-
-None-
Stage 1 Element Recovery Perm Flow(gpm)
Perm TDS(mg/l)
Feed Flow(gpm)
Feed TDS(mg/l)
Feed Press(psig)
1 0.10 6.25 1.96 60.62 16.36 114.202 0.11 6.08 2.07 54.37 18.09 111.103 0.12 5.95 2.19 48.30 20.18 108.404 0.14 5.87 2.33 42.34 22.81 106.095 0.16 5.82 2.49 36.48 26.22 104.146 0.19 5.83 2.68 30.65 30.88 102.54
Stage 2 Element Recovery Perm Flow(gpm)
Perm TDS(mg/l)
Feed Flow(gpm)
Feed TDS(mg/l)
Feed Press(psig)
1 0.11 5.47 2.78 49.66 37.69 96.272 0.12 5.32 2.93 44.18 42.12 93.863 0.13 5.17 3.09 38.87 47.61 91.784 0.15 5.02 3.28 33.70 54.57 90.025 0.17 4.87 3.49 28.68 63.71 88.556 0.20 4.72 3.74 23.81 76.21 87.37
Page 4 of 5ROSA Detailed Report
5/1/2017file:///C:/Program%20Files%20(x86)/Dow%20Chemical/ROSA9/MyProjects/Tintina%20R...

Scaling Calculations
To balance: 0.00 mg/l Na added to feed.
Raw Water Pass 1 Adjusted Feed Pass 1 Concentrate Pass 2 ConcentratepH 6.80 6.80 7.37 0.00Langelier Saturation Index -0.23 -0.23 1.78 0.00Stiff & Davis Stability Index 0.03 0.03 1.40 0.00Ionic Strength (Molal) 0.03 0.03 0.15 0.00TDS (mg/l) 1088.19 1088.21 6079.27 0.00HCO3 237.00 237.00 1312.76 0.00CO2 43.32 43.32 46.85 0.00CO3 0.16 0.16 8.16 0.00CaSO4 (% Saturation) 10.71 10.71 116.37 0.00BaSO4 (% Saturation) 0.00 0.00 0.00 0.00SrSO4 (% Saturation) 45.48 45.48 289.77 0.00CaF2 (% Saturation) 21.54 21.54 3775.48 0.00SiO2 (% Saturation) 1.09 1.09 6.27 0.00Mg(OH)2 (% Saturation) 0.00 0.00 0.01 0.00
Page 5 of 5ROSA Detailed Report
5/1/2017file:///C:/Program%20Files%20(x86)/Dow%20Chemical/ROSA9/MyProjects/Tintina%20R...
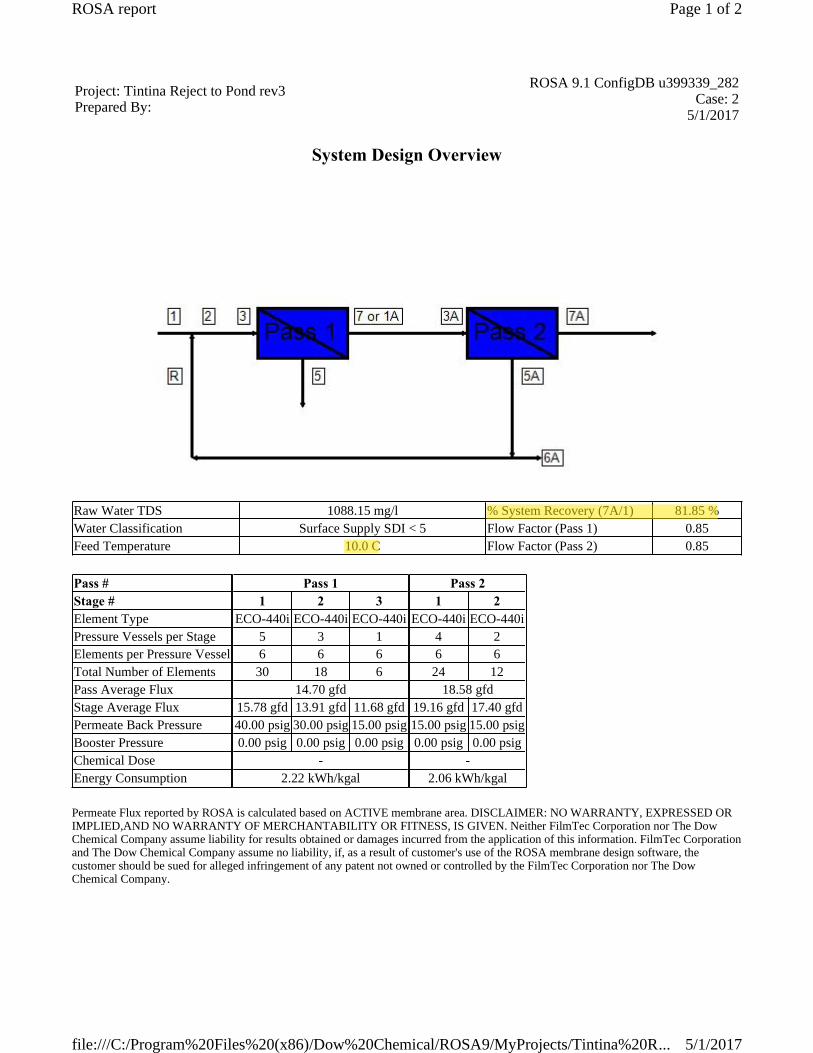
System Design Overview
Permeate Flux reported by ROSA is calculated based on ACTIVE membrane area. DISCLAIMER: NO WARRANTY, EXPRESSED ORIMPLIED,AND NO WARRANTY OF MERCHANTABILITY OR FITNESS, IS GIVEN. Neither FilmTec Corporation nor The DowChemical Company assume liability for results obtained or damages incurred from the application of this information. FilmTec Corporationand The Dow Chemical Company assume no liability, if, as a result of customer's use of the ROSA membrane design software, thecustomer should be sued for alleged infringement of any patent not owned or controlled by the FilmTec Corporation nor The DowChemical Company.
Project: Tintina Reject to Pond rev3Prepared By:
ROSA 9.1 ConfigDB u399339_282Case: 2
5/1/2017
Raw Water TDS 1088.15 mg/l % System Recovery (7A/1) 81.85 %Water Classification Surface Supply SDI < 5 Flow Factor (Pass 1) 0.85Feed Temperature 10.0 C Flow Factor (Pass 2) 0.85
Pass #Stage #Element TypePressure Vessels per StageElements per Pressure VesselTotal Number of ElementsPass Average FluxStage Average FluxPermeate Back PressureBooster PressureChemical DoseEnergy Consumption
Pass 11 2 3
ECO-440i ECO-440i ECO-440i5 3 16 6 6
30 18 614.70 gfd
15.78 gfd 13.91 gfd 11.68 gfd40.00 psig 30.00 psig 15.00 psig0.00 psig 0.00 psig 0.00 psig
-2.22 kWh/kgal
Pass 21 2
ECO-440i ECO-440i4 26 6
24 1218.58 gfd
19.16 gfd 17.40 gfd15.00 psig 15.00 psig0.00 psig 0.00 psig
-2.06 kWh/kgal
Page 1 of 2ROSA report
5/1/2017file:///C:/Program%20Files%20(x86)/Dow%20Chemical/ROSA9/MyProjects/Tintina%20R...

Project Information:Tintina Black Cloud WTP
Design Warnings:-- Pass 1
-- Pass 2
Solubility Warnings:-- Pass 1
-- Pass 2
Permeate Flux reported by ROSA is calculated based on ACTIVE membrane area. DISCLAIMER: NO WARRANTY, EXPRESSED ORIMPLIED,AND NO WARRANTY OF MERCHANTABILITY OR FITNESS, IS GIVEN. Neither FilmTec Corporation nor The DowChemical Company assume liability for results obtained or damages incurred from the application of this information. FilmTec Corporationand The Dow Chemical Company assume no liability, if, as a result of customer's use of the ROSA membrane design software, thecustomer should be sued for alleged infringement of any patent not owned or controlled by the FilmTec Corporation nor The DowChemical Company.
Project: Tintina Reject to Pond rev3Prepared By:
ROSA 9.1 ConfigDB u399339_282Case: 2
5/1/2017
Pass 1
Stream # Flow(gpm)
Pressure(psig)
TDS(mg/l)
1 249.66 0.00 1088.152 287.86 0.00 0.003 287.86 206.15 949.335 45.33 135.84 5991.207 242.54 - 6.86
7/2 % Recovery 84.26
Pass 2
Stream # Flow(gpm)
Pressure(psig)
TDS(mg/l)
1A 242.54 - 6.863A 242.54 206.62 6.865A 38.20 165.31 39.896A 0.88 0.00 0.007A 204.34 - 1.27R 37.32 0.00 0.00
7A/1A % Recovery 84.25
-None-
-None-
Langelier Saturation Index > 0Stiff & Davis Stability Index > 0CaSO4 (% Saturation) > 100%SrSO4 (% Saturation) > 100%CaF2 (% Saturation) > 100%Antiscalants may be required. Consult your antiscalant manufacturer for dosing and maximum allowable system recovery.
-None-
Page 2 of 2ROSA report
5/1/2017file:///C:/Program%20Files%20(x86)/Dow%20Chemical/ROSA9/MyProjects/Tintina%20R...
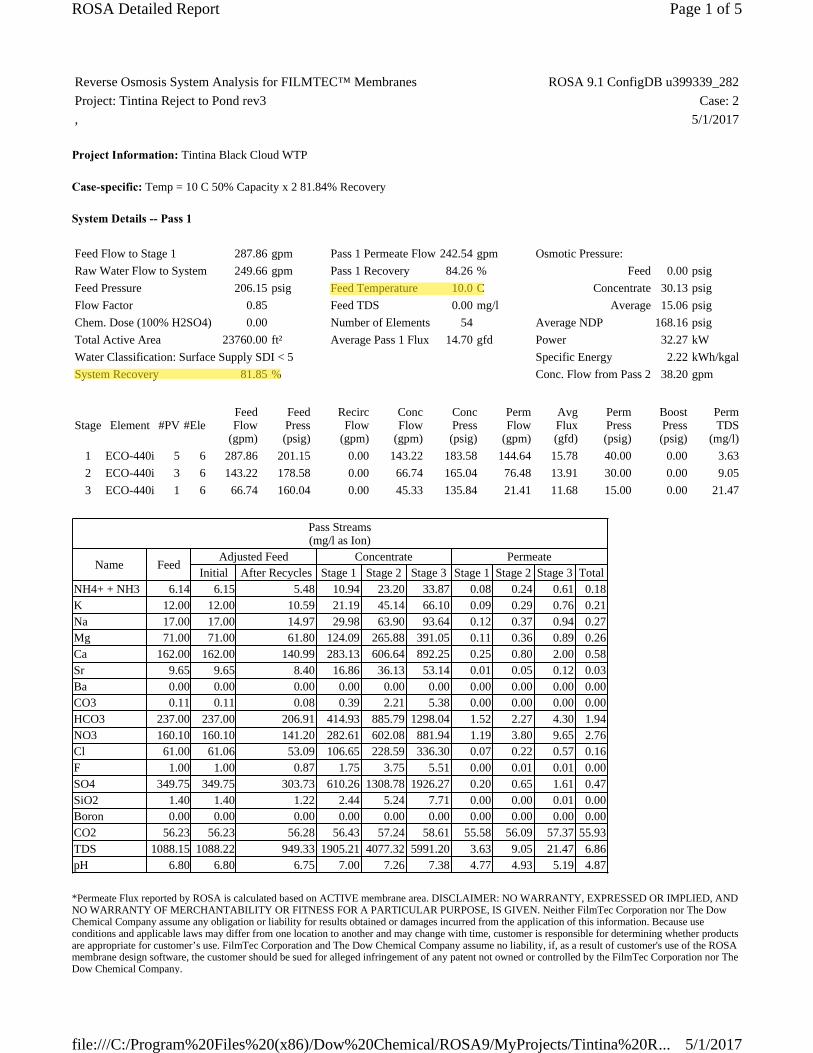
Project Information: Tintina Black Cloud WTP
Case-specific: Temp = 10 C 50% Capacity x 2 81.84% Recovery
System Details -- Pass 1
*Permeate Flux reported by ROSA is calculated based on ACTIVE membrane area. DISCLAIMER: NO WARRANTY, EXPRESSED OR IMPLIED, ANDNO WARRANTY OF MERCHANTABILITY OR FITNESS FOR A PARTICULAR PURPOSE, IS GIVEN. Neither FilmTec Corporation nor The DowChemical Company assume any obligation or liability for results obtained or damages incurred from the application of this information. Because useconditions and applicable laws may differ from one location to another and may change with time, customer is responsible for determining whether productsare appropriate for customer’s use. FilmTec Corporation and The Dow Chemical Company assume no liability, if, as a result of customer's use of the ROSAmembrane design software, the customer should be sued for alleged infringement of any patent not owned or controlled by the FilmTec Corporation nor TheDow Chemical Company.
Reverse Osmosis System Analysis for FILMTEC™ Membranes ROSA 9.1 ConfigDB u399339_282Project: Tintina Reject to Pond rev3 Case: 2, 5/1/2017
Feed Flow to Stage 1 287.86 gpm Pass 1 Permeate Flow 242.54 gpm Osmotic Pressure:Raw Water Flow to System 249.66 gpm Pass 1 Recovery 84.26 % Feed 0.00 psigFeed Pressure 206.15 psig Feed Temperature 10.0 C Concentrate 30.13 psigFlow Factor 0.85 Feed TDS 0.00 mg/l Average 15.06 psigChem. Dose (100% H2SO4) 0.00 Number of Elements 54 Average NDP 168.16 psigTotal Active Area 23760.00 ft² Average Pass 1 Flux 14.70 gfd Power 32.27 kWWater Classification: Surface Supply SDI < 5 Specific Energy 2.22 kWh/kgalSystem Recovery 81.85 % Conc. Flow from Pass 2 38.20 gpm
Stage Element #PV #EleFeedFlow
(gpm)
FeedPress(psig)
RecircFlow
(gpm)
ConcFlow
(gpm)
ConcPress(psig)
PermFlow
(gpm)
AvgFlux(gfd)
PermPress(psig)
BoostPress(psig)
PermTDS
(mg/l)1 ECO-440i 5 6 287.86 201.15 0.00 143.22 183.58 144.64 15.78 40.00 0.00 3.632 ECO-440i 3 6 143.22 178.58 0.00 66.74 165.04 76.48 13.91 30.00 0.00 9.053 ECO-440i 1 6 66.74 160.04 0.00 45.33 135.84 21.41 11.68 15.00 0.00 21.47
Pass Streams(mg/l as Ion)
Name FeedAdjusted Feed Concentrate Permeate
Initial After Recycles Stage 1 Stage 2 Stage 3 Stage 1 Stage 2 Stage 3 TotalNH4+ + NH3 6.14 6.15 5.48 10.94 23.20 33.87 0.08 0.24 0.61 0.18K 12.00 12.00 10.59 21.19 45.14 66.10 0.09 0.29 0.76 0.21Na 17.00 17.00 14.97 29.98 63.90 93.64 0.12 0.37 0.94 0.27Mg 71.00 71.00 61.80 124.09 265.88 391.05 0.11 0.36 0.89 0.26Ca 162.00 162.00 140.99 283.13 606.64 892.25 0.25 0.80 2.00 0.58Sr 9.65 9.65 8.40 16.86 36.13 53.14 0.01 0.05 0.12 0.03Ba 0.00 0.00 0.00 0.00 0.00 0.00 0.00 0.00 0.00 0.00CO3 0.11 0.11 0.08 0.39 2.21 5.38 0.00 0.00 0.00 0.00HCO3 237.00 237.00 206.91 414.93 885.79 1298.04 1.52 2.27 4.30 1.94NO3 160.10 160.10 141.20 282.61 602.08 881.94 1.19 3.80 9.65 2.76Cl 61.00 61.06 53.09 106.65 228.59 336.30 0.07 0.22 0.57 0.16F 1.00 1.00 0.87 1.75 3.75 5.51 0.00 0.01 0.01 0.00SO4 349.75 349.75 303.73 610.26 1308.78 1926.27 0.20 0.65 1.61 0.47SiO2 1.40 1.40 1.22 2.44 5.24 7.71 0.00 0.00 0.01 0.00Boron 0.00 0.00 0.00 0.00 0.00 0.00 0.00 0.00 0.00 0.00CO2 56.23 56.23 56.28 56.43 57.24 58.61 55.58 56.09 57.37 55.93TDS 1088.15 1088.22 949.33 1905.21 4077.32 5991.20 3.63 9.05 21.47 6.86pH 6.80 6.80 6.75 7.00 7.26 7.38 4.77 4.93 5.19 4.87
Page 1 of 5ROSA Detailed Report
5/1/2017file:///C:/Program%20Files%20(x86)/Dow%20Chemical/ROSA9/MyProjects/Tintina%20R...
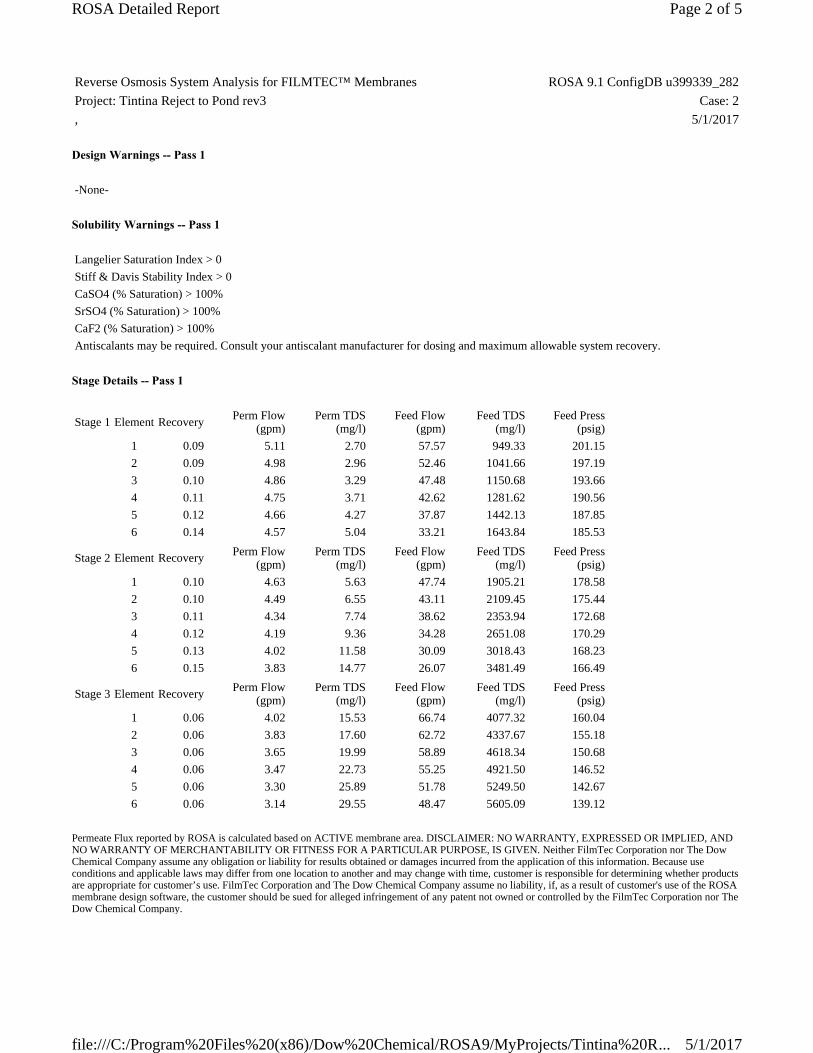
Design Warnings -- Pass 1
Solubility Warnings -- Pass 1
Stage Details -- Pass 1
Permeate Flux reported by ROSA is calculated based on ACTIVE membrane area. DISCLAIMER: NO WARRANTY, EXPRESSED OR IMPLIED, ANDNO WARRANTY OF MERCHANTABILITY OR FITNESS FOR A PARTICULAR PURPOSE, IS GIVEN. Neither FilmTec Corporation nor The DowChemical Company assume any obligation or liability for results obtained or damages incurred from the application of this information. Because useconditions and applicable laws may differ from one location to another and may change with time, customer is responsible for determining whether productsare appropriate for customer’s use. FilmTec Corporation and The Dow Chemical Company assume no liability, if, as a result of customer's use of the ROSAmembrane design software, the customer should be sued for alleged infringement of any patent not owned or controlled by the FilmTec Corporation nor TheDow Chemical Company.
Reverse Osmosis System Analysis for FILMTEC™ Membranes ROSA 9.1 ConfigDB u399339_282Project: Tintina Reject to Pond rev3 Case: 2, 5/1/2017
-None-
Langelier Saturation Index > 0Stiff & Davis Stability Index > 0CaSO4 (% Saturation) > 100%SrSO4 (% Saturation) > 100%CaF2 (% Saturation) > 100%Antiscalants may be required. Consult your antiscalant manufacturer for dosing and maximum allowable system recovery.
Stage 1 Element Recovery Perm Flow(gpm)
Perm TDS(mg/l)
Feed Flow(gpm)
Feed TDS(mg/l)
Feed Press(psig)
1 0.09 5.11 2.70 57.57 949.33 201.152 0.09 4.98 2.96 52.46 1041.66 197.193 0.10 4.86 3.29 47.48 1150.68 193.664 0.11 4.75 3.71 42.62 1281.62 190.565 0.12 4.66 4.27 37.87 1442.13 187.856 0.14 4.57 5.04 33.21 1643.84 185.53
Stage 2 Element Recovery Perm Flow(gpm)
Perm TDS(mg/l)
Feed Flow(gpm)
Feed TDS(mg/l)
Feed Press(psig)
1 0.10 4.63 5.63 47.74 1905.21 178.582 0.10 4.49 6.55 43.11 2109.45 175.443 0.11 4.34 7.74 38.62 2353.94 172.684 0.12 4.19 9.36 34.28 2651.08 170.295 0.13 4.02 11.58 30.09 3018.43 168.236 0.15 3.83 14.77 26.07 3481.49 166.49
Stage 3 Element Recovery Perm Flow(gpm)
Perm TDS(mg/l)
Feed Flow(gpm)
Feed TDS(mg/l)
Feed Press(psig)
1 0.06 4.02 15.53 66.74 4077.32 160.042 0.06 3.83 17.60 62.72 4337.67 155.183 0.06 3.65 19.99 58.89 4618.34 150.684 0.06 3.47 22.73 55.25 4921.50 146.525 0.06 3.30 25.89 51.78 5249.50 142.676 0.06 3.14 29.55 48.47 5605.09 139.12
Page 2 of 5ROSA Detailed Report
5/1/2017file:///C:/Program%20Files%20(x86)/Dow%20Chemical/ROSA9/MyProjects/Tintina%20R...
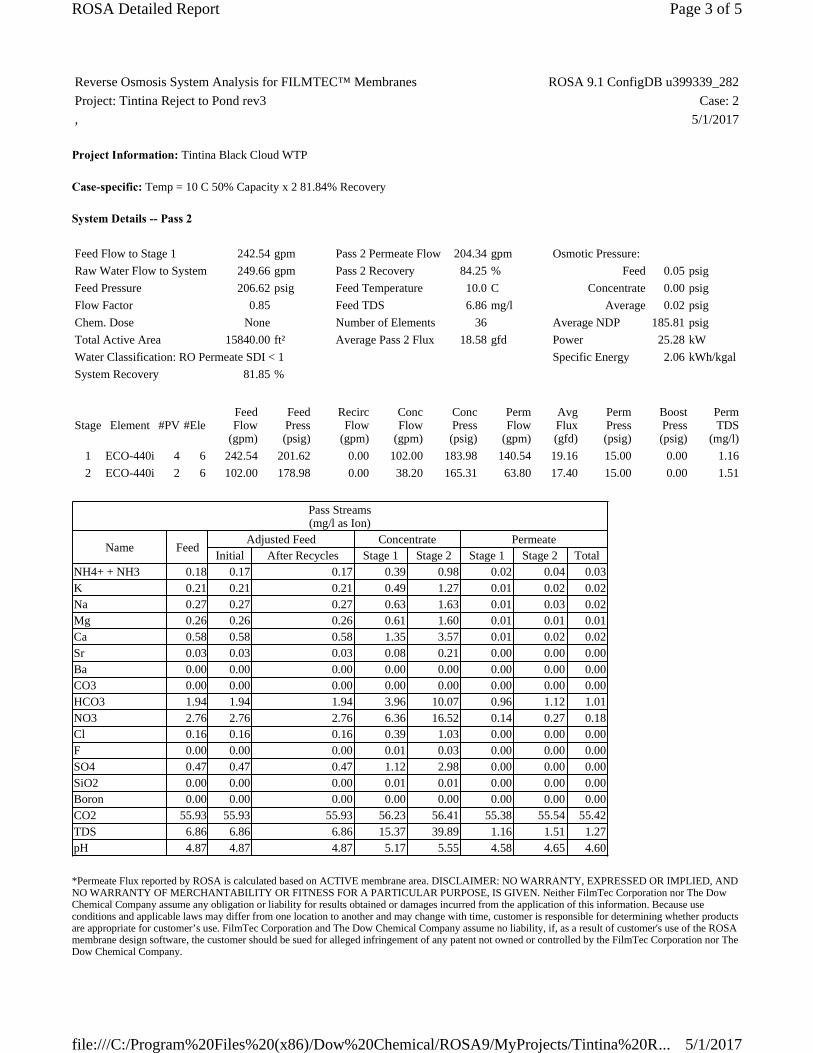
Project Information: Tintina Black Cloud WTP
Case-specific: Temp = 10 C 50% Capacity x 2 81.84% Recovery
System Details -- Pass 2
*Permeate Flux reported by ROSA is calculated based on ACTIVE membrane area. DISCLAIMER: NO WARRANTY, EXPRESSED OR IMPLIED, ANDNO WARRANTY OF MERCHANTABILITY OR FITNESS FOR A PARTICULAR PURPOSE, IS GIVEN. Neither FilmTec Corporation nor The DowChemical Company assume any obligation or liability for results obtained or damages incurred from the application of this information. Because useconditions and applicable laws may differ from one location to another and may change with time, customer is responsible for determining whether productsare appropriate for customer’s use. FilmTec Corporation and The Dow Chemical Company assume no liability, if, as a result of customer's use of the ROSAmembrane design software, the customer should be sued for alleged infringement of any patent not owned or controlled by the FilmTec Corporation nor TheDow Chemical Company.
Reverse Osmosis System Analysis for FILMTEC™ Membranes ROSA 9.1 ConfigDB u399339_282Project: Tintina Reject to Pond rev3 Case: 2, 5/1/2017
Feed Flow to Stage 1 242.54 gpm Pass 2 Permeate Flow 204.34 gpm Osmotic Pressure:Raw Water Flow to System 249.66 gpm Pass 2 Recovery 84.25 % Feed 0.05 psigFeed Pressure 206.62 psig Feed Temperature 10.0 C Concentrate 0.00 psigFlow Factor 0.85 Feed TDS 6.86 mg/l Average 0.02 psigChem. Dose None Number of Elements 36 Average NDP 185.81 psigTotal Active Area 15840.00 ft² Average Pass 2 Flux 18.58 gfd Power 25.28 kWWater Classification: RO Permeate SDI < 1 Specific Energy 2.06 kWh/kgalSystem Recovery 81.85 %
Stage Element #PV #EleFeedFlow
(gpm)
FeedPress(psig)
RecircFlow
(gpm)
ConcFlow
(gpm)
ConcPress(psig)
PermFlow
(gpm)
AvgFlux(gfd)
PermPress(psig)
BoostPress(psig)
PermTDS
(mg/l)1 ECO-440i 4 6 242.54 201.62 0.00 102.00 183.98 140.54 19.16 15.00 0.00 1.162 ECO-440i 2 6 102.00 178.98 0.00 38.20 165.31 63.80 17.40 15.00 0.00 1.51
Pass Streams(mg/l as Ion)
Name FeedAdjusted Feed Concentrate Permeate
Initial After Recycles Stage 1 Stage 2 Stage 1 Stage 2 TotalNH4+ + NH3 0.18 0.17 0.17 0.39 0.98 0.02 0.04 0.03K 0.21 0.21 0.21 0.49 1.27 0.01 0.02 0.02Na 0.27 0.27 0.27 0.63 1.63 0.01 0.03 0.02Mg 0.26 0.26 0.26 0.61 1.60 0.01 0.01 0.01Ca 0.58 0.58 0.58 1.35 3.57 0.01 0.02 0.02Sr 0.03 0.03 0.03 0.08 0.21 0.00 0.00 0.00Ba 0.00 0.00 0.00 0.00 0.00 0.00 0.00 0.00CO3 0.00 0.00 0.00 0.00 0.00 0.00 0.00 0.00HCO3 1.94 1.94 1.94 3.96 10.07 0.96 1.12 1.01NO3 2.76 2.76 2.76 6.36 16.52 0.14 0.27 0.18Cl 0.16 0.16 0.16 0.39 1.03 0.00 0.00 0.00F 0.00 0.00 0.00 0.01 0.03 0.00 0.00 0.00SO4 0.47 0.47 0.47 1.12 2.98 0.00 0.00 0.00SiO2 0.00 0.00 0.00 0.01 0.01 0.00 0.00 0.00Boron 0.00 0.00 0.00 0.00 0.00 0.00 0.00 0.00CO2 55.93 55.93 55.93 56.23 56.41 55.38 55.54 55.42TDS 6.86 6.86 6.86 15.37 39.89 1.16 1.51 1.27pH 4.87 4.87 4.87 5.17 5.55 4.58 4.65 4.60
Page 3 of 5ROSA Detailed Report
5/1/2017file:///C:/Program%20Files%20(x86)/Dow%20Chemical/ROSA9/MyProjects/Tintina%20R...
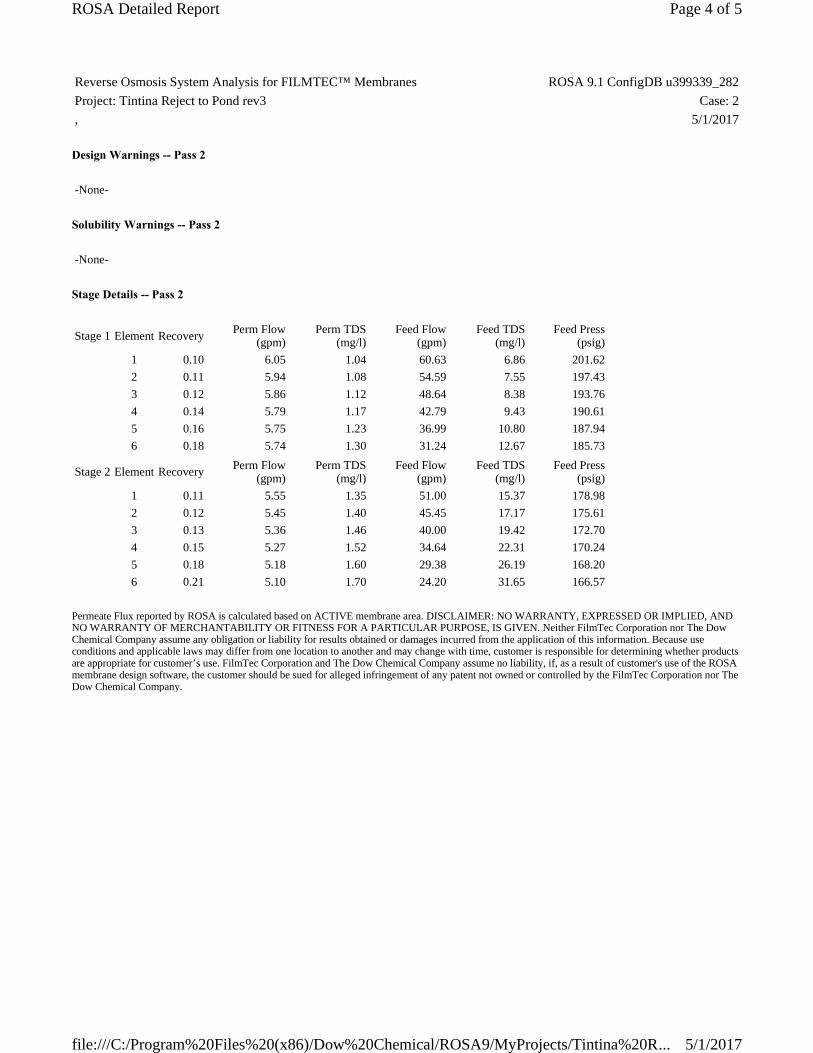
Design Warnings -- Pass 2
Solubility Warnings -- Pass 2
Stage Details -- Pass 2
Permeate Flux reported by ROSA is calculated based on ACTIVE membrane area. DISCLAIMER: NO WARRANTY, EXPRESSED OR IMPLIED, ANDNO WARRANTY OF MERCHANTABILITY OR FITNESS FOR A PARTICULAR PURPOSE, IS GIVEN. Neither FilmTec Corporation nor The DowChemical Company assume any obligation or liability for results obtained or damages incurred from the application of this information. Because useconditions and applicable laws may differ from one location to another and may change with time, customer is responsible for determining whether productsare appropriate for customer’s use. FilmTec Corporation and The Dow Chemical Company assume no liability, if, as a result of customer's use of the ROSAmembrane design software, the customer should be sued for alleged infringement of any patent not owned or controlled by the FilmTec Corporation nor TheDow Chemical Company.
Reverse Osmosis System Analysis for FILMTEC™ Membranes ROSA 9.1 ConfigDB u399339_282Project: Tintina Reject to Pond rev3 Case: 2, 5/1/2017
-None-
-None-
Stage 1 Element Recovery Perm Flow(gpm)
Perm TDS(mg/l)
Feed Flow(gpm)
Feed TDS(mg/l)
Feed Press(psig)
1 0.10 6.05 1.04 60.63 6.86 201.622 0.11 5.94 1.08 54.59 7.55 197.433 0.12 5.86 1.12 48.64 8.38 193.764 0.14 5.79 1.17 42.79 9.43 190.615 0.16 5.75 1.23 36.99 10.80 187.946 0.18 5.74 1.30 31.24 12.67 185.73
Stage 2 Element Recovery Perm Flow(gpm)
Perm TDS(mg/l)
Feed Flow(gpm)
Feed TDS(mg/l)
Feed Press(psig)
1 0.11 5.55 1.35 51.00 15.37 178.982 0.12 5.45 1.40 45.45 17.17 175.613 0.13 5.36 1.46 40.00 19.42 172.704 0.15 5.27 1.52 34.64 22.31 170.245 0.18 5.18 1.60 29.38 26.19 168.206 0.21 5.10 1.70 24.20 31.65 166.57
Page 4 of 5ROSA Detailed Report
5/1/2017file:///C:/Program%20Files%20(x86)/Dow%20Chemical/ROSA9/MyProjects/Tintina%20R...
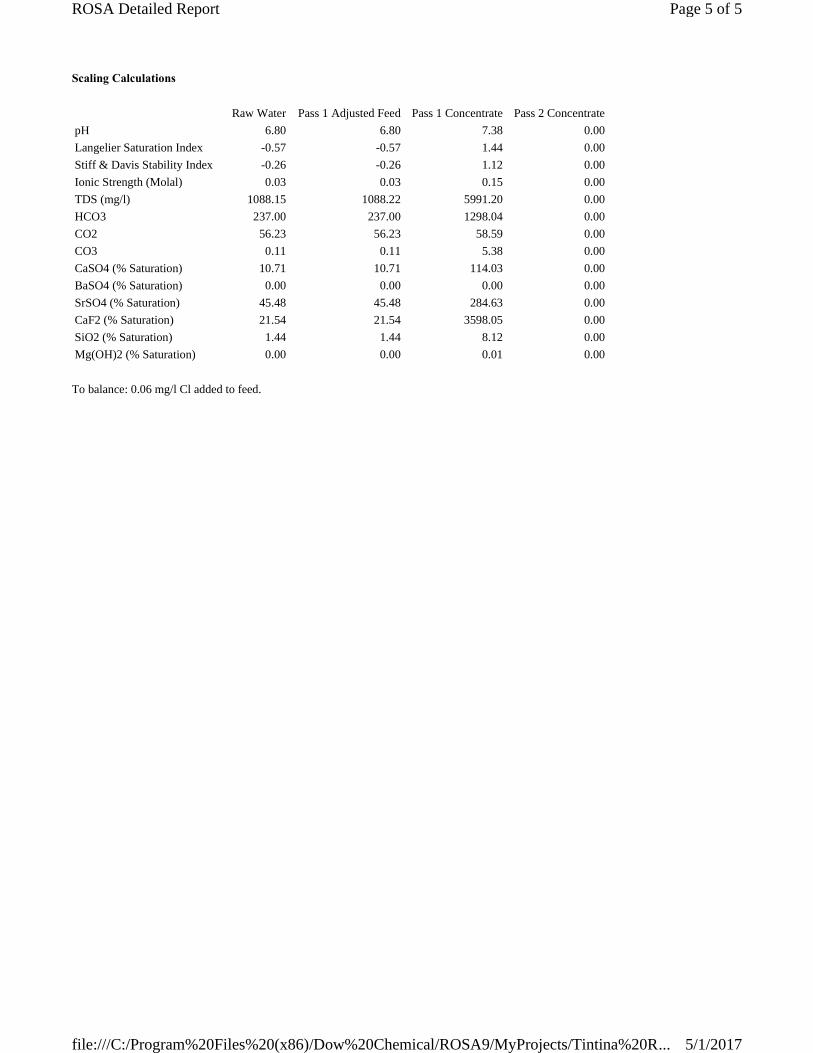
Scaling Calculations
To balance: 0.06 mg/l Cl added to feed.
Raw Water Pass 1 Adjusted Feed Pass 1 Concentrate Pass 2 ConcentratepH 6.80 6.80 7.38 0.00Langelier Saturation Index -0.57 -0.57 1.44 0.00Stiff & Davis Stability Index -0.26 -0.26 1.12 0.00Ionic Strength (Molal) 0.03 0.03 0.15 0.00TDS (mg/l) 1088.15 1088.22 5991.20 0.00HCO3 237.00 237.00 1298.04 0.00CO2 56.23 56.23 58.59 0.00CO3 0.11 0.11 5.38 0.00CaSO4 (% Saturation) 10.71 10.71 114.03 0.00BaSO4 (% Saturation) 0.00 0.00 0.00 0.00SrSO4 (% Saturation) 45.48 45.48 284.63 0.00CaF2 (% Saturation) 21.54 21.54 3598.05 0.00SiO2 (% Saturation) 1.44 1.44 8.12 0.00Mg(OH)2 (% Saturation) 0.00 0.00 0.01 0.00
Page 5 of 5ROSA Detailed Report
5/1/2017file:///C:/Program%20Files%20(x86)/Dow%20Chemical/ROSA9/MyProjects/Tintina%20R...

Avista Advisor
01-May-2017 13:53Avista Advisor Version -3.21
140 Bosstick Blvd 13 Naysmith Square, Houstoun Ind EstateSan Marcos, CA 92069 Livingston, EH54 5GG, UKPhone: +1 (760) 744 0536 Phone: +44 131 449 6677Fax: +1 (760) 744 0619 Fax: +44 131 449 5599
Project Details
Project: Tintina RO Plant DesignPermeate Flowrate: 410USGPM This is split into 2 trains of 205.0USGPMSystem Recovery: 82%
Antiscalant
Vitec 3000 is the selected product at a dose of 2.08mg/l. Assuming the plant operates continuously, then this will require 4551lb of antiscalant per year. This may be supplied in 2 x 2500lb Totes, 10 x 500lb Drums, or 102 x 45lb Pails.
Chemical Cleaning
The chemical cleaning calculation has not been completed for this project.
Biocide
No biocide has been selected for this system. It is always recommended that a biocide injection point be included to allow for the retrofit of a biocide system at a later date.
Coagulant
No coagulant has been selected for this system. It is always recommended that a coagulant injection point be included to allow for the retrofit of a coagulant system at a later date.
Dechlorination
No dechlorination has been selected for this system.

Avista Advisor
01-May-2017 13:53Avista Advisor Version -3.21
140 Bosstick Blvd 13 Naysmith Square, Houstoun Ind EstateSan Marcos, CA 92069 Livingston, EH54 5GG, UKPhone: +1 (760) 744 0536 Phone: +44 131 449 6677Fax: +1 (760) 744 0619 Fax: +44 131 449 5599
Project Details
Project: Tintina RO Plant DesignPermeate Flowrate: 410USGPM This is split into 2 trains of 205.0USGPMSystem Recovery: 82%
Antiscalant Projection
The projection is based on the following feed water analysis. The adjusted feed is the analysis after pH correction, and any ions have been added to balance the analysis. The concentrate analysis has been manually input.Ion Feed Water Adjusted Feed Concentrate Sodium 17.00 19.31 106.23 mg/lPotassium 12.00 12.00 65.81 mg/lCalcium 162.00 162.00 898.61 mg/lMagnesium 71.00 71.00 393.70 mg/lIron 0.01 0.01 0.03 mg/lManganese 0.15 0.15 0.83 mg/lBarium 0.00 0.00 0.02 mg/lStrontium 9.65 9.65 53.53 mg/lAluminium 0.00 0.00 0.00 mg/lChloride 20.10 20.10 110.67 mg/lSulfate 350.00 350.00 1941.44 mg/lBicarbonate 293.00 293.00 1598.19 mg/lNitrate 160.20 160.20 851.85 mg/lFluoride 1.04 1.04 5.73 mg/lPhosphate 0.01 0.01 0.07 mg/lSilica 1.35 1.35 7.43 mg/lCO2 74.80 74.80 74.80 mg/lTDS 1099.82 6034.13 pH 6.80 6.80 6.70
Water Source: Surface Water Water Temperature: 25º C
Product Choice Application
Vitec Choice: Vitec 3000 Dosed Solution Strength: 100%Dosage: 2.08mg/l Pump Rate: 1.20USGPDUsage: 12.47 lb per day. 3.15ml/mThere is one dosing pump per membrane train, using a common chemical tank for all trains.With 2 trains, each pump will deliver 1.20USGPD
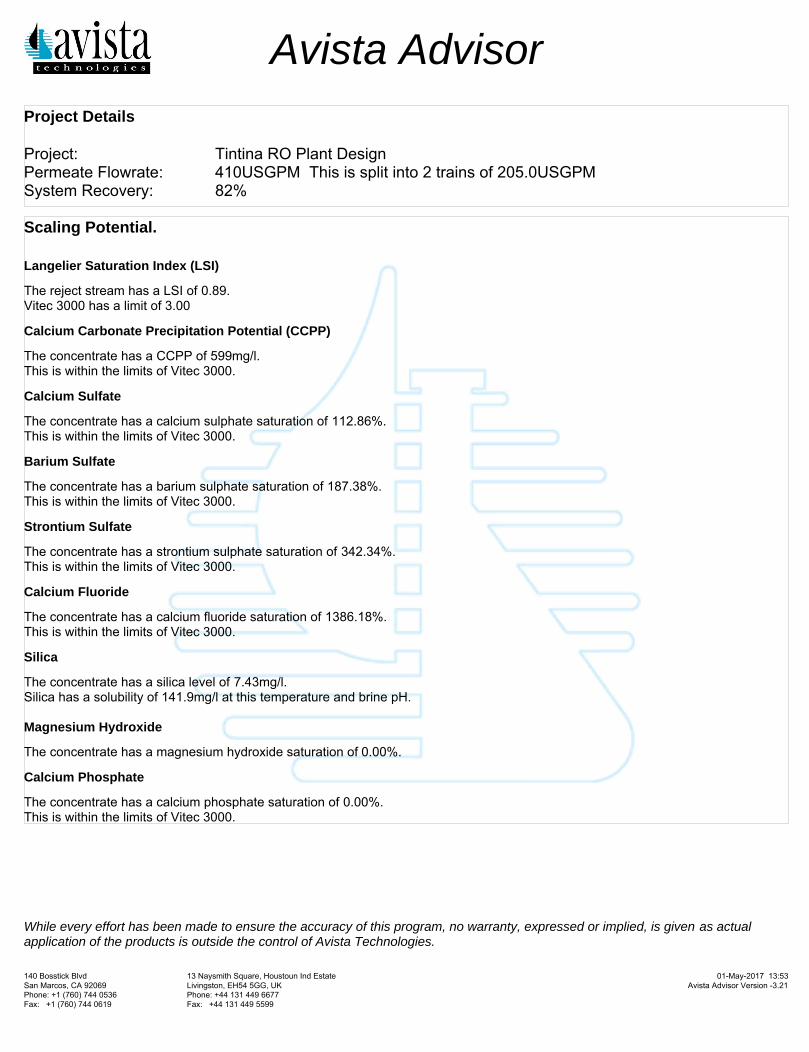
Avista Advisor
01-May-2017 13:53Avista Advisor Version -3.21
140 Bosstick Blvd 13 Naysmith Square, Houstoun Ind EstateSan Marcos, CA 92069 Livingston, EH54 5GG, UKPhone: +1 (760) 744 0536 Phone: +44 131 449 6677Fax: +1 (760) 744 0619 Fax: +44 131 449 5599
Project Details
Project: Tintina RO Plant DesignPermeate Flowrate: 410USGPM This is split into 2 trains of 205.0USGPMSystem Recovery: 82%
Scaling Potential.
Langelier Saturation Index (LSI)
The reject stream has a LSI of 0.89.Vitec 3000 has a limit of 3.00
Calcium Carbonate Precipitation Potential (CCPP)
The concentrate has a CCPP of 599mg/l.This is within the limits of Vitec 3000.
Calcium Sulfate
The concentrate has a calcium sulphate saturation of 112.86%.This is within the limits of Vitec 3000.
Barium Sulfate
The concentrate has a barium sulphate saturation of 187.38%.This is within the limits of Vitec 3000.
Strontium Sulfate
The concentrate has a strontium sulphate saturation of 342.34%.This is within the limits of Vitec 3000.
Calcium Fluoride
The concentrate has a calcium fluoride saturation of 1386.18%.This is within the limits of Vitec 3000.
Silica
The concentrate has a silica level of 7.43mg/l.Silica has a solubility of 141.9mg/l at this temperature and brine pH.
Magnesium Hydroxide
The concentrate has a magnesium hydroxide saturation of 0.00%.
Calcium Phosphate
The concentrate has a calcium phosphate saturation of 0.00%.This is within the limits of Vitec 3000.
While every effort has been made to ensure the accuracy of this program, no warranty, expressed or implied, is given as actual application of the products is outside the control of Avista Technologies.
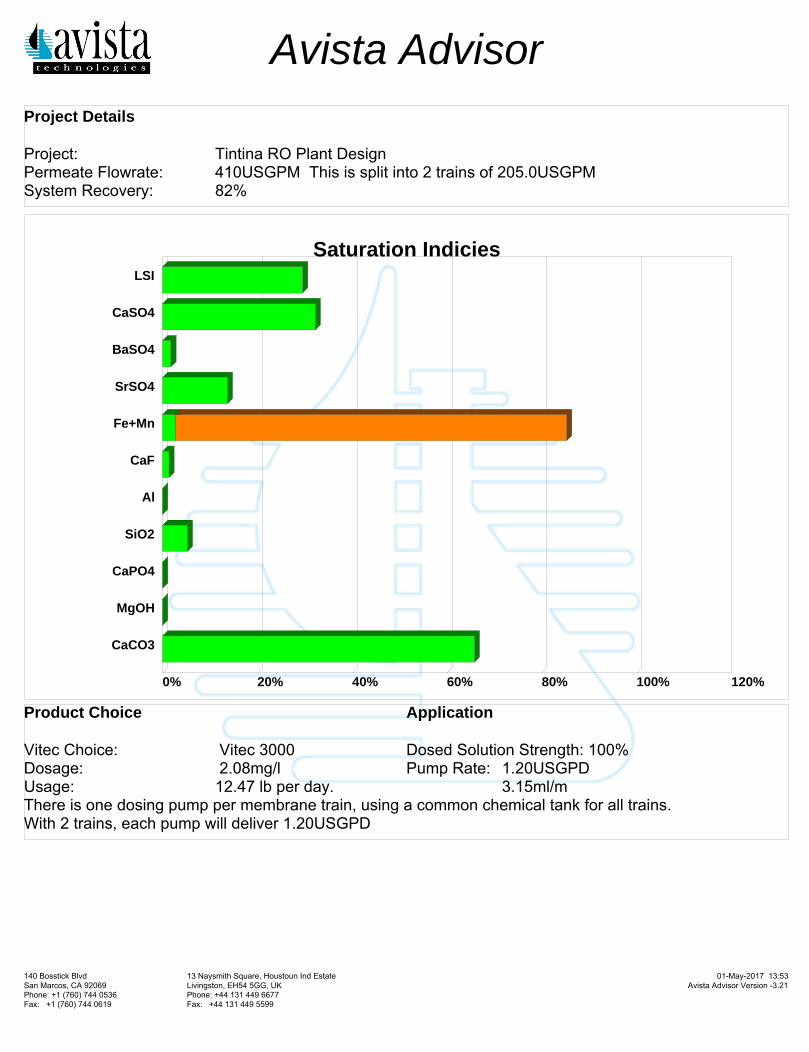
Avista Advisor
01-May-2017 13:53Avista Advisor Version -3.21
140 Bosstick Blvd 13 Naysmith Square, Houstoun Ind EstateSan Marcos, CA 92069 Livingston, EH54 5GG, UKPhone: +1 (760) 744 0536 Phone: +44 131 449 6677Fax: +1 (760) 744 0619 Fax: +44 131 449 5599
Project Details
Project: Tintina RO Plant DesignPermeate Flowrate: 410USGPM This is split into 2 trains of 205.0USGPMSystem Recovery: 82%
Saturation IndiciesLSI
CaSO4
BaSO4
SrSO4
Fe+Mn
CaF
Al
SiO2
CaPO4
MgOH
CaCO3
0% 20% 40% 60% 80% 100% 120%
Product Choice Application
Vitec Choice: Vitec 3000 Dosed Solution Strength: 100%Dosage: 2.08mg/l Pump Rate: 1.20USGPDUsage: 12.47 lb per day. 3.15ml/mThere is one dosing pump per membrane train, using a common chemical tank for all trains.With 2 trains, each pump will deliver 1.20USGPD
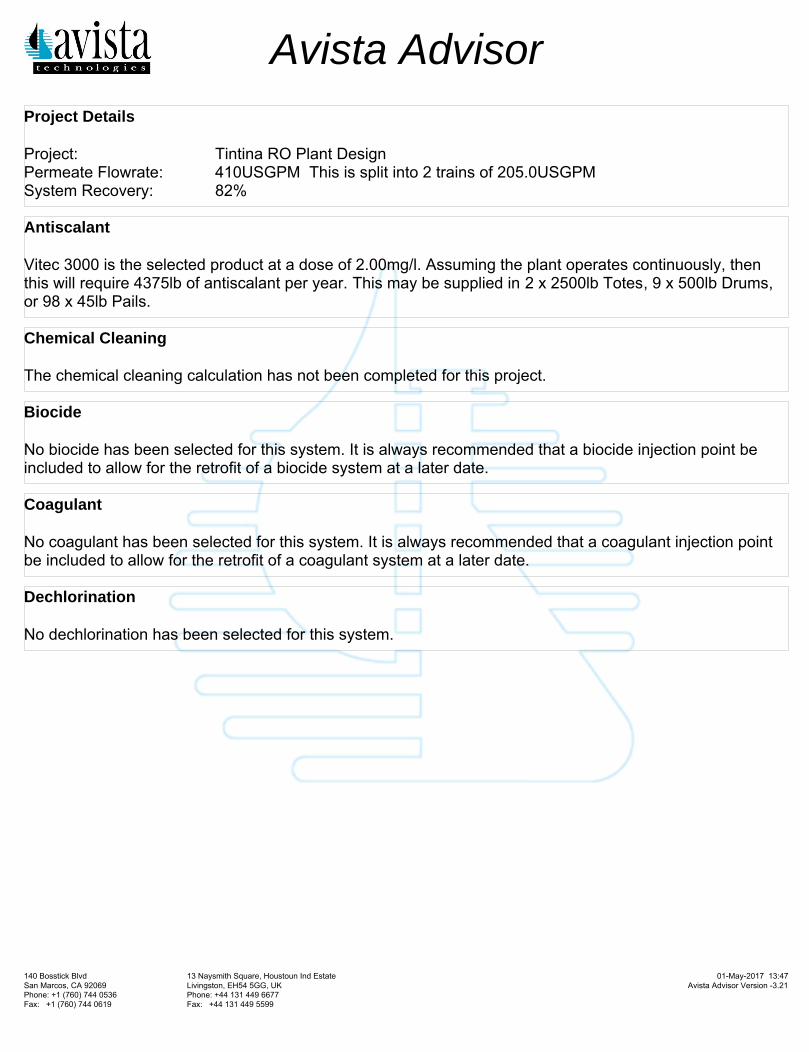
Avista Advisor
01-May-2017 13:47Avista Advisor Version -3.21
140 Bosstick Blvd 13 Naysmith Square, Houstoun Ind EstateSan Marcos, CA 92069 Livingston, EH54 5GG, UKPhone: +1 (760) 744 0536 Phone: +44 131 449 6677Fax: +1 (760) 744 0619 Fax: +44 131 449 5599
Project Details
Project: Tintina RO Plant DesignPermeate Flowrate: 410USGPM This is split into 2 trains of 205.0USGPMSystem Recovery: 82%
Antiscalant
Vitec 3000 is the selected product at a dose of 2.00mg/l. Assuming the plant operates continuously, then this will require 4375lb of antiscalant per year. This may be supplied in 2 x 2500lb Totes, 9 x 500lb Drums, or 98 x 45lb Pails.
Chemical Cleaning
The chemical cleaning calculation has not been completed for this project.
Biocide
No biocide has been selected for this system. It is always recommended that a biocide injection point be included to allow for the retrofit of a biocide system at a later date.
Coagulant
No coagulant has been selected for this system. It is always recommended that a coagulant injection point be included to allow for the retrofit of a coagulant system at a later date.
Dechlorination
No dechlorination has been selected for this system.
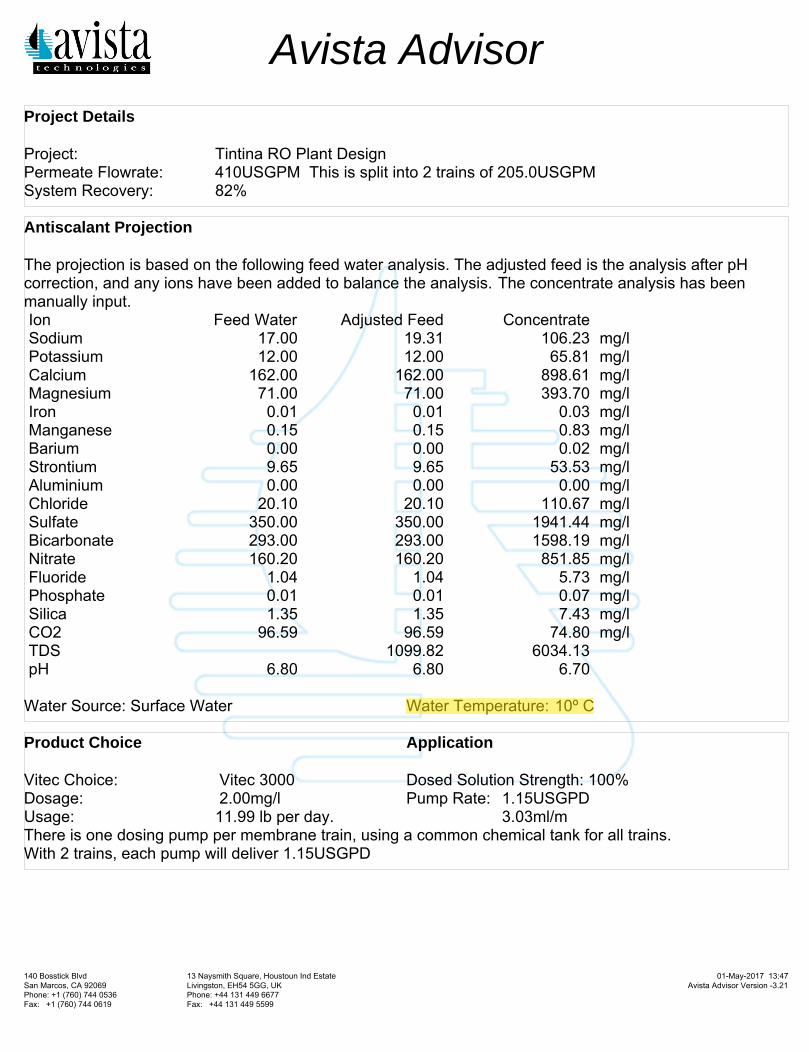
Avista Advisor
01-May-2017 13:47Avista Advisor Version -3.21
140 Bosstick Blvd 13 Naysmith Square, Houstoun Ind EstateSan Marcos, CA 92069 Livingston, EH54 5GG, UKPhone: +1 (760) 744 0536 Phone: +44 131 449 6677Fax: +1 (760) 744 0619 Fax: +44 131 449 5599
Project Details
Project: Tintina RO Plant DesignPermeate Flowrate: 410USGPM This is split into 2 trains of 205.0USGPMSystem Recovery: 82%
Antiscalant Projection
The projection is based on the following feed water analysis. The adjusted feed is the analysis after pH correction, and any ions have been added to balance the analysis. The concentrate analysis has been manually input.Ion Feed Water Adjusted Feed Concentrate Sodium 17.00 19.31 106.23 mg/lPotassium 12.00 12.00 65.81 mg/lCalcium 162.00 162.00 898.61 mg/lMagnesium 71.00 71.00 393.70 mg/lIron 0.01 0.01 0.03 mg/lManganese 0.15 0.15 0.83 mg/lBarium 0.00 0.00 0.02 mg/lStrontium 9.65 9.65 53.53 mg/lAluminium 0.00 0.00 0.00 mg/lChloride 20.10 20.10 110.67 mg/lSulfate 350.00 350.00 1941.44 mg/lBicarbonate 293.00 293.00 1598.19 mg/lNitrate 160.20 160.20 851.85 mg/lFluoride 1.04 1.04 5.73 mg/lPhosphate 0.01 0.01 0.07 mg/lSilica 1.35 1.35 7.43 mg/lCO2 96.59 96.59 74.80 mg/lTDS 1099.82 6034.13 pH 6.80 6.80 6.70
Water Source: Surface Water Water Temperature: 10º C
Product Choice Application
Vitec Choice: Vitec 3000 Dosed Solution Strength: 100%Dosage: 2.00mg/l Pump Rate: 1.15USGPDUsage: 11.99 lb per day. 3.03ml/mThere is one dosing pump per membrane train, using a common chemical tank for all trains.With 2 trains, each pump will deliver 1.15USGPD

Avista Advisor
01-May-2017 13:47Avista Advisor Version -3.21
140 Bosstick Blvd 13 Naysmith Square, Houstoun Ind EstateSan Marcos, CA 92069 Livingston, EH54 5GG, UKPhone: +1 (760) 744 0536 Phone: +44 131 449 6677Fax: +1 (760) 744 0619 Fax: +44 131 449 5599
Project Details
Project: Tintina RO Plant DesignPermeate Flowrate: 410USGPM This is split into 2 trains of 205.0USGPMSystem Recovery: 82%
Scaling Potential.
Langelier Saturation Index (LSI)
The reject stream has a LSI of 0.56.Vitec 3000 has a limit of 3.00
Calcium Carbonate Precipitation Potential (CCPP)
The concentrate has a CCPP of 440mg/l.This is within the limits of Vitec 3000.
Calcium Sulfate
The concentrate has a calcium sulphate saturation of 131.35%.This is within the limits of Vitec 3000.
Barium Sulfate
The concentrate has a barium sulphate saturation of 187.38%.This is within the limits of Vitec 3000.
Strontium Sulfate
The concentrate has a strontium sulphate saturation of 342.34%.This is within the limits of Vitec 3000.
Calcium Fluoride
The concentrate has a calcium fluoride saturation of 1386.18%.This is within the limits of Vitec 3000.
Silica
The concentrate has a silica level of 7.43mg/l.Silica has a solubility of 107.8mg/l at this temperature and brine pH.
Magnesium Hydroxide
The concentrate has a magnesium hydroxide saturation of 0.00%.
Calcium Phosphate
The concentrate has a calcium phosphate saturation of 0.00%.This is within the limits of Vitec 3000.
While every effort has been made to ensure the accuracy of this program, no warranty, expressed or implied, is given as actual application of the products is outside the control of Avista Technologies.
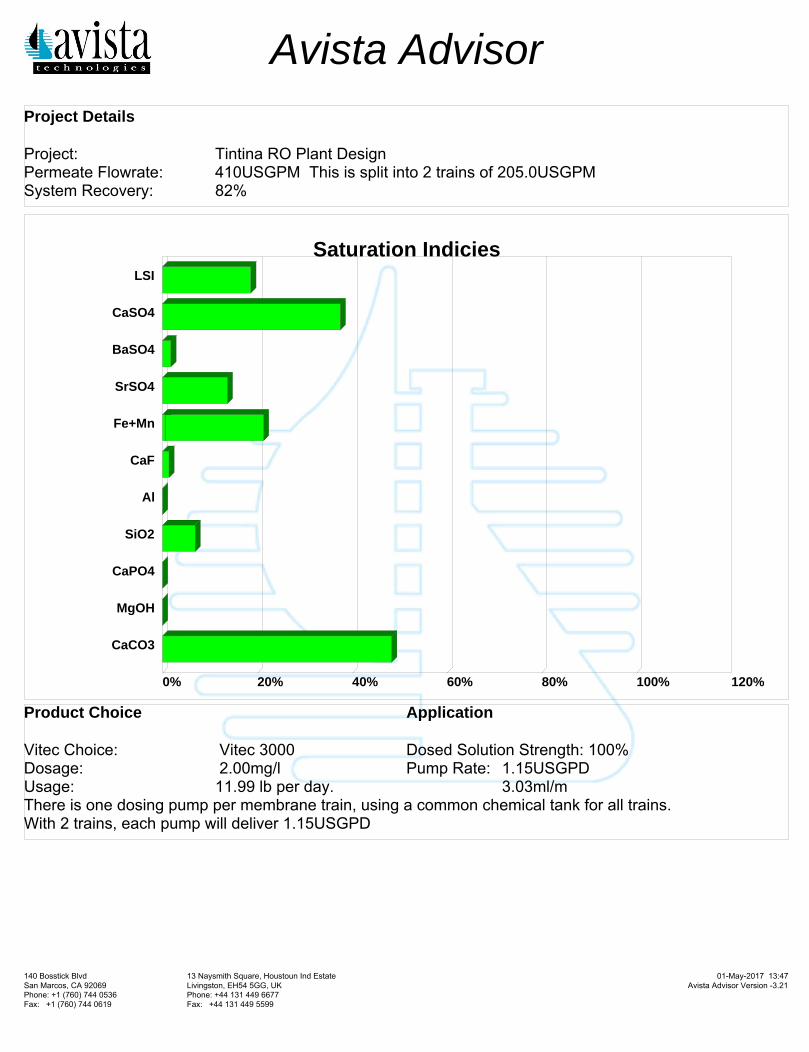
Avista Advisor
01-May-2017 13:47Avista Advisor Version -3.21
140 Bosstick Blvd 13 Naysmith Square, Houstoun Ind EstateSan Marcos, CA 92069 Livingston, EH54 5GG, UKPhone: +1 (760) 744 0536 Phone: +44 131 449 6677Fax: +1 (760) 744 0619 Fax: +44 131 449 5599
Project Details
Project: Tintina RO Plant DesignPermeate Flowrate: 410USGPM This is split into 2 trains of 205.0USGPMSystem Recovery: 82%
Saturation IndiciesLSI
CaSO4
BaSO4
SrSO4
Fe+Mn
CaF
Al
SiO2
CaPO4
MgOH
CaCO3
0% 20% 40% 60% 80% 100% 120%
Product Choice Application
Vitec Choice: Vitec 3000 Dosed Solution Strength: 100%Dosage: 2.00mg/l Pump Rate: 1.15USGPDUsage: 11.99 lb per day. 3.03ml/mThere is one dosing pump per membrane train, using a common chemical tank for all trains.With 2 trains, each pump will deliver 1.15USGPD

APPENDIX V-4
VSEP Projections (Closure Phase)
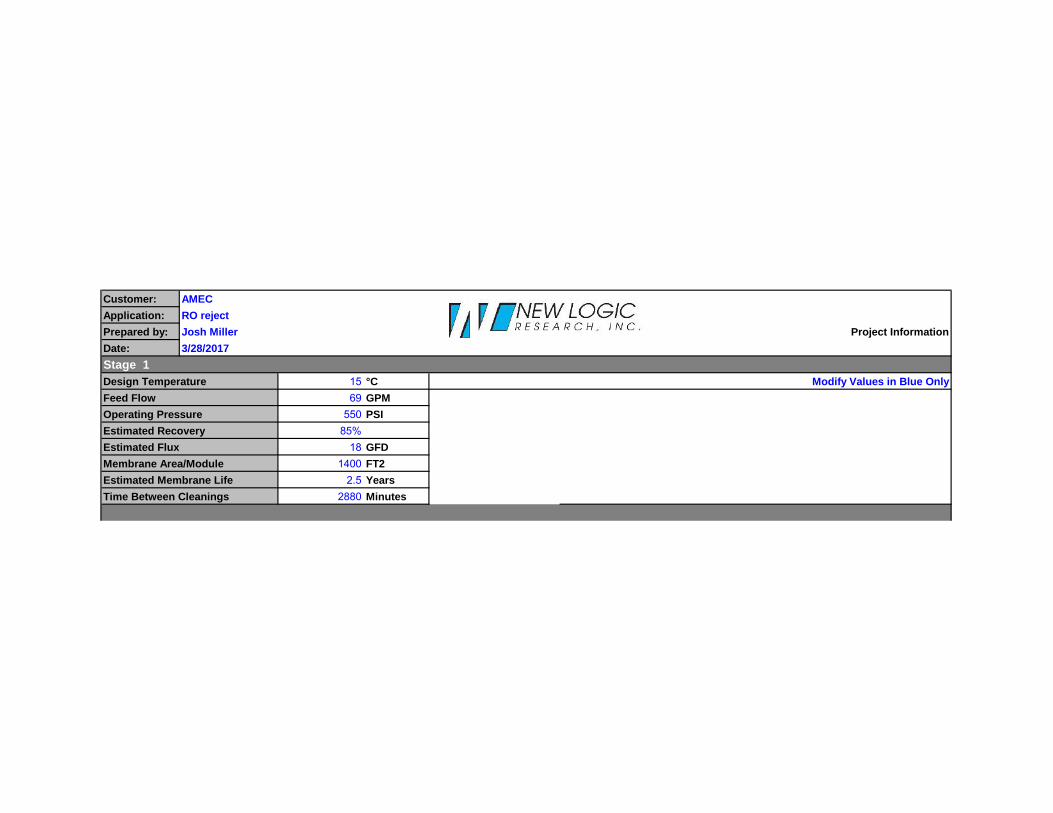
Customer:Application:Prepared by: Project InformationDate:Stage 1Design Temperature 15 °C Modify Values in Blue OnlyFeed Flow 69 GPMOperating Pressure 550 PSIEstimated Recovery 85%Estimated Flux 18 GFDMembrane Area/Module 1400 FT2Estimated Membrane Life 2.5 YearsTime Between Cleanings 2880 Minutes
AMECRO rejectJosh Miller3/28/2017
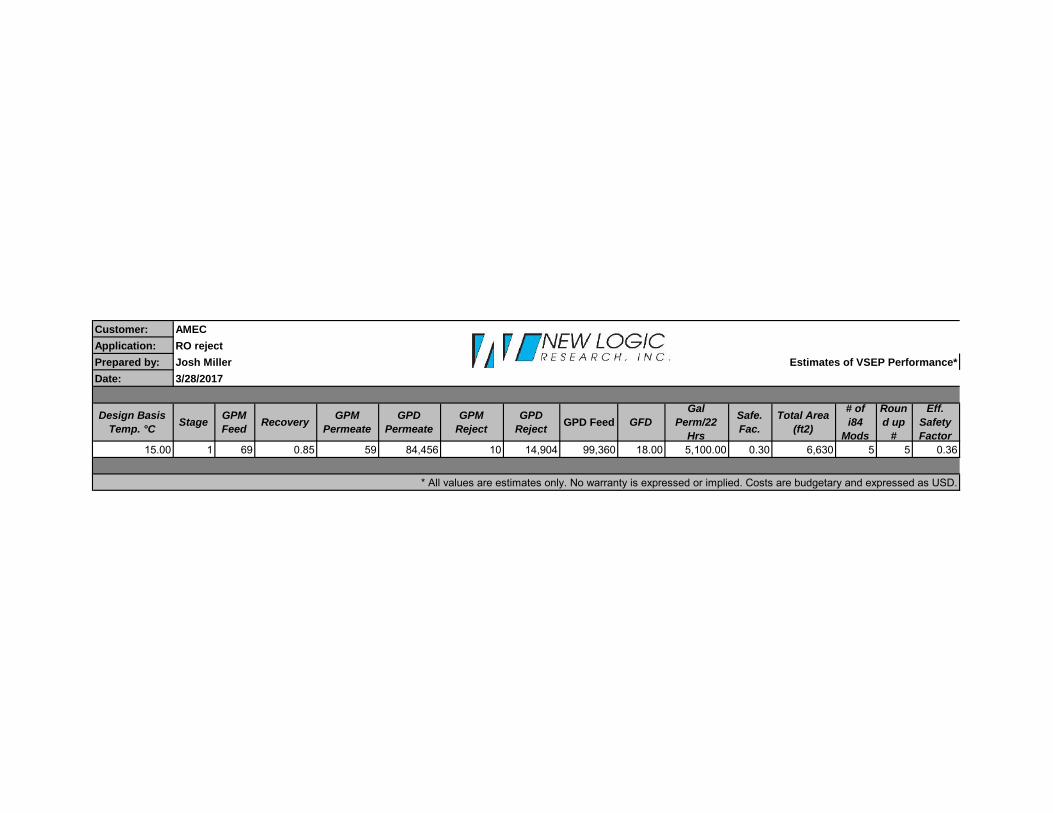
Customer:Application:Prepared by: Estimates of VSEP Performance*Date:
Design BasisTemp. °C Stage GPM
Feed Recovery GPMPermeate
GPDPermeate
GPMReject
GPDReject GPD Feed GFD
GalPerm/22
Hrs
Safe.Fac.
Total Area(ft2)
# ofi84
Mods
Round up
#
Eff.SafetyFactor
15.00 1 69 0.85 59 84,456 10 14,904 99,360 18.00 5,100.00 0.30 6,630 5 5 0.36
* All values are estimates only. No warranty is expressed or implied. Costs are budgetary and expressed as USD.
AMECRO rejectJosh Miller3/28/2017
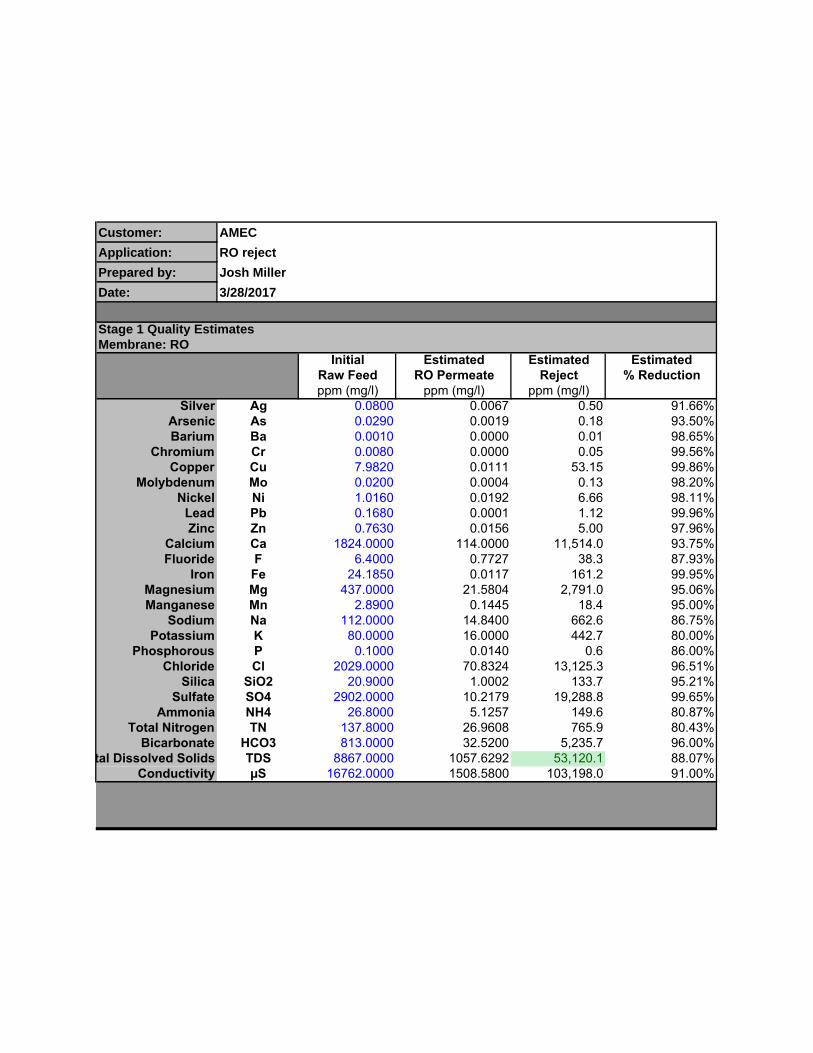
Customer:Application:Prepared by:Date:
Stage 1 Quality EstimatesMembrane: RO
Initial Estimated Estimated EstimatedRaw Feed RO Permeate Reject % Reductionppm (mg/l) ppm (mg/l) ppm (mg/l)
Silver Ag 0.0800 0.0067 0.50 91.66%Arsenic As 0.0290 0.0019 0.18 93.50%Barium Ba 0.0010 0.0000 0.01 98.65%
Chromium Cr 0.0080 0.0000 0.05 99.56%Copper Cu 7.9820 0.0111 53.15 99.86%
Molybdenum Mo 0.0200 0.0004 0.13 98.20%Nickel Ni 1.0160 0.0192 6.66 98.11%
Lead Pb 0.1680 0.0001 1.12 99.96%Zinc Zn 0.7630 0.0156 5.00 97.96%
Calcium Ca 1824.0000 114.0000 11,514.0 93.75%Fluoride F 6.4000 0.7727 38.3 87.93%
Iron Fe 24.1850 0.0117 161.2 99.95%Magnesium Mg 437.0000 21.5804 2,791.0 95.06%Manganese Mn 2.8900 0.1445 18.4 95.00%
Sodium Na 112.0000 14.8400 662.6 86.75%Potassium K 80.0000 16.0000 442.7 80.00%
Phosphorous P 0.1000 0.0140 0.6 86.00%Chloride Cl 2029.0000 70.8324 13,125.3 96.51%
Silica SiO2 20.9000 1.0002 133.7 95.21%Sulfate SO4 2902.0000 10.2179 19,288.8 99.65%
Ammonia NH4 26.8000 5.1257 149.6 80.87%Total Nitrogen TN 137.8000 26.9608 765.9 80.43%
Bicarbonate HCO3 813.0000 32.5200 5,235.7 96.00%Total Dissolved Solids TDS 8867.0000 1057.6292 53,120.1 88.07%
Conductivity µS 16762.0000 1508.5800 103,198.0 91.00%
AMECRO rejectJosh Miller3/28/2017
H:\Files\TGOLD\11048\Integrated Discharge Permit\R17 Permit Application Narrative.Docx\\12/11/17\065 12/11/17\7:28 AM
APPENDIX C
BLACK BUTTE MINE METEOROLOGICAL
MONITORING TEMPERATURE DATA
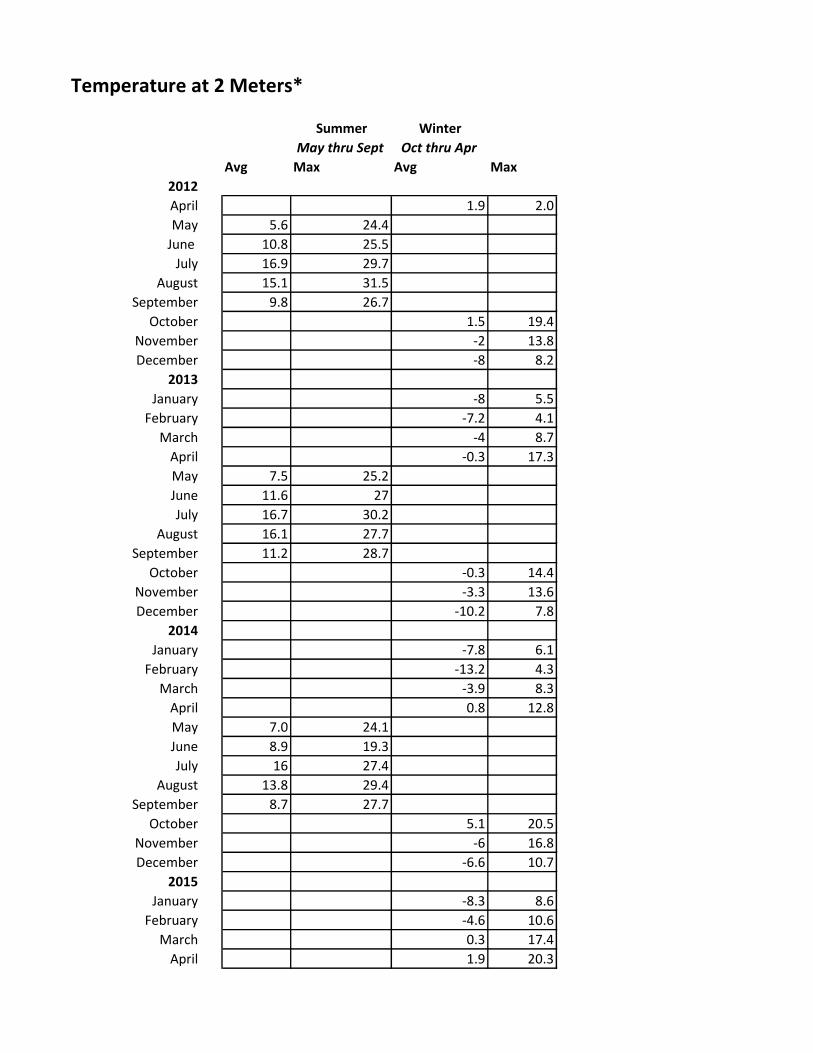
Temperature at 2 Meters*
Summer Winter
May thru Sept Oct thru Apr
Avg Max Avg Max
2012
April 1.9 2.0
May 5.6 24.4
June 10.8 25.5
July 16.9 29.7
August 15.1 31.5
September 9.8 26.7
October 1.5 19.4
November -2 13.8
December -8 8.2
2013
January -8 5.5
February -7.2 4.1
March -4 8.7
April -0.3 17.3
May 7.5 25.2
June 11.6 27
July 16.7 30.2
August 16.1 27.7
September 11.2 28.7
October -0.3 14.4
November -3.3 13.6
December -10.2 7.8
2014
January -7.8 6.1
February -13.2 4.3
March -3.9 8.3
April 0.8 12.8
May 7.0 24.1
June 8.9 19.3
July 16 27.4
August 13.8 29.4
September 8.7 27.7
October 5.1 20.5
November -6 16.8
December -6.6 10.7
2015
January -8.3 8.6
February -4.6 10.6
March 0.3 17.4
April 1.9 20.3
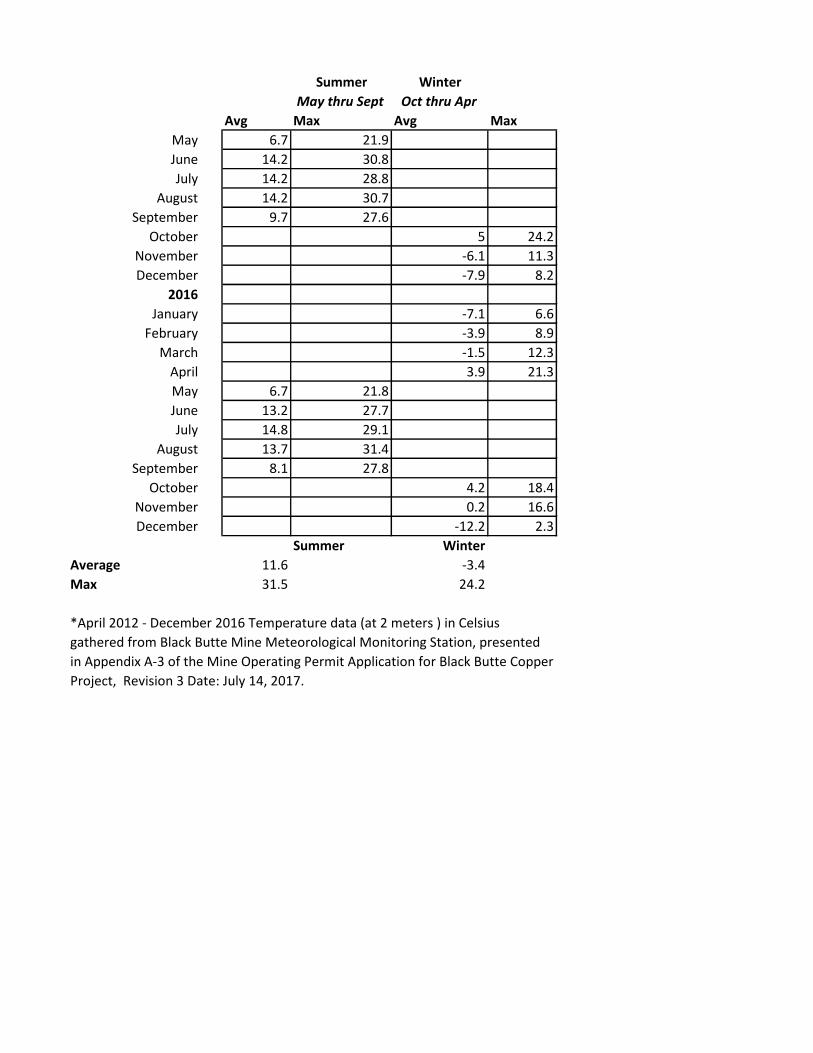
Summer Winter
May thru Sept Oct thru Apr
Avg Max Avg Max
May 6.7 21.9
June 14.2 30.8
July 14.2 28.8
August 14.2 30.7
September 9.7 27.6
October 5 24.2
November -6.1 11.3
December -7.9 8.2
2016
January -7.1 6.6
February -3.9 8.9
March -1.5 12.3
April 3.9 21.3
May 6.7 21.8
June 13.2 27.7
July 14.8 29.1
August 13.7 31.4
September 8.1 27.8
October 4.2 18.4
November 0.2 16.6
December -12.2 2.3
Summer Winter
Average 11.6 -3.4
Max 31.5 24.2
*April 2012 - December 2016 Temperature data (at 2 meters ) in Celsius
gathered from Black Butte Mine Meteorological Monitoring Station, presented
in Appendix A-3 of the Mine Operating Permit Application for Black Butte Copper
Project, Revision 3 Date: July 14, 2017.
H:\Files\TGOLD\11048\Integrated Discharge Permit\R17 Permit Application Narrative.Docx\\12/11/17\065 12/11/17\7:28 AM
APPENDIX D
APPLICATION FOR SOURCE SPECIFIC MIXING
ZONE IN SURFACE WATER FOR TOTAL NITROGEN
H:\Files\TGOLD\11048\Integrated Discharge Permit\Appendices\Appendix D\R17 SW Mixing Zone App 2017.docx\HLN\12/8/2017\065 12/8/2017 2:14 PM
APPLICATION FOR SOURCE SPECIFIC MIXING ZONE IN
SURFACE WATER FOR TOTAL NITROGEN
TINTINA BLACK BUTTE COPPER PROJECT
Prepared for:
Tintina Montana, Inc. Black Butte Copper Project
P.O. Box 431 White Sulphur Springs, MT 59645
406-547-3466
Prepared by:
Hydrometrics, Inc. 3020 Bozeman Ave. Helena, MT 59601
December 2017
H:\Files\TGOLD\11048\Integrated Discharge Permit\Appendices\Appendix D\R17 SW Mixing Zone App 2017.docx\HLN\12/6/2017\065
ii 12/6/2017 2:34 PM
TABLE OF CONTENTS
LIST OF TABLES ...........................................................................................................iii
LIST OF FIGURES .........................................................................................................iii
1.0 INTRODUCTION .....................................................................................................1-1
1.1 PURPOSE ......................................................................................................1-1
1.2 SUMMARY OF NEED AND APPROPRIATENESS OF MIXING ZONE
FOR TOTAL NITROGEN .........................................................................1-2
1.3 DISCHARGE WATER MANAGEMENT....................................................1-4
1.4 ORGANIZATION OF APPLICATION ........................................................1-4
2.0 TOTAL NITROGEN OVERVIEW ...........................................................................2-1
2.1 DESCRIPTION AND OCCURRENCE ........................................................2-1
2.2 WATER QUALITY STANDARDS, NUTRIENT CRITERIA ....................2-1
2.3 POTENTIAL TOXICITY ..............................................................................2-1
3.0 DISCHARGE SYSTEM AND EFFLUENT .............................................................3-1
3.1 GROUNDWATER DISCHARGE SYSTEM OUTFALLS 001 ...................3-1
3.2 QUANTITY OF GROUNDWATER DISCHARGE (EFFLUENT) .............3-1
4.0 SURFACE WATER CONDITIONS AND PROPOSED
SOURCE SPECIFIC SURFACE WATER MIXING ZONE .................................4-1
4.1 QUANTITY, TOXICITY, AND PERSISTENCE OF POLLUTANTS IN
SURFACE WATER ...................................................................................4-2
4.1.1 Quantity of Total Nitrogen ..............................................................4-2
4.1.2 Toxicity of Total Nitrogen ..............................................................4-3
4.1.3 Persistence of Total Nitrogen ..........................................................4-3
4.2 RATE AND VOLUME OF FLOW ...............................................................4-4
4.3 CONCENTRATION OF TOTAL NITROGEN WITHIN THE MIXING
ZONE ..........................................................................................................4-4
4.4 LENGTH OF TIME TOTAL NITROGEN WILL BE PRESENT ................4-4
4.5 PROPOSED BOUNDARIES OF THE MIXING ZONE ..............................4-4
4.6 POTENTIAL IMPACTS TO WATER USES ...............................................4-5
4.7 COMPLIANCE MONITORING ...................................................................4-5
H:\Files\TGOLD\11048\Integrated Discharge Permit\Appendices\Appendix D\R17 SW Mixing Zone App 2017.docx\HLN\12/6/2017\065
iii 12/6/2017 2:34 PM
4.8 CONTINGENCY PLAN ...............................................................................4-6
4.9 SMALLEST PRACTICAL MIXING ZONE AND MINIMUM
PRACTICABLE EFFECT ON WATER USERS ......................................4-6
5.0 WATER QUALITY ASSESSMENT ........................................................................5-1
5.1 BIOLOGICALLY IMPORTANT AREAS ...................................................5-1
5.2 DRINKING WATER OR RECREATIONAL AREAS ................................5-1
5.3 ATTRACTION OF AQUATIC LIFE TO MIXING ZONE .........................5-2
5.4 TOXICITY AND PERSISTENCE OF TOTAL NITROGEN ......................5-3
5.5 PASSAGES OF AQUATIC ORGANISMS ..................................................5-3
5.6 CUMULATIVE EFFECTS OF MULTIPLE MIXING ZONES ...................5-4
5.7 AQUIFER CHARACTERISTICS .................................................................5-4
5.8 GROUNDWATER DISCHARGES TO SURFACE WATER......................5-4
5.9 DISCHARGES TO INTERMITTENT AND EPHEMERAL STREAMS ....5-5
6.0 REFERENCES ..........................................................................................................6-1
LIST OF TABLES
TABLE 1-1. SUMMARY OF INFORMATION PROVIDED FOR SOURCE
SPECIFIC MIXING ZONE IN SURFACE WATER ...........................1-6
TABLE 1-2. SUMMARY OF INFORMATION PROVIDED FOR WATER
QUALITY ASSESSMENT ...................................................................1-6
LIST OF FIGURES
FIGURE 1-1. PROJECTED OPERATIONAL ALLUVIAL POTENTIOMETRIC
SURFACE .............................................................................................1-3
FIGURE 1-2. SOURCE SPECIFIC MIXING ZONE .................................................1-5
FIGURE 4-1. WATER RESOURCE MONITORING SITES ....................................4-7
H:\Files\TGOLD\11048\Integrated Discharge Permit\Appendices\Appendix D\R17 SW Mixing Zone App 2017.docx\HLN\12/8/2017\065
1-1 12/8/2017 2:14 PM
APPLICATION FOR SOURCE SPECIFIC MIXING ZONE IN
SURFACE WATER FOR TOTAL NITROGEN
TINTINA BLACK BUTTE COPPER PROJECT
1.0 INTRODUCTION
1.1 PURPOSE
This Source Specific Mixing Zone Application is requested by Tintina Resources for a
mixing zone in surface water for the parameter total nitrogen associated with discharges from
its Black Butte Copper Project (Project). The requested mixing zone is associated with
discharges of treated water from the reverse osmosis treatment works to the alluvial aquifer
beneath Sheep Creek (Outfall 001). This source specific mixing zone is requested in Sheep
Creek for total nitrogen as the total nitrogen concentrations in treated Project waters may
range up to 0.57 mg/L. At these levels, total nitrogen would exceed nondegradation
nonsignificant criteria for nutrients (DEQ-12) in Sheep Creek. While the discharge will be to
the alluvial groundwater system, there is a hydrologic connection between the alluvial
groundwater systems and Sheep Creek. This mixing analysis presents the necessary
information as specified in the Administrative Rules of Montana (ARM) 17.30.500.
This request for a source specific mixing zone is being submitted as an appendix to the
integrated permit application for new MPDES and storm water discharges. The integrated
permit includes an application narrative to provide additional detail and supporting
information in the permit. Many of the figures and appendices used in the application
narrative are pertinent to this request for a mixing zone. Duplicate figures are provided in
both the application narrative and mixing zone request; however, appendices included in the
application narrative are referenced in this mixing zone.
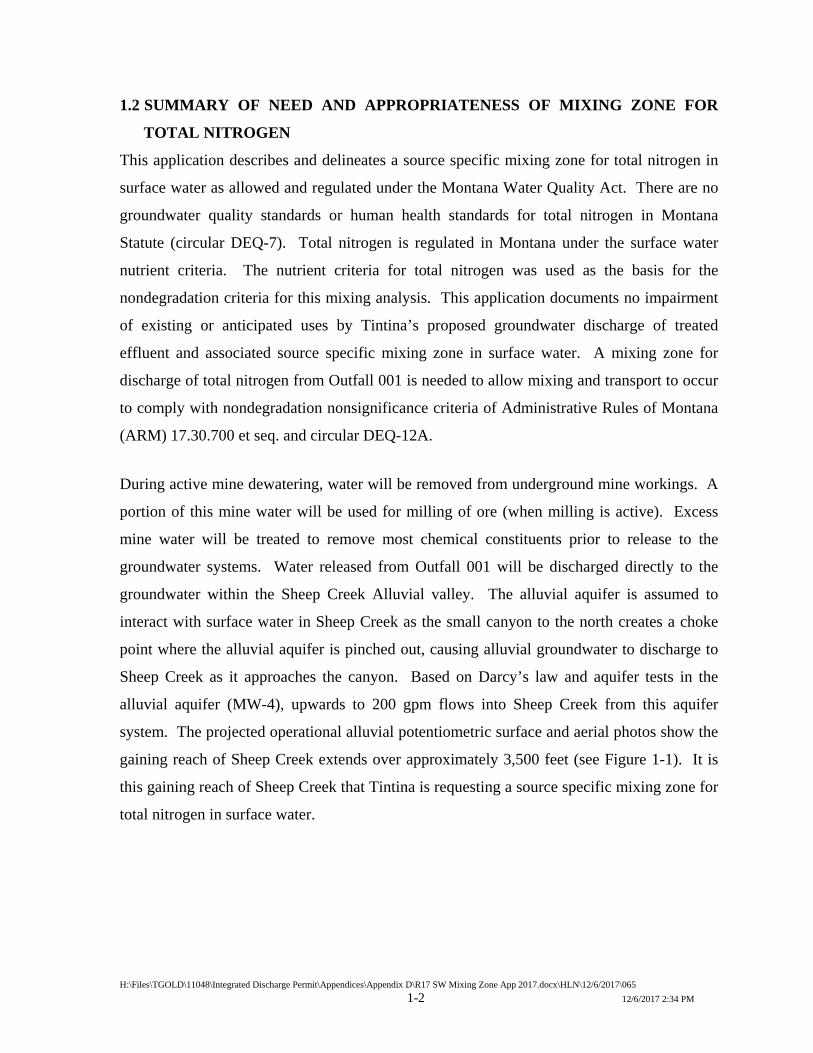
H:\Files\TGOLD\11048\Integrated Discharge Permit\Appendices\Appendix D\R17 SW Mixing Zone App 2017.docx\HLN\12/6/2017\065
1-2 12/6/2017 2:34 PM
1.2 SUMMARY OF NEED AND APPROPRIATENESS OF MIXING ZONE FOR
TOTAL NITROGEN
This application describes and delineates a source specific mixing zone for total nitrogen in
surface water as allowed and regulated under the Montana Water Quality Act. There are no
groundwater quality standards or human health standards for total nitrogen in Montana
Statute (circular DEQ-7). Total nitrogen is regulated in Montana under the surface water
nutrient criteria. The nutrient criteria for total nitrogen was used as the basis for the
nondegradation criteria for this mixing analysis. This application documents no impairment
of existing or anticipated uses by Tintina’s proposed groundwater discharge of treated
effluent and associated source specific mixing zone in surface water. A mixing zone for
discharge of total nitrogen from Outfall 001 is needed to allow mixing and transport to occur
to comply with nondegradation nonsignificance criteria of Administrative Rules of Montana
(ARM) 17.30.700 et seq. and circular DEQ-12A.
During active mine dewatering, water will be removed from underground mine workings. A
portion of this mine water will be used for milling of ore (when milling is active). Excess
mine water will be treated to remove most chemical constituents prior to release to the
groundwater systems. Water released from Outfall 001 will be discharged directly to the
groundwater within the Sheep Creek Alluvial valley. The alluvial aquifer is assumed to
interact with surface water in Sheep Creek as the small canyon to the north creates a choke
point where the alluvial aquifer is pinched out, causing alluvial groundwater to discharge to
Sheep Creek as it approaches the canyon. Based on Darcy’s law and aquifer tests in the
alluvial aquifer (MW-4), upwards to 200 gpm flows into Sheep Creek from this aquifer
system. The projected operational alluvial potentiometric surface and aerial photos show the
gaining reach of Sheep Creek extends over approximately 3,500 feet (see Figure 1-1). It is
this gaining reach of Sheep Creek that Tintina is requesting a source specific mixing zone for
total nitrogen in surface water.

Figure 1-1Projected Operational Alluvial Potentiometric Surface
Black Butte Copper ProjectMeagher County, Montana
5590
5600
5610
5620
5630
5629.11
5627.17
5618.34
5610.89
5606.58
5598.19
5600.48
5590.51
5590.02
5600.63
5608.58
5605.73
5609.89
5613.55
LEGEND
0 500 1000
Surface Water Elevation (feet)
Water Level Contour (feet)
Scale (feet)
K:\p
roje
ct\1
1048
\Dis
char
ge P
erm
it\In
tegr
ated
Per
mit
Rev
ised
_One
UIG
\Fig
ures
\Fig
ure
3.5.
srf
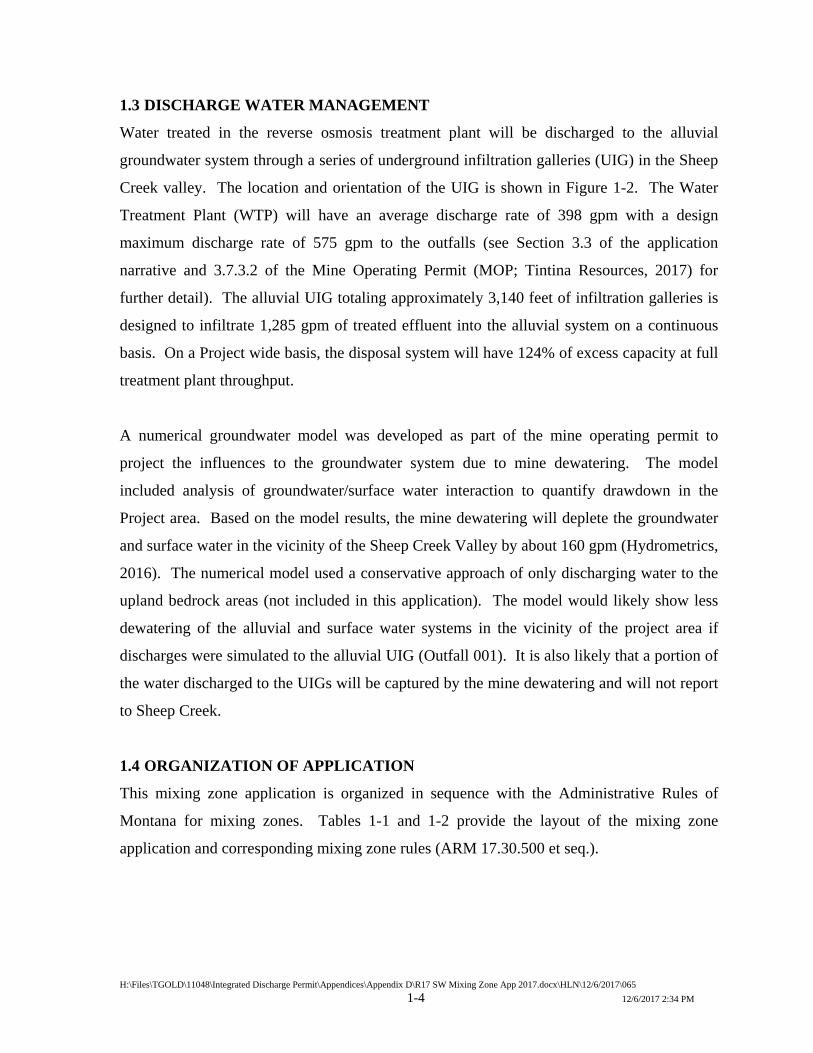
H:\Files\TGOLD\11048\Integrated Discharge Permit\Appendices\Appendix D\R17 SW Mixing Zone App 2017.docx\HLN\12/6/2017\065
1-4 12/6/2017 2:34 PM
1.3 DISCHARGE WATER MANAGEMENT
Water treated in the reverse osmosis treatment plant will be discharged to the alluvial
groundwater system through a series of underground infiltration galleries (UIG) in the Sheep
Creek valley. The location and orientation of the UIG is shown in Figure 1-2. The Water
Treatment Plant (WTP) will have an average discharge rate of 398 gpm with a design
maximum discharge rate of 575 gpm to the outfalls (see Section 3.3 of the application
narrative and 3.7.3.2 of the Mine Operating Permit (MOP; Tintina Resources, 2017) for
further detail). The alluvial UIG totaling approximately 3,140 feet of infiltration galleries is
designed to infiltrate 1,285 gpm of treated effluent into the alluvial system on a continuous
basis. On a Project wide basis, the disposal system will have 124% of excess capacity at full
treatment plant throughput.
A numerical groundwater model was developed as part of the mine operating permit to
project the influences to the groundwater system due to mine dewatering. The model
included analysis of groundwater/surface water interaction to quantify drawdown in the
Project area. Based on the model results, the mine dewatering will deplete the groundwater
and surface water in the vicinity of the Sheep Creek Valley by about 160 gpm (Hydrometrics,
2016). The numerical model used a conservative approach of only discharging water to the
upland bedrock areas (not included in this application). The model would likely show less
dewatering of the alluvial and surface water systems in the vicinity of the project area if
discharges were simulated to the alluvial UIG (Outfall 001). It is also likely that a portion of
the water discharged to the UIGs will be captured by the mine dewatering and will not report
to Sheep Creek.
1.4 ORGANIZATION OF APPLICATION
This mixing zone application is organized in sequence with the Administrative Rules of
Montana for mixing zones. Tables 1-1 and 1-2 provide the layout of the mixing zone
application and corresponding mixing zone rules (ARM 17.30.500 et seq.).

SURFACE WATER SOURCE
SPECIFIC MIXING ZONE
C
O
O
N
C
R
E
E
K
S
H
E
E
P
C
R
E
E
K
001
Source Specific Mixing Zone
Black Butte Copper Project
Meagher County, Montana
Figure 1-2
NO
RT
HSCALE
0
(In Feet)
500
LEGEND
UNDERGROUND INFILTRATION
GALLERY (UIG)
BURIED ALLUVIAL
CONVEYANCE PIPELINE
DISTRIBUTION PIPE UNDER
WETLAND
GROUNDWATER FLOW
DIRECTION
MPDES OUTFALL
001
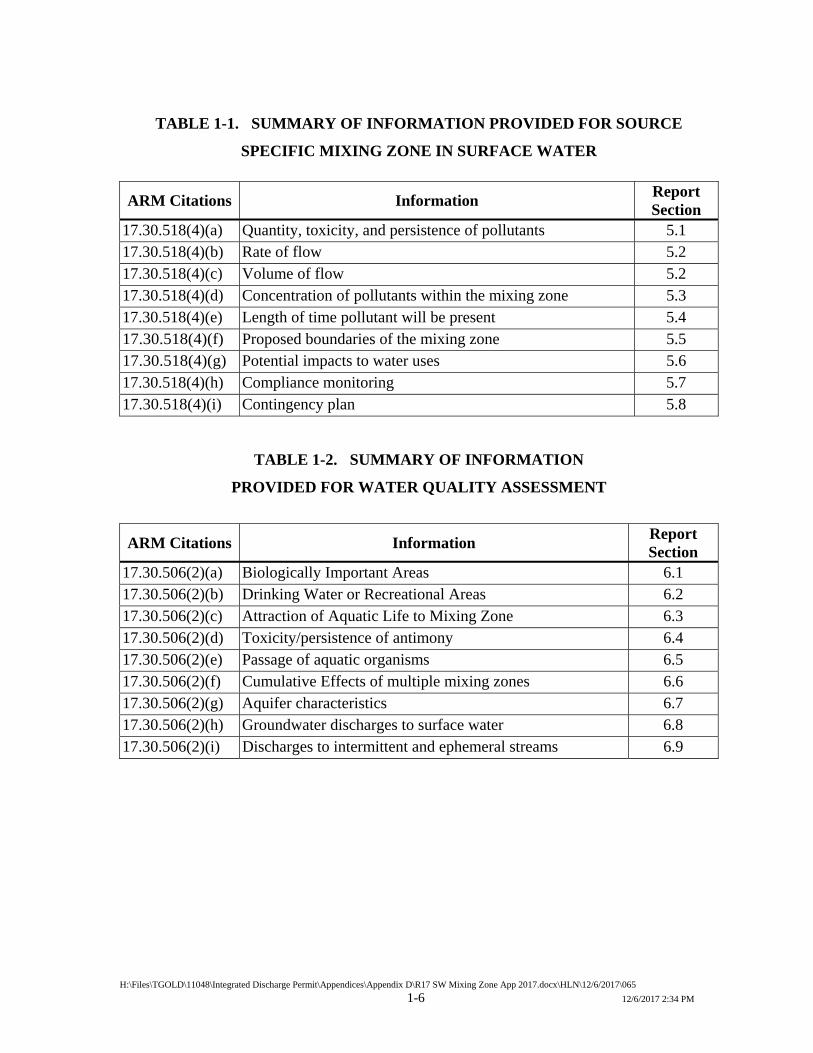
H:\Files\TGOLD\11048\Integrated Discharge Permit\Appendices\Appendix D\R17 SW Mixing Zone App 2017.docx\HLN\12/6/2017\065
1-6 12/6/2017 2:34 PM
TABLE 1-1. SUMMARY OF INFORMATION PROVIDED FOR SOURCE
SPECIFIC MIXING ZONE IN SURFACE WATER
ARM Citations Information Report Section
17.30.518(4)(a) Quantity, toxicity, and persistence of pollutants 5.1 17.30.518(4)(b) Rate of flow 5.2 17.30.518(4)(c) Volume of flow 5.2 17.30.518(4)(d) Concentration of pollutants within the mixing zone 5.3 17.30.518(4)(e) Length of time pollutant will be present 5.4 17.30.518(4)(f) Proposed boundaries of the mixing zone 5.5 17.30.518(4)(g) Potential impacts to water uses 5.6 17.30.518(4)(h) Compliance monitoring 5.7 17.30.518(4)(i) Contingency plan 5.8
TABLE 1-2. SUMMARY OF INFORMATION
PROVIDED FOR WATER QUALITY ASSESSMENT
ARM Citations Information Report Section
17.30.506(2)(a) Biologically Important Areas 6.1 17.30.506(2)(b) Drinking Water or Recreational Areas 6.2 17.30.506(2)(c) Attraction of Aquatic Life to Mixing Zone 6.3 17.30.506(2)(d) Toxicity/persistence of antimony 6.4 17.30.506(2)(e) Passage of aquatic organisms 6.5 17.30.506(2)(f) Cumulative Effects of multiple mixing zones 6.6 17.30.506(2)(g) Aquifer characteristics 6.7 17.30.506(2)(h) Groundwater discharges to surface water 6.8 17.30.506(2)(i) Discharges to intermittent and ephemeral streams 6.9
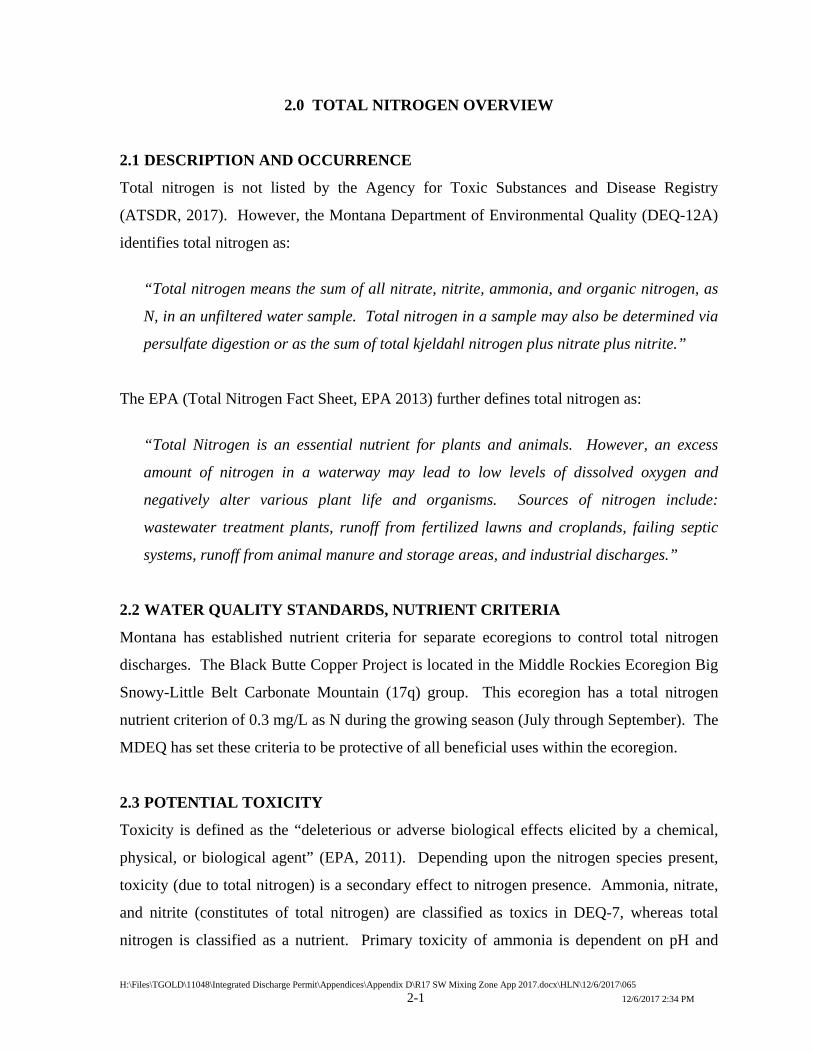
H:\Files\TGOLD\11048\Integrated Discharge Permit\Appendices\Appendix D\R17 SW Mixing Zone App 2017.docx\HLN\12/6/2017\065
2-1 12/6/2017 2:34 PM
2.0 TOTAL NITROGEN OVERVIEW
2.1 DESCRIPTION AND OCCURRENCE
Total nitrogen is not listed by the Agency for Toxic Substances and Disease Registry
(ATSDR, 2017). However, the Montana Department of Environmental Quality (DEQ-12A)
identifies total nitrogen as:
“Total nitrogen means the sum of all nitrate, nitrite, ammonia, and organic nitrogen, as
N, in an unfiltered water sample. Total nitrogen in a sample may also be determined via
persulfate digestion or as the sum of total kjeldahl nitrogen plus nitrate plus nitrite.”
The EPA (Total Nitrogen Fact Sheet, EPA 2013) further defines total nitrogen as:
“Total Nitrogen is an essential nutrient for plants and animals. However, an excess
amount of nitrogen in a waterway may lead to low levels of dissolved oxygen and
negatively alter various plant life and organisms. Sources of nitrogen include:
wastewater treatment plants, runoff from fertilized lawns and croplands, failing septic
systems, runoff from animal manure and storage areas, and industrial discharges.”
2.2 WATER QUALITY STANDARDS, NUTRIENT CRITERIA
Montana has established nutrient criteria for separate ecoregions to control total nitrogen
discharges. The Black Butte Copper Project is located in the Middle Rockies Ecoregion Big
Snowy-Little Belt Carbonate Mountain (17q) group. This ecoregion has a total nitrogen
nutrient criterion of 0.3 mg/L as N during the growing season (July through September). The
MDEQ has set these criteria to be protective of all beneficial uses within the ecoregion.
2.3 POTENTIAL TOXICITY
Toxicity is defined as the “deleterious or adverse biological effects elicited by a chemical,
physical, or biological agent” (EPA, 2011). Depending upon the nitrogen species present,
toxicity (due to total nitrogen) is a secondary effect to nitrogen presence. Ammonia, nitrate,
and nitrite (constitutes of total nitrogen) are classified as toxics in DEQ-7, whereas total
nitrogen is classified as a nutrient. Primary toxicity of ammonia is dependent on pH and

H:\Files\TGOLD\11048\Integrated Discharge Permit\Appendices\Appendix D\R17 SW Mixing Zone App 2017.docx\HLN\12/6/2017\065
2-2 12/6/2017 2:34 PM
temperature. Whereas excessive nitrogen concentrations can reduce dissolved oxygen to
levels deemed toxic to aquatic life by promoting plant growth and decay.
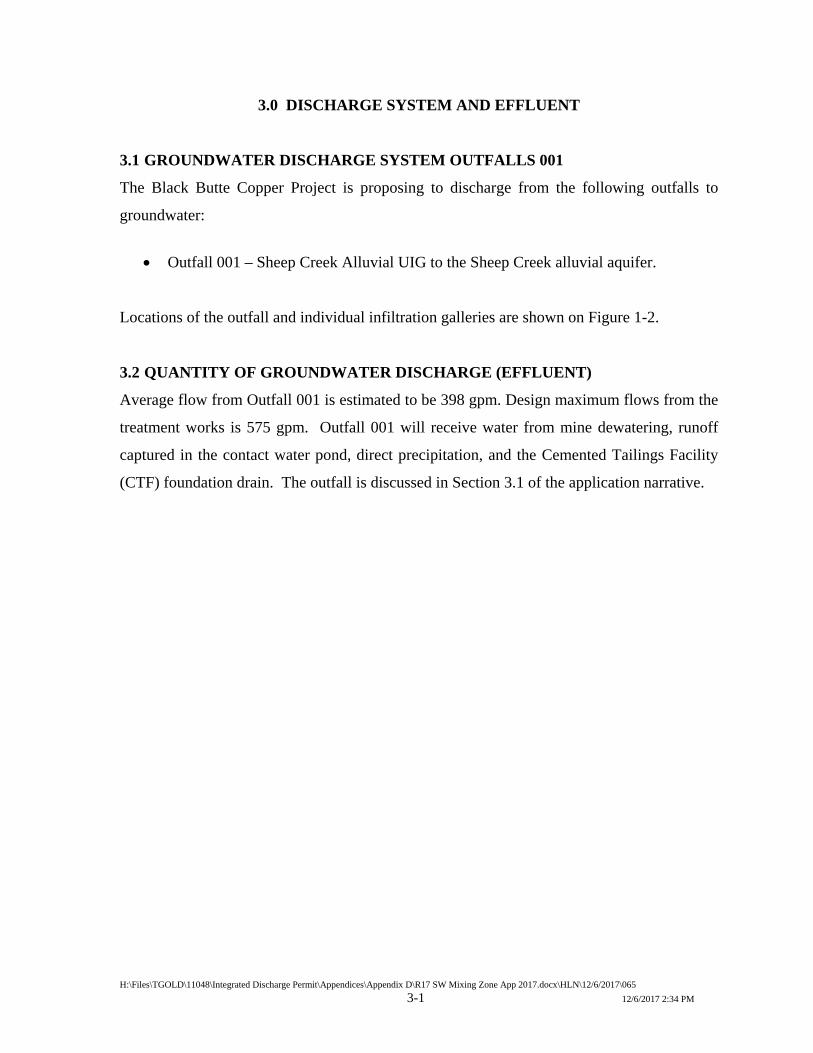
H:\Files\TGOLD\11048\Integrated Discharge Permit\Appendices\Appendix D\R17 SW Mixing Zone App 2017.docx\HLN\12/6/2017\065
3-1 12/6/2017 2:34 PM
3.0 DISCHARGE SYSTEM AND EFFLUENT
3.1 GROUNDWATER DISCHARGE SYSTEM OUTFALLS 001
The Black Butte Copper Project is proposing to discharge from the following outfalls to
groundwater:
Outfall 001 – Sheep Creek Alluvial UIG to the Sheep Creek alluvial aquifer.
Locations of the outfall and individual infiltration galleries are shown on Figure 1-2.
3.2 QUANTITY OF GROUNDWATER DISCHARGE (EFFLUENT)
Average flow from Outfall 001 is estimated to be 398 gpm. Design maximum flows from the
treatment works is 575 gpm. Outfall 001 will receive water from mine dewatering, runoff
captured in the contact water pond, direct precipitation, and the Cemented Tailings Facility
(CTF) foundation drain. The outfall is discussed in Section 3.1 of the application narrative.
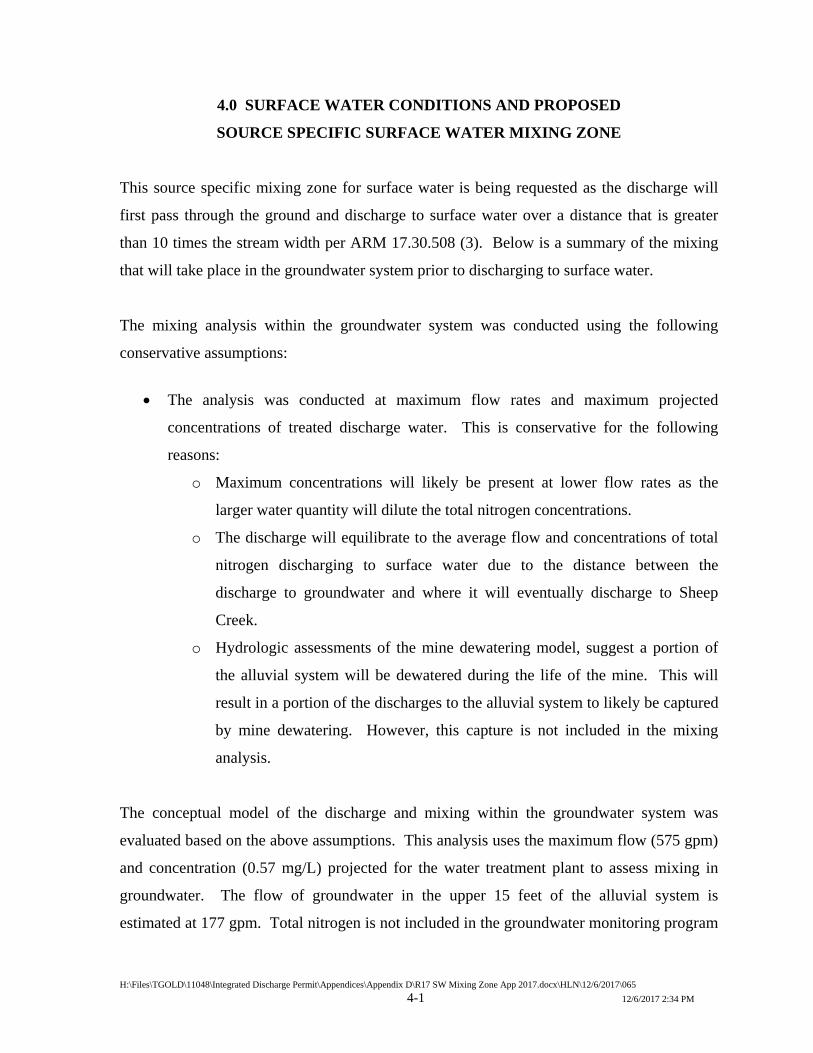
H:\Files\TGOLD\11048\Integrated Discharge Permit\Appendices\Appendix D\R17 SW Mixing Zone App 2017.docx\HLN\12/6/2017\065
4-1 12/6/2017 2:34 PM
4.0 SURFACE WATER CONDITIONS AND PROPOSED
SOURCE SPECIFIC SURFACE WATER MIXING ZONE
This source specific mixing zone for surface water is being requested as the discharge will
first pass through the ground and discharge to surface water over a distance that is greater
than 10 times the stream width per ARM 17.30.508 (3). Below is a summary of the mixing
that will take place in the groundwater system prior to discharging to surface water.
The mixing analysis within the groundwater system was conducted using the following
conservative assumptions:
The analysis was conducted at maximum flow rates and maximum projected
concentrations of treated discharge water. This is conservative for the following
reasons:
o Maximum concentrations will likely be present at lower flow rates as the
larger water quantity will dilute the total nitrogen concentrations.
o The discharge will equilibrate to the average flow and concentrations of total
nitrogen discharging to surface water due to the distance between the
discharge to groundwater and where it will eventually discharge to Sheep
Creek.
o Hydrologic assessments of the mine dewatering model, suggest a portion of
the alluvial system will be dewatered during the life of the mine. This will
result in a portion of the discharges to the alluvial system to likely be captured
by mine dewatering. However, this capture is not included in the mixing
analysis.
The conceptual model of the discharge and mixing within the groundwater system was
evaluated based on the above assumptions. This analysis uses the maximum flow (575 gpm)
and concentration (0.57 mg/L) projected for the water treatment plant to assess mixing in
groundwater. The flow of groundwater in the upper 15 feet of the alluvial system is
estimated at 177 gpm. Total nitrogen is not included in the groundwater monitoring program
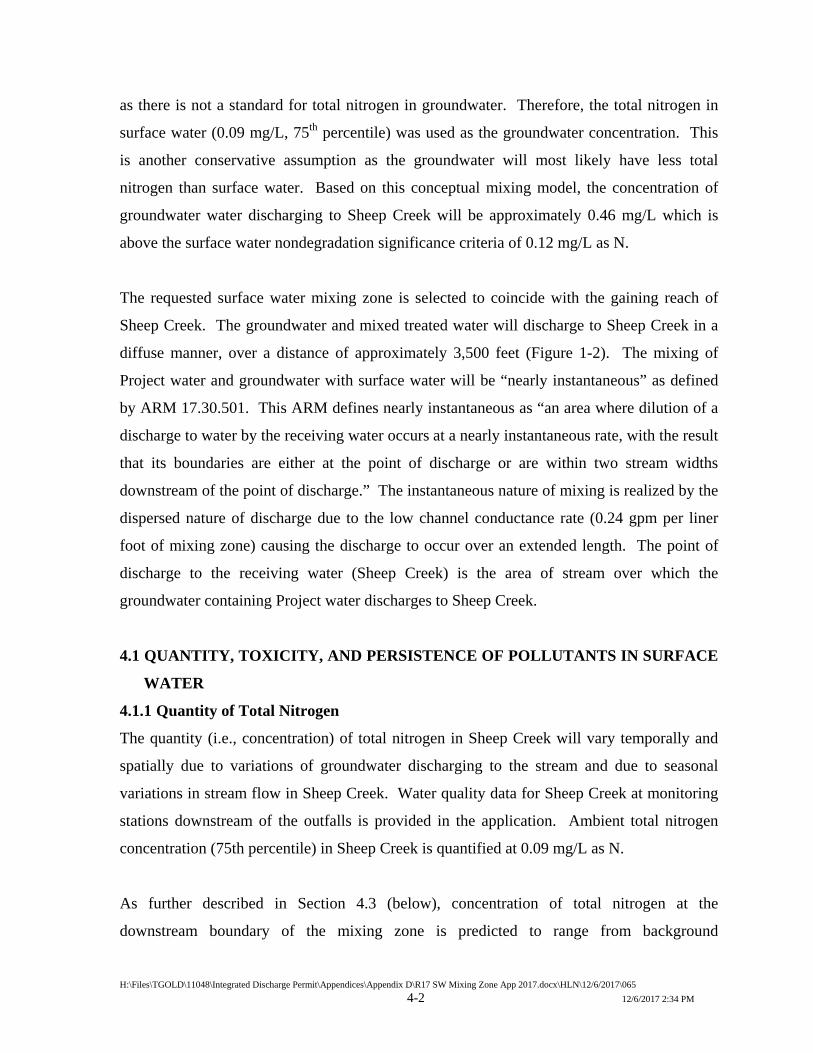
H:\Files\TGOLD\11048\Integrated Discharge Permit\Appendices\Appendix D\R17 SW Mixing Zone App 2017.docx\HLN\12/6/2017\065
4-2 12/6/2017 2:34 PM
as there is not a standard for total nitrogen in groundwater. Therefore, the total nitrogen in
surface water (0.09 mg/L, 75th percentile) was used as the groundwater concentration. This
is another conservative assumption as the groundwater will most likely have less total
nitrogen than surface water. Based on this conceptual mixing model, the concentration of
groundwater water discharging to Sheep Creek will be approximately 0.46 mg/L which is
above the surface water nondegradation significance criteria of 0.12 mg/L as N.
The requested surface water mixing zone is selected to coincide with the gaining reach of
Sheep Creek. The groundwater and mixed treated water will discharge to Sheep Creek in a
diffuse manner, over a distance of approximately 3,500 feet (Figure 1-2). The mixing of
Project water and groundwater with surface water will be “nearly instantaneous” as defined
by ARM 17.30.501. This ARM defines nearly instantaneous as “an area where dilution of a
discharge to water by the receiving water occurs at a nearly instantaneous rate, with the result
that its boundaries are either at the point of discharge or are within two stream widths
downstream of the point of discharge.” The instantaneous nature of mixing is realized by the
dispersed nature of discharge due to the low channel conductance rate (0.24 gpm per liner
foot of mixing zone) causing the discharge to occur over an extended length. The point of
discharge to the receiving water (Sheep Creek) is the area of stream over which the
groundwater containing Project water discharges to Sheep Creek.
4.1 QUANTITY, TOXICITY, AND PERSISTENCE OF POLLUTANTS IN SURFACE
WATER
4.1.1 Quantity of Total Nitrogen
The quantity (i.e., concentration) of total nitrogen in Sheep Creek will vary temporally and
spatially due to variations of groundwater discharging to the stream and due to seasonal
variations in stream flow in Sheep Creek. Water quality data for Sheep Creek at monitoring
stations downstream of the outfalls is provided in the application. Ambient total nitrogen
concentration (75th percentile) in Sheep Creek is quantified at 0.09 mg/L as N.
As further described in Section 4.3 (below), concentration of total nitrogen at the
downstream boundary of the mixing zone is predicted to range from background
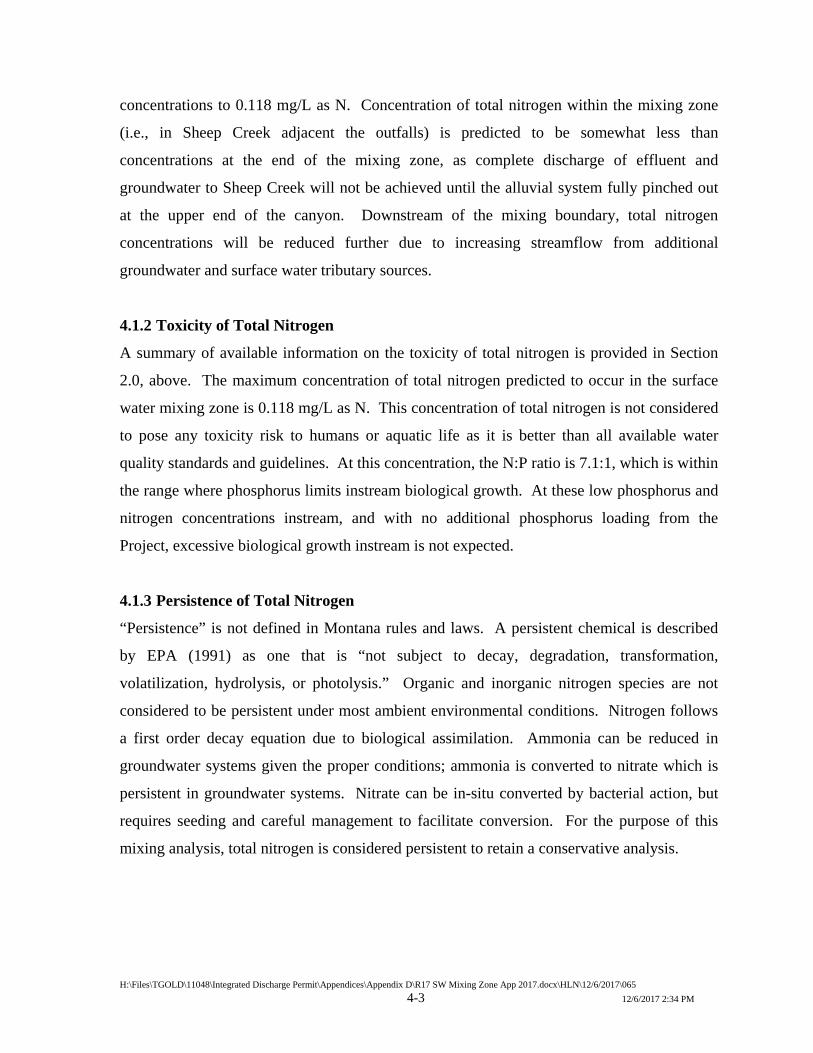
H:\Files\TGOLD\11048\Integrated Discharge Permit\Appendices\Appendix D\R17 SW Mixing Zone App 2017.docx\HLN\12/6/2017\065
4-3 12/6/2017 2:34 PM
concentrations to 0.118 mg/L as N. Concentration of total nitrogen within the mixing zone
(i.e., in Sheep Creek adjacent the outfalls) is predicted to be somewhat less than
concentrations at the end of the mixing zone, as complete discharge of effluent and
groundwater to Sheep Creek will not be achieved until the alluvial system fully pinched out
at the upper end of the canyon. Downstream of the mixing boundary, total nitrogen
concentrations will be reduced further due to increasing streamflow from additional
groundwater and surface water tributary sources.
4.1.2 Toxicity of Total Nitrogen
A summary of available information on the toxicity of total nitrogen is provided in Section
2.0, above. The maximum concentration of total nitrogen predicted to occur in the surface
water mixing zone is 0.118 mg/L as N. This concentration of total nitrogen is not considered
to pose any toxicity risk to humans or aquatic life as it is better than all available water
quality standards and guidelines. At this concentration, the N:P ratio is 7.1:1, which is within
the range where phosphorus limits instream biological growth. At these low phosphorus and
nitrogen concentrations instream, and with no additional phosphorus loading from the
Project, excessive biological growth instream is not expected.
4.1.3 Persistence of Total Nitrogen
“Persistence” is not defined in Montana rules and laws. A persistent chemical is described
by EPA (1991) as one that is “not subject to decay, degradation, transformation,
volatilization, hydrolysis, or photolysis.” Organic and inorganic nitrogen species are not
considered to be persistent under most ambient environmental conditions. Nitrogen follows
a first order decay equation due to biological assimilation. Ammonia can be reduced in
groundwater systems given the proper conditions; ammonia is converted to nitrate which is
persistent in groundwater systems. Nitrate can be in-situ converted by bacterial action, but
requires seeding and careful management to facilitate conversion. For the purpose of this
mixing analysis, total nitrogen is considered persistent to retain a conservative analysis.
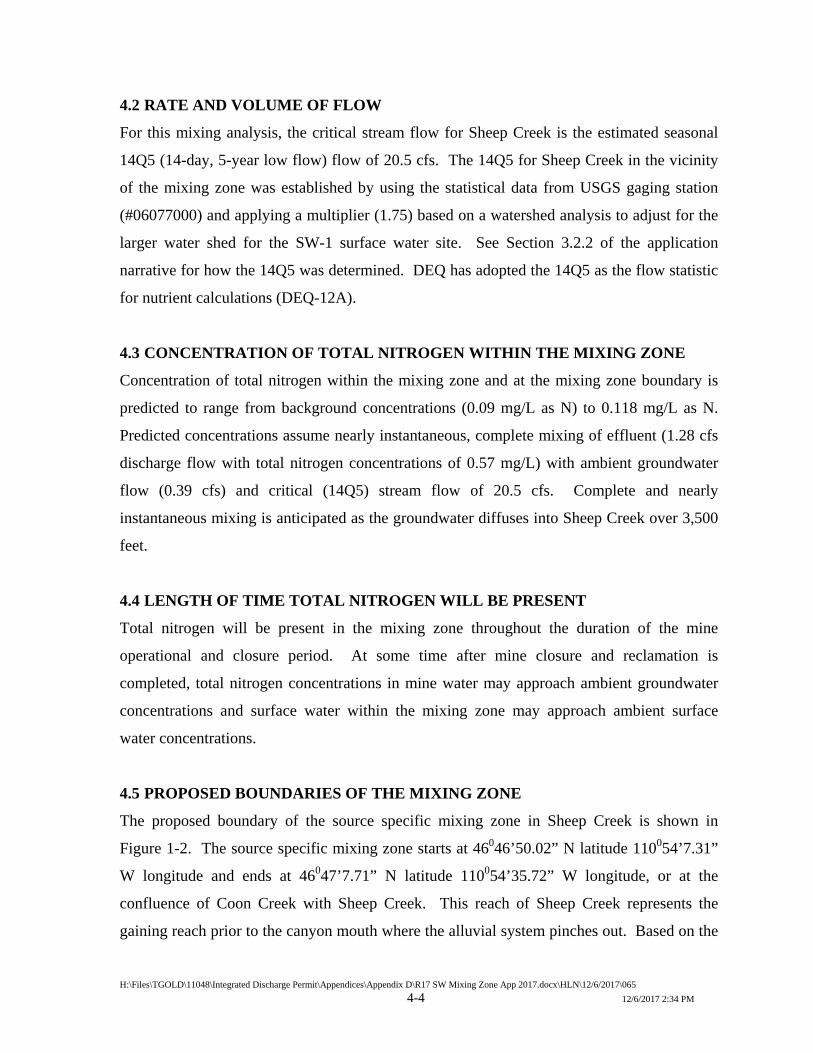
H:\Files\TGOLD\11048\Integrated Discharge Permit\Appendices\Appendix D\R17 SW Mixing Zone App 2017.docx\HLN\12/6/2017\065
4-4 12/6/2017 2:34 PM
4.2 RATE AND VOLUME OF FLOW
For this mixing analysis, the critical stream flow for Sheep Creek is the estimated seasonal
14Q5 (14-day, 5-year low flow) flow of 20.5 cfs. The 14Q5 for Sheep Creek in the vicinity
of the mixing zone was established by using the statistical data from USGS gaging station
(#06077000) and applying a multiplier (1.75) based on a watershed analysis to adjust for the
larger water shed for the SW-1 surface water site. See Section 3.2.2 of the application
narrative for how the 14Q5 was determined. DEQ has adopted the 14Q5 as the flow statistic
for nutrient calculations (DEQ-12A).
4.3 CONCENTRATION OF TOTAL NITROGEN WITHIN THE MIXING ZONE
Concentration of total nitrogen within the mixing zone and at the mixing zone boundary is
predicted to range from background concentrations (0.09 mg/L as N) to 0.118 mg/L as N.
Predicted concentrations assume nearly instantaneous, complete mixing of effluent (1.28 cfs
discharge flow with total nitrogen concentrations of 0.57 mg/L) with ambient groundwater
flow (0.39 cfs) and critical (14Q5) stream flow of 20.5 cfs. Complete and nearly
instantaneous mixing is anticipated as the groundwater diffuses into Sheep Creek over 3,500
feet.
4.4 LENGTH OF TIME TOTAL NITROGEN WILL BE PRESENT
Total nitrogen will be present in the mixing zone throughout the duration of the mine
operational and closure period. At some time after mine closure and reclamation is
completed, total nitrogen concentrations in mine water may approach ambient groundwater
concentrations and surface water within the mixing zone may approach ambient surface
water concentrations.
4.5 PROPOSED BOUNDARIES OF THE MIXING ZONE
The proposed boundary of the source specific mixing zone in Sheep Creek is shown in
Figure 1-2. The source specific mixing zone starts at 46046’50.02” N latitude 110054’7.31”
W longitude and ends at 46047’7.71” N latitude 110054’35.72” W longitude, or at the
confluence of Coon Creek with Sheep Creek. This reach of Sheep Creek represents the
gaining reach prior to the canyon mouth where the alluvial system pinches out. Based on the
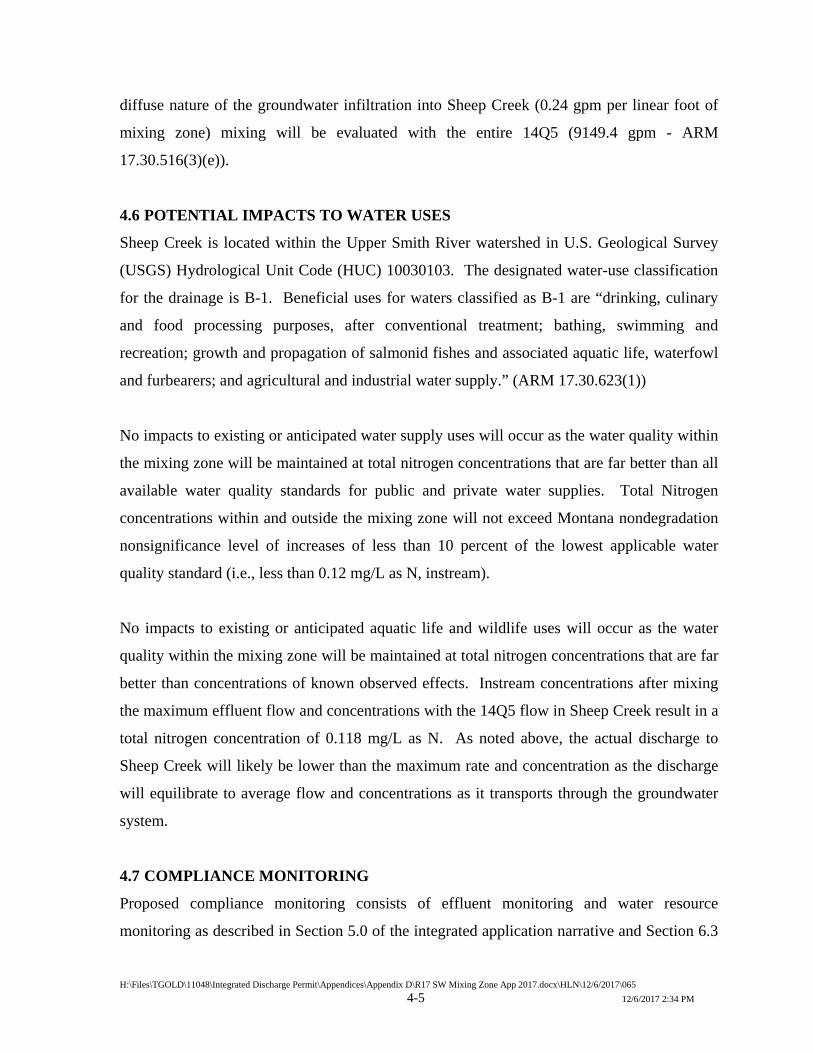
H:\Files\TGOLD\11048\Integrated Discharge Permit\Appendices\Appendix D\R17 SW Mixing Zone App 2017.docx\HLN\12/6/2017\065
4-5 12/6/2017 2:34 PM
diffuse nature of the groundwater infiltration into Sheep Creek (0.24 gpm per linear foot of
mixing zone) mixing will be evaluated with the entire 14Q5 (9149.4 gpm - ARM
17.30.516(3)(e)).
4.6 POTENTIAL IMPACTS TO WATER USES
Sheep Creek is located within the Upper Smith River watershed in U.S. Geological Survey
(USGS) Hydrological Unit Code (HUC) 10030103. The designated water-use classification
for the drainage is B-1. Beneficial uses for waters classified as B-1 are “drinking, culinary
and food processing purposes, after conventional treatment; bathing, swimming and
recreation; growth and propagation of salmonid fishes and associated aquatic life, waterfowl
and furbearers; and agricultural and industrial water supply.” (ARM 17.30.623(1))
No impacts to existing or anticipated water supply uses will occur as the water quality within
the mixing zone will be maintained at total nitrogen concentrations that are far better than all
available water quality standards for public and private water supplies. Total Nitrogen
concentrations within and outside the mixing zone will not exceed Montana nondegradation
nonsignificance level of increases of less than 10 percent of the lowest applicable water
quality standard (i.e., less than 0.12 mg/L as N, instream).
No impacts to existing or anticipated aquatic life and wildlife uses will occur as the water
quality within the mixing zone will be maintained at total nitrogen concentrations that are far
better than concentrations of known observed effects. Instream concentrations after mixing
the maximum effluent flow and concentrations with the 14Q5 flow in Sheep Creek result in a
total nitrogen concentration of 0.118 mg/L as N. As noted above, the actual discharge to
Sheep Creek will likely be lower than the maximum rate and concentration as the discharge
will equilibrate to average flow and concentrations as it transports through the groundwater
system.
4.7 COMPLIANCE MONITORING
Proposed compliance monitoring consists of effluent monitoring and water resource
monitoring as described in Section 5.0 of the integrated application narrative and Section 6.3
H:\Files\TGOLD\11048\Integrated Discharge Permit\Appendices\Appendix D\R17 SW Mixing Zone App 2017.docx\HLN\12/6/2017\065
4-6 12/6/2017 2:34 PM
of the MOP. Proposed monitoring sites for compliance with discharge permit requirements
are shown in Figure 4-1.
4.8 CONTINGENCY PLAN
Migration of total nitrogen beyond the mixing zone boundary at concentrations greater than
the nonsignificance criteria (0.12 mg/L as N, in Sheep Creek) is unlikely due to the
conservative assumptions built into this analysis, high level of dilution available instream,
compliance monitoring, and active engineering controls. Although it is unlikely that total
nitrogen would exceed the nonsignificance criteria, the below contingency actions would
include the following:
Halting or reducing Project activities if necessary to maintain compliance with
mixing zone limits; and
All reasonable steps to minimize or prevent violation of mixing zone limits.
Reasonable steps to correct non-compliance with mixing zone boundaries would depend on
the cause of the condition, but might reasonably include:
1. Additional monitoring and evaluation to identify the cause or source of the non-
compliance.
2. Additional actions to improve the effectiveness of water treatment.
3. Additional actions to minimize the volume of water discharged, or augmentation of
instream flows.
4.9 SMALLEST PRACTICAL MIXING ZONE AND MINIMUM PRACTICABLE
EFFECT ON WATER USERS
The area of the requested mixing zone is selected to coincide with the gaining reach of Sheep
Creek for discharges from Outfall 001 and is as small as practicable. Direct discharges
(Outfall 001) to the alluvial groundwater system will discharge to Sheep Creek where the
alluvial system is pinched out near the head of the canyon to the north. The mixing zone will

#*
!H
!H
!H
!H
!H
#*#*
#*
#*
@?
@?
@?
@?
@?
@?
@?
@?
@?
@?
@?
@?@?
@?
@?
@?
@?
#*
")
")
")
")
")
")
")")")
")
@?
@?
@?@?
@?
@?@?
@?
@?
@?
@?
@?
@?
@?
@?
@?
@?@?
@?
@?
@?
@?
@?
@A
@A
")
")
")
")
")
")")")
")
@A
@A
@A@A
@A
@?@?
@?
@?
!H
@A
!H !H
PW-8PW-9 PW-4
PW-2
PW-1
PW-3
PW-5
PW-7
PW-6
PW-10MW-9
MW-7
MW-8
MW-3
MW-4B
MW-4A
MW-2A
MW-1AMW-1B
MW-2B
MW-6A/6B
MW-14
SC15-194
SC15-198
PZ-11
PZ-12PZ-10
PZ-09
PZ-08
PZ-05PZ-04
PZ-02
PZ-01
PZ-07APZ-07B
PZ-03
001
001
SW-3
SW-14
SW-6
SW-4
SW-1
BB WM5
BB WM6
BB WM7
BB WM8
BB WM2
BB WM1
SC 12-116
001
Copyright:© 2013
Coon
I:\Lan
d Proj
ects\
1104
801\G
IS\11
0480
1H08
1.mxd
Water Resource Monitoring SitesBlack Butte Copper ProjectMeagher County, Montana
Creek
Figure 4-1Date: December 2017, Source: Hydrometrics, Inc. (2017)
LEGEND@?
Piezometers (approx. location) in UIGArea
@? Monitoring Wells in UIG Area") Test Wells in UIG Area#* Surface Water Monitoring Point!H Proposed Bedrock Monitoring Wells!H Proposed Alluvial Monitoring Well
#*Proposed Surface Water MeasuringPoint
#* MPDES Outfall 001Mine Permit BoundaryUnderground Infiltration GalleryBuried Alluvial Conveyance Line
o0 1,000 2,000500
Feet
H:\Files\TGOLD\11048\Integrated Discharge Permit\Appendices\Appendix D\R17 SW Mixing Zone App 2017.docx\HLN\12/6/2017\065
4-8 12/6/2017 2:34 PM
have no practicable effect on water users as total nitrogen concentrations within the
groundwater mixing zone will be maintained at levels that are better than all established
water quality standards and nondegradation requirements.
The mixing zone is the smallest practicable size for the following reasons:
1. Effluent will be treated to a very high level prior to release to groundwater. Using a
conservative analysis (100% of the maximum treated effluent) predicts compliance
with the nondegradation policy and rules.
2. The mixing zone is the area within which the groundwater flow of effluent to Sheep
Creek will occur.
3. The end of the mixing zone corresponds with the end of the gaining reach of Sheep
Creek at the head of the canyon. It is assumed that 100% of the alluvial aquifer
groundwater reports to Sheep Creek by that point.
H:\Files\TGOLD\11048\Integrated Discharge Permit\Appendices\Appendix D\R17 SW Mixing Zone App 2017.docx\HLN\12/6/2017\065
5-1 12/6/2017 2:34 PM
5.0 WATER QUALITY ASSESSMENT
The Montana Water Quality Act allows and regulates mixing zones. This application
describes and delineates a source specific mixing zone for total nitrogen in surface water.
This application documents no impairment of existing or anticipated uses by Tintina’s
proposed groundwater discharge and associated source specific mixing zone in surface water.
5.1 BIOLOGICALLY IMPORTANT AREAS
Biologically important areas for purposes of consideration of the proposed mixing zone are
defined in ARM 17.30.506 (2)(a) as follows:
“the presence of fish spawning areas or shallow water nursery areas within the proposed
mixing zone or a “shore hugging” effluent plume in an aquatic life segment will support a
finding that the mixing zone may be inappropriate during the spawning or nursery
periods.”
Habitat and spawning locations in Sheep Creek are summarized in the baseline fisheries
report. Annual fisheries monitoring (since 2014) is ongoing and is presented as Appendix G
of the MOP.
Due to the low stream channel conductance value, the average rate of groundwater flow into
the stream water column is 0.25 gpm per linear foot of mixing zone. At these low rates
mixing will be nearly instantaneous.
5.2 DRINKING WATER OR RECREATIONAL AREAS
Drinking water or recreational areas and activities for purposes of consideration of the
proposed mixing zone are defined in ARM 17.30.506 (2)(b) as follows:
“the existence of a drinking water intake, a zone of influence around a drinking water
well or a well used for recreational purposes, or a recreational area within or immediately
adjacent to the proposed mixing zone will support a finding that a mixing zone is not
appropriate. For purposes of these rules, “recreational” refers to swimming and
H:\Files\TGOLD\11048\Integrated Discharge Permit\Appendices\Appendix D\R17 SW Mixing Zone App 2017.docx\HLN\12/6/2017\065
5-2 12/6/2017 2:34 PM
“recreational area” refers to a public beach or swimming area, including areas adjacent to
streams or lakes.”
There are no existing or anticipated drinking water uses in the proposed mixing zone. No
impacts to existing or anticipated water supply uses will occur as the water quality within the
mixing zone will be maintained at total nitrogen concentrations that are far better than all
available water quality standards for public and private water supplies. Total nitrogen
concentrations within and outside the mixing zone will not exceed Montana nondegradation
limits of 10 percent of the lowest applicable water quality standard (i.e., less than 0.12 mg/L
as N).
There are no designated public beaches or swimming areas within or near the mixing zone.
However, other types of recreational uses may occur in Sheep Creek downstream of the
mixing zone within the Helena National Forest. There are fishing access points where access
to fishing or secondary contact recreation may occur. No impacts to existing or anticipated
water supply uses will occur as the water quality within the mixing zone will be maintained
at total nitrogen concentrations that are far better than all available water quality standards
for public and private water supplies.
5.3 ATTRACTION OF AQUATIC LIFE TO MIXING ZONE
Attraction of aquatic life to mixing zone for purposes of consideration of the proposed
mixing zone is defined in ARM 17.30.506 (2)(c) as follows:
“where currently available data support a conclusion that fish or other aquatic life would
be attracted to the effluent plume, resulting in adverse effects such as acute or chronic
toxicity, it may be appropriate to adjust a given mixing zone for substances believed to
cause the toxic effects.”
There is no known or currently available data suggesting that aquatic life would be attracted
to the effluent plume. Moreover, no toxic effects would occur if attraction were to occur as

H:\Files\TGOLD\11048\Integrated Discharge Permit\Appendices\Appendix D\R17 SW Mixing Zone App 2017.docx\HLN\12/6/2017\065
5-3 12/6/2017 2:34 PM
total nitrogen concentrations within the mixing zone will be far below applicable water
quality standards and observed effects levels.
5.4 TOXICITY AND PERSISTENCE OF TOTAL NITROGEN
Toxicity/persistence of the substance discharged for purposes of consideration of the
proposed mixing zone is defined in ARM 17.30.506 (2)(d) as follows:
“where a discharge of a parameter is at a concentration that is both toxic and persistent, it
may be appropriate to deny a mixing zone. Toxicity and persistence will be given added
weight to deny a mixing zone where the parameter is expected to remain biologically
available and where a watershed-based solution has not been implemented. For ground
water, this factor will also be considered in areas where the parameter may remain in the
ground water for a period of years after the discharge ceases.”
In the proposed discharges and mixing zone, total nitrogen will not be present at toxic
concentrations. Projected instream concentrations of total nitrogen at 0.118 mg/L as N will
not allow for biological growth to achieve detrimental levels.
5.5 PASSAGES OF AQUATIC ORGANISMS
Passage of aquatic organisms for purposes of consideration of the proposed mixing zone is
defined in ARM 17.30.506 (2)(e) as follows:
“where currently available data indicate that a mixing zone would inhibit migration of
fish or other aquatic species, no mixing zone may be allowed for the parameters that
inhibit migration. In making this determination, the department will consider whether
any parameter in the effluent plume will block migration into tributary segments.”
No significant tributaries to Sheep Creek are present within the proposed mixing zone.
Concentrations of total nitrogen within the mixing zone will be low and are not expected to
inhibit migration of organisms. Diffusion of groundwater into the stream channel is limited
by channel conductance values. Groundwater will flow into Sheep Creek over
approximately 3,500 feet.
H:\Files\TGOLD\11048\Integrated Discharge Permit\Appendices\Appendix D\R17 SW Mixing Zone App 2017.docx\HLN\12/6/2017\065
5-4 12/6/2017 2:34 PM
5.6 CUMULATIVE EFFECTS OF MULTIPLE MIXING ZONES
There are no existing or anticipated mixing zones in Sheep Creek. Thus, no cumulative
effects will occur.
5.7 AQUIFER CHARACTERISTICS
Aquifer characteristics for purposes of consideration of the proposed mixing zone is defined
in ARM 17.30.506 (2)(g) as follows:
“when currently available data indicate that the movement of ground water or pollutants
within the subsurface cannot be accurately predicted, such as the movement of ground
water through fractures, and also indicate that this unpredictability might result in adverse
impacts due to a particular concentration of a parameter in the mixing zone, it may be
appropriate to deny the mixing zone for the parameter of concern.”
The aquifer that will receive discharges from Outfall 001 is an alluvial aquifer composed of
granular sediment (gravel, silt, sand, and cobbles). Flow of groundwater through this porous
media is predictable and is not influenced by fractures. A detailed analysis of the aquifer has
been conducted based on aquifer tests and infiltration tests at 10 sites in the alluvial system.
A detailed potentiometric map provides the necessary information on groundwater flow
directions and the modeling analysis shows how discharges to the alluvial system will affect
where groundwater discharges to Sheep Creek (Figure 1-1). A detailed report from the
characterization study is attached to the permit application narrative as Appendix E.
5.8 GROUNDWATER DISCHARGES TO SURFACE WATER
Groundwater discharges to surface water for purposes of consideration of the proposed
mixing zone is defined in ARM 17.30.506 (2)(h) as follows:
“In the case of a discharge to ground water which in turn discharges to surface water
within a reasonably short time or distance, the mixing zone may extend into the surface
water, and the same considerations which apply to setting mixing zones for direct

H:\Files\TGOLD\11048\Integrated Discharge Permit\Appendices\Appendix D\R17 SW Mixing Zone App 2017.docx\HLN\12/6/2017\065
5-5 12/6/2017 2:34 PM
discharges to surface water will apply in determining the allowability and extent of the
mixing zone in the surface water.”
The proposed groundwater mixing zone extends into adjacent surface water where nearly
instantaneous mixing occurs along the length of the mixing zone.
5.9 DISCHARGES TO INTERMITTENT AND EPHEMERAL STREAMS
There will be no discharges to intermittent of ephemeral streams associated with the
proposed mixing zone.
H:\Files\TGOLD\11048\Integrated Discharge Permit\Appendices\Appendix D\R17 SW Mixing Zone App 2017.docx\HLN\12/6/2017\065
6-1 12/6/2017 2:34 PM
6.0 REFERENCES
ATSDR, 2017. Agency for Toxic Substances and Disease Registry. Online at https://www.atsdr.cdc.gov/. October, 2017.
DEQ, 2006. Administrative Rules of Montana, Chapter 30 Subchapter 5 Mixing Zones in
Surface and Ground Water. 2006 DEQ, 2014a. Circular DEQ-12A Montana Base Numeric Nutrient Standards. July 2014 DEQ, 2014b. Administrative Rules of Montana, Chapter 30 Subchapter 7 Nondegradation of
Water Quality. 2014 DEQ, 2017. Circular DEQ-7 Montana Numeric Water Quality Standards. May 2017. Hydrometrics, Inc., 2016. Groundwater Modeling Assessment for the Black Butte Copper
Project, Meagher County, Montana. Revised June 2016. Tintina Resources, 2017. Mine Operating Permit Application, Black Butte Copper Project,
Meagher County, MT Revision 3. July 2017. US EPA, 1991. Technical Support Document for Water Quality-Based Toxics Control.
Office of Water. EPA/505/2-90-001; PB91-127415. March 1991. US EPA, 2011. EPA Interrogated Risk Information System (IRIS) glossary, accessed
October 2017. US EPA, 2013. Total Nitrogen Fact Sheet. June 2013.

H:\Files\TGOLD\11048\Integrated Discharge Permit\R17 Permit Application Narrative.Docx\\12/11/17\065 12/11/17\7:28 AM
APPENDIX E
INFILTRATION STUDY REPORT
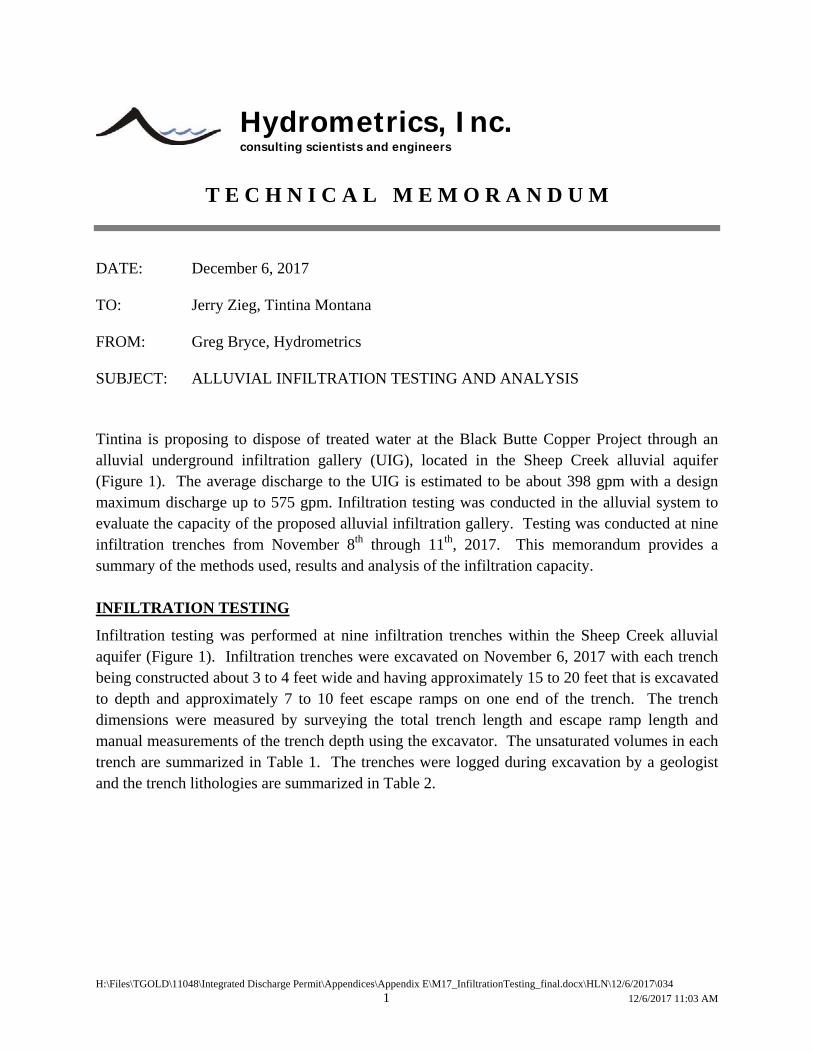
H:\Files\TGOLD\11048\Integrated Discharge Permit\Appendices\Appendix E\M17_InfiltrationTesting_final.docx\HLN\12/6/2017\034
1 12/6/2017 11:03 AM
T E C H N I C A L M E M O R A N D U M
DATE: December 6, 2017 TO: Jerry Zieg, Tintina Montana FROM: Greg Bryce, Hydrometrics SUBJECT: ALLUVIAL INFILTRATION TESTING AND ANALYSIS Tintina is proposing to dispose of treated water at the Black Butte Copper Project through an alluvial underground infiltration gallery (UIG), located in the Sheep Creek alluvial aquifer (Figure 1). The average discharge to the UIG is estimated to be about 398 gpm with a design maximum discharge up to 575 gpm. Infiltration testing was conducted in the alluvial system to evaluate the capacity of the proposed alluvial infiltration gallery. Testing was conducted at nine infiltration trenches from November 8th through 11th, 2017. This memorandum provides a summary of the methods used, results and analysis of the infiltration capacity. INFILTRATION TESTING
Infiltration testing was performed at nine infiltration trenches within the Sheep Creek alluvial aquifer (Figure 1). Infiltration trenches were excavated on November 6, 2017 with each trench being constructed about 3 to 4 feet wide and having approximately 15 to 20 feet that is excavated to depth and approximately 7 to 10 feet escape ramps on one end of the trench. The trench dimensions were measured by surveying the total trench length and escape ramp length and manual measurements of the trench depth using the excavator. The unsaturated volumes in each trench are summarized in Table 1. The trenches were logged during excavation by a geologist and the trench lithologies are summarized in Table 2.
Hydrometrics, Inc.consulting scientists and engineers
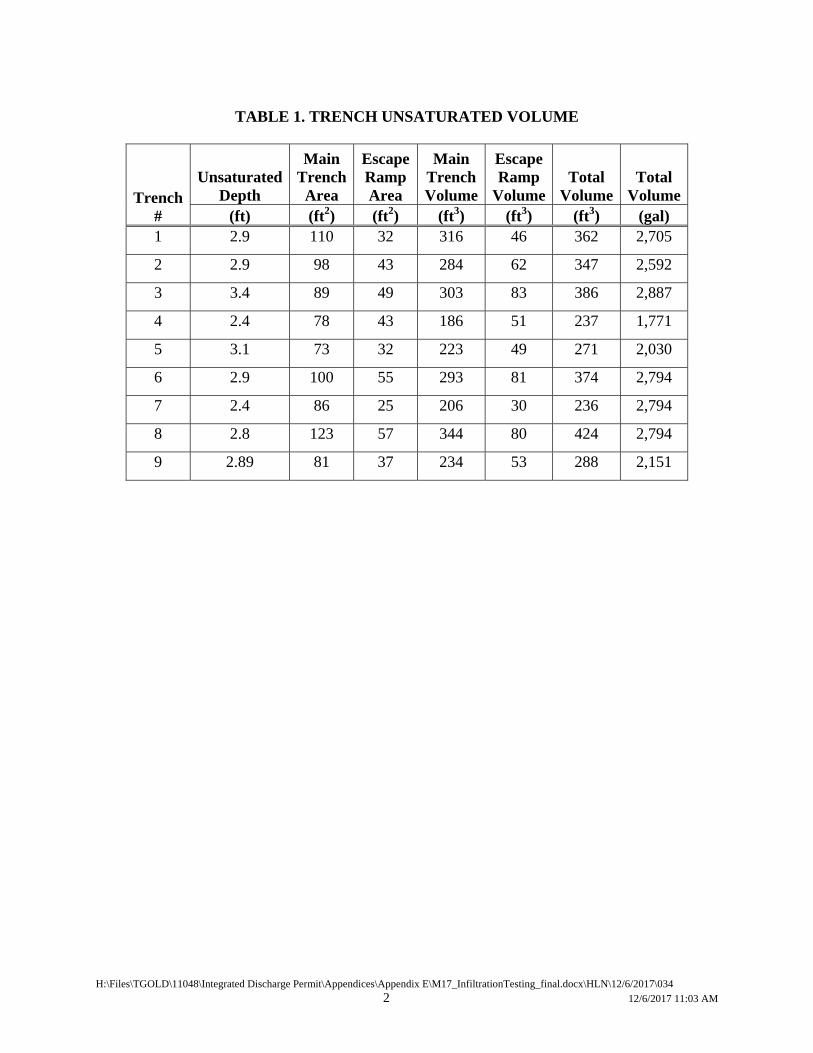
H:\Files\TGOLD\11048\Integrated Discharge Permit\Appendices\Appendix E\M17_InfiltrationTesting_final.docx\HLN\12/6/2017\034
2 12/6/2017 11:03 AM
TABLE 1. TRENCH UNSATURATED VOLUME
Trench #
Unsaturated Depth
Main Trench Area
Escape Ramp Area
Main Trench Volume
Escape Ramp
VolumeTotal
Volume Total
Volume(ft) (ft2) (ft2) (ft3) (ft3) (ft3) (gal)
1 2.9 110 32 316 46 362 2,705
2 2.9 98 43 284 62 347 2,592
3 3.4 89 49 303 83 386 2,887
4 2.4 78 43 186 51 237 1,771
5 3.1 73 32 223 49 271 2,030
6 2.9 100 55 293 81 374 2,794
7 2.4 86 25 206 30 236 2,794
8 2.8 123 57 344 80 424 2,794
9 2.89 81 37 234 53 288 2,151
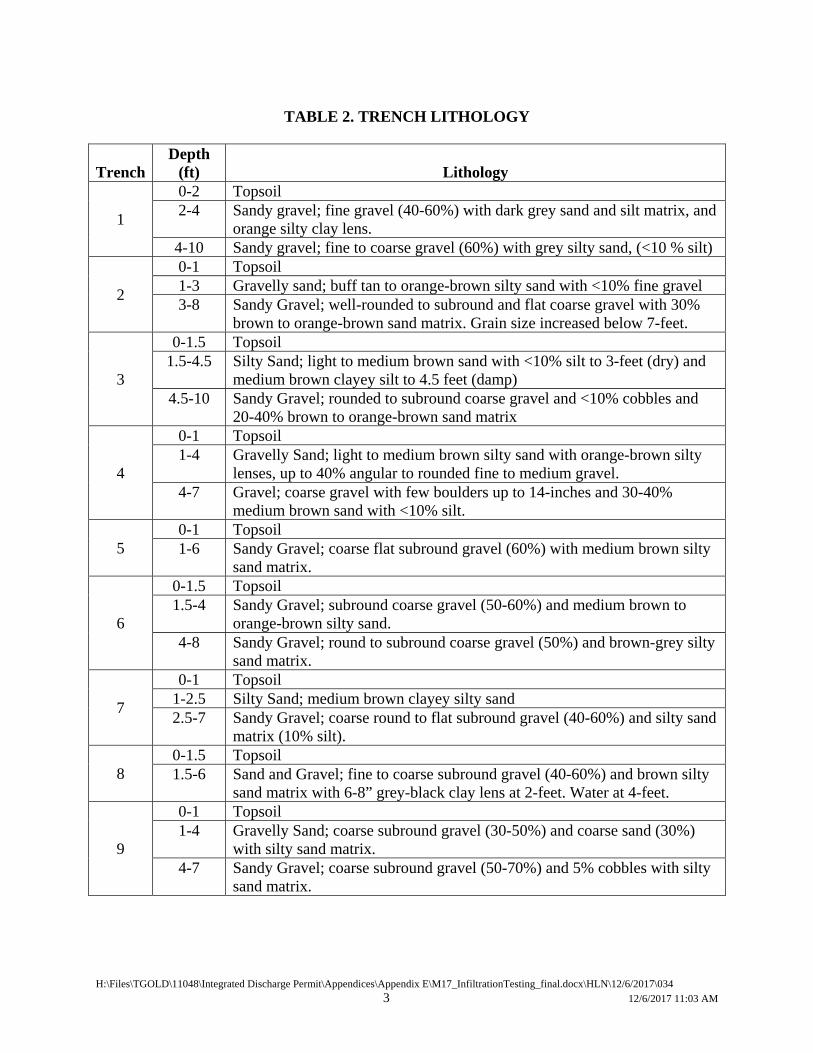
H:\Files\TGOLD\11048\Integrated Discharge Permit\Appendices\Appendix E\M17_InfiltrationTesting_final.docx\HLN\12/6/2017\034
3 12/6/2017 11:03 AM
TABLE 2. TRENCH LITHOLOGY
Trench Depth
(ft) Lithology
1
0-2 Topsoil 2-4 Sandy gravel; fine gravel (40-60%) with dark grey sand and silt matrix, and
orange silty clay lens. 4-10 Sandy gravel; fine to coarse gravel (60%) with grey silty sand, (<10 % silt)
2
0-1 Topsoil 1-3 Gravelly sand; buff tan to orange-brown silty sand with <10% fine gravel 3-8 Sandy Gravel; well-rounded to subround and flat coarse gravel with 30%
brown to orange-brown sand matrix. Grain size increased below 7-feet.
3
0-1.5 Topsoil 1.5-4.5 Silty Sand; light to medium brown sand with <10% silt to 3-feet (dry) and
medium brown clayey silt to 4.5 feet (damp) 4.5-10 Sandy Gravel; rounded to subround coarse gravel and <10% cobbles and
20-40% brown to orange-brown sand matrix
4
0-1 Topsoil 1-4 Gravelly Sand; light to medium brown silty sand with orange-brown silty
lenses, up to 40% angular to rounded fine to medium gravel. 4-7 Gravel; coarse gravel with few boulders up to 14-inches and 30-40%
medium brown sand with <10% silt.
5 0-1 Topsoil 1-6 Sandy Gravel; coarse flat subround gravel (60%) with medium brown silty
sand matrix.
6
0-1.5 Topsoil 1.5-4 Sandy Gravel; subround coarse gravel (50-60%) and medium brown to
orange-brown silty sand. 4-8 Sandy Gravel; round to subround coarse gravel (50%) and brown-grey silty
sand matrix.
7
0-1 Topsoil 1-2.5 Silty Sand; medium brown clayey silty sand 2.5-7 Sandy Gravel; coarse round to flat subround gravel (40-60%) and silty sand
matrix (10% silt).
8 0-1.5 Topsoil 1.5-6 Sand and Gravel; fine to coarse subround gravel (40-60%) and brown silty
sand matrix with 6-8” grey-black clay lens at 2-feet. Water at 4-feet.
9
0-1 Topsoil 1-4 Gravelly Sand; coarse subround gravel (30-50%) and coarse sand (30%)
with silty sand matrix. 4-7 Sandy Gravel; coarse subround gravel (50-70%) and 5% cobbles with silty
sand matrix.
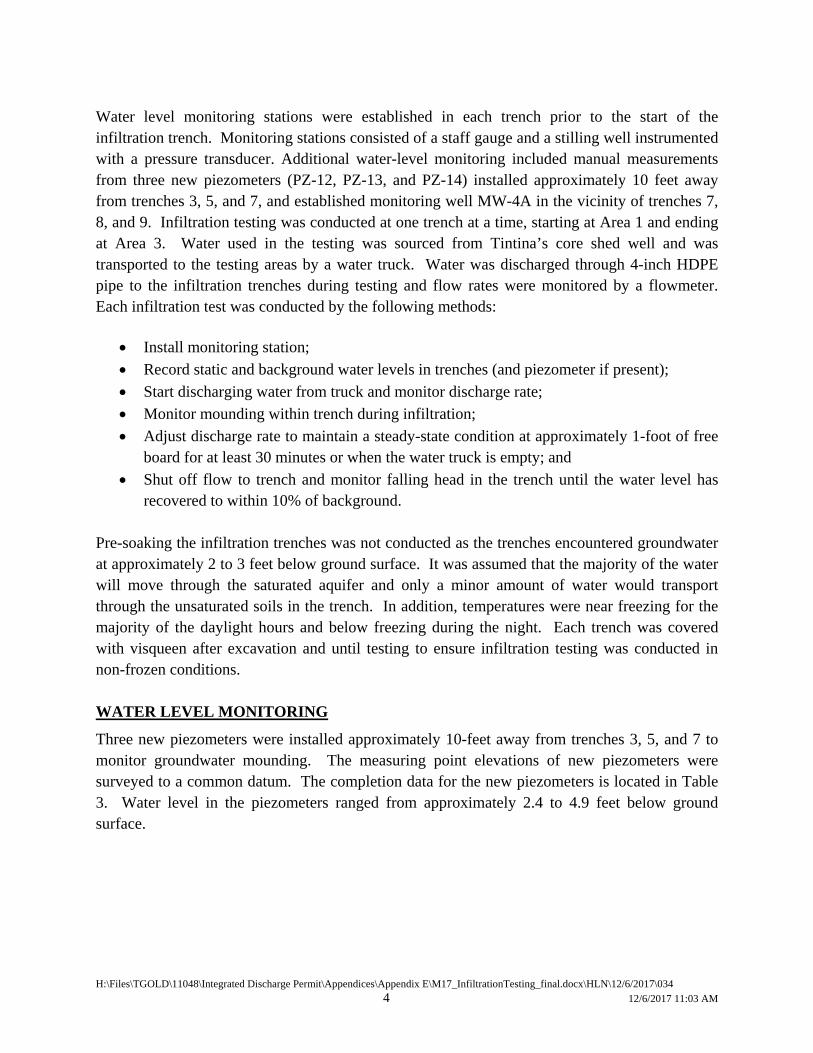
H:\Files\TGOLD\11048\Integrated Discharge Permit\Appendices\Appendix E\M17_InfiltrationTesting_final.docx\HLN\12/6/2017\034
4 12/6/2017 11:03 AM
Water level monitoring stations were established in each trench prior to the start of the infiltration trench. Monitoring stations consisted of a staff gauge and a stilling well instrumented with a pressure transducer. Additional water-level monitoring included manual measurements from three new piezometers (PZ-12, PZ-13, and PZ-14) installed approximately 10 feet away from trenches 3, 5, and 7, and established monitoring well MW-4A in the vicinity of trenches 7, 8, and 9. Infiltration testing was conducted at one trench at a time, starting at Area 1 and ending at Area 3. Water used in the testing was sourced from Tintina’s core shed well and was transported to the testing areas by a water truck. Water was discharged through 4-inch HDPE pipe to the infiltration trenches during testing and flow rates were monitored by a flowmeter. Each infiltration test was conducted by the following methods:
Install monitoring station;
Record static and background water levels in trenches (and piezometer if present);
Start discharging water from truck and monitor discharge rate;
Monitor mounding within trench during infiltration;
Adjust discharge rate to maintain a steady-state condition at approximately 1-foot of free board for at least 30 minutes or when the water truck is empty; and
Shut off flow to trench and monitor falling head in the trench until the water level has recovered to within 10% of background.
Pre-soaking the infiltration trenches was not conducted as the trenches encountered groundwater at approximately 2 to 3 feet below ground surface. It was assumed that the majority of the water will move through the saturated aquifer and only a minor amount of water would transport through the unsaturated soils in the trench. In addition, temperatures were near freezing for the majority of the daylight hours and below freezing during the night. Each trench was covered with visqueen after excavation and until testing to ensure infiltration testing was conducted in non-frozen conditions. WATER LEVEL MONITORING
Three new piezometers were installed approximately 10-feet away from trenches 3, 5, and 7 to monitor groundwater mounding. The measuring point elevations of new piezometers were surveyed to a common datum. The completion data for the new piezometers is located in Table 3. Water level in the piezometers ranged from approximately 2.4 to 4.9 feet below ground surface.
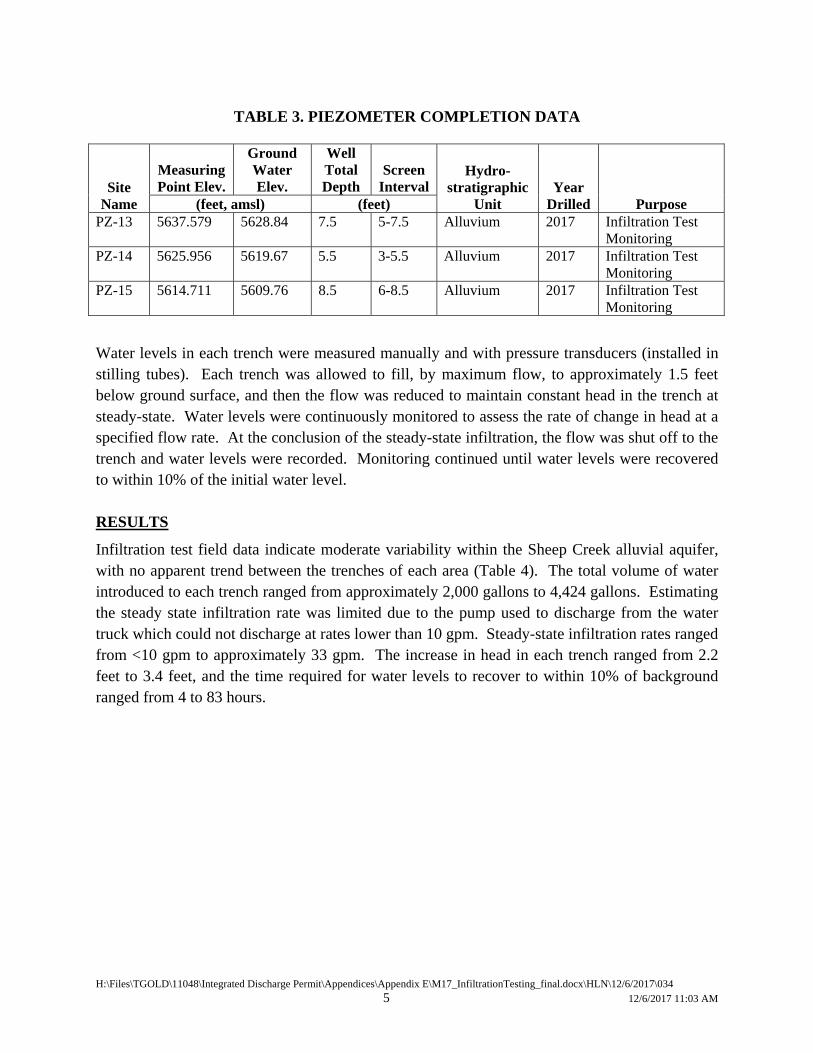
H:\Files\TGOLD\11048\Integrated Discharge Permit\Appendices\Appendix E\M17_InfiltrationTesting_final.docx\HLN\12/6/2017\034
5 12/6/2017 11:03 AM
TABLE 3. PIEZOMETER COMPLETION DATA
Site Name
Measuring Point Elev.
GroundWater Elev.
Well Total Depth
Screen Interval
Hydro-stratigraphic
Unit Year
Drilled Purpose (feet, amsl) (feet) PZ-13 5637.579 5628.84 7.5 5-7.5
Alluvium 2017 Infiltration Test
Monitoring PZ-14 5625.956 5619.67 5.5 3-5.5 Alluvium 2017 Infiltration Test
Monitoring PZ-15 5614.711 5609.76 8.5
6-8.5 Alluvium 2017 Infiltration Test
Monitoring
Water levels in each trench were measured manually and with pressure transducers (installed in stilling tubes). Each trench was allowed to fill, by maximum flow, to approximately 1.5 feet below ground surface, and then the flow was reduced to maintain constant head in the trench at steady-state. Water levels were continuously monitored to assess the rate of change in head at a specified flow rate. At the conclusion of the steady-state infiltration, the flow was shut off to the trench and water levels were recorded. Monitoring continued until water levels were recovered to within 10% of the initial water level. RESULTS
Infiltration test field data indicate moderate variability within the Sheep Creek alluvial aquifer, with no apparent trend between the trenches of each area (Table 4). The total volume of water introduced to each trench ranged from approximately 2,000 gallons to 4,424 gallons. Estimating the steady state infiltration rate was limited due to the pump used to discharge from the water truck which could not discharge at rates lower than 10 gpm. Steady-state infiltration rates ranged from <10 gpm to approximately 33 gpm. The increase in head in each trench ranged from 2.2 feet to 3.4 feet, and the time required for water levels to recover to within 10% of background ranged from 4 to 83 hours.
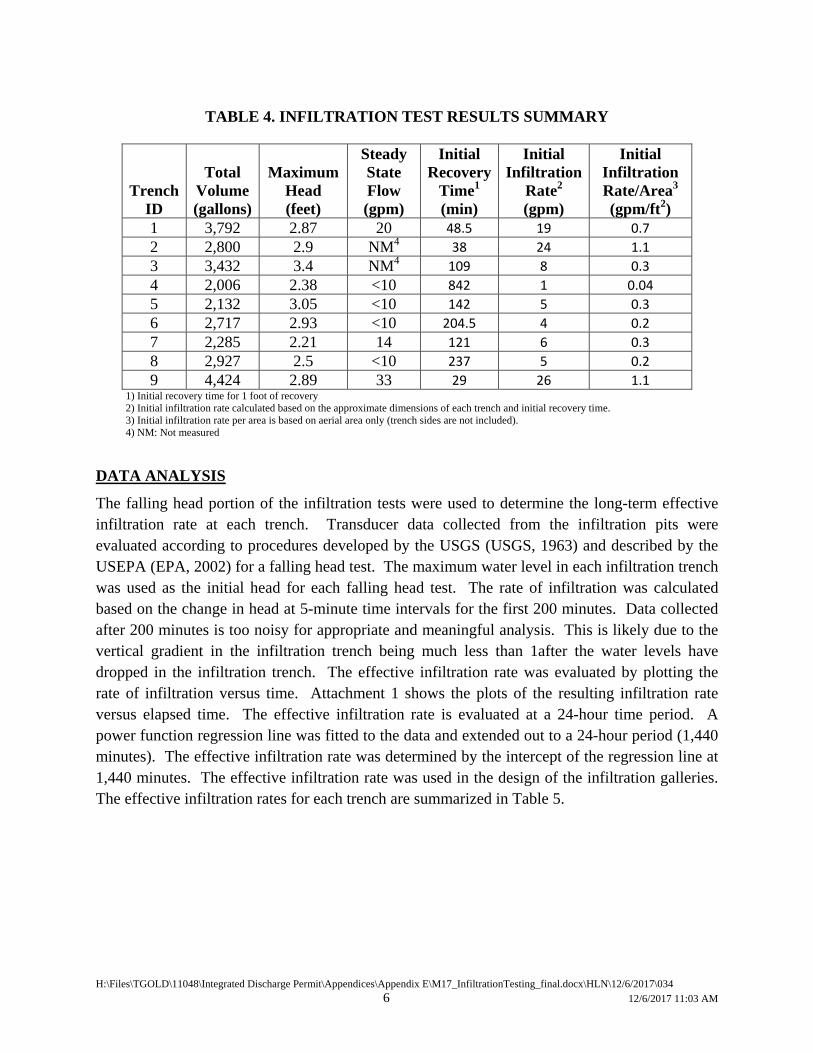
H:\Files\TGOLD\11048\Integrated Discharge Permit\Appendices\Appendix E\M17_InfiltrationTesting_final.docx\HLN\12/6/2017\034
6 12/6/2017 11:03 AM
TABLE 4. INFILTRATION TEST RESULTS SUMMARY
Trench ID
Total Volume (gallons)
Maximum Head (feet)
Steady State Flow (gpm)
Initial Recovery
Time1 (min)
Initial Infiltration
Rate2 (gpm)
Initial Infiltration Rate/Area3 (gpm/ft2)
1 3,792 2.87 20 48.5 19 0.7 2 2,800 2.9 NM4 38 24 1.1 3 3,432 3.4 NM4 109 8 0.3 4 2,006 2.38 <10 842 1 0.04 5 2,132 3.05 <10 142 5 0.3 6 2,717 2.93 <10 204.5 4 0.2 7 2,285 2.21 14 121 6 0.3 8 2,927 2.5 <10 237 5 0.2 9 4,424 2.89 33 29 26 1.1
1) Initial recovery time for 1 foot of recovery 2) Initial infiltration rate calculated based on the approximate dimensions of each trench and initial recovery time. 3) Initial infiltration rate per area is based on aerial area only (trench sides are not included). 4) NM: Not measured
DATA ANALYSIS
The falling head portion of the infiltration tests were used to determine the long-term effective infiltration rate at each trench. Transducer data collected from the infiltration pits were evaluated according to procedures developed by the USGS (USGS, 1963) and described by the USEPA (EPA, 2002) for a falling head test. The maximum water level in each infiltration trench was used as the initial head for each falling head test. The rate of infiltration was calculated based on the change in head at 5-minute time intervals for the first 200 minutes. Data collected after 200 minutes is too noisy for appropriate and meaningful analysis. This is likely due to the vertical gradient in the infiltration trench being much less than 1after the water levels have dropped in the infiltration trench. The effective infiltration rate was evaluated by plotting the rate of infiltration versus time. Attachment 1 shows the plots of the resulting infiltration rate versus elapsed time. The effective infiltration rate is evaluated at a 24-hour time period. A power function regression line was fitted to the data and extended out to a 24-hour period (1,440 minutes). The effective infiltration rate was determined by the intercept of the regression line at 1,440 minutes. The effective infiltration rate was used in the design of the infiltration galleries. The effective infiltration rates for each trench are summarized in Table 5.
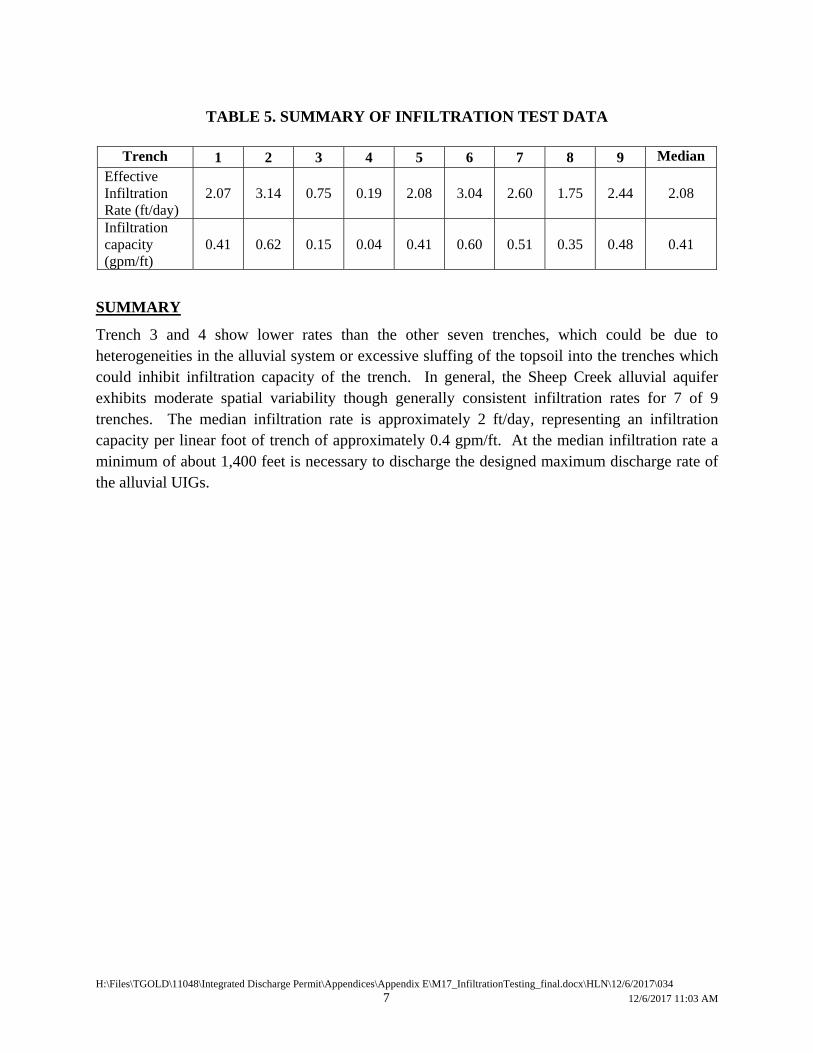
H:\Files\TGOLD\11048\Integrated Discharge Permit\Appendices\Appendix E\M17_InfiltrationTesting_final.docx\HLN\12/6/2017\034
7 12/6/2017 11:03 AM
TABLE 5. SUMMARY OF INFILTRATION TEST DATA
Trench 1 2 3 4 5 6 7 8 9 Median
Effective Infiltration Rate (ft/day)
2.07 3.14 0.75 0.19 2.08 3.04 2.60 1.75 2.44 2.08
Infiltration capacity (gpm/ft)
0.41 0.62 0.15 0.04 0.41 0.60 0.51 0.35 0.48 0.41
SUMMARY
Trench 3 and 4 show lower rates than the other seven trenches, which could be due to heterogeneities in the alluvial system or excessive sluffing of the topsoil into the trenches which could inhibit infiltration capacity of the trench. In general, the Sheep Creek alluvial aquifer exhibits moderate spatial variability though generally consistent infiltration rates for 7 of 9 trenches. The median infiltration rate is approximately 2 ft/day, representing an infiltration capacity per linear foot of trench of approximately 0.4 gpm/ft. At the median infiltration rate a minimum of about 1,400 feet is necessary to discharge the designed maximum discharge rate of the alluvial UIGs.
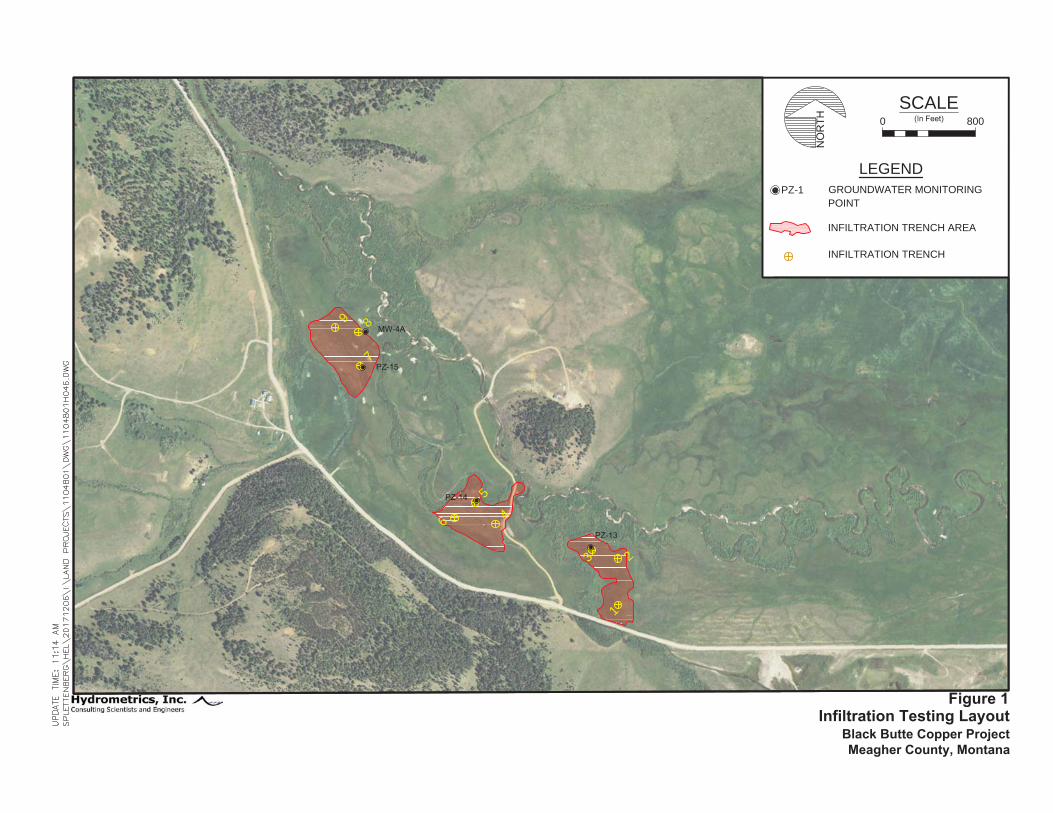
89
7
5
6 4
3 21
LEGENDGROUNDWATER MONITORINGPOINT
INFILTRATION TRENCH AREA
INFILTRATION TRENCH
Infiltration Testing LayoutBlack Butte Copper ProjectMeagher County, Montana
Figure 1
PZ-1
SCALE0 800
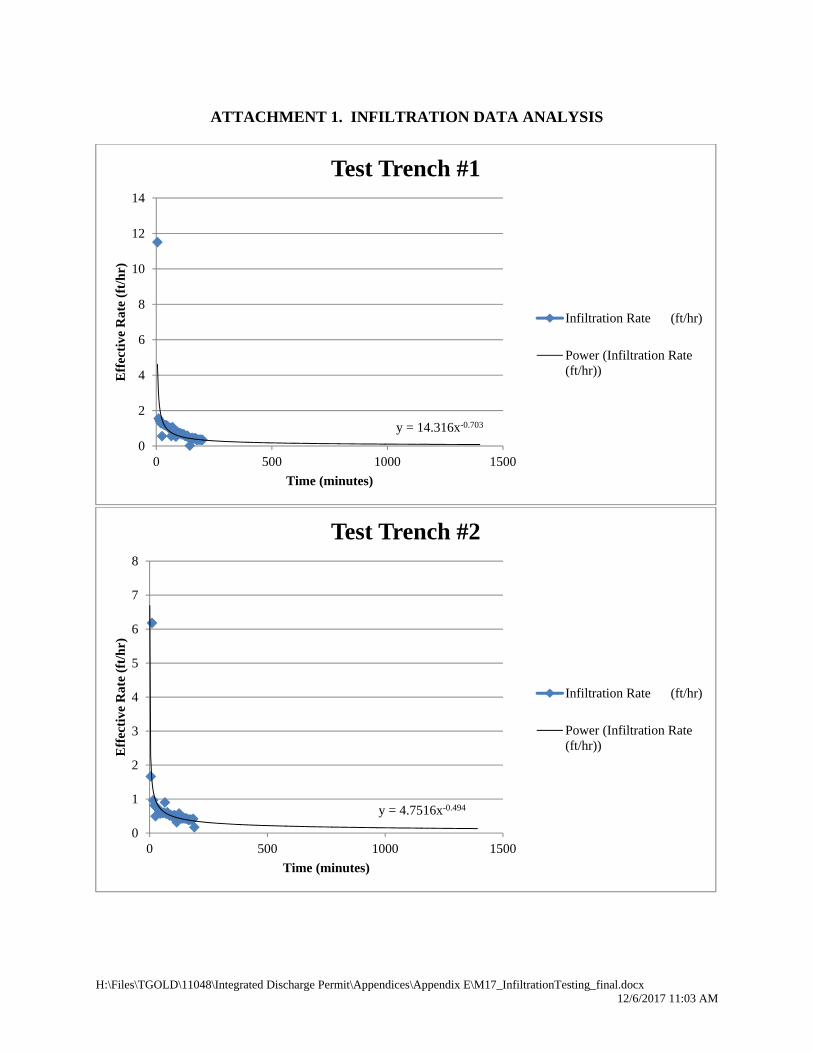
H:\Files\TGOLD\11048\Integrated Discharge Permit\Appendices\Appendix E\M17_InfiltrationTesting_final.docx 12/6/2017 11:03 AM
ATTACHMENT 1. INFILTRATION DATA ANALYSIS
y = 14.316x-0.703
0
2
4
6
8
10
12
14
0 500 1000 1500
Eff
ecti
ve R
ate
(ft/
hr)
Time (minutes)
Test Trench #1
Infiltration Rate (ft/hr)
Power (Infiltration Rate(ft/hr))
y = 4.7516x-0.494
0
1
2
3
4
5
6
7
8
0 500 1000 1500
Eff
ecti
ve R
ate
(ft/
hr)
Time (minutes)
Test Trench #2
Infiltration Rate (ft/hr)
Power (Infiltration Rate(ft/hr))
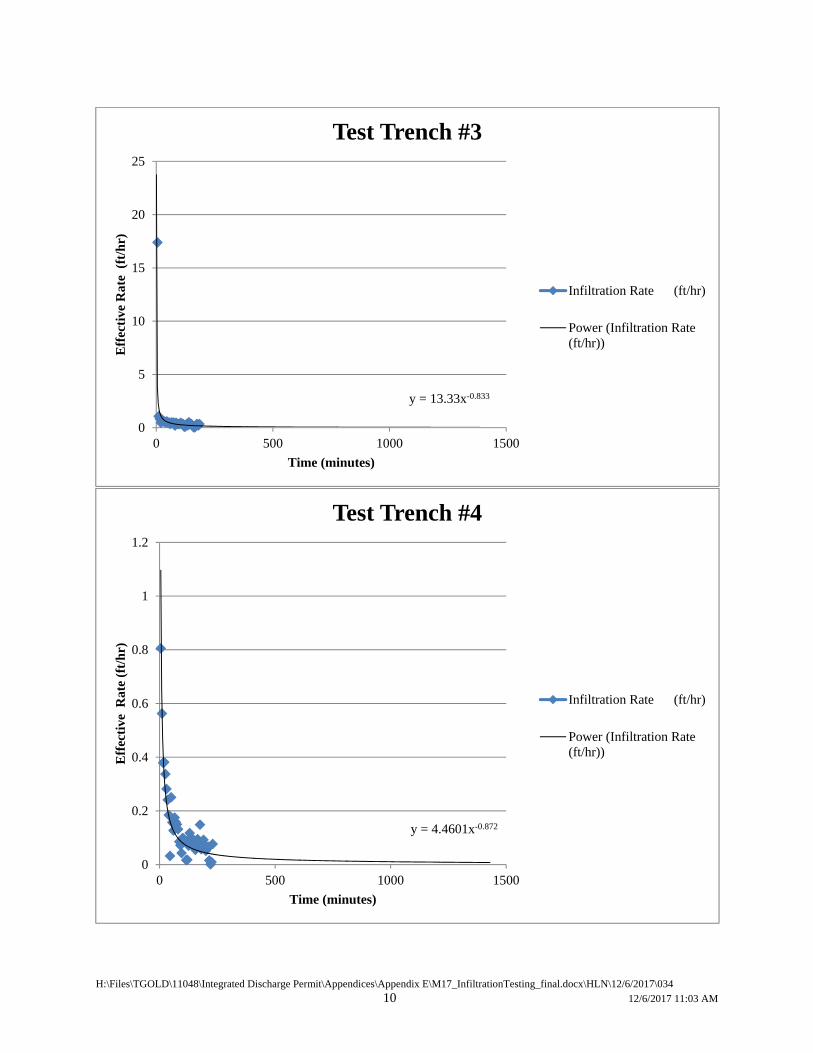
H:\Files\TGOLD\11048\Integrated Discharge Permit\Appendices\Appendix E\M17_InfiltrationTesting_final.docx\HLN\12/6/2017\034
10 12/6/2017 11:03 AM
y = 13.33x-0.833
0
5
10
15
20
25
0 500 1000 1500
Eff
ecti
ve R
ate
(ft
/hr)
Time (minutes)
Test Trench #3
Infiltration Rate (ft/hr)
Power (Infiltration Rate(ft/hr))
y = 4.4601x-0.872
0
0.2
0.4
0.6
0.8
1
1.2
0 500 1000 1500
Eff
ecti
ve R
ate
(ft/
hr)
Time (minutes)
Test Trench #4
Infiltration Rate (ft/hr)
Power (Infiltration Rate(ft/hr))
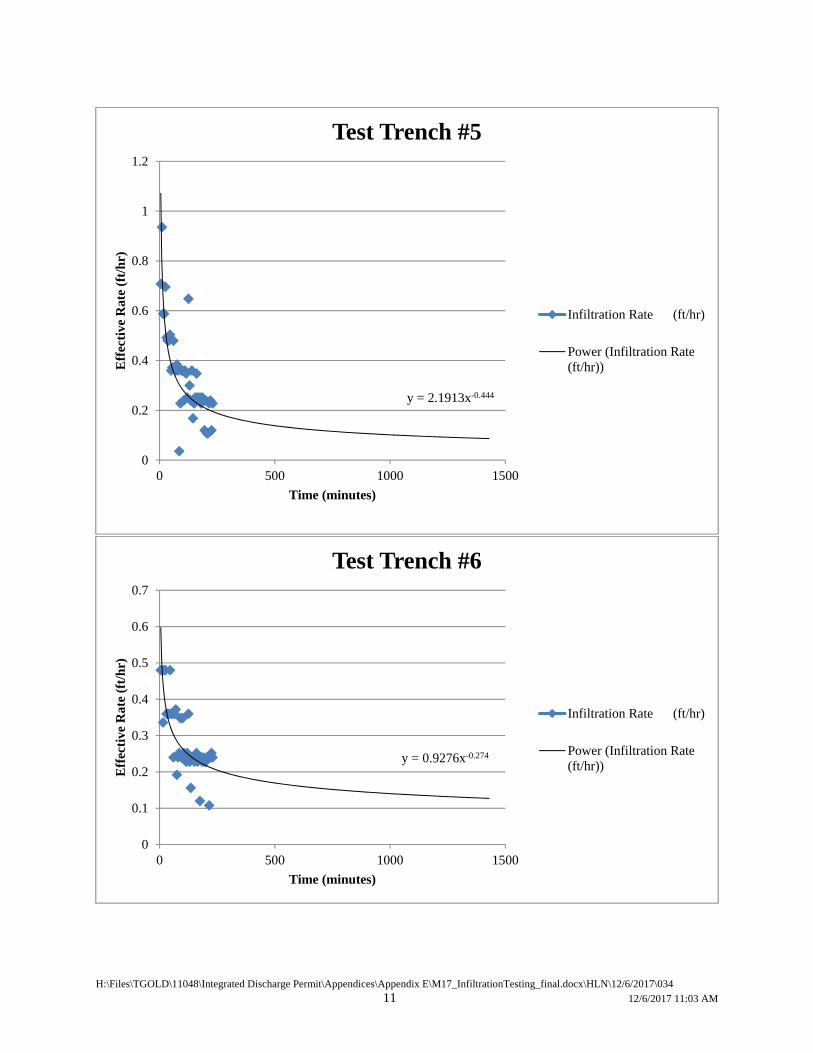
H:\Files\TGOLD\11048\Integrated Discharge Permit\Appendices\Appendix E\M17_InfiltrationTesting_final.docx\HLN\12/6/2017\034
11 12/6/2017 11:03 AM
y = 2.1913x-0.444
0
0.2
0.4
0.6
0.8
1
1.2
0 500 1000 1500
Eff
ecti
ve R
ate
(ft/
hr)
Time (minutes)
Test Trench #5
Infiltration Rate (ft/hr)
Power (Infiltration Rate(ft/hr))
y = 0.9276x-0.274
0
0.1
0.2
0.3
0.4
0.5
0.6
0.7
0 500 1000 1500
Eff
ecti
ve R
ate
(ft/
hr)
Time (minutes)
Test Trench #6
Infiltration Rate (ft/hr)
Power (Infiltration Rate(ft/hr))
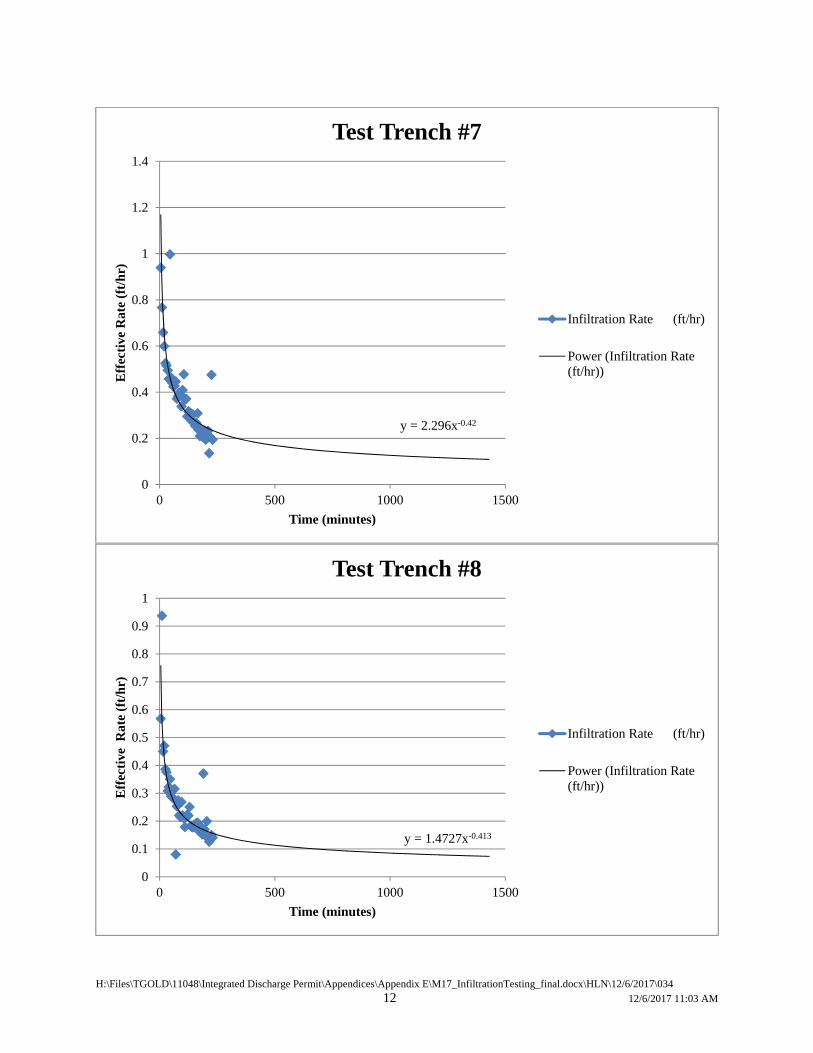
H:\Files\TGOLD\11048\Integrated Discharge Permit\Appendices\Appendix E\M17_InfiltrationTesting_final.docx\HLN\12/6/2017\034
12 12/6/2017 11:03 AM
y = 2.296x-0.42
0
0.2
0.4
0.6
0.8
1
1.2
1.4
0 500 1000 1500
Eff
ecti
ve R
ate
(ft/
hr)
Time (minutes)
Test Trench #7
Infiltration Rate (ft/hr)
Power (Infiltration Rate(ft/hr))
y = 1.4727x-0.413
0
0.1
0.2
0.3
0.4
0.5
0.6
0.7
0.8
0.9
1
0 500 1000 1500
Eff
ecti
ve R
ate
(ft/
hr)
Time (minutes)
Test Trench #8
Infiltration Rate (ft/hr)
Power (Infiltration Rate(ft/hr))
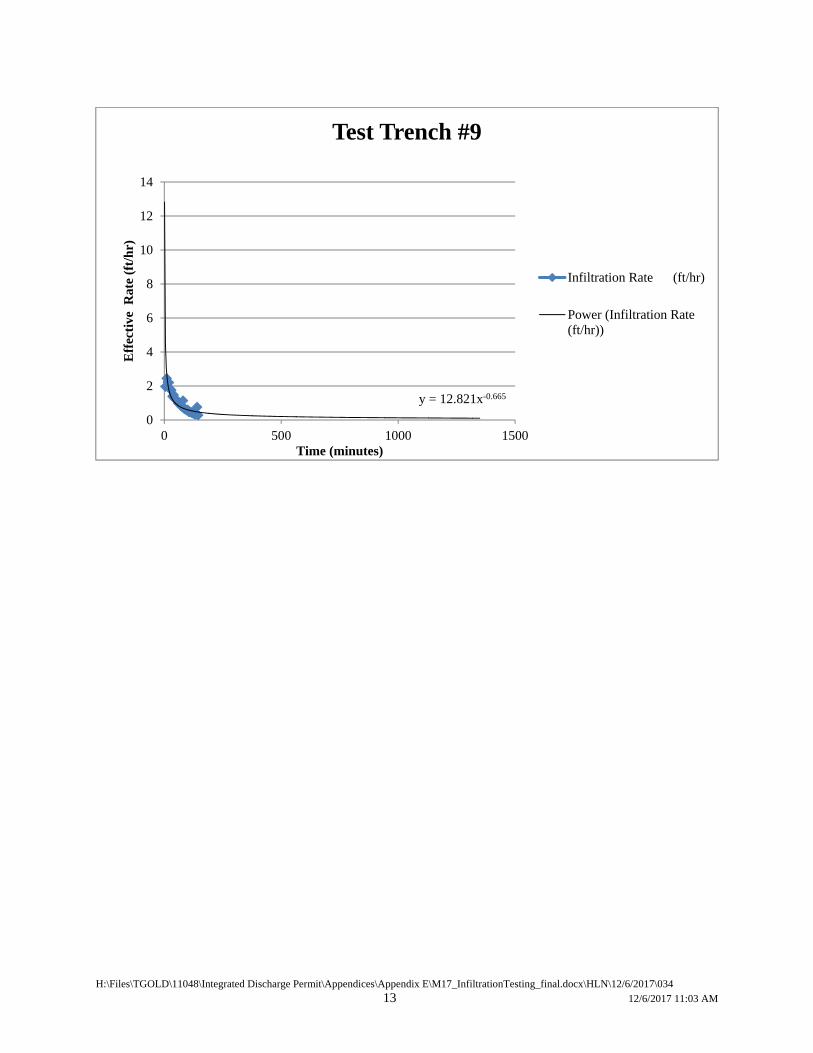
H:\Files\TGOLD\11048\Integrated Discharge Permit\Appendices\Appendix E\M17_InfiltrationTesting_final.docx\HLN\12/6/2017\034
13 12/6/2017 11:03 AM
y = 12.821x-0.665
0
2
4
6
8
10
12
14
0 500 1000 1500
Eff
ecti
ve R
ate
(ft/
hr)
Time (minutes)
Test Trench #9
Infiltration Rate (ft/hr)
Power (Infiltration Rate(ft/hr))

H:\Files\TGOLD\11048\Integrated Discharge Permit\Appendices\Appendix E\M17_InfiltrationTesting_final.docx\HLN\12/6/2017\034
14 12/6/2017 11:03 AM
REFERENCES United States Geological Survey, (USGS), 1963. A Field Method for Measurement of
Infiltration; Geological Survey Water-Supply Paper 1544-F. Environmental Protection Agency (EPA), 2002. Falling Head Percolation Test Procedure.
Design Manual; Onsite Wastewater Treatment and Disposal Systems, EPA/625/1-80-012, pg. 41.
H:\Files\TGOLD\11048\Integrated Discharge Permit\R17 Permit Application Narrative.Docx\\12/11/17\065 12/11/17\7:28 AM
APPENDIX F
NUMERIC GROUNDWATER MODEL REPORT
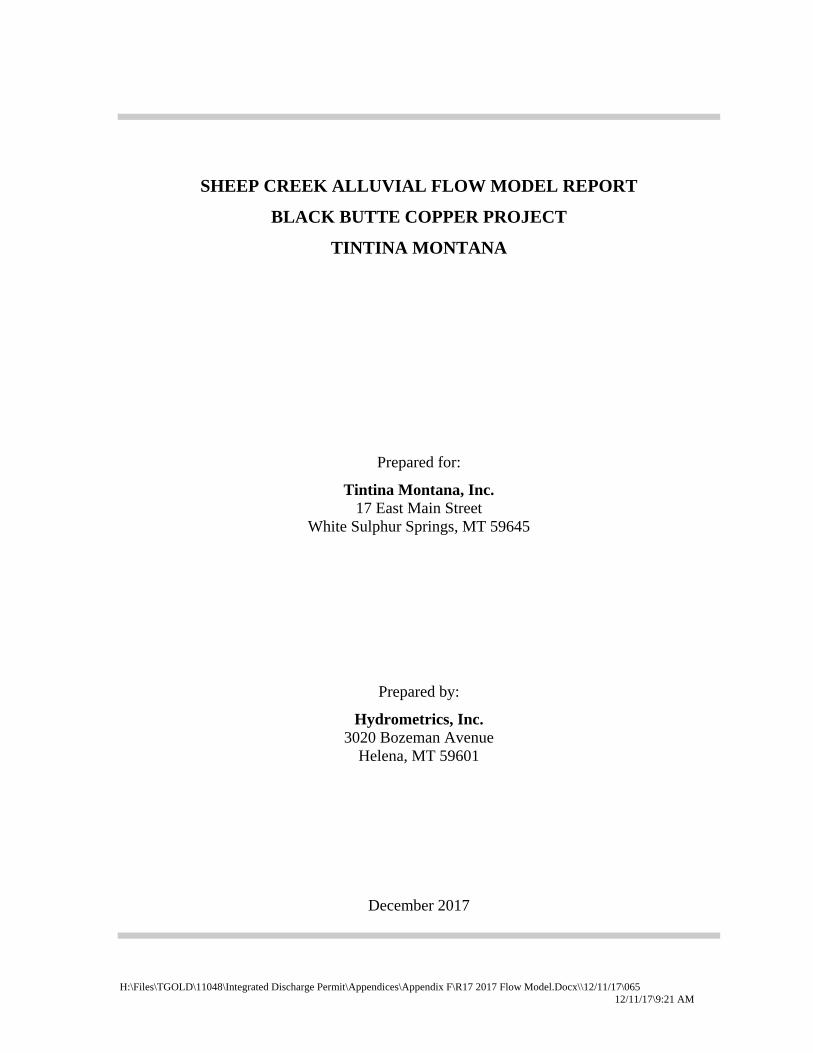
H:\Files\TGOLD\11048\Integrated Discharge Permit\Appendices\Appendix F\R17 2017 Flow Model.Docx\\12/11/17\065 12/11/17\9:21 AM
SHEEP CREEK ALLUVIAL FLOW MODEL REPORT
BLACK BUTTE COPPER PROJECT
TINTINA MONTANA
Prepared for:
Tintina Montana, Inc. 17 East Main Street
White Sulphur Springs, MT 59645
Prepared by:
Hydrometrics, Inc. 3020 Bozeman Avenue
Helena, MT 59601
December 2017
H:\Files\TGOLD\11048\Integrated Discharge Permit\Appendices\Appendix F\R17 2017 Flow Model.Docx\\12/11/17\065
ii 12/11/2017\9:21 AM
TABLE OF CONTENTS
LIST OF TABLES ...........................................................................................................iii
LIST OF FIGURES .........................................................................................................iii
1.0 INTRODUCTION .....................................................................................................1-1
1.1 PREVIOUS MODELING ..............................................................................1-1
1.2 MODEL SELECTION AND APPROACH ...................................................1-2
2.0 CONCEPTUAL MODEL ..........................................................................................2-1
2.1 REGIONAL SETTING .................................................................................2-1
2.2 HYDROGEOLOGIC SETTING ...................................................................2-1
2.3 GROUNDWATER FLOW CONDITIONS ..................................................2-3
2.4 GROUNDWATER RECHARGE ..................................................................2-5
2.5 GROUNDWATER FLUX .............................................................................2-5
3.0 MODEL DESIGN ......................................................................................................3-1
3.1 MODEL DOMAIN ........................................................................................3-1
3.2 BOUNDARY CONDITIONS .......................................................................3-1
3.3 FLOW MODEL INPUT VARIABLES .........................................................3-5
4.0 MODEL CALIBRATION .........................................................................................4-1
4.1 FLOW CALIBRATION ................................................................................4-1
5.0 ALLUVIAL UNDERGROUND INFILTRATION GALLERY ANALYSIS ..........5-1
5.1 MOUNDING SIMULATION .......................................................................5-1
5.2 PROJECTED OPERATIONAL POTENTIOMETRIC .................................5-1
6.0 SENSITIVITY ...........................................................................................................6-1
7.0 DISCUSSION ............................................................................................................7-1
8.0 REFERENCES ..........................................................................................................8-1
H:\Files\TGOLD\11048\Integrated Discharge Permit\Appendices\Appendix F\R17 2017 Flow Model.Docx\\12/11/17\065
iii 12/11/2017\9:21 AM
LIST OF TABLES
TABLE 2-1. GROUNDWATER FLUX CALCULATIONS ....................................2-7
TABLE 3-1. SUMMARY OF HYDROLOGIC PROPERTIES ................................3-8
TABLE 4-1. SIMULATED VERSUS OBSERVED GROUNDWATER-
SURFACE WATER INTERACTION ..................................................4-6
LIST OF FIGURES
FIGURE 2-1. CONCEPTUAL MODEL AREA .........................................................2-2
FIGURE 2-2. NOVEMBER 2017 POTENTIOMETRIC SURFACE .........................2-4
FIGURE 2-3. ALLUVIAL UNDERGROUND INFILTRATION GALLERY ..........2-6
FIGURE 3-1. MODEL LAYOUT AND BOUNDARY CONDITIONS ....................3-2
FIGURE 3-2. SIMULATED INFILTRATION GALLERIES ....................................3-6
FIGURE 4-1. CALIBRATED POTENTIOMETRIC SURFACE AND
RESIDUALS .........................................................................................4-3
FIGURE 4-2. OBSERVED VERSUS SIMULATED HEADS ...................................4-4
FIGURE 5-1. SIMULATED MOUNDING .................................................................5-2
FIGURE 5-2. PROJECTED OPERATIONAL ALLUVIAL POTENTIOMETRIC
SURFACE .............................................................................................5-3
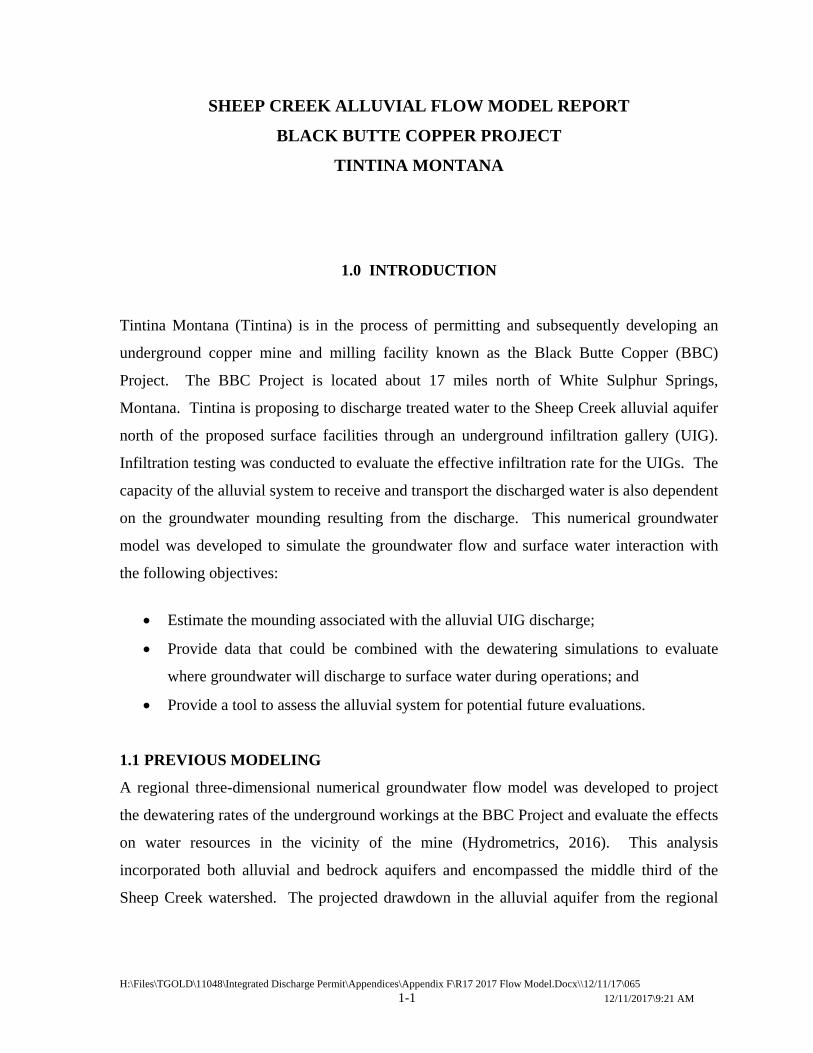
H:\Files\TGOLD\11048\Integrated Discharge Permit\Appendices\Appendix F\R17 2017 Flow Model.Docx\\12/11/17\065
1-1 12/11/2017\9:21 AM
SHEEP CREEK ALLUVIAL FLOW MODEL REPORT
BLACK BUTTE COPPER PROJECT
TINTINA MONTANA
1.0 INTRODUCTION
Tintina Montana (Tintina) is in the process of permitting and subsequently developing an
underground copper mine and milling facility known as the Black Butte Copper (BBC)
Project. The BBC Project is located about 17 miles north of White Sulphur Springs,
Montana. Tintina is proposing to discharge treated water to the Sheep Creek alluvial aquifer
north of the proposed surface facilities through an underground infiltration gallery (UIG).
Infiltration testing was conducted to evaluate the effective infiltration rate for the UIGs. The
capacity of the alluvial system to receive and transport the discharged water is also dependent
on the groundwater mounding resulting from the discharge. This numerical groundwater
model was developed to simulate the groundwater flow and surface water interaction with
the following objectives:
Estimate the mounding associated with the alluvial UIG discharge;
Provide data that could be combined with the dewatering simulations to evaluate
where groundwater will discharge to surface water during operations; and
Provide a tool to assess the alluvial system for potential future evaluations.
1.1 PREVIOUS MODELING
A regional three-dimensional numerical groundwater flow model was developed to project
the dewatering rates of the underground workings at the BBC Project and evaluate the effects
on water resources in the vicinity of the mine (Hydrometrics, 2016). This analysis
incorporated both alluvial and bedrock aquifers and encompassed the middle third of the
Sheep Creek watershed. The projected drawdown in the alluvial aquifer from the regional
H:\Files\TGOLD\11048\Integrated Discharge Permit\Appendices\Appendix F\R17 2017 Flow Model.Docx\\12/11/17\065
1-2 12/11/2017\9:21 AM
model provides data that can be used in conjunction with these modeling results to evaluate
the groundwater flow within the alluvial system during operations.
1.2 MODEL SELECTION AND APPROACH
MODFLOW 2005 (Harbaugh, 2005) was selected to simulate groundwater flow as it
provides an accurate and efficient solution for alluvial systems. The groundwater flow model
was created using the graphical user interface software GMS (Ver. 10.2.3; Aquaveo, 2017) to
facilitate model development and data processing. This model was selected because of its
capability to simulate groundwater flow in heterogeneous aquifers and groundwater-surface
water interaction.
H:\Files\TGOLD\11048\Integrated Discharge Permit\Appendices\Appendix F\R17 2017 Flow Model.Docx\\12/11/17\065
2-1 12/11/2017\9:21 AM
2.0 CONCEPTUAL MODEL
2.1 REGIONAL SETTING
The regional setting of the BBC Project is well documented in the Groundwater Modeling
Assessment Report of the regional groundwater model (Hydrometrics, 2016). A brief
discussion of the regional setting is included in this report to provide a general understanding
of the area.
In the vicinity of the project, Sheep Creek flows from east to west and then shifts to the
northwest adjacent to the project area. The project area lies on the southern side of Sheep
Creek and is located 17.7 river miles from the head of the drainage and about 18 miles from
the confluence with the Smith River (see Figure 2-1 of the regional model report). Numerous
tributaries provide additional flow to Sheep Creek along its entire length. There are two
tributaries (Little Sheep Creek and Coon Creek) to Sheep Creek in the Project area. Little
Sheep Creek is located southeast of the project area. Coon Creek is located west of Sheep
Creek and flows along the western edge of the alluvial valley adjacent to the Project area.
Figure 2-1 shows the conceptual model area and surface water resources evaluated in the
alluvial conceptual model.
2.2 HYDROGEOLOGIC SETTING
The BBC Project will target the Johnny Lee ore body, which is within the lower Newland
Formation and lies between two northeast trending thrust faults, the Volcano Valley Fault
(VVF) to the north and the Black Butte Fault to the south. The mine working are located to
the east and more than 1,000 feet beneath the Sheep Creek Valley. The surface facilities for
the mine are located south of the Sheep Creek Valley. The Sheep Creek Valley consists of a
relatively thin package of alluvial sediments that consist of poorly sorted silty, sand and
gravels in the upper 5-10 feet of the alluvial deposits. Coarser sand, gravel and cobbles are
typically encountered below 10 feet to the base of the alluvial aquifer. The base of the
aquifer is estimated to be 20 to 25 feet below ground surface (bgs). The alluvial sediments
are pinched out by a narrow bedrock canyon north of the valley.
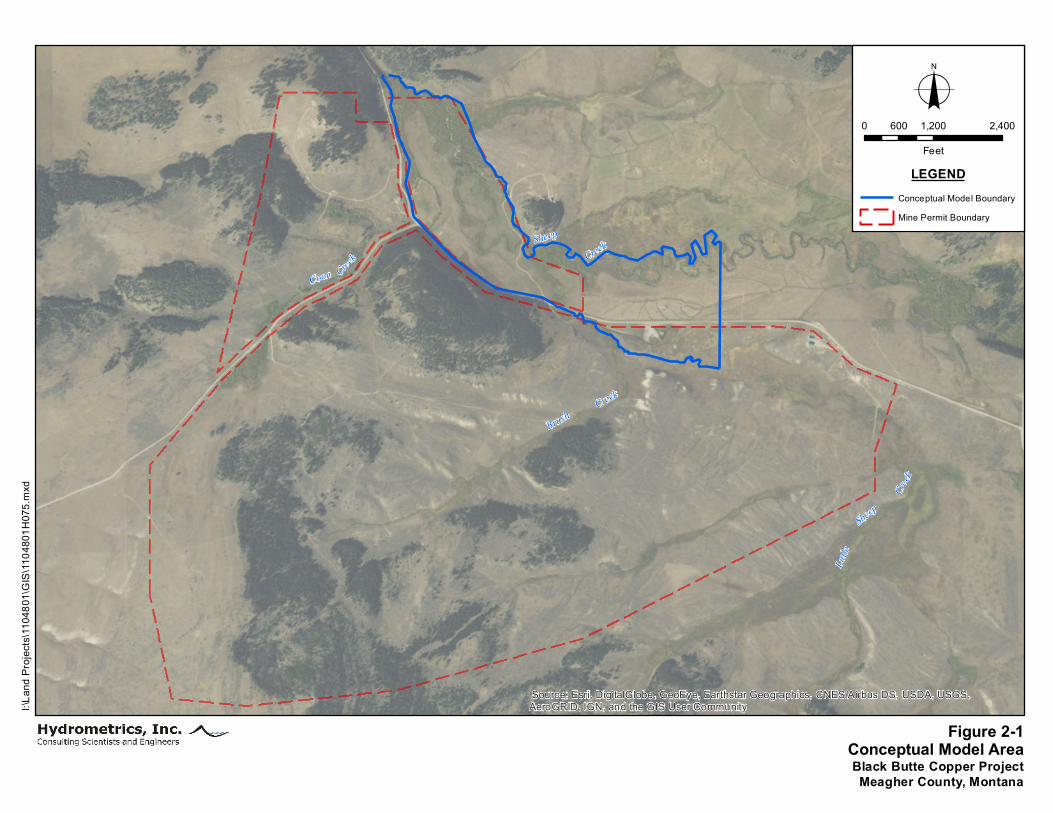
I:\Lan
d Proj
ects\
1104
801\G
IS\11
0480
1H07
5.mxd
Conceptual Model AreaBlack Butte Copper ProjectMeagher County, Montana
Figure 2-1
Source: Esri, DigitalGlobe, GeoEye, Earthstar Geographics, CNES/Airbus DS, USDA, USGS,AeroGRID, IGN, and the GIS User Community
LEGENDConceptual Model BoundaryMine Permit Boundary
o0 1,200 2,400600
Feet
Coon Creek
BrushCreek
SheepCreek
Sheep
Creek
Little
H:\Files\TGOLD\11048\Integrated Discharge Permit\Appendices\Appendix F\R17 2017 Flow Model.Docx\\12/11/17\065
2-3 12/11/2017\9:21 AM
2.3 GROUNDWATER FLOW CONDITIONS
Groundwater is present at about 2 to 3 feet bgs throughout most of the valley with shallower
depths to water as the valley is pinched out by the canyon. A detailed potentiometric map of
the alluvial groundwater system was developed based on water levels measurements from
November 7, 2017 and a survey of Sheep Creek and Coon Creek on November 8, 2017
(Figure 2-2). The potentiometric surface shows water generally flows parallel to Sheep
Creek throughout most of the aquifer and discharges to Sheep Creek as the valley is pinched
out to the north. The alluvial aquifer is recharged by Little Sheep Creek as it enters the
valley in the upgradient portion of the conceptual model area. Coon Creek typically enters
the alluvial valley after being diverted to the east of its natural channel.
The November 2017 potentiometric surface and the synoptic survey conducted in October
2012 indicate Coon Creek intercepts groundwater when it flows through the diverted
channel. The diverted channel is much lower in elevation than the original channel of Coon
Creek, which likely creates an artificial discharge point for the alluvial groundwater system.
If Coon Creek flows in its natural channel it would likely discharge water to the alluvial
groundwater system as the natural channel is about 10 feet higher in elevation than the
diverted channel.
One monitoring well (MW-4A) and 10 piezometers are completed in the alluvial aquifer
(Figure 2-2). Aquifer testing at well MW-4A indicates the alluvial material has a hydraulic
conductivity of about 200 ft/day in the lower portion of the aquifer. This is consistent with
the literature values for coarse sand aquifers (30 to 300 ft/day; Fetter 2001). It is likely that
there are vertical and horizontal heterogeneities throughout the alluvial aquifer. However,
the observed lithology from drilling MW-4A and trench excavations suggest the hydraulic
conductivity near MW-4A is likely representative of the average permeability of the alluvial
aquifer. Typical specific yields for coarse grained alluvial aquifers range from 0.13 to 0.44
(Freeze and Cherry, 1979).
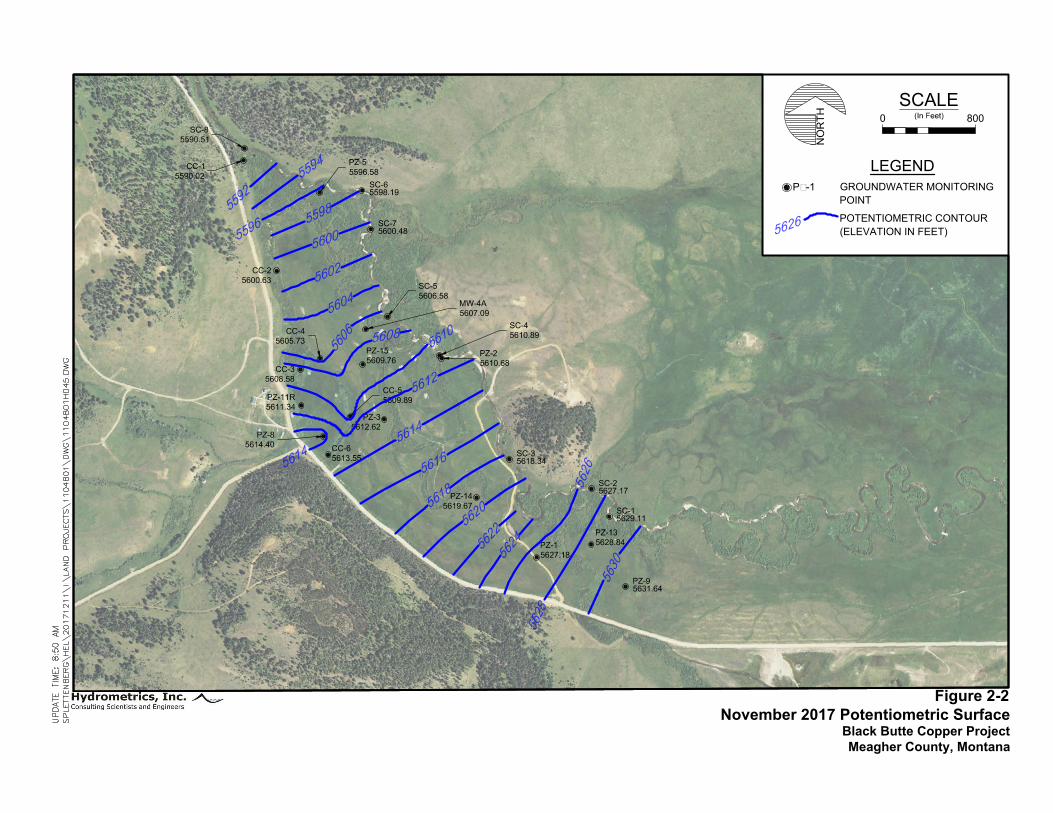
PZ-8
5614.40
PZ-11R
5611.34
PZ-3
5612.62
PZ-5
5596.58
PZ-1
5627.18
PZ-2
5610.68
PZ-14
5619.67
PZ-9
5631.64
PZ-13
5628.84
MW-4A
5607.09
PZ-15
5609.76
SC-1
5629.11
SC-2
5627.17
SC-3
5618.34
SC-4
5610.89
SC-5
5606.58
SC-6
5598.19
SC-7
5600.48
SC-8
5590.51
CC-1
5590.02
CC-2
5600.63
CC-3
5608.58
CC-4
5605.73
CC-5
5609.89
CC-6
5613.55
5
6
3
0
5
6
2
8
5
6
2
6
5
6
2
4
5
6
2
2
5
6
2
0
5
6
1
6
5
6
1
8
5
6
1
4
5
6
1
0
5
6
0
6
5
6
0
2
5
6
1
2
5
6
1
4
5
6
0
8
5
6
0
4
5
6
0
0
5
5
9
8
5
5
9
4
5
5
9
6
5
5
9
2
NO
RT
H
LEGEND
GROUNDWATER MONITORING
POINT
POTENTIOMETRIC CONTOUR
(ELEVATION IN FEET)
November 2017 Potentiometric Surface
Black Butte Copper Project
Meagher County, Montana
Figure 2-2
5
6
2
6
PZ-1
SCALE
0
(In Feet)
800
H:\Files\TGOLD\11048\Integrated Discharge Permit\Appendices\Appendix F\R17 2017 Flow Model.Docx\\12/11/17\065
2-5 12/11/2017\9:21 AM
During operations, the mine working will be dewatered by collecting water that enters the
mine workings in a series of sumps along the declines and drifts used to access the orebodies.
The dewatering model, discussed in Section 1.1, simulated that the mine dewatering would
cause about 1 to 10 feet of drawdown in the alluvial system. The greatest drawdown was
simulated on the western edge of the alluvium with it decreasing to the west as it approached
Sheep Creek. Drawdown during active dewatering will likely result in changes to the
groundwater-surface water interaction within the alluvial aquifer. With 10 feet of drawdown
in the vicinity of Coon Creek, the groundwater will not discharge to the diverted channel of
Coon Creek during operations. Without additional recharge to the alluvial system the
dewatering model suggests streams adjacent to the mine will be depleted by 177 gpm.
Water collected in the underground sumps will be pumped to surface where it will be used in
the milling process or diverted to the water treatment plant (double pass Reverse Osmosis
system). Tintina proposes to discharge the treated water to the Sheep Creek alluvial UIG as
shown on Figure 2-3. The average discharge rate is estimated to be 398 gpm with a design
maximum discharge rate of 575 gpm.
2.4 GROUNDWATER RECHARGE
In addition to surface water recharging the aquifer within the alluvial valley, the alluvial
aquifer also receives some recharge from direct infiltration of precipitation (rain and
snowmelt). An analysis of the average Sheep Creek Hydrograph at USGS gaging station
#6077000 shows the steady state base flows (November to March) in Sheep Creek account
for approximately 10% of the precipitation in the watershed (Hydrometrics, 2016). The
average precipitation in the vicinity of the alluvial aquifer is 18 in/yr; resulting in an
infiltration rate of about 1.8 in/yr. This accounts for approximately 22 gpm of recharge
across the conceptual model domain.
2.5 GROUNDWATER FLUX
Groundwater flows into the conceptual model domain through the upgradient alluvial system
and to a lesser degree from Coon Creek alluvium and surrounding bedrock. The
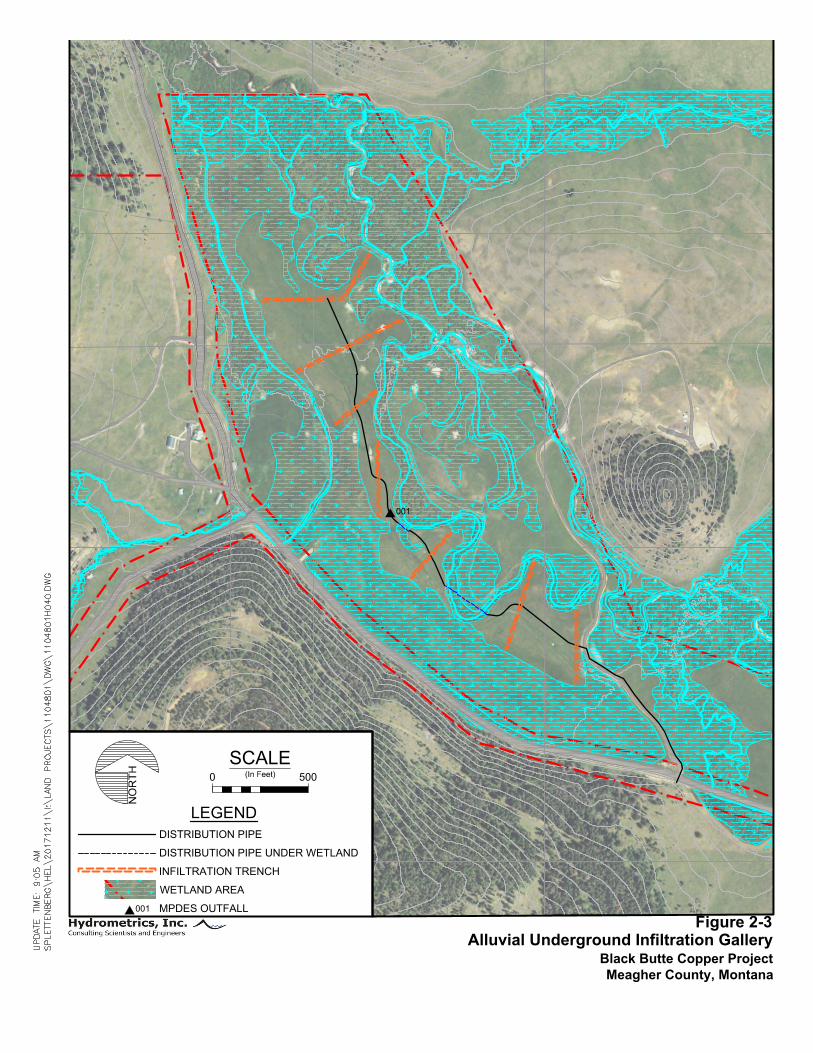
STRAWBERRYBUTTE
S
H
E
E
P
C
R
E
E
K
001
NO
RT
H
LEGEND
DISTRIBUTION PIPE
DISTRIBUTION PIPE UNDER WETLAND
INFILTRATION TRENCH
WETLAND AREA
MPDES OUTFALL001
SCALE
0
(In Feet)
500
Alluvial Underground Infiltration Gallery
Black Butte Copper Project
Meagher County, Montana
Figure 2-3
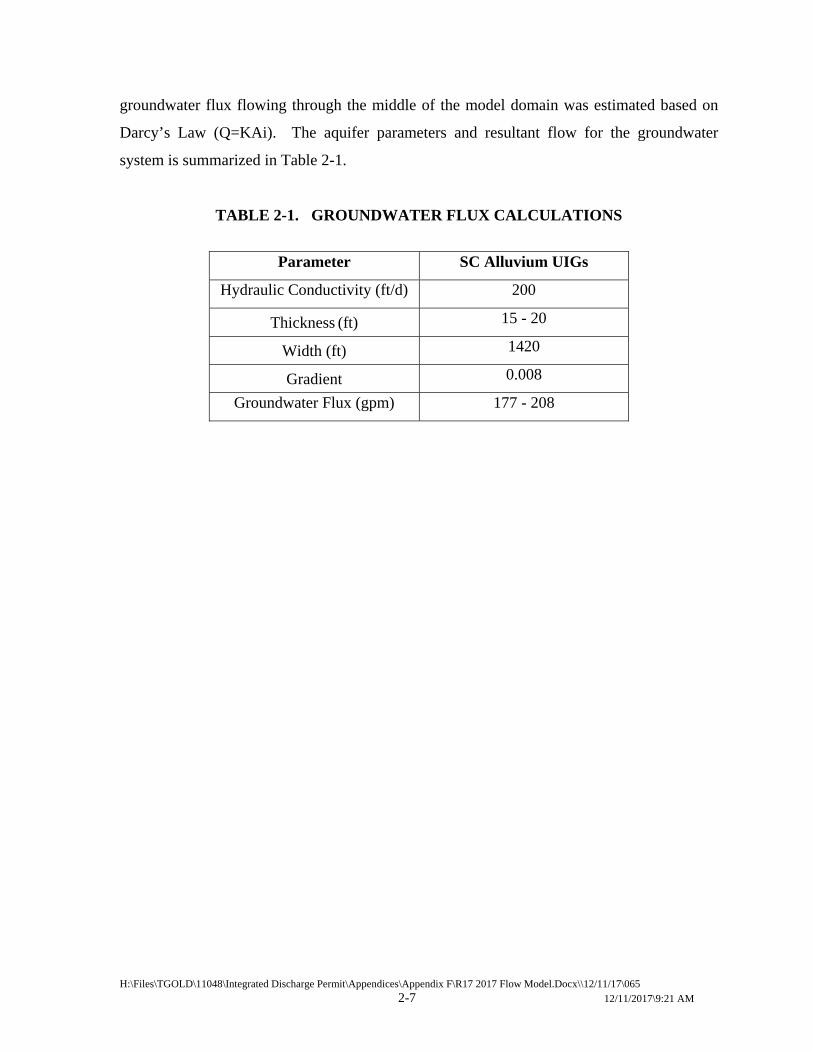
H:\Files\TGOLD\11048\Integrated Discharge Permit\Appendices\Appendix F\R17 2017 Flow Model.Docx\\12/11/17\065
2-7 12/11/2017\9:21 AM
groundwater flux flowing through the middle of the model domain was estimated based on
Darcy’s Law (Q=KAi). The aquifer parameters and resultant flow for the groundwater
system is summarized in Table 2-1.
TABLE 2-1. GROUNDWATER FLUX CALCULATIONS
Parameter SC Alluvium UIGs
Hydraulic Conductivity (ft/d) 200
Thickness (ft) 15 - 20
Width (ft) 1420
Gradient 0.008
Groundwater Flux (gpm) 177 - 208
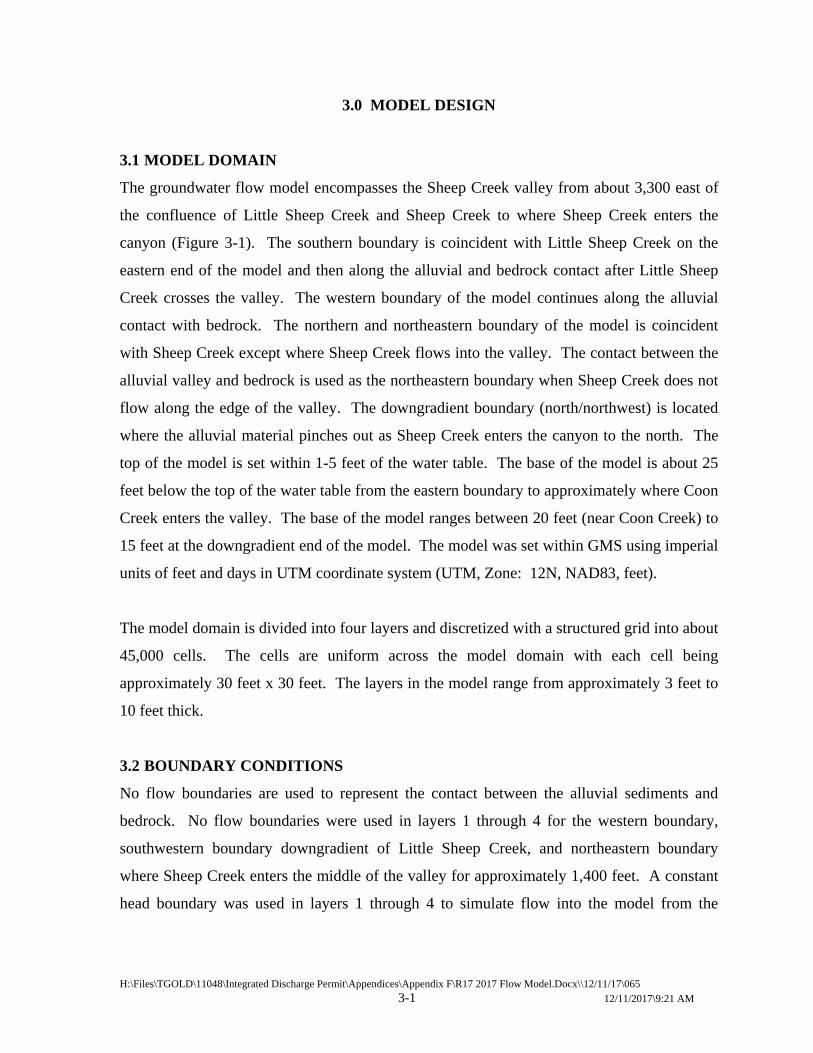
H:\Files\TGOLD\11048\Integrated Discharge Permit\Appendices\Appendix F\R17 2017 Flow Model.Docx\\12/11/17\065
3-1 12/11/2017\9:21 AM
3.0 MODEL DESIGN
3.1 MODEL DOMAIN
The groundwater flow model encompasses the Sheep Creek valley from about 3,300 east of
the confluence of Little Sheep Creek and Sheep Creek to where Sheep Creek enters the
canyon (Figure 3-1). The southern boundary is coincident with Little Sheep Creek on the
eastern end of the model and then along the alluvial and bedrock contact after Little Sheep
Creek crosses the valley. The western boundary of the model continues along the alluvial
contact with bedrock. The northern and northeastern boundary of the model is coincident
with Sheep Creek except where Sheep Creek flows into the valley. The contact between the
alluvial valley and bedrock is used as the northeastern boundary when Sheep Creek does not
flow along the edge of the valley. The downgradient boundary (north/northwest) is located
where the alluvial material pinches out as Sheep Creek enters the canyon to the north. The
top of the model is set within 1-5 feet of the water table. The base of the model is about 25
feet below the top of the water table from the eastern boundary to approximately where Coon
Creek enters the valley. The base of the model ranges between 20 feet (near Coon Creek) to
15 feet at the downgradient end of the model. The model was set within GMS using imperial
units of feet and days in UTM coordinate system (UTM, Zone: 12N, NAD83, feet).
The model domain is divided into four layers and discretized with a structured grid into about
45,000 cells. The cells are uniform across the model domain with each cell being
approximately 30 feet x 30 feet. The layers in the model range from approximately 3 feet to
10 feet thick.
3.2 BOUNDARY CONDITIONS
No flow boundaries are used to represent the contact between the alluvial sediments and
bedrock. No flow boundaries were used in layers 1 through 4 for the western boundary,
southwestern boundary downgradient of Little Sheep Creek, and northeastern boundary
where Sheep Creek enters the middle of the valley for approximately 1,400 feet. A constant
head boundary was used in layers 1 through 4 to simulate flow into the model from the
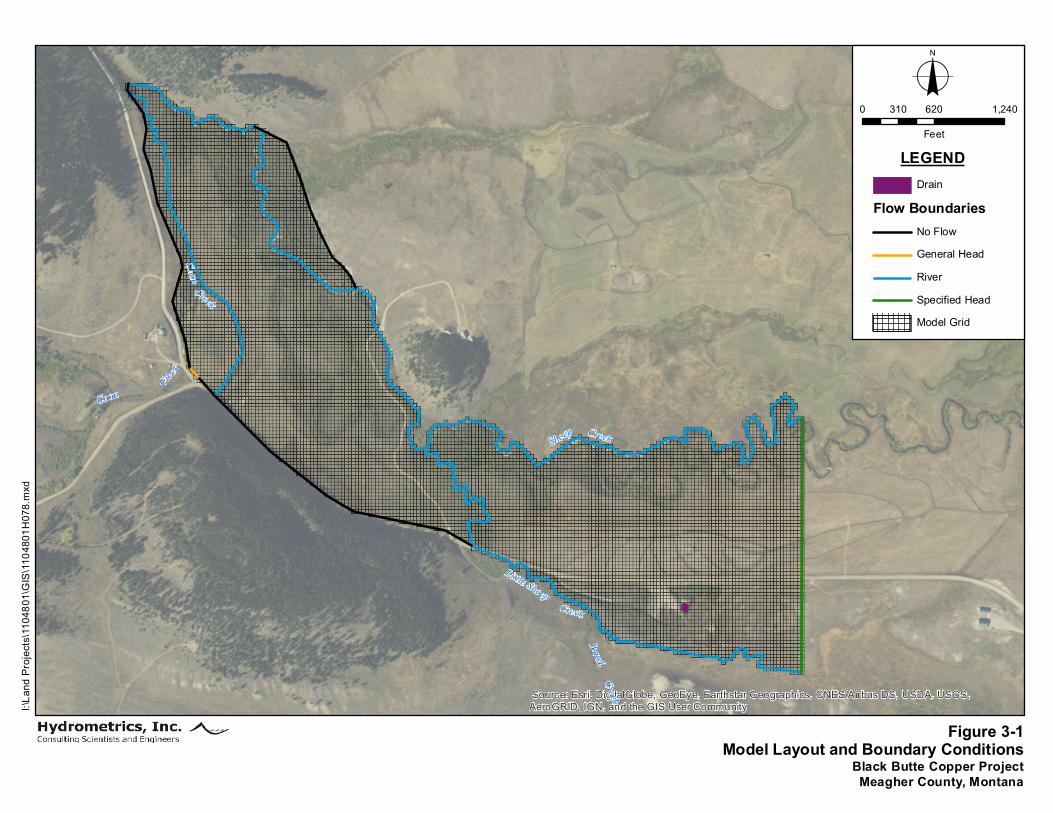
I:\Lan
d Proj
ects\
1104
801\G
IS\11
0480
1H07
8.mxd
Model Layout and Boundary ConditionsBlack Butte Copper ProjectMeagher County, Montana
Figure 3-1
Source: Esri, DigitalGlobe, GeoEye, Earthstar Geographics, CNES/Airbus DS, USDA, USGS,AeroGRID, IGN, and the GIS User Community
LEGENDDrain
Flow BoundariesNo FlowGeneral HeadRiverSpecified HeadModel Grid
o0 620 1,240310
Feet
Creek
Coon
Creek
Sheep Creek
Little Sheep
Coon
Creek
BrushCreek
H:\Files\TGOLD\11048\Integrated Discharge Permit\Appendices\Appendix F\R17 2017 Flow Model.Docx\\12/11/17\065
3-3 12/11/2017\9:21 AM
upgradient alluvial aquifer. River boundaries were used in layers 1 through 3 to simulate
Sheep Creek as it flows along the northern portion of the model domain; no flow boundaries
are used in layer 4 as it is assumed that Sheep Creek is only in direct connection with the
upper 3 layers. River boundaries were used in layers 1 and 2 to simulate Little Sheep Creek
on the southern domain and the creek crosses the alluvial valley and Coon Creek within the
model domain. Layers 3 and 4 on the southern portion of the model are simulated as no flow
boundaries. A general head boundary (GHB) is used to simulate groundwater flow from the
Coon Creek drainage. Parameterization of the boundaries used in the model is discussed
below.
Constant head boundaries are assigned a head value in the model and the flow into the model
is calculated by the model based on internal head conditions. The constant heads assigned to
the eastern edge of the model were based on the estimated water elevation of Sheep Creek
and Little Sheep Creek (5648 feet) at the boundary.
The GHB used to simulate Coon Creek groundwater flow are assigned head values and
conductance values, which are used to calculate the groundwater flux at the model boundary
based on fixed conditions at a more distant head. The heads assigned to the GHB near Coon
Creek were estimated based on the approximate elevation of Coon Creek (5,626 feet) at
about 250 feet upgradient of the GHB. The conductance for the GHB is calculated based on
the following equation:
CGHB =T*W
b*D
where:
C = Conductance (ft2/day);
T = Transmissivity (ft2/day);
W = width (ft);
b = thickness (ft); and
D = Distance between model boundary and reference head (ft).
H:\Files\TGOLD\11048\Integrated Discharge Permit\Appendices\Appendix F\R17 2017 Flow Model.Docx\\12/11/17\065
3-4 12/11/2017\9:21 AM
In GMS, the model calculates the width of the boundary that intersects a cell; therefore, the
initial conductance assigned to the boundary in GMS was calculated based on the hydraulic
conductivity of the material (20 ft/day, estimate) times the total length of the boundary (134
feet), divided by the distance to the reference head (250 feet). The conductance was adjusted
to a final value of 10 ft/day during model calibration until the heads at observation sites and
estimated flows from the boundary were within the calibration targets.
The river boundaries are used to simulate groundwater and surface water interaction within
the Sheep Creek Valley. Figure 3-1 shows the river boundaries used in the model.
Interaction between groundwater and surface water within the model is based on the
difference in head within the model and the stream stage, and the conductance of the
streambed. The streambed conductance is calculated based on the following equation:
CRiv = Kv*L*W
b
where:
CRiv = Conductance of stream bed (ft2/day);
Kv = Vertical conductivity of streambed (ft/day);
W = width of stream (ft);
b = streambed thickness (ft); and
L = River length (calculated by GMS; ft).
The river conductance was set arbitrarily high for Sheep Creek to assure it does not limit the
interaction between the river and the groundwater. This was done as it is assumed that Sheep
Creek is the dominant boundary of the groundwater system. The river conductance assigned
to Little Sheep Creek along the southern boundary and Coon Creek in GMS were based on
an assumed Kv of 1 ft/day, widths ranging between 3 to 10 feet, and a streambed thickness of
1 foot. The riverbed conductance assigned to Little Sheep Creek was increased to 200 ft/day
as it crosses the alluvial valley as both the width of the river the riverbed Kv are assumed to
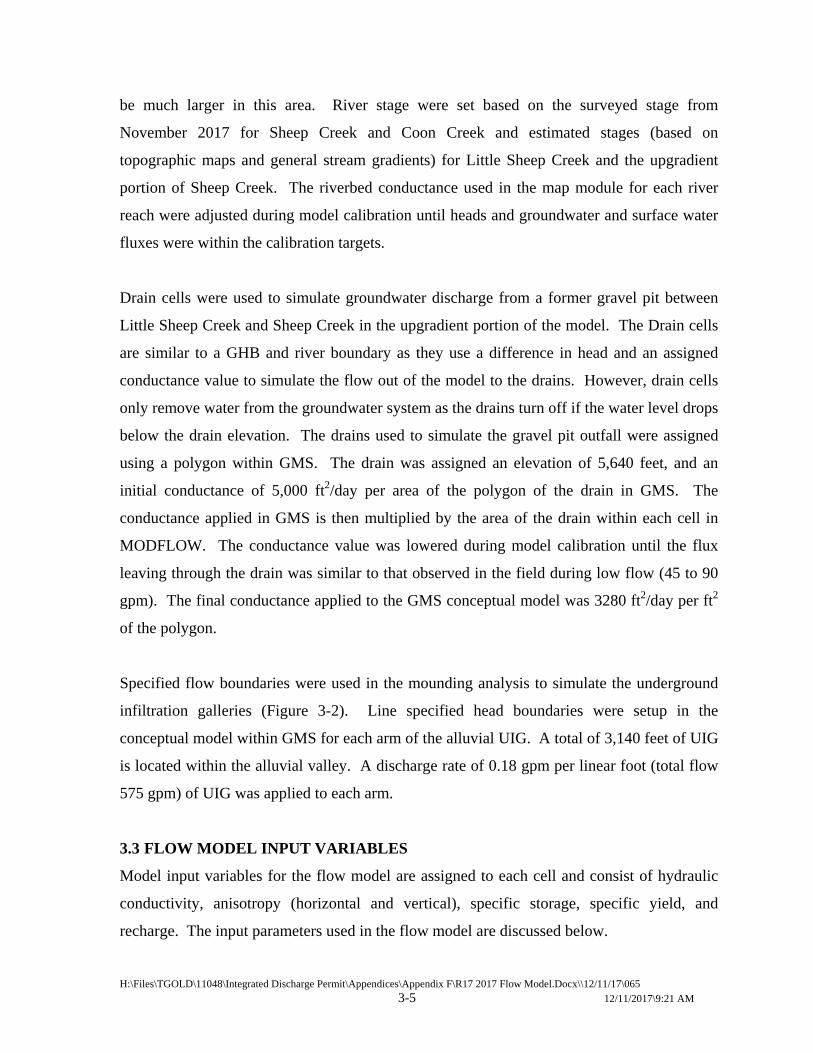
H:\Files\TGOLD\11048\Integrated Discharge Permit\Appendices\Appendix F\R17 2017 Flow Model.Docx\\12/11/17\065
3-5 12/11/2017\9:21 AM
be much larger in this area. River stage were set based on the surveyed stage from
November 2017 for Sheep Creek and Coon Creek and estimated stages (based on
topographic maps and general stream gradients) for Little Sheep Creek and the upgradient
portion of Sheep Creek. The riverbed conductance used in the map module for each river
reach were adjusted during model calibration until heads and groundwater and surface water
fluxes were within the calibration targets.
Drain cells were used to simulate groundwater discharge from a former gravel pit between
Little Sheep Creek and Sheep Creek in the upgradient portion of the model. The Drain cells
are similar to a GHB and river boundary as they use a difference in head and an assigned
conductance value to simulate the flow out of the model to the drains. However, drain cells
only remove water from the groundwater system as the drains turn off if the water level drops
below the drain elevation. The drains used to simulate the gravel pit outfall were assigned
using a polygon within GMS. The drain was assigned an elevation of 5,640 feet, and an
initial conductance of 5,000 ft2/day per area of the polygon of the drain in GMS. The
conductance applied in GMS is then multiplied by the area of the drain within each cell in
MODFLOW. The conductance value was lowered during model calibration until the flux
leaving through the drain was similar to that observed in the field during low flow (45 to 90
gpm). The final conductance applied to the GMS conceptual model was 3280 ft2/day per ft2
of the polygon.
Specified flow boundaries were used in the mounding analysis to simulate the underground
infiltration galleries (Figure 3-2). Line specified head boundaries were setup in the
conceptual model within GMS for each arm of the alluvial UIG. A total of 3,140 feet of UIG
is located within the alluvial valley. A discharge rate of 0.18 gpm per linear foot (total flow
575 gpm) of UIG was applied to each arm.
3.3 FLOW MODEL INPUT VARIABLES
Model input variables for the flow model are assigned to each cell and consist of hydraulic
conductivity, anisotropy (horizontal and vertical), specific storage, specific yield, and
recharge. The input parameters used in the flow model are discussed below.
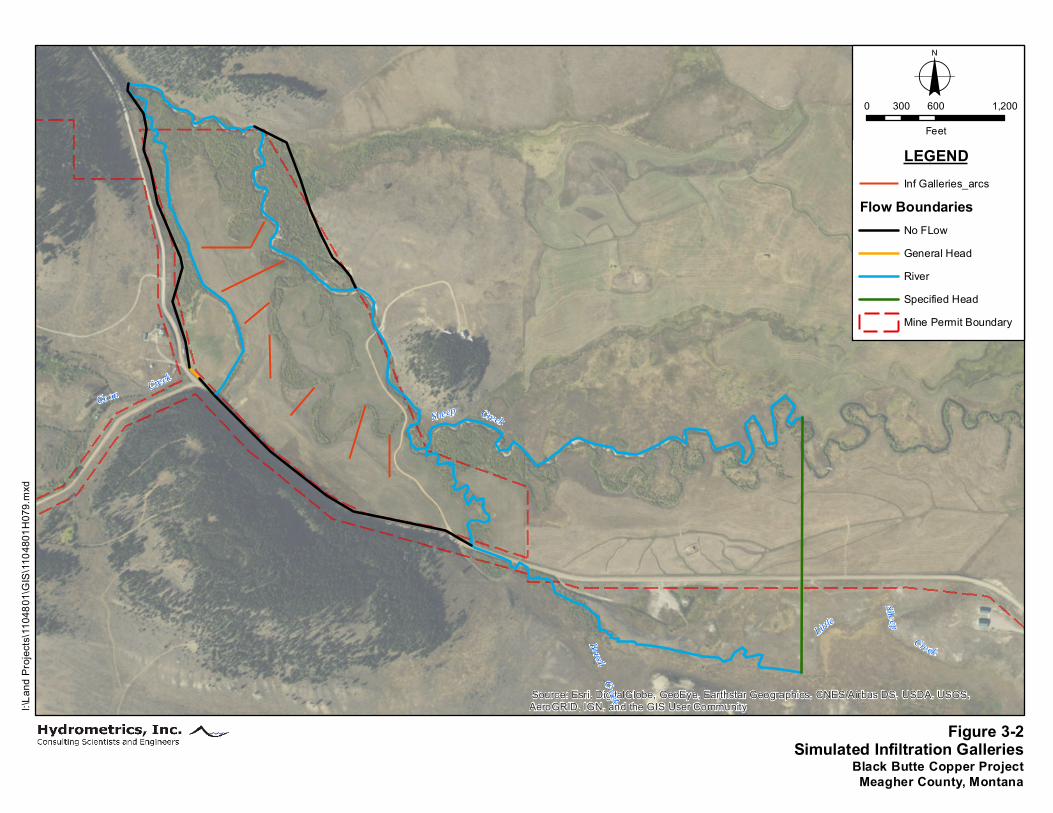
Coon
I:\Lan
d Proj
ects\
1104
801\G
IS\11
0480
1H07
9.mxd
Simulated Infiltration GalleriesBlack Butte Copper ProjectMeagher County, Montana
Creek
Figure 3-2
BrushCreek
Alluvial UIG
Eastern UIGCentral UIG
Source: Esri, DigitalGlobe, GeoEye, Earthstar Geographics, CNES/Airbus DS, USDA, USGS,AeroGRID, IGN, and the GIS User Community
LEGENDInf Galleries_arcs
Flow BoundariesNo FLowGeneral HeadRiverSpecified HeadMine Permit Boundary
o0 600 1,200300
Feet
Coon Creek
BrushCreek
Sheep Creek
Sheep
CreekLittle
H:\Files\TGOLD\11048\Integrated Discharge Permit\Appendices\Appendix F\R17 2017 Flow Model.Docx\\12/11/17\065
3-7 12/11/2017\9:21 AM
Recharge Rate
Areal recharge was used to simulate infiltration of direct precipitation and snowmelt to
groundwater. Due to the small area of the model domain, a uniform recharge was assigned to
the model domain. The model was calibrated to November 2017 water level data; therefore,
a recharge rate of 10% of precipitation (1.8 in/yr) was applied to the model domain. The
recharge accounts for approximately 20% of the flow.
Aquifer Properties
The model was assigned aquifer properties based on aquifer testing and lithology
observations in trenches within the valley. One aquifer test was conducted at well MW-4A;
which is located in lower portion of the aquifer. Based on the aquifer test data (see Section
2.2) layers 3 and 4 were assigned an initial hydraulic conductivity of 200 ft/day. Lithology
observations indicate the shallower material has more fine grained sand and silt than in the
lower portion of the aquifer. The initial hydraulic conductivity applied to layer 1 of the
aquifer was set at 50 ft/day to account for the higher content of finer grained material. Layer
3 was assigned an initial hydraulic conductivity of 100 ft/day as it is assumed to be a
transition layer between layers 1 and 3. Although there are likely some horizontal
heterogeneities within the alluvial aquifer; the use of average hydraulic conductivities is
appropriate for a groundwater flow model in this setting. Vertical hydraulic conductivities
were assigned assumed to be 1/5 of the horizontal hydraulic conductivities throughout the
model. The hydraulic conductivities were adjusted slightly during model calibration until the
simulated heads and flux between groundwater/surface water were within the calibration
targets. Model calibration and mounding simulations were both evaluated at steady state
conditions; therefore, storage coefficients were not used in the modeling analysis. The final
aquifer properties assigned to the model are summarized in Table 3-1.
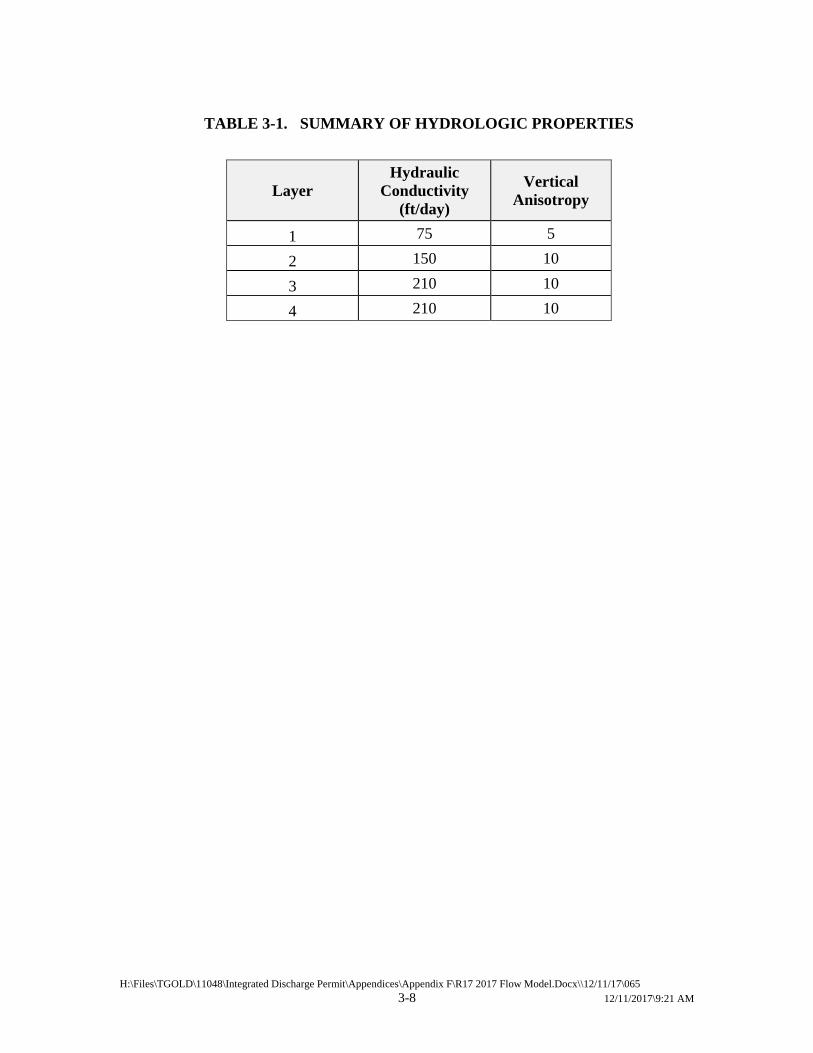
H:\Files\TGOLD\11048\Integrated Discharge Permit\Appendices\Appendix F\R17 2017 Flow Model.Docx\\12/11/17\065
3-8 12/11/2017\9:21 AM
TABLE 3-1. SUMMARY OF HYDROLOGIC PROPERTIES
Layer Hydraulic
Conductivity (ft/day)
Vertical Anisotropy
1 75 5
2 150 10
3 210 10
4 210 10
H:\Files\TGOLD\11048\Integrated Discharge Permit\Appendices\Appendix F\R17 2017 Flow Model.Docx\\12/11/17\065
4-1 12/11/2017\9:21 AM
4.0 MODEL CALIBRATION
The flow model was calibrated to pre-determined calibration targets based on the observed
heads and groundwater-surface water interactions. Head calibration targets were based on
the well and piezometers completed in the alluvial valley. Calibration of flow between
groundwater and surface water was based on observed and assumed discharge rates based on
the assumption that all the groundwater discharges to Sheep Creek at the downgradient end
of the model. A manual calibration process was conducted by adjusting the model
parameters within established ranges from aquifer test data and literature values to optimize
the degree to which the model simulations match observed data. The calibration targets for
the steady state flow model and the transport model are as follows:
Simulated Heads – within 1.5 feet of the observed heads (<5% of the change in head
across the model domain) and Mean Absolute Error < 1.5 feet;
Groundwater-Surface Water Interaction – within 20% of observed flux;
Groundwater flux within estimated range; and
Match general flow direction and gradient.
The final flow model was calibrated to groundwater flow parameters as discussed in Sections
4.1.
4.1 FLOW CALIBRATION
The steady state flow model was calibrated to November 7, 2017 water level elevations from
11 observation sites. Calibration of groundwater-surface water interaction on Coon Creek
was evaluated based on the October 2012 synoptic survey on Coon Creek. Synoptic surveys
conducted on Sheep Creek were not able to quantify the flow between the groundwater and
Sheep Creek as the change in flow from the confluence of Little Sheep Creek to the head of
the canyon were less than the measurement error (Hydrometrics, 2017). Therefore, the
estimated groundwater flux (177 to 208 gpm) was used to calibrate the groundwater
discharge to Sheep Creek. The calibration of the steady state flow model is evaluated based
on qualitative and quantitative analyses.
H:\Files\TGOLD\11048\Integrated Discharge Permit\Appendices\Appendix F\R17 2017 Flow Model.Docx\\12/11/17\065
4-2 12/11/2017\9:21 AM
The qualitative analysis consisted of an evaluation of the general flow direction and
hydraulic gradients in the observed versus the simulated potentiometric surfaces. The
simulated steady state potentiometric surface compares well to the potentiometric surface
developed from the onsite observation sites. The simulated potentiometric surface correctly
indicates that groundwater flow directions are generally parallel to or slightly towards Sheep
Creek throughout the valley (Figure 4-1). As seen in the observed potentiometric map, there
are some discrete flow paths in the vicinity of where Little Sheep Creek and Coon Creek
enters the valley. Water levels show groundwater flow directions away from Little Sheep
Creek as it enters the valley; indicating Little Sheep Creek is recharging the groundwater
system in this area. The simulated potentiometric map in the vicinity of Coon Creek shows
groundwater conditions as the observed potentiometric surface with groundwater flow
toward the diverted portion of the stream as it enters the valley. In the downgradient end of
the model, groundwater discharges to Sheep Creek approximately 3,000 to 3,500 feet along
Sheep Creek prior to entering the canyon.
The residual heads (observed heads minus simulated heads) for each observation site are
shown in Figure 4-1. Sites with green symbols indicate the residual head is within the
calibration target. Yellow symbols indicate the residual heads are 1 to 2 times greater than
the calibration target. There were not any residual heads greater than 2 times the calibration
target. The steady state simulated heads at 10 of the 11 observation sites were within the
calibration target (+/-1.5 feet). The residual at piezometer PZ-9 was about 1.7 feet.
Observation sites within the area of the proposed alluvial UIG matched very well to the
observed heads; with only one site (PZ-1) having a residual greater than +/-1 foot. The
remaining observation sites in the vicinity of the proposed alluvial UIG had residuals
between +/-0.1 and +/-0.6 feet. Figure 4-2 shows the observed versus simulated heads for
each observation point. The graph shows that as a whole, the observation sites are
distributed on either side of the 1:1 correlation line with no evidence of distribution bias
throughout the range of water levels.
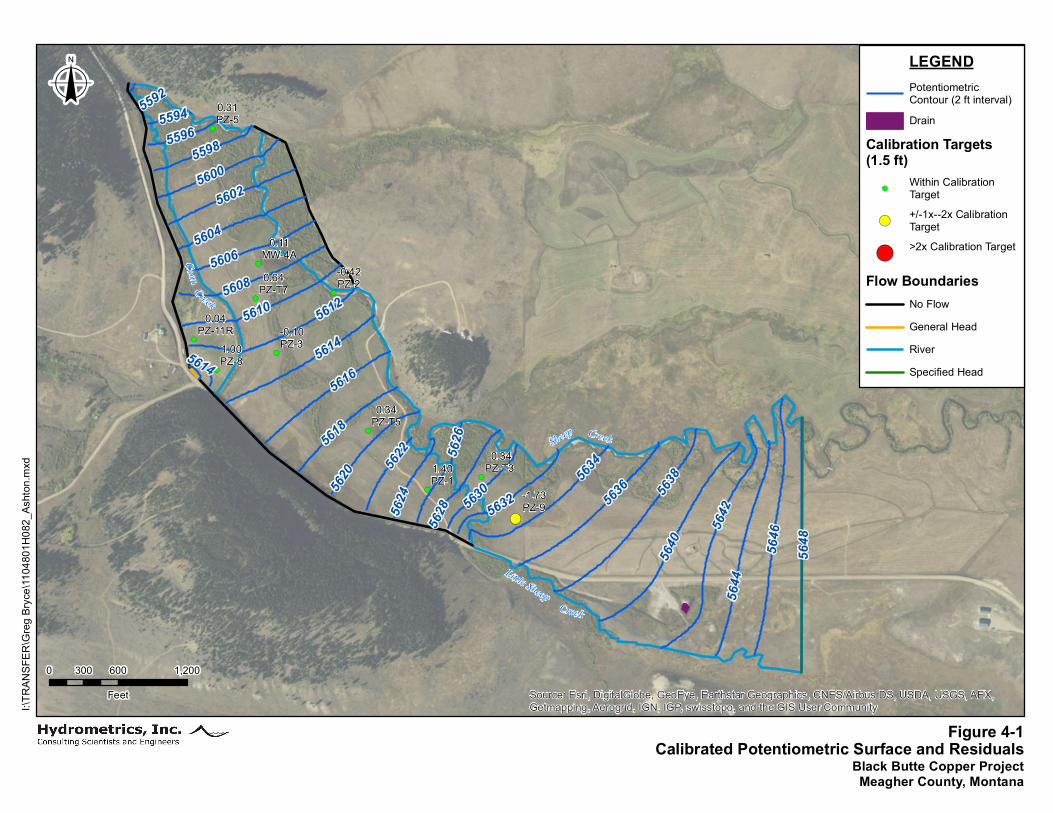
I:\TRA
NSFE
R\Gr
eg Br
yce\1
1048
01H0
82_A
shton
.mxd
Calibrated Potentiometric Surface and ResidualsBlack Butte Copper ProjectMeagher County, Montana
Figure 4-1
!(
!(
!(
!(
!(
!(
!(
!(
!(
!(
!(
1.40PZ-1
0.31PZ-5
1.00PZ-8
0.64PZ-T7
0.11MW-4A
-1.73PZ-9
0.34PZ-T5
-0.42PZ-2
-0.10PZ-3
-0.34PZ-T3
0.04PZ-11R
5646
5648
5642
5640
5644
5638
5636
5612
56145610
5634
5608
5616
5602
56065604
5600
5632
5618
5620
5628 563
0
5626
5598
5622
5624
559655945592
5614
Source: Esri, DigitalGlobe, GeoEye, Earthstar Geographics, CNES/Airbus DS, USDA, USGS, AEX,Getmapping, Aerogrid, IGN, IGP, swisstopo, and the GIS User Community
LEGENDPotentiometricContour (2 ft interval)Drain
Calibration Targets(1.5 ft)
!(Within CalibrationTarget
!(+/-1x--2x CalibrationTarget
!(>2x Calibration Target
Flow BoundariesNo FlowGeneral HeadRiverSpecified Head
o
0 600 1,200300
Feet
Creek
Coon
Creek
Sheep Creek
Little Sheep
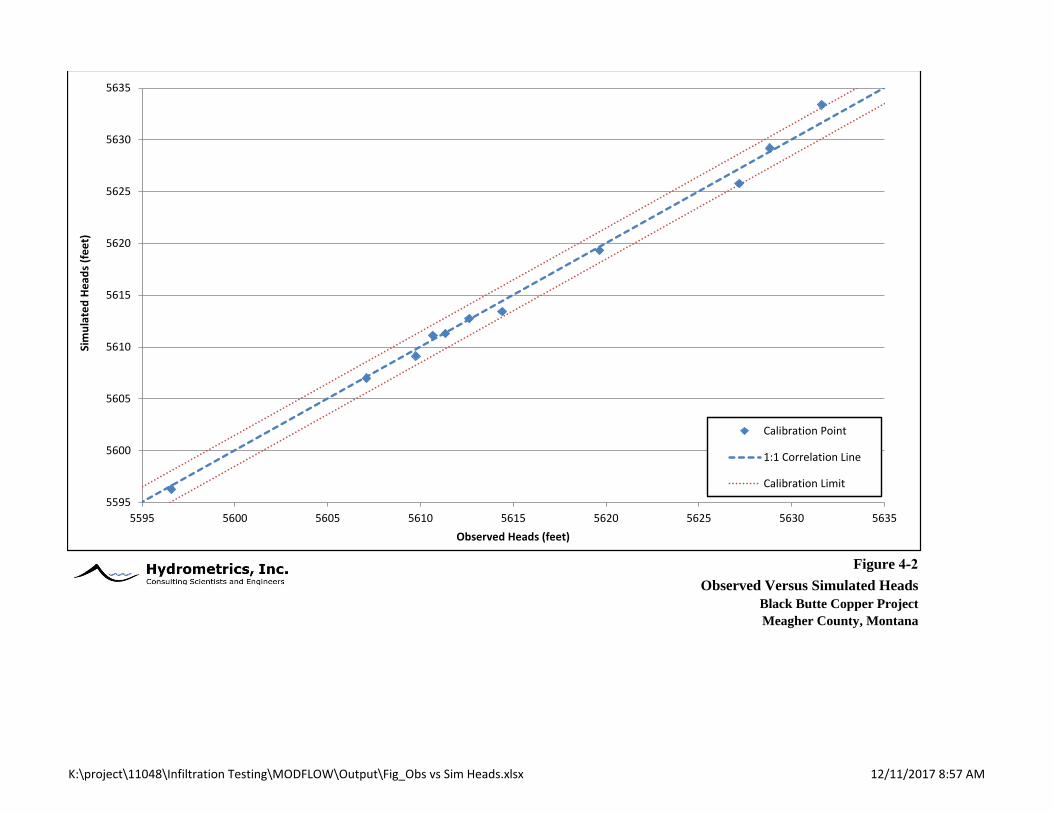
Figure 4-2Observed Versus Simulated Heads
Black Butte Copper Project
Meagher County, Montana
5595
5600
5605
5610
5615
5620
5625
5630
5635
5595 5600 5605 5610 5615 5620 5625 5630 5635
Sim
ula
ted
He
ads
(fe
et)
Observed Heads (feet)
Calibration Point
1:1 Correlation Line
Calibration Limit
K:\project\11048\Infiltration Testing\MODFLOW\Output\Fig_Obs vs Sim Heads.xlsx 12/11/2017 8:57 AM
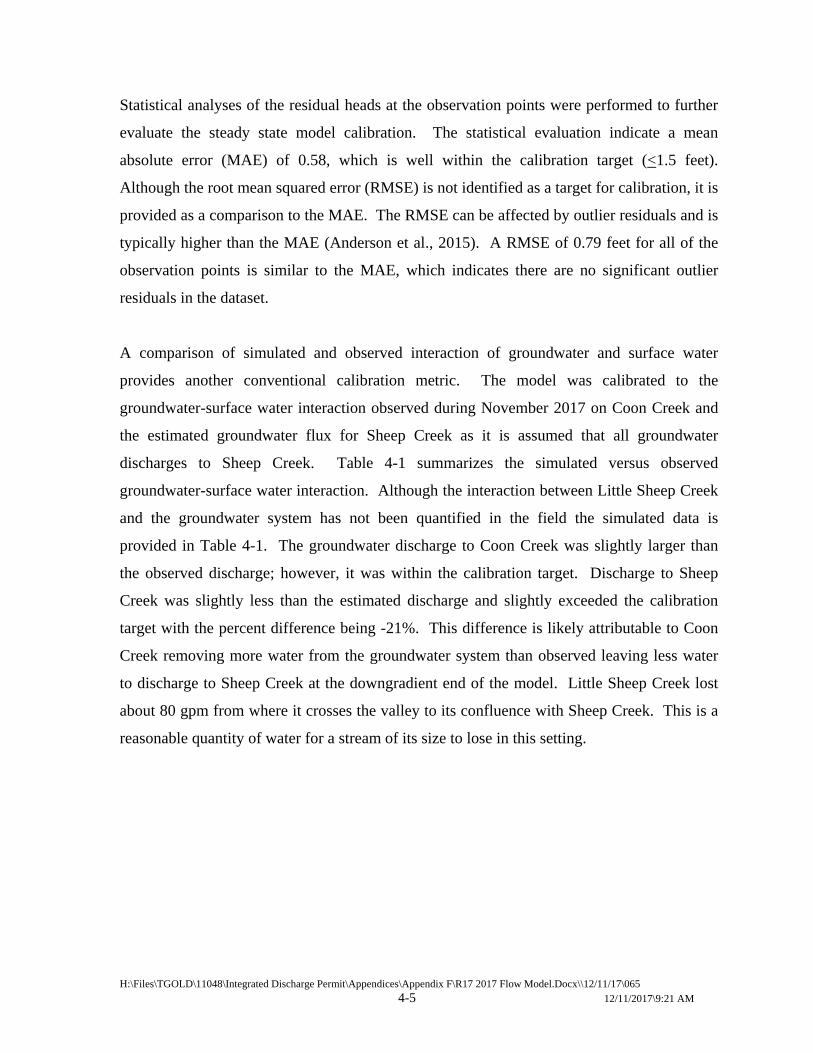
H:\Files\TGOLD\11048\Integrated Discharge Permit\Appendices\Appendix F\R17 2017 Flow Model.Docx\\12/11/17\065
4-5 12/11/2017\9:21 AM
Statistical analyses of the residual heads at the observation points were performed to further
evaluate the steady state model calibration. The statistical evaluation indicate a mean
absolute error (MAE) of 0.58, which is well within the calibration target (<1.5 feet).
Although the root mean squared error (RMSE) is not identified as a target for calibration, it is
provided as a comparison to the MAE. The RMSE can be affected by outlier residuals and is
typically higher than the MAE (Anderson et al., 2015). A RMSE of 0.79 feet for all of the
observation points is similar to the MAE, which indicates there are no significant outlier
residuals in the dataset.
A comparison of simulated and observed interaction of groundwater and surface water
provides another conventional calibration metric. The model was calibrated to the
groundwater-surface water interaction observed during November 2017 on Coon Creek and
the estimated groundwater flux for Sheep Creek as it is assumed that all groundwater
discharges to Sheep Creek. Table 4-1 summarizes the simulated versus observed
groundwater-surface water interaction. Although the interaction between Little Sheep Creek
and the groundwater system has not been quantified in the field the simulated data is
provided in Table 4-1. The groundwater discharge to Coon Creek was slightly larger than
the observed discharge; however, it was within the calibration target. Discharge to Sheep
Creek was slightly less than the estimated discharge and slightly exceeded the calibration
target with the percent difference being -21%. This difference is likely attributable to Coon
Creek removing more water from the groundwater system than observed leaving less water
to discharge to Sheep Creek at the downgradient end of the model. Little Sheep Creek lost
about 80 gpm from where it crosses the valley to its confluence with Sheep Creek. This is a
reasonable quantity of water for a stream of its size to lose in this setting.
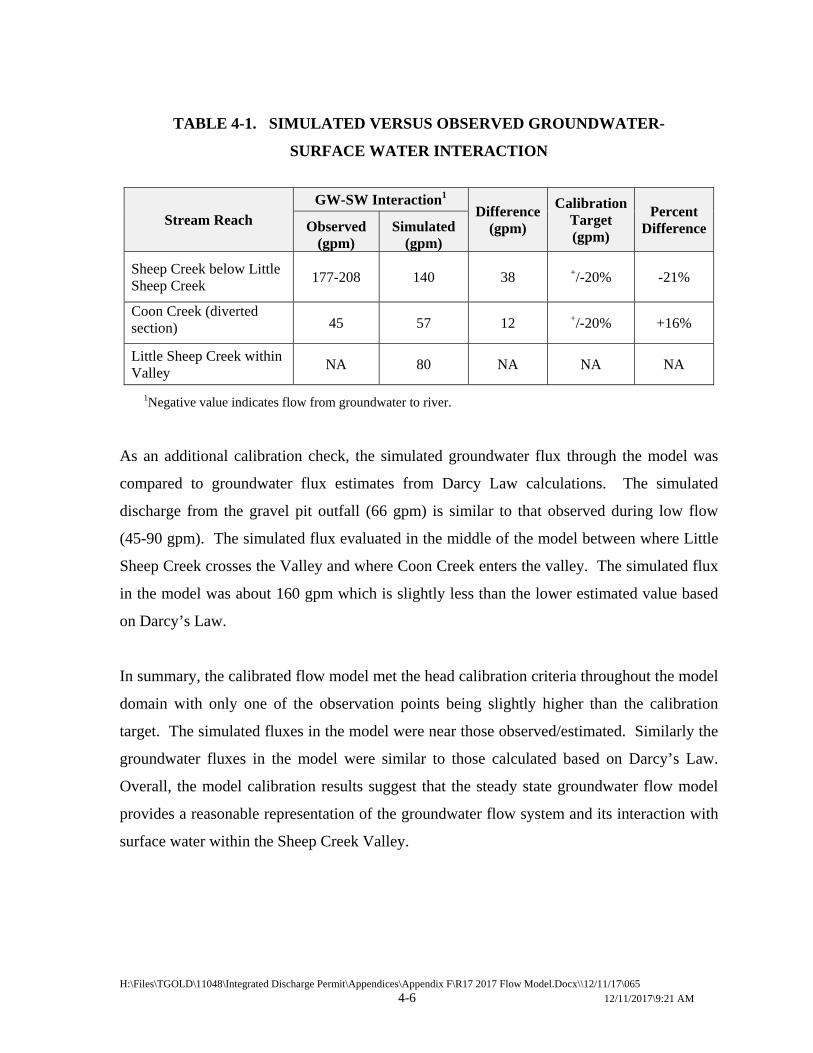
H:\Files\TGOLD\11048\Integrated Discharge Permit\Appendices\Appendix F\R17 2017 Flow Model.Docx\\12/11/17\065
4-6 12/11/2017\9:21 AM
TABLE 4-1. SIMULATED VERSUS OBSERVED GROUNDWATER-
SURFACE WATER INTERACTION
Stream Reach
GW-SW Interaction1 Difference
(gpm)
Calibration Target (gpm)
Percent DifferenceObserved
(gpm) Simulated
(gpm)
Sheep Creek below Little Sheep Creek
177-208 140 38 +/-20% -21%
Coon Creek (diverted section) 45 57 12 +/-20% +16%
Little Sheep Creek within Valley
NA 80 NA NA NA
1Negative value indicates flow from groundwater to river.
As an additional calibration check, the simulated groundwater flux through the model was
compared to groundwater flux estimates from Darcy Law calculations. The simulated
discharge from the gravel pit outfall (66 gpm) is similar to that observed during low flow
(45-90 gpm). The simulated flux evaluated in the middle of the model between where Little
Sheep Creek crosses the Valley and where Coon Creek enters the valley. The simulated flux
in the model was about 160 gpm which is slightly less than the lower estimated value based
on Darcy’s Law.
In summary, the calibrated flow model met the head calibration criteria throughout the model
domain with only one of the observation points being slightly higher than the calibration
target. The simulated fluxes in the model were near those observed/estimated. Similarly the
groundwater fluxes in the model were similar to those calculated based on Darcy’s Law.
Overall, the model calibration results suggest that the steady state groundwater flow model
provides a reasonable representation of the groundwater flow system and its interaction with
surface water within the Sheep Creek Valley.
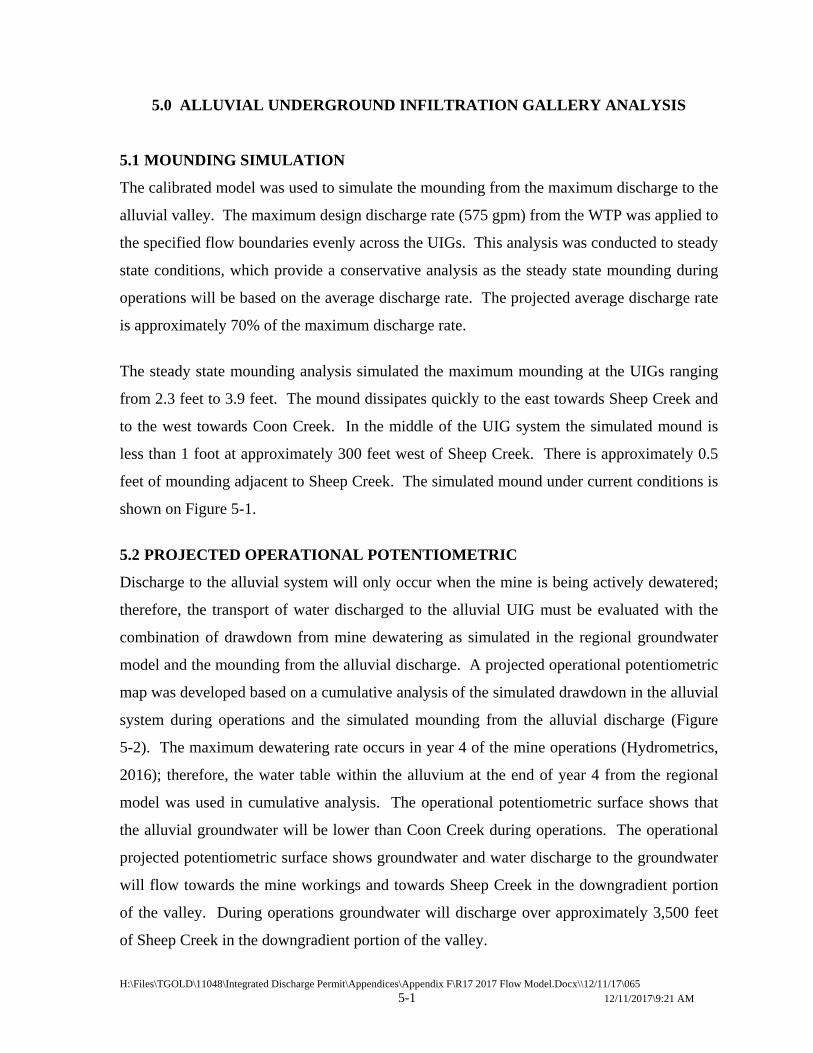
H:\Files\TGOLD\11048\Integrated Discharge Permit\Appendices\Appendix F\R17 2017 Flow Model.Docx\\12/11/17\065
5-1 12/11/2017\9:21 AM
5.0 ALLUVIAL UNDERGROUND INFILTRATION GALLERY ANALYSIS
5.1 MOUNDING SIMULATION
The calibrated model was used to simulate the mounding from the maximum discharge to the
alluvial valley. The maximum design discharge rate (575 gpm) from the WTP was applied to
the specified flow boundaries evenly across the UIGs. This analysis was conducted to steady
state conditions, which provide a conservative analysis as the steady state mounding during
operations will be based on the average discharge rate. The projected average discharge rate
is approximately 70% of the maximum discharge rate.
The steady state mounding analysis simulated the maximum mounding at the UIGs ranging
from 2.3 feet to 3.9 feet. The mound dissipates quickly to the east towards Sheep Creek and
to the west towards Coon Creek. In the middle of the UIG system the simulated mound is
less than 1 foot at approximately 300 feet west of Sheep Creek. There is approximately 0.5
feet of mounding adjacent to Sheep Creek. The simulated mound under current conditions is
shown on Figure 5-1.
5.2 PROJECTED OPERATIONAL POTENTIOMETRIC
Discharge to the alluvial system will only occur when the mine is being actively dewatered;
therefore, the transport of water discharged to the alluvial UIG must be evaluated with the
combination of drawdown from mine dewatering as simulated in the regional groundwater
model and the mounding from the alluvial discharge. A projected operational potentiometric
map was developed based on a cumulative analysis of the simulated drawdown in the alluvial
system during operations and the simulated mounding from the alluvial discharge (Figure
5-2). The maximum dewatering rate occurs in year 4 of the mine operations (Hydrometrics,
2016); therefore, the water table within the alluvium at the end of year 4 from the regional
model was used in cumulative analysis. The operational potentiometric surface shows that
the alluvial groundwater will be lower than Coon Creek during operations. The operational
projected potentiometric surface shows groundwater and water discharge to the groundwater
will flow towards the mine workings and towards Sheep Creek in the downgradient portion
of the valley. During operations groundwater will discharge over approximately 3,500 feet
of Sheep Creek in the downgradient portion of the valley.
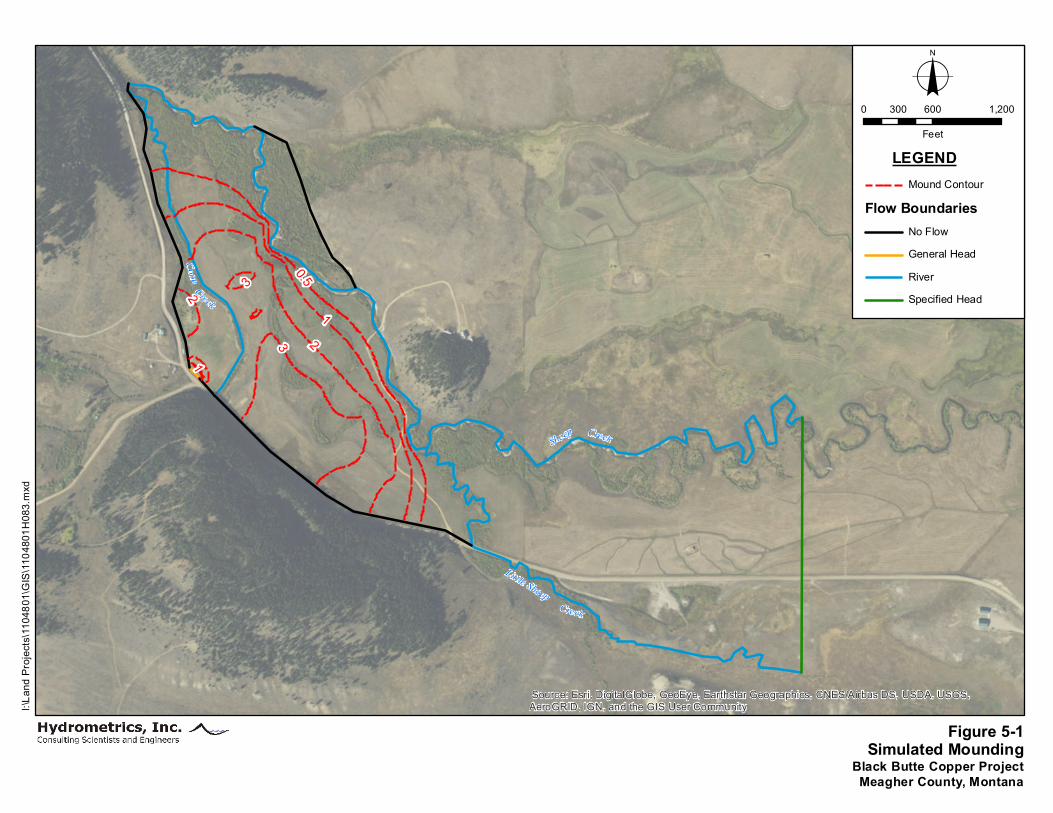
I:\Lan
d Proj
ects\
1104
801\G
IS\11
0480
1H08
3.mxd
Simulated MoundingBlack Butte Copper ProjectMeagher County, Montana
Figure 5-1
2 3
1
0.523
1
Source: Esri, DigitalGlobe, GeoEye, Earthstar Geographics, CNES/Airbus DS, USDA, USGS,AeroGRID, IGN, and the GIS User Community
LEGENDMound Contour
Flow BoundariesNo FlowGeneral HeadRiverSpecified Head
o0 600 1,200300
Feet
Creek
Coon
Creek
Sheep Creek
Little Sheep
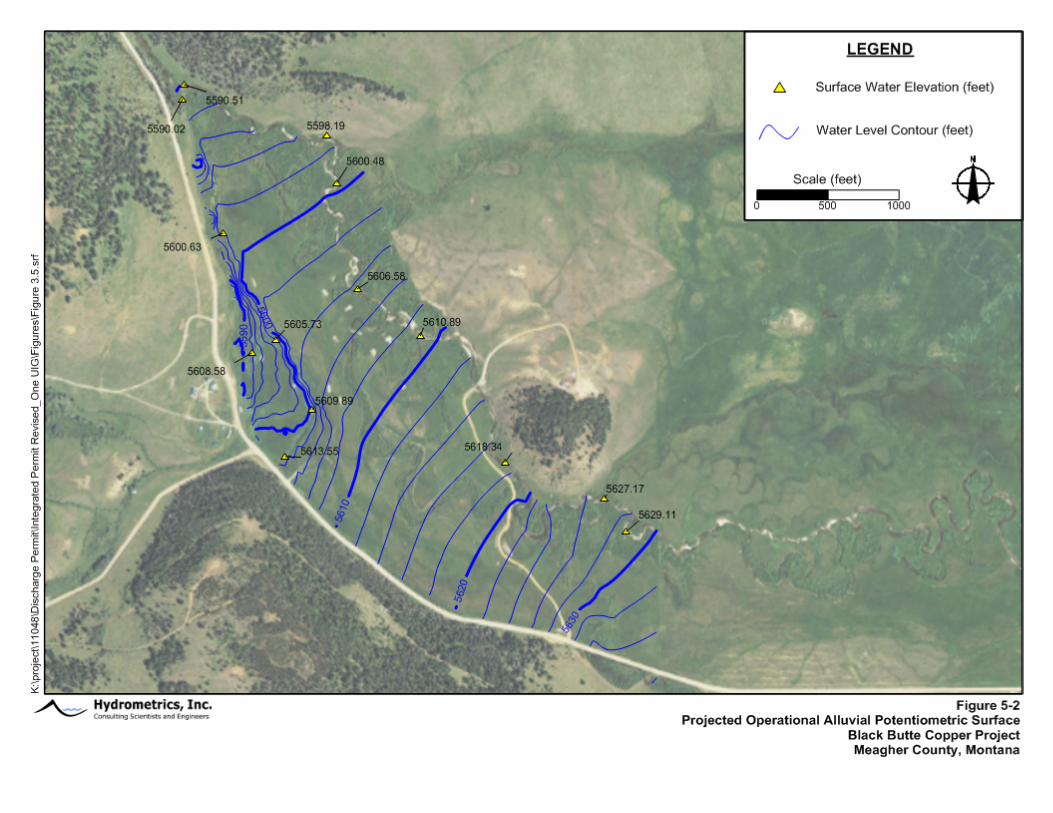
H:\Files\TGOLD\11048\Integrated Discharge Permit\Appendices\Appendix F\R17 2017 Flow Model.Docx\\12/11/17\065
6-1 12/11/2017\9:21 AM
6.0 SENSITIVITY
A formal sensitivity analysis has not been conducted where the change in model results (i.e.,
heads, groundwater flux, and groundwater/surface water interaction) was quantified based on
changes in specific model parameters. However, the general sensitivity of the model was
noted during model calibration. Below is a summary of which parameters the model was
sensitive to during model calibration.
The flow model calibration process provided important information on the sensitivity of the
model with respect to specific parameters used in the model. The model was most sensitive
to changes in horizontal hydraulic conductivities and riverbed conductance. Increases in
hydraulic conductivity resulted in slightly lower heads and greater flows within the
groundwater system and two and from surface water boundaries. Heads increased with lower
hydraulic conductivity values with groundwater flow becoming much lower than estimated.
Similarly interaction between groundwater and surface water showed decreased flux both to
and from surface water boundaries. Heads further from river boundaries showed the largest
effects from changes in hydraulic conductivity.
Riverbed conductance was the other parameter that showed the largest sensitivity during
model calibration. Lower conductance values assigned to the riverbed resulted in decreased
fluxes in and out of the river boundaries used in the model. Lower conductance values also
resulted in lower heads where Little Sheep Creek crosses the alluvial valley and higher heads
near Coon Creek and the downgradient portions of Sheep Creek. Opposite affects were
noted when higher conductance values were assigned to the riverbed.
Areal recharge was not adjusted during model calibration; therefore, the sensitivity of the
model with respect to recharge was not evaluated. As noted in Section 3.3, recharge of
precipitation is a minor component of the flow in the groundwater beneath the site and small
increases or decreases in the percent of precipitation that recharges the aquifer are assumed to
not have a significant effect on the model calibration or mounding analysis.
H:\Files\TGOLD\11048\Integrated Discharge Permit\Appendices\Appendix F\R17 2017 Flow Model.Docx\\12/11/17\065
7-1 12/11/2017\9:21 AM
7.0 DISCUSSION
This modeling analysis was conducted to evaluate the effects the alluvial UIG discharge may
have on water resources in the vicinity of the BBC Project. Modeling objectives were
developed to ensure the model would address current and future analyses within the alluvial
aquifer. The objectives are as follows:
Estimate the mounding associated with the alluvial UIG discharge;
Provide data that could be combined with the dewatering simulations to evaluate
where groundwater will discharge to surface water during operations; and
Provide a tool to assess the alluvial system for potential future evaluations.
The model is calibrated based on November 2017 water level data, and October 2012
synoptic data on Coon Creek. The calibrated flow model is able to reasonably match
observed heads, estimated groundwater flux and groundwater-surface water interactions
throughout the model domain. Overall the model provides a good representation of the
alluvial groundwater flow system.
The alluvial discharge simulations showed there would be up to 3.9 feet of mounding at the
galleries and the mounding would dissipate relatively quickly as you moved away from the
discharge location. The simulated mound was used in conjunction with the simulated year 4
water levels in the alluvial system from the dewatering model to develop a projected
operational potentiometric surface. The projected operational potentiometric surface showed
that the groundwater was below Coon Creek throughout the valley and water discharged to
the alluvial UIGs would transport to the mine workings or to approximately 3,500 feet of the
Sheep Creek in the lower portion of the valley.
H:\Files\TGOLD\11048\Integrated Discharge Permit\Appendices\Appendix F\R17 2017 Flow Model.Docx\\12/11/17\065
8-1 12/11/2017\9:21 AM
8.0 REFERENCES
Anderson, Woessner, and Hunt, 2015. Applied Groundwater Modeling, Simulation of Flow and Advective Transport, Second Edition. Elsevier Inc. - Academic Press.
Aquaveo, 2017. Groundwater Modeling System (GMS) Version 10.2. Aquaveo LLC. Fetter, C.W., 2001. Applied Hydrogeology. 4th Edition. Upper Saddle River, NJ: Prentice
Hall, Inc. Freeze, R.A. and J.A. Cherry, 1979. Groundwater. Englewood Cliffs, N.J. Prentice-Hall, Inc. Harbough, A.W., 2005. The U.S. Geological Survey Modular Ground-Water Model – the
Ground-Water Flow Process. U.S. Geological Survey Techniques and Methods 6-A16.
Hydrometrics, Inc., 2016. Groundwater Modeling Assessment for the Black Butte Copper
Project Meagher County MT. Report prepared for Tintina Resources, Inc. November 2015 (revised June 2016). In Appendix M of the MOP application document (Revision 3, July 14, 2017).
Hydrometrics, Inc., 2017. Baseline Water Resources Monitoring and Hydrologic
Investigations Report, Tintina Resources Black Butte Copper Project. Revised Report Dated March 14, 2017. Original report dated August 2015. In Appendix B of the MOP application document (Revision 3, July 14, 2017).
H:\Files\TGOLD\11048\Integrated Discharge Permit\R17 Permit Application Narrative.Docx\\12/11/17\065 12/11/17\7:28 AM
APPENDIX G
RECEIVING WATER QUALITY DATA
AND STATISTICAL ANALYSIS
(LOCATED ON MAIN CD)

H:\Files\TGOLD\11048\Integrated Discharge Permit\R17 Permit Application Narrative.Docx\\12/11/17\065 12/11/17\7:28 AM
APPENDIX H
SAFETY DATA SHEETS
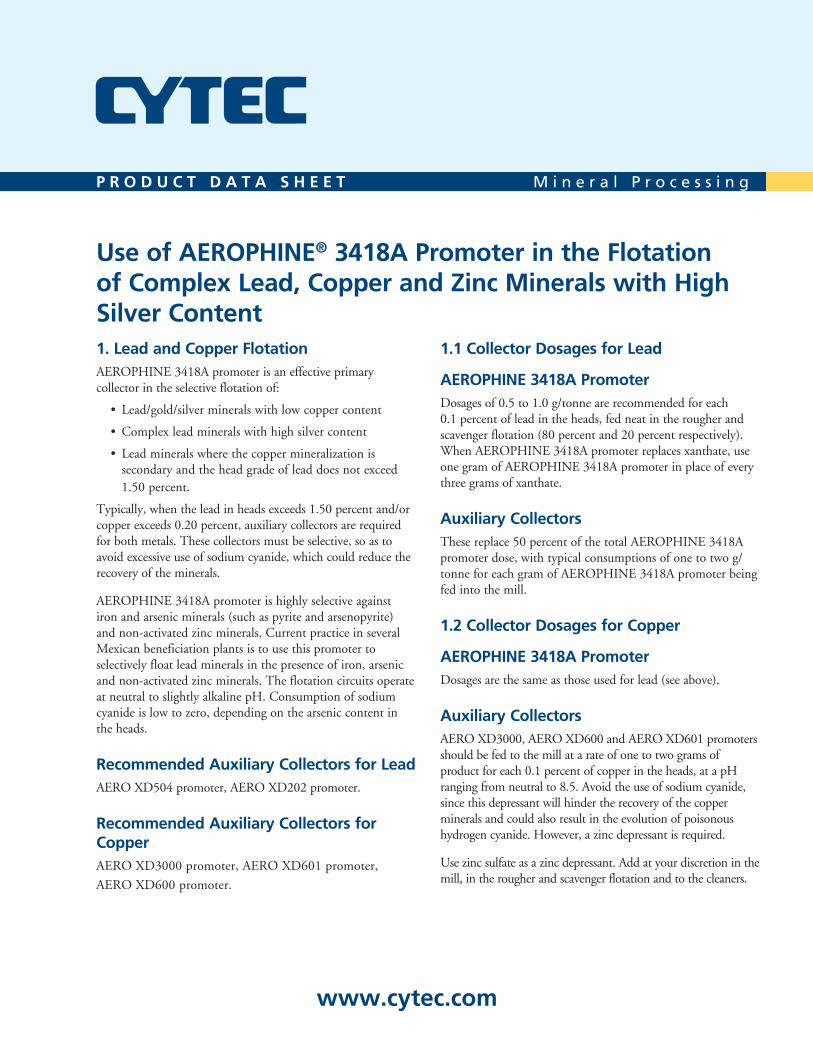
Use of AEROPHINE® 3418A Promoter in the Flotation of Complex Lead, Copper and Zinc Minerals with High Silver Content1. Lead and Copper FlotationAEROPHINE 3418A promoter is an effective primary collector in the selective flotation of:
• Lead/gold/silvermineralswithlowcoppercontent
• Complexleadmineralswithhighsilvercontent
• Leadmineralswherethecoppermineralizationissecondaryandtheheadgradeofleaddoesnotexceed1.50 percent.
Typically,whentheleadinheadsexceeds1.50percentand/orcopperexceeds0.20percent,auxiliarycollectorsarerequiredforbothmetals.Thesecollectorsmustbeselective,soastoavoidexcessiveuseofsodiumcyanide,whichcouldreducetherecovery of the minerals.
AEROPHINE3418Apromoterishighlyselectiveagainstironandarsenicminerals(suchaspyriteandarsenopyrite)andnon-activatedzincminerals.CurrentpracticeinseveralMexicanbeneficiationplantsistousethispromotertoselectivelyfloatleadmineralsinthepresenceofiron,arsenicandnon-activatedzincminerals.TheflotationcircuitsoperateatneutraltoslightlyalkalinepH.Consumptionofsodiumcyanideislowtozero,dependingonthearseniccontentintheheads.
Recommended Auxiliary Collectors for LeadAEROXD504promoter,AEROXD202promoter.
Recommended Auxiliary Collectors for CopperAERO XD3000 promoter, AERO XD601 promoter,
AERO XD600 promoter.
1.1 Collector Dosages for Lead
AEROPHINE 3418A PromoterDosagesof0.5to1.0g/tonnearerecommendedforeach0.1percentofleadintheheads,fedneatintherougherandscavengerflotation(80percentand20percentrespectively).WhenAEROPHINE3418Apromoterreplacesxanthate,useonegramofAEROPHINE3418Apromoterinplaceofeverythreegramsofxanthate.
Auxiliary CollectorsThese replace 50 percent of the total AEROPHINE 3418A promoterdose,withtypicalconsumptionsofonetotwog/tonneforeachgramofAEROPHINE3418Apromoterbeingfedintothemill.
1.2 Collector Dosages for Copper
AEROPHINE 3418A PromoterDosagesarethesameasthoseusedforlead(seeabove).
Auxiliary CollectorsAEROXD3000,AEROXD600andAEROXD601promotersshouldbefedtothemillatarateofonetotwogramsofproductforeach0.1percentofcopperintheheads,atapHrangingfromneutralto8.5.Avoidtheuseofsodiumcyanide,sincethisdepressantwillhindertherecoveryofthecoppermineralsandcouldalsoresultintheevolutionofpoisonoushydrogencyanide.However,azincdepressantisrequired.
Usezincsulfateasazincdepressant.Addatyourdiscretioninthemill,intherougherandscavengerflotationandtothecleaners.
www.cytec.com
P R O D U C t D A t A S H E E t M i n e r a l P r o c e s s i n g
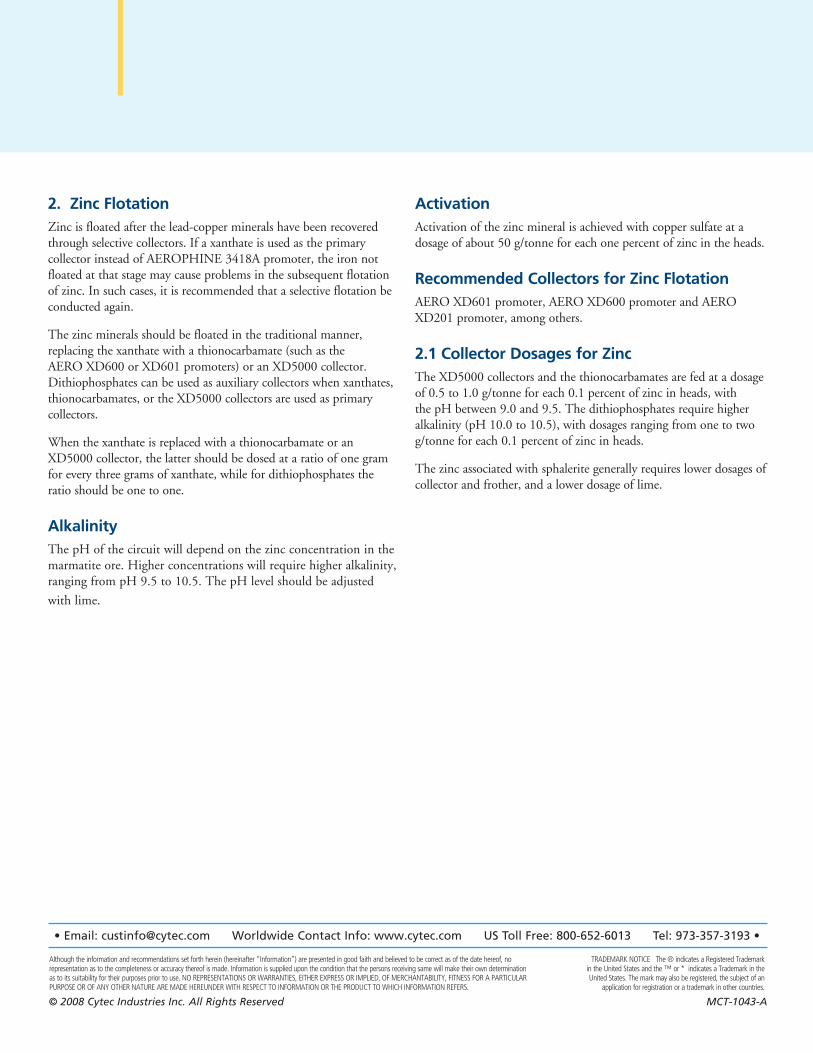
Although the information and recommendations set forth herein (hereinafter “Information”) are presented in good faith and believed to be correct as of the date hereof, no representation as to the completeness or accuracy thereof is made. Information is supplied upon the condition that the persons receiving same will make their own determination as to its suitability for their purposes prior to use. NO REPRESENTATIONS OR WARRANTIES, EITHER EXPRESS OR IMPLIED, OF MERCHANTABILITY, FITNESS FOR A PARTICULAR PURPOSE OR OF ANY OTHER NATURE ARE MADE HEREUNDER WITH RESPECT TO INFORMATION OR THE PRODUCT TO WHICH INFORMATION REFERS.
TRADEMARK NOTICE The ® indicates a Registered Trademark in the United States and the ™ or * indicates a Trademark in the United States. The mark may also be registered, the subject of an
application for registration or a trademark in other countries.
• Email: [email protected] Worldwide Contact Info: www.cytec.com US Toll Free: 800-652-6013 Tel: 973-357-3193 •
© 2008 Cytec Industries Inc. All Rights Reserved MCT-1043-A
2. Zinc FlotationZincisfloatedafterthelead-coppermineralshavebeenrecoveredthroughselectivecollectors.IfaxanthateisusedastheprimarycollectorinsteadofAEROPHINE3418Apromoter,theironnotfloatedatthatstagemaycauseproblemsinthesubsequentflotationofzinc.Insuchcases,itisrecommendedthataselectiveflotationbeconductedagain.
Thezincmineralsshouldbefloatedinthetraditionalmanner,replacingthexanthatewithathionocarbamate(suchastheAEROXD600orXD601promoters)oranXD5000collector.Dithiophosphatescanbeusedasauxiliarycollectorswhenxanthates,thionocarbamates,ortheXD5000collectorsareusedasprimarycollectors.
WhenthexanthateisreplacedwithathionocarbamateoranXD5000collector,thelattershouldbedosedataratioofonegramforeverythreegramsofxanthate,whilefordithiophosphatestheratioshouldbeonetoone.
AlkalinityThepHofthecircuitwilldependonthezincconcentrationinthemarmatiteore.Higherconcentrationswillrequirehigheralkalinity,rangingfrompH9.5to10.5.ThepHlevelshouldbeadjusted
withlime.
ActivationActivationofthezincmineralisachievedwithcoppersulfateatadosageofabout50g/tonneforeachonepercentofzincintheheads.
Recommended Collectors for Zinc FlotationAEROXD601promoter,AEROXD600promoterandAEROXD201promoter,amongothers.
2.1 Collector Dosages for ZincTheXD5000collectorsandthethionocarbamatesarefedatadosageof0.5to1.0g/tonneforeach0.1percentofzincinheads,withthepHbetween9.0and9.5.Thedithiophosphatesrequirehigheralkalinity(pH10.0to10.5),withdosagesrangingfromonetotwog/tonneforeach0.1percentofzincinheads.
Thezincassociatedwithsphaleritegenerallyrequireslowerdosagesofcollectorandfrother,andalowerdosageoflime.
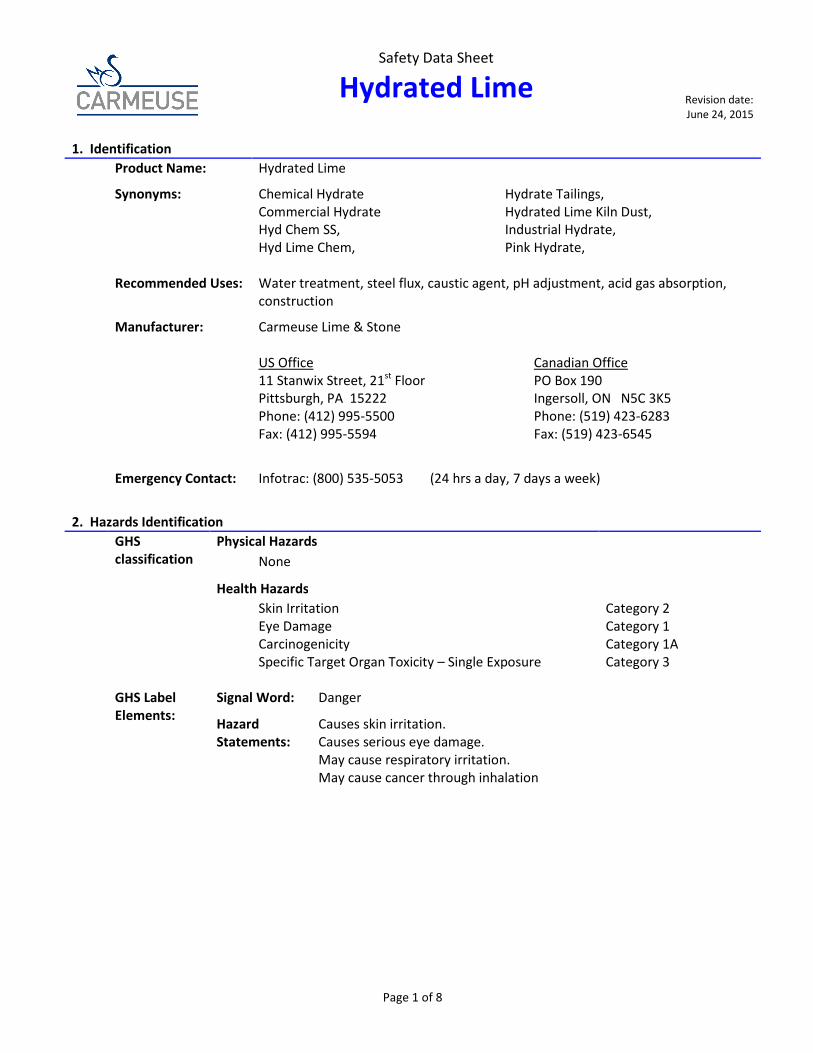
Safety Data Sheet
Hydrated Lime Revision date:
June 24, 2015
Page 1 of 8
1. Identification
Product Name: Hydrated Lime
Synonyms: Chemical Hydrate
Commercial Hydrate
Hyd Chem SS,
Hyd Lime Chem,
Hydrate Tailings,
Hydrated Lime Kiln Dust,
Industrial Hydrate,
Pink Hydrate,
Recommended Uses: Water treatment, steel flux, caustic agent, pH adjustment, acid gas absorption,
construction
Manufacturer: Carmeuse Lime & Stone
US Office
11 Stanwix Street, 21st
Floor
Pittsburgh, PA 15222
Phone: (412) 995-5500
Fax: (412) 995-5594
Canadian Office
PO Box 190
Ingersoll, ON N5C 3K5
Phone: (519) 423-6283
Fax: (519) 423-6545
Emergency Contact: Infotrac: (800) 535-5053 (24 hrs a day, 7 days a week)
2. Hazards Identification
GHS
classification
Physical Hazards
None
Health Hazards
Skin Irritation
Eye Damage
Carcinogenicity
Specific Target Organ Toxicity – Single Exposure
Category 2
Category 1
Category 1A
Category 3
GHS Label
Elements:
Signal Word: Danger
Hazard
Statements:
Causes skin irritation.
Causes serious eye damage.
May cause respiratory irritation.
May cause cancer through inhalation
Safety Data Sheet
Hydrated Lime Revision date:
June 24, 2015
Page 2 of 8
Precautionary
Statements:
Obtain special instructions before use.
Do not handle until all safety precautions have been read and
understood.
Keep container tightly closed
Do not breathe dust.
Wash thoroughly after handling.
Do not eat, drink or smoke when using this product.
Use only outdoors or in well-ventilated area
Wear protective gloves, clothing and eye protection
Pictograms:
3. Composition
Chemical name % by weight CAS#
Calcium hydroxide > 85 1305-62-0
Silica-crystalline quartz < 1 14808-60-7
4. First Aid Measures
Eyes: Immediately flush eyes with generous amounts of water for at least 15 minutes. Pull back
the eyelid to ensure that all lime dust has been washed out. Seek medical attention
immediately. Do not rub eyes.
Skin: Wash exposed area with large amounts of water. Seek medical attention immediately.
Ingestion: Do not induce vomiting. Seek medical attention immediately. Never give anything by
mouth unless instructed to do so by medical personnel.
Inhalation: Move victim to fresh air. Seek medical attention if necessary. If breathing has stopped,
give artificial respiration
Most Important
Symptoms:
Irritation of skin, eyes, gastrointestinal tract or respiratory tract.
Immediate medical attention / special
treatment?
See first aid information above. Note to Physicians: Provide
general supportive measures and treat symptomatically.
5. Fire Fighting Measures
Suitable (and unsuitable)
fire extinguishing media:
Use dry chemical fire extinguisher. Do not use water or halogenated
compounds, except that large amounts of water may be used to deluge small
quantities of this product.
Specific hazards arising
from the product
Inhalation, skin or eye contact, can result in serious injury. This product is
not combustible or flammable. This product is not considered to be an
Safety Data Sheet
Hydrated Lime Revision date:
June 24, 2015
Page 3 of 8
explosion hazard, although reaction with water or other incompatible
materials may rupture containers. When this product is wet, it can be very
slippery and can result in a slip hazard. Hazardous Combustion Products:
None.
Special protective
equipment and
precautions for fire
fighters
Wear full fire-fighting turn-out gear (full Bunker gear), and respiratory
protection (SCBA) to prevent inhalation, skin or eye contact.
6. Accidental Release Measures
Personal precautions, protective equipment, emergency procedures:
Avoid inhalation, eye and skin contact. Avoid generating airborne dust. Wear appropriate
protective clothing as described in section 8.
Methods and materials for containment and clean up:
Utilize cleanup methods that minimize generating dust: vacuum. Avoid dry sweeping. Residue on
surfaces may be removed with copious amount of water or vinegar.
7. Handling & Storage
Safe Handling: Avoid inhalation, skin and eye contact. Avoid generating airborne dust. An eye wash
station should be readily available when this product is handled.
Safe Storage: Keep in tightly closed containers. Protect containers from physical damage. Store in a
cool, dry, and well-ventilated location. Do not store near incompatible materials (see
Section 10 below). Keep away from moisture. Long-term storage in aluminum
containers is not recommended, as calcium oxide may corrode aluminum over long
periods of time
8. Exposure Controls/Personal Protection
Occupational Exposure Limits
OSHA PEL
(mg/m3)
ACGIH TLV
(mg/m3)
Ont. Reg. 833 TWAEV
(mg/m3)
Calcium hydroxide 15 (total)
5 (respirable)
5 5
silica - crystalline quartz 30 / (% silica +2) (total)
10 / (% silica +2)
(respirable)
0.025
(respirable)
0.1
Engineering Controls: Use with adequate general or local exhaust ventilation and to maintain
exposure below occupational exposure limits.
Individual Protection Measures (Personal Protective Equipment):

Safety Data Sheet
Hydrated Lime Revision date:
June 24, 2015
Page 4 of 8
Specific Eye / Face
Protection:
Safety glasses with side shields. In windy conditions, or if work activity
generates elevated airborne dust levels, dust proof or chemical goggles
are recommended. Contact lenses should not be worn.
Specific Skin
Protection:
When there is a risk of skin contact, wear appropriate clothing and
gloves to prevent contact.
Safety Data Sheet
Hydrated Lime Revision date:
June 24, 2015
Page 5 of 8
Specific Respiratory
Protection:
If exposure limits are exceeded, an approved particulate respirator, or
supplied air respirator, appropriate for the airborne concentrations,
should be used. Selection and use of the respiratory protective
equipment must be in accordance with applicable regulations and
good industrial hygiene practices.
Other: An emergency eye wash fountain and shower are recommended.
9. Physical & Chemical Properties
Appearance: White powder
Odor: Odorless
Odor threshold: Not Applicable
pH at 25 degrees C: 12.45
Melting Point: 1076 oF (580
oC)
Boiling Point and range: 5162 oF (2850
oC)
Flash Point: Not Applicable
Evaporation Rate: Not Applicable
Flammability: Not Applicable
Upper/lower flammability or explosive limits Not Applicable
Vapor pressure/density: Non Volatile
Relative density: 2.24
Solubility: Slightly soluble in water: 0.2% @ 0 oC. Soluble in acids, glycerin,
and sugar solutions
Partition coefficient: n-octanol/water Not applicable
Auto-ignition temperature: Not Available
Decomposition temperature: Not available
Viscosity: Not Applicable
10. Stability & Reactivity
Reactivity: Reacts with acids to form calcium salts, releasing heat. Reacts with
carbon dioxide in air to form calcium carbonate. See also
Incompatibility below.
Chemical stability: Stable under normal storage and handling conditions.
Possibility of Hazardous Reactions: See “reactivity” above.
Conditions to avoid: Vicinity of incompatible materials.
Safety Data Sheet
Hydrated Lime Revision date:
June 24, 2015
Page 6 of 8
Incompatibility: This product should not be mixed or stored with the following
materials, due to the potential for violent reaction and release of
heat:
• acids
• reactive fluoridated compounds
• reactive brominated compounds
• reactive powdered metals
• reactive phosphorous compounds
• aluminum powder
• organic acid anhydrides
• nitro-organic compounds
• interhalogenated compounds
Hazardous decomposition products: None
11. Toxicological Information
Likely routes of exposure & symptoms:
Eyes: Contact can cause severe irritation or burning of eyes, including permanent damage.
Skin: Contact can cause severe irritation or burning of skin, especially in the presence of
moisture.
Ingestion: This product can cause severe irritation or burning of gastrointestinal tract if
swallowed.
Inhalation: This product can cause severe irritation of the respiratory system.
Chronic health effects: This product contains trace amounts of crystalline silica. Prolonged or
repeated inhalation of respirable crystalline silica can cause silicosis, as
serious lung disease.
Respiratory or skin
sensitization:
This material is not known to cause sensitization
Germ cell mutagenicity: No data available.
Carcinogenicity: This product is not listed as carcinogenic by OSHA, IARC, NTP, ACGIH, or
the EU Directives. This product may contain trace amounts of crystalline
silica quartz which is listed by IARC as “Carcinogenic to Humans” (Group
1) and “Known to be a Human Carcinogen" by NTP (National Toxicology
Program).
Reproductive toxicity: No Data Available.
Numerical Measures of
Toxicity
Crystalline Silica: Oral Rat LD50 > 22,500 mg/kg
Calcium Hydroxide: Oral (rat) LD50: 7340 mg/kg
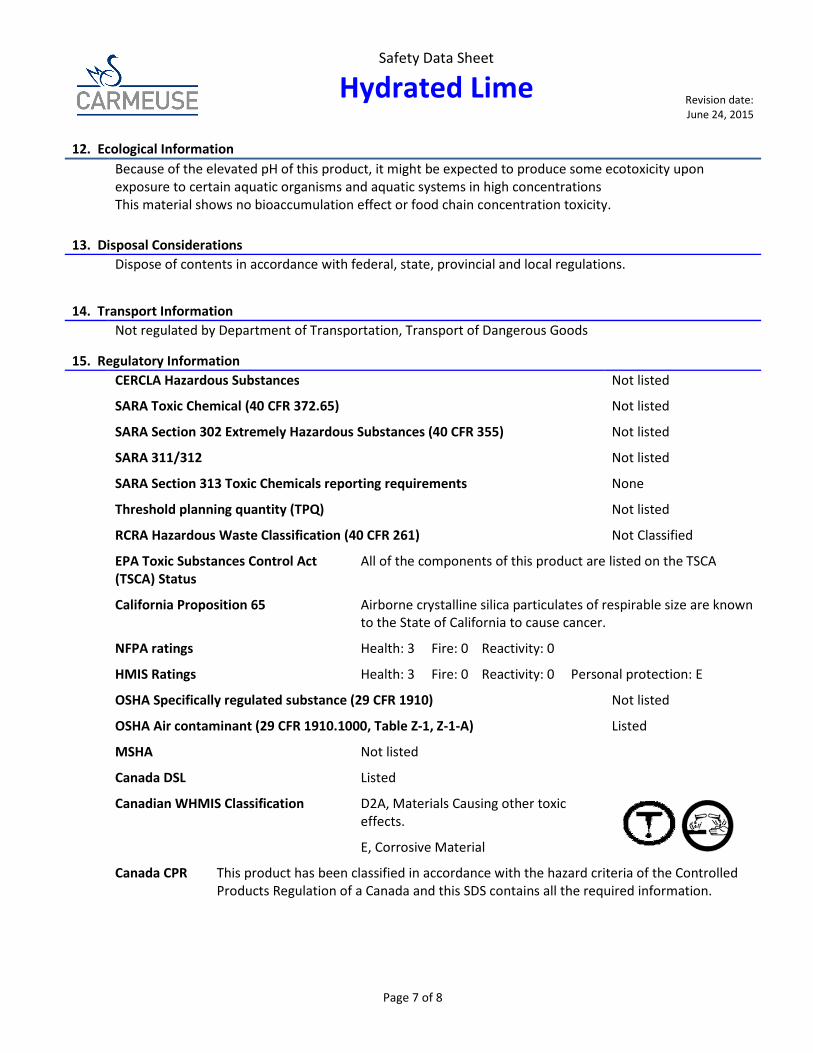
Safety Data Sheet
Hydrated Lime Revision date:
June 24, 2015
Page 7 of 8
12. Ecological Information
Because of the elevated pH of this product, it might be expected to produce some ecotoxicity upon
exposure to certain aquatic organisms and aquatic systems in high concentrations
This material shows no bioaccumulation effect or food chain concentration toxicity.
13. Disposal Considerations
Dispose of contents in accordance with federal, state, provincial and local regulations.
14. Transport Information
Not regulated by Department of Transportation, Transport of Dangerous Goods
15. Regulatory Information
CERCLA Hazardous Substances Not listed
SARA Toxic Chemical (40 CFR 372.65) Not listed
SARA Section 302 Extremely Hazardous Substances (40 CFR 355) Not listed
SARA 311/312 Not listed
SARA Section 313 Toxic Chemicals reporting requirements None
Threshold planning quantity (TPQ) Not listed
RCRA Hazardous Waste Classification (40 CFR 261) Not Classified
EPA Toxic Substances Control Act
(TSCA) Status
All of the components of this product are listed on the TSCA
California Proposition 65 Airborne crystalline silica particulates of respirable size are known
to the State of California to cause cancer.
NFPA ratings Health: 3 Fire: 0 Reactivity: 0
HMIS Ratings Health: 3 Fire: 0 Reactivity: 0 Personal protection: E
OSHA Specifically regulated substance (29 CFR 1910) Not listed
OSHA Air contaminant (29 CFR 1910.1000, Table Z-1, Z-1-A) Listed
MSHA Not listed
Canada DSL Listed
Canadian WHMIS Classification D2A, Materials Causing other toxic
effects.
E, Corrosive Material
Canada CPR This product has been classified in accordance with the hazard criteria of the Controlled
Products Regulation of a Canada and this SDS contains all the required information.
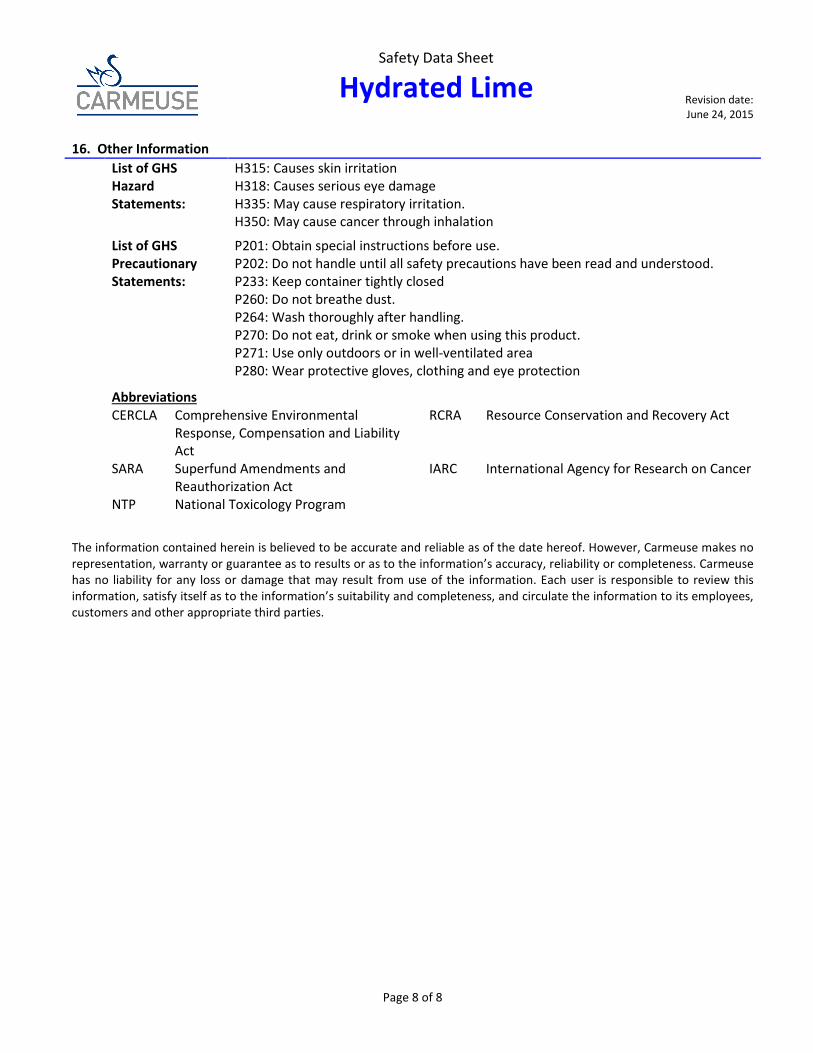
Safety Data Sheet
Hydrated Lime Revision date:
June 24, 2015
Page 8 of 8
16. Other Information
List of GHS
Hazard
Statements:
H315: Causes skin irritation
H318: Causes serious eye damage
H335: May cause respiratory irritation.
H350: May cause cancer through inhalation
List of GHS
Precautionary
Statements:
P201: Obtain special instructions before use.
P202: Do not handle until all safety precautions have been read and understood.
P233: Keep container tightly closed
P260: Do not breathe dust.
P264: Wash thoroughly after handling.
P270: Do not eat, drink or smoke when using this product.
P271: Use only outdoors or in well-ventilated area
P280: Wear protective gloves, clothing and eye protection
Abbreviations
CERCLA Comprehensive Environmental
Response, Compensation and Liability
Act
RCRA Resource Conservation and Recovery Act
SARA Superfund Amendments and
Reauthorization Act
IARC International Agency for Research on Cancer
NTP National Toxicology Program
The information contained herein is believed to be accurate and reliable as of the date hereof. However, Carmeuse makes no
representation, warranty or guarantee as to results or as to the information’s accuracy, reliability or completeness. Carmeuse
has no liability for any loss or damage that may result from use of the information. Each user is responsible to review this
information, satisfy itself as to the information’s suitability and completeness, and circulate the information to its employees,
customers and other appropriate third parties.
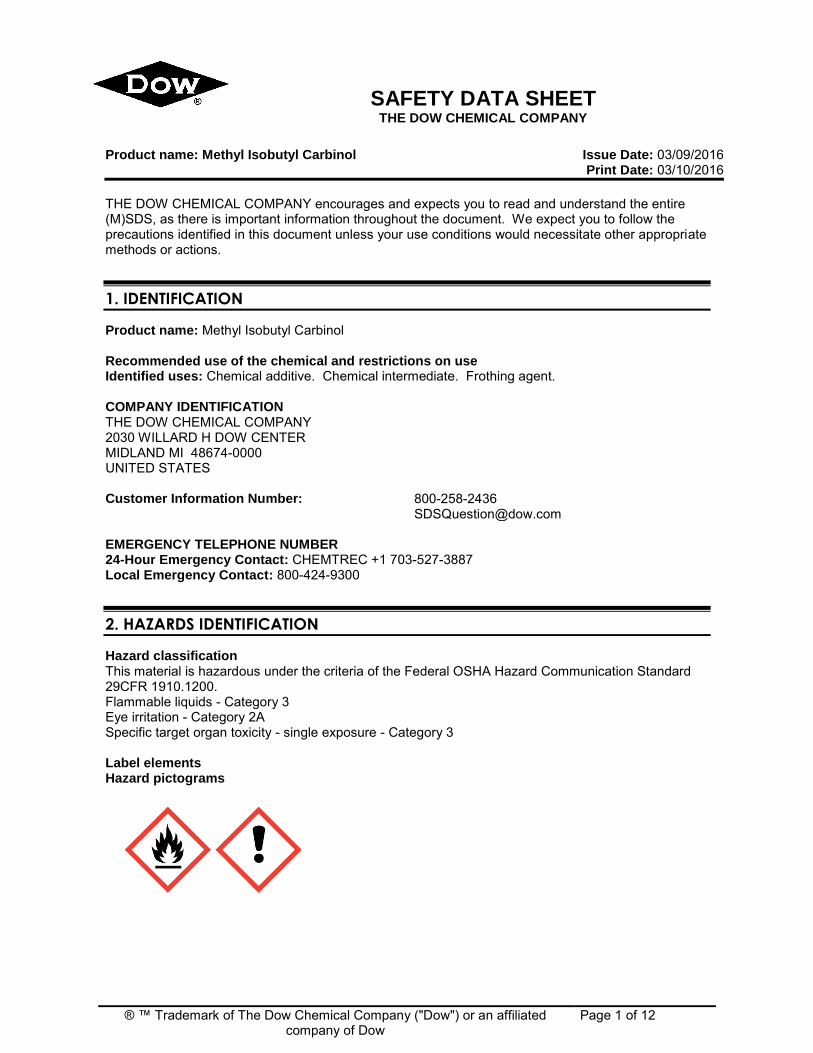
® ™ Trademark of The Dow Chemical Company ("Dow") or an affiliated company of Dow
Page 1 of 12
SAFETY DATA SHEET THE DOW CHEMICAL COMPANY
Product name: Methyl Isobutyl Carbinol Issue Date: 03/09/2016 Print Date: 03/10/2016
THE DOW CHEMICAL COMPANY encourages and expects you to read and understand the entire (M)SDS, as there is important information throughout the document. We expect you to follow the precautions identified in this document unless your use conditions would necessitate other appropriate methods or actions.
1. IDENTIFICATION
Product name: Methyl Isobutyl Carbinol Recommended use of the chemical and restrictions on use Identified uses: Chemical additive. Chemical intermediate. Frothing agent. COMPANY IDENTIFICATION THE DOW CHEMICAL COMPANY 2030 WILLARD H DOW CENTER MIDLAND MI 48674-0000 UNITED STATES Customer Information Number: 800-258-2436
[email protected] EMERGENCY TELEPHONE NUMBER 24-Hour Emergency Contact: CHEMTREC +1 703-527-3887 Local Emergency Contact: 800-424-9300
2. HAZARDS IDENTIFICATION
Hazard classification This material is hazardous under the criteria of the Federal OSHA Hazard Communication Standard 29CFR 1910.1200. Flammable liquids - Category 3 Eye irritation - Category 2A Specific target organ toxicity - single exposure - Category 3 Label elements Hazard pictograms
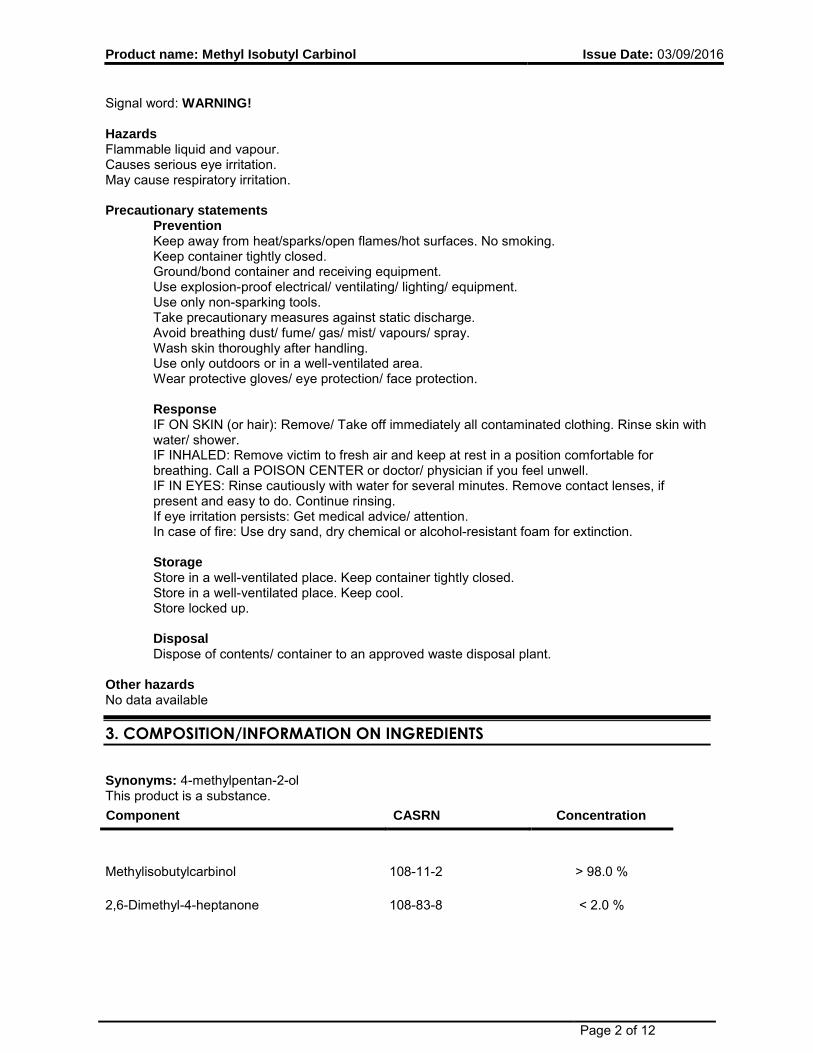
Product name: Methyl Isobutyl Carbinol Issue Date: 03/09/2016
Page 2 of 12
Signal word: WARNING! Hazards Flammable liquid and vapour. Causes serious eye irritation. May cause respiratory irritation. Precautionary statements
Prevention Keep away from heat/sparks/open flames/hot surfaces. No smoking. Keep container tightly closed. Ground/bond container and receiving equipment. Use explosion-proof electrical/ ventilating/ lighting/ equipment. Use only non-sparking tools. Take precautionary measures against static discharge. Avoid breathing dust/ fume/ gas/ mist/ vapours/ spray. Wash skin thoroughly after handling. Use only outdoors or in a well-ventilated area. Wear protective gloves/ eye protection/ face protection. Response IF ON SKIN (or hair): Remove/ Take off immediately all contaminated clothing. Rinse skin with water/ shower. IF INHALED: Remove victim to fresh air and keep at rest in a position comfortable for breathing. Call a POISON CENTER or doctor/ physician if you feel unwell. IF IN EYES: Rinse cautiously with water for several minutes. Remove contact lenses, if present and easy to do. Continue rinsing. If eye irritation persists: Get medical advice/ attention. In case of fire: Use dry sand, dry chemical or alcohol-resistant foam for extinction. Storage Store in a well-ventilated place. Keep container tightly closed. Store in a well-ventilated place. Keep cool. Store locked up. Disposal Dispose of contents/ container to an approved waste disposal plant.
Other hazards No data available
3. COMPOSITION/INFORMATION ON INGREDIENTS
Synonyms: 4-methylpentan-2-ol This product is a substance. Component CASRN Concentration
Methylisobutylcarbinol 108-11-2 > 98.0 % 2,6-Dimethyl-4-heptanone 108-83-8 < 2.0 %
Product name: Methyl Isobutyl Carbinol Issue Date: 03/09/2016
Page 3 of 12
Methyl isobutyl ketone 108-10-1 < 1.0 %
4. FIRST AID MEASURES
Description of first aid measures General advice: First Aid responders should pay attention to self-protection and use the recommended protective clothing (chemical resistant gloves, splash protection). If potential for exposure exists refer to Section 8 for specific personal protective equipment. Inhalation: Move person to fresh air. If not breathing, give artificial respiration; if by mouth to mouth use rescuer protection (pocket mask, etc). If breathing is difficult, oxygen should be administered by qualified personnel. Call a physician or transport to a medical facility. Skin contact: Wash off with plenty of water. Eye contact: Immediately flush eyes with water; remove contact lenses, if present, after the first 5 minutes, then continue flushing eyes for at least 15 minutes. Obtain medical attention without delay, preferably from an ophthalmologist. Suitable emergency eye wash facility should be immediately available. Ingestion: Do not induce vomiting. Call a physician and/or transport to emergency facility immediately. Most important symptoms and effects, both acute and delayed: Aside from the information found under Description of first aid measures (above) and Indication of immediate medical attention and special treatment needed (below), any additional important symptoms and effects are described in Section 11: Toxicology Information. Indication of any immediate medical attention and special treatment needed Notes to physician: Repeated excessive exposure may aggravate preexisting lung disease. Skin contact may aggravate preexisting dermatitis. Maintain adequate ventilation and oxygenation of the patient. May cause asthma-like (reactive airways) symptoms. Bronchodilators, expectorants, antitussives and corticosteroids may be of help. If lavage is performed, suggest endotracheal and/or esophageal control. Danger from lung aspiration must be weighed against toxicity when considering emptying the stomach. The decision of whether to induce vomiting or not should be made by a physician. No specific antidote. Treatment of exposure should be directed at the control of symptoms and the clinical condition of the patient.
5. FIREFIGHTING MEASURES
Suitable extinguishing media: Water fog or fine spray. Dry chemical fire extinguishers. Carbon dioxide fire extinguishers. Foam. Alcohol resistant foams (ATC type) are preferred. General purpose synthetic foams (including AFFF) or protein foams may function, but will be less effective. Unsuitable extinguishing media: No data available Special hazards arising from the substance or mixture Hazardous combustion products: During a fire, smoke may contain the original material in addition to combustion products of varying composition which may be toxic and/or irritating. Combustion products may include and are not limited to: Carbon monoxide. Carbon dioxide.
Product name: Methyl Isobutyl Carbinol Issue Date: 03/09/2016
Page 4 of 12
Unusual Fire and Explosion Hazards: Violent steam generation or eruption may occur upon application of direct water stream to hot liquids. Vapors are heavier than air and may travel a long distance and accumulate in low lying areas. Ignition and/or flash back may occur. Advice for firefighters Fire Fighting Procedures: Keep people away. Isolate fire and deny unnecessary entry. Stay upwind. Keep out of low areas where gases (fumes) can accumulate. Use water spray to cool fire exposed containers and fire affected zone until fire is out and danger of reignition has passed. Do not use direct water stream. May spread fire. Eliminate ignition sources. Burning liquids may be moved by flushing with water to protect personnel and minimize property damage. Avoid accumulation of water. Product may be carried across water surface spreading fire or contacting an ignition source. Special protective equipment for firefighters: Wear positive-pressure self-contained breathing apparatus (SCBA) and protective fire fighting clothing (includes fire fighting helmet, coat, trousers, boots, and gloves). If protective equipment is not available or not used, fight fire from a protected location or safe distance.
6. ACCIDENTAL RELEASE MEASURES
Personal precautions, protective equipment and emergency procedures: Eliminate all sources of ignition in vicinity of spill or released vapor to avoid fire or explosion. Vapor explosion hazard. Keep out of sewers. Isolate area. Refer to section 7, Handling, for additional precautionary measures. Keep unnecessary and unprotected personnel from entering the area. Keep personnel out of low areas. Keep upwind of spill. Ventilate area of leak or spill. No smoking in area. Eliminate all sources of ignition in vicinity of spill or released vapor to avoid fire or explosion. Ground and bond all containers and handling equipment. Use appropriate safety equipment. For additional information, refer to Section 8, Exposure Controls and Personal Protection. Environmental precautions: Prevent from entering into soil, ditches, sewers, waterways and/or groundwater. See Section 12, Ecological Information. Methods and materials for containment and cleaning up: Small spills: Absorb with materials such as: Sand. Vermiculite. Large spills: Contain spilled material if possible. Collect in suitable and properly labeled containers. Pump with explosion-proof equipment. If available, use foam to smother or suppress. See Section 13, Disposal Considerations, for additional information. Removal of ignition sources: Keep away from sources of ignition. Dust Control: Not applicable
7. HANDLING AND STORAGE
Precautions for safe handling: Use of non-sparking or explosion-proof equipment may be necessary, depending upon the type of operation. Keep away from heat, sparks and flame. Avoid contact with eyes. Avoid breathing vapor. No smoking, open flames or sources of ignition in handling and storage area. Vapors are heavier than air and may travel a long distance and accumulate in low lying areas. Ignition and/or flash back may occur. Containers, even those that have been emptied, can contain vapors. Do not cut, drill, grind, weld, or perform similar operations on or near empty containers. Electrically ground and bond all
Product name: Methyl Isobutyl Carbinol Issue Date: 03/09/2016
Page 5 of 12
equipment. See Section 8, EXPOSURE CONTROLS AND PERSONAL PROTECTION. Wash thoroughly after handling. Keep container closed. Use with adequate ventilation. Conditions for safe storage: Minimize sources of ignition, such as static build-up, heat, spark or flame.
8. EXPOSURE CONTROLS/PERSONAL PROTECTION
Control parameters Exposure limits are listed below, if they exist. Component Regulation Type of listing Value/Notation Methylisobutylcarbinol ACGIH TWA 25 ppm ACGIH STEL 40 ppm ACGIH TWA SKIN OSHA Z-1 TWA 100 mg/m3 25 ppm ACGIH STEL SKIN OSHA Z-1 TWA SKIN 2,6-Dimethyl-4-heptanone Dow IHG TWA 25 ppm Dow IHG STEL 35 ppm ACGIH TWA 25 ppm OSHA Z-1 TWA 290 mg/m3 50 ppm OSHA P0 TWA 150 mg/m3 25 ppm Methyl isobutyl ketone ACGIH TWA 20 ppm ACGIH STEL 75 ppm OSHA Z-1 TWA 410 mg/m3 100 ppm ACGIH TWA BEI ACGIH STEL BEI Exposure controls Engineering controls: Use engineering controls to maintain airborne level below exposure limit requirements or guidelines. If there are no applicable exposure limit requirements or guidelines, use only with adequate ventilation. Local exhaust ventilation may be necessary for some operations. Individual protection measures
Eye/face protection: Use chemical goggles. If exposure causes eye discomfort, use a full-face respirator. Skin protection
Hand protection: Use gloves chemically resistant to this material. Examples of preferred glove barrier materials include: Butyl rubber. Chlorinated polyethylene. Natural rubber ("latex"). Neoprene. Polyethylene. Ethyl vinyl alcohol laminate ("EVAL"). Polyvinyl chloride ("PVC" or "vinyl"). Examples of acceptable glove barrier materials include: Nitrile/butadiene rubber ("nitrile" or "NBR"). Polyvinyl alcohol ("PVA"). Viton. NOTICE: The selection of a specific glove for a particular application and duration of use in a workplace should also take into account all relevant workplace factors such as, but not limited to: Other chemicals which may be handled, physical requirements (cut/puncture protection, dexterity, thermal protection), potential body reactions to glove materials, as well as the instructions/specifications provided by the glove supplier. Other protection: Use protective clothing chemically resistant to this material. Selection of specific items such as face shield, boots, apron, or full body suit will depend on the task.
Respiratory protection: Respiratory protection should be worn when there is a potential to exceed the exposure limit requirements or guidelines. If there are no applicable exposure limit
Product name: Methyl Isobutyl Carbinol Issue Date: 03/09/2016
Page 6 of 12
requirements or guidelines, use an approved respirator. Selection of air-purifying or positive-pressure supplied-air will depend on the specific operation and the potential airborne concentration of the material. For emergency conditions, use an approved positive-pressure self-contained breathing apparatus. The following should be effective types of air-purifying respirators: Organic vapor cartridge.
9. PHYSICAL AND CHEMICAL PROPERTIES
Appearance Physical state Liquid. Color Colorless
Odor Mild Odor Threshold No test data available pH No test data available Melting point/range Not applicable to liquids Freezing point -90 °C ( -130 °F) Literature Boiling point (760 mmHg) 132 °C ( 270 °F) Literature Flash point 40.56 °C ( 105.01 °F) open cup Evaporation Rate (Butyl Acetate = 1)
0.43 Literature
Flammability (solid, gas) Not applicable to liquids Lower explosion limit 1.0 % vol Literature Upper explosion limit 5.5 % vol Literature Vapor Pressure No data available Relative Vapor Density (air = 1) 3.5 Literature Relative Density (water = 1) 0.807 at 20 °C (68 °F) / 20 °C Literature Water solubility 1.7 % at 20 °C (68 °F) Literature Partition coefficient: n-octanol/water
log Pow: 1.57 estimated
Auto-ignition temperature 335 °C (635 °F) at 1,013 hPa Literature Decomposition temperature No test data available Dynamic Viscosity 5.2 mPa.s at 20 °C (68 °F) Literature Kinematic Viscosity 6.4 mm2/s at 20 °C (68 °F) Literature Explosive properties Not explosive Oxidizing properties No Molecular weight No data available Molecular formula (CH3)2CHCH2CH(OH)CH3 NOTE: The physical data presented above are typical values and should not be construed as a specification.
10. STABILITY AND REACTIVITY
Reactivity: No data available
Product name: Methyl Isobutyl Carbinol Issue Date: 03/09/2016
Page 7 of 12
Chemical stability: Thermally stable at recommended temperatures and pressures. Possibility of hazardous reactions: Polymerization will not occur. Conditions to avoid: Exposure to elevated temperatures can cause product to decompose. Incompatible materials: Avoid contact with: Acid chlorides. Acids. Oxidizers. Hazardous decomposition products: Decomposition products depend upon temperature, air supply and the presence of other materials.
11. TOXICOLOGICAL INFORMATION
Toxicological information appears in this section when such data is available. Acute toxicity
Acute oral toxicity Low toxicity if swallowed. Small amounts swallowed incidentally as a result of normal handling operations are not likely to cause injury; however, swallowing larger amounts may cause injury. LD50, Rat, 2,590 mg/kg OECD 401 or equivalent Acute dermal toxicity Prolonged skin contact is unlikely to result in absorption of harmful amounts. LD50, Rabbit, 2,870 mg/kg OECD 402 or equivalent Acute inhalation toxicity Prolonged excessive exposure may cause adverse effects. Excessive exposure may cause irritation to upper respiratory tract (nose and throat) and lungs. Symptoms of excessive exposure may be anesthetic or narcotic effects; dizziness and drowsiness may be observed. LC50, Rat, male and female, 4 Hour, vapour, > 16 mg/l
Skin corrosion/irritation Brief contact may cause slight skin irritation with local redness. May cause drying and flaking of the skin. Serious eye damage/eye irritation May cause moderate eye irritation. May cause moderate corneal injury. Vapor may cause eye irritation experienced as mild discomfort and redness. Sensitization Did not cause allergic skin reactions when tested in guinea pigs. For respiratory sensitization: No relevant data found. Specific Target Organ Systemic Toxicity (Single Exposure)
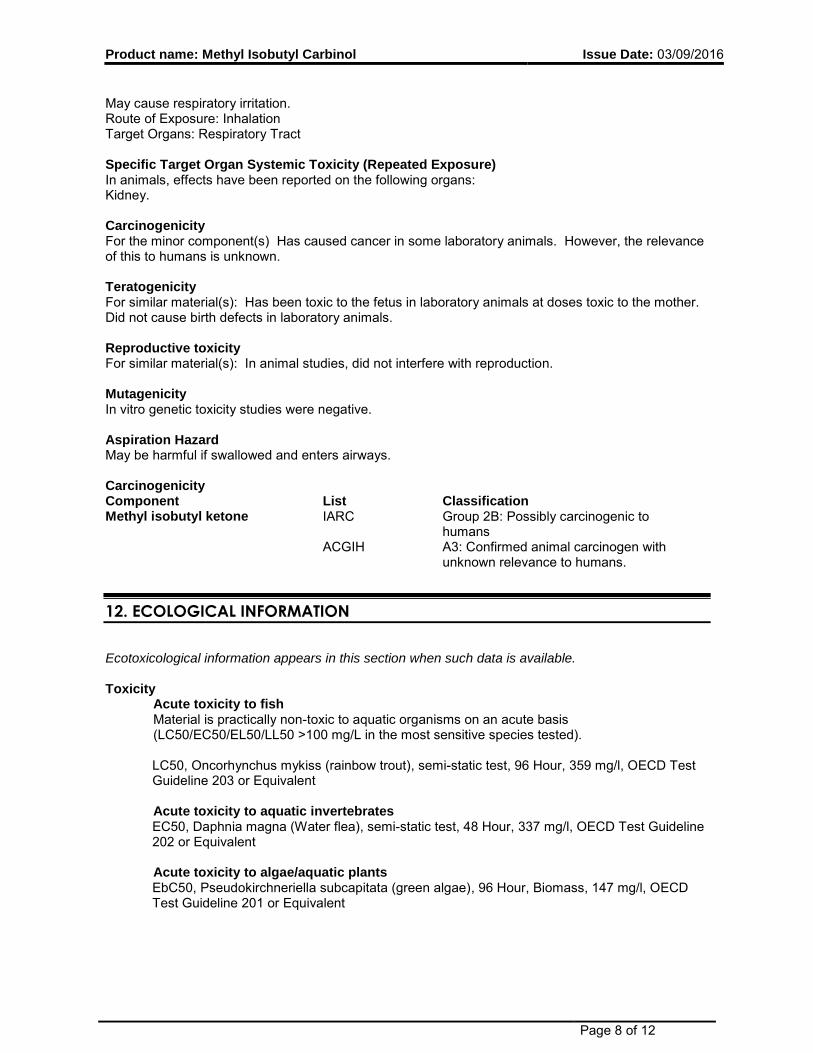
Product name: Methyl Isobutyl Carbinol Issue Date: 03/09/2016
Page 8 of 12
May cause respiratory irritation. Route of Exposure: Inhalation Target Organs: Respiratory Tract Specific Target Organ Systemic Toxicity (Repeated Exposure) In animals, effects have been reported on the following organs: Kidney. Carcinogenicity For the minor component(s) Has caused cancer in some laboratory animals. However, the relevance of this to humans is unknown. Teratogenicity For similar material(s): Has been toxic to the fetus in laboratory animals at doses toxic to the mother. Did not cause birth defects in laboratory animals. Reproductive toxicity For similar material(s): In animal studies, did not interfere with reproduction. Mutagenicity In vitro genetic toxicity studies were negative. Aspiration Hazard May be harmful if swallowed and enters airways. Carcinogenicity Component List Classification Methyl isobutyl ketone IARC Group 2B: Possibly carcinogenic to
humans ACGIH A3: Confirmed animal carcinogen with
unknown relevance to humans.
12. ECOLOGICAL INFORMATION
Ecotoxicological information appears in this section when such data is available. Toxicity
Acute toxicity to fish Material is practically non-toxic to aquatic organisms on an acute basis (LC50/EC50/EL50/LL50 >100 mg/L in the most sensitive species tested). LC50, Oncorhynchus mykiss (rainbow trout), semi-static test, 96 Hour, 359 mg/l, OECD Test Guideline 203 or Equivalent Acute toxicity to aquatic invertebrates EC50, Daphnia magna (Water flea), semi-static test, 48 Hour, 337 mg/l, OECD Test Guideline 202 or Equivalent Acute toxicity to algae/aquatic plants EbC50, Pseudokirchneriella subcapitata (green algae), 96 Hour, Biomass, 147 mg/l, OECD Test Guideline 201 or Equivalent
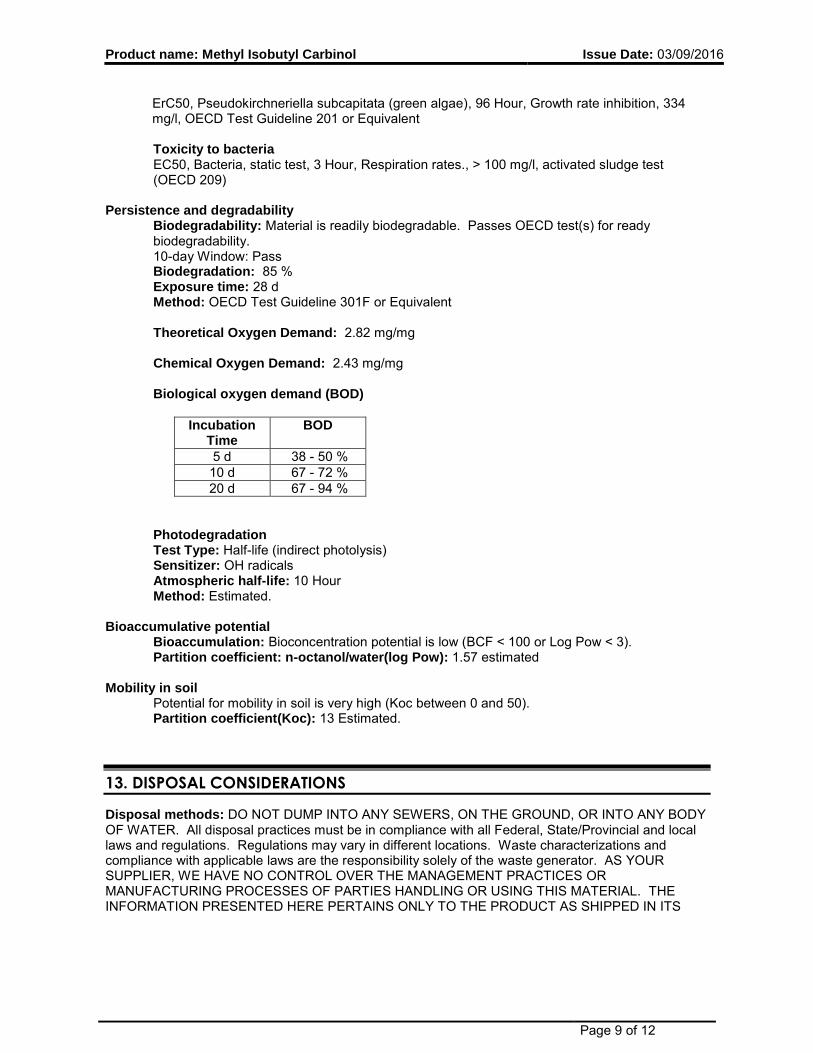
Product name: Methyl Isobutyl Carbinol Issue Date: 03/09/2016
Page 9 of 12
ErC50, Pseudokirchneriella subcapitata (green algae), 96 Hour, Growth rate inhibition, 334 mg/l, OECD Test Guideline 201 or Equivalent Toxicity to bacteria EC50, Bacteria, static test, 3 Hour, Respiration rates., > 100 mg/l, activated sludge test (OECD 209)
Persistence and degradability
Biodegradability: Material is readily biodegradable. Passes OECD test(s) for ready biodegradability. 10-day Window: Pass Biodegradation: 85 % Exposure time: 28 d Method: OECD Test Guideline 301F or Equivalent Theoretical Oxygen Demand: 2.82 mg/mg Chemical Oxygen Demand: 2.43 mg/mg Biological oxygen demand (BOD)
Incubation Time
BOD
5 d 38 - 50 % 10 d 67 - 72 % 20 d 67 - 94 %
Photodegradation Test Type: Half-life (indirect photolysis) Sensitizer: OH radicals Atmospheric half-life: 10 Hour Method: Estimated.
Bioaccumulative potential
Bioaccumulation: Bioconcentration potential is low (BCF < 100 or Log Pow < 3). Partition coefficient: n-octanol/water(log Pow): 1.57 estimated
Mobility in soil
Potential for mobility in soil is very high (Koc between 0 and 50). Partition coefficient(Koc): 13 Estimated.
13. DISPOSAL CONSIDERATIONS
Disposal methods: DO NOT DUMP INTO ANY SEWERS, ON THE GROUND, OR INTO ANY BODY OF WATER. All disposal practices must be in compliance with all Federal, State/Provincial and local laws and regulations. Regulations may vary in different locations. Waste characterizations and compliance with applicable laws are the responsibility solely of the waste generator. AS YOUR SUPPLIER, WE HAVE NO CONTROL OVER THE MANAGEMENT PRACTICES OR MANUFACTURING PROCESSES OF PARTIES HANDLING OR USING THIS MATERIAL. THE INFORMATION PRESENTED HERE PERTAINS ONLY TO THE PRODUCT AS SHIPPED IN ITS
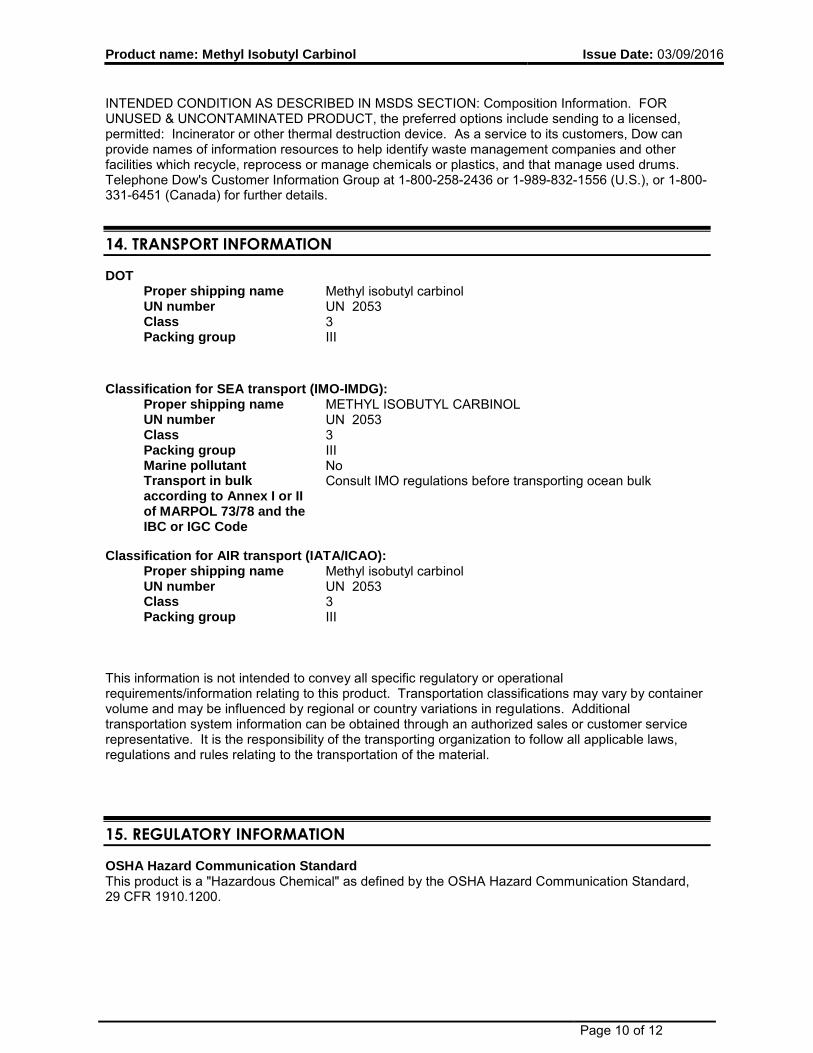
Product name: Methyl Isobutyl Carbinol Issue Date: 03/09/2016
Page 10 of 12
INTENDED CONDITION AS DESCRIBED IN MSDS SECTION: Composition Information. FOR UNUSED & UNCONTAMINATED PRODUCT, the preferred options include sending to a licensed, permitted: Incinerator or other thermal destruction device. As a service to its customers, Dow can provide names of information resources to help identify waste management companies and other facilities which recycle, reprocess or manage chemicals or plastics, and that manage used drums. Telephone Dow's Customer Information Group at 1-800-258-2436 or 1-989-832-1556 (U.S.), or 1-800-331-6451 (Canada) for further details.
14. TRANSPORT INFORMATION
DOT Proper shipping name Methyl isobutyl carbinol UN number UN 2053 Class 3 Packing group III
Classification for SEA transport (IMO-IMDG):
Proper shipping name METHYL ISOBUTYL CARBINOL UN number UN 2053 Class 3 Packing group III Marine pollutant No Transport in bulk according to Annex I or II of MARPOL 73/78 and the IBC or IGC Code
Consult IMO regulations before transporting ocean bulk
Classification for AIR transport (IATA/ICAO):
Proper shipping name Methyl isobutyl carbinol UN number UN 2053 Class 3 Packing group III
This information is not intended to convey all specific regulatory or operational requirements/information relating to this product. Transportation classifications may vary by container volume and may be influenced by regional or country variations in regulations. Additional transportation system information can be obtained through an authorized sales or customer service representative. It is the responsibility of the transporting organization to follow all applicable laws, regulations and rules relating to the transportation of the material.
15. REGULATORY INFORMATION
OSHA Hazard Communication Standard This product is a "Hazardous Chemical" as defined by the OSHA Hazard Communication Standard, 29 CFR 1910.1200.
Product name: Methyl Isobutyl Carbinol Issue Date: 03/09/2016
Page 11 of 12
Superfund Amendments and Reauthorization Act of 1986 Title III (Emergency Planning and Community Right-to-Know Act of 1986) Sections 311 and 312 Fire Hazard Acute Health Hazard Chronic Health Hazard Superfund Amendments and Reauthorization Act of 1986 Title III (Emergency Planning and Community Right-to-Know Act of 1986) Section 313 This material does not contain any chemical components with known CAS numbers that exceed the threshold (De Minimis) reporting levels established by SARA Title III, Section 313. Pennsylvania Worker and Community Right-To-Know Act: The following product components are cited in the Pennsylvania Hazardous Substance List and/or the Pennsylvania Environmental Substance List, and are present at levels which require reporting. Components CASRN Methylisobutylcarbinol 108-11-2 2,6-Dimethyl-4-heptanone 108-83-8 California Proposition 65 (Safe Drinking Water and Toxic Enforcement Act of 1986) WARNING: This product contains a chemical(s) known to the State of California to cause cancer. Components CASRN Methyl isobutyl ketone 108-10-1 United States TSCA Inventory (TSCA) All components of this product are in compliance with the inventory listing requirements of the U.S. Toxic Substances Control Act (TSCA) Chemical Substance Inventory.
16. OTHER INFORMATION
Hazard Rating System NFPA
Health Fire Reactivity 1 2 0
Revision Identification Number: 101234033 / A001 / Issue Date: 03/09/2016 / Version: 7.1 Most recent revision(s) are noted by the bold, double bars in left-hand margin throughout this document. Legend ACGIH USA. ACGIH Threshold Limit Values (TLV) BEI Biological Exposure Indices Dow IHG Dow Industrial Hygiene Guideline OSHA P0 USA. OSHA - TABLE Z-1 Limits for Air Contaminants - 1910.1000 OSHA Z-1 USA. Occupational Exposure Limits (OSHA) - Table Z-1 Limits for Air
Contaminants SKIN Absorbed via skin
Product name: Methyl Isobutyl Carbinol Issue Date: 03/09/2016
Page 12 of 12
STEL Short term exposure limit TWA Time weighted average Information Source and References This SDS is prepared by Product Regulatory Services and Hazard Communications Groups from information supplied by internal references within our company. THE DOW CHEMICAL COMPANY urges each customer or recipient of this (M)SDS to study it carefully and consult appropriate expertise, as necessary or appropriate, to become aware of and understand the data contained in this (M)SDS and any hazards associated with the product. The information herein is provided in good faith and believed to be accurate as of the effective date shown above. However, no warranty, express or implied, is given. Regulatory requirements are subject to change and may differ between various locations. It is the buyer's/user's responsibility to ensure that his activities comply with all federal, state, provincial or local laws. The information presented here pertains only to the product as shipped. Since conditions for use of the product are not under the control of the manufacturer, it is the buyer's/user's duty to determine the conditions necessary for the safe use of this product. Due to the proliferation of sources for information such as manufacturer-specific (M)SDSs, we are not and cannot be responsible for (M)SDSs obtained from any source other than ourselves. If you have obtained an (M)SDS from another source or if you are not sure that the (M)SDS you have is current, please contact us for the most current version.
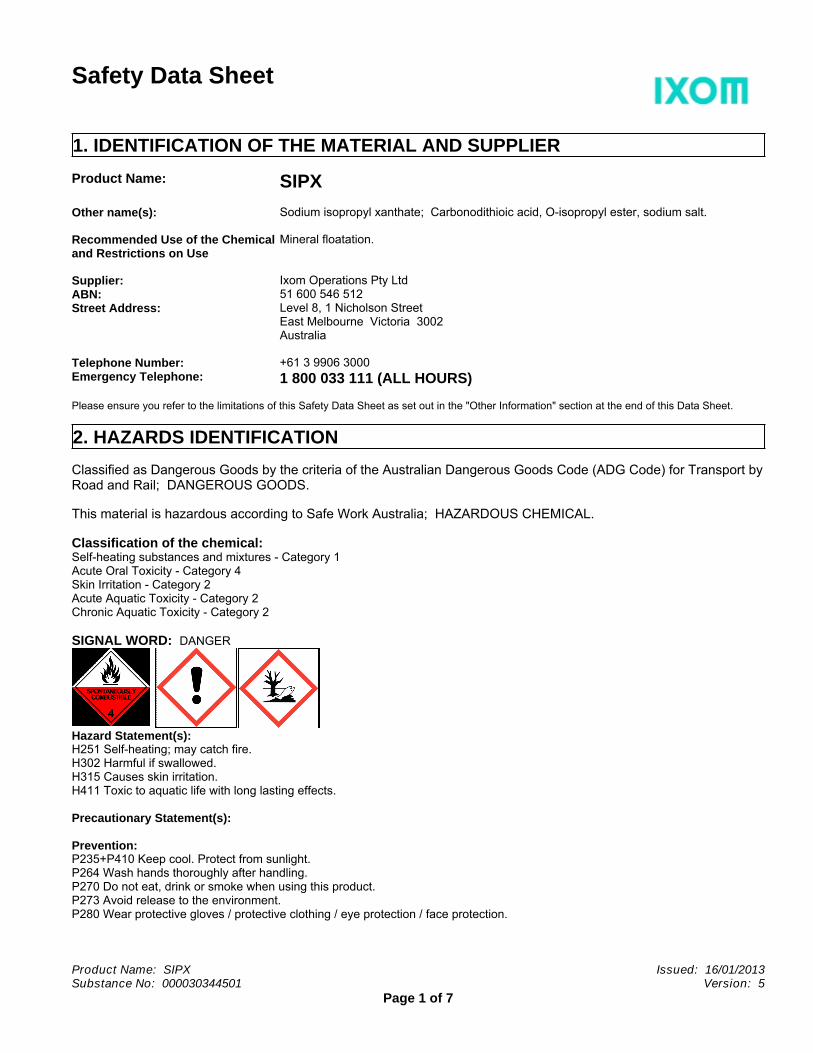
Safety Data Sheet
1. IDENTIFICATION OF THE MATERIAL AND SUPPLIERProduct Name: SIPXOther name(s): Sodium isopropyl xanthate; Carbonodithioic acid, O-isopropyl ester, sodium salt.
Recommended Use of the Chemicaland Restrictions on Use
Mineral floatation.
Supplier: Ixom Operations Pty LtdABN: 51 600 546 512Street Address: Level 8, 1 Nicholson Street
East Melbourne Victoria 3002Australia
Telephone Number: +61 3 9906 3000Emergency Telephone: 1 800 033 111 (ALL HOURS)
Please ensure you refer to the limitations of this Safety Data Sheet as set out in the "Other Information" section at the end of this Data Sheet.
2. HAZARDS IDENTIFICATIONClassified as Dangerous Goods by the criteria of the Australian Dangerous Goods Code (ADG Code) for Transport byRoad and Rail; DANGEROUS GOODS.
This material is hazardous according to Safe Work Australia; HAZARDOUS CHEMICAL.
Classification of the chemical:Self-heating substances and mixtures - Category 1Acute Oral Toxicity - Category 4Skin Irritation - Category 2Acute Aquatic Toxicity - Category 2Chronic Aquatic Toxicity - Category 2
SIGNAL WORD: DANGER
Product Name: SIPX
Hazard Statement(s):H251 Self-heating; may catch fire.H302 Harmful if swallowed.H315 Causes skin irritation.H411 Toxic to aquatic life with long lasting effects.
Issued: 16/01/2013Substance No: 000030344501
Precautionary Statement(s):
Prevention:P235+P410 Keep cool. Protect from sunlight.P264 Wash hands thoroughly after handling.P270 Do not eat, drink or smoke when using this product.P273 Avoid release to the environment.P280 Wear protective gloves / protective clothing / eye protection / face protection.
Version: 5Page 1 of 7
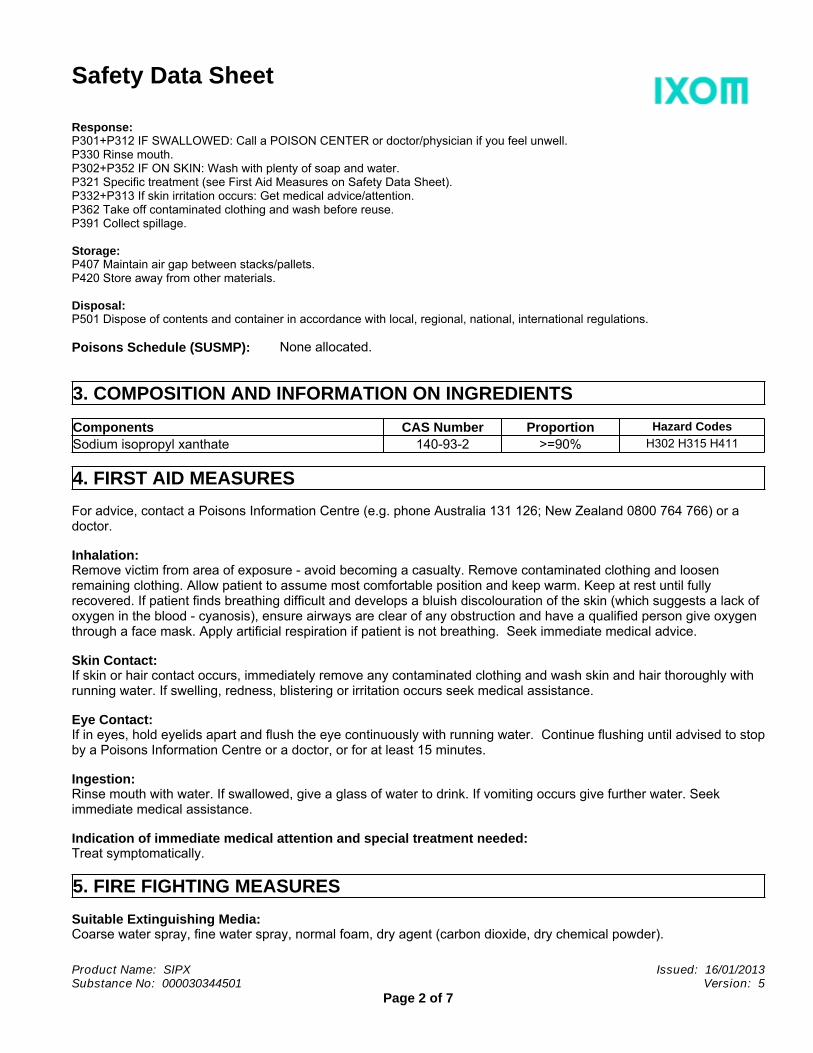
Safety Data Sheet
Response:P301+P312 IF SWALLOWED: Call a POISON CENTER or doctor/physician if you feel unwell.P330 Rinse mouth.P302+P352 IF ON SKIN: Wash with plenty of soap and water.P321 Specific treatment (see First Aid Measures on Safety Data Sheet).P332+P313 If skin irritation occurs: Get medical advice/attention.P362 Take off contaminated clothing and wash before reuse.P391 Collect spillage.
Storage:P407 Maintain air gap between stacks/pallets.P420 Store away from other materials.
Disposal:P501 Dispose of contents and container in accordance with local, regional, national, international regulations.
Poisons Schedule (SUSMP): None allocated.
3. COMPOSITION AND INFORMATION ON INGREDIENTSComponents CAS Number Proportion Hazard CodesSodium isopropyl xanthate 140-93-2 >=90% H302 H315 H411
4. FIRST AID MEASURESFor advice, contact a Poisons Information Centre (e.g. phone Australia 131 126; New Zealand 0800 764 766) or adoctor.
Inhalation:Remove victim from area of exposure - avoid becoming a casualty. Remove contaminated clothing and loosenremaining clothing. Allow patient to assume most comfortable position and keep warm. Keep at rest until fullyrecovered. If patient finds breathing difficult and develops a bluish discolouration of the skin (which suggests a lack ofoxygen in the blood - cyanosis), ensure airways are clear of any obstruction and have a qualified person give oxygenthrough a face mask. Apply artificial respiration if patient is not breathing. Seek immediate medical advice.
Skin Contact:If skin or hair contact occurs, immediately remove any contaminated clothing and wash skin and hair thoroughly withrunning water. If swelling, redness, blistering or irritation occurs seek medical assistance.
Eye Contact:If in eyes, hold eyelids apart and flush the eye continuously with running water. Continue flushing until advised to stopby a Poisons Information Centre or a doctor, or for at least 15 minutes.
Ingestion:Rinse mouth with water. If swallowed, give a glass of water to drink. If vomiting occurs give further water. Seekimmediate medical assistance.
Product Name: SIPX Issued: 16/01/2013
Indication of immediate medical attention and special treatment needed:Treat symptomatically.
Substance No: 000030344501
5. FIRE FIGHTING MEASURES
Version: 5Page 2 of 7
Suitable Extinguishing Media:Coarse water spray, fine water spray, normal foam, dry agent (carbon dioxide, dry chemical powder).
Safety Data Sheet
Hazchem or Emergency Action Code: 1Y
Specific hazards arising from the chemical:Substance liable to spontaneous combustion.
Special protective equipment and precautions for fire-fighters:Heating can cause expansion or decomposition of the material, which can lead to the containers exploding. If safe todo so, remove containers from the path of fire. Decomposes on heating emitting toxic fumes, including those ofhydrogen sulfide , and carbon disulfide . Fire fighters to wear self-contained breathing apparatus and suitableprotective clothing if risk of exposure to products of decomposition.
6. ACCIDENTAL RELEASE MEASURESEmergency procedures/Environmental precautions:Shut off all possible sources of ignition. Clear area of all unprotected personnel. If contamination of sewers orwaterways has occurred advise local emergency services.
Personal precautions/Protective equipment/Methods and materials for containment and cleaning up:Wear protective equipment to prevent skin and eye contact and breathing in vapours/dust. DO NOT allow material toget wet. Air-supplied masks are recommended to avoid inhalation of toxic material. Vacuum solid spills instead ofsweeping. Collect and seal in properly labelled containers or drums for disposal.
7. HANDLING AND STORAGEPrecautions for safe handling:Avoid skin and eye contact and breathing in dust. In common with many organic chemicals, may form flammable dustclouds in air. For precautions necessary refer to Safety Data Sheet "Dust Explosion Hazards".
Product Name: SIPX
Conditions for safe storage, including any incompatibilities:Store in a cool, dry, well ventilated place and out of direct sunlight. Store away from sources of heat or ignition. Storeaway from foodstuffs. Store away from incompatible materials described in Section 10. Keep dry - reacts with water,may lead to drum rupture. Keep containers closed when not in use - check regularly for spills.
Issued: 16/01/2013Substance No: 000030344501
8. EXPOSURE CONTROLS/PERSONAL PROTECTION
Version: 5
Control Parameters: No value assigned for this specific material by Safe Work Australia. However, supplierrecommended Workplace Exposure Standard(s):
TWA = 5 ppm (skin)
However, Workplace Exposure Standard(s) for decomposition product(s):
Page 3 of 7
Carbon disulfide: 8hr TWA = 31 mg/m3 (10 ppm), SkHydrogen sulfide: 8hr TWA = 14 mg/m3 (10 ppm), 15 min STEL 21 mg/m3 (15 ppm)
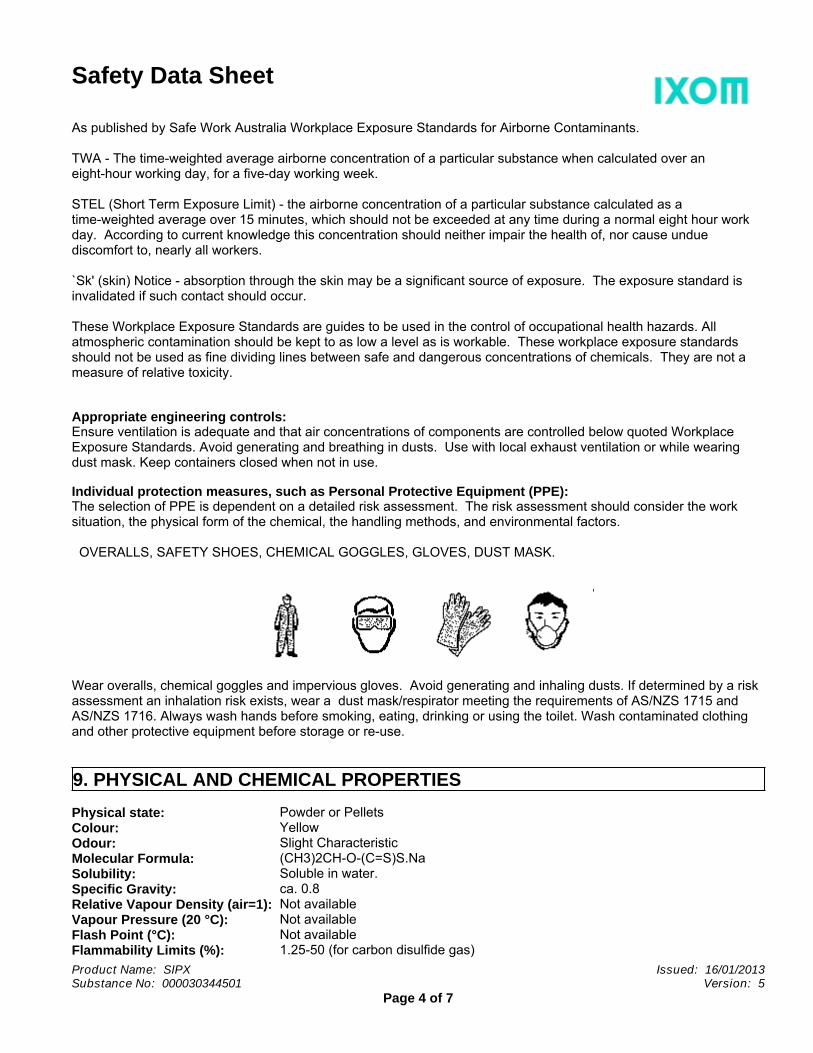
Safety Data Sheet
As published by Safe Work Australia Workplace Exposure Standards for Airborne Contaminants.
TWA - The time-weighted average airborne concentration of a particular substance when calculated over aneight-hour working day, for a five-day working week.
STEL (Short Term Exposure Limit) - the airborne concentration of a particular substance calculated as atime-weighted average over 15 minutes, which should not be exceeded at any time during a normal eight hour workday. According to current knowledge this concentration should neither impair the health of, nor cause unduediscomfort to, nearly all workers.
`Sk' (skin) Notice - absorption through the skin may be a significant source of exposure. The exposure standard isinvalidated if such contact should occur.
These Workplace Exposure Standards are guides to be used in the control of occupational health hazards. Allatmospheric contamination should be kept to as low a level as is workable. These workplace exposure standardsshould not be used as fine dividing lines between safe and dangerous concentrations of chemicals. They are not ameasure of relative toxicity.
Appropriate engineering controls:Ensure ventilation is adequate and that air concentrations of components are controlled below quoted WorkplaceExposure Standards. Avoid generating and breathing in dusts. Use with local exhaust ventilation or while wearingdust mask. Keep containers closed when not in use.
Individual protection measures, such as Personal Protective Equipment (PPE):The selection of PPE is dependent on a detailed risk assessment. The risk assessment should consider the worksituation, the physical form of the chemical, the handling methods, and environmental factors.
OVERALLS, SAFETY SHOES, CHEMICAL GOGGLES, GLOVES, DUST MASK.
Wear overalls, chemical goggles and impervious gloves. Avoid generating and inhaling dusts. If determined by a riskassessment an inhalation risk exists, wear a dust mask/respirator meeting the requirements of AS/NZS 1715 andAS/NZS 1716. Always wash hands before smoking, eating, drinking or using the toilet. Wash contaminated clothingand other protective equipment before storage or re-use.
9. PHYSICAL AND CHEMICAL PROPERTIESPhysical state: Powder or PelletsColour: YellowOdour: Slight CharacteristicMolecular Formula: (CH3)2CH-O-(C=S)S.NaSolubility: Soluble in water.Specific Gravity: ca. 0.8
Product Name: SIPX
Relative Vapour Density (air=1):
Issued: 16/01/2013
Not available
Substance No: 000030344501
Vapour Pressure (20 °C): Not available
Version: 5
Flash Point (°C): Not available
Page 4 of 7
Flammability Limits (%): 1.25-50 (for carbon disulfide gas)
Safety Data Sheet
Autoignition Temperature (°C): Not availableMelting Point/Range (°C): 150-250pH: >12
10. STABILITY AND REACTIVITYReactivity: Reacts with moisture liberating highly flammable carbon disulfide vapours.
Chemical stability: No information available.
Possibility of hazardousreactions:
Reacts exothermically with water .
Conditions to avoid: Avoid exposure to moisture. Avoid exposure to heat.
Incompatible materials: Incompatible with acids , oxidising agents , and moisture .
Hazardous decompositionproducts:
Carbon disulfide.
11. TOXICOLOGICAL INFORMATIONNo adverse health effects expected if the product is handled in accordance with this Safety Data Sheet and theproduct label. Symptoms or effects that may arise if the product is mishandled and overexposure occurs are:
Ingestion: Swallowing may result in irritation of the gastrointestinal tract.
Eye contact: May be an eye irritant. Exposure to the dust may cause discomfort due toparticulate nature. May cause physical irritation to the eyes.
Skin contact: Contact with skin will result in irritation. Will liberate carbon disulfide upon contactwith moist skin. Carbon disulfide can be absorbed through the skin with resultantadverse effects.
Inhalation: Breathing in dust may result in respiratory irritation. May cause coughing andshortness of breath.
Acute toxicity:Oral LD50 (rat): 1500 mg/kg.
Chronic effects: No information available for the product.
12. ECOLOGICAL INFORMATIONEcotoxicity Avoid contaminating waterways.
Aquatic toxicity:
Product Name: SIPX
Toxic to aquatic organisms. May cause long lasting harmful effects to aquatic life.
Issued: 16/01/2013Substance No: 000030344501
13. DISPOSAL CONSIDERATIONS
Version: 5
Disposal methods:Refer to Waste Management Authority. Dispose of material through a licensed waste contractor. Advise flammablenature.
Page 5 of 7
14. TRANSPORT INFORMATION
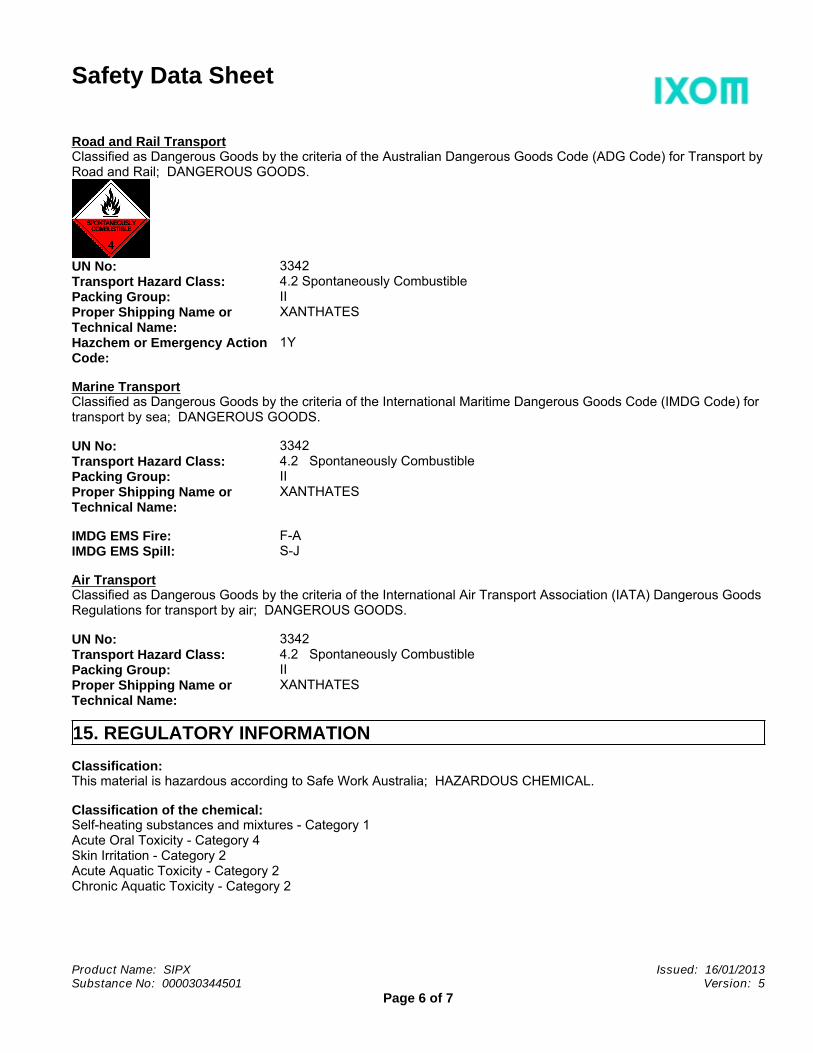
Safety Data Sheet
Road and Rail TransportClassified as Dangerous Goods by the criteria of the Australian Dangerous Goods Code (ADG Code) for Transport byRoad and Rail; DANGEROUS GOODS.
UN No: 3342Transport Hazard Class: 4.2 Spontaneously CombustiblePacking Group: IIProper Shipping Name orTechnical Name:
XANTHATES
Hazchem or Emergency ActionCode:
1Y
Marine TransportClassified as Dangerous Goods by the criteria of the International Maritime Dangerous Goods Code (IMDG Code) fortransport by sea; DANGEROUS GOODS.
UN No: 3342Transport Hazard Class: 4.2 Spontaneously CombustiblePacking Group: IIProper Shipping Name orTechnical Name:
XANTHATES
IMDG EMS Fire: F-AIMDG EMS Spill: S-J
Air TransportClassified as Dangerous Goods by the criteria of the International Air Transport Association (IATA) Dangerous GoodsRegulations for transport by air; DANGEROUS GOODS.
UN No: 3342Transport Hazard Class: 4.2 Spontaneously CombustiblePacking Group: IIProper Shipping Name orTechnical Name:
XANTHATES
15. REGULATORY INFORMATION
Product Name: SIPX Issued: 16/01/2013Substance No: 000030344501
Classification:This material is hazardous according to Safe Work Australia; HAZARDOUS CHEMICAL.
Version: 5
Classification of the chemical:Self-heating substances and mixtures - Category 1Acute Oral Toxicity - Category 4Skin Irritation - Category 2Acute Aquatic Toxicity - Category 2Chronic Aquatic Toxicity - Category 2
Page 6 of 7

Safety Data Sheet
Hazard Statement(s):H251 Self-heating; may catch fire.H302 Harmful if swallowed.H315 Causes skin irritation.H411 Toxic to aquatic life with long lasting effects.
Poisons Schedule (SUSMP): None allocated.
This material is listed on the Australian Inventory of Chemical Substances (AICS).
16. OTHER INFORMATION
Product Name: SIPX Issued: 16/01/2013
This safety data sheet has been prepared by Ixom Operations Pty Ltd Toxicology & SDS Services.
Reason(s) for Issue:Revised Primary SDSAlignment to GHS requirements
Substance No: 000030344501
This SDS summarises to our best knowledge at the date of issue, the chemical health and safety hazards of thematerial and general guidance on how to safely handle the material in the workplace. Since Ixom Operations Pty Ltdcannot anticipate or control the conditions under which the product may be used, each user must, prior to usage,assess and control the risks arising from its use of the material.
If clarification or further information is needed, the user should contact their Ixom representative or Ixom OperationsPty Ltd at the contact details on page 1.
Ixom Operations Pty Ltd's responsibility for the material as sold is subject to the terms and conditions of sale, a copyof which is available upon request.
Version: 5Page 7 of 7

H:\Files\TGOLD\11048\Integrated Discharge Permit\R17 Permit Application Narrative.Docx\\12/11/17\065 12/11/17\7:28 AM
APPENDIX I
NONDEGRADATION CRITERIA CALCULATIONS
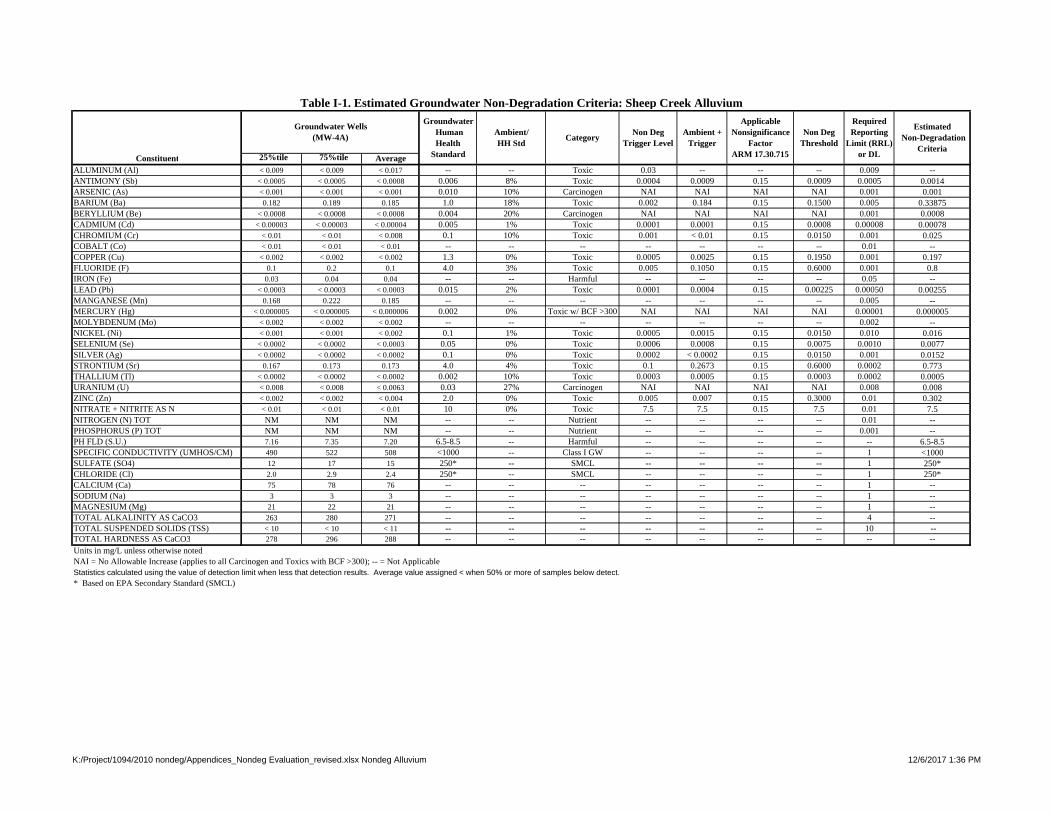
Constituent 25%tile 75%tile AverageALUMINUM (Al) < 0.009 < 0.009 < 0.017 -- -- Toxic 0.03 -- -- -- 0.009 --ANTIMONY (Sb) < 0.0005 < 0.0005 < 0.0008 0.006 8% Toxic 0.0004 0.0009 0.15 0.0009 0.0005 0.0014ARSENIC (As) < 0.001 < 0.001 < 0.001 0.010 10% Carcinogen NAI NAI NAI NAI 0.001 0.001BARIUM (Ba) 0.182 0.189 0.185 1.0 18% Toxic 0.002 0.184 0.15 0.1500 0.005 0.33875BERYLLIUM (Be) < 0.0008 < 0.0008 < 0.0008 0.004 20% Carcinogen NAI NAI NAI NAI 0.001 0.0008CADMIUM (Cd) < 0.00003 < 0.00003 < 0.00004 0.005 1% Toxic 0.0001 0.0001 0.15 0.0008 0.00008 0.00078CHROMIUM (Cr) < 0.01 < 0.01 < 0.008 0.1 10% Toxic 0.001 < 0.01 0.15 0.0150 0.001 0.025COBALT (Co) < 0.01 < 0.01 < 0.01 -- -- -- -- -- -- -- 0.01 --COPPER (Cu) < 0.002 < 0.002 < 0.002 1.3 0% Toxic 0.0005 0.0025 0.15 0.1950 0.001 0.197FLUORIDE (F) 0.1 0.2 0.1 4.0 3% Toxic 0.005 0.1050 0.15 0.6000 0.001 0.8IRON (Fe) 0.03 0.04 0.04 -- -- Harmful -- -- -- -- 0.05 --LEAD (Pb) < 0.0003 < 0.0003 < 0.0003 0.015 2% Toxic 0.0001 0.0004 0.15 0.00225 0.00050 0.00255MANGANESE (Mn) 0.168 0.222 0.185 -- -- -- -- -- -- -- 0.005 --MERCURY (Hg) < 0.000005 < 0.000005 < 0.000006 0.002 0% Toxic w/ BCF >300 NAI NAI NAI NAI 0.00001 0.000005MOLYBDENUM (Mo) < 0.002 < 0.002 < 0.002 -- -- -- -- -- -- -- 0.002 --NICKEL (Ni) < 0.001 < 0.001 < 0.002 0.1 1% Toxic 0.0005 0.0015 0.15 0.0150 0.010 0.016SELENIUM (Se) < 0.0002 < 0.0002 < 0.0003 0.05 0% Toxic 0.0006 0.0008 0.15 0.0075 0.0010 0.0077SILVER (Ag) < 0.0002 < 0.0002 < 0.0002 0.1 0% Toxic 0.0002 < 0.0002 0.15 0.0150 0.001 0.0152STRONTIUM (Sr) 0.167 0.173 0.173 4.0 4% Toxic 0.1 0.2673 0.15 0.6000 0.0002 0.773THALLIUM (Tl) < 0.0002 < 0.0002 < 0.0002 0.002 10% Toxic 0.0003 0.0005 0.15 0.0003 0.0002 0.0005URANIUM (U) < 0.008 < 0.008 < 0.0063 0.03 27% Carcinogen NAI NAI NAI NAI 0.008 0.008ZINC (Zn) < 0.002 < 0.002 < 0.004 2.0 0% Toxic 0.005 0.007 0.15 0.3000 0.01 0.302NITRATE + NITRITE AS N < 0.01 < 0.01 < 0.01 10 0% Toxic 7.5 7.5 0.15 7.5 0.01 7.5NITROGEN (N) TOT NM NM NM -- -- Nutrient -- -- -- -- 0.01 --PHOSPHORUS (P) TOT NM NM NM -- -- Nutrient -- -- -- -- 0.001 --PH FLD (S.U.) 7.16 7.35 7.20 6.5-8.5 -- Harmful -- -- -- -- -- 6.5-8.5SPECIFIC CONDUCTIVITY (UMHOS/CM) 490 522 508 <1000 -- Class I GW -- -- -- -- 1 <1000SULFATE (SO4) 12 17 15 250* -- SMCL -- -- -- -- 1 250*CHLORIDE (Cl) 2.0 2.9 2.4 250* -- SMCL -- -- -- -- 1 250*CALCIUM (Ca) 75 78 76 -- -- -- -- -- -- -- 1 --SODIUM (Na) 3 3 3 -- -- -- -- -- -- -- 1 --MAGNESIUM (Mg) 21 22 21 -- -- -- -- -- -- -- 1 --TOTAL ALKALINITY AS CaCO3 263 280 271 -- -- -- -- -- -- -- 4 --TOTAL SUSPENDED SOLIDS (TSS) < 10 < 10 < 11 -- -- -- -- -- -- -- 10 --TOTAL HARDNESS AS CaCO3 278 296 288 -- -- -- -- -- -- -- -- --Units in mg/L unless otherwise notedNAI = No Allowable Increase (applies to all Carcinogen and Toxics with BCF >300); -- = Not ApplicableStatistics calculated using the value of detection limit when less that detection results. Average value assigned < when 50% or more of samples below detect.* Based on EPA Secondary Standard (SMCL)
Groundwater Human Health
Standard
Non Deg Trigger Level
Non Deg Threshold
Required Reporting
Limit (RRL) or DL
Table I-1. Estimated Groundwater Non-Degradation Criteria: Sheep Creek Alluvium
Estimated Non-Degradation
Criteria
Ambient/HH Std
Groundwater Wells (MW-4A)
Ambient + Trigger
Category
Applicable Nonsignificance
FactorARM 17.30.715
K:/Project/1094/2010 nondeg/Appendices_Nondeg Evaluation_revised.xlsx Nondeg Alluvium 12/6/2017 1:36 PM
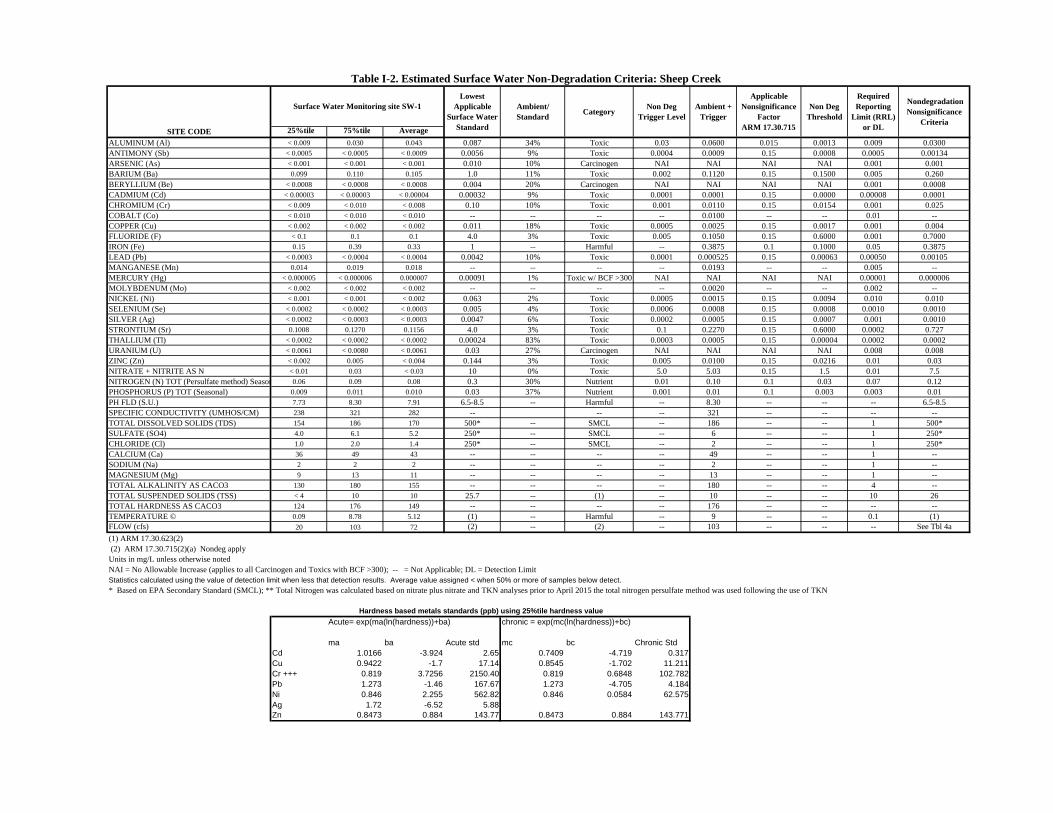
SITE CODE 25%tile 75%tile Average
ALUMINUM (Al) < 0.009 0.030 0.043 0.087 34% Toxic 0.03 0.0600 0.015 0.0013 0.009 0.0300ANTIMONY (Sb) < 0.0005 < 0.0005 < 0.0009 0.0056 9% Toxic 0.0004 0.0009 0.15 0.0008 0.0005 0.00134ARSENIC (As) < 0.001 < 0.001 < 0.001 0.010 10% Carcinogen NAI NAI NAI NAI 0.001 0.001BARIUM (Ba) 0.099 0.110 0.105 1.0 11% Toxic 0.002 0.1120 0.15 0.1500 0.005 0.260BERYLLIUM (Be) < 0.0008 < 0.0008 < 0.0008 0.004 20% Carcinogen NAI NAI NAI NAI 0.001 0.0008CADMIUM (Cd) < 0.00003 < 0.00003 < 0.00004 0.00032 9% Toxic 0.0001 0.0001 0.15 0.0000 0.00008 0.0001CHROMIUM (Cr) < 0.009 < 0.010 < 0.008 0.10 10% Toxic 0.001 0.0110 0.15 0.0154 0.001 0.025COBALT (Co) < 0.010 < 0.010 < 0.010 -- -- -- -- 0.0100 -- -- 0.01 --COPPER (Cu) < 0.002 < 0.002 < 0.002 0.011 18% Toxic 0.0005 0.0025 0.15 0.0017 0.001 0.004FLUORIDE (F) < 0.1 0.1 0.1 4.0 3% Toxic 0.005 0.1050 0.15 0.6000 0.001 0.7000IRON (Fe) 0.15 0.39 0.33 1 -- Harmful -- 0.3875 0.1 0.1000 0.05 0.3875LEAD (Pb) < 0.0003 < 0.0004 < 0.0004 0.0042 10% Toxic 0.0001 0.000525 0.15 0.00063 0.00050 0.00105MANGANESE (Mn) 0.014 0.019 0.018 -- -- -- -- 0.0193 -- -- 0.005 --MERCURY (Hg) < 0.000005 < 0.000006 0.000007 0.00091 1% Toxic w/ BCF >300 NAI NAI NAI NAI 0.00001 0.000006MOLYBDENUM (Mo) < 0.002 < 0.002 < 0.002 -- -- -- -- 0.0020 -- -- 0.002 --NICKEL (Ni) < 0.001 < 0.001 < 0.002 0.063 2% Toxic 0.0005 0.0015 0.15 0.0094 0.010 0.010SELENIUM (Se) < 0.0002 < 0.0002 < 0.0003 0.005 4% Toxic 0.0006 0.0008 0.15 0.0008 0.0010 0.0010SILVER (Ag) < 0.0002 < 0.0003 < 0.0003 0.0047 6% Toxic 0.0002 0.0005 0.15 0.0007 0.001 0.0010STRONTIUM (Sr) 0.1008 0.1270 0.1156 4.0 3% Toxic 0.1 0.2270 0.15 0.6000 0.0002 0.727THALLIUM (Tl) < 0.0002 < 0.0002 < 0.0002 0.00024 83% Toxic 0.0003 0.0005 0.15 0.00004 0.0002 0.0002URANIUM (U) < 0.0061 < 0.0080 < 0.0061 0.03 27% Carcinogen NAI NAI NAI NAI 0.008 0.008ZINC (Zn) < 0.002 0.005 < 0.004 0.144 3% Toxic 0.005 0.0100 0.15 0.0216 0.01 0.03NITRATE + NITRITE AS N < 0.01 0.03 < 0.03 10 0% Toxic 5.0 5.03 0.15 1.5 0.01 7.5NITROGEN (N) TOT (Persulfate method) Season 0.06 0.09 0.08 0.3 30% Nutrient 0.01 0.10 0.1 0.03 0.07 0.12PHOSPHORUS (P) TOT (Seasonal) 0.009 0.011 0.010 0.03 37% Nutrient 0.001 0.01 0.1 0.003 0.003 0.01PH FLD (S.U.) 7.73 8.30 7.91 6.5-8.5 -- Harmful -- 8.30 -- -- -- 6.5-8.5SPECIFIC CONDUCTIVITY (UMHOS/CM) 238 321 282 -- -- -- 321 -- -- -- --TOTAL DISSOLVED SOLIDS (TDS) 154 186 170 500* -- SMCL -- 186 -- -- 1 500*SULFATE (SO4) 4.0 6.1 5.2 250* -- SMCL -- 6 -- -- 1 250*CHLORIDE (Cl) 1.0 2.0 1.4 250* -- SMCL -- 2 -- -- 1 250*CALCIUM (Ca) 36 49 43 -- -- -- -- 49 -- -- 1 --SODIUM (Na) 2 2 2 -- -- -- -- 2 -- -- 1 --MAGNESIUM (Mg) 9 13 11 -- -- -- -- 13 -- -- 1 --TOTAL ALKALINITY AS CACO3 130 180 155 -- -- -- -- 180 -- -- 4 --TOTAL SUSPENDED SOLIDS (TSS) < 4 10 10 25.7 -- (1) -- 10 -- -- 10 26TOTAL HARDNESS AS CACO3 124 176 149 -- -- -- -- 176 -- -- -- --TEMPERATURE © 0.09 8.78 5.12 (1) -- Harmful -- 9 -- -- 0.1 (1)FLOW (cfs) 20 103 72 (2) -- (2) -- 103 -- -- -- See Tbl 4a
(1) ARM 17.30.623(2) (2) ARM 17.30.715(2)(a) Nondeg applyUnits in mg/L unless otherwise notedNAI = No Allowable Increase (applies to all Carcinogen and Toxics with BCF >300); -- = Not Applicable; DL = Detection LimitStatistics calculated using the value of detection limit when less that detection results. Average value assigned < when 50% or more of samples below detect.
* Based on EPA Secondary Standard (SMCL); ** Total Nitrogen was calculated based on nitrate plus nitrate and TKN analyses prior to April 2015 the total nitrogen persulfate method was used following the use of TKN
Acute= exp(ma(ln(hardness))+ba) chronic = exp(mc(ln(hardness))+bc)
ma ba Acute std mc bc Chronic StdCd 1.0166 -3.924 2.65 0.7409 -4.719 0.317Cu 0.9422 -1.7 17.14 0.8545 -1.702 11.211Cr +++ 0.819 3.7256 2150.40 0.819 0.6848 102.782Pb 1.273 -1.46 167.67 1.273 -4.705 4.184Ni 0.846 2.255 562.82 0.846 0.0584 62.575Ag 1.72 -6.52 5.88Zn 0.8473 0.884 143.77 0.8473 0.884 143.771
Hardness based metals standards (ppb) using 25%tile hardness value
Table I-2. Estimated Surface Water Non-Degradation Criteria: Sheep Creek
Nondegradation Nonsignificance
Criteria
Surface Water Monitoring site SW-1Lowest
Applicable Surface Water
Standard
Ambient/Standard
CategoryNon Deg
Trigger LevelAmbient +
Trigger
Applicable Nonsignificance
FactorARM 17.30.715
Non Deg Threshold
Required Reporting
Limit (RRL) or DL
H:\Files\TGOLD\11048\Integrated Discharge Permit\R17 Permit Application Narrative.Docx\\12/11/17\065 12/11/17\7:28 AM
APPENDIX J
STORM WATER FLOW CALCULATIONS
AND SEDCAD OUTPUT
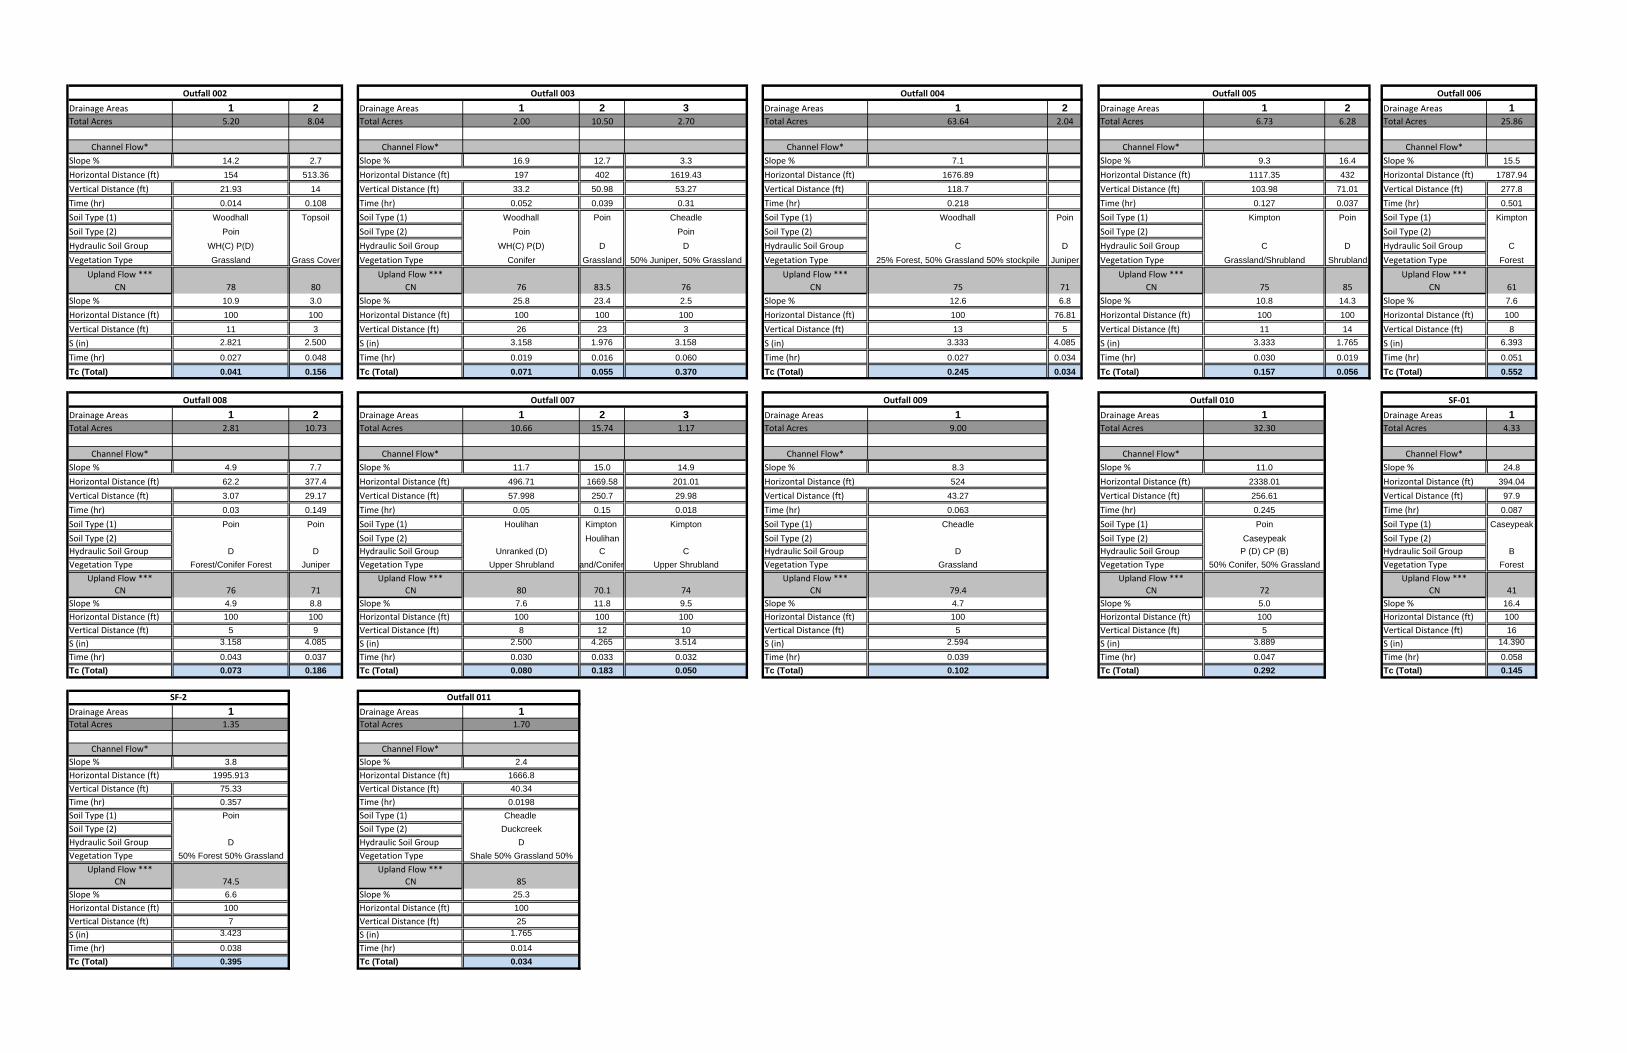
Drainage Areas 1 2 Drainage Areas 1 2 3 Drainage Areas 1 2 Drainage Areas 1 2 Drainage Areas 1Total Acres 5.20 8.04 Total Acres 2.00 10.50 2.70 Total Acres 63.64 2.04 Total Acres 6.73 6.28 Total Acres 25.86
Channel Flow* Channel Flow* Channel Flow* Channel Flow* Channel Flow*
Slope % 14.2 2.7 Slope % 16.9 12.7 3.3 Slope % 7.1 Slope % 9.3 16.4 Slope % 15.5
Horizontal Distance (ft) 154 513.36 Horizontal Distance (ft) 197 402 1619.43 Horizontal Distance (ft) 1676.89 Horizontal Distance (ft) 1117.35 432 Horizontal Distance (ft) 1787.94
Vertical Distance (ft) 21.93 14 Vertical Distance (ft) 33.2 50.98 53.27 Vertical Distance (ft) 118.7 Vertical Distance (ft) 103.98 71.01 Vertical Distance (ft) 277.8
Time (hr) 0.014 0.108 Time (hr) 0.052 0.039 0.31 Time (hr) 0.218 Time (hr) 0.127 0.037 Time (hr) 0.501
Soil Type (1) Woodhall Topsoil Soil Type (1) Woodhall Poin Cheadle Soil Type (1) Woodhall Poin Soil Type (1) Kimpton Poin Soil Type (1) Kimpton
Soil Type (2) Poin Soil Type (2) Poin Poin Soil Type (2) Soil Type (2) Soil Type (2)
Hydraulic Soil Group WH(C) P(D) Hydraulic Soil Group WH(C) P(D) D D Hydraulic Soil Group C D Hydraulic Soil Group C D Hydraulic Soil Group C
Vegetation Type Grassland Grass Cover Vegetation Type Conifer Grassland 50% Juniper, 50% Grassland Vegetation Type 25% Forest, 50% Grassland 50% stockpile Juniper Vegetation Type Grassland/Shrubland Shrubland Vegetation Type Forest
Upland Flow *** Upland Flow *** Upland Flow *** Upland Flow *** Upland Flow ***
CN 78 80 CN 76 83.5 76 CN 75 71 CN 75 85 CN 61
Slope % 10.9 3.0 Slope % 25.8 23.4 2.5 Slope % 12.6 6.8 Slope % 10.8 14.3 Slope % 7.6
Horizontal Distance (ft) 100 100 Horizontal Distance (ft) 100 100 100 Horizontal Distance (ft) 100 76.81 Horizontal Distance (ft) 100 100 Horizontal Distance (ft) 100
Vertical Distance (ft) 11 3 Vertical Distance (ft) 26 23 3 Vertical Distance (ft) 13 5 Vertical Distance (ft) 11 14 Vertical Distance (ft) 8
S (in) 2.821 2.500 S (in) 3.158 1.976 3.158 S (in) 3.333 4.085 S (in) 3.333 1.765 S (in) 6.393
Time (hr) 0.027 0.048 Time (hr) 0.019 0.016 0.060 Time (hr) 0.027 0.034 Time (hr) 0.030 0.019 Time (hr) 0.051
Tc (Total) 0.041 0.156 Tc (Total) 0.071 0.055 0.370 Tc (Total) 0.245 0.034 Tc (Total) 0.157 0.056 Tc (Total) 0.552
Drainage Areas 1 2 Drainage Areas 1 2 3 Drainage Areas 1 Drainage Areas 1 Drainage Areas 1Total Acres 2.81 10.73 Total Acres 10.66 15.74 1.17 Total Acres 9.00 Total Acres 32.30 Total Acres 4.33
Channel Flow* Channel Flow* Channel Flow* Channel Flow* Channel Flow*
Slope % 4.9 7.7 Slope % 11.7 15.0 14.9 Slope % 8.3 Slope % 11.0 Slope % 24.8
Horizontal Distance (ft) 62.2 377.4 Horizontal Distance (ft) 496.71 1669.58 201.01 Horizontal Distance (ft) 524 Horizontal Distance (ft) 2338.01 Horizontal Distance (ft) 394.04
Vertical Distance (ft) 3.07 29.17 Vertical Distance (ft) 57.998 250.7 29.98 Vertical Distance (ft) 43.27 Vertical Distance (ft) 256.61 Vertical Distance (ft) 97.9
Time (hr) 0.03 0.149 Time (hr) 0.05 0.15 0.018 Time (hr) 0.063 Time (hr) 0.245 Time (hr) 0.087
Soil Type (1) Poin Poin Soil Type (1) Houlihan Kimpton Kimpton Soil Type (1) Cheadle Soil Type (1) Poin Soil Type (1) Caseypeak
Soil Type (2) Soil Type (2) Houlihan Soil Type (2) Soil Type (2) Caseypeak Soil Type (2)
Hydraulic Soil Group D D Hydraulic Soil Group Unranked (D) C C Hydraulic Soil Group D Hydraulic Soil Group P (D) CP (B) Hydraulic Soil Group B
Vegetation Type Forest/Conifer Forest Juniper Vegetation Type Upper Shrubland and/Conifer Upper Shrubland Vegetation Type Grassland Vegetation Type 50% Conifer, 50% Grassland Vegetation Type Forest
Upland Flow *** Upland Flow *** Upland Flow *** Upland Flow *** Upland Flow ***
CN 76 71 CN 80 70.1 74 CN 79.4 CN 72 CN 41
Slope % 4.9 8.8 Slope % 7.6 11.8 9.5 Slope % 4.7 Slope % 5.0 Slope % 16.4
Horizontal Distance (ft) 100 100 Horizontal Distance (ft) 100 100 100 Horizontal Distance (ft) 100 Horizontal Distance (ft) 100 Horizontal Distance (ft) 100
Vertical Distance (ft) 5 9 Vertical Distance (ft) 8 12 10 Vertical Distance (ft) 5 Vertical Distance (ft) 5 Vertical Distance (ft) 16
S (in) 3.158 4.085 S (in) 2.500 4.265 3.514 S (in) 2.594 S (in) 3.889 S (in) 14.390
Time (hr) 0.043 0.037 Time (hr) 0.030 0.033 0.032 Time (hr) 0.039 Time (hr) 0.047 Time (hr) 0.058
Tc (Total) 0.073 0.186 Tc (Total) 0.080 0.183 0.050 Tc (Total) 0.102 Tc (Total) 0.292 Tc (Total) 0.145
Drainage Areas 1 Drainage Areas 1Total Acres 1.35 Total Acres 1.70
Channel Flow* Channel Flow*
Slope % 3.8 Slope % 2.4
Horizontal Distance (ft) 1995.913 Horizontal Distance (ft) 1666.8
Vertical Distance (ft) 75.33 Vertical Distance (ft) 40.34
Time (hr) 0.357 Time (hr) 0.0198
Soil Type (1) Poin Soil Type (1) Cheadle
Soil Type (2) Soil Type (2) Duckcreek
Hydraulic Soil Group D Hydraulic Soil Group D
Vegetation Type 50% Forest 50% Grassland Vegetation Type Shale 50% Grassland 50%
Upland Flow *** Upland Flow ***
CN 74.5 CN 85
Slope % 6.6 Slope % 25.3
Horizontal Distance (ft) 100 Horizontal Distance (ft) 100
Vertical Distance (ft) 7 Vertical Distance (ft) 25
S (in) 3.423 S (in) 1.765
Time (hr) 0.038 Time (hr) 0.014
Tc (Total) 0.395 Tc (Total) 0.034
Outfall 006
Outfall 007Outfall 008 Outfall 009 Outfall 010 SF‐01
SF‐2
Outfall 002 Outfall 003 Outfall 004 Outfall 005
Outfall 011
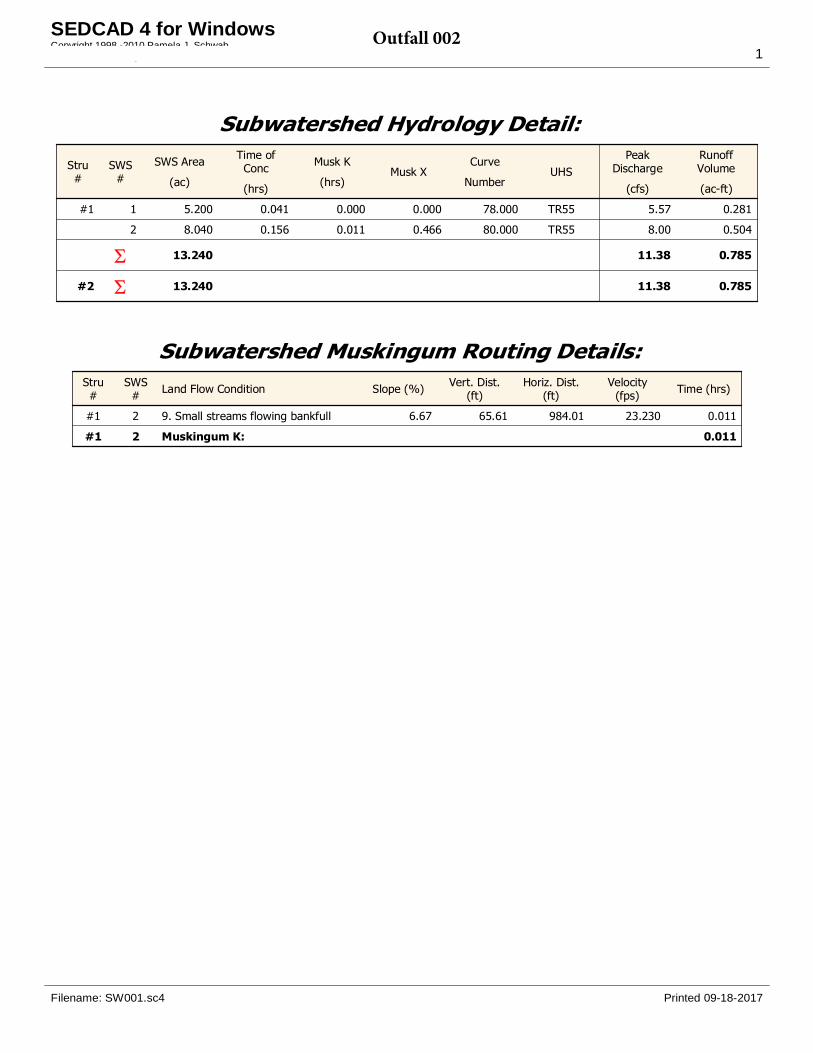
Subwatershed Hydrology Detail:
Stru#
SWS#
SWS Area
(ac)
Time ofConc
(hrs)
Musk K
(hrs)Musk X
Curve
NumberUHS
PeakDischarge
(cfs)
RunoffVolume
(ac-ft)
#1 1 5.200 0.041 0.000 0.000 78.000 TR55 5.57 0.281
2 8.040 0.156 0.011 0.466 80.000 TR55 8.00 0.504
13.240 11.38 0.785
#2 13.240 11.38 0.785
Subwatershed Muskingum Routing Details:Stru#
SWS# Land Flow Condition Slope (%) Vert. Dist.
(ft)Horiz. Dist.
(ft)Velocity
(fps) Time (hrs)
#1 2 9. Small streams flowing bankfull 6.67 65.61 984.01 23.230 0.011
#1 2 Muskingum K: 0.011
Filename: SW001.sc4 Printed 09-18-2017
SEDCAD 4 for WindowsCopyright 1998 -2010 Pamela J. SchwabCivil Software Design, LLC 1
Outfall 002
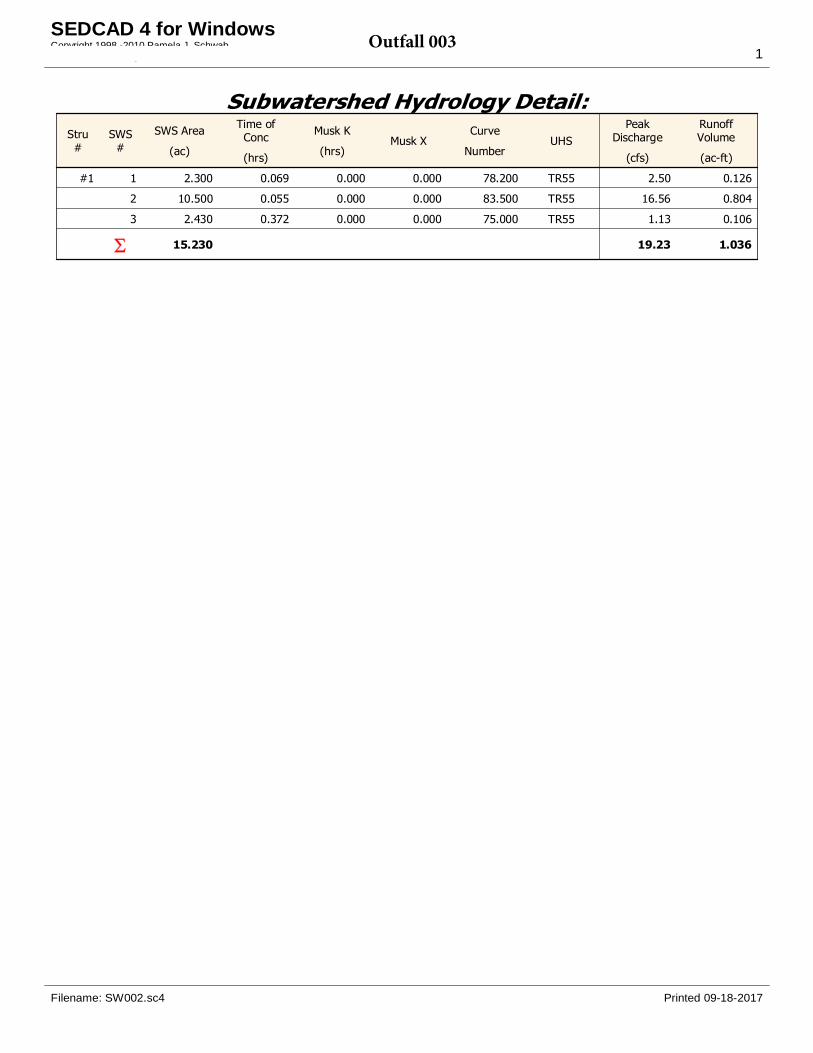
Subwatershed Hydrology Detail:Stru#
SWS#
SWS Area
(ac)
Time ofConc
(hrs)
Musk K
(hrs)Musk X
Curve
NumberUHS
PeakDischarge
(cfs)
RunoffVolume
(ac-ft)
#1 1 2.300 0.069 0.000 0.000 78.200 TR55 2.50 0.126
2 10.500 0.055 0.000 0.000 83.500 TR55 16.56 0.804
3 2.430 0.372 0.000 0.000 75.000 TR55 1.13 0.106
15.230 19.23 1.036
Filename: SW002.sc4 Printed 09-18-2017
SEDCAD 4 for WindowsCopyright 1998 -2010 Pamela J. SchwabCivil Software Design, LLC 1
Outfall 003
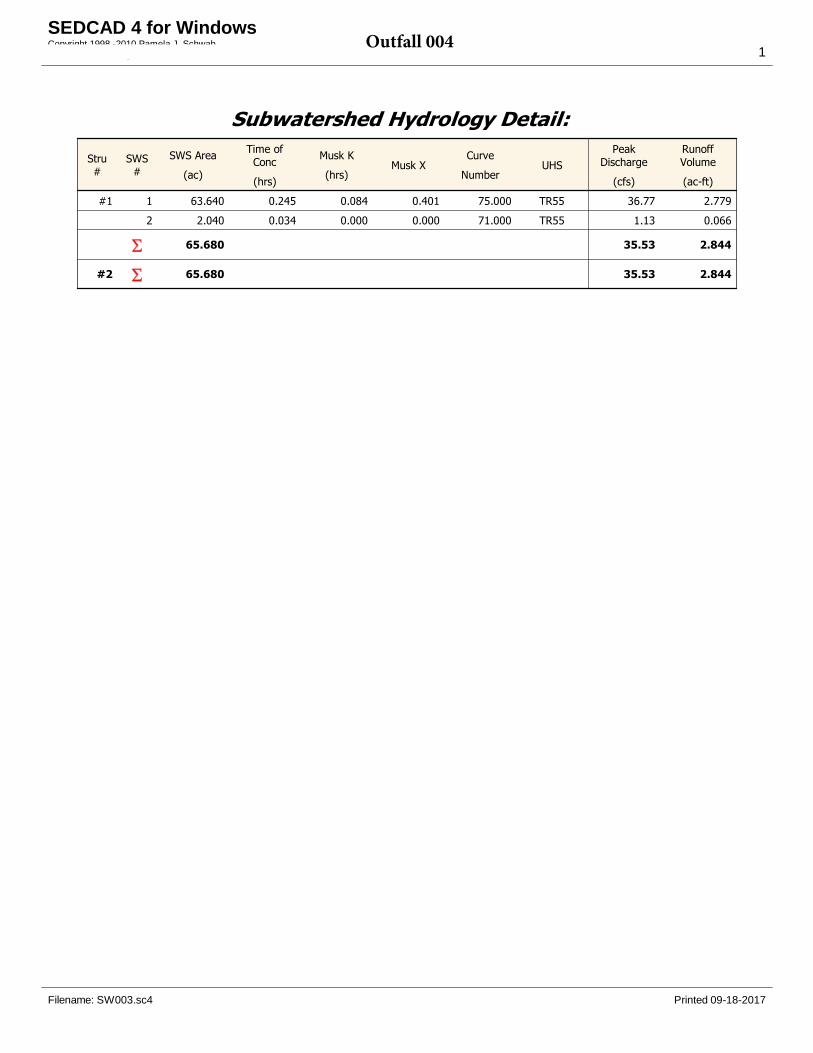
Subwatershed Hydrology Detail:
Stru#
SWS#
SWS Area
(ac)
Time ofConc
(hrs)
Musk K
(hrs)Musk X
Curve
NumberUHS
PeakDischarge
(cfs)
RunoffVolume
(ac-ft)
#1 1 63.640 0.245 0.084 0.401 75.000 TR55 36.77 2.779
2 2.040 0.034 0.000 0.000 71.000 TR55 1.13 0.066
65.680 35.53 2.844
#2 65.680 35.53 2.844
Filename: SW003.sc4 Printed 09-18-2017
SEDCAD 4 for WindowsCopyright 1998 -2010 Pamela J. SchwabCivil Software Design, LLC 1
Outfall 004
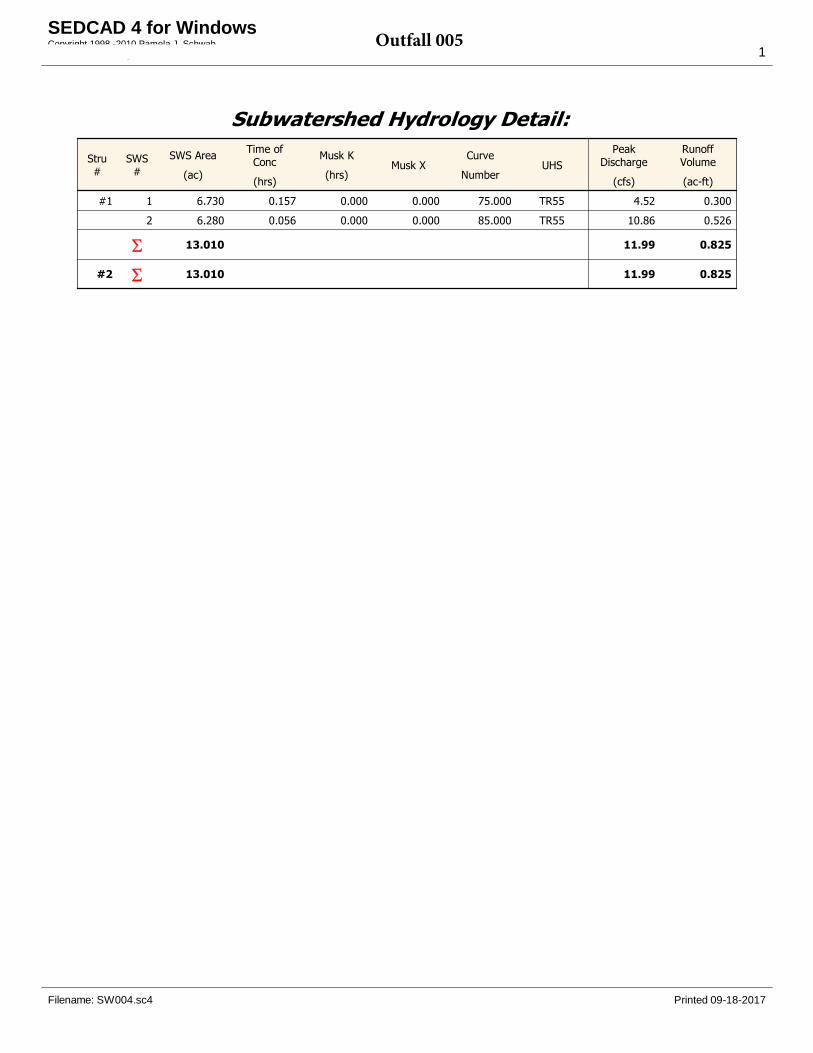
Subwatershed Hydrology Detail:
Stru#
SWS#
SWS Area
(ac)
Time ofConc
(hrs)
Musk K
(hrs)Musk X
Curve
NumberUHS
PeakDischarge
(cfs)
RunoffVolume
(ac-ft)
#1 1 6.730 0.157 0.000 0.000 75.000 TR55 4.52 0.300
2 6.280 0.056 0.000 0.000 85.000 TR55 10.86 0.526
13.010 11.99 0.825
#2 13.010 11.99 0.825
Filename: SW004.sc4 Printed 09-18-2017
SEDCAD 4 for WindowsCopyright 1998 -2010 Pamela J. SchwabCivil Software Design, LLC 1
Outfall 005
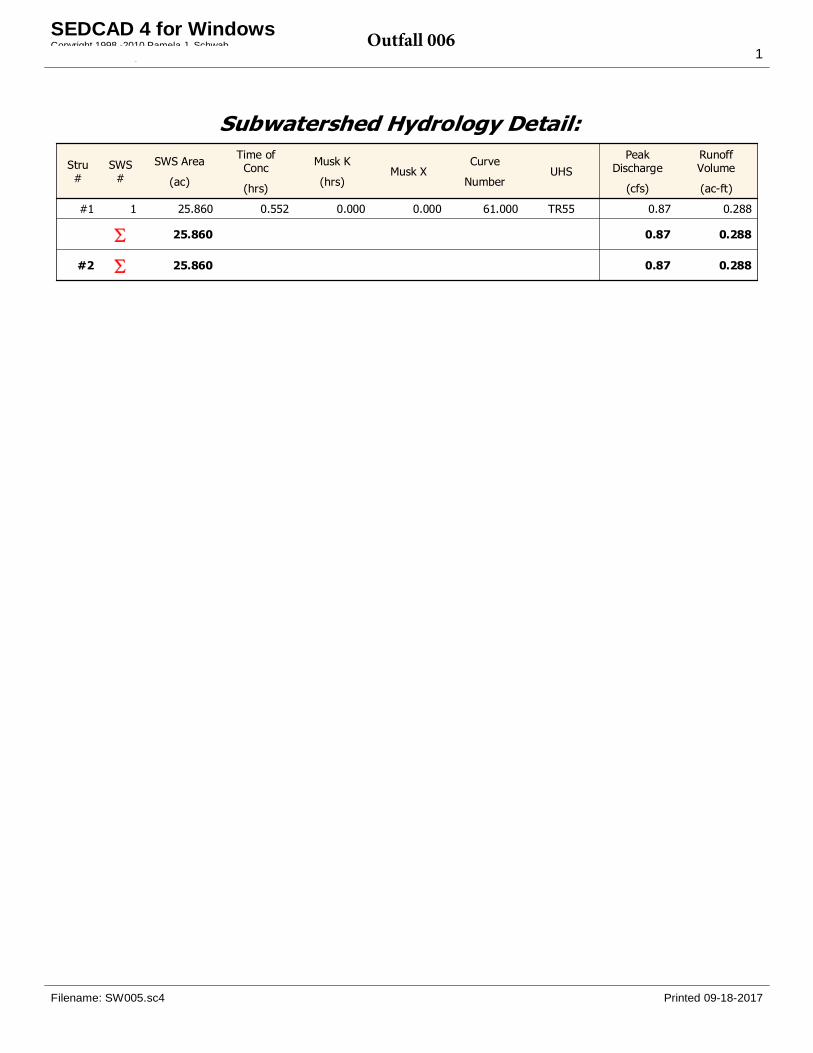
Subwatershed Hydrology Detail:
Stru#
SWS#
SWS Area
(ac)
Time ofConc
(hrs)
Musk K
(hrs)Musk X
Curve
NumberUHS
PeakDischarge
(cfs)
RunoffVolume
(ac-ft)
#1 1 25.860 0.552 0.000 0.000 61.000 TR55 0.87 0.288
25.860 0.87 0.288
#2 25.860 0.87 0.288
Filename: SW005.sc4 Printed 09-18-2017
SEDCAD 4 for WindowsCopyright 1998 -2010 Pamela J. SchwabCivil Software Design, LLC 1
Outfall 006
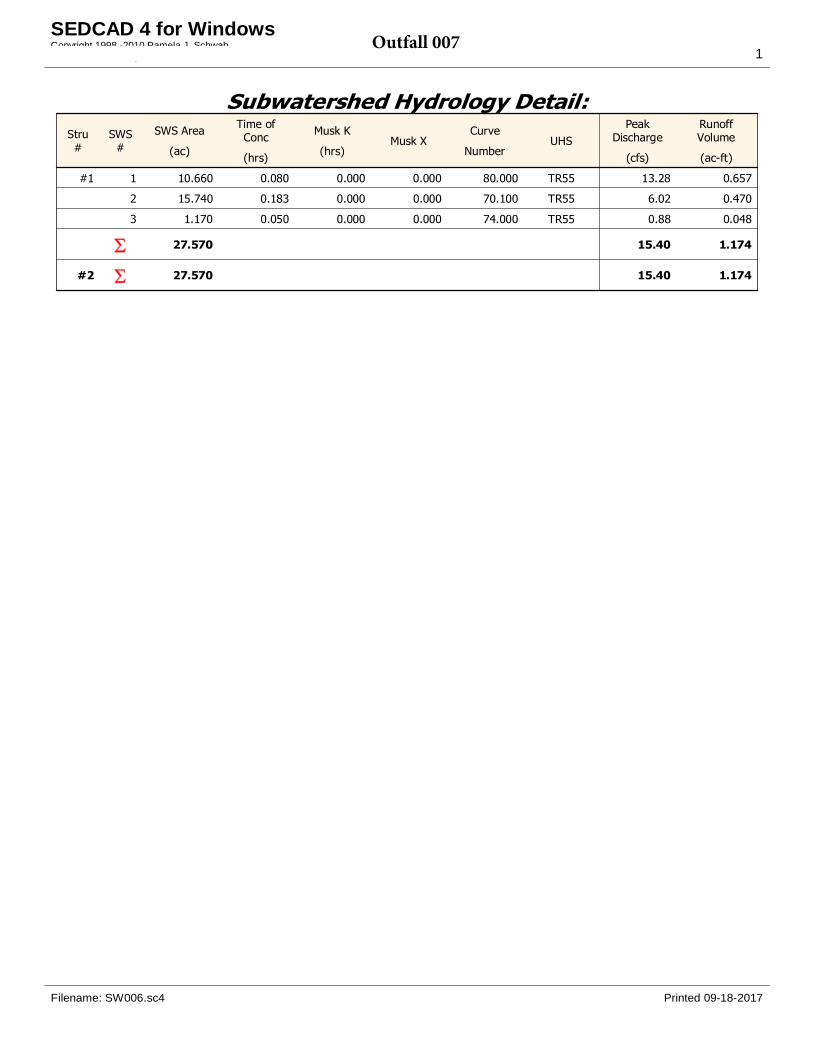
Subwatershed Hydrology Detail:Stru#
SWS#
SWS Area
(ac)
Time ofConc
(hrs)
Musk K
(hrs)Musk X
Curve
NumberUHS
PeakDischarge
(cfs)
RunoffVolume
(ac-ft)
#1 1 10.660 0.080 0.000 0.000 80.000 TR55 13.28 0.657
2 15.740 0.183 0.000 0.000 70.100 TR55 6.02 0.470
3 1.170 0.050 0.000 0.000 74.000 TR55 0.88 0.048
27.570 15.40 1.174
#2 27.570 15.40 1.174
Filename: SW006.sc4 Printed 09-18-2017
SEDCAD 4 for WindowsCopyright 1998 -2010 Pamela J. SchwabCivil Software Design, LLC 1
Outfall 007
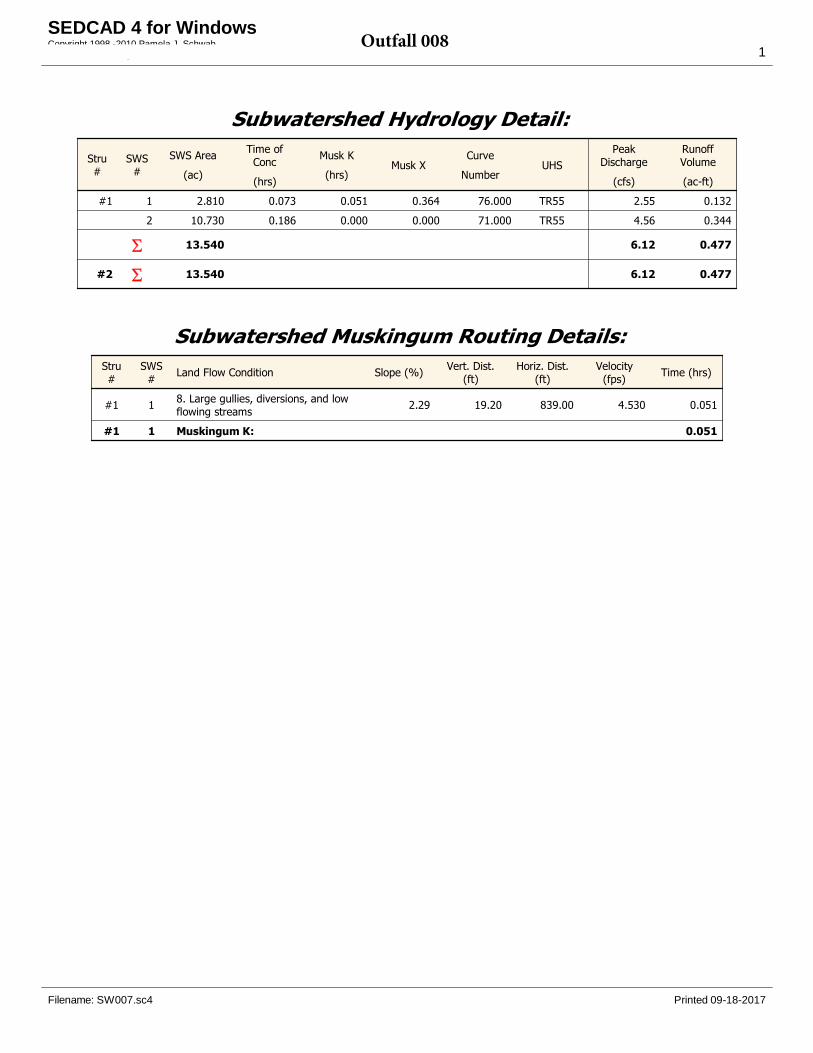
Subwatershed Hydrology Detail:
Stru#
SWS#
SWS Area
(ac)
Time ofConc
(hrs)
Musk K
(hrs)Musk X
Curve
NumberUHS
PeakDischarge
(cfs)
RunoffVolume
(ac-ft)
#1 1 2.810 0.073 0.051 0.364 76.000 TR55 2.55 0.132
2 10.730 0.186 0.000 0.000 71.000 TR55 4.56 0.344
13.540 6.12 0.477
#2 13.540 6.12 0.477
Subwatershed Muskingum Routing Details:Stru#
SWS#
Land Flow Condition Slope (%) Vert. Dist.(ft)
Horiz. Dist.(ft)
Velocity(fps)
Time (hrs)
#1 1 8. Large gullies, diversions, and lowflowing streams
2.29 19.20 839.00 4.530 0.051
#1 1 Muskingum K: 0.051
Filename: SW007.sc4 Printed 09-18-2017
SEDCAD 4 for WindowsCopyright 1998 -2010 Pamela J. SchwabCivil Software Design, LLC 1
Outfall 008
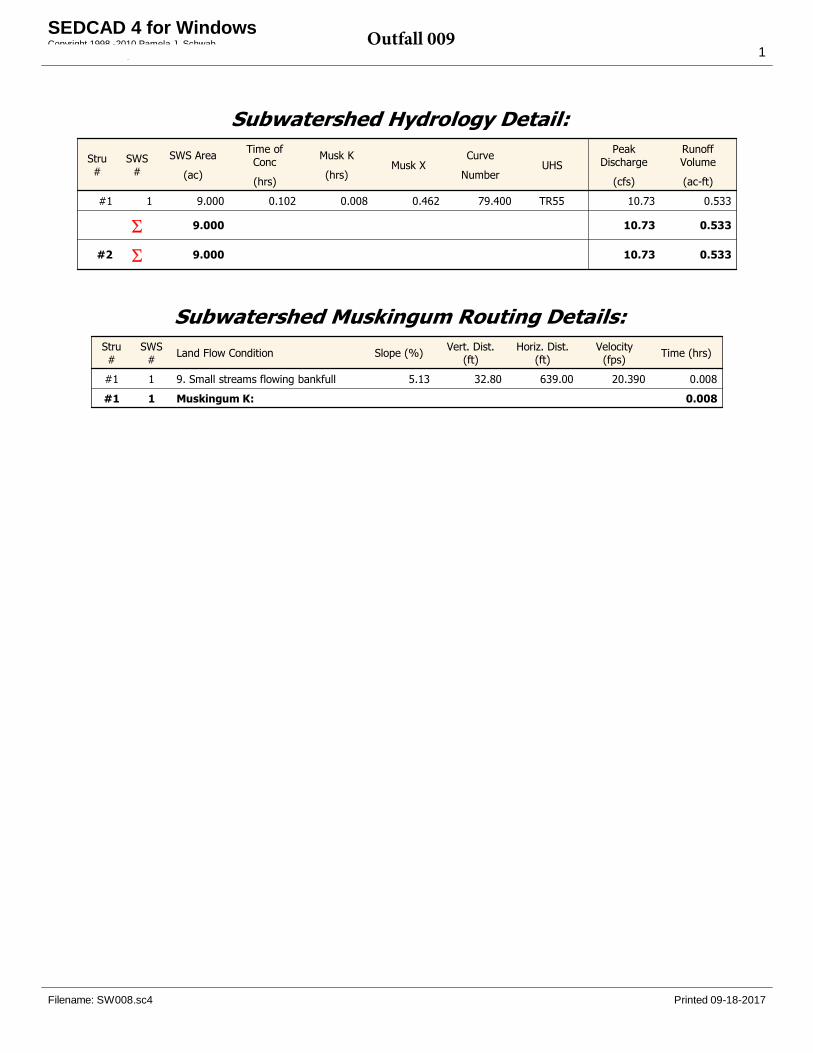
Subwatershed Hydrology Detail:
Stru#
SWS#
SWS Area
(ac)
Time ofConc
(hrs)
Musk K
(hrs)Musk X
Curve
NumberUHS
PeakDischarge
(cfs)
RunoffVolume
(ac-ft)
#1 1 9.000 0.102 0.008 0.462 79.400 TR55 10.73 0.533
9.000 10.73 0.533
#2 9.000 10.73 0.533
Subwatershed Muskingum Routing Details:Stru#
SWS#
Land Flow Condition Slope (%) Vert. Dist.(ft)
Horiz. Dist.(ft)
Velocity(fps)
Time (hrs)
#1 1 9. Small streams flowing bankfull 5.13 32.80 639.00 20.390 0.008
#1 1 Muskingum K: 0.008
Filename: SW008.sc4 Printed 09-18-2017
SEDCAD 4 for WindowsCopyright 1998 -2010 Pamela J. SchwabCivil Software Design, LLC 1
Outfall 009

Subwatershed Hydrology Detail:
Stru#
SWS#
SWS Area
(ac)
Time ofConc
(hrs)
Musk K
(hrs)Musk X
Curve
NumberUHS
PeakDischarge
(cfs)
RunoffVolume
(ac-ft)
#1 1 32.300 0.292 0.000 0.000 72.000 TR55 12.44 1.117
32.300 12.44 1.117
#2 32.300 12.44 1.117
Filename: SW009.sc4 Printed 09-18-2017
SEDCAD 4 for WindowsCopyright 1998 -2010 Pamela J. SchwabCivil Software Design, LLC 1
Outfall 010
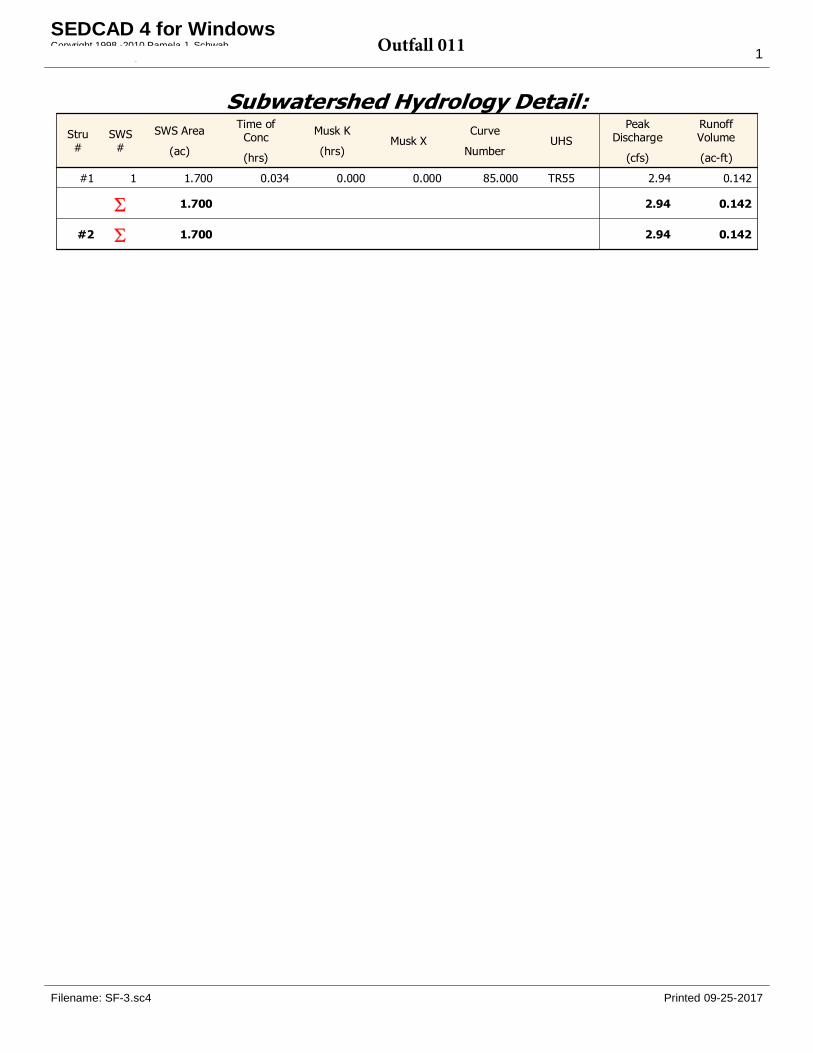
Subwatershed Hydrology Detail:Stru#
SWS#
SWS Area
(ac)
Time ofConc
(hrs)
Musk K
(hrs)Musk X
Curve
NumberUHS
PeakDischarge
(cfs)
RunoffVolume
(ac-ft)
#1 1 1.700 0.034 0.000 0.000 85.000 TR55 2.94 0.142
1.700 2.94 0.142
#2 1.700 2.94 0.142
Filename: SF-3.sc4 Printed 09-25-2017
SEDCAD 4 for WindowsCopyright 1998 -2010 Pamela J. SchwabCivil Software Design, LLC 1Outfall 011

Subwatershed Hydrology Detail:
Stru#
SWS#
SWS Area
(ac)
Time ofConc
(hrs)
Musk K
(hrs)Musk X
Curve
NumberUHS
PeakDischarge
(cfs)
RunoffVolume
(ac-ft)
#1 1 4.330 0.145 0.000 0.000 41.000 TR55 0.00 0.000
4.330 0.00 0.000
#2 4.330 0.00 0.000
Filename: SF-1.sc4 Printed 09-18-2017
SEDCAD 4 for WindowsCopyright 1998 -2010 Pamela J. SchwabCivil Software Design, LLC 1
SF-1
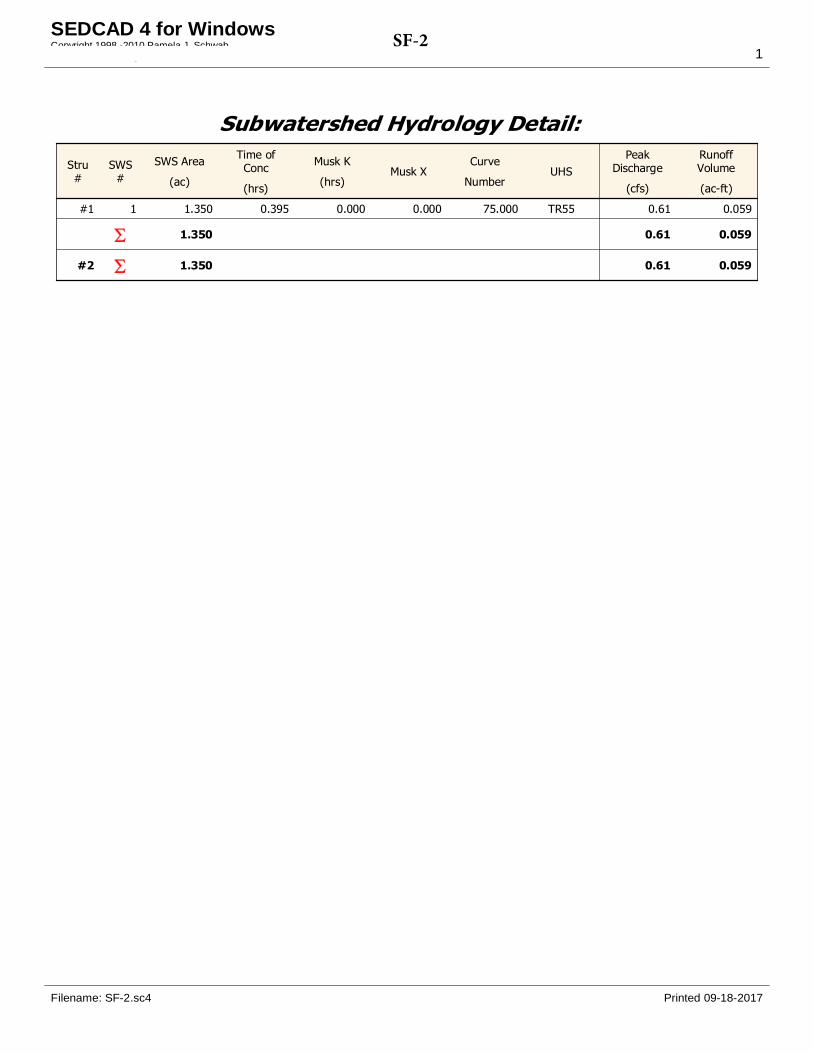
Subwatershed Hydrology Detail:
Stru#
SWS#
SWS Area
(ac)
Time ofConc
(hrs)
Musk K
(hrs)Musk X
Curve
NumberUHS
PeakDischarge
(cfs)
RunoffVolume
(ac-ft)
#1 1 1.350 0.395 0.000 0.000 75.000 TR55 0.61 0.059
1.350 0.61 0.059
#2 1.350 0.61 0.059
Filename: SF-2.sc4 Printed 09-18-2017
SEDCAD 4 for WindowsCopyright 1998 -2010 Pamela J. SchwabCivil Software Design, LLC 1
SF-2
H:\Files\TGOLD\11048\Integrated Discharge Permit\R17 Permit Application Narrative.Docx\\12/11/17\065 12/11/17\7:28 AM
APPENDIX K
WATER RESOURCES MONITORING
FIELD SAMPLING AND ANALYSIS PLAN
H:\Files\TGOLD\11048\Field SAP - 2016\R16 Water Resources SAP.Docx\\6/8/16\065 6/8/16\1:59 PM
WATER RESOURCES MONITORING
FIELD SAMPLING AND ANALYSIS PLAN
BLACK BUTTE COPPER PROJECT
Prepared for:
Tintina Resources Suite 1723 - 595 Burrard Street
Vancouver, BC, Canada V7X1G4
Prepared by:
Hydrometrics, Inc. 3020 Bozeman Avenue
Helena, MT 59601
June 2016
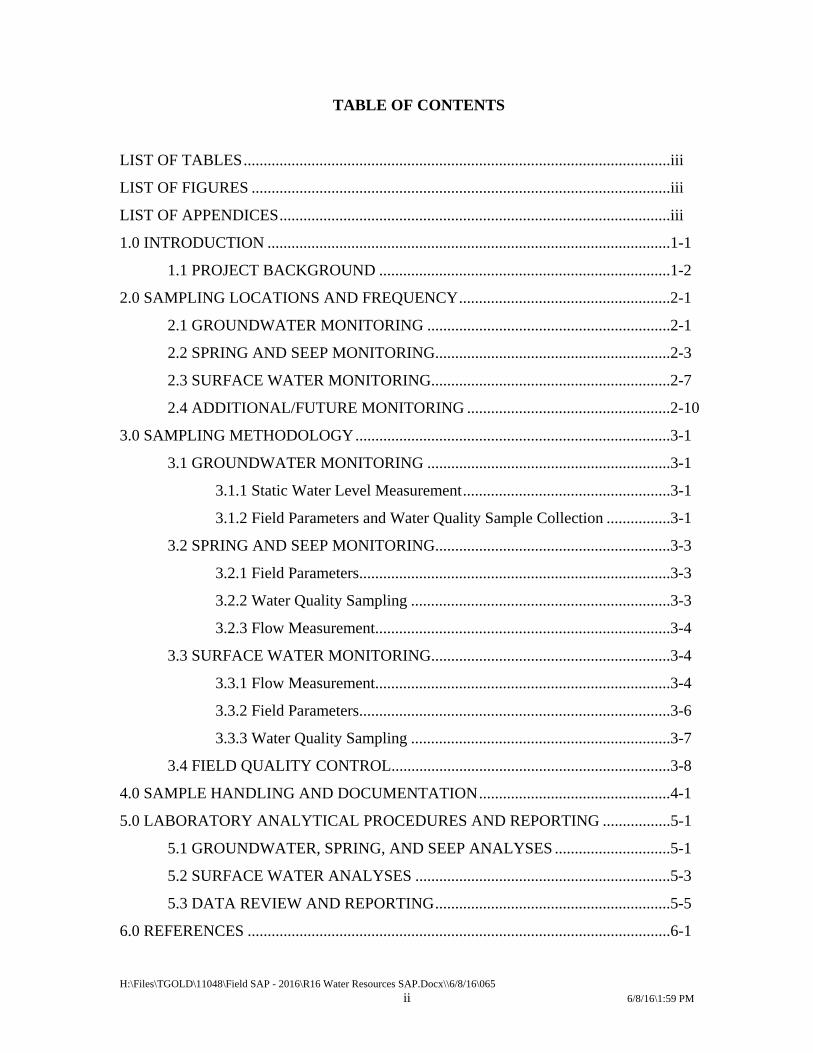
H:\Files\TGOLD\11048\Field SAP - 2016\R16 Water Resources SAP.Docx\\6/8/16\065
ii 6/8/16\1:59 PM
TABLE OF CONTENTS
LIST OF TABLES ...........................................................................................................iii
LIST OF FIGURES .........................................................................................................iii
LIST OF APPENDICES ..................................................................................................iii
1.0 INTRODUCTION .....................................................................................................1-1
1.1 PROJECT BACKGROUND .........................................................................1-2
2.0 SAMPLING LOCATIONS AND FREQUENCY .....................................................2-1
2.1 GROUNDWATER MONITORING .............................................................2-1
2.2 SPRING AND SEEP MONITORING ...........................................................2-3
2.3 SURFACE WATER MONITORING ............................................................2-7
2.4 ADDITIONAL/FUTURE MONITORING ...................................................2-10
3.0 SAMPLING METHODOLOGY ...............................................................................3-1
3.1 GROUNDWATER MONITORING .............................................................3-1
3.1.1 Static Water Level Measurement ....................................................3-1
3.1.2 Field Parameters and Water Quality Sample Collection ................3-1
3.2 SPRING AND SEEP MONITORING ...........................................................3-3
3.2.1 Field Parameters ..............................................................................3-3
3.2.2 Water Quality Sampling .................................................................3-3
3.2.3 Flow Measurement..........................................................................3-4
3.3 SURFACE WATER MONITORING ............................................................3-4
3.3.1 Flow Measurement..........................................................................3-4
3.3.2 Field Parameters ..............................................................................3-6
3.3.3 Water Quality Sampling .................................................................3-7
3.4 FIELD QUALITY CONTROL......................................................................3-8
4.0 SAMPLE HANDLING AND DOCUMENTATION ................................................4-1
5.0 LABORATORY ANALYTICAL PROCEDURES AND REPORTING .................5-1
5.1 GROUNDWATER, SPRING, AND SEEP ANALYSES .............................5-1
5.2 SURFACE WATER ANALYSES ................................................................5-3
5.3 DATA REVIEW AND REPORTING ...........................................................5-5
6.0 REFERENCES ..........................................................................................................6-1
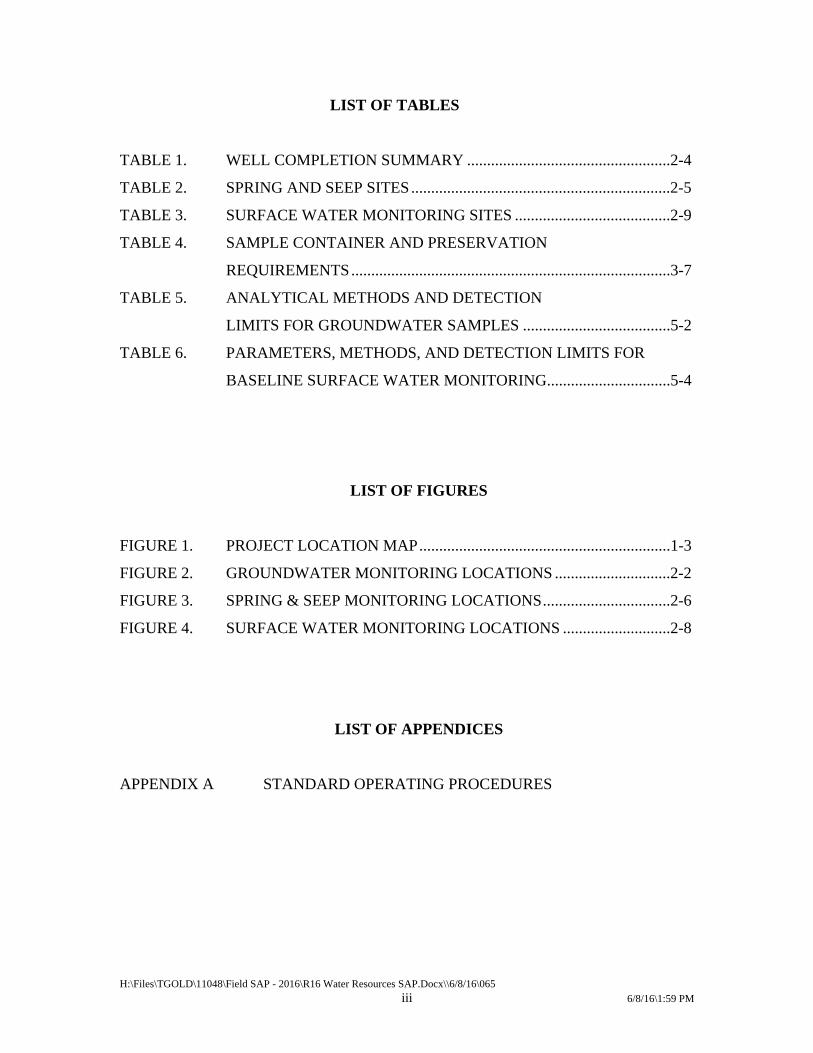
H:\Files\TGOLD\11048\Field SAP - 2016\R16 Water Resources SAP.Docx\\6/8/16\065
iii 6/8/16\1:59 PM
LIST OF TABLES
TABLE 1. WELL COMPLETION SUMMARY ...................................................2-4
TABLE 2. SPRING AND SEEP SITES .................................................................2-5
TABLE 3. SURFACE WATER MONITORING SITES .......................................2-9
TABLE 4. SAMPLE CONTAINER AND PRESERVATION
REQUIREMENTS ................................................................................3-7
TABLE 5. ANALYTICAL METHODS AND DETECTION
LIMITS FOR GROUNDWATER SAMPLES .....................................5-2
TABLE 6. PARAMETERS, METHODS, AND DETECTION LIMITS FOR
BASELINE SURFACE WATER MONITORING ...............................5-4
LIST OF FIGURES
FIGURE 1. PROJECT LOCATION MAP ...............................................................1-3
FIGURE 2. GROUNDWATER MONITORING LOCATIONS .............................2-2
FIGURE 3. SPRING & SEEP MONITORING LOCATIONS ................................2-6
FIGURE 4. SURFACE WATER MONITORING LOCATIONS ...........................2-8
LIST OF APPENDICES
APPENDIX A STANDARD OPERATING PROCEDURES
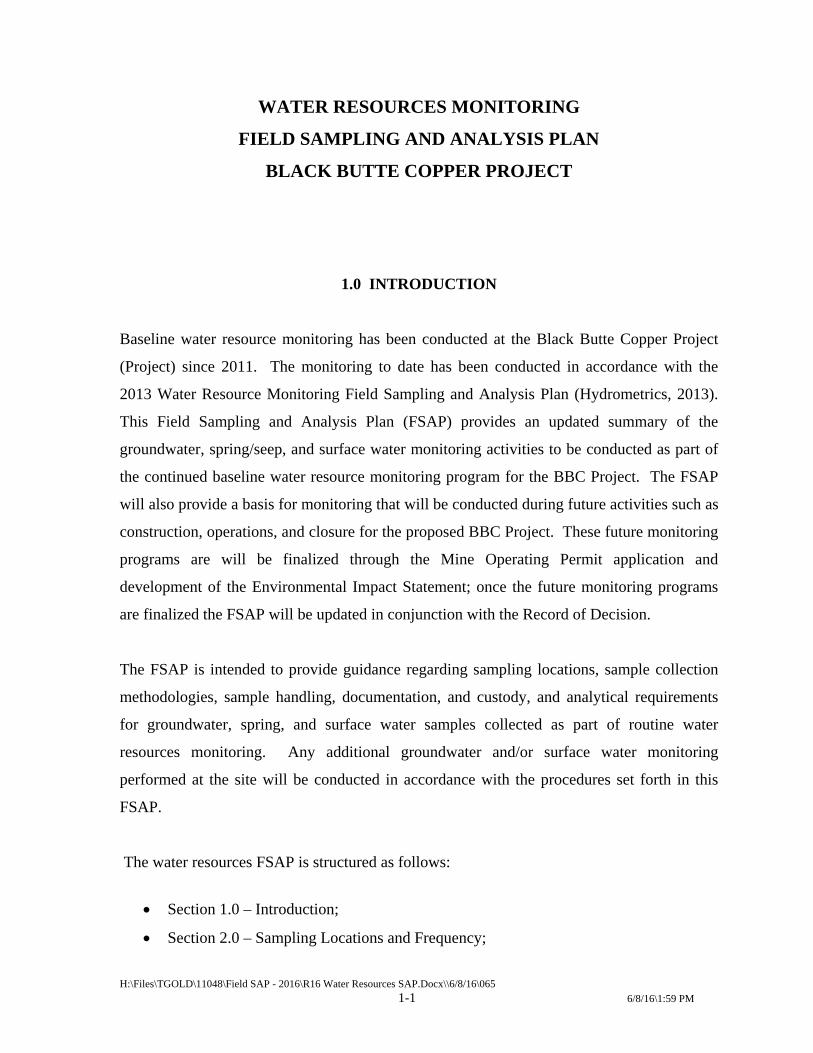
H:\Files\TGOLD\11048\Field SAP - 2016\R16 Water Resources SAP.Docx\\6/8/16\065
1-1 6/8/16\1:59 PM
WATER RESOURCES MONITORING
FIELD SAMPLING AND ANALYSIS PLAN
BLACK BUTTE COPPER PROJECT
1.0 INTRODUCTION
Baseline water resource monitoring has been conducted at the Black Butte Copper Project
(Project) since 2011. The monitoring to date has been conducted in accordance with the
2013 Water Resource Monitoring Field Sampling and Analysis Plan (Hydrometrics, 2013).
This Field Sampling and Analysis Plan (FSAP) provides an updated summary of the
groundwater, spring/seep, and surface water monitoring activities to be conducted as part of
the continued baseline water resource monitoring program for the BBC Project. The FSAP
will also provide a basis for monitoring that will be conducted during future activities such as
construction, operations, and closure for the proposed BBC Project. These future monitoring
programs are will be finalized through the Mine Operating Permit application and
development of the Environmental Impact Statement; once the future monitoring programs
are finalized the FSAP will be updated in conjunction with the Record of Decision.
The FSAP is intended to provide guidance regarding sampling locations, sample collection
methodologies, sample handling, documentation, and custody, and analytical requirements
for groundwater, spring, and surface water samples collected as part of routine water
resources monitoring. Any additional groundwater and/or surface water monitoring
performed at the site will be conducted in accordance with the procedures set forth in this
FSAP.
The water resources FSAP is structured as follows:
Section 1.0 – Introduction;
Section 2.0 – Sampling Locations and Frequency;

H:\Files\TGOLD\11048\Field SAP - 2016\R16 Water Resources SAP.Docx\\6/8/16\065
1-2 6/8/16\1:59 PM
Section 3.0 – Sampling Methodology;
Section 4.0 – Sample Handling and Documentation;
Section 5.0 – Laboratory Analytical Procedures and Reporting; and
Section 6.0 – References.
1.1 PROJECT BACKGROUND
The Project is located approximately 16 miles north of White Sulphur Springs, Montana in
Meagher County (Figure 1). The project is in the early stages of permitting an underground
copper deposit and is collecting baseline data for use in project development. The ore body
consists of a massive sulfide deposit within the Newland Formation of the Precambrian Belt
Supergroup. The Newland Formation can be divided into a lower member that consists of
primarily dolomitic shale and an upper member of interstratified shales and carbonates
(Nelson, 1963). The project site lies within the Sheep Creek drainage.
Water resource monitoring conducted at the site will be used to establish baseline data
including surface water flows, groundwater level elevations, and water quality in the vicinity
of the project area to be used in project development and future permitting. Monitoring
events will be conducted during each calendar quarter (i.e., January-March, April-June, July-
September, and October-December time periods).
Groundwater, including springs and seeps, and surface water monitoring will be conducted in
accordance with Hydrometrics’ Standard Operating Procedures (SOPs). Water quality
samples will be submitted to Energy Laboratories in Helena, MT for analyses of physical
parameters, common constituents, nutrients, and a comprehensive suite of trace constituents.
With the exception of aluminum, trace constituents will be analyzed for the total recoverable
fraction for surface water samples; aluminum will be analyzed for the dissolved fraction. All
trace constituents for groundwater samples will be analyzed for the dissolved fraction.
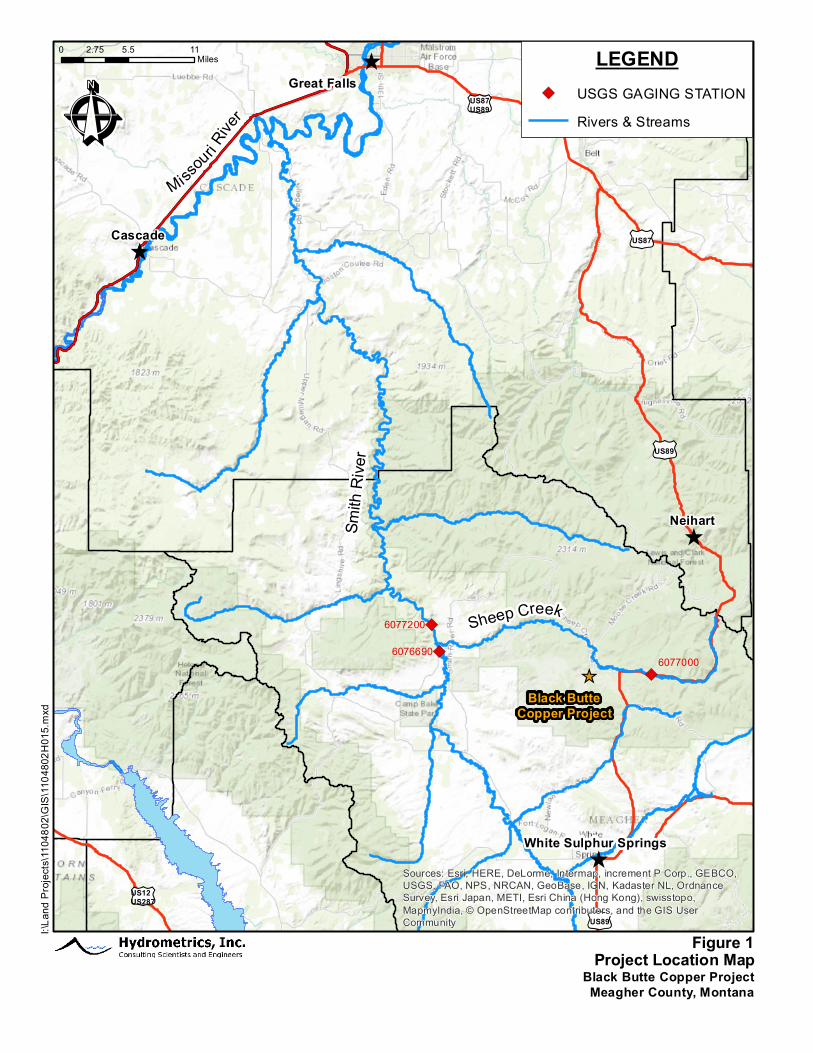
_̂
^
^
^
^
")
")
")
£¤US87US89
£¤US12US287
£¤US89
£¤US87
£¤US89
Sheep Creek
Smith
Rive
r
§̈¦I15
§̈¦I15
§̈¦I15
£¤US12
£¤US87
£¤US89
Missouri R
ive
r
Black ButteCopper Project
6077000
6077200
6076690
Neihart
Cascade
Great Falls
White Sulphur SpringsSources: Esri, HERE, DeLorme, Intermap, increment P Corp., GEBCO,USGS, FAO, NPS, NRCAN, GeoBase, IGN, Kadaster NL, OrdnanceSurvey, Esri Japan, METI, Esri China (Hong Kong), swisstopo,MapmyIndia, © OpenStreetMap contributors, and the GIS UserCommunity
0 5.5 112.75Miles
ÊI:\L
and P
rojec
ts\11
0480
2\GIS\
1104
802H
015.m
xd
Project Location MapBlack Butte Copper ProjectMeagher County, Montana
Figure 1
LEGEND") USGS GAGING STATION
Rivers & Streams
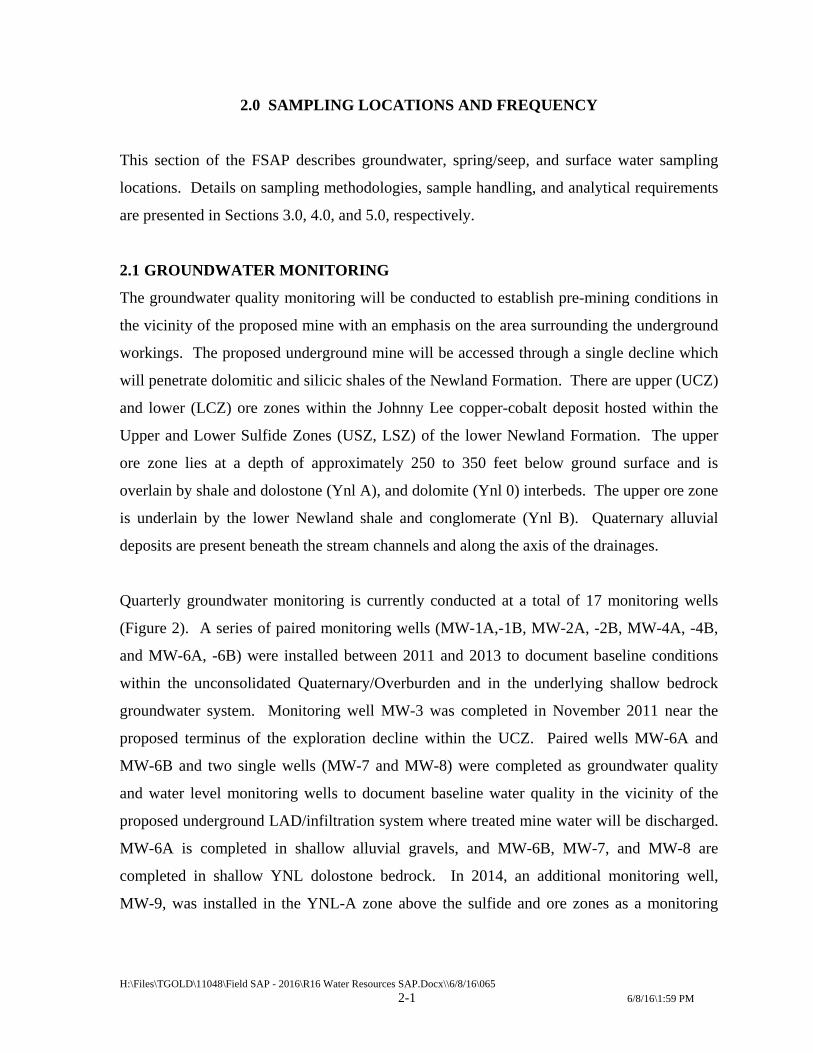
H:\Files\TGOLD\11048\Field SAP - 2016\R16 Water Resources SAP.Docx\\6/8/16\065
2-1 6/8/16\1:59 PM
2.0 SAMPLING LOCATIONS AND FREQUENCY
This section of the FSAP describes groundwater, spring/seep, and surface water sampling
locations. Details on sampling methodologies, sample handling, and analytical requirements
are presented in Sections 3.0, 4.0, and 5.0, respectively.
2.1 GROUNDWATER MONITORING
The groundwater quality monitoring will be conducted to establish pre-mining conditions in
the vicinity of the proposed mine with an emphasis on the area surrounding the underground
workings. The proposed underground mine will be accessed through a single decline which
will penetrate dolomitic and silicic shales of the Newland Formation. There are upper (UCZ)
and lower (LCZ) ore zones within the Johnny Lee copper-cobalt deposit hosted within the
Upper and Lower Sulfide Zones (USZ, LSZ) of the lower Newland Formation. The upper
ore zone lies at a depth of approximately 250 to 350 feet below ground surface and is
overlain by shale and dolostone (Ynl A), and dolomite (Ynl 0) interbeds. The upper ore zone
is underlain by the lower Newland shale and conglomerate (Ynl B). Quaternary alluvial
deposits are present beneath the stream channels and along the axis of the drainages.
Quarterly groundwater monitoring is currently conducted at a total of 17 monitoring wells
(Figure 2). A series of paired monitoring wells (MW-1A,-1B, MW-2A, -2B, MW-4A, -4B,
and MW-6A, -6B) were installed between 2011 and 2013 to document baseline conditions
within the unconsolidated Quaternary/Overburden and in the underlying shallow bedrock
groundwater system. Monitoring well MW-3 was completed in November 2011 near the
proposed terminus of the exploration decline within the UCZ. Paired wells MW-6A and
MW-6B and two single wells (MW-7 and MW-8) were completed as groundwater quality
and water level monitoring wells to document baseline water quality in the vicinity of the
proposed underground LAD/infiltration system where treated mine water will be discharged.
MW-6A is completed in shallow alluvial gravels, and MW-6B, MW-7, and MW-8 are
completed in shallow YNL dolostone bedrock. In 2014, an additional monitoring well,
MW-9, was installed in the YNL-A zone above the sulfide and ore zones as a monitoring
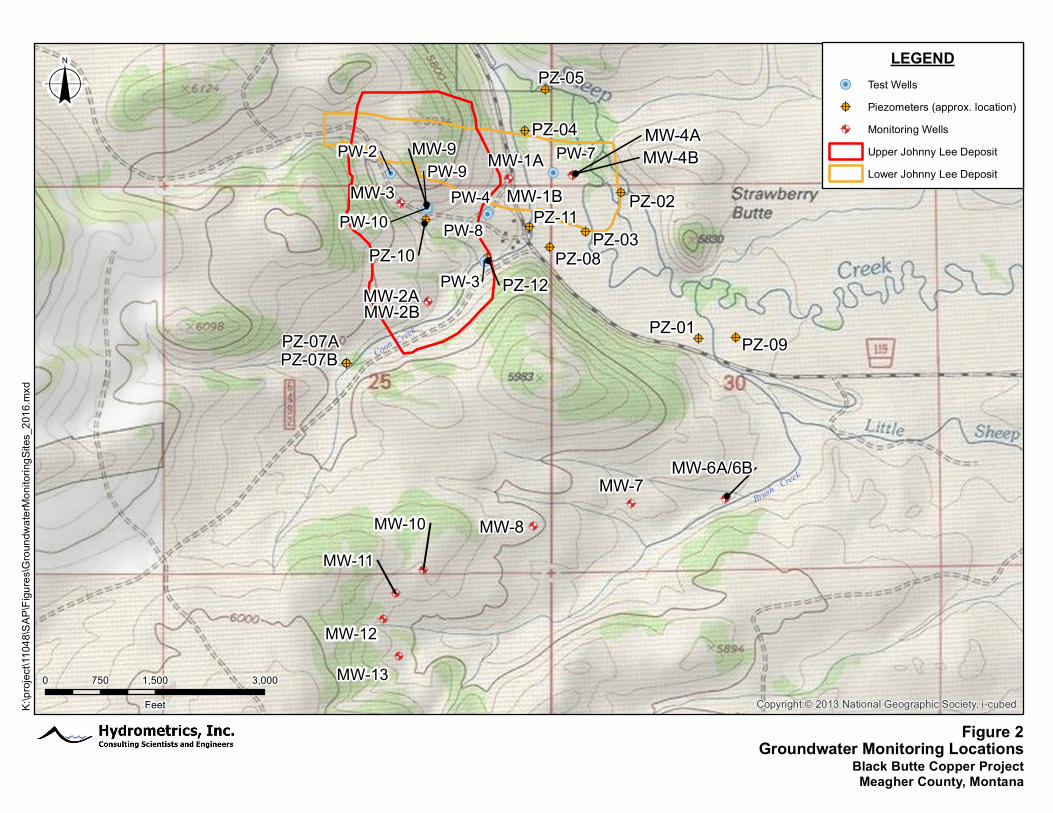
@A
@A
@A@A
@A
@A@A
@A
@A@A
@A
@?
@?
@?
@?
@?
@?@?
@?
@?
@?
@?
@?
@A
@A
@A
@A
&(
&(
&(
&(&(&(
&(
MW-9
MW-7
MW-8
MW-3MW-4BMW-4A
MW-2A
MW-1AMW-1B
MW-2B
MW-6A/6B
PZ-11
PZ-12PZ-10
PZ-09
PZ-08
PZ-05
PZ-04
PZ-03PZ-02
PZ-01PZ-07APZ-07B
MW-10MW-11
MW-12
MW-13
PW-8
PW-9PW-4
PW-2
PW-3
PW-7
PW-10
Copyright:© 2013 National Geographic Society, i-cubed
LEGEND&( Test Wells@? Piezometers (approx. location)@A Monitoring Wells
Upper Johnny Lee DepositLower Johnny Lee Deposit
o
Coon
0 1,500 3,000750
FeetK:\pro
ject\1
1048
\SAP
\Figu
res\G
round
water
Monit
oring
Sites
_201
6.mxd
Groundwater Monitoring LocationsBlack Butte Copper ProjectMeagher County, Montana
Creek
Figure 2
Brush Creek
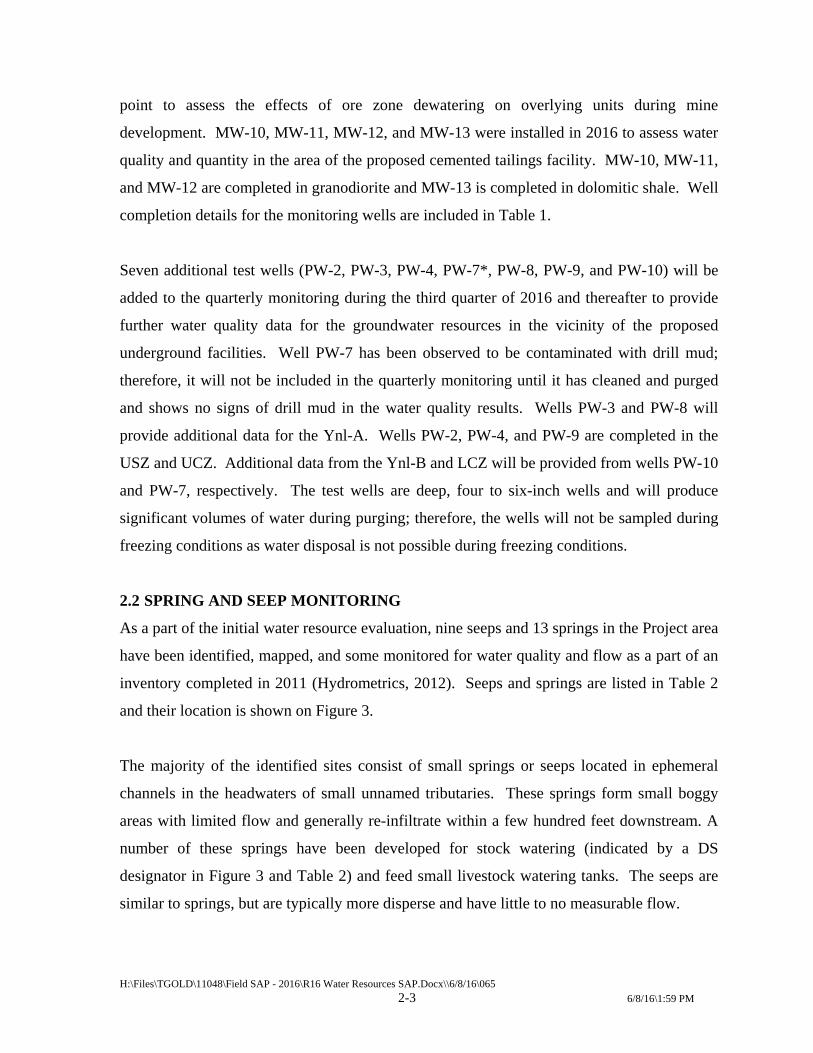
H:\Files\TGOLD\11048\Field SAP - 2016\R16 Water Resources SAP.Docx\\6/8/16\065
2-3 6/8/16\1:59 PM
point to assess the effects of ore zone dewatering on overlying units during mine
development. MW-10, MW-11, MW-12, and MW-13 were installed in 2016 to assess water
quality and quantity in the area of the proposed cemented tailings facility. MW-10, MW-11,
and MW-12 are completed in granodiorite and MW-13 is completed in dolomitic shale. Well
completion details for the monitoring wells are included in Table 1.
Seven additional test wells (PW-2, PW-3, PW-4, PW-7*, PW-8, PW-9, and PW-10) will be
added to the quarterly monitoring during the third quarter of 2016 and thereafter to provide
further water quality data for the groundwater resources in the vicinity of the proposed
underground facilities. Well PW-7 has been observed to be contaminated with drill mud;
therefore, it will not be included in the quarterly monitoring until it has cleaned and purged
and shows no signs of drill mud in the water quality results. Wells PW-3 and PW-8 will
provide additional data for the Ynl-A. Wells PW-2, PW-4, and PW-9 are completed in the
USZ and UCZ. Additional data from the Ynl-B and LCZ will be provided from wells PW-10
and PW-7, respectively. The test wells are deep, four to six-inch wells and will produce
significant volumes of water during purging; therefore, the wells will not be sampled during
freezing conditions as water disposal is not possible during freezing conditions.
2.2 SPRING AND SEEP MONITORING
As a part of the initial water resource evaluation, nine seeps and 13 springs in the Project area
have been identified, mapped, and some monitored for water quality and flow as a part of an
inventory completed in 2011 (Hydrometrics, 2012). Seeps and springs are listed in Table 2
and their location is shown on Figure 3.
The majority of the identified sites consist of small springs or seeps located in ephemeral
channels in the headwaters of small unnamed tributaries. These springs form small boggy
areas with limited flow and generally re-infiltrate within a few hundred feet downstream. A
number of these springs have been developed for stock watering (indicated by a DS
designator in Figure 3 and Table 2) and feed small livestock watering tanks. The seeps are
similar to springs, but are typically more disperse and have little to no measurable flow.
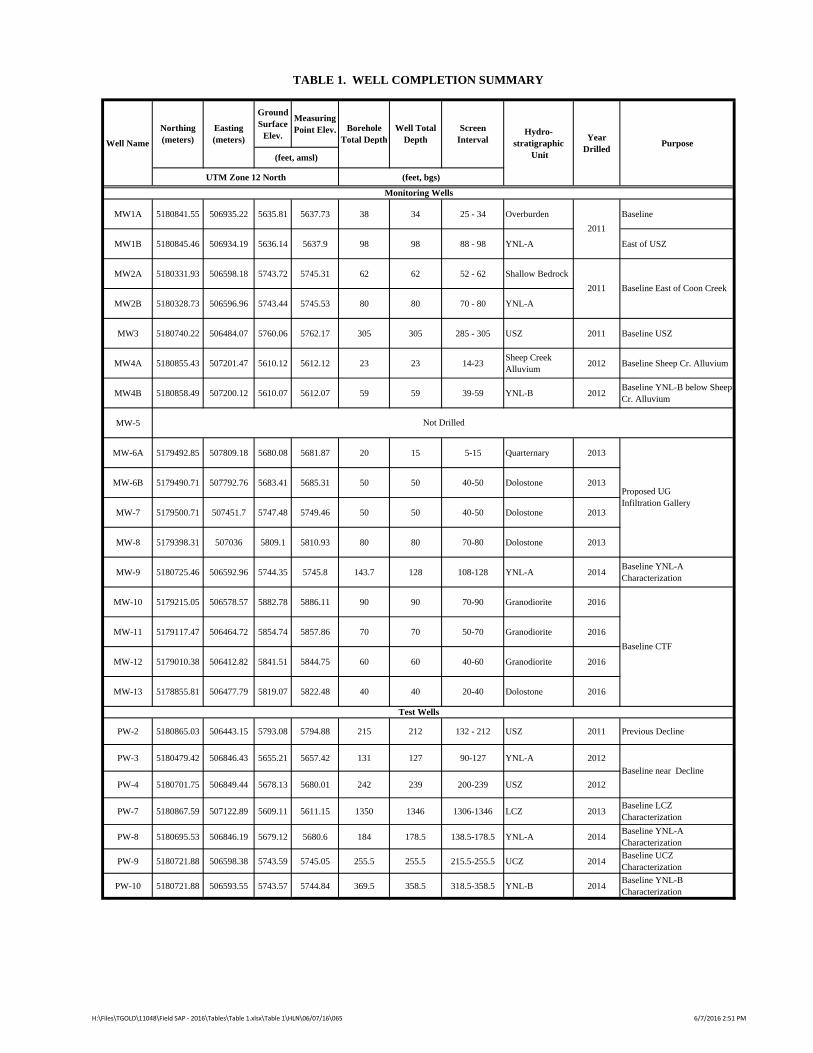
Ground Surface
Elev.
Measuring Point Elev.
MW1A 5180841.55 506935.22 5635.81 5637.73 38 34 25 - 34 Overburden Baseline
MW1B 5180845.46 506934.19 5636.14 5637.9 98 98 88 - 98 YNL-A East of USZ
MW2A 5180331.93 506598.18 5743.72 5745.31 62 62 52 - 62 Shallow Bedrock
MW2B 5180328.73 506596.96 5743.44 5745.53 80 80 70 - 80 YNL-A
MW3 5180740.22 506484.07 5760.06 5762.17 305 305 285 - 305 USZ 2011 Baseline USZ
MW4A 5180855.43 507201.47 5610.12 5612.12 23 23 14-23Sheep Creek Alluvium
2012 Baseline Sheep Cr. Alluvium
MW4B 5180858.49 507200.12 5610.07 5612.07 59 59 39-59 YNL-B 2012Baseline YNL-B below Sheep Cr. Alluvium
MW-5
MW-6A 5179492.85 507809.18 5680.08 5681.87 20 15 5-15 Quarternary 2013
MW-6B 5179490.71 507792.76 5683.41 5685.31 50 50 40-50 Dolostone 2013
MW-7 5179500.71 507451.7 5747.48 5749.46 50 50 40-50 Dolostone 2013
MW-8 5179398.31 507036 5809.1 5810.93 80 80 70-80 Dolostone 2013
MW-9 5180725.46 506592.96 5744.35 5745.8 143.7 128 108-128 YNL-A 2014Baseline YNL-A Characterization
MW-10 5179215.05 506578.57 5882.78 5886.11 90 90 70-90 Granodiorite 2016
MW-11 5179117.47 506464.72 5854.74 5857.86 70 70 50-70 Granodiorite 2016
MW-12 5179010.38 506412.82 5841.51 5844.75 60 60 40-60 Granodiorite 2016
MW-13 5178855.81 506477.79 5819.07 5822.48 40 40 20-40 Dolostone 2016
PW-2 5180865.03 506443.15 5793.08 5794.88 215 212 132 - 212 USZ 2011 Previous Decline
PW-3 5180479.42 506846.43 5655.21 5657.42 131 127 90-127 YNL-A 2012
PW-4 5180701.75 506849.44 5678.13 5680.01 242 239 200-239 USZ 2012
PW-7 5180867.59 507122.89 5609.11 5611.15 1350 1346 1306-1346 LCZ 2013Baseline LCZ Characterization
PW-8 5180695.53 506846.19 5679.12 5680.6 184 178.5 138.5-178.5 YNL-A 2014Baseline YNL-A Characterization
PW-9 5180721.88 506598.38 5743.59 5745.05 255.5 255.5 215.5-255.5 UCZ 2014Baseline UCZ Characterization
PW-10 5180721.88 506593.55 5743.57 5744.84 369.5 358.5 318.5-358.5 YNL-B 2014Baseline YNL-B Characterization
Monitoring Wells
TABLE 1. WELL COMPLETION SUMMARY
Well Name
Northing (meters)
Easting (meters)
Borehole Total Depth
Well Total Depth
Screen Interval
Hydro-stratigraphic
Unit
Year Drilled
Purpose
(feet, amsl)
UTM Zone 12 North (feet, bgs)
2011
Test Wells
Baseline near Decline
Not Drilled
Proposed UGInfiltration Gallery
Baseline CTF
2011 Baseline East of Coon Creek
H:\Files\TGOLD\11048\Field SAP ‐ 2016\Tables\Table 1.xlsx\Table 1\HLN\06/07/16\065 6/7/2016 2:51 PM
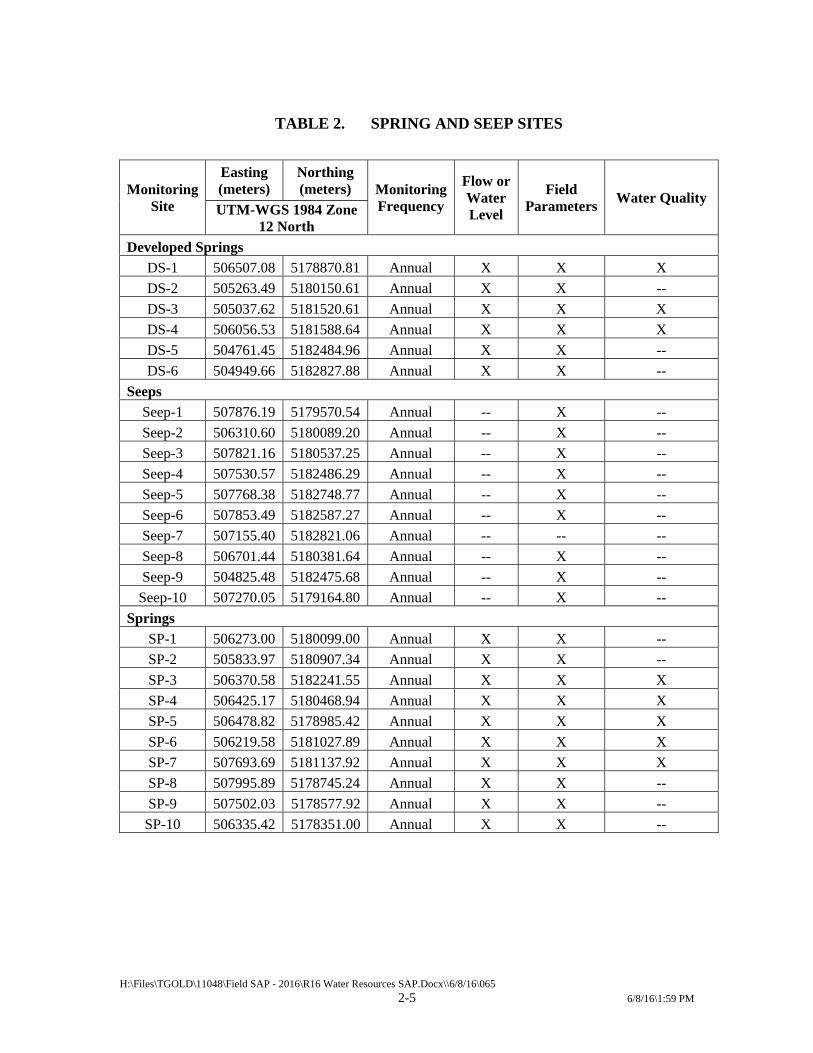
H:\Files\TGOLD\11048\Field SAP - 2016\R16 Water Resources SAP.Docx\\6/8/16\065
2-5 6/8/16\1:59 PM
TABLE 2. SPRING AND SEEP SITES
Monitoring Site
Easting (meters)
Northing (meters) Monitoring
Frequency
Flow orWater Level
Field Parameters
Water Quality UTM-WGS 1984 Zone
12 North
Developed Springs
DS-1 506507.08 5178870.81 Annual X X X
DS-2 505263.49 5180150.61 Annual X X --
DS-3 505037.62 5181520.61 Annual X X X
DS-4 506056.53 5181588.64 Annual X X X
DS-5 504761.45 5182484.96 Annual X X --
DS-6 504949.66 5182827.88 Annual X X --
Seeps
Seep-1 507876.19 5179570.54 Annual -- X --
Seep-2 506310.60 5180089.20 Annual -- X --
Seep-3 507821.16 5180537.25 Annual -- X --
Seep-4 507530.57 5182486.29 Annual -- X --
Seep-5 507768.38 5182748.77 Annual -- X --
Seep-6 507853.49 5182587.27 Annual -- X --
Seep-7 507155.40 5182821.06 Annual -- -- --
Seep-8 506701.44 5180381.64 Annual -- X --
Seep-9 504825.48 5182475.68 Annual -- X --
Seep-10 507270.05 5179164.80 Annual -- X --
Springs
SP-1 506273.00 5180099.00 Annual X X --
SP-2 505833.97 5180907.34 Annual X X --
SP-3 506370.58 5182241.55 Annual X X X
SP-4 506425.17 5180468.94 Annual X X X
SP-5 506478.82 5178985.42 Annual X X X
SP-6 506219.58 5181027.89 Annual X X X
SP-7 507693.69 5181137.92 Annual X X X
SP-8 507995.89 5178745.24 Annual X X --
SP-9 507502.03 5178577.92 Annual X X --
SP-10 506335.42 5178351.00 Annual X X --
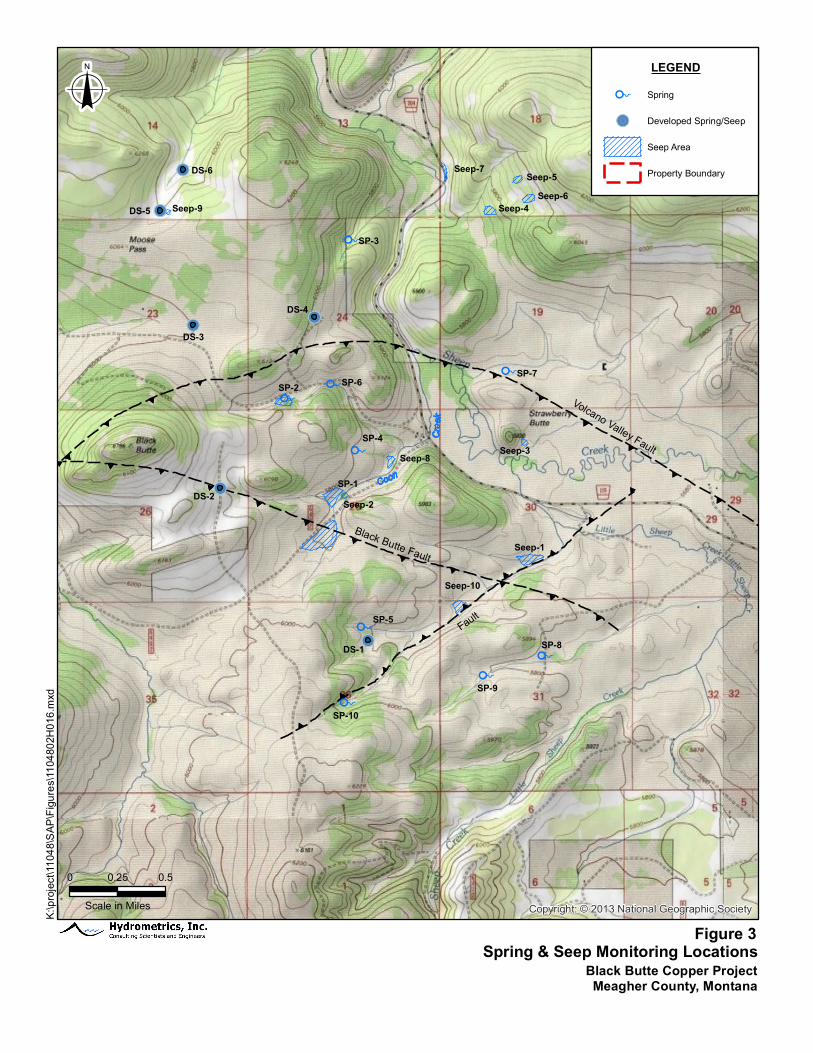
((
((
((
((
((
((
((
((
((
((
((
((
((
((
((
((
((((
((
((((
((
((
((
((
((
((
((
((
((
((
((
((
((
((
((
((
((
((
((
((
((
((
((
((
((
((
((((((
&)
&)&)
&)
&)
&)
D
D
D
D
D
D
D
DD
SP-1
DS-5
Seep-10
SP-10
SP-9
SP-8
SP-6
SP-5
SP-4
SP-2
SP-3
SP-7
DS-1
DS-2
DS-4
DS-3
DS-6
Seep-1
Seep-4Seep-6
Seep-8
Seep-5Seep-7
Seep-3
Seep-2
Seep-9
Volcano Valley Fault
Black Butte Fault
Fault
Copyright: © 2013 National Geographic Society
oLEGEND
D Spring
&) Developed Spring/Seep
Seep Area
Property Boundary
0 0.50.25
Scale in Miles
K:\pro
ject\1
1048
\SAP
\Figu
res\11
0480
2H01
6.mxd
Spring & Seep Monitoring LocationsBlack Butte Copper ProjectMeagher County, Montana
Figure 3
H:\Files\TGOLD\11048\Field SAP - 2016\R16 Water Resources SAP.Docx\\6/8/16\065
2-7 6/8/16\1:59 PM
Slightly larger spring and seep areas were identified along the lower reaches of Coon Creek
and on Little Sheep Creek and support perennial flow on these lower stream reaches.
Springs and seeps are monitored annually during the third quarter water resource monitoring
event. Field parameters are collected at all spring and seep sites and flow is measured at all
springs. In addition, water quality samples are collected at select springs (Table 2).
2.3 SURFACE WATER MONITORING
The project site lies within the Sheep Creek drainage. Sheep Creek originates in the Little
Belt Mountains at an elevation of about 7,600 feet and discharges to the Smith River
approximately 34 river miles to the west at an elevation of 4,380 feet. The project area is
approximately 17 miles above the confluence with the Smith River. Sheep Creek flows in a
meandering channel through a broad alluvial valley upstream of the project site but enters a
constricted bedrock canyon just downstream.
Primary tributaries to Sheep Creek in the immediate project area are Little Sheep Creek, and
Coon Creek (Figure 4). There are also two un-named tributaries that collect flow from the
far side of the valley (to the northeast) and discharge to Sheep Creek immediately upstream
and downstream of Strawberry Butte. Black Butte Creek lies just to the southwest of the
project area and flows to the west away from the site until it discharges to Sheep Creek
further downstream.
Baseline surface water monitoring is conducted on thirteen surface water stations within the
project vicinity on a quarterly basis. Quarterly monitoring is intended to document surface
water conditions at a range of flows. All thirteen sites will be monitored for field parameters
and flow (as described in Section 3.2); eight sites will be samples for water quality
monitoring. The location and monitoring conducted at each surface water monitoring site is
listed in Table 3. Figure 4 shows the location of each site.
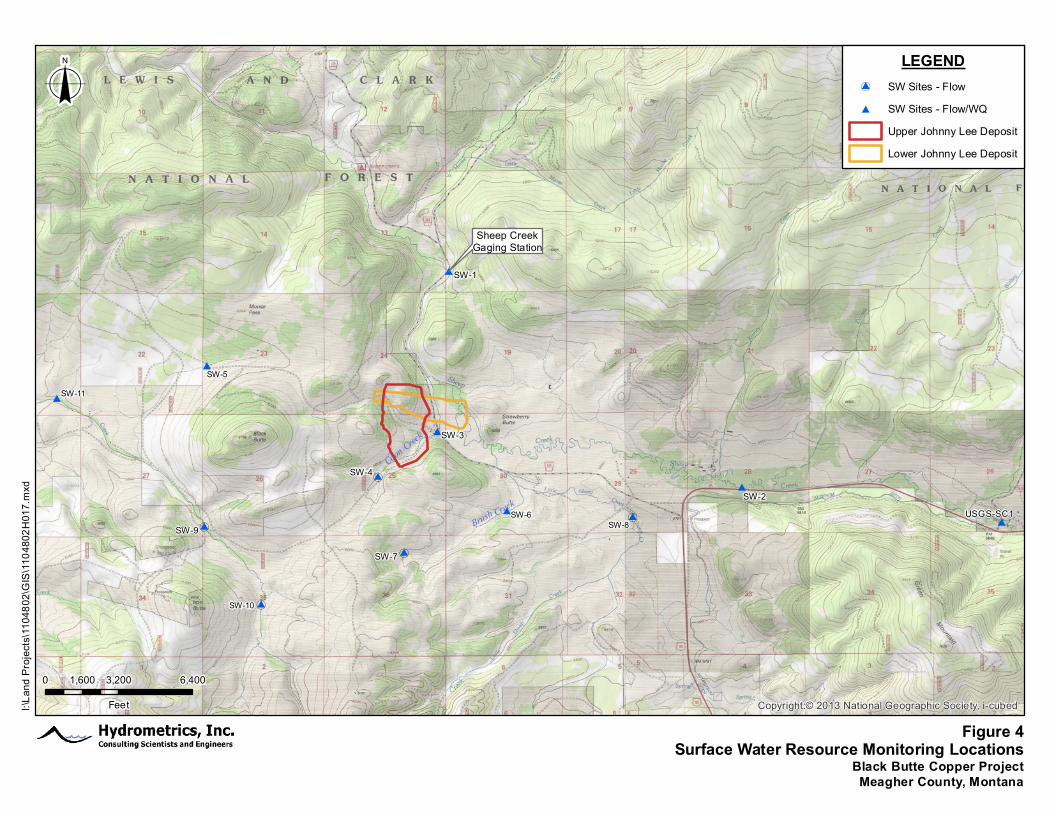
#
#
#
#
#
#
##(
#(
#(
#(
#(
SW-5
SW-6
SW-11
SW-8
SW-10
SW-9
SW-7
SW-4
SW-3
SW-2
SW-1
USGS-SC1
Copyright:© 2013 National Geographic Society, i-cubed
LEGEND#( SW Sites - Flow# SW Sites - Flow/WQ
Upper Johnny Lee DepositLower Johnny Lee Deposit
o
Coon
0 3,200 6,4001,600
FeetI:\Lan
d Proj
ects\
1104
802\G
IS\11
0480
2H01
7.mxd
Sheep CreekGaging Station
Surface Water Resource Monitoring LocationsBlack Butte Copper ProjectMeagher County, Montana
Creek
Figure 4
Brush Creek
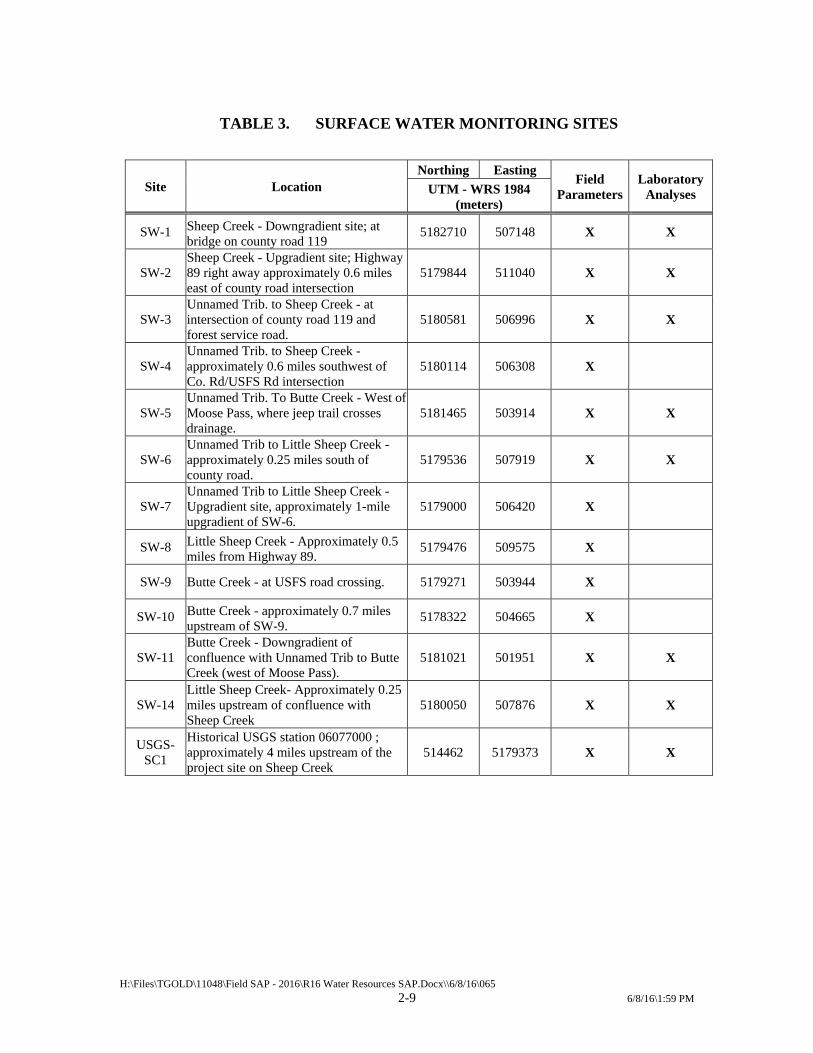
H:\Files\TGOLD\11048\Field SAP - 2016\R16 Water Resources SAP.Docx\\6/8/16\065
2-9 6/8/16\1:59 PM
TABLE 3. SURFACE WATER MONITORING SITES
Site Location Northing Easting
Field Parameters
Laboratory Analyses UTM - WRS 1984
(meters)
SW-1 Sheep Creek - Downgradient site; at bridge on county road 119
5182710 507148 X X
SW-2 Sheep Creek - Upgradient site; Highway 89 right away approximately 0.6 miles east of county road intersection
5179844 511040 X X
SW-3 Unnamed Trib. to Sheep Creek - at intersection of county road 119 and forest service road.
5180581 506996 X X
SW-4 Unnamed Trib. to Sheep Creek - approximately 0.6 miles southwest of Co. Rd/USFS Rd intersection
5180114 506308 X
SW-5 Unnamed Trib. To Butte Creek - West of Moose Pass, where jeep trail crosses drainage.
5181465 503914 X X
SW-6 Unnamed Trib to Little Sheep Creek - approximately 0.25 miles south of county road.
5179536 507919 X X
SW-7 Unnamed Trib to Little Sheep Creek - Upgradient site, approximately 1-mile upgradient of SW-6.
5179000 506420 X
SW-8 Little Sheep Creek - Approximately 0.5 miles from Highway 89.
5179476 509575 X
SW-9 Butte Creek - at USFS road crossing. 5179271 503944 X
SW-10 Butte Creek - approximately 0.7 miles upstream of SW-9.
5178322 504665 X
SW-11 Butte Creek - Downgradient of confluence with Unnamed Trib to Butte Creek (west of Moose Pass).
5181021 501951 X X
SW-14 Little Sheep Creek- Approximately 0.25 miles upstream of confluence with Sheep Creek
5180050 507876 X X
USGS-SC1
Historical USGS station 06077000 ; approximately 4 miles upstream of the project site on Sheep Creek
514462 5179373 X X

H:\Files\TGOLD\11048\Field SAP - 2016\R16 Water Resources SAP.Docx\\6/8/16\065
2-10 6/8/16\1:59 PM
2.4 ADDITIONAL/FUTURE MONITORING
Additional water resource monitoring has consisted of spring and seep, surface water
monitoring during spring runoff, and additional groundwater monitoring associated with
hydrological investigations. As noted in Section 1.0, future monitoring programs are being
developed in conjunction with the Mine Operating Permit application and the Environmental
Impact Statement for different phases of the project (construction, operations, and closure).
The monitoring conducted under these programs and any future programs will be conducted
in accordance with this FSAP. A new FSAP will be developed for the different phases of the
project once the future monitoring programs are completely developed and a record of
decision has been finalized.
H:\Files\TGOLD\11048\Field SAP - 2016\R16 Water Resources SAP.Docx\\6/8/16\065
3-1 6/8/16\1:59 PM
3.0 SAMPLING METHODOLOGY
The sampling methodologies to be utilized for groundwater, spring/seep, and surface water
monitoring conducted as part of the quarterly monitoring program are detailed below:
Groundwater Monitoring Section 3.1, Spring and Seep Monitoring 3.2, and Surface Water
Monitoring Section 3.3. Spring and seep monitoring will be conducted in accordance with
surface water monitoring for field parameters and sample collection methods; however,
sample containers and preservation will be conducted in accordance with groundwater
procedures. SOPs for performing field activities are located in Appendix A. Collection of
field quality control (QC) samples for all sample media is discussed in Section 3.3.
3.1 GROUNDWATER MONITORING
Groundwater monitoring will include collection of field parameters and water quality
samples from seven monitoring wells subsequent to well completion. The collection of
groundwater samples from site monitoring wells will generally consist of three steps:
1. Measurement of static water level;
2. Well purging and monitoring for field parameter stabilization; and
3. Water quality sample collection.
3.1.1 Static Water Level Measurement
Prior to collection of samples or removal/introduction of any equipment into the well, the
static water level will be measured at each well using an electric water level probe to
determine the depth of groundwater below a specified measuring point (typically top of
PVC). Water level measurements will be combined with surveyed measuring point
elevations to compute groundwater elevations at each monitoring point.
3.1.2 Field Parameters and Water Quality Sample Collection
Dedicated HDPE tubing will be installed in monitoring wells, and a submersible pump will
be used to purge and sample the monitoring well. Purging consisted of removing three well
volumes while routinely monitoring field parameters (pH, dissolved oxygen (DO),
H:\Files\TGOLD\11048\Field SAP - 2016\R16 Water Resources SAP.Docx\\6/8/16\065
3-2 6/8/16\1:59 PM
temperature, specific conductance (SC)) during removal of each well volume. Field meters
will be calibrated daily according to factory instructions, with calibration results recorded on
calibration forms. Purge water will be discharged in such a manner that it will not discharge
to surface water.
Samples for laboratory analysis will be collected after one of the following purge conditions
are met:
A minimum of three well volumes have been removed and successive field parameter
measurements agree to within the stability criteria given below; or
At least five well volumes have been removed although field parameter stabilization
criteria are not yet met; or
The well has been pumped dry and allowed to recover sufficiently such that adequate
sample volumes for rinsing equipment and collecting samples can be removed.
Criteria for field parameter stabilization are as follows:
Parameter (Units) Stability Criteria pH (standard units) 0.1 s.u. Water temperature (°C) 0.2 °C
Specific conductance (µmhos/cm) 5% (SC 100 µmhos/cm) 3% (SC > 100 µmhos/cm)
Dissolved oxygen (mg/L) 0.3 mg/L
NOTE: Stability criteria obtained from USGS National Field Manual for the Collection of Water Quality Data: Chapter A4, Collection of Water Samples (September 1999).
Following well purging, final field parameter measurements will be collected and recorded,
and groundwater quality samples obtained. Samples for trace constituents will be filtered
through a 0.45 µm filter prior to preservation, to allow analysis for the dissolved fraction.
Sample containers will be rinsed three times with sample water prior to sample collection,
then preserved as appropriate for the intended analysis (e.g., nitric acid preservation to pH <2
for metals analysis), and stored on ice in coolers at approximately 42°C during transport.
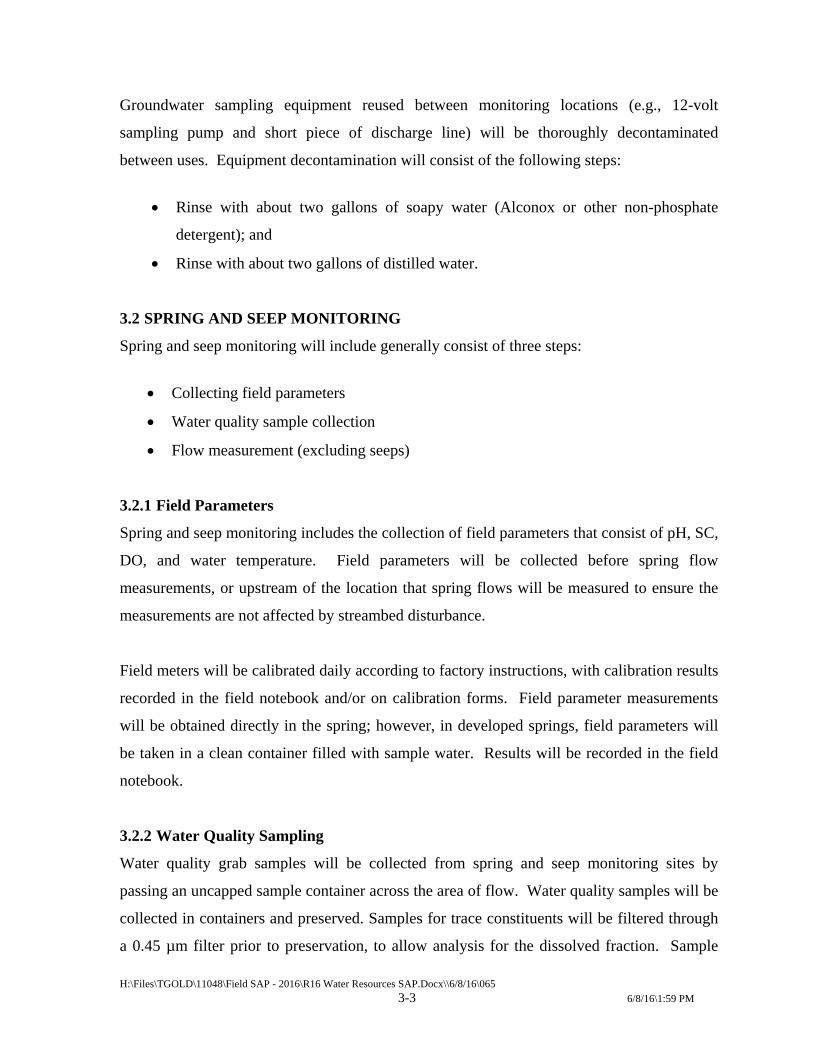
H:\Files\TGOLD\11048\Field SAP - 2016\R16 Water Resources SAP.Docx\\6/8/16\065
3-3 6/8/16\1:59 PM
Groundwater sampling equipment reused between monitoring locations (e.g., 12-volt
sampling pump and short piece of discharge line) will be thoroughly decontaminated
between uses. Equipment decontamination will consist of the following steps:
Rinse with about two gallons of soapy water (Alconox or other non-phosphate
detergent); and
Rinse with about two gallons of distilled water.
3.2 SPRING AND SEEP MONITORING
Spring and seep monitoring will include generally consist of three steps:
Collecting field parameters
Water quality sample collection
Flow measurement (excluding seeps)
3.2.1 Field Parameters
Spring and seep monitoring includes the collection of field parameters that consist of pH, SC,
DO, and water temperature. Field parameters will be collected before spring flow
measurements, or upstream of the location that spring flows will be measured to ensure the
measurements are not affected by streambed disturbance.
Field meters will be calibrated daily according to factory instructions, with calibration results
recorded in the field notebook and/or on calibration forms. Field parameter measurements
will be obtained directly in the spring; however, in developed springs, field parameters will
be taken in a clean container filled with sample water. Results will be recorded in the field
notebook.
3.2.2 Water Quality Sampling
Water quality grab samples will be collected from spring and seep monitoring sites by
passing an uncapped sample container across the area of flow. Water quality samples will be
collected in containers and preserved. Samples for trace constituents will be filtered through
a 0.45 µm filter prior to preservation, to allow analysis for the dissolved fraction. Sample
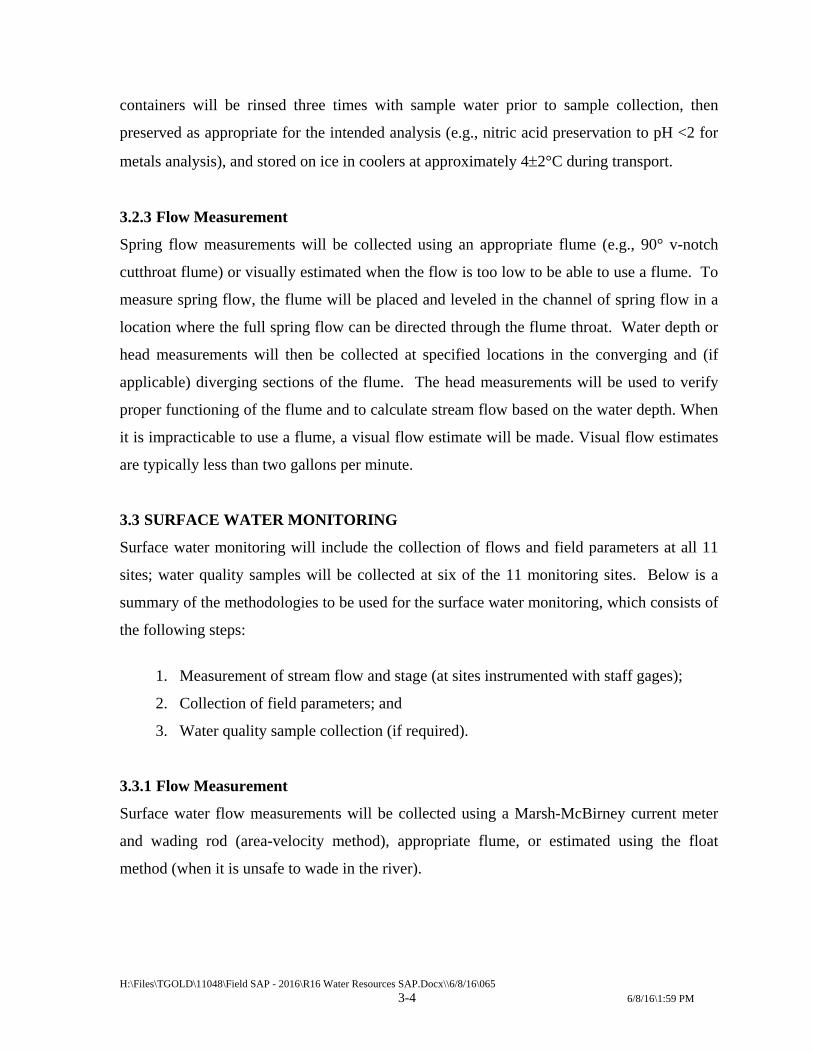
H:\Files\TGOLD\11048\Field SAP - 2016\R16 Water Resources SAP.Docx\\6/8/16\065
3-4 6/8/16\1:59 PM
containers will be rinsed three times with sample water prior to sample collection, then
preserved as appropriate for the intended analysis (e.g., nitric acid preservation to pH <2 for
metals analysis), and stored on ice in coolers at approximately 42°C during transport.
3.2.3 Flow Measurement
Spring flow measurements will be collected using an appropriate flume (e.g., 90° v-notch
cutthroat flume) or visually estimated when the flow is too low to be able to use a flume. To
measure spring flow, the flume will be placed and leveled in the channel of spring flow in a
location where the full spring flow can be directed through the flume throat. Water depth or
head measurements will then be collected at specified locations in the converging and (if
applicable) diverging sections of the flume. The head measurements will be used to verify
proper functioning of the flume and to calculate stream flow based on the water depth. When
it is impracticable to use a flume, a visual flow estimate will be made. Visual flow estimates
are typically less than two gallons per minute.
3.3 SURFACE WATER MONITORING
Surface water monitoring will include the collection of flows and field parameters at all 11
sites; water quality samples will be collected at six of the 11 monitoring sites. Below is a
summary of the methodologies to be used for the surface water monitoring, which consists of
the following steps:
1. Measurement of stream flow and stage (at sites instrumented with staff gages);
2. Collection of field parameters; and
3. Water quality sample collection (if required).
3.3.1 Flow Measurement
Surface water flow measurements will be collected using a Marsh-McBirney current meter
and wading rod (area-velocity method), appropriate flume, or estimated using the float
method (when it is unsafe to wade in the river).
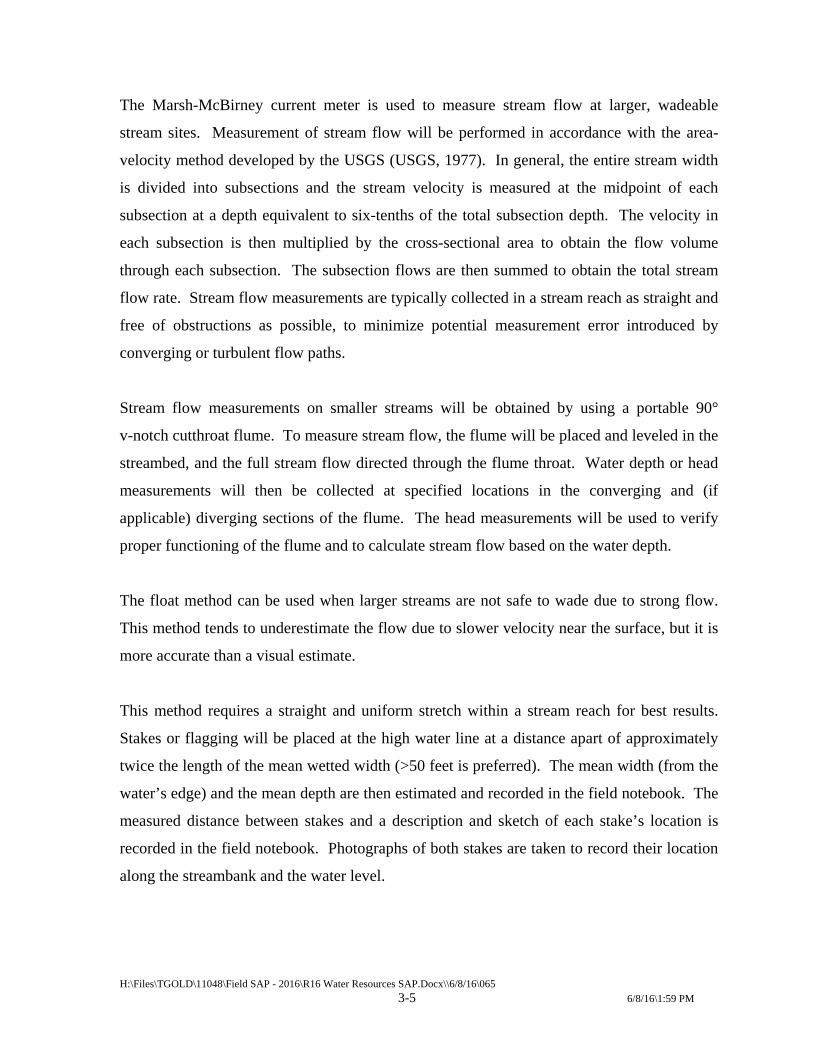
H:\Files\TGOLD\11048\Field SAP - 2016\R16 Water Resources SAP.Docx\\6/8/16\065
3-5 6/8/16\1:59 PM
The Marsh-McBirney current meter is used to measure stream flow at larger, wadeable
stream sites. Measurement of stream flow will be performed in accordance with the area-
velocity method developed by the USGS (USGS, 1977). In general, the entire stream width
is divided into subsections and the stream velocity is measured at the midpoint of each
subsection at a depth equivalent to six-tenths of the total subsection depth. The velocity in
each subsection is then multiplied by the cross-sectional area to obtain the flow volume
through each subsection. The subsection flows are then summed to obtain the total stream
flow rate. Stream flow measurements are typically collected in a stream reach as straight and
free of obstructions as possible, to minimize potential measurement error introduced by
converging or turbulent flow paths.
Stream flow measurements on smaller streams will be obtained by using a portable 90°
v-notch cutthroat flume. To measure stream flow, the flume will be placed and leveled in the
streambed, and the full stream flow directed through the flume throat. Water depth or head
measurements will then be collected at specified locations in the converging and (if
applicable) diverging sections of the flume. The head measurements will be used to verify
proper functioning of the flume and to calculate stream flow based on the water depth.
The float method can be used when larger streams are not safe to wade due to strong flow.
This method tends to underestimate the flow due to slower velocity near the surface, but it is
more accurate than a visual estimate.
This method requires a straight and uniform stretch within a stream reach for best results.
Stakes or flagging will be placed at the high water line at a distance apart of approximately
twice the length of the mean wetted width (>50 feet is preferred). The mean width (from the
water’s edge) and the mean depth are then estimated and recorded in the field notebook. The
measured distance between stakes and a description and sketch of each stake’s location is
recorded in the field notebook. Photographs of both stakes are taken to record their location
along the streambank and the water level.
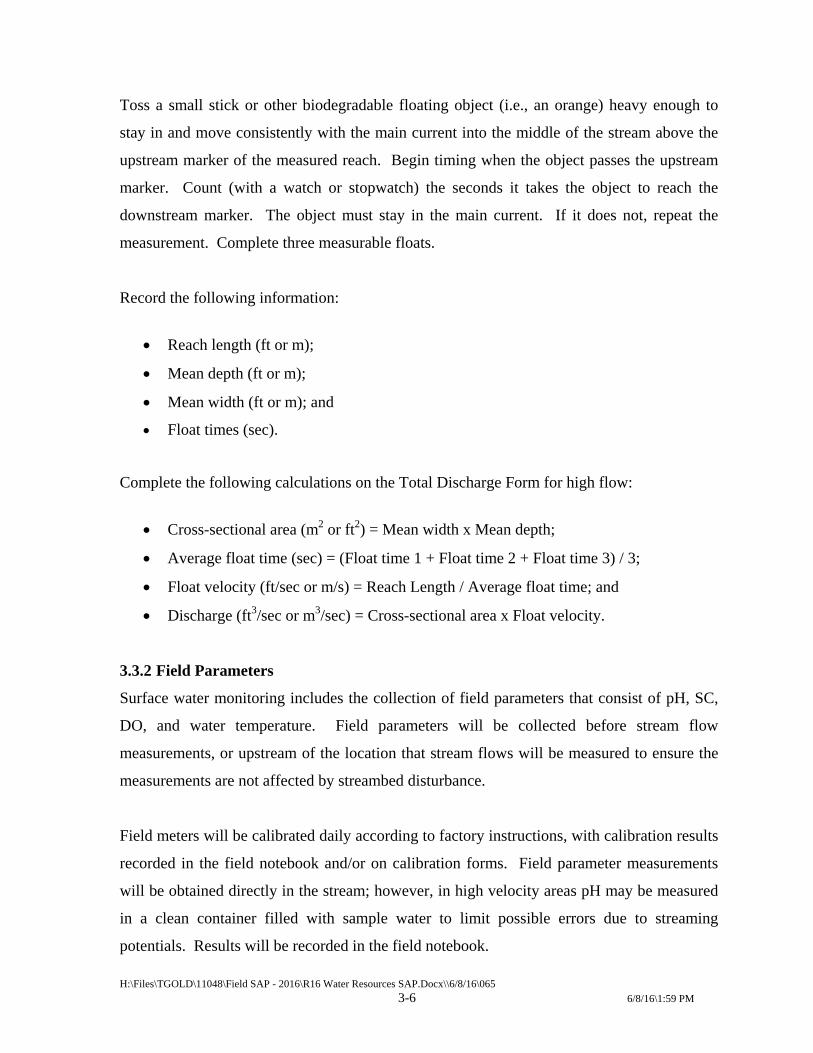
H:\Files\TGOLD\11048\Field SAP - 2016\R16 Water Resources SAP.Docx\\6/8/16\065
3-6 6/8/16\1:59 PM
Toss a small stick or other biodegradable floating object (i.e., an orange) heavy enough to
stay in and move consistently with the main current into the middle of the stream above the
upstream marker of the measured reach. Begin timing when the object passes the upstream
marker. Count (with a watch or stopwatch) the seconds it takes the object to reach the
downstream marker. The object must stay in the main current. If it does not, repeat the
measurement. Complete three measurable floats.
Record the following information:
Reach length (ft or m);
Mean depth (ft or m);
Mean width (ft or m); and
Float times (sec).
Complete the following calculations on the Total Discharge Form for high flow:
Cross-sectional area (m2 or ft2) = Mean width x Mean depth;
Average float time (sec) = (Float time 1 + Float time 2 + Float time 3) / 3;
Float velocity (ft/sec or m/s) = Reach Length / Average float time; and
Discharge (ft3/sec or m3/sec) = Cross-sectional area x Float velocity.
3.3.2 Field Parameters
Surface water monitoring includes the collection of field parameters that consist of pH, SC,
DO, and water temperature. Field parameters will be collected before stream flow
measurements, or upstream of the location that stream flows will be measured to ensure the
measurements are not affected by streambed disturbance.
Field meters will be calibrated daily according to factory instructions, with calibration results
recorded in the field notebook and/or on calibration forms. Field parameter measurements
will be obtained directly in the stream; however, in high velocity areas pH may be measured
in a clean container filled with sample water to limit possible errors due to streaming
potentials. Results will be recorded in the field notebook.
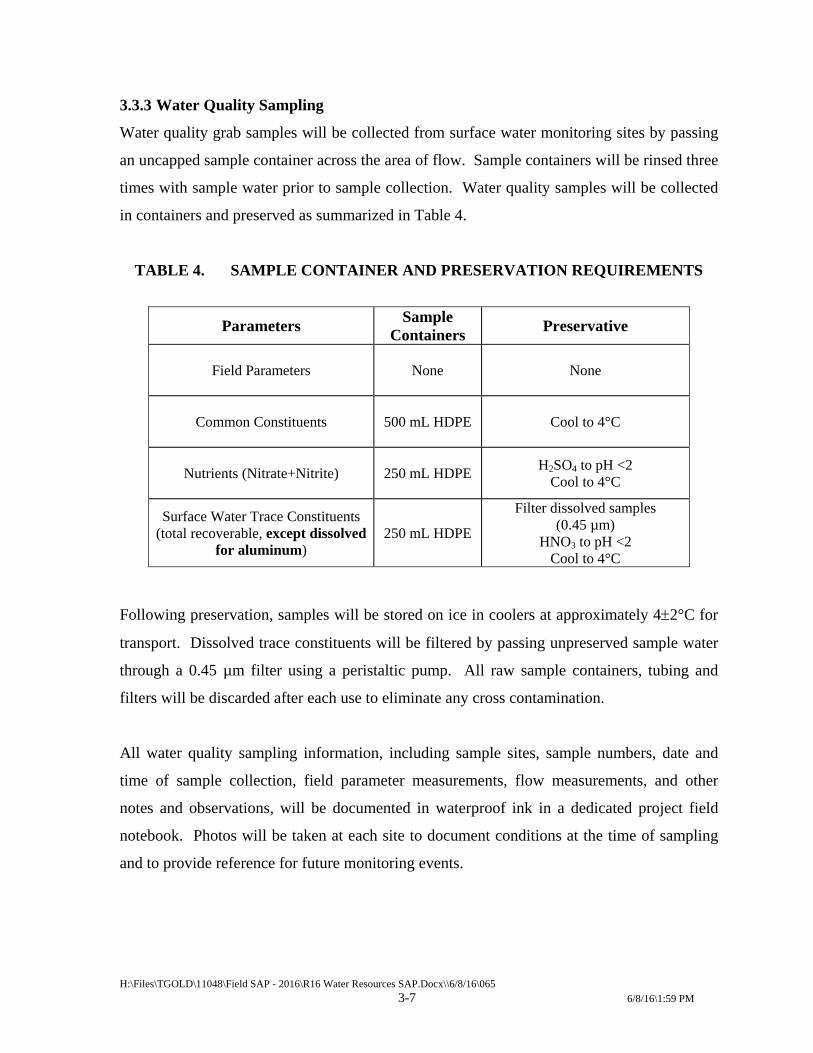
H:\Files\TGOLD\11048\Field SAP - 2016\R16 Water Resources SAP.Docx\\6/8/16\065
3-7 6/8/16\1:59 PM
3.3.3 Water Quality Sampling
Water quality grab samples will be collected from surface water monitoring sites by passing
an uncapped sample container across the area of flow. Sample containers will be rinsed three
times with sample water prior to sample collection. Water quality samples will be collected
in containers and preserved as summarized in Table 4.
TABLE 4. SAMPLE CONTAINER AND PRESERVATION REQUIREMENTS
Parameters Sample
Containers Preservative
Field Parameters
None None
Common Constituents
500 mL HDPE Cool to 4°C
Nutrients (Nitrate+Nitrite)
250 mL HDPE
H2SO4 to pH <2 Cool to 4°C
Surface Water Trace Constituents (total recoverable, except dissolved
for aluminum) 250 mL HDPE
Filter dissolved samples (0.45 µm)
HNO3 to pH <2 Cool to 4°C
Following preservation, samples will be stored on ice in coolers at approximately 42°C for
transport. Dissolved trace constituents will be filtered by passing unpreserved sample water
through a 0.45 µm filter using a peristaltic pump. All raw sample containers, tubing and
filters will be discarded after each use to eliminate any cross contamination.
All water quality sampling information, including sample sites, sample numbers, date and
time of sample collection, field parameter measurements, flow measurements, and other
notes and observations, will be documented in waterproof ink in a dedicated project field
notebook. Photos will be taken at each site to document conditions at the time of sampling
and to provide reference for future monitoring events.
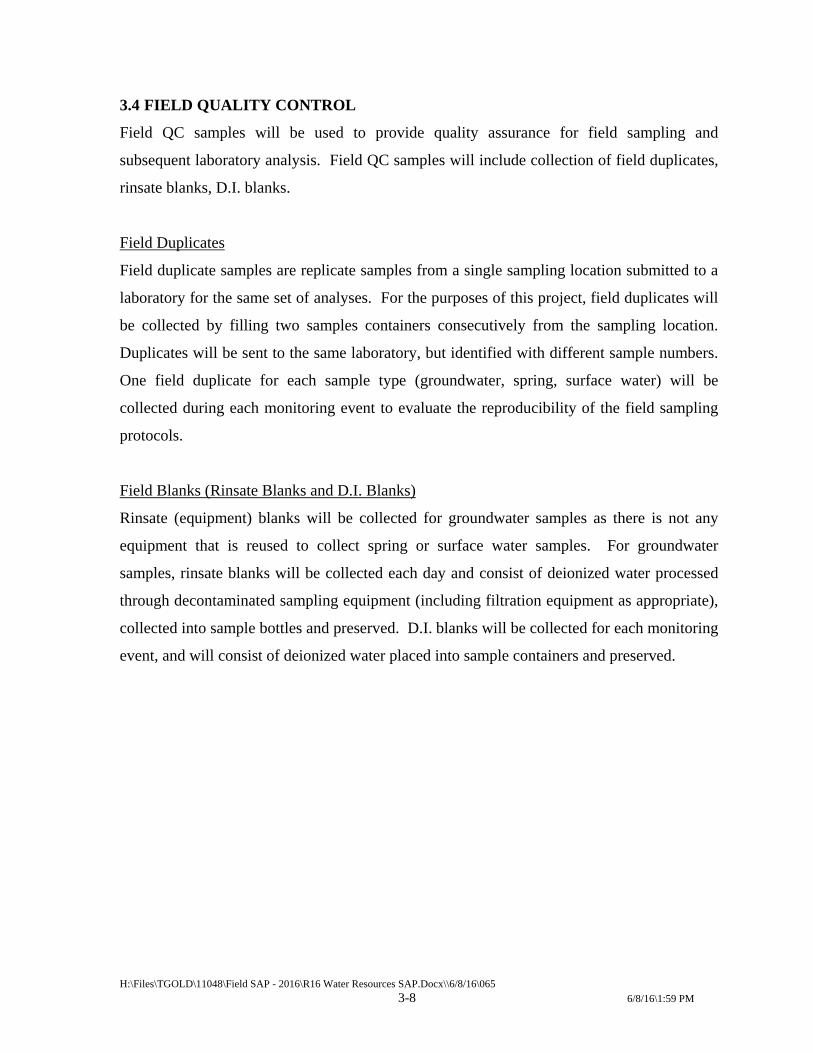
H:\Files\TGOLD\11048\Field SAP - 2016\R16 Water Resources SAP.Docx\\6/8/16\065
3-8 6/8/16\1:59 PM
3.4 FIELD QUALITY CONTROL
Field QC samples will be used to provide quality assurance for field sampling and
subsequent laboratory analysis. Field QC samples will include collection of field duplicates,
rinsate blanks, D.I. blanks.
Field Duplicates
Field duplicate samples are replicate samples from a single sampling location submitted to a
laboratory for the same set of analyses. For the purposes of this project, field duplicates will
be collected by filling two samples containers consecutively from the sampling location.
Duplicates will be sent to the same laboratory, but identified with different sample numbers.
One field duplicate for each sample type (groundwater, spring, surface water) will be
collected during each monitoring event to evaluate the reproducibility of the field sampling
protocols.
Field Blanks (Rinsate Blanks and D.I. Blanks)
Rinsate (equipment) blanks will be collected for groundwater samples as there is not any
equipment that is reused to collect spring or surface water samples. For groundwater
samples, rinsate blanks will be collected each day and consist of deionized water processed
through decontaminated sampling equipment (including filtration equipment as appropriate),
collected into sample bottles and preserved. D.I. blanks will be collected for each monitoring
event, and will consist of deionized water placed into sample containers and preserved.
H:\Files\TGOLD\11048\Field SAP - 2016\R16 Water Resources SAP.Docx\\6/8/16\065
4-1 6/8/16\1:59 PM
4.0 SAMPLE HANDLING AND DOCUMENTATION
All samples transferred to the laboratory for analysis will follow standard documentation,
packing, and chain-of-custody procedures. Samples will be stored in iced coolers or
refrigerated following collection, then hand-delivered to the laboratory in iced coolers to
maintain sample temperatures of approximately 42°C. The SOPs for sample labeling,
documentation and chain-of-custody procedures are in Appendix A of this document.
Sample custody (responsibility for the integrity of samples and prevention of tampering) will
be the responsibility of sampling personnel until samples are shipped or delivered to the
laboratory. Any containers used to ship samples via independent courier will be sealed with
custody seals prior to shipping and the receiving laboratory will record the condition of the
seals upon arrival to ensure that the containers have not been opened during transport.
Custody seals are not required for samples that are maintained under the direct custody of
sampling personnel until being hand-delivered to the laboratory. Upon arrival at the
laboratory, sample custody shifts to laboratory personnel, who are responsible for tracking
individual samples through login, analysis, and reporting. At the time of sample login, the
laboratory will assign a unique laboratory sample number, which can be cross-referenced to
the field sample number and used to track analytical results.
Documents generated during sample collection will consist of:
1. Sample collection field notes and forms;
2. Chain-of-Custody forms; and
3. Shipping receipts in the event that samples are sent to a laboratory via independent
courier.
Sampling activities will be recorded in a project-specific field notebook. Each sample will
be identified with a unique sample number, along with the date and time of collection, on
adhesive labels attached to sample bottles. All labels will be completed using waterproof
ink.
H:\Files\TGOLD\11048\Field SAP - 2016\R16 Water Resources SAP.Docx\\6/8/16\065
4-2 6/8/16\1:59 PM
Field notebooks used to record pertinent sampling information will include, at a minimum,
the following:
Project name;
Date and time;
Sample location;
Sample number;
Sample depth (if applicable);
Media type;
Field meter calibration information;
Sampling personnel present;
Analyses requested;
Sample preservation;
Field parameter measurements;
Weather observations; and
Other relevant project-specific site or sample information.
Entries will be made in permanent ink. Corrections to field notebooks will be made by
crossing out erroneous information with a single line and initialing the correction. Field
books will be signed and dated at the bottom of each page by personnel making entries on
that page.
Individual samples (including QC samples) will be assigned unique sample numbers
according to the following sample numbering scheme:
AAA[A]-YYMM-XXX
where AAA[A] is a three- or four-character code denoting the project, YYMM is a four-digit
code denoting the year and month (e.g., 1109 for September 2011), and XXX is a three-digit
code that is incremented sequentially for each successive sample.
H:\Files\TGOLD\11048\Field SAP - 2016\R16 Water Resources SAP.Docx\\6/8/16\065
5-1 6/8/16\1:59 PM
5.0 LABORATORY ANALYTICAL PROCEDURES AND REPORTING
Laboratory analysis will be conducted by Energy Laboratories’ Helena, Montana branch.
Energy Laboratories is certified by EPA Region 8 and the State of Montana under the Safe
Drinking Water Act. Field parameters will be analyzed by Hydrometrics’ field personnel
using the procedures outlined in Sections 3.1.2 and 3.2.2 above, and in the applicable SOPs
collected in Appendix A of this document. All laboratory analysis will be fully documented
and conducted in accordance with EPA-approved and/or industry standard analytical
methods.
5.1 GROUNDWATER, SPRING, AND SEEP ANALYSES
Required parameters, analytical methods, and project-required detection limits for
groundwater quality samples collected from wells and springs are shown in Table 5.
Groundwater samples, including spring samples, will be analyzed for physical parameters,
common constituents, Nitrite + Nitrate, and a comprehensive suite of trace constituents. The
project required detection limits (PRDLs) for individual parameters have been set at
concentrations normally achievable by routine analytical testing in the absence of unusual
matrix interference (laboratory’s practical quantitation limit). It must be recognized that the
PRDL is a detection limit goal, which may not be achieved in all samples due to sample
matrix interference or other problems. If a PRDL is not met by the laboratory, the data will
be reviewed to determine if any actions (e.g., sample reanalysis or selection of an alternative
analytical method) are required.
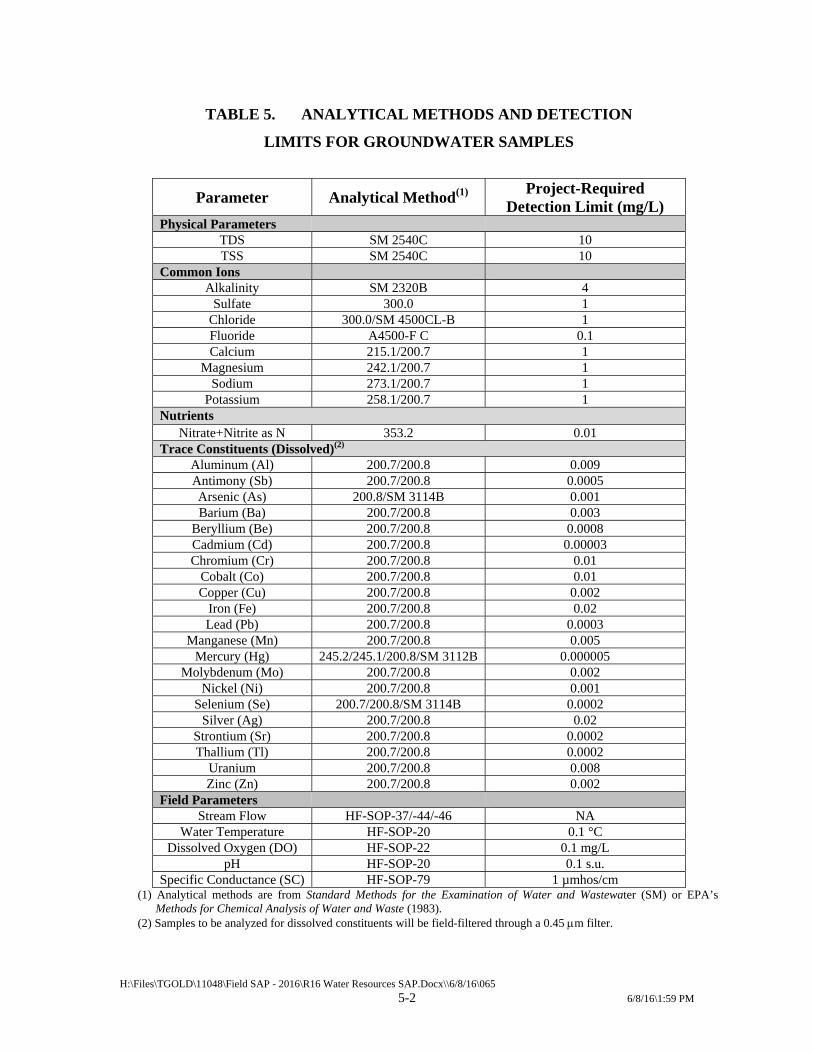
H:\Files\TGOLD\11048\Field SAP - 2016\R16 Water Resources SAP.Docx\\6/8/16\065
5-2 6/8/16\1:59 PM
TABLE 5. ANALYTICAL METHODS AND DETECTION
LIMITS FOR GROUNDWATER SAMPLES
Parameter Analytical Method(1) Project-Required
Detection Limit (mg/L) Physical Parameters
TDS SM 2540C 10 TSS SM 2540C 10
Common Ions Alkalinity SM 2320B 4
Sulfate 300.0 1 Chloride 300.0/SM 4500CL-B 1 Fluoride A4500-F C 0.1 Calcium 215.1/200.7 1
Magnesium 242.1/200.7 1 Sodium 273.1/200.7 1
Potassium 258.1/200.7 1 Nutrients
Nitrate+Nitrite as N 353.2 0.01 Trace Constituents (Dissolved)(2)
Aluminum (Al) 200.7/200.8 0.009 Antimony (Sb) 200.7/200.8 0.0005 Arsenic (As) 200.8/SM 3114B 0.001 Barium (Ba) 200.7/200.8 0.003
Beryllium (Be) 200.7/200.8 0.0008 Cadmium (Cd) 200.7/200.8 0.00003 Chromium (Cr) 200.7/200.8 0.01
Cobalt (Co) 200.7/200.8 0.01 Copper (Cu) 200.7/200.8 0.002
Iron (Fe) 200.7/200.8 0.02 Lead (Pb) 200.7/200.8 0.0003
Manganese (Mn) 200.7/200.8 0.005 Mercury (Hg) 245.2/245.1/200.8/SM 3112B 0.000005
Molybdenum (Mo) 200.7/200.8 0.002 Nickel (Ni) 200.7/200.8 0.001
Selenium (Se) 200.7/200.8/SM 3114B 0.0002 Silver (Ag) 200.7/200.8 0.02
Strontium (Sr) 200.7/200.8 0.0002 Thallium (Tl) 200.7/200.8 0.0002
Uranium 200.7/200.8 0.008 Zinc (Zn) 200.7/200.8 0.002
Field Parameters Stream Flow HF-SOP-37/-44/-46 NA
Water Temperature HF-SOP-20 0.1 °C Dissolved Oxygen (DO) HF-SOP-22 0.1 mg/L
pH HF-SOP-20 0.1 s.u. Specific Conductance (SC) HF-SOP-79 1 µmhos/cm
(1) Analytical methods are from Standard Methods for the Examination of Water and Wastewater (SM) or EPA’s Methods for Chemical Analysis of Water and Waste (1983).
(2) Samples to be analyzed for dissolved constituents will be field-filtered through a 0.45 m filter.
H:\Files\TGOLD\11048\Field SAP - 2016\R16 Water Resources SAP.Docx\\6/8/16\065
5-3 6/8/16\1:59 PM
5.2 SURFACE WATER ANALYSES
Required parameters, analytical methods, and project-required detection limits for surface
water quality samples collected at in the vicinity of the Project are shown in Table 6. Similar
to groundwater, samples will be analyzed for physical parameters, common constituents,
nutrients, and a comprehensive suite of trace constituents. As for groundwater, the PRDLs
for individual parameters have been set at concentrations normally achievable by routine
analytical testing in the absence of unusual matrix interference (laboratory’s practical
quantitation limit). If a PRDL is not met by the laboratory, the data will be reviewed to
determine if any actions (e.g., sample reanalysis or selection of an alternative analytical
method) are required.
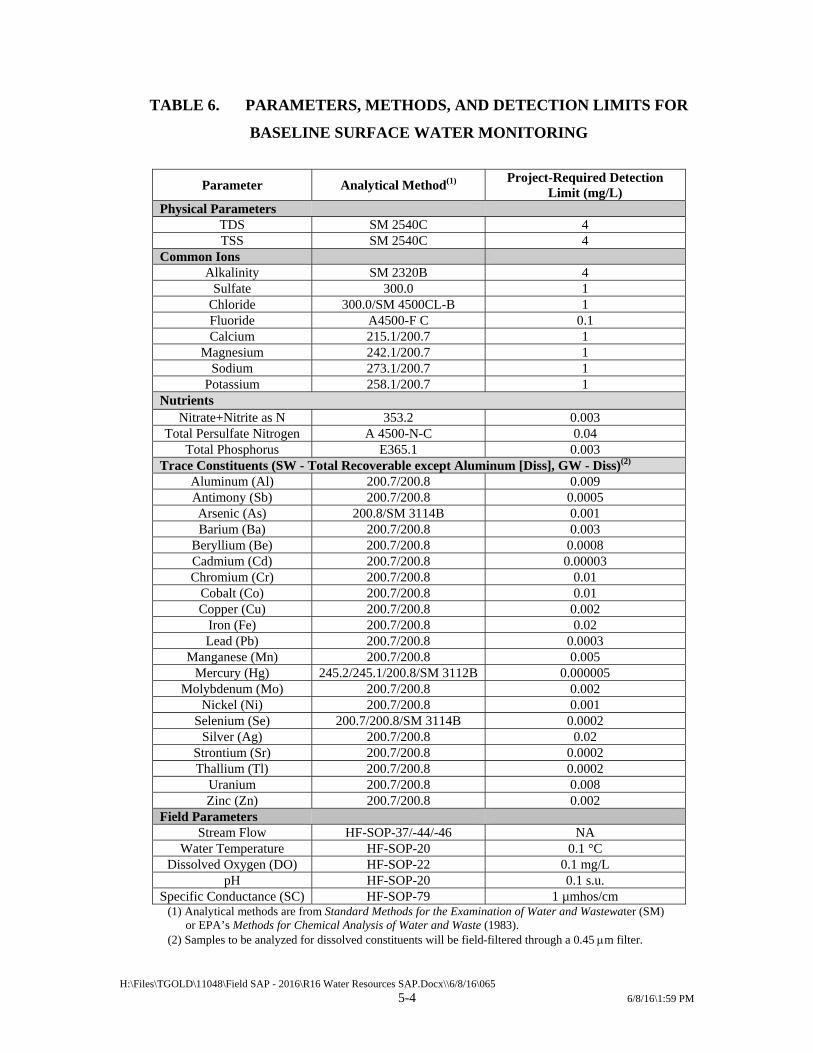
H:\Files\TGOLD\11048\Field SAP - 2016\R16 Water Resources SAP.Docx\\6/8/16\065
5-4 6/8/16\1:59 PM
TABLE 6. PARAMETERS, METHODS, AND DETECTION LIMITS FOR
BASELINE SURFACE WATER MONITORING
Parameter Analytical Method(1) Project-Required Detection
Limit (mg/L) Physical Parameters
TDS SM 2540C 4 TSS SM 2540C 4
Common Ions Alkalinity SM 2320B 4
Sulfate 300.0 1 Chloride 300.0/SM 4500CL-B 1 Fluoride A4500-F C 0.1 Calcium 215.1/200.7 1
Magnesium 242.1/200.7 1 Sodium 273.1/200.7 1
Potassium 258.1/200.7 1 Nutrients
Nitrate+Nitrite as N 353.2 0.003 Total Persulfate Nitrogen A 4500-N-C 0.04
Total Phosphorus E365.1 0.003 Trace Constituents (SW - Total Recoverable except Aluminum [Diss], GW - Diss)(2)
Aluminum (Al) 200.7/200.8 0.009 Antimony (Sb) 200.7/200.8 0.0005 Arsenic (As) 200.8/SM 3114B 0.001 Barium (Ba) 200.7/200.8 0.003
Beryllium (Be) 200.7/200.8 0.0008 Cadmium (Cd) 200.7/200.8 0.00003 Chromium (Cr) 200.7/200.8 0.01
Cobalt (Co) 200.7/200.8 0.01 Copper (Cu) 200.7/200.8 0.002
Iron (Fe) 200.7/200.8 0.02 Lead (Pb) 200.7/200.8 0.0003
Manganese (Mn) 200.7/200.8 0.005 Mercury (Hg) 245.2/245.1/200.8/SM 3112B 0.000005
Molybdenum (Mo) 200.7/200.8 0.002 Nickel (Ni) 200.7/200.8 0.001
Selenium (Se) 200.7/200.8/SM 3114B 0.0002 Silver (Ag) 200.7/200.8 0.02
Strontium (Sr) 200.7/200.8 0.0002 Thallium (Tl) 200.7/200.8 0.0002
Uranium 200.7/200.8 0.008 Zinc (Zn) 200.7/200.8 0.002
Field Parameters Stream Flow HF-SOP-37/-44/-46 NA
Water Temperature HF-SOP-20 0.1 °C Dissolved Oxygen (DO) HF-SOP-22 0.1 mg/L
pH HF-SOP-20 0.1 s.u. Specific Conductance (SC) HF-SOP-79 1 µmhos/cm
(1) Analytical methods are from Standard Methods for the Examination of Water and Wastewater (SM) or EPA’s Methods for Chemical Analysis of Water and Waste (1983).
(2) Samples to be analyzed for dissolved constituents will be field-filtered through a 0.45 m filter.
H:\Files\TGOLD\11048\Field SAP - 2016\R16 Water Resources SAP.Docx\\6/8/16\065
5-5 6/8/16\1:59 PM
5.3 DATA REVIEW AND REPORTING
All data deliverables containing analytical data and QC information will be reviewed for
overall completeness of the data package. Completeness checks will be administered on all
data to determine whether deliverables identified in this FSAP are present. At a minimum,
deliverables will include field notes and/or forms, transmittal information, sample chain-of-
custody forms, analytical results, methods and PQLs, and laboratory QC summaries. The
reviewer will determine whether all required items are present and request copies of missing
deliverables. Procedures for data review, validation, and reporting are discussed in HSOP-58
located in Appendix A.
The number and type of samples collected will be compared with project specifications.
Review of sample collection and handling procedures will include verification of the
following:
Completeness of submittal packages;
Completeness of field documentation, including chain-of-custody documentation;
Field equipment calibration and maintenance and/or quality of field measurements;
and
Adherence to proper sample collection procedures.
Data validation will include a detailed review of all analytical results, including:
Reporting limits (RLs) and PQLs vs. PRDLs;
Holding times;
Analytical methods;
Field QC sample results; and
Laboratory QC sample results.
H:\Files\TGOLD\11048\Field SAP - 2016\R16 Water Resources SAP.Docx\\6/8/16\065
6-1 6/8/16\1:59 PM
6.0 REFERENCES
EPA, 1983. Methods for Chemical Analysis of Water and Wastes. EPA-600/14-79-020. Revised March 1983.
Hydrometrics, Inc., 2012. 2011 Spring and Seep Inventory, Black Butte Copper Project.
January 2012. Hydrometrics, Inc., 2013. Water Resources Monitoring Field Sampling and Analysis Plan,
Black Butte Copper Project. Revised March 2013. Nelson, W.H. 1963. Geology of the Duck Creek Pass Quadrangle, U.S. Geological Survey
Bulletin 1121J, 56 p. USGS, 1977. National Handbook of Recommended Methods for Water-Data Acquisition.
Chapter 1: Surface Water. USGS, 1999. National Field Manual for the Collection of Water Quality Data: Chapter A4,
Collection of Water Samples. September.
H:\Files\TGOLD\11048\Field SAP - 2016\R16 Water Resources SAP.Docx\\6/8/16\065 6/8/16\1:59 PM
APPENDIX A
STANDARD OPERATING PROCEDURES
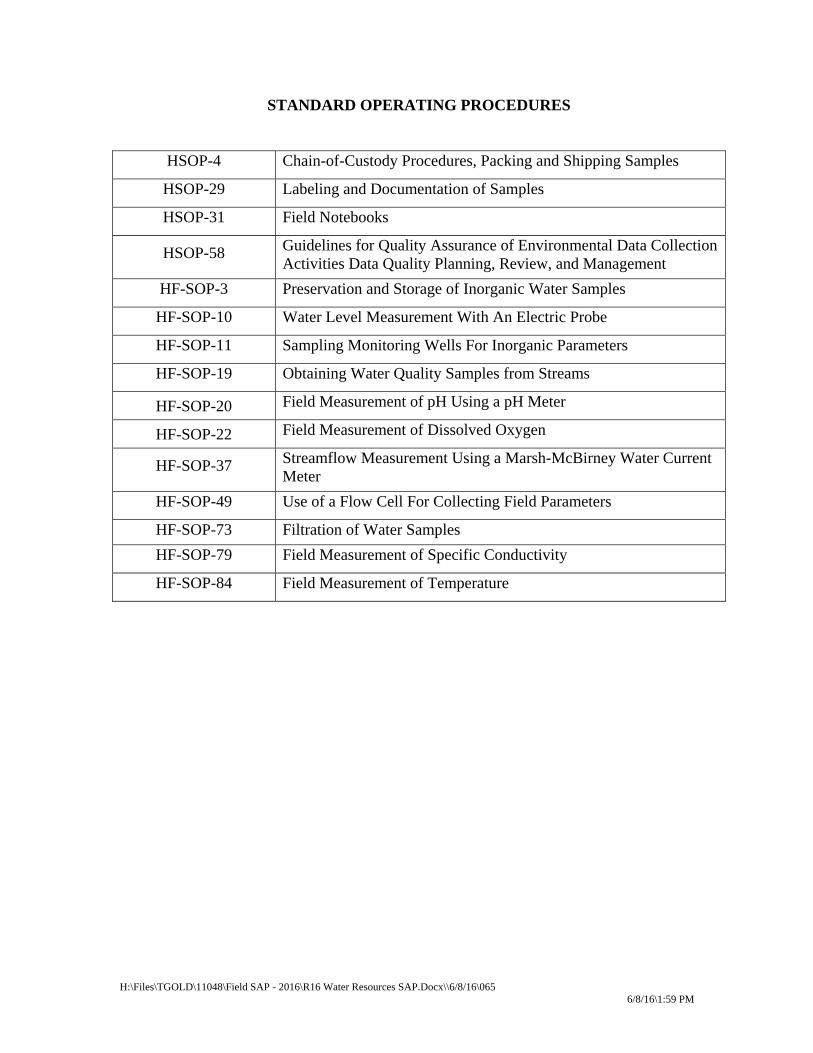
H:\Files\TGOLD\11048\Field SAP - 2016\R16 Water Resources SAP.Docx\\6/8/16\065 6/8/16\1:59 PM
STANDARD OPERATING PROCEDURES
HSOP-4 Chain-of-Custody Procedures, Packing and Shipping Samples
HSOP-29 Labeling and Documentation of Samples
HSOP-31 Field Notebooks
HSOP-58 Guidelines for Quality Assurance of Environmental Data Collection Activities Data Quality Planning, Review, and Management
HF-SOP-3 Preservation and Storage of Inorganic Water Samples
HF-SOP-10 Water Level Measurement With An Electric Probe
HF-SOP-11 Sampling Monitoring Wells For Inorganic Parameters
HF-SOP-19 Obtaining Water Quality Samples from Streams
HF-SOP-20 Field Measurement of pH Using a pH Meter
HF-SOP-22 Field Measurement of Dissolved Oxygen
HF-SOP-37 Streamflow Measurement Using a Marsh-McBirney Water Current Meter
HF-SOP-49 Use of a Flow Cell For Collecting Field Parameters
HF-SOP-73
Filtration of Water Samples
HF-SOP-79 Field Measurement of Specific Conductivity
HF-SOP-84 Field Measurement of Temperature
HSOP-4 Rev. Date: 10/10
Page 1 of 11
H:\ADMIN\HSOP\2004 New Hsops\HSOP-4.Doc
HSOP-4
CHAIN-OF-CUSTODY PROCEDURES, PACKING,
AND SHIPPING SAMPLES
Prepared by: Date: 6/04
Reviewed by: Date: 6/04
Approved by: Date: 6/04
Hydrometrics, Inc. 3020 Bozeman Avenue
Helena, MT 59601

HSOP-4 Rev. Date: 10/10
Page 2 of 11
H:\ADMIN\HSOP\2004 New Hsops\HSOP-4.Doc
REVISION HISTORY
Revised by: Date: 10/2010
HSOP-4 Rev. Date: 10/10
Page 3 of 11
H:\ADMIN\HSOP\2004 New Hsops\HSOP-4.Doc
TABLE OF CONTENTS
1.0 SCOPE AND APPLICATION ........................................................................................... 4
2.0 SUMMARY OF METHOD................................................................................................ 4
3.0 HEALTH AND SAFETY WARNINGS ............................................................................ 4
4.0 INTERFERENCES............................................................................................................. 4
5.0 PERSONNEL QUALIFICATIONS ................................................................................... 4
6.0 EQUIPMENT AND SUPPLIES......................................................................................... 5
7.0 CHAIN-OF-CUSTODY PROCEDURE............................................................................. 5
8.0 PACKING AND SHIPPING PROCEDURE ..................................................................... 7
9.0 DATA AND RECORDS MANAGEMENT....................................................................... 8
10.0 QUALITY CONTROL/QUALITY ASSURANCE ......................................................... 8
11.0 REFERENCES ................................................................................................................. 9
HSOP-4 Rev. Date: 10/10
Page 4 of 11
H:\ADMIN\HSOP\2004 New Hsops\HSOP-4.Doc
1.0 SCOPE AND APPLICATION
HSOP-4 presents procedures to be followed when shipping samples of environmental media (e.g., air, water, soil, waste material) to a laboratory for analysis. All samples submitted should be accompanied by chain-of-custody documentation. 2.0 SUMMARY OF METHOD
Samples of environmental media submitted to laboratories for analysis are often shipped via commercial carrier. Samples are packed in shipping containers to minimize the potential for container breakage or leaking. Each shipment will be accompanied by sample documentation, including chain-of-custody forms and a list of required analytical parameters, methods, and detection limits. Samples are cooled with ice during transport, to maintain temperature at approximately 4°C (±2°C). Shipments of hazardous materials must conform to International Air Transport Association (IATA) Dangerous Goods regulations and/or Department of Transportation (DOT) regulations, as well as any carrier-specific requirements. 3.0 HEALTH AND SAFETY WARNINGS
Field personnel should be aware of the health and safety precautions to be followed during any field event, and should be familiar with any project-specific hazards. This may include review of project-specific health and safety plans, site-specific and/or organization-specific safety requirements and training.
• Care should be exercised when handling samples of hazardous or potentially hazardous waste. Personal protective equipment (PPE) should be utilized (gloves, safety glasses, coveralls) as appropriate.
• Glass sample containers should be handled with extreme care to avoid breakage, loss of sample, and possible injury.
4.0 INTERFERENCES
Not Applicable 5.0 PERSONNEL QUALIFICATIONS
Personnel should be familiar with the project work plan and objectives, and with the operation of equipment listed in Section 6.0 below. Personnel should also familiarize themselves with the schedule of the shipping location to be used for shipping samples. For projects involving hazardous materials, consult the project work plan, courier regulations,
HSOP-4 Rev. Date: 10/10
Page 5 of 11
H:\ADMIN\HSOP\2004 New Hsops\HSOP-4.Doc
and any state and federal air or ground shipping regulations for details on shipping hazardous material. 6.0 EQUIPMENT AND SUPPLIES
• Shipping container (metal or plastic cooler); • Packing material (bubble wrap, Styrofoam peanuts); • Absorbent material (clay absorbents, rock wool); • Shipping tape; • Shipping strap; • Custody seals; • Chain-of-custody (COC) forms; • Heavy-duty or contractor grade garbage bags or similar plastic bags; • Ziploc bags; and • Ice. 7.0 CHAIN-OF-CUSTODY PROCEDURE
1. Chain-of-custody involves ensuring that samples are traceable from the time of collection until received by the analytical laboratory. The laboratory is responsible for custody during processing and analysis. A sample is under custody if:
• It is in your possession; • It is in your view, after being in your possession; or • It was in your possession and you then placed it in a designated secure or locked
area to prevent tampering.
2. When ready to ship samples, set out samples in a clean, secure area to complete chain-of-custody forms. Chain-of-custody forms may be obtained from the project laboratory, or from Hydrometrics’ Data Quality Department. An example COC form is shown in Attachment 1. Each sample should be identified on the form by its sample number, date and time of collection, and analysis requested. Check sample labels against information recorded in field notebook and on chain-of-custody to ensure consistency and guard against transcription errors (HSOP-29). It is usually best to use one chain-of-custody form per shipping container, covering the samples included in the container. When shipping multiple coolers to the laboratory, label chain-of-custody forms as “Cooler 1 of 3,” “Cooler 2 of 3,” etc. While chain-of-custody forms obtained from various sources may differ, certain information regarding sampling dates and times, sample identification, contact information, and requested parameters for analysis should be included on all acceptable forms. Complete all fields on the chain-of-custody form, as applicable to the

HSOP-4 Rev. Date: 10/10
Page 6 of 11
H:\ADMIN\HSOP\2004 New Hsops\HSOP-4.Doc
particular sampling event. Examples of typical COC information to be completed are as follows:
a) Company Name: Enter “Hydrometrics, Inc.”
b) Project Name: Enter the project name and Hydrometrics’ project number
c) Report Mail Address: Enter the name, address, and e-mail address of the person
who should receive the laboratory report.
d) Contact Name: Enter the name of the project manager, sampling personnel, or other responsible contact.
e) Phone/Fax: Enter the phone and fax number of the contact person for the project.
f) E-mail: Enter the e-mail address for the contact person.
g) Sampler: Print the name of the person who collected the samples.
h) Invoice Address: Enter the address where the invoice should be sent.
i) Invoice Contact and Phone: Enter the name and phone number of the person
responsible for approving the invoice.
j) Purchase Order: Enter the Hydrometrics’ Purchase Order number for the sample order.
k) Quote/Bottle Order: Enter the laboratory quote number for the project or bottle
order number provided with the sample bottle order.
l) Note any special reporting requirements or formats.
m) Sample Identification: Enter the unique sample number assigned to the sample.
n) Collection Date: Enter the date each sample was collected. Do not use ditto (“) marks, arrows or lines to represent the same date.
o) Collection Time: Enter the time each sample was collected. Do not use ditto (“)
marks, arrows or lines to represent the same time.
p) Number of Containers and Matrix: Enter the number of bottles the sample is contained in followed by a dash and then a letter representing the type of sample matrix (i.e. A=Air, W=Water, S=Soil/Solid, V=Vegetation, B=Bioassay, O=Other).
HSOP-4 Rev. Date: 10/10
Page 7 of 11
H:\ADMIN\HSOP\2004 New Hsops\HSOP-4.Doc
q) Analysis Requested: Write the analysis to be performed on each sample and check the box for each sample you want to receive this analysis. Also include an analytical parameter list.
r) Remarks: Use this field to make notes or comments to the laboratory.
(Note: If a laboratory-provided COC form is used, be sure to follow any additional instructions included from the laboratory.)
3. Record shipping information (tracking numbers, name of courier, other pertinent
information) on chain-of-custody form. Sign and date chain-of-custody form, and retain one copy of form for project file.
8.0 PACKING AND SHIPPING PROCEDURE
1. Seal drain holes in bottom of shipping cooler (inside and out) to prevent leakage. Check sample container lids to ensure they are tightly sealed.
2. Line bottom of cooler with packing material (bubble wrap). Open and place two heavy-duty plastic bags in cooler (one inside the other).
3. Seal samples within individual plastic or bubble wrap bags, as necessary. All glass containers (VOAs, amber glass bottles, glass soil jars) should be placed in individual bubble wrap bags. Place sealed sample containers in shipping cooler, inside double plastic bags. In most instances, a labeled temperature blank should be included with the samples to allow the laboratory to check the sample temperature upon arrival. The temperature blank is generally a small vial or bottle filled with tap water and labeled “Temperature Blank.” Ensure that temperature blank meets temperature requirements upon receipt by laboratory.
4. Cover samples with ice, inside double plastic bags. 5. Close and seal double plastic bags, by knotting or with shipping tape. Fill any empty
space in cooler with additional packing material or absorbent material.
6. Record shipping information (tracking numbers, name of courier, other pertinent information) on chain-of-custody form. Sign and date chain-of-custody form, and retain one copy of form for project file.
7. Place original chain-of-custody, sample parameter list, cover letter, and any other documentation needed by the laboratory into a plastic Ziploc bag. Seal Ziploc bag and tape to the inside of the shipping container lid.
HSOP-4 Rev. Date: 10/10
Page 8 of 11
H:\ADMIN\HSOP\2004 New Hsops\HSOP-4.Doc
8. Label outside of shipping container with sampling organization name, address, and phone number, laboratory destination name, address, and phone number, and any required DOT shipping labels.
9. Place custody seals on front and back of cooler (see Attachment 2) and tape in place with shipping tape to avoid accidental breakage. Wrap cooler securely in at least two places with a minimum of three wraps of shipping tape. Shipping strap may also be used to provide additional insurance against the cooler opening during shipment.
10. Deliver sample containers to the shipping location. Since samples should reach the
laboratory as soon as possible to protect sample integrity, overnight shipping is required, unless unavailable at the shipping location. Retain copies of shipping receipts for the project file. Shipping receipts and tracking numbers serve as chain-of-custody documentation during sample transport from the sampler to the laboratory.
11. Additional guidance may be found in the EPA’s Contract Laboratory Program Guidance for Field Samplers (EPA, 2004). More stringent shipping requirements may apply to samples collected under CLP protocols. The project work plan should be consulted to determine any special requirements.
9.0 DATA AND RECORDS MANAGEMENT
The following documents generated during sample packing and shipping will be retained in the project file:
• Chain-of-custody form; • Analytical parameter list; • Cover letter; and • Shipping receipts.
10.0 QUALITY CONTROL/QUALITY ASSURANCE • Field personnel should cross-reference information on sample labels, in the field
notebook, and on sample chain-of custody forms during the sample packing and shipping process.
• Data quality review will include checking of sample documentation to ensure consistency.
• Temperature blank measurements by the laboratory upon arrival of samples will document that samples were maintained at the appropriate temperature during shipping.

HSOP-4 Rev. Date: 10/10
Page 9 of 11
H:\ADMIN\HSOP\2004 New Hsops\HSOP-4.Doc
11.0 REFERENCES
EPA, 2004. Contract Laboratory Program Guidance for Field Samplers (Draft Final). EPA 540-R-00-003. January, 2004.
Hydrometrics HSOP-29: Labeling and Documentation of Samples
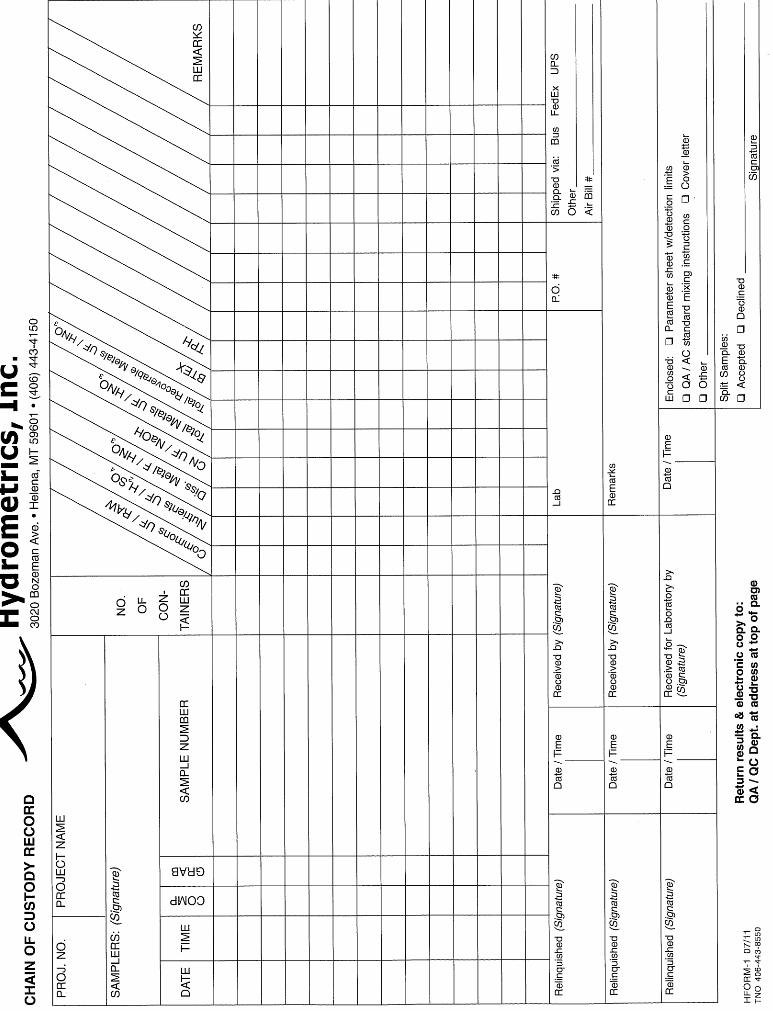
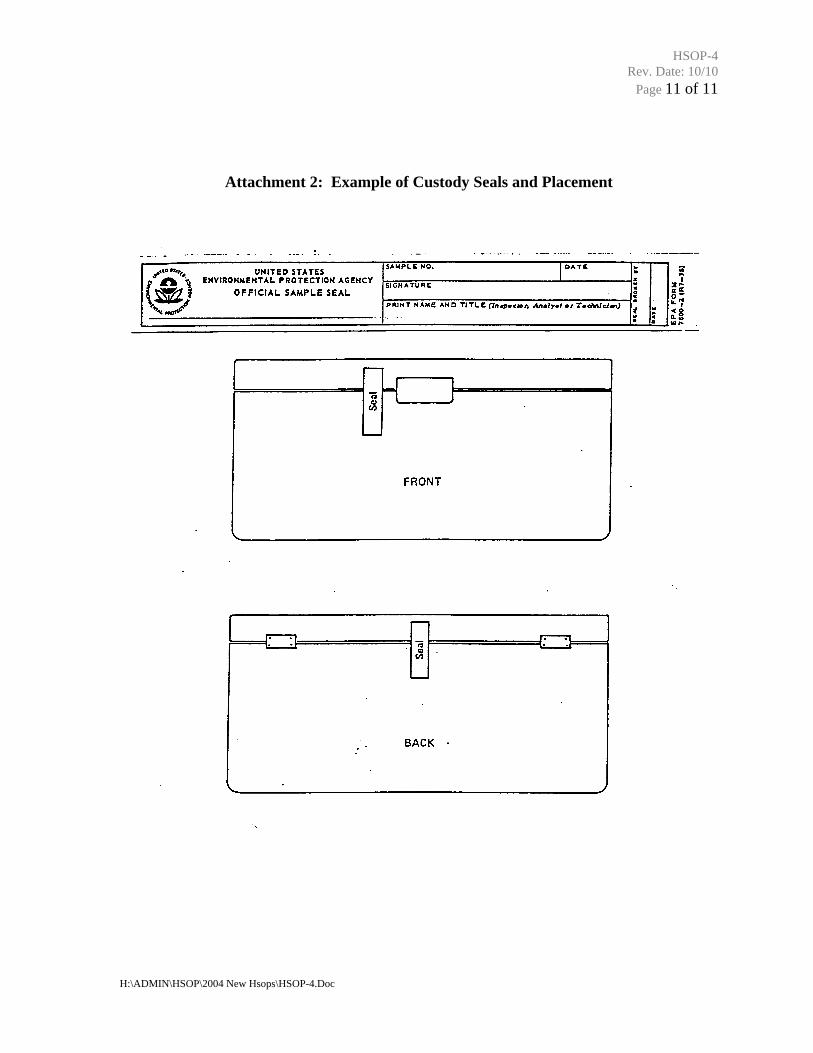
HSOP-4 Rev. Date: 10/10 Page 11 of 11
H:\ADMIN\HSOP\2004 New Hsops\HSOP-4.Doc
Attachment 2: Example of Custody Seals and Placement
HSOP-29 Rev. Date: 6/04
Page 1 of 6
H:\ADMIN\HSOP\2004 New Hsops\HSOP-29.Doc\HLN\6/29/04\065 11/30/05\10:34 AM
HSOP-29
LABELING AND DOCUMENTATION OF SAMPLES
Prepared by: Date: 6/04
Reviewed by: Date: 6/04
Approved by: Date: 6/04
Hydrometrics, Inc. 3020 Bozeman Avenue
Helena, MT 59601

HSOP-29 Rev. Date: 6/04
Page 2 of 6
H:\ADMIN\HSOP\2004 New Hsops\HSOP-29.Doc\HLN\6/29/04\065 11/30/05\10:34 AM
TABLE OF CONTENTS
1.0 SCOPE AND APPLICATION ..................................................................................3
2.0 SUMMARY OF METHOD.......................................................................................3
3.0 HEALTH AND SAFETY WARNINGS ...................................................................3
4.0 INTERFERENCES....................................................................................................3
5.0 PERSONNEL QUALIFICATIONS ..........................................................................3
6.0 EQUIPMENT AND SUPPLIES................................................................................4
7.0 PROCEDURE............................................................................................................4
8.0 DATA AND RECORDS MANAGEMENT..............................................................5
9.0 QUALITY CONTROL/QUALITY ASSURANCE ..................................................5
10.0 REFERENCES ........................................................................................................6
HSOP-29 Rev. Date: 6/04
Page 3 of 6
H:\ADMIN\HSOP\2004 New Hsops\HSOP-29.Doc\HLN\6/29/04\065 11/30/05\10:34 AM
1.0 SCOPE AND APPLICATION HSOP-29 describes typical procedures used to label sample containers, to ensure that information on the label is complete and correct, and to document the number and type of samples collected at a particular site. Samples must be thoroughly documented so that analytical data received from the laboratory can be correlated to the correct sampling site. 2.0 SUMMARY OF METHOD Hydrometrics uses unique sample codes to identify individual samples. Sample codes are distinct from site identification codes, to ensure that the laboratory is unaware of the sample source, and whether the sample is a quality control (QC) or routine sample. Sample codes and other pertinent information is written on adhesive labels affixed to the sample container, or directly on the sample container in some cases. Sample documentation includes recording information in the field notebook (and on sampling forms if required), and completing chain-of-custody documentation for sample storage and shipping. 3.0 HEALTH AND SAFETY WARNINGS Field personnel should be aware of the health and safety precautions to be followed during any field event, and should be familiar with any project-specific hazards. This may include review of project-specific health and safety plans, site-specific and/or organization-specific safety requirements and training. 4.0 INTERFERENCES Some common problems with sample labeling and documentation might include the following:
• Use of incorrect sample numbers; • Transcription errors during sample labeling or recording information in the field
notebook; and • Duplication of sample numbers.
These errors may be avoided by having an additional member of the sampling team check the labeling and documentation during the field event. If one person is conducting the sampling event, information entered on the sample label and in the field notebook should be double-checked for accuracy. 5.0 PERSONNEL QUALIFICATIONS Labeling and documentation of samples should be conducted by personnel familiar with the project work plan and the proposed sample numbering scheme.
HSOP-29 Rev. Date: 6/04
Page 4 of 6
H:\ADMIN\HSOP\2004 New Hsops\HSOP-29.Doc\HLN\6/29/04\065 11/30/05\10:34 AM
6.0 EQUIPMENT AND SUPPLIES
• Sample ID tag or label; • Permanent marker; • Container seals; • Chain-of-custody form; • Sampling forms; and • Field notebook.
7.0 PROCEDURE
1. Determine appropriate sample number to be assigned to the sample. Hydrometrics’ numbering convention is as follows:
XXXX-YYMM-ZZZ
where XXXX=three- or four-letter project prefix; YYMM=last two digits of year followed by month
(e.g., 0407 for July 2004); ZZZ=sequential numbers, starting with 100.
This convention may be modified as necessary; most Quality Assurance Project Plans (QAPPs) contain information on sample numbering to be used for a particular project. For some projects, sample numbers for each site to be sampled may be pre-assigned by Hydrometrics’ Data Quality Department, to facilitate sample entry into the project database.
2. Fill out information on sample ID tag or label. ID tags are typically serially numbered, and may be used for samples that are likely to be the subject of litigation, or as mandated by EPA, other agency, or work plan requirements. Sample labels are similar to ID tags, but are not numbered.
3. Waterproof permanent markers (such as Sharpie pens) should be used to complete sample ID tag or label information. Information to be included on the sample ID tag or label must include:
• Date and time (24-hour style, e.g. 1400 for 2:00 p.m.); • Unique sample number; • Sample processing and preservative (whether the sample has been field-
filtered, whether a preservative has been used, and the type of preservative); and
• Sampling personnel names or initials.
Optional information that may also be included on the sample label or tag as warranted could include the type of analysis requested, or whether the sample is a grab or composite. In no case should a QC sample (blank, duplicate, or blind
HSOP-29 Rev. Date: 6/04
Page 5 of 6
H:\ADMIN\HSOP\2004 New Hsops\HSOP-29.Doc\HLN\6/29/04\065 11/30/05\10:34 AM
performance evaluation sample, used to evaluate lab performance with a standard of known concentration) be identified as such on the sample label. QC samples are assigned sample numbers in the same manner as other samples.
4. When multiple sample containers are used at the same site due to differing preservation requirements or additional volume requirements, the same sample numbers should be used on each container.
5. Due to requirements for cooling samples and field conditions, sample containers often become wet. If possible, it is advisable to place clear shipping tape over the label to ensure that it stays on the container. In addition, some sample information may be written on the sample lid, to aid in sample identification should the label become separated from the container.
6. If required by the project, signed and dated seals may be placed over the container lid to prevent opening without breaking the seal.
7. Sample information is recorded in the field notebook, including the same information recorded on the sample label (date and time, sample number, etc.), as well as identifying information for the sampling site, and QC sample information (see HSOP-31). If desired, sampling forms may also be used to record sampling information.
8. On large projects, with multiple field sampling activities occurring at the same time, multiple field notebooks may be used to document sampling activities. Each notebook should clearly state in the initial entry what tasks will be recorded in the particular book.
9. After collection and documentation, samples should be handled in accordance with standard chain-of-custody procedures (see HSOP-4).
10. Any corrections made to sample labels, field notebooks, or chain-of-custody documentation should be made by crossing out the incorrect information with a single line, entering the correct information, and signing and dating the correction.
8.0 DATA AND RECORDS MANAGEMENT Copies of all sample documentation, including field notebooks, sampling forms, and chain-of-custody forms will be maintained in the project file. Sampling crews are responsible for submitting this information to the Data Quality Department for filing at the completion of each sampling event. 9.0 QUALITY CONTROL/QUALITY ASSURANCE
• At the conclusion of the sampling event, field personnel should collate and review all sampling documentation materials for accuracy, prior to submitting the information to the Data Quality Department.
• Sample codes and associated sampling sites will be cross-referenced during data review and validation procedures stipulated by the project work plan and QAPP.
• Field samplers should ensure that complete documentation of samples has occurred prior to the close of sampling activities each day, by counting the number of samples collected and checking the field notebook for entries related to each sample.

HSOP-29 Rev. Date: 6/04
Page 6 of 6
H:\ADMIN\HSOP\2004 New Hsops\HSOP-29.Doc\HLN\6/29/04\065 11/30/05\10:34 AM
10.0 REFERENCES Hydrometrics HSOP-4: Chain-of-Custody Procedures, Packing, and Shipping Samples Hydrometrics HSOP-31: Field Notebooks
HSOP-31 Rev. Date: 6/04
Page 1 of 5
H:\ADMIN\HSOP\2004 New Hsops\HSOP-31.Doc\HLN\4/5/12\065 4/5/12\4:49 PM
HSOP-31
FIELD NOTEBOOKS
Prepared by: Date: 6/04
Reviewed by: Date: 6/04
Approved by: Date: 6/04
Hydrometrics, Inc. 3020 Bozeman Avenue
Helena, MT 59601

HSOP-31 Rev. Date: 6/04
Page 2 of 5
H:\ADMIN\HSOP\2004 New Hsops\HSOP-31.Doc\HLN\4/5/12\065 4/5/12\4:49 PM
TABLE OF CONTENTS
1.0 SCOPE AND APPLICATION ..................................................................................3
2.0 SUMMARY OF METHOD.......................................................................................3
3.0 HEALTH AND SAFETY WARNINGS ...................................................................3
4.0 INTERFERENCES....................................................................................................3
5.0 PERSONNEL QUALIFICATIONS ..........................................................................3
6.0 EQUIPMENT AND SUPPLIES................................................................................3
7.0 PROCEDURE............................................................................................................3
8.0 DATA AND RECORDS MANAGEMENT..............................................................5
9.0 QUALITY CONTROL/QUALITY ASSURANCE ..................................................5
10.0 REFERENCES ........................................................................................................5
HSOP-31 Rev. Date: 6/04
Page 3 of 5
H:\ADMIN\HSOP\2004 New Hsops\HSOP-31.Doc\HLN\4/5/12\065 4/5/12\4:49 PM
1.0 SCOPE AND APPLICATION HSOP-31 presents general guidance on recording field activities in a dedicated project notebook. Field books are intended to provide sufficient data and observations to enable participants to reconstruct events that occurred during the implementation of the project. In legal proceedings, field notes are typically admissible as evidence and subject to cross-examination. 2.0 SUMMARY OF METHOD Bound notebooks with sequentially numbered pages are used to record observations, sampling information, weather conditions, and other pertinent information during field activities. Entries are made in permanent ink, and signed and dated at the bottom of each page. Both original notebooks and copies of field notes are retained as part of the project file. 3.0 HEALTH AND SAFETY WARNINGS Field personnel should be aware of the health and safety precautions to be followed during any field event, and should be familiar with any project-specific hazards. This may include review of project-specific health and safety plans, site-specific and/or organization-specific safety requirements and training. 4.0 INTERFERENCES The primary potential problem with recording information in field notebooks is dealing with incorrect entries. In no case should erasures be made or information be obliterated or made illegible. Errors should simply be crossed out with a single line, dated, and initialed by the person making the original entry. 5.0 PERSONNEL QUALIFICATIONS No specific qualifications are necessary for recording information in field notebooks. Personnel should be familiar with the scope and objectives of the project in order to record more meaningful field observations. 6.0 EQUIPMENT AND SUPPLIES
• Bound notebook with water resistant, sequentially numbered pages • Pen (indelible ink)
7.0 PROCEDURE
1. New field notebooks should be labeled with the project title and number on the cover. Inside the front cover, write Hydrometrics’ address and phone number as contact
HSOP-31 Rev. Date: 6/04
Page 4 of 5
H:\ADMIN\HSOP\2004 New Hsops\HSOP-31.Doc\HLN\4/5/12\065 4/5/12\4:49 PM
information, in case the notebook is lost. Multiple field notebooks may be required for large or ongoing projects; these should be assigned sequential numbers or labeled on the cover with the inclusive dates of observations recorded in the notebook (e.g., Project X, May 2002 through May 2004).
2. Notebook entries should begin on a fresh page for each day during a field event. While specific entry formats may vary with personal preference, the intent of the field notebook is to provide a daily record of significant events, observations, and measurements, as well as sampling information. All entries should be accompanied by date and time. Examples of information to be recorded in the field notebook includes:
• Weather conditions; • Personnel on-site, including arrival and departure times and identities of
visitors and observers; • Purpose of daily activities; • Site sketch maps; • Health and safety briefing information; • Field meter calibration information; • Identification and description of sampling sites (see HSOP-2); and • Descriptions of photos taken; • Communication logs; • Documentation of deviation from methods; • Sampling instrument decontamination records.
Sampling-specific information should include (see also HSOP-29):
• Sample number, date, and time; • Site identifier; • Description of sample containers, preservation, and sample collection method; • Sample tag number (if applicable); • Field parameter measurements and water calibration (static water level, total
well depth, pH, specific conductance, water temperature, turbidity, color, odor, etc.); and
• Soil depth intervals and descriptions. This list is not meant to be exhaustive, and other pertinent information should also be recorded in the field notebook as determined by field personnel.
3. The field notebook will be used to record communication with individuals on-site and on the phone that could result in a deviation from the SAP or that could impact the quality of the data being collected as part of the investigations.
4. Observations and measurements should be recorded in indelible ink, at the time they are made.
HSOP-31 Rev. Date: 6/04
Page 5 of 5
H:\ADMIN\HSOP\2004 New Hsops\HSOP-31.Doc\HLN\4/5/12\065 4/5/12\4:49 PM
5. If erroneous entries are recorded, corrections should be made by deleting incorrect information with a single line, and dating and initialing the deletion in the notebook. Do not erase or obliterate incorrect entries, or remove pages from the notebook.
6. Blank and unused portions of notebook pages should be crossed out with a single line.
7. At the conclusion of the field event, review notebook entries, sign and date each page (if not already done), and photocopy notebook pages for inclusion in the project file. Original notebooks may be maintained in the project file, or in the files of individual field personnel at the discretion of the project manager.
8.0 DATA AND RECORDS MANAGEMENT Copies of field notes are retained in the project file. Original field notebooks are maintained in the project file, or in the files of individual field personnel at the discretion of the project manager. Completed (filled) notebooks should be placed in the project files or the Data Quality Department notebook library, at the discretion of the project manager. Copies of field notebooks should be updated in project files at the end of each field event. 9.0 QUALITY CONTROL/QUALITY ASSURANCE Standard procedure requires review of field notes by a person other than the person who recorded the field notes, prior to entering the information into the project files, to check for inaccurate, incomplete, or unclear entries, blank pages, or other problems with documentation. Peer review of notebook entries should also be conducted at least once per day during field activities. 10.0 REFERENCES Hydrometrics HSOP-2: Determination, Identification, and Description of Field Sampling
Sites Hydrometrics HSOP-29: Labeling and Documentation of Samples
HSOP-58 Rev. Date: 01/2012
Page 1 of 13
H:\ADMIN\HSOP\2004 New HSOPs\HSOP-58.doc Revised 01/2012
HSOP-58
GUIDELINES FOR QUALITY ASSURANCE OF
ENVIRONMENTAL DATA COLLECTION ACTIVITIES
DATA QUALITY PLANNING, REVIEW, AND MANAGEMENT
Prepared by: Jenny Vanek Date: October 27, 2011 Reviewed by: Kris Adler Date: October 2011 Approved by: Mark Walker Date: January 5, 2012
Hydrometrics, Inc. 3020 Bozeman Avenue
Helena, MT 59601

HSOP-58 Rev. Date: 01/2012
Page 2 of 13
H:\ADMIN\HSOP\2004 New HSOPs\HSOP-58.doc Revised 01/2012
TABLE OF CONTENTS
1.0 PURPOSE AND APPLICABILITY..........................................................................3
2.0 ORGANIZATION AND RESPONSIBILITY...........................................................3
3.0 DATA QUALITY OBJECTIVES .............................................................................3
4.0 DATA REVIEW AND VALIDATION ....................................................................5
5.0 DATA MANAGEMENT ACTIVITIES....................................................................8
5.1 DOCUMENTATION ....................................................................................8
5.1.1 Field Sampling Documents.............................................................8
5.1.2 Laboratory Documents....................................................................8
5.1.3 Data Management Records .............................................................11
5.2 DATA STORAGE .........................................................................................11
5.3 DATA/DOCUMENT RETRIEVAL..............................................................12
5.4 EXTERNAL DOCUMENT SOURCES........................................................12
5.5 REPORTING .................................................................................................12
5.6 SYSTEMS AUDIT/CONTROL ....................................................................12
6.0 REFERENCES ..........................................................................................................13
LIST OF TABLES
TABLE 1. VALIDATION LEVELS AND APPLICATIONS.......................................6
LIST OF FIGURES
FIGURE 1. PRINCIPAL DATA HANDLERS AND DOCUMENTATION FLOW ....4
FIGURE 2. TYPICAL DATA MANAGEMENT ACTIVITIES ...................................9
FIGURE 3. DATA DOCUMENTATION FLOW..........................................................10
HSOP-58 Rev. Date: 01/2012
Page 3 of 13
H:\ADMIN\HSOP\2004 New HSOPs\HSOP-58.doc Revised 01/2012
1.0 PURPOSE AND APPLICABILITY This Standard Operating Procedure (SOP) outlines Hydrometrics’ standard data review and data management policies and procedures. These policies and procedures provide a general framework to guide the collection, analysis, technical review, and management of data obtained during an environmental investigation. Although the required level of rigor will vary based on individual project goals and objectives, some provisions for assessment of data quality and data usability should be incorporated into all projects involving collection and analysis of environmental samples. This SOP describes aspects of data review, validation, and management that are applicable throughout the full duration of a typical environmental investigation, from initial project planning through preparation and submittal of any final reports. Note that project-specific requirements for data review, data validation, and data management are frequently detailed in project planning documents such as Work Plans, Sampling and Analysis Plans (SAPs), and/or Quality Assurance Project Plans (QAPPs). The procedures outlined in this SOP are intended to function as a basis for development of project-specific requirements, and also to provide a fundamental set of review, validation, and management practices applicable to all environmental investigations. 2.0 ORGANIZATION AND RESPONSIBILITY A QA manager is assigned to each individual project. The QA manager has the primary responsibility of overseeing implementation of field activities and laboratory analysis, to ensure that requirements in the project planning documents (Work Plan, SAP, QAPP) are met. These requirements may include specified field and laboratory methodologies, sample types and locations, data quality objectives, quality control sample types and frequencies, and data review, validation, and management procedures. At the direction of the client or QA manager, periodic audits may be performed to evaluate project-specific QA/QC and data management procedures and to provide an avenue for corrective actions. The QA manager and project manager are responsible for assigning personnel to additional roles, including field team leaders and data quality review and management coordinators. Maintenance of complete and accurate field and laboratory documentation should be a focus of the QA team throughout the life of the project. The integrity of the data is maintained throughout all transfers and manipulations between principal data handlers/users. The flow of information is shown in Figure 1. 3.0 DATA QUALITY OBJECTIVES Project-specific Data Quality Objectives (DQOs) should be developed during the project planning phase. The DQO process is designed to ensure that the type, quantity and quality of data collected during the investigation are appropriate for the intended application (EPA, 2006). The DQO process sets the stage for development and implementation of the project work plan.
FIGURE 1. SAMPLE INFORMATION AND DOCUMENTATION FLOW CHART
Samples
Samples Sampling Documentation
Data Deliverables
Data Results and Reports
Reports
SAMPLE INITIATION
SAMPLE COLLECTION
DATA MANAGEMENTAND VALIDATION(HYDROMETRICS)
INTERNAL REVIEWAGENCY
SUBMITTAL AND REVIEW
LABORATORY ANALYSIS
- PREPARATION OF SAMPLECODE LIST
- START SAMPLING EVENTFILE
CLOSURE AND STORAGEOF SAMPLING EVENT
SHIPMENT OF SAMPLES
h:\admin\HSOP\2004 New HSOPs\HSOP-58 Figure 1.xls\HLN\01/05/12\065
HSOP-58 Rev. Date: 01/2012
Page 5 of 13
H:\ADMIN\HSOP\2004 New HSOPs\HSOP-58.doc Revised 01/2012
4.0 DATA REVIEW AND VALIDATION Data review and validation involve the evaluation of the completeness, correctness and conformance of a specific data set against requirements set forth in the project planning documents (EPA, 2002). The level of review used for a particular data set will therefore depend on a comprehensive consideration of not only the intended end use and project objectives but also of project documentation requirements, QA/QC procedures, and inherent limitations in various sampling techniques and analytical methods. These levels are fairly fluid and can be customized to meet project requests/requirements. Table 1 lists Hydrometrics’ established validation levels and their applications. Additionally, for any Montana Department of Environmental Quality CECRA site, the MDEQ’s Data Validation Guidelines will be performed and will take precedence over any inconsistencies with this SOP. The MDEQ guidance document is located at http://deq.mt.gov/ StateSuperfund/PDFs/DataValidationReport.pdf.
• Level I - Visual Validation - At this level the verification of completeness and accuracy of all sampling information takes place. This includes the following: confirming all results (both field and lab); all parameters, units and measurement basis, as being correct; cross checking of field notes and forms; and the verification of flow calculations. The results of this validation, at this level, are documented in a data review report memo. This level of validation generally corresponds to “data verification” as discussed in EPA (2002).
• Level II - Standard Validation - This level of validation encompasses the visual validation plus a more comprehensive review of all of the sampling information. The additional review includes the following: an examination of both field and laboratory QC (any laboratory QC that is included within the analytical package) using validation criteria limits as specified in the USEPA Contract Laboratory Program National Functional Guidelines for Inorganic/Organic Data Review (EPA, 2010; 2008); a survey of the achievement of the project data quality objectives; qualification of the data per project requirements; data evaluation; historic trend comparison and/or graphs; ion balance; and statistical comparisons. The results of this validation, at this level, are documented in a comprehensive data review report.
• Level III - (Contract Laboratory Program) CLP Validation - At this level of review, both the visual and standard validation tasks are performed. Analytical data is characterized by rigorous QA/QC protocols and documentation. Validation procedures utilize such documentation as necessary to support project needs. Additional review requirements are: verification of the laboratory’s raw data and quality control for frequency; accuracy; completeness; and procedures as required by the criteria limits specified in the USEPA Contract Laboratory Program National Functional Guidelines for Inorganic/Organic Data Review.
Performance criteria for the following sampling and analytical specific data quality indicators (DQIs) for the precision, accuracy, representativeness, completeness and comparability
HSOP-58 Rev. Date: 01/2012
Page 6 of 13
H:\ADMIN\HSOP\2004 New HSOPs\HSOP-58.doc Revised 01/2012
TABLE 1. VALIDATION LEVELS AND APPLICATIONS
VALIDATION LEVELS
APPLICATION
Level I - Visual Validation • Verify Completeness and Accuracy of Input Data: - Results - Sampling Information - Parameters - Units - Measurement Basis • Cross Check Field Notes and Forms • Verify Flow Calculations • Report via Validation Memo
Level II - Standard Validation • Visual Validation • Quality Control Review - Field Quality Control - Laboratory Batch Quality Control • Data Quality Objectives(DQO) Summary for Precision, Accuracy, Representativeness Comparability, Completeness (PARCC) • Qualify Data as per Project Requirements • Data Evaluation - Statistical Comparison - Ion Balance - Trend Comparison and Graphs • Report via Standard Comprehensive Data Review Report
Level III - CLP Validation (EPA, 2010; 2008)
• Visual • Standard • Quality Control Validation - Laboratory Quality Control - Field Quality Control • Verification with Raw Data - Frequency - Accuracy - Completeness - Procedure • Quality Data as per Project Requirements • Report via Standard Comprehensive Data Review Report
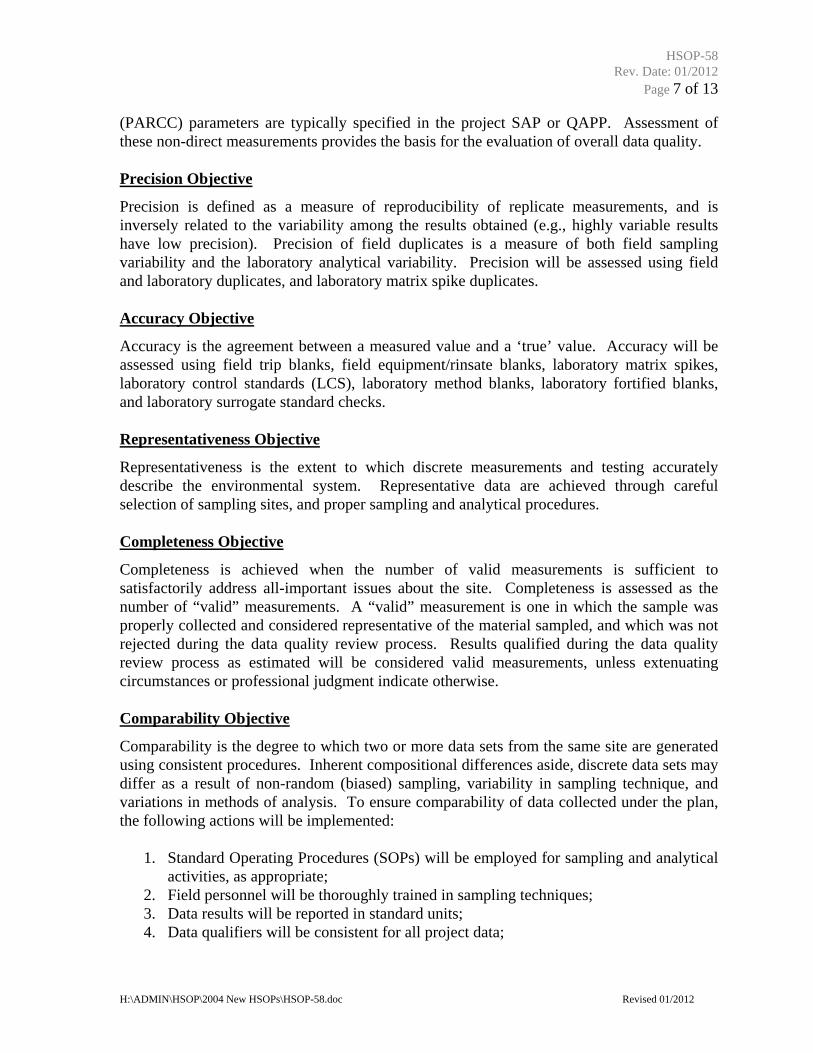
HSOP-58 Rev. Date: 01/2012
Page 7 of 13
H:\ADMIN\HSOP\2004 New HSOPs\HSOP-58.doc Revised 01/2012
(PARCC) parameters are typically specified in the project SAP or QAPP. Assessment of these non-direct measurements provides the basis for the evaluation of overall data quality. Precision Objective
Precision is defined as a measure of reproducibility of replicate measurements, and is inversely related to the variability among the results obtained (e.g., highly variable results have low precision). Precision of field duplicates is a measure of both field sampling variability and the laboratory analytical variability. Precision will be assessed using field and laboratory duplicates, and laboratory matrix spike duplicates. Accuracy Objective
Accuracy is the agreement between a measured value and a ‘true’ value. Accuracy will be assessed using field trip blanks, field equipment/rinsate blanks, laboratory matrix spikes, laboratory control standards (LCS), laboratory method blanks, laboratory fortified blanks, and laboratory surrogate standard checks. Representativeness Objective
Representativeness is the extent to which discrete measurements and testing accurately describe the environmental system. Representative data are achieved through careful selection of sampling sites, and proper sampling and analytical procedures. Completeness Objective
Completeness is achieved when the number of valid measurements is sufficient to satisfactorily address all-important issues about the site. Completeness is assessed as the number of “valid” measurements. A “valid” measurement is one in which the sample was properly collected and considered representative of the material sampled, and which was not rejected during the data quality review process. Results qualified during the data quality review process as estimated will be considered valid measurements, unless extenuating circumstances or professional judgment indicate otherwise. Comparability Objective
Comparability is the degree to which two or more data sets from the same site are generated using consistent procedures. Inherent compositional differences aside, discrete data sets may differ as a result of non-random (biased) sampling, variability in sampling technique, and variations in methods of analysis. To ensure comparability of data collected under the plan, the following actions will be implemented:
1. Standard Operating Procedures (SOPs) will be employed for sampling and analytical activities, as appropriate;
2. Field personnel will be thoroughly trained in sampling techniques; 3. Data results will be reported in standard units; 4. Data qualifiers will be consistent for all project data;
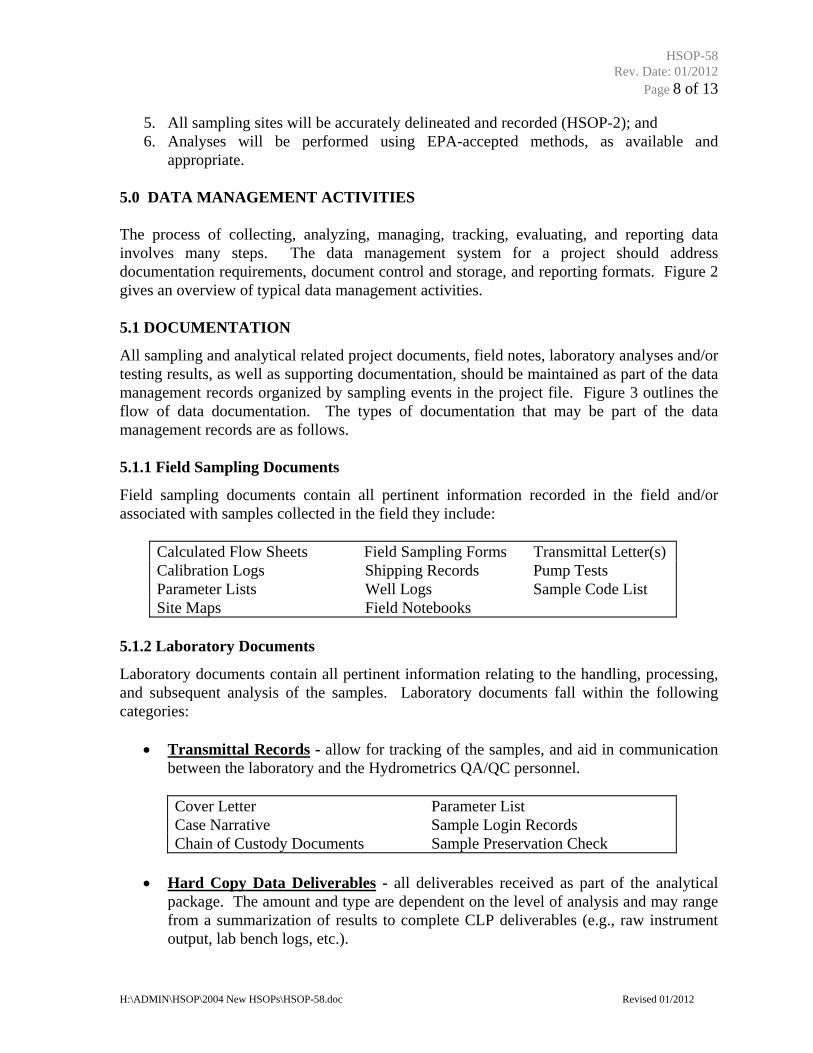
HSOP-58 Rev. Date: 01/2012
Page 8 of 13
H:\ADMIN\HSOP\2004 New HSOPs\HSOP-58.doc Revised 01/2012
5. All sampling sites will be accurately delineated and recorded (HSOP-2); and 6. Analyses will be performed using EPA-accepted methods, as available and
appropriate. 5.0 DATA MANAGEMENT ACTIVITIES The process of collecting, analyzing, managing, tracking, evaluating, and reporting data involves many steps. The data management system for a project should address documentation requirements, document control and storage, and reporting formats. Figure 2 gives an overview of typical data management activities. 5.1 DOCUMENTATION
All sampling and analytical related project documents, field notes, laboratory analyses and/or testing results, as well as supporting documentation, should be maintained as part of the data management records organized by sampling events in the project file. Figure 3 outlines the flow of data documentation. The types of documentation that may be part of the data management records are as follows. 5.1.1 Field Sampling Documents
Field sampling documents contain all pertinent information recorded in the field and/or associated with samples collected in the field they include:
Calculated Flow Sheets Field Sampling Forms Transmittal Letter(s) Calibration Logs Shipping Records Pump Tests Parameter Lists Well Logs Sample Code List Site Maps Field Notebooks
5.1.2 Laboratory Documents
Laboratory documents contain all pertinent information relating to the handling, processing, and subsequent analysis of the samples. Laboratory documents fall within the following categories:
• Transmittal Records - allow for tracking of the samples, and aid in communication between the laboratory and the Hydrometrics QA/QC personnel.
Cover Letter Parameter List Case Narrative Sample Login Records Chain of Custody Documents Sample Preservation Check
• Hard Copy Data Deliverables - all deliverables received as part of the analytical
package. The amount and type are dependent on the level of analysis and may range from a summarization of results to complete CLP deliverables (e.g., raw instrument output, lab bench logs, etc.).
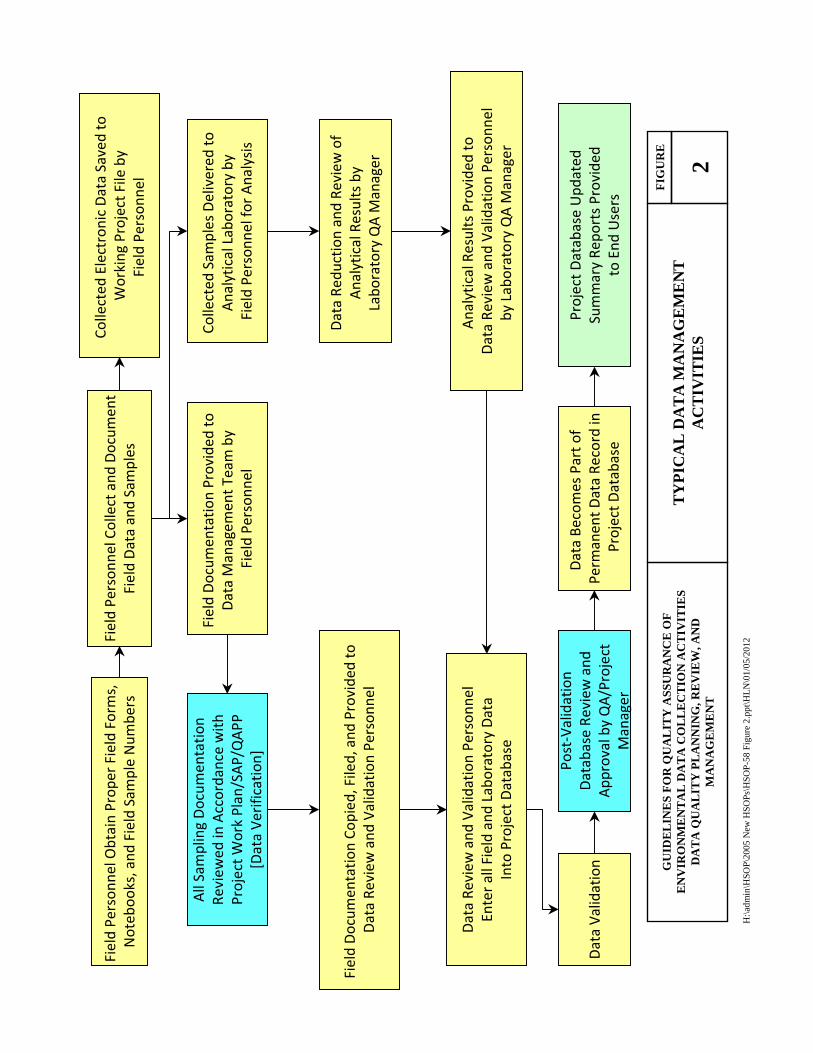
Field Pe
rson
nel O
btain Prop
er Field Forms,
Noteb
ooks, and
Field Sam
ple Num
bers
H:\
adm
in\H
SOP\
2005
New
HS
OP
s\H
SO
P-58
Fig
ure
2.pp
t\H
LN
\01/
05/2
012Field Pe
rson
nel Collect and
Docum
ent
Field Data and Samples
Collected
Sam
ples Delivered
to
Analytical Laboratory by
Field Pe
rson
nel for Analysis
Field Docum
entatio
n Provided
to
Data Managem
ent T
eam by
Field Pe
rson
nel
Data Re
duction and Re
view
of
Analytical Results by
Labo
ratory QA M
anager
Field Docum
entatio
n Co
pied
, Filed, and
Provide
d to
Data Re
view
and
Validation Pe
rson
nel
Data Re
view
and
Validation Pe
rson
nel
Enter all Field and
Laboratory Data
Into Project Database
Data Va
lidation
2
FIG
UR
E
TY
PIC
AL
DA
TA
MA
NA
GE
ME
NT
A
CT
IVIT
IES
GU
IDE
LIN
ES
FO
R Q
UA
LIT
Y A
SS
UR
AN
CE
OF
E
NV
IRO
NM
EN
TA
L D
AT
A C
OL
LE
CT
ION
AC
TIV
ITIE
SD
AT
A Q
UA
LIT
Y P
LA
NN
ING
, RE
VIE
W, A
ND
M
AN
AG
EM
EN
T
Collected
Electronic Data Saved to
Working
Project File by
Field Pe
rson
nel
Analytical Results Provide
d to
Data Re
view
and
Validation Pe
rson
nel
by Laboratory QA M
anager
Data Be
comes Part o
f Pe
rmanen
t Data Re
cord in
Project D
atabase
Project D
atabase Upd
ated
Summary Re
ports Provided
to End
Users
Post‐Validation
Database Re
view
and
App
roval by QA/Project
Manager
All Sampling Docum
entatio
n Re
view
ed in Accordance with
Project W
ork Plan/SAP/QAPP
[Data Ve
rification]
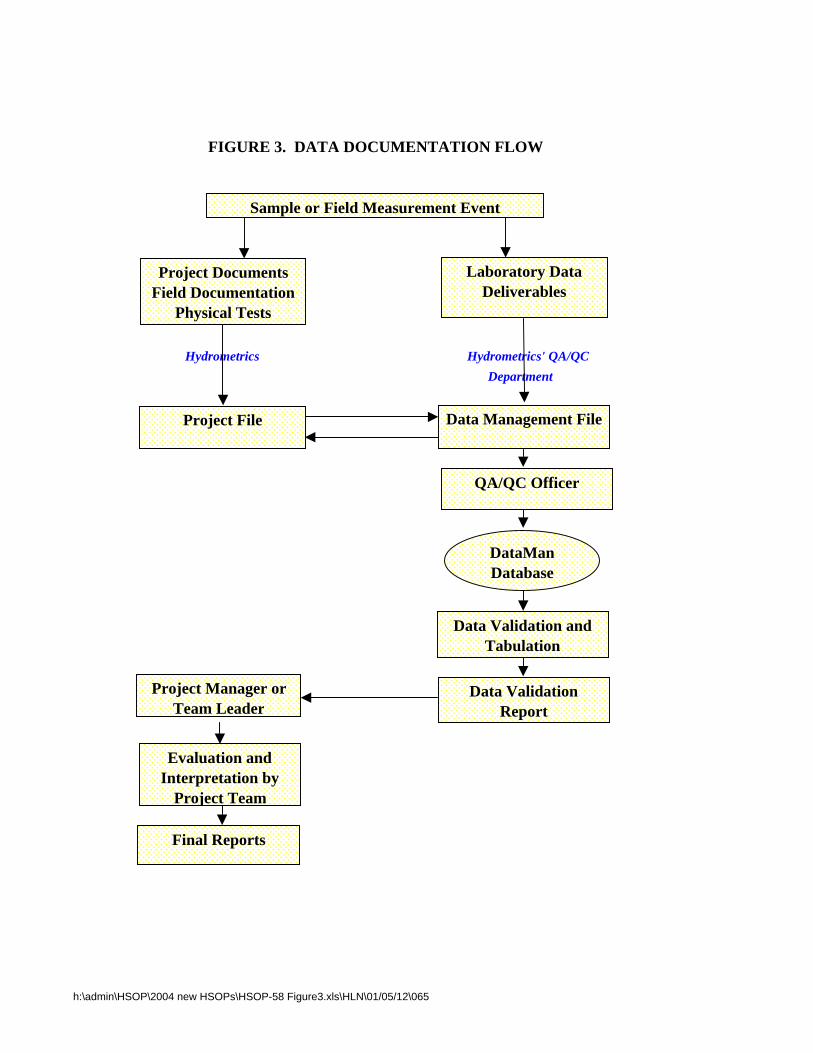
Hydrometrics Hydrometrics' QA/QC
Department
FIGURE 3. DATA DOCUMENTATION FLOW
Sample or Field Measurement Event
Project DocumentsField Documentation
Physical Tests
Project File Data Management File
Project Manager or Team Leader
DataManDatabase
Evaluation and Interpretation by
Project Team
Final Reports
Laboratory Data Deliverables
QA/QC Officer
Data Validation and Tabulation
Data ValidationReport
h:\admin\HSOP\2004 new HSOPs\HSOP-58 Figure3.xls\HLN\01/05/12\065
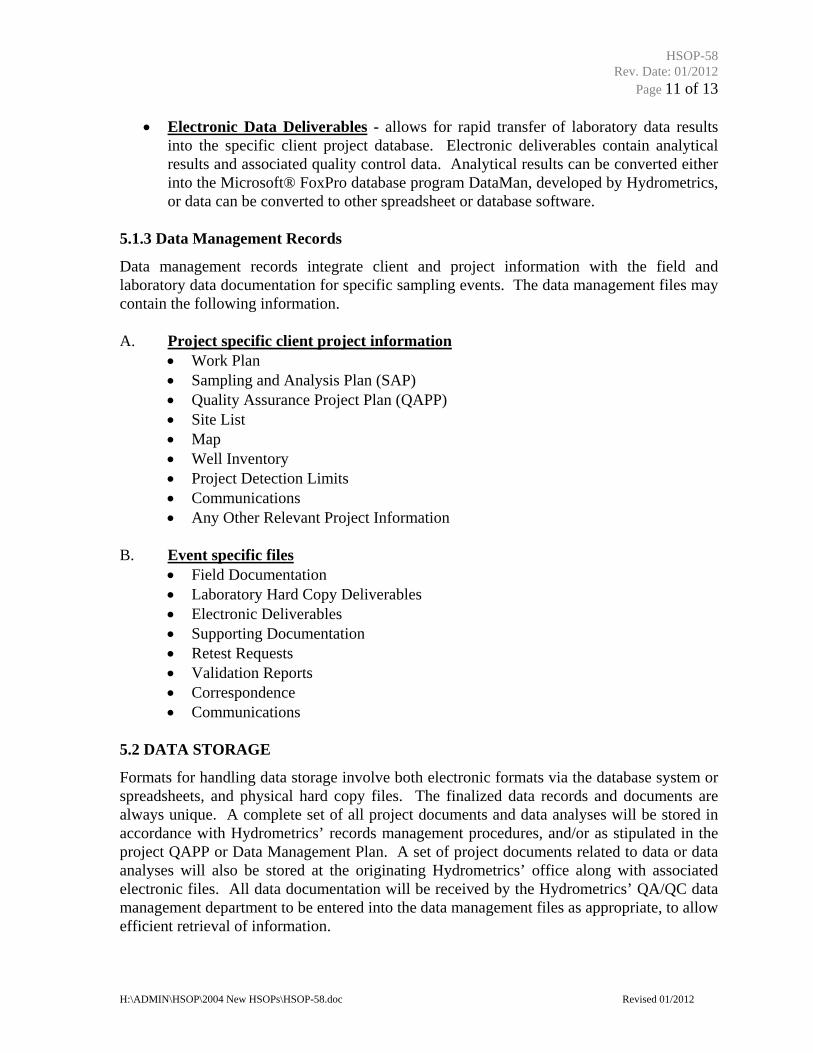
HSOP-58 Rev. Date: 01/2012
Page 11 of 13
H:\ADMIN\HSOP\2004 New HSOPs\HSOP-58.doc Revised 01/2012
• Electronic Data Deliverables - allows for rapid transfer of laboratory data results into the specific client project database. Electronic deliverables contain analytical results and associated quality control data. Analytical results can be converted either into the Microsoft® FoxPro database program DataMan, developed by Hydrometrics, or data can be converted to other spreadsheet or database software.
5.1.3 Data Management Records
Data management records integrate client and project information with the field and laboratory data documentation for specific sampling events. The data management files may contain the following information. A. Project specific client project information
• Work Plan • Sampling and Analysis Plan (SAP) • Quality Assurance Project Plan (QAPP) • Site List • Map • Well Inventory • Project Detection Limits • Communications • Any Other Relevant Project Information
B. Event specific files
• Field Documentation • Laboratory Hard Copy Deliverables • Electronic Deliverables • Supporting Documentation • Retest Requests • Validation Reports • Correspondence • Communications
5.2 DATA STORAGE
Formats for handling data storage involve both electronic formats via the database system or spreadsheets, and physical hard copy files. The finalized data records and documents are always unique. A complete set of all project documents and data analyses will be stored in accordance with Hydrometrics’ records management procedures, and/or as stipulated in the project QAPP or Data Management Plan. A set of project documents related to data or data analyses will also be stored at the originating Hydrometrics’ office along with associated electronic files. All data documentation will be received by the Hydrometrics’ QA/QC data management department to be entered into the data management files as appropriate, to allow efficient retrieval of information.
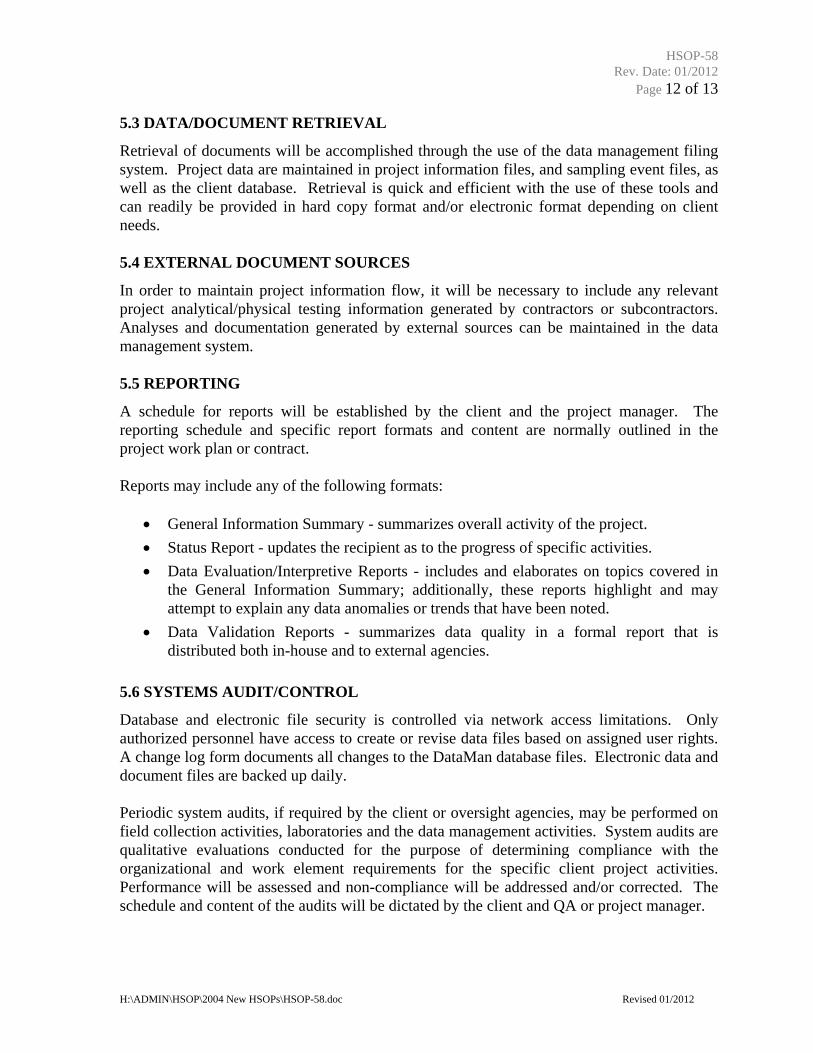
HSOP-58 Rev. Date: 01/2012
Page 12 of 13
H:\ADMIN\HSOP\2004 New HSOPs\HSOP-58.doc Revised 01/2012
5.3 DATA/DOCUMENT RETRIEVAL
Retrieval of documents will be accomplished through the use of the data management filing system. Project data are maintained in project information files, and sampling event files, as well as the client database. Retrieval is quick and efficient with the use of these tools and can readily be provided in hard copy format and/or electronic format depending on client needs. 5.4 EXTERNAL DOCUMENT SOURCES
In order to maintain project information flow, it will be necessary to include any relevant project analytical/physical testing information generated by contractors or subcontractors. Analyses and documentation generated by external sources can be maintained in the data management system. 5.5 REPORTING
A schedule for reports will be established by the client and the project manager. The reporting schedule and specific report formats and content are normally outlined in the project work plan or contract. Reports may include any of the following formats:
• General Information Summary - summarizes overall activity of the project.
• Status Report - updates the recipient as to the progress of specific activities.
• Data Evaluation/Interpretive Reports - includes and elaborates on topics covered in the General Information Summary; additionally, these reports highlight and may attempt to explain any data anomalies or trends that have been noted.
• Data Validation Reports - summarizes data quality in a formal report that is distributed both in-house and to external agencies.
5.6 SYSTEMS AUDIT/CONTROL
Database and electronic file security is controlled via network access limitations. Only authorized personnel have access to create or revise data files based on assigned user rights. A change log form documents all changes to the DataMan database files. Electronic data and document files are backed up daily. Periodic system audits, if required by the client or oversight agencies, may be performed on field collection activities, laboratories and the data management activities. System audits are qualitative evaluations conducted for the purpose of determining compliance with the organizational and work element requirements for the specific client project activities. Performance will be assessed and non-compliance will be addressed and/or corrected. The schedule and content of the audits will be dictated by the client and QA or project manager.
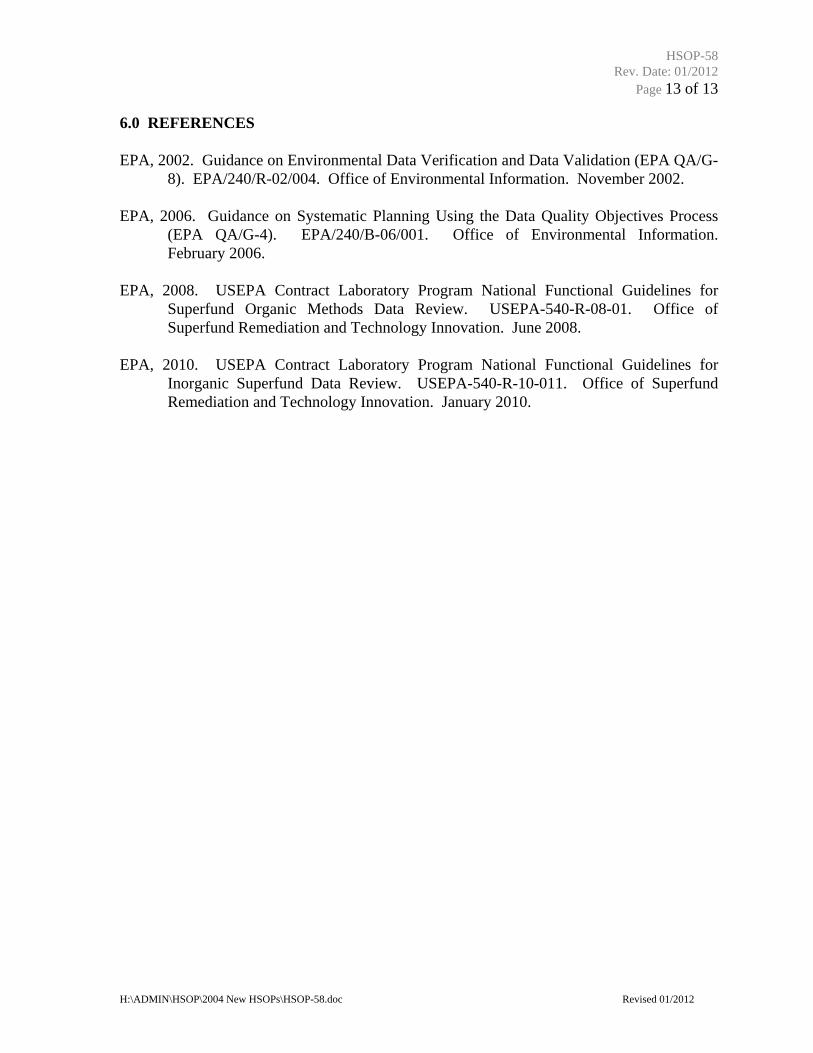
HSOP-58 Rev. Date: 01/2012
Page 13 of 13
H:\ADMIN\HSOP\2004 New HSOPs\HSOP-58.doc Revised 01/2012
6.0 REFERENCES
EPA, 2002. Guidance on Environmental Data Verification and Data Validation (EPA QA/G-8). EPA/240/R-02/004. Office of Environmental Information. November 2002.
EPA, 2006. Guidance on Systematic Planning Using the Data Quality Objectives Process
(EPA QA/G-4). EPA/240/B-06/001. Office of Environmental Information. February 2006.
EPA, 2008. USEPA Contract Laboratory Program National Functional Guidelines for
Superfund Organic Methods Data Review. USEPA-540-R-08-01. Office of Superfund Remediation and Technology Innovation. June 2008.
EPA, 2010. USEPA Contract Laboratory Program National Functional Guidelines for
Inorganic Superfund Data Review. USEPA-540-R-10-011. Office of Superfund Remediation and Technology Innovation. January 2010.
Hydrometrics, Inc. Consulting Scientists and Engineers
h:\admin\hsop\sec2.1\hfsop-3.doc\HLN\7/23/02\034 Revised 4/97 1 02/01/06 1:25 PM
STANDARD OPERATING PROCEDURE
PRESERVATION AND STORAGE OF INORGANIC WATER SAMPLES© HF-SOP-3
1.0 PURPOSE An important factor in obtaining representative water quality data is the preservation and storage of samples. Preservation is designed to:
1. Retard biological activity;
2. Retard chemical reactions; and
3. Reduce volatility of constituents.
Preservation generally includes chemical additives, pH control, refrigeration, proper container materials, and immediate field filtration for dissolved constituents. 2.0 EQUIPMENT Table 1 (attached) lists recommended preservatives, containers and holding times for various parameters. Be sure to assemble all the required containers, preservatives, and filters, as required, before leaving for the field. 3.0 PROCEDURE In all cases where dissolved constituents are to be measured, the sample will be field-filtered through a 0.45 micron filter prior to addition of a preservative. Samples will be preserved according to guidelines presented in Table 1, and will remain refrigerated or in coolers with ice until analysis. Complete sampling form for groundwater or surface water (HF-FORM-430). 4.0 REFERENCES U.S. EPA, 1983. Methods for Chemical Analysis of Water and Wastes, EPA-600/4-79-020, 3rd Edition.
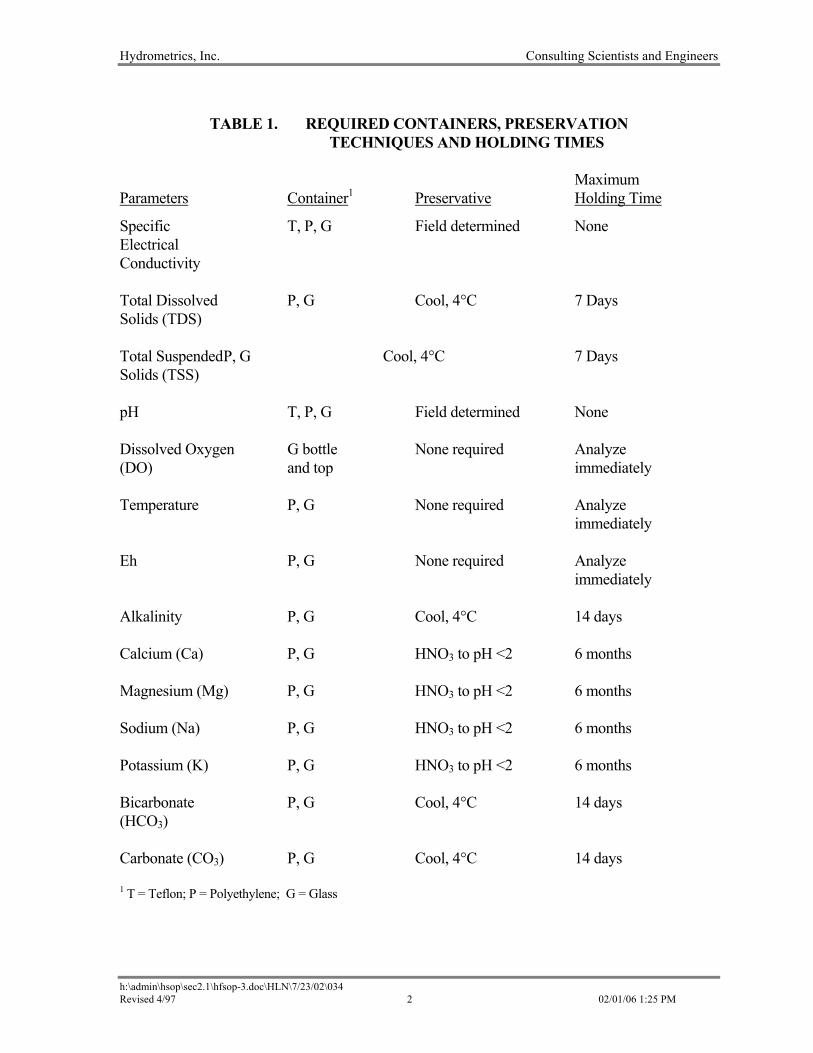
Hydrometrics, Inc. Consulting Scientists and Engineers
h:\admin\hsop\sec2.1\hfsop-3.doc\HLN\7/23/02\034 Revised 4/97 2 02/01/06 1:25 PM
TABLE 1. REQUIRED CONTAINERS, PRESERVATION TECHNIQUES AND HOLDING TIMES
Maximum Parameters Container1 Preservative Holding Time
Specific T, P, G Field determined None Electrical Conductivity Total Dissolved P, G Cool, 4°C 7 Days Solids (TDS) Total Suspended P, G Cool, 4°C 7 Days Solids (TSS) pH T, P, G Field determined None Dissolved Oxygen G bottle None required Analyze (DO) and top immediately Temperature P, G None required Analyze immediately Eh P, G None required Analyze immediately Alkalinity P, G Cool, 4°C 14 days Calcium (Ca) P, G HNO3 to pH <2 6 months Magnesium (Mg) P, G HNO3 to pH <2 6 months Sodium (Na) P, G HNO3 to pH <2 6 months Potassium (K) P, G HNO3 to pH <2 6 months Bicarbonate P, G Cool, 4°C 14 days (HCO3) Carbonate (CO3) P, G Cool, 4°C 14 days 1 T = Teflon; P = Polyethylene; G = Glass
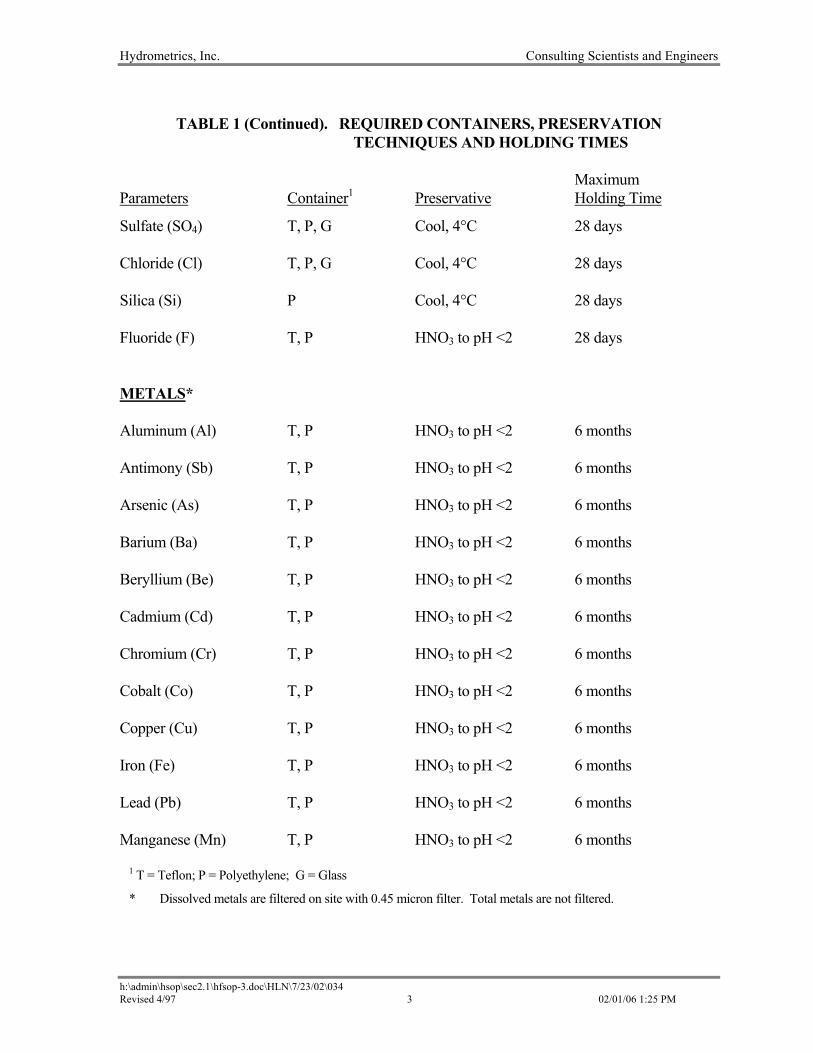
Hydrometrics, Inc. Consulting Scientists and Engineers
h:\admin\hsop\sec2.1\hfsop-3.doc\HLN\7/23/02\034 Revised 4/97 3 02/01/06 1:25 PM
TABLE 1 (Continued). REQUIRED CONTAINERS, PRESERVATION TECHNIQUES AND HOLDING TIMES
Maximum Parameters Container1 Preservative Holding Time
Sulfate (SO4) T, P, G Cool, 4°C 28 days Chloride (Cl) T, P, G Cool, 4°C 28 days Silica (Si) P Cool, 4°C 28 days Fluoride (F) T, P HNO3 to pH <2 28 days METALS* Aluminum (Al) T, P HNO3 to pH <2 6 months Antimony (Sb) T, P HNO3 to pH <2 6 months Arsenic (As) T, P HNO3 to pH <2 6 months Barium (Ba) T, P HNO3 to pH <2 6 months Beryllium (Be) T, P HNO3 to pH <2 6 months Cadmium (Cd) T, P HNO3 to pH <2 6 months Chromium (Cr) T, P HNO3 to pH <2 6 months Cobalt (Co) T, P HNO3 to pH <2 6 months Copper (Cu) T, P HNO3 to pH <2 6 months Iron (Fe) T, P HNO3 to pH <2 6 months Lead (Pb) T, P HNO3 to pH <2 6 months Manganese (Mn) T, P HNO3 to pH <2 6 months 1 T = Teflon; P = Polyethylene; G = Glass * Dissolved metals are filtered on site with 0.45 micron filter. Total metals are not filtered.
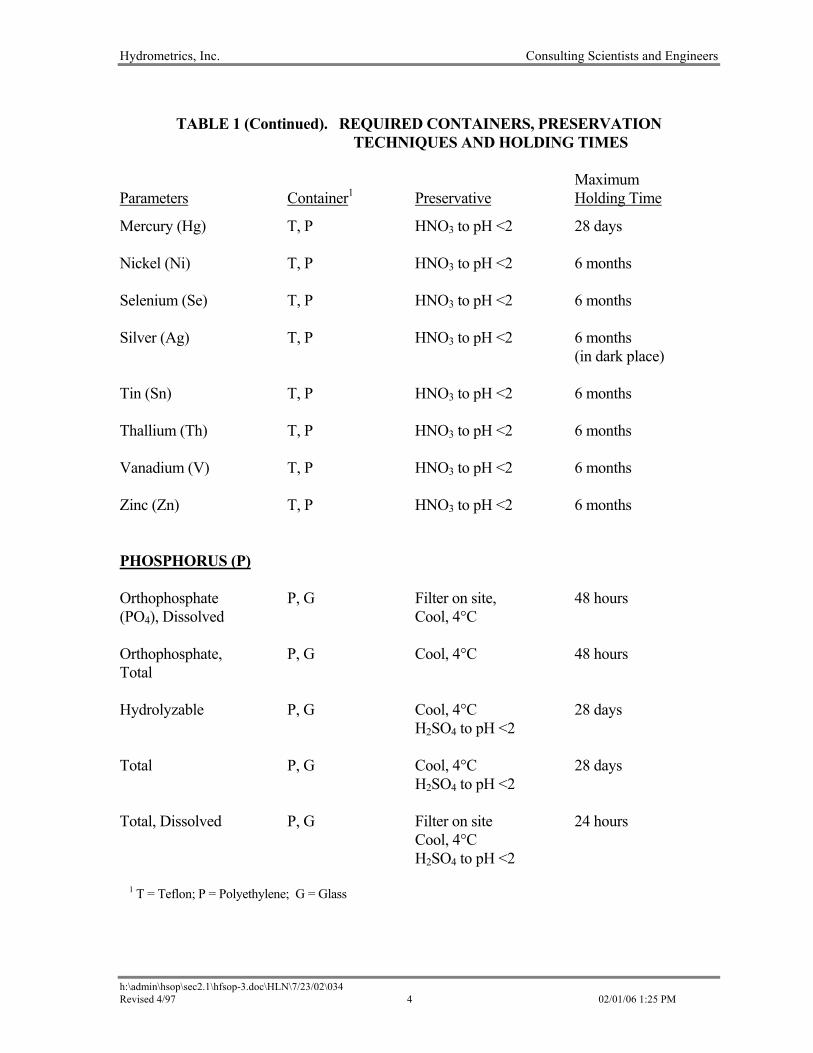
Hydrometrics, Inc. Consulting Scientists and Engineers
h:\admin\hsop\sec2.1\hfsop-3.doc\HLN\7/23/02\034 Revised 4/97 4 02/01/06 1:25 PM
TABLE 1 (Continued). REQUIRED CONTAINERS, PRESERVATION TECHNIQUES AND HOLDING TIMES
Maximum Parameters Container1 Preservative Holding Time
Mercury (Hg) T, P HNO3 to pH <2 28 days Nickel (Ni) T, P HNO3 to pH <2 6 months Selenium (Se) T, P HNO3 to pH <2 6 months Silver (Ag) T, P HNO3 to pH <2 6 months (in dark place) Tin (Sn) T, P HNO3 to pH <2 6 months Thallium (Th) T, P HNO3 to pH <2 6 months Vanadium (V) T, P HNO3 to pH <2 6 months Zinc (Zn) T, P HNO3 to pH <2 6 months PHOSPHORUS (P) Orthophosphate P, G Filter on site, 48 hours (PO4), Dissolved Cool, 4°C Orthophosphate, P, G Cool, 4°C 48 hours Total Hydrolyzable P, G Cool, 4°C 28 days H2SO4 to pH <2 Total P, G Cool, 4°C 28 days H2SO4 to pH <2 Total, Dissolved P, G Filter on site 24 hours Cool, 4°C H2SO4 to pH <2 1 T = Teflon; P = Polyethylene; G = Glass
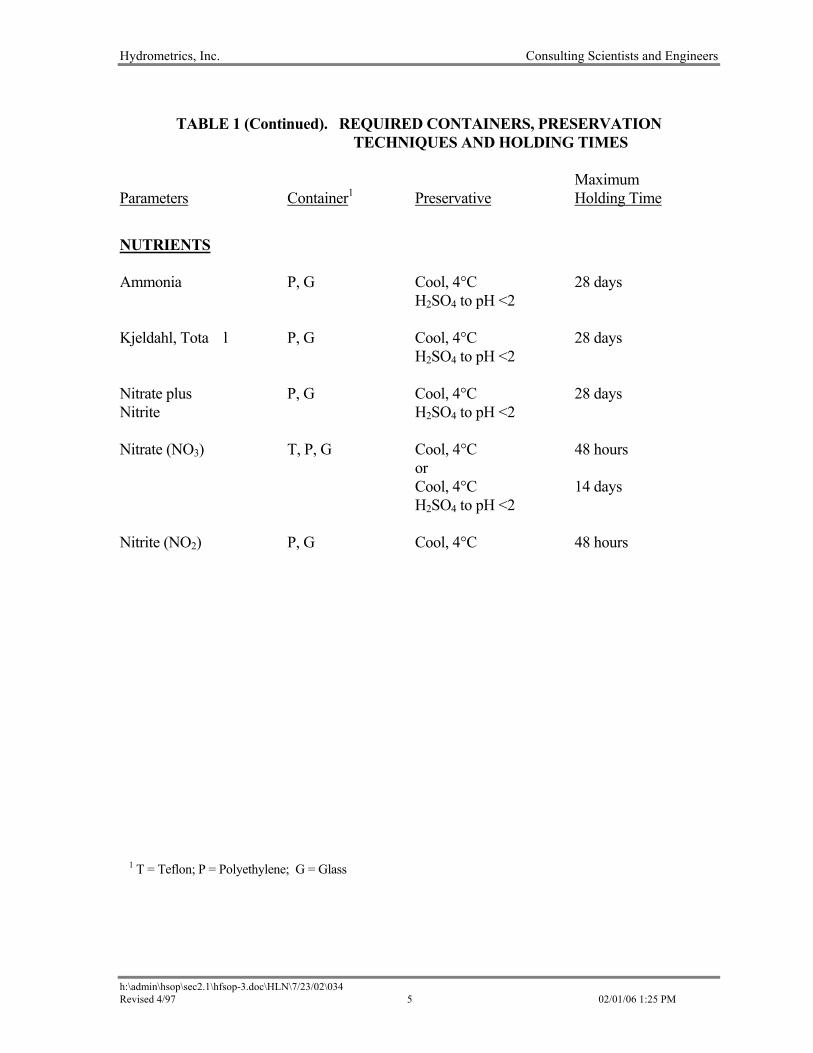
Hydrometrics, Inc. Consulting Scientists and Engineers
h:\admin\hsop\sec2.1\hfsop-3.doc\HLN\7/23/02\034 Revised 4/97 5 02/01/06 1:25 PM
TABLE 1 (Continued). REQUIRED CONTAINERS, PRESERVATION TECHNIQUES AND HOLDING TIMES
Maximum Parameters Container1 Preservative Holding Time
NUTRIENTS Ammonia P, G Cool, 4°C 28 days H2SO4 to pH <2 Kjeldahl, Tota l P, G Cool, 4°C 28 days H2SO4 to pH <2 Nitrate plus P, G Cool, 4°C 28 days Nitrite H2SO4 to pH <2 Nitrate (NO3) T, P, G Cool, 4°C 48 hours or Cool, 4°C 14 days H2SO4 to pH <2 Nitrite (NO2) P, G Cool, 4°C 48 hours 1 T = Teflon; P = Polyethylene; G = Glass

Water Sampling Form ~~ HF-430
Project Name: Site Designation:Project Code: Sample Code Number:
Sample Team Member(s): Sample Date:Laboratory Used: Sample Time: (military)
For Groundwater SamplesIf Duplicate Sample Collected,
Please Record Belowwell volume
formula:V = (TD-SWL)x(Dia.2)
25 Comments
Duplicate Sample Code #: TD (ft): Duplicate Sample Time: SWL (ft): no access/pumping
Casing Diameter (I.D.")
Site Conditions Water Volume (V) (gal):x 3=(gal.)
New Site: Yes No Photo taken: Yes No Actual Vol. Removed (gal.)Site Type: DRY surface water process water Water Level Recovery: slow moderate rapid
monitoring well domestic well adit seep For Surface Water Samples
spring other: Flow Method: Marsh McBirney Volumetric Flume Weir Estimate
Weather Conditions: calm breeze windy Other Flow or Description:no precip. rain snowclear p. cloudy overcast
Air Temperature: o C o F Flow: gpm cfs Staff Gage:
Field Parameter Stabilization
Time (military)
Oxidation Reduction
Potential (mV)Dissolved
Oxygen (mg/l) pH S.C.
(µmhos/cm)Turbidity
(n.t.u.)Temperature
(oC)
Additional Parameters or Notes
Turbidity: clear moderate Sample Method: grab composite pump bailer other (circle) slight very (describe) large peristaltic
Field Parameters Bottles CollectedSample Duplicate Quantity Size Filter or Unfilt. Preservative Parameter Additional Notes
ORP (mV) ml F or UFDO (mg/l) ml F or UF
pH ml F or UFSC (µmhos/cm) ml F or UF
Turbidity (ntu) ml F or UFH2O Tmp. (oC) ml F or UF
Color ml F or UFOther: ml F or UF
ml F or UFComments:
Sample Team Member Signature: Page of
h:\files\105\9801\admin\hsop\sec6.0\hf-430.xls\HLN\07/17/97\034 11/30/2005/10:38 AM
Hydrometrics, Inc. Consulting Scientists and Engineers
h:\admin\hsop\sec2.2\hfsop-10.doc\HLN\6/17/05\034 Revised 2/99 1 11/30/05 10:35 AM
STANDARD OPERATING PROCEDURE
WATER LEVEL MEASUREMENT WITH AN ELECTRIC PROBE
HF-SOP-10 1.0 PURPOSE This procedure applies to all water level measurements obtained using an electric probe. Normally, this procedure is used for measurement of water levels in wells. All electrical probes used, such as an Olympic Well Probe or Solinst, must have permanent depth markers placed at a minimum of every five feet on the probe wire or must have a direct reading tape. 2.0 EQUIPMENT
• Electronic probe;
• Water level measurement form (HF-FORM-430, Water Sampling Form);
• Field notebook; and
• Probe calibration data. 3.0 PROCEDURE The water level is obtained by lowering the probe until contact is made between the probe tip and the water surface. The contact point is carefully checked by a slight lowering and raising of the probe and simultaneously observing the needle deflection, buzzer or light on the meter. For accurate measurements, the wire line must be straight as the probe is lowered. This is particularly important for the first few feet of line. Water depth is determined by direct reading of the probe wire or by measurement of the wire to the center of the nearest large marker and addition or subtraction from the marker value. Water level measurements are referenced to the measuring point (MP). Normally, the MP is the top of a well casing but may be some other point. The MP used must be described. The north edge of the casing is usually marked or notched and all water level measurements are referred to this marked point. 3.1 CALIBRATION All electric probes must be periodically calibrated. Normally, calibration is once or twice per year but, if the probe has been rebuilt, stretched, or replaced, it also must be recalibrated. For
Hydrometrics, Inc. Consulting Scientists and Engineers
h:\admin\hsop\sec2.2\hfsop-10.doc\HLN\6/17/05\034 Revised 2/99 2 11/30/05 10:35 AM
recalibration, the electrical line is laid out on a flat surface and stretched to approximate its normal hanging weight. A steel tape graduated in 0.01 foot increments is used to determine probe accuracy. Additionally, the probe must be placed in wells with differing water levels and water depth measured and compared with a steel tape. A calibration record with correction factor is developed and placed in the equipment calibration file. This calibration record is used in the field to correct probe readings. 3.2 MEASUREMENT ACCURACY All water levels and calibrations are normally measured to the nearest 0.01 foot. Probe data are considered accurate to 0.05 feet under good measurement and calibration conditions and to 0.10 feet under normal conditions. For deep or difficult conditions, accuracy may be less than 0.10 feet. 3.3 PROBE DECONTAMINATION For projects where cross-contamination of wells may be a problem, the well probe and line must be decontaminated between measurement sites. This is particularly important when measuring wells containing substances such as PAH (polyaromatic hydrocarbons), pesticides, petroleum products and some metals. Decontamination must include cleaning the probe and wire line. Most organics can be removed by wiping the line, then using detergent in water followed by acetone or methanol, followed by rinsing with DI (deionized) water. Many inorganics can be removed by wiping the wire line and rinsing the probe in DI water. Specific attention must be paid to any sediment, rust or dirt on the wire line.

Water Sampling Form ~~ HF-430
Project Name: Site Designation:Project Code: Sample Code Number:
Sample Team Member(s): Sample Date:Laboratory Used: Sample Time: (military)
For Groundwater SamplesIf Duplicate Sample Collected,
Please Record Belowwell volume
formula:V = (TD-SWL)x(Dia.2)
25 Comments
Duplicate Sample Code #: TD (ft): Duplicate Sample Time: SWL (ft): no access/pumping
Casing Diameter (I.D.")
Site Conditions Water Volume (V) (gal):x 3=(gal.)
New Site: Yes No Photo taken: Yes No Actual Vol. Removed (gal.)Site Type: DRY surface water process water Water Level Recovery: slow moderate rapid
monitoring well domestic well adit seep For Surface Water Samples
spring other: Flow Method: Marsh McBirney Volumetric Flume Weir Estimate
Weather Conditions: calm breeze windy Other Flow or Description:no precip. rain snowclear p. cloudy overcast
Air Temperature: o C o F Flow: gpm cfs Staff Gage:
Field Parameter Stabilization
Time (military)
Oxidation Reduction
Potential (mV)Dissolved
Oxygen (mg/l) pH S.C.
(µmhos/cm)Turbidity
(n.t.u.)Temperature
(oC)
Additional Parameters or Notes
Turbidity: clear moderate Sample Method: grab composite pump bailer other (circle) slight very (describe) large peristaltic
Field Parameters Bottles CollectedSample Duplicate Quantity Size Filter or Unfilt. Preservative Parameter Additional Notes
ORP (mV) ml F or UFDO (mg/l) ml F or UF
pH ml F or UFSC (µmhos/cm) ml F or UF
Turbidity (ntu) ml F or UFH2O Tmp. (oC) ml F or UF
Color ml F or UFOther: ml F or UF
ml F or UFComments:
Sample Team Member Signature: Page of
h:\files\105\9801\admin\hsop\sec6.0\hf-430.xls\HLN\07/17/97\034 11/30/2005/10:38 AM
Hydrometrics, Inc. Consulting Scientists and Engineers
h:\admin\hsop\sec2.2\hfsop-11.doc\HLN\7/22/04\034 Revised 8/00 11/30/05 10:36 AM 1
STANDARD OPERATING PROCEDURE
SAMPLING MONITORING WELLS FOR INORGANIC PARAMETERS
HF-SOP-11 1.0 PURPOSE This procedure describes the methods to be used in collection of groundwater samples from wells. The procedure is designed for wells where inorganic constituents are of primary concern. Methods presented in this SOP are based on recent USGS guidance (USGS, 1999). 2.0 EQUIPMENT Bailers, submersible pumps, sample containers and water level electric probe. Other sampling equipment may be required for specific tasks. Other general equipment may include:
• Distilled or deionized water; • Sampling sheets; • Samplers notebook; • Coolers; • Preservatives; • 0.45 µm filter apparatus with inert filters; • Chemical-free paper towels; • Properly cleaned sample containers of an appropriate volume; and • Stopwatch or watch with second hand.
3.0 PROCEDURE
A. Unlock and open well. B. Obtain water level measurement (see water level HF-SOP-10). If total well depth is
unknown, measure total depth by sounding well. NOTE: electric water level probes are typically not recommended for sounding wells; instead, use a weighted measuring tape or other equipment.
C. Calculate well volume (see calculation on HF-FORM-430) as [(H) x (D)2] / 25,
where H = height of water column (feet), and D = well diameter (inches).
Hydrometrics, Inc. Consulting Scientists and Engineers
h:\admin\hsop\sec2.2\hfsop-11.doc\HLN\7/22/04\034 Revised 8/00 11/30/05 10:36 AM 2
D. Purge well using an appropriate device (bailer, pump, etc.). Standard procedure involves removal of a minimum of three well volumes of water while monitoring field measurements and water level over time. In addition, purge volume should be adequate to remove water from the well annulus (filter pack). Record all pertinent purging information in field notebook and/or on field sampling forms, including:
• Purge method, rate, and total volume; • Field parameter measurements; • Water level changes (drawdown/recovery); • Location of pump intake; and • Other information.
The USGS (1999) recommends pumping or otherwise purging at a rate that does not significantly lower the water level. Toward the end of purging, a minimum of five sets of field parameters should be collected at regular intervals while pumping at the rate to be used for sampling. Use of a flow cell for field parameter monitoring is recommended. Field parameters are considered “stable” when the variability between five sequential measurements is as follows: Parameter Stability Criteria pH +0.1 Temperature (°C) +0.2 SC (µmhos/cm) +5% (SC < 100) or +3% (SC > 100) Dissolved oxygen (mg/L) +0.3 Turbidity (NTU) +10% (NTU < 100)
Modifications of the standard purge procedure are allowable if site conditions, the project work plan, or study objectives dictate such modifications. At a minimum, sufficient water must be removed to rinse equipment and sample bottles, and field measurements must be monitored prior to sampling. Low-flow (micropurge) techniques are discussed in a separate procedure (HF-SOP-105).
E. Samples are collected after a sufficient purge volume is withdrawn and/or field
parameters have stabilized and final field measurements have been collected. Bottles are filled directly from discharge from the well or from another clean container. Considerable care should be taken to minimize entrainment of air, particularly if bailers are used for sampling.
F. Preserve and store samples as appropriate for the intended laboratory analysis.
Collect final water level measurements if desired to determine water level recovery following purging.
Hydrometrics, Inc. Consulting Scientists and Engineers
h:\admin\hsop\sec2.2\hfsop-11.doc\HLN\7/22/04\034 Revised 8/00 11/30/05 10:36 AM 3
4.0 DECONTAMINATION If cross contamination of sampled wells is a potential problem, the following procedure should be followed:
A. Design sampling to proceed from the best quality water to the poorest quality water; and
B. Rinse the pumping apparatus or bailer between holes if well yields are too low to
supply sufficient water to purge the pump, water hose or bailer. If contamination is a problem, dedicated pumps or bailers should be used to ensure the samples are representative of site conditions (see Decontamination of Sampling Equipment HF-SOP-7). 5.0 ASSOCIATED DOCUMENTS A. Decontamination of Sampling Equipment (HF-SOP-7)
B. Water Level Measurement with an Electric Probe (HF-SOP-10)
The following forms will be completed and retained in the project file: A. Water Sampling Form (HF-FORM-430); B. Chain-of-Custody Form (HF-FORM-1); and C. Shipping receipts. 6.0 REFERENCES USGS, 1999. National Field Manual for the Collection of Water-Quality Data: Chapter A4,
Collection of Water Samples. USGS TWRI Book 9, September 1999.
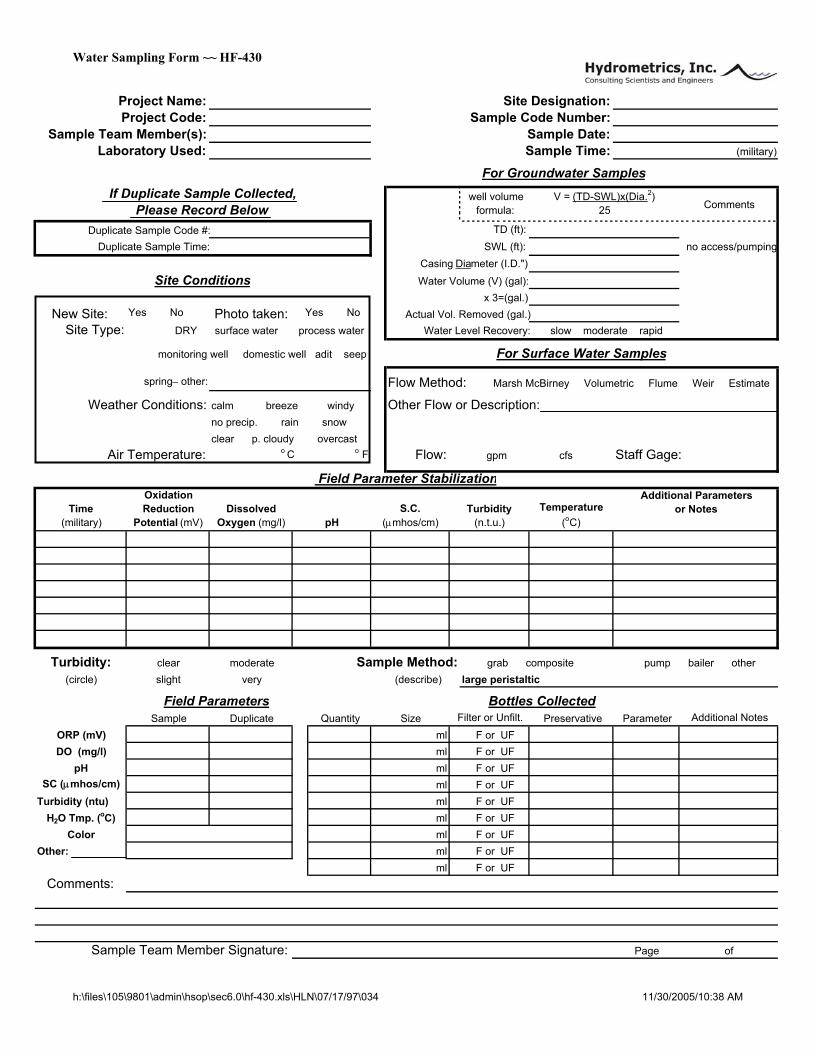
Water Sampling Form ~~ HF-430
Project Name: Site Designation:Project Code: Sample Code Number:
Sample Team Member(s): Sample Date:Laboratory Used: Sample Time: (military)
For Groundwater SamplesIf Duplicate Sample Collected,
Please Record Belowwell volume
formula:V = (TD-SWL)x(Dia.2)
25 Comments
Duplicate Sample Code #: TD (ft): Duplicate Sample Time: SWL (ft): no access/pumping
Casing Diameter (I.D.")
Site Conditions Water Volume (V) (gal):x 3=(gal.)
New Site: Yes No Photo taken: Yes No Actual Vol. Removed (gal.)Site Type: DRY surface water process water Water Level Recovery: slow moderate rapid
monitoring well domestic well adit seep For Surface Water Samples
spring other: Flow Method: Marsh McBirney Volumetric Flume Weir Estimate
Weather Conditions: calm breeze windy Other Flow or Description:no precip. rain snowclear p. cloudy overcast
Air Temperature: o C o F Flow: gpm cfs Staff Gage:
Field Parameter Stabilization
Time (military)
Oxidation Reduction
Potential (mV)Dissolved
Oxygen (mg/l) pH S.C.
(µmhos/cm)Turbidity
(n.t.u.)Temperature
(oC)
Additional Parameters or Notes
Turbidity: clear moderate Sample Method: grab composite pump bailer other (circle) slight very (describe) large peristaltic
Field Parameters Bottles CollectedSample Duplicate Quantity Size Filter or Unfilt. Preservative Parameter Additional Notes
ORP (mV) ml F or UFDO (mg/l) ml F or UF
pH ml F or UFSC (µmhos/cm) ml F or UF
Turbidity (ntu) ml F or UFH2O Tmp. (oC) ml F or UF
Color ml F or UFOther: ml F or UF
ml F or UFComments:
Sample Team Member Signature: Page of
h:\files\105\9801\admin\hsop\sec6.0\hf-430.xls\HLN\07/17/97\034 11/30/2005/10:38 AM
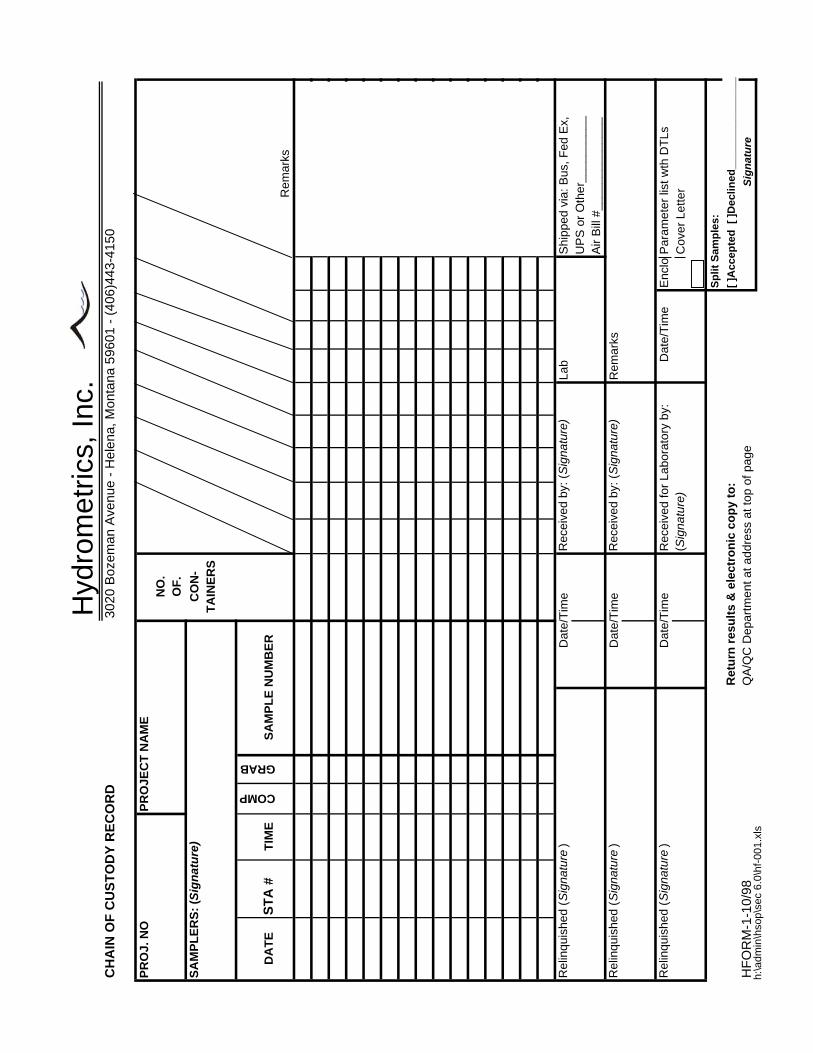
Hyd
rom
etric
s, In
c.C
HA
IN O
F C
US
TO
DY
RE
CO
RD
3020
Boz
eman
Ave
nue
- H
elen
a, M
onta
na 5
9601
- (
406)
443-
4150
PR
OJ.
NO
PR
OJE
CT
NA
ME
NO
.O
F.
SA
MP
LE
RS
: (S
igna
ture
)C
ON
-T
AIN
ER
S
DA
TE
ST
A #
TIM
ECOMP
GRABS
AM
PL
E N
UM
BE
R
R
emar
ks
Rel
inqu
ishe
d (S
igna
ture
)D
ate/
Tim
eR
ecei
ved
by: (
Sig
natu
re)
Lab
Shi
pped
via
: Bus
, Fed
Ex,
UP
S o
r O
ther
____
____
__A
ir B
ill #
____
____
____
__
Rel
inqu
ishe
d (S
igna
ture
)D
ate/
Tim
eR
ecei
ved
by: (
Sig
natu
re)
Rem
arks
Rel
inqu
ishe
d (S
igna
ture
)D
ate/
Tim
eR
ecei
ved
for
Labo
rato
ry b
y:D
ate/
Tim
eE
nclo
sPar
amet
er li
st w
th D
TLs
(Sig
natu
re)
Cov
er L
ette
r
Sp
lit S
amp
les:
Ret
urn
res
ult
s &
ele
ctro
nic
co
py
to:
[ ]A
ccep
ted
[ ]
Dec
lined
____
____
____
___
_
HF
OR
M-1
-10/
98Q
A/Q
C D
epar
tmen
t at a
ddre
ss a
t top
of p
age
Sign
atur
eh:
\adm
in\h
sop\
sec
6.0\
hf-0
01.x
ls
Hydrometrics, Inc. Consulting Scientists and Engineers
h:\admin\hsop\sec2.3\hfsop-19.doc\HLN\10/5/04\034 11/30/05 10:37 AM Revised 10/04
STANDARD OPERATING PROCEDURE
OBTAINING WATER QUALITY SAMPLES FROM STREAMS© HF-SOP-19
1.0 PURPOSE The type of samples described in the following are "grab samples". They represent the water quality at one point for one time period. This is a commonly employed method of water quality sampling and the purpose of this procedure is to standardize sampling. 2.0 EQUIPMENT
• Sampler's field notebook;
• Water Sampling Form (HF-FORM-430);
• Clean sample bottles and labels;
• Preservatives;
• Coolers, ice;
• 0.45 micron filter apparatus with inert filters;
• Distilled, deionized water; and
• Custody seals if required by project. 3.0 PROCEDURE 3.1 Select a station where the water quality sample would best represent the hydrochemistry
of the stream segment. This could be a rapids or fast moving section of a stream. Avoid stagnant areas. Do not sample downstream from a tributary unless complete mixing has occurred. If possible, choose an accessible site for streams to be monitored regularly. Avoid sampling downstream of road crossings, sample upstream if at all possible.
3.2 Measure and record stage and/or flow (see appropriate stage and streamflow measurement
Standard Operating Procedure). 3.3 Label each sample bottle with the appropriate information in accordance with the field
procedure. Complete the Water Sampling Form (HF-FORM-430) (a copy of which is attached).
3.4 If the sample bottle does not contain preservatives, bottle and cap should be rinsed three
times with sample water before the actual sample is collected. A distilled, deionized water rinse can be used as an alternative in some situations.
Hydrometrics, Inc. Consulting Scientists and Engineers
h:\admin\hsop\sec2.3\hfsop-19.doc\HLN\10/5/04\034 11/30/05 10:37 AM Revised 10/04
3.5 Conditions at the surface of stream environments may differ significantly from conditions
within the water column due to the presence of buoyant contaminants (dust, pollen, leaves, etc.). In most cases, inclusion of the surface layer in the integrated sample is desirable. However, if conditions indicate that surface layer contamination would seriously compromise the representativeness of the sample, the sample bottle may be uncapped, filled, and recapped while submerged.
3.6 Obtain a stream width and depth integrated sample by collecting water while moving the
open sample bottle up and down and across the width of the stream. Raise and lower the bottle through the entire depth while proceeding across the stream to assure a representative sample where needed or use an isokinetic depth-integrating sampler such as the USGS US DH-81, DH-48, or D-77 sampler (USGS, 1998). Be sure to leave sufficient volume in sample bottles such that required preservatives may be added without overfilling bottles. Total suspended sediment samples should always be collected using the depth and cross-section integration method. When wading, be sure to collect the sample upstream of wading personnel to avoid sampling resuspended bed sediments caused by bed disturbances.
3.7 Filter and preserve samples as required. 3.8 Immediately place filled sample bottles in cooler chest that is kept at the appropriate
temperature. 4.0 ASSOCIATED REFERENCES HF-FORM-430 Water Sampling Form USGS, 1998. Techniques of Water-Resources Investigations, Book 9, Chapter AZ: Selection of
Equipment for Water Sampling. August 1998.

Water Sampling Form ~~ HF-430
Project Name: Site Designation:Project Code: Sample Code Number:
Sample Team Member(s): Sample Date:Laboratory Used: Sample Time: (military)
For Groundwater SamplesIf Duplicate Sample Collected,
Please Record Belowwell volume
formula:V = (TD-SWL)x(Dia.2)
25 Comments
Duplicate Sample Code #: TD (ft): Duplicate Sample Time: SWL (ft): no access/pumping
Casing Diameter (I.D.")
Site Conditions Water Volume (V) (gal):x 3=(gal.)
New Site: Yes No Photo taken: Yes No Actual Vol. Removed (gal.)Site Type: DRY surface water process water Water Level Recovery: slow moderate rapid
monitoring well domestic well adit seep For Surface Water Samples
spring other: Flow Method: Marsh McBirney Volumetric Flume Weir Estimate
Weather Conditions: calm breeze windy Other Flow or Description:no precip. rain snowclear p. cloudy overcast
Air Temperature: o C o F Flow: gpm cfs Staff Gage:
Field Parameter Stabilization
Time (military)
Oxidation Reduction
Potential (mV)Dissolved
Oxygen (mg/l) pH S.C.
(µmhos/cm)Turbidity
(n.t.u.)Temperature
(oC)
Additional Parameters or Notes
Turbidity: clear moderate Sample Method: grab composite pump bailer other (circle) slight very (describe) large peristaltic
Field Parameters Bottles CollectedSample Duplicate Quantity Size Filter or Unfilt. Preservative Parameter Additional Notes
ORP (mV) ml F or UFDO (mg/l) ml F or UF
pH ml F or UFSC (µmhos/cm) ml F or UF
Turbidity (ntu) ml F or UFH2O Tmp. (oC) ml F or UF
Color ml F or UFOther: ml F or UF
ml F or UFComments:
Sample Team Member Signature: Page of
h:\files\105\9801\admin\hsop\sec6.0\hf-430.xls\HLN\07/17/97\034 11/30/2005/10:38 AM
Hydrometrics, Inc. Consulting Scientists and Engineers
h:\admin\hsop\sec2.6\hfsop-20.doc\HLN\7/22/04\034 Revised 12/94 11/30/05 10:39 AM
1
STANDARD OPERATING PROCEDURE
FIELD MEASUREMENT OF pH USING A pH METER HF-SOP-20
1.0 PURPOSE The purpose of this procedure is to obtain accurate field measurements of the pH of water samples. 2.0 EQUIPMENT This procedure written for Beckman pH meters is applicable to a variety of pH meters. Specific operating instructions accompanying each pH meter should be followed where in variance with the following. 2.1 INSTRUMENTS
• Beckman I-10 or I-21 pH meter or similar instrument;
• Beckman pH electrode/probe, Model 39841 or equivalent;
• Beckman temperature probe, Model 598115 or equivalent; and
• Field notebook. 2.2 REAGENTS
• Buffers pH 4.0, 7.0 and 10.0 (other buffers may be used in unusual waters);
• Deionized water; and
• Beckman filling and storage solution - 4 Molar KCl (potassium chloride). 3.0 PROCEDURE Calibration of the instrument should be performed at least once per day, before sampling activities commence. Field calibration forms must be completed at this time, and calibration verification should be documented in field notebooks. While field instruments are manufactured to be rugged and dependable, a reasonable amount of care is still required to ensure that instruments function properly and give accurate readings.
Hydrometrics, Inc. Consulting Scientists and Engineers
h:\admin\hsop\sec2.6\hfsop-20.doc\HLN\7/22/04\034 Revised 12/94 11/30/05 10:39 AM
2
Field instruments must be cleaned and stored in accordance with established guidelines (see operating instructions) in order to maintain instrument integrity. 3.1 EQUIPMENT SET UP
3.1.1 Instrument Check
• Turn instrument on by pressing pH button, check display and confirm the low battery light is not illuminated; and
• Visually inspect probe for damage and fluid level. If damage is evident, replace probe. If low on fluid, refill using 4 Molar KCl potassium chloride. Be sure to leave vent hole uncovered while taking measurement so that liquid junction flows freely.
3.1.2 Connecting Electrodes
• Insert the pH electrode connector into the large input jack on the top of the instrument and twist to the locked position.
• Insert temperature electrode connector into the small input jack on the instrument
top. Instrument is now ready to use. 3.2 pH MEASUREMENT 3.2.1 Select two buffers, one with a pH of 7.0. Select a second buffer (pH 4.0 or 10.0) so that
the two buffers bracket the anticipated sample pH (use fresh buffers for calibration). 3.2.2 Uncap pH electrode, remove stopper from vent hole, rinse both pH probe and temp
probe with deionized water and place in pH 7.0 buffer. 3.2.3 Depress the CLR button, then depress the ↓ button. The meter will automatically
temperature adjust the reading and compensate to read the buffer in which it is reading. This reading will lock in memory and display on the bottom of the screen.
3.2.4 Remove electrodes from the solution. Rinse with distilled water and place in the second
buffer. 3.2.5 Repeat step 3.2.3 with the second buffer. 3.2.6 Remove electrodes from the second buffer, rinse with distilled water then a portion of
sample and place in sample. The instrument is calibrated daily or anytime a pH is measured, which is not in the buffer range for which the instrument is calibrated.

Hydrometrics, Inc. Consulting Scientists and Engineers
h:\admin\hsop\sec2.6\hfsop-20.doc\HLN\7/22/04\034 Revised 12/94 11/30/05 10:39 AM
3
3.2.7 Record the pH of the sample in sample field notebook. 3.2.8 When measurements are complete, rinse probe with distilled water. Add a few drops of
4 Molar KCl solution to the protective cap and store probe in the protective cap. Replace cover over vent hole.
4.0 ASSOCIATED REFERENCES Beckman Instruments, 1992. Instruction manuals for specific ion meter, models I-10, I-11, I-12; and I-21 pH meters.
Hydrometrics, Inc. Consulting Scientists and Engineers
h:\admin\hsop\sec2.6\hfsop-22.doc\HLN\7/22/04\034 Revised 6/97 05/17/10 2:10 PM 1
STANDARD OPERATING PROCEDURE
FIELD MEASUREMENT OF DISSOLVED OXYGEN
HF-SOP-22 1.0 PURPOSE The purpose of this procedure is to obtain accurate field measurements of dissolved oxygen (DO) in water. 2.0 EQUIPMENT
2.1 INSTRUMENTS
• YSI Model 55 Dissolved Oxygen Meter
2.2 REAGENTS
• Deionized water (DI H2O); and
• Oxygen probe solution. 2.3 OTHER
• Flow Cell (strongly recommended) • Field Notebook
3.0 PROCEDURE When collecting measurements in surface water, the probe can be placed directly into the water body. Similarly, the best method for measuring DO in groundwater is by using a downhole probe. However, if this is not feasible, alternate acceptable methods are available. When measuring ground water, care should be taken to avoid adding oxygen to the water during sample collection. To avoid this condition, bailers should be moved slowly across the water surface and pumping rates should be reduced to avoid splashing or otherwise aerating the sample upon collection in the sample cup. Pumps which cause air to contact the water should not be used. Use of a flow-through cell is strongly encouraged over collection in a sample cup. A flow-through cell reduces potential sample aeration and allows for selection of a standard flow rate to proceed across the probe.
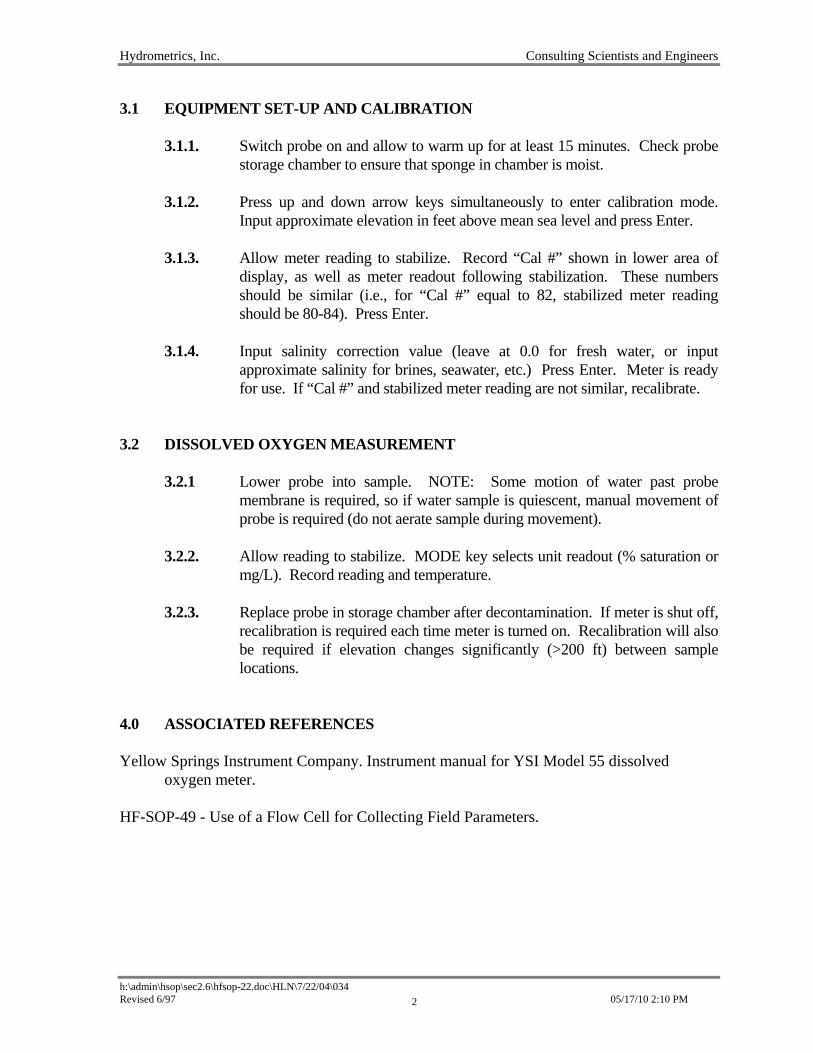
Hydrometrics, Inc. Consulting Scientists and Engineers
h:\admin\hsop\sec2.6\hfsop-22.doc\HLN\7/22/04\034 Revised 6/97 05/17/10 2:10 PM 2
3.1 EQUIPMENT SET-UP AND CALIBRATION 3.1.1. Switch probe on and allow to warm up for at least 15 minutes. Check probe
storage chamber to ensure that sponge in chamber is moist. 3.1.2. Press up and down arrow keys simultaneously to enter calibration mode.
Input approximate elevation in feet above mean sea level and press Enter. 3.1.3. Allow meter reading to stabilize. Record “Cal #” shown in lower area of
display, as well as meter readout following stabilization. These numbers should be similar (i.e., for “Cal #” equal to 82, stabilized meter reading should be 80-84). Press Enter.
3.1.4. Input salinity correction value (leave at 0.0 for fresh water, or input
approximate salinity for brines, seawater, etc.) Press Enter. Meter is ready for use. If “Cal #” and stabilized meter reading are not similar, recalibrate.
3.2 DISSOLVED OXYGEN MEASUREMENT 3.2.1 Lower probe into sample. NOTE: Some motion of water past probe
membrane is required, so if water sample is quiescent, manual movement of probe is required (do not aerate sample during movement).
3.2.2. Allow reading to stabilize. MODE key selects unit readout (% saturation or
mg/L). Record reading and temperature. 3.2.3. Replace probe in storage chamber after decontamination. If meter is shut off,
recalibration is required each time meter is turned on. Recalibration will also be required if elevation changes significantly (>200 ft) between sample locations.
4.0 ASSOCIATED REFERENCES Yellow Springs Instrument Company. Instrument manual for YSI Model 55 dissolved
oxygen meter. HF-SOP-49 - Use of a Flow Cell for Collecting Field Parameters.
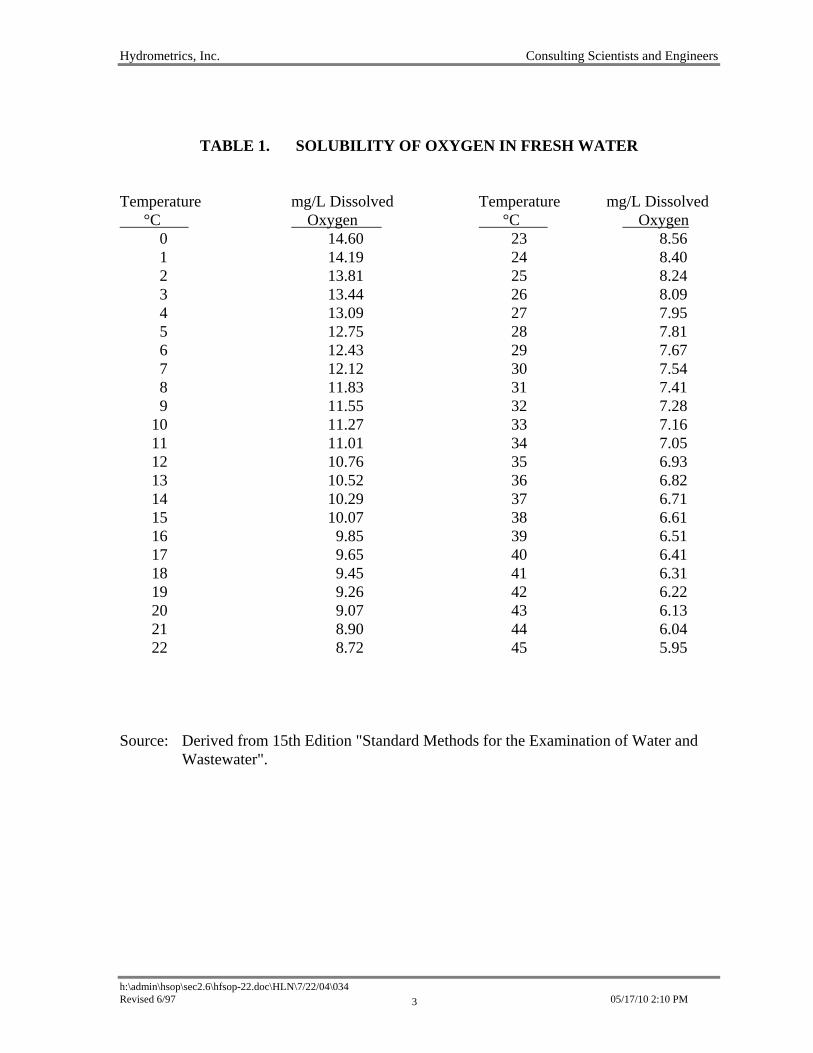
Hydrometrics, Inc. Consulting Scientists and Engineers
h:\admin\hsop\sec2.6\hfsop-22.doc\HLN\7/22/04\034 Revised 6/97 05/17/10 2:10 PM 3
TABLE 1. SOLUBILITY OF OXYGEN IN FRESH WATER Temperature mg/L Dissolved Temperature mg/L Dissolved °C Oxygen °C Oxygen 0 14.60 23 8.56 1 14.19 24 8.40 2 13.81 25 8.24 3 13.44 26 8.09 4 13.09 27 7.95 5 12.75 28 7.81 6 12.43 29 7.67 7 12.12 30 7.54 8 11.83 31 7.41 9 11.55 32 7.28 10 11.27 33 7.16 11 11.01 34 7.05 12 10.76 35 6.93 13 10.52 36 6.82 14 10.29 37 6.71 15 10.07 38 6.61 16 9.85 39 6.51 17 9.65 40 6.41 18 9.45 41 6.31 19 9.26 42 6.22 20 9.07 43 6.13 21 8.90 44 6.04 22 8.72 45 5.95 Source: Derived from 15th Edition "Standard Methods for the Examination of Water and
Wastewater".
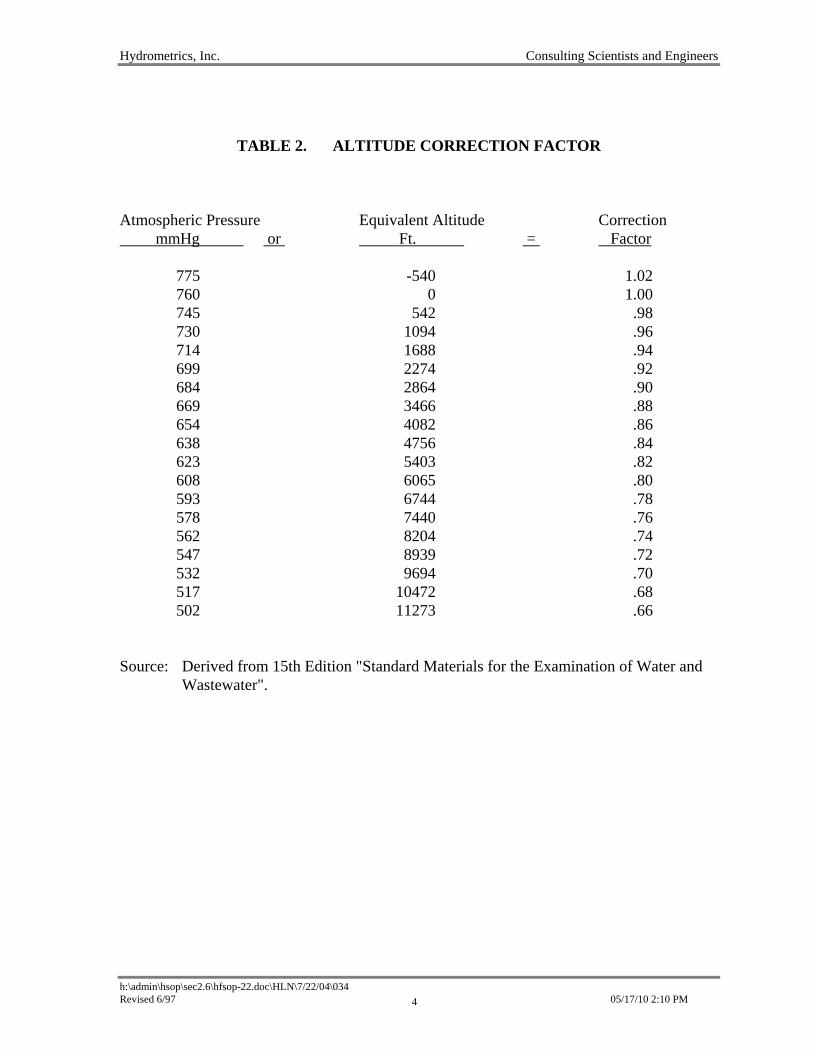
Hydrometrics, Inc. Consulting Scientists and Engineers
h:\admin\hsop\sec2.6\hfsop-22.doc\HLN\7/22/04\034 Revised 6/97 05/17/10 2:10 PM 4
TABLE 2. ALTITUDE CORRECTION FACTOR Atmospheric Pressure Equivalent Altitude Correction mmHg or Ft. = Factor 775 -540 1.02 760 0 1.00 745 542 .98 730 1094 .96 714 1688 .94 699 2274 .92 684 2864 .90 669 3466 .88 654 4082 .86 638 4756 .84 623 5403 .82 608 6065 .80 593 6744 .78 578 7440 .76 562 8204 .74 547 8939 .72 532 9694 .70 517 10472 .68 502 11273 .66 Source: Derived from 15th Edition "Standard Materials for the Examination of Water and
Wastewater".
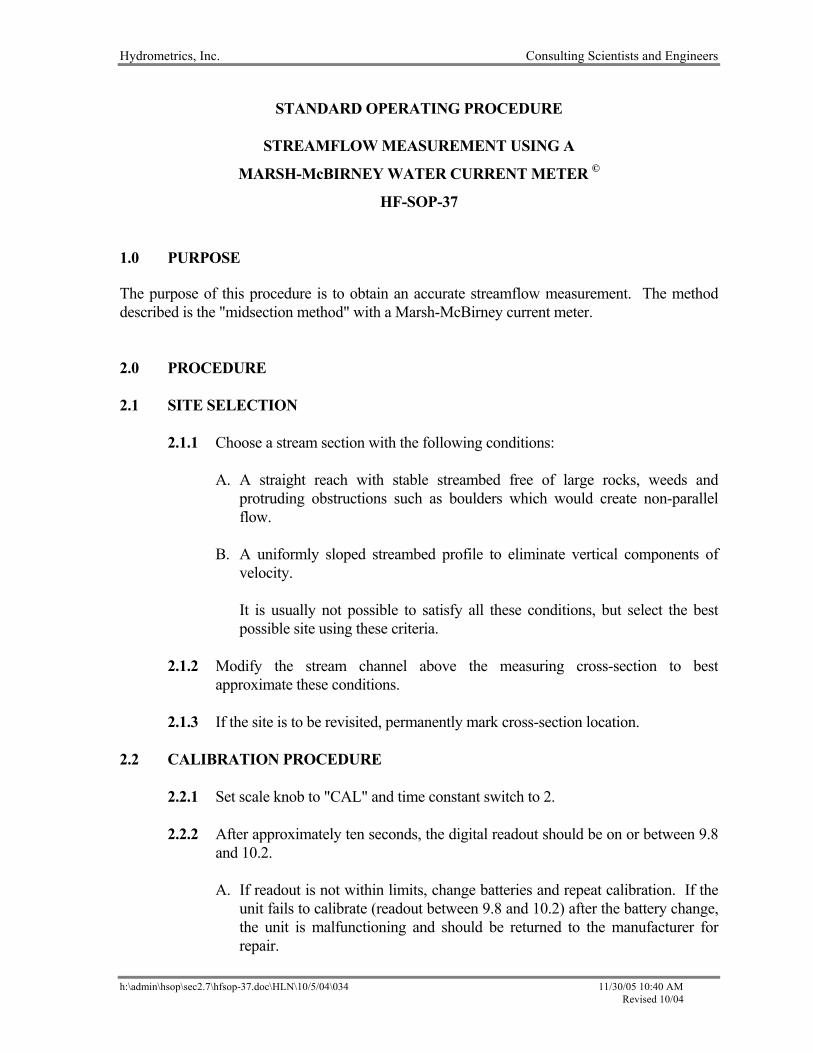
Hydrometrics, Inc. Consulting Scientists and Engineers
h:\admin\hsop\sec2.7\hfsop-37.doc\HLN\10/5/04\034 11/30/05 10:40 AM Revised 10/04
STANDARD OPERATING PROCEDURE
STREAMFLOW MEASUREMENT USING A
MARSH-McBIRNEY WATER CURRENT METER ©
HF-SOP-37 1.0 PURPOSE The purpose of this procedure is to obtain an accurate streamflow measurement. The method described is the "midsection method" with a Marsh-McBirney current meter. 2.0 PROCEDURE 2.1 SITE SELECTION 2.1.1 Choose a stream section with the following conditions:
A. A straight reach with stable streambed free of large rocks, weeds and protruding obstructions such as boulders which would create non-parallel flow.
B. A uniformly sloped streambed profile to eliminate vertical components of
velocity.
It is usually not possible to satisfy all these conditions, but select the best possible site using these criteria.
2.1.2 Modify the stream channel above the measuring cross-section to best
approximate these conditions. 2.1.3 If the site is to be revisited, permanently mark cross-section location.
2.2 CALIBRATION PROCEDURE
2.2.1 Set scale knob to "CAL" and time constant switch to 2. 2.2.2 After approximately ten seconds, the digital readout should be on or between 9.8
and 10.2.
A. If readout is not within limits, change batteries and repeat calibration. If the unit fails to calibrate (readout between 9.8 and 10.2) after the battery change, the unit is malfunctioning and should be returned to the manufacturer for repair.
Hydrometrics, Inc. Consulting Scientists and Engineers
h:\admin\hsop\sec2.7\hfsop-37.doc\HLN\10/5/04\034 11/30/05 10:40 AM Revised 10/04
B. If readout is within limits, the instrument is correctly calibrated.
3.0 MEASUREMENT PROCEDURE 3.1 Place a measuring tape or tag line across the selected section at right angles (if possible)
to direction of flow. If it is not possible to establish a line perpendicular to flow, record the angle between the perpendicular and the actual flow measurement line. Record the total channel width. Estimate the number of sections needed to allow no more than 5 percent of the total flow in each section. For small streams, 10 percent of flow is permitted. Twenty-five to thirty sections are needed for a good measurement to get less than 5 percent of flow in each section. For less stringent accuracy, a lesser number of stations can be used.
3.2 Fill out the required information on stream gaging on the Stream Gaging - Current
Meter Form (HF-FORM-438). Much of the form is self-explanatory; however, the following explanation will assist in completing some parts of the form.
A. Site: List the site number and its name. B. Distance from This is the measured distance from the initial point. Initial Point: For example: A measuring tape may be used and the edge of water may be several feet from the tape zero point. C. Width: Width of the cross section in feet. D. Depth: Depth of water in feet measured by wading rod or other measuring device. E. Area: Product of WIDTH x DEPTH in square feet. F. Point Velocity: Velocity as read from meter. G. Discharge: Product of area times the point velocity. This is the computed flow in cfs with attention paid to significant numbers and the error limits. H. Measurement Conditions
and Rating: Estimate conditions. Good (5%): Bottom slightly rough, flow not completely straight
and smooth. Fair (8%): Moderately rough bottom flow velocity varies across
channel.
Hydrometrics, Inc. Consulting Scientists and Engineers
h:\admin\hsop\sec2.7\hfsop-37.doc\HLN\10/5/04\034 11/30/05 10:40 AM Revised 10/04
Poor (over 12%): Rough bottoms; significant velocity variation across
channel. Very Poor (20%): Very rough bottom; channel divided by boulders or
weed-filled or other problems. Other (EXPLAIN): Some channels are rocky or weedy and are otherwise
difficult to measure. Estimate error. Error can range from 20% to over 100%.
I. Gage Height: Record reading of staff gage or other measuring device
placed in the stream. This is a measurement of stream stage. 3.3 Identify stream bank by either LEOW or REOW (left or right edge of water,
respectively, when facing downstream) and record starting time. 3.4 Note any changes in stage height during measurement. 3.5 To begin measurement note distance from end of tape to beginning edge of water. Try to
start at an even increment. 3.6 Measure and record water depth at the edge of the water. 3.7 Move out to center of the first section. 3.8 Record the distance from the initial point. 3.9 Using the top-setting wading rod, measure and record the depth at that point. 3.10 Mean velocity of flow at the point is determined by measuring velocity at 0.6 depth from
the surface, for depths less than 2.5 feet. To set the sensor at 0.6 depth using the top-setting wading rod, line up the foot scale on the sliding rod with the tenth scale at the top of the depth gauge rod so that the combined scales match the depth of water at the measuring point. For depths greater than 2.5 feet, measurements are collected at 0.2 and 0.8 depth below the surface and the average of these values is used as the average velocity for the cross-section.
3.11 Set wading rod so the sensor is facing directly into flow (record any angles). Be sure
you are not disturbing flow around the meter, stand to the side and downstream while taking the measurement.
3.12 Allow meter readout to stabilize. Start with the smallest time constant setting. If, after a
period of time (in seconds) equal to 5 times the time constant setting (e.g. 10, 30 and 100
Hydrometrics, Inc. Consulting Scientists and Engineers
h:\admin\hsop\sec2.7\hfsop-37.doc\HLN\10/5/04\034 11/30/05 10:40 AM Revised 10/04
seconds for settings of 2, 6 and 20), the readout has not stabilized move to the next highest time constant settling.
3.13 Record velocity. 3.14 Move to the center of the next section. 3.15 Continue through the sections using steps 8 through 15. 3.16 For streams with a fairly uniform flow regime, the section can remain of equal width. 3.17 In areas where velocity varies or flow is concentrated in a narrow area, divide the high
flow sections up into smaller widths to account for higher velocities (discharge). 3.18 Record the distance at the edge of water and ending time and note which edge this is -
either LEOW or REOW. 3.19 Compute flow using the mid-section technique (USGS, 1977). 4.0 MAINTENANCE PROCEDURES
• Keep sensor free of dirt and coatings such as grease. Clean sensor with mild soap and water.
• Routinely check batteries by calibrating the meter.
5.0 REFERENCES USGS, 1977. National Handbook of Recommended Methods for Water-Data Acquisition.
Chapter 1: Surface Water.
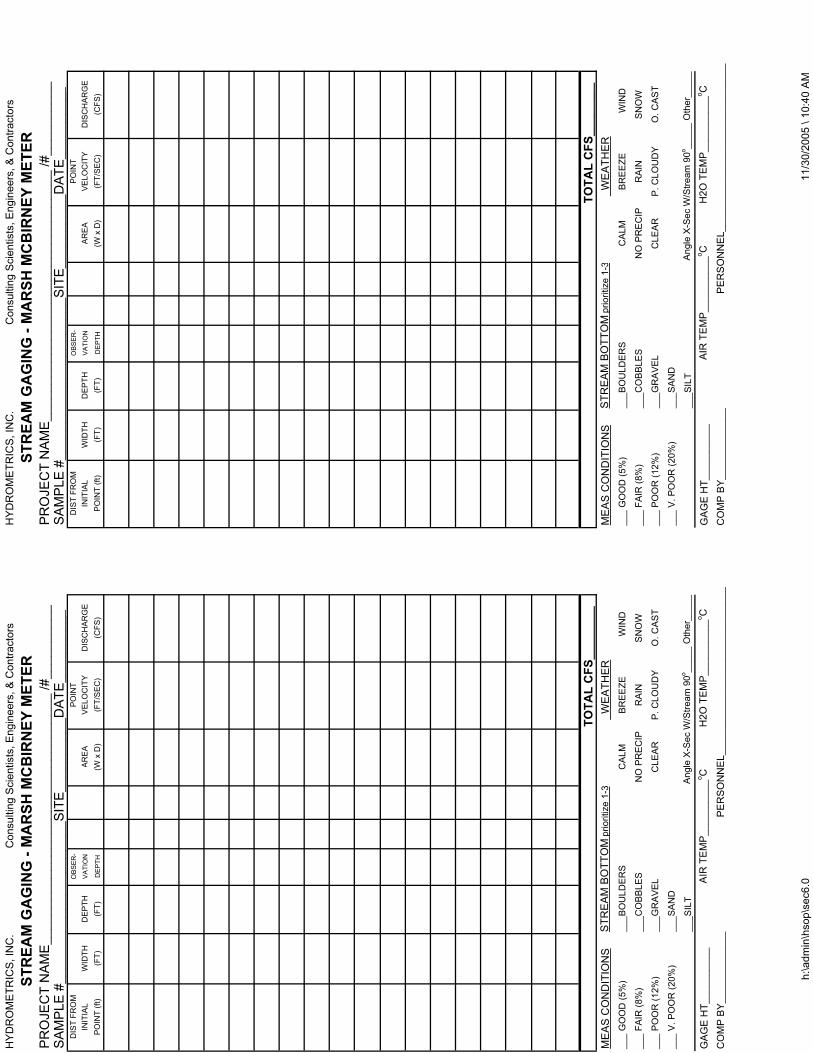
HY
DR
OM
ETR
ICS
, IN
C.
C
onsu
lting
Sci
entis
ts, E
ngin
eers
, & C
ontra
ctor
sH
YD
RO
ME
TRIC
S, I
NC
.
Con
sulti
ng S
cien
tists
, Eng
inee
rs, &
Con
tract
ors
STR
EAM
GA
GIN
G -
MA
RSH
MC
BIR
NEY
MET
ERST
REA
M G
AG
ING
- M
AR
SH M
CB
IRN
EY M
ETER
PR
OJE
CT
NA
ME
____
____
____
____
____
____
____
____
__ /#
____
____
__P
RO
JEC
T N
AM
E__
____
____
____
____
____
____
____
____
/#__
____
____
SA
MP
LE #
____
____
____
____
____
__S
ITE
____
____
__D
ATE
____
____
__S
AM
PLE
#__
____
____
____
____
____
SIT
E__
____
____
DA
TE__
____
____
DIS
T FR
OM
OB
SE
R-
PO
INT
DIS
T FR
OM
OB
SE
R-
PO
INT
INIT
IAL
WID
THD
EP
THV
ATI
ON
AR
EA
VE
LOC
ITY
DIS
CH
AR
GE
INIT
IAL
WID
THD
EP
THV
ATI
ON
AR
EA
VE
LOC
ITY
DIS
CH
AR
GE
PO
INT
(ft)
(FT)
(FT)
DE
PTH
(W x
D)
(FT/
SE
C)
(CFS
)P
OIN
T (ft
)(F
T)(F
T)D
EP
TH(W
x D
)(F
T/S
EC
)(C
FS)
TOTA
L C
FS__
____
__TO
TAL
CFS
____
____
ME
AS
CO
ND
ITIO
NS
STR
EA
M B
OTT
OM
prio
ritiz
e 1-
3 W
EA
THE
RM
EA
S C
ON
DIT
ION
SS
TRE
AM
BO
TTO
M p
riorit
ize
1-3
WE
ATH
ER
___
GO
OD
(5%
)__
_BO
ULD
ER
SC
ALM
BR
EE
ZE
WIN
D__
_ G
OO
D (5
%)
___B
OU
LDE
RS
CA
LMB
RE
EZE
W
IND
___
FAIR
(8%
)__
_CO
BB
LES
NO
PR
EC
IPR
AIN
SN
OW
___
FAIR
(8%
)__
_CO
BB
LES
NO
PR
EC
IPR
AIN
SN
OW
___
PO
OR
(12%
)__
_GR
AV
EL
CLE
AR
P. C
LOU
DY
O. C
AS
T__
_ P
OO
R (1
2%)
___G
RA
VE
LC
LEA
RP
. CLO
UD
YO
. CA
ST
___
V. P
OO
R (2
0%)
___S
AN
D__
_ V
. PO
OR
(20%
)__
_SA
ND
___S
ILT
Ang
le X
-Sec
W/S
tream
90o __
___
Oth
er__
___
___S
ILT
Ang
le X
-Sec
W/S
tream
90o __
___
Oth
er__
___
GA
GE
HT_
____
____
_A
IR T
EM
P__
____
____
o CH
2O T
EM
P__
____
____
o CG
AG
E H
T___
____
___
AIR
TE
MP
____
____
__o C
H2O
TE
MP
____
____
__o C
CO
MP
BY
____
____
____
_P
ER
SO
NN
EL_
____
____
____
____
____
____
____
_C
OM
P B
Y__
____
____
___
PE
RS
ON
NE
L___
____
____
____
____
____
____
___
h:\a
dmin
\hso
p\se
c6.0
11/3
0/20
05 \
10:4
0 A
M

DIS
T FR
OM
OB
SE
R-
PO
INT
DIS
T FR
OM
OB
SE
R-
PO
INT
INIT
IAL
WID
THD
EP
THV
ATI
ON
AR
EA
VE
LOC
ITY
DIS
CH
AR
GE
INIT
IAL
WID
THD
EP
THV
ATI
ON
AR
EA
VE
LOC
ITY
DIS
CH
AR
GE
PO
INT
(ft)
(FT)
(FT)
DE
PTH
(W x
D)
(FT/
SE
C)
(CFS
)P
OIN
T (ft
)(F
T)(F
T)D
EP
TH(W
x D
)(F
T/S
EC
)(C
FS)
TOTA
L C
FS__
____
__TO
TAL
CFS
____
____
CO
MM
EN
TS:
CO
MM
EN
TS:
h:\a
dmin
\hso
p\se
c6.0
11/3
0/20
05 \
10:4
0 A
M
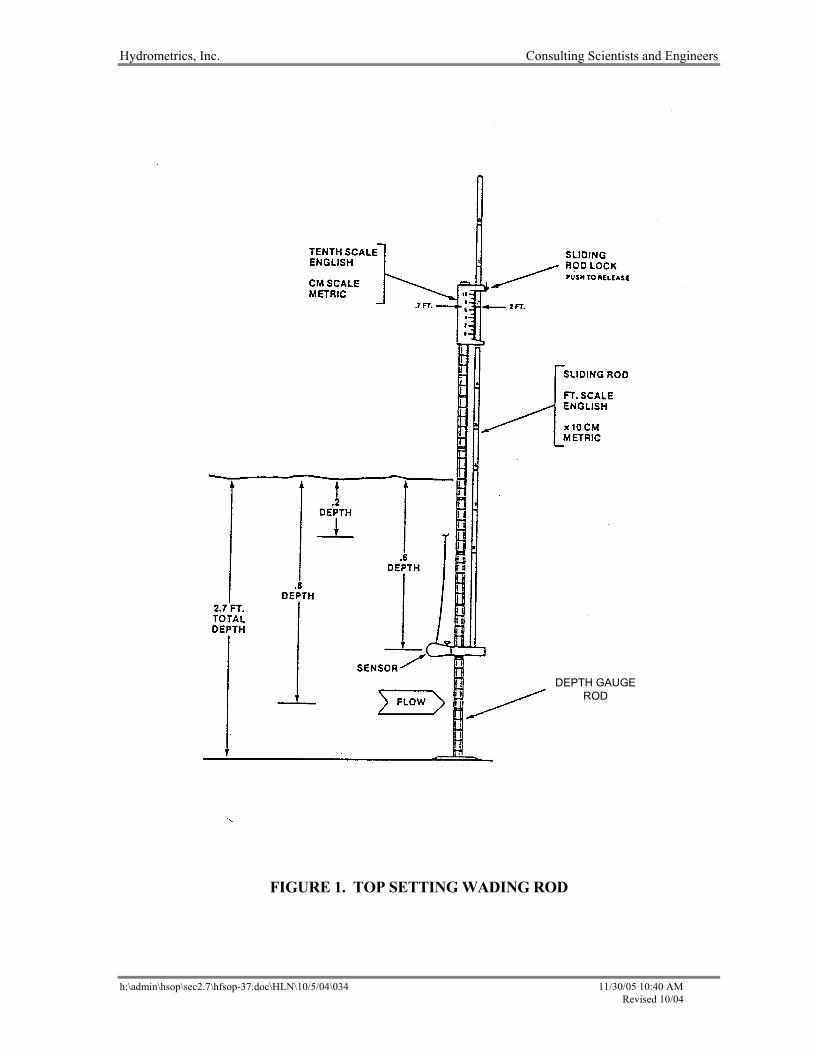
Hydrometrics, Inc. Consulting Scientists and Engineers
h:\admin\hsop\sec2.7\hfsop-37.doc\HLN\10/5/04\034 11/30/05 10:40 AM Revised 10/04
FIGURE 1. TOP SETTING WADING ROD
DEPTH GAUGEROD
Hydrometrics, Inc. Consulting Scientists and Engineers
h:\admin\hsop\sec2.6\hfsop-49.doc\HLN\4/5/12\034 Revised 4/2012 04/05/12 5:05 PM
STANDARD OPERATING PROCEDURE
USE OF A FLOW CELL FOR COLLECTING FIELD PARAMETERS©
HF-SOP-49
1.0 PURPOSE The purpose of using a flow cell is to increase the accuracy of field parameter values while sampling groundwater. The flow cell is designed to allow field personnel the ability to obtain field parameters from groundwater that are, with the exception of the pumping equipment, undisturbed. Specifically, use of a flow cell isolates the water sample from contact with the atmosphere at ground surface, providing a better representation of in situ groundwater chemistry for field parameter measurement. 2.0 EQUIPMENT A) Flow cell
Necessary fittings to connect pumping system to the flow cell.
3.0 PROCEDURE
A) Connect flow cell to discharge tubing of pump system.
B) Connect or place meter (YSI 556 or similar) in the flow cell
C) Take readings as necessary from the field meter, according to the requirements outlined in the project work plan or sampling and analysis plan
D) If performing low flow sampling, reference HSOP-105 for instruction on use of a flow cell during low flow sampling.
Hydrometrics, Inc. Consulting Scientists and Engineers
h:\admin\hsop\sec2.1\hfsop-73.doc\HLN\7/23/02\034 Revised 10/96 1 02/01/06 1:33 PM
STANDARD OPERATING PROCEDURE
FILTRATION OF WATER SAMPLES©
HF-SOP-73 1.0 PURPOSE Water is filtered to obtain a sample for analysis of dissolved constituents. Dissolved constituents are operational, defined as those which pass a 0.45 micron filter. This SOP describes three methods in which filtered water samples can be prepared in the field. Other types of filtering equipment can be employed. The essential points are use of the proper filter and adequate decontamination of reusable equipment. 2.0 EQUIPMENT Disposable Filter Barrel or Plate Filter or Filter Cartridges Tire pump Peristaltic Pump 0.45 µm filter Filter barrel Plate filter cartridges Clean sample bottles 0.45 µm membrane Peristaltic Pump Prefilters (where needed) filters Plastic tubing 0.45 µm filter membranes Prefilters (where Clean sample bottles Distilled or deionized water needed) Distilled or Plastic tweezers Plastic tubing deionized water Clean sample bottles Distilled or deionized water Plastic tweezers 3.0 PROCEDURE A) General
1. Have at hand clean sample bottle pre-labeled with appropriate information. 2. Use a new filter membrane or disposable cartridge for each sampling site. 3. If water is very turbid, it must be first run through a larger pore size pre-filter. 4. Be sure you know the volume of sample required for analysis, check with laboratory
if in doubt. 5. If collecting samples for low level analysis, rinse filter with an appropriate amount
(usually 100 to 200 ml) of DI water prior to filtering any sample. This step should
Hydrometrics, Inc. Consulting Scientists and Engineers
h:\admin\hsop\sec2.1\hfsop-73.doc\HLN\7/23/02\034 Revised 10/96 2 02/01/06 1:33 PM
remove contaminants (particularly zinc) which may be entrained within the filter matrix. Record the amount of DI water used to rinse the filter.
6. Rinse sample bottle with filtered water three times, before collecting actual sample.
However, if water is hard to filter or of limited quantity, distilled or deionized water rinses are acceptable.
7. Avoid dusty locations and vehicle motor exhaust while filtering. 8. When a peristaltic pump is used, the pump and tubing should be cleaned immediately
after obtaining a sample by pumping 500 ml of deionized water. After pumping 500 ml deionized water, remove inlet tubing from DI source and continue pumping until tubing is drained.
B) Filter Cartridge These are single-use, self-contained membrane filtration devices with inlet and outlet hose barbs designed for use when samples are pumped.
1. Examine a new filter cartridge and note direction of flow arrow imprinted on it. 2. Slip hose from pump over inlet nipple of cartridge. Sample may be collected directly
from filter outlet (optional, place another short piece of tubing over outlet, if this is more convenient). Keep tubing length as short as possible.
3. It is important that water flow through filter in direction of imprinted arrow, as filter
failure will likely result if flow direction is reversed. Also, inlet pressure should not exceed 25 PSI (pounds per square inch) for most filters of this type.
4. Turn pump on, discard initial 30 ml of filtrate (filter purge), then begin collecting
sample. C) Filter Barrel Filter barrels are reusable plastic cylinders with removable endcaps and
fitted with a replaceable filter at one end (the outlet) and an air inlet at the opposite end by which the barrel is pressurized. Filter barrels are used where samples cannot be pumped.
1. Filter barrels must be decontaminated prior to going to the field. Remove both end
caps, O-rings, and filter support. Wash components thoroughly with a non-phosphate detergent and water, thoroughly rinse with distilled or deionized water, re-assemble and store in plastic bag.
2. Ideally, the filter barrel should be rinsed with the water to be sampled. If an
inadequate volume of sample water is available, a distilled or deionized water rinse is acceptable.
Hydrometrics, Inc. Consulting Scientists and Engineers
h:\admin\hsop\sec2.1\hfsop-73.doc\HLN\7/23/02\034 Revised 10/96 3 02/01/06 1:33 PM
3. After rinsing, fill filter barrel 2/3 full with sample water. 4. Place clean 0.45 µm filter on filter support (do not touch filter with hands, use plastic
tweezers or blue divider papers to move or adjust filter). Wet filter support will hold filter in place.
5. Assemble filter barrel carefully so as not to twist or put folds in filter paper. 6. Turn filter barrel over so sample water comes in contact with filter paper. 7. Connect tire pump to Shrader valve and pump several times. Do not allow static
pressure on tire pump to go over 20 PSI. 8. Purge filter by draining approximately 100 ml of water from lower side of filter
support. Discard this initial filtrate. 9. Once sample bottle is full, preserve sample as needed and place in cooler with ice.
(see HF-SOP-3, Preservation and Storage of Inorganic Water Samples). 10. Before leaving the sampling site, disassemble filter barrel, remove and dispose of
filter paper, and immediately rinse with distilled or deionized water. Partial decontamination, consisting of three successive distilled or deionized water rinses between sites is acceptable.
D) Plate Filter Plate filter is a reusable membrane filter holder, generally fitted with three
removable legs. The filter holder is disassembled to replace the large diameter (typically 14.2 cm) membrane filter. Water is pumped through the filter, entering at the top and exiting through a port at the bottom.
1. Plate filters must be decontaminated prior to use. Disassemble plate filter, wash
components thoroughly with a non-phosphate detergent and water, thoroughly rinse with distilled or deionized water, re-assemble and store in plastic bag.
2. Ideally, the plate filter should be rinsed with the water to be sampled. If an
inadequate volume of sample water is available, a distilled or deionized water rinse is acceptable.
3. Place clean 0.45 µm membrane filter on filter support (do not touch filter with hands,
use plastic tweezers or blue divider papers to move or adjust filter). Wet filter support will hold filter in place.
4. Assemble plate filter carefully so as not to twist or put folds in filter paper.
Hydrometrics, Inc. Consulting Scientists and Engineers
h:\admin\hsop\sec2.1\hfsop-73.doc\HLN\7/23/02\034 Revised 10/96 4 02/01/06 1:33 PM
5. Connect plastic tubing from pump to top hose barb on filter. Sample may be collected directly from outlet, or keep tubing lengths as short as possible. A short piece of tubing may be connected to outlet barb at bottom.
6. Purge filter by pumping approximately 100 ml of water through the filter. Discard
this initial filtrate. 7. Once sample bottle is full, preserve sample as needed and place in cooler with ice.
(see HF-SOP-3, Preservation and Storage of Inorganic Water Samples). 8. Before leaving the sampling site, disassemble plate filter, remove and dispose of
filter paper, and rinse with distilled or deionized water. NOTES
• Use a new filter membrane for each sample. • Run very turbid or muddy water through prefilter first and then a 0.45 micron filter. • Check with lab performing analysis for adequate quantity and holding time for
sample. Complete all appropriate documentation. • Completely decontaminate filtering equipment after each day of use and whenever
partial decontamination doesn't visually clean all filter parts. • Do not attempt filtration in dusty locations or while your vehicle motor is running
(due to exhaust).
Hydrometrics, Inc. Consulting Scientists and Engineers
h:\admin\hsop\sec2.6\hfsop-79.doc\HLN\7/22/04\034 Revised 10/96 11/30/05 10:43 AM
STANDARD OPERATING PROCEDURE
FIELD MEASUREMENT OF SPECIFIC CONDUCTIVITY HF-SOP-79
1.0 PURPOSE The purpose of this procedure is to obtain accurate field measurements of specific electrical conductance of water samples. This procedure is written for the Hydac Digital type meter; other meters may be used if they are calibrated and used according to manufacturer's recommendations. 2.0 EQUIPMENT 2.1 Instrument
• Hydac Digital Conductance Meter or equivalent meter. 2.2 Reagents
• Potassium Chloride (KCl) standard solutions with known conductivities: (e.g., 50, 74, 147, 400, 718, 1413, 6668, 12990 µmhos/cm at 25°C).
2.3 Other Materials
• Distilled or deionized water for rinsing
• Field Sampling Notebook 3.0 PROCEDURE 3.1 Calibration 3.1.1 Rinse sample cup with distilled water before and after each conductivity standard
used. 3.1.2 Select a standard with a conductivity value in the approximate range of the
samples to be measured. After rinsing the sample cup with distilled water, rinse with the selected standard. Fill the cup with the standard, set function selector to TEMPERATURE and depress READ button. Set the temperature compensation knob on the conductivity side of the meter to the displayed temperature.
Hydrometrics, Inc. Consulting Scientists and Engineers
h:\admin\hsop\sec2.6\hfsop-79.doc\HLN\7/22/04\034 Revised 10/96 11/30/05 10:43 AM
3.1.3 Switch function selector to CONDUCTIVITY and depress the READ button (READ button must be held down for display). Move the range selector to the lowest setting which will give a reading.
3.1.4 If the reading is not that of the standard, with a small screwdriver, adjust the
calibration screw at the bottom of the meter (only small turns are required for fine-tuning).
3.1.5 Record reading, temperature, and time of calibration. 3.2 Sample Specific Conductivity Measurement 3.2.1 Rinse the sample cup with distilled water prior to filling with the sample. Rinse
and fill with sample water. 3.2.2 Switch function selector to temperature scale and measure temperature of
sample. 3.2.3 Adjust temperature compensator knob on the conductivity side of the meter to
the displayed temperature. 3.2.4 Switch function selector to conductivity and depress READ button. Move the
range selector to the lowest setting which will give a reading. Read conductivity and multiply by range. Record in field sampling notebook.
3.2.5 When measurements are complete, rinse probe with distilled water. 3.3 Calibration Check 3.3.1 At least once per day (or about once per every ten samples collected, whichever
is more frequent), or when measuring conductivities of samples significantly different from the initial calibration solution, the meter should be checked against a standard of known conductivity. Record the check standard conductivity, temperature, and meter reading on appropriate documentation.
3.3.2 If the check standard reading differs from the true value by more than 10%, the
meter should be recalibrated according to Section 3.1 of this SOP. 4.0 ASSOCIATED REFERENCES
Hydac Instruments -Instruction Manual for Digital Conductance, Temperature, and pH Tester. Hydrometrics' Video Training Library -- Measurement of Conductivity.
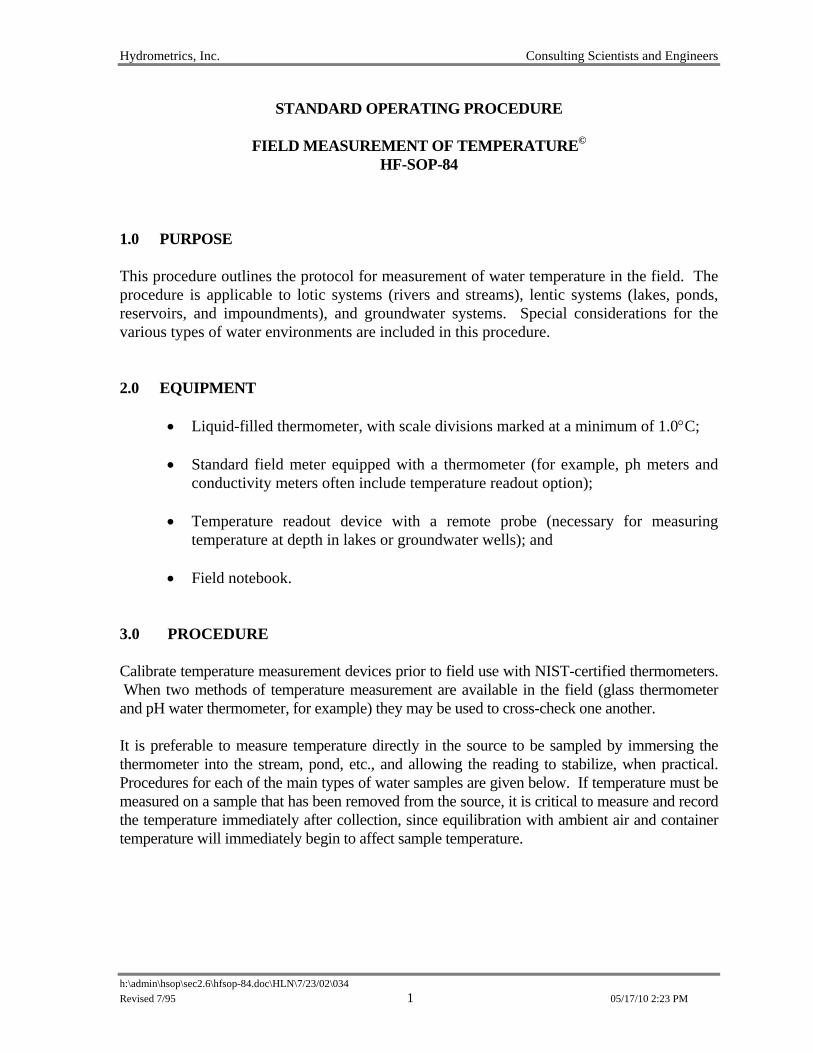
Hydrometrics, Inc. Consulting Scientists and Engineers
h:\admin\hsop\sec2.6\hfsop-84.doc\HLN\7/23/02\034
Revised 7/95 1 05/17/10 2:23 PM
STANDARD OPERATING PROCEDURE
FIELD MEASUREMENT OF TEMPERATURE© HF-SOP-84
1.0 PURPOSE This procedure outlines the protocol for measurement of water temperature in the field. The procedure is applicable to lotic systems (rivers and streams), lentic systems (lakes, ponds, reservoirs, and impoundments), and groundwater systems. Special considerations for the various types of water environments are included in this procedure. 2.0 EQUIPMENT
• Liquid-filled thermometer, with scale divisions marked at a minimum of 1.0°C;
• Standard field meter equipped with a thermometer (for example, ph meters and conductivity meters often include temperature readout option);
• Temperature readout device with a remote probe (necessary for measuring temperature at depth in lakes or groundwater wells); and
• Field notebook. 3.0 PROCEDURE Calibrate temperature measurement devices prior to field use with NIST-certified thermometers. When two methods of temperature measurement are available in the field (glass thermometer and pH water thermometer, for example) they may be used to cross-check one another. It is preferable to measure temperature directly in the source to be sampled by immersing the thermometer into the stream, pond, etc., and allowing the reading to stabilize, when practical. Procedures for each of the main types of water samples are given below. If temperature must be measured on a sample that has been removed from the source, it is critical to measure and record the temperature immediately after collection, since equilibration with ambient air and container temperature will immediately begin to affect sample temperature.
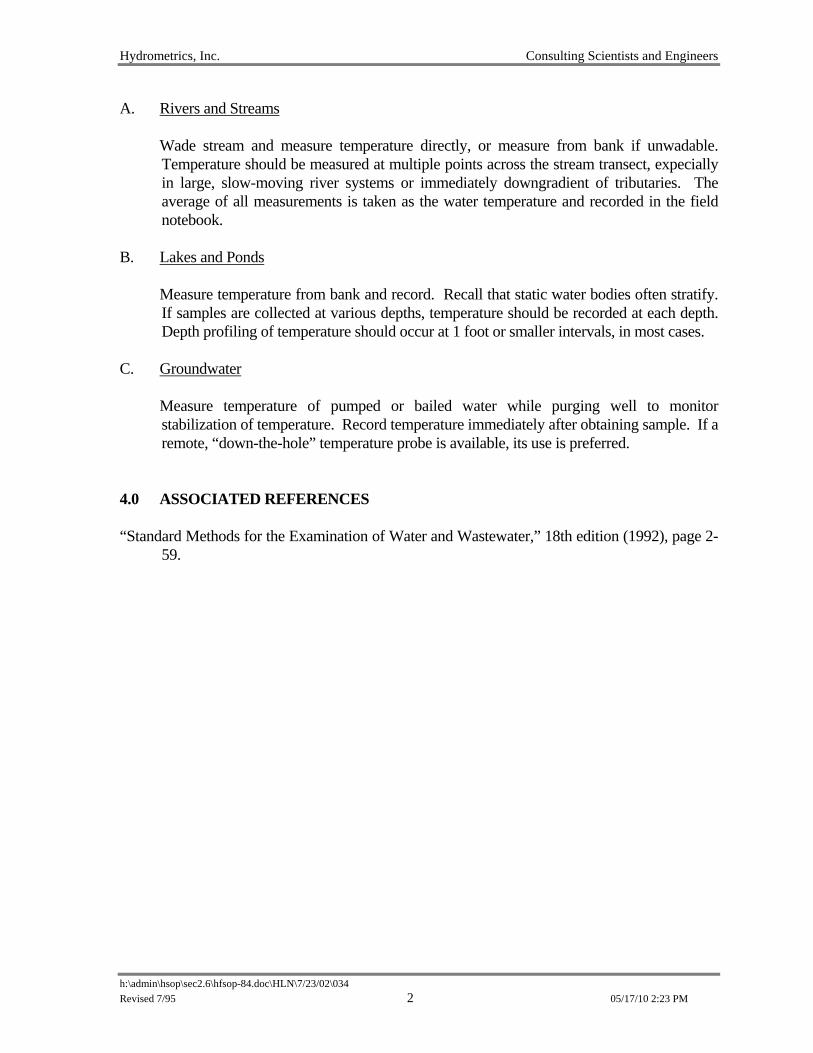
Hydrometrics, Inc. Consulting Scientists and Engineers
h:\admin\hsop\sec2.6\hfsop-84.doc\HLN\7/23/02\034
Revised 7/95 2 05/17/10 2:23 PM
A. Rivers and Streams Wade stream and measure temperature directly, or measure from bank if unwadable.
Temperature should be measured at multiple points across the stream transect, expecially in large, slow-moving river systems or immediately downgradient of tributaries. The average of all measurements is taken as the water temperature and recorded in the field notebook.
B. Lakes and Ponds Measure temperature from bank and record. Recall that static water bodies often stratify.
If samples are collected at various depths, temperature should be recorded at each depth. Depth profiling of temperature should occur at 1 foot or smaller intervals, in most cases.
C. Groundwater Measure temperature of pumped or bailed water while purging well to monitor
stabilization of temperature. Record temperature immediately after obtaining sample. If a remote, “down-the-hole” temperature probe is available, its use is preferred.
4.0 ASSOCIATED REFERENCES “Standard Methods for the Examination of Water and Wastewater,” 18th edition (1992), page 2-
59.