Embed Size (px)
Citation preview

P O S I V A O Y
FI -27160 OLKILUOTO, F INLAND
Tel +358-2-8372 31
Fax +358-2-8372 3709
Ka l l e Ho l lmén
January 2008
Work ing Repor t 2007 -101
R20 Programme: The Development of GroutingTechnique – Stop Criteria and Field Tests

January 2008
Working Reports contain information on work in progress
or pending completion.
The conclusions and viewpoints presented in the report
are those of author(s) and do not necessarily
coincide with those of Posiva.
Ka l le Ho l lmén
Pöyry I n f r a Oy
Work ing Repor t 2007 -101
R20 Programme: The Development of GroutingTechnique – Stop Criteria and Field Tests
ABSTRACT
This work is a part of the project ‘Grouting Technique’ by Posiva Oy, which is responsible for the final disposal of spent nuclear fuel in Finland. This study attempts to collect disperse information about the design parameters of the grouting and about a field-test stop criterion, which differs from the prevailing practice.
The literature study describes salient processes of grouting design in sufficient extent. Different methods for grouting stop criterion are described in more detail. Grouting design based on selected grouting theory, grouting and evaluating of the grouting results are presented in the experiential part of this study. This study focuses on rock tunnel grouting using cement-based grout.
The requirements for water tightness, which are set down by customer, direct the grouting design. Information about fractures in rock mass, which surrounds the rock facility, is the prime initial data for grouting design. In grouting work, fracturing is generally studied by water loss measurements performed in investigation, probe and grouting holes. Besides the water loss measurement, the Posiva Flow Log –tool, which measures location and transmissivity for every single fracture, is used in ONKALO.
Grouting pressure and grout must be chosen together and case-specifically. Both pressure and yield strength of grout are influencing the penetration length of grout in a fracture. Grouting pressure must be high enough to ensure sufficient penetration length, but pressure must be under the level where rock mass breaks to avoid hydraulic fracturing. Raising the water to dry material ratio reduces the yield strength of grout, in which case the grouting pressure can be lowered.
Stop criterion for grouting aims to define the point, when the result of the grouting is adequate, and the grouting after that point is uneconomical. Properly specified stop criterion minimizes extra grout volume and reduces the running time of grouting work. From the references, three different stop criteria for grouting are found: maximum pressure and maximum grouted volume together, GIN-method (Grouting Intensity Number) and GT-method (Grouting Time). Empirically set maximum pressure and grout volume are current prevailing practice for stop criterion. The stop criteria in GIN-method are grouting pressure, grout volume and distinct GIN-number, which is product of maximum pressure and maximum grout volume. Grouting time is the stop criterion in recently presented GT-method. Criterion is analytical and based on relations between grout penetration and grouting time.
The field trials to test GT-method were done in ONKALO as a part of normal grouting. The first field test was pre-grouting in access tunnel and the second was shaft-grouting in personnel shaft. On the grounds of the field tests it cannot be committed with certainty if the GT-method is workable as a grouting stop criterion. Therefore further clarifications and test runs for GT-method are needed.
Keywords: grouting, ONKALO, final disposal of spent nuclear fuel, control of water inflow, rock engineering, tunnelling, GIN, GT-method, water loss measurement, stop criterion
R20 OHJELMA: INJEKTOINTITEKNIIKAN KEHITYS - LOPETUSKRITEERI JA KENTTÄKOKEET
TIIVISTELMÄ
Tämä työ on osa käytetyn ydinpolttoaineen loppusijoituksesta Suomessa vastaavan Posiva Oy:n projektia ’Injektoinnin kehitys’. Tutkimuksen tavoite on koota yhteen hajanainen tieto suunnitteluparametreista ja testata kirjallisuudesta löytynyttä, vallitse-vasta käytännöstä poikkeavaa injektoinnin lopetuskriteeriä käytännössä.
Työn teoriaosa kuvaa injektointisuunnittelun keskeisimmät menetelmät injektointi-suunnittelun kannalta riittävässä laajuudessa. Erilaiset teoriat injektoinnin lopetus-kriteeriksi on kuvattu muita yksityiskohtaisemmin. Valittuun teoriaan perustunut injek-toinnin suunnittelu, injektointi sekä tulosten arviointi on esitetty työn tutkimusosassa. Työ käsittele tunneli-injektointia sementtipohjaisilla injektointiaineilla.
Injektointisuunnittelua ohjaa tilaajan asettama tiiveystavoite. Tieto kalliotilaa ympäröi-vän kivimassan rakoilusta on injektointisuunnittelun tärkein lähtötieto. Rakoilua tutki-taan yleisesti vesimenekkikokeella tutkimus-, tunnustelu-, ja injektointirei’issä. ONKALOssa käytetään vesimenekkikokeen lisäksi myös Posiva Flow Log –laitetta, jolla saadaan tieto yksittäisen raon sijainnista ja tranmissiviteetista, eli veden-johtokyvystä.
Injektointipaine ja -massa pitää valita yhdessä ja tapauskohtaisesti. Injektointipaine ja -massan myötöraja yhdessä vaikuttavat injektointiaineen tunkeutuvuuteen kallioraossa. Injektointipaineen pitää olla riittävä taatakseen injektointimassalle vaaditun tunkeuman kalliorakoon, mutta paine ei saa vahingoittaa kalliota. Massan vesi-kuiva-ainesuhdettakasvattamalla massan myötöraja laskee, jolloin injektointipainetta voidaan laskea.
Injektoinnin lopetuskriteeri tavoitteena on määrittää hetki, jolloin injektointitulos on riittävä, ja jonka jälkeen injektoinnin jatkaminen on epätaloudellista. Oikein määritetty lopetuskriteeri minimoi ylimääräisen massamenekin ja vähentää injektointityön ajallista kestoa. Kirjallisuudesta löytyy kolme erilaista injektoinnin lopetuskriteeriä: maksimi-paine ja –menekki yhdessä, GIN-menetelmä sekä GT-menetelmä. Empiirisesti asetettu maksimipaine ja –menekki ovat tämän hetken vallitseva käytäntö lopetuskriteeriksi. GIN-menetelmässä (Grouting Intensity Number) lopetuskriteerinä toimii paine ja massamenekki sekä erillinen GIN-luku, joka on maksimipaineen ja –menekin tulo. Äskettäin esitellyssä GT-menetelmässä (Grouting Time) injektointiaika toimii lopetuskriteerinä. Kriteeri perustuu analyyttiseen malliin injektointimassan tunkeutu-mispituuden ja injektointiajan välisestä riippuvuudesta.
GT-menetelmää testanneet kenttäkokeet toteutettiin ONKALOssa osana normaalia injektointia. Ensimmäinen koeinjektointi toteutettiin ajotunnelin esi-injektointina ja toinen kuiluninjektointina. Injektointikokeiden perusteella ei voida varmuudella ottaa kantaa GT-menetelmän toimivuudesta lopetuskriteerinä, joten lisäselvityksiä ja testejä GT-menetelmälle tarvitaan.

Avainsanat: injektointi, ONKALO, käytetyn ydinpolttoaineen loppusijoitus, vuoto-vesien hallinta, kalliotekniikka, tunnelin louhinta, GIN, GT-menetelmä, vesimenekki-koe, lopetuskriteeri

PREFACE
R20 INKE (Grouting Technique) is a project, which concentrates to develop grouting technique, criteria and methods for assessment of grouting demand. The members of the R20 INKE project group was project manager Ursula Sievänen (Saanio & Riekkola Oy), Johanna Hansen (Posiva Oy), Petriikka Karttunen (Saanio & Riekkola Oy), Kimmo Lehtola (Posiva Oy), Mari Lokkila (Saanio & Riekkola Oy), Tapani Lyytinen (ELY Management Oy), Seppo Mellanen (Genpro Solutions Oy), Pauli Syrjänen (WSP Finland Oy), Pasi Tolppanen (Pöyry Infra Oy), Tiina Vaittinen (Pöyry Environment Oy), Antti Öhberg (Saanio & Riekkola Oy) and Kalle Hollmén (Pöyry Infra Oy). The author thanks whole project group for good advices and comments during the work.
This report will be a part of a Master’s Thesis at Helsinki University of Technology that was commissioned and funded by Posiva Oy. The work was carried out by Pöyry Infra Oy.
Special thanks belong to my supervisors Lic. Phil. Ursula Sievänen and PhD Pasi Tolppanen, who always gave their best supports to me. I’d also like to thank M. Sc. Reeta Ranta-Korpi (Pöyry Infra Oy) for helping me during experimental part of this study.
1
TABLE OF CONTENTS
ABSTRACT
TIIVISTELMÄ
PREFACE
GLOSSARY AND NOMENCLATURE ............................................................................ 5
NOTATION ..................................................................................................................... 7
1 INTRODUCTION................................................................................................... 9
2 TUNNEL GROUTING.......................................................................................... 11
2.1 Pre-grouting and post-grouting in tunnelling .............................................. 12
2.2 Grouting materials...................................................................................... 13
3 BACKGROUND OF GROUTING IN ONKALO.................................................... 15
3.1 Groundwater inflowing into ONKALO......................................................... 15
3.2 Grouting materials in ONKALO .................................................................. 15
3.3 Posiva’s R20 programme and INKE-project .............................................. 15
4 ROCK CHARACTERISATION FOR GROUTING ............................................... 17
4.1 Groundwater inflowing to tunnel................................................................. 17
4.2 Hydraulic conductivity and transmissivity................................................... 184.2.1 Water loss measurement .............................................................. 18
4.3 Inflow estimation ........................................................................................ 21
4.4 Hydraulic aperture of fracture..................................................................... 22
5 CONTROLLING OF GROUTING PROCESS...................................................... 23
5.1 Grout penetration ....................................................................................... 23
5.2 Grouting pressure ...................................................................................... 24
5.3 The requirements on grout strength........................................................... 265.3.1 Packers’ removing time ................................................................. 28
5.4 Starting criteria for grouting........................................................................ 285.4.1 Starting criteria in the ONKALO .................................................... 28
5.5 Stop criteria ................................................................................................ 295.5.1 Prevailing practice ......................................................................... 295.5.2 GIN-principle ................................................................................. 295.5.3 GT-method .................................................................................... 335.5.4 Comparison and conclusions of the different stop criteria............. 38
5.6 Practical grouting experiences in conditions similar to ONKALO............... 395.6.1 Grouting experiences under high groundwater pressure .............. 39
2
5.6.2 Grouting experiences with strict inflow target................................ 40
6 FIELD TEST I ...................................................................................................... 43
6.1 General ...................................................................................................... 43
6.2 Site description........................................................................................... 43
6.3 Designing the test grouting ........................................................................ 446.3.1 Probe holes ................................................................................... 446.3.2 Drilling pattern ............................................................................... 456.3.3 Tests in grouting holes before grouting design ............................. 466.3.4 Grouting materials ......................................................................... 476.3.5 Penetration length and grouting pressure ..................................... 476.3.6 Final grouting design ..................................................................... 486.3.7 Plan for evaluating the grouting result........................................... 49
6.4 Results of the grouting ............................................................................... 496.4.1 Grouting......................................................................................... 496.4.2 Packers’ removing time ................................................................. 526.4.3 Control holes ................................................................................. 536.4.4 Leakage water inflow after excavation .......................................... 54
6.5 Summary and conclusions of the field test I............................................... 56
7 FIELD TEST II ..................................................................................................... 59
7.1 General ...................................................................................................... 59
7.2 Site description........................................................................................... 59
7.3 Designing the test grouting ........................................................................ 607.3.1 Grouting fan................................................................................... 607.3.2 Plan for evaluating the grouting result........................................... 62
7.4 First grouting round .................................................................................... 627.4.1 Tests in grouting holes before grouting design ............................. 627.4.2 Grouting materials ......................................................................... 637.4.3 Penetration length and grouting pressure ..................................... 637.4.4 Final grouting design ..................................................................... 637.4.5 Grouting......................................................................................... 64
7.5 Second grouting round............................................................................... 667.5.1 Tests in grouting holes before grouting design ............................. 667.5.2 Grouting materials ......................................................................... 677.5.3 Penetration length, grouting pressure and final grouting design ... 677.5.4 Grouting......................................................................................... 68
7.6 Third grouting round................................................................................... 707.6.1 Tests in grouting holes before grouting design ............................. 707.6.2 Grouting materials ......................................................................... 727.6.3 Penetration length, grouting pressure and final grouting design ... 727.6.4 Grouting......................................................................................... 73
7.7 Results of the grouting ............................................................................... 75
7.8 Tests in grouting holes ............................................................................... 757.8.1 Leakage water inflow after raise boring......................................... 76
7.9 Summary and conclusions of field test II.................................................... 76
3
8 CONCLUSIONS .................................................................................................. 79
REFERENCES ............................................................................................................. 81
APPENDIX A: GROUT VOLUME ESTIMATION (GT-METHOD)................................. 87
APPENDIX B: THE RESULTS OF DEVIATION MEASUREMENT FOR PROBE HOLES – FIELD TEST I ............................................................................................... 89
APPENDIX C. DRILL PLAN REPORT FOR GROUTING HOLES - FIELD TEST I...... 91
APPENDIX D. GROUTING PLAN – FIELD TEST I...................................................... 93
APPENDIX E. MINUTES OF GROUTING – FIELD TEST I ......................................... 95
APPENDIX F. GROUTING PRESSURES, FLOW AND GROUT TAKE – FIELD TEST I ............................................................................................................................ 97
APPENDIX G. DRILL PLAN REPORT FOR CONTROL HOLES - FIELD TEST I ..... 103
APPENDIX H. THE RESULTS OF DEVIATION MEASUREMENT IN FIELD TEST II105
APPENDIX I. FLOW LOG RESULTS – FIELD TEST II.............................................. 109
APPENDIX J. WLM (A ONE-METER DOUBLE PACKER) RESULTS – FIELD TEST II . .......................................................................................................................... 115
APPENDIX K. GROUTING PLANS – FIELD TEST II................................................. 121
APPENDIX L. GROUTING PRESSURES, FLOW AND GROUT TAKE – FIELD TEST II .......................................................................................................................... 125
APPENDIX M: ANALYSIS OF DATA FROM A GROUTED HOLES – FIELD TEST II129
APPENDIX N: FIGHTING HIGH WATER PRESSURE IN THE ÅKRAFJORD TUNNEL . .......................................................................................................................... 135
APPENDIX O: EIKSUND TUNNEL PROJECT........................................................... 137

4
5
GLOSSARY AND NOMENCLATURE
d95 Grain size limit: describes 95 % of material passing the sieve
EDZ Excavation damaged zone FT Field test GIN Grouting Intensity Number GT Grouting Time LUG Lugeon value (dm3/metre/minute/MPa) ONKALO The underground rock characterisation facility being
built for rock characterisation for the final disposal of spent nuclear fuel
Posiva Nuclear waste management company in Finland Q-method A system for the classification of rock masses W/C Water-cement -ratio W/DM Water to dry material ratio WLM Water loss measurement

6
7
NOTATION
Q [m3/s] The inflow to the tunnel k [m/s] The hydraulic conductivity T [m2/s] Transmissivity h [m] Water pressure expressed as water head (in
tunnel centre) H [m] Depth below ground surface R [m] The radius R0 [m] The active radius of flow te [m] The extension of the grouted zone
[-] The skin factor Lug [dm3/m/min/MPa] Lugeon unit L [m] Borehole distance l [m] Length g [m/s2 ] Gravitational acceleration n [-] Number of main joints (per 1 m of borehole) b [m] Aperture of fracture bhydr [m] Hydraulic aperture of fracture
[Pas] Dynamic viscosity µ [Pas] Plastic viscosity d [m] The thickness of the formation
[kg/m3] Density I [m] Penetration length of injected grout
p [Pa] Over-pressure p [Pa] Pressure
0 [Pa ] Yield strength of grout [Pa ] Shear strength of grout
kc [-] Safety factor for penetration kp [-] Coefficient to consider pressure losses due to
the rugosity of the rock walls of the joint and the variation of the aperture
kv [-] Coefficient to consider volume increase due to undulations as well as to variations of the opening of the joints
t0 [s] Characteristic grouting time t [s] time GIN [Pa·m3/m of borehole] Grouting Intensity Number V m3 Volume VGIN [dm3/m of borehole] Grout volume in GIN stop criteria
3 [Pa] The minimum rock stress v [Pa] The vertical stress of rock mass.
Indexesb = borehole g = grout t = tunnel

8
r = rock D = dimensionless w = groundwater lug = Lugeon test GIN = Grouting Intensity Number h = hydraulic
9
1 INTRODUCTION
Grouting is currently an essential part of the excavation cycle. The most knowledge of grouting is empirical, which may explain the differences in opinions regarding grouting. For example, several different “rules of thumb” for grouting pressure have been presented, which demonstrates the need of further research of grouting.
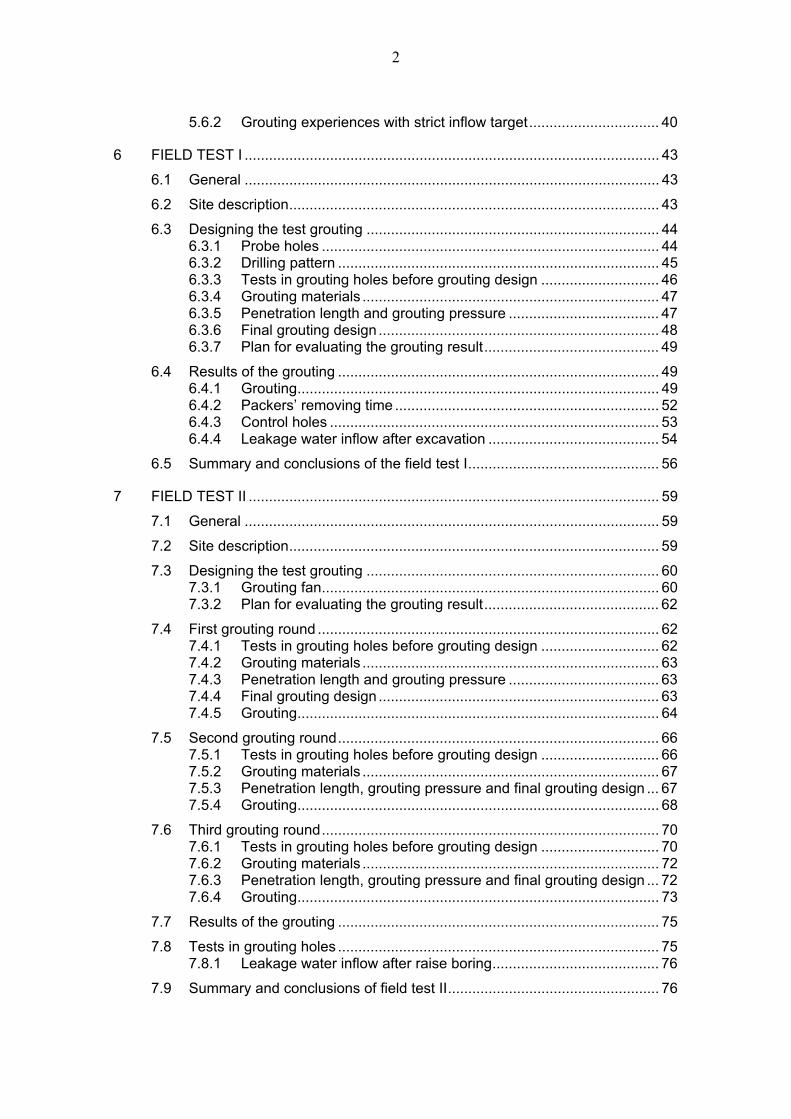
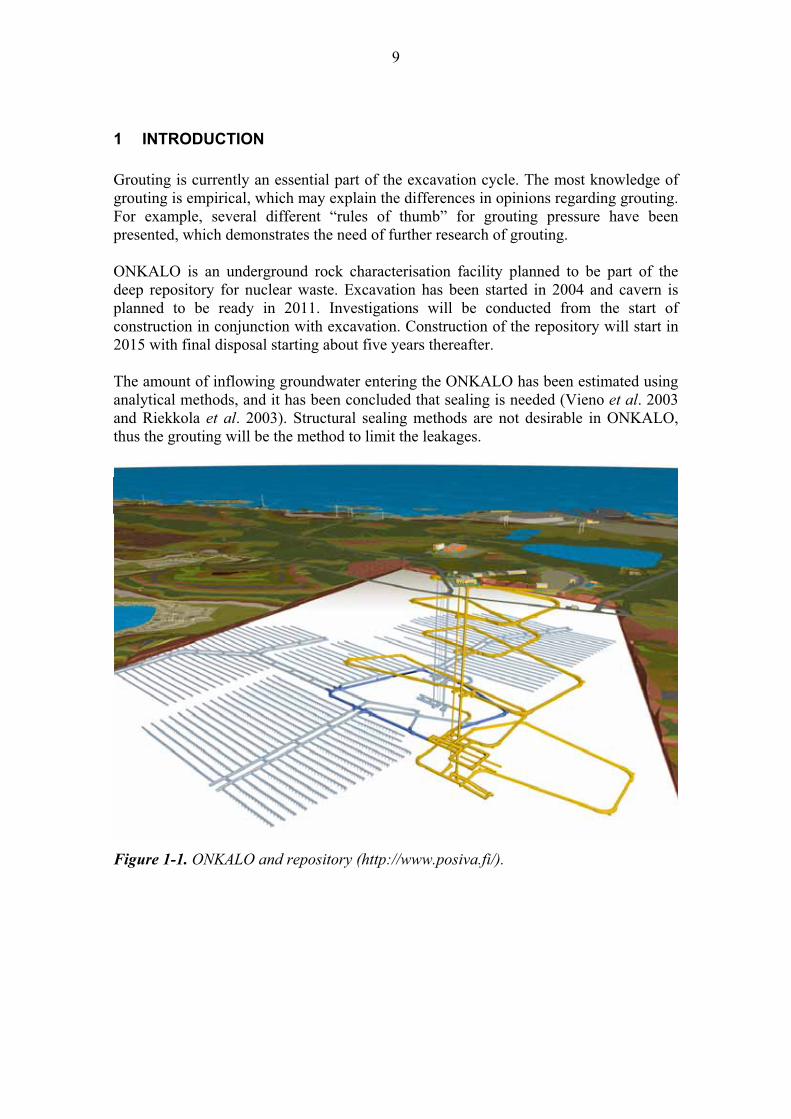
ONKALO is an underground rock characterisation facility planned to be part of the deep repository for nuclear waste. Excavation has been started in 2004 and cavern is planned to be ready in 2011. Investigations will be conducted from the start of construction in conjunction with excavation. Construction of the repository will start in 2015 with final disposal starting about five years thereafter.
The amount of inflowing groundwater entering the ONKALO has been estimated using analytical methods, and it has been concluded that sealing is needed (Vieno et al. 2003 and Riekkola et al. 2003). Structural sealing methods are not desirable in ONKALO, thus the grouting will be the method to limit the leakages.
Figure 1-1. ONKALO and repository (http://www.posiva.fi/).
10
This thesis attempts to collect disperse information about the design parameters of the grouting. In addition, the purpose of this study is to detect practical grouting experiences with conditions similar to those used in Posivas underground research laboratory ONKALO. This study forms part of a large R20-programme the purpose of which is to develop a practical way of grouting to ONKALO.
The first section of this thesis comprises a literature review concerning the characterisation of rock and controlling of the grouting process. A large part of this study discusses different stop criteria for grouting. The second, experimental part of this thesis presents and analyzes the field tests carried out in order to test and demonstrate optimised grouting in practise.
This thesis is limited to focus to rock tunnel grouting using cement-based grout. Studies concerning grouting materials are out of the scope and reported in Rantakorpi et al.(2007).
11
2 TUNNEL GROUTING
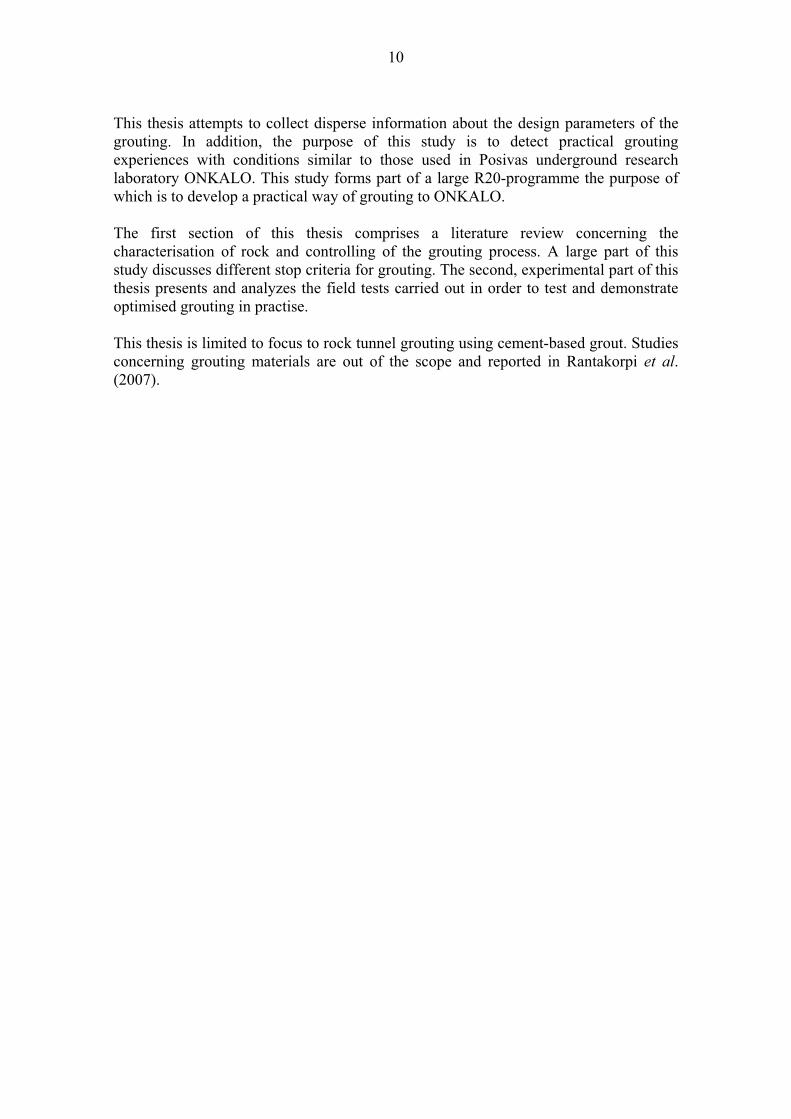
Grouting can be defined as a process where fluid material which is injected under pressure into fractures and cavities in rock, soil or artificial structures.
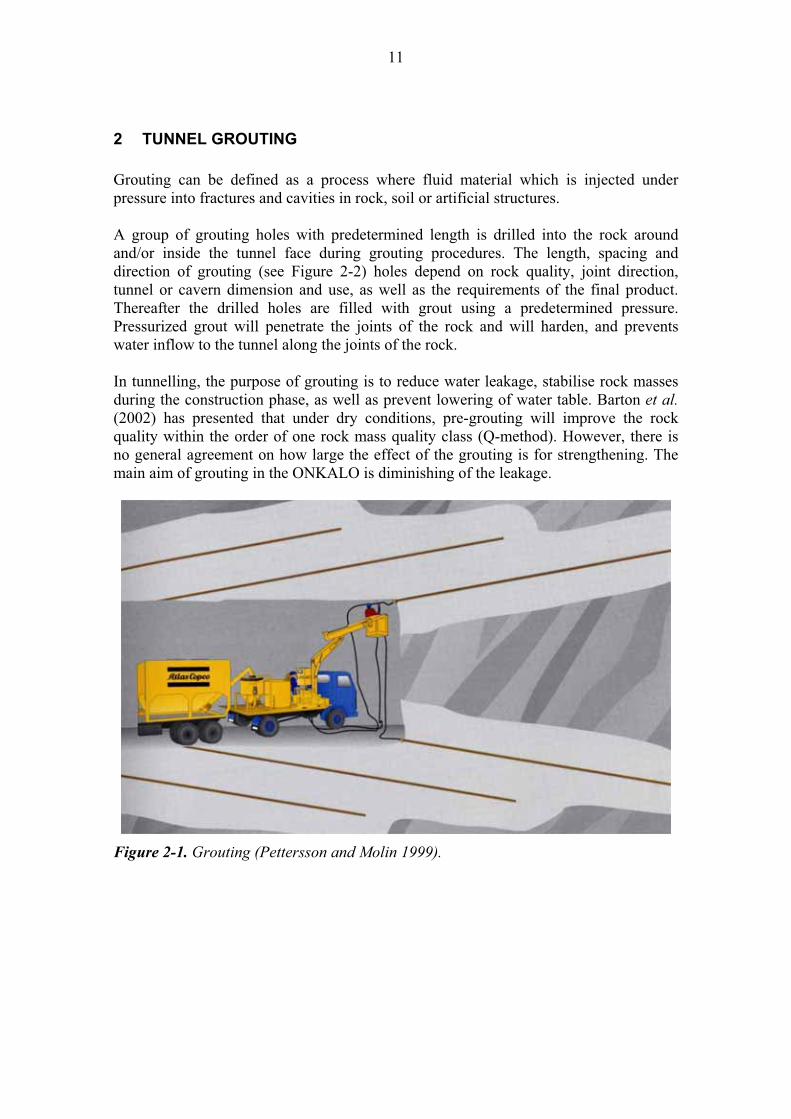
A group of grouting holes with predetermined length is drilled into the rock around and/or inside the tunnel face during grouting procedures. The length, spacing and direction of grouting (see Figure 2-2) holes depend on rock quality, joint direction, tunnel or cavern dimension and use, as well as the requirements of the final product. Thereafter the drilled holes are filled with grout using a predetermined pressure. Pressurized grout will penetrate the joints of the rock and will harden, and prevents water inflow to the tunnel along the joints of the rock.
In tunnelling, the purpose of grouting is to reduce water leakage, stabilise rock masses during the construction phase, as well as prevent lowering of water table. Barton et al.
(2002) has presented that under dry conditions, pre-grouting will improve the rock quality within the order of one rock mass quality class (Q-method). However, there is no general agreement on how large the effect of the grouting is for strengthening. The main aim of grouting in the ONKALO is diminishing of the leakage.
Figure 2-1. Grouting (Pettersson and Molin 1999).
12
Figure 2-2. Pre-grouting drill pattern (MBT 2001).
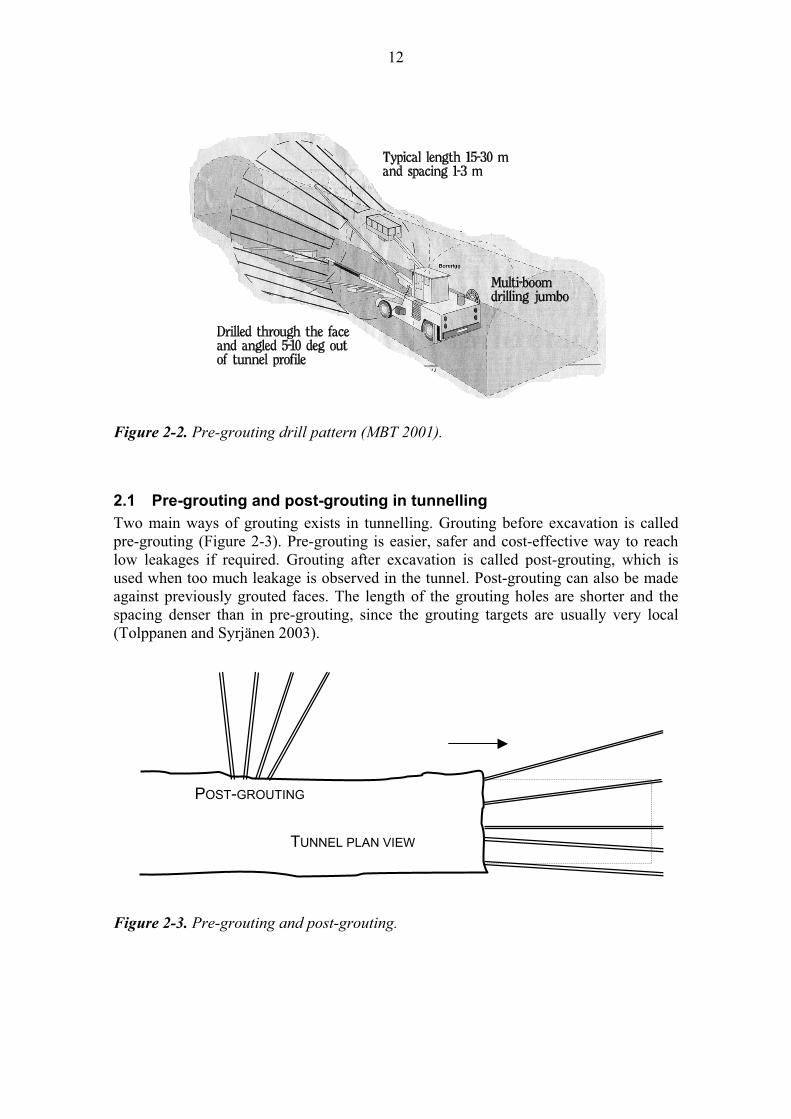
2.1 Pre-grouting and post-grouting in tunnelling
Two main ways of grouting exists in tunnelling. Grouting before excavation is called pre-grouting (Figure 2-3). Pre-grouting is easier, safer and cost-effective way to reach low leakages if required. Grouting after excavation is called post-grouting, which is used when too much leakage is observed in the tunnel. Post-grouting can also be made against previously grouted faces. The length of the grouting holes are shorter and the spacing denser than in pre-grouting, since the grouting targets are usually very local (Tolppanen and Syrjänen 2003).
Figure 2-3. Pre-grouting and post-grouting.
POST-GROUTING
TUNNEL PLAN VIEW
13
2.2 Grouting materials Mostly cementitious materials are used in rock grouting in tunnels. Due to the high level of the tightness requirements, very fine-grained cements are more often used since very small fracture apertures must be grouted (Tolppanen and Syrjänen 2003). According to Bergman et al. (1970), the grain-size distribution (d95) should be less than one third of fracture aperture (b), which has become an established criterion for cement-based grouts:
395
bd
(1.)
Eklund (2005) has presented that the divisor in the equation (1.) depends on a number of different parameters and it can be 2…16.
Cement-based grouts are Bingham fluids, which have plastic viscosity (µg). Plastic viscosity is resistance of fluid to flow.
Chemical grouts are mainly used in very difficult places for grouting due the better penetrability. However, they have a potential negative influence on the environment; they are not very commonly used (Tolppanen and Syrjänen 2003). Several cases chemical grouts are strictly forbidden.
Colloidal silica is a grouting material that penetrates into small fractures where cement cannot penetrate, thus it is a very potential material for tunnels with strict inflow target such as deep repositories (Ranta-Korpi 2007). Colloidal silica is a gelling liquid, and therefore sealing effect is possible. However, grouting using colloidal silica and chemical grouts is out of the scope of this study.

14
15
3 BACKGROUND OF GROUTING IN ONKALO
3.1 Groundwater inflowing into ONKALO
Groundwater inflowing into the underground facilities disturbs the natural groundwater flowing in the rock mass and drawdown the groundwater table. Especially in the ONKALO, upconing of deep saline groundwater would be a potential risk if no sealing of rock will be done. The upconing of deep saline water can also be related to the drawdown of groundwater table since groundwater pressure decreases. It would lead to locally high salinity levels that may negatively impact the performance of buffer bentonite and backfill (Vieno et al. 2003, Ahokas et al. 2006).
A few studies in order to estimate the amount of the inflowing groundwater into the ONKALO have been done. Vieno et al. (2003) have presented that the total inflow into the ONKALO before sealing is ca. 1.14 m3/min. Riekkola et al. (2003) have presented that the total inflow could be as high as 3 m3/min and after sealing 0.4…0.5 m3/min. Ahokas et al. (2006) have used numerical flow model to analyse the impact of several grouting alternatives. The results showed that the water inflow rate to the ONKALO would be far too high if no grouting was used. The target for the inflowing water is set to be 0.14 m3/min for the ONKALO as a whole. To meet this leakage requirement, grouting is needed.
3.2 Grouting materials in ONKALO
All the materials, which are grouted into the rock mass in the ONKALO, should be examined and approved before used. The total amount of grout in the ONKALO should be minimized because of the risk of a geochemical disturbance. Therefore the amount of grouting holes outside the tunnel profile should be minimized, even though the grouting holes are typically drilled as a curtain around the tunnel (see Figure 2-2).
When constructing an underground disposal facility in deep bedrock, low-pH cement-based injection grout is desired because no assured data of the extent of a possible high-pH plume in saturated bedrock conditions is available. Posiva has had several projects to develop low-pH cement-based injection grout. More information about those developing projects is available in e.g. Bodén and Sievänen (2006).
3.3 Posiva’s R20 programme and INKE-project
The name of the R20 research programme comes from the R20-structure, which is a fracture zone in the depth of -300 m from the surface on the ONKALO site. It is assumed that significant part of the water inflowing to the ONKALO will come from the R20-structure which can be directly connected to the final repository. The R20 programme attempts to determine acceptable sealing method before excavations penetrates the R20-structure. Also requirements below R20 structure are stricter regarding the geochemical disturbances and other influences. The R20 program, which will later be reported by Posiva, includes three projects: Long-Term Safety (IPA), Grouting Materials (IMA) and Grouting Technique (INKE).
This study is a part of the INKE-project, which concentrates to develop grouting techniques, criteria and methods for assessment of grouting demand. The challenges of

16
the INKE-project are optimisation of grouting fans, working methods and composition of grouts. The aims of this study are presented in the Introduction (Chapter 1).
17
4 ROCK CHARACTERISATION FOR GROUTING
Several geological factors are effecting to the grouting work. Those factors briefly described below, should be defined a prior to grouting design.
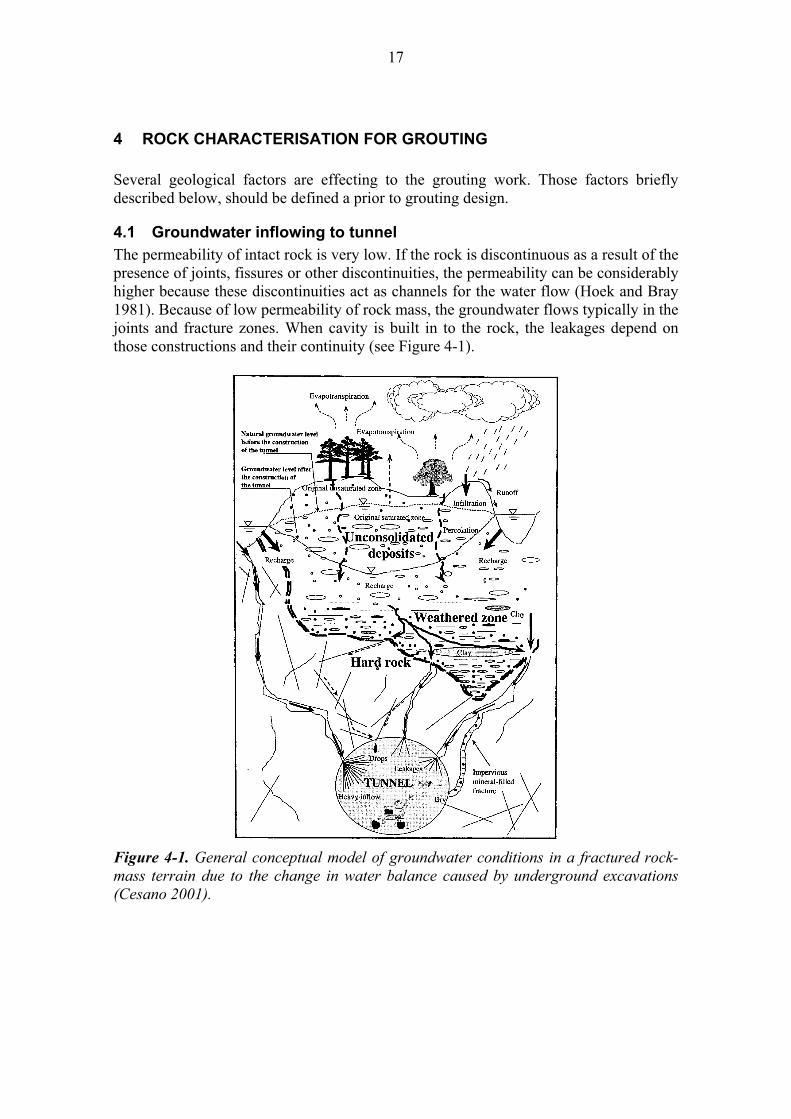
4.1 Groundwater inflowing to tunnel
The permeability of intact rock is very low. If the rock is discontinuous as a result of the presence of joints, fissures or other discontinuities, the permeability can be considerably higher because these discontinuities act as channels for the water flow (Hoek and Bray 1981). Because of low permeability of rock mass, the groundwater flows typically in the joints and fracture zones. When cavity is built in to the rock, the leakages depend on those constructions and their continuity (see Figure 4-1).
Figure 4-1. General conceptual model of groundwater conditions in a fractured rock-
mass terrain due to the change in water balance caused by underground excavations
(Cesano 2001).
18
4.2 Hydraulic conductivity and transmissivity Hydraulic conductivity (k) describes the amount of water which flows through pore spaces under standard pressure head. All rock types have different hydraulic conductivity. As it is stated in the Chapter 4.1 (page 9), the permeability of intact rock mass is very low and the groundwater is typically in the joints and fracture zones, therefore hydraulic conductivity describes also amount of water which flows though fractures.
Transmissivity (T) is the volume of water which flows through a cross-sectional area. Thus, transmissivity is directly proportional to the thickness of the formation (e.g. the thickness of the aquifer or length of test interval in borehole). The relationship between transmissivity (T) and hydraulic conductivity (k) can be calculated with equation (2.):
kdT (2.)where:
T = transmissivity [m2/s] k = hydraulic conductivity of the rock mass [m/s], and d = the thickness of the formation [m].
Transmissivity (T) of fractures or fracture zones observed in boreholes can be evaluated by using for example Posiva Flow Log –method which is used at ONKALO site. The Posiva Flow Log –tool is a novel method to characterize transmissivity (T) for each joint in hole. Öhberg and Rouhiainen (2000) have written more about Posiva Flow Log –tool.
4.2.1 Water loss measurement
The water loss measurement (WLM) is a method to indicate hydraulic properties of the rock mass in situ. A few practical methods have been developed e.g. constant pressure measurement, Falling Head –test and Lugeon test, which is mostly used in Finland. In Lugeon test, water is pumped in to rock and water under pressure flows outwards from a tested hole. Maurice Lugeon (1870 - 1953) was the inventor of the most used water loss measurement and therefore the measured unit (Lug) is named after him.
The Lugeon value is: Lug = waterloss (dm3/m/min), (3.)
when over-pressure for water is 10 bar (= 1.0 MPa), as Lugeon (1933) has recommended.
19
When different pressures and SI-units are used, the equation (3.) can be reformulated:
8106)( wLugLugLug
lug
pptl
VLug ,
(4.)
where:Lug = Lugeon value [dm3/m/min] VLug = water volume [m3 ]lLug = length of test section in bore hole [m] tLug = test time [s], and pw = groundwater pressure [Pa], and pLug = water pressure in Lugeon-test [Pa].
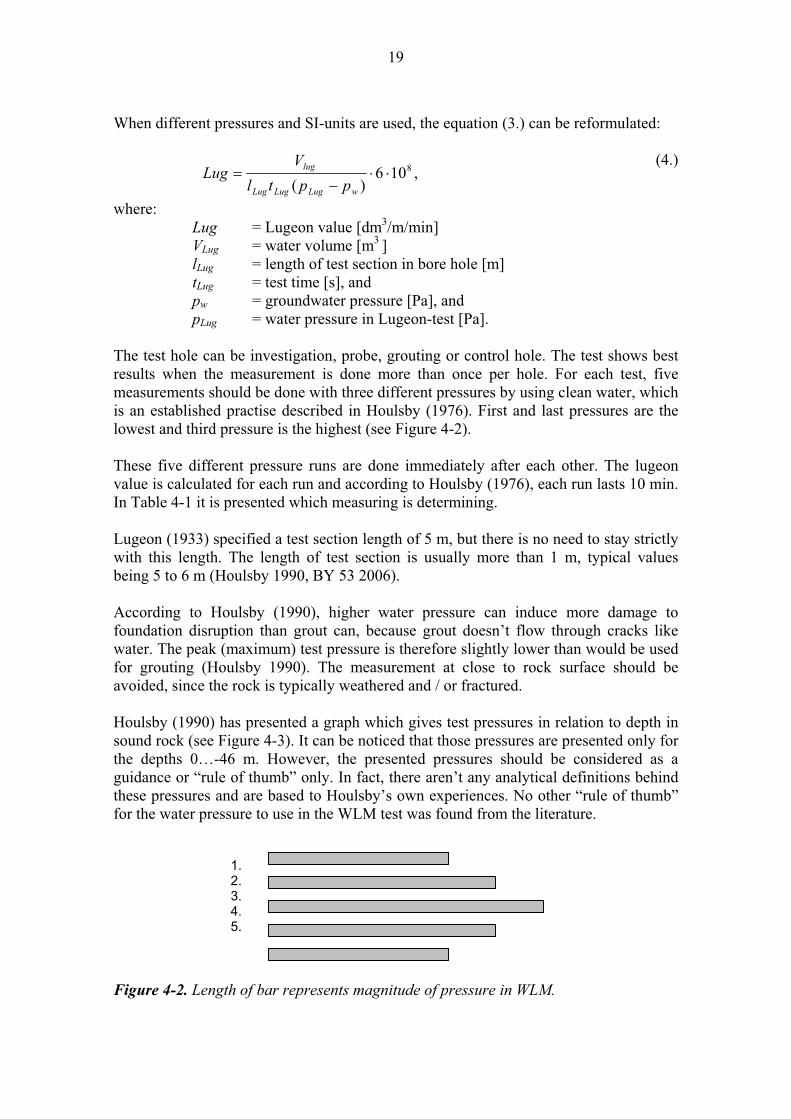
The test hole can be investigation, probe, grouting or control hole. The test shows best results when the measurement is done more than once per hole. For each test, five measurements should be done with three different pressures by using clean water, which is an established practise described in Houlsby (1976). First and last pressures are the lowest and third pressure is the highest (see Figure 4-2).
These five different pressure runs are done immediately after each other. The lugeon value is calculated for each run and according to Houlsby (1976), each run lasts 10 min. In Table 4-1 it is presented which measuring is determining.
Lugeon (1933) specified a test section length of 5 m, but there is no need to stay strictly with this length. The length of test section is usually more than 1 m, typical values being 5 to 6 m (Houlsby 1990, BY 53 2006).
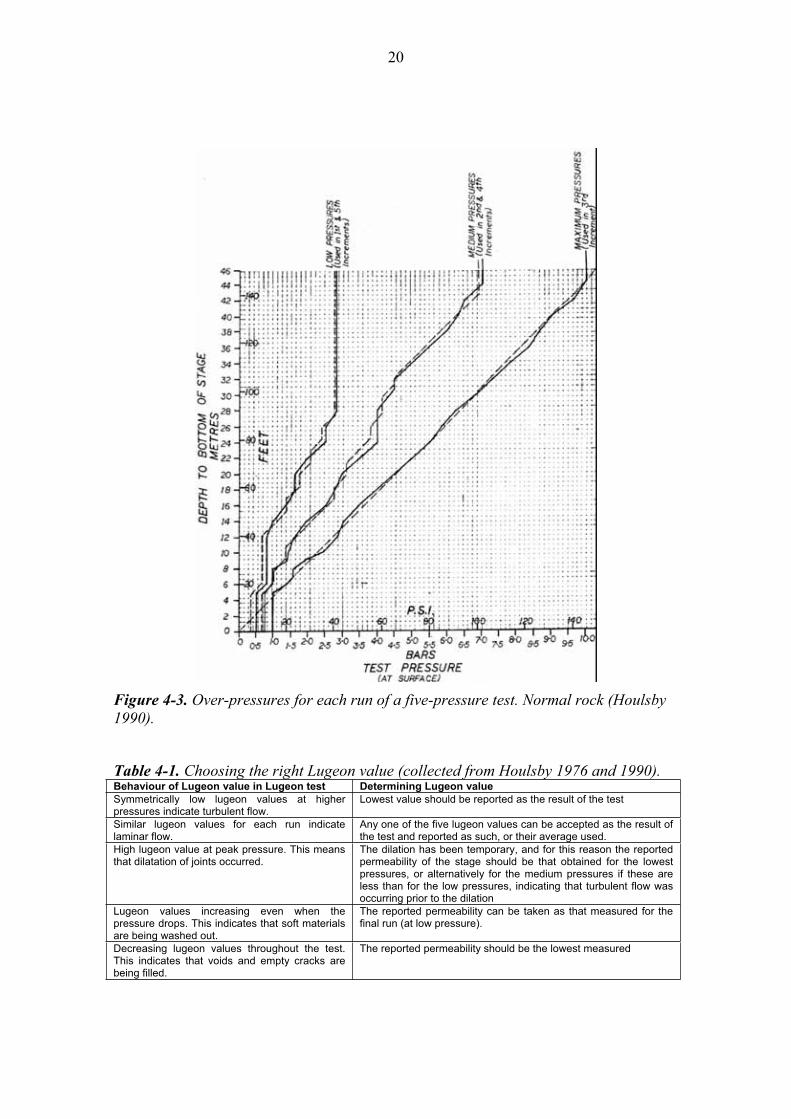
According to Houlsby (1990), higher water pressure can induce more damage to foundation disruption than grout can, because grout doesn’t flow through cracks like water. The peak (maximum) test pressure is therefore slightly lower than would be used for grouting (Houlsby 1990). The measurement at close to rock surface should be avoided, since the rock is typically weathered and / or fractured.
Houlsby (1990) has presented a graph which gives test pressures in relation to depth in sound rock (see Figure 4-3). It can be noticed that those pressures are presented only for the depths 0…-46 m. However, the presented pressures should be considered as a guidance or “rule of thumb” only. In fact, there aren’t any analytical definitions behind these pressures and are based to Houlsby’s own experiences. No other “rule of thumb” for the water pressure to use in the WLM test was found from the literature.
Figure 4-2. Length of bar represents magnitude of pressure in WLM.
1.2.3.4.5.
20
Figure 4-3. Over-pressures for each run of a five-pressure test. Normal rock (Houlsby
1990).
Table 4-1. Choosing the right Lugeon value (collected from Houlsby 1976 and 1990).Behaviour of Lugeon value in Lugeon test Determining Lugeon value Symmetrically low lugeon values at higher pressures indicate turbulent flow.
Lowest value should be reported as the result of the test
Similar lugeon values for each run indicate laminar flow.
Any one of the five lugeon values can be accepted as the result of the test and reported as such, or their average used.
High lugeon value at peak pressure. This means that dilatation of joints occurred.
The dilation has been temporary, and for this reason the reported permeability of the stage should be that obtained for the lowest pressures, or alternatively for the medium pressures if these are less than for the low pressures, indicating that turbulent flow was occurring prior to the dilation
Lugeon values increasing even when the pressure drops. This indicates that soft materials are being washed out.
The reported permeability can be taken as that measured for the final run (at low pressure).
Decreasing lugeon values throughout the test. This indicates that voids and empty cracks are being filled.
The reported permeability should be the lowest measured
21
According to Dalmalm and Janson (2001), measured Lugeon values lower than 0.15 are below the accuracy of the equipment and could therefore not be determined and accepted. Houlsby (1990) has written that Lugeons should never be given to a decimal place, and any values between 0…1 should be rounded up to 1.
The Lugeon value is not strictly equal to hydraulic conductivity but it is quite good approximation for grouting purposes (Rosengren et al. 1996):
7103,1Lugk (5.)
where:k = hydraulic conductivity of the rock mass [m/s], and Lug = Lugeon value [dm3/m/min].
4.3 Inflow estimation
The analytical method to estimate water inflow to the tunnel is originally presented by Wiberg (1961). After correction of these equations the current version is the following (Swedish National Road Administration 1994):
tR
R
khQ
0ln
2 (6.)
gt
g
t
gt
g
tR
R
k
k
R
tR
hkQ
0lnln
2,
(7.)
where:Q = the inflow to the tunnel [m3/s] k = the hydraulic conductivity of the rock mass outside the grouted
zone [m/s] kg = the hydraulic conductivity of the grouted zone [m/s] h = water pressure expressed as water head (in tunnel centre)[m] Rt = the radius of the tunnel [m] R0 = the active radius of flow [m], 2·h is a typically used estimation tg = the extension of the grouted zone [m], and
= the skin factor [-].
Equation (6.) is for non-grouted rock and equation (7.) for grouted rock. Both equations are valid only for tunnels existing below groundwater table, though it is not possible to assess an exact limit how deep a tunnel should be. However, an estimation has been presented that the equations are valid when the hydraulic head (h) is at least 6…8 · R.
Both equations (6.) and (7.) derives from the Darcy’s law. Sievänen (2002) and Kolymbas & Wagner (2007) have presented exact deducing for those equations.
22
4.4 Hydraulic aperture of fracture The hydraulic aperture of fracture can be calculated by using the cubic law:
312
g
Tb
w
whydr ,
(8.)
where:T = transmissivity [m2/s] bhydr = hydraulic aperture of fracture [m] g = gravitational acceleration [m/s2 ]
w = dynamic viscosity of water [Pas], and w = density of water [kg/m3].
Equation (8.) derives from the Navier-Stokes equation, and the exact deducing is presented for example in Sisavath et al. (2003) and Eloranta (2007).
According to Fransson (2001), the hydraulic aperture determined by the cubic law has shown to be a good estimate for the grouting aperture.
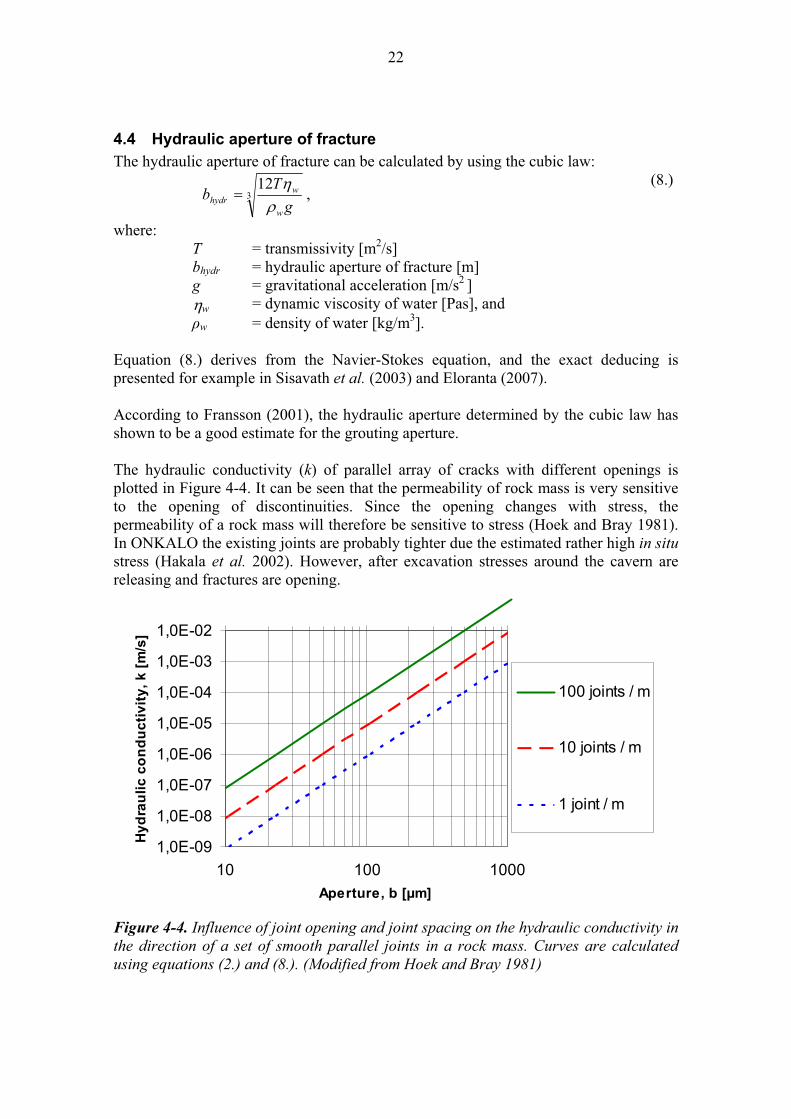
The hydraulic conductivity (k) of parallel array of cracks with different openings is plotted in Figure 4-4. It can be seen that the permeability of rock mass is very sensitive to the opening of discontinuities. Since the opening changes with stress, the permeability of a rock mass will therefore be sensitive to stress (Hoek and Bray 1981). In ONKALO the existing joints are probably tighter due the estimated rather high in situ
stress (Hakala et al. 2002). However, after excavation stresses around the cavern are releasing and fractures are opening.
1,0E-09
1,0E-08
1,0E-07
1,0E-06
1,0E-05
1,0E-04
1,0E-03
1,0E-02
10 100 1000
Aperture, b [µm]
Hy
dra
uli
c c
on
du
cti
vit
y,
k [
m/s
]
100 joints / m
10 joints / m
1 joint / m
Figure 4-4. Influence of joint opening and joint spacing on the hydraulic conductivity in
the direction of a set of smooth parallel joints in a rock mass. Curves are calculated
using equations (2.) and (8.). (Modified from Hoek and Bray 1981)
23
5 CONTROLLING OF GROUTING PROCESS
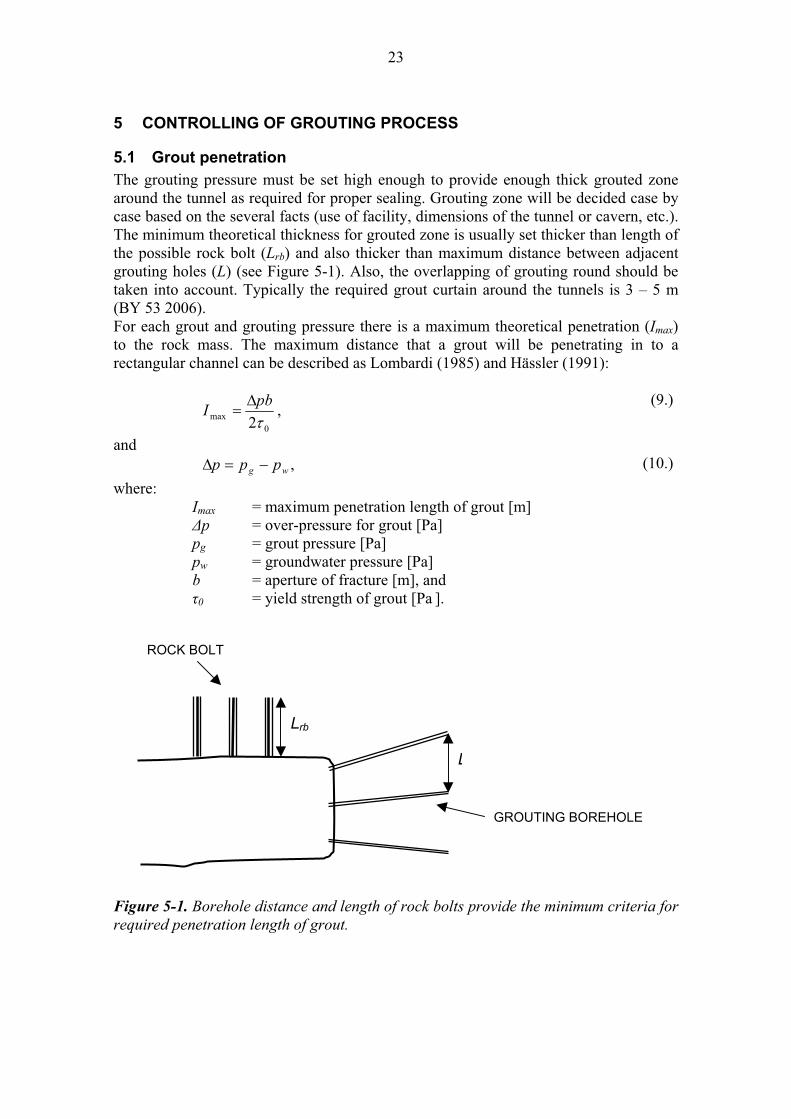
5.1 Grout penetration
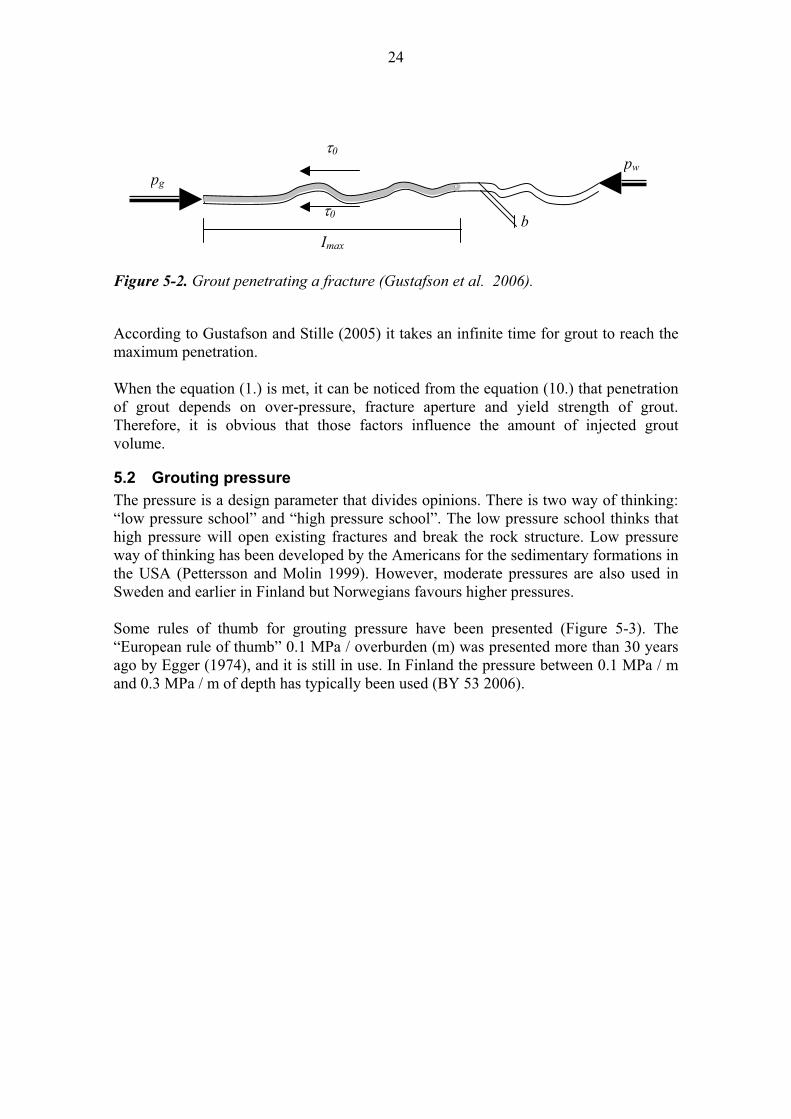
The grouting pressure must be set high enough to provide enough thick grouted zone around the tunnel as required for proper sealing. Grouting zone will be decided case by case based on the several facts (use of facility, dimensions of the tunnel or cavern, etc.). The minimum theoretical thickness for grouted zone is usually set thicker than length of the possible rock bolt (Lrb) and also thicker than maximum distance between adjacent grouting holes (L) (see Figure 5-1). Also, the overlapping of grouting round should be taken into account. Typically the required grout curtain around the tunnels is 3 – 5 m (BY 53 2006).For each grout and grouting pressure there is a maximum theoretical penetration (Imax)to the rock mass. The maximum distance that a grout will be penetrating in to a rectangular channel can be described as Lombardi (1985) and Hässler (1991):
0max 2
pbI ,
(9.)
and
wg ppp , (10.)
where:Imax = maximum penetration length of grout [m]
p = over-pressure for grout [Pa] pg = grout pressure [Pa] pw = groundwater pressure [Pa] b = aperture of fracture [m], and
0 = yield strength of grout [Pa ].
Figure 5-1. Borehole distance and length of rock bolts provide the minimum criteria for
required penetration length of grout.
Lrb
L
GROUTING BOREHOLE
ROCK BOLT
24
Figure 5-2. Grout penetrating a fracture (Gustafson et al. 2006).
According to Gustafson and Stille (2005) it takes an infinite time for grout to reach the maximum penetration.
When the equation (1.) is met, it can be noticed from the equation (10.) that penetration of grout depends on over-pressure, fracture aperture and yield strength of grout. Therefore, it is obvious that those factors influence the amount of injected grout volume.
5.2 Grouting pressure
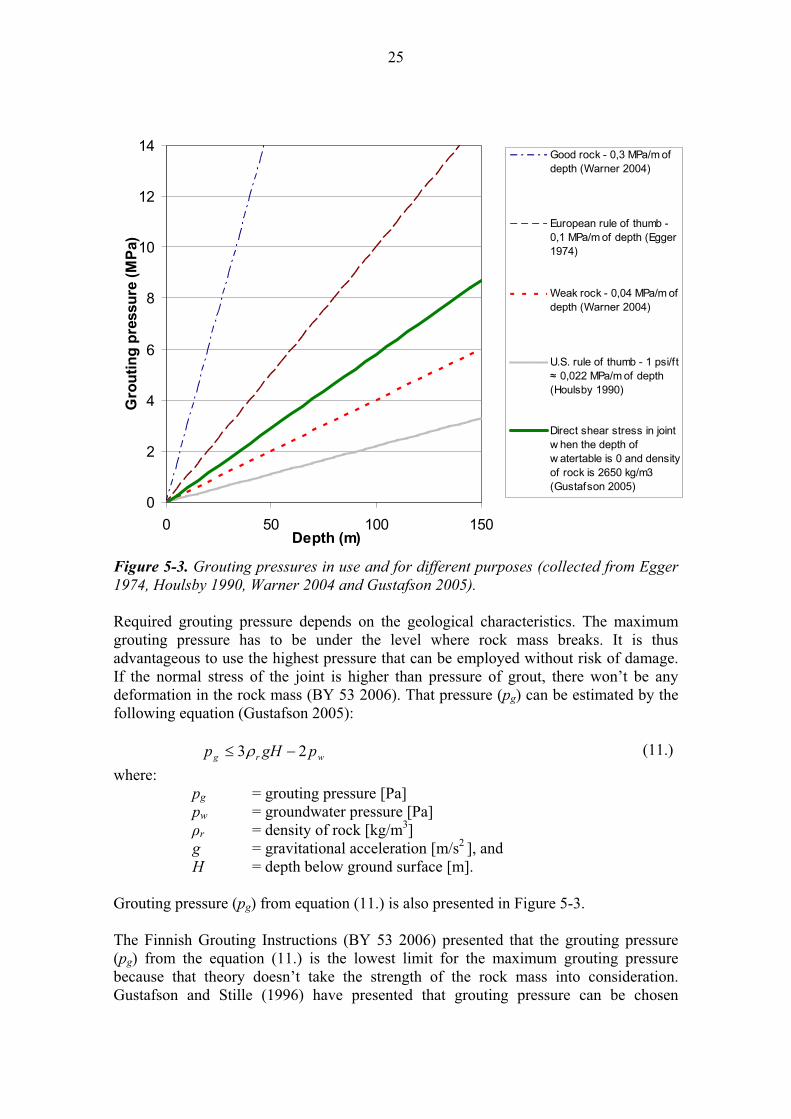
The pressure is a design parameter that divides opinions. There is two way of thinking: “low pressure school” and “high pressure school”. The low pressure school thinks that high pressure will open existing fractures and break the rock structure. Low pressure way of thinking has been developed by the Americans for the sedimentary formations in the USA (Pettersson and Molin 1999). However, moderate pressures are also used in Sweden and earlier in Finland but Norwegians favours higher pressures.
Some rules of thumb for grouting pressure have been presented (Figure 5-3). The “European rule of thumb” 0.1 MPa / overburden (m) was presented more than 30 years ago by Egger (1974), and it is still in use. In Finland the pressure between 0.1 MPa / m and 0.3 MPa / m of depth has typically been used (BY 53 2006).
Imax
0
0
pw
pg
b
25
0
2
4
6
8
10
12
14
0 50 100 150Depth (m)
Gro
uti
ng
pre
ssu
re (
MP
a)
Good rock - 0,3 MPa/m ofdepth (Warner 2004)
European rule of thumb -0,1 MPa/m of depth (Egger1974)
Weak rock - 0,04 MPa/m ofdepth (Warner 2004)
U.S. rule of thumb - 1 psi/ft 0,022 MPa/m of depth
(Houlsby 1990)
Direct shear stress in jointw hen the depth ofw atertable is 0 and densityof rock is 2650 kg/m3(Gustafson 2005)
Figure 5-3. Grouting pressures in use and for different purposes (collected from Egger
1974, Houlsby 1990, Warner 2004 and Gustafson 2005).
Required grouting pressure depends on the geological characteristics. The maximum grouting pressure has to be under the level where rock mass breaks. It is thus advantageous to use the highest pressure that can be employed without risk of damage. If the normal stress of the joint is higher than pressure of grout, there won’t be any deformation in the rock mass (BY 53 2006). That pressure (pg) can be estimated by the following equation (Gustafson 2005):
wrg pgHp 23 (11.)
where:pg = grouting pressure [Pa] pw = groundwater pressure [Pa]
r = density of rock [kg/m3]g = gravitational acceleration [m/s2 ], and H = depth below ground surface [m].
Grouting pressure (pg) from equation (11.) is also presented in Figure 5-3.
The Finnish Grouting Instructions (BY 53 2006) presented that the grouting pressure (pg) from the equation (11.) is the lowest limit for the maximum grouting pressure because that theory doesn’t take the strength of the rock mass into consideration. Gustafson and Stille (1996) have presented that grouting pressure can be chosen
26
arbitrarily between 2pw and the minimum rock stress ( 3). Gustafson et al. (2006) have written that in normal tunnel, a reasonable rule of thumb for minimum grout over-pressure is more than twice the groundwater pressure, thus pg > 3pw. Brantberger et al.
(2001) has presented that a grouting pressure of more than three times vertical stress ( v
rgH) due to the overburden could be used without risk of hydraulic uplift. Equation (11.) is based on that assumption.
Norwegians are typically using much higher pressures than have been used in Finland and Sweden. One rule of thumb for pressure in Norway is that the pressure should be 2.5…3.5 MPa higher than the groundwater pressure although grouting pressures of up to 8…9 MPa are used on depth 10…20 m (Tolppanen and Syrjänen 2003). Lindstrøm and Kveen (2006) presented that low W/C –ratio combined with high pressure is absolutely the main condition for successful grouting. Barton (2004) expresses reasons for performing high pressure (5…10 MPa) grouting when pre-grouting ahead of tunnels is that inflows have to be controlled, perhaps down to 1…2 dm3/min/100m. He also stated that at least 40% to 80% of original pressure drops at the distance of first 1 m radius from a grouting hole.
No other “rule of the thumb” or equations for the grouting pressure were found from the references.
5.3 The requirements on grout strength
The yield strength of grout effects greatly when estimating the grout penetration. Few criteria for yield strength can be presented.
Because the required penetration length (I) for grout must be selected to be less than the maximum theoretical penetration (Imax), the maximum value for yield strength can thus be formulated:
I
pb
20
(12.)
keeping in mind equation (9.) and: I < Imax , (13.)
where:Imax = maximum penetration length of grout [m] I = penetration length of injected grout
p = over-pressure for grout [Pa] b = aperture of fracture [m], and
0 = yield strength of grout [Pa ].
27
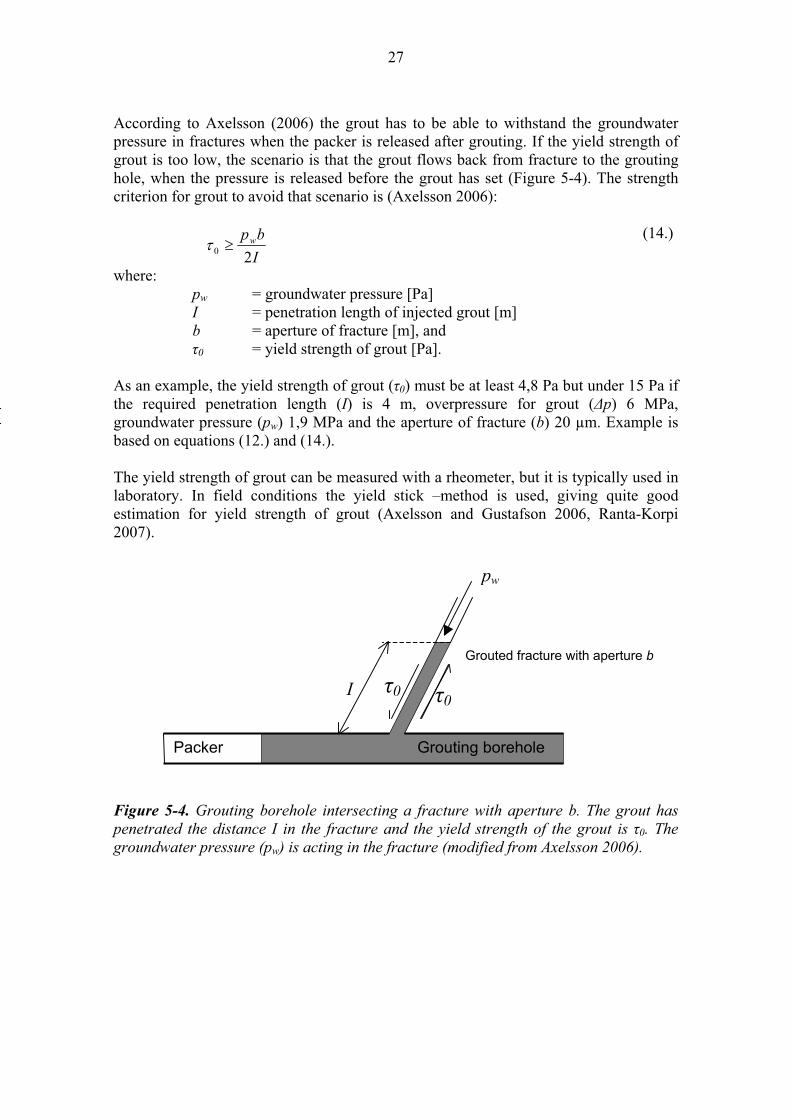
According to Axelsson (2006) the grout has to be able to withstand the groundwater pressure in fractures when the packer is released after grouting. If the yield strength of grout is too low, the scenario is that the grout flows back from fracture to the grouting hole, when the pressure is released before the grout has set (Figure 5-4). The strength criterion for grout to avoid that scenario is (Axelsson 2006):
I
bpw
20
(14.)
where:pw = groundwater pressure [Pa] I = penetration length of injected grout [m] b = aperture of fracture [m], and
0 = yield strength of grout [Pa].
As an example, the yield strength of grout ( 0) must be at least 4,8 Pa but under 15 Pa if the required penetration length (I) is 4 m, overpressure for grout ( p) 6 MPa, groundwater pressure (pw) 1,9 MPa and the aperture of fracture (b) 20 µm. Example is based on equations (12.) and (14.).
The yield strength of grout can be measured with a rheometer, but it is typically used in laboratory. In field conditions the yield stick –method is used, giving quite good estimation for yield strength of grout (Axelsson and Gustafson 2006, Ranta-Korpi 2007).
Figure 5-4. Grouting borehole intersecting a fracture with aperture b. The grout has
penetrated the distance I in the fracture and the yield strength of the grout is 0. The
groundwater pressure (pw) is acting in the fracture (modified from Axelsson 2006).
00
pw
I
Packer
Grouted fracture with aperture b
Grouting borehole
28
If the packer is removed too early from the grouting hole, there is a risk that grout flows from borehole to the tunnel. To be able to minimize the risk of backflow occurs, Axelsson (2006) has presented following equation for fast estimation:
b
bw
l
Rp
2
(15.)
where:pw = groundwater pressure [Pa] lb = the length of the borehole [m] Rb = the radius of the borehole[m], and
= shear strength of grout [Pa ].
The shear strength of grout can be rather accurately measured in the laboratory. At the site shear strengths can be estimated with a fall cone test (e.g. Koumoto and Houlsby 2001, standard ISO-TS 17892-6:2004). It is important to notice that the conditions are different in laboratory than at the site, and especially in a grouting hole, respectively.
5.3.1 Packers’ removing time
The packers’ removing time is typically set empirically. Finnish Concrete Association (2006) has been presented a simplified “cup test” to illustrate setting-time of grout in the site conditions. It is very important to notice that the cup test does not take the conditions of rock mass (temperature, groundwater’s pressure, humidity) and groundwater chemistry into account, and therefore results of the test are not directly valid, especially in deep rock.
If the results of shear strength development are known well enough in conditions similar to in grouting hole, the packers removing time can be calculated using equation (15.): when the shear strength reaches the required level, the packers can be removed safely.
5.4 Starting criteria for grouting
The limits of the inflowing water typically determine the starting criteria for pre-grouting.
Starting criteria are typically based on measured values from probe hole. The starting criterion can be, for example, maximum limit for Lugeon-value or for out flowing water from the probe holes.
5.4.1 Starting criteria in the ONKALO
Inflows have to be controlled in the ONKALO (see Chapter 3.1, page 15); the target for the inflowing water is 140 dm3/min for repository as a whole, which means an average of 1…2 dm3/min/100 m tunnel (Ahokas et al. 2006).
Starting of grouting is based on: - observed local inflow from fracture / fracture zones - out flowing water from probe holes - water loss measurement
29
5.5 Stop criteria Stop criteria describes the point when grouting in each borehole can be stopped. In an ideal case, when grouting reaches the level of stop criterion, the sealing effect should be at adequate level. Grouting after that point is uneconomical.
A few different stop criteria for grouting have been developed. Those are presented in the following Chapters.
5.5.1 Prevailing practice
Different stop criteria are set up to limit the amount of grout in the rock mass. Prevalent usage for stop criterion is to set highest pressure (pmax) allowed. To make it simple, grouting will be stopped after 5 to 10 minutes after the time when grouting pressure attained the limiting pressure (pmax), and during that time the pressure should be nearly maximum pressure. That maximum volume (Vmax) for grout take can also be a trigger to stop grouting with or without highest pressure taken into account. W/C –ratio for grout mix is usually lowered if borehole takes more grout than is anticipated.
The minimum flow is also used as a stop criterion together with maximum pressure and maximum volume, e.g. when the grout flow has been 0,0 dm3 / min during last 2 minutes, the grouting will be stopped. The minimum flow criterion has usually been very low when joints are tight.
Stop criterion, which is based on highest pressure, maximum volume and minimum flow, has typically been used in the most of cases in tunnelling, also in the ONKALO. However, some more theory based criterias exists.
5.5.2 GIN-principle
In a given grouting interval, the energy expended is approximately proportional to the product of the final grouting pressure and the grout volume injected. This value is called Grouting Intensity Number, also known as GIN (Lombardi and Deere 1993).
where:GIN = Grouting Intensity Number [MPa·dm3/m of borehole] pg = grouting pressure [Pa], and VGIN = grout take [dm3/m of borehole].
The GIN-method was developed to control grouting operations for dam constructions. Also, Lombardi (1997) stated that GIN-method is usable in variable type of rock mass. Further, in rocks with both small and large fractures the GIN-method could be usable for the first grouting round in order to seal the largest fractures.
To simplify the process, GIN-grouting employs a single stable (thick) grout, injected at a uniform rate and conforming to chosen limitation. It is presented that recognizing the poor correlation between evaluated Lugeon values (see Chapter 4.2) and groutability, GIN eliminates such testing, and simplifying the process. Instead, computer-generated
GIN = pgVGIN (16.)
30
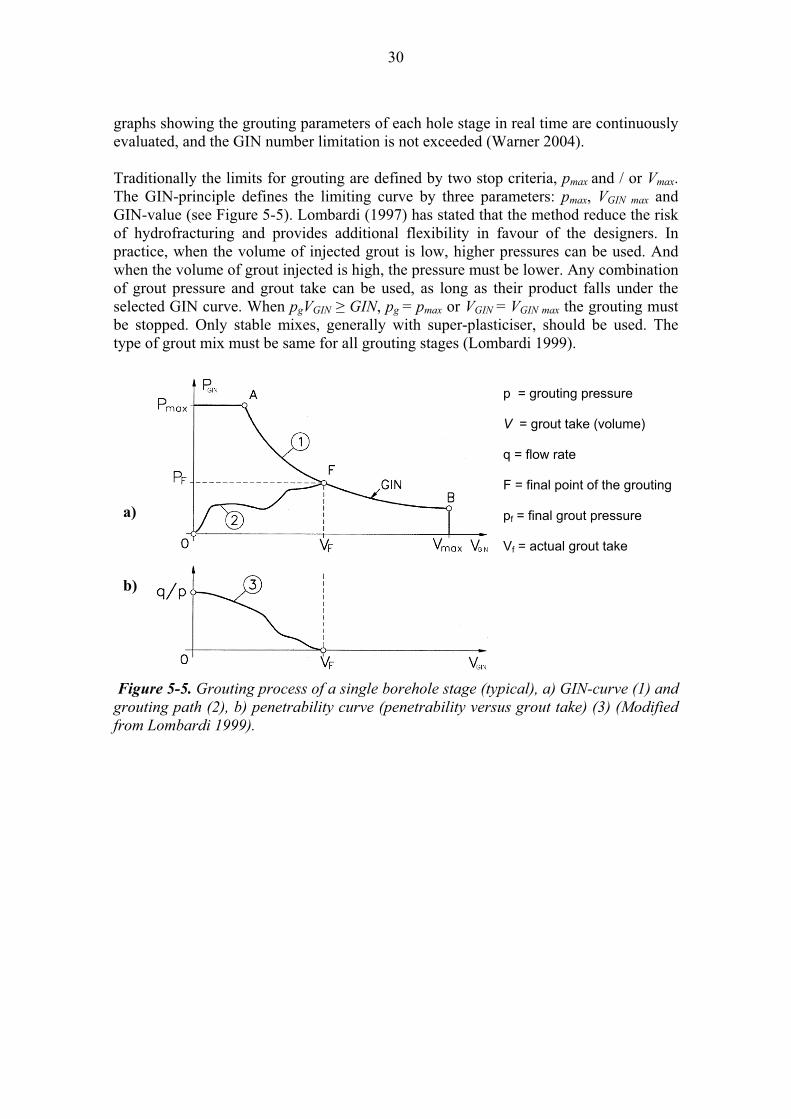
graphs showing the grouting parameters of each hole stage in real time are continuously evaluated, and the GIN number limitation is not exceeded (Warner 2004).
Traditionally the limits for grouting are defined by two stop criteria, pmax and / or Vmax.The GIN-principle defines the limiting curve by three parameters: pmax, VGIN max and GIN-value (see Figure 5-5). Lombardi (1997) has stated that the method reduce the risk of hydrofracturing and provides additional flexibility in favour of the designers. In practice, when the volume of injected grout is low, higher pressures can be used. And when the volume of grout injected is high, the pressure must be lower. Any combination of grout pressure and grout take can be used, as long as their product falls under the selected GIN curve. When pgVGIN GIN, pg = pmax or VGIN = VGIN max the grouting must be stopped. Only stable mixes, generally with super-plasticiser, should be used. The type of grout mix must be same for all grouting stages (Lombardi 1999).
Figure 5-5. Grouting process of a single borehole stage (typical), a) GIN-curve (1) and
grouting path (2), b) penetrability curve (penetrability versus grout take) (3) (Modified
from Lombardi 1999).
p = grouting pressure
V = grout take (volume)
q = flow rate
F = final point of the grouting
pf = final grout pressure
Vf = actual grout take
a)
b)
31
GIN-value is more or less proportional to the energy that is allowed to be injected into the rock mass. The fundamental principle of the GIN-method is to reduce the grouting pressure in function of the volume of the grout injected. Exact definition of the GIN-value for real joints is the following (Lombardi 2003):
where:GIN = Grouting Intensity Number [MPa·dm3/m of borehole]
0 = yield strength of grout [Pa] IGIN = average penetration length of the grout [m] pg = grouting pressure [MPa] VGIN = grout take [dm3/m of borehole] b = aperture of fracture [m] n = number of main joints (per m borehole) [-] kp = coefficient to consider pressure losses due to the rugosity of the
rock walls of the joint and the variation of the aperture [-], and kv = coefficient to consider volume increase due to undulations as
well as to variations of the opening of the joints [-].
Lombardi (2003) has presented also estimation for the GIN-number:
It can be noticed from equation (18.) that the GIN-number has high values if the yield strength of grout is low.
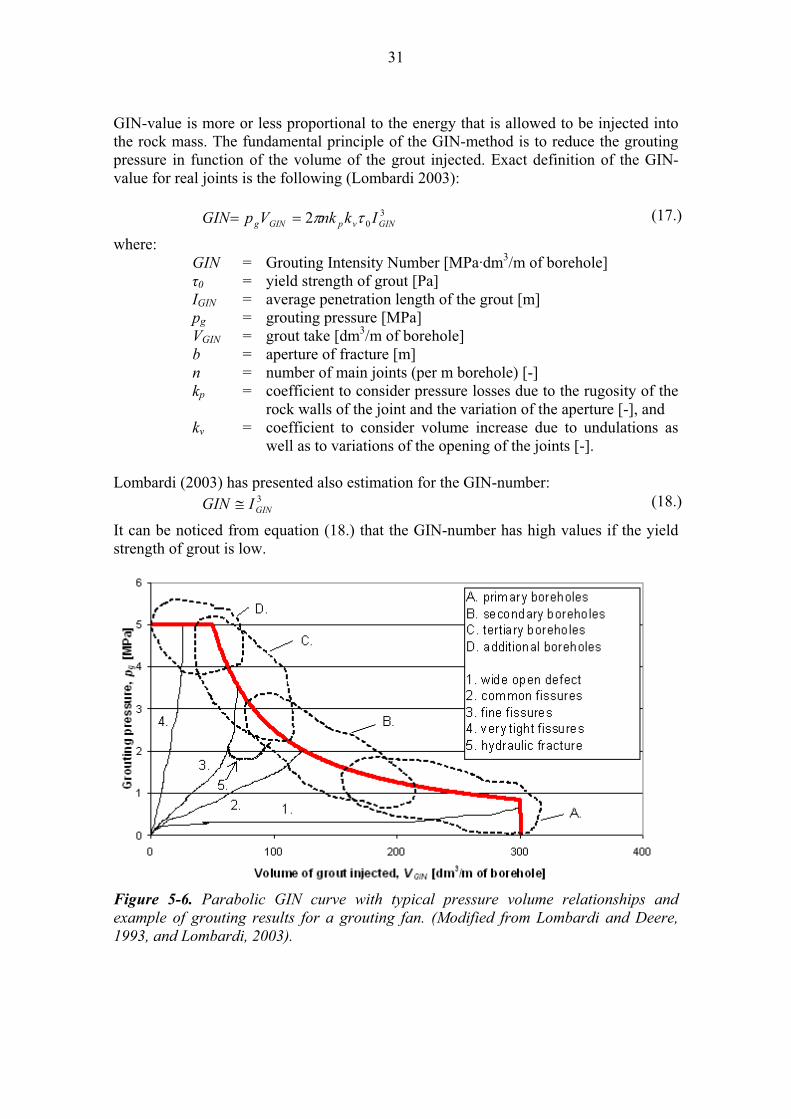
Figure 5-6. Parabolic GIN curve with typical pressure volume relationships and
example of grouting results for a grouting fan. (Modified from Lombardi and Deere,
1993, and Lombardi, 2003).
302 GINvpGINg IknkVpGIN (17.)
3GINIGIN (18.)
32
Once the limiting grout volume and pressure are chosen, the parabolic GIN curve is calculated (Figure 5-6). At the GIN curve a range of pressure-volume curves that may reasonably be expected to occur during typical grouting procedure are also presented. When filling fractures in the early injection phases, the volume will be high and pressure low (see Figure 5-6). Conversely, higher pressures will be experienced in the later phases, but the volume will be significantly less (Warner 2004).
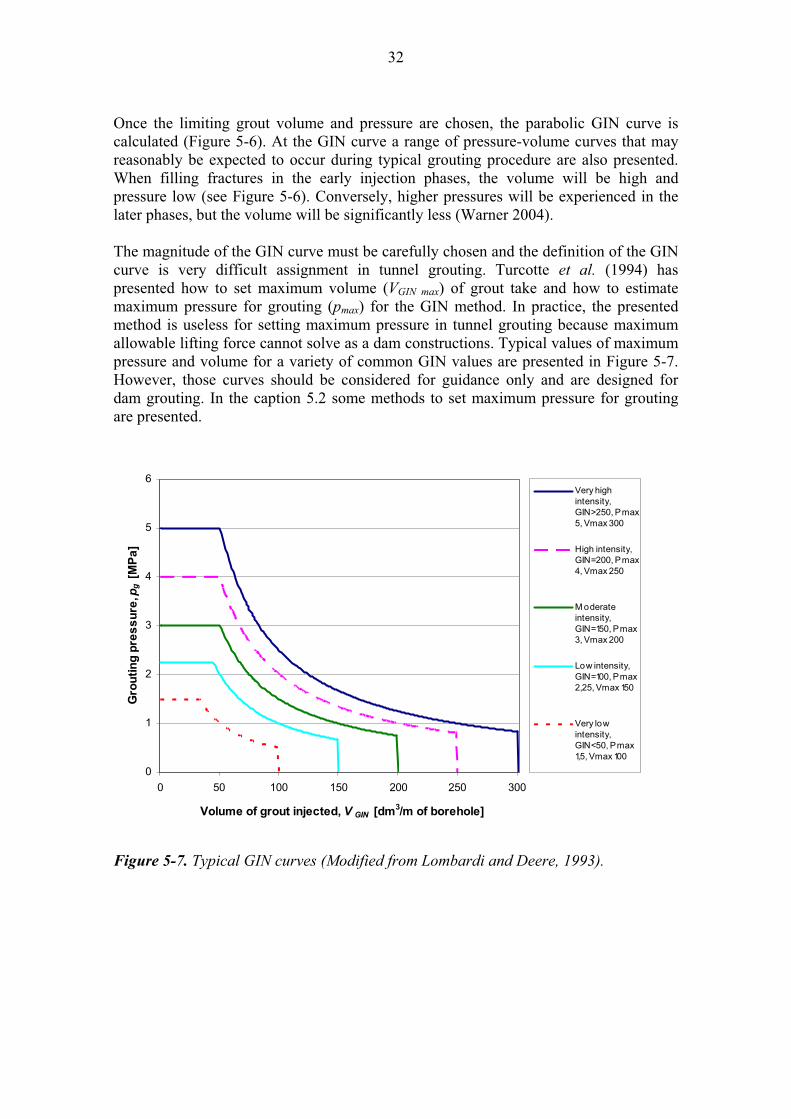
The magnitude of the GIN curve must be carefully chosen and the definition of the GIN curve is very difficult assignment in tunnel grouting. Turcotte et al. (1994) has presented how to set maximum volume (VGIN max) of grout take and how to estimate maximum pressure for grouting (pmax) for the GIN method. In practice, the presented method is useless for setting maximum pressure in tunnel grouting because maximum allowable lifting force cannot solve as a dam constructions. Typical values of maximum pressure and volume for a variety of common GIN values are presented in Figure 5-7. However, those curves should be considered for guidance only and are designed for dam grouting. In the caption 5.2 some methods to set maximum pressure for grouting are presented.
0
1
2
3
4
5
6
0 50 100 150 200 250 300
Volume of grout injected, V GIN [dm3/m of borehole]
Gro
uti
ng
pre
ss
ure
, pg
[M
Pa
]
Very highintensity,GIN>250, Pmax5, Vmax 300
High intensity,GIN=200, Pmax4, Vmax 250
M oderateintensity,GIN=150, Pmax3, Vmax 200
Low intensity,GIN=100, Pmax2,25, Vmax 150
Very lowintensity,GIN<50, Pmax1,5, Vmax 100
Figure 5-7. Typical GIN curves (Modified from Lombardi and Deere, 1993).
33
GIN-value has to be significantly smaller than the critical value (Lombardi 1997):
where:GIN = Grouting Intensity Number [MPa·dm3/m of borehole] GINcritical = implied GIN-value where hydraulic uplift of rock can be
initiated [MPa·dm3/m of borehole] pmax = maximum pressure [MPa], and VGIN max = maximum grout volume [dm3/m of borehole].
From the literature only one case was found, where GIN-method was really used in tunnel grouting; Göta Tunnel in Sweden. The utilised GIN-number was set to 30 MPa·dm3/m of borehole (Lindblom et al. 2005). Unfortunately, limiting curve for the case is not presented. Maximum volume VGIN max for grout was set to 60 dm3/m of borehole and maximum pressure (pmax) was 3 MPa. Even though the GIN-value was very low (see Figure 5-7), most of the performed groutings were stopped to the maximum pressure or to the maximum volume. W/C –ratio of 0.8 was used. The final result for the leakage was ca. 0.7 dm3 / min / 100 m of tunnel (Lindblom et al. 2005).
Several opinions has been raised, that GIN-method is difficult to use in situ, since it does not take geological factors into account and the grout take is dependent on geology (Tolppanen and Syrjänen 2003). Also, Lombardi (1993) has stated, that no water pressure tests should be carried out at GIN method, which renders it difficult to optimise the grouting process since the rock mass conditions are unknown (Axelsson 2006).
The main purpose of using the GIN-method is to minimise the risk of hydraulic lifting. However, Brantberger (et al. 2001) has proved analytically that the risk of hydraulic lifting in tunnel grouting is not clearly taken care of with the GIN-method.
Further, GIN method is based on the system, that only one type of grout mix is used. By that, there could be problems if high sealing by grouting is required. Thick stable mixes have been favoured by Lombardi (1999 & 2003) but in tunnel, at least at greater depth, the joints are typically tight and thereby thicker grout mixes can not penetrate so far away as desired. Rombough et al. (2006) have dissected achievable penetrability control of GIN-mixes, and the results indicate that for realistic grout properties and injection rates the GIN-approximation may over-estimate the achievable penetration.
5.5.3 GT-method
BackgroundGrouting Time –method (GT-method) is an analytical method to describe the relationship between grout penetration and grouting time to derive stop criterion for grouting. It is a grouting strategy developed in Chalmers University of Technology and Royal University of Technology in Sweden. The whole method is presented by Gustafson and Stille (2005), but also some other references include some basic equations for this principle. Because GT-method has recently been presented, there are no objective comments in literature about it. The method is named by R20 INKE-project.
GIN < GINcritical = p maxVGIN max (19.)
34
The main issue of the strategy is the time spent for pumping since, in principle, it takes an infinite time to reach the maximum penetration. The basic relation between penetration and grouting time means that the relative penetration ID is the same in all fractures cut by a borehole (Gustafson and Stille 2005).
maxI
II D
(20.)
where:ID = relative penetration length [-] I = penetration length of injected grout [m], and Imax = maximum penetration length of grout [m].
The equation (9.) (page 23) for maximum penetration Imax is presented in chapter 5.1.
The timescale is given by the characteristic grouting time (Gustafson and Stille 2005):
D
g
t
tpt
20
0
6 (21.)
where:t0 = characteristic grouting time [s]
p = over-pressure for grout [Pa] µg = plastic viscosity of grout [Pas]
0 = yield strength of grout [Pa ]tD = relative grouting time [-], and t = grouting time [s].
The charasteric time is time is the time needed for obtaining about 88 % of possible 1D-penetration and about 59 % of possible 2D-penetration. Any detailed info about how the equation for the charasteric grouting time t0 is generated was found from the literature.
The relative grouting time (tD) is presented for one-dimensional (1D) and two-dimensional (2D) cases. In reality, flow inside joint is something between 1D and 2D cases, or even 3D (see Figure 5-8).
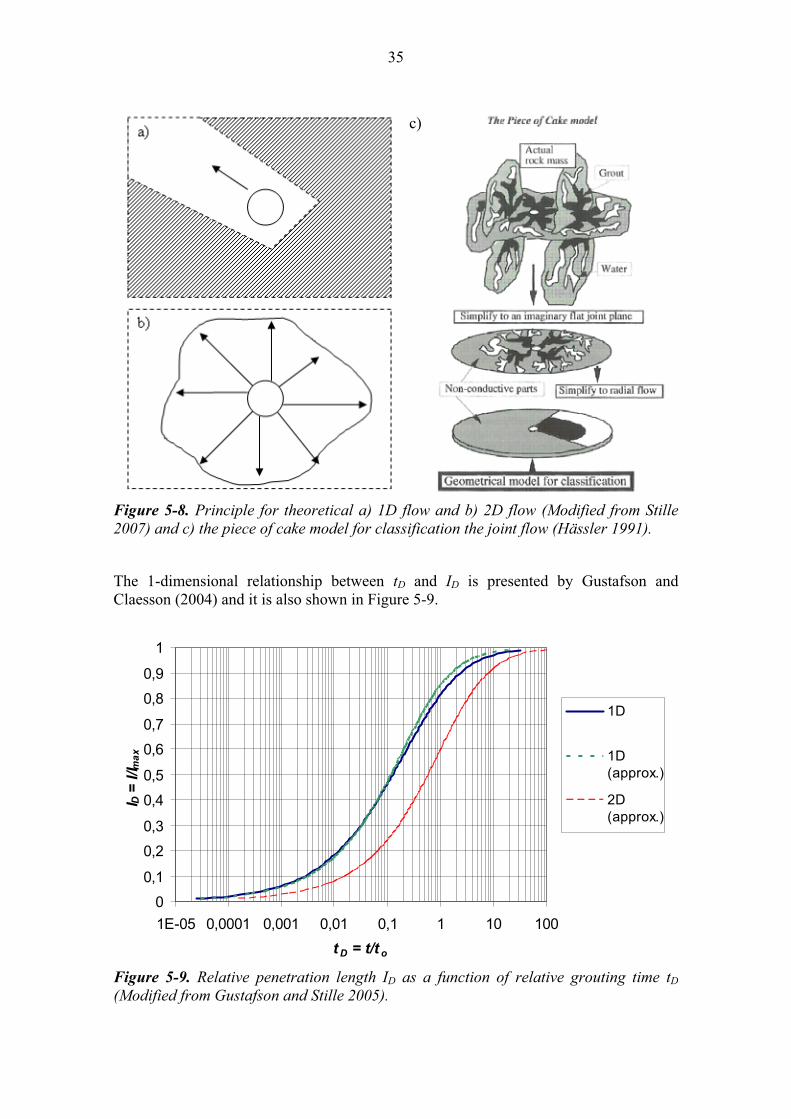
35
c)
Figure 5-8. Principle for theoretical a) 1D flow and b) 2D flow (Modified from Stille
2007) and c) the piece of cake model for classification the joint flow (Hässler 1991).
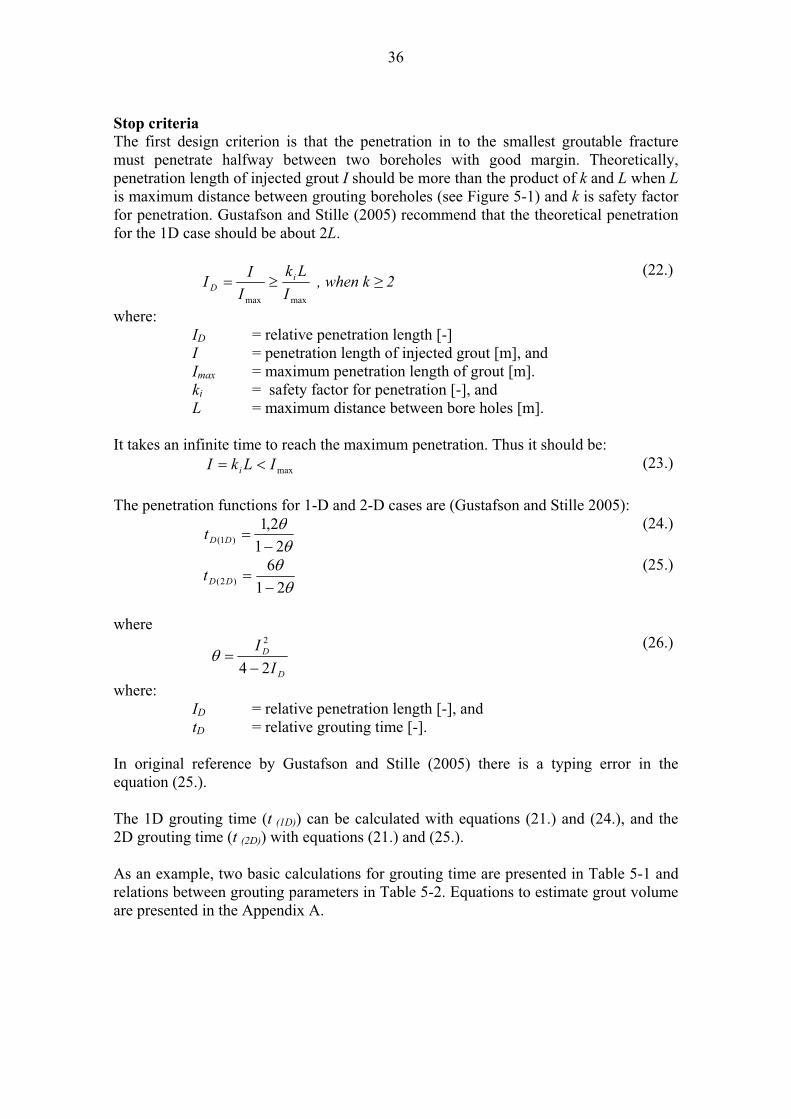
The 1-dimensional relationship between tD and ID is presented by Gustafson and Claesson (2004) and it is also shown in Figure 5-9.
0
0,1
0,2
0,3
0,4
0,5
0,6
0,7
0,8
0,9
1
1E-05 0,0001 0,001 0,01 0,1 1 10 100
t D = t/t o
I D =
I/I m
ax
1D
1D(approx.)
2D(approx.)
Figure 5-9. Relative penetration length ID as a function of relative grouting time tD
(Modified from Gustafson and Stille 2005).
36
Stop criteria The first design criterion is that the penetration in to the smallest groutable fracture must penetrate halfway between two boreholes with good margin. Theoretically, penetration length of injected grout I should be more than the product of k and L when Lis maximum distance between grouting boreholes (see Figure 5-1) and k is safety factor for penetration. Gustafson and Stille (2005) recommend that the theoretical penetration for the 1D case should be about 2L.
maxmax I
Lk
I
II i
D , when k 2 (22.)
where:ID = relative penetration length [-] I = penetration length of injected grout [m], and Imax = maximum penetration length of grout [m]. ki = safety factor for penetration [-], and L = maximum distance between bore holes [m].
It takes an infinite time to reach the maximum penetration. Thus it should be:
maxILkI i(23.)
The penetration functions for 1-D and 2-D cases are (Gustafson and Stille 2005):
21
2,1)1( DDt
(24.)
21
6)2( DDt
(25.)
where
D
D
I
I
24
2 (26.)
where:ID = relative penetration length [-], and tD = relative grouting time [-].
In original reference by Gustafson and Stille (2005) there is a typing error in the equation (25.).
The 1D grouting time (t (1D)) can be calculated with equations (21.) and (24.), and the 2D grouting time (t (2D)) with equations (21.) and (25.).
As an example, two basic calculations for grouting time are presented in Table 5-1 and relations between grouting parameters in Table 5-2. Equations to estimate grout volume are presented in the Appendix A.
37
Table 5-1. Grout properties in accordance to grouting parameters.
Title symbol value 1 unit value 2 unit
Yield strength of grout 0 20 Pa 10 Pa
Plastic viscosity of grout µ g 17 mPas 8,5 mPas
hydraulic aperture of fracture b hydr 75 µm 75 µm
Driving pressure for grout (over-pressure) p 3,00 MPa 3,00 MPa
Maximum penetration length of grout I max 5,63 m 11,25 m
Geometrical distance L 2,50 m 2,50 m
Safety factor (k i 2) k i 2 2
Penetration length needed (I =Lk ) I 5 m 5 m
Relative penetration length I D 0,89 0,44
Characteristic grouting time t 0 765,00 s 1530,00 s
Relative grouting time in 1D-case t D (1D) 1,48 0,09
Relative grouting time in 2D-case t D (2D) 7,38 0,44
Stop criteria:Grouting time in 1D-case t (1D) 18,8 min 2,2 min
Grouting time in 2D-case t (2D) 94,2 min 11,1 min
Table 5-2. Relations between grouting parameters (modified and complemented from
Gustafson and Stille 2005).
Rheology Grouting situation Pressure Viscosity
Yieldstrength
Time to reach dm3
Flow at penetration
Maximalpenetration
Reference pg µg 0 t Q Imax
Double pressure 2 pg µg 0 1/3 t 3.5 Q > 2 Imax
Half viscosity pg 0.5 µg 0 0.5 t 2 Q Imax
Double yield strength
pg µg 2 0 3/2 t 0.7 Q 0.5 Imax
Some factors should be taken into consideration: - Only one type of grout mix should be used in one grouting hole, but Kobayashi
and Stille (2007) have presented how to calculate penetration if mix is changed during the grouting.
- The stop criterion is very sensitive to the yield strength of grout. - Criteria for yield strength ( 0) are presented in Chapter 5.3 (page 26). - Equation (11.) is recommended to use for the maximal grouting pressure. It
should be noticed that the method does not take the head loss in hose into account.
- In practice, the grouting pressure (pg) must be kept right from the beginning. Timekeeping for grouting time (t) starts when borehole is filled and the grouting pressure has reached the target level.
- It is uneconomical to grout for longer time than about 3t. If the borehole takes significant amounts of grout after 3t, there are all reasons to stop, since it indicates an unrestricted outflow of grout somewhere in the system (Gustafson and Stille 2005).
38
5.5.4 Comparison and conclusions of the different stop criteria
Conclusions of the stop criteria are aggregated to Table 5-3.
Table 5-3. Conclusions of the stop criteria in tunnel grouting.
Stop criterion / criteria
Pros and cons Suitability
Prevailing practice
Maximum volume (Vmax)and maximum pressure (Pmax).
+ Method is well-known.
+ Results are sometimes excellent.
- Un economical. It is possible that grouting takes much more time and grout than is needed.
- Method is more or less empirical
Grouting designer should be experienced specialist because stop criterion is empirical.
Stop criterion may be uneconomical.
GIN-method Maximum volume (Vmax),maximum pressure (Pmax)and GIN-number.
+ Fast grouting cycle (no WLM recommended).
- No hydrogeological characterisation recommended but grout take is dependent on geology.
- No adequate info how to solve exact definition of the GIN-value.
- Not useable when the joints are very tight (thick grout recommended).
- No analytical theory behind method
The method might work in tunnel grouting, in variable rock conditions. Method could be usable for the first grouting round in order to seal the largest fractures.
Only one experience in tunnel grouting found (Göta Tunnel).
GT-method Grouting time (t). + Gives analytical method to review grout
penetration with relation to stop criterion.
+ Economical. The minimum grouting time can be calculated.
- Limited practical experienced with cement-based grouts.
- Very sensitive to fracture characteristics and grout properties.
- Made demands for the capacity of the grouting equipment: method requires that grouting pressure meets the case during whole grouting time. The capacity of grouting pump and mixer can be a limiting factor.
Useable when fracture-system is simple. For complicated fracture-system further development is needed.
39
5.6 Practical grouting experiences in conditions similar to ONKALO
5.6.1 Grouting experiences under high groundwater pressure
There are many deep tunnels in the world. For example in only Norway at least 23 sub sea road tunnels and 10 sub sea tunnels for water, gas and oil with maximum depths of 56…264 m are excavated (Blindheim et al. 2005). In those tunnels grouting have been one of the sealing methods. Thus, grouting experiences under high groundwater pressure exist, but the problem is a scanty reporting of experiences gained. Only few pieces of information could be found, but the formation of entirety is unfeasible. Therefore only a few grouting experiences are listed below (Table 5-4).
The Åkrafjord tunnel, Norway The Åkrafjord tunnel is 7390 m long traffic tunnel in Norway, overburden is some 600 meters. It was excavated in 1998-1999. Systematic pre-grouting was not planned, but after 2300 meters (horizontal), water at high pressure was encountered. Water pressure was about 4.6 MPa and the total inflow per zone was almost 3 000 – 5 000 l/min. And systematic post-grouting was started. In order to get penetration, a pressure of approx. 7 MPa was needed and W/C –ratio 0.4 and 0.9 were used. The final result for the leakage was 10 dm3/min/100m of tunnel length, which was satisfied (Appendix N).
Table 5-4. Summing up of grouting in few tunnel projects (collected from NFF 2004
and Klüver et al. 2004).
Tunnel project Bragernes, Norway Lunner (øst), Norway
Year completed 2001 2003 Purpose of tunnel traffic traffic Depth 10… 150 m 10…300 m Total length 2310 m 3800 m Requirement water inflow 10…30 dm3 / min / 100 m of
tunnel10…20 dm3 / min / 100 m of tunnel
Grouting strategy systematic pre-grouting systematic pre-grouting Drill hole quantity 0.57 m / m2 (1 1.26 m / m2 (1
Grouting material Standard cement with micro silica (Rapid Rp 38) from Norcem
Standard cement and Ultrafin 12 from Scancem
Additives Rescon HP 2-3 % Grout Aid 5-23 %, SP40 2-3 %
W/C-ratio 1.0…0.5 2.0…0.5 Pumping pressure 2…9 MPa 5…7 MPa Mass quantity 81 kg/borehole-m 30 kg/borehole-m Results of grouting (water inflow)
10.1 dm3 / min / 100 m 8.4 dm3 / min / 100 m
(1 m2 tunnel is the entire tunnel circumference multiplied with full tunnel length
40
The Eiksund tunnel, Norway The Eiksund traffic tunnel will be the world’s deepest sub sea tunnel (due for completion on February 2008). The tunnel is 7765 m long and dives to -287 m beneath the surface of the fjord, maximum rock cover is ca. 500 m. Acceptable water inflow into the tunnel is less than 30 dm3/min/100m. During the excavation, four 26 m long probe holes are systematically drilled (after each 4 rounds) and normally grouting is carried out if the total inflow from the probe holes exceeds 20 dm3/min. When the grouting is needed, the arrangements of the grouting holes are based on inflow from the different probe holes. A grouting fan consist of 26…30 holes of 23…26 m length each, and is inclined 15° from the tunnel. Grouting pressures up to 100 bars are used. The estimated grout intake was 333 kg / meter of tunnel and the measured water inflow during the construction was approx. 40 % acceptable level which means ca. 12 dm3/min/100m (Appendix O).
5.6.2 Grouting experiences with strict inflow target
Strict inflow targets are currently quite common in traffic tunnels. As it is stated in the previous Chapter (5.6.1), the problem is a scanty literature about experiences.
Table 5-5. Summing up of grouting in two tunnel projects (collected from Hellerslien
2000, NFF 2004, and Klüver et al. 2004).
Tunnel project Baneheia, Norway Lundby, Sweden
Year completed 2001 1998 Purpose of tunnel traffic traffic Depth 20…40 m 5…35 m Total length 3000 m 2060 m Requirement for tightness 60 dm3 / min total 0.5…2.5 dm3 / min / 100 m of
tunnelGrouting strategy systematic pre-grouting systematic pre-grouting
(continuous) Drill hole quantity 1.08 m / m2 (1 2.00 m / m2 (1
Grouting material Ulltrafin 12 from Scancem Grouting cement from Cementa
Additives Grout Aid 5-15 %, SP40 2 % Bentonite 3 %, Intraplaster 0.5 %
W/C-ratio 0.9…0.7 3.0…0.5 (0.3 hole filling) Pumping pressure 5…8 MPa 2.5 MPa Mass quantity 9 kg/borehole-m 6 kg/borehole-m Results of grouting (water inflow)
1.8 dm3 / min / 100 m 0.9 dm3 / min / 100 m
(1 m2 tunnel is the entire tunnel circumference multiplied with full tunnel length
41
The Bekkestua tunnel, Norway The Bekkestua tunnel is a 705 m long traffic tunnel in Norway, where the limit of water ingress to tunnel was set as maximum 2 dm3 / min / 100 m of tunnel. A total of 25 pre-grouting holes were drilled (cross-section 68 m2) with a length 21 m in every round, which means over 26000 m of boreholes (Garshol 2003).
If measured leakage was more than 5 dm3 / min per hole, the used grout was normal Portland cement and 2 % of Rheobuild 1000 admixture of water reduction. Maximum grout take per hole was set 4000 kg and maximum grouting pressure 3 MPa. If the water leaking was less than 5 dm3 / min per hole, the used grout was normal Rheocem microcement with 3 % of Rheobuild 1000 as water reducing and dispersing agent. Maximum grout take per hole was set 2000 kg and maximum grouting pressure 3 MPa (Garshol 2003).
A large amount of grout was used: 583 tons of Rheocem 650, 40 tons of Rheocem 900 and 556 tons of Portland cement. The final result for the leakage was ca. 0.7 dm3 / min / 100 m of tunnel. The largest leakage 1.7 dm3/min/100m of tunnel was in the area where only Portland cement was used (Garshol 2003).

42
43
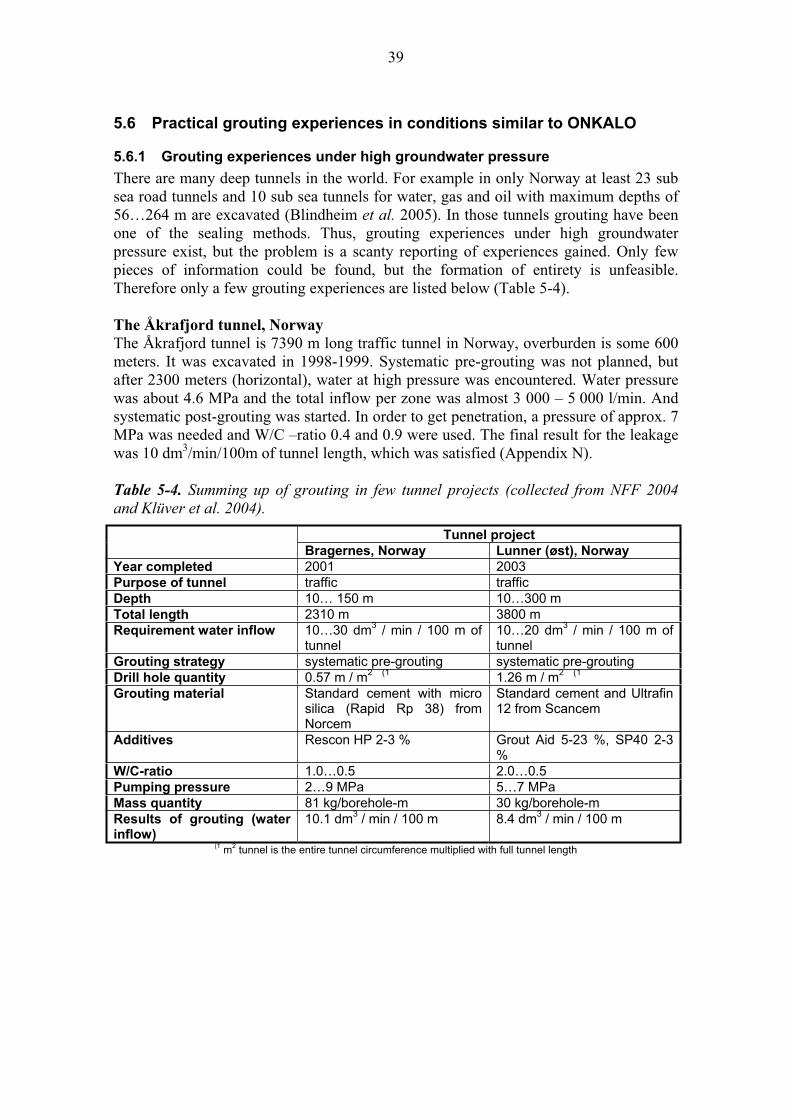
6 FIELD TEST I
Field testing was done as a part of normal pre-grouting. Characterisation work was more detailed compared to the normal procedure and grouting design was different and more testing of grouting material was done during the grouting.
6.1 General
The plan for the field test I was to grout a fan using GIN-principle or GT-method with low-pH grout. After literature study was done, the GT-method was decided to be used in the field test I, because its analytical method to review grout penetration interested the project. The GIN-principle was not used because the literature study revealed that the exact GIN-value can’t be solved when grouting in tunnels.
The test was arranged 6.-7.3.2007 in Olkiluoto.
6.2 Site description
The test site was at the tunnel chainage 1880 to 1906 in the ONKALO (1880 m from the access tunnel entrance). The overburden in the test site is ca. 190 m and the orientation of the tunnel is ca. 315°.
Figure 6-1. The test site was at the chainage 1880 to 1906.
44
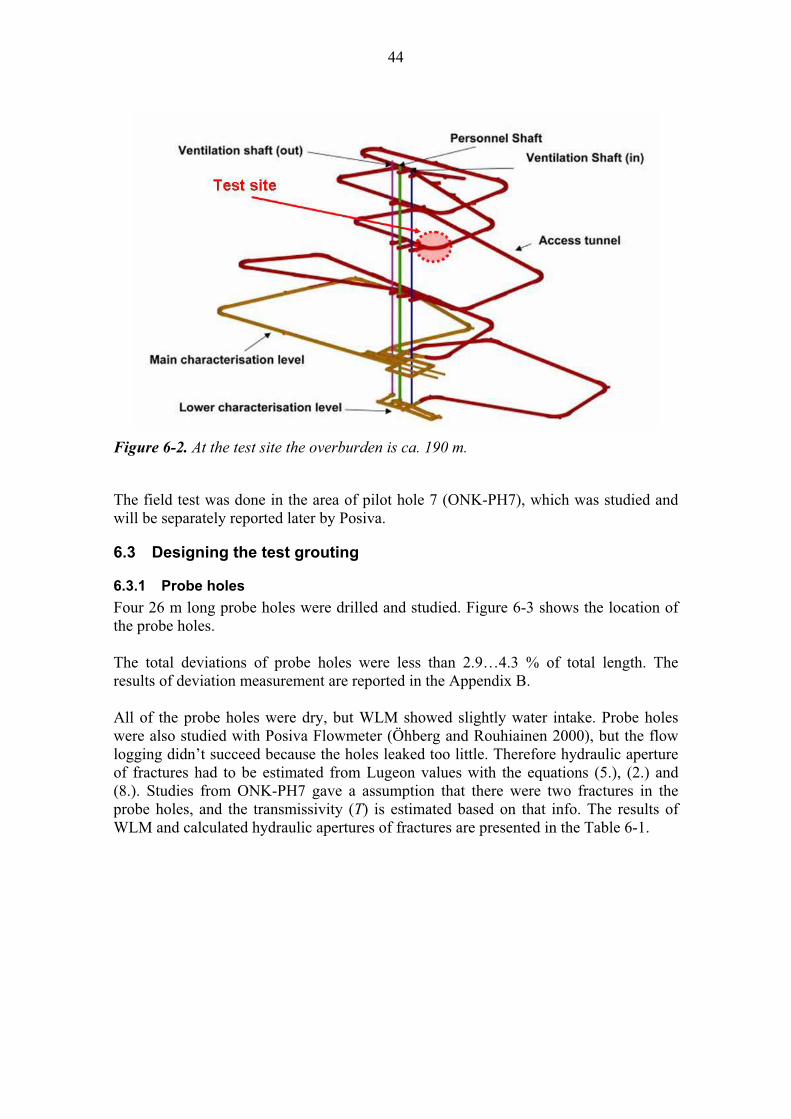
Figure 6-2. At the test site the overburden is ca. 190 m.
The field test was done in the area of pilot hole 7 (ONK-PH7), which was studied and will be separately reported later by Posiva.
6.3 Designing the test grouting
6.3.1 Probe holes
Four 26 m long probe holes were drilled and studied. Figure 6-3 shows the location of the probe holes.
The total deviations of probe holes were less than 2.9…4.3 % of total length. The results of deviation measurement are reported in the Appendix B.
All of the probe holes were dry, but WLM showed slightly water intake. Probe holes were also studied with Posiva Flowmeter (Öhberg and Rouhiainen 2000), but the flow logging didn’t succeed because the holes leaked too little. Therefore hydraulic aperture of fractures had to be estimated from Lugeon values with the equations (5.), (2.) and (8.). Studies from ONK-PH7 gave a assumption that there were two fractures in the probe holes, and the transmissivity (T) is estimated based on that info. The results of WLM and calculated hydraulic apertures of fractures are presented in the Table 6-1.
45
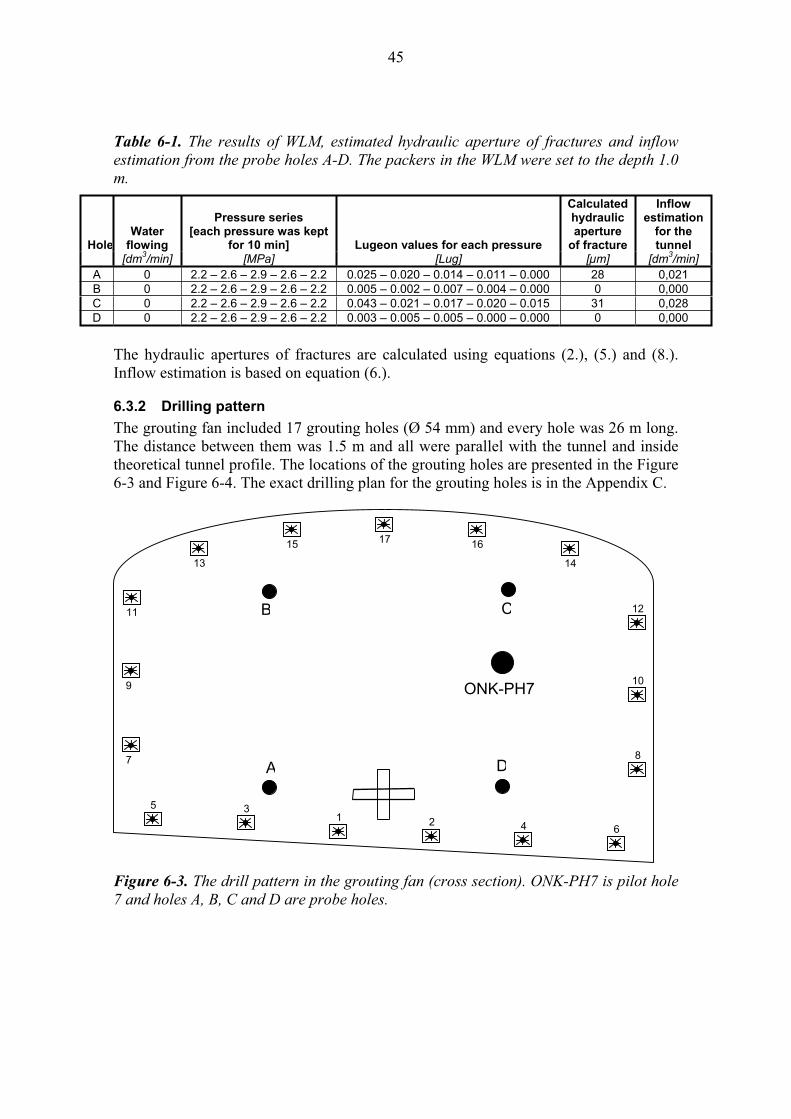
Table 6-1. The results of WLM, estimated hydraulic aperture of fractures and inflow
estimation from the probe holes A-D. The packers in the WLM were set to the depth 1.0
m.
HoleWater
flowing
Pressure series [each pressure was kept
for 10 min] Lugeon values for each pressure
Calculated hydraulic aperture
of fracture
Inflow estimation
for the tunnel
[dm3/min] [MPa] [Lug] [µm] [dm
3/min]
A 0 2.2 – 2.6 – 2.9 – 2.6 – 2.2 0.025 – 0.020 – 0.014 – 0.011 – 0.000 28 0,021 B 0 2.2 – 2.6 – 2.9 – 2.6 – 2.2 0.005 – 0.002 – 0.007 – 0.004 – 0.000 0 0,000 C 0 2.2 – 2.6 – 2.9 – 2.6 – 2.2 0.043 – 0.021 – 0.017 – 0.020 – 0.015 31 0,028 D 0 2.2 – 2.6 – 2.9 – 2.6 – 2.2 0.003 – 0.005 – 0.005 – 0.000 – 0.000 0 0,000
The hydraulic apertures of fractures are calculated using equations (2.), (5.) and (8.). Inflow estimation is based on equation (6.).
6.3.2 Drilling pattern
The grouting fan included 17 grouting holes (Ø 54 mm) and every hole was 26 m long. The distance between them was 1.5 m and all were parallel with the tunnel and inside theoretical tunnel profile. The locations of the grouting holes are presented in the Figure 6-3 and Figure 6-4. The exact drilling plan for the grouting holes is in the Appendix C.
Figure 6-3. The drill pattern in the grouting fan (cross section). ONK-PH7 is pilot hole
7 and holes A, B, C and D are probe holes.
B C
DA
ONK-PH7
14
161715
13
11
9
7
5 31 2 4 6
10
8
12
46
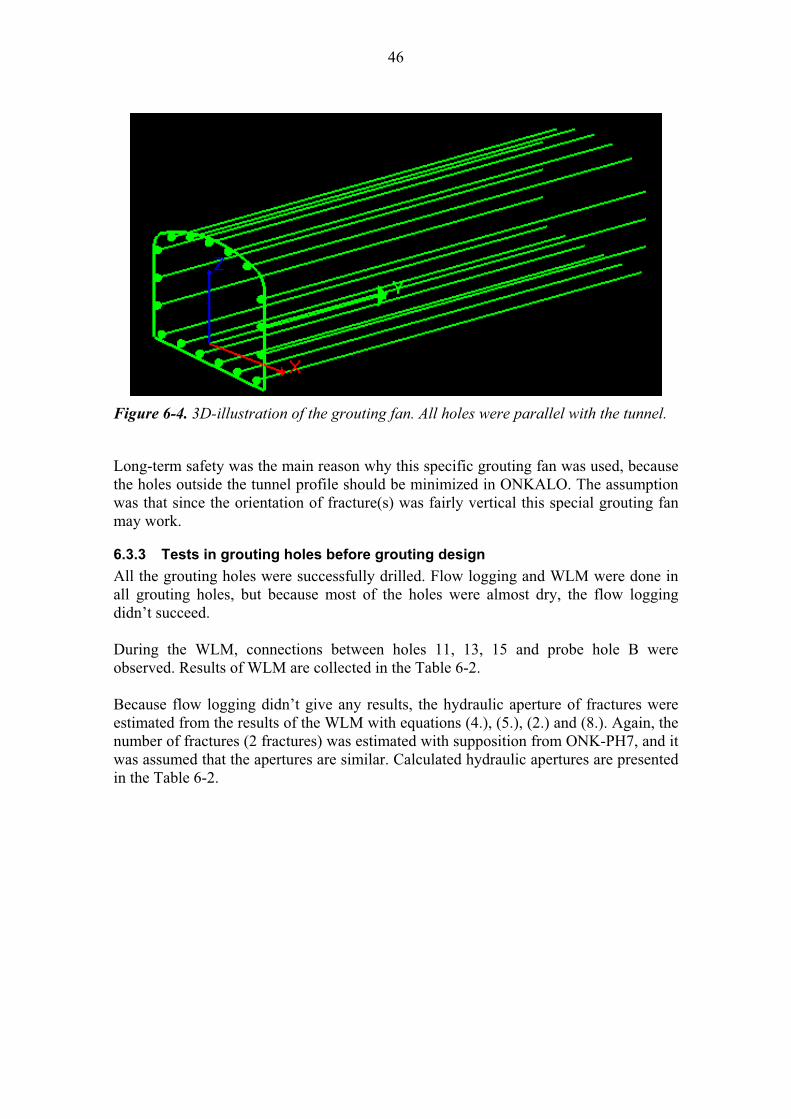
Figure 6-4. 3D-illustration of the grouting fan. All holes were parallel with the tunnel.
Long-term safety was the main reason why this specific grouting fan was used, because the holes outside the tunnel profile should be minimized in ONKALO. The assumption was that since the orientation of fracture(s) was fairly vertical this special grouting fan may work.
6.3.3 Tests in grouting holes before grouting design
All the grouting holes were successfully drilled. Flow logging and WLM were done in all grouting holes, but because most of the holes were almost dry, the flow logging didn’t succeed.
During the WLM, connections between holes 11, 13, 15 and probe hole B were observed. Results of WLM are collected in the Table 6-2.
Because flow logging didn’t give any results, the hydraulic aperture of fractures were estimated from the results of the WLM with equations (4.), (5.), (2.) and (8.). Again, the number of fractures (2 fractures) was estimated with supposition from ONK-PH7, and it was assumed that the apertures are similar. Calculated hydraulic apertures are presented in the Table 6-2.
47
Table 6-2. The results of the WLM and the estimated hydraulic aperture of fractures
from grouting holes 1…17. The packers were set to the depth 1.0 m.
HoleWater
flowing
Pressure series [each pressure was kept
for 10 min] Lugeon values for each pressure
Hydraulic aperture
of fracture no [dm
3/min] [MPa] [Lug] [µm]
1 0 2.2 – 2.6 – 2.9 – 2.6 – 2.2 0.003 – 0.002 - 0.001 - 0.000 - 0.000 13 2 0 2.2 – 2.6 – 2.9 – 2.6 – 2.2 0.003 – 0.000 - 0.000 - 0.000 - 0.000 0 3 0 2.2 – 2.6 – 2.9 – 2.6 – 2.2 0.027 – 0.017 - 0.019 - 0.014 - 0.016 30 4 0 2.2 – 2.6 – 2.9 – 2.6 – 2.2 0.004 – 0.002 - 0.001 - 0.000 - 0.000 12 5 0 2.2 – 2.6 – 2.9 – 2.6 – 2.2 0.002 – 0.004 - 0.004 - 0.000 - 0.000 16 6 0 2.2 – 2.6 – 2.9 – 2.6 – 2.2 0.000 – 0.003 - 0.004 - 0.000 - 0.000 18 7 0 2.2 – 2.6 – 2.9 – 2.6 – 2.2 0.024 – 0.010 - 0.015 - 0.000 - 0.007 25 8 0 2.2 – 2.6 – 2.9 – 2.6 – 2.2 0.011 – 0.004 - 0.003 - 0.000 - 0.000 19 9 0 2.2 – 2.6 – 2.9 – 2.6 – 2.2 0.010 – 0.009 - 0.003 - 0.000 - 0.000 19 10 0 2.2 – 2.6 – 2.9 – 2.6 – 2.2 0.057 – 0.037 - 0.022 - 0.007 - 0.002 15 11 0.007 2.2 – 2.6 – 2.9 – 2.6 – 2.2 0.024 – 0.015 - 0.007 - 0.000 - 0.000 24 12 0 2.2 – 2.6 – 2.9 – 2.6 – 2.2 0.007 – 0.009 - 0.007 - 0.000 - 0.000 24 13 0.006 2.2 – 2.6 – 2.9 – 2.6 – 2.2 0.013 – 0.019 - 0.015 - 0.006 - 0.001 12 14 0 2.2 – 2.6 – 2.9 – 2.6 – 2.2 0.011 – 0.010 - 0.008 - 0.000 - 0.000 25 15 0 2.2 – 2.6 – 2.9 – 2.6 – 2.2 0.019 – 0.011 - 0.009 - 0.000 - 0.000 28 16 0.0050 2.2 – 2.6 – 2.9 – 2.6 – 2.2 0.012 – 0.006 - 0.004 - 0.000 - 0.000 20 17 0.0035 2.2 – 2.6 – 2.9 – 2.6 – 2.2 0.012 – 0.010 - 0.009 - 0.004 - 0.007 24
6.3.4 Grouting materials
Grout-mix UF-41-14-4 was used in the field test and recipe for the mix is presented in the grouting plan (Appendix D). Based on earlier laboratory tests (Sievänen et al. 2006), the yield strength of that grout ( 0) was assumed to be 13 Pa and the plastic viscosity (µg) was assumed to be 12 mPas. There were no results from batch mixing tests in the field using Posiva´s new grouting equipment available for that grout. Thus, the results of material parameters of the grout were based on rheology measurements in the laboratory.
Grout properties observed during this field test are reported by Ranta-Korpi et al.(2007).
6.3.5 Penetration length and grouting pressure
As it is stated in the Chapter 5.1 (page 23), the minimum thickness for grouted zone should be more than the length of the possible rock bolt (see Figure 5-1). Typically in the ONKALO rock bolts are 3.0 m, and therefore the minimum length of grout penetration should be 3.0 m outside the tunnel profile. Because of the placing of the grouting holes, the needed penetration length (I) was set to be 3.2 m for grouting holes 1…12 and 3.0 m for grouting holes 13…17.
The maximum grouting pressure was set with equation (11.) and the minimum pressure with the assumption that grouting pressure must be more than 2pw. The hydraulic head was ca. 180 m and overburden ca. 190 m, therefore the suitable grouting pressure was something between 3.5…11.2 MPa.
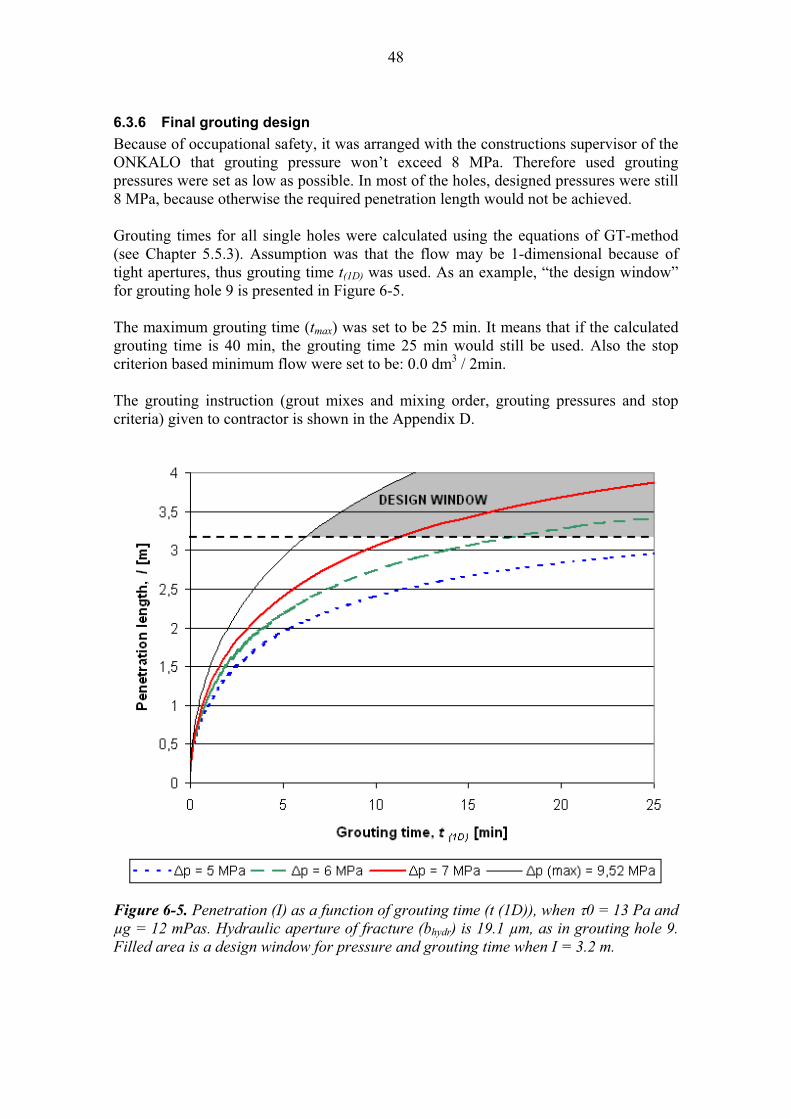
48
6.3.6 Final grouting design
Because of occupational safety, it was arranged with the constructions supervisor of the ONKALO that grouting pressure won’t exceed 8 MPa. Therefore used grouting pressures were set as low as possible. In most of the holes, designed pressures were still 8 MPa, because otherwise the required penetration length would not be achieved.
Grouting times for all single holes were calculated using the equations of GT-method (see Chapter 5.5.3). Assumption was that the flow may be 1-dimensional because of tight apertures, thus grouting time t(1D) was used. As an example, “the design window” for grouting hole 9 is presented in Figure 6-5.
The maximum grouting time (tmax) was set to be 25 min. It means that if the calculated grouting time is 40 min, the grouting time 25 min would still be used. Also the stop criterion based minimum flow were set to be: 0.0 dm3 / 2min.
The grouting instruction (grout mixes and mixing order, grouting pressures and stop criteria) given to contractor is shown in the Appendix D.
Figure 6-5. Penetration (I) as a function of grouting time (t (1D)), when 0 = 13 Pa and
µg = 12 mPas. Hydraulic aperture of fracture (bhydr) is 19.1 µm, as in grouting hole 9.
Filled area is a design window for pressure and grouting time when I = 3.2 m.

49
6.3.7 Plan for evaluating the grouting result
It was planned that few control holes will be drilled and studied. The placement of control holes was planned to be designed after grouting when the grout takes in each hole will be known. From the control holes the results of grouting, and especially the penetration lengths of the grout, can be detected.
Also leakage mapping (see Chapter 6.4.4) will be done after excavation.
6.4 Results of the grouting
6.4.1 Grouting
The grouting was done using Posiva’s new grouting equipment, which has been designed to be used under high groundwater pressure (e.g. maximum pumping pressure is 20 MPa). Consequently, the designed pressures were not a problem to the equipment.
Grouting started from the holes no. 13 and 15. A few minutes after the pressure had reached the target level, the grout flowed out from the holes no. 16 and 14, and eventually from the holes 8, 9, 10, 12, B, C and also from the ONK-PH7 (see Figure 6-7). Nevertheless, the grouting was continued without interruption, but five minutes before the stop criterion, the grouting in the hole no. 13 had to be stopped because grout leaked to the drift (see Figure 6-8).
Figure 6-6. Posiva’s new grouting equipment (mixers, agitators and pumps made by
Häny) was used in the test.
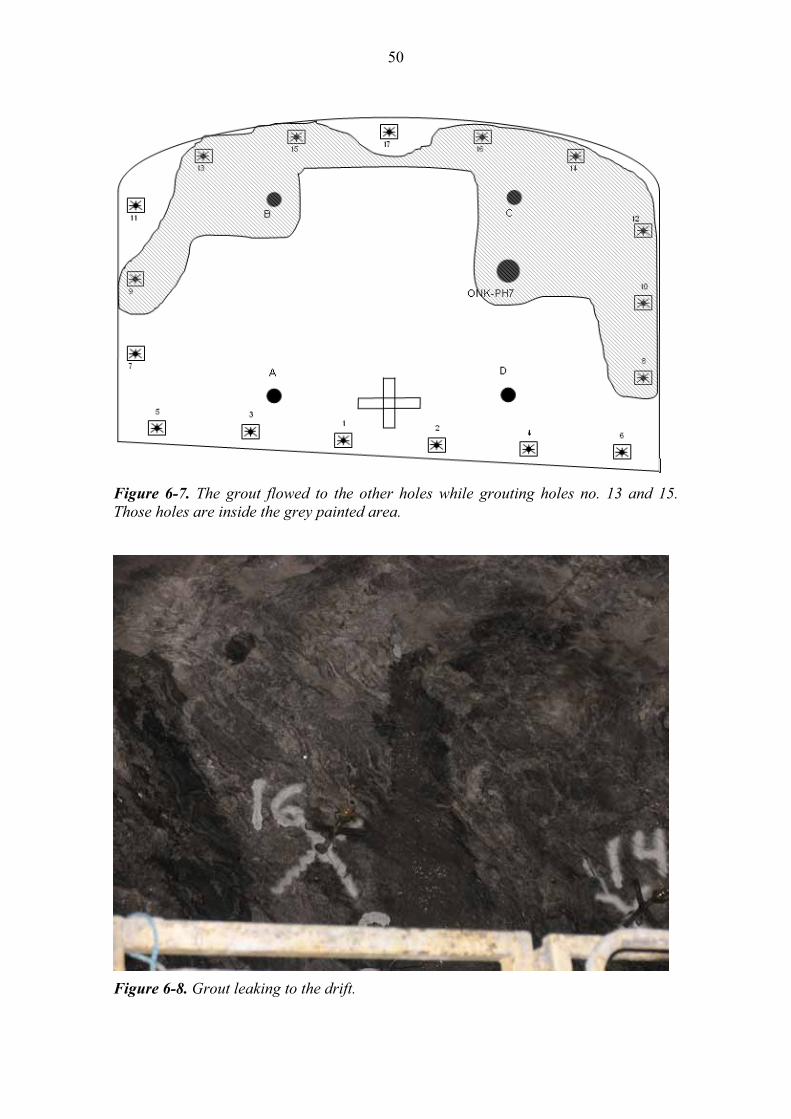
50
Figure 6-7. The grout flowed to the other holes while grouting holes no. 13 and 15.
Those holes are inside the grey painted area.
Figure 6-8. Grout leaking to the drift.
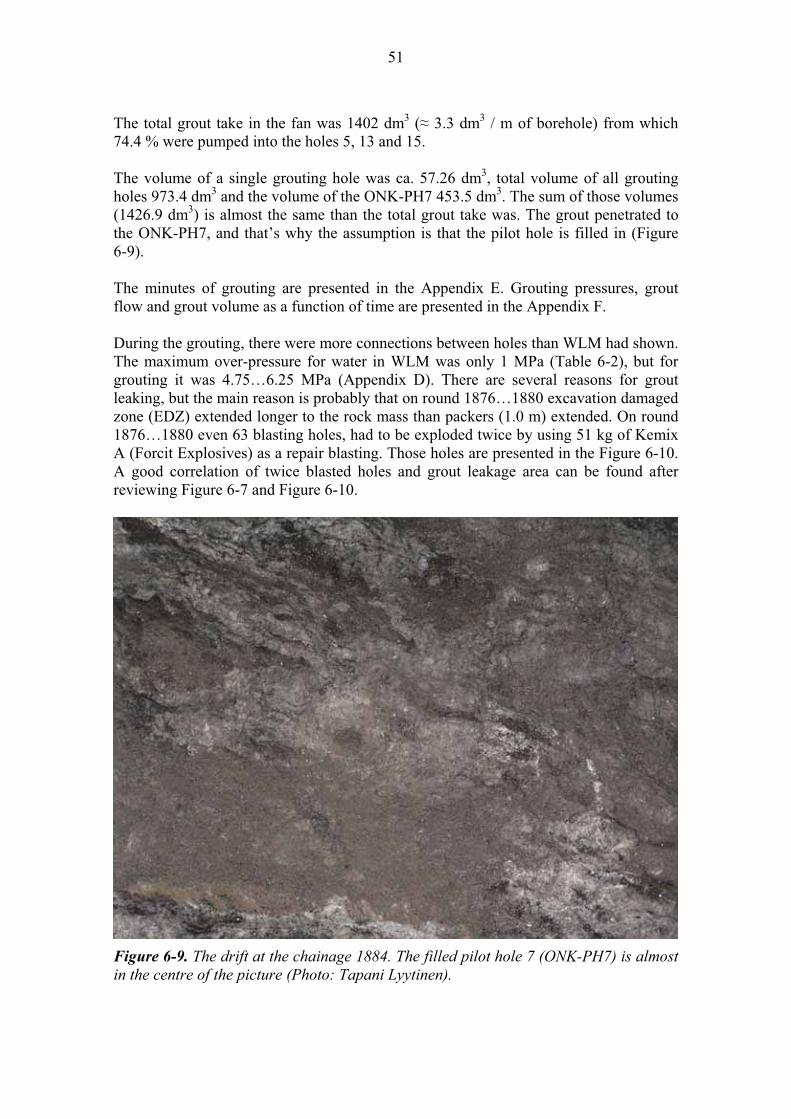
51
The total grout take in the fan was 1402 dm3 ( 3.3 dm3 / m of borehole) from which 74.4 % were pumped into the holes 5, 13 and 15.
The volume of a single grouting hole was ca. 57.26 dm3, total volume of all grouting holes 973.4 dm3 and the volume of the ONK-PH7 453.5 dm3. The sum of those volumes (1426.9 dm3) is almost the same than the total grout take was. The grout penetrated to the ONK-PH7, and that’s why the assumption is that the pilot hole is filled in (Figure 6-9).
The minutes of grouting are presented in the Appendix E. Grouting pressures, grout flow and grout volume as a function of time are presented in the Appendix F.
During the grouting, there were more connections between holes than WLM had shown. The maximum over-pressure for water in WLM was only 1 MPa (Table 6-2), but for grouting it was 4.75…6.25 MPa (Appendix D). There are several reasons for grout leaking, but the main reason is probably that on round 1876…1880 excavation damaged zone (EDZ) extended longer to the rock mass than packers (1.0 m) extended. On round 1876…1880 even 63 blasting holes, had to be exploded twice by using 51 kg of Kemix A (Forcit Explosives) as a repair blasting. Those holes are presented in the Figure 6-10. A good correlation of twice blasted holes and grout leakage area can be found after reviewing Figure 6-7 and Figure 6-10.
Figure 6-9. The drift at the chainage 1884. The filled pilot hole 7 (ONK-PH7) is almost
in the centre of the picture (Photo: Tapani Lyytinen).
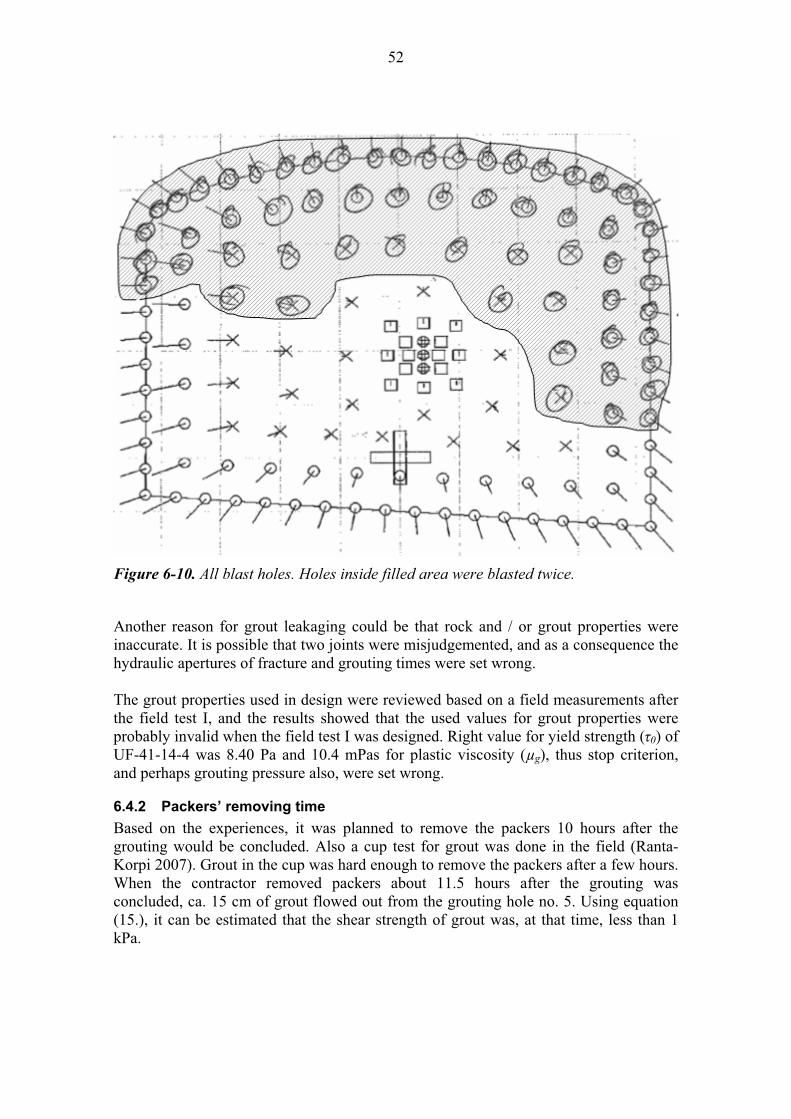
52
Figure 6-10. All blast holes. Holes inside filled area were blasted twice.
Another reason for grout leakaging could be that rock and / or grout properties were inaccurate. It is possible that two joints were misjudgemented, and as a consequence the hydraulic apertures of fracture and grouting times were set wrong.
The grout properties used in design were reviewed based on a field measurements after the field test I, and the results showed that the used values for grout properties were probably invalid when the field test I was designed. Right value for yield strength ( 0) of UF-41-14-4 was 8.40 Pa and 10.4 mPas for plastic viscosity (µg), thus stop criterion, and perhaps grouting pressure also, were set wrong.
6.4.2 Packers’ removing time
Based on the experiences, it was planned to remove the packers 10 hours after the grouting would be concluded. Also a cup test for grout was done in the field (Ranta-Korpi 2007). Grout in the cup was hard enough to remove the packers after a few hours. When the contractor removed packers about 11.5 hours after the grouting was concluded, ca. 15 cm of grout flowed out from the grouting hole no. 5. Using equation (15.), it can be estimated that the shear strength of grout was, at that time, less than 1 kPa.
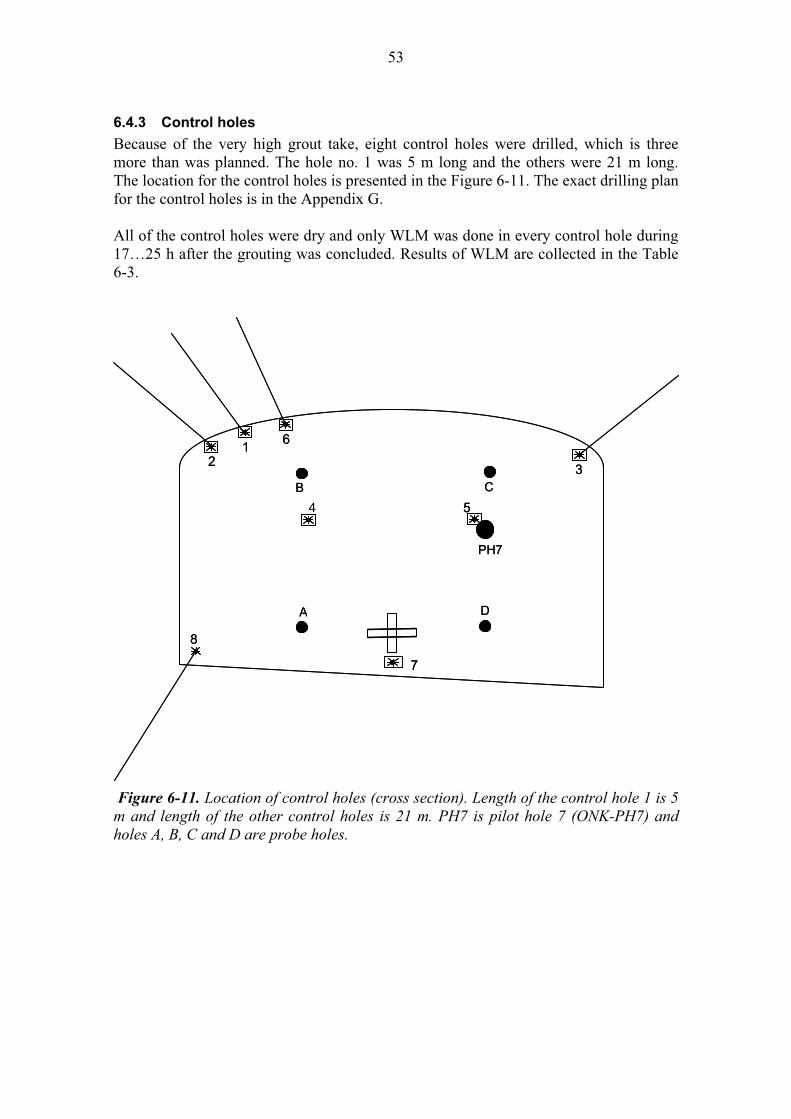
53
6.4.3 Control holes
Because of the very high grout take, eight control holes were drilled, which is three more than was planned. The hole no. 1 was 5 m long and the others were 21 m long. The location for the control holes is presented in the Figure 6-11. The exact drilling plan for the control holes is in the Appendix G.
All of the control holes were dry and only WLM was done in every control hole during 17…25 h after the grouting was concluded. Results of WLM are collected in the Table 6-3.
Figure 6-11. Location of control holes (cross section). Length of the control hole 1 is 5
m and length of the other control holes is 21 m. PH7 is pilot hole 7 (ONK-PH7) and
holes A, B, C and D are probe holes.
B C
DA
PH7
3
5
61
2
8
4
7
B C
DA
PH7
3
5
61
2
8
7
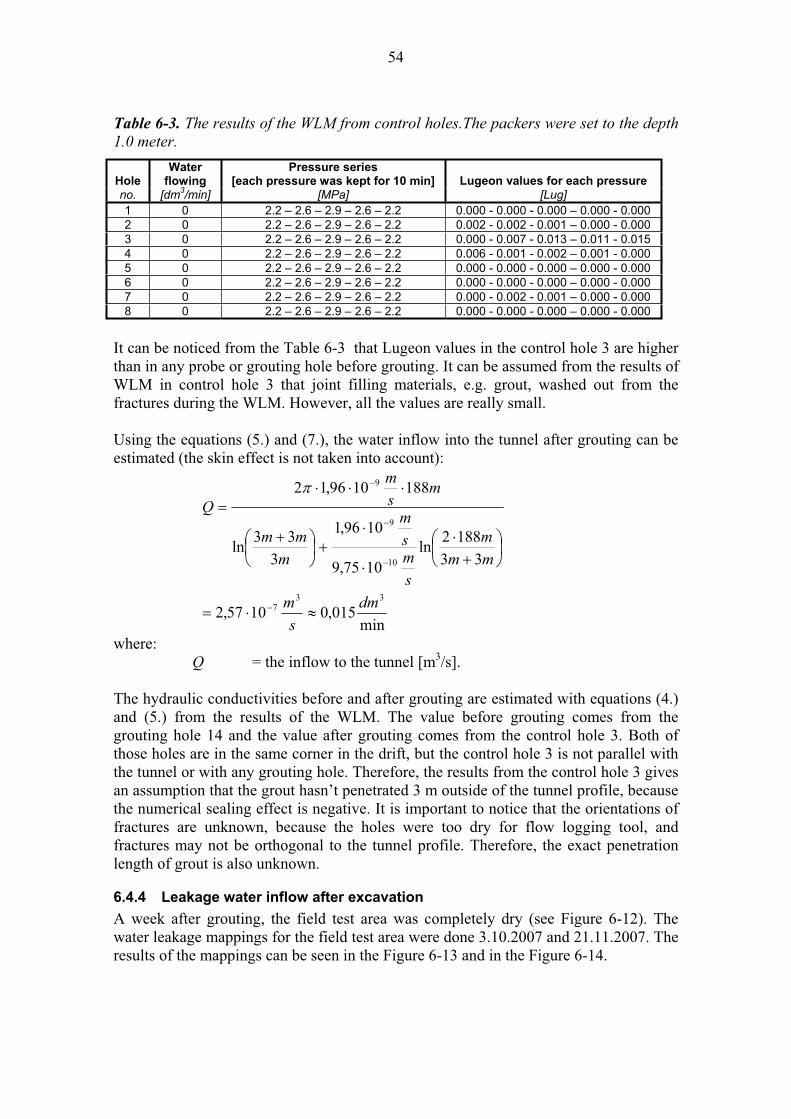
54
Table 6-3. The results of the WLM from control holes.The packers were set to the depth
1.0 meter.
HoleWater
flowing Pressure series
[each pressure was kept for 10 min] Lugeon values for each pressure no. [dm
3/min] [MPa] [Lug]
1 0 2.2 – 2.6 – 2.9 – 2.6 – 2.2 0.000 - 0.000 - 0.000 – 0.000 - 0.000 2 0 2.2 – 2.6 – 2.9 – 2.6 – 2.2 0.002 - 0.002 - 0.001 – 0.000 - 0.000 3 0 2.2 – 2.6 – 2.9 – 2.6 – 2.2 0.000 - 0.007 - 0.013 – 0.011 - 0.015 4 0 2.2 – 2.6 – 2.9 – 2.6 – 2.2 0.006 - 0.001 - 0.002 – 0.001 - 0.000 5 0 2.2 – 2.6 – 2.9 – 2.6 – 2.2 0.000 - 0.000 - 0.000 – 0.000 - 0.000 6 0 2.2 – 2.6 – 2.9 – 2.6 – 2.2 0.000 - 0.000 - 0.000 – 0.000 - 0.000 7 0 2.2 – 2.6 – 2.9 – 2.6 – 2.2 0.000 - 0.002 - 0.001 – 0.000 - 0.000 8 0 2.2 – 2.6 – 2.9 – 2.6 – 2.2 0.000 - 0.000 - 0.000 – 0.000 - 0.000
It can be noticed from the Table 6-3 that Lugeon values in the control hole 3 are higher than in any probe or grouting hole before grouting. It can be assumed from the results of WLM in control hole 3 that joint filling materials, e.g. grout, washed out from the fractures during the WLM. However, all the values are really small.
Using the equations (5.) and (7.), the water inflow into the tunnel after grouting can be estimated (the skin effect is not taken into account):
min015,01057,2
33
1882ln
1075,9
1096,1
3
33ln
1881096,12
337
10
9
9
dm
s
m
mm
m
s
ms
m
m
mm
ms
m
Q
where:Q = the inflow to the tunnel [m3/s].
The hydraulic conductivities before and after grouting are estimated with equations (4.) and (5.) from the results of the WLM. The value before grouting comes from the grouting hole 14 and the value after grouting comes from the control hole 3. Both of those holes are in the same corner in the drift, but the control hole 3 is not parallel with the tunnel or with any grouting hole. Therefore, the results from the control hole 3 gives an assumption that the grout hasn’t penetrated 3 m outside of the tunnel profile, because the numerical sealing effect is negative. It is important to notice that the orientations of fractures are unknown, because the holes were too dry for flow logging tool, and fractures may not be orthogonal to the tunnel profile. Therefore, the exact penetration length of grout is also unknown.
6.4.4 Leakage water inflow after excavation
A week after grouting, the field test area was completely dry (see Figure 6-12). The water leakage mappings for the field test area were done 3.10.2007 and 21.11.2007. The results of the mappings can be seen in the Figure 6-13 and in the Figure 6-14.
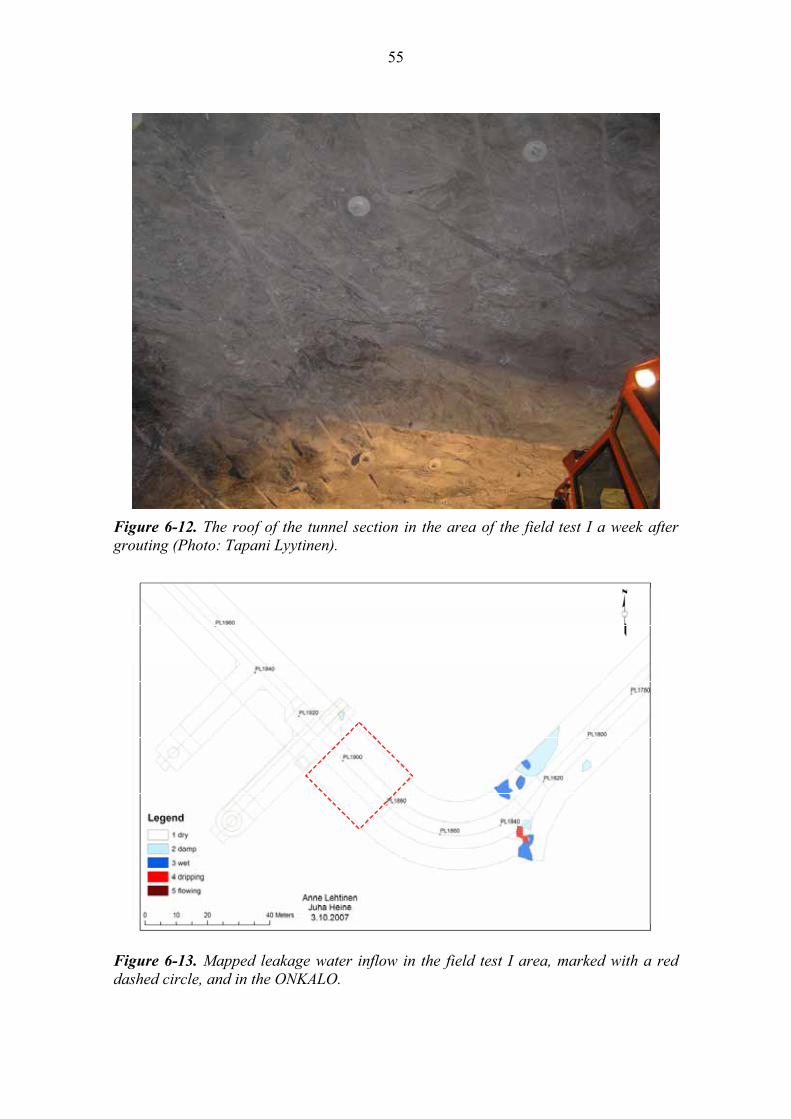
55
Figure 6-12. The roof of the tunnel section in the area of the field test I a week after
grouting (Photo: Tapani Lyytinen).
Figure 6-13. Mapped leakage water inflow in the field test I area, marked with a red
dashed circle, and in the ONKALO.
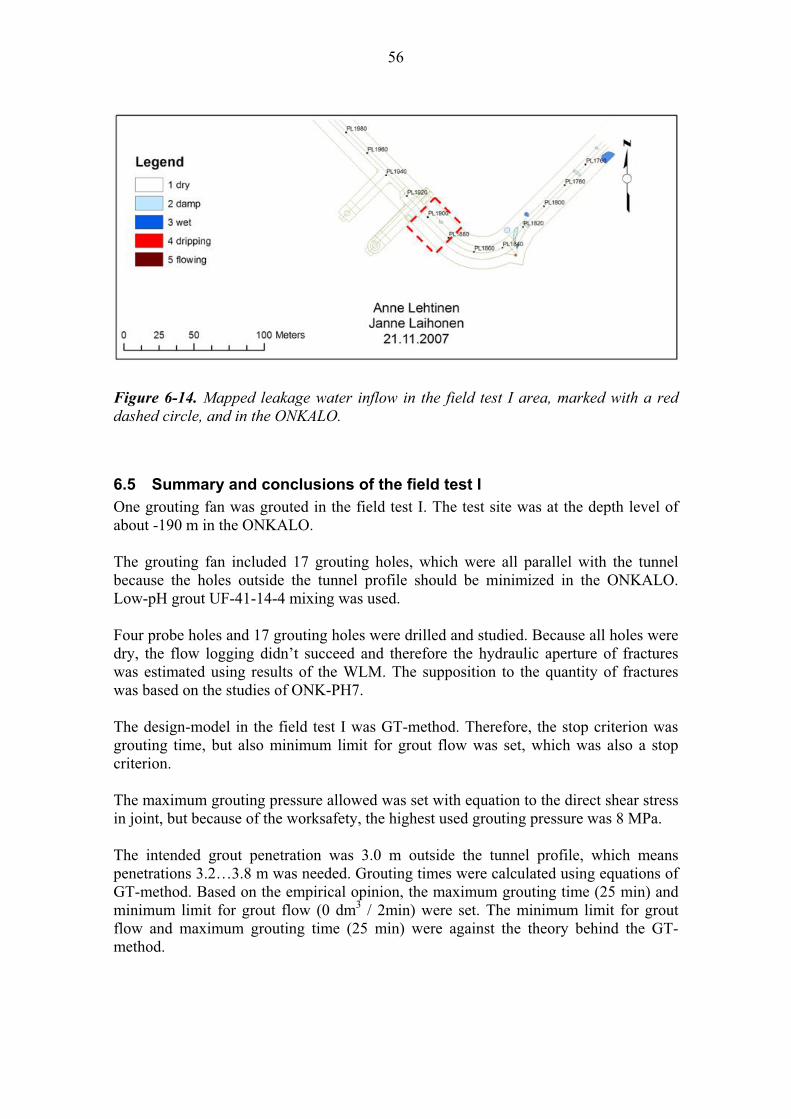
56
Figure 6-14. Mapped leakage water inflow in the field test I area, marked with a red
dashed circle, and in the ONKALO.
6.5 Summary and conclusions of the field test I
One grouting fan was grouted in the field test I. The test site was at the depth level of about -190 m in the ONKALO.
The grouting fan included 17 grouting holes, which were all parallel with the tunnel because the holes outside the tunnel profile should be minimized in the ONKALO. Low-pH grout UF-41-14-4 mixing was used.
Four probe holes and 17 grouting holes were drilled and studied. Because all holes were dry, the flow logging didn’t succeed and therefore the hydraulic aperture of fractures was estimated using results of the WLM. The supposition to the quantity of fractures was based on the studies of ONK-PH7.
The design-model in the field test I was GT-method. Therefore, the stop criterion was grouting time, but also minimum limit for grout flow was set, which was also a stop criterion.
The maximum grouting pressure allowed was set with equation to the direct shear stress in joint, but because of the worksafety, the highest used grouting pressure was 8 MPa.
The intended grout penetration was 3.0 m outside the tunnel profile, which means penetrations 3.2…3.8 m was needed. Grouting times were calculated using equations of GT-method. Based on the empirical opinion, the maximum grouting time (25 min) and minimum limit for grout flow (0 dm3 / 2min) were set. The minimum limit for grout flow and maximum grouting time (25 min) were against the theory behind the GT-method.
57
A few minutes after the pressure had reached the target level in the first two holes, the grout started to flow out from the other grouting holes. All in all, the grout flowed out from six different grouting holes, two probe holes and from the pilot hole ONK-PH7. During the grouting, in contrast to results of WLM, there were much more connections between the holes than was expected. It is important to notice that maximum over-pressure for water in WLM was only 1 MPa and for grouting it was 4.75…6.25 MPa. Therefore, further study for pressures of WLM in deep sound rock is needed.
The total grout take was 1.4 m3, and almost 75 % from that was in three grouting holes. Assumption is that the grout flowed to the probe holes and to the pilot hole ONK-PH7, and filled them in.
The grout properties were reviewed after the field test I, and the results showed that the right value for the yield strength seemed to be almost half smaller than the value used in grouting time calculations, keeping in mind that GT-method is very sensitive to grout properties.
In all probability, the main reason for massive grout back flowing to the tunnel was too short packers versus EDZ. At the chainage 1880, EDZ was outsized because of massive repair blasting on round 1876…1880. In future, if the excavation is out of line with normal case, it is important that contractor informs all the differences to the grouting designer before grouting.
Packers were removed about 11.5 h after the grouting was concluded, which was too early because the grout flowed out from the grouting hole no. 5. For estimating the right time to remove packers it is important to get information about grout strength development.
Eight control holes were drilled and studied after grouting. Only WLM succeeded. The hydraulic conductivity was highest in control hole 3, and it was higher than in any probe or grouting hole.
After excavation, the tunnel section of the field test I (chainage 1880 to 1906) was completely dry, which may indicate that grouting was successful. However, the penetration length of grout is unknown.

58

59
7 FIELD TEST II
7.1 General
The aim of the field test II was to get more grouting experience using GT-method. In this field test, a part of a personnel shaft in the ONKALO was grouted with low-pH grout.
The test grouting was arranged 24.5.2007, 13.6.2007 and 18.7.2007.
7.2 Site description
The field test II was performed in ONKALO’s personnel shaft 1, from the depth level -80 m to the level -110 m. The grouted area in the shaft was ca. -86…-110 m because the length of the packers was 6 m. Level -80…-90 m was grouted earlier, but the results showed that sealing effect wasn’t good enough.
Almost in the middle of the shaft has been earlier drilled, studied and plugged vertical borehole OL-KR24 (Niinimäki 2003, Rautio 2004, Pöllänen et al. 2005). Studies from borehole OL-KR24 gave an assumption that one large fracture will cut all grouting holes.
Figure 7-1. The field Test II was performed in personnel shaft 1 (-86…110m).
60
Figure 7-2. Location of the test site.
7.3 Designing the test grouting
7.3.1 Grouting fan
The plan was to do the grouting in 2 or 3 stages using 13 grouting holes with hole numbers 86…98 (Figure 7-3). Every hole was 30 m long and the distance between them was ca. 1.04 m. All holes were vertical and inside the shaft profile.
The field test was planned to be done in three stages, holes no. 86…88 were drilled, studied and grouted in first stage, holes no. 89…91 in second stage and the holes no. 92…98 in third stage. The first stage aims to seal only largest fractures, and the third stage is to assure the final results of the grouting. The holes 92…98 in third section are grouted only if the sealing effect is not good enough after two earlier grouting rounds.
The grouting holes must be inside the shaft profile in ONKALO because of long-term safety. To minimize the deviations of the grouting holes, the drilling method was core drilling.
Accidentally, the hole no. 88 was drilled to the place where the hole no. 95 should have been. After evaluations and discussions by members of INKE-project, the changed positions of holes 88 and 95 was decided to accept and this was taken into account in grouting design. The real locations of the holes are shown in the Figure 7-4.
61
Figure 7-3. Designed locations of the grouting holes 86…98 (from above). The radius
of the personnel shaft 1 is 2.25 m.
Figure 7-4. The real locations of the grouting holes. Holes no. 86…88 are holes of the
first grouting stage, no. 89…91 are holes of the second section and holes no. 92…98
are grouting holes of third section.
62
7.3.2 Plan for evaluating the grouting result
The results of grouting will be evaluated after every stage. Because the grouted zone after previous round should cover the area where the next grouting holes will be drilled, the evaluating is based on the results of rock characterisation from the holes in next round. The results of grouting after third part will be evaluated from the leakages of water inflow after raise boring.
The methods to characterize holes, and thereby the results of grouting, are the flow logging and the WLM. The WLM is done using a single packer and a one-meter double packer. The idea is to compare results of the same research method before and after grouting.
7.4 First grouting round
7.4.1 Tests in grouting holes before grouting design
Deviation measurement, flow logging and WLM were done in all grouting holes.
The results of the flow logging show (Appendix I) numerous fractures in all holes, and all large apertures were in hole no. 86 (bhydr (max) = 98 µm).
WLM was done in every hole using a single packer and a one-meter double packer. The results of the WLM using single packer are shown in the Table 7-1 and the results using double packer is presented in the Appendix J. The results from both of the WLM-methods are in line with the results of the flow logging.
-110
-105
-100
-95
-90
0 10 20 30 40 50 60 70 80 90 100
Aperture of fracture, bhydr [µm]
Dep
th, Z
[m
]
ONK-PP 86 ONK-PP 87 ONK-PP 88
Figure 7-5. Fracture apertures as function of depth from the flow logging.
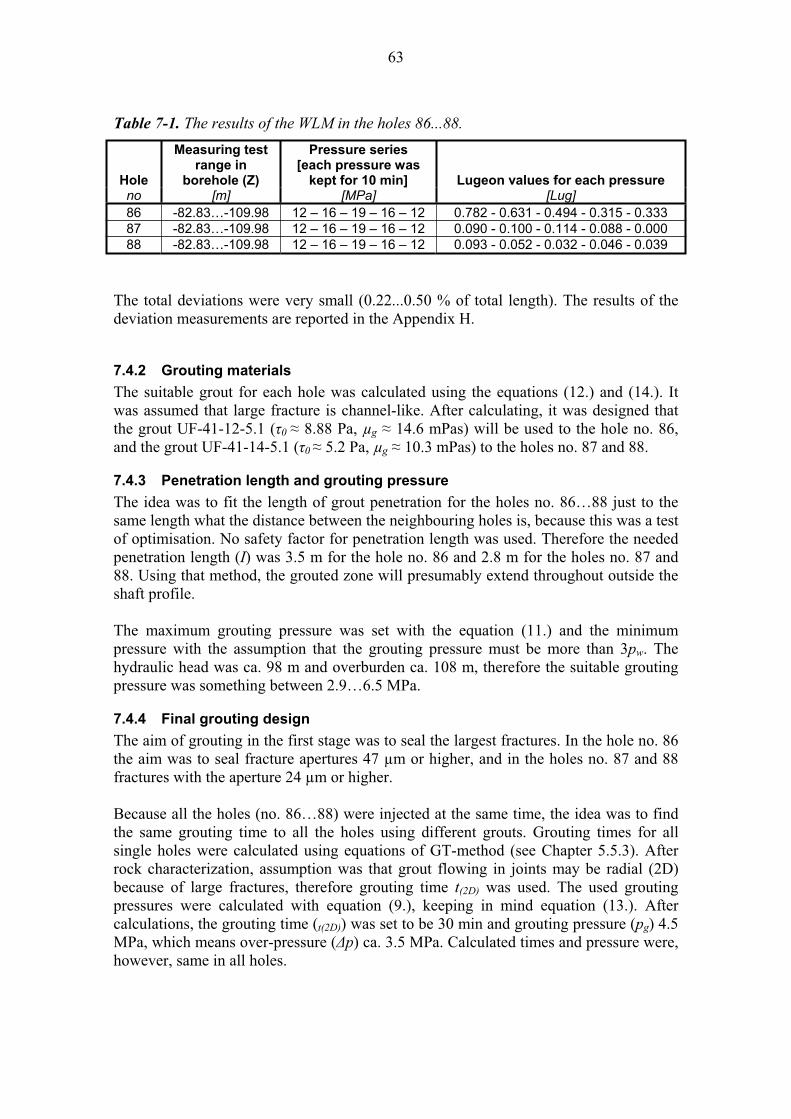
63
Table 7-1. The results of the WLM in the holes 86...88.
Hole
Measuring test range in
borehole (Z)
Pressure series [each pressure was
kept for 10 min] Lugeon values for each pressure no [m] [MPa] [Lug]
86 -82.83…-109.98 12 – 16 – 19 – 16 – 12 0.782 - 0.631 - 0.494 - 0.315 - 0.333 87 -82.83…-109.98 12 – 16 – 19 – 16 – 12 0.090 - 0.100 - 0.114 - 0.088 - 0.000 88 -82.83…-109.98 12 – 16 – 19 – 16 – 12 0.093 - 0.052 - 0.032 - 0.046 - 0.039
The total deviations were very small (0.22...0.50 % of total length). The results of the deviation measurements are reported in the Appendix H.
7.4.2 Grouting materials
The suitable grout for each hole was calculated using the equations (12.) and (14.). It was assumed that large fracture is channel-like. After calculating, it was designed that the grout UF-41-12-5.1 ( 0 8.88 Pa, µg 14.6 mPas) will be used to the hole no. 86, and the grout UF-41-14-5.1 ( 0 5.2 Pa, µg 10.3 mPas) to the holes no. 87 and 88.
7.4.3 Penetration length and grouting pressure
The idea was to fit the length of grout penetration for the holes no. 86…88 just to the same length what the distance between the neighbouring holes is, because this was a test of optimisation. No safety factor for penetration length was used. Therefore the needed penetration length (I) was 3.5 m for the hole no. 86 and 2.8 m for the holes no. 87 and 88. Using that method, the grouted zone will presumably extend throughout outside the shaft profile.
The maximum grouting pressure was set with the equation (11.) and the minimum pressure with the assumption that the grouting pressure must be more than 3pw. The hydraulic head was ca. 98 m and overburden ca. 108 m, therefore the suitable grouting pressure was something between 2.9…6.5 MPa.
7.4.4 Final grouting design
The aim of grouting in the first stage was to seal the largest fractures. In the hole no. 86 the aim was to seal fracture apertures 47 µm or higher, and in the holes no. 87 and 88 fractures with the aperture 24 µm or higher.
Because all the holes (no. 86…88) were injected at the same time, the idea was to find the same grouting time to all the holes using different grouts. Grouting times for all single holes were calculated using equations of GT-method (see Chapter 5.5.3). After rock characterization, assumption was that grout flowing in joints may be radial (2D) because of large fractures, therefore grouting time t(2D) was used. The used grouting pressures were calculated with equation (9.), keeping in mind equation (13.). After calculations, the grouting time (t(2D)) was set to be 30 min and grouting pressure (pg) 4.5 MPa, which means over-pressure ( p) ca. 3.5 MPa. Calculated times and pressure were, however, same in all holes.
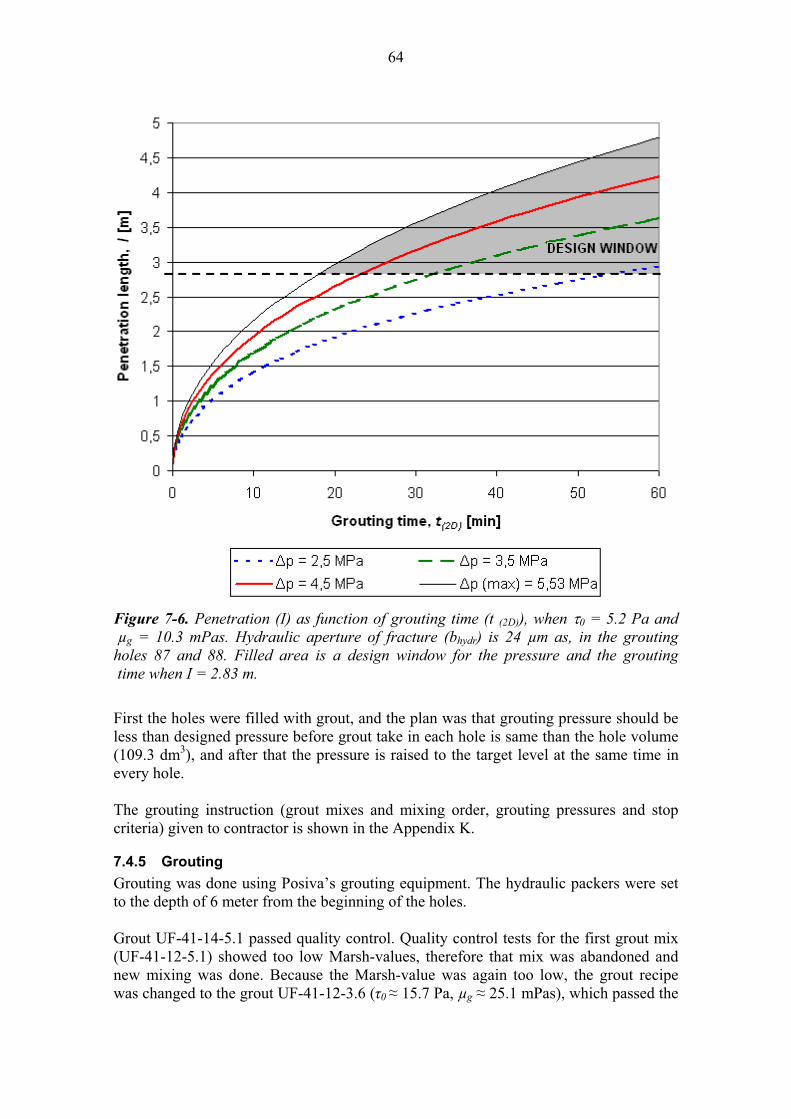
64
Figure 7-6. Penetration (I) as function of grouting time (t (2D)), when 0 = 5.2 Pa and
µg = 10.3 mPas. Hydraulic aperture of fracture (bhydr) is 24 µm as, in the grouting
holes 87 and 88. Filled area is a design window for the pressure and the grouting
time when I = 2.83 m.
First the holes were filled with grout, and the plan was that grouting pressure should be less than designed pressure before grout take in each hole is same than the hole volume (109.3 dm3), and after that the pressure is raised to the target level at the same time in every hole.
The grouting instruction (grout mixes and mixing order, grouting pressures and stop criteria) given to contractor is shown in the Appendix K.
7.4.5 Grouting
Grouting was done using Posiva’s grouting equipment. The hydraulic packers were set to the depth of 6 meter from the beginning of the holes.
Grout UF-41-14-5.1 passed quality control. Quality control tests for the first grout mix (UF-41-12-5.1) showed too low Marsh-values, therefore that mix was abandoned and new mixing was done. Because the Marsh-value was again too low, the grout recipe was changed to the grout UF-41-12-3.6 ( 0 15.7 Pa, µg 25.1 mPas), which passed the
65
quality control tests. No changes to the grouting times were done in the field because the idea was to calculate the influence after grouting.
It took 25…30 minutes before all the three holes were filled in (Vborehole 109.3 dm3).The operator had a mixing problem and therefore the grouting had progressed about 1 h when the time keeping for stop criterion started.
When contractor removed packers about 12.5 hours after the grouting was concluded, some grout came out from the hole no. 88. Using the equation (15.), it can be estimated that the shear strength of grout was, at that time, less than 0.5 kPa.
Grouting pressures, grout flow and grout volume as a function of time are presented in the Appendix L. Dimensionality of grout flow is analyzed and results are presented in the Appendix M. From the analysis it can be seen that the grout flow was one-, two- and three-dimensional during the grouting.
Grout properties observed during this field test are reported by Ranta-Korpi et al.(2007).
Table 7-2. Grouting pressures and grout take. Grout takes include the amount of grout
in grouting hole (about 109.3 dm3 in each hole).
Hole
designedgroutingpressure
average pressure during
grouting time grouting
time grout take (t (2D) = 0)
grouttake
Vol./bore-hole–m
no. [MPa] [MPa] [hh:mm:ss] [dm3] [dm3] [l / m] 86 4.5 4.62 00:30:00 414.40 547.5 22.7 87 4.5 4.36 00:30:00 181.26 192.3 8.0 88 4.5 4.28 00:30:00 189.63 431.9 17.9
TOTAL 785.29 1171.9
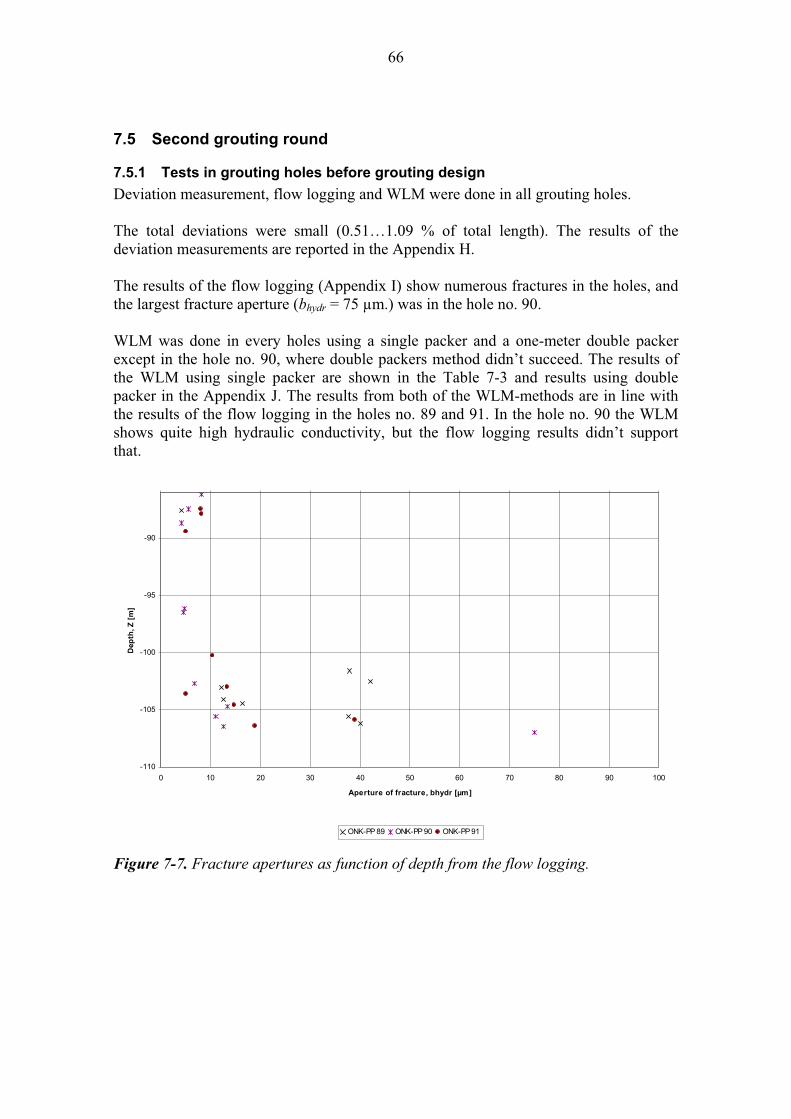
66
7.5 Second grouting round
7.5.1 Tests in grouting holes before grouting design
Deviation measurement, flow logging and WLM were done in all grouting holes.
The total deviations were small (0.51…1.09 % of total length). The results of the deviation measurements are reported in the Appendix H.
The results of the flow logging (Appendix I) show numerous fractures in the holes, and the largest fracture aperture (bhydr = 75 µm.) was in the hole no. 90.
WLM was done in every holes using a single packer and a one-meter double packer except in the hole no. 90, where double packers method didn’t succeed. The results of the WLM using single packer are shown in the Table 7-3 and results using double packer in the Appendix J. The results from both of the WLM-methods are in line with the results of the flow logging in the holes no. 89 and 91. In the hole no. 90 the WLM shows quite high hydraulic conductivity, but the flow logging results didn’t support that.
-110
-105
-100
-95
-90
0 10 20 30 40 50 60 70 80 90 100
Aperture of fracture, bhydr [µm]
Dep
th, Z
[m
]
ONK-PP 89 ONK-PP 90 ONK-PP 91
Figure 7-7. Fracture apertures as function of depth from the flow logging.
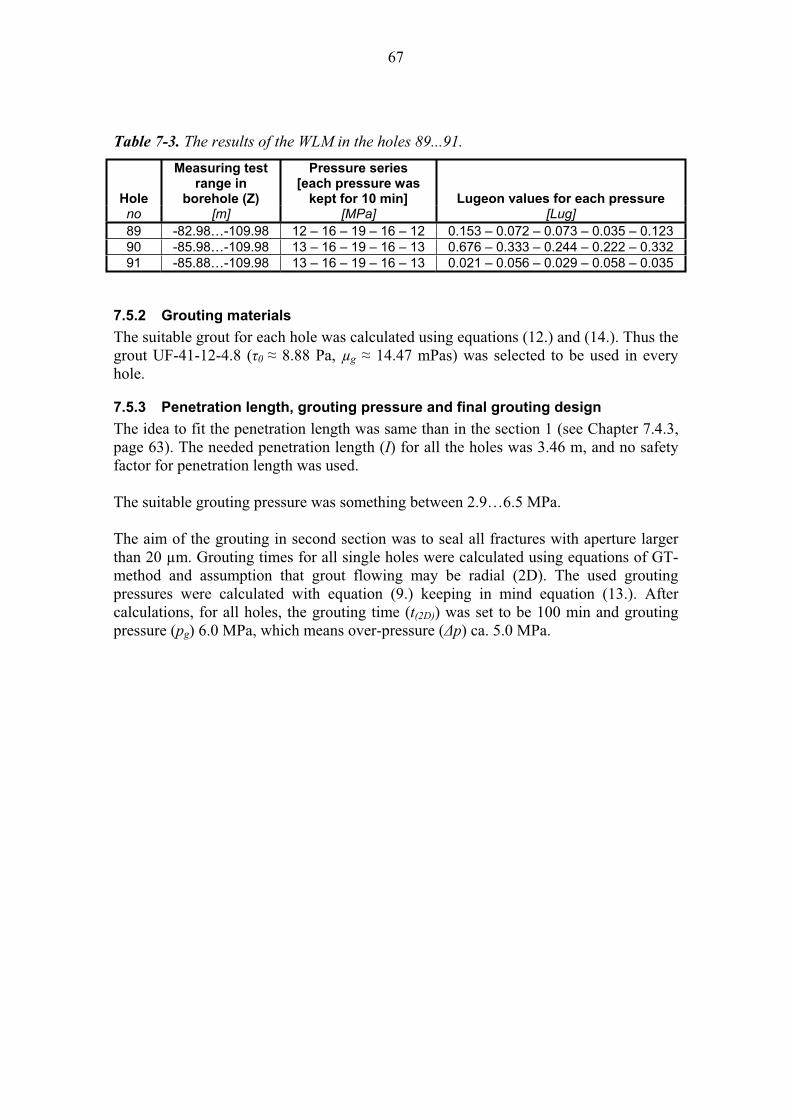
67
Table 7-3. The results of the WLM in the holes 89...91.
Hole
Measuring test range in
borehole (Z)
Pressure series [each pressure was
kept for 10 min] Lugeon values for each pressure no [m] [MPa] [Lug]
89 -82.98…-109.98 12 – 16 – 19 – 16 – 12 0.153 – 0.072 – 0.073 – 0.035 – 0.123 90 -85.98…-109.98 13 – 16 – 19 – 16 – 13 0.676 – 0.333 – 0.244 – 0.222 – 0.332 91 -85.88…-109.98 13 – 16 – 19 – 16 – 13 0.021 – 0.056 – 0.029 – 0.058 – 0.035
7.5.2 Grouting materials
The suitable grout for each hole was calculated using equations (12.) and (14.). Thus the grout UF-41-12-4.8 ( 0 8.88 Pa, µg 14.47 mPas) was selected to be used in every hole.
7.5.3 Penetration length, grouting pressure and final grouting design
The idea to fit the penetration length was same than in the section 1 (see Chapter 7.4.3, page 63). The needed penetration length (I) for all the holes was 3.46 m, and no safety factor for penetration length was used.
The suitable grouting pressure was something between 2.9…6.5 MPa.
The aim of the grouting in second section was to seal all fractures with aperture larger than 20 µm. Grouting times for all single holes were calculated using equations of GT-method and assumption that grout flowing may be radial (2D). The used grouting pressures were calculated with equation (9.) keeping in mind equation (13.). After calculations, for all holes, the grouting time (t(2D)) was set to be 100 min and grouting pressure (pg) 6.0 MPa, which means over-pressure ( p) ca. 5.0 MPa.
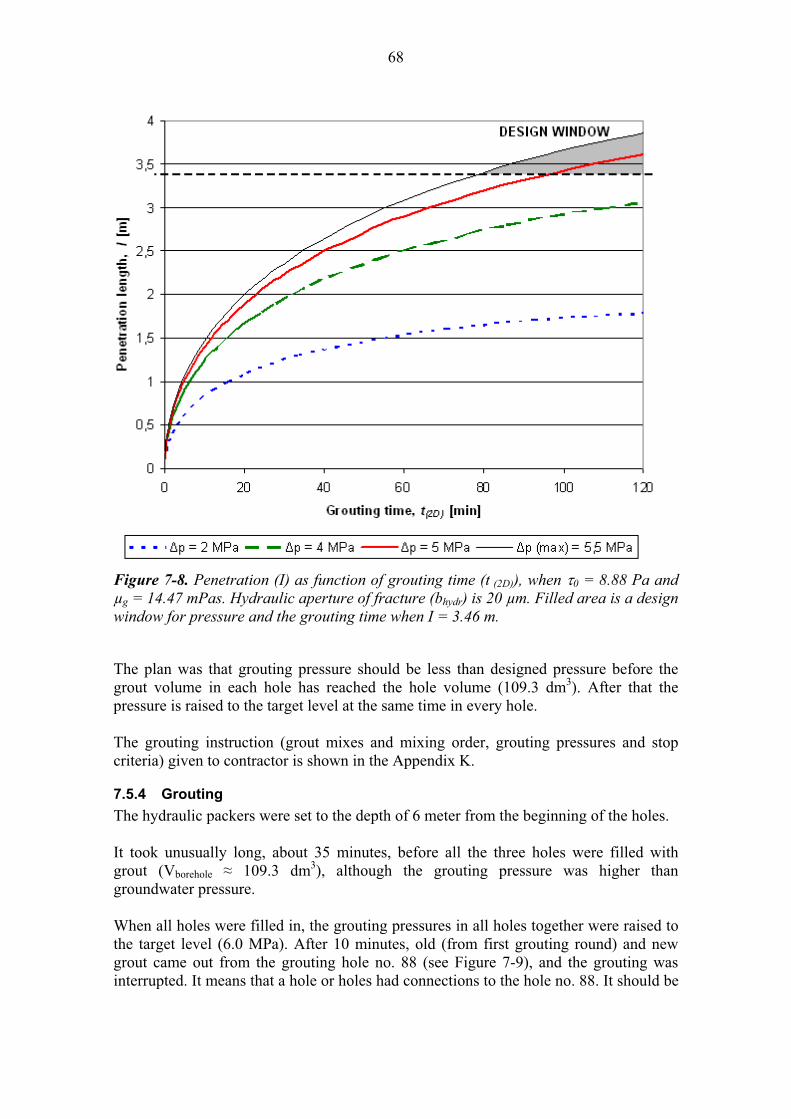
68
Figure 7-8. Penetration (I) as function of grouting time (t (2D)), when 0 = 8.88 Pa and
µg = 14.47 mPas. Hydraulic aperture of fracture (bhydr) is 20 µm. Filled area is a design
window for pressure and the grouting time when I = 3.46 m.
The plan was that grouting pressure should be less than designed pressure before the grout volume in each hole has reached the hole volume (109.3 dm3). After that the pressure is raised to the target level at the same time in every hole.
The grouting instruction (grout mixes and mixing order, grouting pressures and stop criteria) given to contractor is shown in the Appendix K.
7.5.4 Grouting
The hydraulic packers were set to the depth of 6 meter from the beginning of the holes.
It took unusually long, about 35 minutes, before all the three holes were filled with grout (Vborehole 109.3 dm3), although the grouting pressure was higher than groundwater pressure.
When all holes were filled in, the grouting pressures in all holes together were raised to the target level (6.0 MPa). After 10 minutes, old (from first grouting round) and new grout came out from the grouting hole no. 88 (see Figure 7-9), and the grouting was interrupted. It means that a hole or holes had connections to the hole no. 88. It should be
69
remembered that the distance between the holes no. 88 and 90 was slightly more than one meter, and in the hole no. 90 the WLM showed quite high hydraulic conductivity, especially in first measuring, which may indicate connections between holes.
A hydraulic packer was installed into the earlier grouted hole no. 88, and grouting was continued. An automatic logging tool was accidentally turned off when grouting continued, and therefore data is missing after the break. Fortunately, hand written “back up” documentation for total grout take was done and is presented in Table 7-4, but actual grouting pressures and grout flows as function of time are missing. In any case, shortly after the grouting was continued, the grout flow was very low in every hole, almost 0.0 dm3/min, to the end of the grouting.
Figure 7-9. Old and new grout came out from the hole no. 88. Hole no. 90 is on the
right side of the picture.
70
Table 7-4. Grouting pressures and grout take. Grout takes includes the amount of grout
in grouting hole (about 109.3 dm3 in each hole).
Hole
designedgroutingpressure grouting time
grout take (t (2D) = 0)
grouttake Vol./bore-hole–m
no. [MPa] [hh:mm:ss] [dm3] [dm3] [l / m] 89 6.0 01:40:00 109.30 317 13.2 90 6.0 01:40:00 109.30 305 12.7 91 6.0 01:40:00 109.30 302 12.5
TOTAL 327.9 924
Grouting pressures, grout flow and grout volume from the first 45 min as a function of time are presented in Appendix L. Dimensionality of grout flow is analyzed and results are presented in Appendix M, but because a part of the data of automatic logging tool was lost, are dimensionality analyses also incomplete.
The packers were removed without problems about 14 h after grouting.
Grout properties observed during this field test are reported by Ranta-Korpi et al.(2007).
7.6 Third grouting round
7.6.1 Tests in grouting holes before grouting design
Holes no. 92…98 was successfully drilled using drill core –method. Deviation measurement, flow logging and WLM were done in all grouting holes.
The total deviations were again very small (0.17…0.69 % of total length). The results of the deviation measurements are reported in the Appendix H.
The results of the flow logging show (Appendix I) numerous fractures in all holes, and the largest fracture aperture (bhydr = 45 µm.) was in the hole no. 94. The need for grouting was evident, even though large fractures had been sealed earlier.
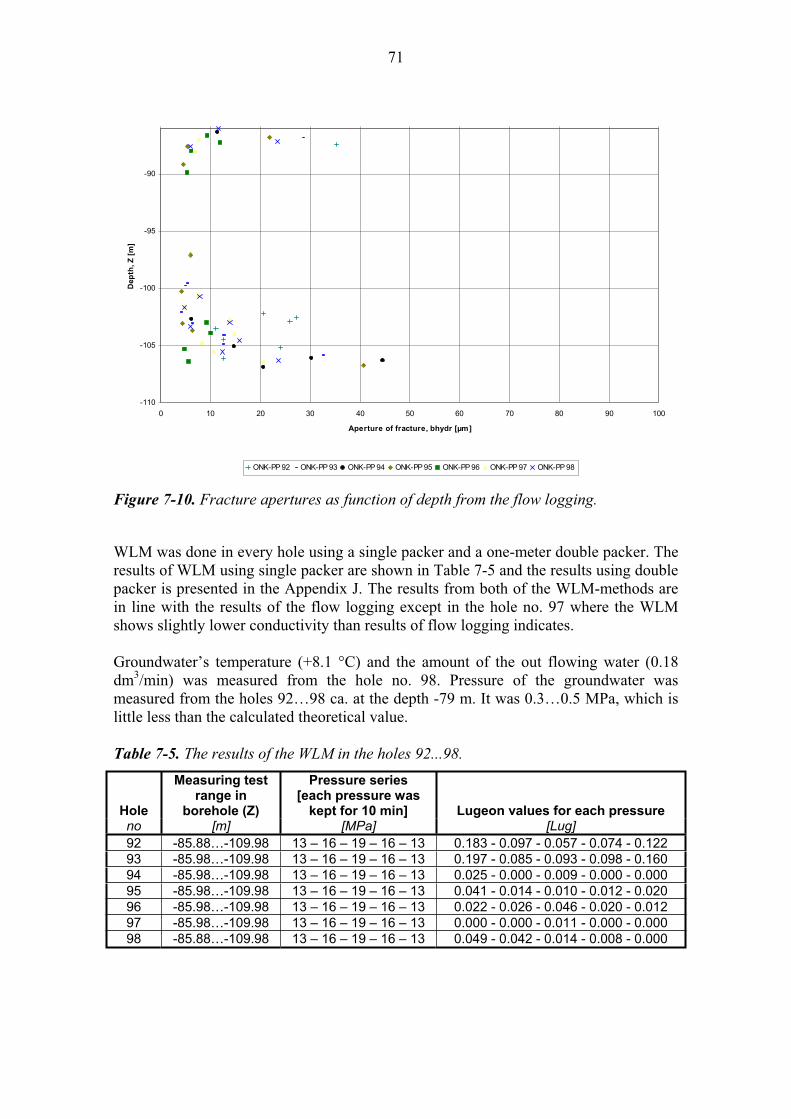
71
-110
-105
-100
-95
-90
0 10 20 30 40 50 60 70 80 90 100
Aperture of fracture, bhydr [µm]
Dep
th, Z
[m
]
ONK-PP 92 ONK-PP 93 ONK-PP 94 ONK-PP 95 ONK-PP 96 ONK-PP 97 ONK-PP 98
Figure 7-10. Fracture apertures as function of depth from the flow logging.
WLM was done in every hole using a single packer and a one-meter double packer. The results of WLM using single packer are shown in Table 7-5 and the results using double packer is presented in the Appendix J. The results from both of the WLM-methods are in line with the results of the flow logging except in the hole no. 97 where the WLM shows slightly lower conductivity than results of flow logging indicates.
Groundwater’s temperature (+8.1 °C) and the amount of the out flowing water (0.18 dm3/min) was measured from the hole no. 98. Pressure of the groundwater was measured from the holes 92…98 ca. at the depth -79 m. It was 0.3…0.5 MPa, which is little less than the calculated theoretical value.
Table 7-5. The results of the WLM in the holes 92...98.
Hole
Measuring test range in
borehole (Z)
Pressure series [each pressure was
kept for 10 min] Lugeon values for each pressure no [m] [MPa] [Lug]
92 -85.88…-109.98 13 – 16 – 19 – 16 – 13 0.183 - 0.097 - 0.057 - 0.074 - 0.122 93 -85.98…-109.98 13 – 16 – 19 – 16 – 13 0.197 - 0.085 - 0.093 - 0.098 - 0.160 94 -85.98…-109.98 13 – 16 – 19 – 16 – 13 0.025 - 0.000 - 0.009 - 0.000 - 0.000 95 -85.98…-109.98 13 – 16 – 19 – 16 – 13 0.041 - 0.014 - 0.010 - 0.012 - 0.020 96 -85.98…-109.98 13 – 16 – 19 – 16 – 13 0.022 - 0.026 - 0.046 - 0.020 - 0.012 97 -85.98…-109.98 13 – 16 – 19 – 16 – 13 0.000 - 0.000 - 0.011 - 0.000 - 0.000 98 -85.88…-109.98 13 – 16 – 19 – 16 – 13 0.049 - 0.042 - 0.014 - 0.008 - 0.000
72
7.6.2 Grouting materials
The suitable grout for each hole was calculated using equations (12.) and (14.). The grout UF-41-14-4 ( 0 8.40 Pa, µg 10.4 mPas) was selected to be used in every hole.
7.6.3 Penetration length, grouting pressure and final grouting design
In the final grouting round the needed penetration length (I) was 4 meters in every hole, and the aim was to seal all fractures with aperture larger than 20 µm. Grouting pressures and times were calculated similarly as in the earlier rounds. Grouting time (t(2D)) was set to be 110 min and grouting pressure (pg) 6.0 MPa (over-pressure p is ca. 5.0 MPa).
The plan was to fill in the holes with grout using a hose just before the grouting. With this method the grouting time can start at the same time in every hole.
The grouting instruction (grout mixes and mixing order, grouting pressures and stop criteria) given to contractor is shown in the Appendix K.
Figure 7-11. Penetration (I) as function of grouting time (t (2D)), when 0 = 8.40 Pa and
µg = 10.4 mPas. Hydraulic aperture of fracture (bhydr) is 20 µm. Filled area is a design
window for pressure and the grouting time when I = 4.0 m.
73
7.6.4 Grouting
After all holes were filled in with grout, the hydraulic packers were set to the depth of 6 meters, and grouting started immediately after that. Pipe branches were made because there were six grouting holes but only four pumps and channels in the grouting equipment. Therefore holes no. 92 & 97 and 94 & 95 were connected to the same pump.
Just after the grouting started, the grouting pressures were raised in every hole. At the same moment the timing of grouting started. During the grouting, pressures were less than the target level and grout flows were much higher than expected based on the results from the WLM and flow logging. Those observations indicate that the fracture system was very complicated and there were many larger fractures than the pre-measurements showed. After 90 minutes the grout leaked to the tunnel at chainage 960, which means about 30 meters long grout penetration and indicates invalid results of the WLM and flow logging measurements (see Figure 7-2 and Figure 7-13).
Figure 7-12. Six grouting holes were injected at the same time using four lines.
74
Figure 7-13. Grout leaked to the tunnel ca. at the chainage 960.
When the grouting time 110 min was reached, grout flows were still very high ( 10 dm3/min) in every hole. Therefore it was decided that the grout recipe will be changed for thicker grout UF 41-10-4 ( 0 27 Pa, µg 27.8 mPas) and grouting was continued with that grout about 50 min. Grout flow and total grout takes were still high in every hole, which confirms the arguments that the results of pre-measurements were not valid for grouting.
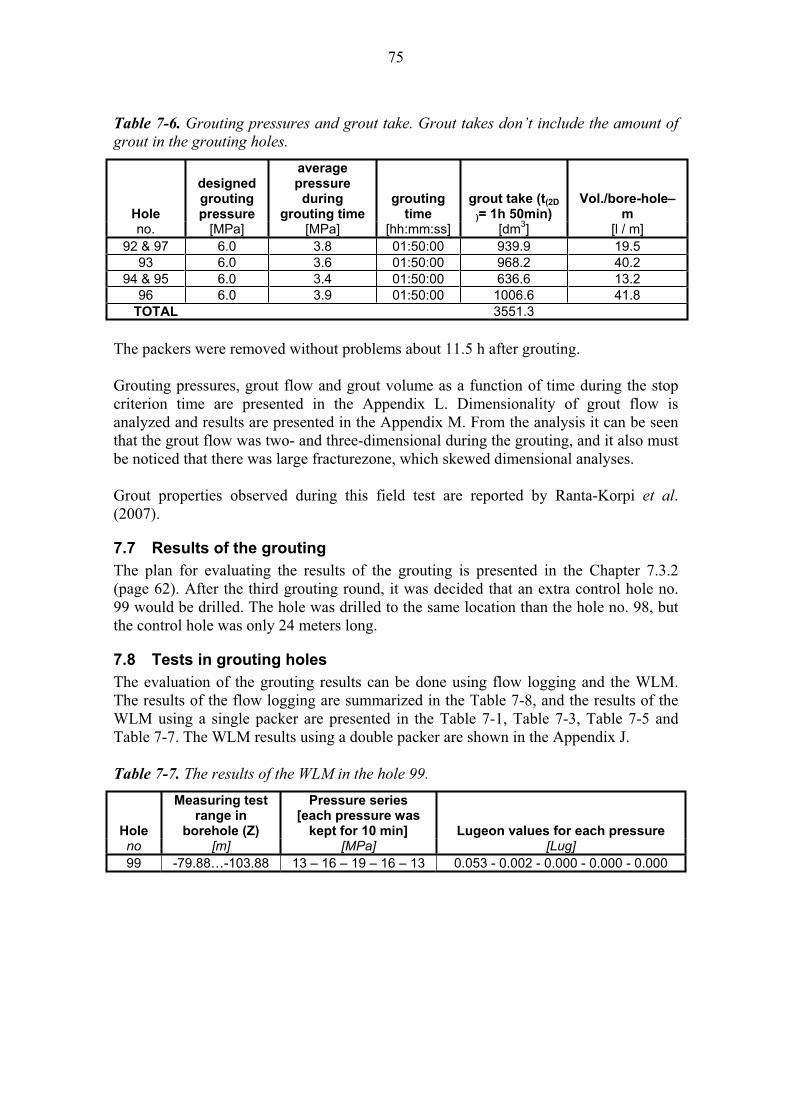
75
Table 7-6. Grouting pressures and grout take. Grout takes don’t include the amount of
grout in the grouting holes.
Hole
designedgroutingpressure
average pressure
duringgrouting time
groutingtime
grout take (t(2D
)= 1h 50min) Vol./bore-hole–
mno. [MPa] [MPa] [hh:mm:ss] [dm3] [l / m]
92 & 97 6.0 3.8 01:50:00 939.9 19.5 93 6.0 3.6 01:50:00 968.2 40.2
94 & 95 6.0 3.4 01:50:00 636.6 13.2 96 6.0 3.9 01:50:00 1006.6 41.8
TOTAL 3551.3
The packers were removed without problems about 11.5 h after grouting.
Grouting pressures, grout flow and grout volume as a function of time during the stop criterion time are presented in the Appendix L. Dimensionality of grout flow is analyzed and results are presented in the Appendix M. From the analysis it can be seen that the grout flow was two- and three-dimensional during the grouting, and it also must be noticed that there was large fracturezone, which skewed dimensional analyses.
Grout properties observed during this field test are reported by Ranta-Korpi et al.(2007).
7.7 Results of the grouting
The plan for evaluating the results of the grouting is presented in the Chapter 7.3.2 (page 62). After the third grouting round, it was decided that an extra control hole no. 99 would be drilled. The hole was drilled to the same location than the hole no. 98, but the control hole was only 24 meters long.
7.8 Tests in grouting holes
The evaluation of the grouting results can be done using flow logging and the WLM. The results of the flow logging are summarized in the Table 7-8, and the results of the WLM using a single packer are presented in the Table 7-1, Table 7-3, Table 7-5 and Table 7-7. The WLM results using a double packer are shown in the Appendix J.
Table 7-7. The results of the WLM in the hole 99.
Hole
Measuring test range in
borehole (Z)
Pressure series [each pressure was
kept for 10 min] Lugeon values for each pressure no [m] [MPa] [Lug]
99 -79.88…-103.88 13 – 16 – 19 – 16 – 13 0.053 - 0.002 - 0.000 - 0.000 - 0.000
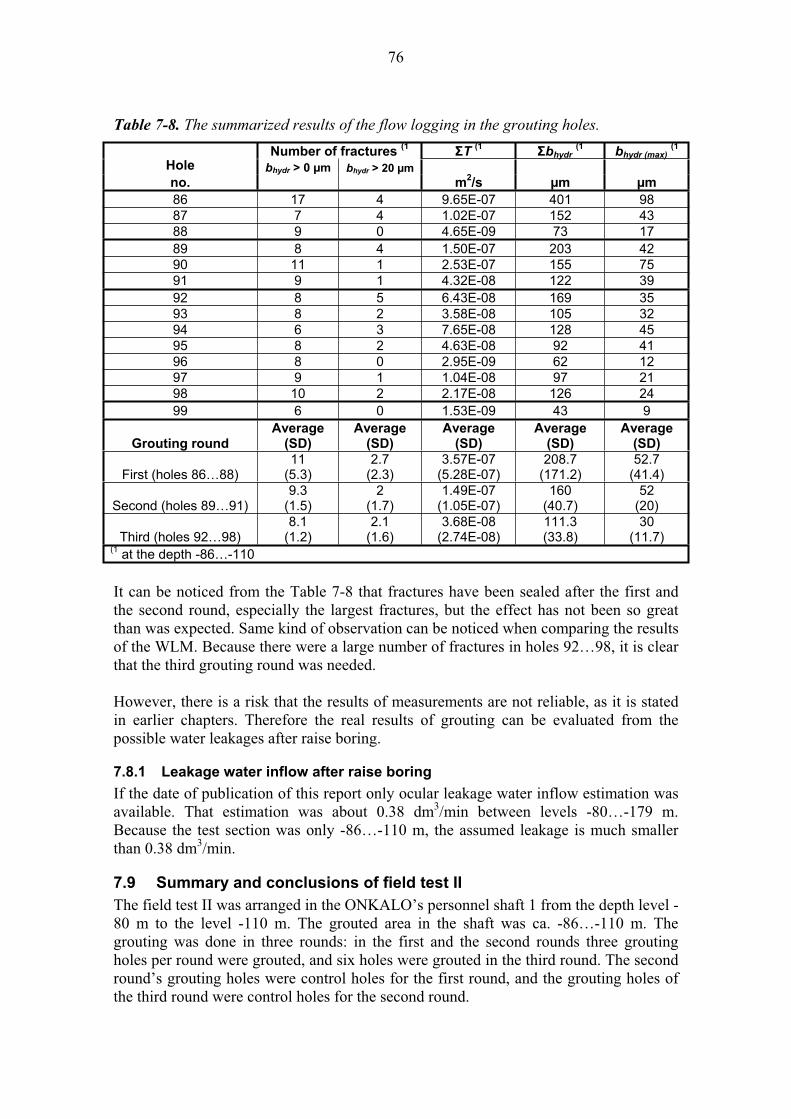
76
Table 7-8. The summarized results of the flow logging in the grouting holes.
Number of fractures (1 T(1
bhydr(1
bhydr (max)(1
Hole bhydr > 0 µm bhydr > 20 µm no. m2/s µm µm 86 17 4 9.65E-07 401 98 87 7 4 1.02E-07 152 43 88 9 0 4.65E-09 73 17 89 8 4 1.50E-07 203 42 90 11 1 2.53E-07 155 75 91 9 1 4.32E-08 122 39 92 8 5 6.43E-08 169 35 93 8 2 3.58E-08 105 32 94 6 3 7.65E-08 128 45 95 8 2 4.63E-08 92 41 96 8 0 2.95E-09 62 12 97 9 1 1.04E-08 97 21 98 10 2 2.17E-08 126 24 99 6 0 1.53E-09 43 9
Grouting round Average
(SD)Average
(SD)Average
(SD)Average
(SD)Average
(SD)
First (holes 86…88) 11
(5.3)2.7
(2.3)3.57E-07
(5.28E-07) 208.7
(171.2) 52.7
(41.4)
Second (holes 89…91) 9.3
(1.5)2
(1.7)1.49E-07
(1.05E-07) 160
(40.7) 52
(20)
Third (holes 92…98) 8.1
(1.2)2.1
(1.6)3.68E-08
(2.74E-08) 111.3(33.8)
30(11.7)
(1 at the depth -86…-110
It can be noticed from the Table 7-8 that fractures have been sealed after the first and the second round, especially the largest fractures, but the effect has not been so great than was expected. Same kind of observation can be noticed when comparing the results of the WLM. Because there were a large number of fractures in holes 92…98, it is clear that the third grouting round was needed.
However, there is a risk that the results of measurements are not reliable, as it is stated in earlier chapters. Therefore the real results of grouting can be evaluated from the possible water leakages after raise boring.
7.8.1 Leakage water inflow after raise boring
If the date of publication of this report only ocular leakage water inflow estimation was available. That estimation was about 0.38 dm3/min between levels -80…-179 m. Because the test section was only -86…-110 m, the assumed leakage is much smaller than 0.38 dm3/min.
7.9 Summary and conclusions of field test II
The field test II was arranged in the ONKALO’s personnel shaft 1 from the depth level -80 m to the level -110 m. The grouted area in the shaft was ca. -86…-110 m. The grouting was done in three rounds: in the first and the second rounds three grouting holes per round were grouted, and six holes were grouted in the third round. The second round’s grouting holes were control holes for the first round, and the grouting holes of the third round were control holes for the second round.
77
All grouting holes were vertical and inside the shaft profile, because the grouting holes outside the shaft profile are not accepted in ONKALO due the long-term safety reasons. The holes were drilled using a core drilling –method. The rock mass was characterized using the WLM (single packer and a one-meter double packer) and the flow logging –tool. Also deviation measurements were done for the grouting holes.
Used grouts were UF-41-12-3.6 (hole no. 86), UF-41-14-5.1 (holes no. 87 & 88), UF-41-12-4.8 (holes no. 89…91) and UF-41-14-4 (holes no. 92…97), which are all low-pH grouts.
The design was based on GT-model. The grouting pressures were set using the equation for the direct shear stress in joint, which means that maximum pressures should be less than 6.5 MPa, and pressures of 4.0 MPa and 6.0 MPa were used. The intended grout penetrations were 2.8 m, 3.5 m and 4 m, depending on hole location. Grouting times were calculated using equations of the GT-method. In every round, all holes were grouted at the same time, and therefore grouting times and pressures were the same in all holes.
On the last grouting round the grout leaked to the tunnel at the chainage 960, which means about 30 meters long grout penetration. Even though 2D-flow model was used, the total grout take was much higher than expected after the tests in grouting holes (WLM, flow logging). Especially on the third round, the total grout take was very high in proportion to the measured Lugeon-values and the hydraulic apertures (flow logging). It is important to notice that maximum over-pressure for water in WLM is only 1 MPa, which is much less than used over-pressure for grouting. As it is stated in the Chapter 6.5, further study for pressures of the WLM in deep sound rock is needed.
Grouting results were evaluated from the tests made in the holes of the following grouting round. After the first and second round fractures were slightly sealed, especially the largest fractures, but not enough. Therefore the third grouting round was needed. Observed leakage after raise boring was insignificant.

78
79
8 CONCLUSIONS
Strict inflow targets are currently quite common in rock tunnels, hence grouting will be become more and more essential part of the excavation cycle. In ONKALO where the inflow target is strict ( 1…2 dm3/min/100 m of tunnel length) and groundwater pressure might become a problem as the tunnel goes deeper, the grouting is main and almost only suitable sealing method against groundwater flow.
Cementitious grouts with variable grain size are mostly used in rock grouting in tunnels. In the future, colloidal silica may be a useable grouting material when very tight fractures (bhydr < 20 µm) must be sealed. The grout should be fluid enough so that required penetration length can be reached. At the same time, the grout should be thick enough so that the grouting pressure can be raised and that the grout doesn’t flow back from fracture to the grouting hole.
Rock characterization before grouting can be done in pilot, probe and grouting holes. The water loss measurement and the flow logging used together are useable and recommended test methods to estimate number and hydraulic apertures of fractures. Hydraulic aperture of fracture is a quite good estimation for the grouting aperture and it should be known before grouting parameters, for example grout to be used, are decided. The field tests were proving that further development is needed for over-pressure of water loss measurement, when the test is done in deep sound rock.
The grouting pressure is a design parameter that divides opinions. Recommended grouting pressure by author is little less than the direct shear stress in joint. The grouting very close to rock surface is typically done using higher pressures than that recommendation.
Stop criterion for grouting is the point when the sealing effect is good enough. This means that grouting is uneconomical after that point and it can be stopped. Traditionally in tunnel grouting, the stop criterion is set empirically. Current practise is to set highest allowable pressure and grout take, and that is used also in the ONKALO. GIN-method (Grouting Intensity Number) is a stop criterion, which defines limiting curve by maximum pressure, maximum grouted volume and GIN-value. As in prevailing practise, all the three limiting parameters in GIN-method are set more or less empirically. Exact GIN-value is unsolved when grouting in tunnels. Author recommends that GIN-method should not be used in tunnel grouting before exact GIN-value is solvable. Grouting Time -method (GT-method) is a recently presented design criterion, which offers an analytical method to review grout penetration in fracture in relation to grouting time. The main conclusion about the field test was that the stop criteria based on analysis of grout penetration is not easy to use when fracture-system is complicated, but may be useable when fracture-system is simple. Criterion is also difficult to use if the fracture characteristics are unreliable. Therefore further development for GT-method is needed, since exact characterization at the site is very difficult.
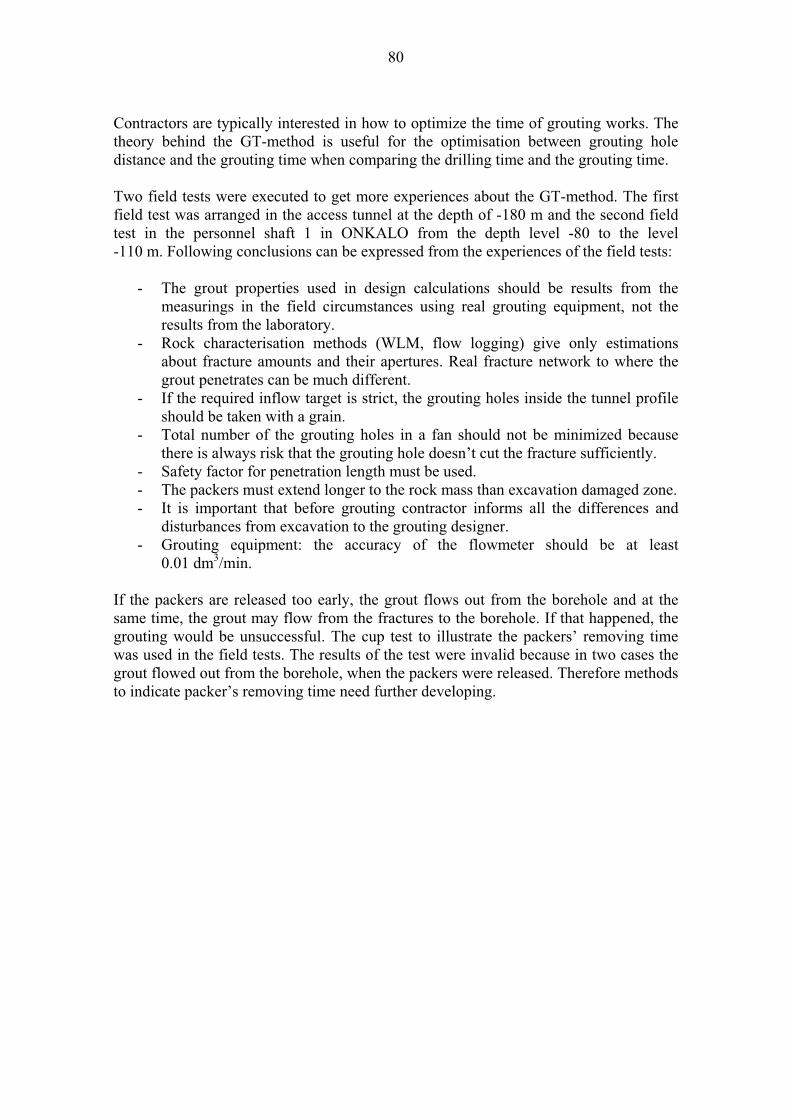
80
Contractors are typically interested in how to optimize the time of grouting works. The theory behind the GT-method is useful for the optimisation between grouting hole distance and the grouting time when comparing the drilling time and the grouting time.
Two field tests were executed to get more experiences about the GT-method. The first field test was arranged in the access tunnel at the depth of -180 m and the second field test in the personnel shaft 1 in ONKALO from the depth level -80 to the level -110 m. Following conclusions can be expressed from the experiences of the field tests:
- The grout properties used in design calculations should be results from the measurings in the field circumstances using real grouting equipment, not the results from the laboratory.
- Rock characterisation methods (WLM, flow logging) give only estimations about fracture amounts and their apertures. Real fracture network to where the grout penetrates can be much different.
- If the required inflow target is strict, the grouting holes inside the tunnel profile should be taken with a grain.
- Total number of the grouting holes in a fan should not be minimized because there is always risk that the grouting hole doesn’t cut the fracture sufficiently.
- Safety factor for penetration length must be used. - The packers must extend longer to the rock mass than excavation damaged zone. - It is important that before grouting contractor informs all the differences and
disturbances from excavation to the grouting designer. - Grouting equipment: the accuracy of the flowmeter should be at least
0.01 dm3/min.
If the packers are released too early, the grout flows out from the borehole and at the same time, the grout may flow from the fractures to the borehole. If that happened, the grouting would be unsuccessful. The cup test to illustrate the packers’ removing time was used in the field tests. The results of the test were invalid because in two cases the grout flowed out from the borehole, when the packers were released. Therefore methods to indicate packer’s removing time need further developing.
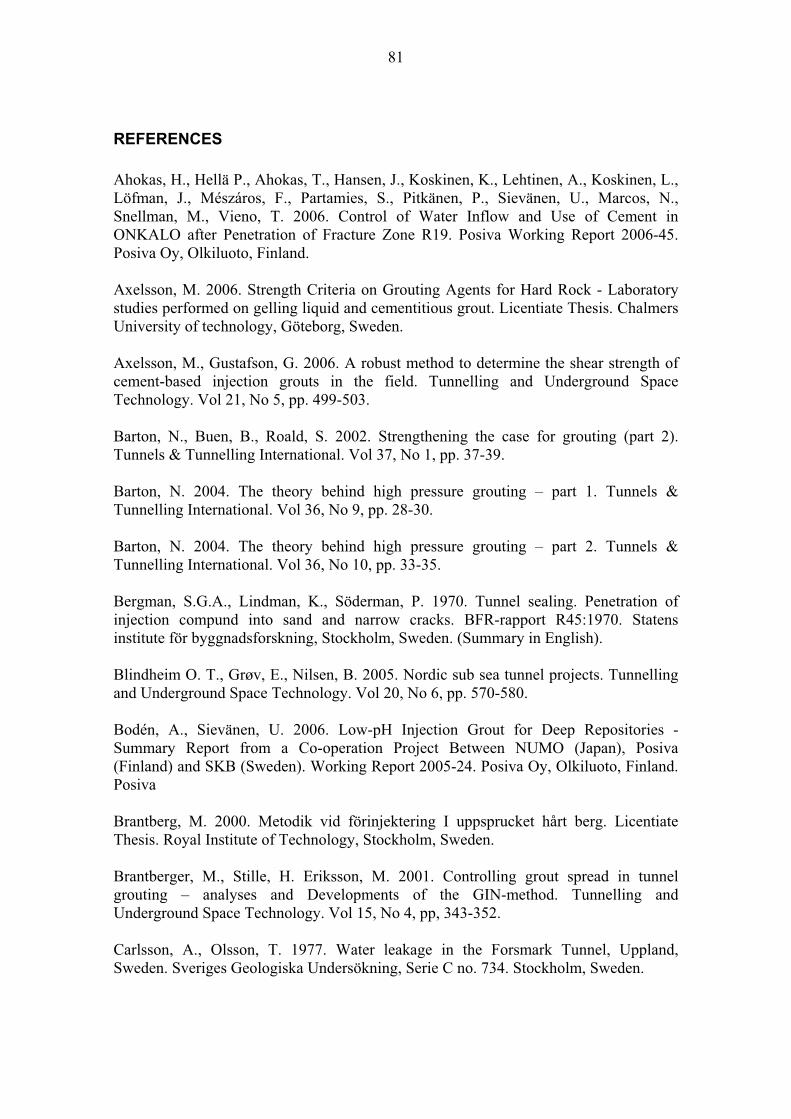
81
REFERENCES
Ahokas, H., Hellä P., Ahokas, T., Hansen, J., Koskinen, K., Lehtinen, A., Koskinen, L., Löfman, J., Mészáros, F., Partamies, S., Pitkänen, P., Sievänen, U., Marcos, N., Snellman, M., Vieno, T. 2006. Control of Water Inflow and Use of Cement in ONKALO after Penetration of Fracture Zone R19. Posiva Working Report 2006-45. Posiva Oy, Olkiluoto, Finland.
Axelsson, M. 2006. Strength Criteria on Grouting Agents for Hard Rock - Laboratory studies performed on gelling liquid and cementitious grout. Licentiate Thesis. Chalmers University of technology, Göteborg, Sweden.
Axelsson, M., Gustafson, G. 2006. A robust method to determine the shear strength of cement-based injection grouts in the field. Tunnelling and Underground Space Technology. Vol 21, No 5, pp. 499-503.
Barton, N., Buen, B., Roald, S. 2002. Strengthening the case for grouting (part 2). Tunnels & Tunnelling International. Vol 37, No 1, pp. 37-39.
Barton, N. 2004. The theory behind high pressure grouting – part 1. Tunnels & Tunnelling International. Vol 36, No 9, pp. 28-30.
Barton, N. 2004. The theory behind high pressure grouting – part 2. Tunnels & Tunnelling International. Vol 36, No 10, pp. 33-35.
Bergman, S.G.A., Lindman, K., Söderman, P. 1970. Tunnel sealing. Penetration of injection compund into sand and narrow cracks. BFR-rapport R45:1970. Statens institute för byggnadsforskning, Stockholm, Sweden. (Summary in English).
Blindheim O. T., Grøv, E., Nilsen, B. 2005. Nordic sub sea tunnel projects. Tunnelling and Underground Space Technology. Vol 20, No 6, pp. 570-580.
Bodén, A., Sievänen, U. 2006. Low-pH Injection Grout for Deep Repositories - Summary Report from a Co-operation Project Between NUMO (Japan), Posiva (Finland) and SKB (Sweden). Working Report 2005-24. Posiva Oy, Olkiluoto, Finland. Posiva
Brantberg, M. 2000. Metodik vid förinjektering I uppsprucket hårt berg. Licentiate Thesis. Royal Institute of Technology, Stockholm, Sweden.
Brantberger, M., Stille, H. Eriksson, M. 2001. Controlling grout spread in tunnel grouting – analyses and Developments of the GIN-method. Tunnelling and Underground Space Technology. Vol 15, No 4, pp, 343-352.
Carlsson, A., Olsson, T. 1977. Water leakage in the Forsmark Tunnel, Uppland, Sweden. Sveriges Geologiska Undersökning, Serie C no. 734. Stockholm, Sweden.
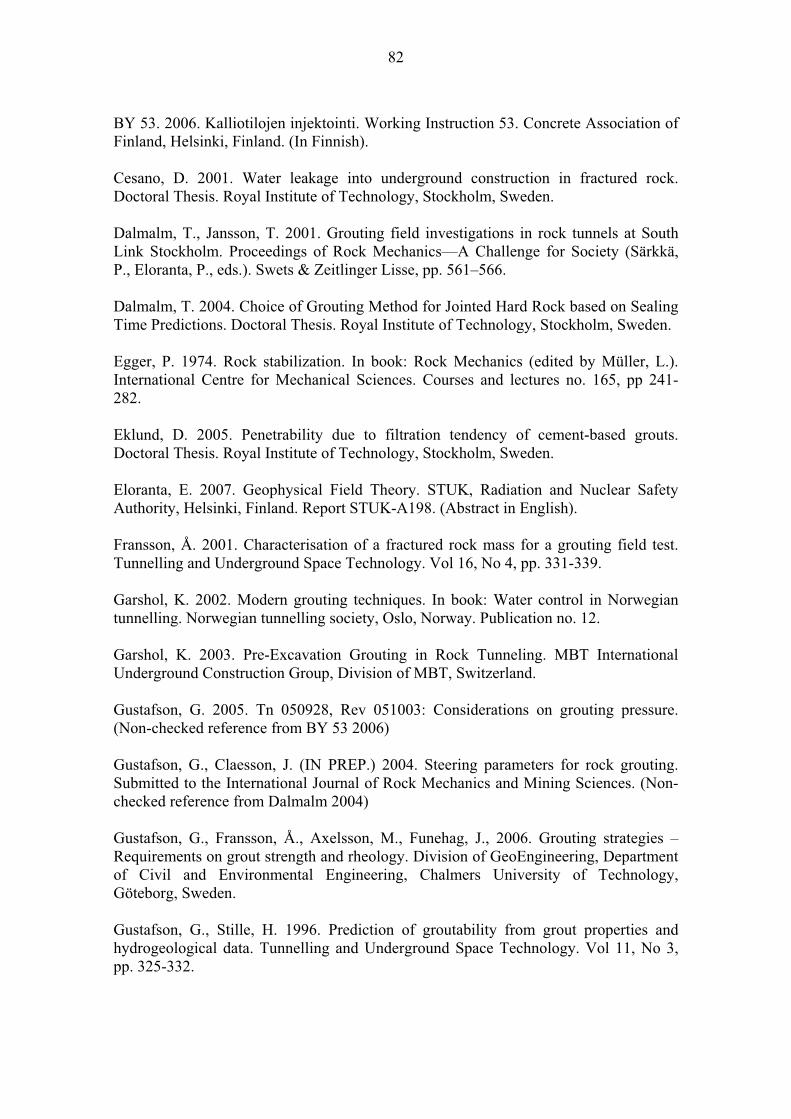
82
BY 53. 2006. Kalliotilojen injektointi. Working Instruction 53. Concrete Association of Finland, Helsinki, Finland. (In Finnish).
Cesano, D. 2001. Water leakage into underground construction in fractured rock. Doctoral Thesis. Royal Institute of Technology, Stockholm, Sweden.
Dalmalm, T., Jansson, T. 2001. Grouting field investigations in rock tunnels at South Link Stockholm. Proceedings of Rock Mechanics—A Challenge for Society (Särkkä, P., Eloranta, P., eds.). Swets & Zeitlinger Lisse, pp. 561–566.
Dalmalm, T. 2004. Choice of Grouting Method for Jointed Hard Rock based on Sealing Time Predictions. Doctoral Thesis. Royal Institute of Technology, Stockholm, Sweden.
Egger, P. 1974. Rock stabilization. In book: Rock Mechanics (edited by Müller, L.). International Centre for Mechanical Sciences. Courses and lectures no. 165, pp 241-282.
Eklund, D. 2005. Penetrability due to filtration tendency of cement-based grouts. Doctoral Thesis. Royal Institute of Technology, Stockholm, Sweden.
Eloranta, E. 2007. Geophysical Field Theory. STUK, Radiation and Nuclear Safety Authority, Helsinki, Finland. Report STUK-A198. (Abstract in English).
Fransson, Å. 2001. Characterisation of a fractured rock mass for a grouting field test. Tunnelling and Underground Space Technology. Vol 16, No 4, pp. 331-339.
Garshol, K. 2002. Modern grouting techniques. In book: Water control in Norwegian tunnelling. Norwegian tunnelling society, Oslo, Norway. Publication no. 12.
Garshol, K. 2003. Pre-Excavation Grouting in Rock Tunneling. MBT International Underground Construction Group, Division of MBT, Switzerland.
Gustafson, G. 2005. Tn 050928, Rev 051003: Considerations on grouting pressure. (Non-checked reference from BY 53 2006)
Gustafson, G., Claesson, J. (IN PREP.) 2004. Steering parameters for rock grouting. Submitted to the International Journal of Rock Mechanics and Mining Sciences. (Non-checked reference from Dalmalm 2004)
Gustafson, G., Fransson, Å., Axelsson, M., Funehag, J., 2006. Grouting strategies – Requirements on grout strength and rheology. Division of GeoEngineering, Department of Civil and Environmental Engineering, Chalmers University of Technology, Göteborg, Sweden.
Gustafson, G., Stille, H. 1996. Prediction of groutability from grout properties and hydrogeological data. Tunnelling and Underground Space Technology. Vol 11, No 3, pp. 325-332.

83
Gustafson, G. Stille, H. 2005. Stop Criteria for Cement Grouting. Felsbau: Zeitschrift für Geomechanik und Ingenieurgeologie im Bauwesen und Bergbau. Vol 23, No 3, pp. 62-68.
Hakala, M., Kuula, H., Matinlassi, M., Somervuori, P., Syrjänen, P. & Tolppanen, P. 2002. Analyses of tunnel stress failures at Pyhäsalmi mine. Posiva Working Report 2002-28. Posiva Oy, Helsinki, Finland.
Hellerslien, R. 2000. Grouting of the Banehei Highway Tunnel. Master’s thesis. The Norwegian University of Science and Technology, Trondheim, Norway. (Abstract in English).
Hoek, E., Bray, J., 1981. Rock Slope Engineering – revised third edition. The institute of Mining and Metallurgy, London, United Kingdom.
Houlsby, A. 1976. Routine interpretation of the Lugeon water-test. Quarterly Journal Of Engineering Geology. Vol 9, pp. 303-313.
Houlsby, A. 1990. Construction and Design of Cement Grouting. John Wiley and Sons, New York, The United States of America.
Hässler, L. 1991. Grouting of rock – simulation and classification. Doctoral Thesis. Royal Institute of Technology, Stockholm, Sweden.
ISO/TS 17892-6: Geotechnical investigation and testing – Laboratory testing of soil – Part 6: Fall cone test, International Organization for Standardization, 2004.
Klüver, B., Kveen, A. 2004. Berginjeksjon i praksis. Miljø- og samfunnstjenlige. Statens vegvesen, Oslo, Norway. Publication no. 104. (in Norwegian).
Kobayashi, S., Stille, H. 2007. Design for rock grouting based on analysis of grout penetration. Report R-07-13. Swedish Nuclear Fuel and Waste Management Co (SKB), Stockholm, Sweden.
Koumoto, T., Houlsby, G.T. 2001. Theory and Practice of the Fall Cone Test. Geotechnique. Vol 51, No 8, pp. 701-712.
Kolymbas, D., Wagner, P. 2007. Groundwater ingress to tunnels – The exact analytical solution. Tunnelling and Underground Space Technology. Vol 7, No 4, pp. 453-458.
Lindblom, U. Ludvig, B. Axelsson, H. 2005. The Göta Tunnel – an impervious rock structure in a sensitive geotechnical environment. In proceeding of Rock mechanic days 2005, SveBeFo, Stockholm, Sweden. (Summary in English).
Lindstrøm, M., Kveen, A. 2006. Techniques for groundwater control. In book: Sustainable undergroundconcepts. Publication no. 15. Norwegian tunnelling society, Oslo, Norway.
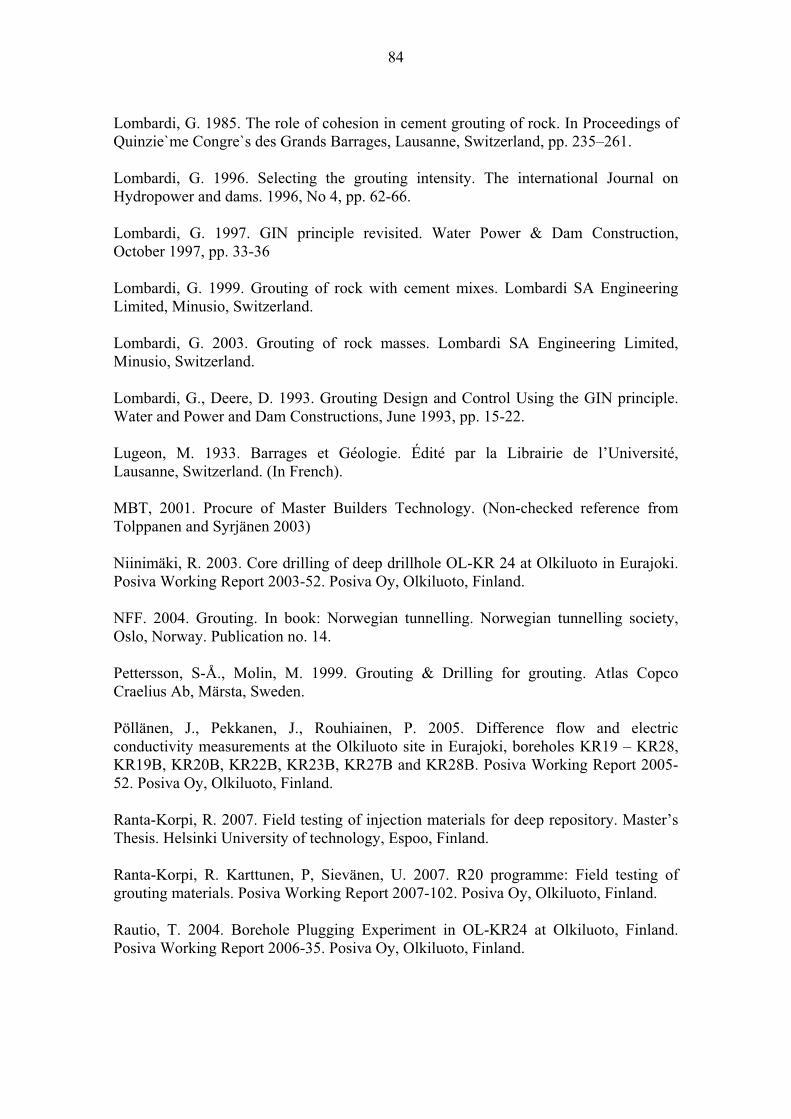
84
Lombardi, G. 1985. The role of cohesion in cement grouting of rock. In Proceedings of Quinzie`me Congre`s des Grands Barrages, Lausanne, Switzerland, pp. 235–261.
Lombardi, G. 1996. Selecting the grouting intensity. The international Journal on Hydropower and dams. 1996, No 4, pp. 62-66.
Lombardi, G. 1997. GIN principle revisited. Water Power & Dam Construction, October 1997, pp. 33-36
Lombardi, G. 1999. Grouting of rock with cement mixes. Lombardi SA Engineering Limited, Minusio, Switzerland.
Lombardi, G. 2003. Grouting of rock masses. Lombardi SA Engineering Limited, Minusio, Switzerland.
Lombardi, G., Deere, D. 1993. Grouting Design and Control Using the GIN principle. Water and Power and Dam Constructions, June 1993, pp. 15-22.
Lugeon, M. 1933. Barrages et Géologie. Édité par la Librairie de l’Université, Lausanne, Switzerland. (In French).
MBT, 2001. Procure of Master Builders Technology. (Non-checked reference from Tolppanen and Syrjänen 2003)
Niinimäki, R. 2003. Core drilling of deep drillhole OL-KR 24 at Olkiluoto in Eurajoki. Posiva Working Report 2003-52. Posiva Oy, Olkiluoto, Finland.
NFF. 2004. Grouting. In book: Norwegian tunnelling. Norwegian tunnelling society, Oslo, Norway. Publication no. 14.
Pettersson, S-Å., Molin, M. 1999. Grouting & Drilling for grouting. Atlas Copco Craelius Ab, Märsta, Sweden.
Pöllänen, J., Pekkanen, J., Rouhiainen, P. 2005. Difference flow and electric conductivity measurements at the Olkiluoto site in Eurajoki, boreholes KR19 – KR28, KR19B, KR20B, KR22B, KR23B, KR27B and KR28B. Posiva Working Report 2005-52. Posiva Oy, Olkiluoto, Finland.
Ranta-Korpi, R. 2007. Field testing of injection materials for deep repository. Master’s Thesis. Helsinki University of technology, Espoo, Finland.
Ranta-Korpi, R. Karttunen, P, Sievänen, U. 2007. R20 programme: Field testing of grouting materials. Posiva Working Report 2007-102. Posiva Oy, Olkiluoto, Finland.
Rautio, T. 2004. Borehole Plugging Experiment in OL-KR24 at Olkiluoto, Finland. Posiva Working Report 2006-35. Posiva Oy, Olkiluoto, Finland.

85
Riekkola, R., Sievänen, U., Vieno, T. 2003. Controlling of Disturbances due to Groundwater Inflow into ONKALO and the deep Repository. Posiva Working Report 2003-46. Posiva Oy, Olkiluoto, Finland.
Rombough, V., Bonin, G., Shuttle, D. 2006. Penetrability control of GIN mixes during fractured rock grouting. Sea to Sky Geotechnique, 2006, pp. 528-535.
Rosengren, L., Olofsson, S-O., Israelsson, J., Bergman, M., Hakami, H., Bognar, S., Sjöström, Ö., Salomonson, J., Hallin, A. & Wagenius, J., 1996. Förutsättningar, dimensioneringsprinciper och beräkningar avseende bergförstärkning och tätning. Norra Länken 2, Värtan bygg. Konsortiet KM-FFNS Norra Länken 2, Stockholm. (Non-checked reference from Tolppanen and Syrjänen 2003)
Sievänen, U. 2002. Groundwater inflow and grouting conditions at the Olkiluoto site, Eurajoki, western Finland. Licenciate Thesis. University of Helsinki, Helsinki, Finland.
Sievänen, U., Raivio, P., Vuorinen, U., Hansen, J., Norokallio J., Syrjänen, P. 2006. Optimisation of Technical Properties of Low pH Cementitious Injection Grout. Laboratory Tests and Pilot Field Test 3. Posiva Working Report 2006-85. Posiva Oy, Olkiluoto, Finland.
Sisavath, S., Al-Yaaruby, A., Pain, C., Zimmerman, R. 2003. A Simple Model for Deviations from the Cubic Law for a Fracture Undergoing Dilation or Closure. Pure and Applied Geophysics, Vol 160, No 5-6, pp. 1009-1022.
Stille, B. 2007. Grouting model tested with data from a case history. In proceeding of Rock mechanic days 2007, SveBeFo, Stockholm, Sweden. (In Swedish).
Swedish National Road Administration, 1994. Groundwater, sealing and infiltration. Rock engineering directives for design of the Stockholm ring road and outer by-pass route. Swedish National Road Administration, Stockholm, Sweden. Report ANV 0004.
Tolppanen, P. Syrjänen, P. 2003. Hard rock tunnel grouting practice in Finland, Sweden, and Norway – Literature Study. Finnish Tunnelling Association MTR ry., Finland. Publications no:1, Report 8:2003.
Turcotte, L., Savard, B., Lombardi, G., Jobin, H. 1994. The use of stable grout and GIN technique in grouting for dam rehabilitation. Annual meeting Canadian dam safety conference CSDA and Cancold, Winnipeg, Manitoba, October 1994.
Vieno, T., Lehikoinen, J., Löfman, J., Nordman, H., Mészáros, F. 2003. Assessment of Aisturbances Caused by Construction and Operation of ONKALO. Posiva Report 2003-6. Posiva Oy, Olkiluoto, Finland.
Warner, J. 2004. Practical Handbook of Grouting – Soil, rock and structures. John Wiley & Sons. Hoboken, New Jersey, USA.

86
Wiberg, L. 1961. Grundvattenströmning till rorledningar. Doctoral Thesis. Royal Institute of Technology, Stockholm, Sweden. (Non-checked reference from Carlsson and Olsson 1977)
Öhberg, A., Rouhiainen, P. 2000. Posiva groundwater flow measuring techniques. Posiva Report 2000-12. Posiva Oy, Olkiluoto, Finland.
87
APPENDIX A: GROUT VOLUME ESTIMATION (GT-METHOD)
Gustafson and Stille (2005) have presented equations to estimate grout volumes in both of dimensional cases:
Volume in injected fracture is: IwbV D)1( (A- 1)
bIV D
2)2( (A- 2)
The maximum grout volume of the fracture is: wbIV
D maxmax )1( (A- 3)
bIVD
2maxmax )2(
(A- 4)
The relative injected volume in every fracture is:
)1()1( DD DD IV (A- 5)2
)2()2( DD DD IV (A- 6)
For number of parallel fractures the total volume will be:
)1()1()1( max DDDVVV Dtot (A- 7)
)2()2()2( max DDDVVV Dtot (A- 8)
where:ID = Relative penetration length [-] I = Penetration length of injected grout [m] Imax = Maximum penetration length of grout [m] b = Aperture of fracture [m] w = 1D channels width [m] V = Volume of grout injected [m3]VD = The relative amount of grout in every fracture [m3]Vtot = Total volume of grout injected [m3], and Vmax = The maximum grout take in each joint [m3].

88

89
APPENDIX B: THE RESULTS OF DEVIATION MEASUREMENT FOR PROBE HOLES – FIELD TEST I
Survey name Station Dip Azimuth LocalA LocalB LocalC
Totaldevia-
tion
Percen-tage of
total length NB. * Metres Degrees Degrees Metres Metres Metres %
PL-1880A 0 -5,8 315,3 0 0 0 PL-1880A 3 -6,3 313,5 2,98 -0,03 -0,02 0,04 1,2 PL-1880A 6 -6,2 313,1 5,96 -0,12 -0,05 0,13 2,2 PL-1880A 9 -6,4 312,4 8,94 -0,23 -0,08 0,24 2,7 PL-1880A 12 -6,5 312 11,92 -0,38 -0,12 0,40 3,3 PL-1880A 15 -6,1 312,5 14,9 -0,52 -0,15 0,54 3,6 PL-1880A 18 -6 312 17,88 -0,67 -0,17 0,69 3,8 PL-1880A 21 -6,3 312 20,86 -0,82 -0,19 0,84 4,0 PL-1880A 24 -5,5 312,5 23,84 -0,97 -0,2 0,99 4,1
PL-1880B 0 -6,2 334,2 0 0 0
Magneticdisturbancein angle of departure
PL-1880B 3 -7,1 312 2,93 0,42 -0,06 0,42 14,1 PL-1880B 6 -7,3 314,5 5,91 0,32 -0,14 0,35 5,8 PL-1880B 9 -7,7 313,4 8,88 0,27 -0,23 0,35 3,9 PL-1880B 12 -8,1 313,1 11,85 0,18 -0,35 0,39 3,3 PL-1880B 15 -8,3 312,7 14,82 0,07 -0,48 0,49 3,2 PL-1880B 18 -8,3 312,5 17,78 -0,06 -0,62 0,62 3,5 PL-1880B 21 -8,6 312,7 20,75 -0,19 -0,76 0,78 3,7 PL-1880B 24 -8,8 313,2 23,71 -0,29 -0,92 0,96 4,0
PL-1880C 0 -6,1 322,1 0 0 0
Magneticdisturbancein angle of departure
PL-1880C 3 -6,6 314,2 2,97 0,16 -0,04 0,16 5,5 PL-1880C 6 -6,9 313,4 5,95 0,1 -0,09 0,13 2,2 PL-1880C 9 -7,2 312,6 8,93 0 -0,16 0,16 1,8 PL-1880C 12 -7,6 311,9 11,9 -0,15 -0,25 0,29 2,4 PL-1880C 15 -7,9 312,1 14,87 -0,3 -0,36 0,47 3,1 PL-1880C 18 -7,8 311,8 17,84 -0,46 -0,47 0,66 3,7 PL-1880C 21 -7,8 311,7 20,8 -0,63 -0,58 0,86 4,1 PL-1880C 24 -7,3 312,6 23,77 -0,78 -0,68 1,03 4,3 PL-1880D 0 -5,8 315,2 0 0 0 PL-1880D 3 -6,5 313,8 2,98 -0,03 -0,02 0,04 1,2 PL-1880D 6 -6,6 314,3 5,96 -0,08 -0,07 0,11 1,8 PL-1880D 9 -7,4 314 8,94 -0,12 -0,14 0,18 2,0 PL-1880D 12 -7 314,1 11,92 -0,17 -0,21 0,27 2,3 PL-1880D 15 -7,3 314,1 14,89 -0,22 -0,29 0,36 2,4 PL-1880D 18 -7,8 314,2 17,87 -0,26 -0,39 0,47 2,6 PL-1880D 21 -7,9 314,7 20,84 -0,29 -0,51 0,59 2,8 PL-1880D 24 -8,3 315,5 23,81 -0,29 -0,63 0,69 2,9

90
91
APPENDIX C. DRILL PLAN REPORT FOR GROUTING HOLES - FIELD TEST I
92
93
APPENDIX D. GROUTING PLAN – FIELD TEST I
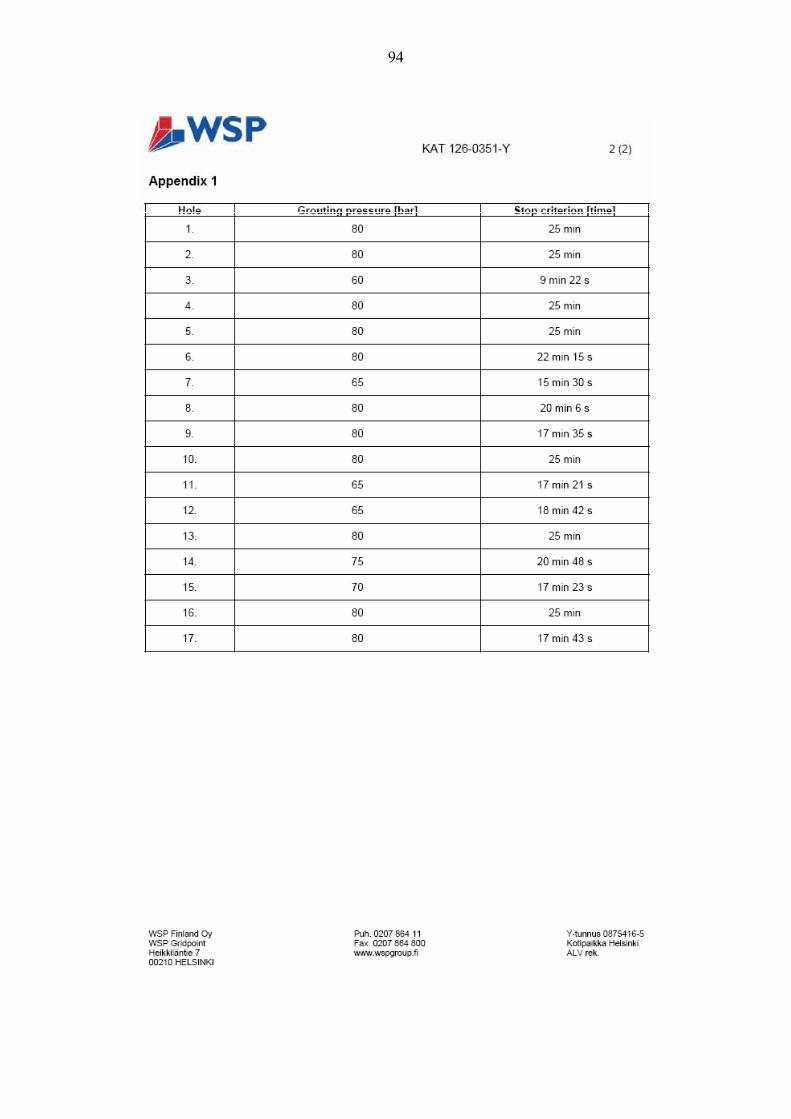
94
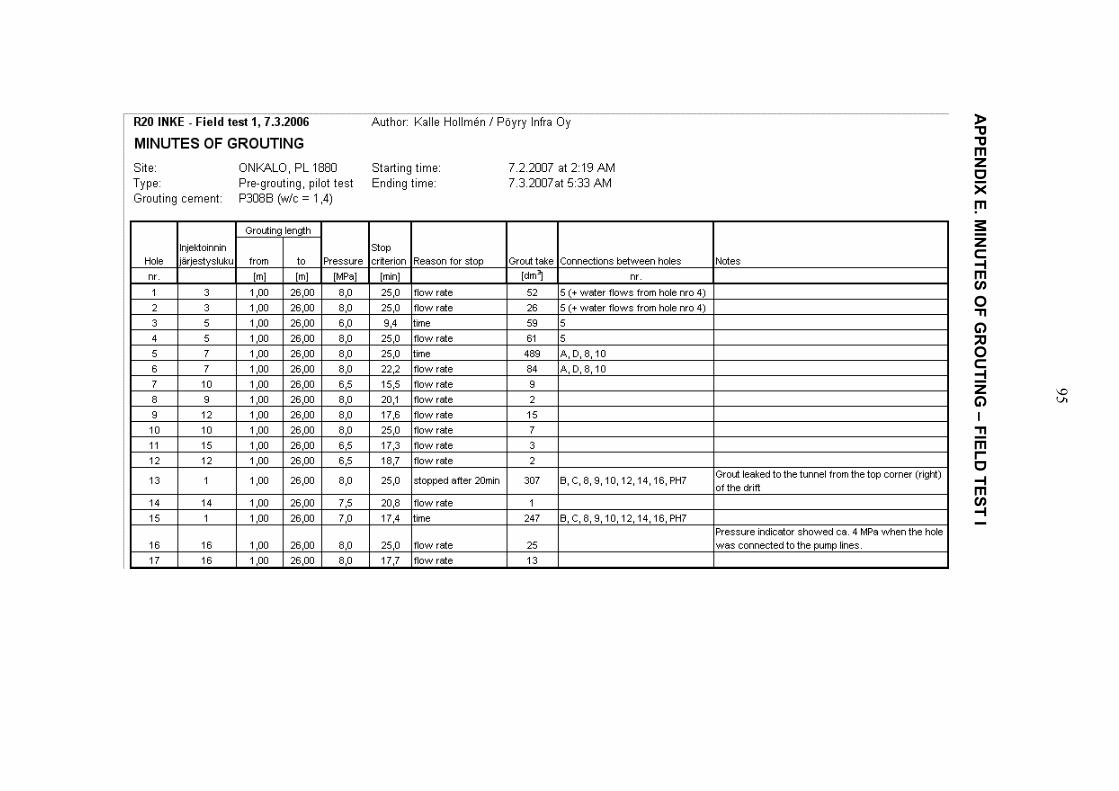
95
AP
PE
ND
IX E
. MIN
UT
ES
OF
GR
OU
TIN
G –
FIE
LD
TE
ST
I

96
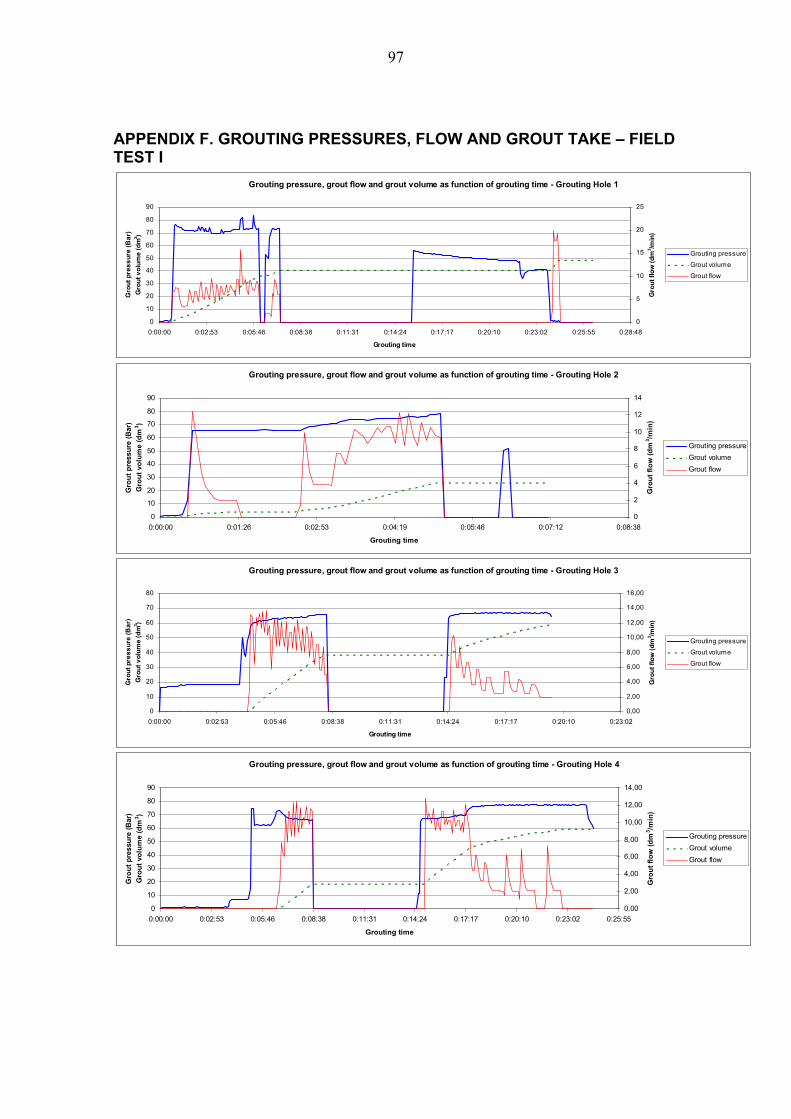
97
APPENDIX F. GROUTING PRESSURES, FLOW AND GROUT TAKE – FIELD TEST I
Grouting pressure, grout flow and grout volume as function of grouting time - Grouting Hole 1
0
10
20
30
40
50
60
70
80
90
0:00:00 0:02:53 0:05:46 0:08:38 0:11:31 0:14:24 0:17:17 0:20:10 0:23:02 0:25:55 0:28:48
Grouting time
Gro
ut
pre
ss
ure
(B
ar)
Gro
ut
vo
lum
e (
dm
3 )
0
5
10
15
20
25
Gro
ut
flo
w (
dm
3 /min
)
Grouting pressure
Grout volume
Grout flow
Grouting pressure, grout flow and grout volume as function of grouting time - Grouting Hole 2
0
10
20
30
40
50
60
70
80
90
0:00:00 0:01:26 0:02:53 0:04:19 0:05:46 0:07:12 0:08:38
Grouting time
Gro
ut
pre
ssu
re (
Bar
)
Gro
ut
volu
me
(dm
3)
0
2
4
6
8
10
12
14
Gro
ut
flo
w (
dm
3/m
in)
Grouting pressure
Grout volume
Grout flow
Grouting pressure, grout flow and grout volume as function of grouting time - Grouting Hole 3
0
10
20
30
40
50
60
70
80
0:00:00 0:02:53 0:05:46 0:08:38 0:11:31 0:14:24 0:17:17 0:20:10 0:23:02
Grouting time
Gro
ut
pre
ss
ure
(B
ar)
Gro
ut
vo
lum
e (
dm
3 )
0,00
2,00
4,00
6,00
8,00
10,00
12,00
14,00
16,00
Gro
ut
flo
w (
dm
3 /min
)
Grouting pressure
Grout volume
Grout flow
Grouting pressure, grout flow and grout volume as function of grouting time - Grouting Hole 4
0
10
20
30
40
50
60
70
80
90
0:00:00 0:02:53 0:05:46 0:08:38 0:11:31 0:14:24 0:17:17 0:20:10 0:23:02 0:25:55
Grouting time
Gro
ut
pre
ssu
re (
Bar
)
Gro
ut
volu
me
(dm
3 )
0,00
2,00
4,00
6,00
8,00
10,00
12,00
14,00
Gro
ut
flo
w (
dm
3 /min
)
Grouting pressure
Grout volume
Grout flow
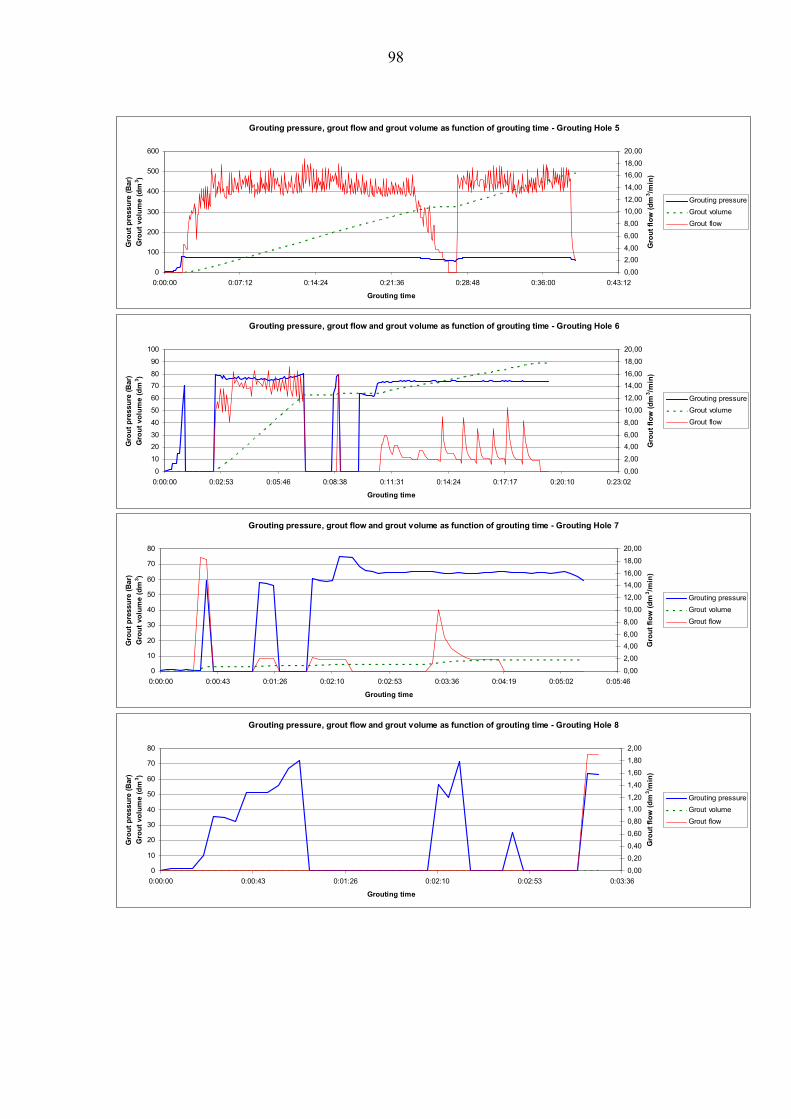
98
Grouting pressure, grout flow and grout volume as function of grouting time - Grouting Hole 5
0
100
200
300
400
500
600
0:00:00 0:07:12 0:14:24 0:21:36 0:28:48 0:36:00 0:43:12
Grouting time
Gro
ut
pre
ssu
re (
Bar
)
Gro
ut
volu
me
(dm
3 )
0,00
2,00
4,00
6,00
8,00
10,00
12,00
14,00
16,00
18,00
20,00
Gro
ut
flo
w (
dm
3 /min
)
Grouting pressure
Grout volume
Grout flow
Grouting pressure, grout flow and grout volume as function of grouting time - Grouting Hole 6
0
10
20
30
40
50
60
70
80
90
100
0:00:00 0:02:53 0:05:46 0:08:38 0:11:31 0:14:24 0:17:17 0:20:10 0:23:02
Grouting time
Gro
ut
pre
ssu
re (
Bar
)
Gro
ut
volu
me
(dm
3 )
0,00
2,00
4,00
6,00
8,00
10,00
12,00
14,00
16,00
18,00
20,00
Gro
ut
flo
w (
dm
3 /min
)
Grouting pressure
Grout volume
Grout flow
Grouting pressure, grout flow and grout volume as function of grouting time - Grouting Hole 7
0
10
20
30
40
50
60
70
80
0:00:00 0:00:43 0:01:26 0:02:10 0:02:53 0:03:36 0:04:19 0:05:02 0:05:46
Grouting time
Gro
ut
pre
ssu
re (
Bar
)
Gro
ut
volu
me
(dm
3)
0,00
2,00
4,00
6,00
8,00
10,00
12,00
14,00
16,00
18,00
20,00
Gro
ut
flo
w (
dm
3/m
in)
Grouting pressure
Grout volume
Grout flow
Grouting pressure, grout flow and grout volume as function of grouting time - Grouting Hole 8
0
10
20
30
40
50
60
70
80
0:00:00 0:00:43 0:01:26 0:02:10 0:02:53 0:03:36
Grouting time
Gro
ut
pre
ssu
re (
Bar
)
Gro
ut
volu
me
(dm
3 )
0,00
0,20
0,40
0,60
0,80
1,00
1,20
1,40
1,60
1,80
2,00
Gro
ut
flo
w (
dm
3 /min
)
Grouting pressure
Grout volume
Grout flow
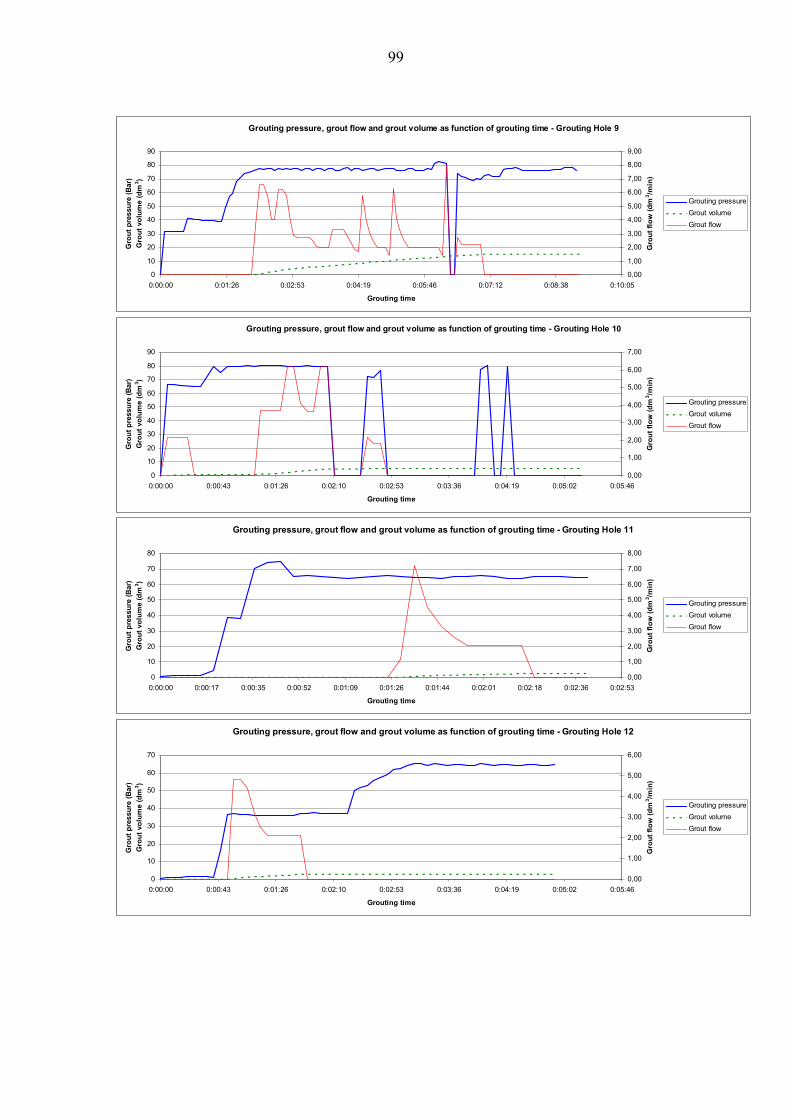
99
Grouting pressure, grout flow and grout volume as function of grouting time - Grouting Hole 9
0
10
20
30
40
50
60
70
80
90
0:00:00 0:01:26 0:02:53 0:04:19 0:05:46 0:07:12 0:08:38 0:10:05
Grouting time
Gro
ut
pre
ssu
re (
Bar
)
Gro
ut
volu
me
(dm
3)
0,00
1,00
2,00
3,00
4,00
5,00
6,00
7,00
8,00
9,00
Gro
ut
flo
w (
dm
3 /min
)
Grouting pressure
Grout volume
Grout flow
Grouting pressure, grout flow and grout volume as function of grouting time - Grouting Hole 10
0
10
20
30
40
50
60
70
80
90
0:00:00 0:00:43 0:01:26 0:02:10 0:02:53 0:03:36 0:04:19 0:05:02 0:05:46
Grouting time
Gro
ut
pre
ssu
re (
Bar
)
Gro
ut
volu
me
(dm
3 )
0,00
1,00
2,00
3,00
4,00
5,00
6,00
7,00
Gro
ut
flo
w (
dm
3 /min
)
Grouting pressure
Grout volume
Grout flow
Grouting pressure, grout flow and grout volume as function of grouting time - Grouting Hole 11
0
10
20
30
40
50
60
70
80
0:00:00 0:00:17 0:00:35 0:00:52 0:01:09 0:01:26 0:01:44 0:02:01 0:02:18 0:02:36 0:02:53
Grouting time
Gro
ut
pre
ssu
re (
Bar
)
Gro
ut
volu
me
(dm
3 )
0,00
1,00
2,00
3,00
4,00
5,00
6,00
7,00
8,00
Gro
ut
flo
w (
dm
3 /min
)
Grouting pressure
Grout volume
Grout flow
Grouting pressure, grout flow and grout volume as function of grouting time - Grouting Hole 12
0
10
20
30
40
50
60
70
0:00:00 0:00:43 0:01:26 0:02:10 0:02:53 0:03:36 0:04:19 0:05:02 0:05:46
Grouting time
Gro
ut
pre
ssu
re (
Bar
)
Gro
ut
volu
me
(dm
3 )
0,00
1,00
2,00
3,00
4,00
5,00
6,00
Gro
ut
flo
w (
dm
3 /min
)
Grouting pressure
Grout volume
Grout flow
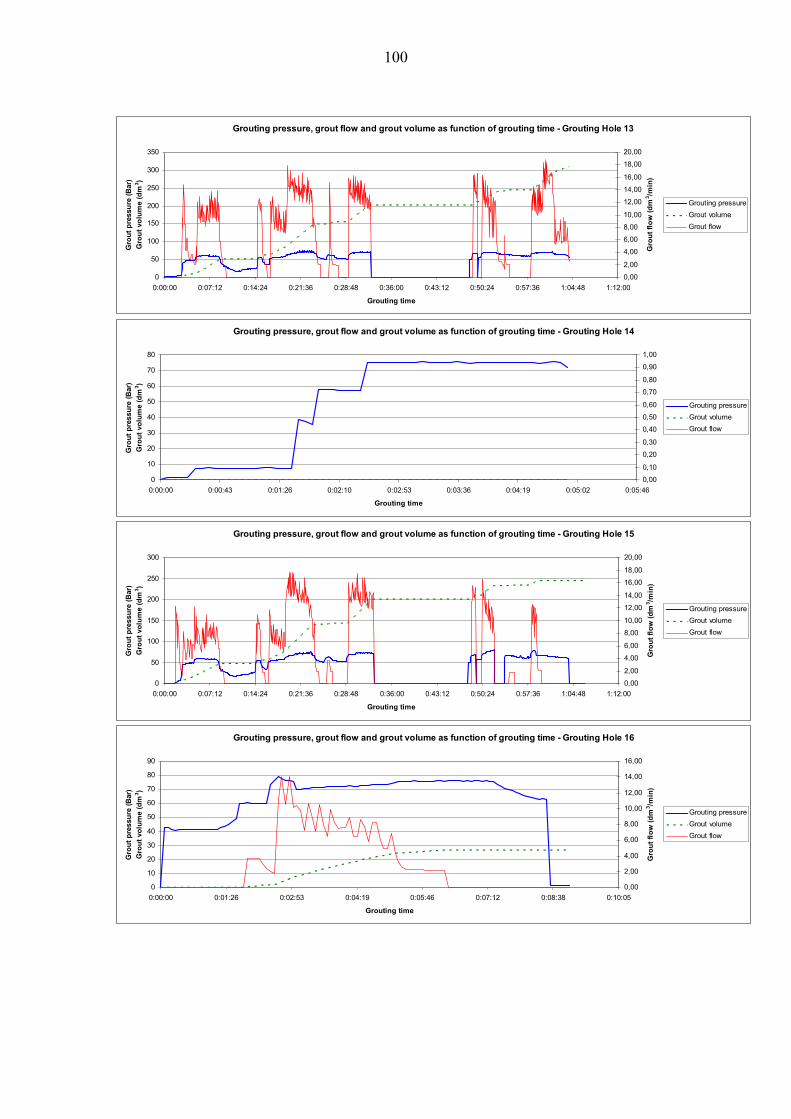
100
Grouting pressure, grout flow and grout volume as function of grouting time - Grouting Hole 13
0
50
100
150
200
250
300
350
0:00:00 0:07:12 0:14:24 0:21:36 0:28:48 0:36:00 0:43:12 0:50:24 0:57:36 1:04:48 1:12:00
Grouting time
Gro
ut
pre
ssu
re (
Bar
)
Gro
ut
volu
me
(dm
3 )
0,00
2,00
4,00
6,00
8,00
10,00
12,00
14,00
16,00
18,00
20,00
Gro
ut
flo
w (
dm
3 /min
)
Grouting pressure
Grout volume
Grout flow
Grouting pressure, grout flow and grout volume as function of grouting time - Grouting Hole 14
0
10
20
30
40
50
60
70
80
0:00:00 0:00:43 0:01:26 0:02:10 0:02:53 0:03:36 0:04:19 0:05:02 0:05:46
Grouting time
Gro
ut
pre
ssu
re (
Bar
)
Gro
ut
volu
me
(dm
3 )
0,00
0,10
0,20
0,30
0,40
0,50
0,60
0,70
0,80
0,90
1,00
Grouting pressure
Grout volume
Grout flow
Grouting pressure, grout flow and grout volume as function of grouting time - Grouting Hole 15
0
50
100
150
200
250
300
0:00:00 0:07:12 0:14:24 0:21:36 0:28:48 0:36:00 0:43:12 0:50:24 0:57:36 1:04:48 1:12:00
Grouting time
Gro
ut
pre
ssu
re (
Bar
)
Gro
ut
volu
me
(dm
3 )
0,00
2,00
4,00
6,00
8,00
10,00
12,00
14,00
16,00
18,00
20,00
Gro
ut
flo
w (
dm
3 /min
)
Grouting pressure
Grout volume
Grout flow
Grouting pressure, grout flow and grout volume as function of grouting time - Grouting Hole 16
0
10
20
30
40
50
60
70
80
90
0:00:00 0:01:26 0:02:53 0:04:19 0:05:46 0:07:12 0:08:38 0:10:05
Grouting time
Gro
ut
pre
ssu
re (
Bar
)
Gro
ut
volu
me
(dm
3 )
0,00
2,00
4,00
6,00
8,00
10,00
12,00
14,00
16,00
Gro
ut
flo
w (
dm
3 /min
)
Grouting pressure
Grout volume
Grout flow
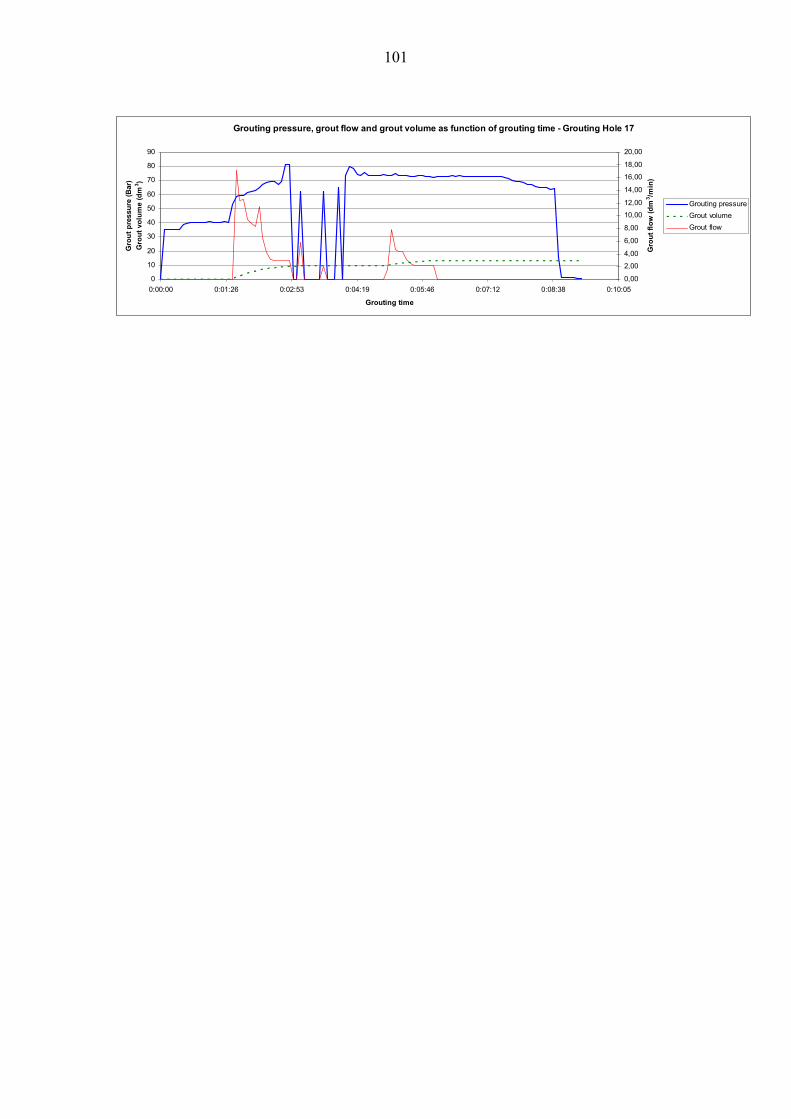
101
Grouting pressure, grout flow and grout volume as function of grouting time - Grouting Hole 17
0
10
20
30
40
50
60
70
80
90
0:00:00 0:01:26 0:02:53 0:04:19 0:05:46 0:07:12 0:08:38 0:10:05
Grouting time
Gro
ut
pre
ssu
re (
Bar
)
Gro
ut
volu
me
(dm
3 )
0,00
2,00
4,00
6,00
8,00
10,00
12,00
14,00
16,00
18,00
20,00
Gro
ut
flo
w (
dm
3 /min
)
Grouting pressure
Grout volume
Grout flow

102
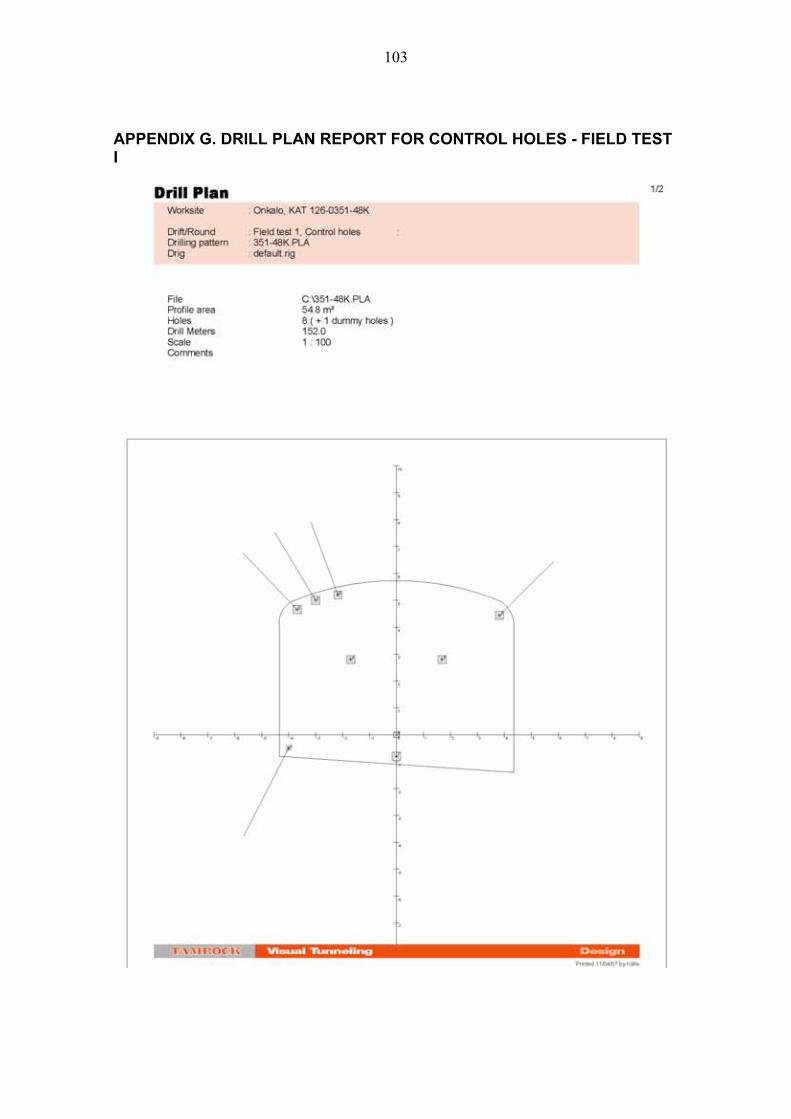
103
APPENDIX G. DRILL PLAN REPORT FOR CONTROL HOLES - FIELD TEST I
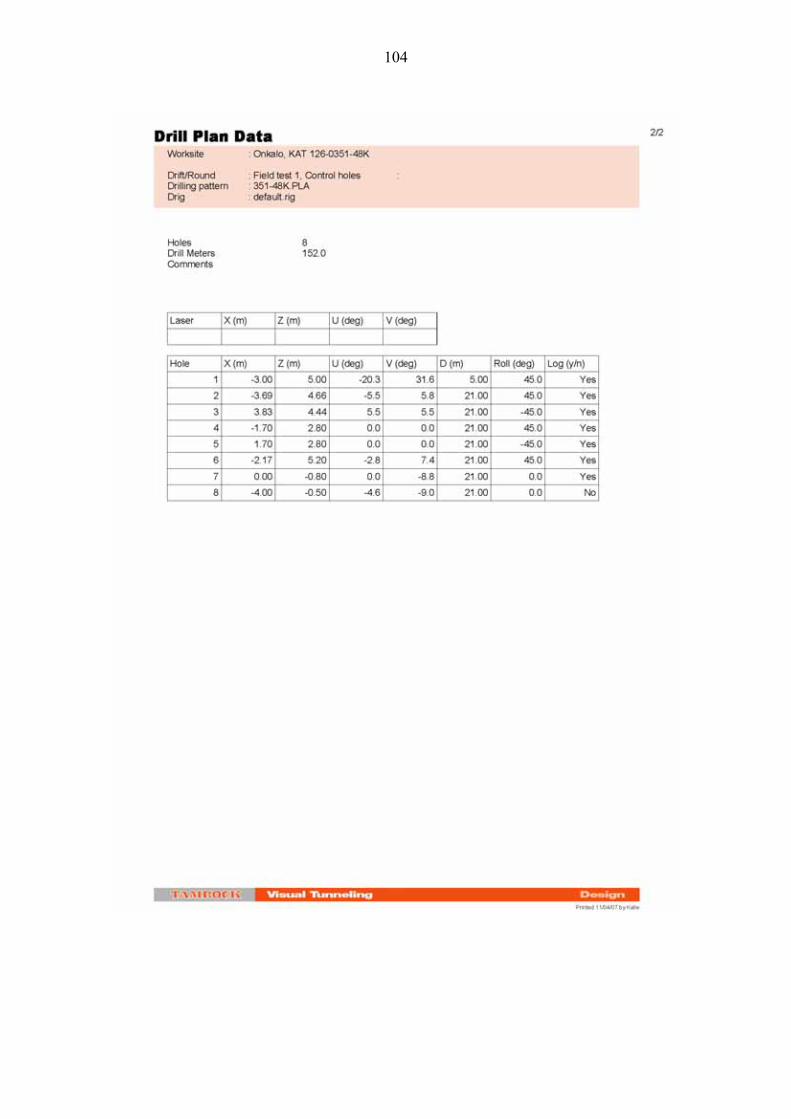
104
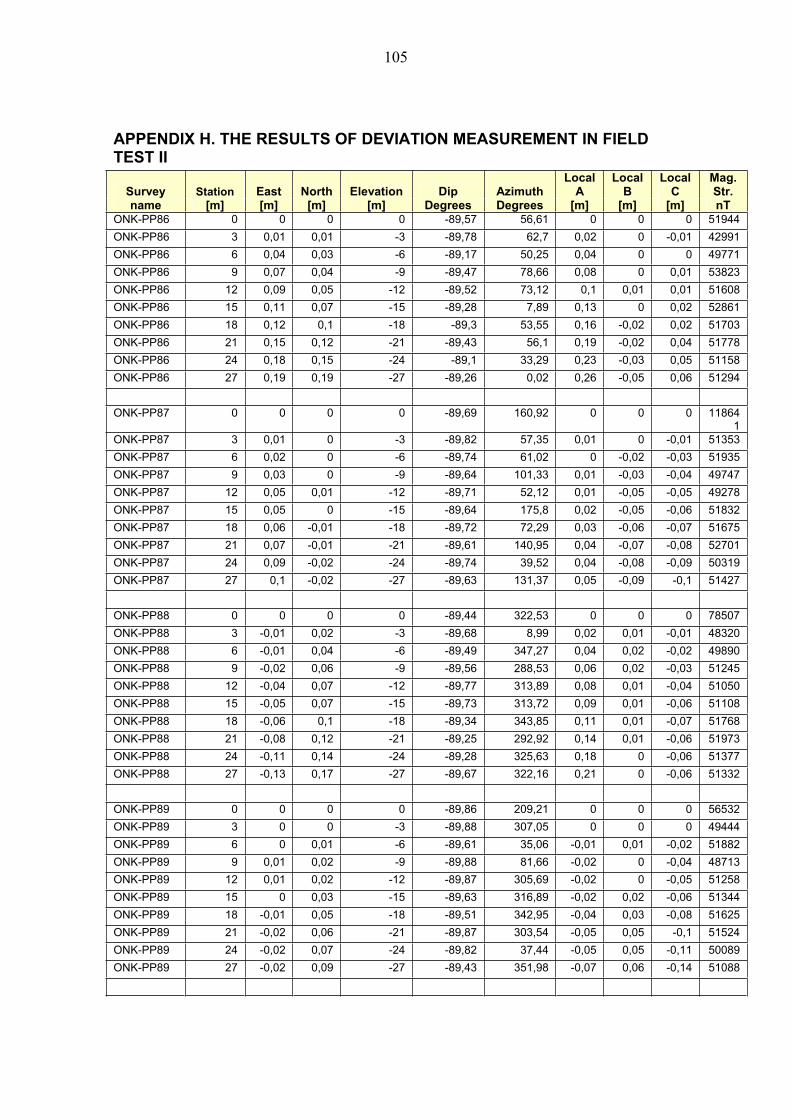
105
APPENDIX H. THE RESULTS OF DEVIATION MEASUREMENT IN FIELD TEST II
Survey Station East North Elevation Dip Azimuth Local
ALocal
BLocal
CMag.Str.
name [m] [m] [m] [m] Degrees Degrees [m] [m] [m] nTONK-PP86 0 0 0 0 -89,57 56,61 0 0 0 51944
ONK-PP86 3 0,01 0,01 -3 -89,78 62,7 0,02 0 -0,01 42991
ONK-PP86 6 0,04 0,03 -6 -89,17 50,25 0,04 0 0 49771
ONK-PP86 9 0,07 0,04 -9 -89,47 78,66 0,08 0 0,01 53823
ONK-PP86 12 0,09 0,05 -12 -89,52 73,12 0,1 0,01 0,01 51608
ONK-PP86 15 0,11 0,07 -15 -89,28 7,89 0,13 0 0,02 52861
ONK-PP86 18 0,12 0,1 -18 -89,3 53,55 0,16 -0,02 0,02 51703
ONK-PP86 21 0,15 0,12 -21 -89,43 56,1 0,19 -0,02 0,04 51778
ONK-PP86 24 0,18 0,15 -24 -89,1 33,29 0,23 -0,03 0,05 51158
ONK-PP86 27 0,19 0,19 -27 -89,26 0,02 0,26 -0,05 0,06 51294
ONK-PP87 0 0 0 0 -89,69 160,92 0 0 0 118641
ONK-PP87 3 0,01 0 -3 -89,82 57,35 0,01 0 -0,01 51353
ONK-PP87 6 0,02 0 -6 -89,74 61,02 0 -0,02 -0,03 51935
ONK-PP87 9 0,03 0 -9 -89,64 101,33 0,01 -0,03 -0,04 49747
ONK-PP87 12 0,05 0,01 -12 -89,71 52,12 0,01 -0,05 -0,05 49278
ONK-PP87 15 0,05 0 -15 -89,64 175,8 0,02 -0,05 -0,06 51832
ONK-PP87 18 0,06 -0,01 -18 -89,72 72,29 0,03 -0,06 -0,07 51675
ONK-PP87 21 0,07 -0,01 -21 -89,61 140,95 0,04 -0,07 -0,08 52701
ONK-PP87 24 0,09 -0,02 -24 -89,74 39,52 0,04 -0,08 -0,09 50319
ONK-PP87 27 0,1 -0,02 -27 -89,63 131,37 0,05 -0,09 -0,1 51427
ONK-PP88 0 0 0 0 -89,44 322,53 0 0 0 78507
ONK-PP88 3 -0,01 0,02 -3 -89,68 8,99 0,02 0,01 -0,01 48320
ONK-PP88 6 -0,01 0,04 -6 -89,49 347,27 0,04 0,02 -0,02 49890
ONK-PP88 9 -0,02 0,06 -9 -89,56 288,53 0,06 0,02 -0,03 51245
ONK-PP88 12 -0,04 0,07 -12 -89,77 313,89 0,08 0,01 -0,04 51050
ONK-PP88 15 -0,05 0,07 -15 -89,73 313,72 0,09 0,01 -0,06 51108
ONK-PP88 18 -0,06 0,1 -18 -89,34 343,85 0,11 0,01 -0,07 51768
ONK-PP88 21 -0,08 0,12 -21 -89,25 292,92 0,14 0,01 -0,06 51973
ONK-PP88 24 -0,11 0,14 -24 -89,28 325,63 0,18 0 -0,06 51377
ONK-PP88 27 -0,13 0,17 -27 -89,67 322,16 0,21 0 -0,06 51332
ONK-PP89 0 0 0 0 -89,86 209,21 0 0 0 56532
ONK-PP89 3 0 0 -3 -89,88 307,05 0 0 0 49444
ONK-PP89 6 0 0,01 -6 -89,61 35,06 -0,01 0,01 -0,02 51882
ONK-PP89 9 0,01 0,02 -9 -89,88 81,66 -0,02 0 -0,04 48713
ONK-PP89 12 0,01 0,02 -12 -89,87 305,69 -0,02 0 -0,05 51258
ONK-PP89 15 0 0,03 -15 -89,63 316,89 -0,02 0,02 -0,06 51344
ONK-PP89 18 -0,01 0,05 -18 -89,51 342,95 -0,04 0,03 -0,08 51625
ONK-PP89 21 -0,02 0,06 -21 -89,87 303,54 -0,05 0,05 -0,1 51524
ONK-PP89 24 -0,02 0,07 -24 -89,82 37,44 -0,05 0,05 -0,11 50089
ONK-PP89 27 -0,02 0,09 -27 -89,43 351,98 -0,07 0,06 -0,14 51088
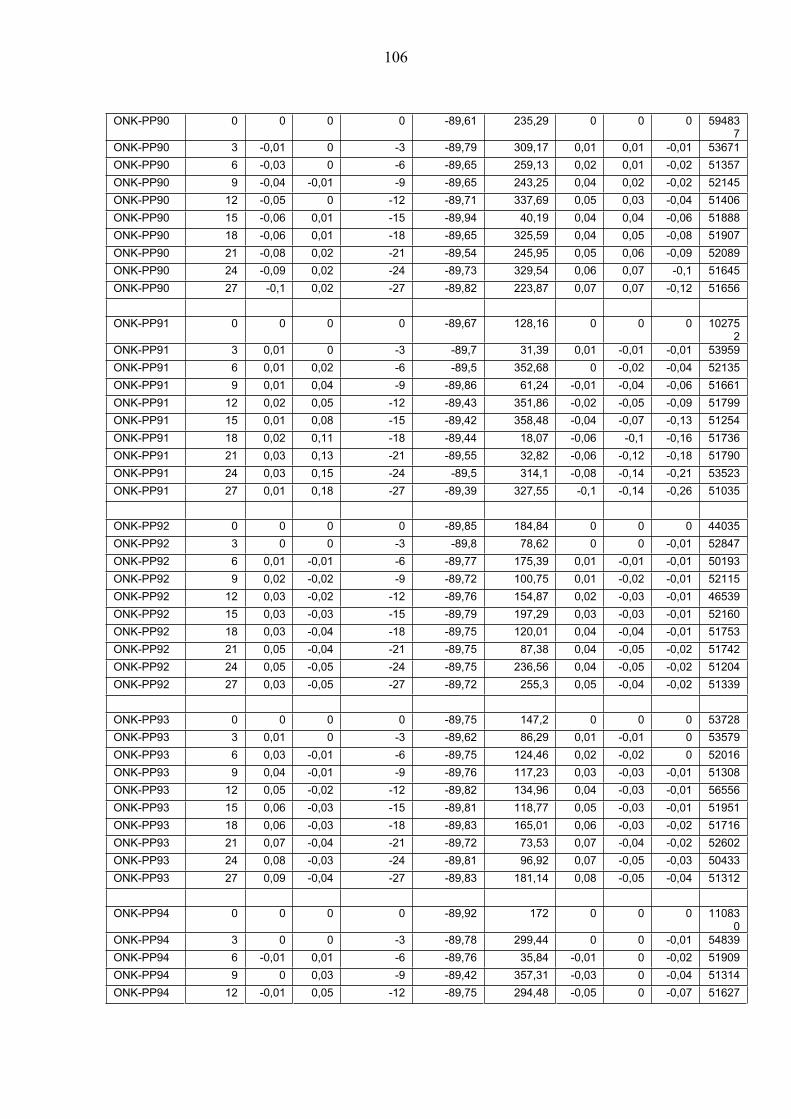
106
ONK-PP90 0 0 0 0 -89,61 235,29 0 0 0 594837
ONK-PP90 3 -0,01 0 -3 -89,79 309,17 0,01 0,01 -0,01 53671
ONK-PP90 6 -0,03 0 -6 -89,65 259,13 0,02 0,01 -0,02 51357
ONK-PP90 9 -0,04 -0,01 -9 -89,65 243,25 0,04 0,02 -0,02 52145
ONK-PP90 12 -0,05 0 -12 -89,71 337,69 0,05 0,03 -0,04 51406
ONK-PP90 15 -0,06 0,01 -15 -89,94 40,19 0,04 0,04 -0,06 51888
ONK-PP90 18 -0,06 0,01 -18 -89,65 325,59 0,04 0,05 -0,08 51907
ONK-PP90 21 -0,08 0,02 -21 -89,54 245,95 0,05 0,06 -0,09 52089
ONK-PP90 24 -0,09 0,02 -24 -89,73 329,54 0,06 0,07 -0,1 51645
ONK-PP90 27 -0,1 0,02 -27 -89,82 223,87 0,07 0,07 -0,12 51656
ONK-PP91 0 0 0 0 -89,67 128,16 0 0 0 102752
ONK-PP91 3 0,01 0 -3 -89,7 31,39 0,01 -0,01 -0,01 53959
ONK-PP91 6 0,01 0,02 -6 -89,5 352,68 0 -0,02 -0,04 52135
ONK-PP91 9 0,01 0,04 -9 -89,86 61,24 -0,01 -0,04 -0,06 51661
ONK-PP91 12 0,02 0,05 -12 -89,43 351,86 -0,02 -0,05 -0,09 51799
ONK-PP91 15 0,01 0,08 -15 -89,42 358,48 -0,04 -0,07 -0,13 51254
ONK-PP91 18 0,02 0,11 -18 -89,44 18,07 -0,06 -0,1 -0,16 51736
ONK-PP91 21 0,03 0,13 -21 -89,55 32,82 -0,06 -0,12 -0,18 51790
ONK-PP91 24 0,03 0,15 -24 -89,5 314,1 -0,08 -0,14 -0,21 53523
ONK-PP91 27 0,01 0,18 -27 -89,39 327,55 -0,1 -0,14 -0,26 51035
ONK-PP92 0 0 0 0 -89,85 184,84 0 0 0 44035
ONK-PP92 3 0 0 -3 -89,8 78,62 0 0 -0,01 52847
ONK-PP92 6 0,01 -0,01 -6 -89,77 175,39 0,01 -0,01 -0,01 50193
ONK-PP92 9 0,02 -0,02 -9 -89,72 100,75 0,01 -0,02 -0,01 52115
ONK-PP92 12 0,03 -0,02 -12 -89,76 154,87 0,02 -0,03 -0,01 46539
ONK-PP92 15 0,03 -0,03 -15 -89,79 197,29 0,03 -0,03 -0,01 52160
ONK-PP92 18 0,03 -0,04 -18 -89,75 120,01 0,04 -0,04 -0,01 51753
ONK-PP92 21 0,05 -0,04 -21 -89,75 87,38 0,04 -0,05 -0,02 51742
ONK-PP92 24 0,05 -0,05 -24 -89,75 236,56 0,04 -0,05 -0,02 51204
ONK-PP92 27 0,03 -0,05 -27 -89,72 255,3 0,05 -0,04 -0,02 51339
ONK-PP93 0 0 0 0 -89,75 147,2 0 0 0 53728
ONK-PP93 3 0,01 0 -3 -89,62 86,29 0,01 -0,01 0 53579
ONK-PP93 6 0,03 -0,01 -6 -89,75 124,46 0,02 -0,02 0 52016
ONK-PP93 9 0,04 -0,01 -9 -89,76 117,23 0,03 -0,03 -0,01 51308
ONK-PP93 12 0,05 -0,02 -12 -89,82 134,96 0,04 -0,03 -0,01 56556
ONK-PP93 15 0,06 -0,03 -15 -89,81 118,77 0,05 -0,03 -0,01 51951
ONK-PP93 18 0,06 -0,03 -18 -89,83 165,01 0,06 -0,03 -0,02 51716
ONK-PP93 21 0,07 -0,04 -21 -89,72 73,53 0,07 -0,04 -0,02 52602
ONK-PP93 24 0,08 -0,03 -24 -89,81 96,92 0,07 -0,05 -0,03 50433
ONK-PP93 27 0,09 -0,04 -27 -89,83 181,14 0,08 -0,05 -0,04 51312
ONK-PP94 0 0 0 0 -89,92 172 0 0 0 110830
ONK-PP94 3 0 0 -3 -89,78 299,44 0 0 -0,01 54839
ONK-PP94 6 -0,01 0,01 -6 -89,76 35,84 -0,01 0 -0,02 51909
ONK-PP94 9 0 0,03 -9 -89,42 357,31 -0,03 0 -0,04 51314
ONK-PP94 12 -0,01 0,05 -12 -89,75 294,48 -0,05 0 -0,07 51627
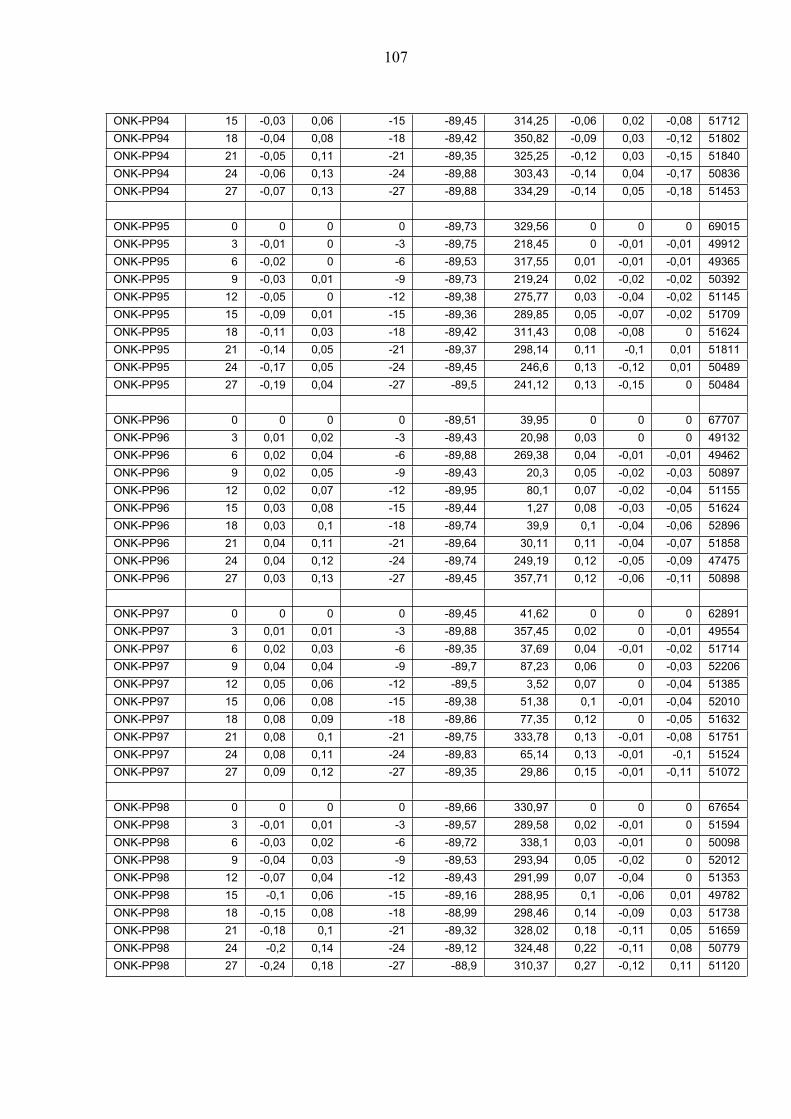
107
ONK-PP94 15 -0,03 0,06 -15 -89,45 314,25 -0,06 0,02 -0,08 51712
ONK-PP94 18 -0,04 0,08 -18 -89,42 350,82 -0,09 0,03 -0,12 51802
ONK-PP94 21 -0,05 0,11 -21 -89,35 325,25 -0,12 0,03 -0,15 51840
ONK-PP94 24 -0,06 0,13 -24 -89,88 303,43 -0,14 0,04 -0,17 50836
ONK-PP94 27 -0,07 0,13 -27 -89,88 334,29 -0,14 0,05 -0,18 51453
ONK-PP95 0 0 0 0 -89,73 329,56 0 0 0 69015
ONK-PP95 3 -0,01 0 -3 -89,75 218,45 0 -0,01 -0,01 49912
ONK-PP95 6 -0,02 0 -6 -89,53 317,55 0,01 -0,01 -0,01 49365
ONK-PP95 9 -0,03 0,01 -9 -89,73 219,24 0,02 -0,02 -0,02 50392
ONK-PP95 12 -0,05 0 -12 -89,38 275,77 0,03 -0,04 -0,02 51145
ONK-PP95 15 -0,09 0,01 -15 -89,36 289,85 0,05 -0,07 -0,02 51709
ONK-PP95 18 -0,11 0,03 -18 -89,42 311,43 0,08 -0,08 0 51624
ONK-PP95 21 -0,14 0,05 -21 -89,37 298,14 0,11 -0,1 0,01 51811
ONK-PP95 24 -0,17 0,05 -24 -89,45 246,6 0,13 -0,12 0,01 50489
ONK-PP95 27 -0,19 0,04 -27 -89,5 241,12 0,13 -0,15 0 50484
ONK-PP96 0 0 0 0 -89,51 39,95 0 0 0 67707
ONK-PP96 3 0,01 0,02 -3 -89,43 20,98 0,03 0 0 49132
ONK-PP96 6 0,02 0,04 -6 -89,88 269,38 0,04 -0,01 -0,01 49462
ONK-PP96 9 0,02 0,05 -9 -89,43 20,3 0,05 -0,02 -0,03 50897
ONK-PP96 12 0,02 0,07 -12 -89,95 80,1 0,07 -0,02 -0,04 51155
ONK-PP96 15 0,03 0,08 -15 -89,44 1,27 0,08 -0,03 -0,05 51624
ONK-PP96 18 0,03 0,1 -18 -89,74 39,9 0,1 -0,04 -0,06 52896
ONK-PP96 21 0,04 0,11 -21 -89,64 30,11 0,11 -0,04 -0,07 51858
ONK-PP96 24 0,04 0,12 -24 -89,74 249,19 0,12 -0,05 -0,09 47475
ONK-PP96 27 0,03 0,13 -27 -89,45 357,71 0,12 -0,06 -0,11 50898
ONK-PP97 0 0 0 0 -89,45 41,62 0 0 0 62891
ONK-PP97 3 0,01 0,01 -3 -89,88 357,45 0,02 0 -0,01 49554
ONK-PP97 6 0,02 0,03 -6 -89,35 37,69 0,04 -0,01 -0,02 51714
ONK-PP97 9 0,04 0,04 -9 -89,7 87,23 0,06 0 -0,03 52206
ONK-PP97 12 0,05 0,06 -12 -89,5 3,52 0,07 0 -0,04 51385
ONK-PP97 15 0,06 0,08 -15 -89,38 51,38 0,1 -0,01 -0,04 52010
ONK-PP97 18 0,08 0,09 -18 -89,86 77,35 0,12 0 -0,05 51632
ONK-PP97 21 0,08 0,1 -21 -89,75 333,78 0,13 -0,01 -0,08 51751
ONK-PP97 24 0,08 0,11 -24 -89,83 65,14 0,13 -0,01 -0,1 51524
ONK-PP97 27 0,09 0,12 -27 -89,35 29,86 0,15 -0,01 -0,11 51072
ONK-PP98 0 0 0 0 -89,66 330,97 0 0 0 67654
ONK-PP98 3 -0,01 0,01 -3 -89,57 289,58 0,02 -0,01 0 51594
ONK-PP98 6 -0,03 0,02 -6 -89,72 338,1 0,03 -0,01 0 50098
ONK-PP98 9 -0,04 0,03 -9 -89,53 293,94 0,05 -0,02 0 52012
ONK-PP98 12 -0,07 0,04 -12 -89,43 291,99 0,07 -0,04 0 51353
ONK-PP98 15 -0,1 0,06 -15 -89,16 288,95 0,1 -0,06 0,01 49782
ONK-PP98 18 -0,15 0,08 -18 -88,99 298,46 0,14 -0,09 0,03 51738
ONK-PP98 21 -0,18 0,1 -21 -89,32 328,02 0,18 -0,11 0,05 51659
ONK-PP98 24 -0,2 0,14 -24 -89,12 324,48 0,22 -0,11 0,08 50779
ONK-PP98 27 -0,24 0,18 -27 -88,9 310,37 0,27 -0,12 0,11 51120

108
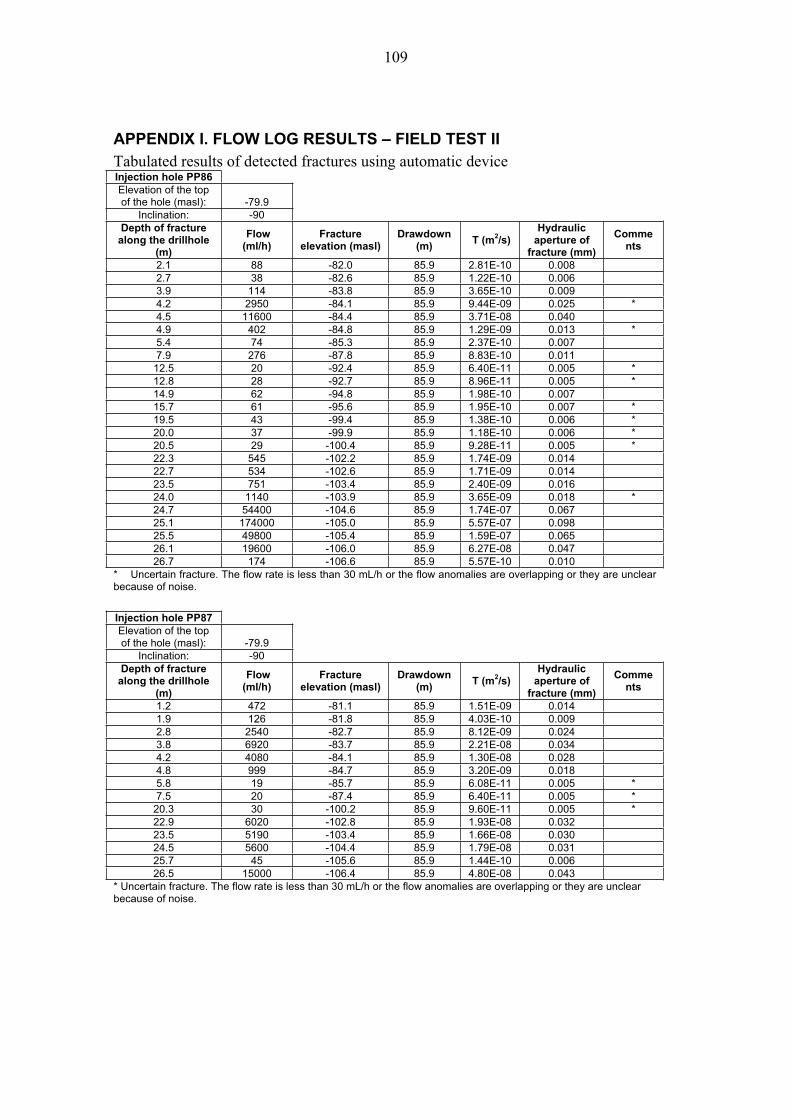
109
APPENDIX I. FLOW LOG RESULTS – FIELD TEST II Tabulated results of detected fractures using automatic device Injection hole PP86 Elevation of the top of the hole (masl): -79.9
Inclination: -90 Depth of fracture
along the drillhole (m)
Flow (ml/h)
Fracture elevation (masl)
Drawdown (m)
T (m2/s)Hydraulic
aperture of fracture (mm)
Comments
2.1 88 -82.0 85.9 2.81E-10 0.008 2.7 38 -82.6 85.9 1.22E-10 0.006 3.9 114 -83.8 85.9 3.65E-10 0.009 4.2 2950 -84.1 85.9 9.44E-09 0.025 * 4.5 11600 -84.4 85.9 3.71E-08 0.040 4.9 402 -84.8 85.9 1.29E-09 0.013 * 5.4 74 -85.3 85.9 2.37E-10 0.007 7.9 276 -87.8 85.9 8.83E-10 0.011
12.5 20 -92.4 85.9 6.40E-11 0.005 * 12.8 28 -92.7 85.9 8.96E-11 0.005 * 14.9 62 -94.8 85.9 1.98E-10 0.007 15.7 61 -95.6 85.9 1.95E-10 0.007 * 19.5 43 -99.4 85.9 1.38E-10 0.006 * 20.0 37 -99.9 85.9 1.18E-10 0.006 * 20.5 29 -100.4 85.9 9.28E-11 0.005 * 22.3 545 -102.2 85.9 1.74E-09 0.014 22.7 534 -102.6 85.9 1.71E-09 0.014 23.5 751 -103.4 85.9 2.40E-09 0.016 24.0 1140 -103.9 85.9 3.65E-09 0.018 * 24.7 54400 -104.6 85.9 1.74E-07 0.067 25.1 174000 -105.0 85.9 5.57E-07 0.098 25.5 49800 -105.4 85.9 1.59E-07 0.065 26.1 19600 -106.0 85.9 6.27E-08 0.047 26.7 174 -106.6 85.9 5.57E-10 0.010
* Uncertain fracture. The flow rate is less than 30 mL/h or the flow anomalies are overlapping or they are unclear because of noise.
Injection hole PP87 Elevation of the top of the hole (masl): -79.9
Inclination: -90 Depth of fracture
along the drillhole (m)
Flow (ml/h)
Fracture elevation (masl)
Drawdown (m)
T (m2/s)Hydraulic
aperture of fracture (mm)
Comments
1.2 472 -81.1 85.9 1.51E-09 0.014 1.9 126 -81.8 85.9 4.03E-10 0.009 2.8 2540 -82.7 85.9 8.12E-09 0.024 3.8 6920 -83.7 85.9 2.21E-08 0.034 4.2 4080 -84.1 85.9 1.30E-08 0.028 4.8 999 -84.7 85.9 3.20E-09 0.018 5.8 19 -85.7 85.9 6.08E-11 0.005 * 7.5 20 -87.4 85.9 6.40E-11 0.005 *
20.3 30 -100.2 85.9 9.60E-11 0.005 * 22.9 6020 -102.8 85.9 1.93E-08 0.032 23.5 5190 -103.4 85.9 1.66E-08 0.030 24.5 5600 -104.4 85.9 1.79E-08 0.031 25.7 45 -105.6 85.9 1.44E-10 0.006 26.5 15000 -106.4 85.9 4.80E-08 0.043
* Uncertain fracture. The flow rate is less than 30 mL/h or the flow anomalies are overlapping or they are unclear because of noise.
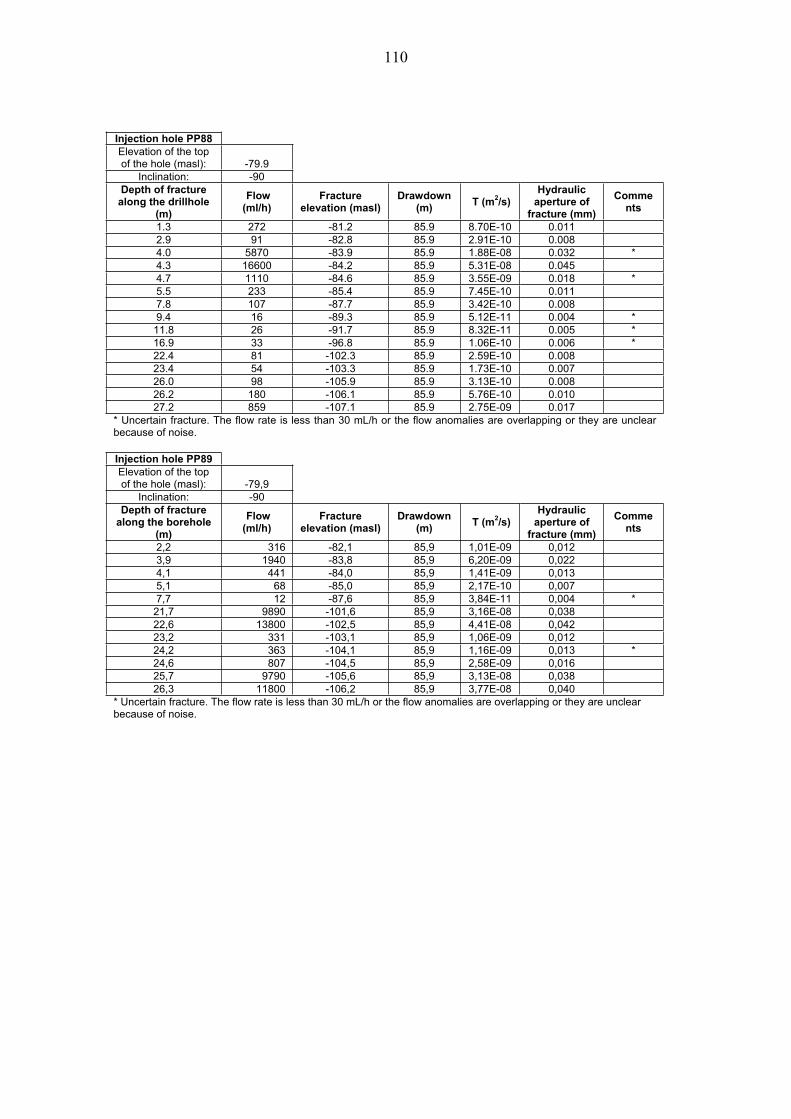
110
Injection hole PP88 Elevation of the top of the hole (masl): -79.9
Inclination: -90 Depth of fracture
along the drillhole (m)
Flow (ml/h)
Fracture elevation (masl)
Drawdown (m)
T (m2/s)Hydraulic
aperture of fracture (mm)
Comments
1.3 272 -81.2 85.9 8.70E-10 0.011 2.9 91 -82.8 85.9 2.91E-10 0.008 4.0 5870 -83.9 85.9 1.88E-08 0.032 * 4.3 16600 -84.2 85.9 5.31E-08 0.045 4.7 1110 -84.6 85.9 3.55E-09 0.018 * 5.5 233 -85.4 85.9 7.45E-10 0.011 7.8 107 -87.7 85.9 3.42E-10 0.008 9.4 16 -89.3 85.9 5.12E-11 0.004 *
11.8 26 -91.7 85.9 8.32E-11 0.005 * 16.9 33 -96.8 85.9 1.06E-10 0.006 * 22.4 81 -102.3 85.9 2.59E-10 0.008 23.4 54 -103.3 85.9 1.73E-10 0.007 26.0 98 -105.9 85.9 3.13E-10 0.008 26.2 180 -106.1 85.9 5.76E-10 0.010 27.2 859 -107.1 85.9 2.75E-09 0.017
* Uncertain fracture. The flow rate is less than 30 mL/h or the flow anomalies are overlapping or they are unclear because of noise.
Injection hole PP89 Elevation of the top of the hole (masl): -79,9
Inclination: -90 Depth of fracture
along the borehole (m)
Flow (ml/h)
Fracture elevation (masl)
Drawdown (m)
T (m2/s)Hydraulic
aperture of fracture (mm)
Comments
2,2 316 -82,1 85,9 1,01E-09 0,012 3,9 1940 -83,8 85,9 6,20E-09 0,022 4,1 441 -84,0 85,9 1,41E-09 0,013 5,1 68 -85,0 85,9 2,17E-10 0,007 7,7 12 -87,6 85,9 3,84E-11 0,004 *
21,7 9890 -101,6 85,9 3,16E-08 0,038 22,6 13800 -102,5 85,9 4,41E-08 0,042 23,2 331 -103,1 85,9 1,06E-09 0,012 24,2 363 -104,1 85,9 1,16E-09 0,013 * 24,6 807 -104,5 85,9 2,58E-09 0,016 25,7 9790 -105,6 85,9 3,13E-08 0,038 26,3 11800 -106,2 85,9 3,77E-08 0,040
* Uncertain fracture. The flow rate is less than 30 mL/h or the flow anomalies are overlapping or they are unclear because of noise.

111
Injection hole PP90 Elevation of the top of the hole (masl): -79,9
Inclination: -90 Depth of fracture
along the borehole (m)
Flow (ml/h)
Fracture elevation (masl)
Drawdown (m)
T (m2/s)Hydraulic
aperture of fracture (mm)
Comments
2,5 2470 -82,4 85,9 7,90E-09 0,024 4,0 5940 -83,9 85,9 1,90E-08 0,032 4,2 3380 -84,1 85,9 1,08E-08 0,026 5,2 310 -85,1 85,9 9,92E-10 0,012 6,0 147 -85,9 85,9 4,70E-10 0,009 6,3 98 -86,2 85,9 3,13E-10 0,008 7,6 31 -87,5 85,9 9,92E-11 0,006 8,8 14 -88,7 85,9 4,48E-11 0,004 *
16,3 20 -96,2 85,9 6,40E-11 0,005 16,6 16 -96,5 85,9 5,12E-11 0,004 * 22,8 57 -102,7 85,9 1,82E-10 0,007 24,8 439 -104,7 85,9 1,40E-09 0,013 25,7 253 -105,6 85,9 8,09E-10 0,011 26,6 363 -106,5 85,9 1,16E-09 0,013 27,1 77800 -107,0 85,9 2,49E-07 0,075
* Uncertain fracture. The flow rate is less than 30 mL/h or the flow anomalies are overlapping or they are unclear because of noise.
Injection hole PP91 Elevation of the top of the hole (masl): -79,9
Inclination: -90 Depth of fracture
along the borehole (m)
Flow (ml/h)
Fracture elevation (masl)
Drawdown (m)
T (m2/s)Hydraulic
aperture of fracture (mm)
Comments
4,4 940 -84,3 85,9 3,01E-09 0,017 * 4,7 8480 -84,6 85,9 2,71E-08 0,036 5,7 214 -85,6 85,9 6,84E-10 0,011 7,6 93 -87,5 85,9 2,97E-10 0,008 8,0 97 -87,9 85,9 3,10E-10 0,008 9,5 24 -89,4 85,9 7,68E-11 0,005 *
20,4 205 -100,3 85,9 6,56E-10 0,010 23,1 439 -103,0 85,9 1,40E-09 0,013 23,7 24 -103,6 85,9 7,68E-11 0,005 * 24,7 583 -104,6 85,9 1,86E-09 0,015 26,0 10800 -105,9 85,9 3,45E-08 0,039 26,5 1240 -106,4 85,9 3,97E-09 0,019
* Uncertain fracture. The flow rate is less than 30 mL/h or the flow anomalies are overlapping or they are unclear because of noise.
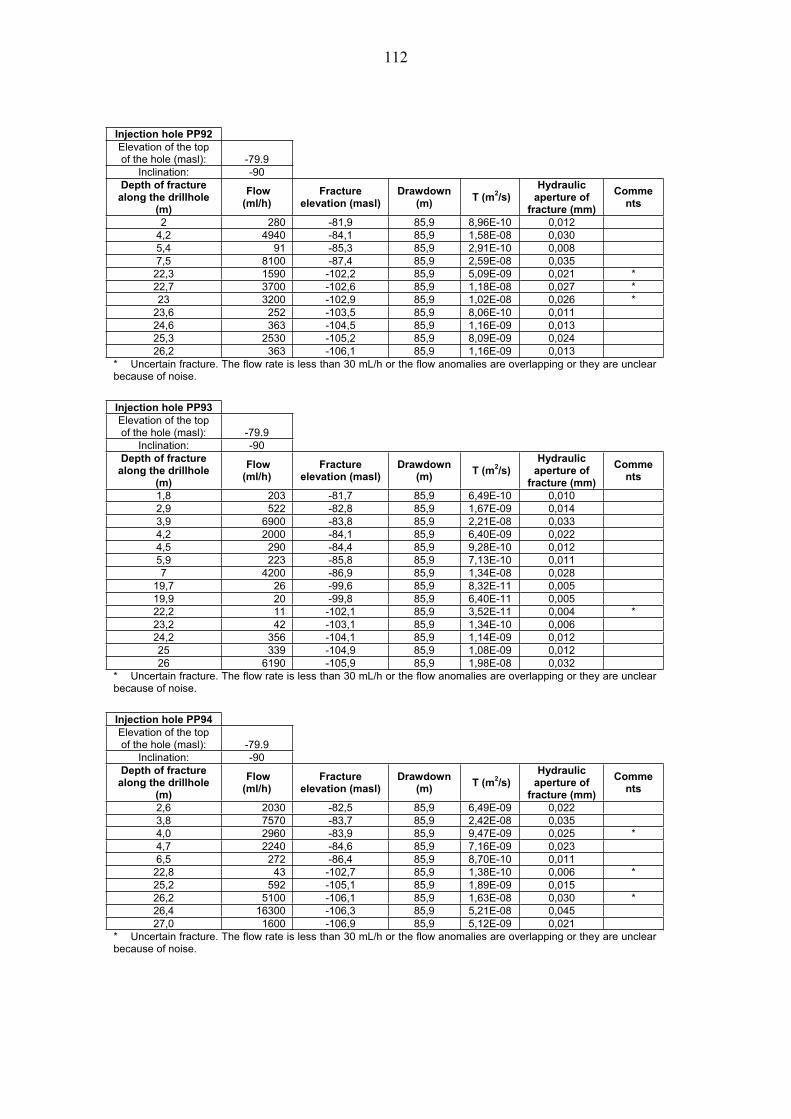
112
Injection hole PP92 Elevation of the top of the hole (masl): -79.9
Inclination: -90 Depth of fracture
along the drillhole (m)
Flow (ml/h)
Fracture elevation (masl)
Drawdown (m)
T (m2/s)Hydraulic
aperture of fracture (mm)
Comments
2 280 -81,9 85,9 8,96E-10 0,012 4,2 4940 -84,1 85,9 1,58E-08 0,030 5,4 91 -85,3 85,9 2,91E-10 0,008 7,5 8100 -87,4 85,9 2,59E-08 0,035
22,3 1590 -102,2 85,9 5,09E-09 0,021 * 22,7 3700 -102,6 85,9 1,18E-08 0,027 * 23 3200 -102,9 85,9 1,02E-08 0,026 *
23,6 252 -103,5 85,9 8,06E-10 0,011 24,6 363 -104,5 85,9 1,16E-09 0,013 25,3 2530 -105,2 85,9 8,09E-09 0,024 26,2 363 -106,1 85,9 1,16E-09 0,013
* Uncertain fracture. The flow rate is less than 30 mL/h or the flow anomalies are overlapping or they are unclear because of noise.
Injection hole PP93 Elevation of the top of the hole (masl): -79.9
Inclination: -90 Depth of fracture
along the drillhole (m)
Flow (ml/h)
Fracture elevation (masl)
Drawdown (m)
T (m2/s)Hydraulic
aperture of fracture (mm)
Comments
1,8 203 -81,7 85,9 6,49E-10 0,010 2,9 522 -82,8 85,9 1,67E-09 0,014 3,9 6900 -83,8 85,9 2,21E-08 0,033 4,2 2000 -84,1 85,9 6,40E-09 0,022 4,5 290 -84,4 85,9 9,28E-10 0,012 5,9 223 -85,8 85,9 7,13E-10 0,011 7 4200 -86,9 85,9 1,34E-08 0,028
19,7 26 -99,6 85,9 8,32E-11 0,005 19,9 20 -99,8 85,9 6,40E-11 0,005 22,2 11 -102,1 85,9 3,52E-11 0,004 * 23,2 42 -103,1 85,9 1,34E-10 0,006 24,2 356 -104,1 85,9 1,14E-09 0,012 25 339 -104,9 85,9 1,08E-09 0,012 26 6190 -105,9 85,9 1,98E-08 0,032
* Uncertain fracture. The flow rate is less than 30 mL/h or the flow anomalies are overlapping or they are unclear because of noise.
Injection hole PP94 Elevation of the top of the hole (masl): -79.9
Inclination: -90 Depth of fracture
along the drillhole (m)
Flow (ml/h)
Fracture elevation (masl)
Drawdown (m)
T (m2/s)Hydraulic
aperture of fracture (mm)
Comments
2,6 2030 -82,5 85,9 6,49E-09 0,022 3,8 7570 -83,7 85,9 2,42E-08 0,035 4,0 2960 -83,9 85,9 9,47E-09 0,025 * 4,7 2240 -84,6 85,9 7,16E-09 0,023 6,5 272 -86,4 85,9 8,70E-10 0,011
22,8 43 -102,7 85,9 1,38E-10 0,006 * 25,2 592 -105,1 85,9 1,89E-09 0,015 26,2 5100 -106,1 85,9 1,63E-08 0,030 * 26,4 16300 -106,3 85,9 5,21E-08 0,045 27,0 1600 -106,9 85,9 5,12E-09 0,021
* Uncertain fracture. The flow rate is less than 30 mL/h or the flow anomalies are overlapping or they are unclear because of noise.
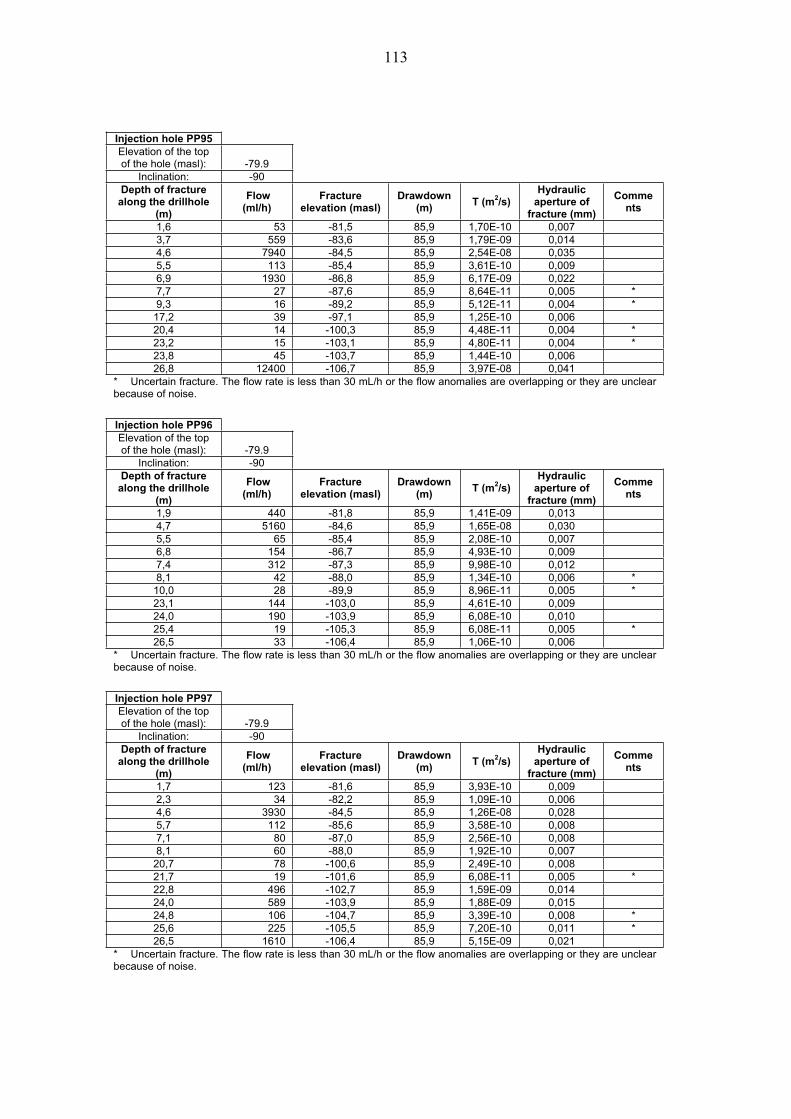
113
Injection hole PP95 Elevation of the top of the hole (masl): -79.9
Inclination: -90 Depth of fracture
along the drillhole (m)
Flow (ml/h)
Fracture elevation (masl)
Drawdown (m)
T (m2/s)Hydraulic
aperture of fracture (mm)
Comments
1,6 53 -81,5 85,9 1,70E-10 0,007 3,7 559 -83,6 85,9 1,79E-09 0,014 4,6 7940 -84,5 85,9 2,54E-08 0,035 5,5 113 -85,4 85,9 3,61E-10 0,009 6,9 1930 -86,8 85,9 6,17E-09 0,022 7,7 27 -87,6 85,9 8,64E-11 0,005 * 9,3 16 -89,2 85,9 5,12E-11 0,004 *
17,2 39 -97,1 85,9 1,25E-10 0,006 20,4 14 -100,3 85,9 4,48E-11 0,004 * 23,2 15 -103,1 85,9 4,80E-11 0,004 * 23,8 45 -103,7 85,9 1,44E-10 0,006 26,8 12400 -106,7 85,9 3,97E-08 0,041
* Uncertain fracture. The flow rate is less than 30 mL/h or the flow anomalies are overlapping or they are unclear because of noise.
Injection hole PP96 Elevation of the top of the hole (masl): -79.9
Inclination: -90 Depth of fracture
along the drillhole (m)
Flow (ml/h)
Fracture elevation (masl)
Drawdown (m)
T (m2/s)Hydraulic
aperture of fracture (mm)
Comments
1,9 440 -81,8 85,9 1,41E-09 0,013 4,7 5160 -84,6 85,9 1,65E-08 0,030 5,5 65 -85,4 85,9 2,08E-10 0,007 6,8 154 -86,7 85,9 4,93E-10 0,009 7,4 312 -87,3 85,9 9,98E-10 0,012 8,1 42 -88,0 85,9 1,34E-10 0,006 *
10,0 28 -89,9 85,9 8,96E-11 0,005 * 23,1 144 -103,0 85,9 4,61E-10 0,009 24,0 190 -103,9 85,9 6,08E-10 0,010 25,4 19 -105,3 85,9 6,08E-11 0,005 * 26,5 33 -106,4 85,9 1,06E-10 0,006
* Uncertain fracture. The flow rate is less than 30 mL/h or the flow anomalies are overlapping or they are unclear because of noise.
Injection hole PP97 Elevation of the top of the hole (masl): -79.9
Inclination: -90 Depth of fracture
along the drillhole (m)
Flow (ml/h)
Fracture elevation (masl)
Drawdown (m)
T (m2/s)Hydraulic
aperture of fracture (mm)
Comments
1,7 123 -81,6 85,9 3,93E-10 0,009 2,3 34 -82,2 85,9 1,09E-10 0,006 4,6 3930 -84,5 85,9 1,26E-08 0,028 5,7 112 -85,6 85,9 3,58E-10 0,008 7,1 80 -87,0 85,9 2,56E-10 0,008 8,1 60 -88,0 85,9 1,92E-10 0,007
20,7 78 -100,6 85,9 2,49E-10 0,008 21,7 19 -101,6 85,9 6,08E-11 0,005 * 22,8 496 -102,7 85,9 1,59E-09 0,014 24,0 589 -103,9 85,9 1,88E-09 0,015 24,8 106 -104,7 85,9 3,39E-10 0,008 * 25,6 225 -105,5 85,9 7,20E-10 0,011 * 26,5 1610 -106,4 85,9 5,15E-09 0,021
* Uncertain fracture. The flow rate is less than 30 mL/h or the flow anomalies are overlapping or they are unclear because of noise.
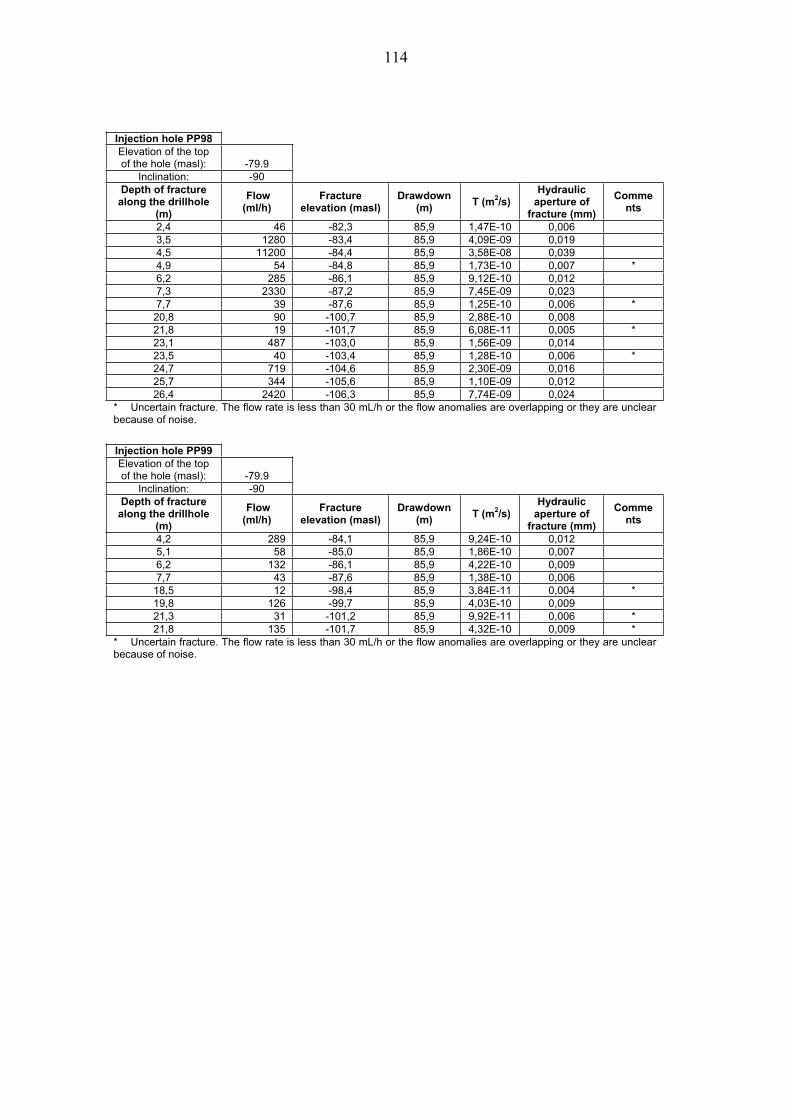
114
Injection hole PP98 Elevation of the top of the hole (masl): -79.9
Inclination: -90 Depth of fracture
along the drillhole (m)
Flow (ml/h)
Fracture elevation (masl)
Drawdown (m)
T (m2/s)Hydraulic
aperture of fracture (mm)
Comments
2,4 46 -82,3 85,9 1,47E-10 0,006 3,5 1280 -83,4 85,9 4,09E-09 0,019 4,5 11200 -84,4 85,9 3,58E-08 0,039 4,9 54 -84,8 85,9 1,73E-10 0,007 * 6,2 285 -86,1 85,9 9,12E-10 0,012 7,3 2330 -87,2 85,9 7,45E-09 0,023 7,7 39 -87,6 85,9 1,25E-10 0,006 *
20,8 90 -100,7 85,9 2,88E-10 0,008 21,8 19 -101,7 85,9 6,08E-11 0,005 * 23,1 487 -103,0 85,9 1,56E-09 0,014 23,5 40 -103,4 85,9 1,28E-10 0,006 * 24,7 719 -104,6 85,9 2,30E-09 0,016 25,7 344 -105,6 85,9 1,10E-09 0,012 26,4 2420 -106,3 85,9 7,74E-09 0,024
* Uncertain fracture. The flow rate is less than 30 mL/h or the flow anomalies are overlapping or they are unclear because of noise.
Injection hole PP99 Elevation of the top of the hole (masl): -79.9
Inclination: -90 Depth of fracture
along the drillhole (m)
Flow (ml/h)
Fracture elevation (masl)
Drawdown (m)
T (m2/s)Hydraulic
aperture of fracture (mm)
Comments
4,2 289 -84,1 85,9 9,24E-10 0,012 5,1 58 -85,0 85,9 1,86E-10 0,007 6,2 132 -86,1 85,9 4,22E-10 0,009 7,7 43 -87,6 85,9 1,38E-10 0,006
18,5 12 -98,4 85,9 3,84E-11 0,004 * 19,8 126 -99,7 85,9 4,03E-10 0,009 21,3 31 -101,2 85,9 9,92E-11 0,006 * 21,8 135 -101,7 85,9 4,32E-10 0,009 *
* Uncertain fracture. The flow rate is less than 30 mL/h or the flow anomalies are overlapping or they are unclear because of noise.
115
APPENDIX J. WLM (A ONE-METER DOUBLE PACKER) RESULTS – FIELD TEST II
NB. Measuring in the hole 90 didn’t succeed.
Hole ONK-PP 86 Pressure in each measuring: 18 MPa Measuring time in each measuring: 5 min Measuring test range in borehole (Z) Lugeon value Measuring test range in borehole (Z) Lugeon value
[m] [Lug] [m] [Lug]
-81…-82 2,852 -96…-97 0,000 -82…-83 0,046 -97…-98 0,166 -83…-84 0,043 -98…-99 0,000 -84…-85 0,159 -99…-100 0,080 -85…-86 0,000 -100…-101 0,000 -86…-87 0,000 -101…-102 0,002 -87…-88 0,000 -102…-103 0,116 -88…-89 0,000 -103…-104 0,031 -89…-90 0,000 -104…-105 1,293 -90…-91 0,000 -105…-106 1,014 -91…-92 0,000 -106…-107 0,053 -92…-93 0,000 -107…-108 0,121 -93…-94 0,000 -108…-109 0,000 -94…-95 0,000 -109…-110 0,017 -95…-96 0,000
Hole ONK-PP 87 Pressure in each measuring: 18 MPa Measuring time in each measuring: 5 min Measuring test range in borehole (Z) Lugeon value Measuring test range in borehole (Z) Lugeon value
[m] [Lug] [m] [Lug]
-82…-83 0,071 -96…-97 0,000 -83…-84 0,137 -97…-98 0,000 -84…-85 0,196 -98…-99 0,000 -85…-86 0,000 -99…-100 0,000 -86…-87 0,000 -100…-101 0,000 -87…-88 0,000 -101…-102 0,027 -88…-89 0,000 -102…-103 0,048 -89…-90 0,000 -103…-104 0,000 -90…-91 0,000 -104…-105 0,026 -91…-92 0,131 -105…-106 0,000 -92…-93 0,000 -106…-107 0,138 -93…-94 0,050 -107…-108 0,110 -94…-95 0,014 -108…-109 0,000 -95…-96 0,000 -109…-110 0,000
Hole ONK-PP 88 Pressure in each measuring: 18 MPa Measuring time in each measuring: 5 min Measuring test range in borehole (Z) Lugeon value Measuring test range in borehole (Z) Lugeon value
[m] [Lug] [m] [Lug]
-82…-83 0,067 -96…-97 0,000 -83…-84 0,000 -97…-98 0,000 -84…-85 0,175 -98…-99 0,000 -85…-86 0,058 -99…-100 0,000 -86…-87 0,002 -100…-101 0,000 -87…-88 0,000 -101…-102 0,000 -88…-89 0,043 -102…-103 0,000 -89…-90 0,011 -103…-104 0,000 -90…-91 0,000 -104…-105 0,000 -91…-92 0,104 -105…-106 0,000 -92…-93 0,000 -106…-107 0,000 -93…-94 0,000 -107…-108 0,000 -94…-95 0,000 -108…-109 0,000 -95…-96 0,000 -109…-110 0,000
116
Hole ONK-PP 89 Pressure in each measuring: 18 MPa Measuring time in each measuring: 5 min Measuring test range in borehole (Z) Lugeon value Measuring test range in borehole (Z) Lugeon value
[m] [Lug] [m] [Lug]
-82…-83 0,073 -96…-97 0,023 -83…-84 0,153 -97…-98 0,000 -84…-85 0,000 -98…-99 0,086 -85…-86 0,000 -99…-100 0,000 -86…-87 0,000 -100…-101 0,000 -87…-88 0,149 -101…-102 0,000 -88…-89 0,131 -102…-103 0,224 -89…-90 0,147 -103…-104 0,025 -90…-91 0,042 -104…-105 0,129 -91…-92 0,038 -105…-106 0,170 -92…-93 0,000 -106…-107 0,079 -93…-94 0,029 -107…-108 0,046 -94…-95 0,000 -108…-109 0,000 -95…-96 0,000 -109…-110 0,000
Hole ONK-PP 91 Pressure in each measuring: 18 MPa Measuring time in each measuring: 5 min Measuring test range in borehole (Z) Lugeon value Measuring test range in borehole (Z) Lugeon value
[m] [Lug] [m] [Lug]
-83…-84 0,000 -97…-98 0,119 -84…-85 0,165 -98…-99 0,098 -85…-86 0,083 -99…-100 0,063 -86…-87 0,034 -100…-101 0,125 -87…-88 0,132 -101…-102 0,139 -88…-89 0,107 -102…-103 0,154 -89…-90 0,126 -103…-104 0,082 -90…-91 0,066 -104…-105 0,070 -91…-92 0,007 -105…-106 0,246 -92…-93 0,085 -106…-107 0,172 -93…-94 0,029 -107…-108 0,062 -94…-95 0,057 -108…-109 0,027 -95…-96 0,035 -109…-110 0,058 -96…-97 0,000
Hole ONK-PP 92 Pressure in each measuring: 18 MPa Measuring time in each measuring: 5 min Measuring test range in borehole (Z) Lugeon value Measuring test range in borehole (Z) Lugeon value
[m] [Lug] [m] [Lug]
-83…-84 0,449 -97…-98 0,000 -84…-85 0,474 -98…-99 0,132 -85…-86 0,000 -99…-100 0,049 -86…-87 0,021 -100…-101 0,368 -87…-88 0,151 -101…-102 0,174 -88…-89 0,000 -102…-103 0,327 -89…-90 0,087 -103…-104 0,140 -90…-91 0,024 -104…-105 0,114 -91…-92 0,000 -105…-106 0,105 -92…-93 0,072 -106…-107 0,000 -93…-94 0,045 -107…-108 0,011 -94…-95 0,062 -108…-109 0,000 -95…-96 0,000 -109…-110 0,000 -96…-97 0,023
117
Hole ONK-PP 93 Pressure in each measuring: 18 MPa Measuring time in each measuring: 5 min Measuring test range in borehole (Z) Lugeon value Measuring test range in borehole (Z) Lugeon value
[m] [Lug] [m] [Lug]
-83…-84 0,224 -97…-98 0,000-84…-85 0,029 -98…-99 0,000-85…-86 0,025 -99…-100 0,000-86…-87 0,277 -100…-101 0,000-87…-88 0,000 -101…-102 0,104 -88…-89 0,009 -102…-103 0,030 -89…-90 0,000 -103…-104 0,000 -90…-91 0,000 -104…-105 0,000 -91…-92 0,000 -105…-106 0,000 -92…-93 0,000 -106…-107 0,000 -93…-94 0,000 -107…-108 0,000 -94…-95 0,000 -108…-109 0,000 -95…-96 0,000 -109…-110 0,000 -96…-97 0,000
Hole ONK-PP 94 Pressure in each measuring: 18 MPa Measuring time in each measuring: 5 min Measuring test range in borehole (Z) Lugeon value Measuring test range in borehole (Z) Lugeon value
[m] [Lug] [m] [Lug]
-83…-84 0,126 -97…-98 0,000-84…-85 0,103 -98…-99 0,000-85…-86 0,010 -99…-100 0,000-86…-87 0,000 -100…-101 0,000-87…-88 0,000 -101…-102 0,000-88…-89 0,000 -102…-103 0,000-89…-90 0,000 -103…-104 0,000-90…-91 0,000 -104…-105 0,000-91…-92 0,000 -105…-106 0,000-92…-93 0,000 -106…-107 0,000-93…-94 0,000 -107…-108 0,000-94…-95 0,000 -108…-109 0,000-95…-96 0,000 -109…-110 0,000-96…-97 0,000
Hole ONK-PP 95 Pressure in each measuring: 18 MPa Measuring time in each measuring: 5 min Measuring test range in borehole (Z) Lugeon value Measuring test range in borehole (Z) Lugeon value
[m] [Lug] [m] [Lug]
-83…-84 0,194 -97…-98 0,000-84…-85 0,093 -98…-99 0,000-85…-86 0,000 -99…-100 0,000-86…-87 0,000 -100…-101 0,000-87…-88 0,000 -101…-102 0,000-88…-89 0,000 -102…-103 0,000-89…-90 0,000 -103…-104 0,000-90…-91 0,000 -104…-105 0,000-91…-92 0,000 -105…-106 0,000-92…-93 0,000 -106…-107 0,087 -93…-94 0,000 -107…-108 0,000-94…-95 0,000 -108…-109 0,000-95…-96 0,000 -109…-110 0,000-96…-97 0,000
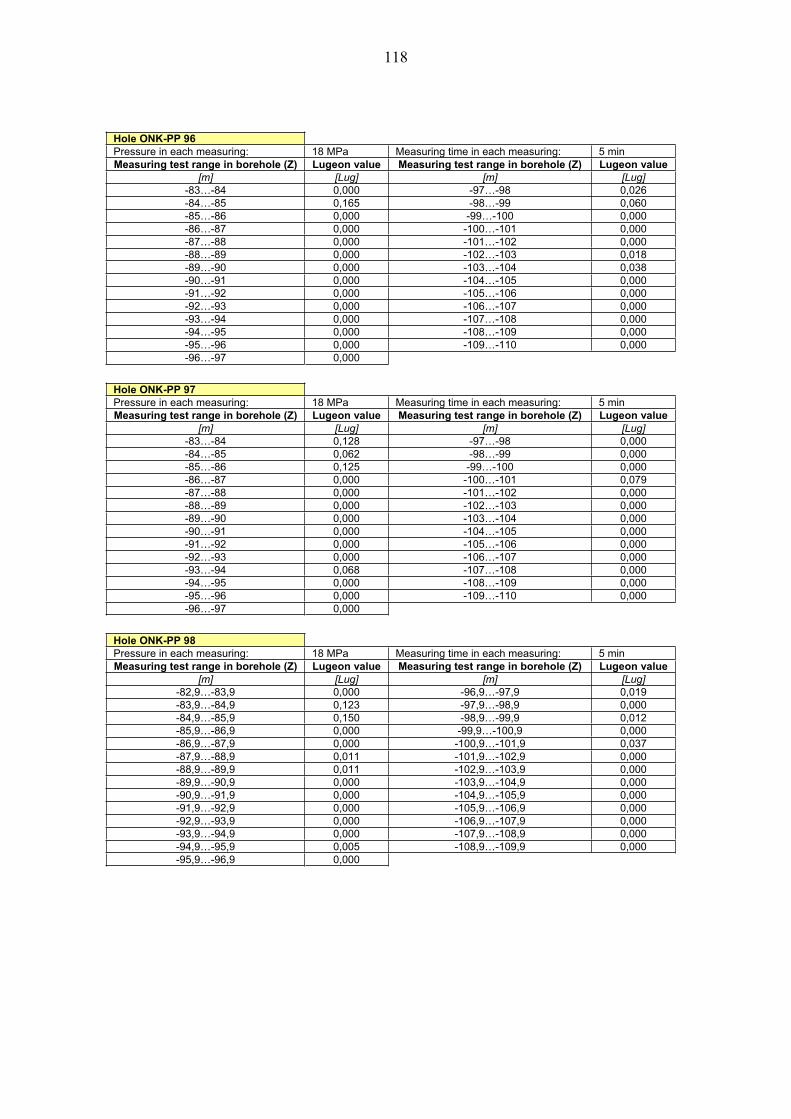
118
Hole ONK-PP 96 Pressure in each measuring: 18 MPa Measuring time in each measuring: 5 min Measuring test range in borehole (Z) Lugeon value Measuring test range in borehole (Z) Lugeon value
[m] [Lug] [m] [Lug]
-83…-84 0,000 -97…-98 0,026 -84…-85 0,165 -98…-99 0,060 -85…-86 0,000 -99…-100 0,000-86…-87 0,000 -100…-101 0,000-87…-88 0,000 -101…-102 0,000-88…-89 0,000 -102…-103 0,018 -89…-90 0,000 -103…-104 0,038 -90…-91 0,000 -104…-105 0,000-91…-92 0,000 -105…-106 0,000-92…-93 0,000 -106…-107 0,000-93…-94 0,000 -107…-108 0,000-94…-95 0,000 -108…-109 0,000-95…-96 0,000 -109…-110 0,000-96…-97 0,000
Hole ONK-PP 97 Pressure in each measuring: 18 MPa Measuring time in each measuring: 5 min Measuring test range in borehole (Z) Lugeon value Measuring test range in borehole (Z) Lugeon value
[m] [Lug] [m] [Lug]
-83…-84 0,128 -97…-98 0,000-84…-85 0,062 -98…-99 0,000-85…-86 0,125 -99…-100 0,000-86…-87 0,000 -100…-101 0,079 -87…-88 0,000 -101…-102 0,000-88…-89 0,000 -102…-103 0,000-89…-90 0,000 -103…-104 0,000-90…-91 0,000 -104…-105 0,000-91…-92 0,000 -105…-106 0,000-92…-93 0,000 -106…-107 0,000-93…-94 0,068 -107…-108 0,000-94…-95 0,000 -108…-109 0,000-95…-96 0,000 -109…-110 0,000-96…-97 0,000
Hole ONK-PP 98 Pressure in each measuring: 18 MPa Measuring time in each measuring: 5 min Measuring test range in borehole (Z) Lugeon value Measuring test range in borehole (Z) Lugeon value
[m] [Lug] [m] [Lug]
-82,9…-83,9 0,000 -96,9…-97,9 0,019 -83,9…-84,9 0,123 -97,9…-98,9 0,000-84,9…-85,9 0,150 -98,9…-99,9 0,012 -85,9…-86,9 0,000 -99,9…-100,9 0,000 -86,9…-87,9 0,000 -100,9…-101,9 0,037 -87,9…-88,9 0,011 -101,9…-102,9 0,000-88,9…-89,9 0,011 -102,9…-103,9 0,000-89,9…-90,9 0,000 -103,9…-104,9 0,000-90,9…-91,9 0,000 -104,9…-105,9 0,000-91,9…-92,9 0,000 -105,9…-106,9 0,000-92,9…-93,9 0,000 -106,9…-107,9 0,000-93,9…-94,9 0,000 -107,9…-108,9 0,000-94,9…-95,9 0,005 -108,9…-109,9 0,000-95,9…-96,9 0,000

119
Hole ONK-PP 99 Pressure in each measuring: 18 MPa Measuring time in each measuring: 5 min Measuring test range in borehole (Z) Lugeon value Measuring test range in borehole (Z) Lugeon value
[m] [Lug] [m] [Lug]
-84,9…-85,9 0,000 -94,9…-95,9 0,000 -85,9…-86,9 0,000 -95,9…-96,9 0,000-86,9…-87,9 0,000 -96,9…-97,9 0,000 -87,9…-88,9 0,043 -97,9…-98,9 0,000 -88,9…-89,9 0,000 -98,9…-99,9 0,000 -89,9…-90,9 0,000 -99,9…-100,9 0,000-90,9…-91,9 0,000 -100,9…-101,9 0,000-91,9…-92,9 0,000 -101,9…-102,9 0,000-92,9…-93,9 0,000 -102,9…-103,9 0,000-93,9…-94,9 0,000

120
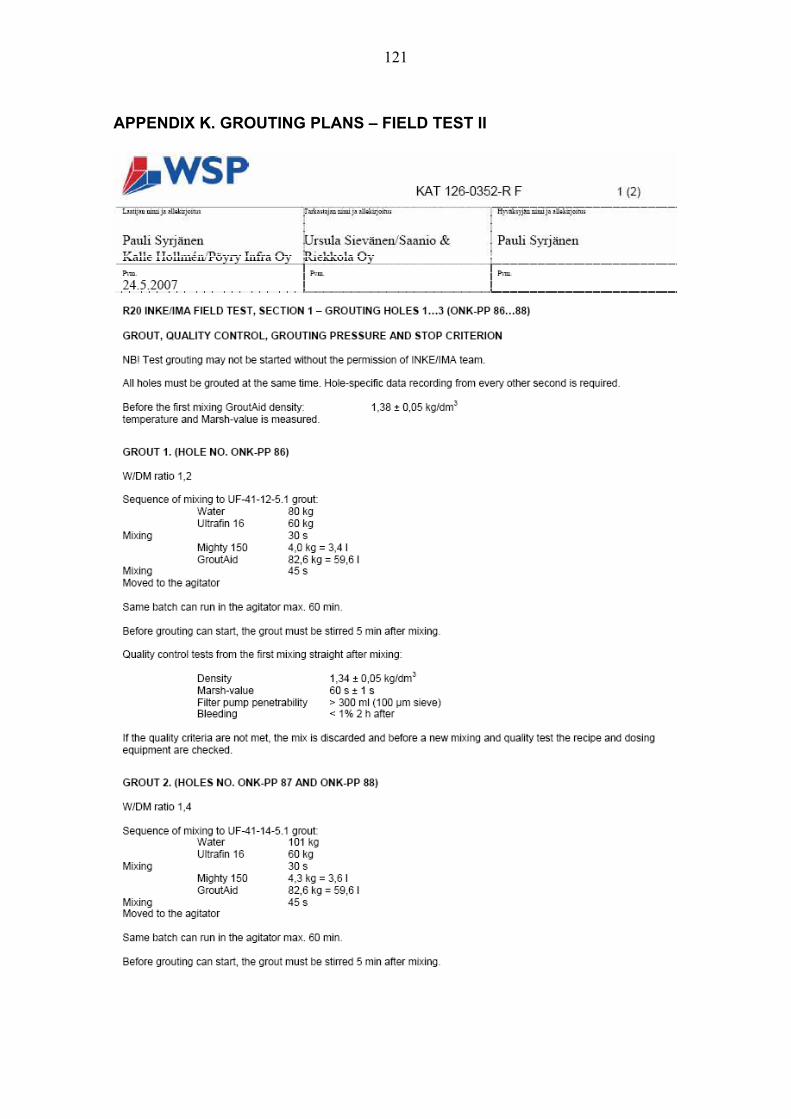
121
APPENDIX K. GROUTING PLANS – FIELD TEST II
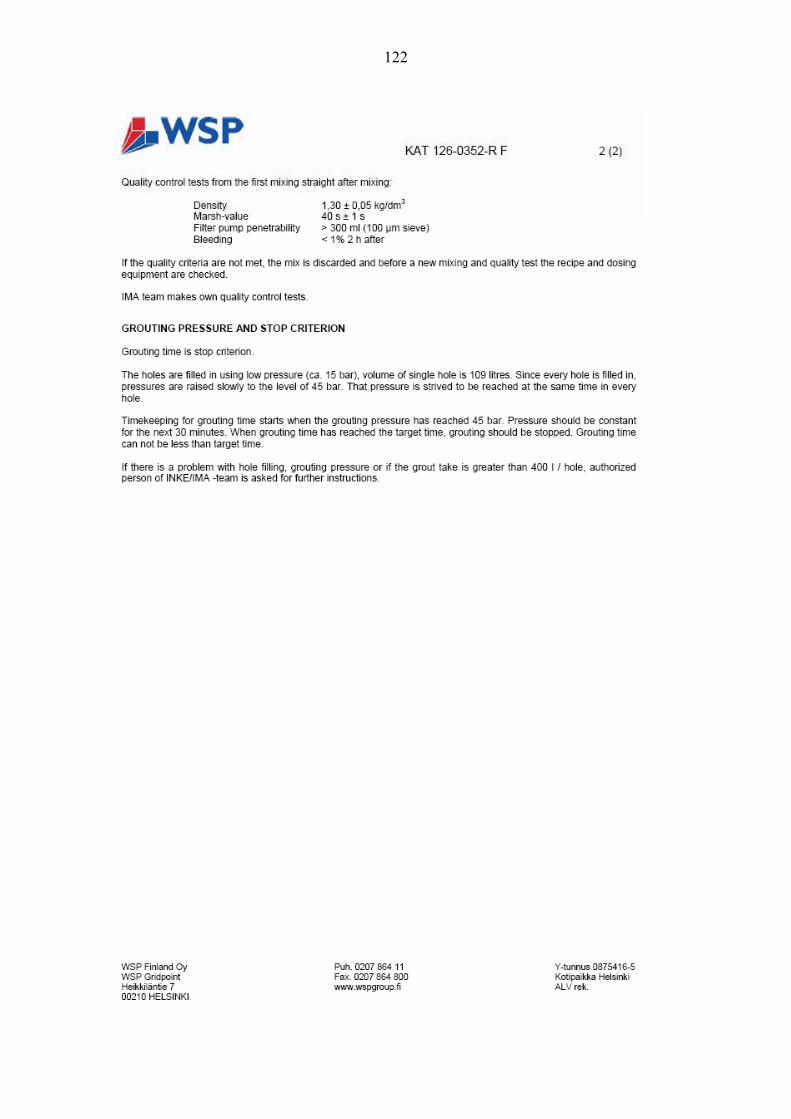
122
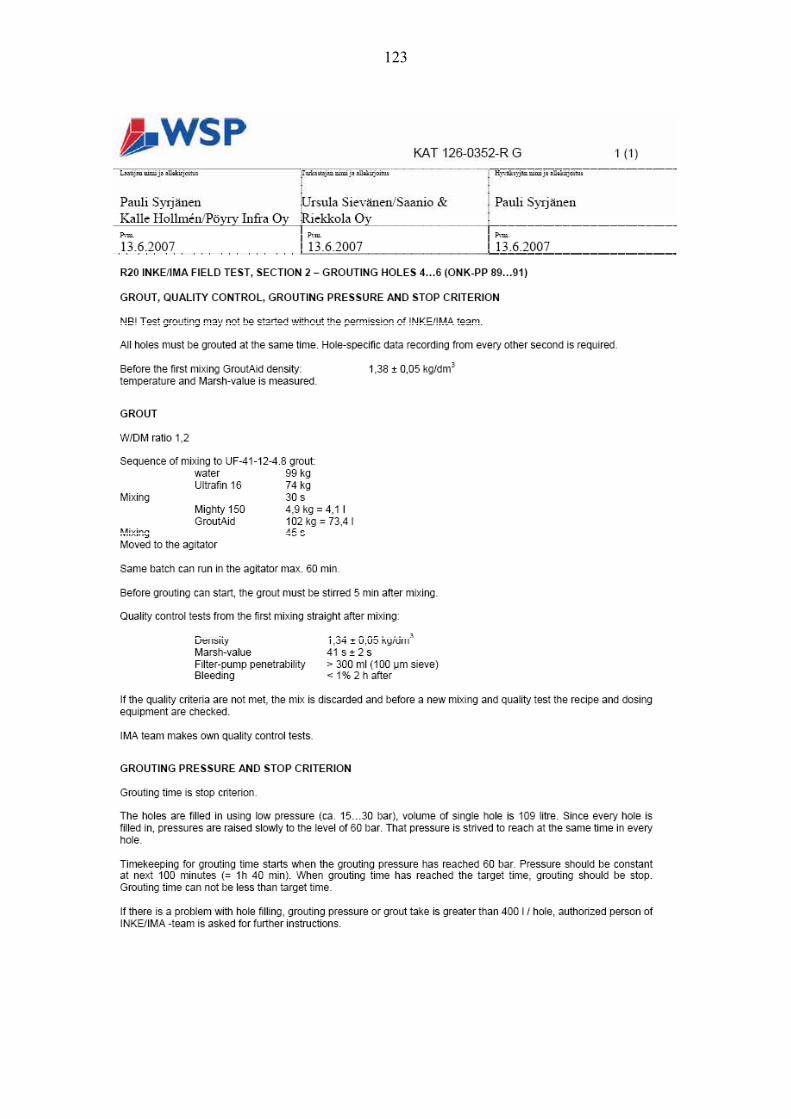
123
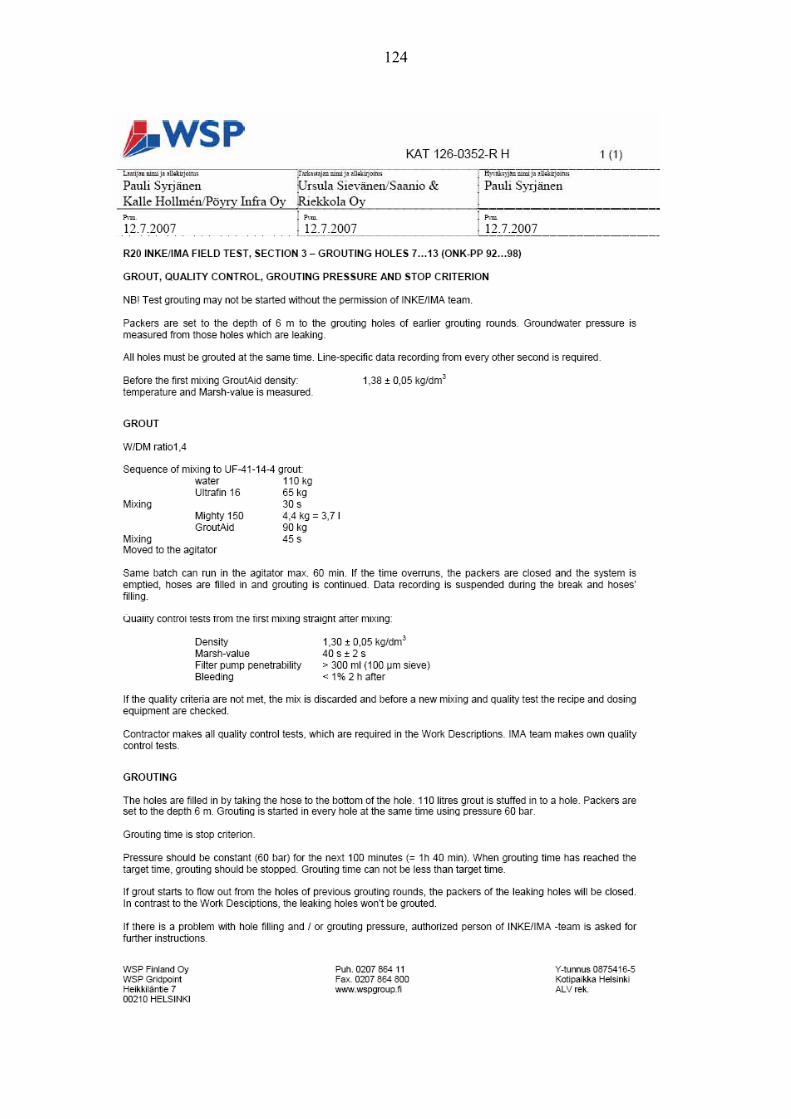
124
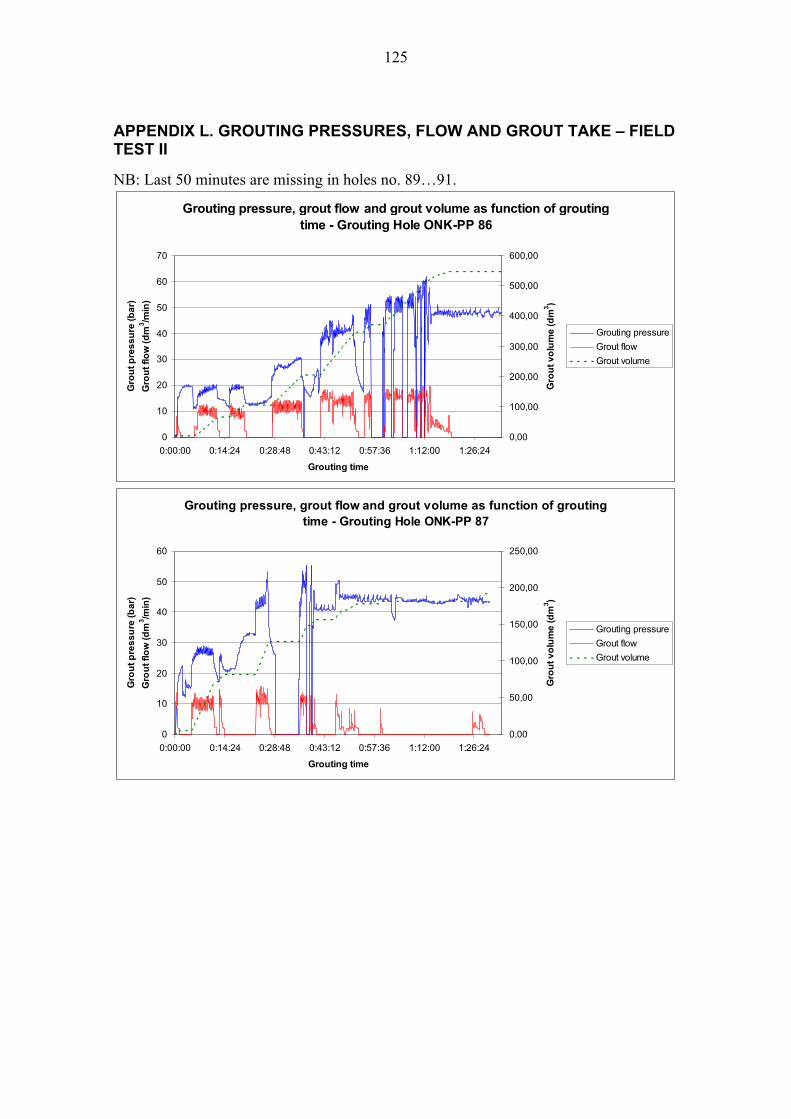
125
APPENDIX L. GROUTING PRESSURES, FLOW AND GROUT TAKE – FIELD TEST II
NB: Last 50 minutes are missing in holes no. 89…91.
Grouting pressure, grout flow and grout volume as function of groutingtime - Grouting Hole ONK-PP 86
0
10
20
30
40
50
60
70
0:00:00 0:14:24 0:28:48 0:43:12 0:57:36 1:12:00 1:26:24
Grouting time
Gro
ut
pre
ss
ure
(b
ar)
Gro
ut
flo
w (
dm
3 /min
)
0,00
100,00
200,00
300,00
400,00
500,00
600,00
Gro
ut
vo
lum
e (
dm
3 )
Grouting pressure
Grout flow
Grout volume
Grouting pressure, grout flow and grout volume as function of grouting time - Grouting Hole ONK-PP 87
0
10
20
30
40
50
60
0:00:00 0:14:24 0:28:48 0:43:12 0:57:36 1:12:00 1:26:24
Grouting time
Gro
ut
pre
ss
ure
(b
ar)
Gro
ut fl
ow
(d
m3 /m
in)
0,00
50,00
100,00
150,00
200,00
250,00G
rou
t v
olu
me
(d
m3 )
Grouting pressure
Grout flow
Grout volume
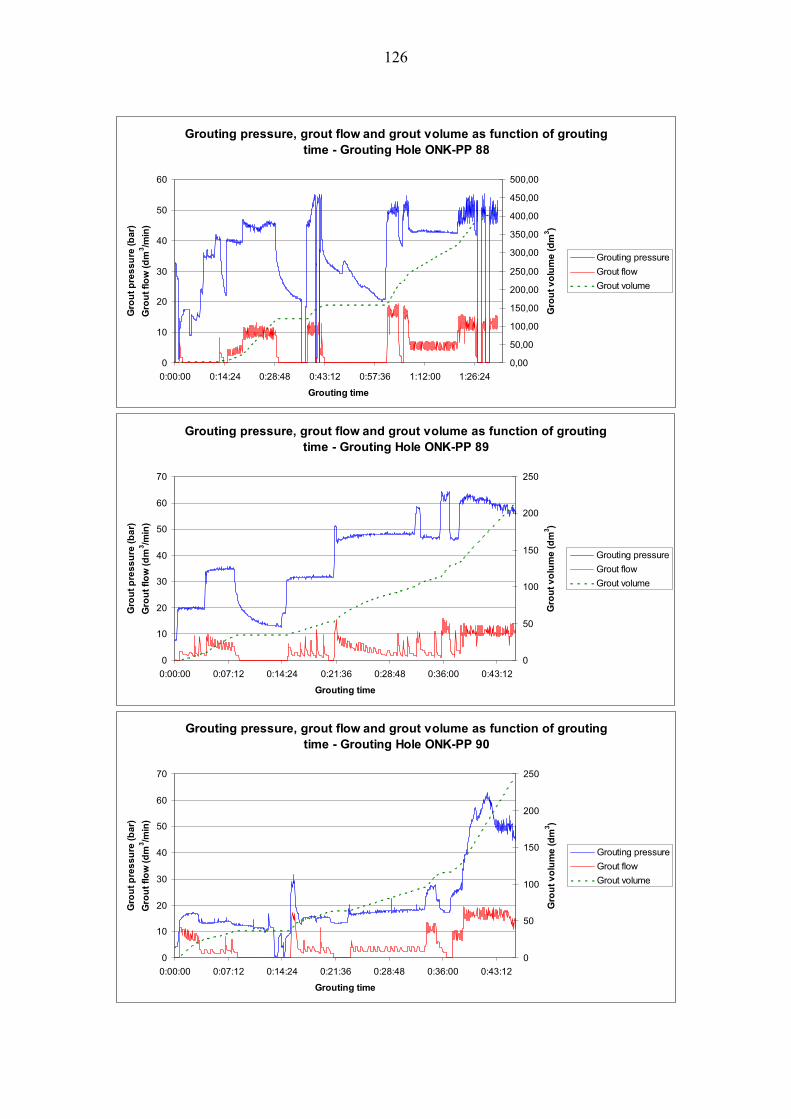
126
Grouting pressure, grout flow and grout volume as function of grouting time - Grouting Hole ONK-PP 88
0
10
20
30
40
50
60
0:00:00 0:14:24 0:28:48 0:43:12 0:57:36 1:12:00 1:26:24
Grouting time
Gro
ut
pre
ss
ure
(b
ar)
Gro
ut
flo
w (
dm
3 /min
)
0,00
50,00
100,00
150,00
200,00
250,00
300,00
350,00
400,00
450,00
500,00
Gro
ut
vo
lum
e (
dm
3 )
Grouting pressure
Grout flow
Grout volume
Grouting pressure, grout flow and grout volume as function of grouting time - Grouting Hole ONK-PP 89
0
10
20
30
40
50
60
70
0:00:00 0:07:12 0:14:24 0:21:36 0:28:48 0:36:00 0:43:12
Grouting time
Gro
ut
pre
ss
ure
(b
ar)
Gro
ut
flo
w (
dm
3 /min
)
0
50
100
150
200
250
Gro
ut
vo
lum
e (
dm
3 )Grouting pressure
Grout flow
Grout volume
Grouting pressure, grout flow and grout volume as function of grouting time - Grouting Hole ONK-PP 90
0
10
20
30
40
50
60
70
0:00:00 0:07:12 0:14:24 0:21:36 0:28:48 0:36:00 0:43:12
Grouting time
Gro
ut
pre
ss
ure
(b
ar)
Gro
ut
flo
w (
dm
3 /min
)
0
50
100
150
200
250
Gro
ut
vo
lum
e (
dm
3 )
Grouting pressure
Grout flow
Grout volume
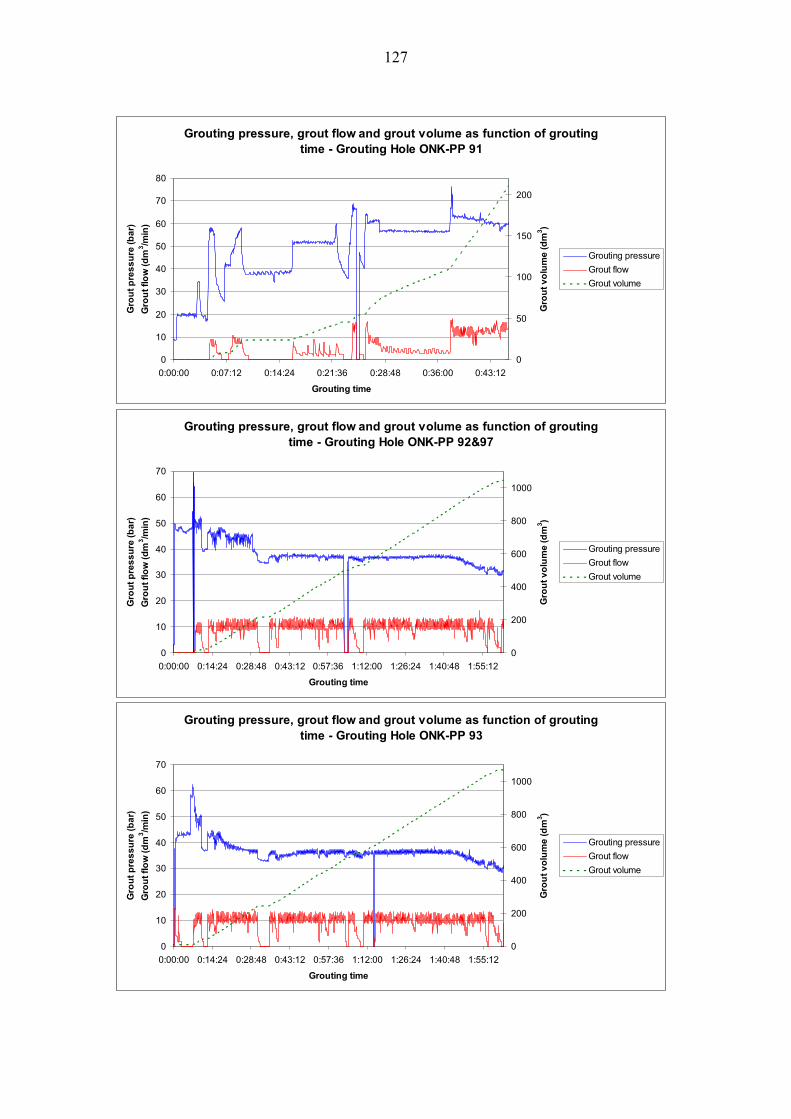
127
Grouting pressure, grout flow and grout volume as function of grouting time - Grouting Hole ONK-PP 91
0
10
20
30
40
50
60
70
80
0:00:00 0:07:12 0:14:24 0:21:36 0:28:48 0:36:00 0:43:12
Grouting time
Gro
ut
pre
ss
ure
(b
ar)
Gro
ut
flo
w (
dm
3 /min
)
0
50
100
150
200
Gro
ut
vo
lum
e (
dm
3 )
Grouting pressure
Grout flow
Grout volume
Grouting pressure, grout flow and grout volume as function of grouting time - Grouting Hole ONK-PP 92&97
0
10
20
30
40
50
60
70
0:00:00 0:14:24 0:28:48 0:43:12 0:57:36 1:12:00 1:26:24 1:40:48 1:55:12
Grouting time
Gro
ut
pre
ss
ure
(b
ar)
Gro
ut
flo
w (
dm
3 /min
)
0
200
400
600
800
1000
Gro
ut
vo
lum
e (
dm
3 )Grouting pressure
Grout flow
Grout volume
Grouting pressure, grout flow and grout volume as function of grouting time - Grouting Hole ONK-PP 93
0
10
20
30
40
50
60
70
0:00:00 0:14:24 0:28:48 0:43:12 0:57:36 1:12:00 1:26:24 1:40:48 1:55:12
Grouting time
Gro
ut
pre
ss
ure
(b
ar)
Gro
ut
flo
w (
dm
3 /min
)
0
200
400
600
800
1000
Gro
ut
vo
lum
e (
dm
3 )
Grouting pressure
Grout flow
Grout volume
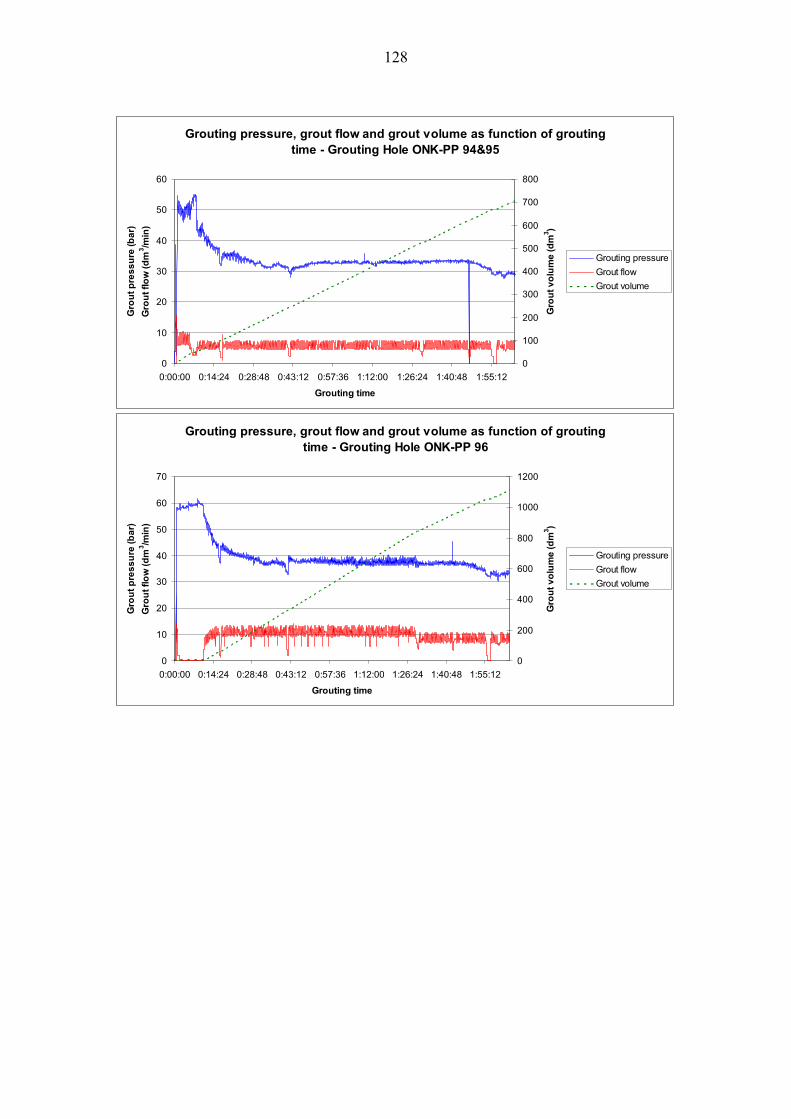
128
Grouting pressure, grout flow and grout volume as function of grouting time - Grouting Hole ONK-PP 94&95
0
10
20
30
40
50
60
0:00:00 0:14:24 0:28:48 0:43:12 0:57:36 1:12:00 1:26:24 1:40:48 1:55:12
Grouting time
Gro
ut
pre
ss
ure
(b
ar)
Gro
ut
flo
w (
dm
3 /min
)
0
100
200
300
400
500
600
700
800
Gro
ut
vo
lum
e (
dm
3 )
Grouting pressure
Grout flow
Grout volume
Grouting pressure, grout flow and grout volume as function of grouting time - Grouting Hole ONK-PP 96
0
10
20
30
40
50
60
70
0:00:00 0:14:24 0:28:48 0:43:12 0:57:36 1:12:00 1:26:24 1:40:48 1:55:12
Grouting time
Gro
ut
pre
ss
ure
(b
ar)
Gro
ut
flo
w (
dm
3 /min
)
0
200
400
600
800
1000
1200
Gro
ut
vo
lum
e (
dm
3 )Grouting pressure
Grout flow
Grout volume
129
APPENDIX M: ANALYSIS OF DATA FROM A GROUTED HOLES – FIELD TEST II
In the figures below, theoretical 1- and 2-dimensional curves for grout flow are calculated according to Gustafson and Stille (2005):
)1(max0
)1(
1D
Vtdt
dIQ
D
DD (M - 1)
)2(max0
)2(
12
DV
tdt
dIIQ
D
DDD (M - 2)
V
tQ
td
Vd
log
log(M - 3)
where:ID = Relative penetration length [-] tD = Relative grouting time [-] t = Grouting time [s] t0 = Characteristic grouting time [s] V = Volume of grout injected [m3], and Vmax = Maximum grout take [m3].
Analysis of dimensionality - ONK-PP 86
1,0E-01
1,0E+00
1,0E+01
1,0E-04 1,0E-03 1,0E-02 1,0E-01 1,0E+00
tD
d lo
g V
/ d
log
t
Q*t/V d logV/d log t (1D) d logV/d log t (2D)
130
Analysis of dimensionality - ONK-PP 87
1,0E-01
1,0E+00
1,0E+01
1,0E+02
1,0E+03
1,0E-04 1,0E-03 1,0E-02 1,0E-01 1,0E+00
tD
d lo
g V
/ d
log
t
Q*t/V d logV/d log t (1D) d logV/d log t (2D)
Analysis of dimensionality - ONK-PP 88
1,0E-01
1,0E+00
1,0E+01
1,0E-04 1,0E-03 1,0E-02 1,0E-01 1,0E+00
tD
d lo
g V
/ d
log
t
Q*t/V d logV/d log t (1D) d logV/d log t (2D)
NB: Last 50 minutes are missing in holes no. 89…91.
131
Analysis of dimensionality - ONK-PP 89
1,0E-01
1,0E+00
1,0E+01
1,0E-04 1,0E-03 1,0E-02 1,0E-01 1,0E+00
tD
d lo
g V
/ d
log
t
Q*t/V d logV/d log t (1D) d logV/d log t (2D)
Analysis of dimensionality - ONK-PP 90
1,0E-01
1,0E+00
1,0E+01
1,0E-04 1,0E-03 1,0E-02 1,0E-01 1,0E+00
tD
d lo
g V
/ d
log
t
Q*t/V d logV/d log t (1D) d logV/d log t (2D)
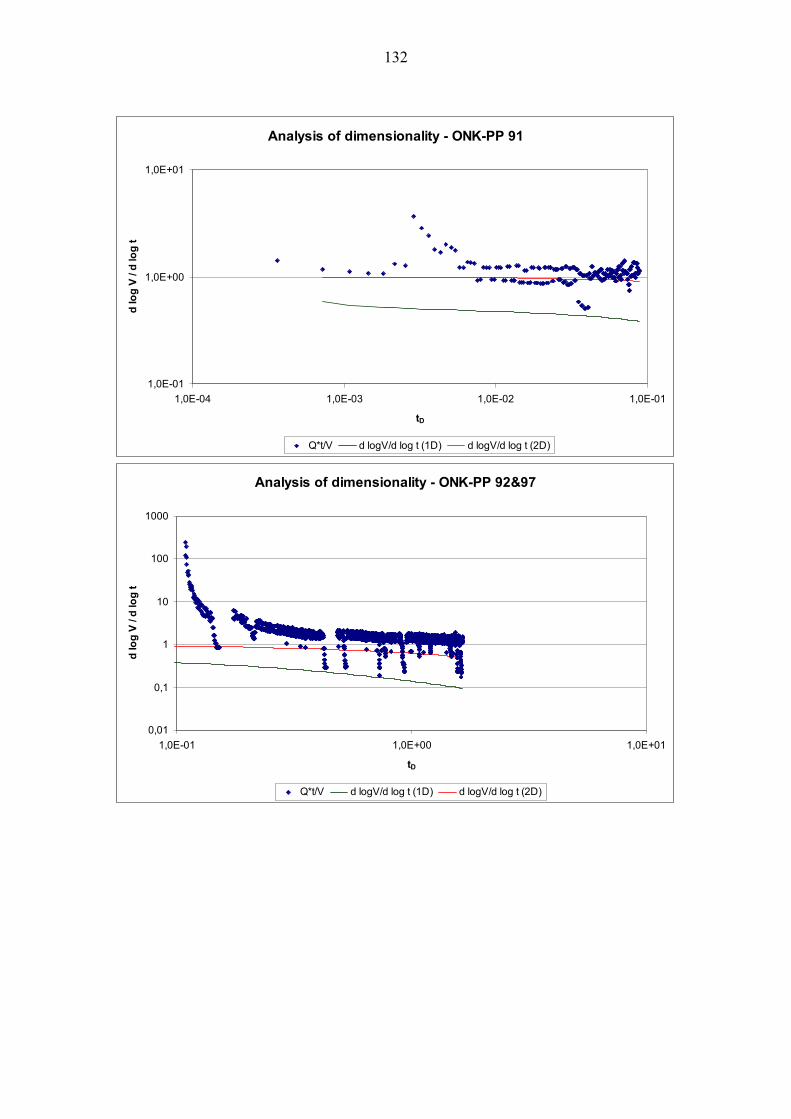
132
Analysis of dimensionality - ONK-PP 91
1,0E-01
1,0E+00
1,0E+01
1,0E-04 1,0E-03 1,0E-02 1,0E-01
tD
d lo
g V
/ d
log
t
Q*t/V d logV/d log t (1D) d logV/d log t (2D)
Analysis of dimensionality - ONK-PP 92&97
0,01
0,1
1
10
100
1000
1,0E-01 1,0E+00 1,0E+01
tD
d lo
g V
/ d
log
t
Q*t/V d logV/d log t (1D) d logV/d log t (2D)
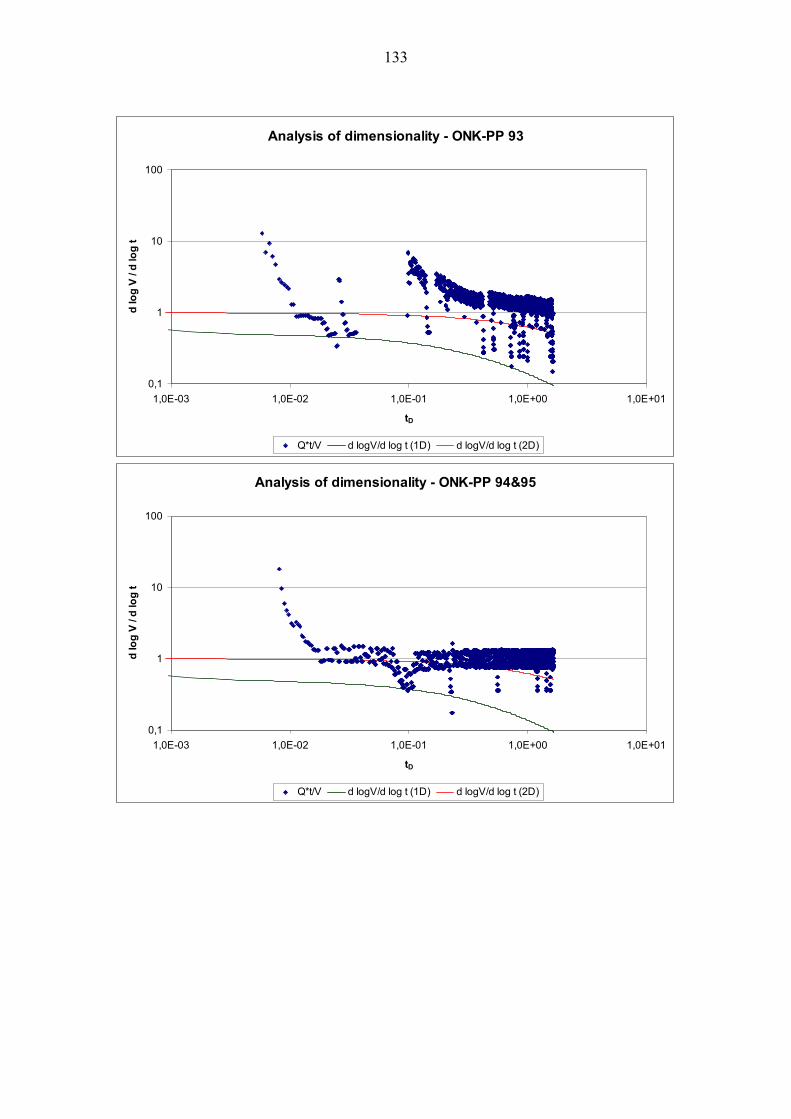
133
Analysis of dimensionality - ONK-PP 93
0,1
1
10
100
1,0E-03 1,0E-02 1,0E-01 1,0E+00 1,0E+01
tD
d lo
g V
/ d
log
t
Q*t/V d logV/d log t (1D) d logV/d log t (2D)
Analysis of dimensionality - ONK-PP 94&95
0,1
1
10
100
1,0E-03 1,0E-02 1,0E-01 1,0E+00 1,0E+01
tD
d lo
g V
/ d
log
t
Q*t/V d logV/d log t (1D) d logV/d log t (2D)
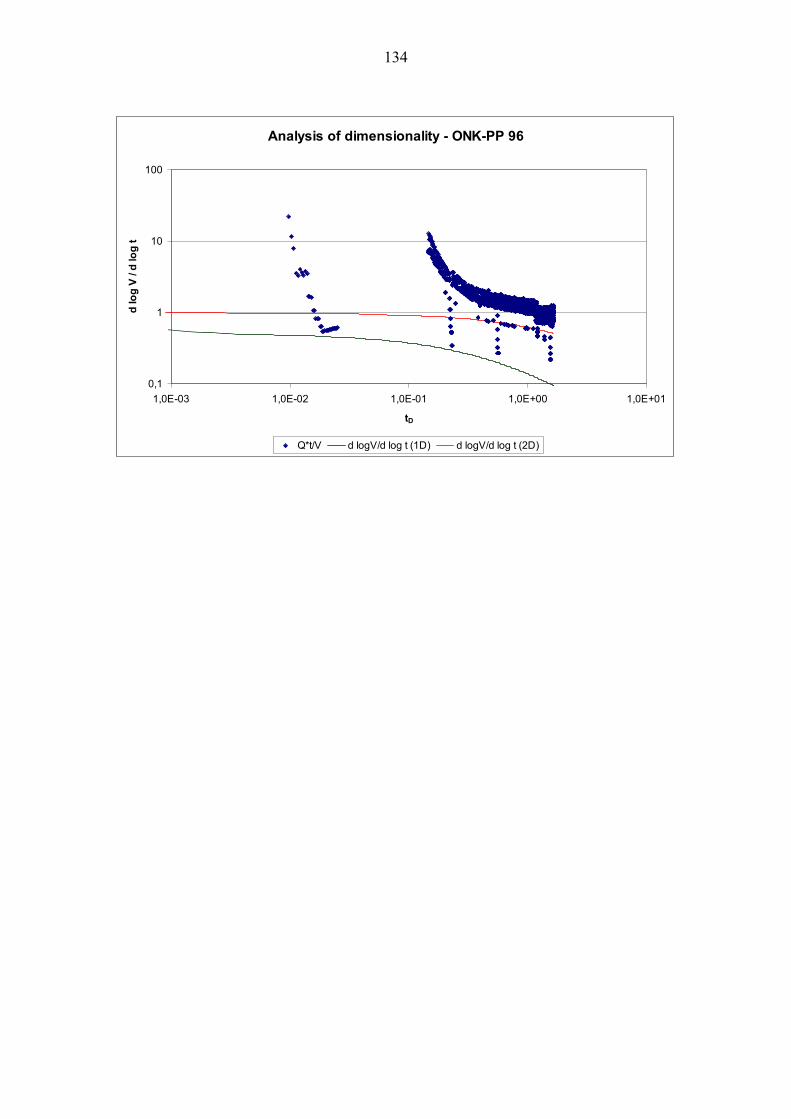
134
Analysis of dimensionality - ONK-PP 96
0,1
1
10
100
1,0E-03 1,0E-02 1,0E-01 1,0E+00 1,0E+01
tD
d lo
g V
/ d
log
t
Q*t/V d logV/d log t (1D) d logV/d log t (2D)
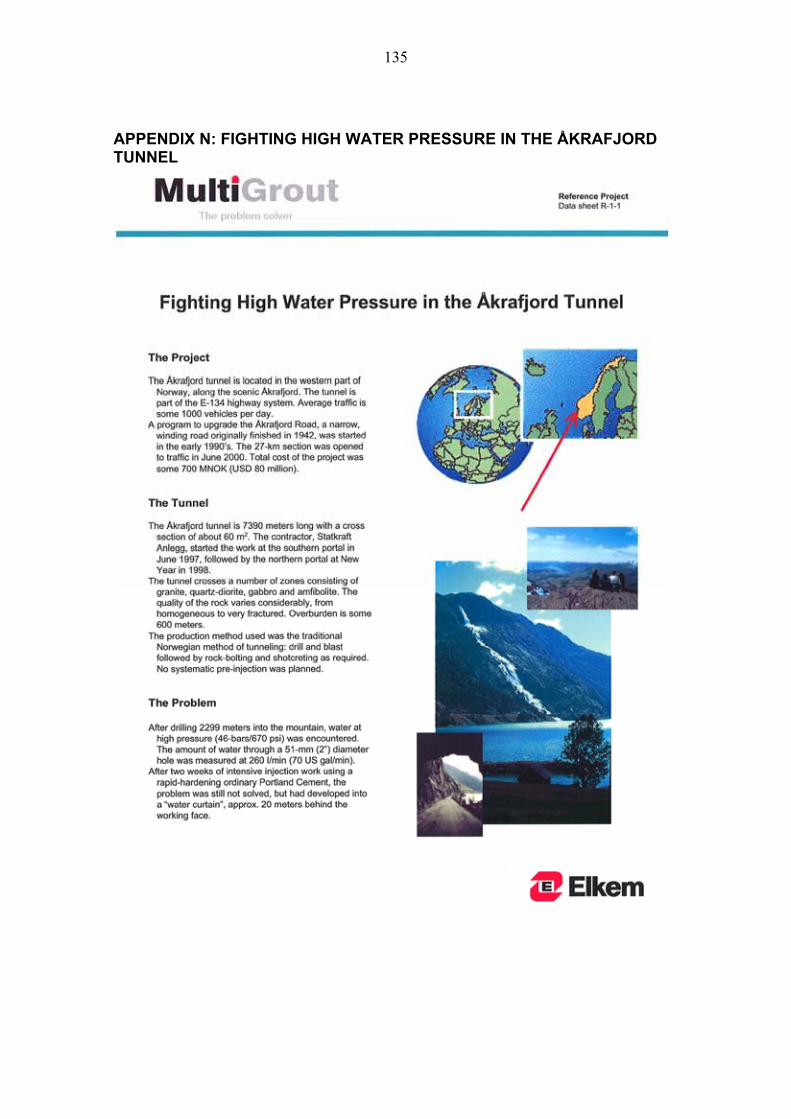
135
APPENDIX N: FIGHTING HIGH WATER PRESSURE IN THE ÅKRAFJORD TUNNEL
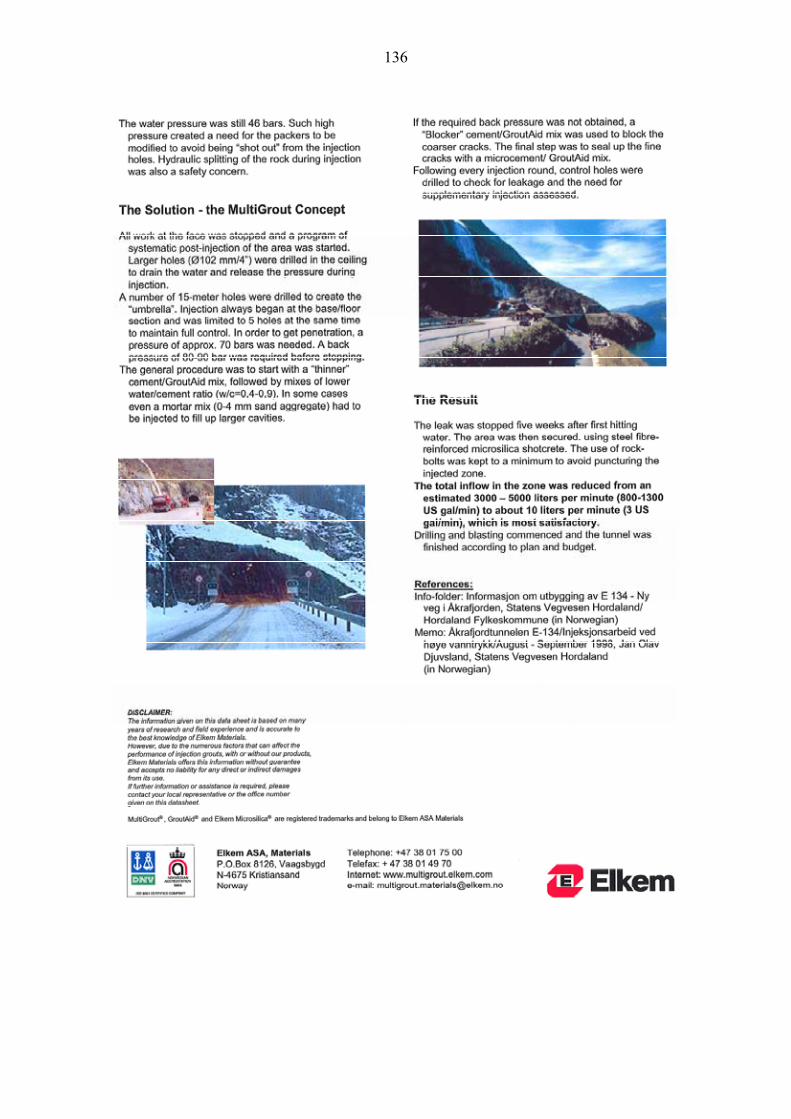
136
137
APPENDIX O: EIKSUND TUNNEL PROJECT
http://sveinskeide.net/eiksundtunnelen/engelsk/engelsk.htm Referenced 16.07.2007.
Question about the Eiksundtunnelen.
1. Site Investigation
1.1 Question: Percentage of construction cost used for SI
Answer: Total cost estimate for the Eiksund project is 846 mill NOK (2005 value). Of this the Eiksundtunnelen turn into 500 mill NOK. Site Investigations were 2.4% of the tunnel cost (12 millions NOK)
1.2 Question: Practice adopted for investigating:
Answer: - Studies and field mapping for a regional geological report - Acoustic sounding of the sea bed floor and overburden - Refraction seismic investigations at the sea bed floor and at the open cuts - Drilling to map the rock surface at the open cuts - Core drilling of 5 holes from the seashores
Question: Rock head level
Answer: Minimum rock cover is approximately 50 m, maximum is ~500 m
Question: The location, characteristic and extent of fault zone
Answer: The major fault zones are localized in the straight between Eika and Yksenøya, and just outside of Yksenøya. Some fault zones have also been localized just outside of Berkneshalvøya.
Question: Ground water inflow in the tunnel
Answer: The rock mass is in some areas fractured with open water bearing fissures. These areas will be grouted in advance, provided that leakage exceeds a certain value. A reduction (sinking) of ground water table is not considered to cause any problem. Maximum acceptable ground water inflow in the tunnel is 300 l/min/km tunnel
1.3 Question: Use of geophysical methods
Answer: Refraction seismic and acoustic sounding
138
1.4 Question: use of directional drilling
Answer: Core drilling during site investigations was to some extent made using directional drilling technique. By directional drilling the capacity is reduced and the price increased. Straight and longer holes should be considered an alternative.
2. Selection of Construction Method
2.1 Question: Choice between TBM and blasting method for the Eiksund tunnels and the client’s role in choosing the construction method with reference to:
Answer: This choice between the two methods has not been considered for the Eiksund tunnel, but drill and blast technique is most common in Norway, and the most economical. The quality of the rock mass makes TBM less favourable.
Question: Construction risks consideration
Answer: The client has carried out site investigations and is responsible for ground conditions being in accordance with the descriptions. The reports give information of geological registrations, and it is up to the contractor to choose the correct method of tunnel excavation.
Question: Achievable progress rate
Answer: The drilling rods used are 5.20m. Average progress rate per round will then be 4.80m. When rock conditions are favourable it is possible to achieve 3 rounds during 2 shifts (06:00 - 02:00). In the Eiksund tunnel progress rate is far less due to probe drilling, grouting, water pumping etc. Average progress rate pr week is 45 m/week.
Question: Ground water control
Answer: Not necessary for this project.
Question: Ground support and stabilization of faulted ground.
Answer: Method for rock support will be adapted to actual rock conditions observed at the tunnel face. Systematic rock bolting using anchored or fully grouted bolts (CT-bolt). Fibre reinforced shotcrete of thickness varying between 6 and 15cm. In fault zones reinforced shotcrete ribs or concrete lining in contact with the rock will be used. Concrete construction on tunnel floor if necessary.
In unstable conditions, for example rock fall or collapse, the tunnel face will be blocked with a concrete plug using a lining scaffold that can be
139
closed at the face. According to the agreement the contractor is obliged to keep this lining scaffold ready to be applied.
3. Grouting for Ground Water Control and Ground Stabilization
3.1 Question: Water ingress: Specification on allowable inflow limits (liters/min/m) during construction and after completion
Answer: The Public Roads Administration norm for acceptable inflow is 0.3 l/min/m. The inflow is recorded in the tunnel using a gauge at the pumps. Until today inflow is approx. 40% of this norm. The measured inflow from probe drilling holes at the tunnel face is evaluated and discussed between the client and the contractor before a decision about grouting is taken. Normally grouting is carried out if total inflow from 4 · 26m long probe holes exceeds 20 l/min.
Question: Methodology and basis of design
Answer: Method for grouting is developed based on experience from similar projects. The contract describes method, equipment and documentation requirements.
Question: Measured inflow before and after ground treatment
Answer: We have no measurements for this other than registered inflow from probe holes and measured inflow for tunnel excavated.
3.2 Grouting:
Question: Specific problem with high water pressure (29 bars)
Answer: High water pressure is not considered a big problem. It is being grouted with higher pressure (up to 100 bars).
Question: Grouting methodology (equipment, grouting pressure, grouting material, number, length, orientation and arrangement of grout holes)
Answer: The arrangement of the grout holes are based on inflow from the different probe holes. Full grout umbrella consist of 26-30 holes of 23-26m length each, and is inclined 15º from the tunnel.
Question: Grout intake per meter of tunnel
Answer: In the contract it is estimated an average grout intake of 333kg pr meter of tunnel. Until today average grout intake is 200kg pr meter of tunnel.
140
Question: Excavation cycle time for probing, drilling for grouting, grouting, excavation and maintenance
Answer: Probe drilling is taking place after each 4 excavation rounds. Drilling for grouting is performed when necessary, see above.
Question: Excavation progress rate (predicted and actual) lining type (cast in situ or precast lining)
Answer: There are two types of lining for water and frost shielding; shotcrete protected polyurethane foam and PVC lining. The client is free to choose between either types or to regulate the quantities between these based on evaluations of water leakage from the tunnel roof.
3.3 Question: Method of going through faulted ground subject to high water pressure (29 bars).
Answer: Reduced excavation rounds and stabilization as described under 2.1. Ground freezing is a method that has been applied in Norwegian tunnels, but it is not evaluated any probability for this to become necessary.
4. Blast Control
Question: Method of blasting monitoring
Answer: There are certain limits stated in the contract for ground vibrations that nearby buildings may subjected to. Ground vibrations are measured on nearby buildings and the charges must be planned in order not to exceed the vibration limits.
5. Contract
Question: Public consultation and publicity programmed
Answer: All contracts of more than 200 000 NOK must follow parliamentary regulations. Contracts exceeding 41 millions NOK have to be announced in a data base for the whole EEC area.
5.1 Question: Contract system Practice and Arrangement
Answer: Contract system and contract form employed and provision on risk sharing between the client and the contractor: The contract form is a unit price contract. All risks except ground conditions and the basis for tunnel plans lies on the contractor.
Question: Payment system (with particular reference to rock grouting, ground stabilization and support)

141
Answer: The contractor receives a monthly payment based on performed work. The client is holding back 10% until 5% of the contract sum is reached. This guaranty will be transferred with the final bill.
Question: Rules for measurement of quantities
Answer: The rules for measurement of quantities are stated for each process in the contract. The contractor must deliver documented measurement for each of this process with the client controls measures.
Question: Rules for granting additional time for completion.
Answer: When the actual quantities diverge from the quantities given in the contract, additional time will be granted or time for completion will be reduced. Otherwise the Norwegian Standard NS3430, which forms part of the contract, provides rules for adjustment in connection with additional work or modifications.
Question: Who shall decide the actual amount of works such as grouting and ground support on site?
Answer: The client decides the actual amount of permanent rock support, the contractor decides temporary support. Grouting is decided by the client.
5.2 Question: Contractual claims/disputes
Answer: All such questions will as far as possible be solved locally at the site or within the project organisation. After a few rounds of negotiations further up in the system, the legal court is the last instance.
5.3 Question: Tendering system and method for choosing successful tenderness (based on price alone or combination of price and proposed construction method?)
Answer: The tendering system contains rules for company qualification with a (point system). If a company does not reach sufficient points it will be disqualified. Of the remaining companies the one with the lower price will normally be selected. The quality is described in the contract, and shall in principle be independent of the contractor. Other criteria for choosing contractor, such as construction time, design etc, may be included in some tendering systems.
5.4 Question: Insurance for tunnel works and issues on procurement
Answer: The contractor has his own insurance that covers damage and accidents during construction. The client (Public Roads Administration) is

142
self insured. All issues of procurement that is brought to the site are considered the contractors belongings until the client takes over all the contractual works.