Embed Size (px)
DESCRIPTION
Â
Citation preview
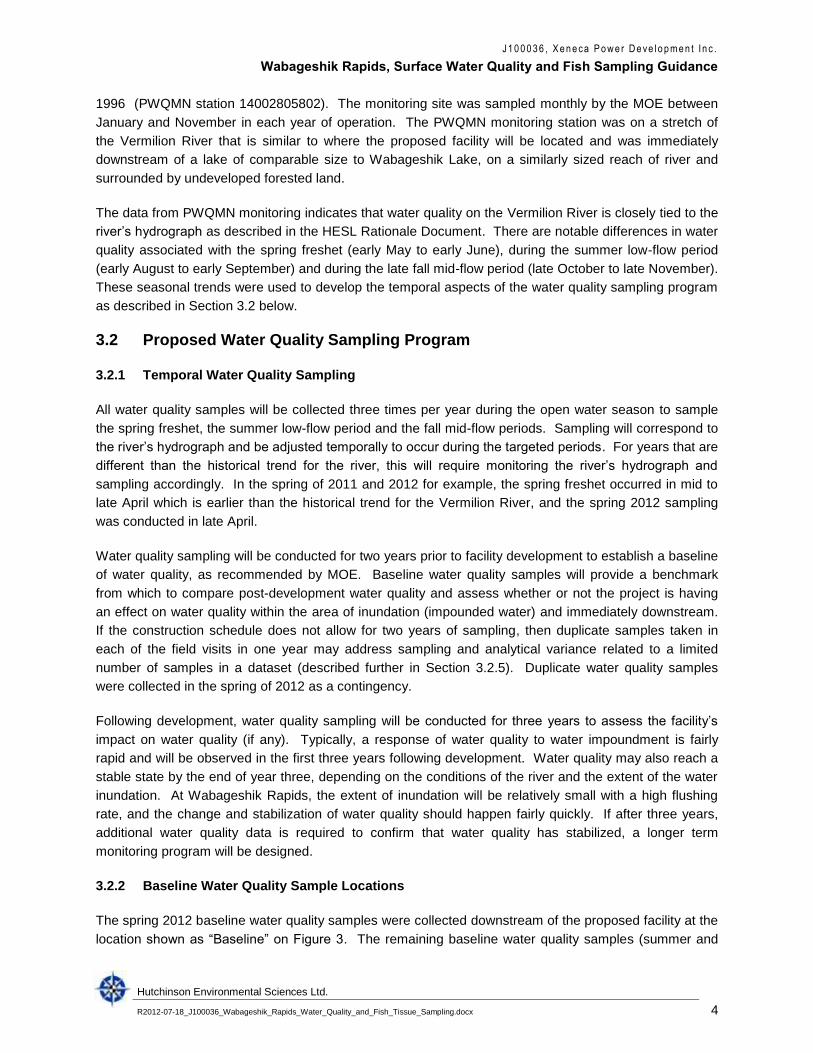
3-1 Taylor Road, Bracebridge, ON P1L 1S6 ph: 705 645 0021
121 Charles St. W. Unit C406, Kitchener, ON N2G 1H6 ph: 519 576 1711
Hutchinson
Environmental Sciences Ltd.
Prepared for: Xeneca Power Development Inc.
Job No.: J120022
July 18, 2012
Wabageshik Rapids, Vermilion River
Proposed Hydroelectric Generating Station
Surface Water Quality and Fish Sampling Guidance
3-1 Taylor Road, Bracebridge, ON P1L 1S6 ph: 705-645-0021
R2012-07-18_J100036_Wabageshik_Rapids_Water_Quality_and_Fish_Tissue_Sampling.docx
Hutchinson Environmental Sciences Ltd.
July 18, 2012 Project No.: J120022
Ed Laratta
Manager, Environmental Programs and Approvals
Xeneca Power Development Inc.
5160 Yonge Street, Suite 520
Toronto, ON
M2N 6L9
Dear Mr. Laratta:
We are pleased to provide the surface water quality and fish tissue sampling guidance for the proposed
Wabageshik Rapids hydroelectric generating facility on the Vermilion River, east of Espanola, Ontario.
The complete document describing the rationale used to develop the guidance is included in Appendix A
of the attached report and water quality results from the spring 2012 baseline water quality sampling
event are briefly described in the report and included in Appendix B.
The guidance was developed based on the recommendations provided in the Ontario Ministry of the
Environment’s draft guidance document titled ““From Class EA to Permit to Take Water: A Guide to
Understanding the Ministry of the Environment’s (MOE) Technical Requirements for Waterpower”
(January, 2012), subsequent discussions with the MOE and proven scientific approaches used to assess
the environmental quality of surface water and fish tissue.
If you have any questions regarding the guidance or its supporting rationale, please do not hesitate to
contact me or Dr. Neil Hutchinson. Thank you for the opportunity to assist Xeneca with this project!
Sincerely,
Hutchinson Environmental Sciences Ltd.
David Leeder
Intermediate Environmental Scientist
J1 0 0 0 3 6 , X e n e ca P o w e r D e ve l o p m e n t I n c .
Wabageshik Rapids, Surface Water Quality and Fish Sampling Guidance
Hutchinson Environmental Sciences Ltd.
R2012-07-18_J100036_Wabageshik_Rapids_Water_Quality_and_Fish_Tissue_Sampling.docx ii
Signatures
David Leeder
Environmental Scientist
Neil J. Hutchinson, Ph.D.
Principal Scientist
J1 0 0 0 3 6 , X e n e ca P o w e r D e ve l o p m e n t I n c .
Wabageshik Rapids, Surface Water Quality and Fish Sampling Guidance
Hutchinson Environmental Sciences Ltd.
R2012-07-18_J100036_Wabageshik_Rapids_Water_Quality_and_Fish_Tissue_Sampling.docx iii
Table of Contents
Transmittal Letter
Signatures
Executive Summary
1. Introduction .................................................................................................................................... 1
2. Facility Description ........................................................................................................................ 1
3. Water Quality .................................................................................................................................. 3
3.1 Existing Data ....................................................................................................................... 3 3.1.1 Project Related Monitoring ..................................................................................... 3 3.1.2 PWQMN Data ........................................................................................................ 3
3.2 Proposed Water Quality Sampling Program ....................................................................... 4 3.2.1 Temporal Water Quality Sampling ......................................................................... 4 3.2.2 Baseline Water Quality Sample Locations ............................................................. 4 3.2.3 Post-Development Water Quality Sample Locations ............................................. 5 3.2.4 Water Quality Sample Parameter List ................................................................... 6 3.2.5 Water Quality Blind Duplicates and QA/QC ........................................................... 7
4. Fish Tissue Sampling .................................................................................................................... 7
4.1 Sample Locations ................................................................................................................ 7 4.1.1 Baseline ................................................................................................................. 7 4.1.2 Post-Development ................................................................................................. 8
4.2 Sampling Schedule ............................................................................................................. 8 4.2.1 Baseline and Post-Development ............................................................................ 8 4.2.2 Annual Timing of Sample Events ........................................................................... 8
4.3 Existing Fish Samples ......................................................................................................... 9 4.4 2012 Fish Tissue Sampling Program .................................................................................. 9
5. Closing .......................................................................................................................................... 10
List of Figures
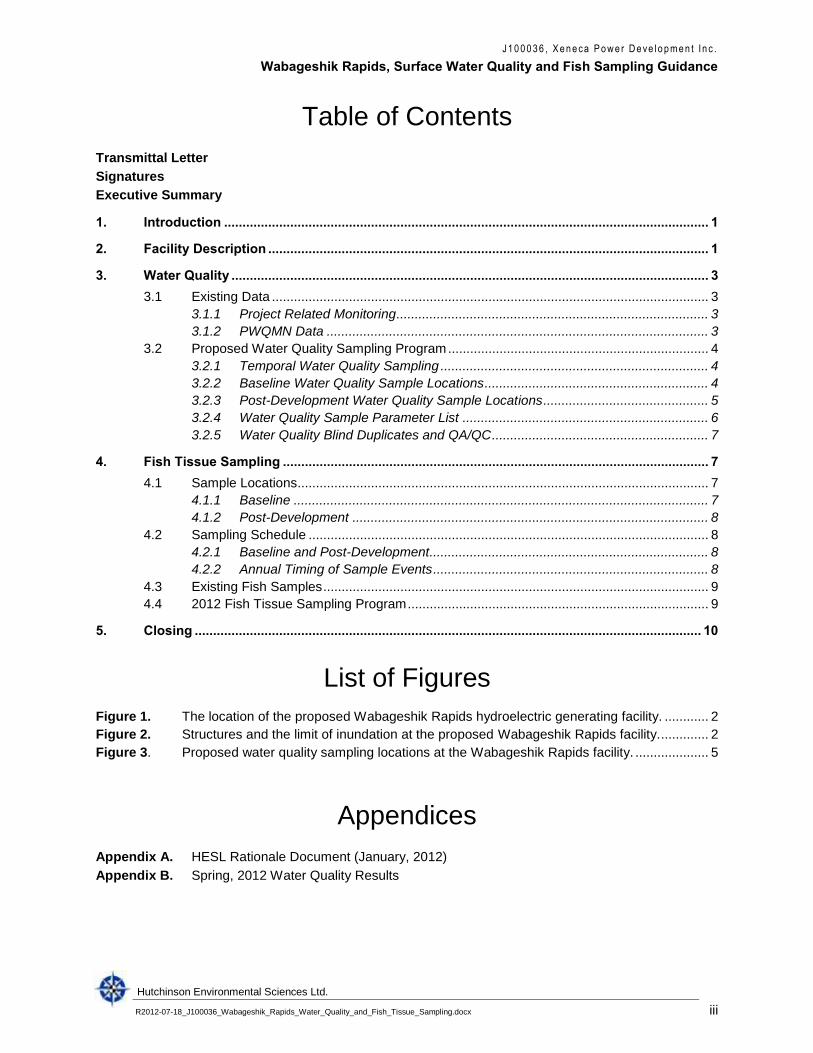
Figure 1. The location of the proposed Wabageshik Rapids hydroelectric generating facility. ............ 2
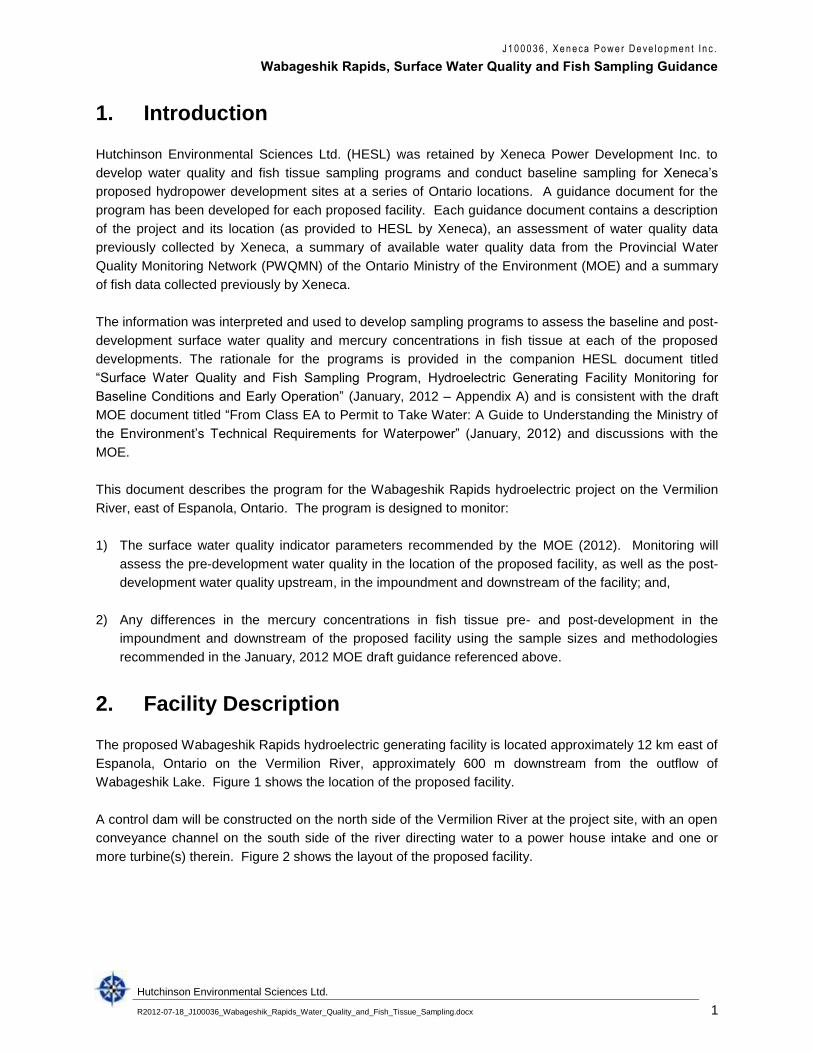
Figure 2. Structures and the limit of inundation at the proposed Wabageshik Rapids facility. ............. 2
Figure 3. Proposed water quality sampling locations at the Wabageshik Rapids facility. .................... 5
Appendices
Appendix A. HESL Rationale Document (January, 2012)
Appendix B. Spring, 2012 Water Quality Results
J1 0 0 0 3 6 , X e n e ca P o w e r D e ve l o p m e n t I n c .
Wabageshik Rapids, Surface Water Quality and Fish Sampling Guidance
Hutchinson Environmental Sciences Ltd.
R2012-07-18_J100036_Wabageshik_Rapids_Water_Quality_and_Fish_Tissue_Sampling.docx 1
1. Introduction
Hutchinson Environmental Sciences Ltd. (HESL) was retained by Xeneca Power Development Inc. to
develop water quality and fish tissue sampling programs and conduct baseline sampling for Xeneca’s
proposed hydropower development sites at a series of Ontario locations. A guidance document for the
program has been developed for each proposed facility. Each guidance document contains a description
of the project and its location (as provided to HESL by Xeneca), an assessment of water quality data
previously collected by Xeneca, a summary of available water quality data from the Provincial Water
Quality Monitoring Network (PWQMN) of the Ontario Ministry of the Environment (MOE) and a summary
of fish data collected previously by Xeneca.
The information was interpreted and used to develop sampling programs to assess the baseline and post-
development surface water quality and mercury concentrations in fish tissue at each of the proposed
developments. The rationale for the programs is provided in the companion HESL document titled
“Surface Water Quality and Fish Sampling Program, Hydroelectric Generating Facility Monitoring for
Baseline Conditions and Early Operation” (January, 2012 – Appendix A) and is consistent with the draft
MOE document titled “From Class EA to Permit to Take Water: A Guide to Understanding the Ministry of
the Environment’s Technical Requirements for Waterpower” (January, 2012) and discussions with the
MOE.
This document describes the program for the Wabageshik Rapids hydroelectric project on the Vermilion
River, east of Espanola, Ontario. The program is designed to monitor:
1) The surface water quality indicator parameters recommended by the MOE (2012). Monitoring will
assess the pre-development water quality in the location of the proposed facility, as well as the post-
development water quality upstream, in the impoundment and downstream of the facility; and,
2) Any differences in the mercury concentrations in fish tissue pre- and post-development in the
impoundment and downstream of the proposed facility using the sample sizes and methodologies
recommended in the January, 2012 MOE draft guidance referenced above.
2. Facility Description
The proposed Wabageshik Rapids hydroelectric generating facility is located approximately 12 km east of
Espanola, Ontario on the Vermilion River, approximately 600 m downstream from the outflow of
Wabageshik Lake. Figure 1 shows the location of the proposed facility.
A control dam will be constructed on the north side of the Vermilion River at the project site, with an open
conveyance channel on the south side of the river directing water to a power house intake and one or
more turbine(s) therein. Figure 2 shows the layout of the proposed facility.
J1 0 0 0 3 6 , X e n e ca P o w e r D e ve l o p m e n t I n c .
Wabageshik Rapids, Surface Water Quality and Fish Sampling Guidance
Hutchinson Environmental Sciences Ltd.
R2012-07-18_J100036_Wabageshik_Rapids_Water_Quality_and_Fish_Tissue_Sampling.docx 2
Figure 1. The location of the proposed Wabageshik Rapids hydroelectric generating facility.
Figure 2. Proposed structures and layout of the proposed Wabageshik Rapids facility.
J1 0 0 0 3 6 , X e n e ca P o w e r D e ve l o p m e n t I n c .
Wabageshik Rapids, Surface Water Quality and Fish Sampling Guidance
Hutchinson Environmental Sciences Ltd.
R2012-07-18_J100036_Wabageshik_Rapids_Water_Quality_and_Fish_Tissue_Sampling.docx 3
The project is considered to be a run-of-the-river project, with modified peaking controlling water flows
through a spillway dam and directing water through the power house. The project will result in 600 m of
inundation up the rapids to the outlet of Wabageshik Lake. HESL understands from Xeneca that the
facility will not impound water in Wabageshik Lake. The inundation will not result in appreciable lateral
flooding of land on either side of the existing river channel due to the steep slopes on either side of the
existing rapids.
Xeneca has informed HESL that the dam and power house will not represent impassable barriers to
upstream fish migration. Fish will be able to move freely into Wabageshik Lake from the head pond
upstream of the facility. If the status of fish passage at the facility changes, HESL requests to be notified
immediately, and the fish sampling program will need to be revised.
3. Water Quality
3.1 Existing Data
3.1.1 Project Related Monitoring
On April 14, 2012, baseline water quality samples were collected from the Vermilion River at the
proposed facility. The results of the sampling event indicate that the Vermilion River at the facility is
slightly alkaline with low nutrient concentrations, low turbidity, conductivity of 138 µS/cm and high
dissolved organic carbon (DOC) concentrations. The concentrations of total aluminum, copper and nickel
at the proposed facility exceeded Ontario Provincial Water Quality Objectives (PWQOs), the regulatory
surface water quality objectives that apply to water at the proposed facility.
The concentrations of nickel (> 34 µg/L) and copper (> 6.5 µg/L) are unusually high for surface water on
the Canadian Shield and may reflect local mineralization or the response to historical nickel-copper
sulphide smelting in Sudbury. Future sampling events will determine if the measured values were
anomalies or typical of the Vermilion River. The concentrations of aluminum and iron were also high and
may be the result of measured high dissolved organic carbon (DOC) concentrations which is commonly
associated with wetland drainage. No other parameter concentrations exceeded PWQOs.
Spring, 2012 baseline analytical results will be discussed in detail along with summer and fall 2012
results, in a 2012 baseline year end water quality report (to be completed in December, 2012). Water
quality results from the spring 2012 baseline water quality sampling event are included in Appendix B.
Prior to spring 2012 sampling, water quality sampling at the proposed facility was limited to two events
during the 2010 open water season. The 2010 sampling consisted of field parameter measurements and
two water samples analyzed for iron. The 2010 data has limited water chemistry analysis but is useful for
establishing trends in water quality through the project area over time, when combined with other data.
3.1.2 PWQMN Data
A PWQMN monitoring station was in operation on the Vermilion River at Regional Road 10 (old Highway
549) approximately 24 km east of the proposed facility and upstream of Wabageshik Lake from 1994 to
J1 0 0 0 3 6 , X e n e ca P o w e r D e ve l o p m e n t I n c .
Wabageshik Rapids, Surface Water Quality and Fish Sampling Guidance
Hutchinson Environmental Sciences Ltd.
R2012-07-18_J100036_Wabageshik_Rapids_Water_Quality_and_Fish_Tissue_Sampling.docx 4
1996 (PWQMN station 14002805802). The monitoring site was sampled monthly by the MOE between
January and November in each year of operation. The PWQMN monitoring station was on a stretch of
the Vermilion River that is similar to where the proposed facility will be located and was immediately
downstream of a lake of comparable size to Wabageshik Lake, on a similarly sized reach of river and
surrounded by undeveloped forested land.
The data from PWQMN monitoring indicates that water quality on the Vermilion River is closely tied to the
river’s hydrograph as described in the HESL Rationale Document. There are notable differences in water
quality associated with the spring freshet (early May to early June), during the summer low-flow period
(early August to early September) and during the late fall mid-flow period (late October to late November).
These seasonal trends were used to develop the temporal aspects of the water quality sampling program
as described in Section 3.2 below.
3.2 Proposed Water Quality Sampling Program
3.2.1 Temporal Water Quality Sampling
All water quality samples will be collected three times per year during the open water season to sample
the spring freshet, the summer low-flow period and the fall mid-flow periods. Sampling will correspond to
the river’s hydrograph and be adjusted temporally to occur during the targeted periods. For years that are
different than the historical trend for the river, this will require monitoring the river’s hydrograph and
sampling accordingly. In the spring of 2011 and 2012 for example, the spring freshet occurred in mid to
late April which is earlier than the historical trend for the Vermilion River, and the spring 2012 sampling
was conducted in late April.
Water quality sampling will be conducted for two years prior to facility development to establish a baseline
of water quality, as recommended by MOE. Baseline water quality samples will provide a benchmark
from which to compare post-development water quality and assess whether or not the project is having
an effect on water quality within the area of inundation (impounded water) and immediately downstream.
If the construction schedule does not allow for two years of sampling, then duplicate samples taken in
each of the field visits in one year may address sampling and analytical variance related to a limited
number of samples in a dataset (described further in Section 3.2.5). Duplicate water quality samples
were collected in the spring of 2012 as a contingency.
Following development, water quality sampling will be conducted for three years to assess the facility’s
impact on water quality (if any). Typically, a response of water quality to water impoundment is fairly
rapid and will be observed in the first three years following development. Water quality may also reach a
stable state by the end of year three, depending on the conditions of the river and the extent of the water
inundation. At Wabageshik Rapids, the extent of inundation will be relatively small with a high flushing
rate, and the change and stabilization of water quality should happen fairly quickly. If after three years,
additional water quality data is required to confirm that water quality has stabilized, a longer term
monitoring program will be designed.
3.2.2 Baseline Water Quality Sample Locations
The spring 2012 baseline water quality samples were collected downstream of the proposed facility at the
location shown as “Baseline” on Figure 3. The remaining baseline water quality samples (summer and
J1 0 0 0 3 6 , X e n e ca P o w e r D e ve l o p m e n t I n c .
Wabageshik Rapids, Surface Water Quality and Fish Sampling Guidance
Hutchinson Environmental Sciences Ltd.
R2012-07-18_J100036_Wabageshik_Rapids_Water_Quality_and_Fish_Tissue_Sampling.docx 5
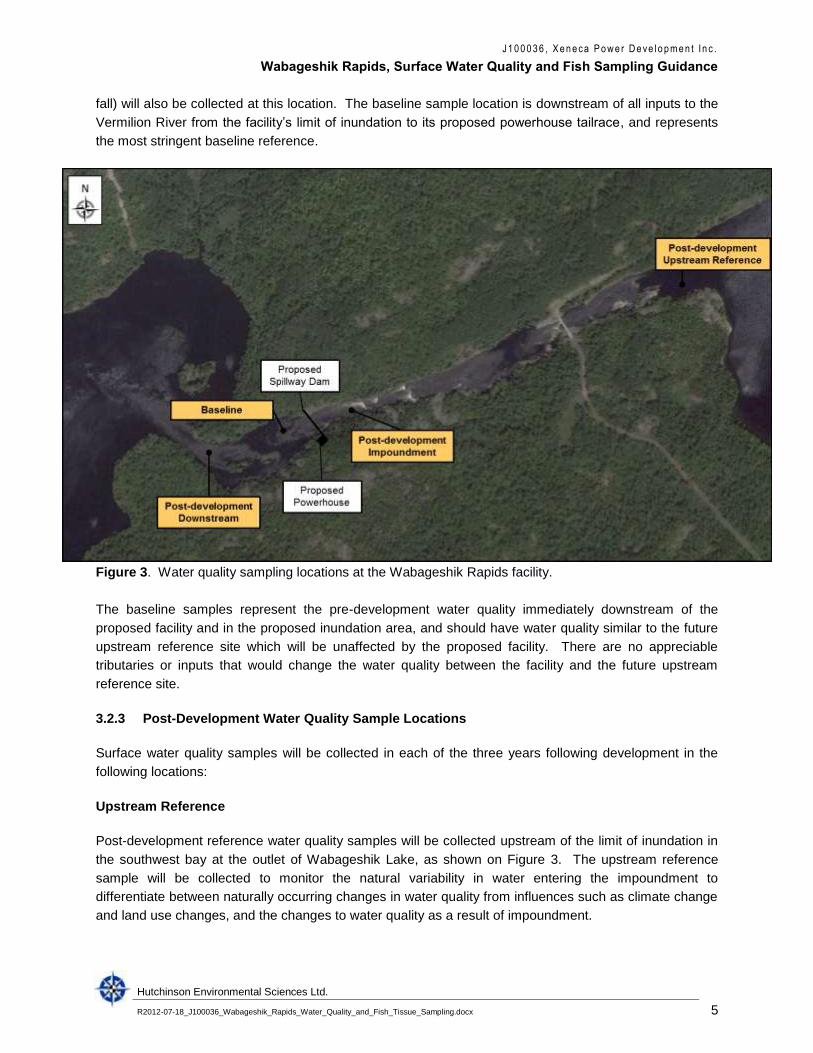
fall) will also be collected at this location. The baseline sample location is downstream of all inputs to the
Vermilion River from the facility’s limit of inundation to its proposed powerhouse tailrace, and represents
the most stringent baseline reference.
Figure 3. Water quality sampling locations at the Wabageshik Rapids facility.
The baseline samples represent the pre-development water quality immediately downstream of the
proposed facility and in the proposed inundation area, and should have water quality similar to the future
upstream reference site which will be unaffected by the proposed facility. There are no appreciable
tributaries or inputs that would change the water quality between the facility and the future upstream
reference site.
3.2.3 Post-Development Water Quality Sample Locations
Surface water quality samples will be collected in each of the three years following development in the
following locations:
Upstream Reference
Post-development reference water quality samples will be collected upstream of the limit of inundation in
the southwest bay at the outlet of Wabageshik Lake, as shown on Figure 3. The upstream reference
sample will be collected to monitor the natural variability in water entering the impoundment to
differentiate between naturally occurring changes in water quality from influences such as climate change
and land use changes, and the changes to water quality as a result of impoundment.
J1 0 0 0 3 6 , X e n e ca P o w e r D e ve l o p m e n t I n c .
Wabageshik Rapids, Surface Water Quality and Fish Sampling Guidance
Hutchinson Environmental Sciences Ltd.
R2012-07-18_J100036_Wabageshik_Rapids_Water_Quality_and_Fish_Tissue_Sampling.docx 6
Impoundment
Post-development water quality samples will be collected in the deepest part of the impoundment to
monitor the change in water quality in the inundated area. In addition to the water quality analyses and
field parameters that will be measured at the other sampling locations (Section 4.3.3) a temperature and
dissolved oxygen profile with measurements taken every metre of depth, will be conducted at the
impoundment water sample location to determine if thermal stratification is occurring in the impoundment.
If thermal stratification is identified, a discrete water quality sample will be collected from each thermally
stratified layer. The proposed impoundment water quality sample location is shown as “Post-
development, Impoundment” on Figure 3. This sample location may be moved if post-development, the
deepest part of the impoundment is in another location.
Downstream
Post-development water quality samples will be collected in the pool immediately downstream of the
proposed facility. The spillway dam and tailrace from the power house will both discharge to this pool and
collecting samples from this pool will measure the combined discharge of both of these structures. This
sample location is shown on Figure 3 as “Post-development, Downstream”.
3.2.4 Water Quality Sample Parameter List
All water quality samples will be analyzed for the following parameters, as recommended in the MOE
(2012) guidance:
pH, conductivity, alkalinity;
suspended and dissolved solids;
cations (Mg, Na, Ca, K);
anions (chloride, sulphate);
dissolved organic carbon;
total phosphorus;
nitrate, nitrite, ammonia and total Kjeldahl nitrogen (TKN);
metals;
low level total mercury (0.1 ng/L detection limit); and,
low level methyl mercury (0.02 ng/L detection limit).
Water temperature, dissolved oxygen, pH, conductivity and turbidity will be measured in the field at the
time of sample collection. A field data sheet for recording field parameter measurements and other
pertinent information at the time of sampling (e.g., weather, precipitation in the last 24 hours, field
parameter meter calibration) has been developed by HESL and will be provided to field staff for each
sampling event.
J1 0 0 0 3 6 , X e n e ca P o w e r D e ve l o p m e n t I n c .
Wabageshik Rapids, Surface Water Quality and Fish Sampling Guidance
Hutchinson Environmental Sciences Ltd.
R2012-07-18_J100036_Wabageshik_Rapids_Water_Quality_and_Fish_Tissue_Sampling.docx 7
Low-level phosphorus analysis will be conducted by the Trent University Laboratory in Dorset, Ontario as
the higher detection limits of commercial laboratories may not provide good resolution of phosphorus
concentrations in surface waters.
3.2.5 Water Quality Duplicates and QA/QC
A duplicate water quality sample will be collected during each baseline and post-development sampling
event. Analytical results from the sample and its duplicate pair will be compared to identify significant
differences in parameter concentrations and provide confidence in sample representativeness via
replication and the precision of the lab’s analytical methods. Samples from multiple projects will be
collected in approximately the same time frame by sampling teams across Ontario. 10% or more of all
samples taken over the multiple projects will be submitted as duplicates.
If only one year of baseline sampling is conducted, a replicate sample will be collected at the baseline
sample location during each visit, slightly after the first sample was collected to confirm that the samples
are representative of the river’s water quality. A sample collected at a slightly different time measures
different water moving through the same location of the river; if both samples are representative of this
location of the river, the analytical results should be similar. Replicate sampling address some sampling
and analytical variance issues associated with small analytical datasets.
4. Fish Tissue Sampling
Methyl mercury is a concern associated with all hydro-electric projects that inundate previously unflooded
land and mercury bio-accumulation is a well described response to land inundation. Soils and vegetation
in Ontario contain mercury from natural sources and from atmospheric deposition. Decomposition of
flooded organic matter enhances the methylation of inorganic mercury in soil and sediment to the
bioavailable and toxic form of methyl mercury.
Mercury may accumulate in the food chain, affecting the health of higher organisms such as predatory
fish and humans. Downstream fish populations may also be exposed to mercury as the inundated water
flows, or organisms and detritus containing mercury migrate, downstream. Upstream fish populations
may also be affected by inundation-generated mercury, as fish can migrate upstream against the river’s
current. Mercury concentrations in fish in the project area should be established at baseline to provide a
comparative baseline for any post-development changes of concentrations in fish.
4.1 Sample Locations
4.1.1 Baseline
Fish can move upstream and downstream throughout the project area and fish found in one location of
the project area could be exposed to mercury throughout their preferred habitats in other locations within
the project area. Specific sample sites will be selected within the project area based on the type of forage
fish or large fish targeted for sampling, as permitted by the Ontario Ministry of Natural Resources (MNR)
and according to the MNR “Riverine Index Netting, Manual of Instructions” (March, 2010).
J1 0 0 0 3 6 , X e n e ca P o w e r D e ve l o p m e n t I n c .
Wabageshik Rapids, Surface Water Quality and Fish Sampling Guidance
Hutchinson Environmental Sciences Ltd.
R2012-07-18_J100036_Wabageshik_Rapids_Water_Quality_and_Fish_Tissue_Sampling.docx 8
MOE (2012) recommended that reference sampling be conducted upstream of barriers to fish migration.
There is no barrier to upstream fish migration at the proposed Wabageshik Rapids facility. Therefore,
upstream reference sampling will not be conducted for the facility as fish can freely migrate from the
project area, upstream, and ‘upstream references’ would not provide an accurate reference of naturally
occurring mercury concentrations in fish. Sampling fish in a different branch of the river than the facility is
proposed for may not represent a reference for fish at the proposed facility due to different environmental
conditions.
4.1.2 Post-Development
Post-development, fish will be sampled within the same reach of the river as at baseline. There will be an
overflow weir at the facility which will not impede fish migration, and as such, fish will be able to move
throughout the project area as they did prior to facility development. Upstream reference sampling is not
recommended post-development as there is no upstream barrier to fish migration in the same branch of
the river as the proposed facility.
4.2 Sampling Schedule
4.2.1 Baseline and Post-Development
Fish tissue sampling will be conducted prior to construction (baseline) and on three occasions following
development starting on the third year, followed by sampling on the sixth and ninth years of operation.
Pre-development sampling will establish a baseline of mercury concentrations in fish tissue from which to
compare post-development mercury concentrations. Mercury accumulation in the food chain has a
slower response to inundation than water quality, and MOE (2012) recommends sampling on years three,
six and nine after development to assess mercury accumulation in fish tissue. If mercury concentrations
in fish tissue have not stabilized by year nine, additional sampling may be required and a revised program
can be derived at that time.
Baseline fish sampling was conducted by other consultants for Xeneca in the reach of the river that the
facility will be constructed on, from 500 m upstream of the impoundment to 500 m downstream of the
furthest proposed downstream discharge. Additional sampling will be conducted in the summer of 2012
in the same part of the river to complete the baseline fish sampling program.
4.2.2 Annual Timing of Sample Events
Fish sampling should be conducted during the most likely time of the year to catch the fish that are in the
area of the proposed facility. In most rivers, including the Vermilion, forage fish catches are most
abundant in late summer or early fall. Large fish may need to be sampled at a different time of the year,
depending on the habitat and species present at the facility.
Sampling over multiple visits in one year to obtain the required catch should be avoided for forage fish,
particularly if the sampling is focussed on yearlings, as relative sizes will increase quickly over the course
of one year, possibly resulting in problems interpreting mercury body burdens. For larger fish, sampling
over multiple visits in a single season, or even over two years is acceptable, provided that a comparable
size and distribution of fish are submitted for each sampling event.
J1 0 0 0 3 6 , X e n e ca P o w e r D e ve l o p m e n t I n c .
Wabageshik Rapids, Surface Water Quality and Fish Sampling Guidance
Hutchinson Environmental Sciences Ltd.
R2012-07-18_J100036_Wabageshik_Rapids_Water_Quality_and_Fish_Tissue_Sampling.docx 9
Where possible, fish sampling should be co-ordinated with water quality sampling to help relate the
results of the programs to each other and reduce expenses.
4.3 Existing Fish Samples
In 2010 and 2011, fish sampling was conducted by Natural Resource Solutions Inc. (NRSI) at the
proposed facility. Sampling was conducted according to the MNR’s Riverine Index Netting protocol.
72 fish were caught during the 2010 and 2011 programs. The most common sport fish species’ caught
were Walleye (Sander vitreus), Northern Pike (Esox Lucius), Yellow Perch (Perca flavescens) and
Smallmouth Bass (Micropterus dolomieu). Brown Bullhead (Ameiurus nebulosus), Lake Herring
(Coregonus artedi), Lake Sturgeon (Acipenser fulvescens), Longnose Sucker (Catostomus catostomus)
and White Sucker (Catostomus commersonii) were caught in lower abundance. Cyprinid species caught
and considered to be forage fish were Bluntnose Minnow (Pimephales notatus) and Fathead Minnow
(Pimephales promelas).
NSRI collected fish tissue samples from 17 Walleye (large fish) according to MOE’s “Protocol for the
Collection of Sport Fish Samples for Inorganic and Organic Contaminant Analyses”. These samples are
currently frozen and archived at NRSI’s facility in Waterloo, Ontario and will be analyzed when the
collections are complete in 2012.
4.4 2012 Fish Tissue Sampling Program
The MOE (2012) recommends that the following fish sizes and numbers of fish be sampled at each
location during each baseline and post-development sampling program:
Large Fish: 20 individuals of at least 25 to 55 cm size; fish species common to the area that can be
caught in subsequent years and piscivorous fish are preferred; and,
Forage Fish: five (5) composite samples of 5 to 10 individuals of yearling perch or other cyprinid
species; fish should be sufficient size to yield a composite sample of 10 grams.
The following fish remain to meet MOE (2012) recommendations and will be targeted in 2012 to complete
the baseline fish sampling program:
Large fish: three (3) samples by angling from Walleye or Northern Pike to be consistent with the
archived samples and meet MOE (2012) recommendations. If Pike are sampled, at least two
individuals are needed to meet MOE (2012) recommendations (i.e., two or more samples of any one
species are required for the species to be included in the sampling population); and,
Forage fish: five (5) composite samples of 5 fish each using gill nets and minnow traps, preferably
Bluntnose Minnow and Fathead minnow, or yearling Yellow Perch, as these species commonly occur
at the proposed facility.
The large fish and forage fish samples collected in 2012 and the 17 large fish samples collected in 2010
to 2011 by NSRI (currently archived) will be submitted to Flett Research in Winnipeg, Manitoba for
analysis of low level total mercury (detection limit < 2.0 ng/g). Low level methyl mercury analysis
J1 0 0 0 3 6 , X e n e ca P o w e r D e ve l o p m e n t I n c .
Wabageshik Rapids, Surface Water Quality and Fish Sampling Guidance
Hutchinson Environmental Sciences Ltd.
R2012-07-18_J100036_Wabageshik_Rapids_Water_Quality_and_Fish_Tissue_Sampling.docx 10
(detection limit < 1.0 ng/g) will be conducted by Flett on the 2012 composite forage fish samples in
additional to total mercury analysis.
It will be conservatively assumed that all mercury in large fish is methyl-mercury for fish consumption
guideline purposes. Methyl-mercury will be measured in addition to total mercury in forage fish to provide
information to the MOE on methyl-mercury accumulation in the food chain.
5. Closing
This document has been prepared to describe the surface water quality and mercury-in-fish sampling
programs to be conducted at the proposed Wabageshik Rapids hydroelectric generating facility.
Supporting rationale for the programs is provided in the HESL document titled “Surface Water Quality and
Fish Sampling Program, Hydroelectric Generating Facility Monitoring for Baseline Conditions and Early
Operation” (January, 2012) and the draft MOE document titled “From Class EA to Permit to Take Water:
A Guide to Understanding the Ministry of the Environment’s Technical Requirements for Waterpower”
(January, 2012). Please direct any questions concerning this guidance or the rationale used to develop it
to David Leeder or Neil Hutchinson of Hutchinson Environmental Sciences Ltd.
J1 0 0 0 3 6 , X e n e ca P o w e r D e ve l o p m e n t I n c .
Wabageshik Rapids, Surface Water Quality and Fish Sampling Guidance
Hutchinson Environmental Sciences Ltd.
R2012-07-18_J100036_Wabageshik_Rapids_Water_Quality_and_Fish_Tissue_Sampling.docx A1
Appendix A
HESL Rationale Document (January, 2012)
3-1 Taylor Road, Bracebridge, ON P1L 1S6 ph: 705 645 0021
121 Charles St. W. Unit C406, Kitchener, ON N2G 1H6 ph: 519 576 1711
Hutchinson
Environmental Sciences Ltd.
Prepared for: Xeneca Power Development Inc.
Job No.: J100036
June, 2012
Xeneca Power Development Surface Water Quality and
Fish Sampling Program
Hydroelectric Generating Facility Monitoring
For Baseline Conditions and Early Operation
3-1 Taylor Road, Bracebridge, ON P1L 1S6 ph: 705-645-0021
R2012-07-16_J100036_Surface Water and Fish Sampling Rationale_Update to MOE 2012.docx
Hutchinson Environmental Sciences Ltd.
July 16, 2012 Project No.: J100036
Mr. Ed Laratta
Manager, Environmental Programs and Approvals
Xeneca Power Development Inc.
5160 Yonge Street, Suite 520
Toronto, ON
M2N 6L9
Dear Mr. Laratta:
The Surface Water Quality and Fish Sampling Programs for Hydroelectric Generating Facility Monitoring
has been prepared based on the Draft Ontario Ministry of the Environment (MOE) document titled “From
Class EA to Permit to Take Water: A Guide to Understanding the Ministry of the Environment’s Technical
Requirements for Waterpower” (January, 2012), and subsequent conversations with MOE regarding their
guidance and its application to Xeneca’s proposed hydroelectric generating facilities. This revised
document supersedes our May, 2012 reported (titled the same).
The revised draft describes our application of the MOE (2012) guidance to the proposed Xeneca facilities
and provides the rationale for the application for the MOE’s review and acceptance. In most cases,
MOE’s 2012 guidance has been applied as recommended by the ministry. In some cases, the MOE
guidance does not apply to the conditions at the Xeneca facilities and we have recommended an
alternative sampling or analytical approach which meets the intent of the MOE guidance as we
understand it.
Facility-specific sampling plans are currently being finalized for the priority Xeneca facilities that are being
sampled in 2012 for water quality and mercury concentrations in fish. These reports are site-specific
companion documents to this report. Water quality and fish sampling was mostly completed in 2011 for
the four proposed Xeneca facilities on the Kapuskasing River, prior to MOE’s current guidance (2012),
and as such the recommendations presented herein do not apply to those facilities.
Please review this report and do not hesitate to get in touch if you have any questions or concerns. I
thank you for the opportunity to assist Xeneca and look forward to the next stages of the project.
Sincerely,
Neil J. Hutchinson, Ph.D.
President, Principal Aquatic Scientist
J100036, Xeneca Power Development
Surface Water Quality and Fish Sampling Programs
Hutchinson Environmental Sciences Ltd.
R2012-07-16_J100036_Surface Water and Fish Sampling Rationale_Update to MOE 2012.docx ii
Signatures
Bev Clark
Senior Aquatic Scientist
David Leeder
Intermediate Environmental Scientist
Neil J. Hutchinson, Ph.D.
Principal Scientist
J100036, Xeneca Power Development
Surface Water Quality and Fish Sampling Programs
Hutchinson Environmental Sciences Ltd.
R2012-07-16_J100036_Surface Water and Fish Sampling Rationale_Update to MOE 2012.docx iii
Table of Contents
1. Introduction .................................................................................................................................... 1
2. Background .................................................................................................................................... 2
2.1 Relevance of Monitoring ..................................................................................................... 2 2.2 Mechanisms of Post-Development Change ....................................................................... 2
3. Monitoring Objectives ................................................................................................................... 4
4. Surface Water Quality Monitoring ................................................................................................ 4
4.1 Water Quality Parameters ................................................................................................... 4 4.2 Water Sampling – Temporal ............................................................................................... 5
4.2.1 Program Duration ................................................................................................... 5 4.2.2 Annual Sampling Schedule .................................................................................... 6
4.3 Water Sampling – Spatial ................................................................................................... 6 4.3.1 Pre-Development (Baseline) Water Quality ........................................................... 6 4.3.2 Post-Development Water Quality........................................................................... 8 4.3.3 Water Quality QA/QC ............................................................................................. 8
5. Mercury in Fish Tissue .................................................................................................................. 8
5.1 Fish Sample Sizes and Quantities ...................................................................................... 9 5.2 Fish Sampling - Temporal ................................................................................................. 10
5.2.1 Program Duration ................................................................................................. 10 5.2.2 Number and Timing of Events Annually .............................................................. 10
5.3 Fish Sample Locations ...................................................................................................... 11 5.3.1 Baseline ............................................................................................................... 11 5.3.2 Post-Development ............................................................................................... 12
5.4 Fish Mercury Analysis ....................................................................................................... 14
6. Closing .......................................................................................................................................... 14
7. References .................................................................................................................................... 16
List of Figures
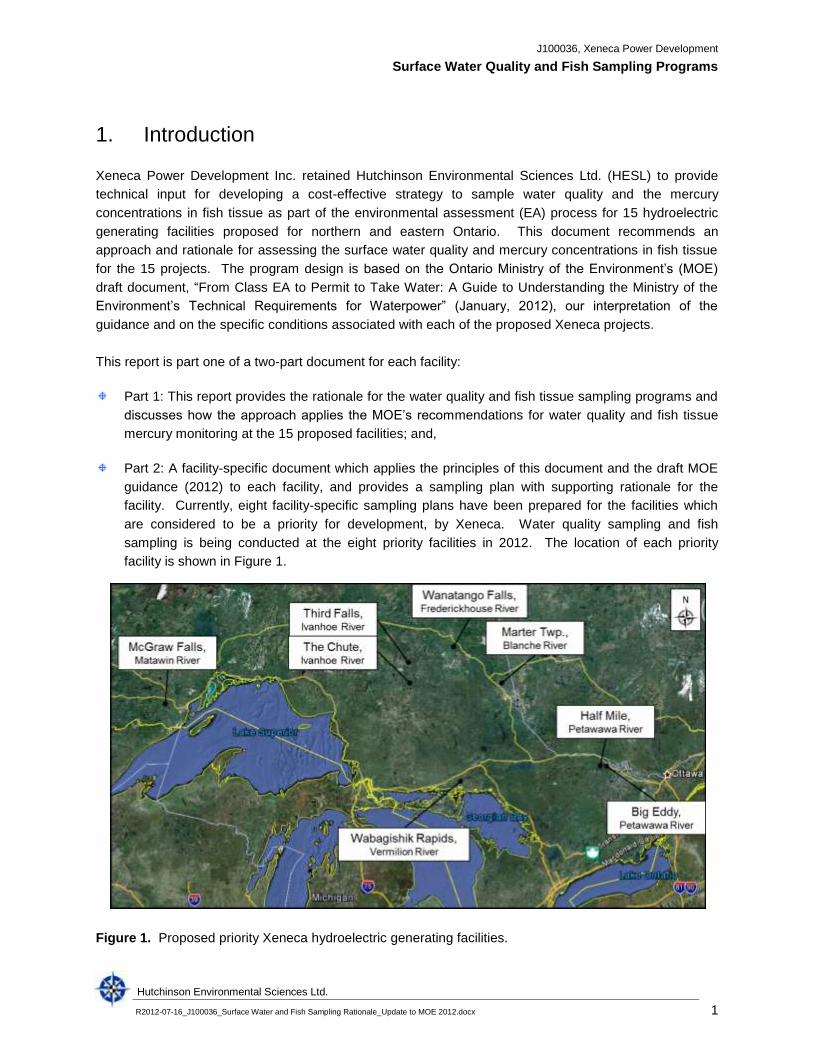
Figure 1. Proposed priority Xeneca hydroelectric generating facilities. ...................................................... 1
Figure 2. Water quality sample location conceptual diagrams. ................................................................... 7
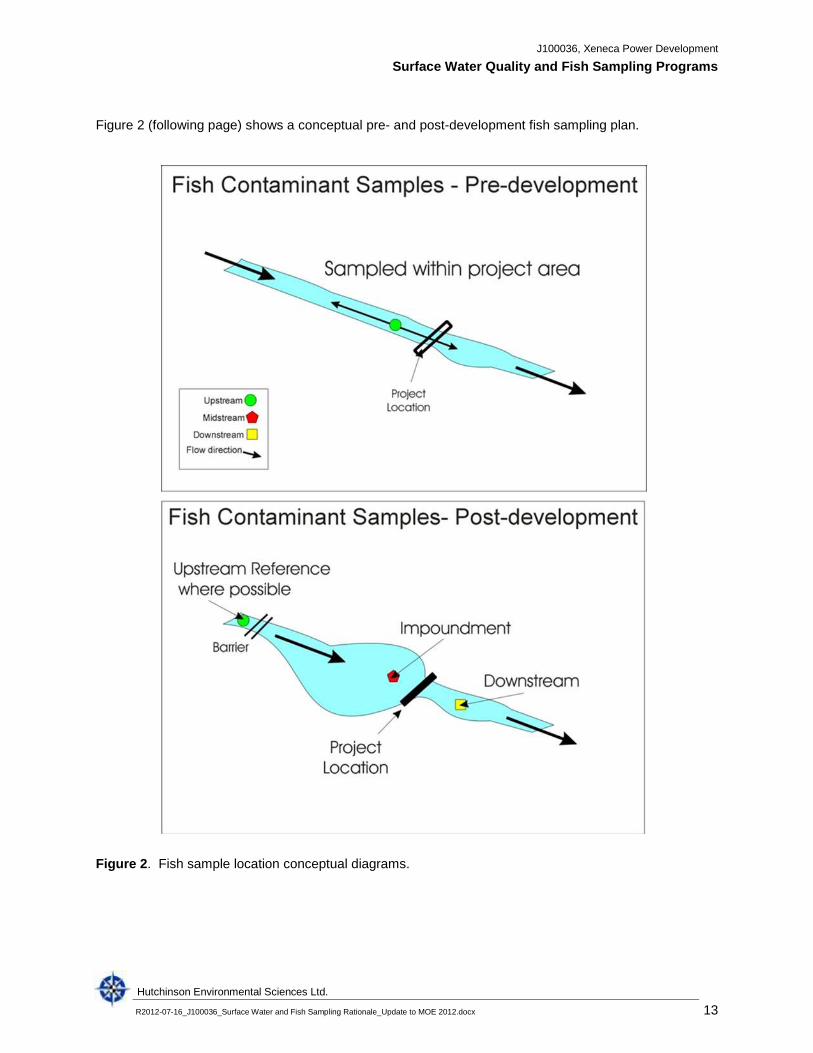
Figure 3. Fish sample location conceptual diagrams. ............................................................................... 13
J100036, Xeneca Power Development
Surface Water Quality and Fish Sampling Programs
Hutchinson Environmental Sciences Ltd.
R2012-07-16_J100036_Surface Water and Fish Sampling Rationale_Update to MOE 2012.docx 1
1. Introduction
Xeneca Power Development Inc. retained Hutchinson Environmental Sciences Ltd. (HESL) to provide
technical input for developing a cost-effective strategy to sample water quality and the mercury
concentrations in fish tissue as part of the environmental assessment (EA) process for 15 hydroelectric
generating facilities proposed for northern and eastern Ontario. This document recommends an
approach and rationale for assessing the surface water quality and mercury concentrations in fish tissue
for the 15 projects. The program design is based on the Ontario Ministry of the Environment’s (MOE)
draft document, “From Class EA to Permit to Take Water: A Guide to Understanding the Ministry of the
Environment’s Technical Requirements for Waterpower” (January, 2012), our interpretation of the
guidance and on the specific conditions associated with each of the proposed Xeneca projects.
This report is part one of a two-part document for each facility:
Part 1: This report provides the rationale for the water quality and fish tissue sampling programs and
discusses how the approach applies the MOE’s recommendations for water quality and fish tissue
mercury monitoring at the 15 proposed facilities; and,
Part 2: A facility-specific document which applies the principles of this document and the draft MOE
guidance (2012) to each facility, and provides a sampling plan with supporting rationale for the
facility. Currently, eight facility-specific sampling plans have been prepared for the facilities which
are considered to be a priority for development, by Xeneca. Water quality sampling and fish
sampling is being conducted at the eight priority facilities in 2012. The location of each priority
facility is shown in Figure 1.
Figure 1. Proposed priority Xeneca hydroelectric generating facilities.
J100036, Xeneca Power Development
Surface Water Quality and Fish Sampling Programs
Hutchinson Environmental Sciences Ltd.
R2012-07-16_J100036_Surface Water and Fish Sampling Rationale_Update to MOE 2012.docx 2
The EAs for four proposed Xeneca facilities on the Kapuskasing River are currently under final regulatory
review. The water quality and fish assessment work on these facilities was completed in the fall of 2011,
with the exception of some minor data gap filling field work that is being conducted in 2012. Hatch
Consultants conducted this work and it is HESL’s understanding from Xeneca that the work has satisfied
the recommendations presented in MOE’s draft document titled “Guidance for Conducting Baseline and
Post Development Monitoring of Water Quality and Fish Tissue for Proposed Waterpower Projects”
(November, 2010) and the intent of MOE’s 2012 draft guidance document. Since the work on the
Kapuskasing River facilities was mostly completed prior to MOE’s current guidance document
(January, 2012), the recommendations presented herein do not apply to those facilities.
2. Background
2.1 Relevance of Monitoring
Surface water quality and mercury accumulation in fish tissue may be affected by any hydropower
development, or impounding of surface water, including the impoundments related to the proposed
Xeneca projects. Water quality and mercury in fish tissue should be monitored before and after facility
development to assess if change is occurring as a result of the development and if this change poses a
human health or environmental risk. For example, mercury concentrations are elevated in fish tissue
through much of Ontario as a result of atmospheric deposition and natural soil weathering, and a pre-
development baseline of mercury concentrations in fish should be established so that post-development
concentrations are not mistakenly attributed to a development involving water impoundment. Conversely,
if unacceptable change is occurring as a result of development, monitoring results provide valuable
information on the trend(s) of the change relative to pre-development conditions, and informed mitigating
action can be undertaken. The monitoring results from existing projects can also be used to design and
operate future projects in a way that will have less of an environmental impact.
2.2 Mechanisms of Post-Development Change
Water will be impounded or diverted to some extent as part of each of the proposed Xeneca projects.
The extent of impoundment and diversion will vary between the projects depending on the operating
regime of the project, the conditions at each facility, and stakeholder as well as environmental
requirements. Diversion and impoundment are required to increase the head (fall) of water through the
facility to generate power, and water storage is required so that there is a relatively constant water supply
through the year for consistent power generation, to maintain flows in the natural watercourse, or a
combination of the two.
Impounding a river creates an environment in the impounded area that can be more pond- or lake-like
than the original river. This results in physical changes to the aquatic environment which may include
vertical thermal stratification in the impounded water body, a change in nutrient or metal cycling and
concentrations, and/or changes to the fish and invertebrate communities. Similar effects may occur in
lakes that increase in depth and surface area as a result of impounding water in their basins, although
HESL understands that lakes will not be affected by the impoundments of the proposed Xeneca projects.
J100036, Xeneca Power Development
Surface Water Quality and Fish Sampling Programs
Hutchinson Environmental Sciences Ltd.
R2012-07-16_J100036_Surface Water and Fish Sampling Rationale_Update to MOE 2012.docx 3
Impounded water will be exposed to areas of rock, soil and vegetation that have not been historically
saturated with water. Impoundment creates both physical and chemical changes to the water as flooded
land changes from a terrestrial environment to an aquatic or riparian environment with nutrients, metals,
organic carbon, dissolved and suspended solids being released to the impounded water. The rate and
nature of this change from a terrestrial to an aquatic environment will affect the rate of release of these
materials and will depend on several factors, including the type of terrestrial vegetation, the depth and
type of soil saturated by the impounded area, and the depth and duration of the impoundment.
Typically, following impoundment, water chemistry will change quickly and then stabilize. Nutrients,
metals, cations (i.e., Mg, Na, Ca, K), anions (i.e., chloride and sulphate), dissolved organic carbon (DOC),
dissolved and suspended solids, conductivity, alkalinity, dissolved oxygen, and temperature may all
change as a result of:
Chemical and physical inputs to surface water from the inundated land;
A shift in the aquatic processes of the water in the impoundment; and,
The physical structure of the water in the impoundment (e.g., water depth, thermal stratification,
surface area of the impoundment and water residence time in the impoundment).
Changes in water quality downstream of a facility may occur as the impounded water moves through
downstream surface water systems.
Water quality changes in the impoundment and downstream may be reflected in increased concentrations
of some parameters and decreases in others. The physical effects of impoundment may also affect the
chemical effects of impoundment. For example, the impoundment may trap and store particulate material
as sediment, thus decreasing the downstream export of total nutrients or metals that adsorb to sediment.
In all cases, water chemistry and physical parameters may stabilize at different conditions after
impoundment than prior to impoundment or conditions may show a response to impoundment and then
return to pre-impoundment conditions. These changes should be compared to baseline conditions and
environmental guidelines to assess if they will result in a negative environmental impact.
Mercury is present naturally in soils and rocks in Ontario, and environmental concentrations are
enhanced by atmospheric deposition from human sources such as the combustion of coal. Inundating
land with water results in the partial release of natural and anthropogenic inorganic mercury (Hg)
accumulated in the vegetation and soils (Bodaly et al. 1984, Hecky et al. 1991). Decomposition of flooded
organic matter in soils and vegetation enhances the methylation of inorganic Hg to the bioavailable and
toxic form of methyl mercury (Kelly 1997, Montgomery 2000). These elevated concentrations of mercury
and methyl mercury may biomagnify within the food chain and can pose a health concern to humans and
wildlife through fish consumption (Bodaly et al. 1984, Jackson 1988, Hall et al. 2005). Mercury is
therefore always a potential concern associated with hydro-electric projects and bio-accumulation is a
well-described response to impoundment.
Mercury concentrations in fish may increase rapidly after impoundment and then decrease and stabilize
in subsequent years. This cycle has been observed in hydroelectric projects in Quebec where mercury is
J100036, Xeneca Power Development
Surface Water Quality and Fish Sampling Programs
Hutchinson Environmental Sciences Ltd.
R2012-07-16_J100036_Surface Water and Fish Sampling Rationale_Update to MOE 2012.docx 4
also present in the soils and vegetation of impounded areas from natural and anthropogenic sources
(http://www.hydroquebec.com/sustainable-development/documentation/mercure.html).
Mercury accumulation in fish is not confined to the impounded area. If there are no barriers to fish
migration, fish will move from the impounded area to adjacent areas and mercury accumulated in the
impoundment will be passed on to higher predators if the fish are consumed. Conversely, mercury is
present in all Ontario water courses and background mercury concentrations may be higher and
bioavailable in water bodies unaffected by the impoundment; mercury accumulated in areas outside of
the impoundment may be observed in fish in the impoundment if fish migrate to-and-from the
impoundment.
3. Monitoring Objectives
The water quality and fish sampling programs are designed to assess:
1. Any differences in surface water quality pre- and post-development using the indicator parameters
and protocols recommended by the MOE (2012) in waters upstream, in the impoundments of, and
downstream of the proposed facilities; and,
2. Any differences in mercury concentrations in fish tissue pre- and post-development in the reach of
the river that the facility will be constructed on, as recommended by the MOE (2012). Where barriers
to fish migration are present on the same reach of the river as the facility, or the facility when
constructed will create a barrier, the differences in mercury concentrations in fish tissue upstream
and downstream of the barriers should also be assessed.
The overall sampling program is intended to meet the MOE (2012) draft guidance objectives and
recommendations.
4. Surface Water Quality Monitoring
4.1 Water Quality Parameters
All water quality samples should be analyzed for the following parameters, recommended by MOE
(2012):
pH, conductivity, alkalinity;
suspended and dissolved solids;
cations (Mg, Na, Ca, K);
anions (chloride, sulphate);
dissolved organic carbon;
total phosphorus;
nitrate, nitrite, ammonia and total Kjeldahl nitrogen (TKN);
metals;
J100036, Xeneca Power Development
Surface Water Quality and Fish Sampling Programs
Hutchinson Environmental Sciences Ltd.
R2012-07-16_J100036_Surface Water and Fish Sampling Rationale_Update to MOE 2012.docx 5
low level total mercury (0.1 ng/L detection limit); and,
low level methyl mercury (0.02 ng/L detection limit).
Water temperature, dissolved oxygen, pH, conductivity and turbidity should also be measured in the field
at the time of sample collection. A field data sheet for recording field parameter measurements and other
pertinent information at the sample location will be completed at the time of sampling.
Low-level phosphorus analysis should be conducted by the Trent University Laboratory in Dorset, Ontario
as the detection limits of commercial laboratories are often too high to provide good resolution of
phosphorus concentrations in surface waters.
All water samples should be collected using ‘ultra clean’ protocols and be analyzed by a laboratory that
can achieve the minimum detection limits for low-level mercury and the Ontario Provincial Water Quality
Objectives (PWQOs). Water samples should be collected just below the surface of the water, except in
areas where thermal stratification is present (e.g., lakes, ponds, impoundments or quiescent pools). In
the case of thermal stratification, a depth profile should be conducted at deepest known point of the water
body, with water temperature and dissolved oxygen measured with every metre of depth. Once the
thermal stratification is determined, a water sample will be collected from the well-mixed surface layer and
the thermally isolated bottom layers.
4.2 Water Sampling – Temporal
4.2.1 Program Duration
Water quality sampling is proposed for two years prior to development and in the early stages of each
facility’s operation. Two years of pre-development sampling will establish a baseline for water quality
against which post-development water quality can be compared to assess whether or not a project is
having an effect on water quality within the impoundment and immediately downstream.
In some cases, it may not be possible to collect two years of baseline data before construction begins. If
only one year of baseline sampling is conducted, a replicate sample should be collected at each water
sample location at a slightly different time, to confirm that the sampling is representative of the river’s
water quality moving through the sample location on the sample day. This will address some sampling
and analytical variance issues associated with small analytical datasets. Baseline sampling can also be
conducted upstream of a facility during construction, provided the natural water elevations and flow have
not been altered by construction.
Following development, early operation monitoring should be conducted annually for the first three years
of facility operation. Given the typical response of water quality to impoundment with a rapid change in
water quality shortly after impoundment, followed by water quality stabilizing in the early stages of a
facility’s operation, this time frame should be sufficient to monitor changes and establish a new baseline
of water quality (if any). If water quality does not reach a stable state by the end of year three, a longer
term monitoring program can be developed. Construction-phase water quality monitoring (if required) is
not discussed in this document.
J100036, Xeneca Power Development
Surface Water Quality and Fish Sampling Programs
Hutchinson Environmental Sciences Ltd.
R2012-07-16_J100036_Surface Water and Fish Sampling Rationale_Update to MOE 2012.docx 6
4.2.2 Annual Sampling Schedule
Seasonal water quality in Ontario rivers is strongly tied to the river’s hydrograph, and seasonal
differences in water quality can be represented by water samples collected during each of the annual
hydrograph periods. All water quality samples should be collected three times per year during the open
water season to sample the spring freshet commonly occurring in mid-April to mid-May during the
descending hydrograph, the summer low-flow period commonly in early August to early September and
the fall mid-flow period commonly in late October to late November on the ascending arm of the
hydrograph, as recommended by MOE (2012).
Sampling should correspond to the river’s hydrograph and be adjusted temporally to occur during the
targeted periods as required. For years that are different than the historical trend for the river, this will
require monitoring the river’s hydrograph and sampling accordingly.
4.3 Water Sampling – Spatial
4.3.1 Pre-Development (Baseline) Water Quality
For each proposed facility, pre-development, baseline water quality samples (with duplicates) should be
collected within the project area (i.e., from somewhere between the proposed upstream extent of the
impoundment and the discharge of the power house tailrace). This assumes that water quality is the
same within the reach of the project area in an unobstructed river. Where the project area is not uniform,
other strategies should be considered. Four examples of baseline water quality sampling locations are
proposed to reflect different project environments:
1. One sampling location is adequate for an unobstructed and uniform project area (Figure 1,
Scenario A – following page);
2. A tributary or other influence (e.g., urban runoff) entering the river within the project area could affect
water quality. In this case, a water sample collected upstream and downstream of the influence
differentiates between the water quality of the river entering the project area and the combined water
quality of the river and the tributary within the project area (Figure 1, Scenario B);
3. If the impoundment provides direct hydraulic connection with an upstream lake, an upstream sample
should be collected from the lake to determine its pre-development water quality (Figure 1,
Scenario C), as lake water quality can vary appreciably from that in a downstream river. If the pond
or lake is thermally stratified, a temperature and dissolved oxygen depth profile should be taken at its
deepest point and water samples collected from each thermal stratification layer (if present). None of
the proposed priority Xeneca facilities impound water to a lake at this time; and,
4. If there is a ponded water or an impoundment within the project area, a pre-development water
quality sample should be collected downstream of the pond, within the pond and upstream of the
pond (Figure 1, Scenario D) as the water quality may vary appreciably between these locations. If
the pond or lake is thermally stratified, a temperature and dissolved oxygen depth profile should be
taken at its deepest point and water samples collected from each thermal stratification layer (if
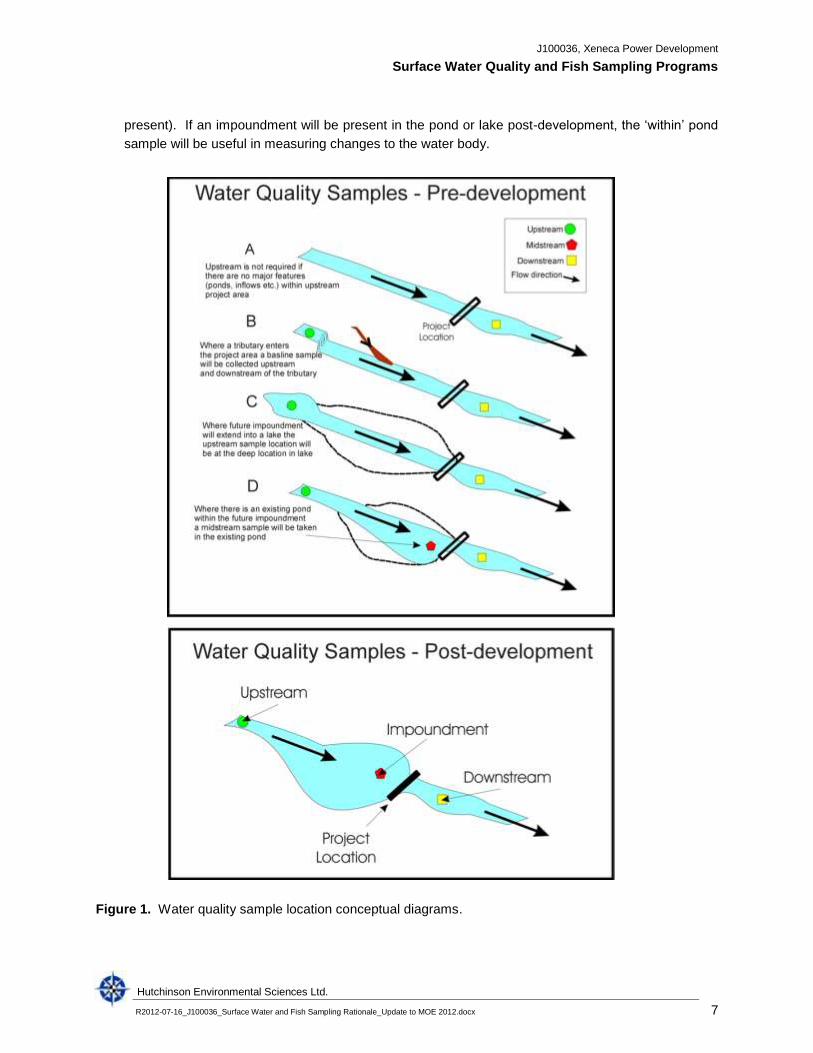
J100036, Xeneca Power Development
Surface Water Quality and Fish Sampling Programs
Hutchinson Environmental Sciences Ltd.
R2012-07-16_J100036_Surface Water and Fish Sampling Rationale_Update to MOE 2012.docx 7
present). If an impoundment will be present in the pond or lake post-development, the ‘within’ pond
sample will be useful in measuring changes to the water body.
Figure 1. Water quality sample location conceptual diagrams.
J100036, Xeneca Power Development
Surface Water Quality and Fish Sampling Programs
Hutchinson Environmental Sciences Ltd.
R2012-07-16_J100036_Surface Water and Fish Sampling Rationale_Update to MOE 2012.docx 8
4.3.2 Post-Development Water Quality
For each proposed facility, post-development water quality samples will be collected during the first three
years of facility operation as shown at the bottom of Figure 1 and described below:
Upstream: A water sample should be collected in the reach of river immediately upstream of the
impoundment. The upstream reference sample is to assess the quality of the water entering the
impoundment (unaffected by the development) to provide a reference from which to compare
impoundment water quality. The upstream sample will also assess the effects of natural variability on
water quality by comparing upstream water quality, unaffected by the development, over time and to
pre-development baseline water quality. Upstream post-development water quality and baseline
water quality should be comparable; if it is not, natural variability is affecting water quality, and the
difference between baseline and post-development upstream water quality should be considered
when interpreting post-development impoundment and downstream water quality. This will
differentiate between natural or regional environmental effects and impoundment-related effects on
water quality.
Impoundment: A water sample should be collected one meter off of the bottom in the deepest part of
each impoundment. In cases where an impoundment is thermally stratified, a temperature and
dissolved oxygen profile should be measured, and water samples collected from the mixed surface
layer and the deeper hypolimnion (if present).
Downstream: A water sample should be collected in the reach of the river within 500 m downstream
of all project discharges so that any project effects can be determined.
4.3.3 Water Quality QA/QC
A blind duplicate water quality sample should be collected during each baseline or post-development
sampling event. Analytical results from the sample and its duplicate pair can be compared assess
confidence in sample representativeness via replication. The blind duplicate can also be used to confirm
the accuracy of the lab’s analytical methods by comparison to its sample pair.
Samples from multiple projects will be collected in approximately the same time frame by sampling teams
across Ontario. 10% or more of all samples taken over the multiple projects will be submitted as blind
duplicates to assess analytical error for each sampling event.
5. Mercury in Fish Tissue
Mercury can bio-magnify through the food chain and can result in increases in fish body burdens even
when increased mercury concentrations are not detectable in ambient water samples, as mercury uptake
in fish is primarily through food sources. Fish will integrate spatial and temporal changes in contaminant
availability over time as contaminants accumulate in their tissues, as they forage in different areas
seasonally and during different life stages. Measuring the mercury in fish measures the mercury in living
J100036, Xeneca Power Development
Surface Water Quality and Fish Sampling Programs
Hutchinson Environmental Sciences Ltd.
R2012-07-16_J100036_Surface Water and Fish Sampling Rationale_Update to MOE 2012.docx 9
receptors directly and provides a means of measuring mercury increases in surface water that might not
otherwise be detectable.
Mercury accumulation can affect fish health and the health of predators that consume fish, including
humans. Sampling young forage fish that have only accumulated mercury over one or two years
provides an indication of mercury change in the environment over a relatively short time – comparing the
mercury concentrations in these samples to previous samples of similar age, species and habitat,
provides an empirical record of mercury change over time. In the case of mercury increases in the
environment, this record is an important ‘early warning’ of unacceptable mercury concentrations and
allows time for mitigating actions to be implemented before increased mercury in the environment
accumulates in predators higher up the food chain. Sampling mercury in large piscivorous predatory fish
provides an indication of mercury concentrations near the top of the food chain and information from
which to base human fish consumption guidelines.
Mercury sampling in fish tissue has the following objectives:
1. To evaluate the potential impacts of waterpower development on mercury burdens in fish; and,
2. To advise fish consumption guidelines over the life of a facility.
Fish sizes and quantities, sampling locations and frequencies, and sample analysis as recommended by
MOE (2012) and adapted to suit the Xeneca priority projects are described in the following sub-sections.
5.1 Fish Sample Sizes and Quantities
MOE (2012) recommend that fish be sampled in the following sizes and quantities, at each sampling
location.
Large Fish: 20 individuals of at least 25 to 55 cm length. It is preferred that a fillet be collected of
each fish sample, 20 grams in weight minimum and preferably 50 grams, as described in MOE’s
“Protocol for the Collection of Sport Fish Samples for Inorganic and Organic Contaminant Analyses”.
Fish smaller than 15 cm total length are unacceptable. If only one fish of a species is caught it is also
unacceptable as it may not be common to the area of the facility or representative of its population.
Following development, the number of large fish collected from each sample location can be
decreased to 10 for each sampling event. Where possible, non-lethal fish tissue sampling
techniques are encouraged for large fish (e.g., 100 mg tissue plugs obtained using a dermal punch -
Baker et al, 2004). Non-lethal sampling may not be possible for some species or for forage fish.
Forage Fish: 5 composite samples of 5 to 10 individuals of yearling perch or other cyprinid species.
The fish should be sufficient size to yield a composite sample of 10 grams within the following range:
Spottail shiners and minnows: 50 to 70 mm in total length; and,
Yearling yellow perch: 50 to 100 mm total length.
J100036, Xeneca Power Development
Surface Water Quality and Fish Sampling Programs
Hutchinson Environmental Sciences Ltd.
R2012-07-16_J100036_Surface Water and Fish Sampling Rationale_Update to MOE 2012.docx 10
Yearling perch are preferred because they are easy to identify and the accumulation of mercury in
perch is well known. With other small fish species, the ages of the fish may not be readily known
and the only reliable qualifying data for sampled fish may be that they are of the same species and
size, captured from the same area.
A sampling location is considered to be the area of a facility that is sampled (i.e., upstream, impoundment
or downstream) and may include several sub-sample sites in each area to catch the recommended
number of fish. For example, post-development there will be at least two sampling locations per facility:
one in the impoundment and one downstream, possibly with several nets deployed in different locations
of each the impoundment and downstream areas to catch the recommended number of fish for each
area. The age and location of all fish samples retained for mercury analysis should be recorded.
At baseline, the fish selected for sampling should be common to the area of the facility and available
following development. Different fish species accumulate mercury differently, so it is important to monitor
the same species pre- and post-development so that the effects of mercury increases (if any) are not
confused with differences in fish foraging/prey habits or fish physiology. The population effects from
lethal sampling pre- and post-development should be considered for sample comparison and the
numbers of fish sampled should be decreased if sampling will stress the fish population.
In some cases large predatory fish may not be available in the numbers recommended by MOE (e.g., at
the proposed Big Eddy and Half Mile facilities on the Petawawa River). In these cases, large omnivorous
fish such as catfish that may be consumed by humans should be substituted for large predatory fish. The
species to be substituted for large predatory fish should be proposed to MOE on facility-by-facility basis
with rationale supporting the substitution.
5.2 Fish Sampling - Temporal
5.2.1 Program Duration
MOE (2012) recommends that fish tissue sampling be conducted pre-development and every three years
post-development starting on the third year of operation of the facility and ending on the ninth year of
operation. Pre-development sampling will establish a baseline for mercury concentrations in fish tissue
from which to compare post-development mercury concentrations and to assess if a hydroelectric facility
is causing an increase in mercury concentrations in fish. The need to continue with this sampling
frequency should be reviewed after the ninth year to determine if mercury concentrations have increased
and if so, if the accumulation has stabilized.
5.2.2 Number and Timing of Events Annually
Fish sampling should be conducted during the most likely time of the year to catch the fish that are in the
area of each proposed facility (e.g., if Walleye are targeted, sampling would be conducted during the
spring spawning season, permits providing). For some locations, multiple visits may be required over the
year to obtain enough fish to meet minimum sample sizes. Sampling over multiple visits should be
avoided for forage fish, particularly if the sampling is focussed on yearling fish, as relative sizes will
increase quickly over the course of one year, with potential problems interpreting body burdens. For
J100036, Xeneca Power Development
Surface Water Quality and Fish Sampling Programs
Hutchinson Environmental Sciences Ltd.
R2012-07-16_J100036_Surface Water and Fish Sampling Rationale_Update to MOE 2012.docx 11
larger fish, sampling over multiple visits in a single season, or even over two years is acceptable,
provided that the same sized fish are analyzed for mercury each year.
Fish sampling programs have been conducted at all of the proposed priority facilities to date and the
types of fish, their locations during the year and effective capture methods are generally known. The
species of fish targeted for sampling varies between the proposed facilities and is described in detail
along with the time of sampling for each facility in the site-specific sampling plans. Where possible, fish
sampling should be co-ordinated with water quality sampling to help relate the results of each program to
each other and reduce expenses.
5.3 Fish Sample Locations
5.3.1 Baseline
Fish can migrate up and downstream through a river depending on their needs at different life stages or
as a result of seasonal influences that affect water flow and forage. Unless a barrier to fish migration
currently exists at a proposed facility, it is assumed that fish captured upstream of a proposed facility
could move downstream of the facility, and vice-versa. Therefore, if there is no barrier to fish passage at a
proposed facility, pre-development fish sampling can focus on locations within the project area where the
highest catches of fish are expected. There is no need to separate upstream from downstream sites in
this case.
If a barrier to fish migration currently exists within the project area, fish may migrate downstream through
the barrier but cannot migrate back upstream. Barriers may cause some populations of fish to be isolated
in upstream areas which will be influenced by the development. In these cases the fish in the upstream
area should also be sampled pre-development to establish baseline conditions.
To provide a reference of mercury in fish from a location that fish cannot migrate to from a proposed
facility once it is developed, MOE (2012) recommends that fish sampling be conducted upstream of the
proposed facility on the upstream side of the nearest barrier to fish migration. This sampling is
recommended at baseline and post-development for spatial and temporal comparison of results.
At most of the proposed Xeneca facilities, there is no barrier to fish migration upstream of the proposed
facility and on the same reach of the river. The reach of the river is defined as a length of river that does
not have any tributaries or wetlands draining into it, or any changes in land use or land type adjacent to it,
up to 10 km upstream of a proposed facility and 5 km downstream. Drainage inputs to a river or changes
in adjacent land may alter the downstream condition of the river and the fish in it, and sampling upstream
or of these influences relative to a facility may not be representative of the river conditions at the facility.
Upstream reference sampling is not recommended at facilities where there is no barrier to fish migration
within 10 km of and within the same reach of the river as a proposed facility, as the reference sampling
may not represent conditions at the facility. For the same reason, sampling should not be conducted
downstream of a facility and downstream of a change in adjacent land or other influence, as the results
may not be representative of the conditions at the facility.
J100036, Xeneca Power Development
Surface Water Quality and Fish Sampling Programs
Hutchinson Environmental Sciences Ltd.
R2012-07-16_J100036_Surface Water and Fish Sampling Rationale_Update to MOE 2012.docx 12
5.3.2 Post-Development
Post-development, fish should be sampled in the following locations, within the same reach of the river as
the facility:
Upstream (reference): In cases where there is barrier to fish migration upstream of the proposed
facility and within the same reach of the river, fish sampling should be conducted upstream of the
barrier to fish migration to provide a temporal and spatial reference. The upstream reference will
also assess the natural variability of water and fish quality entering the area of the facility. If there is
no upstream reference for a facility, natural variability should be conservatively considered during
interpretation of fish sampling data;
Impoundment: Upstream fish sampling should be conducted in the impoundment. This represents
the ‘worst-case’ condition, as these fish are most likely to be exposed to any mercury increases in
water or the food chain resulting from the impoundment. The fish species sampled post-
development should be the same as those sampled at baseline. However, this may not be possible
in the impoundment if the physical environment of the river has changed post-development, resulting
in a change of fish community. For example, if the river has become more quiescent, species
preferring moving water may no longer be abundant. In this case it will be important to monitor
mercury in forage fish pre- and post-development, as composite forage fish samples will represent
the mean mercury accumulation at lower trophic levels. If the original large fish baseline species is
not present post-development, other large fish species should be sampled for setting fish
consumption guidelines; and,
Downstream: Fish sampling should be conducted downstream of each proposed facility to monitor
the effects of mercury generated in the impoundment area (if any) on downstream fish. In some
cases the water retention structure(s) at each facility will be an impassable barrier to some fish
moving upstream. However, fish from the impoundment and upstream may migrate downstream
through the structures. Therefore, the mercury concentrations in fish downstream of the facility may
be measured from:
a) Fish that have migrated downstream from the impoundment into the downstream area;
b) Fish that inhabit the area where they have been collected immediately downstream of the
proposed facility and are affected by changes in water quality, detritus and food migrating
downstream from the impoundment;
c) Fish that have foraged in a different reach of the river than the facility, including adjoining
tributaries, and have accumulated mercury in these areas that is unrelated to the facility; or,
d) A combination of the above.
Site conditions must be considered when interpreting post-development fish sample results to
differentiate between the effects that the impoundment might have on downstream fish, and the
conditions of fish that have never been exposed to effects of the impoundment but have been
collected downstream of the facility.
J100036, Xeneca Power Development
Surface Water Quality and Fish Sampling Programs
Hutchinson Environmental Sciences Ltd.
R2012-07-16_J100036_Surface Water and Fish Sampling Rationale_Update to MOE 2012.docx 13
Figure 2 (following page) shows a conceptual pre- and post-development fish sampling plan.
Figure 2. Fish sample location conceptual diagrams.
J100036, Xeneca Power Development
Surface Water Quality and Fish Sampling Programs
Hutchinson Environmental Sciences Ltd.
R2012-07-16_J100036_Surface Water and Fish Sampling Rationale_Update to MOE 2012.docx 14
5.4 Fish Mercury Analysis
At each sample location, fish should be sampled for the following species of mercury, in the following
quantities:
Baseline:
Large fish: total mercury – 20 samples; methyl mercury – 5 samples;
Forage fish: total mercury and methyl mercury – 5 composite samples;
Post-development:
Large fish: total mercury – 10 samples; methyl mercury – 5 samples; and,
Forage fish: total mercury and methyl mercury – 5 composite samples.
Most mercury in fish is methyl mercury (Rodgers et al, 1982). For the purpose of setting fish consumption
guidelines and assessing the toxicity of mercury in fish, it is conservatively assumed that all mercury
measured in fish is methyl mercury. Therefore, the measured total mercury concentrations can be
considered to represent the methyl mercury concentrations and the number of methyl mercury samples
can be reduced from MOE (2012) recommendations. MOE fish consumption guidelines are currently
based on the concentration of total mercury in fish.
To confirm the assumptions that most mercury in fish is methyl mercury and to monitor methyl mercury
accumulation in the food chain, five forage fish composite samples per sampling location per sampling
event should also be analyzed for methyl mercury.
6. Closing
This guidance document has been prepared to provide the rationale for the water quality and fish tissue
mercury sampling programs for the hydroelectric generating facilities proposed for northern and
southeastern Ontario by Xeneca. The guidance presented herein is similar to the recommendations in
MOE document titled “From Class EA to Permit to Take Water: A Guide to Understanding the Ministry of
the Environment’s Technical Requirements for Waterpower” (January, 2012). Any guidance or
recommendations that differ from MOE (2012) are specific to the proposed Xeneca developments and the
conditions that exist at the developments. The recommendations herein are consistent with HESL’s
understanding of the intent of the MOE (2012) guidance.
A site-specific guidance document has been prepared describing the sampling to be conducted at each of
Xeneca’s eight proposed priority facilities. Each site-specific document contains a description of the
sampling program for the subject facility based on the conditions at that facility, the recommendations of
this document and the recommendations of MOE (2012).
Water quality and fish sampling was mostly completed in 2011 for four proposed Xeneca facilities on the
Kapuskasing River, with the exception of some minor data gap filling field work being conducted in 2012.
J100036, Xeneca Power Development
Surface Water Quality and Fish Sampling Programs
Hutchinson Environmental Sciences Ltd.
R2012-07-16_J100036_Surface Water and Fish Sampling Rationale_Update to MOE 2012.docx 15
The work on the Kapuskasing River facilities was mostly completed prior to MOE’s current guidance
document (January, 2012) and the recommendations presented herein do not apply to those facilities.
J100036, Xeneca Power Development
Surface Water Quality and Fish Sampling Programs
Hutchinson Environmental Sciences Ltd.
R2012-07-16_J100036_Surface Water and Fish Sampling Rationale_Update to MOE 2012.docx 16
7. References
Baker, R.F.; Blanchfield, P.J.; Patterson, M. J.; Flett, R. J.; Wesson, L. Evaluation of Nonlethal Methods
for the Analysis of Mercury in Fish Tissue. Transactions of the American Fisheries Society, 133: 568-576.
2004.
Bodaly, We A., R. E. Hecky, and W. J. P. Fudge. 1984. Increases in fish mercury levels in lakes flooded
by the Churchill River diversion, northern Manitoba. Canadian Journal of Fisheries and Aquatic Sciences.
41: 682-691.
Hall BD, St. Louis VL, Rolfhus KR, Bodaly RA, Beaty KG, Paterson M. 2005. The impact of reservoir
creation on the biogeochemical cycling of methyl and total mercury in boreal upland forests. Ecosystems
2005;8(3):248 – 66.
Hecky RE, Ramsey DJ, Bodaly RA, Strange NE. 1991. Increased methylmercury contamination in fish in
newly formed freshwater reservoirs. In: Suzuki T, Imura N, Clarkson TW, editors. Advances in mercury
toxicology. New York: Plenum Press, 33-52.
Jackson, T. A. 1988. The mercury problem in recently formed reservoirs of northern Manitoba (Canada):
effects of impoundment and other factors on the production of methyl mercury by microorganisms in
sediments. Canadian Journal of Fisheries and Aquatic Sciences 45: 97-121.
Kelly, C.A., J.W.M. Rudd, R.A. Bodaly, N.P. Roulet, V.L. St. Louis, A. Heyes, T.R . Moore, S. Schiff, R.
Aravena, K.J. Scott, B. Dyck, R. Harris, B. Warner, G. Edwards 1997. Increases in fluxes of greenhouse
gases and methyl mercury following flooding of an experimental reservoir. Environmental Science and
Technology 31: 1334-1344.
Montgomery, S., M. Lucotte, I. Rheault 2000. Temporal and spatial influences of flooding on dissolved
mercury in boreal reservoirs. The Science of the Total Environment. 260: 147-157.
Ontario Ministry of the Environment. 2010. Guidance for Conducting Baseline and Post Development
Monitoring of Water Quality and Fish Tissue for Proposed Waterpower Projects. Draft Document,
November 2010.
Rodgers, D. W., and S. U. Qadri. 1982. Growth and mercury accumulation in yearling yellow perch, Perca
flavescens, in the Ottawa River, Ontario. Environmental Biology of Fishes 7:377-383.
J1 0 0 0 3 6 , X e n e ca P o w e r D e ve l o p m e n t I n c .
Wabageshik Rapids, Surface Water Quality and Fish Sampling Guidance
Hutchinson Environmental Sciences Ltd.
R2012-07-18_J100036_Wabageshik_Rapids_Water_Quality_and_Fish_Tissue_Sampling.docx B1
Appendix B
Spring, 2012 Water Quality Results
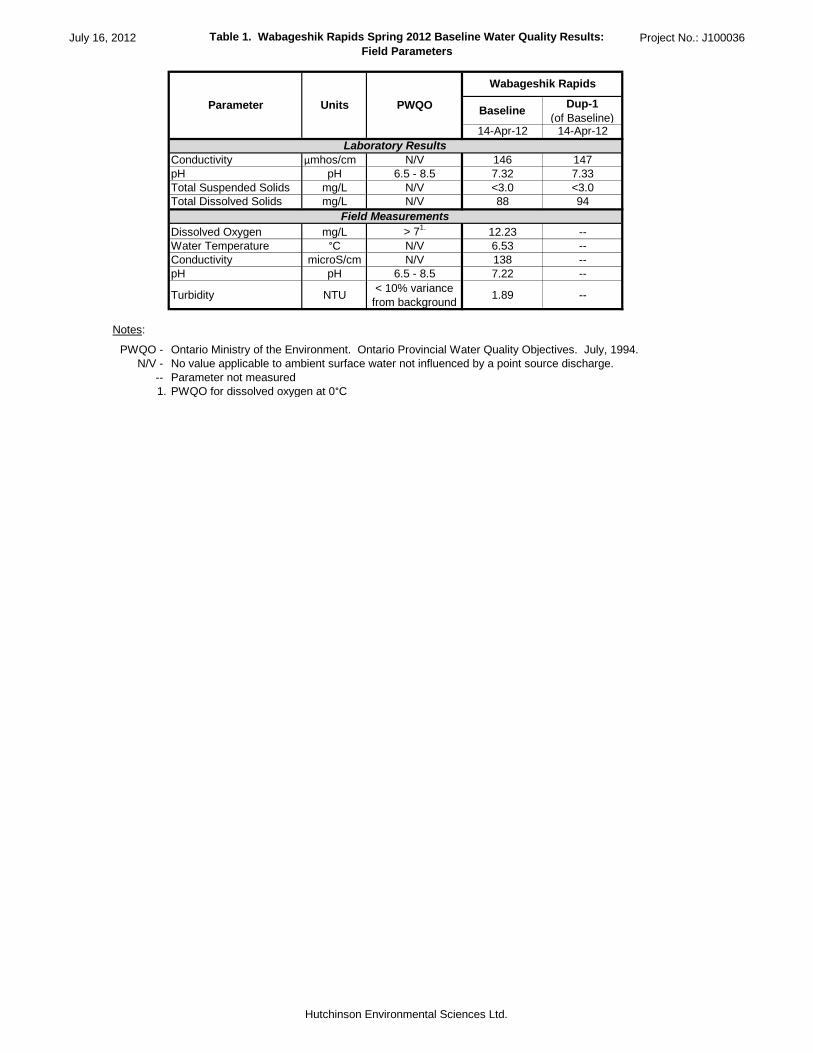
July 16, 2012 Table 1. Wabageshik Rapids Spring 2012 Baseline Water Quality Results:
Field Parameters
Project No.: J100036
BaselineDup-1
(of Baseline)14-Apr-12 14-Apr-12
Conductivity µmhos/cm N/V 146 147
pH pH 6.5 - 8.5 7.32 7.33
Total Suspended Solids mg/L N/V <3.0 <3.0
Total Dissolved Solids mg/L N/V 88 94
Dissolved Oxygen mg/L > 71.
12.23 --
Water Temperature °C N/V 6.53 --
Conductivity microS/cm N/V 138 --
pH pH 6.5 - 8.5 7.22 --
Turbidity NTU< 10% variance
from background1.89 --
Notes:
PWQO - Ontario Ministry of the Environment. Ontario Provincial Water Quality Objectives. July, 1994.
N/V - No value applicable to ambient surface water not influenced by a point source discharge.
-- Parameter not measured
1. PWQO for dissolved oxygen at 0°C
Field Measurements
Parameter Units PWQO
Wabageshik Rapids
Laboratory Results
Hutchinson Environmental Sciences Ltd.
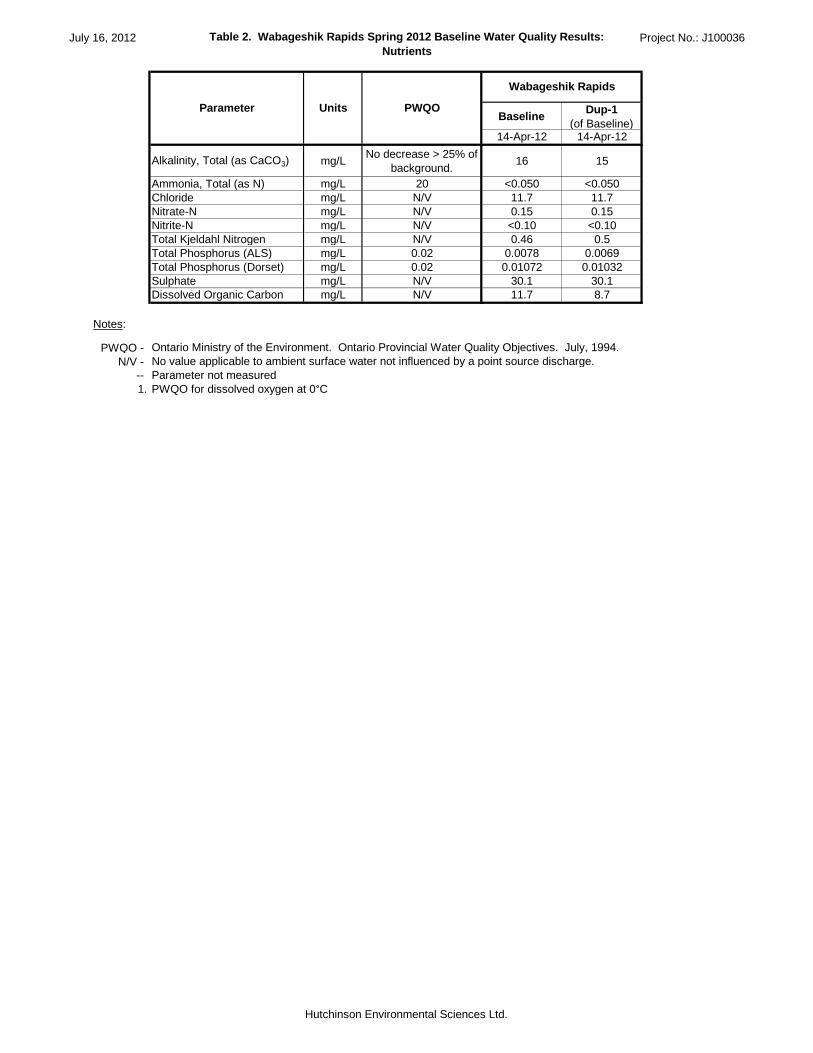
July 16, 2012 Table 2. Wabageshik Rapids Spring 2012 Baseline Water Quality Results:
Nutrients
Project No.: J100036
BaselineDup-1
(of Baseline)14-Apr-12 14-Apr-12
Alkalinity, Total (as CaCO3) mg/LNo decrease > 25% of
background.16 15
Ammonia, Total (as N) mg/L 20 <0.050 <0.050
Chloride mg/L N/V 11.7 11.7
Nitrate-N mg/L N/V 0.15 0.15
Nitrite-N mg/L N/V <0.10 <0.10
Total Kjeldahl Nitrogen mg/L N/V 0.46 0.5
Total Phosphorus (ALS) mg/L 0.02 0.0078 0.0069
Total Phosphorus (Dorset) mg/L 0.02 0.01072 0.01032
Sulphate mg/L N/V 30.1 30.1
Dissolved Organic Carbon mg/L N/V 11.7 8.7
Notes:
PWQO -
N/V - No value applicable to ambient surface water not influenced by a point source discharge.
-- Parameter not measured
1. PWQO for dissolved oxygen at 0°C
Parameter Units PWQO
Wabageshik Rapids
Ontario Ministry of the Environment. Ontario Provincial Water Quality Objectives. July, 1994.
Hutchinson Environmental Sciences Ltd.

July 16, 2012 Table 3. Wabageshik Rapids Spring 2012 Water Quality Results:
Metals
Project No.: J100036
BaselineDup-1
(of Baseline)
14-Apr-12 14-Apr-12
Aluminum (Al) µg/L 751.
108 100
Antimony (Sb) µg/L 20 <5.0 <5.0
Arsenic (As) µg/L 100 <1.0 <1.0
Barium (Ba) µg/L N/V 11 10
Beryllium (Be) µg/L 112.
<1.0 <1.0
Bismuth (Bi) µg/L N/V <1.0 <1.0
Boron (B) µg/L 200 <50 <50
Cadmium (Cd)-Total µg/L 0.2 <0.090 <0.090
Calcium (Ca) µg/L N/V 1,370 1,250
Chromium (Cr) µg/L 8.93.
<0.50 <0.50
Cobalt (Co) µg/L 0.9 0.79 0.76
Copper (Cu) µg/L 5 6.7 6.5
Iron (Fe) µg/L 300 232 215
Lead (Pb) µg/L 54.
<1.0 <1.0
Magnesium (Mg) µg/L N/V 2380 2290
Manganese (Mn) µg/L N/V 38.8 37.1
Mercury (Hg) µg/L 0.2 0.00003 0.00003
Methyl Mercury [(CH3Hg)+] µg/L N/V 0.00003 0.00003
Molybdenum (Mo) µg/L 40 <1.0 <1.0
Nickel (Ni) µg/L 25 35.6 34.9
Potassium (K) µg/L N/V 1100 1100
Selenium (Se)-Total µg/L 100 0.73 0.71
Silicon (Si) µg/L N/V 2,600 2,500
Silver (Ag) µg/L 0.1 <0.10 <0.10
Strontium (Sr) µg/L N/V 33.4 32.4
Thallium (Tl) µg/L 0.3 <0.30 <0.30
Tin (Sn) µg/L N/V <1.0 <1.0
Titanium (Ti) µg/L N/V 3.1 2.6
Tungsten (W ) µg/L 30 <10 <10
Uranium (U) µg/L 5 <5.0 <5.0
Vanadium (V) µg/L 6 <1.0 <1.0
Zinc (Zn) µg/L 30 10.1 4.3
Zirconium (Zr) µg/L 4 <4.0 <4.0
Notes:
PWQO -
N/V -
1. Interim PWQO for pH >6.5
2. Interim PWQO for hardness as CaCO3 <75 mg/L.
3. PWQO for trivalent chromium.
4. PWQO for alkalinity as CaCO3 < 20 mg/L.
Ontario Ministry of the Environment. Ontario Provincial Water Quality Objectives. July, 1994.
No value applicable to ambient surface water not influenced by a point source discharge.
Parameter Units PWQO
Wabageshik Rapids
Hutchinson Environmental Sciences Ltd.
[This report shall not be reproduced except in full without the written authority of the Laboratory.]
19-APR-12
Lab Work Order #: L1136530
Date Received:HUTCHINSON ENVIRONMENTAL SCIENCES LTD
3-1 Taylor Rd.Bracebridge ON P1L 1S6
ATTN: David Leeder FINAL 25-APR-12 14:02 (MT)Report Date:
Version:
Certificate of Analysis
ALS CANADA LTD Part of the ALS Group A Campbell Brothers Limited Company
____________________________________________
Lindsay D. ZuikerAccount Manager
ADDRESS: 60 Northland Road, Unit 1, Waterloo, ON N2V 2B8 Canada | Phone: +1 519 886 6910 | Fax: +1 519 886 9047
Client Phone: 705-645-0021
120022Job Reference: NOT SUBMITTEDProject P.O. #:
C of C Numbers: Legal Site Desc:
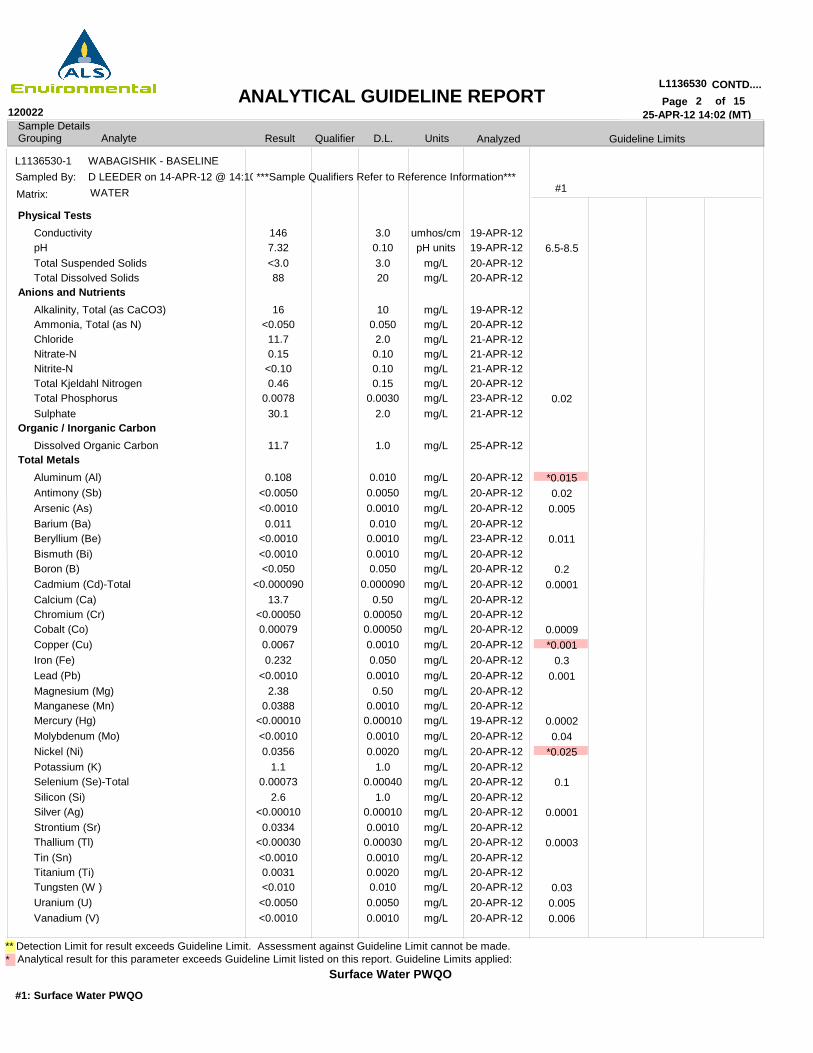
Result
25-APR-12 14:02 (MT)Sample DetailsGrouping Analyte D.L. UnitsQualifier Analyzed
Surface Water PWQO
L1136530 CONTD....2Page of
120022ANALYTICAL GUIDELINE REPORT
Analytical result for this parameter exceeds Guideline Limit listed on this report. Guideline Limits applied:
Guideline Limits
#1: Surface Water PWQO
* ** Detection Limit for result exceeds Guideline Limit. Assessment against Guideline Limit cannot be made.
15
L1136530-1 WABAGISHIK - BASELINED LEEDER on 14-APR-12 @ 14:10Sampled By:WATERMatrix:
***Sample Qualifiers Refer to Reference Information***#1
Physical Tests
Anions and Nutrients
Organic / Inorganic Carbon
Total Metals
ConductivitypHTotal Suspended SolidsTotal Dissolved Solids
Alkalinity, Total (as CaCO3)Ammonia, Total (as N)ChlorideNitrate-NNitrite-NTotal Kjeldahl NitrogenTotal PhosphorusSulphate
Dissolved Organic Carbon
Aluminum (Al)Antimony (Sb)Arsenic (As)Barium (Ba)Beryllium (Be)Bismuth (Bi)Boron (B)Cadmium (Cd)-TotalCalcium (Ca)Chromium (Cr)Cobalt (Co)Copper (Cu)Iron (Fe)Lead (Pb)Magnesium (Mg)Manganese (Mn)Mercury (Hg)Molybdenum (Mo)Nickel (Ni)Potassium (K)Selenium (Se)-TotalSilicon (Si)Silver (Ag)Strontium (Sr)Thallium (Tl)Tin (Sn)Titanium (Ti)Tungsten (W )Uranium (U)Vanadium (V)
1467.32<3.088
16<0.05011.70.15
<0.100.46
0.007830.1
11.7
0.108<0.0050<0.00100.011
<0.0010<0.0010<0.050
<0.00009013.7
<0.000500.000790.00670.232
<0.00102.38
0.0388<0.00010<0.00100.0356
1.10.00073
2.6<0.000100.0334
<0.00030<0.00100.0031<0.010<0.0050<0.0010
3.00.103.020
100.0502.00.100.100.15
0.00302.0
1.0
0.0100.00500.00100.0100.00100.00100.050
0.0000900.50
0.000500.000500.00100.0500.00100.50
0.00100.000100.00100.0020
1.00.00040
1.00.000100.00100.000300.00100.00200.0100.00500.0010
umhos/cmpH units
mg/Lmg/L
mg/Lmg/Lmg/Lmg/Lmg/Lmg/Lmg/Lmg/L
mg/L
mg/Lmg/Lmg/Lmg/Lmg/Lmg/Lmg/Lmg/Lmg/Lmg/Lmg/Lmg/Lmg/Lmg/Lmg/Lmg/Lmg/Lmg/Lmg/Lmg/Lmg/Lmg/Lmg/Lmg/Lmg/Lmg/Lmg/Lmg/Lmg/Lmg/L
19-APR-1219-APR-1220-APR-1220-APR-12
19-APR-1220-APR-1221-APR-1221-APR-1221-APR-1220-APR-1223-APR-1221-APR-12
25-APR-12
20-APR-1220-APR-1220-APR-1220-APR-1223-APR-1220-APR-1220-APR-1220-APR-1220-APR-1220-APR-1220-APR-1220-APR-1220-APR-1220-APR-1220-APR-1220-APR-1219-APR-1220-APR-1220-APR-1220-APR-1220-APR-1220-APR-1220-APR-1220-APR-1220-APR-1220-APR-1220-APR-1220-APR-1220-APR-1220-APR-12
6.5-8.5
0.02
*0.0150.020.005
0.011
0.20.0001
0.0009*0.001
0.30.001
0.00020.04
*0.025
0.1
0.0001
0.0003
0.030.0050.006
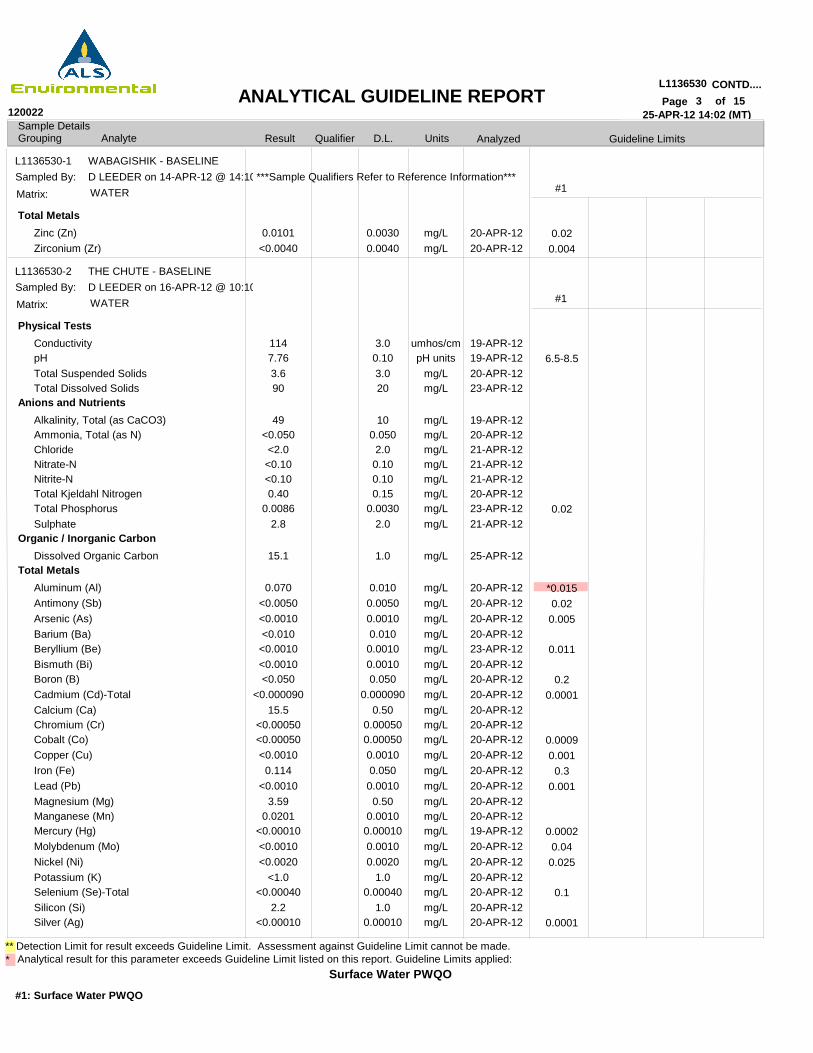
Result
25-APR-12 14:02 (MT)Sample DetailsGrouping Analyte D.L. UnitsQualifier Analyzed
Surface Water PWQO
L1136530 CONTD....3Page of
120022ANALYTICAL GUIDELINE REPORT
Analytical result for this parameter exceeds Guideline Limit listed on this report. Guideline Limits applied:
Guideline Limits
#1: Surface Water PWQO
* ** Detection Limit for result exceeds Guideline Limit. Assessment against Guideline Limit cannot be made.
15
L1136530-1
L1136530-2
WABAGISHIK - BASELINE
THE CHUTE - BASELINE
D LEEDER on 14-APR-12 @ 14:10
D LEEDER on 16-APR-12 @ 10:10
Sampled By:
Sampled By:
WATER
WATER
Matrix:
Matrix:
***Sample Qualifiers Refer to Reference Information***#1
#1
Total Metals
Physical Tests
Anions and Nutrients
Organic / Inorganic Carbon
Total Metals
Zinc (Zn)Zirconium (Zr)
ConductivitypHTotal Suspended SolidsTotal Dissolved Solids
Alkalinity, Total (as CaCO3)Ammonia, Total (as N)ChlorideNitrate-NNitrite-NTotal Kjeldahl NitrogenTotal PhosphorusSulphate
Dissolved Organic Carbon
Aluminum (Al)Antimony (Sb)Arsenic (As)Barium (Ba)Beryllium (Be)Bismuth (Bi)Boron (B)Cadmium (Cd)-TotalCalcium (Ca)Chromium (Cr)Cobalt (Co)Copper (Cu)Iron (Fe)Lead (Pb)Magnesium (Mg)Manganese (Mn)Mercury (Hg)Molybdenum (Mo)Nickel (Ni)Potassium (K)Selenium (Se)-TotalSilicon (Si)Silver (Ag)
0.0101<0.0040
1147.763.690
49<0.050<2.0<0.10<0.100.40
0.00862.8
15.1
0.070<0.0050<0.0010<0.010<0.0010<0.0010<0.050
<0.00009015.5
<0.00050<0.00050<0.00100.114
<0.00103.59
0.0201<0.00010<0.0010<0.0020
<1.0<0.00040
2.2<0.00010
0.00300.0040
3.00.103.020
100.0502.00.100.100.15
0.00302.0
1.0
0.0100.00500.00100.0100.00100.00100.050
0.0000900.50
0.000500.000500.00100.0500.00100.50
0.00100.000100.00100.0020
1.00.00040
1.00.00010
mg/Lmg/L
umhos/cmpH units
mg/Lmg/L
mg/Lmg/Lmg/Lmg/Lmg/Lmg/Lmg/Lmg/L
mg/L
mg/Lmg/Lmg/Lmg/Lmg/Lmg/Lmg/Lmg/Lmg/Lmg/Lmg/Lmg/Lmg/Lmg/Lmg/Lmg/Lmg/Lmg/Lmg/Lmg/Lmg/Lmg/Lmg/L
20-APR-1220-APR-12
19-APR-1219-APR-1220-APR-1223-APR-12
19-APR-1220-APR-1221-APR-1221-APR-1221-APR-1220-APR-1223-APR-1221-APR-12
25-APR-12
20-APR-1220-APR-1220-APR-1220-APR-1223-APR-1220-APR-1220-APR-1220-APR-1220-APR-1220-APR-1220-APR-1220-APR-1220-APR-1220-APR-1220-APR-1220-APR-1219-APR-1220-APR-1220-APR-1220-APR-1220-APR-1220-APR-1220-APR-12
0.020.004
6.5-8.5
0.02
*0.0150.020.005
0.011
0.20.0001
0.00090.0010.3
0.001
0.00020.040.025
0.1
0.0001
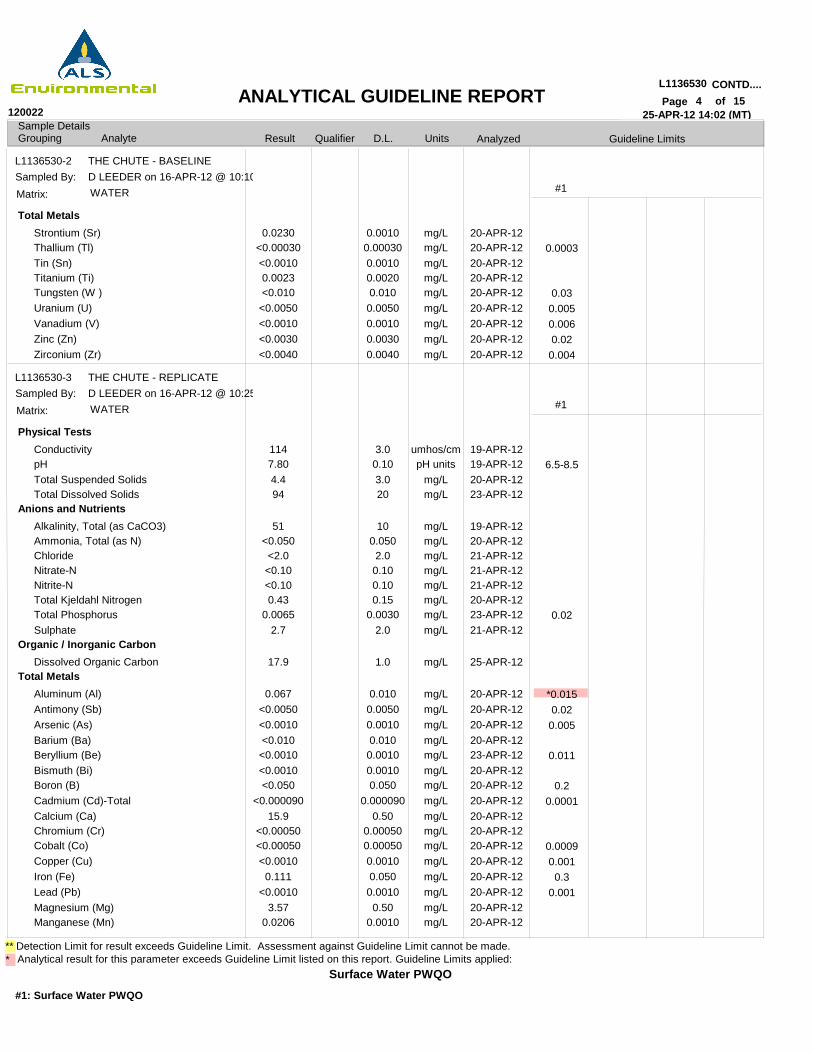
Result
25-APR-12 14:02 (MT)Sample DetailsGrouping Analyte D.L. UnitsQualifier Analyzed
Surface Water PWQO
L1136530 CONTD....4Page of
120022ANALYTICAL GUIDELINE REPORT
Analytical result for this parameter exceeds Guideline Limit listed on this report. Guideline Limits applied:
Guideline Limits
#1: Surface Water PWQO
* ** Detection Limit for result exceeds Guideline Limit. Assessment against Guideline Limit cannot be made.
15
L1136530-2
L1136530-3
THE CHUTE - BASELINE
THE CHUTE - REPLICATE
D LEEDER on 16-APR-12 @ 10:10
D LEEDER on 16-APR-12 @ 10:25
Sampled By:
Sampled By:
WATER
WATER
Matrix:
Matrix:
#1
#1
Total Metals
Physical Tests
Anions and Nutrients
Organic / Inorganic Carbon
Total Metals
Strontium (Sr)Thallium (Tl)Tin (Sn)Titanium (Ti)Tungsten (W )Uranium (U)Vanadium (V)Zinc (Zn)Zirconium (Zr)
ConductivitypHTotal Suspended SolidsTotal Dissolved Solids
Alkalinity, Total (as CaCO3)Ammonia, Total (as N)ChlorideNitrate-NNitrite-NTotal Kjeldahl NitrogenTotal PhosphorusSulphate
Dissolved Organic Carbon
Aluminum (Al)Antimony (Sb)Arsenic (As)Barium (Ba)Beryllium (Be)Bismuth (Bi)Boron (B)Cadmium (Cd)-TotalCalcium (Ca)Chromium (Cr)Cobalt (Co)Copper (Cu)Iron (Fe)Lead (Pb)Magnesium (Mg)Manganese (Mn)
0.0230<0.00030<0.00100.0023<0.010<0.0050<0.0010<0.0030<0.0040
1147.804.494
51<0.050<2.0<0.10<0.100.43
0.00652.7
17.9
0.067<0.0050<0.0010<0.010<0.0010<0.0010<0.050
<0.00009015.9
<0.00050<0.00050<0.00100.111
<0.00103.57
0.0206
0.00100.000300.00100.00200.0100.00500.00100.00300.0040
3.00.103.020
100.0502.00.100.100.15
0.00302.0
1.0
0.0100.00500.00100.0100.00100.00100.050
0.0000900.50
0.000500.000500.00100.0500.00100.50
0.0010
mg/Lmg/Lmg/Lmg/Lmg/Lmg/Lmg/Lmg/Lmg/L
umhos/cmpH units
mg/Lmg/L
mg/Lmg/Lmg/Lmg/Lmg/Lmg/Lmg/Lmg/L
mg/L
mg/Lmg/Lmg/Lmg/Lmg/Lmg/Lmg/Lmg/Lmg/Lmg/Lmg/Lmg/Lmg/Lmg/Lmg/Lmg/L
20-APR-1220-APR-1220-APR-1220-APR-1220-APR-1220-APR-1220-APR-1220-APR-1220-APR-12
19-APR-1219-APR-1220-APR-1223-APR-12
19-APR-1220-APR-1221-APR-1221-APR-1221-APR-1220-APR-1223-APR-1221-APR-12
25-APR-12
20-APR-1220-APR-1220-APR-1220-APR-1223-APR-1220-APR-1220-APR-1220-APR-1220-APR-1220-APR-1220-APR-1220-APR-1220-APR-1220-APR-1220-APR-1220-APR-12
0.0003
0.030.0050.0060.020.004
6.5-8.5
0.02
*0.0150.020.005
0.011
0.20.0001
0.00090.0010.3
0.001
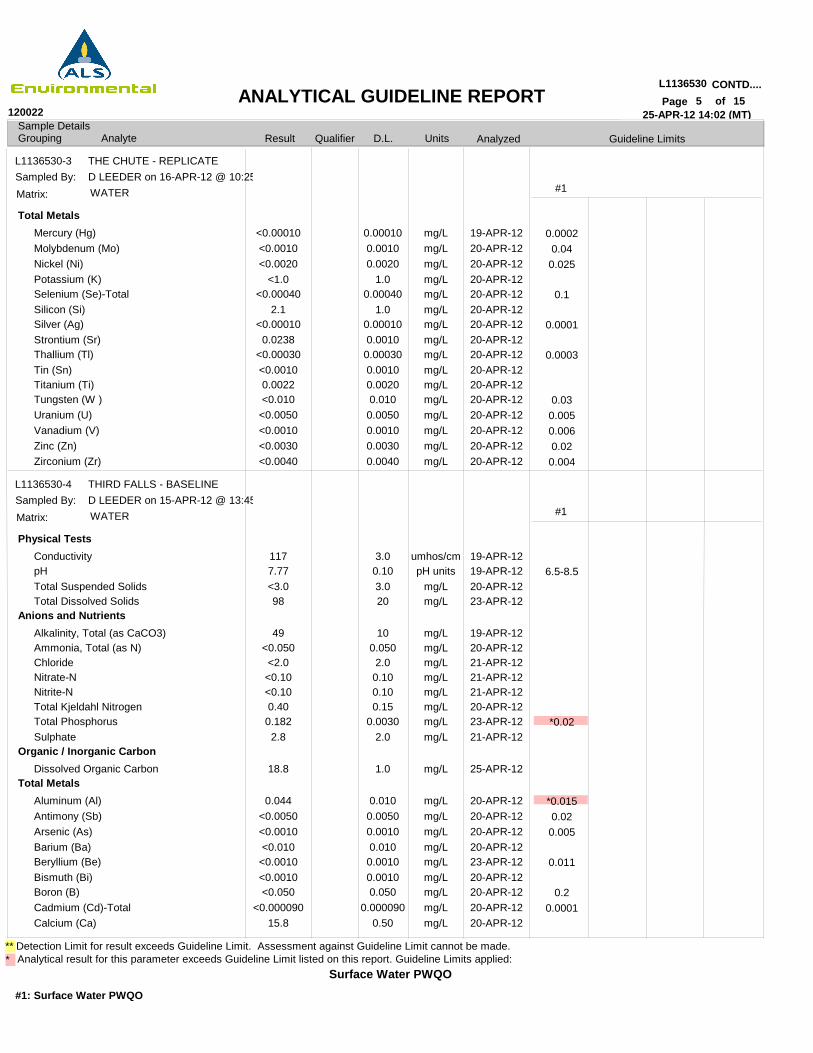
Result
25-APR-12 14:02 (MT)Sample DetailsGrouping Analyte D.L. UnitsQualifier Analyzed
Surface Water PWQO
L1136530 CONTD....5Page of
120022ANALYTICAL GUIDELINE REPORT
Analytical result for this parameter exceeds Guideline Limit listed on this report. Guideline Limits applied:
Guideline Limits
#1: Surface Water PWQO
* ** Detection Limit for result exceeds Guideline Limit. Assessment against Guideline Limit cannot be made.
15
L1136530-3
L1136530-4
THE CHUTE - REPLICATE
THIRD FALLS - BASELINE
D LEEDER on 16-APR-12 @ 10:25
D LEEDER on 15-APR-12 @ 13:45
Sampled By:
Sampled By:
WATER
WATER
Matrix:
Matrix:
#1
#1
Total Metals
Physical Tests
Anions and Nutrients
Organic / Inorganic Carbon
Total Metals
Mercury (Hg)Molybdenum (Mo)Nickel (Ni)Potassium (K)Selenium (Se)-TotalSilicon (Si)Silver (Ag)Strontium (Sr)Thallium (Tl)Tin (Sn)Titanium (Ti)Tungsten (W )Uranium (U)Vanadium (V)Zinc (Zn)Zirconium (Zr)
ConductivitypHTotal Suspended SolidsTotal Dissolved Solids
Alkalinity, Total (as CaCO3)Ammonia, Total (as N)ChlorideNitrate-NNitrite-NTotal Kjeldahl NitrogenTotal PhosphorusSulphate
Dissolved Organic Carbon
Aluminum (Al)Antimony (Sb)Arsenic (As)Barium (Ba)Beryllium (Be)Bismuth (Bi)Boron (B)Cadmium (Cd)-TotalCalcium (Ca)
<0.00010<0.0010<0.0020
<1.0<0.00040
2.1<0.000100.0238
<0.00030<0.00100.0022<0.010<0.0050<0.0010<0.0030<0.0040
1177.77<3.098
49<0.050<2.0<0.10<0.100.400.1822.8
18.8
0.044<0.0050<0.0010<0.010<0.0010<0.0010<0.050
<0.00009015.8
0.000100.00100.0020
1.00.00040
1.00.000100.00100.000300.00100.00200.0100.00500.00100.00300.0040
3.00.103.020
100.0502.00.100.100.15
0.00302.0
1.0
0.0100.00500.00100.0100.00100.00100.050
0.0000900.50
mg/Lmg/Lmg/Lmg/Lmg/Lmg/Lmg/Lmg/Lmg/Lmg/Lmg/Lmg/Lmg/Lmg/Lmg/Lmg/L
umhos/cmpH units
mg/Lmg/L
mg/Lmg/Lmg/Lmg/Lmg/Lmg/Lmg/Lmg/L
mg/L
mg/Lmg/Lmg/Lmg/Lmg/Lmg/Lmg/Lmg/Lmg/L
19-APR-1220-APR-1220-APR-1220-APR-1220-APR-1220-APR-1220-APR-1220-APR-1220-APR-1220-APR-1220-APR-1220-APR-1220-APR-1220-APR-1220-APR-1220-APR-12
19-APR-1219-APR-1220-APR-1223-APR-12
19-APR-1220-APR-1221-APR-1221-APR-1221-APR-1220-APR-1223-APR-1221-APR-12
25-APR-12
20-APR-1220-APR-1220-APR-1220-APR-1223-APR-1220-APR-1220-APR-1220-APR-1220-APR-12
0.00020.040.025
0.1
0.0001
0.0003
0.030.0050.0060.020.004
6.5-8.5
*0.02
*0.0150.020.005
0.011
0.20.0001
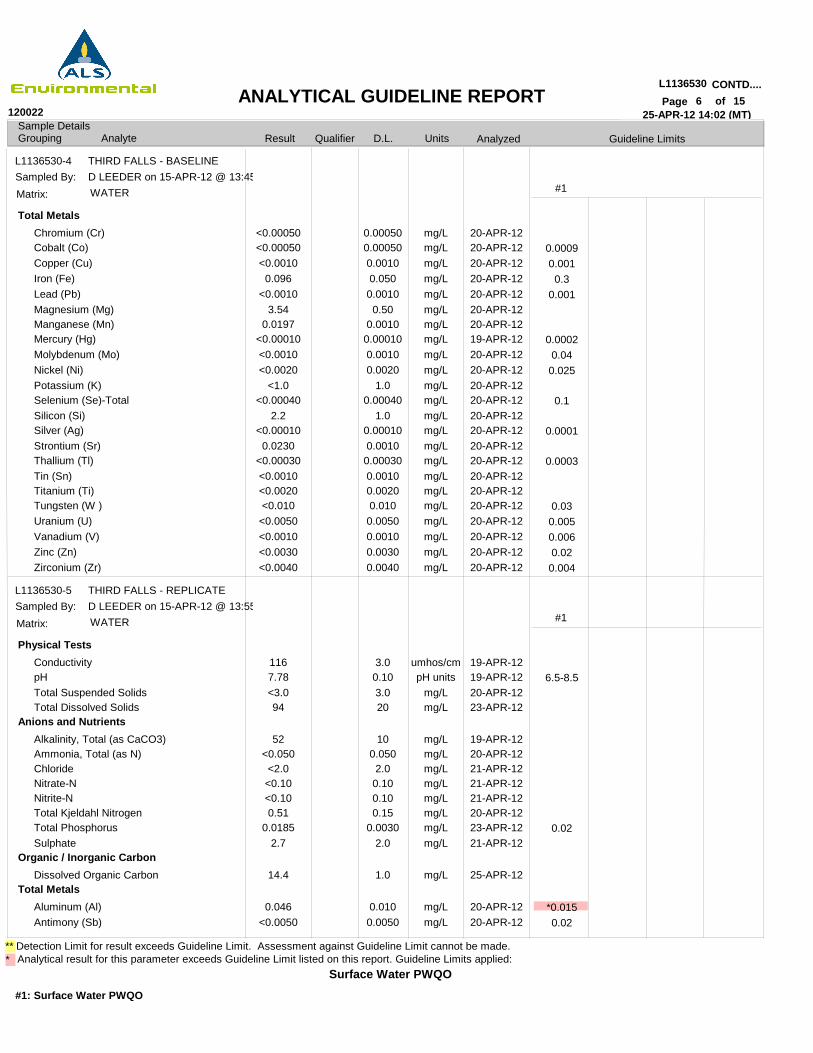
Result
25-APR-12 14:02 (MT)Sample DetailsGrouping Analyte D.L. UnitsQualifier Analyzed
Surface Water PWQO
L1136530 CONTD....6Page of
120022ANALYTICAL GUIDELINE REPORT
Analytical result for this parameter exceeds Guideline Limit listed on this report. Guideline Limits applied:
Guideline Limits
#1: Surface Water PWQO
* ** Detection Limit for result exceeds Guideline Limit. Assessment against Guideline Limit cannot be made.
15
L1136530-4
L1136530-5
THIRD FALLS - BASELINE
THIRD FALLS - REPLICATE
D LEEDER on 15-APR-12 @ 13:45
D LEEDER on 15-APR-12 @ 13:55
Sampled By:
Sampled By:
WATER
WATER
Matrix:
Matrix:
#1
#1
Total Metals
Physical Tests
Anions and Nutrients
Organic / Inorganic Carbon
Total Metals
Chromium (Cr)Cobalt (Co)Copper (Cu)Iron (Fe)Lead (Pb)Magnesium (Mg)Manganese (Mn)Mercury (Hg)Molybdenum (Mo)Nickel (Ni)Potassium (K)Selenium (Se)-TotalSilicon (Si)Silver (Ag)Strontium (Sr)Thallium (Tl)Tin (Sn)Titanium (Ti)Tungsten (W )Uranium (U)Vanadium (V)Zinc (Zn)Zirconium (Zr)
ConductivitypHTotal Suspended SolidsTotal Dissolved Solids
Alkalinity, Total (as CaCO3)Ammonia, Total (as N)ChlorideNitrate-NNitrite-NTotal Kjeldahl NitrogenTotal PhosphorusSulphate
Dissolved Organic Carbon
Aluminum (Al)Antimony (Sb)
<0.00050<0.00050<0.00100.096
<0.00103.54
0.0197<0.00010<0.0010<0.0020
<1.0<0.00040
2.2<0.000100.0230
<0.00030<0.0010<0.0020<0.010<0.0050<0.0010<0.0030<0.0040
1167.78<3.094
52<0.050<2.0<0.10<0.100.51
0.01852.7
14.4
0.046<0.0050
0.000500.000500.00100.0500.00100.50
0.00100.000100.00100.0020
1.00.00040
1.00.000100.00100.000300.00100.00200.0100.00500.00100.00300.0040
3.00.103.020
100.0502.00.100.100.15
0.00302.0
1.0
0.0100.0050
mg/Lmg/Lmg/Lmg/Lmg/Lmg/Lmg/Lmg/Lmg/Lmg/Lmg/Lmg/Lmg/Lmg/Lmg/Lmg/Lmg/Lmg/Lmg/Lmg/Lmg/Lmg/Lmg/L
umhos/cmpH units
mg/Lmg/L
mg/Lmg/Lmg/Lmg/Lmg/Lmg/Lmg/Lmg/L
mg/L
mg/Lmg/L
20-APR-1220-APR-1220-APR-1220-APR-1220-APR-1220-APR-1220-APR-1219-APR-1220-APR-1220-APR-1220-APR-1220-APR-1220-APR-1220-APR-1220-APR-1220-APR-1220-APR-1220-APR-1220-APR-1220-APR-1220-APR-1220-APR-1220-APR-12
19-APR-1219-APR-1220-APR-1223-APR-12
19-APR-1220-APR-1221-APR-1221-APR-1221-APR-1220-APR-1223-APR-1221-APR-12
25-APR-12
20-APR-1220-APR-12
0.00090.0010.3
0.001
0.00020.040.025
0.1
0.0001
0.0003
0.030.0050.0060.020.004
6.5-8.5
0.02
*0.0150.02
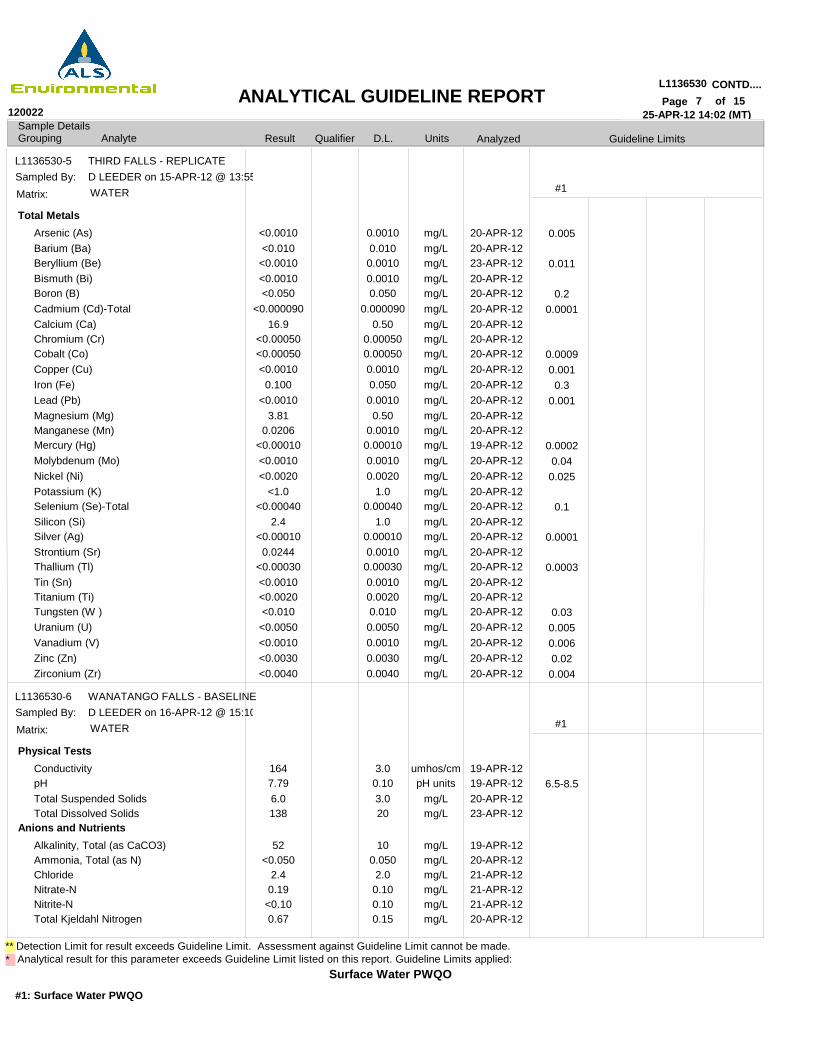
Result
25-APR-12 14:02 (MT)Sample DetailsGrouping Analyte D.L. UnitsQualifier Analyzed
Surface Water PWQO
L1136530 CONTD....7Page of
120022ANALYTICAL GUIDELINE REPORT
Analytical result for this parameter exceeds Guideline Limit listed on this report. Guideline Limits applied:
Guideline Limits
#1: Surface Water PWQO
* ** Detection Limit for result exceeds Guideline Limit. Assessment against Guideline Limit cannot be made.
15
L1136530-5
L1136530-6
THIRD FALLS - REPLICATE
WANATANGO FALLS - BASELINE
D LEEDER on 15-APR-12 @ 13:55
D LEEDER on 16-APR-12 @ 15:10
Sampled By:
Sampled By:
WATER
WATER
Matrix:
Matrix:
#1
#1
Total Metals
Physical Tests
Anions and Nutrients
Arsenic (As)Barium (Ba)Beryllium (Be)Bismuth (Bi)Boron (B)Cadmium (Cd)-TotalCalcium (Ca)Chromium (Cr)Cobalt (Co)Copper (Cu)Iron (Fe)Lead (Pb)Magnesium (Mg)Manganese (Mn)Mercury (Hg)Molybdenum (Mo)Nickel (Ni)Potassium (K)Selenium (Se)-TotalSilicon (Si)Silver (Ag)Strontium (Sr)Thallium (Tl)Tin (Sn)Titanium (Ti)Tungsten (W )Uranium (U)Vanadium (V)Zinc (Zn)Zirconium (Zr)
ConductivitypHTotal Suspended SolidsTotal Dissolved Solids
Alkalinity, Total (as CaCO3)Ammonia, Total (as N)ChlorideNitrate-NNitrite-NTotal Kjeldahl Nitrogen
<0.0010<0.010<0.0010<0.0010<0.050
<0.00009016.9
<0.00050<0.00050<0.00100.100
<0.00103.81
0.0206<0.00010<0.0010<0.0020
<1.0<0.00040
2.4<0.000100.0244
<0.00030<0.0010<0.0020<0.010<0.0050<0.0010<0.0030<0.0040
1647.796.0138
52<0.050
2.40.19
<0.100.67
0.00100.0100.00100.00100.050
0.0000900.50
0.000500.000500.00100.0500.00100.50
0.00100.000100.00100.0020
1.00.00040
1.00.000100.00100.000300.00100.00200.0100.00500.00100.00300.0040
3.00.103.020
100.0502.00.100.100.15
mg/Lmg/Lmg/Lmg/Lmg/Lmg/Lmg/Lmg/Lmg/Lmg/Lmg/Lmg/Lmg/Lmg/Lmg/Lmg/Lmg/Lmg/Lmg/Lmg/Lmg/Lmg/Lmg/Lmg/Lmg/Lmg/Lmg/Lmg/Lmg/Lmg/L
umhos/cmpH units
mg/Lmg/L
mg/Lmg/Lmg/Lmg/Lmg/Lmg/L
20-APR-1220-APR-1223-APR-1220-APR-1220-APR-1220-APR-1220-APR-1220-APR-1220-APR-1220-APR-1220-APR-1220-APR-1220-APR-1220-APR-1219-APR-1220-APR-1220-APR-1220-APR-1220-APR-1220-APR-1220-APR-1220-APR-1220-APR-1220-APR-1220-APR-1220-APR-1220-APR-1220-APR-1220-APR-1220-APR-12
19-APR-1219-APR-1220-APR-1223-APR-12
19-APR-1220-APR-1221-APR-1221-APR-1221-APR-1220-APR-12
0.005
0.011
0.20.0001
0.00090.0010.3
0.001
0.00020.040.025
0.1
0.0001
0.0003
0.030.0050.0060.020.004
6.5-8.5
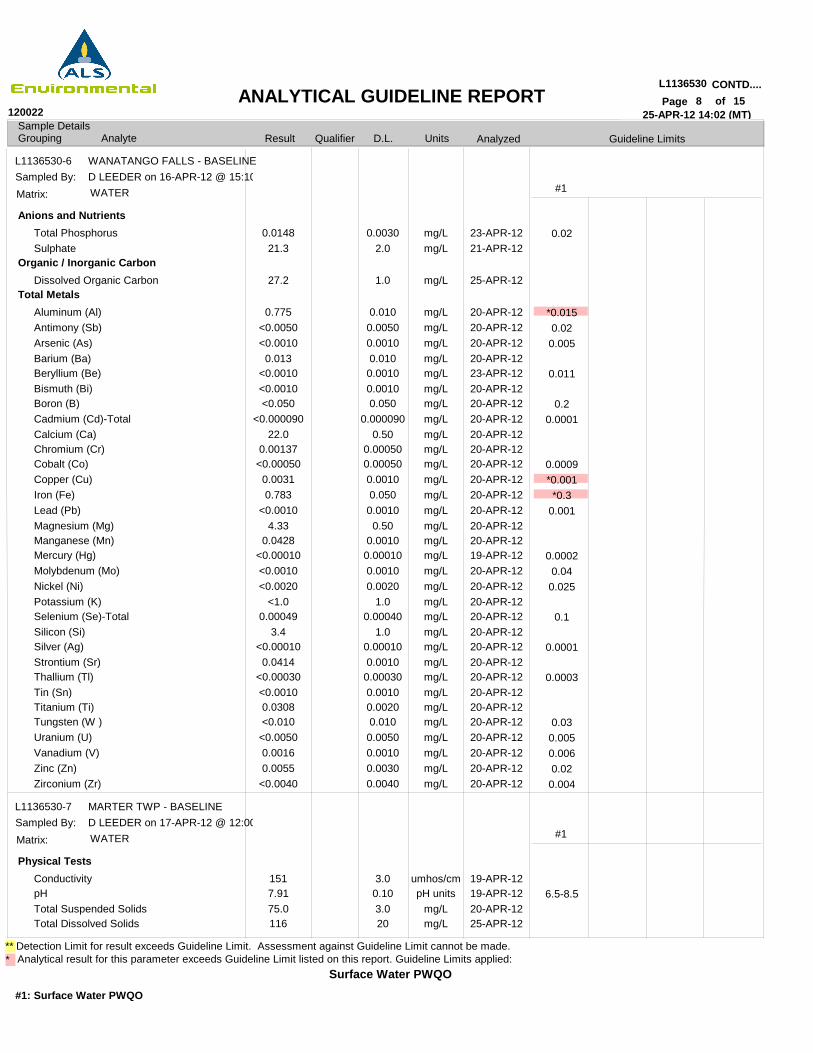
Result
25-APR-12 14:02 (MT)Sample DetailsGrouping Analyte D.L. UnitsQualifier Analyzed
Surface Water PWQO
L1136530 CONTD....8Page of
120022ANALYTICAL GUIDELINE REPORT
Analytical result for this parameter exceeds Guideline Limit listed on this report. Guideline Limits applied:
Guideline Limits
#1: Surface Water PWQO
* ** Detection Limit for result exceeds Guideline Limit. Assessment against Guideline Limit cannot be made.
15
L1136530-6
L1136530-7
WANATANGO FALLS - BASELINE
MARTER TWP - BASELINE
D LEEDER on 16-APR-12 @ 15:10
D LEEDER on 17-APR-12 @ 12:00
Sampled By:
Sampled By:
WATER
WATER
Matrix:
Matrix:
#1
#1
Anions and Nutrients
Organic / Inorganic Carbon
Total Metals
Physical Tests
Total PhosphorusSulphate
Dissolved Organic Carbon
Aluminum (Al)Antimony (Sb)Arsenic (As)Barium (Ba)Beryllium (Be)Bismuth (Bi)Boron (B)Cadmium (Cd)-TotalCalcium (Ca)Chromium (Cr)Cobalt (Co)Copper (Cu)Iron (Fe)Lead (Pb)Magnesium (Mg)Manganese (Mn)Mercury (Hg)Molybdenum (Mo)Nickel (Ni)Potassium (K)Selenium (Se)-TotalSilicon (Si)Silver (Ag)Strontium (Sr)Thallium (Tl)Tin (Sn)Titanium (Ti)Tungsten (W )Uranium (U)Vanadium (V)Zinc (Zn)Zirconium (Zr)
ConductivitypHTotal Suspended SolidsTotal Dissolved Solids
0.014821.3
27.2
0.775<0.0050<0.00100.013
<0.0010<0.0010<0.050
<0.00009022.0
0.00137<0.000500.00310.783
<0.00104.33
0.0428<0.00010<0.0010<0.0020
<1.00.00049
3.4<0.000100.0414
<0.00030<0.00100.0308<0.010<0.00500.00160.0055
<0.0040
1517.9175.0116
0.00302.0
1.0
0.0100.00500.00100.0100.00100.00100.050
0.0000900.50
0.000500.000500.00100.0500.00100.50
0.00100.000100.00100.0020
1.00.00040
1.00.000100.00100.000300.00100.00200.0100.00500.00100.00300.0040
3.00.103.020
mg/Lmg/L
mg/L
mg/Lmg/Lmg/Lmg/Lmg/Lmg/Lmg/Lmg/Lmg/Lmg/Lmg/Lmg/Lmg/Lmg/Lmg/Lmg/Lmg/Lmg/Lmg/Lmg/Lmg/Lmg/Lmg/Lmg/Lmg/Lmg/Lmg/Lmg/Lmg/Lmg/Lmg/Lmg/L
umhos/cmpH units
mg/Lmg/L
23-APR-1221-APR-12
25-APR-12
20-APR-1220-APR-1220-APR-1220-APR-1223-APR-1220-APR-1220-APR-1220-APR-1220-APR-1220-APR-1220-APR-1220-APR-1220-APR-1220-APR-1220-APR-1220-APR-1219-APR-1220-APR-1220-APR-1220-APR-1220-APR-1220-APR-1220-APR-1220-APR-1220-APR-1220-APR-1220-APR-1220-APR-1220-APR-1220-APR-1220-APR-1220-APR-12
19-APR-1219-APR-1220-APR-1225-APR-12
0.02
*0.0150.020.005
0.011
0.20.0001
0.0009*0.001*0.3
0.001
0.00020.040.025
0.1
0.0001
0.0003
0.030.0050.0060.020.004
6.5-8.5
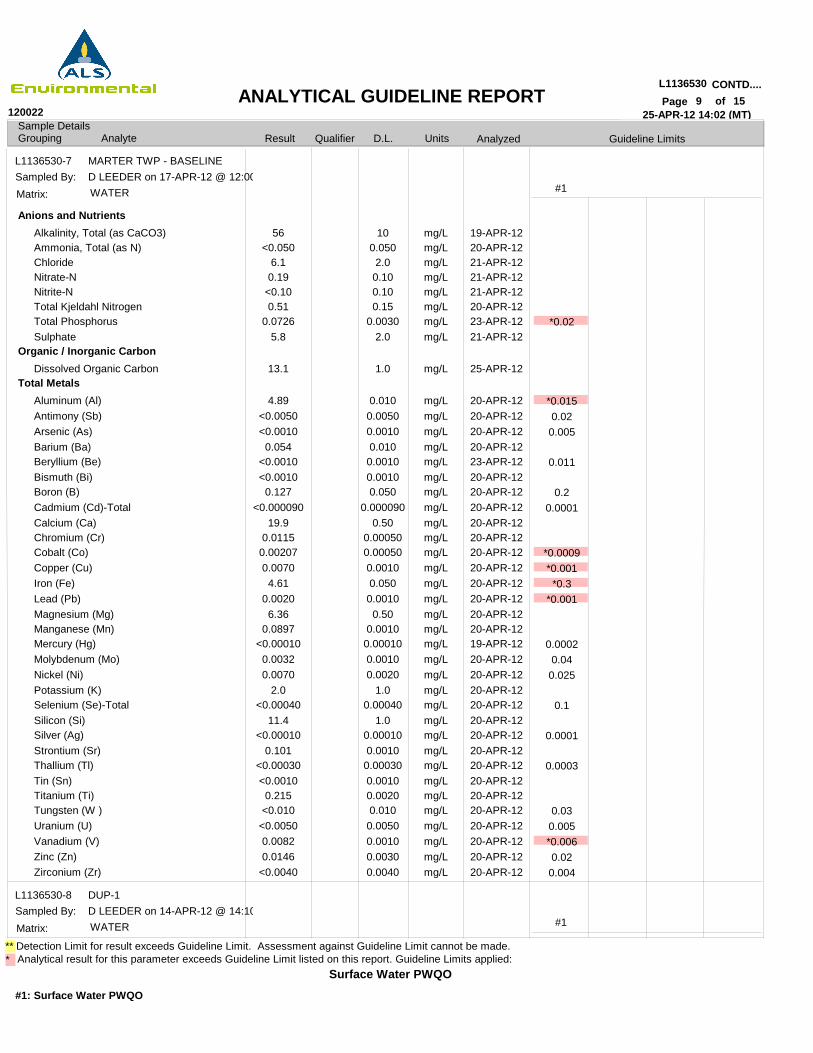
Result
25-APR-12 14:02 (MT)Sample DetailsGrouping Analyte D.L. UnitsQualifier Analyzed
Surface Water PWQO
L1136530 CONTD....9Page of
120022ANALYTICAL GUIDELINE REPORT
Analytical result for this parameter exceeds Guideline Limit listed on this report. Guideline Limits applied:
Guideline Limits
#1: Surface Water PWQO
* ** Detection Limit for result exceeds Guideline Limit. Assessment against Guideline Limit cannot be made.
15
L1136530-7
L1136530-8
MARTER TWP - BASELINE
DUP-1
D LEEDER on 17-APR-12 @ 12:00
D LEEDER on 14-APR-12 @ 14:10
Sampled By:
Sampled By:
WATER
WATER
Matrix:
Matrix:
#1
#1
Anions and Nutrients
Organic / Inorganic Carbon
Total Metals
Alkalinity, Total (as CaCO3)Ammonia, Total (as N)ChlorideNitrate-NNitrite-NTotal Kjeldahl NitrogenTotal PhosphorusSulphate
Dissolved Organic Carbon
Aluminum (Al)Antimony (Sb)Arsenic (As)Barium (Ba)Beryllium (Be)Bismuth (Bi)Boron (B)Cadmium (Cd)-TotalCalcium (Ca)Chromium (Cr)Cobalt (Co)Copper (Cu)Iron (Fe)Lead (Pb)Magnesium (Mg)Manganese (Mn)Mercury (Hg)Molybdenum (Mo)Nickel (Ni)Potassium (K)Selenium (Se)-TotalSilicon (Si)Silver (Ag)Strontium (Sr)Thallium (Tl)Tin (Sn)Titanium (Ti)Tungsten (W )Uranium (U)Vanadium (V)Zinc (Zn)Zirconium (Zr)
56<0.050
6.10.19
<0.100.51
0.07265.8
13.1
4.89<0.0050<0.00100.054
<0.0010<0.00100.127
<0.00009019.9
0.01150.002070.00704.61
0.00206.36
0.0897<0.000100.00320.0070
2.0<0.00040
11.4<0.00010
0.101<0.00030<0.00100.215
<0.010<0.00500.00820.0146
<0.0040
100.0502.00.100.100.15
0.00302.0
1.0
0.0100.00500.00100.0100.00100.00100.050
0.0000900.50
0.000500.000500.00100.0500.00100.50
0.00100.000100.00100.0020
1.00.00040
1.00.000100.00100.000300.00100.00200.0100.00500.00100.00300.0040
mg/Lmg/Lmg/Lmg/Lmg/Lmg/Lmg/Lmg/L
mg/L
mg/Lmg/Lmg/Lmg/Lmg/Lmg/Lmg/Lmg/Lmg/Lmg/Lmg/Lmg/Lmg/Lmg/Lmg/Lmg/Lmg/Lmg/Lmg/Lmg/Lmg/Lmg/Lmg/Lmg/Lmg/Lmg/Lmg/Lmg/Lmg/Lmg/Lmg/Lmg/L
19-APR-1220-APR-1221-APR-1221-APR-1221-APR-1220-APR-1223-APR-1221-APR-12
25-APR-12
20-APR-1220-APR-1220-APR-1220-APR-1223-APR-1220-APR-1220-APR-1220-APR-1220-APR-1220-APR-1220-APR-1220-APR-1220-APR-1220-APR-1220-APR-1220-APR-1219-APR-1220-APR-1220-APR-1220-APR-1220-APR-1220-APR-1220-APR-1220-APR-1220-APR-1220-APR-1220-APR-1220-APR-1220-APR-1220-APR-1220-APR-1220-APR-12
*0.02
*0.0150.020.005
0.011
0.20.0001
*0.0009*0.001*0.3
*0.001
0.00020.040.025
0.1
0.0001
0.0003
0.030.005*0.0060.020.004
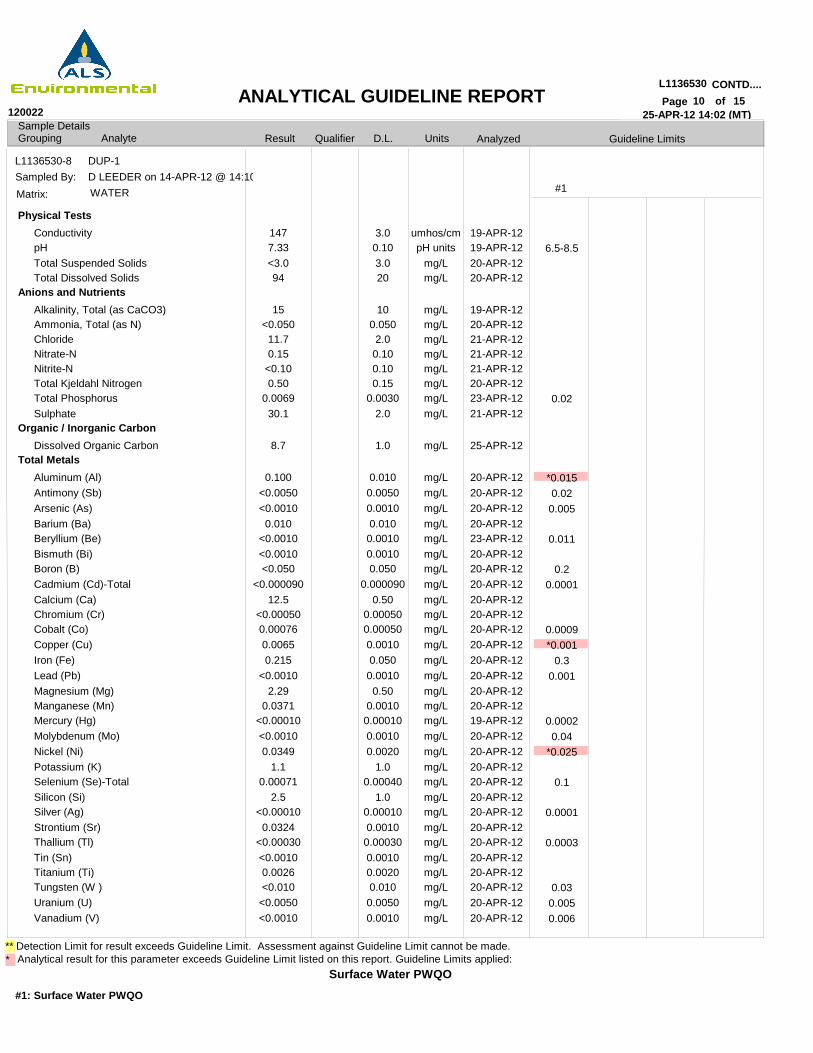
Result
25-APR-12 14:02 (MT)Sample DetailsGrouping Analyte D.L. UnitsQualifier Analyzed
Surface Water PWQO
L1136530 CONTD....10Page of
120022ANALYTICAL GUIDELINE REPORT
Analytical result for this parameter exceeds Guideline Limit listed on this report. Guideline Limits applied:
Guideline Limits
#1: Surface Water PWQO
* ** Detection Limit for result exceeds Guideline Limit. Assessment against Guideline Limit cannot be made.
15
L1136530-8 DUP-1D LEEDER on 14-APR-12 @ 14:10Sampled By:WATERMatrix: #1
Physical Tests
Anions and Nutrients
Organic / Inorganic Carbon
Total Metals
ConductivitypHTotal Suspended SolidsTotal Dissolved Solids
Alkalinity, Total (as CaCO3)Ammonia, Total (as N)ChlorideNitrate-NNitrite-NTotal Kjeldahl NitrogenTotal PhosphorusSulphate
Dissolved Organic Carbon
Aluminum (Al)Antimony (Sb)Arsenic (As)Barium (Ba)Beryllium (Be)Bismuth (Bi)Boron (B)Cadmium (Cd)-TotalCalcium (Ca)Chromium (Cr)Cobalt (Co)Copper (Cu)Iron (Fe)Lead (Pb)Magnesium (Mg)Manganese (Mn)Mercury (Hg)Molybdenum (Mo)Nickel (Ni)Potassium (K)Selenium (Se)-TotalSilicon (Si)Silver (Ag)Strontium (Sr)Thallium (Tl)Tin (Sn)Titanium (Ti)Tungsten (W )Uranium (U)Vanadium (V)
1477.33<3.094
15<0.05011.70.15
<0.100.50
0.006930.1
8.7
0.100<0.0050<0.00100.010
<0.0010<0.0010<0.050
<0.00009012.5
<0.000500.000760.00650.215
<0.00102.29
0.0371<0.00010<0.00100.0349
1.10.00071
2.5<0.000100.0324
<0.00030<0.00100.0026<0.010<0.0050<0.0010
3.00.103.020
100.0502.00.100.100.15
0.00302.0
1.0
0.0100.00500.00100.0100.00100.00100.050
0.0000900.50
0.000500.000500.00100.0500.00100.50
0.00100.000100.00100.0020
1.00.00040
1.00.000100.00100.000300.00100.00200.0100.00500.0010
umhos/cmpH units
mg/Lmg/L
mg/Lmg/Lmg/Lmg/Lmg/Lmg/Lmg/Lmg/L
mg/L
mg/Lmg/Lmg/Lmg/Lmg/Lmg/Lmg/Lmg/Lmg/Lmg/Lmg/Lmg/Lmg/Lmg/Lmg/Lmg/Lmg/Lmg/Lmg/Lmg/Lmg/Lmg/Lmg/Lmg/Lmg/Lmg/Lmg/Lmg/Lmg/Lmg/L
19-APR-1219-APR-1220-APR-1220-APR-12
19-APR-1220-APR-1221-APR-1221-APR-1221-APR-1220-APR-1223-APR-1221-APR-12
25-APR-12
20-APR-1220-APR-1220-APR-1220-APR-1223-APR-1220-APR-1220-APR-1220-APR-1220-APR-1220-APR-1220-APR-1220-APR-1220-APR-1220-APR-1220-APR-1220-APR-1219-APR-1220-APR-1220-APR-1220-APR-1220-APR-1220-APR-1220-APR-1220-APR-1220-APR-1220-APR-1220-APR-1220-APR-1220-APR-1220-APR-12
6.5-8.5
0.02
*0.0150.020.005
0.011
0.20.0001
0.0009*0.001
0.30.001
0.00020.04
*0.025
0.1
0.0001
0.0003
0.030.0050.006
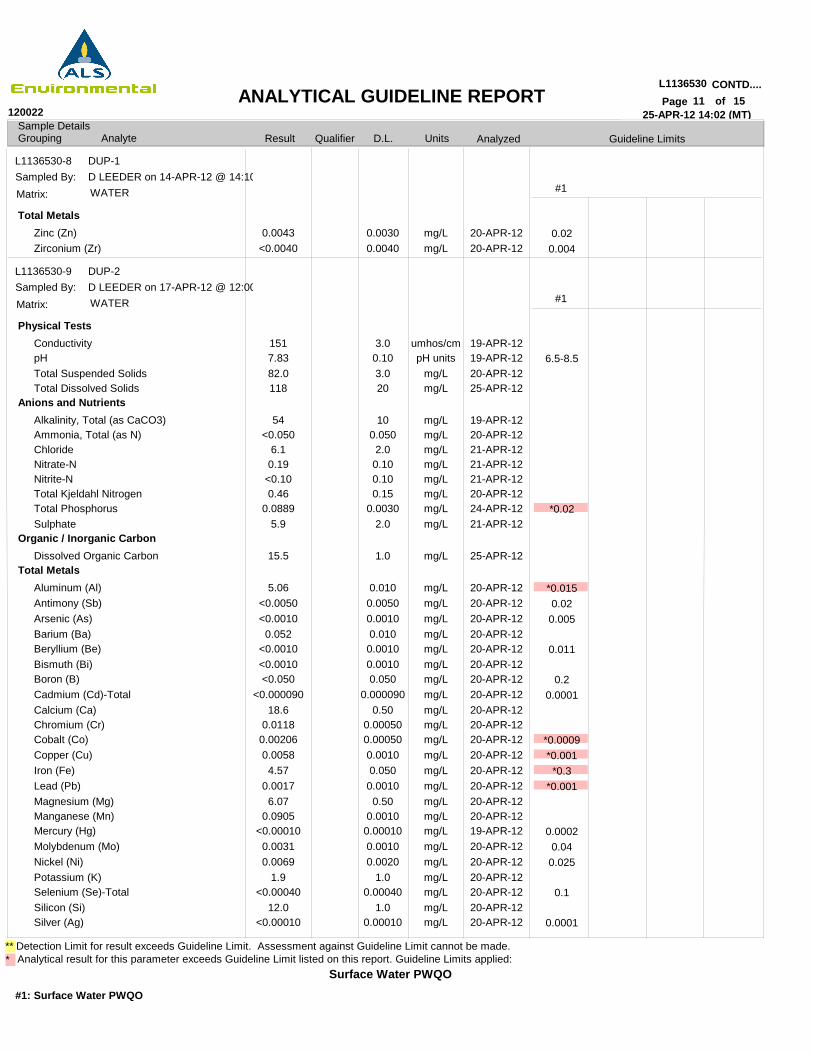
Result
25-APR-12 14:02 (MT)Sample DetailsGrouping Analyte D.L. UnitsQualifier Analyzed
Surface Water PWQO
L1136530 CONTD....11Page of
120022ANALYTICAL GUIDELINE REPORT
Analytical result for this parameter exceeds Guideline Limit listed on this report. Guideline Limits applied:
Guideline Limits
#1: Surface Water PWQO
* ** Detection Limit for result exceeds Guideline Limit. Assessment against Guideline Limit cannot be made.
15
L1136530-8
L1136530-9
DUP-1
DUP-2
D LEEDER on 14-APR-12 @ 14:10
D LEEDER on 17-APR-12 @ 12:00
Sampled By:
Sampled By:
WATER
WATER
Matrix:
Matrix:
#1
#1
Total Metals
Physical Tests
Anions and Nutrients
Organic / Inorganic Carbon
Total Metals
Zinc (Zn)Zirconium (Zr)
ConductivitypHTotal Suspended SolidsTotal Dissolved Solids
Alkalinity, Total (as CaCO3)Ammonia, Total (as N)ChlorideNitrate-NNitrite-NTotal Kjeldahl NitrogenTotal PhosphorusSulphate
Dissolved Organic Carbon
Aluminum (Al)Antimony (Sb)Arsenic (As)Barium (Ba)Beryllium (Be)Bismuth (Bi)Boron (B)Cadmium (Cd)-TotalCalcium (Ca)Chromium (Cr)Cobalt (Co)Copper (Cu)Iron (Fe)Lead (Pb)Magnesium (Mg)Manganese (Mn)Mercury (Hg)Molybdenum (Mo)Nickel (Ni)Potassium (K)Selenium (Se)-TotalSilicon (Si)Silver (Ag)
0.0043<0.0040
1517.8382.0118
54<0.050
6.10.19
<0.100.46
0.08895.9
15.5
5.06<0.0050<0.00100.052
<0.0010<0.0010<0.050
<0.00009018.6
0.01180.002060.00584.57
0.00176.07
0.0905<0.000100.00310.0069
1.9<0.00040
12.0<0.00010
0.00300.0040
3.00.103.020
100.0502.00.100.100.15
0.00302.0
1.0
0.0100.00500.00100.0100.00100.00100.050
0.0000900.50
0.000500.000500.00100.0500.00100.50
0.00100.000100.00100.0020
1.00.00040
1.00.00010
mg/Lmg/L
umhos/cmpH units
mg/Lmg/L
mg/Lmg/Lmg/Lmg/Lmg/Lmg/Lmg/Lmg/L
mg/L
mg/Lmg/Lmg/Lmg/Lmg/Lmg/Lmg/Lmg/Lmg/Lmg/Lmg/Lmg/Lmg/Lmg/Lmg/Lmg/Lmg/Lmg/Lmg/Lmg/Lmg/Lmg/Lmg/L
20-APR-1220-APR-12
19-APR-1219-APR-1220-APR-1225-APR-12
19-APR-1220-APR-1221-APR-1221-APR-1221-APR-1220-APR-1224-APR-1221-APR-12
25-APR-12
20-APR-1220-APR-1220-APR-1220-APR-1220-APR-1220-APR-1220-APR-1220-APR-1220-APR-1220-APR-1220-APR-1220-APR-1220-APR-1220-APR-1220-APR-1220-APR-1219-APR-1220-APR-1220-APR-1220-APR-1220-APR-1220-APR-1220-APR-12
0.020.004
6.5-8.5
*0.02
*0.0150.020.005
0.011
0.20.0001
*0.0009*0.001*0.3
*0.001
0.00020.040.025
0.1
0.0001
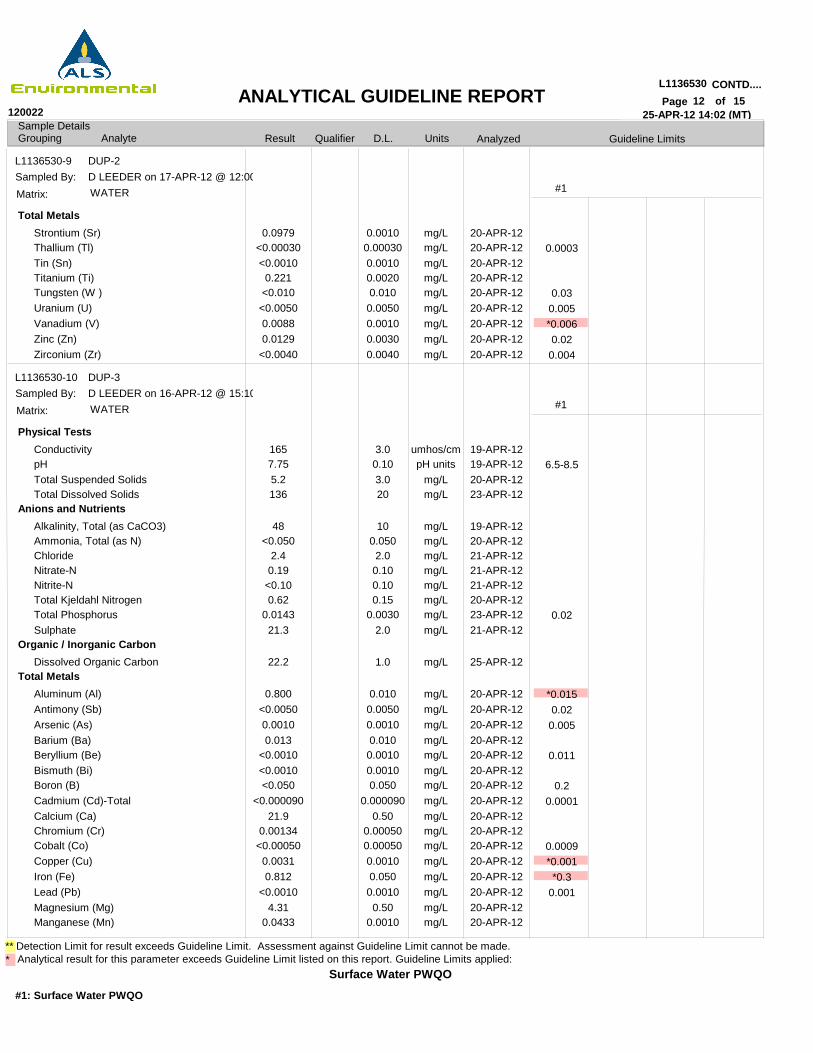
Result
25-APR-12 14:02 (MT)Sample DetailsGrouping Analyte D.L. UnitsQualifier Analyzed
Surface Water PWQO
L1136530 CONTD....12Page of
120022ANALYTICAL GUIDELINE REPORT
Analytical result for this parameter exceeds Guideline Limit listed on this report. Guideline Limits applied:
Guideline Limits
#1: Surface Water PWQO
* ** Detection Limit for result exceeds Guideline Limit. Assessment against Guideline Limit cannot be made.
15
L1136530-9
L1136530-10
DUP-2
DUP-3
D LEEDER on 17-APR-12 @ 12:00
D LEEDER on 16-APR-12 @ 15:10
Sampled By:
Sampled By:
WATER
WATER
Matrix:
Matrix:
#1
#1
Total Metals
Physical Tests
Anions and Nutrients
Organic / Inorganic Carbon
Total Metals
Strontium (Sr)Thallium (Tl)Tin (Sn)Titanium (Ti)Tungsten (W )Uranium (U)Vanadium (V)Zinc (Zn)Zirconium (Zr)
ConductivitypHTotal Suspended SolidsTotal Dissolved Solids
Alkalinity, Total (as CaCO3)Ammonia, Total (as N)ChlorideNitrate-NNitrite-NTotal Kjeldahl NitrogenTotal PhosphorusSulphate
Dissolved Organic Carbon
Aluminum (Al)Antimony (Sb)Arsenic (As)Barium (Ba)Beryllium (Be)Bismuth (Bi)Boron (B)Cadmium (Cd)-TotalCalcium (Ca)Chromium (Cr)Cobalt (Co)Copper (Cu)Iron (Fe)Lead (Pb)Magnesium (Mg)Manganese (Mn)
0.0979<0.00030<0.00100.221
<0.010<0.00500.00880.0129
<0.0040
1657.755.2136
48<0.050
2.40.19
<0.100.62
0.014321.3
22.2
0.800<0.00500.00100.013
<0.0010<0.0010<0.050
<0.00009021.9
0.00134<0.000500.00310.812
<0.00104.31
0.0433
0.00100.000300.00100.00200.0100.00500.00100.00300.0040
3.00.103.020
100.0502.00.100.100.15
0.00302.0
1.0
0.0100.00500.00100.0100.00100.00100.050
0.0000900.50
0.000500.000500.00100.0500.00100.50
0.0010
mg/Lmg/Lmg/Lmg/Lmg/Lmg/Lmg/Lmg/Lmg/L
umhos/cmpH units
mg/Lmg/L
mg/Lmg/Lmg/Lmg/Lmg/Lmg/Lmg/Lmg/L
mg/L
mg/Lmg/Lmg/Lmg/Lmg/Lmg/Lmg/Lmg/Lmg/Lmg/Lmg/Lmg/Lmg/Lmg/Lmg/Lmg/L
20-APR-1220-APR-1220-APR-1220-APR-1220-APR-1220-APR-1220-APR-1220-APR-1220-APR-12
19-APR-1219-APR-1220-APR-1223-APR-12
19-APR-1220-APR-1221-APR-1221-APR-1221-APR-1220-APR-1223-APR-1221-APR-12
25-APR-12
20-APR-1220-APR-1220-APR-1220-APR-1220-APR-1220-APR-1220-APR-1220-APR-1220-APR-1220-APR-1220-APR-1220-APR-1220-APR-1220-APR-1220-APR-1220-APR-12
0.0003
0.030.005*0.0060.020.004
6.5-8.5
0.02
*0.0150.020.005
0.011
0.20.0001
0.0009*0.001*0.3
0.001
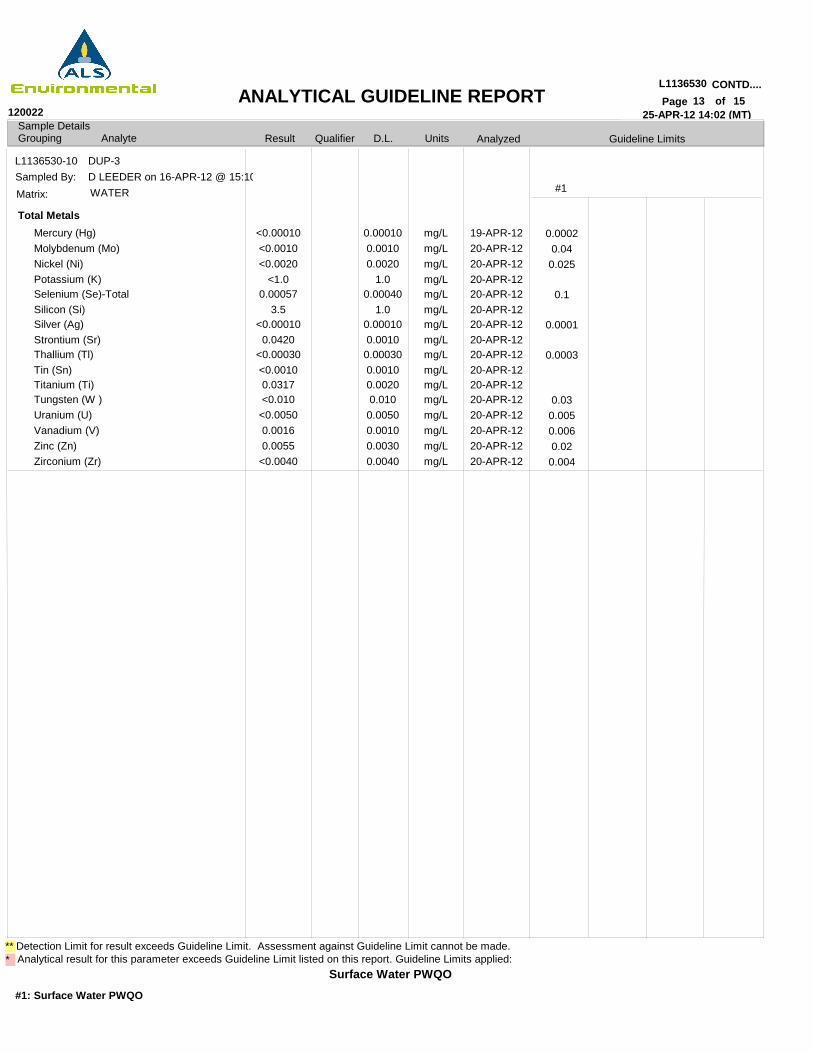
Result
25-APR-12 14:02 (MT)Sample DetailsGrouping Analyte D.L. UnitsQualifier Analyzed
Surface Water PWQO
L1136530 CONTD....13Page of
120022ANALYTICAL GUIDELINE REPORT
Analytical result for this parameter exceeds Guideline Limit listed on this report. Guideline Limits applied:
Guideline Limits
#1: Surface Water PWQO
* ** Detection Limit for result exceeds Guideline Limit. Assessment against Guideline Limit cannot be made.
15
L1136530-10 DUP-3D LEEDER on 16-APR-12 @ 15:10Sampled By:WATERMatrix: #1
Total Metals
Mercury (Hg)Molybdenum (Mo)Nickel (Ni)Potassium (K)Selenium (Se)-TotalSilicon (Si)Silver (Ag)Strontium (Sr)Thallium (Tl)Tin (Sn)Titanium (Ti)Tungsten (W )Uranium (U)Vanadium (V)Zinc (Zn)Zirconium (Zr)
<0.00010<0.0010<0.0020
<1.00.00057
3.5<0.000100.0420
<0.00030<0.00100.0317<0.010<0.00500.00160.0055
<0.0040
0.000100.00100.0020
1.00.00040
1.00.000100.00100.000300.00100.00200.0100.00500.00100.00300.0040
mg/Lmg/Lmg/Lmg/Lmg/Lmg/Lmg/Lmg/Lmg/Lmg/Lmg/Lmg/Lmg/Lmg/Lmg/Lmg/L
19-APR-1220-APR-1220-APR-1220-APR-1220-APR-1220-APR-1220-APR-1220-APR-1220-APR-1220-APR-1220-APR-1220-APR-1220-APR-1220-APR-1220-APR-1220-APR-12
0.00020.040.025
0.1
0.0001
0.0003
0.030.0050.0060.020.004
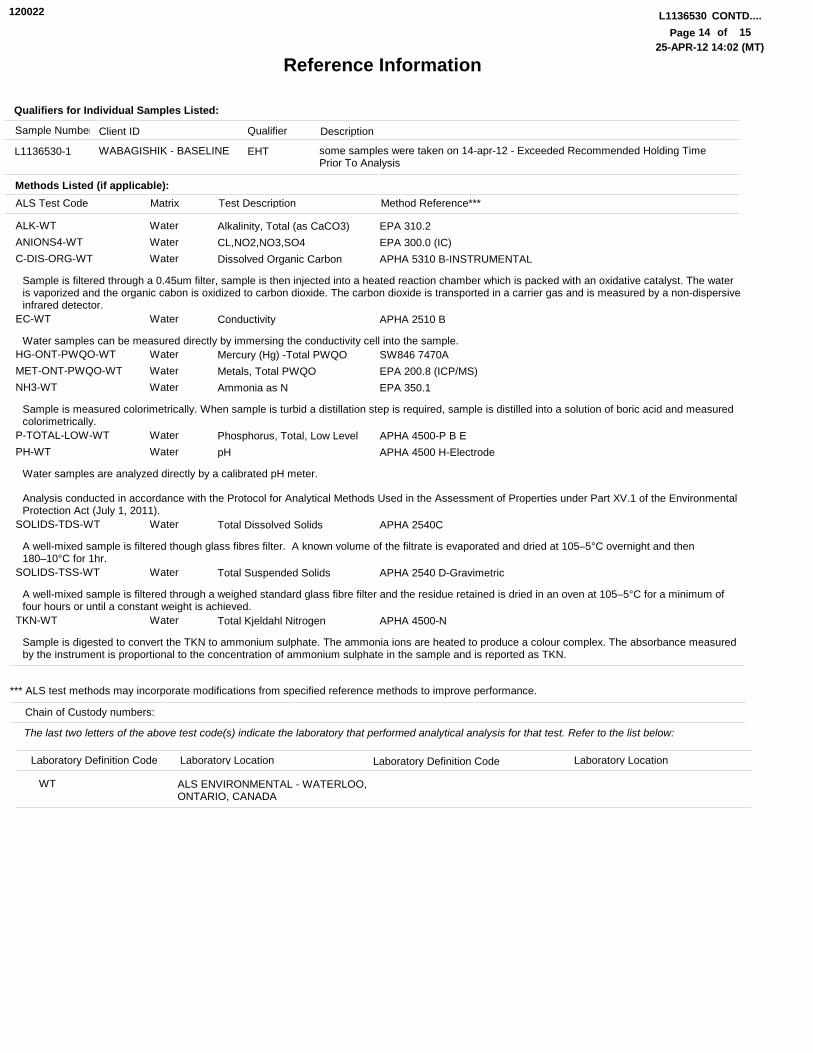
ALK-WTANIONS4-WTC-DIS-ORG-WT
EC-WT
HG-ONT-PWQO-WTMET-ONT-PWQO-WTNH3-WT
P-TOTAL-LOW-WTPH-WT
SOLIDS-TDS-WT
SOLIDS-TSS-WT
TKN-WT
Reference Information
Alkalinity, Total (as CaCO3)CL,NO2,NO3,SO4Dissolved Organic Carbon
Conductivity
Mercury (Hg) -Total PWQOMetals, Total PWQOAmmonia as N
Phosphorus, Total, Low LevelpH
Total Dissolved Solids
Total Suspended Solids
Total Kjeldahl Nitrogen
120022
Sample is filtered through a 0.45um filter, sample is then injected into a heated reaction chamber which is packed with an oxidative catalyst. The water is vaporized and the organic cabon is oxidized to carbon dioxide. The carbon dioxide is transported in a carrier gas and is measured by a non-dispersiveinfrared detector.
Water samples can be measured directly by immersing the conductivity cell into the sample.
Sample is measured colorimetrically. When sample is turbid a distillation step is required, sample is distilled into a solution of boric acid and measured colorimetrically.
Water samples are analyzed directly by a calibrated pH meter.
Analysis conducted in accordance with the Protocol for Analytical Methods Used in the Assessment of Properties under Part XV.1 of the Environmental Protection Act (July 1, 2011).
A well-mixed sample is filtered though glass fibres filter. A known volume of the filtrate is evaporated and dried at 105–5°C overnight and then 180–10°C for 1hr.
A well-mixed sample is filtered through a weighed standard glass fibre filter and the residue retained is dried in an oven at 105–5°C for a minimum of four hours or until a constant weight is achieved.
Sample is digested to convert the TKN to ammonium sulphate. The ammonia ions are heated to produce a colour complex. The absorbance measured by the instrument is proportional to the concentration of ammonium sulphate in the sample and is reported as TKN.
L1136530-1 some samples were taken on 14-apr-12 - Exceeded Recommended Holding Time Prior To Analysis
Qualifiers for Individual Samples Listed:
Sample Number
WABAGISHIK - BASELINE
Methods Listed (if applicable):
ALS Test Code Test Description
Client ID Description
WaterWaterWater
Water
WaterWaterWater
WaterWater
Water
Water
Water
EHT
EPA 310.2EPA 300.0 (IC)APHA 5310 B-INSTRUMENTAL
APHA 2510 B
SW846 7470AEPA 200.8 (ICP/MS)EPA 350.1
APHA 4500-P B EAPHA 4500 H-Electrode
APHA 2540C
APHA 2540 D-Gravimetric
APHA 4500-N
Method Reference***
*** ALS test methods may incorporate modifications from specified reference methods to improve performance.
Qualifier
Matrix
The last two letters of the above test code(s) indicate the laboratory that performed analytical analysis for that test. Refer to the list below:
Chain of Custody numbers:
L1136530 CONTD....14Page of
25-APR-12 14:02 (MT)
Laboratory Definition Code Laboratory Location Laboratory Definition Code Laboratory Location
WT ALS ENVIRONMENTAL - WATERLOO, ONTARIO, CANADA
15
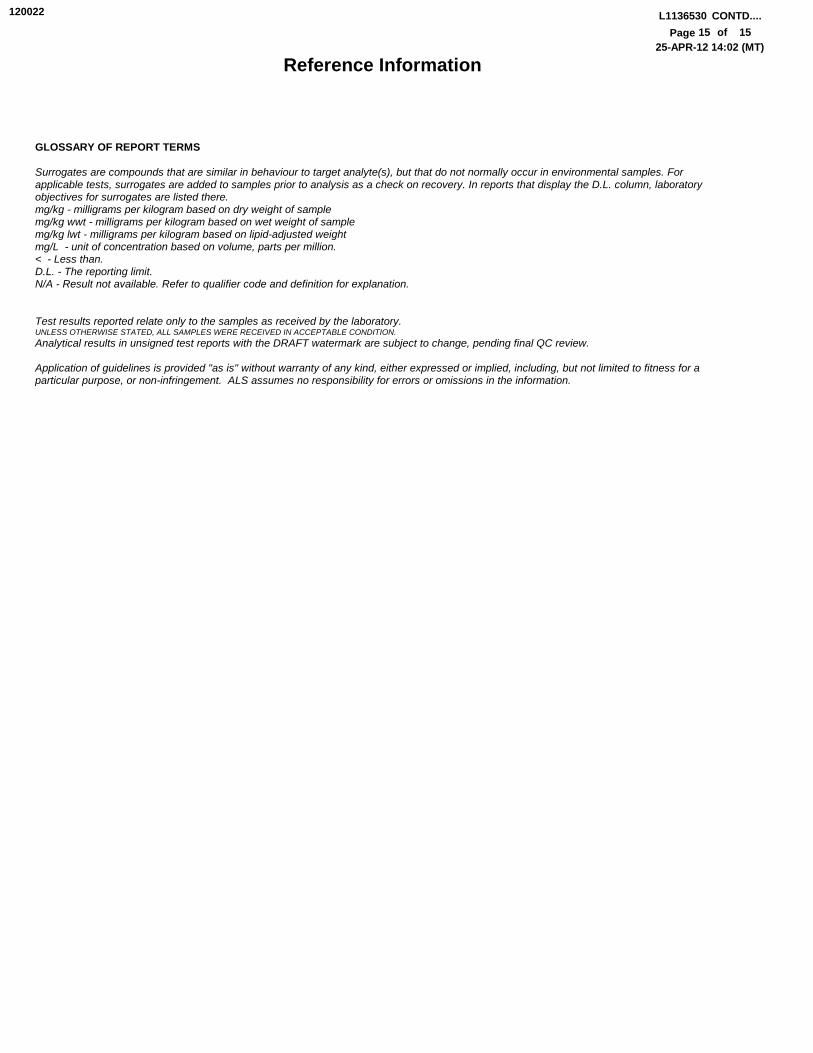
Reference Information
120022
GLOSSARY OF REPORT TERMS
Surrogates are compounds that are similar in behaviour to target analyte(s), but that do not normally occur in environmental samples. For applicable tests, surrogates are added to samples prior to analysis as a check on recovery. In reports that display the D.L. column, laboratory objectives for surrogates are listed there.mg/kg - milligrams per kilogram based on dry weight of samplemg/kg wwt - milligrams per kilogram based on wet weight of samplemg/kg lwt - milligrams per kilogram based on lipid-adjusted weight mg/L - unit of concentration based on volume, parts per million.< - Less than.D.L. - The reporting limit.N/A - Result not available. Refer to qualifier code and definition for explanation.
Test results reported relate only to the samples as received by the laboratory.UNLESS OTHERWISE STATED, ALL SAMPLES WERE RECEIVED IN ACCEPTABLE CONDITION.Analytical results in unsigned test reports with the DRAFT watermark are subject to change, pending final QC review.
Application of guidelines is provided "as is" without warranty of any kind, either expressed or implied, including, but not limited to fitness for a particular purpose, or non-infringement. ALS assumes no responsibility for errors or omissions in the information.
L1136530 CONTD....15Page of
25-APR-12 14:02 (MT)15
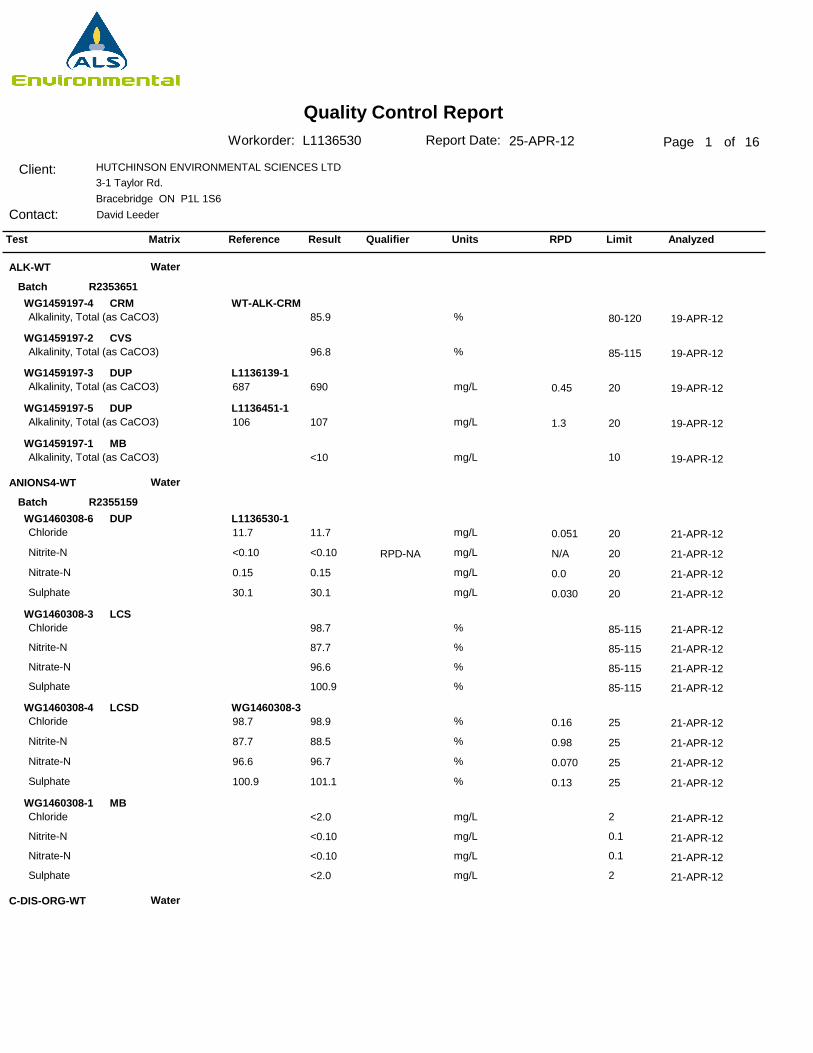
Quality Control ReportPage 1 of
Client:
Contact:
HUTCHINSON ENVIRONMENTAL SCIENCES LTD3-1 Taylor Rd. Bracebridge ON P1L 1S6David Leeder
Report Date: 25-APR-12Workorder: L1136530
Test Matrix Reference Result Qualifier Units RPD Limit Analyzed
ALK-WT
ANIONS4-WT
C-DIS-ORG-WT
Water
Water
Water
R2353651
R2355159
Batch
Batch
CRM
CVS
DUP
DUP
MB
DUP
LCS
LCSD
MB
WG1459197-4
WG1459197-2
WG1459197-3
WG1459197-5
WG1459197-1
WG1460308-6
WG1460308-3
WG1460308-4
WG1460308-1
WT-ALK-CRM
L1136139-1
L1136451-1
L1136530-1
WG1460308-3
Alkalinity, Total (as CaCO3)
Alkalinity, Total (as CaCO3)
Alkalinity, Total (as CaCO3)
Alkalinity, Total (as CaCO3)
Alkalinity, Total (as CaCO3)
Chloride
Nitrite-N
Nitrate-N
Sulphate
Chloride
Nitrite-N
Nitrate-N
Sulphate
Chloride
Nitrite-N
Nitrate-N
Sulphate
Chloride
Nitrite-N
Nitrate-N
Sulphate
85.9
96.8
690
107
<10
11.7
<0.10
0.15
30.1
98.7
87.7
96.6
100.9
98.9
88.5
96.7
101.1
<2.0
<0.10
<0.10
<2.0
19-APR-12
19-APR-12
19-APR-12
19-APR-12
19-APR-12
21-APR-12
21-APR-12
21-APR-12
21-APR-12
21-APR-12
21-APR-12
21-APR-12
21-APR-12
21-APR-12
21-APR-12
21-APR-12
21-APR-12
21-APR-12
21-APR-12
21-APR-12
21-APR-12
0.45
1.3
0.051
N/A
0.0
0.030
0.16
0.98
0.070
0.13
20
20
20
20
20
20
25
25
25
25
80-120
85-115
85-115
85-115
85-115
85-115
%
%
mg/L
mg/L
mg/L
mg/L
mg/L
mg/L
mg/L
%
%
%
%
%
%
%
%
mg/L
mg/L
mg/L
mg/L
687
106
11.7
<0.10
0.15
30.1
98.7
87.7
96.6
100.9
10
2
0.1
0.1
2
RPD-NA
16
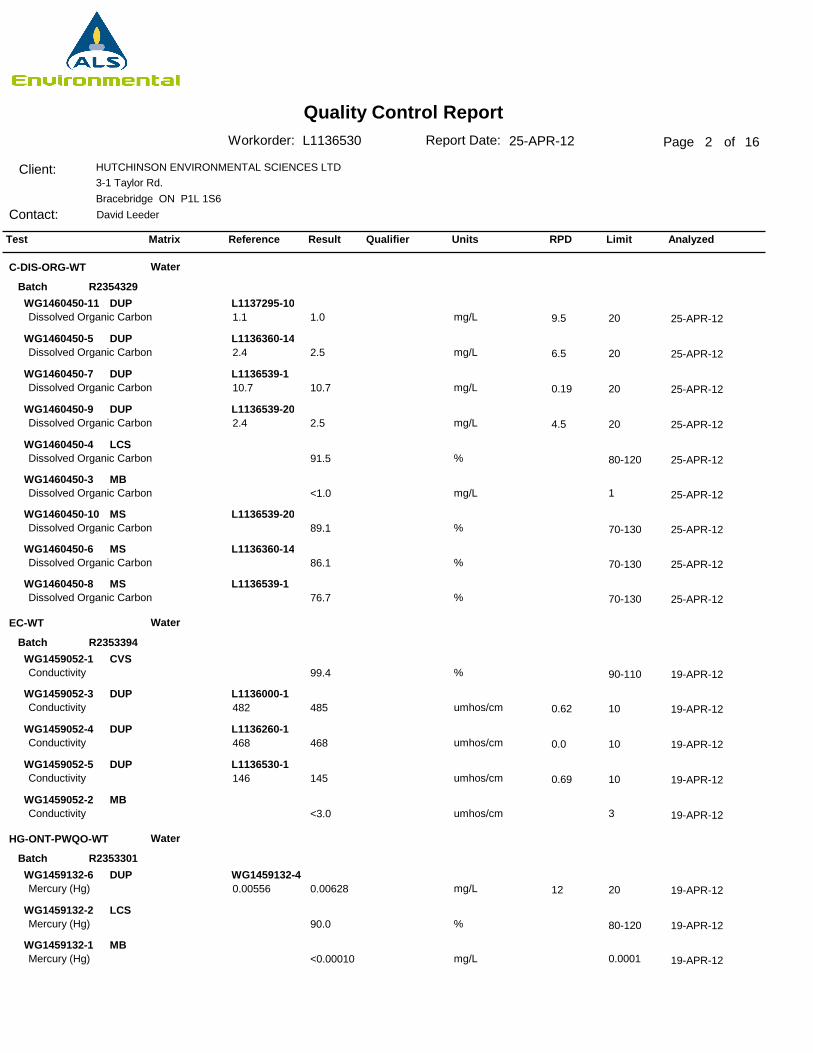
Quality Control ReportPage 2 of
Client:
Contact:
HUTCHINSON ENVIRONMENTAL SCIENCES LTD3-1 Taylor Rd. Bracebridge ON P1L 1S6David Leeder
Report Date: 25-APR-12Workorder: L1136530
Test Matrix Reference Result Qualifier Units RPD Limit Analyzed
C-DIS-ORG-WT
EC-WT
HG-ONT-PWQO-WT
Water
Water
Water
R2354329
R2353394
R2353301
Batch
Batch
Batch
DUP
DUP
DUP
DUP
LCS
MB
MS
MS
MS
CVS
DUP
DUP
DUP
MB
DUP
LCS
MB
WG1460450-11
WG1460450-5
WG1460450-7
WG1460450-9
WG1460450-4
WG1460450-3
WG1460450-10
WG1460450-6
WG1460450-8
WG1459052-1
WG1459052-3
WG1459052-4
WG1459052-5
WG1459052-2
WG1459132-6
WG1459132-2
WG1459132-1
L1137295-10
L1136360-14
L1136539-1
L1136539-20
L1136539-20
L1136360-14
L1136539-1
L1136000-1
L1136260-1
L1136530-1
WG1459132-4
Dissolved Organic Carbon
Dissolved Organic Carbon
Dissolved Organic Carbon
Dissolved Organic Carbon
Dissolved Organic Carbon
Dissolved Organic Carbon
Dissolved Organic Carbon
Dissolved Organic Carbon
Dissolved Organic Carbon
Conductivity
Conductivity
Conductivity
Conductivity
Conductivity
Mercury (Hg)
Mercury (Hg)
Mercury (Hg)
1.0
2.5
10.7
2.5
91.5
<1.0
89.1
86.1
76.7
99.4
485
468
145
<3.0
0.00628
90.0
<0.00010
25-APR-12
25-APR-12
25-APR-12
25-APR-12
25-APR-12
25-APR-12
25-APR-12
25-APR-12
25-APR-12
19-APR-12
19-APR-12
19-APR-12
19-APR-12
19-APR-12
19-APR-12
19-APR-12
19-APR-12
9.5
6.5
0.19
4.5
0.62
0.0
0.69
12
20
20
20
20
10
10
10
20
80-120
70-130
70-130
70-130
90-110
80-120
mg/L
mg/L
mg/L
mg/L
%
mg/L
%
%
%
%
umhos/cm
umhos/cm
umhos/cm
umhos/cm
mg/L
%
mg/L
1.1
2.4
10.7
2.4
482
468
146
0.00556
1
3
0.0001
16
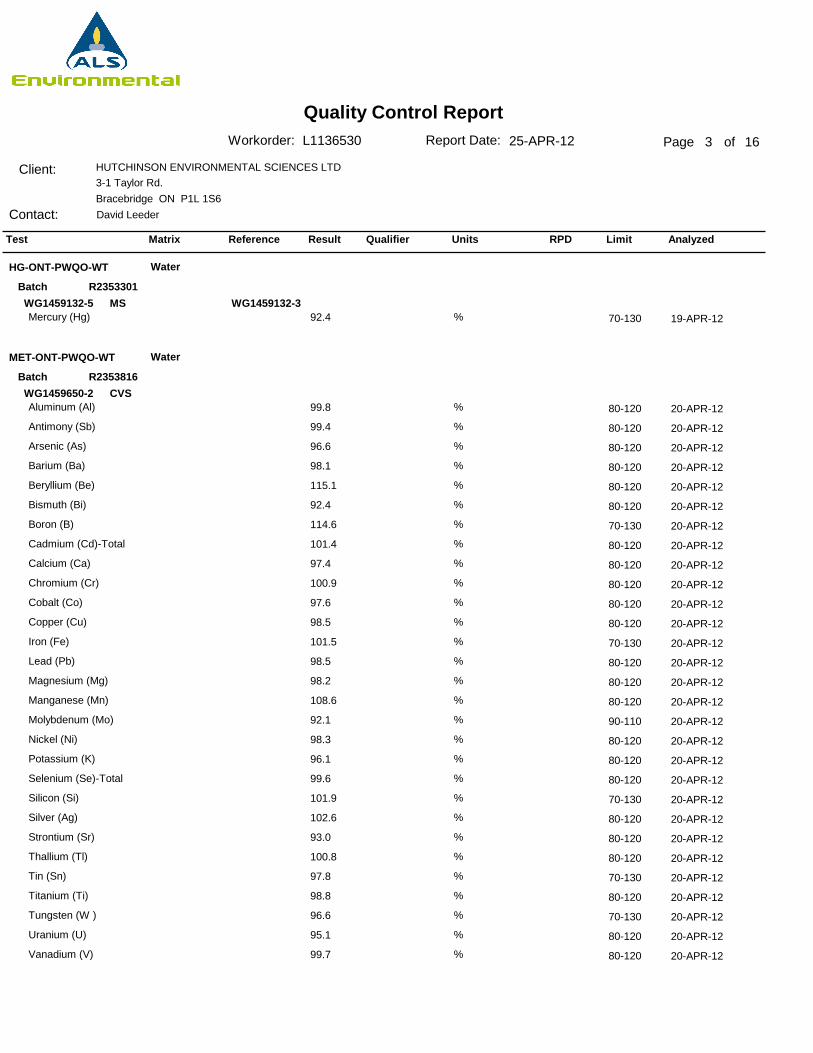
Quality Control ReportPage 3 of
Client:
Contact:
HUTCHINSON ENVIRONMENTAL SCIENCES LTD3-1 Taylor Rd. Bracebridge ON P1L 1S6David Leeder
Report Date: 25-APR-12Workorder: L1136530
Test Matrix Reference Result Qualifier Units RPD Limit Analyzed
HG-ONT-PWQO-WT
MET-ONT-PWQO-WT
Water
Water
R2353301
R2353816
Batch
Batch
MS
CVS
WG1459132-5
WG1459650-2
WG1459132-3Mercury (Hg)
Aluminum (Al)
Antimony (Sb)
Arsenic (As)
Barium (Ba)
Beryllium (Be)
Bismuth (Bi)
Boron (B)
Cadmium (Cd)-Total
Calcium (Ca)
Chromium (Cr)
Cobalt (Co)
Copper (Cu)
Iron (Fe)
Lead (Pb)
Magnesium (Mg)
Manganese (Mn)
Molybdenum (Mo)
Nickel (Ni)
Potassium (K)
Selenium (Se)-Total
Silicon (Si)
Silver (Ag)
Strontium (Sr)
Thallium (Tl)
Tin (Sn)
Titanium (Ti)
Tungsten (W )
Uranium (U)
Vanadium (V)
92.4
99.8
99.4
96.6
98.1
115.1
92.4
114.6
101.4
97.4
100.9
97.6
98.5
101.5
98.5
98.2
108.6
92.1
98.3
96.1
99.6
101.9
102.6
93.0
100.8
97.8
98.8
96.6
95.1
99.7
19-APR-12
20-APR-12
20-APR-12
20-APR-12
20-APR-12
20-APR-12
20-APR-12
20-APR-12
20-APR-12
20-APR-12
20-APR-12
20-APR-12
20-APR-12
20-APR-12
20-APR-12
20-APR-12
20-APR-12
20-APR-12
20-APR-12
20-APR-12
20-APR-12
20-APR-12
20-APR-12
20-APR-12
20-APR-12
20-APR-12
20-APR-12
20-APR-12
20-APR-12
20-APR-12
70-130
80-120
80-120
80-120
80-120
80-120
80-120
70-130
80-120
80-120
80-120
80-120
80-120
70-130
80-120
80-120
80-120
90-110
80-120
80-120
80-120
70-130
80-120
80-120
80-120
70-130
80-120
70-130
80-120
80-120
%
%
%
%
%
%
%
%
%
%
%
%
%
%
%
%
%
%
%
%
%
%
%
%
%
%
%
%
%
%
16
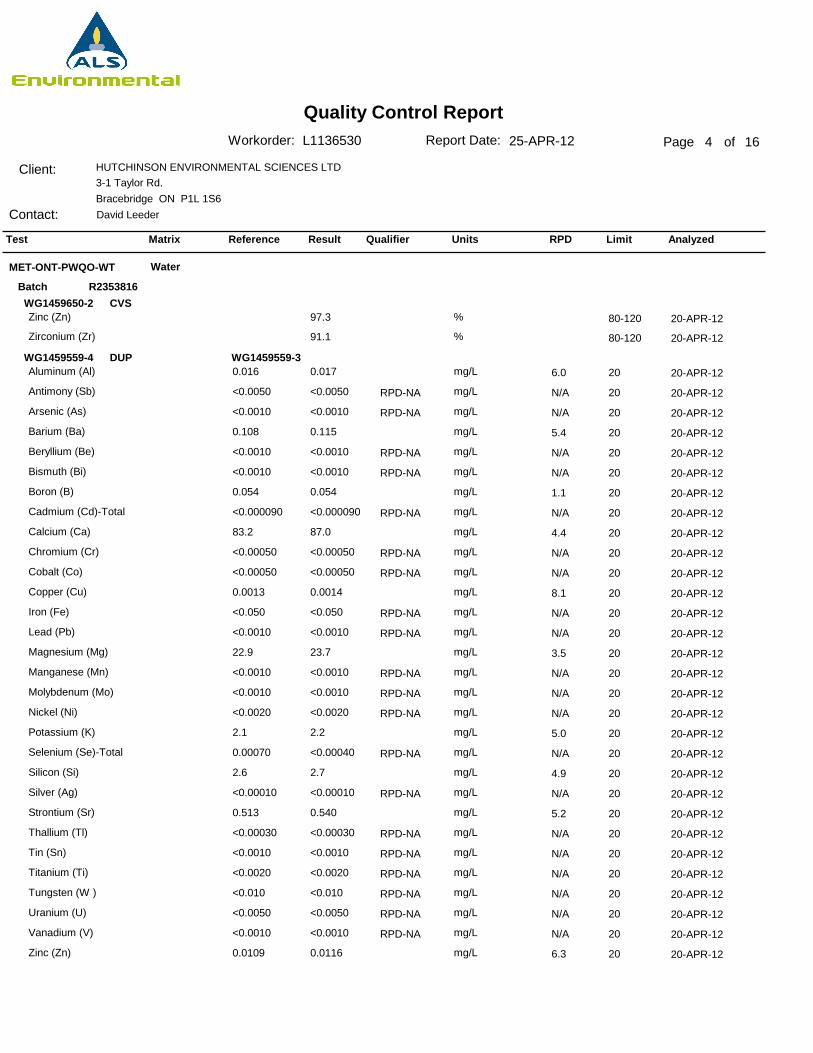
Quality Control ReportPage 4 of
Client:
Contact:
HUTCHINSON ENVIRONMENTAL SCIENCES LTD3-1 Taylor Rd. Bracebridge ON P1L 1S6David Leeder
Report Date: 25-APR-12Workorder: L1136530
Test Matrix Reference Result Qualifier Units RPD Limit Analyzed
MET-ONT-PWQO-WT Water
R2353816BatchCVS
DUP
WG1459650-2
WG1459559-4 WG1459559-3
Zinc (Zn)
Zirconium (Zr)
Aluminum (Al)
Antimony (Sb)
Arsenic (As)
Barium (Ba)
Beryllium (Be)
Bismuth (Bi)
Boron (B)
Cadmium (Cd)-Total
Calcium (Ca)
Chromium (Cr)
Cobalt (Co)
Copper (Cu)
Iron (Fe)
Lead (Pb)
Magnesium (Mg)
Manganese (Mn)
Molybdenum (Mo)
Nickel (Ni)
Potassium (K)
Selenium (Se)-Total
Silicon (Si)
Silver (Ag)
Strontium (Sr)
Thallium (Tl)
Tin (Sn)
Titanium (Ti)
Tungsten (W )
Uranium (U)
Vanadium (V)
Zinc (Zn)
97.3
91.1
0.017
<0.0050
<0.0010
0.115
<0.0010
<0.0010
0.054
<0.000090
87.0
<0.00050
<0.00050
0.0014
<0.050
<0.0010
23.7
<0.0010
<0.0010
<0.0020
2.2
<0.00040
2.7
<0.00010
0.540
<0.00030
<0.0010
<0.0020
<0.010
<0.0050
<0.0010
0.0116
20-APR-12
20-APR-12
20-APR-12
20-APR-12
20-APR-12
20-APR-12
20-APR-12
20-APR-12
20-APR-12
20-APR-12
20-APR-12
20-APR-12
20-APR-12
20-APR-12
20-APR-12
20-APR-12
20-APR-12
20-APR-12
20-APR-12
20-APR-12
20-APR-12
20-APR-12
20-APR-12
20-APR-12
20-APR-12
20-APR-12
20-APR-12
20-APR-12
20-APR-12
20-APR-12
20-APR-12
20-APR-12
6.0
N/A
N/A
5.4
N/A
N/A
1.1
N/A
4.4
N/A
N/A
8.1
N/A
N/A
3.5
N/A
N/A
N/A
5.0
N/A
4.9
N/A
5.2
N/A
N/A
N/A
N/A
N/A
N/A
6.3
20
20
20
20
20
20
20
20
20
20
20
20
20
20
20
20
20
20
20
20
20
20
20
20
20
20
20
20
20
20
80-120
80-120
%
%
mg/L
mg/L
mg/L
mg/L
mg/L
mg/L
mg/L
mg/L
mg/L
mg/L
mg/L
mg/L
mg/L
mg/L
mg/L
mg/L
mg/L
mg/L
mg/L
mg/L
mg/L
mg/L
mg/L
mg/L
mg/L
mg/L
mg/L
mg/L
mg/L
mg/L
0.016
<0.0050
<0.0010
0.108
<0.0010
<0.0010
0.054
<0.000090
83.2
<0.00050
<0.00050
0.0013
<0.050
<0.0010
22.9
<0.0010
<0.0010
<0.0020
2.1
0.00070
2.6
<0.00010
0.513
<0.00030
<0.0010
<0.0020
<0.010
<0.0050
<0.0010
0.0109
RPD-NA
RPD-NA
RPD-NA
RPD-NA
RPD-NA
RPD-NA
RPD-NA
RPD-NA
RPD-NA
RPD-NA
RPD-NA
RPD-NA
RPD-NA
RPD-NA
RPD-NA
RPD-NA
RPD-NA
RPD-NA
RPD-NA
RPD-NA
16
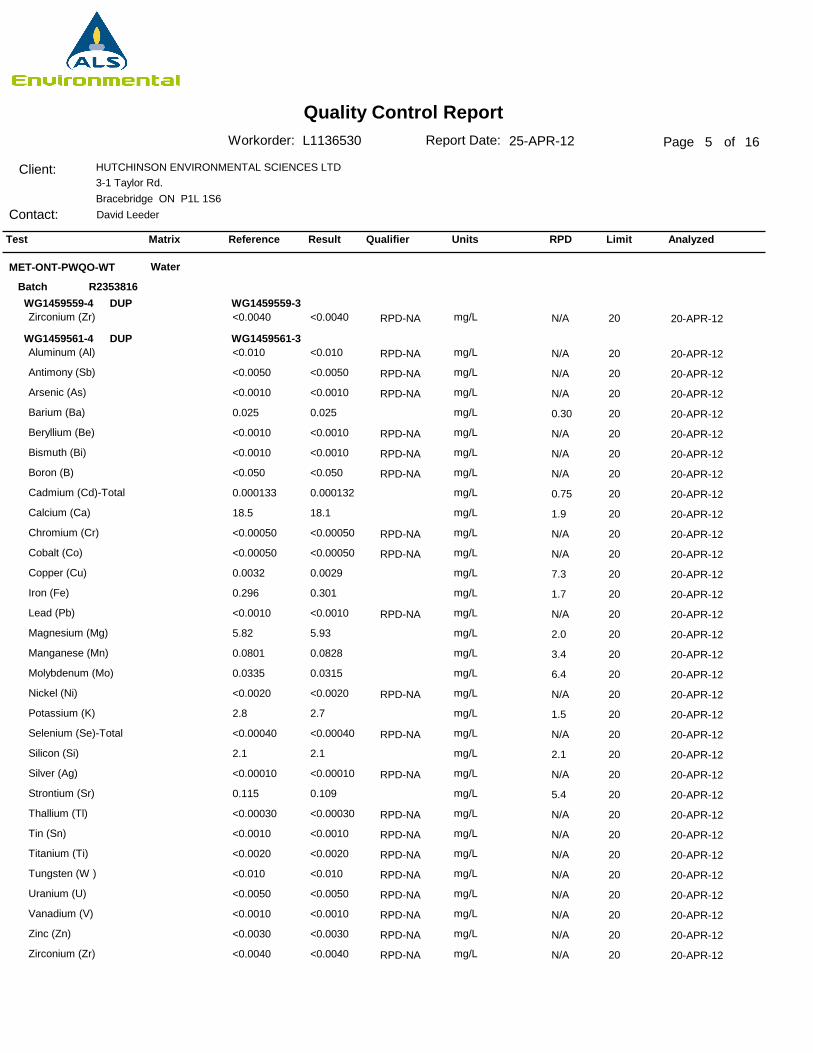
Quality Control ReportPage 5 of
Client:
Contact:
HUTCHINSON ENVIRONMENTAL SCIENCES LTD3-1 Taylor Rd. Bracebridge ON P1L 1S6David Leeder
Report Date: 25-APR-12Workorder: L1136530
Test Matrix Reference Result Qualifier Units RPD Limit Analyzed
MET-ONT-PWQO-WT Water
R2353816BatchDUP
DUP
WG1459559-4
WG1459561-4
WG1459559-3
WG1459561-3
Zirconium (Zr)
Aluminum (Al)
Antimony (Sb)
Arsenic (As)
Barium (Ba)
Beryllium (Be)
Bismuth (Bi)
Boron (B)
Cadmium (Cd)-Total
Calcium (Ca)
Chromium (Cr)
Cobalt (Co)
Copper (Cu)
Iron (Fe)
Lead (Pb)
Magnesium (Mg)
Manganese (Mn)
Molybdenum (Mo)
Nickel (Ni)
Potassium (K)
Selenium (Se)-Total
Silicon (Si)
Silver (Ag)
Strontium (Sr)
Thallium (Tl)
Tin (Sn)
Titanium (Ti)
Tungsten (W )
Uranium (U)
Vanadium (V)
Zinc (Zn)
Zirconium (Zr)
<0.0040
<0.010
<0.0050
<0.0010
0.025
<0.0010
<0.0010
<0.050
0.000132
18.1
<0.00050
<0.00050
0.0029
0.301
<0.0010
5.93
0.0828
0.0315
<0.0020
2.7
<0.00040
2.1
<0.00010
0.109
<0.00030
<0.0010
<0.0020
<0.010
<0.0050
<0.0010
<0.0030
<0.0040
20-APR-12
20-APR-12
20-APR-12
20-APR-12
20-APR-12
20-APR-12
20-APR-12
20-APR-12
20-APR-12
20-APR-12
20-APR-12
20-APR-12
20-APR-12
20-APR-12
20-APR-12
20-APR-12
20-APR-12
20-APR-12
20-APR-12
20-APR-12
20-APR-12
20-APR-12
20-APR-12
20-APR-12
20-APR-12
20-APR-12
20-APR-12
20-APR-12
20-APR-12
20-APR-12
20-APR-12
20-APR-12
N/A
N/A
N/A
N/A
0.30
N/A
N/A
N/A
0.75
1.9
N/A
N/A
7.3
1.7
N/A
2.0
3.4
6.4
N/A
1.5
N/A
2.1
N/A
5.4
N/A
N/A
N/A
N/A
N/A
N/A
N/A
N/A
20
20
20
20
20
20
20
20
20
20
20
20
20
20
20
20
20
20
20
20
20
20
20
20
20
20
20
20
20
20
20
20
mg/L
mg/L
mg/L
mg/L
mg/L
mg/L
mg/L
mg/L
mg/L
mg/L
mg/L
mg/L
mg/L
mg/L
mg/L
mg/L
mg/L
mg/L
mg/L
mg/L
mg/L
mg/L
mg/L
mg/L
mg/L
mg/L
mg/L
mg/L
mg/L
mg/L
mg/L
mg/L
<0.0040
<0.010
<0.0050
<0.0010
0.025
<0.0010
<0.0010
<0.050
0.000133
18.5
<0.00050
<0.00050
0.0032
0.296
<0.0010
5.82
0.0801
0.0335
<0.0020
2.8
<0.00040
2.1
<0.00010
0.115
<0.00030
<0.0010
<0.0020
<0.010
<0.0050
<0.0010
<0.0030
<0.0040
RPD-NA
RPD-NA
RPD-NA
RPD-NA
RPD-NA
RPD-NA
RPD-NA
RPD-NA
RPD-NA
RPD-NA
RPD-NA
RPD-NA
RPD-NA
RPD-NA
RPD-NA
RPD-NA
RPD-NA
RPD-NA
RPD-NA
RPD-NA
RPD-NA
16
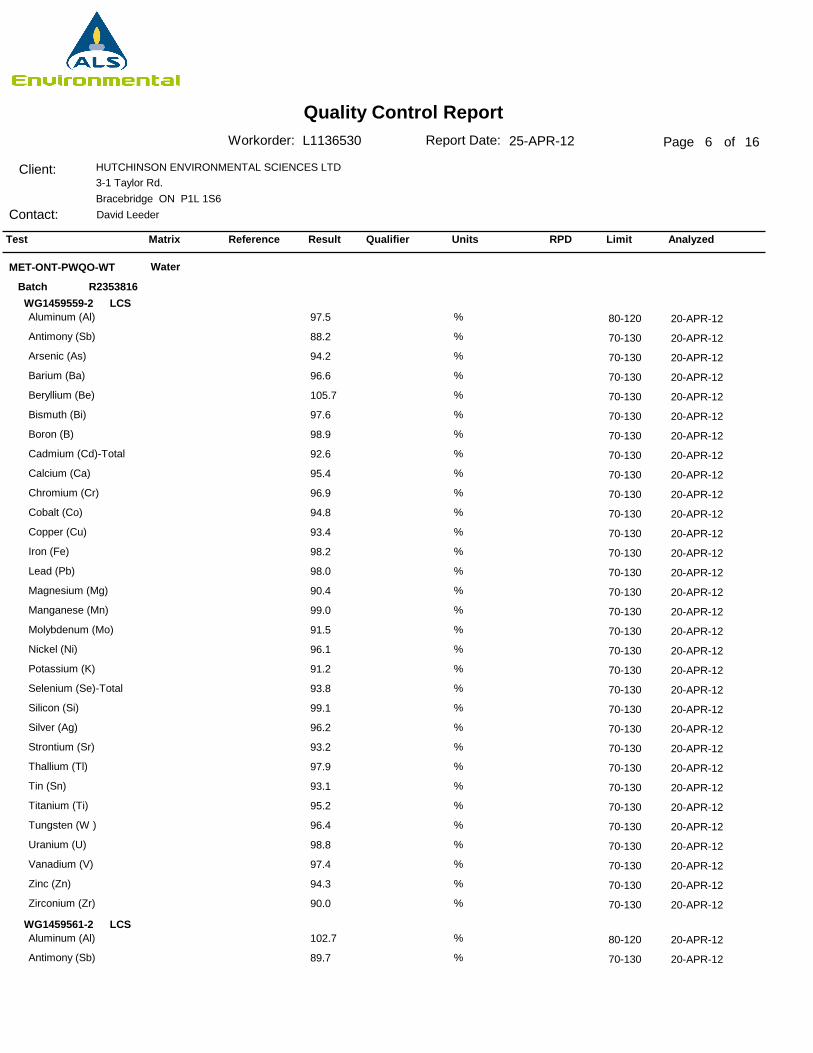
Quality Control ReportPage 6 of
Client:
Contact:
HUTCHINSON ENVIRONMENTAL SCIENCES LTD3-1 Taylor Rd. Bracebridge ON P1L 1S6David Leeder
Report Date: 25-APR-12Workorder: L1136530
Test Matrix Reference Result Qualifier Units RPD Limit Analyzed
MET-ONT-PWQO-WT Water
R2353816BatchLCS
LCS
WG1459559-2
WG1459561-2
Aluminum (Al)
Antimony (Sb)
Arsenic (As)
Barium (Ba)
Beryllium (Be)
Bismuth (Bi)
Boron (B)
Cadmium (Cd)-Total
Calcium (Ca)
Chromium (Cr)
Cobalt (Co)
Copper (Cu)
Iron (Fe)
Lead (Pb)
Magnesium (Mg)
Manganese (Mn)
Molybdenum (Mo)
Nickel (Ni)
Potassium (K)
Selenium (Se)-Total
Silicon (Si)
Silver (Ag)
Strontium (Sr)
Thallium (Tl)
Tin (Sn)
Titanium (Ti)
Tungsten (W )
Uranium (U)
Vanadium (V)
Zinc (Zn)
Zirconium (Zr)
Aluminum (Al)
Antimony (Sb)
97.5
88.2
94.2
96.6
105.7
97.6
98.9
92.6
95.4
96.9
94.8
93.4
98.2
98.0
90.4
99.0
91.5
96.1
91.2
93.8
99.1
96.2
93.2
97.9
93.1
95.2
96.4
98.8
97.4
94.3
90.0
102.7
89.7
20-APR-12
20-APR-12
20-APR-12
20-APR-12
20-APR-12
20-APR-12
20-APR-12
20-APR-12
20-APR-12
20-APR-12
20-APR-12
20-APR-12
20-APR-12
20-APR-12
20-APR-12
20-APR-12
20-APR-12
20-APR-12
20-APR-12
20-APR-12
20-APR-12
20-APR-12
20-APR-12
20-APR-12
20-APR-12
20-APR-12
20-APR-12
20-APR-12
20-APR-12
20-APR-12
20-APR-12
20-APR-12
20-APR-12
80-120
70-130
70-130
70-130
70-130
70-130
70-130
70-130
70-130
70-130
70-130
70-130
70-130
70-130
70-130
70-130
70-130
70-130
70-130
70-130
70-130
70-130
70-130
70-130
70-130
70-130
70-130
70-130
70-130
70-130
70-130
80-120
70-130
%
%
%
%
%
%
%
%
%
%
%
%
%
%
%
%
%
%
%
%
%
%
%
%
%
%
%
%
%
%
%
%
%
16
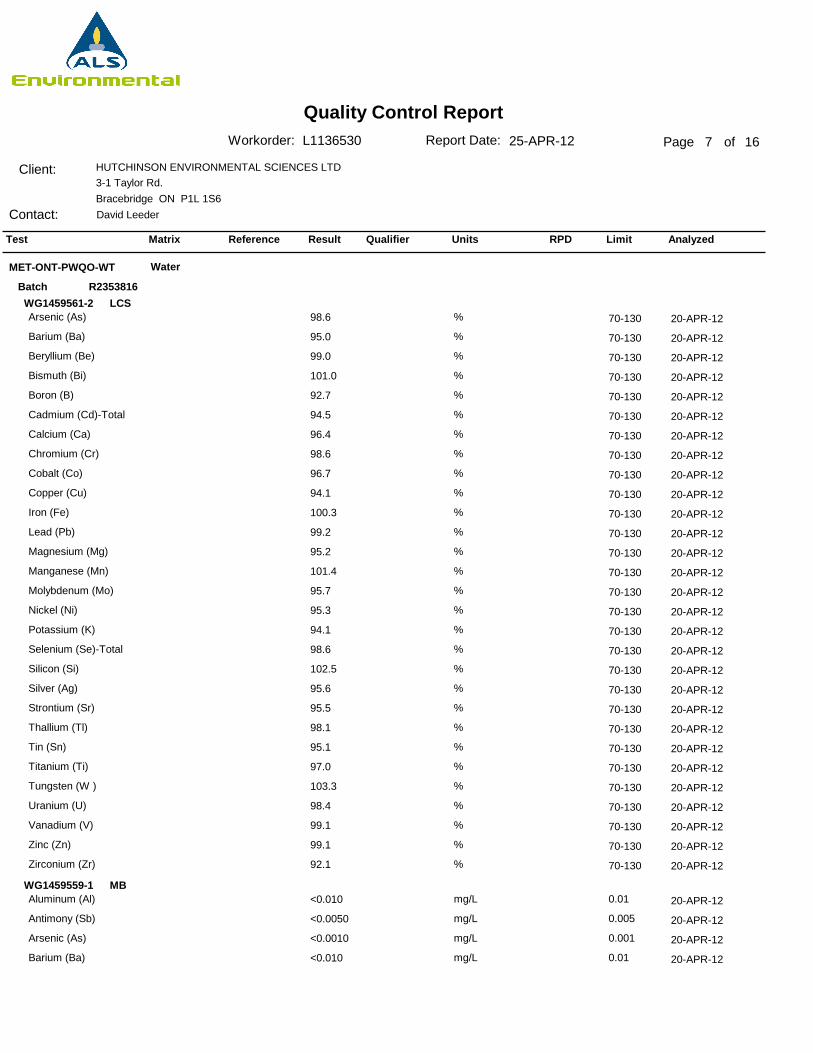
Quality Control ReportPage 7 of
Client:
Contact:
HUTCHINSON ENVIRONMENTAL SCIENCES LTD3-1 Taylor Rd. Bracebridge ON P1L 1S6David Leeder
Report Date: 25-APR-12Workorder: L1136530
Test Matrix Reference Result Qualifier Units RPD Limit Analyzed
MET-ONT-PWQO-WT Water
R2353816BatchLCS
MB
WG1459561-2
WG1459559-1
Arsenic (As)
Barium (Ba)
Beryllium (Be)
Bismuth (Bi)
Boron (B)
Cadmium (Cd)-Total
Calcium (Ca)
Chromium (Cr)
Cobalt (Co)
Copper (Cu)
Iron (Fe)
Lead (Pb)
Magnesium (Mg)
Manganese (Mn)
Molybdenum (Mo)
Nickel (Ni)
Potassium (K)
Selenium (Se)-Total
Silicon (Si)
Silver (Ag)
Strontium (Sr)
Thallium (Tl)
Tin (Sn)
Titanium (Ti)
Tungsten (W )
Uranium (U)
Vanadium (V)
Zinc (Zn)
Zirconium (Zr)
Aluminum (Al)
Antimony (Sb)
Arsenic (As)
Barium (Ba)
98.6
95.0
99.0
101.0
92.7
94.5
96.4
98.6
96.7
94.1
100.3
99.2
95.2
101.4
95.7
95.3
94.1
98.6
102.5
95.6
95.5
98.1
95.1
97.0
103.3
98.4
99.1
99.1
92.1
<0.010
<0.0050
<0.0010
<0.010
20-APR-12
20-APR-12
20-APR-12
20-APR-12
20-APR-12
20-APR-12
20-APR-12
20-APR-12
20-APR-12
20-APR-12
20-APR-12
20-APR-12
20-APR-12
20-APR-12
20-APR-12
20-APR-12
20-APR-12
20-APR-12
20-APR-12
20-APR-12
20-APR-12
20-APR-12
20-APR-12
20-APR-12
20-APR-12
20-APR-12
20-APR-12
20-APR-12
20-APR-12
20-APR-12
20-APR-12
20-APR-12
20-APR-12
70-130
70-130
70-130
70-130
70-130
70-130
70-130
70-130
70-130
70-130
70-130
70-130
70-130
70-130
70-130
70-130
70-130
70-130
70-130
70-130
70-130
70-130
70-130
70-130
70-130
70-130
70-130
70-130
70-130
%
%
%
%
%
%
%
%
%
%
%
%
%
%
%
%
%
%
%
%
%
%
%
%
%
%
%
%
%
mg/L
mg/L
mg/L
mg/L
0.01
0.005
0.001
0.01
16
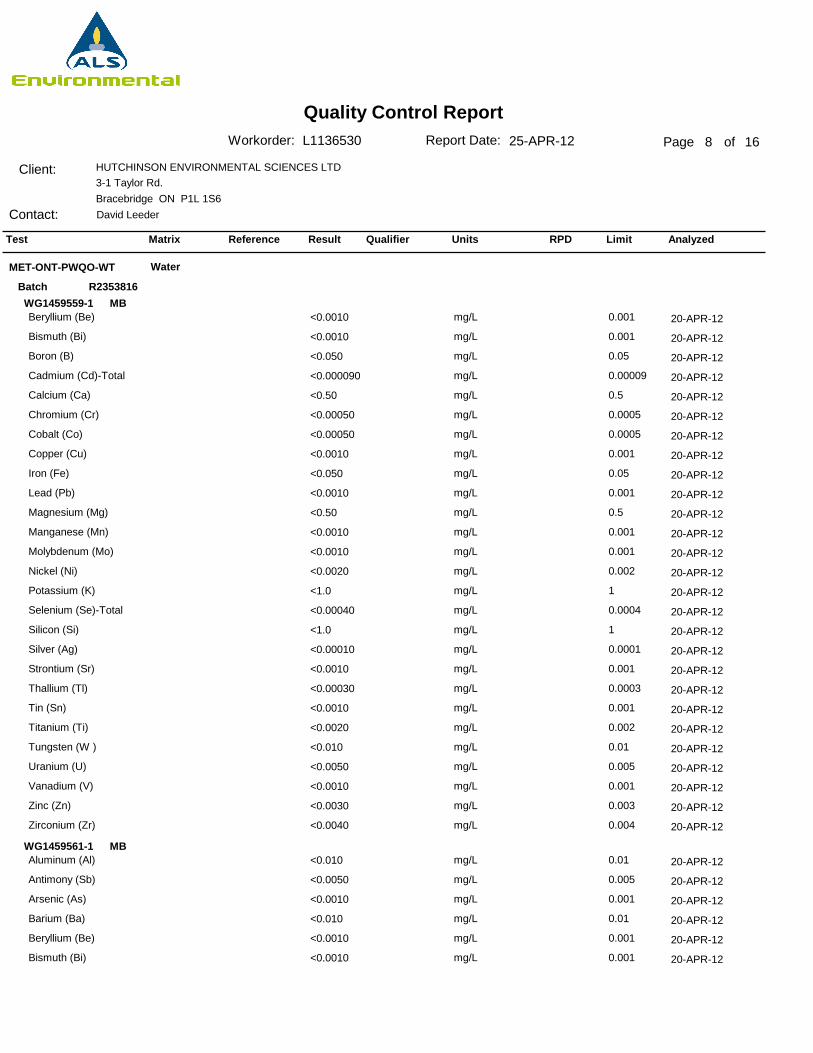
Quality Control ReportPage 8 of
Client:
Contact:
HUTCHINSON ENVIRONMENTAL SCIENCES LTD3-1 Taylor Rd. Bracebridge ON P1L 1S6David Leeder
Report Date: 25-APR-12Workorder: L1136530
Test Matrix Reference Result Qualifier Units RPD Limit Analyzed
MET-ONT-PWQO-WT Water
R2353816BatchMB
MB
WG1459559-1
WG1459561-1
Beryllium (Be)
Bismuth (Bi)
Boron (B)
Cadmium (Cd)-Total
Calcium (Ca)
Chromium (Cr)
Cobalt (Co)
Copper (Cu)
Iron (Fe)
Lead (Pb)
Magnesium (Mg)
Manganese (Mn)
Molybdenum (Mo)
Nickel (Ni)
Potassium (K)
Selenium (Se)-Total
Silicon (Si)
Silver (Ag)
Strontium (Sr)
Thallium (Tl)
Tin (Sn)
Titanium (Ti)
Tungsten (W )
Uranium (U)
Vanadium (V)
Zinc (Zn)
Zirconium (Zr)
Aluminum (Al)
Antimony (Sb)
Arsenic (As)
Barium (Ba)
Beryllium (Be)
Bismuth (Bi)
<0.0010
<0.0010
<0.050
<0.000090
<0.50
<0.00050
<0.00050
<0.0010
<0.050
<0.0010
<0.50
<0.0010
<0.0010
<0.0020
<1.0
<0.00040
<1.0
<0.00010
<0.0010
<0.00030
<0.0010
<0.0020
<0.010
<0.0050
<0.0010
<0.0030
<0.0040
<0.010
<0.0050
<0.0010
<0.010
<0.0010
<0.0010
20-APR-12
20-APR-12
20-APR-12
20-APR-12
20-APR-12
20-APR-12
20-APR-12
20-APR-12
20-APR-12
20-APR-12
20-APR-12
20-APR-12
20-APR-12
20-APR-12
20-APR-12
20-APR-12
20-APR-12
20-APR-12
20-APR-12
20-APR-12
20-APR-12
20-APR-12
20-APR-12
20-APR-12
20-APR-12
20-APR-12
20-APR-12
20-APR-12
20-APR-12
20-APR-12
20-APR-12
20-APR-12
20-APR-12
mg/L
mg/L
mg/L
mg/L
mg/L
mg/L
mg/L
mg/L
mg/L
mg/L
mg/L
mg/L
mg/L
mg/L
mg/L
mg/L
mg/L
mg/L
mg/L
mg/L
mg/L
mg/L
mg/L
mg/L
mg/L
mg/L
mg/L
mg/L
mg/L
mg/L
mg/L
mg/L
mg/L
0.001
0.001
0.05
0.00009
0.5
0.0005
0.0005
0.001
0.05
0.001
0.5
0.001
0.001
0.002
1
0.0004
1
0.0001
0.001
0.0003
0.001
0.002
0.01
0.005
0.001
0.003
0.004
0.01
0.005
0.001
0.01
0.001
0.001
16
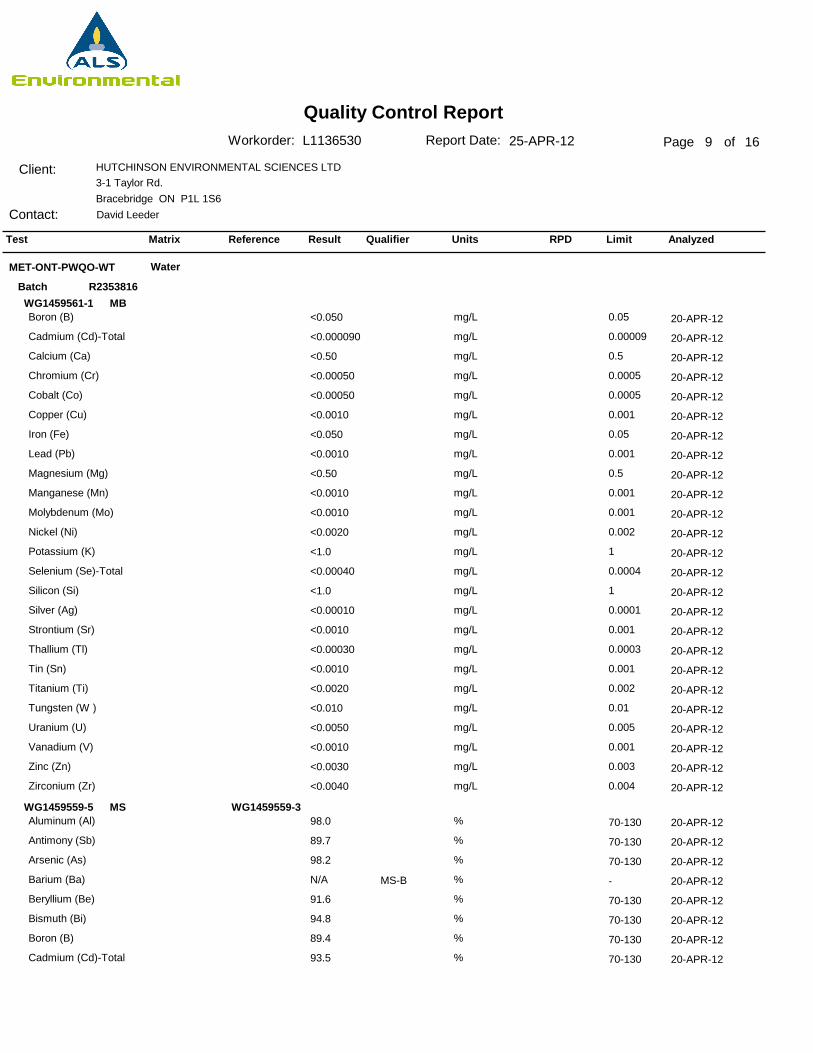
Quality Control ReportPage 9 of
Client:
Contact:
HUTCHINSON ENVIRONMENTAL SCIENCES LTD3-1 Taylor Rd. Bracebridge ON P1L 1S6David Leeder
Report Date: 25-APR-12Workorder: L1136530
Test Matrix Reference Result Qualifier Units RPD Limit Analyzed
MET-ONT-PWQO-WT Water
R2353816BatchMB
MS
WG1459561-1
WG1459559-5 WG1459559-3
Boron (B)
Cadmium (Cd)-Total
Calcium (Ca)
Chromium (Cr)
Cobalt (Co)
Copper (Cu)
Iron (Fe)
Lead (Pb)
Magnesium (Mg)
Manganese (Mn)
Molybdenum (Mo)
Nickel (Ni)
Potassium (K)
Selenium (Se)-Total
Silicon (Si)
Silver (Ag)
Strontium (Sr)
Thallium (Tl)
Tin (Sn)
Titanium (Ti)
Tungsten (W )
Uranium (U)
Vanadium (V)
Zinc (Zn)
Zirconium (Zr)
Aluminum (Al)
Antimony (Sb)
Arsenic (As)
Barium (Ba)
Beryllium (Be)
Bismuth (Bi)
Boron (B)
Cadmium (Cd)-Total
<0.050
<0.000090
<0.50
<0.00050
<0.00050
<0.0010
<0.050
<0.0010
<0.50
<0.0010
<0.0010
<0.0020
<1.0
<0.00040
<1.0
<0.00010
<0.0010
<0.00030
<0.0010
<0.0020
<0.010
<0.0050
<0.0010
<0.0030
<0.0040
98.0
89.7
98.2
N/A
91.6
94.8
89.4
93.5
20-APR-12
20-APR-12
20-APR-12
20-APR-12
20-APR-12
20-APR-12
20-APR-12
20-APR-12
20-APR-12
20-APR-12
20-APR-12
20-APR-12
20-APR-12
20-APR-12
20-APR-12
20-APR-12
20-APR-12
20-APR-12
20-APR-12
20-APR-12
20-APR-12
20-APR-12
20-APR-12
20-APR-12
20-APR-12
20-APR-12
20-APR-12
20-APR-12
20-APR-12
20-APR-12
20-APR-12
20-APR-12
20-APR-12
70-130
70-130
70-130
-
70-130
70-130
70-130
70-130
mg/L
mg/L
mg/L
mg/L
mg/L
mg/L
mg/L
mg/L
mg/L
mg/L
mg/L
mg/L
mg/L
mg/L
mg/L
mg/L
mg/L
mg/L
mg/L
mg/L
mg/L
mg/L
mg/L
mg/L
mg/L
%
%
%
%
%
%
%
%
MS-B
0.05
0.00009
0.5
0.0005
0.0005
0.001
0.05
0.001
0.5
0.001
0.001
0.002
1
0.0004
1
0.0001
0.001
0.0003
0.001
0.002
0.01
0.005
0.001
0.003
0.004
16
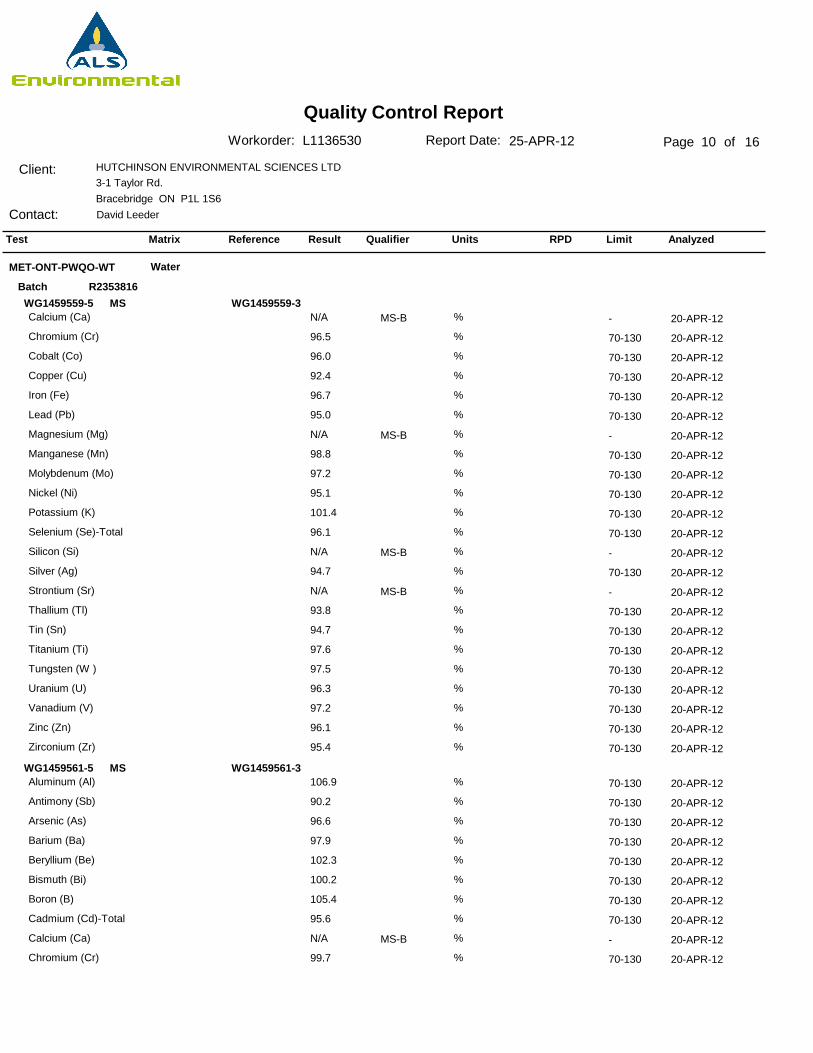
Quality Control ReportPage 10 of
Client:
Contact:
HUTCHINSON ENVIRONMENTAL SCIENCES LTD3-1 Taylor Rd. Bracebridge ON P1L 1S6David Leeder
Report Date: 25-APR-12Workorder: L1136530
Test Matrix Reference Result Qualifier Units RPD Limit Analyzed
MET-ONT-PWQO-WT Water
R2353816BatchMS
MS
WG1459559-5
WG1459561-5
WG1459559-3
WG1459561-3
Calcium (Ca)
Chromium (Cr)
Cobalt (Co)
Copper (Cu)
Iron (Fe)
Lead (Pb)
Magnesium (Mg)
Manganese (Mn)
Molybdenum (Mo)
Nickel (Ni)
Potassium (K)
Selenium (Se)-Total
Silicon (Si)
Silver (Ag)
Strontium (Sr)
Thallium (Tl)
Tin (Sn)
Titanium (Ti)
Tungsten (W )
Uranium (U)
Vanadium (V)
Zinc (Zn)
Zirconium (Zr)
Aluminum (Al)
Antimony (Sb)
Arsenic (As)
Barium (Ba)
Beryllium (Be)
Bismuth (Bi)
Boron (B)
Cadmium (Cd)-Total
Calcium (Ca)
Chromium (Cr)
N/A
96.5
96.0
92.4
96.7
95.0
N/A
98.8
97.2
95.1
101.4
96.1
N/A
94.7
N/A
93.8
94.7
97.6
97.5
96.3
97.2
96.1
95.4
106.9
90.2
96.6
97.9
102.3
100.2
105.4
95.6
N/A
99.7
20-APR-12
20-APR-12
20-APR-12
20-APR-12
20-APR-12
20-APR-12
20-APR-12
20-APR-12
20-APR-12
20-APR-12
20-APR-12
20-APR-12
20-APR-12
20-APR-12
20-APR-12
20-APR-12
20-APR-12
20-APR-12
20-APR-12
20-APR-12
20-APR-12
20-APR-12
20-APR-12
20-APR-12
20-APR-12
20-APR-12
20-APR-12
20-APR-12
20-APR-12
20-APR-12
20-APR-12
20-APR-12
20-APR-12
-
70-130
70-130
70-130
70-130
70-130
-
70-130
70-130
70-130
70-130
70-130
-
70-130
-
70-130
70-130
70-130
70-130
70-130
70-130
70-130
70-130
70-130
70-130
70-130
70-130
70-130
70-130
70-130
70-130
-
70-130
%
%
%
%
%
%
%
%
%
%
%
%
%
%
%
%
%
%
%
%
%
%
%
%
%
%
%
%
%
%
%
%
%
MS-B
MS-B
MS-B
MS-B
MS-B
16
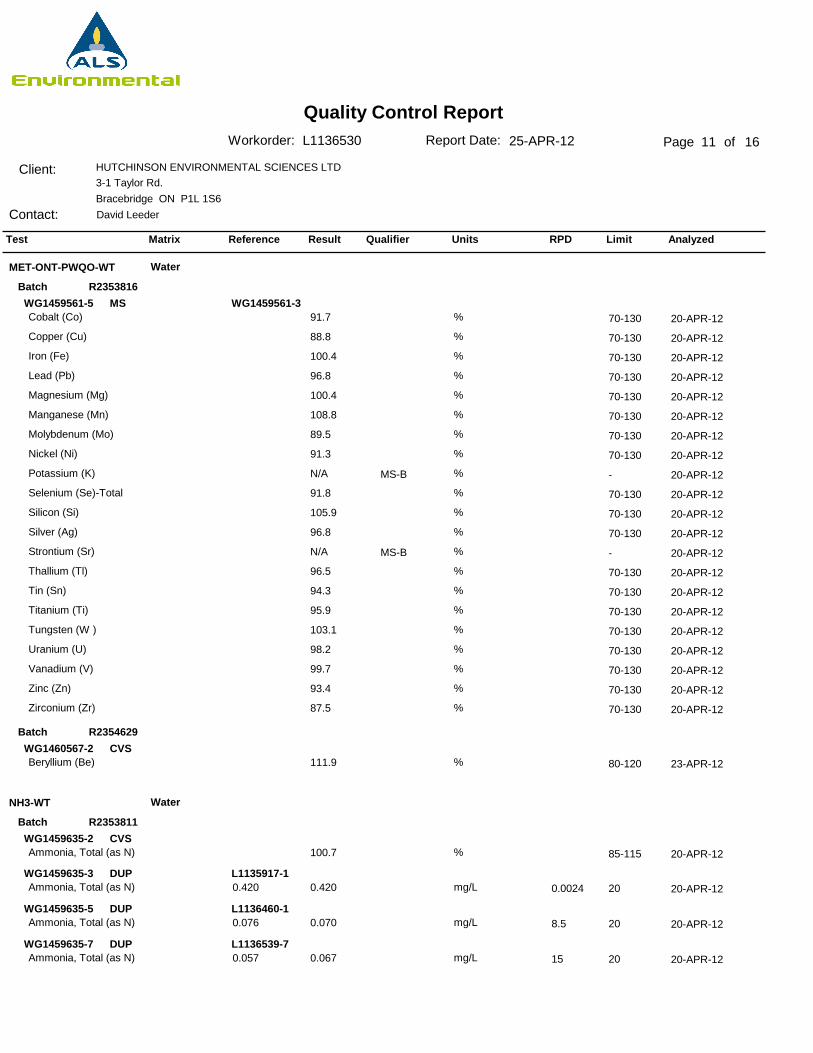
Quality Control ReportPage 11 of
Client:
Contact:
HUTCHINSON ENVIRONMENTAL SCIENCES LTD3-1 Taylor Rd. Bracebridge ON P1L 1S6David Leeder
Report Date: 25-APR-12Workorder: L1136530
Test Matrix Reference Result Qualifier Units RPD Limit Analyzed
MET-ONT-PWQO-WT
NH3-WT
Water
Water
R2353816
R2354629
R2353811
Batch
Batch
Batch
MS
CVS
CVS
DUP
DUP
DUP
WG1459561-5
WG1460567-2
WG1459635-2
WG1459635-3
WG1459635-5
WG1459635-7
WG1459561-3
L1135917-1
L1136460-1
L1136539-7
Cobalt (Co)
Copper (Cu)
Iron (Fe)
Lead (Pb)
Magnesium (Mg)
Manganese (Mn)
Molybdenum (Mo)
Nickel (Ni)
Potassium (K)
Selenium (Se)-Total
Silicon (Si)
Silver (Ag)
Strontium (Sr)
Thallium (Tl)
Tin (Sn)
Titanium (Ti)
Tungsten (W )
Uranium (U)
Vanadium (V)
Zinc (Zn)
Zirconium (Zr)
Beryllium (Be)
Ammonia, Total (as N)
Ammonia, Total (as N)
Ammonia, Total (as N)
Ammonia, Total (as N)
91.7
88.8
100.4
96.8
100.4
108.8
89.5
91.3
N/A
91.8
105.9
96.8
N/A
96.5
94.3
95.9
103.1
98.2
99.7
93.4
87.5
111.9
100.7
0.420
0.070
0.067
20-APR-12
20-APR-12
20-APR-12
20-APR-12
20-APR-12
20-APR-12
20-APR-12
20-APR-12
20-APR-12
20-APR-12
20-APR-12
20-APR-12
20-APR-12
20-APR-12
20-APR-12
20-APR-12
20-APR-12
20-APR-12
20-APR-12
20-APR-12
20-APR-12
23-APR-12
20-APR-12
20-APR-12
20-APR-12
20-APR-12
0.0024
8.5
15
20
20
20
70-130
70-130
70-130
70-130
70-130
70-130
70-130
70-130
-
70-130
70-130
70-130
-
70-130
70-130
70-130
70-130
70-130
70-130
70-130
70-130
80-120
85-115
%
%
%
%
%
%
%
%
%
%
%
%
%
%
%
%
%
%
%
%
%
%
%
mg/L
mg/L
mg/L
MS-B
MS-B
0.420
0.076
0.057
16
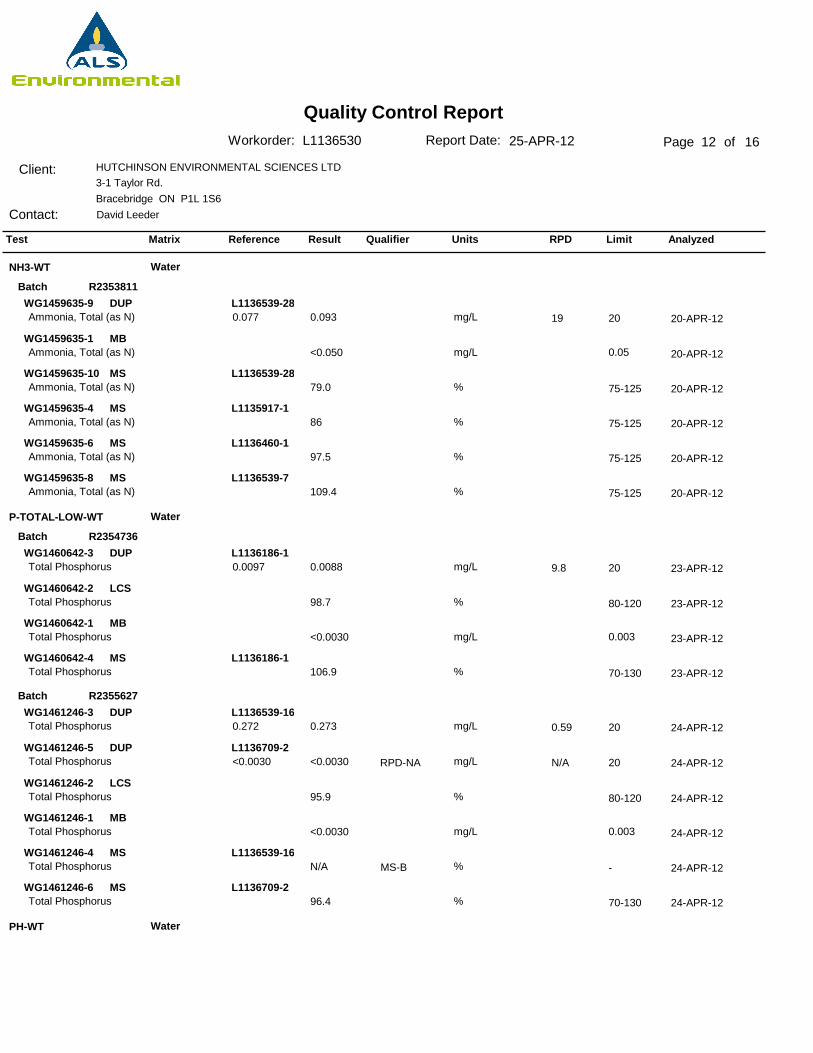
Quality Control ReportPage 12 of
Client:
Contact:
HUTCHINSON ENVIRONMENTAL SCIENCES LTD3-1 Taylor Rd. Bracebridge ON P1L 1S6David Leeder
Report Date: 25-APR-12Workorder: L1136530
Test Matrix Reference Result Qualifier Units RPD Limit Analyzed
NH3-WT
P-TOTAL-LOW-WT
PH-WT
Water
Water
Water
R2353811
R2354736
R2355627
Batch
Batch
Batch
DUP
MB
MS
MS
MS
MS
DUP
LCS
MB
MS
DUP
DUP
LCS
MB
MS
MS
WG1459635-9
WG1459635-1
WG1459635-10
WG1459635-4
WG1459635-6
WG1459635-8
WG1460642-3
WG1460642-2
WG1460642-1
WG1460642-4
WG1461246-3
WG1461246-5
WG1461246-2
WG1461246-1
WG1461246-4
WG1461246-6
L1136539-28
L1136539-28
L1135917-1
L1136460-1
L1136539-7
L1136186-1
L1136186-1
L1136539-16
L1136709-2
L1136539-16
L1136709-2
Ammonia, Total (as N)
Ammonia, Total (as N)
Ammonia, Total (as N)
Ammonia, Total (as N)
Ammonia, Total (as N)
Ammonia, Total (as N)
Total Phosphorus
Total Phosphorus
Total Phosphorus
Total Phosphorus
Total Phosphorus
Total Phosphorus
Total Phosphorus
Total Phosphorus
Total Phosphorus
Total Phosphorus
0.093
<0.050
79.0
86
97.5
109.4
0.0088
98.7
<0.0030
106.9
0.273
<0.0030
95.9
<0.0030
N/A
96.4
20-APR-12
20-APR-12
20-APR-12
20-APR-12
20-APR-12
20-APR-12
23-APR-12
23-APR-12
23-APR-12
23-APR-12
24-APR-12
24-APR-12
24-APR-12
24-APR-12
24-APR-12
24-APR-12
19
9.8
0.59
N/A
20
20
20
20
75-125
75-125
75-125
75-125
80-120
70-130
80-120
-
70-130
mg/L
mg/L
%
%
%
%
mg/L
%
mg/L
%
mg/L
mg/L
%
mg/L
%
%
MS-B
0.077
0.0097
0.272
<0.0030
0.05
0.003
0.003
RPD-NA
16
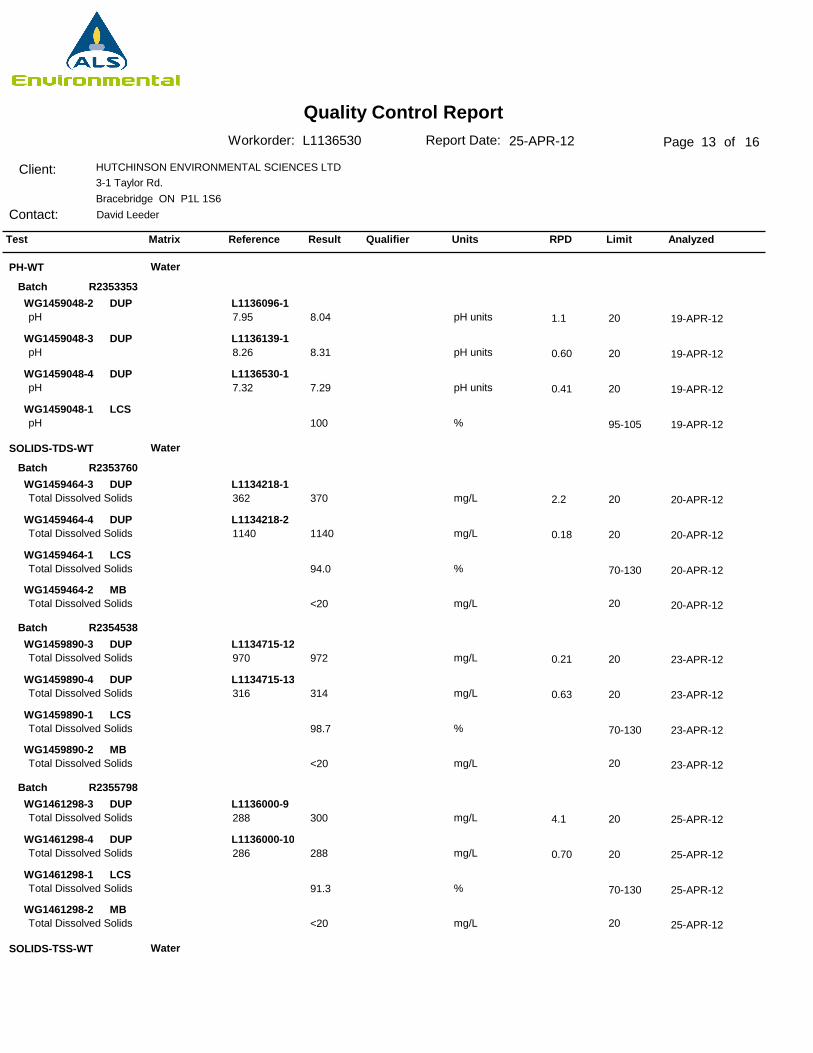
Quality Control ReportPage 13 of
Client:
Contact:
HUTCHINSON ENVIRONMENTAL SCIENCES LTD3-1 Taylor Rd. Bracebridge ON P1L 1S6David Leeder
Report Date: 25-APR-12Workorder: L1136530
Test Matrix Reference Result Qualifier Units RPD Limit Analyzed
PH-WT
SOLIDS-TDS-WT
SOLIDS-TSS-WT
Water
Water
Water
R2353353
R2353760
R2354538
R2355798
Batch
Batch
Batch
Batch
DUP
DUP
DUP
LCS
DUP
DUP
LCS
MB
DUP
DUP
LCS
MB
DUP
DUP
LCS
MB
WG1459048-2
WG1459048-3
WG1459048-4
WG1459048-1
WG1459464-3
WG1459464-4
WG1459464-1
WG1459464-2
WG1459890-3
WG1459890-4
WG1459890-1
WG1459890-2
WG1461298-3
WG1461298-4
WG1461298-1
WG1461298-2
L1136096-1
L1136139-1
L1136530-1
L1134218-1
L1134218-2
L1134715-12
L1134715-13
L1136000-9
L1136000-10
pH
pH
pH
pH
Total Dissolved Solids
Total Dissolved Solids
Total Dissolved Solids
Total Dissolved Solids
Total Dissolved Solids
Total Dissolved Solids
Total Dissolved Solids
Total Dissolved Solids
Total Dissolved Solids
Total Dissolved Solids
Total Dissolved Solids
Total Dissolved Solids
8.04
8.31
7.29
100
370
1140
94.0
<20
972
314
98.7
<20
300
288
91.3
<20
19-APR-12
19-APR-12
19-APR-12
19-APR-12
20-APR-12
20-APR-12
20-APR-12
20-APR-12
23-APR-12
23-APR-12
23-APR-12
23-APR-12
25-APR-12
25-APR-12
25-APR-12
25-APR-12
1.1
0.60
0.41
2.2
0.18
0.21
0.63
4.1
0.70
20
20
20
20
20
20
20
20
20
95-105
70-130
70-130
70-130
pH units
pH units
pH units
%
mg/L
mg/L
%
mg/L
mg/L
mg/L
%
mg/L
mg/L
mg/L
%
mg/L
7.95
8.26
7.32
362
1140
970
316
288
286
20
20
20
16
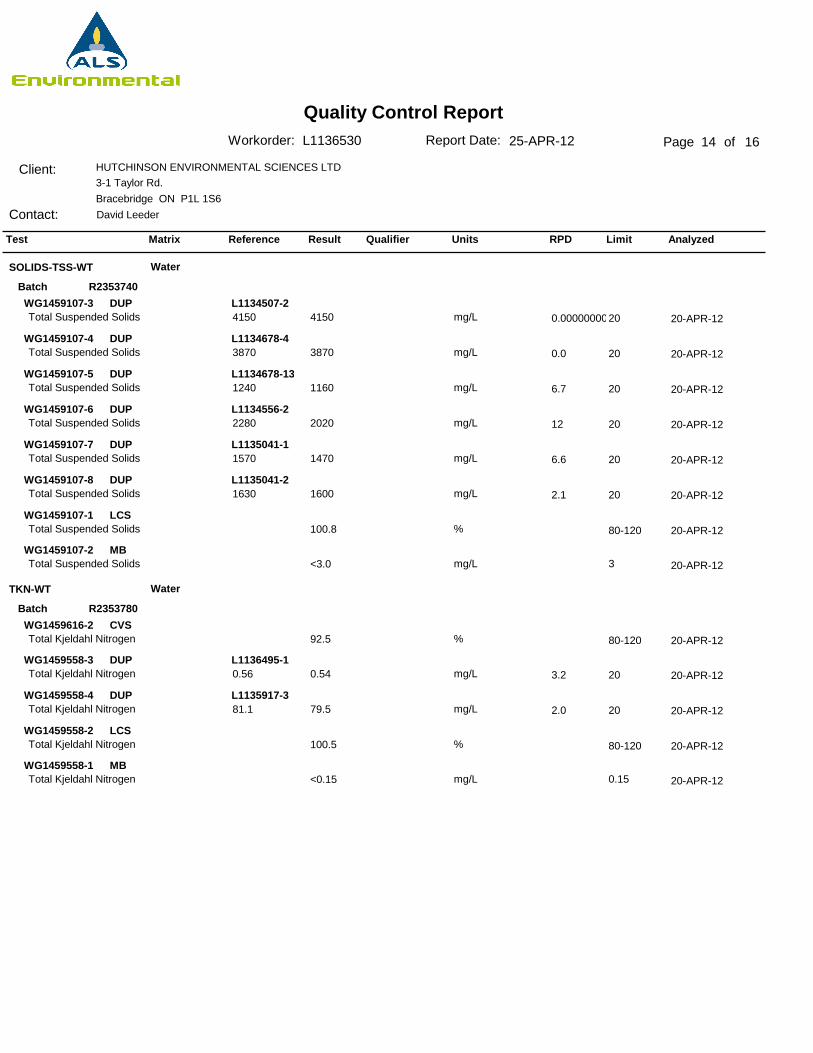
Quality Control ReportPage 14 of
Client:
Contact:
HUTCHINSON ENVIRONMENTAL SCIENCES LTD3-1 Taylor Rd. Bracebridge ON P1L 1S6David Leeder
Report Date: 25-APR-12Workorder: L1136530
Test Matrix Reference Result Qualifier Units RPD Limit Analyzed
SOLIDS-TSS-WT
TKN-WT
Water
Water
R2353740
R2353780
Batch
Batch
DUP
DUP
DUP
DUP
DUP
DUP
LCS
MB
CVS
DUP
DUP
LCS
MB
WG1459107-3
WG1459107-4
WG1459107-5
WG1459107-6
WG1459107-7
WG1459107-8
WG1459107-1
WG1459107-2
WG1459616-2
WG1459558-3
WG1459558-4
WG1459558-2
WG1459558-1
L1134507-2
L1134678-4
L1134678-13
L1134556-2
L1135041-1
L1135041-2
L1136495-1
L1135917-3
Total Suspended Solids
Total Suspended Solids
Total Suspended Solids
Total Suspended Solids
Total Suspended Solids
Total Suspended Solids
Total Suspended Solids
Total Suspended Solids
Total Kjeldahl Nitrogen
Total Kjeldahl Nitrogen
Total Kjeldahl Nitrogen
Total Kjeldahl Nitrogen
Total Kjeldahl Nitrogen
4150
3870
1160
2020
1470
1600
100.8
<3.0
92.5
0.54
79.5
100.5
<0.15
20-APR-12
20-APR-12
20-APR-12
20-APR-12
20-APR-12
20-APR-12
20-APR-12
20-APR-12
20-APR-12
20-APR-12
20-APR-12
20-APR-12
20-APR-12
0.00000000
0.0
6.7
12
6.6
2.1
3.2
2.0
20
20
20
20
20
20
20
20
80-120
80-120
80-120
mg/L
mg/L
mg/L
mg/L
mg/L
mg/L
%
mg/L
%
mg/L
mg/L
%
mg/L
4150
3870
1240
2280
1570
1630
0.56
81.1
3
0.15
16
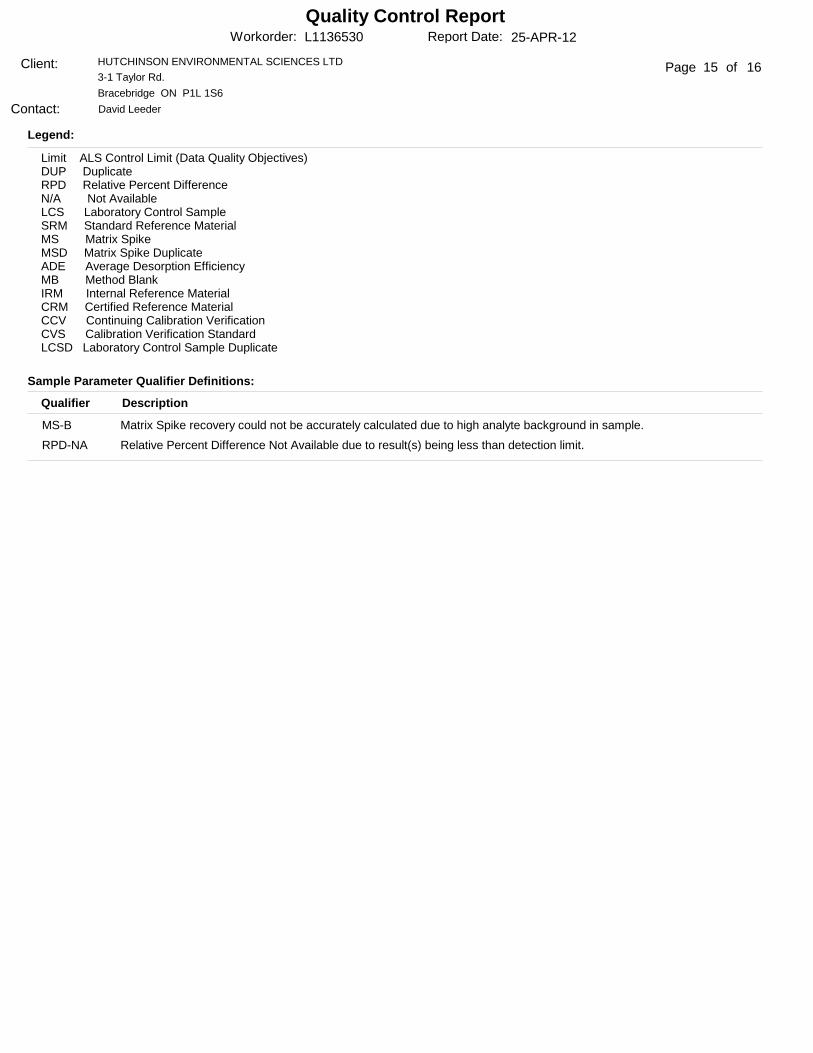
Quality Control Report
Page 15 of
Report Date: 25-APR-12Workorder: L1136530
Sample Parameter Qualifier Definitions:
Description Qualifier
MS-B
RPD-NA
Matrix Spike recovery could not be accurately calculated due to high analyte background in sample.
Relative Percent Difference Not Available due to result(s) being less than detection limit.
Limit ALS Control Limit (Data Quality Objectives)DUP DuplicateRPD Relative Percent DifferenceN/A Not AvailableLCS Laboratory Control SampleSRM Standard Reference MaterialMS Matrix SpikeMSD Matrix Spike DuplicateADE Average Desorption EfficiencyMB Method BlankIRM Internal Reference MaterialCRM Certified Reference MaterialCCV Continuing Calibration VerificationCVS Calibration Verification StandardLCSD Laboratory Control Sample Duplicate
Legend:
Client:
Contact:
HUTCHINSON ENVIRONMENTAL SCIENCES LTD3-1 Taylor Rd. Bracebridge ON P1L 1S6David Leeder
16
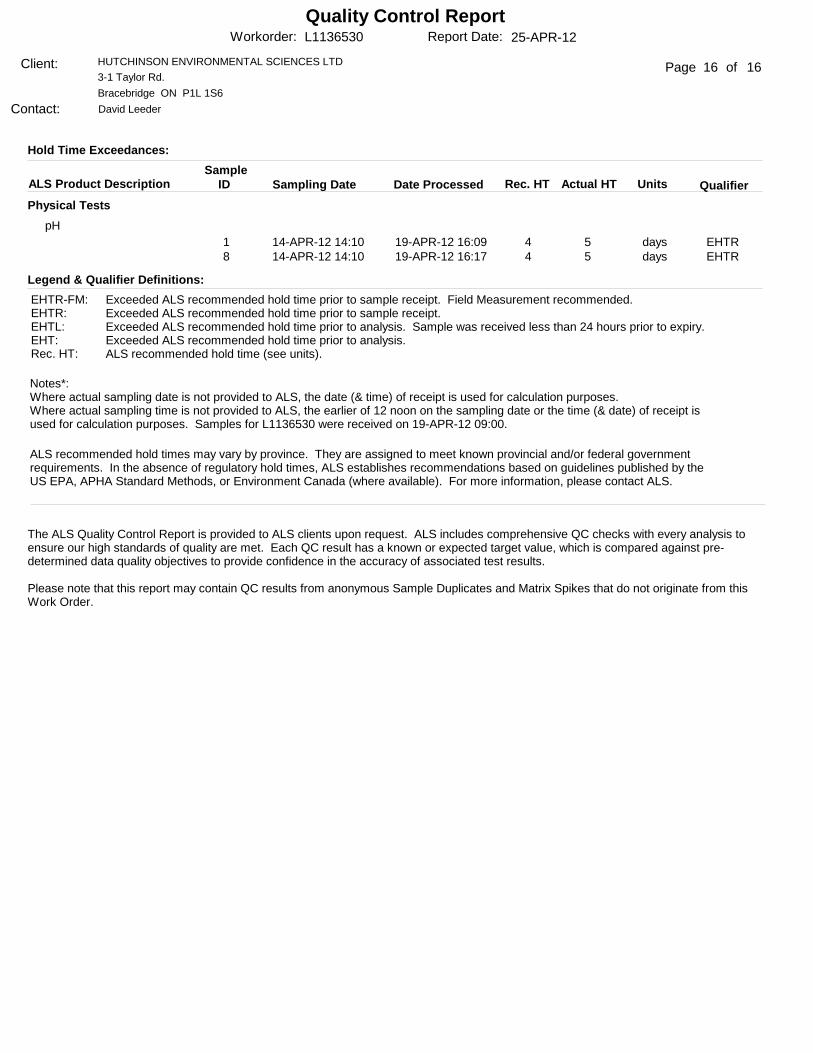
Quality Control Report
Page 16 of
Report Date: 25-APR-12Workorder: L1136530
ALS Product Description Sample
ID Sampling Date Date Processed Rec. HT Actual HT
Physical Tests
18
14-APR-12 14:1014-APR-12 14:10
19-APR-12 16:0919-APR-12 16:17
44
55
pHEHTREHTR
Qualifier
Legend & Qualifier Definitions:
The ALS Quality Control Report is provided to ALS clients upon request. ALS includes comprehensive QC checks with every analysis to ensure our high standards of quality are met. Each QC result has a known or expected target value, which is compared against pre-determined data quality objectives to provide confidence in the accuracy of associated test results.
Please note that this report may contain QC results from anonymous Sample Duplicates and Matrix Spikes that do not originate from this Work Order.
Hold Time Exceedances:
Units
daysdays
EHTR-FM: EHTR: EHTL: EHT: Rec. HT:
Exceeded ALS recommended hold time prior to sample receipt. Field Measurement recommended.Exceeded ALS recommended hold time prior to sample receipt.Exceeded ALS recommended hold time prior to analysis. Sample was received less than 24 hours prior to expiry.Exceeded ALS recommended hold time prior to analysis.ALS recommended hold time (see units).
Notes*:Where actual sampling date is not provided to ALS, the date (& time) of receipt is used for calculation purposes.Where actual sampling time is not provided to ALS, the earlier of 12 noon on the sampling date or the time (& date) of receipt isused for calculation purposes. Samples for L1136530 were received on 19-APR-12 09:00.
ALS recommended hold times may vary by province. They are assigned to meet known provincial and/or federal governmentrequirements. In the absence of regulatory hold times, ALS establishes recommendations based on guidelines published by theUS EPA, APHA Standard Methods, or Environment Canada (where available). For more information, please contact ALS.
Client:
Contact:
HUTCHINSON ENVIRONMENTAL SCIENCES LTD3-1 Taylor Rd. Bracebridge ON P1L 1S6David Leeder
16
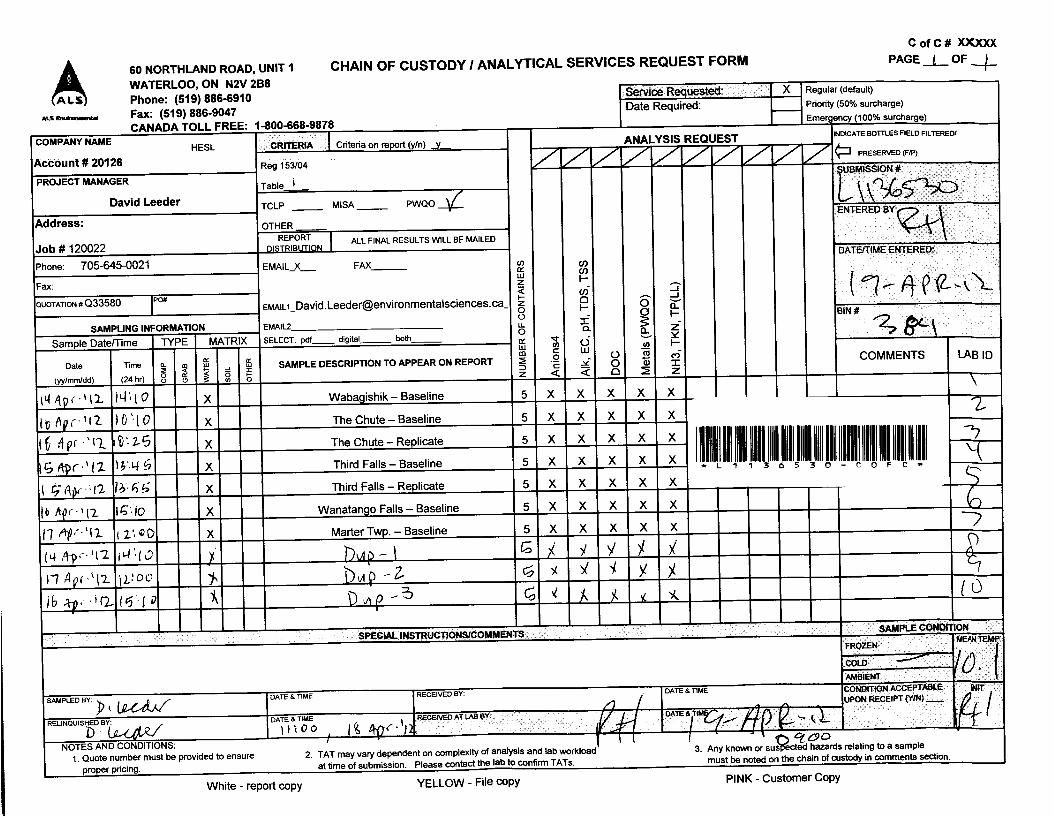
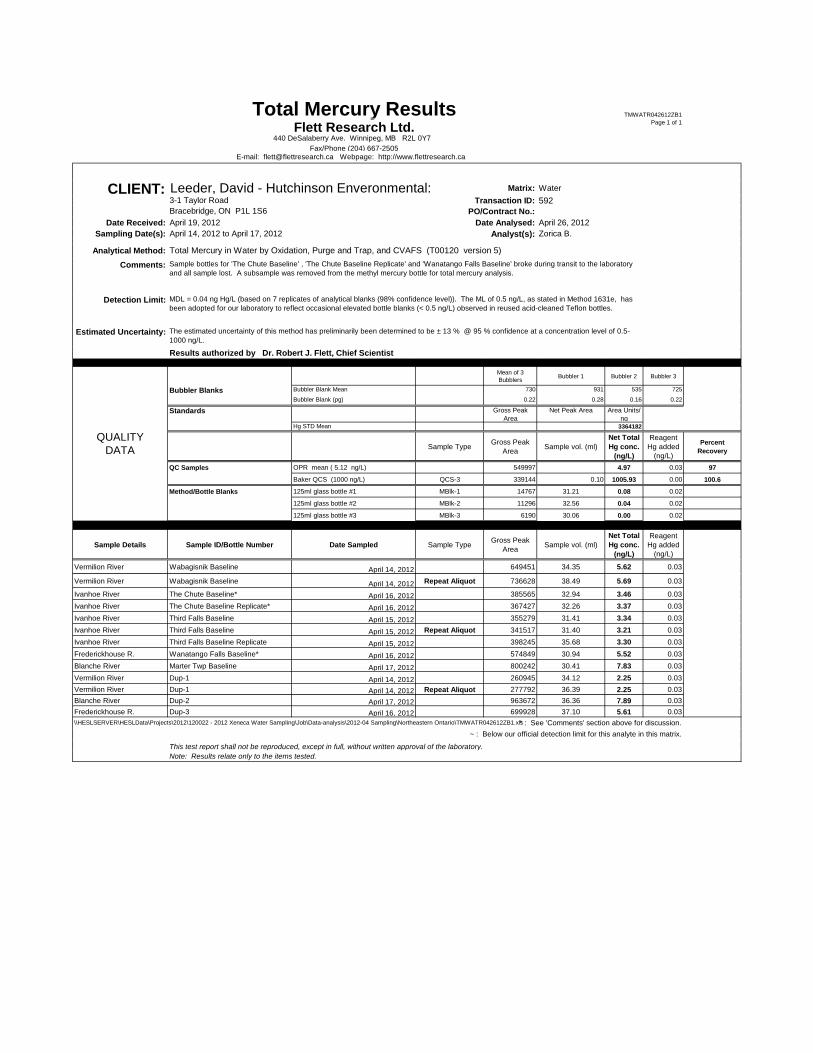
Total Mercury Results TMWATR042612ZB1
Flett Research Ltd.Page 1 of 1
440 DeSalaberry Ave. Winnipeg, MB R2L 0Y7
Fax/Phone (204) 667-2505E-mail: [email protected] Webpage: http://www.flettresearch.ca
CLIENT: Leeder, David - Hutchinson Enveronmental: Matrix: Water
Transaction ID: 592
PO/Contract No.:
Date Received: April 19, 2012 Date Analysed: April 26, 2012
Sampling Date(s): April 14, 2012 to April 17, 2012 Analyst(s): Zorica B.
Analytical Method:
Comments:
Detection Limit:
Estimated Uncertainty:
Results authorized by Dr. Robert J. Flett, Chief Scientist
Mean of 3
BubblersBubbler 1 Bubbler 2 Bubbler 3
Bubbler Blanks Bubbler Blank Mean 730 931 535 725
Bubbler Blank (pg) 0.22 0.28 0.16 0.22
Standards Gross Peak
Area
Net Peak Area Area Units/
ngHg STD Mean 3364182
Sample TypeGross Peak
AreaSample vol. (ml)
Net Total
Hg conc.
(ng/L)
Reagent
Hg added
(ng/L)
Percent
Recovery
QC Samples OPR mean ( 5.12 ng/L) 549997 4.97 0.03 97
Baker QCS (1000 ng/L) QCS-3 339144 0.10 1005.93 0.00 100.6
Method/Bottle Blanks 125ml glass bottle #1 MBlk-1 14767 31.21 0.08 0.02
125ml glass bottle #2 MBlk-2 11296 32.56 0.04 0.02
125ml glass bottle #3 MBlk-3 6190 30.06 0.00 0.02
Sample Details Sample ID/Bottle Number Date Sampled Sample TypeGross Peak
AreaSample vol. (ml)
Net Total
Hg conc.
(ng/L)
Reagent
Hg added
(ng/L)
Vermilion River Wabagisnik Baseline April 14, 2012 649451 34.35 5.62 0.03
Vermilion River Wabagisnik Baseline April 14, 2012 Repeat Aliquot 736628 38.49 5.69 0.03
Ivanhoe River The Chute Baseline* April 16, 2012 385565 32.94 3.46 0.03
Ivanhoe River The Chute Baseline Replicate* April 16, 2012 367427 32.26 3.37 0.03
Ivanhoe River Third Falls Baseline April 15, 2012 355279 31.41 3.34 0.03
Ivanhoe River Third Falls Baseline April 15, 2012 Repeat Aliquot 341517 31.40 3.21 0.03
Ivanhoe River Third Falls Baseline Replicate April 15, 2012 398245 35.68 3.30 0.03
Frederickhouse R. Wanatango Falls Baseline* April 16, 2012 574849 30.94 5.52 0.03
Blanche River Marter Twp Baseline April 17, 2012 800242 30.41 7.83 0.03
Vermilion River Dup-1 April 14, 2012 260945 34.12 2.25 0.03
Vermilion River Dup-1 April 14, 2012 Repeat Aliquot 277792 36.39 2.25 0.03
Blanche River Dup-2 April 17, 2012 963672 36.36 7.89 0.03
Frederickhouse R. Dup-3 April 16, 2012 699928 37.10 5.61 0.03
\\HESLSERVER\HESLData\Projects\2012\120022 - 2012 Xeneca Water Sampling\Job\Data-analysis\2012-04 Sampling\Northeastern Ontario\TMWATR042612ZB1.xls * : See 'Comments' section above for discussion.
~ : Below our official detection limit for this analyte in this matrix.
This test report shall not be reproduced, except in full, without written approval of the laboratory.
Note: Results relate only to the items tested.
QUALITY
DATA
3-1 Taylor Road
Bracebridge, ON P1L 1S6
The estimated uncertainty of this method has preliminarily been determined to be ± 13 % @ 95 % confidence at a concentration level of 0.5-
1000 ng/L.
Total Mercury in Water by Oxidation, Purge and Trap, and CVAFS (T00120 version 5)
MDL = 0.04 ng Hg/L (based on 7 replicates of analytical blanks (98% confidence level)). The ML of 0.5 ng/L, as stated in Method 1631e, has
been adopted for our laboratory to reflect occasional elevated bottle blanks (< 0.5 ng/L) observed in reused acid-cleaned Teflon bottles.
Sample bottles for 'The Chute Baseline' , 'The Chute Baseline Replicate' and 'Wanatango Falls Baseline' broke during transit to the laboratory
and all sample lost. A subsample was removed from the methyl mercury bottle for total mercury analysis.
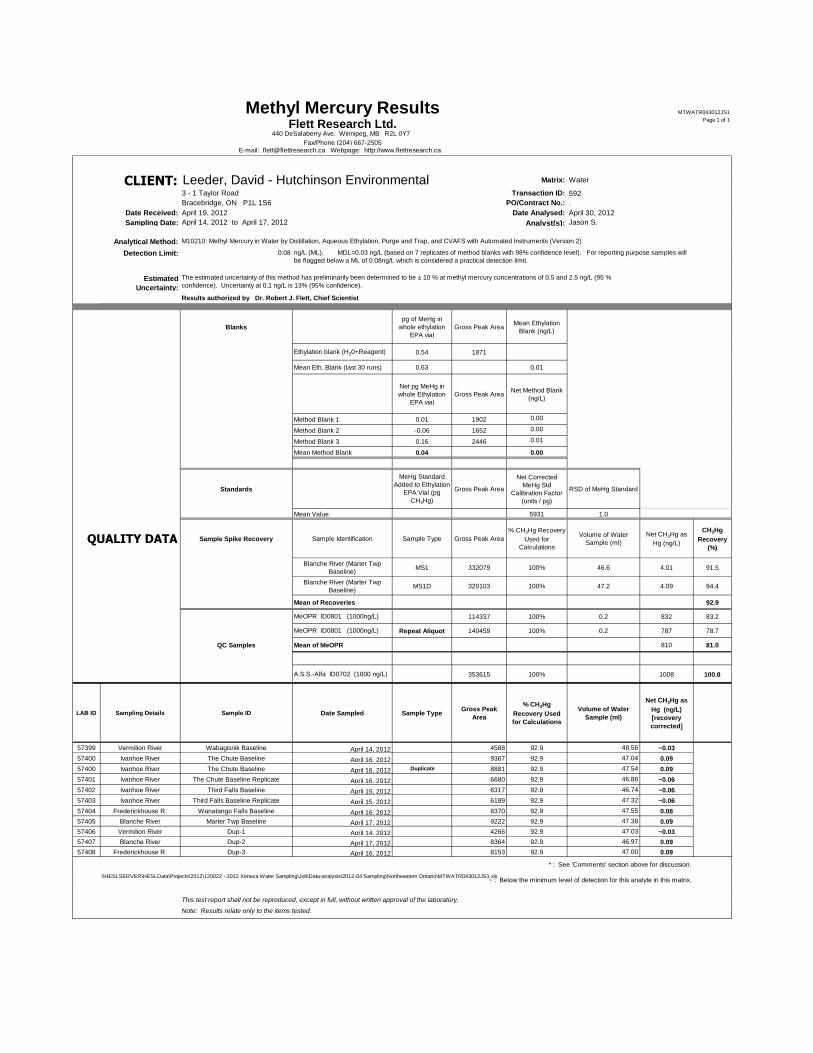
Methyl Mercury Results MTWATR043012JS1
Flett Research Ltd.Page 1 of 1
440 DeSalaberry Ave. Winnipeg, MB R2L 0Y7
Fax/Phone (204) 667-2505E-mail: [email protected] Webpage: http://www.flettresearch.ca
CLIENT: Leeder, David - Hutchinson Environmental Matrix: Water
3 - 1 Taylor Road Transaction ID: 592
Bracebridge, ON P1L 1S6 PO/Contract No.: .
Date Received: April 19, 2012 Date Analysed: April 30, 2012
Sampling Date: April 14, 2012 to April 17, 2012 Analyst(s): Jason S.
Analytical Method:
Detection Limit: 0.08
Estimated
Uncertainty:
Results authorized by Dr. Robert J. Flett, Chief Scientist
Blanks
pg of MeHg in
whole ethylation
EPA vial
Gross Peak AreaMean Ethylation
Blank (ng/L)
Ethylation blank (H20+Reagent) 0.54 1871
Mean Eth. Blank (last 30 runs) 0.63 0.01
Net pg MeHg in
whole Ethylation
EPA vial
Gross Peak AreaNet Method Blank
(ng/L)
Method Blank 1 0.01 1902 0.00
Method Blank 2 -0.06 1652 0.00
Method Blank 3 0.16 2446 0.01
Mean Method Blank 0.04 0.00
Standards
MeHg Standard
Added to Ethylation
EPA Vial (pg
CH3Hg)
Gross Peak Area
Net Corrected
MeHg Std
Calibration Factor
(units / pg)
RSD of MeHg Standard
Mean Value 5931 1.0
QUALITY DATA Sample Spike Recovery Sample Identification Sample Type Gross Peak Area
% CH3Hg Recovery
Used for
Calculations
Volume of Water
Sample (ml)
Net CH3Hg as
Hg (ng/L)
CH3Hg
Recovery
(%)
Blanche River (Marter Twp
Baseline)MS1 332079 100% 46.6 4.01 91.5
Blanche River (Marter Twp
Baseline)MS1D 320103 100% 47.2 4.09 94.4
Mean of Recoveries 92.9
MeOPR ID0801 (1000ng/L) 114337 100% 0.2 832 83.2
MeOPR ID0801 (1000ng/L) Repeat Aliquot 140459 100% 0.2 787 78.7
QC Samples Mean of MeOPR 810 81.0
A.S.S.-Alfa ID0702 (1000 ng/L) 353615 100% 1008 100.8
LAB ID Sampling Details Sample ID Date Sampled Sample TypeGross Peak
Area
% CH3Hg
Recovery Used
for Calculations
Volume of Water
Sample (ml)
Net CH3Hg as
Hg (ng/L)
[recovery
corrected]
57399 Vermilion River Wabagisnik Baseline April 14, 2012 4588 92.9 48.56 ~0.03
57400 Ivanhoe River The Chute Baseline April 16, 2012 9367 92.9 47.04 0.09
57400 Ivanhoe River The Chute Baseline April 16, 2012 Duplicate 8881 92.9 47.54 0.09
57401 Ivanhoe River The Chute Baseline Replicate April 16, 2012 6680 92.9 46.86 ~0.06
57402 Ivanhoe River Third Falls Baseline April 15, 2012 6317 92.9 46.74 ~0.06
57403 Ivanhoe River Third Falls Baseline Replicate April 15, 2012 6189 92.9 47.32 ~0.06
57404 Frederickhouse R. Wanatango Falls Baseline April 16, 2012 8370 92.9 47.55 0.08
57405 Blanche River Marter Twp Baseline April 17, 2012 9222 92.9 47.38 0.09
57406 Vermilion River Dup-1 April 14, 2012 4266 92.9 47.03 ~0.03
57407 Blanche River Dup-2 April 17, 2012 8364 92.9 46.97 0.09
57408 Frederickhouse R. Dup-3 April 16, 2012 8153 92.9 47.00 0.09
* : See 'Comments' section above for discussion.
\\HESLSERVER\HESLData\Projects\2012\120022 - 2012 Xeneca Water Sampling\Job\Data-analysis\2012-04 Sampling\Northeastern Ontario\MTWATR043012JS1.xls ~ : Below the minimum level of detection for this analyte in this matrix.
This test report shall not be reproduced, except in full, without written approval of the laboratory.
Note: Results relate only to the items tested.
The estimated uncertainty of this method has preliminarily been determined to be ± 10 % at methyl mercury concentrations of 0.5 and 2.5 ng/L (95 %
confidence). Uncertainty at 0.1 ng/L is 13% (95% confidence).
M10210: Methyl Mercury in Water by Distillation, Aqueous Ethylation, Purge and Trap, and CVAFS with Automated Instruments (Version 2)
ng/L (ML), MDL=0.03 ng/L (based on 7 replicates of method blanks with 98% confidence level). For reporting purpose samples will
be flagged below a ML of 0.08ng/L which is considered a practical detection limit.
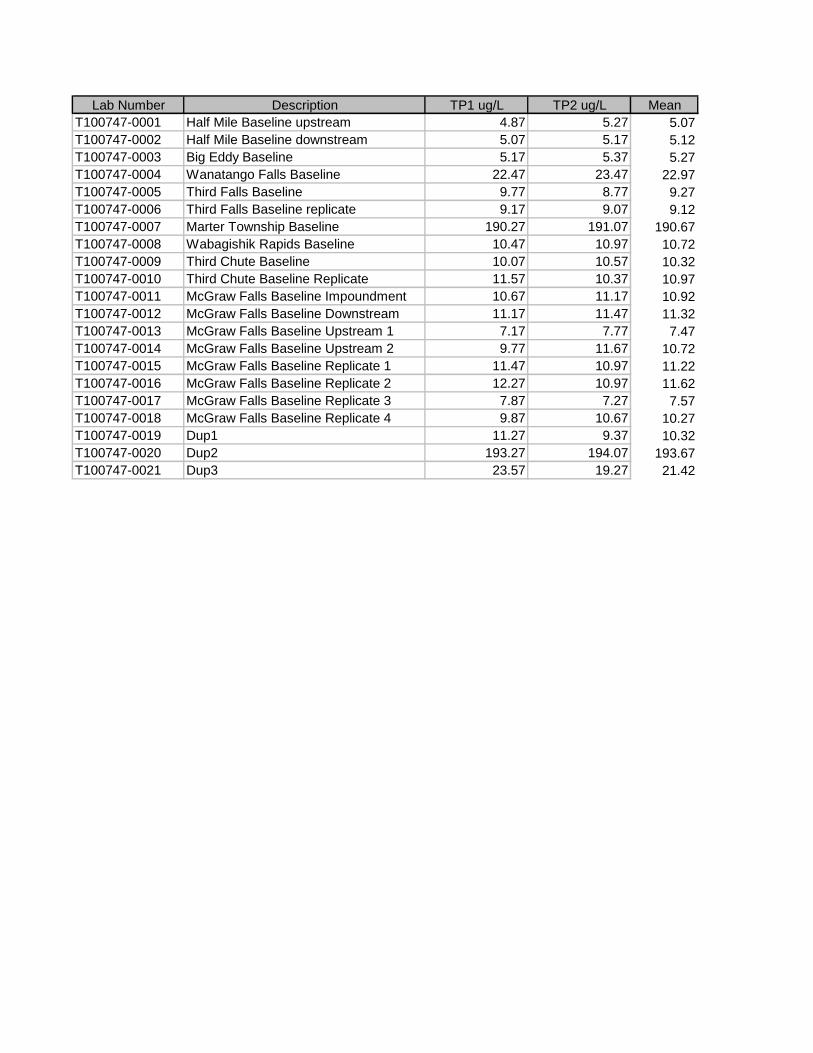
Lab Number Description TP1 ug/L TP2 ug/L Mean
T100747-0001 Half Mile Baseline upstream 4.87 5.27 5.07
T100747-0002 Half Mile Baseline downstream 5.07 5.17 5.12
T100747-0003 Big Eddy Baseline 5.17 5.37 5.27
T100747-0004 Wanatango Falls Baseline 22.47 23.47 22.97
T100747-0005 Third Falls Baseline 9.77 8.77 9.27
T100747-0006 Third Falls Baseline replicate 9.17 9.07 9.12
T100747-0007 Marter Township Baseline 190.27 191.07 190.67
T100747-0008 Wabagishik Rapids Baseline 10.47 10.97 10.72
T100747-0009 Third Chute Baseline 10.07 10.57 10.32
T100747-0010 Third Chute Baseline Replicate 11.57 10.37 10.97
T100747-0011 McGraw Falls Baseline Impoundment 10.67 11.17 10.92
T100747-0012 McGraw Falls Baseline Downstream 11.17 11.47 11.32
T100747-0013 McGraw Falls Baseline Upstream 1 7.17 7.77 7.47
T100747-0014 McGraw Falls Baseline Upstream 2 9.77 11.67 10.72
T100747-0015 McGraw Falls Baseline Replicate 1 11.47 10.97 11.22
T100747-0016 McGraw Falls Baseline Replicate 2 12.27 10.97 11.62
T100747-0017 McGraw Falls Baseline Replicate 3 7.87 7.27 7.57
T100747-0018 McGraw Falls Baseline Replicate 4 9.87 10.67 10.27
T100747-0019 Dup1 11.27 9.37 10.32
T100747-0020 Dup2 193.27 194.07 193.67
T100747-0021 Dup3 23.57 19.27 21.42