Embed Size (px)
Citation preview
Race Disparity Audit Summary Findings from the Ethnicity Facts and Figures website
October 2017 (revised March 2018)
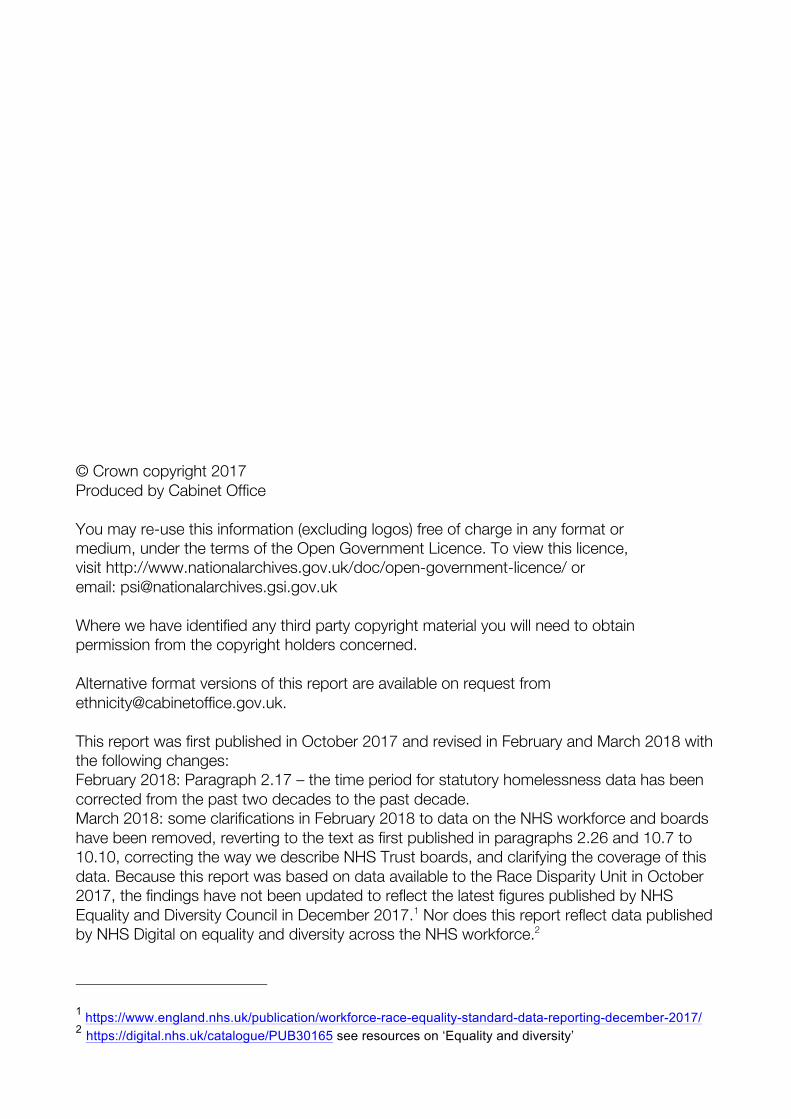
© Crown copyright 2017 Produced by Cabinet Office You may re-use this information (excluding logos) free of charge in any format or medium, under the terms of the Open Government Licence. To view this licence, visit http://www.nationalarchives.gov.uk/doc/open-government-licence/ or email: [email protected] Where we have identified any third party copyright material you will need to obtain permission from the copyright holders concerned. Alternative format versions of this report are available on request from [email protected]. This report was first published in October 2017 and revised in February and March 2018 with the following changes: February 2018: Paragraph 2.17 – the time period for statutory homelessness data has been corrected from the past two decades to the past decade. March 2018: some clarifications in February 2018 to data on the NHS workforce and boards have been removed, reverting to the text as first published in paragraphs 2.26 and 10.7 to 10.10, correcting the way we describe NHS Trust boards, and clarifying the coverage of this data. Because this report was based on data available to the Race Disparity Unit in October 2017, the findings have not been updated to reflect the latest figures published by NHS Equality and Diversity Council in December 2017.1 Nor does this report reflect data published by NHS Digital on equality and diversity across the NHS workforce.2
1 https://www.england.nhs.uk/publication/workforce-race-equality-standard-data-reporting-december-2017/ 2 https://digital.nhs.uk/catalogue/PUB30165 see resources on ‘Equality and diversity’
www.ethnicity-facts-f igures.service.gov.uk
1
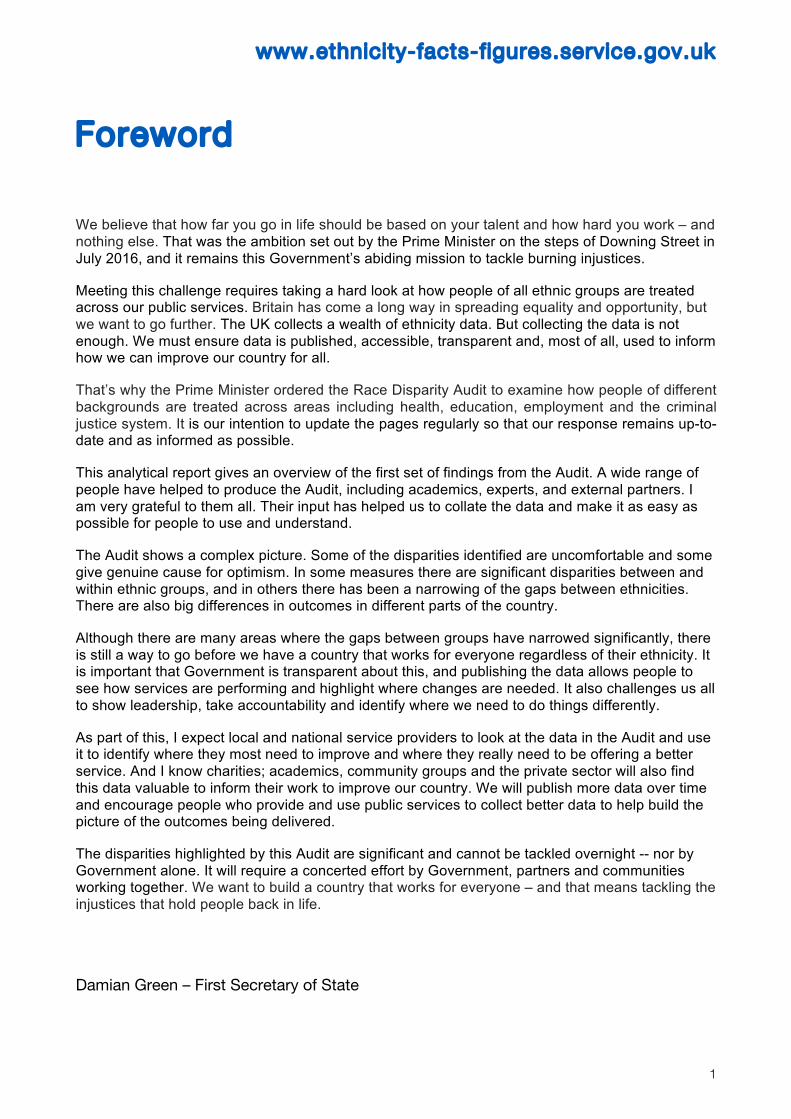
Foreword
We believe that how far you go in life should be based on your talent and how hard you work – and nothing else. That was the ambition set out by the Prime Minister on the steps of Downing Street in July 2016, and it remains this Government’s abiding mission to tackle burning injustices. Meeting this challenge requires taking a hard look at how people of all ethnic groups are treated across our public services. Britain has come a long way in spreading equality and opportunity, but we want to go further. The UK collects a wealth of ethnicity data. But collecting the data is not enough. We must ensure data is published, accessible, transparent and, most of all, used to inform how we can improve our country for all. That’s why the Prime Minister ordered the Race Disparity Audit to examine how people of different backgrounds are treated across areas including health, education, employment and the criminal justice system. It is our intention to update the pages regularly so that our response remains up-to-date and as informed as possible. This analytical report gives an overview of the first set of findings from the Audit. A wide range of people have helped to produce the Audit, including academics, experts, and external partners. I am very grateful to them all. Their input has helped us to collate the data and make it as easy as possible for people to use and understand. The Audit shows a complex picture. Some of the disparities identified are uncomfortable and some give genuine cause for optimism. In some measures there are significant disparities between and within ethnic groups, and in others there has been a narrowing of the gaps between ethnicities. There are also big differences in outcomes in different parts of the country. Although there are many areas where the gaps between groups have narrowed significantly, there is still a way to go before we have a country that works for everyone regardless of their ethnicity. It is important that Government is transparent about this, and publishing the data allows people to see how services are performing and highlight where changes are needed. It also challenges us all to show leadership, take accountability and identify where we need to do things differently. As part of this, I expect local and national service providers to look at the data in the Audit and use it to identify where they most need to improve and where they really need to be offering a better service. And I know charities; academics, community groups and the private sector will also find this data valuable to inform their work to improve our country. We will publish more data over time and encourage people who provide and use public services to collect better data to help build the picture of the outcomes being delivered. The disparities highlighted by this Audit are significant and cannot be tackled overnight -- nor by Government alone. It will require a concerted effort by Government, partners and communities working together. We want to build a country that works for everyone – and that means tackling the injustices that hold people back in life.
Damian Green – First Secretary of State
www.ethnicity-facts-f igures.service.gov.uk
2
Contents
1. The Race Disparity Audit 4 2. Overview of disparit ies 8 3. Community 13 4. Education 19 5. Labour market part icipation and income 25 6. Housing 31 7. Crime and pol icing 36 8. Criminal Justice System 40 9. Health 46 10. Publ ic Sector Workforce 51

www.ethnicity-facts-f igures.service.gov.uk
3
www.ethnicity-facts-f igures.service.gov.uk
4
1. The Race Disparity Audit
Introduction
1.1 The Prime Minister announced the Race Disparity Audit in August 2016 with a view to shining a light on how people of different ethnicities are treated across public services by publishing data held by the Government.
Review and prioritisation of the data
1.2 An initial review required all Government Departments to identify what data they held on UK public services that could be analysed by ethnicity. The review identified a vast amount of information, some of which is already published and some that had not yet been analysed for ethnic differences. The data identified by the Audit was very varied in quality and depth. It spanned the Census, published official statistics, numerous Government surveys and Departments’ own administrative records.
1.3 Some datasets have been prioritised for inclusion in the first release. The intention is that others will follow in due course. The criteria for prioritising data reflected its quality, readiness, manageability and relevance to key concerns identified by users of the data, including members of the public, non-Governmental organisations (NGOs), public services and Government Departments themselves. The emphasis was on opening up data to the public where it was reasonably reliable, with caveats as necessary.
1.4 Ongoing and wide-ranging consultation with potential users of data has helped
identify questions of public interest and concern, and to understand how to present the data objectively and meaningfully in a way that makes sense to users and commands their confidence. This has included roundtable discussions with NGOs, public service providers and academics, and engagement with the public from a range of ethnic and demographic backgrounds, experts in research and statistics, and government policy officials and analysts.
Development of the Ethnicity Facts and Figures website
1.5 All of the collated data has been made available on www.ethnicity-facts-figures.service.gov.uk.
1.6 The Ethnicity Facts and Figures website was developed in parallel with extensive
research with different types of user, and with reference to the government’s Digital Service Standard and good practice in presenting UK official statistics. The content represents an unprecedented release of government data to describe – in one easily accessible place – the experiences and outcomes of people of all ethnicities across public services.
www.ethnicity-facts-f igures.service.gov.uk
5
1.7 The data is presented under themes adapted from the Equality Measurement Framework, developed by the Equalities and Human Rights Commission, to reflect the range of data held by Departments and user research on how it is best organised. The website has been thoroughly tested to check that users can navigate it easily and find the content they are looking for. The content is presented in a way that it is hoped will be clear to non-experts in statistics, explaining how any weaknesses in the data may affect interpretation, with further technical details and context for those who wish to know more.
1.8 The Ethnicity Facts and Figures website will be a permanent resource: measures
presented in this first release of the website will be updated as the data changes and more measures will be added to it over time.
1.9 Data for Scotland, Wales and Northern Ireland is only included if it pertains to
policy areas that are not devolved and remain the responsibility of central government departments. Also, data on local services – such as on local authority homelessness acceptances, police use of stop and search, and progress and attainment in schools – is only presented where it is compiled by central Government departments.
Data quality
1.10 There is already a considerable amount of data collected across central Government that permits analysis by ethnicity, but there are also some areas of public services where there is little or no data about ethnicity. Where relevant data is collected, a common challenge is having insufficient numbers of cases to study in the ethnic minority groups; inevitably this limits the degree to which firm conclusions can be made about differences between ethnic groups, and the ability to take account of other factors in analysis in addition to ethnicity. Surveys are particularly prone to this limitation unless samples are very large or deliberately boosted to include greater numbers of people from minority groups. Another consequence of this sample size issue is that for some sources it is only meaningful to compare data for broad ethnic groups or for the White or White British groups compared to all others. This will often not adequately distinguish the different experiences of people within such broad groups.
1.11 The quality of data on the ethnicity of individuals varies and is generally better when reported by people themselves, as it is in surveys and the Census. Administrative data – such as is collected from service users – can suffer high levels of non-recording of ethnicity and overuse of ‘other’ categories, undermining the ability to identify differences in how people in each ethnic group are treated.
Data analysis
1.12 Much of the data presented is broken down to take account of people’s age, sex or other relevant factors including their income or socioeconomic status, and geography. This is done to give users additional information where it is available to help inform like-for-like comparisons between ethnic groups, since
www.ethnicity-facts-f igures.service.gov.uk
6
these differ widely in their age profiles and other characteristics. However, it is not possible to take account of all such factors using these datasets and it is particularly difficult to take account of different levels of need for services. It is therefore often the case that the Audit is observing differences between ethnic groups, but it would require further research to establish the full context in which any disparities should be interpreted.
1.13 Nor is it possible from the Audit data alone to determine the causes of any differences observed between ethnic groups. Even where analysis shows differences between ethnic groups are associated with other relevant factors such age, sex or socio-economic status, it is not possible to say whether those factors are the cause or the effect of differences between ethnic groups.
1.14 A critical question for the Audit is whether differences in the experiences across ethnic groups are reducing or increasing. Where it has been possible to do so on a comparable basis, departments have provided data going back in time.
1.15 For the sake of objectivity, Ethnicity Facts and Figures describes the
differences that are observed in public services between ethnic groups and does not refer to any wider research done by Government Departments or others to identify disparities, their main drivers or causes.
The report
1.16 This report provides an overview of the main findings from the Audit. As well as a review of each topic, the report presents an overview of disparities that have most impact across all aspects of people’s lives. This analysis helps to understand and assess differences between ethnic groups, and to identify those public services where disparities are diminishing and those where work is needed to develop effective strategies to reduce disparities between ethnic groups. Some measures are being uploaded and so some descriptions in this report are not yet on the site.
Next steps
1.17 There are standards for classifying ethnicity at broad and more detailed levels across Government data sources and these help achieve comparability across datasets. These standards are reviewed for each census by the Office for National Statistics so that they reflect the UK population. But sources differ in the way they classify ethnicity and some departments are still using classifications from the 2001 Census, making comparisons across Ethnicity Facts and Figures difficult.
1.18 Some stability in the standard classification of ethnicity is required over time, so that government can track whether differences between ethnic groups are reducing, getting bigger or staying the same. At the same time it is recognised that the standard classification needs to reflect changes in the population and in

www.ethnicity-facts-f igures.service.gov.uk
7
people’s perceptions of their ethnicity over time. Time series data is available for some measures in the Audit, but such time series are often limited in length due to changing classifications and other changes to how data is measured, which affect the comparability of data over time.
1.19 It is important to take account of questions from the public about ethnic
disparities, which point to areas where government could strengthen its data. For this reason, an important element of Ethnicity Facts and Figures is the ability for users to provide feedback on the site.
www.ethnicity-facts-f igures.service.gov.uk
8
2. Overview of disparit ies
2.1 The data presented in this Audit paints a picture of life for people in different ethnic groups in the UK. Throughout people’s lives, and across the various aspects of their lives, experiences and outcomes often vary with the ethnic group they belong to.
2.2 The Audit and this report only considers the outcomes and experiences of people according to their ethnic group, rather than their nationality, country of birth or national identity.
Key findings
2.3 This report presents a summary of the key findings from the Audit. The findings are set out in full in the datasets published on the website Ethnicity Facts and Figures. The report does not seek to give a comprehensive summary of all the data on the website, nor does it focus only on the largest disparities. It seeks to reflect the ethnic disparities observed in the data that have most impact on people’s quality of life and their future opportunities. Much of the data presented is for England or England and Wales, with some UK data.
2.4 There are disparities between ethnic groups in all areas of life affected by public organisations. Some are more pronounced than others or have a greater impact on people’s life chances and quality of life. In some areas, disparities are reducing, while in others, they are static or increasing.
Communities
2.5 The UK has become more ethnically diverse. The proportion of people identifying as White British in England and Wales decreased from 87.4% in 2001 to 80.5% in 2011.
2.6 The majority, 87%, of the usual resident population of England and Wales in 2011 were born in the UK, and 13% (7.5 million) were born outside the UK. After White British people, of whom 98% were born in the UK, people from a Mixed White and Black Caribbean background were the most likely to have been born in the UK, with 94% born here. Over half of people from Pakistani and Bangladeshi backgrounds were born in the UK, with 56% and 52% respectively born here. People who identified as Other White were the least likely to have been born in the UK - less than 15% were born here.
2.7 In England, adults from a Bangladeshi and Pakistani background, primarily
those in the older age groups, were the most likely not to speak English well or at all. Among adults aged 16 to 24 in these ethnic groups, almost all of them could speak English. Regardless of ability to speak English, around 1 in every

www.ethnicity-facts-f igures.service.gov.uk
9
13 people in England and Wales aged 3 and over had a main language other than English. Polish was the most common language after English with 1% of the population reporting it as their main language. Despite the variation between ethnic groups in their ability to speak English and the main languages spoken, a substantial majority of adults in the White, Asian, Black and Mixed ethnic groups felt a sense of belonging to Britain.
2.8 The majority of people in each ethnic group also felt a sense of belonging to
their local neighbourhood. This was similar across ethnic groups, and manifested in a range of positive civic behaviours and attitudes. More than three quarters of people from each ethnic group felt that their local area is a place where people from different backgrounds get on well together: Black people reported the lowest levels and people from an Asian background reported very high levels. However, Black people – together with White people and people in the Other group – were the most likely to participate in some regular formal volunteering. Black people felt appreciably more able to influence decisions that affect their local area (such as contacting their councillor) than White people.
Poverty and living standards
2.9 Asian and Black households and those in the Other ethnic group were more likely to be poor and were the most likely to be in persistent poverty. Around 1 in 4 children in households headed by people from an Asian background or those in the Other ethnic group were in persistent poverty, as were 1 in 5 children in Black households and 1 in 10 White British households. Households of Bangladeshi, Pakistani, Black, Mixed and Other backgrounds were more likely to receive income-related benefits and tax credits than those in other ethnic groups. The ethnic minority population is more likely to live in areas of deprivation, especially Black, Pakistani and Bangladeshi people.
Education
2.10 Pupils in several ethnic groups were achieving and progressing better than
White British pupils. Pupils from Chinese and Indian backgrounds showed high attainment and progress throughout their school careers and high rates of entry to university. Pupils from Gypsy and Roma, or Irish Traveller background (which are not included in the White British category), had the lowest attainment and progress, and were least likely to stay in education after the age of 16. Although pupils in the Black ethnic group made more progress overall than the national average, Black Caribbean pupils fell behind. White British pupils and those from a Mixed background also made less progress than average.
2.11 Low educational attainment and progress is closely associated with economic disadvantage. There is a sizeable gap in attainment between disadvantaged pupils and those from better off households among White British, White Irish and Mixed pupils. In particular, White British and White Irish pupils who were
www.ethnicity-facts-f igures.service.gov.uk
10
not eligible for free school meals were around twice as likely to attain A*- C in maths and English GCSEs as those who were eligible. In contrast, attainment for Black Caribbean pupils is very low overall, with a smaller gap between pupils eligible for free school meals and those not. Pupils from Pakistani and Bangladeshi backgrounds are achieving almost as well as, and progressing better than, White British pupils, whereas the attainment and progress of Black Caribbean pupils is much lower. White pupils from state schools had the lowest university entry rate of any ethnic group in 2016.
2.12 Of all regions in England, the most educational progress and best attainment in
state primary and secondary schools was found in London, where more than half of pupils were from ethnic minority groups. Disadvantaged pupils in receipt of free school meals in London made more progress and had higher attainment than their counterparts elsewhere in England.
Employment
2.13 Employment rates have increased for all ethnic groups, but substantial differences remain in their participation in the labour market; around 1 in 10 adults from a Black, Pakistani, Bangladeshi or Mixed background were unemployed compared with 1 in 25 White British people. Although women from Pakistani and Bangladeshi backgrounds were the least likely to be employed, the proportion who were in work has increased substantially since 2004.
2.14 While employment rates among people from Pakistani and Bangladeshi backgrounds have been improving, these populations remain more likely to be in low skilled, low paying occupations than other ethnic groups. They also have higher rates of self-employment. Pakistani or Bangladeshi employees received the lowest average hourly pay, which was £4.39 per hour less in the last three months of 2016 than Indian employees who received the highest average hourly pay.
Housing
2.15 Home ownership, access to social housing, affordability and the quality of housing varies very widely between ethnic groups. Home ownership is most common among households of White British, Indian, Pakistani, and Mixed White and Asian origin; it is substantially lower among African, Arab, and Mixed White and Black African households.
2.16 The households that are most likely to rent social housing were headed by someone in the African, Caribbean, Other Black, Bangladeshi, Irish and Arab groups, or the Mixed groups other than Mixed White and Asian. As a group, ethnic minority households are also much more likely to rent privately than White British households and to spend a higher proportion of their incomes on rent, regardless of whether they rent from a social or private landlord. Their housing tends to be of lower quality, particularly among households of
www.ethnicity-facts-f igures.service.gov.uk
11
Pakistani origin, and overcrowding is more common, especially among households of Bangladeshi origin. Overcrowding affects ethnic minority households disproportionately, and London had one of the highest rates of overcrowding of all regions of England.
2.17 There has been an increase in the number of ethnic minority households
accepted by local authorities as statutorily homeless over the past decade, even though the number of acceptances overall has fallen substantially.
Policing
2.18 There are lower levels of confidence in the police among Black people, and especially among younger Black adults. While there has been a very large reduction in the use of Stop and Search among Black people since 2008/09, the use of these powers remains far higher on this ethnic group than others. Black men are also almost three and a half times more likely to be arrested than White men.
Criminal justice
2.19 Of all defendants, including juveniles, who were remanded at Crown Court for indictable offences, the proportion of defendants who were remanded in custody (rather than allowed out on bail) was highest for Black defendants, and particularly for Black males.
2.20 Among adults who were tried for indictable offences, the percentage of prosecutions resulting in conviction – known as the conviction ratio – was highest among White defendants at 87% in 2016, and lowest for Asians (81%); for Black defendants it was 82%. Across all ethnic groups the conviction ratio was lower for juveniles than adults. The lowest conviction ratio for juveniles was among Black defendants (69%); the conviction ratio for juveniles from all other ethnic groups ranged between 71% and 73%.
2.21 For all offenders (including juveniles), the average custodial sentence length
(ACSL) for indictable offences has increased for all ethnic groups since 2009. White offenders consistently received the shortest ACSL. In 2016, the ACSL for White offenders was 18 months whereas Black and Asian offenders received the longest ACSL at 24 and 25 months respectively. These statistics do not take into account any other contextual factors such as the offences dealt with, which may differ by ethnic group.
Health
2.22 There are differences between ethnic groups across a range of health-related behaviours and preventable poor outcomes, and each ethnic group exhibits both healthy and unhealthy behaviours. More than half of adults in all ethnic
www.ethnicity-facts-f igures.service.gov.uk
12
groups other than the Chinese group were overweight (having a Body Mass Index of 25 and over), and this was particularly so among the White and Black ethnic groups, affecting 2 out of 3 White and Black adults. Adults in the Mixed group were the most likely to be physically active but also the most likely to smoke.
2.23 Most Asian groups express lower levels of satisfaction and less positive experiences of NHS General Practice services than other ethnic groups and there are differences in the prevalence of mental ill-health, its treatment and outcomes between ethnic groups.
2.24 In the general adult population, Black women were the most likely to have
experienced a common mental disorder such as anxiety or depression in the last week, and Black men were the most likely to have experienced a psychotic disorder in the past year. However, White British adults were more likely to be receiving treatment for a mental or emotional problem than adults in other ethnic groups. Of those receiving psychological therapies, White adults experienced better outcomes than those in other ethnic groups. Black adults were more likely than adults in other ethnic groups to have been sectioned under the Mental Health Act.
The public sector workforce
2.25 The public sector workforce is a major employer, but ethnic minority employees are concentrated in the lower grades or ranks, and among younger employees.
2.26 In 2016, 18% of the non-medical NHS workforce (all staff excluding doctors
and dentists) were from an ethnic minority group (excluding White minorities). Only 7% of very senior managers and 11% of senior managers were from an ethnic minority group. Also, the boards of many NHS trusts do not reflect the diversity of the NHS workforce: where ethnicity is known, 93% of NHS board members in England are White (which includes White ethnic minority backgrounds). Court judges are disproportionately White, though the imbalance is less marked among tribunal judges (though the judiciary are independent office holders).
2.27 Some parts of the public sector workforce are more ethnically diverse than
others. For example, the vast majority of police officers are from the White group and this has not changed over the past decade. The volunteer, part-time Special Constabulary was the most ethnically diverse part of the police workforce, followed by Police Community Support Officers. The Army is far more diverse than the Air Force.
www.ethnicity-facts-f igures.service.gov.uk
13
3. Community
3.1 This section begins by describing the population of England and Wales according to their ethnicity and country of birth. It also reviews people’s sense of belonging to Britain and, locally, their ability to speak English, the cohesiveness of communities, and people’s empowerment in local decisions in England, and personal well-being indicators for people across the UK.
Country of birth
3.2 The UK has become more ethnically diverse. The proportion of people identifying
as White British in England and Wales decreased from 87.4% in 2001 to 80.5% in 2011.
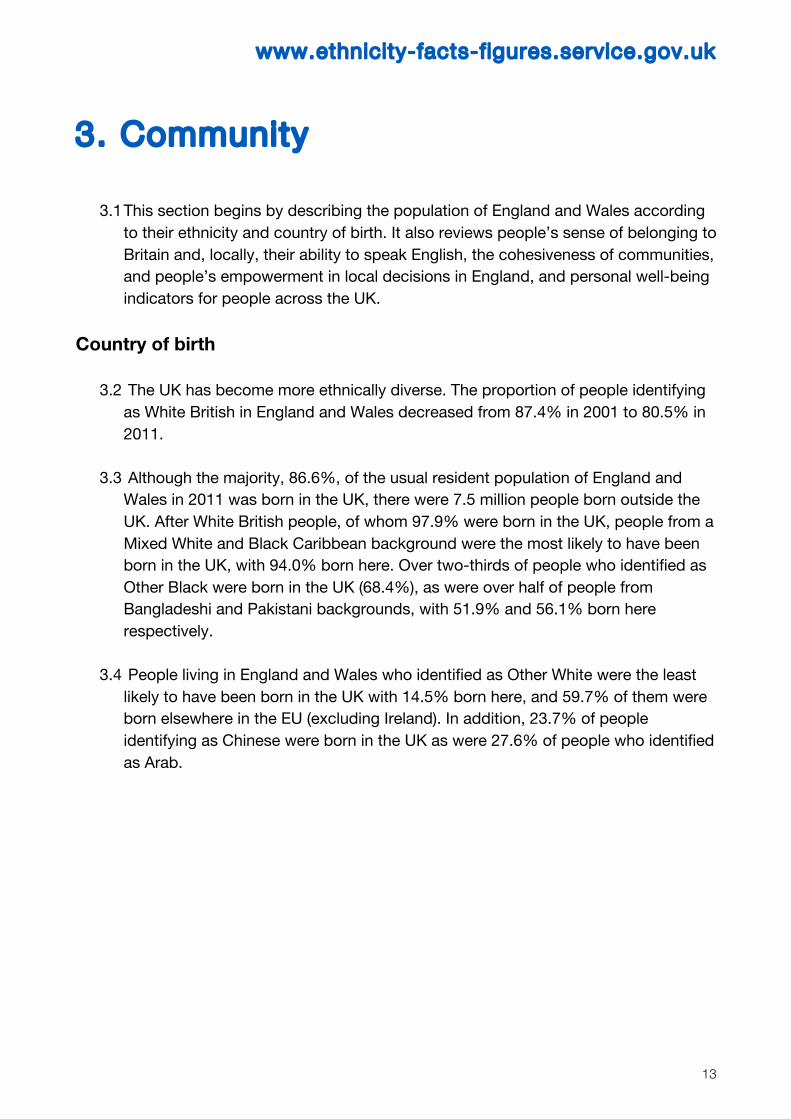
3.3 Although the majority, 86.6%, of the usual resident population of England and Wales in 2011 was born in the UK, there were 7.5 million people born outside the UK. After White British people, of whom 97.9% were born in the UK, people from a Mixed White and Black Caribbean background were the most likely to have been born in the UK, with 94.0% born here. Over two-thirds of people who identified as Other Black were born in the UK (68.4%), as were over half of people from Bangladeshi and Pakistani backgrounds, with 51.9% and 56.1% born here respectively.
3.4 People living in England and Wales who identified as Other White were the least
likely to have been born in the UK with 14.5% born here, and 59.7% of them were born elsewhere in the EU (excluding Ireland). In addition, 23.7% of people identifying as Chinese were born in the UK as were 27.6% of people who identified as Arab.
www.ethnicity-facts-f igures.service.gov.uk
14
Source: 2011 Census, Office for National Statistics Language
3.5 According to the 2011 Census, around 1 in every 13 people in England and Wales (4.2 million) aged 3 and over had a main language other than English; this increases to 1 in every 12 adults aged 16 or over. Polish was the most common language spoken after English with 546,000 people (1.0% of the population) reporting it as their main language. This was followed by Panjabi which was the main language for 273,000 people and Urdu, for 269,000 people.
3.6 People who reported a main language other than English were asked how well they spoke English. In England, only 1.3% (726,000) of the population aged 3 and over could not speak English well and 0.3% (138,000) could not speak English at all. Chinese people were least likely to speak English as their main language but
www.ethnicity-facts-f igures.service.gov.uk
15
Bangladeshi and Pakistani people were most likely to not speak English well or at all; around 1 in 5 Bangladeshi and Pakistani people did not speak English well or at all.
3.7 Whether or not a person can speak English is strongly related to age: across all
ethnic groups, those aged 65 and over are least likely to speak English and those aged 16 to 24 are most likely.
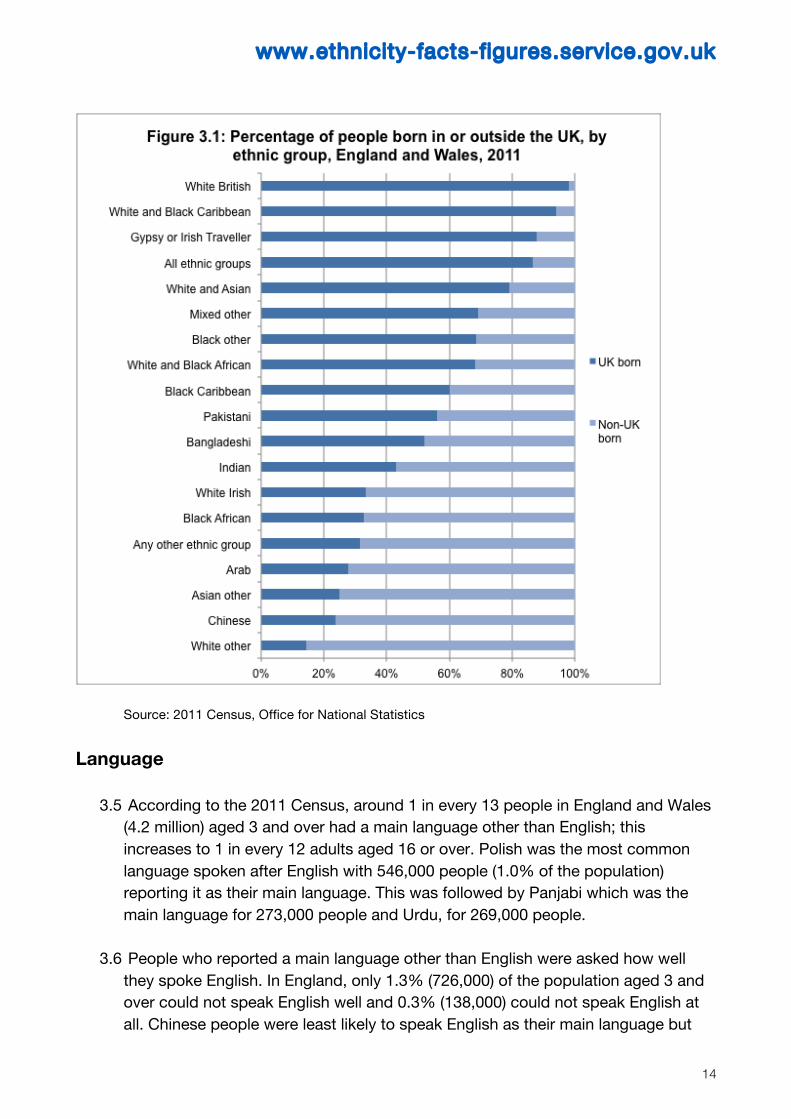
3.8 Women were more likely than men to have poor English proficiency, and this was
most pronounced among Pakistani and Bangladeshi adults. However, while almost half of Bangladeshi women and a third of Pakistani women aged 65 and over could not speak English, among those aged 16 to 24, only around 1% could not speak English.
Source: 2011 Census, Office for National Statisics
3.9 There were regional differences in the proportions of people who are able to speak
English for the Asian ethnic groups, Arabs and the Other ethnic group. Compared with many other UK regions, the West Midlands has a higher proportion of people in these ethnic groups who cannot speak English, and in this region the inability to speak English is most common among Bangladeshi and Pakistani people - around 4% and 3% respectively cannot speak English. Almost 3% of Indian people in the East Midlands, 3% of Bangladeshi people in the North West and nearly 3% of those who identify as Arab or in the Other ethnic group in Yorkshire and the Humber cannot speak English.
www.ethnicity-facts-f igures.service.gov.uk
16
Social capital measures and participation by ethnic group
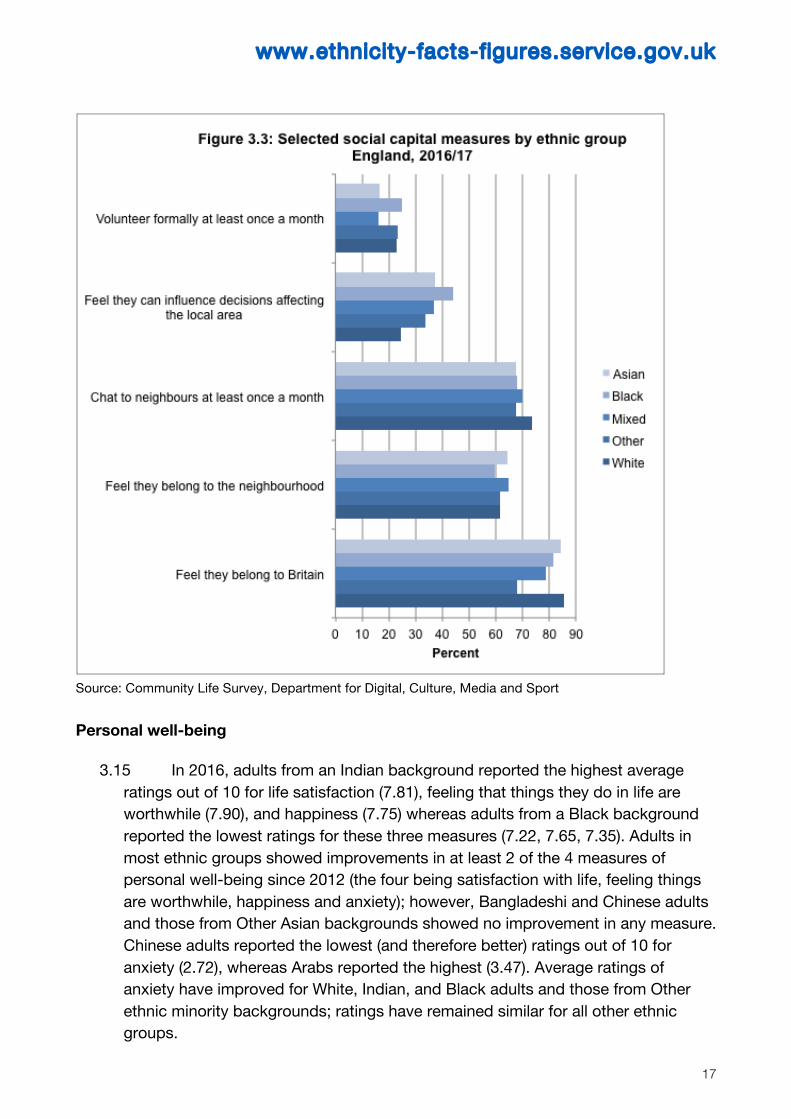
3.10 Black adults were among the most likely to participate in some form of formal volunteering on a regular basis, which involves providing unpaid help through groups, clubs or organisations at least once a month. 1 in 4 Black adults and almost as many White adults regularly participated in formal volunteering in 2016-17, and they were more likely to do so than those of Asian or Mixed ethnicity of whom around 1 in 6 volunteered formally on a monthly basis.
3.11 There were marked differences between ethnic groups in the extent to which people felt able to influence local decisions, with Black adults feeling the most able to influence them and White adults, the least. In 2016-17, 44% of Black adults agreed they could influence decisions affecting their local area, compared with 25% of White adults.
3.12 There was little difference between ethnic groups in their sense of belonging
to their neighbourhood, with the majority of all ethnic groups feeling they belong to their neighbourhood very or fairly strongly.
3.13 In addition, a substantial majority of adults across all ethnic groups felt they
belonged to Britain. Around 85% of White and Asian adults, and around 80% of adults from Black or Mixed backgrounds felt that they belong to Britain, though the proportion of adults from Other ethnic backgrounds who felt this was lower, at 68%.
3.14 Asian adults were most likely to feel that their local area is a place where
people from different backgrounds get on well together with 85% agreeing. On the other hand, Black adults were least likely to feel that their local area is a place where people from different backgrounds get on well together, with just 77% agreeing.
www.ethnicity-facts-f igures.service.gov.uk
17
Source: Community Life Survey, Department for Digital, Culture, Media and Sport Personal well-being
3.15 In 2016, adults from an Indian background reported the highest average ratings out of 10 for life satisfaction (7.81), feeling that things they do in life are worthwhile (7.90), and happiness (7.75) whereas adults from a Black background reported the lowest ratings for these three measures (7.22, 7.65, 7.35). Adults in most ethnic groups showed improvements in at least 2 of the 4 measures of personal well-being since 2012 (the four being satisfaction with life, feeling things are worthwhile, happiness and anxiety); however, Bangladeshi and Chinese adults and those from Other Asian backgrounds showed no improvement in any measure. Chinese adults reported the lowest (and therefore better) ratings out of 10 for anxiety (2.72), whereas Arabs reported the highest (3.47). Average ratings of anxiety have improved for White, Indian, and Black adults and those from Other ethnic minority backgrounds; ratings have remained similar for all other ethnic groups.
www.ethnicity-facts-f igures.service.gov.uk
18
3.16 There was little difference in average ratings for men and women across most ethnic groups and well-being measures. The exception was for the feeling that the things done in life are worthwhile for which women in the Bangladeshi, Black and Mixed groups gave higher ratings than men did. The rating given by Bangladeshi women was 7.90 compared with 7.52 for Bangladeshi men; Black women gave a rating of 7.72 compared with 7.54 for Black men; and in the Mixed ethnic group, women gave a rating of 7.76 compared with 7.46 for men.
www.ethnicity-facts-f igures.service.gov.uk
19
4. Education
4.1 There is a large amount of data on children and young people’s educational lives. For this analysis, the Department for Education provided the latest data for England on development, attainment, progress and exclusions, Higher and Further education and apprenticeships. Some of this data was also broken down by eligibility for free school meals, geography and gender, amongst other pupil characteristics.
4.2 Children and young people’s learning is reviewed at key points in their school career. Data on attainment (such as test scores) and progress between key stages provides a clear demonstration of different outcomes for specific ethnic groups. In England, Chinese pupils had the highest attainment throughout school, made the most progress and were the most likely to stay in education and go to university. In 2016, almost a quarter of Chinese level 3 pupils attained 3 A grades or higher at A level and almost 3 out of 5 went to university, meaning that they were twice as likely to have gone to university than White pupils.
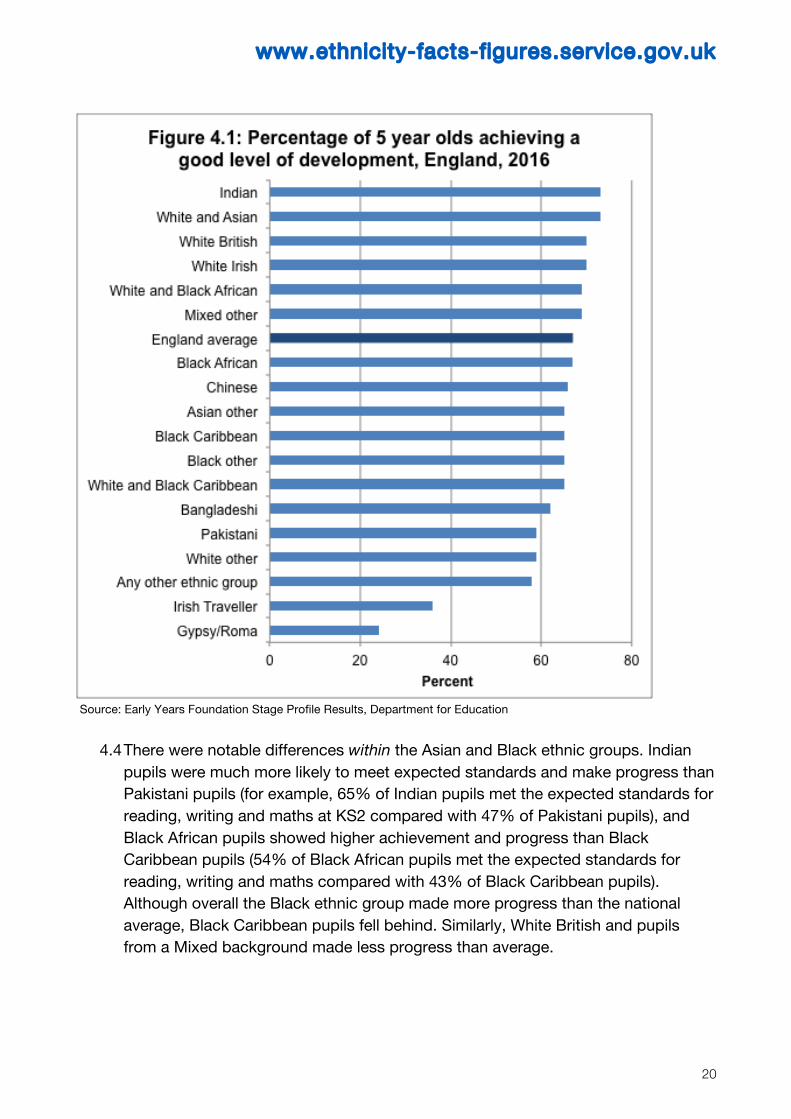
4.3 Conversely, pupils from Gypsy or Roma backgrounds and those from a Traveller or
Irish Heritage background had the lowest attainment of all ethnic groups throughout their school years. As shown in Figure 4.1, at age 5, around a quarter of Gypsy and Roma pupils achieved a good level of development, making them around three times less likely to do so than average. At key stage 4 the disparity is wider; in 2015/16 the Attainment 8 score – an average of points scored for attainment in 8 GCSEs including English and Maths – for Gypsy and Roma pupils was 20 points compared with the English average of 50 points and 62 points for Chinese pupils. Gypsy and Roma pupils, and those from an Irish Traveller background, also made less progress compared with the average for pupils with similar prior attainment. They were also far less likely to stay in education after the age of 16 than pupils in any other ethnic group, with just 58% of Irish Traveller pupils and 62% or Gypsy and Roma pupils staying on in 2014/15, compared with 90% of White British pupils and 97% of Chinese pupils.
www.ethnicity-facts-f igures.service.gov.uk
20
Source: Early Years Foundation Stage Profile Results, Department for Education
4.4 There were notable differences within the Asian and Black ethnic groups. Indian pupils were much more likely to meet expected standards and make progress than Pakistani pupils (for example, 65% of Indian pupils met the expected standards for reading, writing and maths at KS2 compared with 47% of Pakistani pupils), and Black African pupils showed higher achievement and progress than Black Caribbean pupils (54% of Black African pupils met the expected standards for reading, writing and maths compared with 43% of Black Caribbean pupils). Although overall the Black ethnic group made more progress than the national average, Black Caribbean pupils fell behind. Similarly, White British and pupils from a Mixed background made less progress than average.
www.ethnicity-facts-f igures.service.gov.uk
21
Differences by region
4.5 In 2015/16, the best attainment and progress in state primary and secondary schools was in London, where more than half of children at primary school and secondary school were from ethnic minorities. In particular children eligible for free school meals (FSM) in London had higher attainment and made more progress than children eligible for FSM elsewhere in England. In addition, schools in Inner London had the lowest overall absence rate and schools in Outer London had the lowest fixed period exclusion rates.
Attainment and economic disadvantage
4.6 Low educational attainment and progress is closely associated with economic
disadvantage. In 2016, Black pupils were over three times more likely to be eligible for FSM than Chinese pupils. Pupils from an Irish Traveller background were most likely to be eligible for free school meals with 3 in 5 Key stage 4 pupils eligible in 2016.
4.7 Children eligible for FSM have lower attainment than non-FSM pupils in all ethnic groups, but White British pupils and White Irish pupils had the biggest gap in attainment between those eligible and those not. At key stage 2 the attainment gap was 26 percentage points for White British pupils and 29 percentage points for White Irish pupils. The gap was smallest for pupils from Gypsy or Roma backgrounds (1 percentage point at KS2) and pupils from an Irish Traveller background (7 percentage points at KS2), the majority of whom were eligible for FSM.
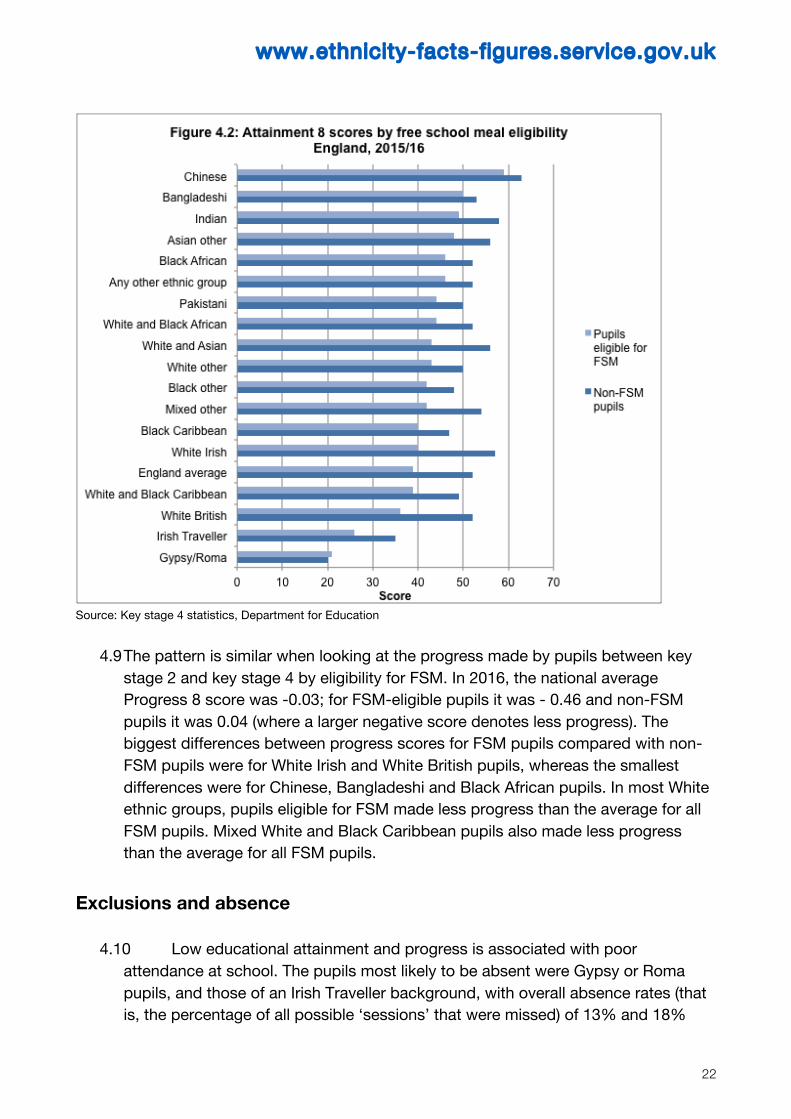
4.8 For pupils in key stage 4 in 2016 the Attainment 8 scores for White British pupils
eligible for FSM was 16 points lower than for those not eligible; for White Irish pupils eligible for FSM, the Attainment 8 score was 17 points lower than for those not eligible. White British and White Irish pupils not eligible for FSM were almost twice as likely to achieve A*- C in maths and English GCSEs than those who were eligible (with gaps of 33 percentage points and 37 percentage points respectively).
www.ethnicity-facts-f igures.service.gov.uk
22
Source: Key stage 4 statistics, Department for Education
4.9 The pattern is similar when looking at the progress made by pupils between key stage 2 and key stage 4 by eligibility for FSM. In 2016, the national average Progress 8 score was -0.03; for FSM-eligible pupils it was - 0.46 and non-FSM pupils it was 0.04 (where a larger negative score denotes less progress). The biggest differences between progress scores for FSM pupils compared with non-FSM pupils were for White Irish and White British pupils, whereas the smallest differences were for Chinese, Bangladeshi and Black African pupils. In most White ethnic groups, pupils eligible for FSM made less progress than the average for all FSM pupils. Mixed White and Black Caribbean pupils also made less progress than the average for all FSM pupils.
Exclusions and absence
4.10 Low educational attainment and progress is associated with poor
attendance at school. The pupils most likely to be absent were Gypsy or Roma pupils, and those of an Irish Traveller background, with overall absence rates (that is, the percentage of all possible ‘sessions’ that were missed) of 13% and 18%
www.ethnicity-facts-f igures.service.gov.uk
23
respectively in 2016. This compares with 4.6% for White British pupils and 2.4% for Chinese pupils.
4.11 Gypsy or Roma pupils, and those of an Irish Traveller background were also most likely to be excluded in 2015/16: 22% and 18% of pupils in these groups respectively were given fixed period exclusions, and 0.33% and 0.49% of each group respectively were permanently excluded. These figures should be interpreted carefully as these pupil populations are relatively small. Black Caribbean pupils were around three times as likely to be permanently excluded than White British pupils (0.29% compared with 0.10%) and around twice as likely to receive a fixed period exclusion (10.1% compared with 5.2%) than White British pupils.
Destinations
4.12 Educational attainment is one of the factors affecting pupils’ post-school destinations. At the age of 16, nearly all Chinese and Indian pupils stay in education, employment or training for at least two terms the year after finishing compulsory schooling (97%). Pupils from a Mixed White and Black Caribbean background were less likely to stay in education, employment or training (91%). Only around two-thirds of Gypsy or Roma pupils (62%), and those of an Irish Traveller background (58%) stayed in education, employment or training in the 2014/15 academic year.
4.13 Between 2002/03 and 2015/16, apprenticeship starts more than tripled, from 168,000 to 509,000. In 2015/16, White people were disproportionately more likely to take up apprenticeships (88% of apprenticeships compared with 85% of the population), whereas ethnic minorities were disproportionately less likely to do so (10% compared to 15% in the population in England).
4.14 Of young people who took level 3 qualifications (for example, A levels) in
2014/15, 91% of Chinese students stayed in education or employment for at least two terms the following year, followed closely by Black African and Indian students at 90%. In each of these ethnic groups, over four fifths of students stayed in (further or higher) education after the age of 18. Although White British students were almost as likely as students in these groups to stay in either education or employment overall, less than two-thirds stayed in education (the lowest rate of any ethnic group except Gypsy or Roma). White British students were more likely to go into sustained employment at the age of 18 than any ethnic minority group, with over 1 in 4 doing so.

www.ethnicity-facts-f igures.service.gov.uk
24
4.15 Access to higher education is primarily linked to students’ prior educational attainment. The entry rates for 18 year olds from all ethnic groups increased in 2016, reaching the highest recorded values for each group. 18 year olds from all ethnic groups were more likely to enter Higher Education than those from the White group. In 2016, Chinese former state school pupils had the highest Higher Education entry rate (58%) compared with 29% of White pupils.
www.ethnicity-facts-f igures.service.gov.uk
25
5. Labour market part icipation and income
5.1 This section reviews data on employment, unemployment, income, benefits and residence in areas of deprivation.
Employment
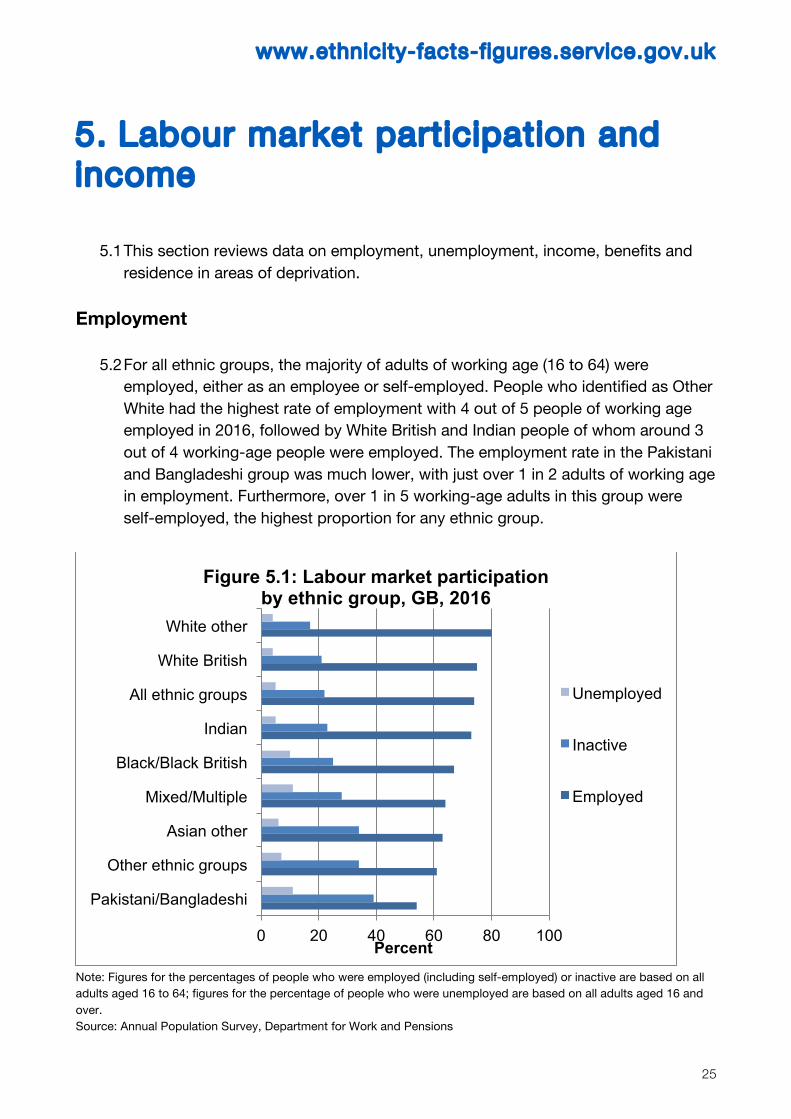
5.2 For all ethnic groups, the majority of adults of working age (16 to 64) were employed, either as an employee or self-employed. People who identified as Other White had the highest rate of employment with 4 out of 5 people of working age employed in 2016, followed by White British and Indian people of whom around 3 out of 4 working-age people were employed. The employment rate in the Pakistani and Bangladeshi group was much lower, with just over 1 in 2 adults of working age in employment. Furthermore, over 1 in 5 working-age adults in this group were self-employed, the highest proportion for any ethnic group.
Note: Figures for the percentages of people who were employed (including self-employed) or inactive are based on all adults aged 16 to 64; figures for the percentage of people who were unemployed are based on all adults aged 16 and over. Source: Annual Population Survey, Department for Work and Pensions
0 20 40 60 80 100
Pakistani/Bangladeshi
Other ethnic groups
Asian other
Mixed/Multiple
Black/Black British
Indian
All ethnic groups
White British
White other
Percent
Figure 5.1: Labour market participation by ethnic group, GB, 2016
Unemployed
Inactive
Employed
www.ethnicity-facts-f igures.service.gov.uk
26
5.3 The gap between the employment rates of the ethnic minority population and the
overall population has closed by 0.6 percentage points since 2015 to 10.1 percentage points in 2016.
5.4 In comparison with White British people of whom 1 in 25 adults aged 16 and over were unemployed, Black people, Pakistani and Bangladeshi people, and those who identified as Mixed were the most likely to be unemployed (around 1 in 10).
5.5 Nearly 2 out of 5 working-age people in the Pakistani and Bangladeshi group
group were economically inactive. In addition to this group, those from Other Asian backgrounds (excluding Indian) and those who identified with the Other ethnic group were also more likely to be economically inactive than White British people.
5.6 In all 9 regions of England, and in Scotland and Wales, White adults of working
age (including those in White minority ethnic groups) were more likely to be employed, and less likely to be economically inactive than working-age adults in other ethnic groups.
Occupations and industries
5.7 Around 1 in 4 White people who were in work were in the three lowest-skilled occupations, a lower rate than most other ethnic groups. Pakistani and Bangladeshi workers were more likely than workers in other ethnic groups to be concentrated in the three lowest-skilled occupation groups, with more than 2 in 5 Pakistani and Bangladeshi workers in these lower-skilled occupations. Pakistani and Bangladeshi workers were also concentrated in certain industries with more than 1 in 4 employed in distribution, hotels and restaurants, and 1 in 5 in the transport and communications industries.
5.8 Conversely, Indian people in work were the most likely of any ethnic group to work in the highest-skilled occupational groups: over 1 in 10 were in Manager, Director and Senior Official roles and over 3 in 10 were in Professional occupations. People in work from all ethnic groups, except Pakistani and Bangladeshi people, were most likely to work in Public Service industries (such as Education, Health and Public Administration) than in any other industry. In particular, 43% of Black people in work were in Public Service industries compared with 30% of White people.
Participation of men and women
5.9 Among people of working age in each ethnic group, men were more likely to be employed than women. In 2016, around 88% of men who identified as Other White
www.ethnicity-facts-f igures.service.gov.uk
27
were in employment, as were 81% of Indian men, compared with 79% of White British men. Similarly, 73% of women who identified as Other White were in employment compared with 71% of White British women. With just 35% in employment and 59% economically inactive, Pakistani and Bangladeshi women of working age were the least likely to be employed and the most likely to be economically inactive.
Participation over time
5.10 Employment rates have increased for all ethnic groups since 2004, with corresponding decreases in the unemployment and inactivity rates. In particular, the inactivity rate for Pakistani and Bangladeshi people has decreased substantially since 2004 from 49% to 39%, while the unemployment rates for Other Asian people and people who identify with the Other ethnic group have decreased by 3 and 4 percentage points respectively, more than for any other ethnic groups.
Participation by age
5.11 Just over half of people aged 16 to 24 were employed in 2016: a lower employment rate than among older adults in both the 25 to 49, and the 50 to 64, year age groups. Young people were also more likely to be unemployed or inactive than the older age groups. Within each age group, the unemployment rate of White people was around half that of most of the other ethnic groups; for example, among 16 to 24 year olds, 12% of White people were unemployed compared with 23% of people in other ethnic groups. The inactivity rates of 16 to 24 year old and 25 to 49 year old White people were correspondingly around half that of those in other ethnic groups. Young people aged 16 to 24 of Other Asian background had the lowest employment rate and the highest rate of inactivity, but young people from a Mixed ethnic background were the most likely to be inactive due to being in full-time education.
Income
5.12 Relative to the UK population overall, people living in households headed by
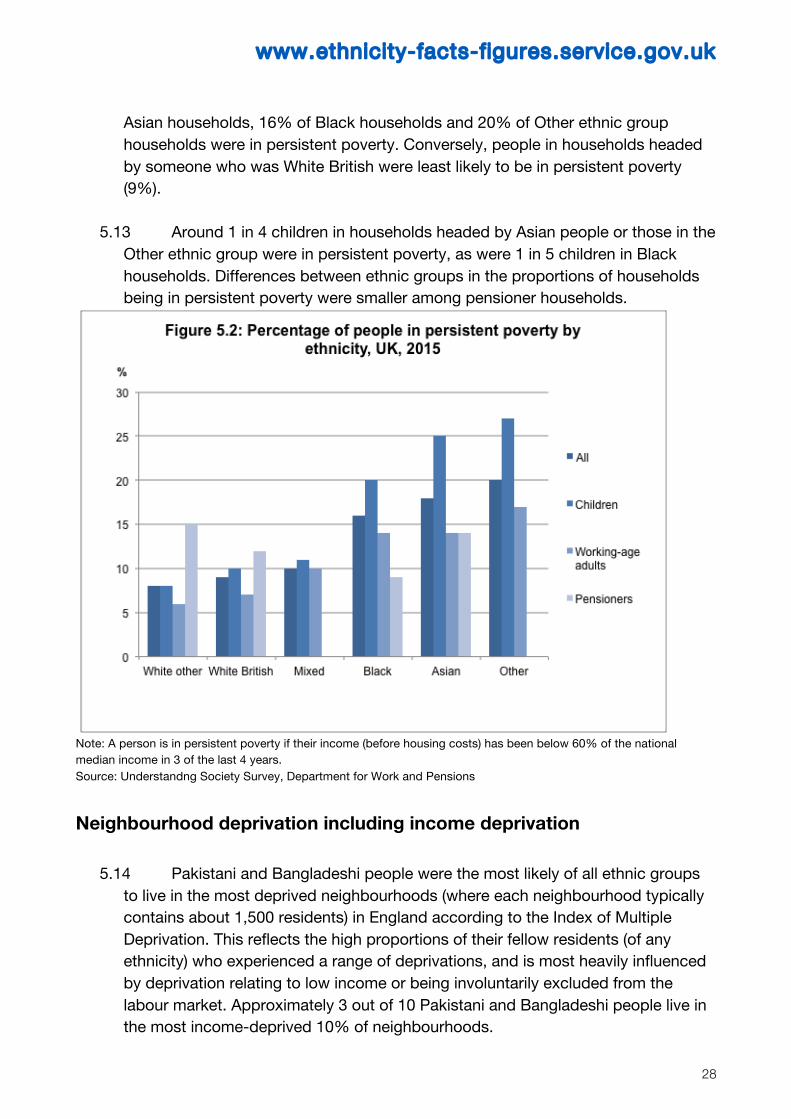
someone in the Asian, Black or Other ethnic groups were disproportionately likely to be on a low income. Almost half of households in these ethnic groups had incomes in the bottom 40% nationally before housing costs were taken into account. These groups were also the most likely to be in persistent poverty, that is, having less than 60% of median income (before housing costs) in 3 of the last 4 years after taking the size and composition of households into account: 18% of
www.ethnicity-facts-f igures.service.gov.uk
28
Asian households, 16% of Black households and 20% of Other ethnic group households were in persistent poverty. Conversely, people in households headed by someone who was White British were least likely to be in persistent poverty (9%).
5.13 Around 1 in 4 children in households headed by Asian people or those in the Other ethnic group were in persistent poverty, as were 1 in 5 children in Black households. Differences between ethnic groups in the proportions of households being in persistent poverty were smaller among pensioner households.
Note: A person is in persistent poverty if their income (before housing costs) has been below 60% of the national median income in 3 of the last 4 years. Source: Understandng Society Survey, Department for Work and Pensions
Neighbourhood deprivation including income deprivation
5.14 Pakistani and Bangladeshi people were the most likely of all ethnic groups to live in the most deprived neighbourhoods (where each neighbourhood typically contains about 1,500 residents) in England according to the Index of Multiple Deprivation. This reflects the high proportions of their fellow residents (of any ethnicity) who experienced a range of deprivations, and is most heavily influenced by deprivation relating to low income or being involuntarily excluded from the labour market. Approximately 3 out of 10 Pakistani and Bangladeshi people live in the most income-deprived 10% of neighbourhoods.
www.ethnicity-facts-f igures.service.gov.uk
29
Amount of income
5.15 The composition of a household affects the number of potential earners, the amount and purchasing power of household income and the number of people to be supported, thus affecting living standards. Black households were more likely to be single parent households, limiting the number of potential earners, whereas Pakistani and Bangladeshi households were more likely to consist of married couples, or extended family households, with dependent children. This data has not allowed for the impact of household composition on total weekly income, and is therefore not a full reflection of living standards.
5.16 In terms of actual amounts of income, Black households and those from
Other ethnic groups were most likely to have gross weekly income from all sources of less than £400 with over 1 in 3 households in this income bracket. Conversely, around 1 in 3 households in the Indian or Other Asian groups had a gross weekly income of £1,000 or more, and households in these groups were twice as likely to be in this income bracket as Pakistani or Black households.
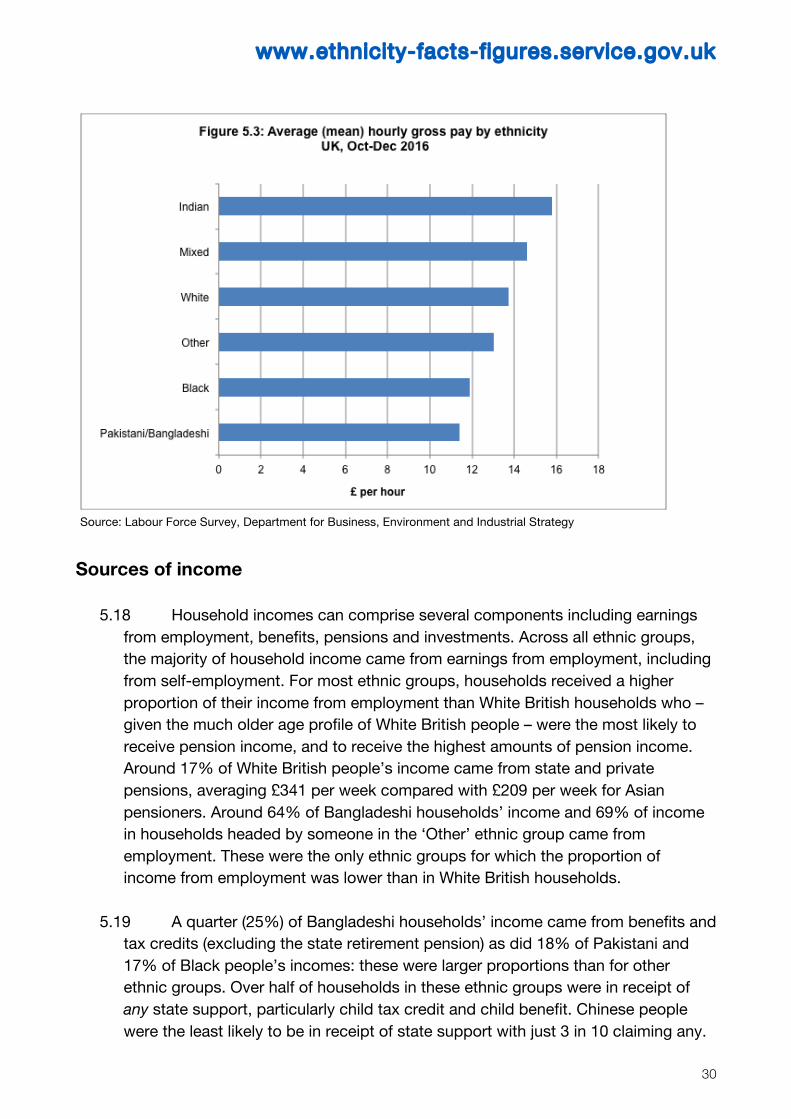
5.17 There were wide variations in gross earnings from employment between
ethnic groups: among those working as an employee, people in the Pakistani or Bangladeshi group and Black people received the lowest average hourly pay whereas Indian people received the highest. Average hourly pay (before deductions) for employees in the Pakistani or Bangladeshi group was £11.42 in the last three months of 2016, which was £4.39 per hour less than Indian employees.
www.ethnicity-facts-f igures.service.gov.uk
30
Source: Labour Force Survey, Department for Business, Environment and Industrial Strategy
Sources of income
5.18 Household incomes can comprise several components including earnings from employment, benefits, pensions and investments. Across all ethnic groups, the majority of household income came from earnings from employment, including from self-employment. For most ethnic groups, households received a higher proportion of their income from employment than White British households who – given the much older age profile of White British people – were the most likely to receive pension income, and to receive the highest amounts of pension income. Around 17% of White British people’s income came from state and private pensions, averaging £341 per week compared with £209 per week for Asian pensioners. Around 64% of Bangladeshi households’ income and 69% of income in households headed by someone in the ‘Other’ ethnic group came from employment. These were the only ethnic groups for which the proportion of income from employment was lower than in White British households.
5.19 A quarter (25%) of Bangladeshi households’ income came from benefits and tax credits (excluding the state retirement pension) as did 18% of Pakistani and 17% of Black people’s incomes: these were larger proportions than for other ethnic groups. Over half of households in these ethnic groups were in receipt of any state support, particularly child tax credit and child benefit. Chinese people were the least likely to be in receipt of state support with just 3 in 10 claiming any.

www.ethnicity-facts-f igures.service.gov.uk
31
6. Housing
6.1 This section reviews data for England on home ownership and renting from a social or
private landlord, and also on overcrowding, homelessness and the concentration of ethnic groups in areas of multiple deprivation from the Department for Communities and Local Government.
Home ownership and renting
6.2 Around 2 out of every 3 White British householders owned their home either outright
or with a mortgage in 2015/16, but only 2 out 5 householders from all other ethnic groups combined did. Compared with all other households, White British householders were most likely to own their own home within every region of the country, every socio-economic group and income band, as well as all age groups.
6.3 Households of Indian, Pakistani, and Mixed White and Asian ethnicity had similar rates of home ownership to White British households, of whom 68% owned their homes. Apart from these groups, households in all other groups were less likely to be home owners than White British households. Fewer than 1 in 4 African, Arab, and Mixed White and Black African households were owner-occupiers.
6.4 White British households were correspondingly less likely to rent either privately or
from a social landlord than all other households: 16% of them rented from a social landlord, compared with 22% of all other households, and a further 16% rented from a private landlord compared with 37% of others.
6.5 The households most likely to rent social housing were in the African, Caribbean,
Other Black, Bangladeshi, Irish, Arab and mixed groups (with the exception of the mixed White and Asian group).
6.6 There were just over 3.9 million households living in the social rented sector, of which
almost 3.1 million, or 79%, were White British. For the purposes of comparison, White British households make up 83% of all households in England.
www.ethnicity-facts-f igures.service.gov.uk
32
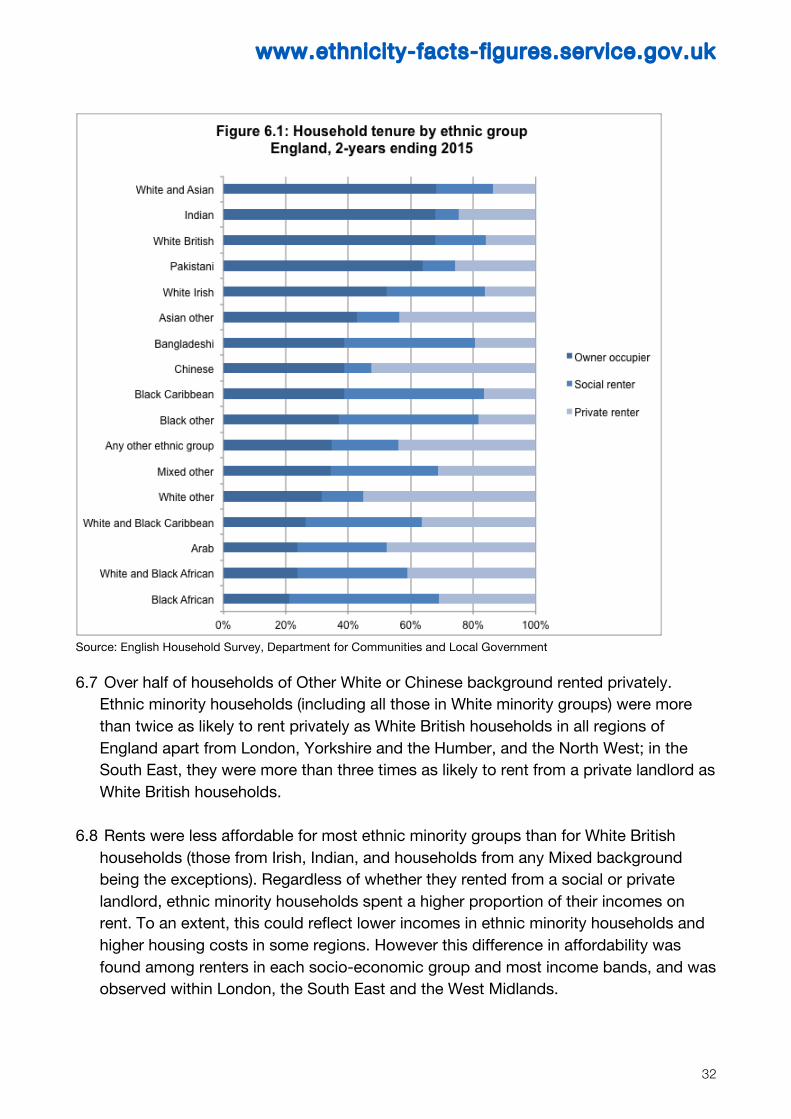
Source: English Household Survey, Department for Communities and Local Government 6.7 Over half of households of Other White or Chinese background rented privately.
Ethnic minority households (including all those in White minority groups) were more than twice as likely to rent privately as White British households in all regions of England apart from London, Yorkshire and the Humber, and the North West; in the South East, they were more than three times as likely to rent from a private landlord as White British households.
6.8 Rents were less affordable for most ethnic minority groups than for White British households (those from Irish, Indian, and households from any Mixed background being the exceptions). Regardless of whether they rented from a social or private landlord, ethnic minority households spent a higher proportion of their incomes on rent. To an extent, this could reflect lower incomes in ethnic minority households and higher housing costs in some regions. However this difference in affordability was found among renters in each socio-economic group and most income bands, and was observed within London, the South East and the West Midlands.

www.ethnicity-facts-f igures.service.gov.uk
33
Living standards and deprivation 6.9 Poor quality of housing was an issue for some groups, and Pakistani households
were more likely to live in non-decent homes than White British households. Overcrowding, which reflects both family sizes as well as the nature and affordability of the local housing stock, was more common among ethnic minority households in general. Overcrowding affected 30% of Bangladeshi households in 2015/16, a far higher proportion than of White British households (2%). However White British households made up almost half of the 660,000 overcrowded households in England. Compared with all other regions, London had the highest rates of overcrowding, affecting 13% of ethnic minority households and 3% of White British households.
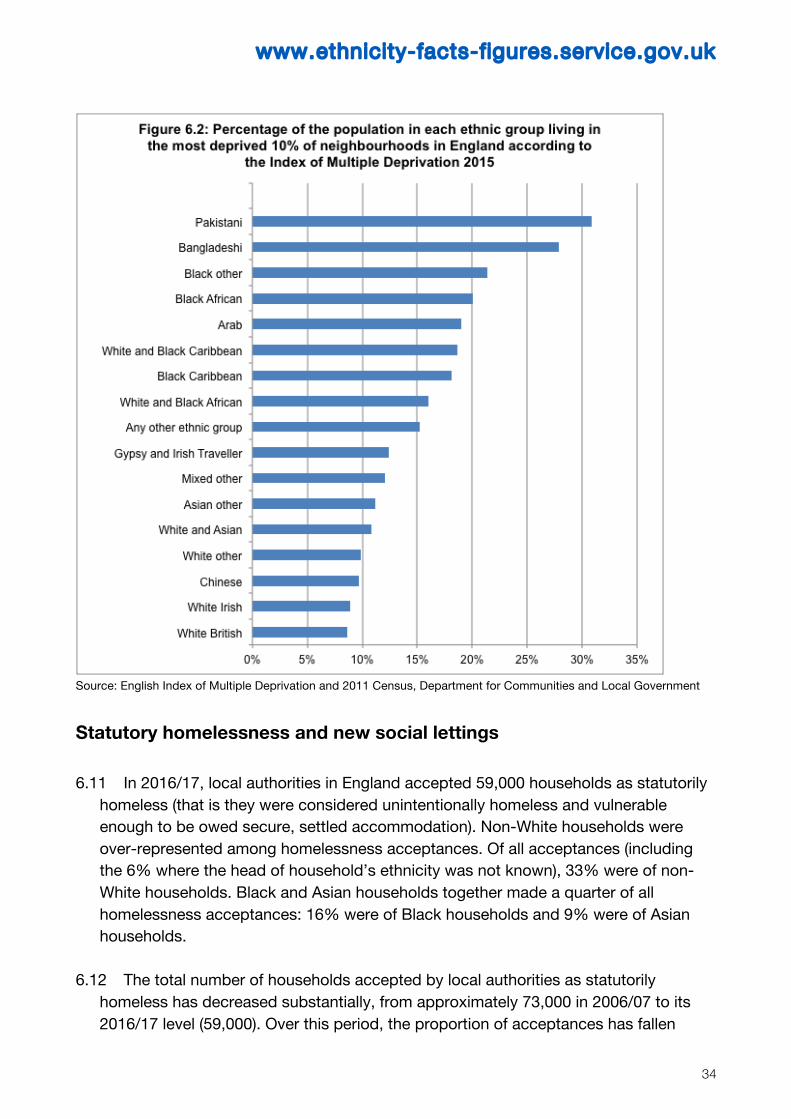
6.10 People in the most deprived neighbourhoods tend to be disadvantaged across multiple aspects of life. Pakistani and Bangladeshi people were overrepresented in the most deprived neighbourhoods in England: 31% or around 343,000 of the Pakistani population and 28% or around 113,000 of the Bangladeshi population lived in the most deprived 10% of neighbourhoods in England. (By definition, 10% of the population overall lives in the most deprived 10% of neighbourhoods.) All the Black ethnic groups were also disproportionately likely to live in the most deprived neighbourhoods. Only Indian, White British, White Irish, Chinese and Other White ethnic groups were not disproportionately likely to live in these most deprived neighbourhoods.
www.ethnicity-facts-f igures.service.gov.uk
34
Source: English Index of Multiple Deprivation and 2011 Census, Department for Communities and Local Government
Statutory homelessness and new social lettings
6.11 In 2016/17, local authorities in England accepted 59,000 households as statutorily
homeless (that is they were considered unintentionally homeless and vulnerable enough to be owed secure, settled accommodation). Non-White households were over-represented among homelessness acceptances. Of all acceptances (including the 6% where the head of household’s ethnicity was not known), 33% were of non-White households. Black and Asian households together made a quarter of all homelessness acceptances: 16% were of Black households and 9% were of Asian households.
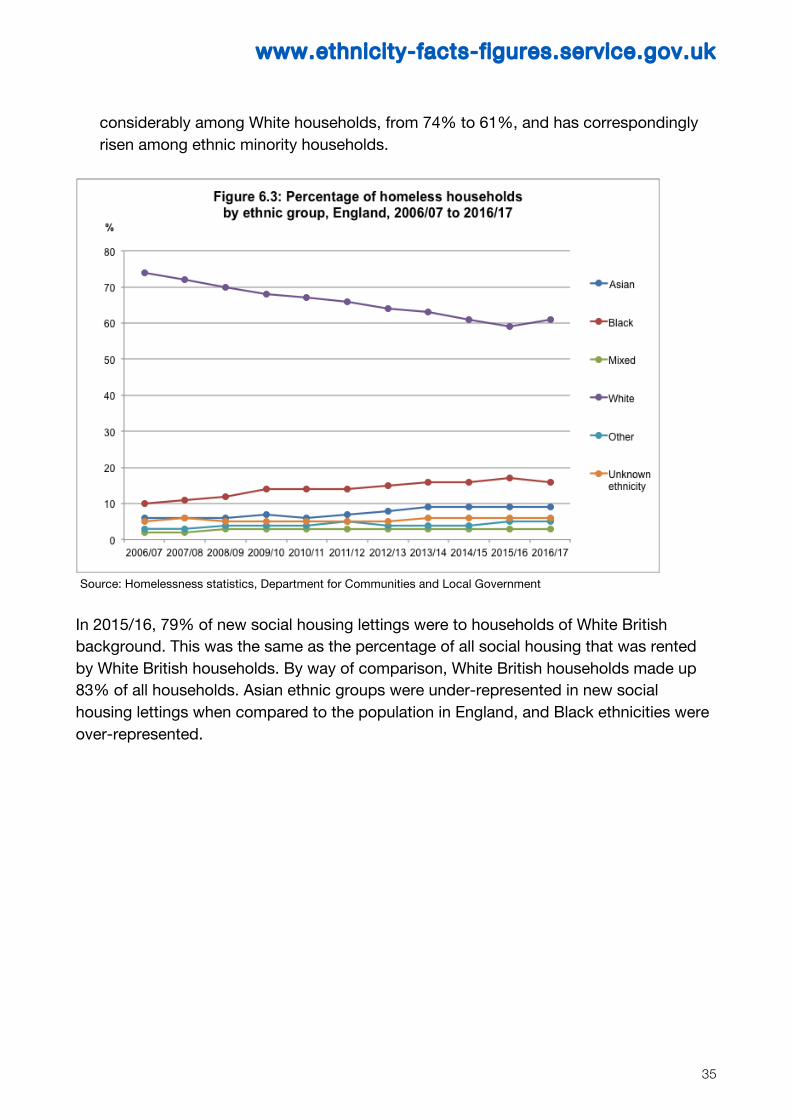
6.12 The total number of households accepted by local authorities as statutorily homeless has decreased substantially, from approximately 73,000 in 2006/07 to its 2016/17 level (59,000). Over this period, the proportion of acceptances has fallen
www.ethnicity-facts-f igures.service.gov.uk
35
considerably among White households, from 74% to 61%, and has correspondingly risen among ethnic minority households.
Source: Homelessness statistics, Department for Communities and Local Government In 2015/16, 79% of new social housing lettings were to households of White British background. This was the same as the percentage of all social housing that was rented by White British households. By way of comparison, White British households made up 83% of all households. Asian ethnic groups were under-represented in new social housing lettings when compared to the population in England, and Black ethnicities were over-represented.
www.ethnicity-facts-f igures.service.gov.uk
36
7. Cr ime and pol icing
7.1 This section reviews data on fear of crime, victims of crime, stop and search actions and arrests in England and Wales.
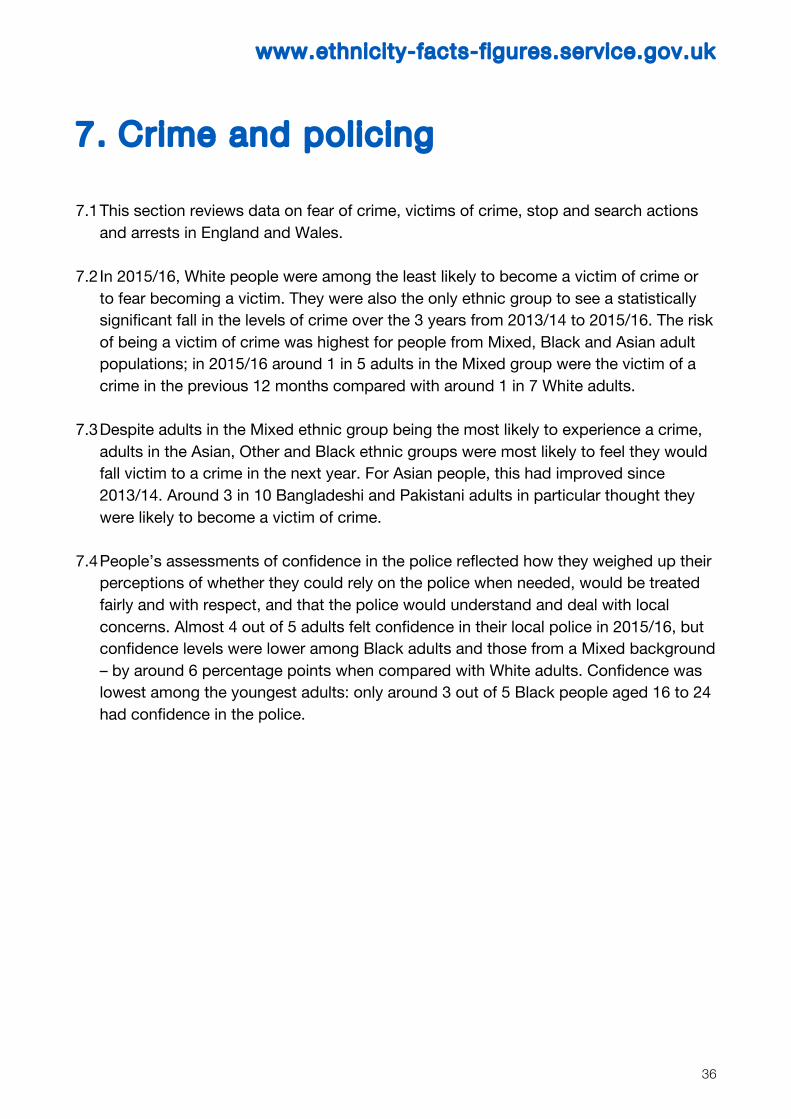
7.2 In 2015/16, White people were among the least likely to become a victim of crime or to fear becoming a victim. They were also the only ethnic group to see a statistically significant fall in the levels of crime over the 3 years from 2013/14 to 2015/16. The risk of being a victim of crime was highest for people from Mixed, Black and Asian adult populations; in 2015/16 around 1 in 5 adults in the Mixed group were the victim of a crime in the previous 12 months compared with around 1 in 7 White adults.
7.3 Despite adults in the Mixed ethnic group being the most likely to experience a crime,
adults in the Asian, Other and Black ethnic groups were most likely to feel they would fall victim to a crime in the next year. For Asian people, this had improved since 2013/14. Around 3 in 10 Bangladeshi and Pakistani adults in particular thought they were likely to become a victim of crime.
7.4 People’s assessments of confidence in the police reflected how they weighed up their
perceptions of whether they could rely on the police when needed, would be treated fairly and with respect, and that the police would understand and deal with local concerns. Almost 4 out of 5 adults felt confidence in their local police in 2015/16, but confidence levels were lower among Black adults and those from a Mixed background – by around 6 percentage points when compared with White adults. Confidence was lowest among the youngest adults: only around 3 out of 5 Black people aged 16 to 24 had confidence in the police.
www.ethnicity-facts-f igures.service.gov.uk
37
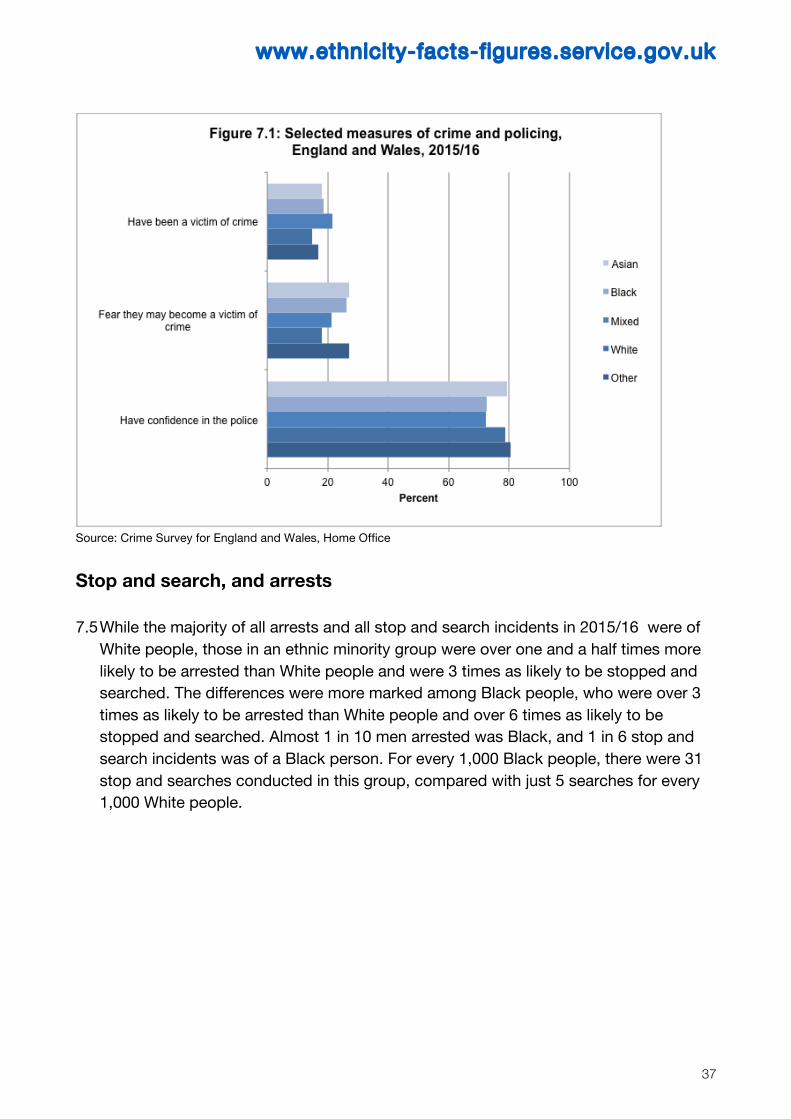
Source: Crime Survey for England and Wales, Home Office Stop and search, and arrests 7.5 While the majority of all arrests and all stop and search incidents in 2015/16 were of
White people, those in an ethnic minority group were over one and a half times more likely to be arrested than White people and were 3 times as likely to be stopped and searched. The differences were more marked among Black people, who were over 3 times as likely to be arrested than White people and over 6 times as likely to be stopped and searched. Almost 1 in 10 men arrested was Black, and 1 in 6 stop and search incidents was of a Black person. For every 1,000 Black people, there were 31 stop and searches conducted in this group, compared with just 5 searches for every 1,000 White people.
www.ethnicity-facts-f igures.service.gov.uk
38
Source: Arrests Open Data, Home Office
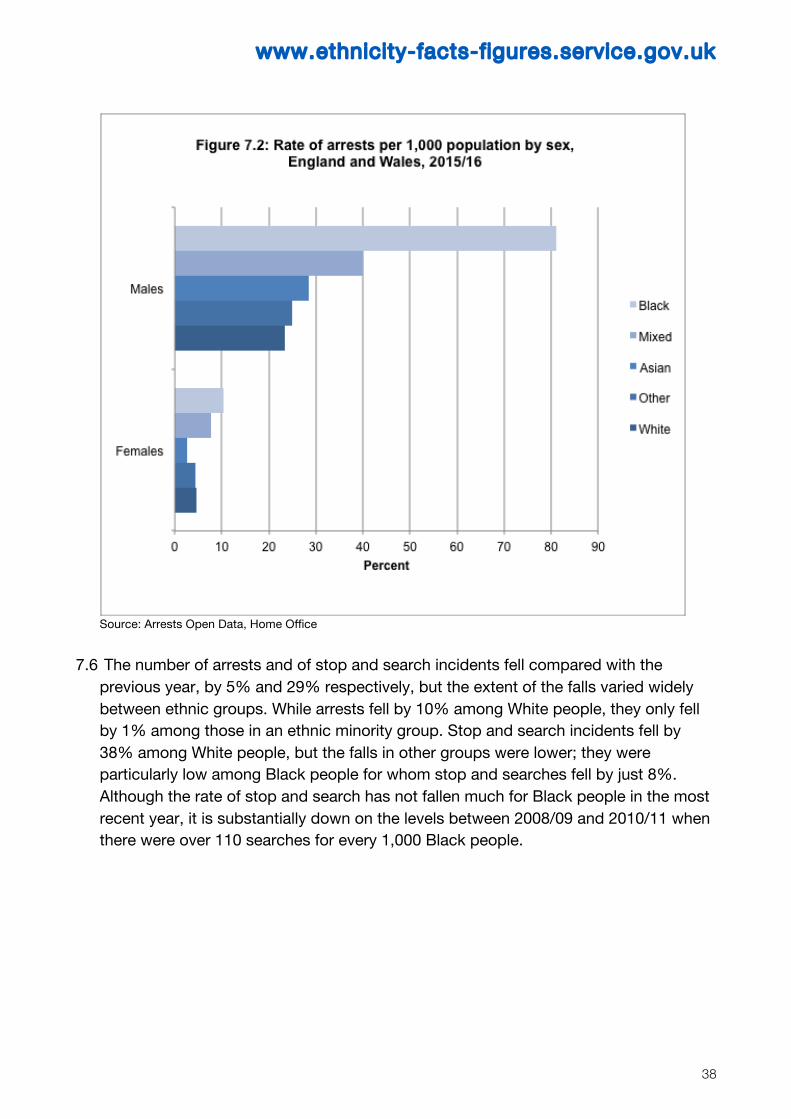
7.6 The number of arrests and of stop and search incidents fell compared with the previous year, by 5% and 29% respectively, but the extent of the falls varied widely between ethnic groups. While arrests fell by 10% among White people, they only fell by 1% among those in an ethnic minority group. Stop and search incidents fell by 38% among White people, but the falls in other groups were lower; they were particularly low among Black people for whom stop and searches fell by just 8%. Although the rate of stop and search has not fallen much for Black people in the most recent year, it is substantially down on the levels between 2008/09 and 2010/11 when there were over 110 searches for every 1,000 Black people.
www.ethnicity-facts-f igures.service.gov.uk
39
Source: Policing Statistics, Home Office 7.7 Wide variations in the rates of arrest among ethnic groups around the UK in part
reflect the ethnic makeup of different areas. In the London Metropolitan police force area, 51% of people arrested were from an ethnic minority background (the highest percentage in all police force areas). By comparison, the ethnic minority population made up 40% of the total in London.
7.8 In 2015/16, the London Metropolitan police force area had the highest rate of stop and search overall, at 19 for every 1,000 people resident, but among Black people this was 42 per 1,000 of the resident Black population. Care is required in comparing rates of stop and search between police force areas – especially those with high numbers of visitors – because they are based on the resident population in each ethnic group. For example, in Dorset and Sussex police force areas, the rates of stop and search of Black people were very high relative to the resident Black population. Even so, whereas a third of all stop and searches in the Metropolitan police force area were of Black people, a far lower proportion of stop and searches in Dorset (1 in 13) and Sussex (1 in 12) were of Black people.
www.ethnicity-facts-f igures.service.gov.uk
40
8. Cr iminal Justice System
8.1 This section reviews England and Wales data on youth cautions, remand,
prosecutions, convictions and sentencing for indictable offences, young people in custody, and violence and self harm among prisoners. These statistics do not take into account any other contextual factors such as the offences dealt with, which may differ by ethnic group.
8.2 The figures for convictions and sentencing relate to indictable offences only. Indictable offences include triable-either-way offences, which can be committed to the Crown Court but may also be dealt with in the magistrate court), and indictable only offences, which must be committed to the Crown Court. Data on ethnicity is not of sufficient quality to report on summary offences which are typically less severe and heard entirely at magistrates’ courts.The figures also relate to the principal offences for which defendants were dealt with: if a defendant is found guilty of more than one offence, this is the one carrying the heaviest penalty.
Convictions and sentencing 8.3 While a person accused of a crime stands trial, they may be remanded in custody or
on bail, or they may not be remanded at all during the period leading up to, and during, the trial. Regardless of their ethnic group, defendants that were remanded at the Crown Court for an indictable offence in 2016 were more likely to receive bail than to be remanded in custody. However, Black defendants at the Crown Court, particularly Black males, were the most likely to be remanded in custody, whereas White and Asian defendants were less likely to be remanded in custody.
8.4 Young people aged 10 to 17 may be given a youth caution. This is a formal out-of-court disposal that can be used as an alternative to prosecution. The number of youth cautions has decreased substantially since 2005/06, but the proportion given to different ethnic minority groups has remained broadly similar, with the vast majority (86%) given to White young people.
8.5 Of all defendants prosecuted for an indictable offence in 2016 where ethnicity was
known, the proportion of White defendants was 79%, Black defendants made up 11%, Asian defendants (6%), Mixed defendants (3%) and Chinese or Other defendants (1%). These proportions have remained relatively stable since 2009.
www.ethnicity-facts-f igures.service.gov.uk
41
8.6 The conviction ratio (number of offenders convicted as a proportion of the number prosecuted) for indictable offences tried at Crown Court has increased for all ethnic groups since 2009. In 2016, White defendants had the highest conviction ratio at 86%, while all other ethnic groups had conviction ratios of 81%. White defendants had the highest conviction ratios for both men and women, although conviction ratios ranged more widely among women from 73% for Asian women to 85% for White women; for men it was from 81% for Asian and Black men to 86% for White men.
8.7 Across all ethnic groups the conviction ratio was lower for juveniles than adults. The
lowest conviction ratio for juveniles in 2016 was among Black defendants (69%); the conviction ratio for juveniles from all other ethnic groups ranged between 71% and 73%.
8.8 The custody rate is the proportion of offenders sentenced for an indictable offence
who received an immediate custodial sentence, as opposed to another sentence such as a community sentence or a suspended sentence. In 2016, of all offenders, both adults and young people, who were sentenced for indictable or triable-either-way offences, Asian offenders had the highest custody rate (35%), whereas the rates for all other ethnic groups ranged from 31% to 33%. Between 2009 and 2016, the custody rates for White and Mixed offenders increased by over 8 percentage points each; these were the biggest increases over the period.
8.9 Adult offenders had a higher custody rate than both young adult offenders (age 18 to
20 years) and juvenile offenders (age 10 to 17 years). White offenders in all age groups were the least likely to receive an immediate custodial sentence. Of juvenile and adult offenders, Asian offenders were most likely to receive an immediate custodial sentence, with 13% of Asian juveniles and 37% of Asian adults receiving custodial sentences. For young adults, those from a Mixed ethnic background had the highest custody rate at 31%.
8.10 Of all adult offenders sentenced to immediate custody for an indictable offence in
2016, 79% were White and the remaining 21% were from all other ethnic minority groups. For juvenile offenders, 61% were White and 39% were from all other ethnic groups. Black offenders made up 22% of all juvenile offenders sentenced to immediate custody for an indictable offence.
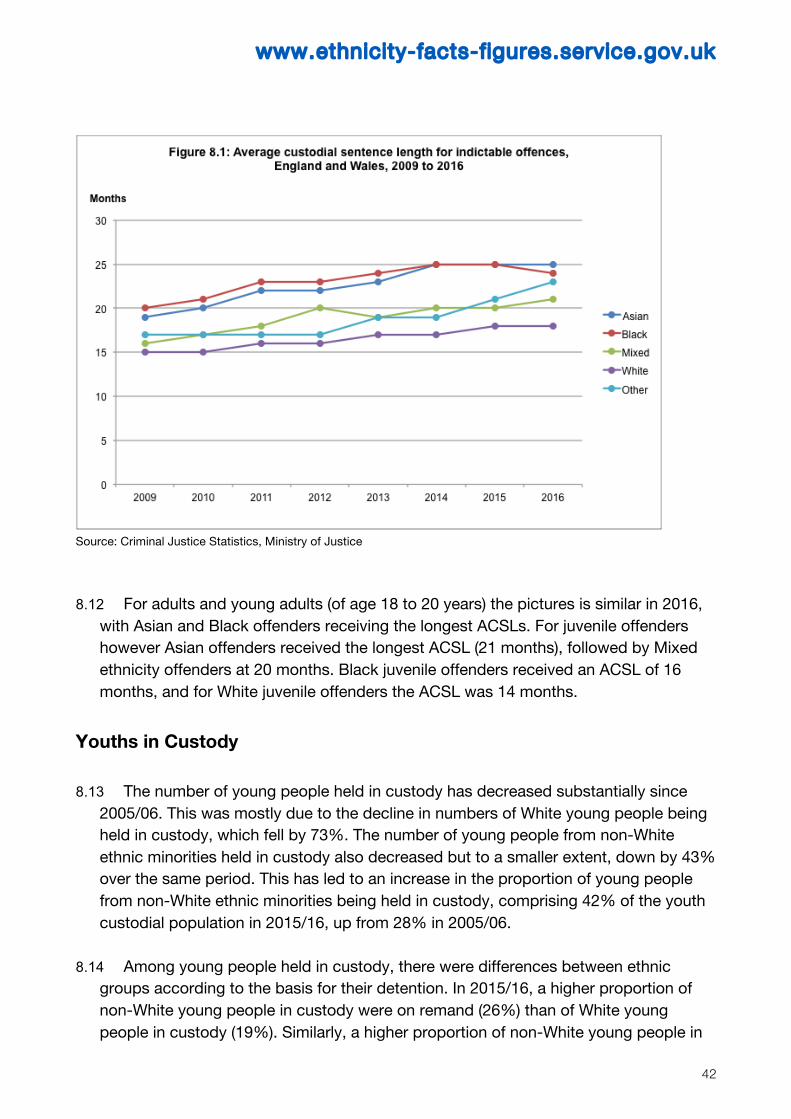
8.11 For all offenders including juveniles, the average custodial sentence length (ACSL)
for indictable offences has increased for all ethnic groups since 2009. White offenders consistently received the shortest ACSLs. In 2016, the ACSL for White offenders was 18 months whereas Black and Asian offenders received the longest ACSLs at 24 and 25 months respectively.
www.ethnicity-facts-f igures.service.gov.uk
42
Source: Criminal Justice Statistics, Ministry of Justice 8.12 For adults and young adults (of age 18 to 20 years) the pictures is similar in 2016,
with Asian and Black offenders receiving the longest ACSLs. For juvenile offenders however Asian offenders received the longest ACSL (21 months), followed by Mixed ethnicity offenders at 20 months. Black juvenile offenders received an ACSL of 16 months, and for White juvenile offenders the ACSL was 14 months.
Youths in Custody 8.13 The number of young people held in custody has decreased substantially since
2005/06. This was mostly due to the decline in numbers of White young people being held in custody, which fell by 73%. The number of young people from non-White ethnic minorities held in custody also decreased but to a smaller extent, down by 43% over the same period. This has led to an increase in the proportion of young people from non-White ethnic minorities being held in custody, comprising 42% of the youth custodial population in 2015/16, up from 28% in 2005/06.
8.14 Among young people held in custody, there were differences between ethnic groups according to the basis for their detention. In 2015/16, a higher proportion of non-White young people in custody were on remand (26%) than of White young people in custody (19%). Similarly, a higher proportion of non-White young people in
www.ethnicity-facts-f igures.service.gov.uk
43
custody were detained on Section 91 sentences which are for more serious offences (25% compared to 19% for White young people) while proportionately more White young people in custody were serving a Detention and Training Order (DTO) than non-White young people (58% compared to 44%). The first half of a DTO is served in custody, the second half is served in the community.
8.15 Of all young people in custody, a greater proportion of non-White offenders had
committed offences of violence against the person (40%), robbery (27%) and drugs (13%) than White offenders (30%, 23% and 4% respectively).
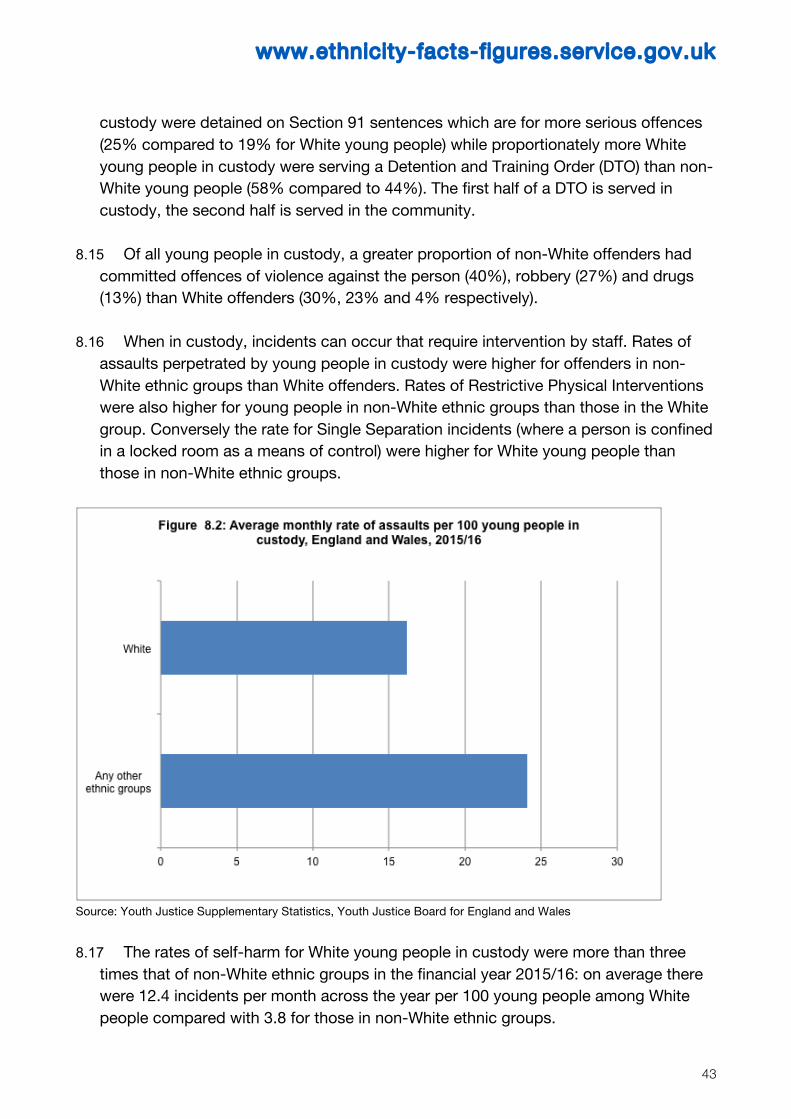
8.16 When in custody, incidents can occur that require intervention by staff. Rates of
assaults perpetrated by young people in custody were higher for offenders in non-White ethnic groups than White offenders. Rates of Restrictive Physical Interventions were also higher for young people in non-White ethnic groups than those in the White group. Conversely the rate for Single Separation incidents (where a person is confined in a locked room as a means of control) were higher for White young people than those in non-White ethnic groups.
Source: Youth Justice Supplementary Statistics, Youth Justice Board for England and Wales 8.17 The rates of self-harm for White young people in custody were more than three
times that of non-White ethnic groups in the financial year 2015/16: on average there were 12.4 incidents per month across the year per 100 young people among White people compared with 3.8 for those in non-White ethnic groups.
www.ethnicity-facts-f igures.service.gov.uk
44
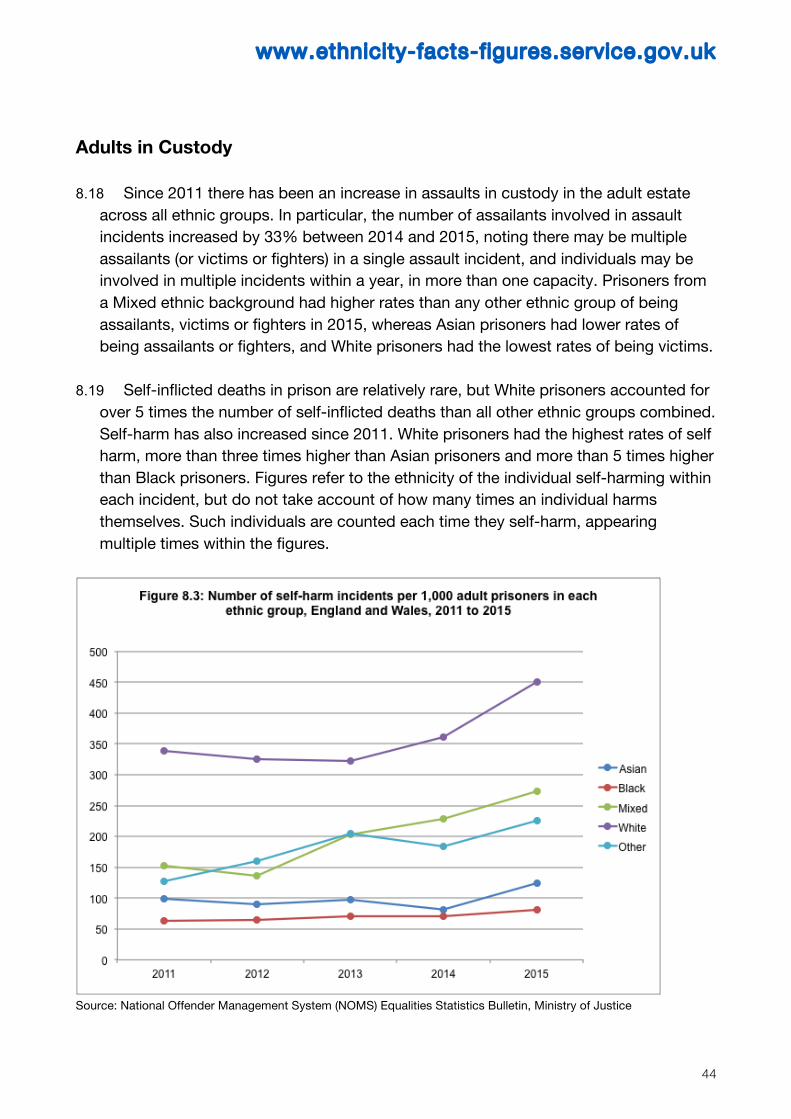
Adults in Custody 8.18 Since 2011 there has been an increase in assaults in custody in the adult estate
across all ethnic groups. In particular, the number of assailants involved in assault incidents increased by 33% between 2014 and 2015, noting there may be multiple assailants (or victims or fighters) in a single assault incident, and individuals may be involved in multiple incidents within a year, in more than one capacity. Prisoners from a Mixed ethnic background had higher rates than any other ethnic group of being assailants, victims or fighters in 2015, whereas Asian prisoners had lower rates of being assailants or fighters, and White prisoners had the lowest rates of being victims.
8.19 Self-inflicted deaths in prison are relatively rare, but White prisoners accounted for over 5 times the number of self-inflicted deaths than all other ethnic groups combined. Self-harm has also increased since 2011. White prisoners had the highest rates of self harm, more than three times higher than Asian prisoners and more than 5 times higher than Black prisoners. Figures refer to the ethnicity of the individual self-harming within each incident, but do not take account of how many times an individual harms themselves. Such individuals are counted each time they self-harm, appearing multiple times within the figures.
Source: National Offender Management System (NOMS) Equalities Statistics Bulletin, Ministry of Justice

www.ethnicity-facts-f igures.service.gov.uk
45
Reoffending 8.20 In 2014, rates of reoffending ranged from 29% among Black offenders to 18% of
those in the Other ethnic group. Black offenders had the highest rate of reoffending compared to other ethnic groups from 2006 to 2014, and in all regions of England and Wales except the North West and Yorkshire and the Humber. In interpreting comparisons of reoffending rates between ethnic groups, it should be borne in mind that they do not take account of important factors such as the nature of the offence or the number of previous offences.
www.ethnicity-facts-f igures.service.gov.uk
46
9. Health
9.1 There is a wealth of data collected about health and NHS services. Key sources for
understanding health outcomes include the NHS Outcomes Framework, Social Care Outcomes Framework and the Public Health Outcomes Framework. This audit has only been able to present a selection of data and focuses on indicators published with ethnicity breakdowns, predominantly from the NHS and Public Health Outcome Frameworks. The Audit considered some data on patients’ experience of NHS services, and on preventable ill health, but has more limited coverage of people’s physical health or patient outcomes following treatment.
9.2 The Audit’s coverage of mental health has been broader, with data on the mental health of the adult general population and on treatments including secondary health services, and their outcomes.
9.3 Understanding ethnic disparities in health is complex and involves considering a
range of factors, including socio-economic, demographic and cultural factors. For some, but not all data it has been possible to take account of gender and differences in the age profile between ethnic groups. The context of a person’s ‘health pathway’ is also important. For instance, health outcomes and people’s satisfaction with health care depend on their behaviours and measures for the prevention of illness, their health conditions, location and access to health services, as well as the success of their treatment. Where possible, the Audit has attempted to present data in themes that support the concept of a person’s health pathway.
Preventing ill health
9.4 Among older people, aged 65 and over, those in four ethnic groups – Pakistani,
Bangladeshi, Gypsy and Irish Traveller, and Arab – have particularly poor health-related quality of life, taking account of their mobility, self-care, usual activities, pain and discomfort, anxiety and depression. Health-related quality of life among older people was highest in the Other Asian group.
9.5 There were wide differences between ethnic groups across a range of health-related behaviours and preventable poor outcomes. The picture is complex as the ethnic groups exhibited both healthy and unhealthy behaviours. For example White British adults were the most likely to eat the recommended portions of fruit and vegetables each day but were also among the most likely to be overweight (having a Body Mass
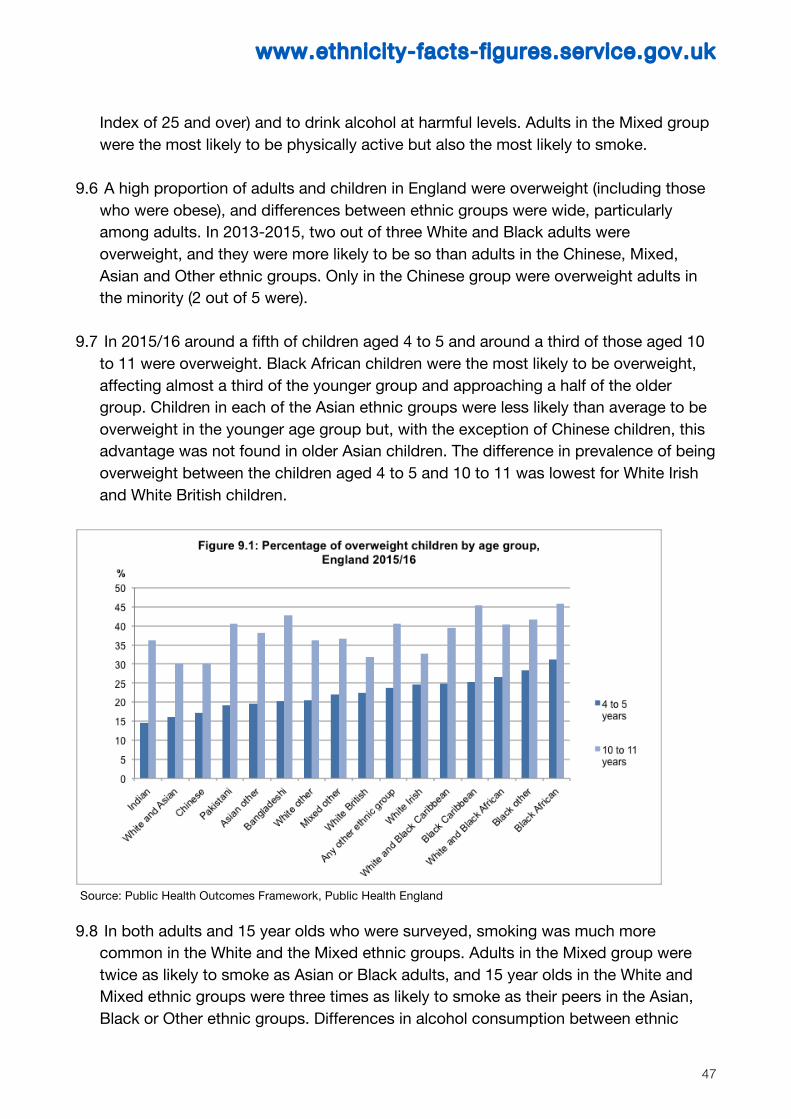
www.ethnicity-facts-f igures.service.gov.uk
47
Index of 25 and over) and to drink alcohol at harmful levels. Adults in the Mixed group were the most likely to be physically active but also the most likely to smoke.
9.6 A high proportion of adults and children in England were overweight (including those
who were obese), and differences between ethnic groups were wide, particularly among adults. In 2013-2015, two out of three White and Black adults were overweight, and they were more likely to be so than adults in the Chinese, Mixed, Asian and Other ethnic groups. Only in the Chinese group were overweight adults in the minority (2 out of 5 were).
9.7 In 2015/16 around a fifth of children aged 4 to 5 and around a third of those aged 10
to 11 were overweight. Black African children were the most likely to be overweight, affecting almost a third of the younger group and approaching a half of the older group. Children in each of the Asian ethnic groups were less likely than average to be overweight in the younger age group but, with the exception of Chinese children, this advantage was not found in older Asian children. The difference in prevalence of being overweight between the children aged 4 to 5 and 10 to 11 was lowest for White Irish and White British children.
Source: Public Health Outcomes Framework, Public Health England 9.8 In both adults and 15 year olds who were surveyed, smoking was much more
common in the White and the Mixed ethnic groups. Adults in the Mixed group were twice as likely to smoke as Asian or Black adults, and 15 year olds in the White and Mixed ethnic groups were three times as likely to smoke as their peers in the Asian, Black or Other ethnic groups. Differences in alcohol consumption between ethnic
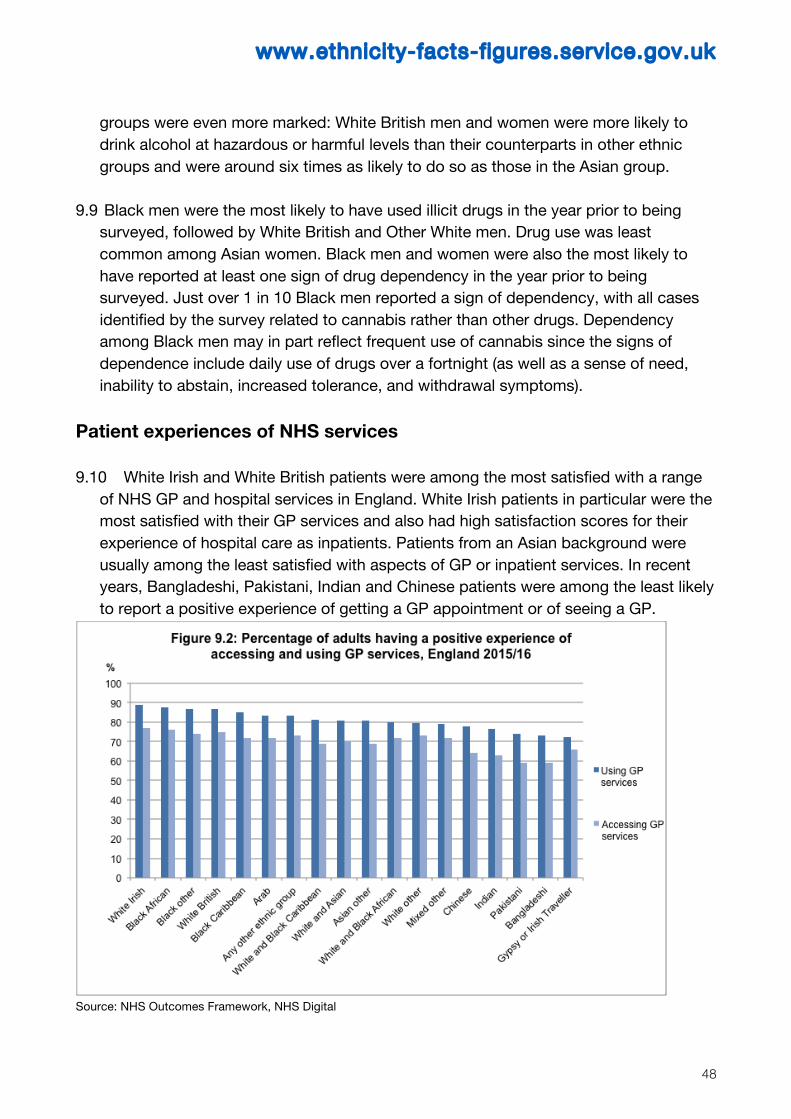
www.ethnicity-facts-f igures.service.gov.uk
48
groups were even more marked: White British men and women were more likely to drink alcohol at hazardous or harmful levels than their counterparts in other ethnic groups and were around six times as likely to do so as those in the Asian group.
9.9 Black men were the most likely to have used illicit drugs in the year prior to being surveyed, followed by White British and Other White men. Drug use was least common among Asian women. Black men and women were also the most likely to have reported at least one sign of drug dependency in the year prior to being surveyed. Just over 1 in 10 Black men reported a sign of dependency, with all cases identified by the survey related to cannabis rather than other drugs. Dependency among Black men may in part reflect frequent use of cannabis since the signs of dependence include daily use of drugs over a fortnight (as well as a sense of need, inability to abstain, increased tolerance, and withdrawal symptoms).
Patient experiences of NHS services 9.10 White Irish and White British patients were among the most satisfied with a range
of NHS GP and hospital services in England. White Irish patients in particular were the most satisfied with their GP services and also had high satisfaction scores for their experience of hospital care as inpatients. Patients from an Asian background were usually among the least satisfied with aspects of GP or inpatient services. In recent years, Bangladeshi, Pakistani, Indian and Chinese patients were among the least likely to report a positive experience of getting a GP appointment or of seeing a GP.
Source: NHS Outcomes Framework, NHS Digital
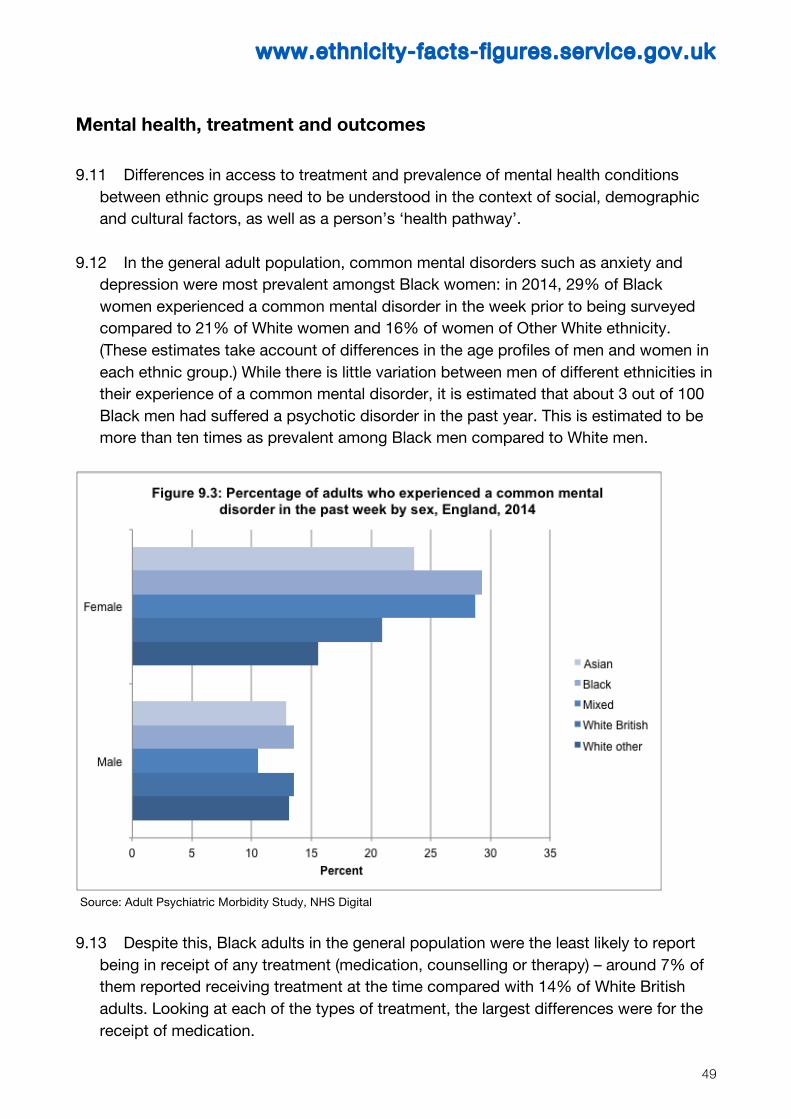
www.ethnicity-facts-f igures.service.gov.uk
49
Mental health, treatment and outcomes 9.11 Differences in access to treatment and prevalence of mental health conditions
between ethnic groups need to be understood in the context of social, demographic and cultural factors, as well as a person’s ‘health pathway’.
9.12 In the general adult population, common mental disorders such as anxiety and depression were most prevalent amongst Black women: in 2014, 29% of Black women experienced a common mental disorder in the week prior to being surveyed compared to 21% of White women and 16% of women of Other White ethnicity. (These estimates take account of differences in the age profiles of men and women in each ethnic group.) While there is little variation between men of different ethnicities in their experience of a common mental disorder, it is estimated that about 3 out of 100 Black men had suffered a psychotic disorder in the past year. This is estimated to be more than ten times as prevalent among Black men compared to White men.
Source: Adult Psychiatric Morbidity Study, NHS Digital 9.13 Despite this, Black adults in the general population were the least likely to report
being in receipt of any treatment (medication, counselling or therapy) – around 7% of them reported receiving treatment at the time compared with 14% of White British adults. Looking at each of the types of treatment, the largest differences were for the receipt of medication.
www.ethnicity-facts-f igures.service.gov.uk
50
9.14 Having been referred to psychological therapies, patients in some ethnic groups
have better outcomes than others. Both men and women were most likely to see a recovery if they were White (British, Irish or Other White) and least likely to if they were Bangladeshi, Pakistani, or identified as Other Asian or the Other ethnic group.
9.15 Around 4,800 in every 100,000 Black British or Black Caribbean adults were in contact with NHS funded adult secondary mental health and learning disability services in 2014/15 compared with around 3,600 in every 100,000 adults overall. The highest rates were among adults in the Other Black and Other ethnic groups, but this is thought to reflect recording practices whereby patients’ ethnicities were often not collected in sufficient detail. As a result, rates of contact for specific ethnic groups, and particularly among Black ethnic groups, are likely to be under-estimated. Black Caribbean adults were also the most likely to have been detained under the Mental Health Act.
www.ethnicity-facts-f igures.service.gov.uk
51
10. Publ ic Sector Workforce
10.1 One of the primary uses of ethnicity statistics collected about the public sector workforce is to identify which organisations are succeeding in recruiting a diverse range of employees. Statistics can also identify whether or not people from ethnic minority backgrounds are reaching senior levels within organisations. However, the statistics do not take account of specific skill sets or career paths that may be be required to reach more senior levels.
10.2 Across the public sector workforce, there is a high level of unknown or undisclosed information on ethnicity, which can make it difficult to draw firm conclusions about differences between ethnic groups. This section reviews data about the workforce in the police and criminal justice system, the NHS, state schools, armed forces and the Civil Service.
Police and criminal justice system 10.3 In 2016, 94% of prison officers in England and Wales who disclosed their ethnicity
were White; 14% of prison officers did not disclose their ethnic group.
10.4 Overall in 2016, around 1 police officer in every 17 was from a non-white ethnic minority group, and this proportion has been increasing over the past decade. This differed greatly by rank, type of work and geography, although there has been a slight increase in the proportion of officers from a non-white background over the last 10 years.
10.5 Police officers from non-White ethnic minority groups were more concentrated in
lower ranks, with a higher proportion of officers from non-White groups at the rank of constable: 85% were constables, 14% were in the sergeant or inspector ranks, and 1% were at the most senior ranks of chief inspector, superintendent, chief superintendent and chief officer. This compared with 77% of White officers being constables, 20% being in the sergeant or inspector ranks, and 2% being at the most senior ranks. The proportion of people from non-White ethnic groups working as police officers was smaller than in other roles within the police workforce. The volunteer, part-time Special Constabulary was the most ethnically diverse part of this workforce with 12% being from a non-White ethnic minority group, followed by police community support officers (10%).
www.ethnicity-facts-f igures.service.gov.uk
52
10.6 Although the judiciary are independent office holders, they provide a significant
public service and are therefore included in the Audit. To become a judge requires a minimum of 5 years’ qualified legal experience, with greater requirements for more senior judicial roles. In 2016, 6% of court judges who declared their ethnicity were from non-White ethnic groups. Representation of those from non-White ethnic groups was more than twice as high among tribunal judges and non-legal members of tribunals combined, at 14%. Asian people made up the largest non-White ethnic group in these roles, with around 3% of court judges and 8% of tribunal judges and non-legal members. Around 16% of court judges and 12% of tribunal judges and non-legal members did not disclose their ethnic group.
NHS workforce and boards 10.7 Among non-medical staff in the NHS in England, that is apart from doctors or
dentists, around 7% of very senior managers and 11% of senior managers in 2016 were from a non-White ethnic minority group. By comparison, 18% of the whole non-medical NHS workforce were from a non-White ethnic minority group.
10.8 Of all applicants who were shortlisted for NHS jobs in England, White applicants (including those from White ethnic minority backgrounds) were more likely to be appointed: 18% of White shortlisted applicants were appointed, compared with 11% of shortlisted applicants from non-White ethnic minority groups. These differences were observed in all areas but were largest in London, where 20% of shortlisted White applicants were appointed compared with 11% of shortlisted applicants from non-White ethnic groups.
10.9 NHS staff from a non-White background were more likely to report having
personally experienced discrimination at work from either a manager or colleague than White staff (including those from a White ethnic minority group): 14% of them did so compared with 6% of White staff in 2016. They were also more likely to be entered into formal disciplinary procedures than White staff were: 2% of non-White staff entered the disciplinary process while 1% of White staff did so. (These percentages are based on staff in post at the end of the period.) This difference was larger in London than in other areas where 3% of non-White staff entered the disciplinary process compared with only 1% of White staff.
10.10 The boards of many trusts do not reflect the diversity of the NHS workforce. Only
7% of trust board members in England in 2016 were from a non-White background while the remaining 93% of board members were White, where ethnicity was known. The highest rate of participation at board level among people from a non-White ethnic group was observed in London, where they made up 12% of board members

www.ethnicity-facts-f igures.service.gov.uk
53
whose ethnicity was known; the lowest participation rate was observed in the south (South East and South West combined), where they made up 4% of members whose ethnicity was known.
Education 10.11 The majority of teachers in England were White British, with fewer than 1 in 7
coming from an ethnic minority group, and 1 in 12 from a non-White ethnic minority group in 2016. After White British, teachers were most likely to be from Other White, Indian or White Irish backgrounds whereas they were least likely to be from White and Black African, Chinese or Other Black backgrounds. More than 9 out of 10 head teachers were White British. Teachers from White Irish or Other White backgrounds each comprise just under 2% of headteachers in England, and teachers from an Indian or Black Caribbean background comprise just under 1% each. Only 1 in 1000 head teachers were from Bangladeshi, Chinese or Other Black backgrounds. There were three times as many female teachers as male and the ethnic make-up was similar for both sexes. However, Black Africans made up 1.2% of the male teaching workforce but only 0.6% of the female workforce.
Armed forces 10.12 Overall, in 2017 around 1 in every 14 members of the UK Armed Forces is from a
non-White ethnic minority. The Army is the most diverse with around 1 in 10 personnel from an ethnic minority background and the RAF is the least diverse, with 1 in 50 from an ethnic minority background.
10.13 In each of the Forces, personnel from an ethnic minority background are more likely to be in non-Officer ranks. Overall, 1 in 12 non-Officer rank personnel in the Armed Forces was from an ethnic minority compared with 1 in 42 Officers.
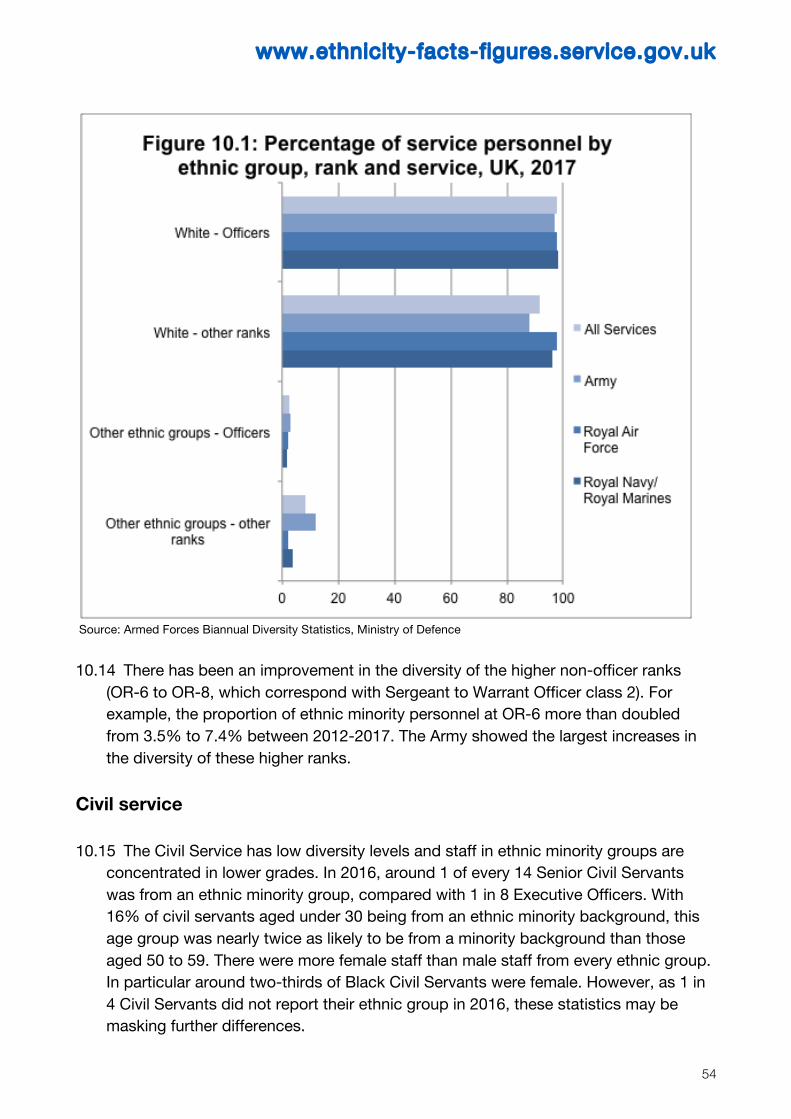
www.ethnicity-facts-f igures.service.gov.uk
54
Source: Armed Forces Biannual Diversity Statistics, Ministry of Defence 10.14 There has been an improvement in the diversity of the higher non-officer ranks
(OR-6 to OR-8, which correspond with Sergeant to Warrant Officer class 2). For example, the proportion of ethnic minority personnel at OR-6 more than doubled from 3.5% to 7.4% between 2012-2017. The Army showed the largest increases in the diversity of these higher ranks.
Civil service 10.15 The Civil Service has low diversity levels and staff in ethnic minority groups are
concentrated in lower grades. In 2016, around 1 of every 14 Senior Civil Servants was from an ethnic minority group, compared with 1 in 8 Executive Officers. With 16% of civil servants aged under 30 being from an ethnic minority background, this age group was nearly twice as likely to be from a minority background than those aged 50 to 59. There were more female staff than male staff from every ethnic group. In particular around two-thirds of Black Civil Servants were female. However, as 1 in 4 Civil Servants did not report their ethnic group in 2016, these statistics may be masking further differences.


This report provides an overview of the main findings from the first release of data from the Race Disparity Audit. As well as a review of each topic on www.ethnicity-facts-figures.service.gov.uk, the report presents an overview of disparities that have most impact across all aspects of people’s lives. This analysis helps to understand and assess differences between ethnic groups, and to identify those public services where disparities are diminishing and those where work is needed to develop effective strategies to reduce disparities between ethnic groups.