Embed Size (px)
Citation preview

1
Race, Shelby County, and the Voter Information Verification Act
in North Carolina*
Florida State University Law Review, 2015, Forthcoming
Michael C. Herron† Daniel A. Smith‡
February 28, 2014
Abstract
Shortly after the Supreme Court in Shelby County v. Holder struck down Section 4(b) of the
Voting Rights Act (VRA), the state of North Carolina enacted an omnibus piece of election-
reform legislation known as the Voter Information Verification Act (VIVA). Prior to Shelby
portions of North Carolina were covered jurisdictions per the VRA’s Sections 4 and 5—
meaning that they had to seek federal preclearance for changes to their election procedures—
and this motivates our assessment of whether VIVA’s many alterations to North Carolina’s
election procedures are race-neutral. We show that in presidential elections in North Carolina
black early voters have cast their ballots disproportionately in the first week of early voting,
which was eliminated by VIVA; that blacks disproportionately have registered to vote during
early voting and in the immediate run-up to Election Day, something VIVA now prohibits;
that registered voters in the state who lack two VIVA-acceptable forms of voter identification,
driver’s licenses and non-operator identification cards, are disproportionately black; that
VIVA’s identification dispensation for voters at least 70 years disproportionately benefits
white registered voters; and, that preregistered sixteen and seventeen year old voters in North
Carolina, a category of registrants that VIVA prohibits, are disproportionately black. These
results illustrate how VIVA will have a disparate effect on black voters in North Carolina.
* The authors thank Michael P. McDonald (University of Florida) for providing two North Carolina voter files,
and Shengzhi Wang (University of Vermont College of Law), Matthew Price (University of Florida College of Law)
and Caitlin Ostroff (University of Florida) for their excellent editorial assistance. † Professor of Government, Dartmouth College, 6108 Silsby Hall, Hanover, NH 03755-3547
([email protected]). ‡ Professor of Political Science, University of Florida, 234 Anderson Hall, Gainesville, FL 32611-7325
2
I. INTRODUCTION ........................................................................................................................... 2
II. ELECTORAL REFORM IN THE SHADOW OF SHELBY COUNTY V. HOLDER ....................................... 6
A. The Voting Rights Act and Origins of Shelby .......................................................................... 6
B. The Aftermath of Shelby ........................................................................................................ 10
C. North Carolina’s Voter Information and Verification Act .................................................... 12
III. NORTH CAROLINA REGISTRATION AND VOTING DATA ............................................................ 17
IV. RACIAL TRENDS IN EARLY VOTING .......................................................................................... 23
V. RACE AND TIMING OF VOTER REGISTRATION........................................................................... 32
VI. RACE AND AVAILABILITY OF VOTER PHOTO IDENTIFICATION.................................................. 37
VII. RACE, VOTER IDENTIFICATION, AND THE 70-YEAR SPECIAL DISPENSATION ............................ 44
VIII. RACE AND YOUTH PREREGISTRATION ...................................................................................... 49
IX. CONCLUSION ............................................................................................................................ 50
I. INTRODUCTION
In the final week of its 2012–13 Term, the United States Supreme Court in Shelby County v.
Holder1 struck down as unconstitutional Section 4(b) of the Voting Rights Act (VRA).2 Historically
a key objective of the VRA has been preventing retrogression in racial and language minority voting
rights,3 and the now-defunct Section 4(b) contributed to this goal by defining a coverage formula that
identified jurisdictions in the United States requiring federal preclearance before changing their
election laws and procedures. By extension, the majority’s decision undermined Section 5 of the
1 Shelby County v. Holder, 133 S.Ct. 2612 (2013). 2 See Voting Rights Act of 1965, Pub.L. No. 89–110, § 4(b), 79 Stat. 437, 438 (codified as amended at 42
U.S.C. § 1973b(b) (2012)), invalidated by Shelby County, 133 S.Ct. at 2631 (2013) (“[Congress’s] failure to [update
the coverage formula] leaves us today with no choice but to declare § 4(b) unconstitutional. The formula in that section
can no longer be used as a basis for subjecting jurisdictions to preclearance.”). 3 See generally CONTROVERSIES IN MINORITY VOTING: THE VOTING RIGHTS ACT IN PERSPECTIVE (Bernard
Grofman & Chandler Davidson eds., 1992); Samuel Issacharoff, Beyond the Discrimination Model on Voting, 127
HARV. L. REV. 95 (2013).
3
Act, which specifies preclearance procedures and heretofore required all or parts of 15 states to
receive preclearance before making any changes to their election procedures.
The Court issued Shelby on June 25, 2013. Shortly thereafter the North Carolina state
legislature passed an omnibus elections bill, House Bill 589, which was signed into law by
Republican Governor Pat McCrory on August 12, 2013.4 Among its many alterations to the
electoral environment in North Carolina, the Voter Information Verification Act, known
colloquially as VIVA, shortened from 17 to ten days the state’s early voting period; eliminated
same-day voter registration during early voting; created a photo identification requirement for
casting a ballot in-person but with special dispensation for voters over the age of 70; and,
limited the preregistration of sixteen and seventeen year olds to those turning 18 by Election Day.5
Because 40 of North Carolina’s 100 counties had been covered by Section 5 of the VRA,6 pre-
Shelby these election law changes would have necessitated preclearance with the federal
government so as to ensure that they did not lead to “retrogression in the position of racial
minorities with respect to their effective exercise of the electoral franchise.”7 Post-Shelby, however,
no such preclearance requirement for North Carolina exists.
4 Act of July 26, 2013, ch. 381, 2013 N.C. Sess. Laws 1505 (the session law version). See also H.R. 589, 2013,
Gen. Assemb., Reg. Sess. (N.C. 2013) (the final House bill version), available at
http://www.ncleg.net/Sessions/2013/Bills/House/PDF/H589v9.pdf (last accessed Dec. 31, 2014). Its legislative history
is also available on the North Carolina General Assembly website. House Bill 589 / S.L. 2013-381, N.C. GEN.
ASSEMBLY, http://www.ncleg.net/gascripts/BillLookUp/BillLookUp.pl?BillID=H589&Session=2013 (last visited Dec.
31, 2014). 5 VIVA’s photo identification requirement is not slated to go into effect until 2016. In addition to the special
dispensation made for registered voters over the age of 70, VIVA also makes exceptions to its identification
requirements for those with religious objections to photographic identification and to those who prior to an election
were victims of a natural disaster. See id. § 2.1., 2013 N.C. Sess. Laws at 1506. 6 Jurisdictions Previously Covered by Section 5, U.S. DEP’T OF JUSTICE,
http://www.justice.gov/crt/about/vot/sec_5/covered.php (last visited Jan. 2, 2014) (presenting a list of, inter alia, the 40
North Carolina counties subject to preclearance prior to Shelby). 7 Beer v. United States, 425 U.S. 130, 141 (1976).
4
VIVA has been lauded by supporters for its focus on protecting the integrity of voting
processes in North Carolina and criticized by others who view it as a piece of legislation designed
to suppress votes, in particular votes of eligible black residents of North Carolina. Viewed in this
light, VIVA exemplifies the contemporary—and increasingly partisan—debate in the United States
over voting rights and the sometimes caustic struggle between those advocating for relatively liberal
ballot access laws and those who urge vigilance in the face of allegations of election fraud.8 The
issue of race is entwined in this struggle, and in light of this what follows is an analysis of North
Carolina’s electoral environment, one that focuses on the intersection of VIVA and race. Our
attention here is specifically directed at race—as opposed to, say, political party affiliation—because
of this construct’s position in the VRA and the recent decision in Shelby, not to mention the legacy
of racial discrimination in American electoral history.9 Broadly speaking, our objective is assessing
whether VIVA will have differential effects on the two major racial groups, blacks and whites, in
North Carolina. According to 2012 estimates from the United States Census, these two groups
constitute over 93 percent of North Carolina residents; in particular, the Census reports that roughly
72 percent of North Carolina residents are monoracial white and 22 percent, monoracial black.10
The scope of this study is the past three General Elections in North Carolina—those that
occurred in 2008, 2010, and 2012—in addition to the past two off-year elections—those in 2009
and 2011. In light of this paper’s stated objective of assessing whether VIVA will have differential
effects across racial groups in North Carolina, our analysis of these five elections considers whether
8 See Richard L. Hasen, Race or Party? How Courts Should Think About Republican Efforts to Make it Harder
to Vote in North Carolina and Elsewhere, 127 HARV. L. REV. F. 58 (2014), available at
http://cdn.harvardlawreview.org/wp-content/uploads/pdfs/forvol127_hasen.pdf. 9 See MORGAN J. KOUSSER, THE SHAPING OF SOUTHERN POLITICS: SUFFRAGE RESTRICTION AND THE
ESTABLISHMENT OF THE ONE-PARTY SOUTH, 1880-1910 (1974). 10 See North Carolina QuickFacts from the US Census Bureau, U.S. CENSUS BUREAU,
https://web.archive.org/web/20131028151451/http://quickfacts.census.gov/qfd/states/37000.html (last visited Dec. 21,
2014) (presenting the 2012 racial demographics for North Carolina).
5
black and white early voters in North Carolina have traditionally cast their ballots on similar days
during North Carolina’s early voting period; whether blacks and whites in North Carolina tend to differ
in their propensities to register to vote immediately prior to voting early; whether registered voters
in North Carolina over the age of 70 are disproportionately black or white; and, whether black and
white voters will be differentially affected by VIVA’s rules regarding voter identification. As will
be made clear when we discuss VIVA in greater detail, we investigate these race-based questions
because of the specific changes that VIVA has wrought on North Carolina election procedures.
The evidence we offer implies that VIVA will have a disparate effect on black voters in North
Carolina and is thus not race-neutral. We show, for example, that blacks in the state often vote
relatively early in the first week of what historically was an approximately 17 day early voting period,
a week that VIVA eliminated when it reduced North Carolina’s early voting period to ten days;
that in two of the three most recent General Elections in North Carolina blacks disproportionately
registered on early voting days that VIVA has eliminated; that blacks are disproportionately
represented among registered voters in North Carolina who lack two of the seemingly standard
forms of photo identification that VIVA deems acceptable; that a special dispensation regarding
photo identification requirements for older voters is a greater benefit to whites than to blacks; and,
that prior to VIVA’s eliminating preregistration in North Carolina for all sixteen and some 17 year
olds, preregistered voters were disproportionately black.
In the next section of the paper we describe VIVA’s political context, situating it in the post-
Shelby County v. Holder landscape. After discussing the legislative history of VIVA and some of
its particulars, we turn to the data used in our analysis of five recent North Carolina elections. Next
we present results on the role of race in North Carolina early voting, registration timing, access to
voter identification, and preregistration. We end the paper with some concluding thoughts.
6
II. ELECTORAL REFORM IN THE SHADOW OF SHELBY COUNTY V. HOLDER
The origins of VIVA predate by several months the Supreme Court’s decision in Shelby
County v. Holder. Nonetheless, the context surrounding this relatively recent North Carolina state
law is now part of the aftermath of what appears to be one of the most momentous Supreme Court
decisions in the area of voting rights since the 1960s.
A. The Voting Rights Act and Origins of Shelby
The VRA was originally passed by Congress in 1965 and signed into law by then-President
Lyndon B. Johnson. The objective of the Act was elimination of voting discrimination, and the
VRA established extensive federal oversight of election administration. The VRA has many facets,
and the aspects of this law that concern us here are its sections dealing with preclearance. In the
introduction we noted that Section 4(b) of the VRA provides a coverage formula that specifies the
jurisdictions in the United States subject prior to Shelby to federal preclearance, i.e., that needed
permission to modify their election procedures prior to implementing them. Section 4(b)’s formula
includes indicators as to whether a given voting jurisdiction mandated a literacy “test or device” as a
requirement for registering to vote as of November 1, 1964, or had registration or turnout rates of
less than 50 percent of voting age population in 1964.11 Section 5 of the VRA describes how
preclearance is implemented and thus leans heavily on Section 4(b). Beyond Sections 4 and 5, Section
2 of the VRA prohibits everywhere in the United States the dilution or denial of voting rights on the
basis of race and language minority status. In contrast to Sections 4 and 5 and their emphasis on
preclearing changes to election laws before they are promulgated, the VRA’s Section 2 places the
burden of proof on those affected by ostensibly problematic election protocol changes.
11 See, e.g., Section 4(b) of the Voting Rights Act, U.S. DEP’T OF JUSTICE,
http://www.justice.gov/crt/about/vot/misc/sec_4.php (last visited Dec. 21, 2014).
7
Pre-Shelby, all election law and protocol changes that affected covered jurisdictions—i.e., those
characterized as such by the VRA’s Section 4(b)—were reviewed by the United States Department
of Justice or the federal courts in order to determine if they had retrogressive effects on racial, ethnic,
or language minorities. Between 2006, when Congress last reauthorized the VRA, and the spring of
2013, the Department of Justice used its preclearance authority to block many election law
alterations that it determined would have discriminatory effects. Prior to the 2012 General Election,
for example, the Department of Justice challenged and prevented restrictive photo identification
laws from being implemented in Alabama, Mississippi, South Carolina, and Texas, and it
successfully forced Florida to modify a mid-2011 law that placed new restrictions on voter
registration drives by third party organizations.12
Shelby struck down the VRA’s Section 4(b) on account of ostensible problems with the
preclearance coverage formula, thus rendering Section 5 of the VRA effectively toothless. As a
result of this case, changes to voter registration procedures, new requirements for voter
identification, and altered early voting hours, inter alia, in previously covered or partially covered
states no longer must be vetted by the federal government before taking effect. According to Chief
Justice Roberts’s majority opinion, the VRA’s antiquated preclearance formula was “based on 40-year-
old facts having no logical relationship to the present day.”13 Some scholars who historically have
been critical of preclearance were pleased with Shelby, with vice-chair of the United States
Commission on Civil Rights, Abigail Thernstrom, arguing that, “The court’s ruling Tuesday will
12 Michael C. Herron & Daniel A. Smith, The Effects of House Bill 1355 on Voter Registration in Florida, 13
ST. POL. & POL’Y Q. 279 (2013). See also MYRNA PÉREZ & VISHAL AGRAHARKAR, BRENNEN CTR. FOR JUSTICE AT
N.Y. UNIV. SCH. OF LAW, IF SECTION 5 FALLS: NEW VOTING IMPLICATIONS (2013), available at
http://www.brennancenter.org/sites/default/files/publications/Section_5_New_Voting_Implications.pdf (last visited
Dec. 22, 2014); WENDY UNDERHILL, NAT’L CONF. ST. LEGISLATURES, VOTER IDENTIFICATION REQUIREMENTS (2013),
available at http://www.ncsl.org/research/elections-and-campaigns/voter-id.aspx (last visited Dec. 22, 2014). 13 Shelby County v. Holder, 133 S.Ct. 2612, 2629 (2013).
8
benefit black America.”14 Similarly, former United States Department of Justice official, Hans von
Spakovsky, stated that the Court “effectively threw out the preclearance requirements because they
were based on 40-year old data,” and in so doing, “foreclosed what seems to be one of the favorite
pastimes of [Department of Justice] Voting Section lawyers—pretending it is still 1965.”15
Others, even some who have historically been generally sympathetic with the goals of the VRA,
concurred with Roberts’s opinion that Congress had neglected its duty—most recently in
2006, when it reauthorized the VRA—to modernize the Act’s coverage criteria. Noting that “[T]he
[VRA] was pivotal in bringing black Americans to the broad currents of political life,” Issacharoff
nonetheless concedes that the Court’s “unromantic constitutional ruling” in Shelby reveals that “the
race discrimination structure of Section 5 could not be justified in light of the increasing distance
between the prohibitions and the distinct practices of racial exclusion that lie at the heart of the Voting
Rights Act.”16 Grofman writes similarly, arguing that, “[T]he data used for the [Section 4 trigger of
Section 5] were not just stale, they were incredibly stale.”17 Still, as Kimball points out, recent
literature on ballot access shows that voting discrimination in the United States is hardly a thing of
the past notwithstanding the raw voter turnout figures cited in the Shelby majority opinion as evidence
of a lack thereof.18
Reactions from the voting rights community to the Shelby decision were predictably harsh.
14 See Abigail Thernstrom, A Vindication of the Voting Rights Act, WALL ST. J., June 26, 2013,
http://www.wsj.com/news/articles/SB10001424127887323873904578569453308090298?mg=reno64-wsj, available at
http://www.aei.org/article/politics-and-public-opinion/judicial/a-vindication-of-the-voting-rights-
act/?utm_source=new+on+aei&utm_medium= web&utm_campaign=062813 (last visited Dec. 22, 2014). 15 See Hans von Spakovsky, Texas Residents Who Support Voter ID Denied Intervention in DOJ
Lawsuit—Will the Same Thing Happen in North Carolina?, NAT’L REV. ONLINE (Dec. 17, 2013),
http://www.nationalreview.com/corner/366590/texas-residents-who-support-voter-id-denied-intervention-doj-lawsuit-
will-same-thing (last visited Dec. 22, 2014). 16 Samuel Issacharoff, Beyond the Discrimination Model on Voting, 127 HARV. L. REV. 95, 95–96, 117 (2013). 17 Bernard Grofman, Devising a Sensible Trigger for Section 5 of the Voting Rights Act, 12 ELECTION L.J. 332,
332 (2013). 18 David C. Kimball, Judges Are Not Social Scientists (Yet), 12 ELECTION L.J. 324, ___ (2013).
9
Congressional Representative John Lewis (D-Ga), who was alongside President Johnson in 1965
when he signed the VRA into law, excoriated the Supreme Court’s decision: “When the Supreme
Court made the decision, I almost cried. I almost shed some tears. . . . I kept saying to myself, ‘I wish
somehow the members of the Supreme Court—especially the five that voted to put a dagger in the
heart and soul of the Voting Rights Act—could walk in our shoes.”’19 Voting rights groups quickly
took aim at the decision, with Advancement Project, for example, issuing a statement expressing
“disappoint[ment] that the Supreme Court has taken the extreme act of at least temporarily
suspending the nation’s strongest civil rights protection,” and arguing that “[a]mple evidence shows
that prior Section 4 formula—which enabled Section 5 to block more than 1,500 discriminatory
voting laws from going into effect since its inception, including five last year—is still a critical
necessity, and that the formula for those covered states was clearly appropriate.”20 The Campaign
Legal Center, a nonpartisan public advocacy group specializing in elections, also decried Shelby,
saying “[t]he Roberts Court proved again that it will not be deterred by Supreme Court precedent,
the realities on the ground in our nation; nor will it defer to Congress even when the legislative branch
is granted clear authority by the Constitution to remedy our nation’s long history of discrimination
against racial and language minorities.”21 The NAACP Legal Defense and Educational Fund, which
defended the VRA in Shelby, called the Court’s decision “extraordinary judicial overreach,” which
has “left millions of minority voters without the mechanism that has allowed them to stop voting
discrimination before it occurs.”22 Elisabeth MacNamara, President of the League of Women Voters,
19 The Voting Rights Act: Hard-Won Gains, An Uncertain Future, NPR (July 21, 2013),
http://www.npr.org/2013/07/21/204284355/whats-next-for-the-voting-rights-act. 20 Press Release, Advancement Project, Supreme Court Removes Critical Protection for Voters of Color, Civil
Rights Group Pledges to Keep Fighting States that Discriminate (June 25, 2013), available at
http://www.advancementproject.org/news/entry/scotus-removes-critical-protection-for-voters-of-color#sthash. 21 Ryan Reilly, Voting Rights Act Section 4 Struck Down by Supreme Court, HUFFINGTON POST (July 25,
2013), http://www.huffingtonpost.com/2013/06/25/voting-rights-act-supreme-court_n_3429810.html. 22 Court Rejects Congress’ Determination of Where the Voting Rights Act Should Apply,
10
said the Court “erased fundamental protections against racial discrimination in voting that have been
effective for more than 40 years.”23
B. The Aftermath of Shelby
In the wake of Shelby, a debate among voting rights and election law scholars started over the
future of the VRA’s Sections 4 and 5. Some legal scholars have argued that race-based criteria for
preclearance remain defensible. Gilda Daniels, for example, asserts that Congress should expand
Section 5’s preemptive preclearance power “to protect citizens from discriminatory voting laws.”24
Others, though, have proposed new, arguably race-neutral criteria for preclearance. Chris Elmendorf
and Doug Spencer suggest that an alternative requirement for federal preclearance turn on the fraction
of residents in a state who hold negative stereotypes of minorities;25 drawing on the history of
litigation under Section 2 of the VRA, Bernie Grofman suggests a new trigger mechanism for federal
preclearance, namely targeting jurisdictions that have had “multiple Section 2 cases brought against
them” or those that “have repeatedly been found in violation” of retrogressive changes under Section
5;26 and, Bruce Cain and Spencer Overton suggest a greater use of the VRA’s Section 3 “bail-in
provision” in light of the concern that Congress in the near future is unlikely to craft more extensive
franchise protections.27 Alternatively, Janai Nelson argues that the courts should adhere to a more
Leaving Voters Unprotected, NAACP LEGAL DEF. AND EDUC. FUND (June 25, 2013),
http://www.naacpldf.org/update/supreme-court-ruling-voting-rights-opens-door-wave-minority-voter-suppression. 23 Press Release, League of Women Voters, Supreme Court Erases Protections Against Racial Discrimination
in Voting (June 25, 2013), available at http://lwv.org/press-releases/lwv-reacts-supreme-court-decision-voting-rights-
act. 24 Gilda R. Daniels, Unfinished Business: Protecting Voting Rights in the Twenty-First Century, 81 GEO.
WASH. L. REV. 1928, 1934 (2013). 25 See Christopher S. Elmendorf & Douglas M. Spencer, The Geography of Racial Stereotyping: Evidence and
Implications for VRA Preclearance after Shelby County, 102 CAL. L. REV. (forthcoming 2014), available at
http://papers.ssrn.com/sol3/papers.cfm?abstract id=2262954. 26 Bernard Grofman, Devising a Sensible Trigger for Section 5 of the Voting Rights Act, 12 ELECTION L.J. 332,
334 (2013). 27 See Bruce E. Cain, Moving Past Section 5: More Fingers or a New Dike? 12 ELECTION L.J. 338, 340
(2013); Spencer Overton, Voting Rights Disclosure, 127 HARV. L. REV. F. 19, 30 (2013).
11
narrow construction of disparate impact claims under Section 2 (as amended by Congress in 1982),
specifically that statistical analyses of vote dilution should look not only at the racial impact, “but
also [at] the racial context in which this evidence is situated,” or what she dubs the “causal context”
that defines disparate vote denial.28 Finally, Rick Hasen takes a broader view, arguing that since race
and party are tightly intertwined, federal courts should ensure that the rights of voters remain
protected from maneuvers that could be interpreted as having harmful effects on the grounds of either
party or race.29 Sam Bagenstos labels this approach “universalist” since it seeks to “provide uniform
protections to everyone” as opposed to, say, a particular racial group.30
Concomitant with the post-Shelby debate over the future of preclearance and possible trigger
mechanisms for federal oversight of state-level and local election procedures, election law changes
across many states are underway in various forms. Mississippi, Texas, and Virginia, for example,
have begun implementing voter identification requirements that prior to Shelby could have faced
extensive federal scrutiny. In response to the Texas voter identification law, the federal Department
of Justice has under Section 2 of the VRA filed suit against the voter identification law known as
Senate Bill 14, requesting that federal courts enjoin key sections of this bill and additionally make
Texas subject to the type of preclearance that it faced pre-Shelby.31 Other states—Arizona and
Kansas, the former previously a Section 4 jurisdiction—have embarked on dual-registration systems,
requiring proof-of-citizenship for voters wishing to cast their ballots in state elections. Note that the
Supreme Court ruled in Arizona v. Inter Tribal Council of Arizona that states cannot require proof of
28 Janai S. Nelson, The Causal Context of Disparate Vote Denial, 54 B.C. L. REV. 579, 586 (2013). 29 See Hasen, supra note 8, at 61. 30 Samuel R. Bagenstos, Universalism and Civil Rights (with Notes on Voting Rights after Shelby), 123 YALE
L.J. 2838, 2838 (2014). 31 Complaint at 14, United States v. Texas, No. 2:13-cv-00263 (S.D. Tex. Aug. 22, 2013), 2013 WL 4479214,
available at http://www.justice.gov/iso/opa/resources/7472013822155117860058.pdf (last visited Dec. 27, 2014).
12
citizenship to vote in federal elections.32 Dale Ho, Director of the ACLU’s Voting Rights Project,
notes that dual registration systems “were set up after Reconstruction alongside poll taxes, literacy
tests and all the other devices that were used to disenfranchise African-American voters.”33 In Ohio,
legislative efforts are currently underway as of the writing of this paper not only to eliminate a week
from early voting, but also, as in North Carolina, to eliminate the so-called “Golden Week” that has
permitted eligible citizens of Ohio to register and vote on the same day.34 Even before Shelby many
states in the past several years have created new voter identification rules and passed restrictions on
absentee and early voting, and Keith Bentele and Erin O’Brien, as well as Will Hicks and his
coauthors, argue that this behavior follows a well-worn tradition in the United States of using ballot
access laws for partisan purposes.35
C. North Carolina’s Voter Information and Verification Act
The original version of VIVA—called House Bill 589—was filed in the North Carolina
House on April 4, 2013, and at that time this proposed legislation was essentially a bill aimed at
establishing a photo identification requirement for in-person voting in North Carolina. The early 2013
version of House Bill 589, for example, did not alter the length of the state’s early voting period.36
32 Arizona v. Inter Tribal Council of Arizona, 133 S.Ct. 2247, 2260 (2013). 33 See Ari Berman, Blog, Separate and Unequal Voting in Arizona and Kansas, THE NATION (Oct. 15, 2013),
http://www.thenation.com/blog/176650/separate-and-unequal-voting-arizona-and-kansas (Arizona and Kansas). 34 See Ari Berman, Blog, Ohio GOP Resurrects Voter Suppression Efforts, THE NATION (Dec. 3, 2013),
http://www.thenation.com/blog/177454/ohio-gop-resurrects-voter-suppression-efforts (Ohio). 35 Keith G. Bentele & Erin E. O’Brien, Jim Crow 2.0? Why States Consider and Adopt Restrictive Voter
Access Policies, 11 PERSP. ON POL. 1088, 1091 (2013). William D. Hicks, Seth C. McKee, Mitchell D. Sellers, &
Daniel A. Smith, A Principle or a Strategy? Voter Identification Laws and Partisan Competition in the American
States, 68 POL. RES. Q. ____, ____ (2015). See generally ALEXANDER KEYSSAR, THE RIGHT TO VOTE: THE
CONTESTED HISTORY OF DEMOCRACY IN THE UNITED STATES (Basic Books original ed. 2000). See also Kara
Brandeisky, Hanqing Chen & Mike Tigas, Everything That’s Happened Since Supreme Court Ruled on Voting Rights
Act, PROPUBLICA (Nov. 4, 2014), http://www.propublica.org/article/voting-rights-by-state-map (presenting a map-
based display of changing voting rights since Shelby). 36 See the text of the original House Bill 589 at http://www.ncleg.net/Applications/
BillLookUp/LoadBillDocument.aspx?SessionCode=2013&DocNum=3118&SeqNum=0 (last visited
Dec. 9, 2013).
13
The North Carolina House passed (81 votes in favor, 36 opposed) House Bill 589 on April 24, 2013,
the legislation was received by the North Carolina Senate on the subsequent April 25, and following
that date legislative action on this bill ceased until late July 2013.
On July 23, 2013, a committee substitute for House Bill 589 was adopted in the North
Carolina Senate, and with respect to the original bill this substitute narrowed the types of permitted
forms of voter photo identification, cut the number of early voting days in North Carolina by a week,
eliminated same day registration and voting during early voting, and made other changes to the North
Carolina electoral law. Regarding narrowing the acceptable forms of voter photo identification, for
example, an employee identification card was acceptable under the original House Bill 589 but not
under the substitute; moreover, expired forms of photo identification were acceptable under the
former as long as date of expiry was fewer than ten years in the past. Notwithstanding the additional
restrictions called for in the substitute House Bill 589, this piece of legislation passed (33 in favor,
14 opposed) the North Carolina Senate on July 25, 2013 at 5:24pm, was sent immediately thereafter
to the House, passing the lower chamber several hours later (73 in favor, 41 opposed), at 10:39pm.
House Bill 589 was signed into law by North Carolina Governor Pat McCrory, thus producing what
is now known as VIVA.
The passage of VIVA has engendered an acrimonious dispute between the Act’s supporters,
who describe the new legislation as protecting the integrity of North Carolina’s election procedures,
and its critics, who see VIVA as a bill designed to suppress votes. Particularly notable about the
current dispute in North Carolina is the question of whether the Court’s abandonment of Section 5
federal preclearance is a harbinger of new attempts to insert race into debates about voting rights and
ballot access.
14
Indeed, critics of VIVA have alleged that the Act’s cut in North Carolina’s early voting period
might have differential effects on black voters in the state.37 North Carolina Attorney General,
Democrat Roy Cooper, whose job responsibilities include enforcing VIVA, claims the new law
“threaten[s] fifty years of progress” in the state and has said as well that “[a] lot of bad public policy
was lumped into this bill at the last minute.”38 And upon passage of VIVA, nine-term Democratic
state Senator Ellie Kinnaird resigned in protest, saying that the law was designed “to deny people
their right to vote.”39 Nonetheless, supporters of VIVA argue that the bill protects the right to vote
for all eligible North Carolinians and in addition brings North Carolina into alignment with a majority
of other states that do not allow voters to register to vote and then vote on the same day. Upon signing
it into law, Governor McCrory said, “I am proud to sign [VIVA] into law. Common practices like
boarding an airplane and purchasing Sudafed require photo ID and we should expect nothing less for
the protection of our right to vote.”40 Senate President Pro Tem Phil Berger argued similarly, saying
37 See, e.g., Richard L. Hasen, Supreme Error, SLATE (Aug. 19, 2013),
http://www.slate.com/articles/news_and_politics/jurisprudence/2013/08/north_carolina_s_speedy_vote_suppression_ta
ctics_show_exactly_why_the_voting.html; John Peragine, North Carolina Prosecutor Takes Shots at the Laws He’s
Obliged to Enforce, N.Y. TIMES (Oct. 24, 2013), http://www.nytimes.com/2013/10/25/us/north-carolina-prosecutor-
takes-shots-at-the-laws-hes-obliged-to-enforce.html?_r=0. 38 See Roy Cooper, The Blog, North Carolina: Threatening Fifty Years of Progress in Ten Months,
HUFFINGTON POST (Oct. 15, 2013), http://www.huffingtonpost.com/roy-cooper/north-carolina-
republicans_b_4100573.html; Ned Barnett, Opinion, Roy Cooper is Right to Object to Laws that Ill-serve the Public,
NEWSOBSERVER.COM (Nov. 9, 2013), http://www.newsobserver.com/2013/11/09/3355846_roy-cooper-is-right-to-
object.html. 39 See Mollie Reilly, Ellie Kinnaird, Nine-Term State Senator, Resigns Over North Carolina Voter ID Law,
HUFFINGTON POST (Aug. 20, 2013), http://www.huffingtonpost.com/2013/08/20/ellie-kinnaird-
resigns_n_3784644.html. See also Ellie Kinnaird, http://elliekinnaird.org (last visited Dec. 28, 2014) (presenting the
full text of Senator Kinnaird’s statement. 40 Press Release, N.C. Office of the Governor, Governor McCrory Signs Popular Voter ID into Law (Aug. 12,
2013), available at http://www.governor.state.nc.us/newsroom/press-releases/20130812/governor-mccrory-signs-
popular-voter-id-law. The press release also notes that 37 states do not allow same day registration followed
immediately by voting. Id. (“This new law also aligns North Carolina with the majority of states (37) that do not allow
a person to register and vote on the same day.”).
15
that “[VIVA] is a common sense measure to address concerns that a lot of people have about voting,
about making sure that when people vote, they are who they say they are.”41
As of this paper’s writing VIVA continues to face multiple legal challenges. On September
30, 2013, the federal Department of Justice filed a lawsuit in federal district court alleging that parts
of VIVA violate Section 2 of the VRA insofar as they “would have the result of denying or abridging
the right to vote on account of race, color, or membership in a language minority group.”42 The
lawsuit specifically comments on VIVA’s decrease in early voting hours and its elimination of same-
day voter registration as well as aspects of VIVA that deal with provisional ballots and voter
identification. The Department of Justice’s lawsuit came on the heels of two other federal cases, both
filed on August 12, 2013. In one of these federal suits, the North Carolina State Conference of the
NAACP and other plaintiffs claim VIVA violates Section 2 of the Voting Rights Act and the
Fourteenth and Fifteenth Amendments of the Constitution.43 In the second, League of Women Voters
and others challenge VIVA, alleging the law would result in “the denial or abridgement of the right
of African Americans in North Carolina to vote in contravention of Section 2 of the Voting Rights
Act.”44 Beyond these three federal lawsuits, the League of Women Voters of North Carolina and
41 Ben Brown, Voter ID bill, Proposed System Overhaul Prompts Protest in Wilmington, PORT CITY DAILY
(July 25, 2013), http://portcitydaily.com/2013/07/25/voter-id-bill-system-overhaul-prompts-protest-in-wilmington. 42 Complaint at 29, United States v. North Carolina, No. 1:13-cv-00861 (M.D.N.C. Sept. 26, 2013), 2014 WL
494911, available at http://www.justice.gov/iso/opa/resources/646201393013723793555.pdf (last visited Dec. 28,
2014). 43 See the original Complaint at 27, 29, N.C. State Conference of the NAACP v. McCrory, 997 F.Supp. 2d 322
(M.D.N.C. 2014) (No. 1:13-cv-00658), 2013 WL 4053231, available at
http://moritzlaw.osu.edu/electionlaw/litigation/documents/NAACPv.MCCRORY.Complaint.pdf (last visited Dec. 28,
2014). The plaintiffs later amended their complaint but still include the two Fourteenth and Fifteenth Amendment
claims. See First Amended Complaint at 35, 37, N.C. State Conference of the NAACP v. McCrory, 997 F.Supp. 2d 322
(M.D.N.C. 2014) (No. 1:13-cv-00658), 2013 WL 6253645. As of this paper’s writing, the separate federal lawsuits
were consolidated into a single case, which has been partially affirmed and partially reversed by a 4th Cir. Opinion,
League of Women Voters of N.C. v. North Carolina, 769 F.3d 224 (4th Cir. 2014). 44 Complaint at 2, League of Women Voters of N.C. v. North Carolina, No. 1:13-cv-00660 (M.D.N.C. Aug.
12, 2013), 2014 BL 220658, available at
http://moritzlaw.osu.edu/electionlaw/litigation/documents/LOWVv.Howard.Complaint.pdf. There is also an
intervening motion on this case. See Memorandum of Law in Support of Motion to Intervene as Plaintiffs by Louis M.
Duke, Charles M. Gray, Asgod Barrantes, Josue E. Berduo, and Brian M. Miller, League of Women Voters of N.C. v.
16
various other plaintiffs have challenged VIVA in state court, arguing that the law’s requirement
pertaining to photo identification “imposes an unconstitutional property requirement in violation of
Article I, § 10 [of the North Carolina state constitution] by requiring voters to possess not only an
acceptable photo ID, but also the documents necessary to obtain the photo ID and the resources
necessary to procure those documents.”45
VIVA has many facets, and our analysis here focuses on what appear to be the most
significant aspects of the Act. These include the changes VIVA made to the North Carolina early
voting period (shortening it from seventeen days to ten); the elimination of same day voter
registration; the creation of a photo identification requirement for voters albeit with a special
dispensation for voters at least 70 years old; and, the elimination of preregistration of eligible sixteen
and seventeen year olds unless they turn eighteen before an upcoming election. The existence of
aspects of VIVA that we do not address should not be taken as an endorsement of the claim that these
aspects are race-neutral or indeed neutral in any other fashion. Indeed, as Jonathan Wand and his
coauthors and Laurin Frisina and her coauthors illustrate, seemingly anomalous or innocuous changes
to electoral protocols can have serious consequences for elections.46
As a follow-up to a remark we made in the introduction, we emphasize here that we are not
interested in this paper in whether VIVA may or may not have partisan effects in North Carolina.
North Carolina, No. 1:13-cv-00660 (M.D.N.C. Nov. 25, 2013), 2014 BL 220658, available at
http://electionlawblog.org/wp-content/uploads/29-main.pdf/ (last visited Jan. 1, 2015). For coverage of these lawsuits,
see “Judge: No quick trial on NC voting law changes,” WRAL.com, available at
http://www.wsoctv.com/news/news/local/judge-weigh-trial-schedule-nc-voting-changes/ncJQg/ (last visited January
25, 2015). 45 See Complaint at 20, Currie v. State, 13-CV-001419 (N.C. Orange Cnty., Super. Ct. Div. Aug. 13, 2013),
available at http://moritzlaw.osu.edu/electionlaw/litigation/documents/Currie-v-NC.pdf (last visited Jan. 1, 2015). 46 See Jonathan N. Wand, Kenneth W. Shotts, Jasjeet S. Sekhon, Walter R. Mebane, Jr., Michael C. Herron &
Henry E. Brady, The Butterfly Did It: The Aberrant Vote for Buchanan in Palm Beach County, Florida, 95 AM. POL.
SCI. REV. 793, 803 (2001); Laurin Frisina, Michael C. Herron, James Honaker & Jeffrey B. Lewis, Ballot Formats,
Touchscreens, and Undervotes: A Study of the 2006 Midterm Elections in Florida, 7 Election L.J. 25, 40 (2008).
17
Insofar as race is often correlated with political preferences, 47 any conclusions we draw about
differential effects of VIVA across racial groups will almost by construction have partisan
implications as well. Moreover, the partisan implications of election-reform efforts presumably
weigh heavily on office-motivated politicians. Still, we avoid the matter of partisanship because this
construct is not protected by the VRA, and we leave for future research the question of whether
VIVA’s changes to voting laws in North Carolina could alter the partisan balance in the state.
III. NORTH CAROLINA REGISTRATION AND VOTING DATA
Our assessment of the extent to which VIVA has differential effects across racial groups in
North Carolina is based on examining historical patterns in North Carolina elections. We have noted
above, for example, that VIVA altered the length of North Carolina’s early voting period, and this
motivates our upcoming analysis of the types of voters in North Carolina who historically have
tended to vote early. Such an analysis allows us to determine the types of voters who will be most
affected by VIVA’s shortening of the North Carolina early voting period.
We consider here five elections, in particular those that took place in 2008, 2009, 2010, 2011,
and 2012. This collection of elections provides us with variance in several ways. Of these five
elections, three were general—2008, 2010, and 2012—and two were off-year—2009 and 2011.
Moreover, of the general elections, two were presidential—2008 and 2012—and the third was the
2010 midterm election that lacked a presidential contest.
We draw on three different data sources when analyzing our five elections of interest, and
one key source is the North Carolina statewide voter file. Most of our analysis relies on a version of
47 See, e.g., Stephen Ansolabehere, Nathaniel Persily & Charles Stewart III, Regional Differences in Racial
Polarization in the 2012 Presidential Election: Implications for the Constitutionality of Section 5 of the Voting Rights
Act 2013, 126 HARV. L. REV. F. 205, 217 (2013); Hasen, supra note 9, at 62.
18
this file downloaded from the North Carolina State Board of Elections (SBOE) on September 5, 2013.
We call this file the September 2013, voter file. To a limited extent we also use copies of the North
Carolina voter file that to the best of our knowledge were created in February 2009, and in February,
2011. We use these latter two files only when assessing the racial composition of the North Carolina
registered voter pool as of February 2009, and February 2011, respectively, and below we make it
clear when these two files are invoked.48
The September 2013, North Carolina voter file contains a list of registered voters in North
Carolina.49 It also contains names of previously registered voters who as of September 2013, were
no longer registered in North Carolina because, for example, they had moved out of the state or had
died. For both currently or previously registered voters in North Carolina, the September 2013, voter
file contains basic demographics (e.g., age, gender, and race), registration dates, and so forth. North
Carolina voter files also include history information that describes for each registered North Carolina
voter whether, and if so how, he or she participated in various elections. Such history information
does not include actual vote choices, of course.50
As a consistency check on our September 2013, voter file, consider Table 1. For the General
Elections of 2008, 2010, and 2012, this table lists official turnout as characterized by the North
Carolina SBOE, turnout based on counts in our voter file, and associated coverage percentages.51
48 Michael McDonald of George Mason University provided these files to us. 49 To the best of our knowledge, the September 2013, voter file lists North Carolina registered voters as of the
date that the file was created. 50 The term “voter file” is a generic one that applies across states, and voter files provide snapshots of
electorates at given moments in time. The September 2013, North Carolina voter file actually consists of two separate
files, one which contains voter demographics and related variables and one which contains voter participation codes.
These two files are available at ftp://www.app.sboe.state.nc.us/data/ncvoter_Statewide.zip and
ftp://www.app.sboe.state.nc.us/data/ncvhis_Statewide.zip, respectively. Together these files constitute one instance of
the North Carolina voter file. 51 Official statewide turnout for North Carolina elections can be found at http://www.ncsbe.gov/ncsbe/voter-
turnout (last visited Jan. 9, 2015). Per a phone conversation on January 8, 2014 with George McCue of the North
Carolina SBOE, the overall turnout numbers on this website do not include provisional ballots that were not counted.
19
The three percentages in Table 1 are all very close to 100, and the very small discrepancies in the
table may reflect provisional ballots and minor data errors.
Table 1: Voter File Coverage
Election Official Turnout Voter File Turnout Coverage Percentage
2008 General 4,354,052 4,347,938 99.86
2010 General 2,700,393 2,699,143 99.95
2012 General 4,542,488 4,540,838 99.96
Note: reports general election participation counts from the September 2013, voter file ignoring
voters whose participation methods are listed as “elig-nv” and “abs-nv”. To the best of our
knowledge, voters with these classifications did not cast valid ballots. Percentages are listed to four
significant digits.
North Carolina voter files contain fields that describe the registration statuses of each
registered voter in the state. When a registered voter moves out of North Carolina or moves across
counties within the state, said voter’s record is marked as “removed.” Despite the use of this word, a
so-called removed record is not eliminated from the voter file; rather, it is simply marked as removed.
If prior to September 2013, for example, a North Carolina registered voter moved from one county
in the state to another, and in the process changed her county of registration, she has two records in
the voter file, one corresponding to her initial county of registration and a second record
corresponding to her destination county. In addition, a North Carolina registered voter’s status may
change to “denied” if a county establishes that the voter “is not qualified to vote based on age,
citizenship, residence or conviction of a felony.”52 For example, our September 2013, voter file
contains 7,345,422 individual-level records, and there were 6,465,982 registered voters whose status
52 GARY O. BARTLETT, N.C. STATE BD. OF ELECTIONS, APRIL 2013 SBOE-DMV ID ANALYSIS 2 (2013),
available at http://www.democracy-nc.org/downloads/SBOE-DMVMatchMemoApril2013.pdf [hereinafter SBOE
APRIL REPORT]. The voter file field called voter_status_desc specifies whether a registered voter’s record is denied or
removed.
20
as of the date when the file was created was neither “denied” nor “removed.” These voters constitute
the registered voter pool in North Carolina as of September 2013. Associated with the approximately
7.3 million records in the voter file are 28,422,881 participation records; each participation record
describes how a given registered voter participated in an election.
Beyond voter files, the North Carolina SBOE creates for general and off-year elections what
are called absentee files, and in September 2013, we downloaded absentee files for the 2008, 2009,
2010, 2011, and 2012 elections. So-called absentee files constitute our second data source, and an
absentee file for a given election lists the North Carolina voters who voted early and absentee.53 In
North Carolina early voting is known as “one-stop” absentee voting, and this contrasts with what in
the state is called absentee voting by mail. The latter form of voting is what is traditionally known
simply as absentee voting. To keep matters clear, henceforth we refer to one-stop absentee voting as
early voting and absentee voting by mail as simply absentee voting.
Table 2 describes three North Carolina registered voter pools and five early voting electorates.
The registered voter pools reflect the collection of registered voters in North Carolina as of a given
date, and the early voting electorates are associated with individual elections. Here we use our
complete set of three voter files so that we have three snapshots of the North Carolina registered voter
pool at three different times. The counts in Table 2 are disaggregated by race—in particular, using
the categories of black and white—as these two racial groups are the largest two such groups in North
Carolina. For example, as of February 2009, blacks and white comprised approximately 94.89
percent of all registered voters in North Carolina.54
53 Absentee files are available at ftp://www.app.sboe.state.nc.us/ENRS. 54 Our five absentee files, one per each election in 2008 through 2012, contain a small number of voters whose
recorded dates of early voting lie outside of official North Carolina statewide early voting periods. These voters do not
appear in Table 2, and they are not part of the analysis in this paper.
21
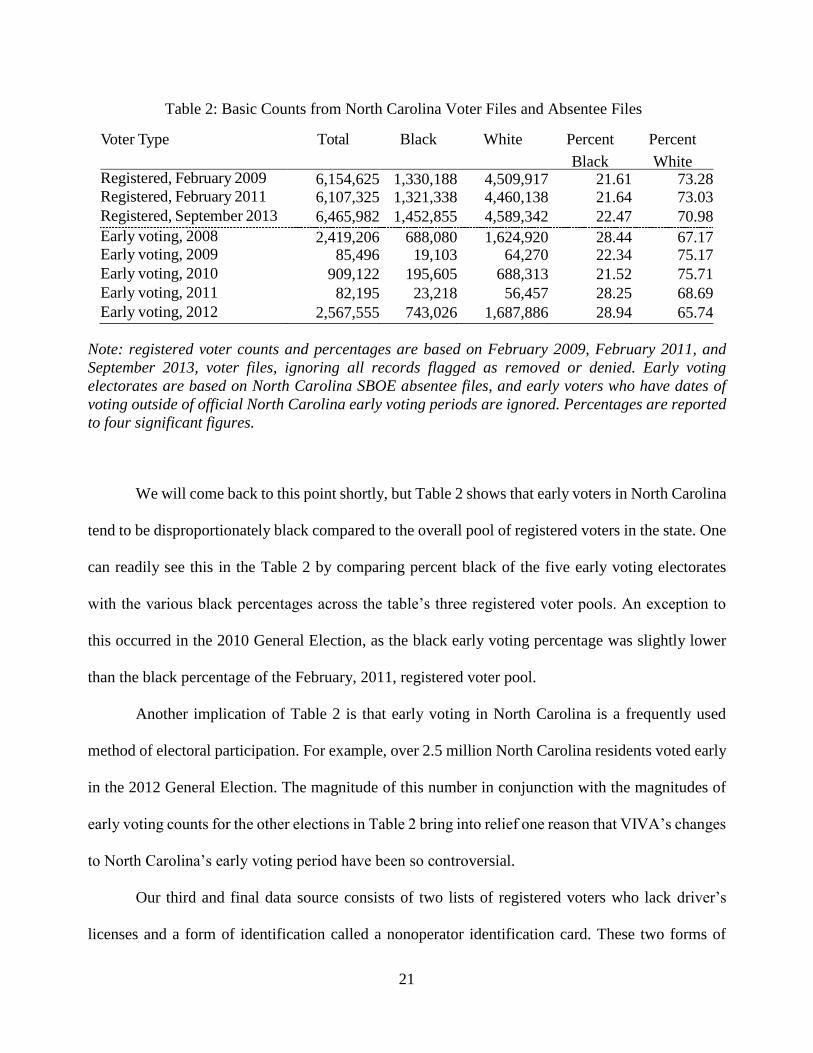
Table 2: Basic Counts from North Carolina Voter Files and Absentee Files
Voter Type Total Black White Percent
Black
Percent
White Registered, February 2009 6,154,625 1,330,188 4,509,917 21.61 73.28 Registered, February 2011 6,107,325 1,321,338 4,460,138 21.64 73.03
6,107,325 Registered, September 2013 6,465,982 1,452,855 4,589,342 22.47 70.98
6,465,982 Early voting, 2008 2,419,206 688,080 1,624,920 28.44 67.17
2,419,206 Early voting, 2009 85,496 19,103 64,270 22.34 75.17
85,496 Early voting, 2010 909,122 195,605 688,313 21.52 75.71
909,122 Early voting, 2011 82,195 23,218 56,457 28.25 68.69
82,195 Early voting, 2012 2,567,555 743,026 1,687,886 28.94 65.74
2,567,555 Note: registered voter counts and percentages are based on February 2009, February 2011, and
September 2013, voter files, ignoring all records flagged as removed or denied. Early voting
electorates are based on North Carolina SBOE absentee files, and early voters who have dates of
voting outside of official North Carolina early voting periods are ignored. Percentages are reported
to four significant figures.
We will come back to this point shortly, but Table 2 shows that early voters in North Carolina
tend to be disproportionately black compared to the overall pool of registered voters in the state. One
can readily see this in the Table 2 by comparing percent black of the five early voting electorates
with the various black percentages across the table’s three registered voter pools. An exception to
this occurred in the 2010 General Election, as the black early voting percentage was slightly lower
than the black percentage of the February, 2011, registered voter pool.
Another implication of Table 2 is that early voting in North Carolina is a frequently used
method of electoral participation. For example, over 2.5 million North Carolina residents voted early
in the 2012 General Election. The magnitude of this number in conjunction with the magnitudes of
early voting counts for the other elections in Table 2 bring into relief one reason that VIVA’s changes
to North Carolina’s early voting period have been so controversial.
Our third and final data source consists of two lists of registered voters who lack driver’s
licenses and a form of identification called a nonoperator identification card. These two forms of
22
identification are managed by the North Carolina Department of Motor Vehicles (DMV) and are
permissible forms of voter identification as specified by VIVA. Our lists of registered voters who
lack these two types of identification were created by the North Carolina SBOE and are described in
two public reports, the first of which was released on January 7, 2013, and is titled “2013 SBOE-
DMV ID Analysis” and the second of which was released on April 17, 2013, and is titled “April 2013
SBOE-DMV ID Analysis.” These two reports detail how the SBOE attempted to determine which
registered voters in North Carolina lack driver’s licenses and nonoperator identification cards, and as
described in the reports the SBOE merged a voter file with a DMV-supplied list of individuals who
have these forms of identification. Voter file names that could not be matched with names in the
DMV list are assumed to lack driver’s licenses and nonoperator identification cards, and the
implication is that these individuals face relatively higher risks of not having the types of
identification necessary to vote. The January list of so-called unmatched registered voters (i.e.,
registered voters who appear to have neither a driver’s license nor a nonoperator identification)
contains 612,955 names and the April list, 318,643 names. These numbers differ roughly by an order
of magnitude, and the discrepancy between them reflects the fact that the SBOE used a different
merging algorithm in April 2013, than it had originally.55
55 The January 2013 unmatched registered voter list previously was available at
ftp://www.app.sboe.state.nc.us/Requests/NODL_20130101.zip (last visited Dec. 9, 2013; available from the authors)
and the April 2013 list previously was available at
ftp://www.app.sboe.state.nc.us/Requests/Unmatched\%20Voters_DMVID.xlsx (last visited Dec. 4, 2013; available
from the authors). See also the accompanying January report at
http://www.app.sboe.state.nc.us/Requests/Materials/Report_ID_DMV\%20&\%20SBOE\%20ID\%20Analysis_2013.p
df (last visited Dec. 9, 2013); SBOE APRIL REPORT, supra note 52.
We checked whether the two unmatched voter lists contain any duplicate records where duplicate records are
those with common county and county-level voter identification numbers; they do not. One issue regarding dates,
though, is worth noting. The registration date field in the January file (it is called registr_dt) contains four-digit years so
that, for example, 1911 can be distinguished from 2011; we checked whether any registration dates in this file were
after January 2, 2013, and none was. That is consistent with the North Carolina SBOE report that describes the January
file as drawing on individuals who were registered as of January 1, 2013. The registration date field for the April 2013,
unmatched voter file contains two-digit years, and this leads to ambiguity between, say, 1950 and 2050. According to
the North Carolina SBOE, the April file is based on registrants as of March 25, 2013; thus, a registrant with an
23
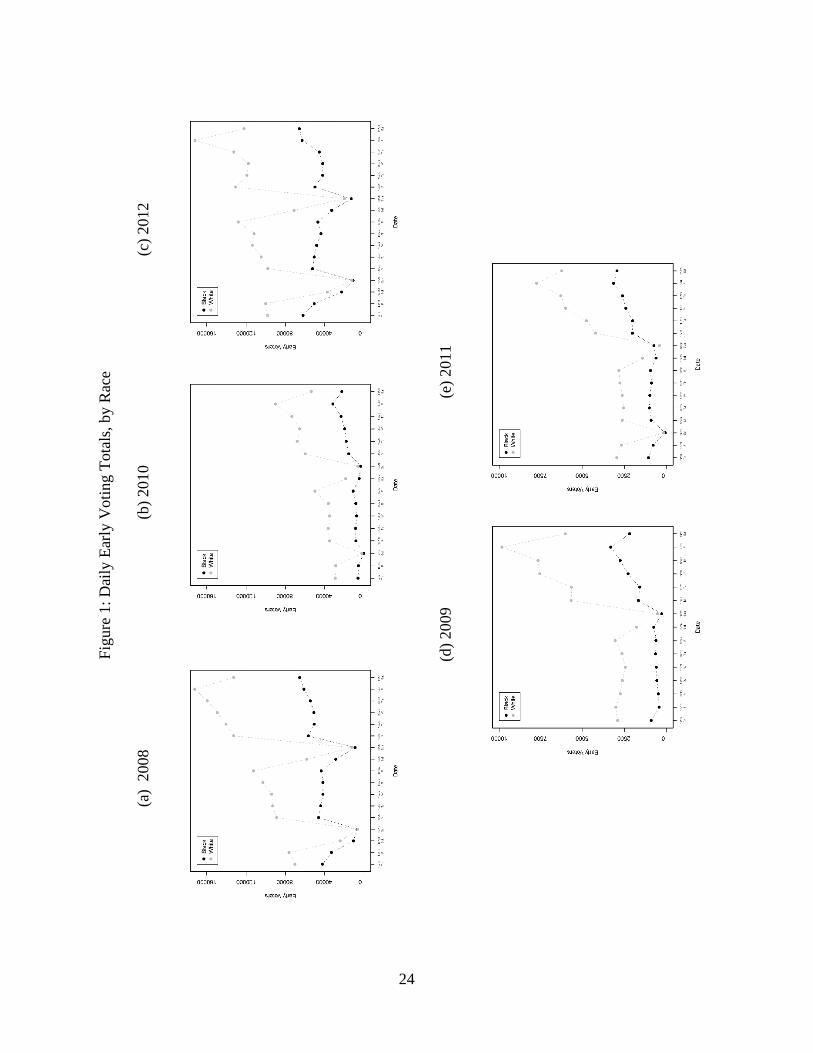
IV. RACIAL TRENDS IN EARLY VOTING
We begin our assessment of the extent to which VIVA will have differential effects across racial
groups in North Carolina with an analysis of early voting in the state in the general and off-year
elections of 2008 through 2012. Prior to VIVA’s enactment, the early voting period in North Carolina
started three Thursdays before a Tuesday Election Day. This yielded an early voting period that could
extend up to 17 days, but in some years past this period contained fewer days because of a lack of
early voting on what would have been the first Sunday of early voting.
Figure 1 displays for our five elections of interest early voting counts broken down by racial
group. There are five panels in the figure, and the horizontal axis in each panel list days on which
early voting took place; not all horizontal axes have the same number of dates, and this reflects the
occasional lack of Saturday and/or Sunday voting in an initial weekend of early voting. The
arrangement of the panels in Figure 1 incorporates the fact that the elections of 2008, 2010, and
2012 were general elections whereas those in 2009 and 2011 were off-year elections. Within these
two groupings the vertical axes are identical across the panels in Figure 1.
ambiguous registration year, one that would lead to a registration post-March 25, 2013, is assumed to have a
registration year in the 20th Century.
24
Fig
ure
1:
Dai
ly E
arly
Vo
ting T
ota
ls,
by R
ace
(c)
2012
(e
) 2
011
(b)
2010
(d)
2009
(a)
2008
25
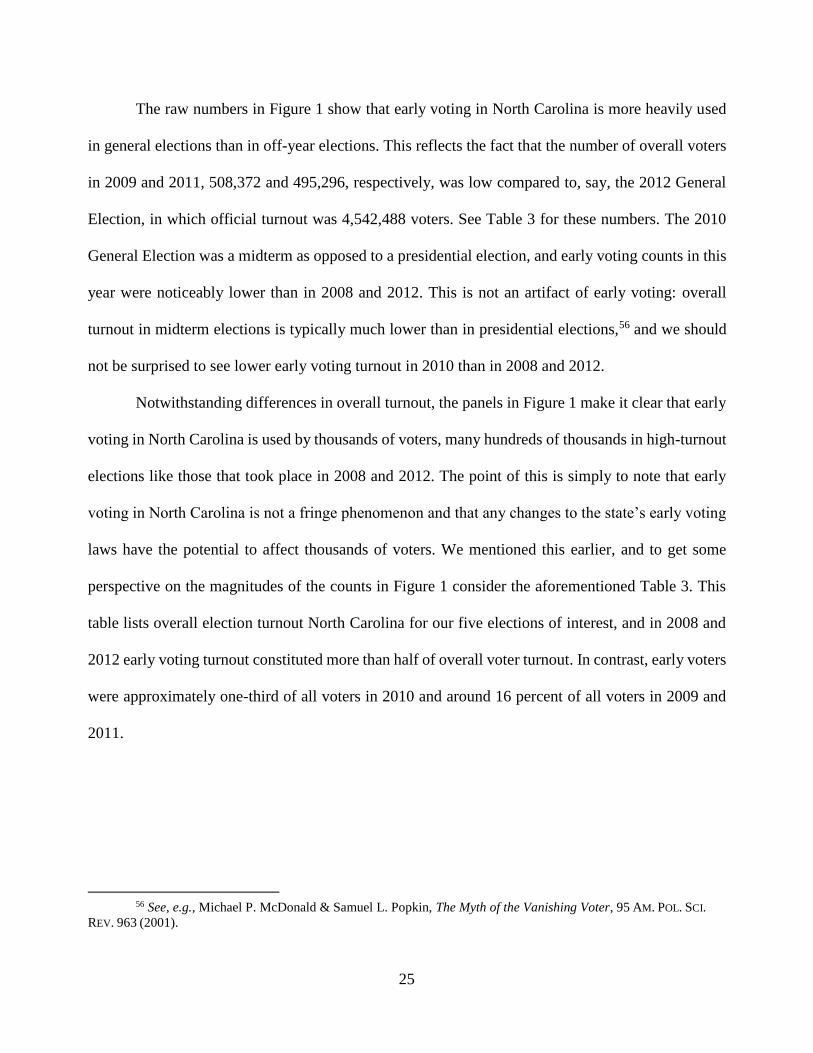
The raw numbers in Figure 1 show that early voting in North Carolina is more heavily used
in general elections than in off-year elections. This reflects the fact that the number of overall voters
in 2009 and 2011, 508,372 and 495,296, respectively, was low compared to, say, the 2012 General
Election, in which official turnout was 4,542,488 voters. See Table 3 for these numbers. The 2010
General Election was a midterm as opposed to a presidential election, and early voting counts in this
year were noticeably lower than in 2008 and 2012. This is not an artifact of early voting: overall
turnout in midterm elections is typically much lower than in presidential elections,56 and we should
not be surprised to see lower early voting turnout in 2010 than in 2008 and 2012.
Notwithstanding differences in overall turnout, the panels in Figure 1 make it clear that early
voting in North Carolina is used by thousands of voters, many hundreds of thousands in high-turnout
elections like those that took place in 2008 and 2012. The point of this is simply to note that early
voting in North Carolina is not a fringe phenomenon and that any changes to the state’s early voting
laws have the potential to affect thousands of voters. We mentioned this earlier, and to get some
perspective on the magnitudes of the counts in Figure 1 consider the aforementioned Table 3. This
table lists overall election turnout North Carolina for our five elections of interest, and in 2008 and
2012 early voting turnout constituted more than half of overall voter turnout. In contrast, early voters
were approximately one-third of all voters in 2010 and around 16 percent of all voters in 2009 and
2011.
56 See, e.g., Michael P. McDonald & Samuel L. Popkin, The Myth of the Vanishing Voter, 95 AM. POL. SCI.
REV. 963 (2001).
26
Table 3: Overall and Early Voting Turnout
Election Overall Turnout Early Voting Turnout Percent Early
2008 4,353,739 2,419,206 55.57
2009 508,372 85,496 16.82
2010 2,700,383 909,122 33.37
2011 495,296 82,195 16.60
2012 4,542,488 2,567,555 56.52
Note: percentages are reported to four significant figures.
The five panels in Figure 1 report daily counts of early voters, and we can use these panels to
understand patterns in temporal variability of early voting in North Carolina. To this end, several
patterns are evident in the figure. First, in all five elections pictured in the figure there were
disproportionately fewer early voters on weekends than on weekdays; this holds for both black and
white early voters. Second, within weekends themselves Sundays saw fewer early voters than
Saturdays, again for both black and white voters. Third, on almost every day of early voting, more
whites than blacks voted early; this is consistent with the fact that there are more whites than blacks
in North Carolina, and this was evident in the aforementioned Table 2. Fourth, Figure 1 shows that,
weekends notwithstanding, North Carolina early voters tend to vote in the second half of the state’s
early voting period; however, the matter of first versus second week of early voting (broadly
construed insofar as North Carolina does not have exactly a two-week early voting period) is not
constant across racial groups. Namely, the white-black gap in early voting turnout appears to
increase as the early voting period progresses.
27
Fig
ure
2:
Dai
ly W
hit
e-B
lack
Dif
fere
nce
s in
Ear
ly V
oti
ng C
ounts
(c)
2012
(e
) 2011
(b)
2010
(d)
2009
(a)
2008
28
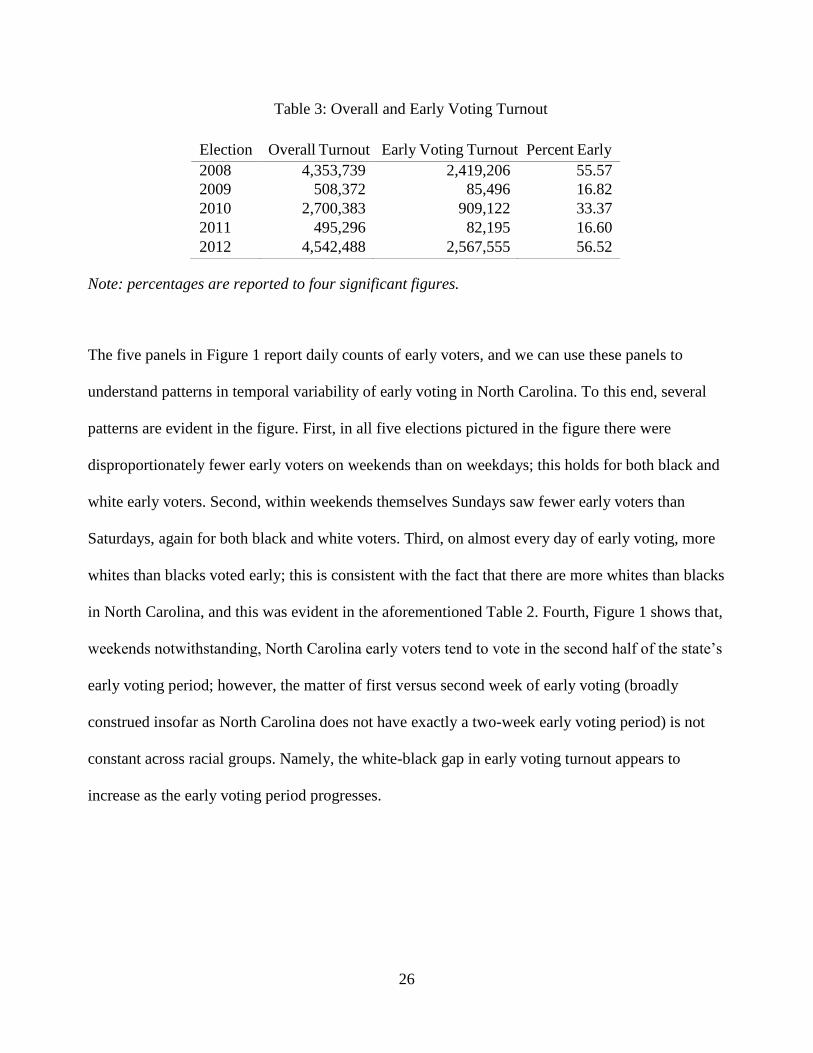
This latter point is particularly noteworthy in light of VIVA’s elimination of the first week of
early voting in North Carolina. More details on the white-black early voting gap are reported in
Figure 2, which plots white-black differences in early voting counts from the General Elections of
2008 through 2012. To be precise, the differences in Figure 2 are computed by subtracting black
early voting counts in Figure 1 from corresponding white counts. When a difference on a particular
day is relatively large and positive, then many whites compared to blacks early voted on that day. A
white minus black early voting difference that is negative connotes a day on which more blacks cast
their ballots early compared than whites.
Temporarily ignoring the evident weekend effects, what is clear in Figure 2 is that the five
pictured white-black difference sequences in early voting turnout increase in time. In other words,
early voting blacks tend to cast their ballots earlier than do early voting whites. Why this phenomenon
obtains is beyond the scope of this study, and it would be difficult to address this matter with voter
file data alone.57 Regardless, Figure 2 documents that the two largest racial groups in North Carolina
have historically voted at different times during past the early voting periods in the state.
Weekends break up the patterns in Figure 2, but even here we see evidence of a changing
white-black early voting gap. Comparing when possible the second Saturday of early voting to the
first Saturday of early voting or the second Sunday of early voting to first Sunday of early voting
shows that the white-black early voting gap is greater in second weekend early voting compared to
first weekend early voting.
57 One explanation may lie in mobilization efforts carried out by groups such as Democracy North Carolina
and the North Carolina NAACP, who have worked with African American congregations as well as the General Baptist
State Convention and other churches, to get out the vote as part of an early voting “Souls to the Polls” Project. See
Souls to the Polls, DEMOCRACY N.C., available at http://nc-democracy.org/get-involved/souls-to-the-polls (last visited
Dec. 29, 2014).
29
Fig
ure
3:
Rac
ial C
om
posi
tion
of
Ear
ly V
oti
ng E
lect
ora
tes
(c)
2012
(e
) 2011
(b)
2010
(d)
2009
(a)
2008
30
This is consistent with the idea that black early voters in North Carolina tend to vote earlier in the
allotted period than white early voters. Herron and Smith find evidence of similar weekend early
voting effects in Florida in the 2008 and 2012 General Elections.58
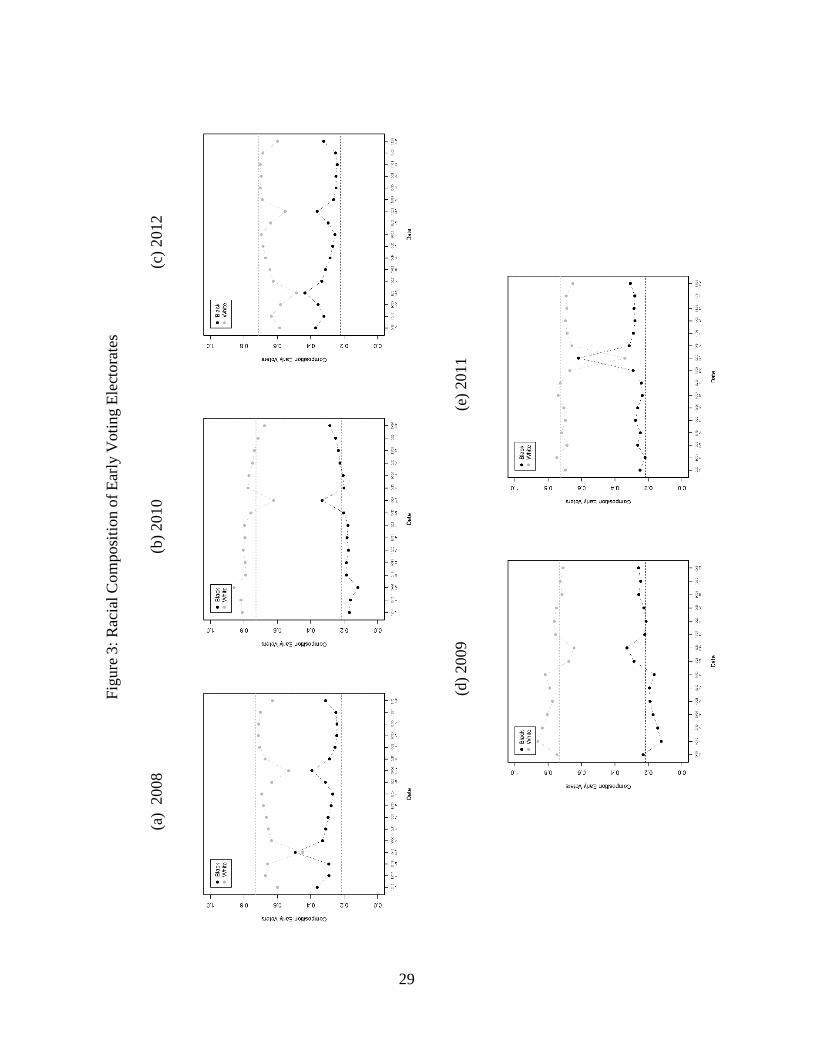
Another perspective on the difference between black and white early voting rates in North
Carolina can be gleaned by considering the fraction of a day’s early voting electorate that was black
(similarly, white) and then comparing this fraction to the fraction of blacks (similarly, whites) in a
corresponding registered voter pool. With this in mind, for our five elections of interest Figure 3 plots
for each early voting day the composition of the early voting electorate that is black and the
composition that is white. On each early voting day these compositions sum to a number close to one
because there are North Carolina early voters in all five of our elections of interest who were neither
black nor white. The panels in Figure 3 contain dashed horizontal lines that indicate the fraction of
the North Carolina registered voter pool that was black and white based on an appropriate voter file.
The dashed lines reflect the black and white registered voter percentages in Table 2.59
Several things are apparent in Figure 3. First, in presidential election years—2008 and 2012—
the early voting electorate in North Carolina was disproportionately black on every day of early
voting. In Figures 3a and 3c, that is, every black dot lies above its corresponding dashed line and
every white dot below its dashed line. In the 2010 General Election, which was a general election yet
did not feature a presidential contest, this pattern does not hold. In 2010, whites were
58 Michael C. Herron & Daniel A. Smith, Race, Party, and the Consequences of Restricting Early Voting in
Florida in the 2012 General Election, 67 POL. RES. Q. 646, 656 (2014). 59 Table 2 shows that within the North Carolina registered voter pool fraction black increased slightly in 2013.
This is incorporated in the placement of the dashed line in Figure 3c although visually speaking the height of this line is
very similar to the heights of the dashed lines in Figures 3a and 3b.
31
disproportionately represented among early voters up until the end of the early voting period, when
blacks became the disproportionately represented group.60
Second, the presence of weekend effects in Figure 3 is evident: the early voting electorate in
North Carolina is disproportionately black on weekends compared to the registered voter pool in
North Carolina. Third, in the presidential election years of 2008 and 2012 the black fraction of the
early voting electorate gradually decreased over the course of the early voting period. There were
only 17 days in the 2008 and 2012 early voting periods, of which five days were weekends, and thus
we compare in Table 4 fraction black on the first day of early voting with fraction black on the last
non-weekend day of early voting. The table shows that the first weekday-last weekday drop in
fraction black of the early voting electorate was statistically significant at conventional confidence
levels in four of our elections studied with negative drops in 2008 and 2012 (presidential years) and
the opposite in 2010 (midterm election).
Table 4: Fraction Black at Beginning and End of Early Voting Period
Election Fraction Black
First Thursday
Fraction Black
Last Friday
Difference
z-statistic
2008 0.3611 0.2492 0.1120 69.83
2009 0.2316 0.2463 -0.01463 1.877
2010 0.1683 0.2510 -0.08277 32.83
2011 0.2503 0.2815 -0.03117 3.888
2012 0.3703 0.2518 0.1186 82.01
Note: results are reported to four significant figures.
Fourth and finally, the dashed lines in the five panels of Figure 3 are notable insofar as they
show that black early voters in 2008 and 2012 were overrepresented compared to blacks in the North
60 We computed difference-in-proportion z-statistics for each black percentage in Figure 4a, 4b and 4c. All the
z-statistics—those that are positive because the black percentage of early voters lies above a dotted line and in addition
those that are negative—are significantly different than zero at conventional confidence levels.
32
Carolina voter pool and that white early voters were underrepresented. This pattern of black and
white over and under representation obtains on every early voting day in 2012 and has been found in
other contexts as well.61 In 2008 there were some days on which the fraction of white early voters
was slightly larger than the fraction of white registered voters in the state, but, as in 2012, black early
voters were disproportionately overrepresented on every day of early voting.
V. RACE AND TIMING OF VOTER REGISTRATION
We earlier noted that VIVA altered the voter registration rules in North Carolina. Prior to this
legislation’s enactment, eligible North Carolina residents could register to vote during early voting
and even on Election Day itself; election Day registrants were not allowed to vote on the day they
registered, however. Per VIVA, however, registration and subsequent voting during the North
Carolina’s early voting period—what is often known as “Same Day Registration”—is no longer
permitted, and eligible residents in the state who want to register to vote in a General Election must
register no later than 25 days prior to Election Day.
Are VIVA’s changes to voter registration protocols in North Carolina race-neutral? Our initial
look at this question considers VIVA’s elimination of the opportunity for eligible North Carolina
residents to register to vote in the 25 days prior to and including Election Day. For the General
Elections in 2008, 2010, and 2012, Table 5 describes the total number (see the “All” row in the table)
of North Carolina voter registrations in the year before the election as well as the total number of
registrations in the 25 day window beforehand. Table 5 also breaks down these registrations into
black and white categories; for each election, it reports the percentages of a given registration pool
that these two racial groups group constituted.
61 See, e.g., Michael C. Herron & Daniel A. Smith, Souls to the Polls: Early Voting in Florida in the Shadow
of House Bill 1355, 11 ELECTION L.J. 331, 343 (2012);
33
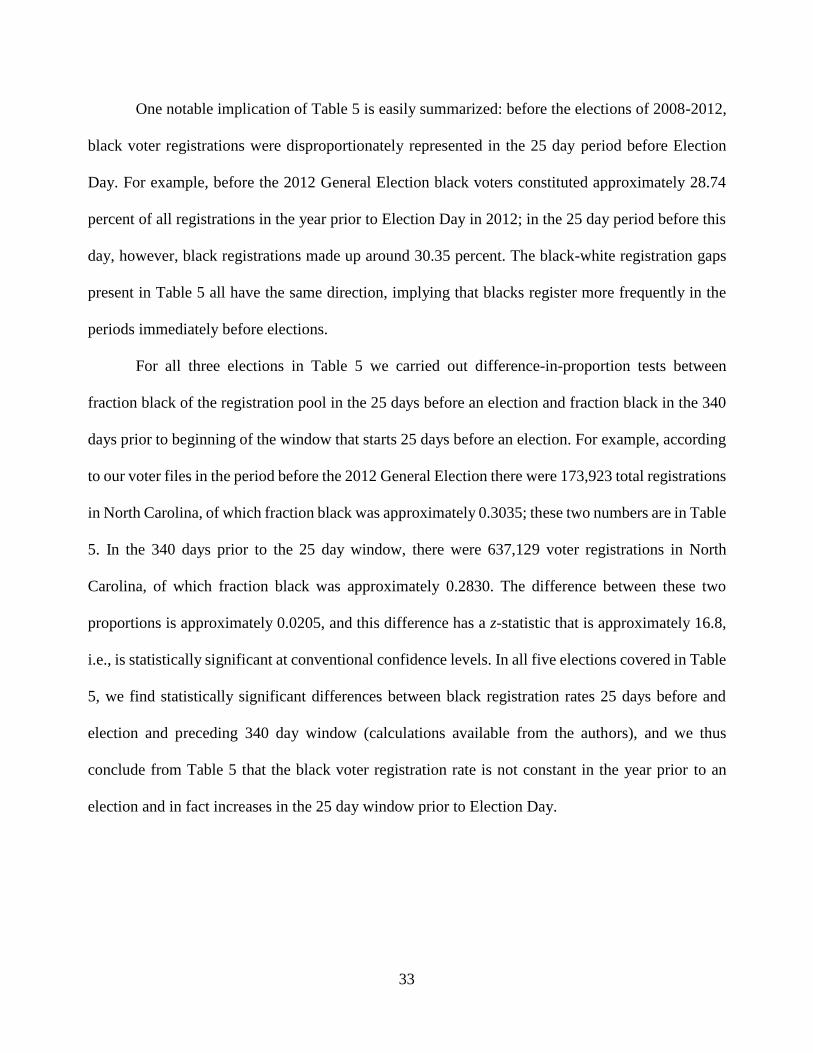
One notable implication of Table 5 is easily summarized: before the elections of 2008-2012,
black voter registrations were disproportionately represented in the 25 day period before Election
Day. For example, before the 2012 General Election black voters constituted approximately 28.74
percent of all registrations in the year prior to Election Day in 2012; in the 25 day period before this
day, however, black registrations made up around 30.35 percent. The black-white registration gaps
present in Table 5 all have the same direction, implying that blacks register more frequently in the
periods immediately before elections.
For all three elections in Table 5 we carried out difference-in-proportion tests between
fraction black of the registration pool in the 25 days before an election and fraction black in the 340
days prior to beginning of the window that starts 25 days before an election. For example, according
to our voter files in the period before the 2012 General Election there were 173,923 total registrations
in North Carolina, of which fraction black was approximately 0.3035; these two numbers are in Table
5. In the 340 days prior to the 25 day window, there were 637,129 voter registrations in North
Carolina, of which fraction black was approximately 0.2830. The difference between these two
proportions is approximately 0.0205, and this difference has a z-statistic that is approximately 16.8,
i.e., is statistically significant at conventional confidence levels. In all five elections covered in Table
5, we find statistically significant differences between black registration rates 25 days before and
election and preceding 340 day window (calculations available from the authors), and we thus
conclude from Table 5 that the black voter registration rate is not constant in the year prior to an
election and in fact increases in the 25 day window prior to Election Day.
34
Table 5: Voter Registrations before General Elections
Total Percentage
Election Group Year Prior 25 Days Prior Year Prior 25 Days Prior
2008 All 881,831 177,103 — —
Black 275,153 58,652 31.20 33.12
White 503,150 95,398 57.06 53.87
2009 All 194,089 14,707 — —
Black 38,002 3,072 19.58 20.89
White 13,7911 10,404 71.06 70.74
2010 All 263,731 46,475 — —
Black 52,940 11,291 20.07 24.29
White 187,075 29,126 70.93 62.67
2011 All 242,905 21,773 — —
Black 54,304 5,209 22.24 23.92
White 167,625 14,378 69.01 66.04
2012 All 811,052 173,923 — —
Black 233,072 52,790 28.74 30.35
White 463,733 90,958 57.18 52.30
Note: the percentage columns in the table refer to the fraction of a registration cohort that a
particular racial group comprises. Percentages are reported to four significant figures.
The language of VIVA focuses attention on the 25 day period before an election, but our
registration data allow us to compare daily black and white registration rates. For both blacks and
whites and for each election of interest we calculate using the September 2013, voter file the number
of registrations on each day in a 51 day window up to and including Election Day itself. Then, for
each day we calculate the racial composition of the day’s registration pool by dividing the number of
blacks who registered on that day by the number of that day’s registrations; this yields a daily time
series of black registration compositions. We do the same for whites, thus generating a daily series
of white registration compositions. We then plot our black and white sequences in Figure 4, and this
figure contains five panels, each of which is associated with an election in North Carolina. The
orientation of the panels in Figure 4 is identical to that seen earlier, the various dots in the panels
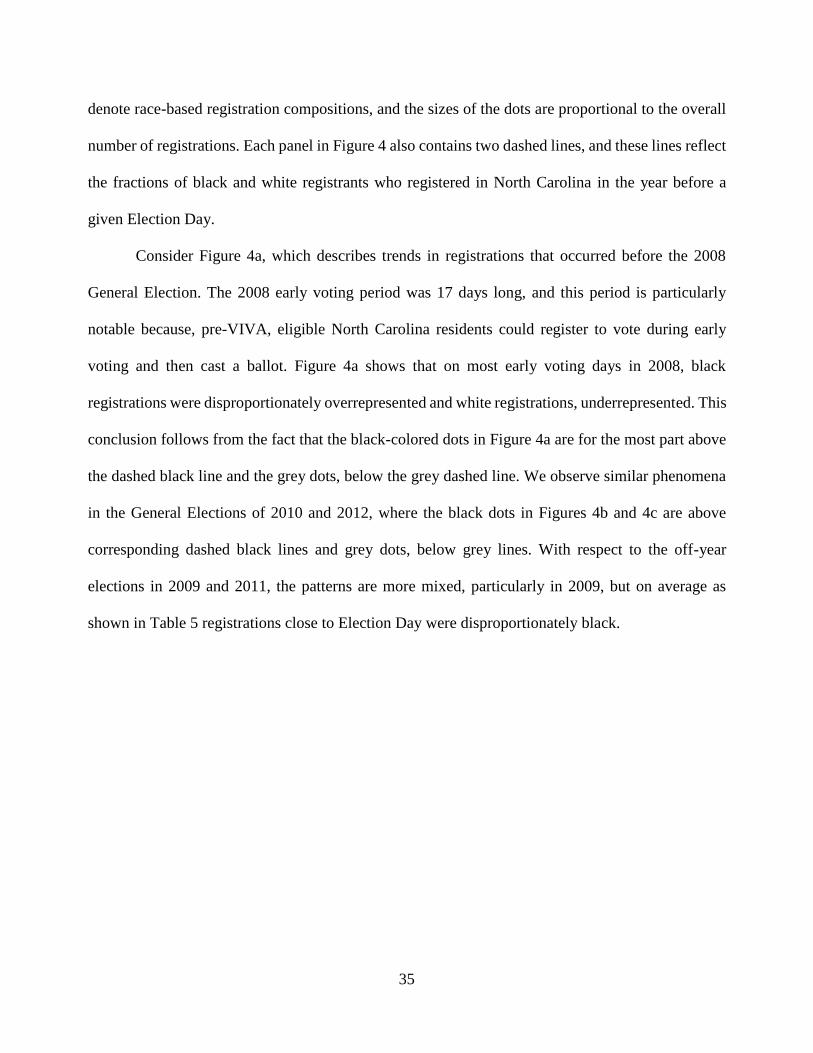
35
denote race-based registration compositions, and the sizes of the dots are proportional to the overall
number of registrations. Each panel in Figure 4 also contains two dashed lines, and these lines reflect
the fractions of black and white registrants who registered in North Carolina in the year before a
given Election Day.
Consider Figure 4a, which describes trends in registrations that occurred before the 2008
General Election. The 2008 early voting period was 17 days long, and this period is particularly
notable because, pre-VIVA, eligible North Carolina residents could register to vote during early
voting and then cast a ballot. Figure 4a shows that on most early voting days in 2008, black
registrations were disproportionately overrepresented and white registrations, underrepresented. This
conclusion follows from the fact that the black-colored dots in Figure 4a are for the most part above
the dashed black line and the grey dots, below the grey dashed line. We observe similar phenomena
in the General Elections of 2010 and 2012, where the black dots in Figures 4b and 4c are above
corresponding dashed black lines and grey dots, below grey lines. With respect to the off-year
elections in 2009 and 2011, the patterns are more mixed, particularly in 2009, but on average as
shown in Table 5 registrations close to Election Day were disproportionately black.
36
Fig
ure
4:
Dai
ly R
ace-
Bas
ed C
om
posi
tions
of
Nort
h C
aroli
na
Reg
istr
ants
(c)
2012
Note
: ea
ch d
ot re
pre
sents
a d
ay’
s w
ort
h o
f vo
ter
regis
trati
on for
a r
aci
al
gro
up.
Dot si
zes
are
pro
port
ional to
the
num
ber
of
regis
trati
ons,
and
the
two
dots
for
each
day
in th
e fi
gure
do n
ot in
gen
eral
sum
to o
ne
bec
ause
ther
e are
raci
al gro
ups
in
Nort
h C
aro
lina b
eyond b
lack
and w
hit
e.
(e)
2011
(b)
2010
(d)
2009
(a)
2008
37
VI. RACE AND AVAILABILITY OF VOTER PHOTO IDENTIFICATION
Our next look at VIVA considers the matter of voter photo identification. This subject is the
focus of a variety of existing research projects,62 and here we contribute to the literature a brief
analysis of the availability of identification to currently registered North Carolina residents.
Prior to the passage of VIVA, North Carolina did not have a voter identification requirement.
However, VIVA mandates that starting in 2016 all in-person voters in North Carolina show photo
identification prior to casting a ballot, and VIVA contains a list of identification forms that are
acceptable for this purpose. This list includes the following eight types of identification: North
Carolina driver’s license; nonoperator identification card; United States passport; United States
military identification; Veterans Identification card; tribal enrollment card recognized by the United
States; tribal enrollment card recognized by the state of North Carolina; and, driver’s license or
nonoperator identification card issued by Washington, D.C., or a state other than North Carolina as
long as the date of a voter’s registration was within 90 days of an election.63 In considering our
objective of assessing the extent to which VIVA is race-neutral, it is natural to examine rates of
identification ownership by racial group in North Carolina.
To the best of our knowledge, there are no publicly available lists of which residents of North
Carolina (not to mention which registered voters in North Carolina) have passports, military
62 See, e.g., Shelley de Alth, ID at the Polls: Assessing the Impact of Recent State Voter ID Laws on Voter
Turnout, 3 HARV. L. & POL’Y REV. 185 (2008); Matt A. Barreto, Stephen A. Nuño & Gabriel R. Sanchez, The
Disproportionate Impact of Voter-ID Requirements on the Electorate—New Evidence from Indiana, 42 PS: POL. SCI. &
POL. 111 (2009); Jason D. Mycoff, Michael W. Wagner & David C. Wilson, The Empirical Effects of Voter-ID Laws:
Present or Absent?, 42 PS: POL. SCI. & POL. 121 (2009); Richard Sobel & Robert Ellis Smith, Voter-ID Laws
Discourage Participation, Particularly among Minorities, and Trigger a Constitutional Remedy in Lost
Representation, 42 PS: POL. SCI. & POL. 107 (2009); Kyle A. Dropp, Voter Identification Laws and Voter Turnout
(May 28, 2013) (unpublished manuscript), available at
http://kyledropp.weebly.com/uploads/1/2/0/9/12094568/dropp_voter_id.pdf. 63 See Act of July 26, 2013, ch. 381, pt. 2, § 2.1., 2013 N.C. Sess. Laws 1505, 1506, for complete details on
these eight forms of identification.
38
identification form, veterans identification forms, tribal enrollment forms, or driver’s licenses issued
by states other than North Carolina. However, the North Carolina SBOE has created lists of registered
voters in the state who do not appear to have North Carolina driver’s licenses or nonoperator
identification cards, and we rely on these lists when analyzing rates of identification ownership
among North Carolina registered voters.
We discussed earlier when introducing our data sources the SBOE’s attempts to determine
rates of voter identification ownership, and here it suffices to note that during the first half of 2013
the SBOE attempted to match names on a voter file with names of North Carolina residents who hold
driver’s licenses or nonoperator identification cards; recall that these two forms of identification are
managed by the North Carolina DMV. The SBOE carried out such matching exercises multiple times,
and it published matching reports three times, once in January 2013, once in March 2013, and once
in April 2013. Each matching exercise produced a list of what are called unmatched registered voters.
To be clear, these registered voters are individuals who are registered to vote but appear not to have
a driver’s license or a nonoperator identification card. The lists do not contain any voters whose status
is “denied” or “removed.”
In what follows we analyze unmatched registered voter lists produced by the SBOE’s January
and April matching exercises. These were the first and last (as of this paper’s writing) exercises, and
the March list contains fewer names than the January list but more names than the April list. The
January and April unmatched voter lists are publicly available, and they differ in the criteria used to
determine whether a match exists between a given registered voter and an individual whose name
appears on a list of North Carolina residents who have, say, driver’s licenses. For example, consider
a registered voter in North Carolina whose first name, last name, and driver’s license number on
record with the SBOE exactly match the first name, last name, and license number, respectively,
39
associated with a driver’s license issued in North Carolina. The April 2013 matching exercise would
presume that said registered voter was issued a driver’s license in North Carolina.
The example above is arguably not particularly complicated because it uses exact matches in
ostensibly important fields (name and driver’s license number) to link a registered voter in North
Carolina with a driver’s license. Indeed, perhaps the primary dilemma in matching records across
lists of individuals is determining the tightness of criteria for asserting the existence of a match. To
illustrate this point, the April matching exercise carried out by the North Carolina SBOE also assumes
that a match exists between a registered voter and a given driver’s license if the voter and license
share exact first names, last names, and dates of birth; if they share exact first names, last names, and
zip codes; or if the two first names sound similar (this determined by an algorithm which assesses
similarity in names based on sound), the last names match exactly, and dates of birth match exactly.
The January matching exercise used criteria that were much tighter than those used in the
April exercise. In its April report however, the SBOE writes as follows: “With [the] April 2013
analysis, the SBOE is [sic] expanded its matching criteria to allow for additional variation in voters
names and data entry errors on driver license number, social security number or date of birth in either
of the databases.”64 The April report provides 29 criteria such that, if any criterion is satisfied, a
match is said to exist between a registered voter in North Carolina and a driver’s license or
nonoperator identification card issued in the state.65
The top portion of Table 6 (“Active and inactive registered voters”) contains a black-white
racial breakdown for the January and April unmatched registered voter lists. Since the latter exercise
had looser matching requirements, by construction it produced fewer unmatched registered voters.
64 SBOE APRIL REPORT, supra note 52, at 5. 65 Id.
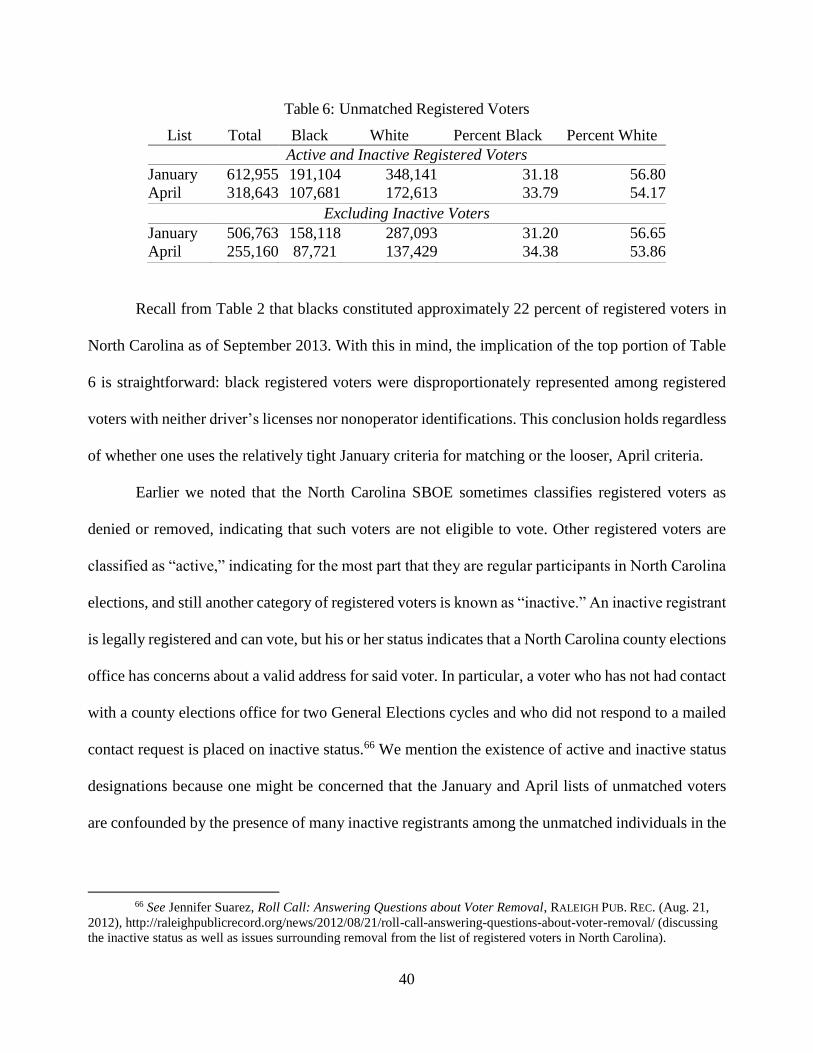
40
Table 6: Unmatched Registered Voters
List Total Black White Percent Black Percent White
Active and Inactive Registered Voters
January 612,955 191,104 348,141 31.18 56.80
April 318,643 107,681 172,613 33.79 54.17
Excluding Inactive Voters
January 506,763 158,118
287,093 31.20 56.65
April 255,160 87,721 137,429 34.38 53.86
Recall from Table 2 that blacks constituted approximately 22 percent of registered voters in
North Carolina as of September 2013. With this in mind, the implication of the top portion of Table
6 is straightforward: black registered voters were disproportionately represented among registered
voters with neither driver’s licenses nor nonoperator identifications. This conclusion holds regardless
of whether one uses the relatively tight January criteria for matching or the looser, April criteria.
Earlier we noted that the North Carolina SBOE sometimes classifies registered voters as
denied or removed, indicating that such voters are not eligible to vote. Other registered voters are
classified as “active,” indicating for the most part that they are regular participants in North Carolina
elections, and still another category of registered voters is known as “inactive.” An inactive registrant
is legally registered and can vote, but his or her status indicates that a North Carolina county elections
office has concerns about a valid address for said voter. In particular, a voter who has not had contact
with a county elections office for two General Elections cycles and who did not respond to a mailed
contact request is placed on inactive status.66 We mention the existence of active and inactive status
designations because one might be concerned that the January and April lists of unmatched voters
are confounded by the presence of many inactive registrants among the unmatched individuals in the
66 See Jennifer Suarez, Roll Call: Answering Questions about Voter Removal, RALEIGH PUB. REC. (Aug. 21,
2012), http://raleighpublicrecord.org/news/2012/08/21/roll-call-answering-questions-about-voter-removal/ (discussing
the inactive status as well as issues surrounding removal from the list of registered voters in North Carolina).
41
top portion of Table 6; perhaps these individuals tend to participate infrequently in all parts of social
and political life, i.e., voting, having a driver’s license, and so forth. To see if such inactivity
confounds our unmatched registered voter results, consider the lower portion of Table 6 (“Excluding
inactive voters”).
If we exclude inactive voters, the fraction of black North Carolina registrants that lacks
driver’s licenses and nonoperator identification cards increases albeit very slightly, i.e., from
approximately 33.79 percent in April 2013, to 34.38 percent. These two percentages are qualitatively
practically identical, and thus Table 6 shows that the overrepresentation of black registrants among
registrants who lack driver’s licenses and nonoperator identification cards is not a function of an
overrepresentation of inactive registered voters among unmatched registered voters.
We now consider whether, and if so how, unmatched registered voters from the
aforementioned January and April lists participated in the 2012 General Election. It is theoretically
possible that all of these individuals did not vote in this election, and it is also theoretically possible
that these individuals tend to vote absentee, which in principle could alleviate the concern that they
lack some forms of VIVA-acceptable identification. According to VIVA, applications for absentee
ballots require “[o]ne or more of the following in the order of preference”: a North Carolina driver’s
license number; a nonoperator identification card number; and the last four digits of an applicant’s
social security number.67 We cannot assess how an absentee ballot request containing only a social
security number would be handled by a county elections official in North Carolina. But, it nonetheless
67 See Act of July 26, 2013, ch. 381, pt. 4, § 4.3., 2013 N.C. Sess. Laws 1505, 1514, for complete details of
such requirements.
42
appears that voters may be able to participate actively in North Carolina elections without providing
photo identification if they vote absentee.68
With this in mind, we merged the January and April lists of unmatched voters with our
September 2013, voter file. This file contains records of who voted in the 2012 General Election, and
results for this merge are in Table 7. An unmatched voter who has a record in the September voter
file but no voting method for the 2012 General Election is assumed to have abstained from voting in
this election.69
Table 7 addresses two questions. First, do the January and April unmatched voter lists consist
predominantly of non-voters? The answer here is no. While the 2012 General Election abstention
rates—approximately 47 percent and approximately 56 percent—for our two sets of unmatched
voters are greater than the then North Carolina abstention rate—approximately 31 percent—in
November 2012, many tens of thousands of unmatched voters participated in the 2012 General
Election.
Second, we noted that VIVA’s voter identification requirements for absentee voting may be
less stringent than those associated with in-person early or in-person Election Day voting. Regardless
of one’s interpretation of VIVA’s language regarding absentee identification, Table 7 shows that
unmatched voters are not heavy users of absentee voting. Rather, they are heavy users of both forms
68 For exceptions related to first-time voters, see the SBOE publication titled “Voter ID Requirements in North
Carolina,” available at
http://www.ncsbe.gov/ncsbe/Voter-Id (Click the third tab named “Voter Information Verification Act (VIVA)” (last
accessed Jan. 31, 2015). 69 To merge the September 2013, voter file and its 2012 General Election participation codes with an
unmatched voter list, we compared county voter identification numbers, county names, and North Carolina voter
identification numbers. If these three fields matched across records in the September file and an unmatched voter list,
then we treat an unmatched voter as having a 2012 General Election participation code. The January unmatched voter
file contains 7,641 individuals who registered on or after Election Day in 2012 (November 6) and the April file, 8,916
such individuals. These individuals are not part of the 2012 General Election analysis in Table 7. Also not part of that
table are one January unmatched voter and three April unmatched voters who have invalid registration fields in their
respective unmatched voter files.
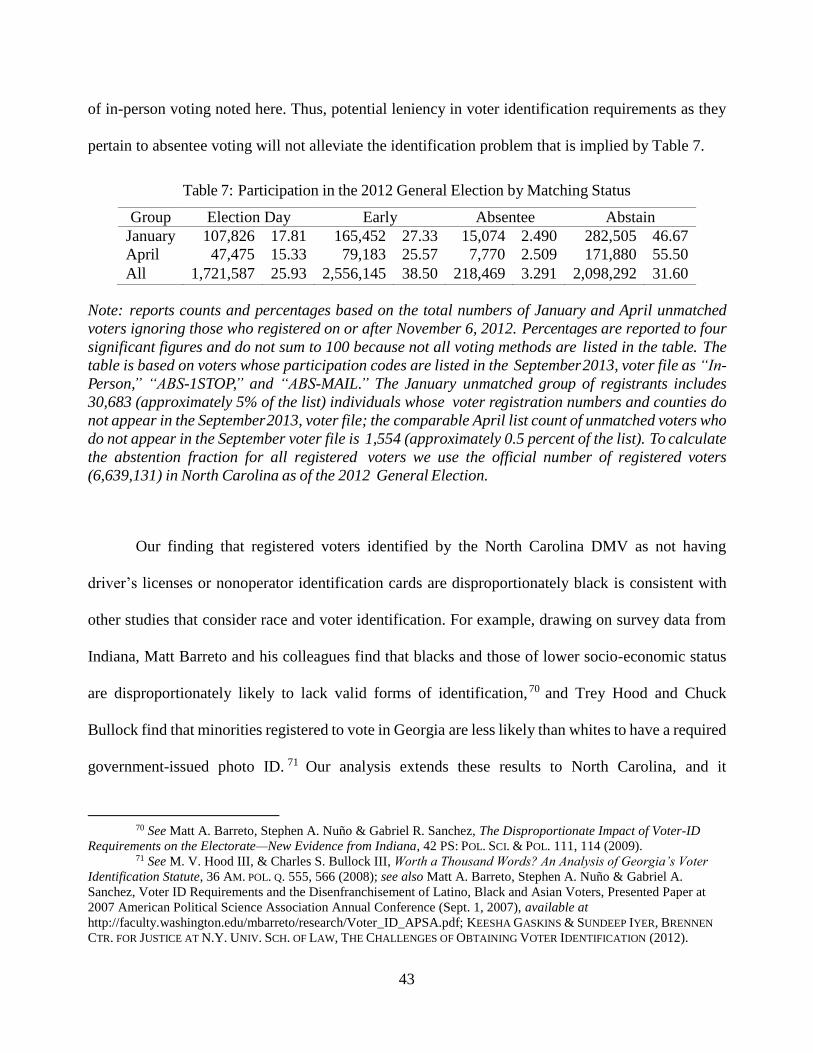
43
of in-person voting noted here. Thus, potential leniency in voter identification requirements as they
pertain to absentee voting will not alleviate the identification problem that is implied by Table 7.
Table 7: Participation in the 2012 General Election by Matching Status
Group Election Day Early Absentee Abstain
January 107,826 17.81 165,452 27.33 15,074 2.490 282,505 46.67
April 47,475 15.33 79,183 25.57 7,770 2.509 171,880 55.50
All 1,721,587 25.93 2,556,145 38.50 218,469 3.291 2,098,292 31.60
Note: reports counts and percentages based on the total numbers of January and April unmatched
voters ignoring those who registered on or after November 6, 2012. Percentages are reported to four
significant figures and do not sum to 100 because not all voting methods are listed in the table. The
table is based on voters whose participation codes are listed in the September 2013, voter file as “In-
Person,” “ABS-1STOP,” and “ABS-MAIL.” The January unmatched group of registrants includes
30,683 (approximately 5% of the list) individuals whose voter registration numbers and counties do
not appear in the September 2013, voter file; the comparable April list count of unmatched voters who
do not appear in the September voter file is 1,554 (approximately 0.5 percent of the list). To calculate
the abstention fraction for all registered voters we use the official number of registered voters
(6,639,131) in North Carolina as of the 2012 General Election.
Our finding that registered voters identified by the North Carolina DMV as not having
driver’s licenses or nonoperator identification cards are disproportionately black is consistent with
other studies that consider race and voter identification. For example, drawing on survey data from
Indiana, Matt Barreto and his colleagues find that blacks and those of lower socio-economic status
are disproportionately likely to lack valid forms of identification,70 and Trey Hood and Chuck
Bullock find that minorities registered to vote in Georgia are less likely than whites to have a required
government-issued photo ID. 71 Our analysis extends these results to North Carolina, and it
70 See Matt A. Barreto, Stephen A. Nuño & Gabriel R. Sanchez, The Disproportionate Impact of Voter-ID
Requirements on the Electorate—New Evidence from Indiana, 42 PS: POL. SCI. & POL. 111, 114 (2009). 71 See M. V. Hood III, & Charles S. Bullock III, Worth a Thousand Words? An Analysis of Georgia’s Voter
Identification Statute, 36 AM. POL. Q. 555, 566 (2008); see also Matt A. Barreto, Stephen A. Nuño & Gabriel A.
Sanchez, Voter ID Requirements and the Disenfranchisement of Latino, Black and Asian Voters, Presented Paper at
2007 American Political Science Association Annual Conference (Sept. 1, 2007), available at
http://faculty.washington.edu/mbarreto/research/Voter_ID_APSA.pdf; KEESHA GASKINS & SUNDEEP IYER, BRENNEN
CTR. FOR JUSTICE AT N.Y. UNIV. SCH. OF LAW, THE CHALLENGES OF OBTAINING VOTER IDENTIFICATION (2012).
44
complements the literature’s survey-based findings on the relationship between voter identification
possession and race.
VII. RACE, VOTER IDENTIFICATION, AND THE 70-YEAR SPECIAL DISPENSATION
We have thus far shown that black registrants in North Carolina are disproportionately
represented among registered voters in the state who lack driver’s licenses and nonoperator
identification forms. VIVA, however, provides a limited age-related exemption to its identification
requirements, and this exemption reads as follows: “any voter having attained the age of 70 years at
the time [the voter presents a form of identification] at [a] voting place shall be permitted to present
an expired form of [an acceptable type] that was unexpired on the voter’s 70th birthday.”72 In addition,
for registered voters at least 70 years old as well as for legally blind, homeless, and certain classes of
registered voters who are unable to obtain a driver’s license, VIVA waives the fee for a special voter
identification card.
Might VIVA’s special treatment of older registered voters ameliorate the overrepresentation
of blacks among North Carolina registrants who lack some types of VIVA-acceptable identification?
Or, in contrast, does the 70 year dispensation exacerbate the racial imbalance that we have discussed
above? One way to address these questions is to compare the black and white fractions of North
Carolina registered voters who are at least 70 years old. Of course there are in North Carolina more
white registered voters who are at least 70 years old compared to black registered voters of this age,
but this is simply a reflection of the fact that there are more whites than blacks in the state. Thus, we
consider here whether the composition of the 70 years plus registered voter pool is similar to the
composition of the North Carolina registered voter pool in general.73
72 Act of July 26, 2013, ch. 381, pt. 2, § 2.1., 2013 N.C. Sess. Laws 1505, 1506. 73 See infra Table 8. Note that this table uses all three of the voter files discussed earlier.
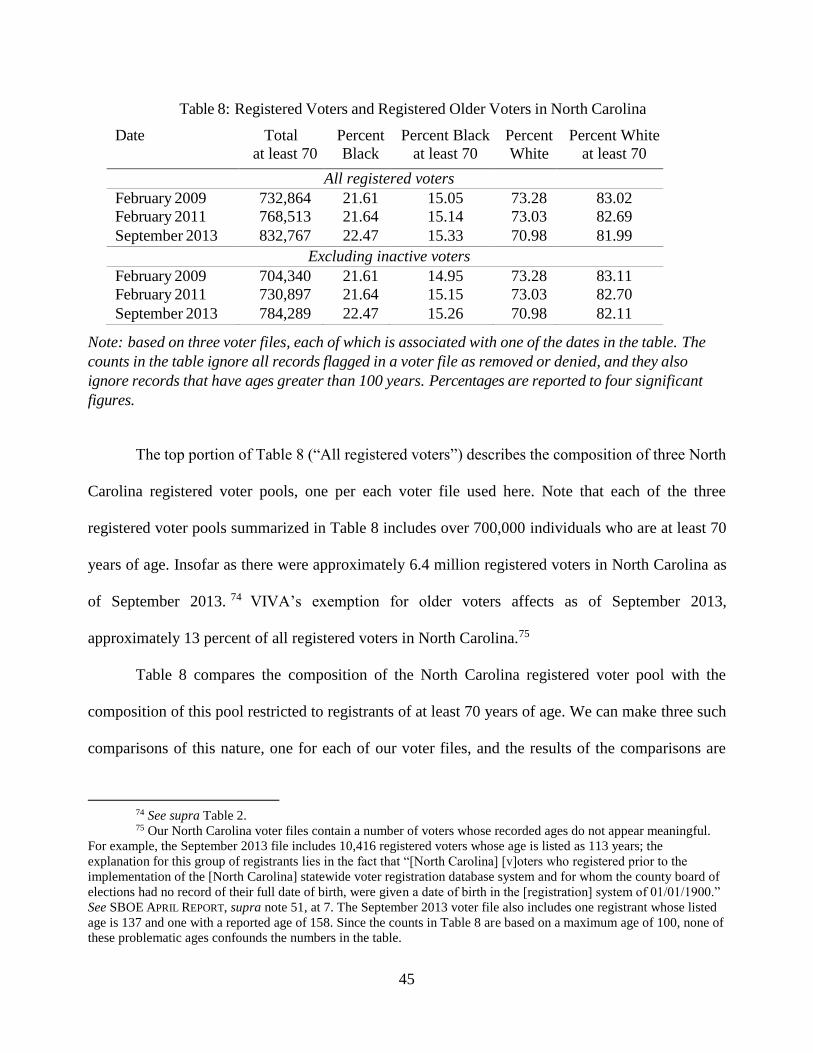
45
Table 8: Registered Voters and Registered Older Voters in North Carolina
Date Total
at least 70
Percent
Black
Percent Black
at least 70
Percent
White
Percent White
at least 70
All registered voters
February 2009 732,864 21.61 15.05 73.28 83.02
February 2011 768,513 21.64 15.14 73.03 82.69
September 2013 832,767 22.47 15.33 70.98 81.99
Excluding inactive voters
February 2009 704,340 21.61 14.95 73.28 83.11
February 2011 730,897 21.64 15.15 73.03 82.70
September 2013 784,289 22.47 15.26 70.98 82.11
Note: based on three voter files, each of which is associated with one of the dates in the table. The
counts in the table ignore all records flagged in a voter file as removed or denied, and they also
ignore records that have ages greater than 100 years. Percentages are reported to four significant
figures.
The top portion of Table 8 (“All registered voters”) describes the composition of three North
Carolina registered voter pools, one per each voter file used here. Note that each of the three
registered voter pools summarized in Table 8 includes over 700,000 individuals who are at least 70
years of age. Insofar as there were approximately 6.4 million registered voters in North Carolina as
of September 2013. 74 VIVA’s exemption for older voters affects as of September 2013,
approximately 13 percent of all registered voters in North Carolina.75
Table 8 compares the composition of the North Carolina registered voter pool with the
composition of this pool restricted to registrants of at least 70 years of age. We can make three such
comparisons of this nature, one for each of our voter files, and the results of the comparisons are
74 See supra Table 2. 75 Our North Carolina voter files contain a number of voters whose recorded ages do not appear meaningful.
For example, the September 2013 file includes 10,416 registered voters whose age is listed as 113 years; the
explanation for this group of registrants lies in the fact that “[North Carolina] [v]oters who registered prior to the
implementation of the [North Carolina] statewide voter registration database system and for whom the county board of
elections had no record of their full date of birth, were given a date of birth in the [registration] system of 01/01/1900.”
See SBOE APRIL REPORT, supra note 51, at 7. The September 2013 voter file also includes one registrant whose listed
age is 137 and one with a reported age of 158. Since the counts in Table 8 are based on a maximum age of 100, none of
these problematic ages confounds the numbers in the table.
46
straightforward: whites are disproportionately represented among registered voters who are at least
70 years old. For example, in February 2009, the North Carolina registered voter pool was
approximately 73.28 percent white. However, among registered voters who were at least 70 years
old, the North Carolina registered voter pool was approximately 83.02 percent white.
It seems intuitively plausible that older registrants in North Carolina are more likely to have
an inactive status than younger registrants, and in theory this could confound the associations
described in Table 8 between age and race. Perhaps the overabundance of white registrants in the top
portion of the table includes primarily inactive voters, in which case one might argue that the size of
such a group is not particularly noteworthy. With this in mind, the lower portion of Table 8
(“Excluding inactive voters”) reports results about age and race, this time excluding officially
inactive registered voters. The racial percentages in the lower part of the table are not identical to
those in the top half, but they are nonetheless qualitatively very similar. Indeed, the implications of
both sections of Table 8 are identical: whites are overrepresented, and blacks underrepresented,
among registered voters in North Carolina who are at least 70 years of age.
Figure 5 presents another look at the distribution of age among registered North Carolina
voters. The figure contains three panels, one corresponding to each of the voter files considered here,
and each panel describes the distribution of age among black and among white registrants. In
particular, for ages 17 to 100 the black points in the three panels of Figure 5 describe the fraction of
all black registered voters who are of a given age; the grey-colored points describe the same thing
but for white registered voters. The sum of the heights of the black points (and similarly the white
points) in each panel is one. Finally, each panel in Figure 5 contains a dashed vertical line at 70 years,
and this reflects VIVA’s 70 year age dispensation.
47
The three panels in Figure 5 are not appreciably different, and this is not particularly
surprising. It would be somewhat peculiar if, say, the distribution of age across North Carolina
registered voters had changed dramatically between 2009 and 2013.
Figures 5a-5c show the following. Among black registrants, there are more relatively younger
voters than older voters. This is evident in the heights of the black dots that correspond to lower ages,
say, ages under 40. Among white registrants, though, one observes the opposite pattern, namely, that
there older registrants are more numerous than younger ones. Average ages follow a similar pattern.
In September 2013, for example, the average age among black registrants was approximately 44.76
(s ≈ 17.26), and the corresponding white registrant average, approximately 49.55 (s ≈ 18.03).76 This
pattern—white registrants in North Carolina being on average older than black registrants—obtained
in February 2009 and in February 2011 as well.77
In sum, the composition of registered voters in North Carolina who are at least 70 years of
age is disproportionately white, and there is also a greater proportion of white registered voters who
are 70 years of age and older compared to black registered voters. We thus find that VIVA’s photo
identification dispensation for older, registered voters will likely only exacerbate the disparity across
racial groups we have identified with respect to driver’s licenses and nonoperator forms of
identification. This dispensation is not race-neutral as it effectively lowers the cost of in-person
voting for a larger proportion of white registered voters than black registered voters.
76 These averages are based on registrants whose ages are reported to be between 16 and 100 years. The black
and white averages are significantly different at conventional confidence levels. 77 The results are available from the authors.
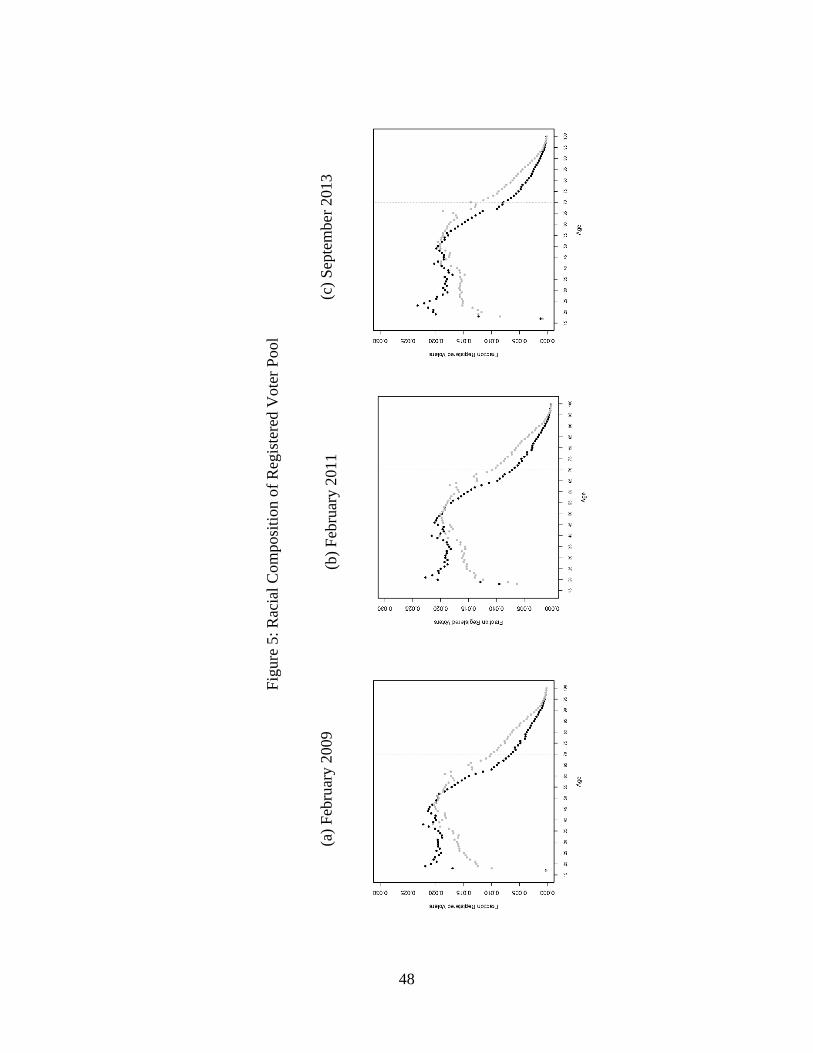
48
Fig
ure
5:
Rac
ial
Com
posi
tion o
f R
egis
tere
d V
ote
r P
ool
(c)
Sep
tem
ber
2013
(b)
Feb
ruar
y 2
011
(a)
Feb
ruar
y 2
009
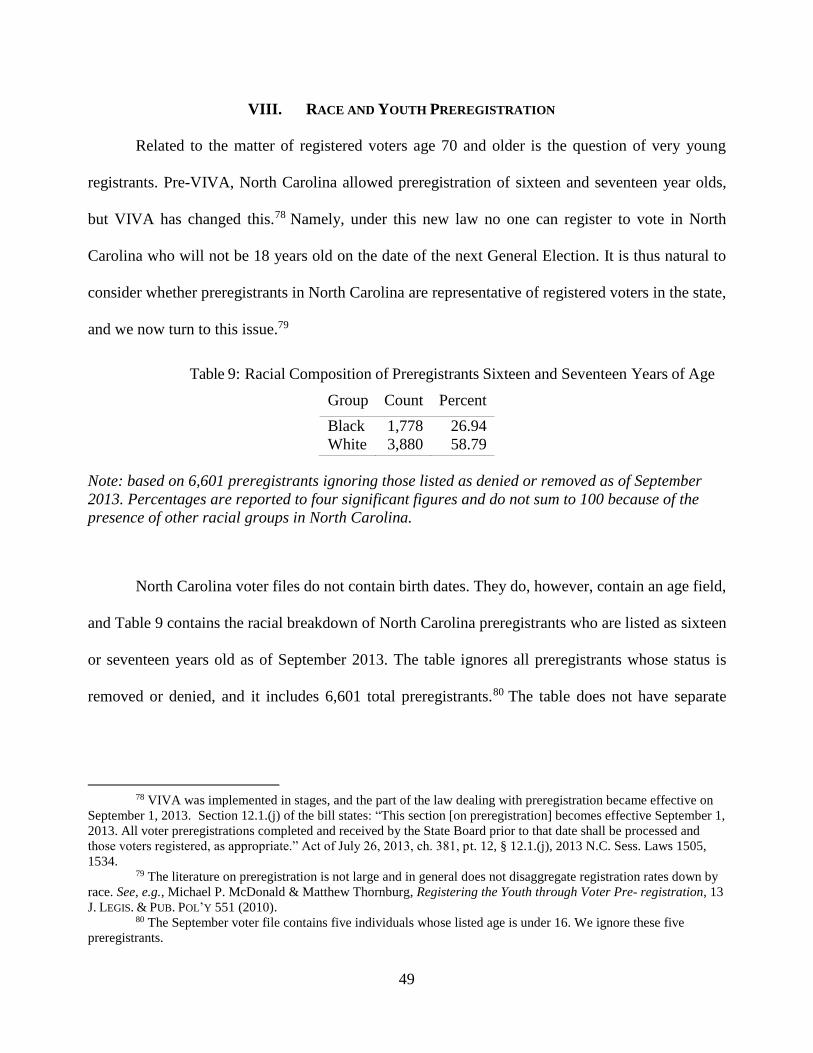
49
VIII. RACE AND YOUTH PREREGISTRATION
Related to the matter of registered voters age 70 and older is the question of very young
registrants. Pre-VIVA, North Carolina allowed preregistration of sixteen and seventeen year olds,
but VIVA has changed this.78 Namely, under this new law no one can register to vote in North
Carolina who will not be 18 years old on the date of the next General Election. It is thus natural to
consider whether preregistrants in North Carolina are representative of registered voters in the state,
and we now turn to this issue.79
Table 9: Racial Composition of Preregistrants Sixteen and Seventeen Years of Age
Group Count Percent
Black 1,778 26.94
White 3,880 58.79
Note: based on 6,601 preregistrants ignoring those listed as denied or removed as of September
2013. Percentages are reported to four significant figures and do not sum to 100 because of the
presence of other racial groups in North Carolina.
North Carolina voter files do not contain birth dates. They do, however, contain an age field,
and Table 9 contains the racial breakdown of North Carolina preregistrants who are listed as sixteen
or seventeen years old as of September 2013. The table ignores all preregistrants whose status is
removed or denied, and it includes 6,601 total preregistrants.80 The table does not have separate
78 VIVA was implemented in stages, and the part of the law dealing with preregistration became effective on
September 1, 2013. Section 12.1.(j) of the bill states: “This section [on preregistration] becomes effective September 1,
2013. All voter preregistrations completed and received by the State Board prior to that date shall be processed and
those voters registered, as appropriate.” Act of July 26, 2013, ch. 381, pt. 12, § 12.1.(j), 2013 N.C. Sess. Laws 1505,
1534. 79 The literature on preregistration is not large and in general does not disaggregate registration rates down by
race. See, e.g., Michael P. McDonald & Matthew Thornburg, Registering the Youth through Voter Pre- registration, 13
J. LEGIS. & PUB. POL’Y 551 (2010). 80 The September voter file contains five individuals whose listed age is under 16. We ignore these five
preregistrants.
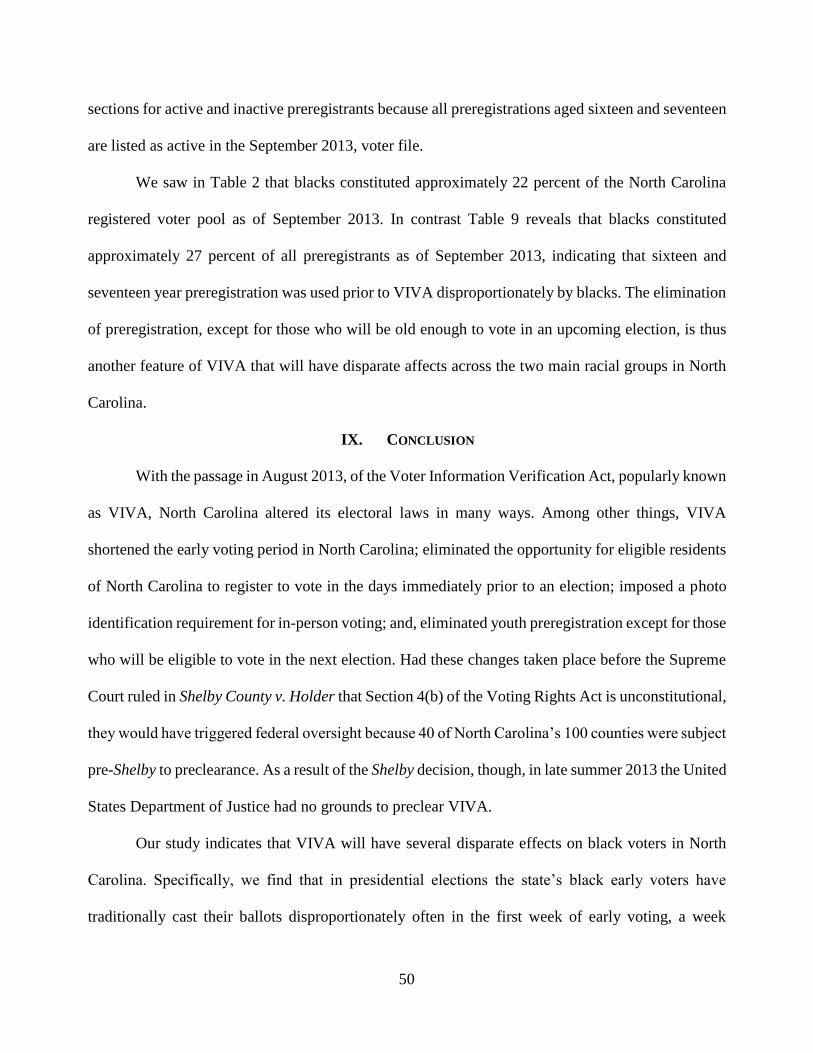
50
sections for active and inactive preregistrants because all preregistrations aged sixteen and seventeen
are listed as active in the September 2013, voter file.
We saw in Table 2 that blacks constituted approximately 22 percent of the North Carolina
registered voter pool as of September 2013. In contrast Table 9 reveals that blacks constituted
approximately 27 percent of all preregistrants as of September 2013, indicating that sixteen and
seventeen year preregistration was used prior to VIVA disproportionately by blacks. The elimination
of preregistration, except for those who will be old enough to vote in an upcoming election, is thus
another feature of VIVA that will have disparate affects across the two main racial groups in North
Carolina.
IX. CONCLUSION
With the passage in August 2013, of the Voter Information Verification Act, popularly known
as VIVA, North Carolina altered its electoral laws in many ways. Among other things, VIVA
shortened the early voting period in North Carolina; eliminated the opportunity for eligible residents
of North Carolina to register to vote in the days immediately prior to an election; imposed a photo
identification requirement for in-person voting; and, eliminated youth preregistration except for those
who will be eligible to vote in the next election. Had these changes taken place before the Supreme
Court ruled in Shelby County v. Holder that Section 4(b) of the Voting Rights Act is unconstitutional,
they would have triggered federal oversight because 40 of North Carolina’s 100 counties were subject
pre-Shelby to preclearance. As a result of the Shelby decision, though, in late summer 2013 the United
States Department of Justice had no grounds to preclear VIVA.
Our study indicates that VIVA will have several disparate effects on black voters in North
Carolina. Specifically, we find that in presidential elections the state’s black early voters have
traditionally cast their ballots disproportionately often in the first week of early voting, a week
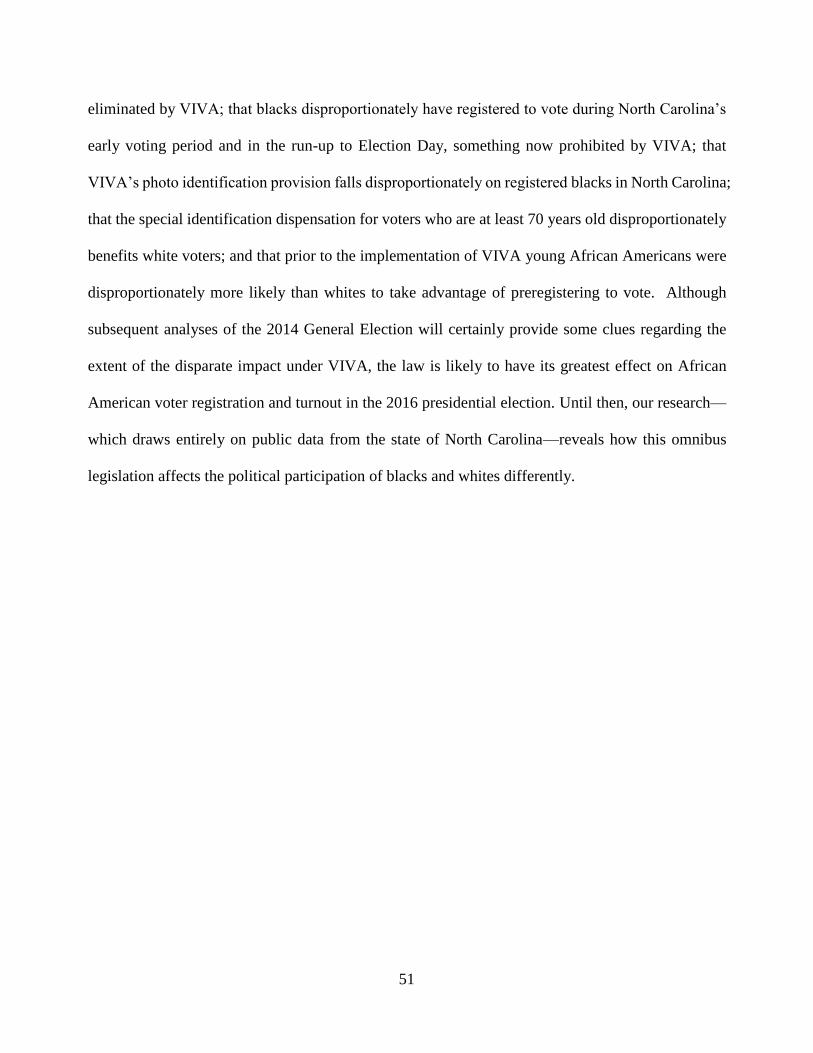
51
eliminated by VIVA; that blacks disproportionately have registered to vote during North Carolina’s
early voting period and in the run-up to Election Day, something now prohibited by VIVA; that
VIVA’s photo identification provision falls disproportionately on registered blacks in North Carolina;
that the special identification dispensation for voters who are at least 70 years old disproportionately
benefits white voters; and that prior to the implementation of VIVA young African Americans were
disproportionately more likely than whites to take advantage of preregistering to vote. Although
subsequent analyses of the 2014 General Election will certainly provide some clues regarding the
extent of the disparate impact under VIVA, the law is likely to have its greatest effect on African
American voter registration and turnout in the 2016 presidential election. Until then, our research—
which draws entirely on public data from the state of North Carolina—reveals how this omnibus
legislation affects the political participation of blacks and whites differently.