Embed Size (px)
Citation preview
The author(s) shown below used Federal funds provided by the U.S. Department of Justice and prepared the following final report: Document Title: Race/Ethnicity, Juvenile Court Processing and
Case Outcomes: Fluctuation or Stability? Author(s): Michael J. Leiber, Ph.D., Jennifer H. Peck, Ph.D. Document No.: 246229 Date Received: April 2014 Award Number: 2012-IJ-CX-0051 This report has not been published by the U.S. Department of Justice. To provide better customer service, NCJRS has made this Federally-funded grant report available electronically.
Opinions or points of view expressed are those of the author(s) and do not necessarily reflect
the official position or policies of the U.S. Department of Justice.
1
RACE/ETHNICITY, JUVENILE COURT PROCESSING AND CASE OUTCOMES:
FLUCTUATION OR STABILITY?
Final Report
Submitted to Data Resources Program for 2012: Funding for Analysis of Existing Data
National Institute of Justice
Award No.: 2012-IJ-CX-0051
March 14, 2014
Michael J. Leiber, Ph.D.
Professor and Chair
Department of Criminology
College of Behavioral and Community Sciences
University of South Florida
4202 East Fowler Ave. SOC 107
Tampa, FL 33620
(813) 974-9704 - Office
(813) 974-2803 - Fax
Jennifer H. Peck, Ph.D.
School of Criminology & Criminal Justice
Florida Atlantic University
777 Glades Road
Boca Raton, FL 33431
This project was supported by Award No. 2012-IJ-CX-0051, awarded by the National Institute
of Justice, Office of Justice Programs, U.S. Department of Justice. We like to thank the National
Center for Juvenile Justice, especially Melissa Sickmund, for their support and use of the
Juvenile Court Data Archive (NJCDA), the states and localities that approved access to the data,
as well as the data person for providing more detailed data for the Northeast state. We also want
to thank Dr. Lyndsay Boggess, Dr. Wesley Jennings, Dr. Rachael Powers, and Dr. OJ Mitchell
for their support. The opinions, findings, and conclusions or recommendations expressed in this
publication/program/ exhibition are those of the author(s) and do not necessarily reflect those of
the Department of Justice and those we acknowledged.
This document is a research report submitted to the U.S. Department of Justice. This report has not been published by the Department. Opinions or points of view expressed are those of the author(s)
and do not necessarily reflect the official position or policies of the U.S. Department of Justice.
i
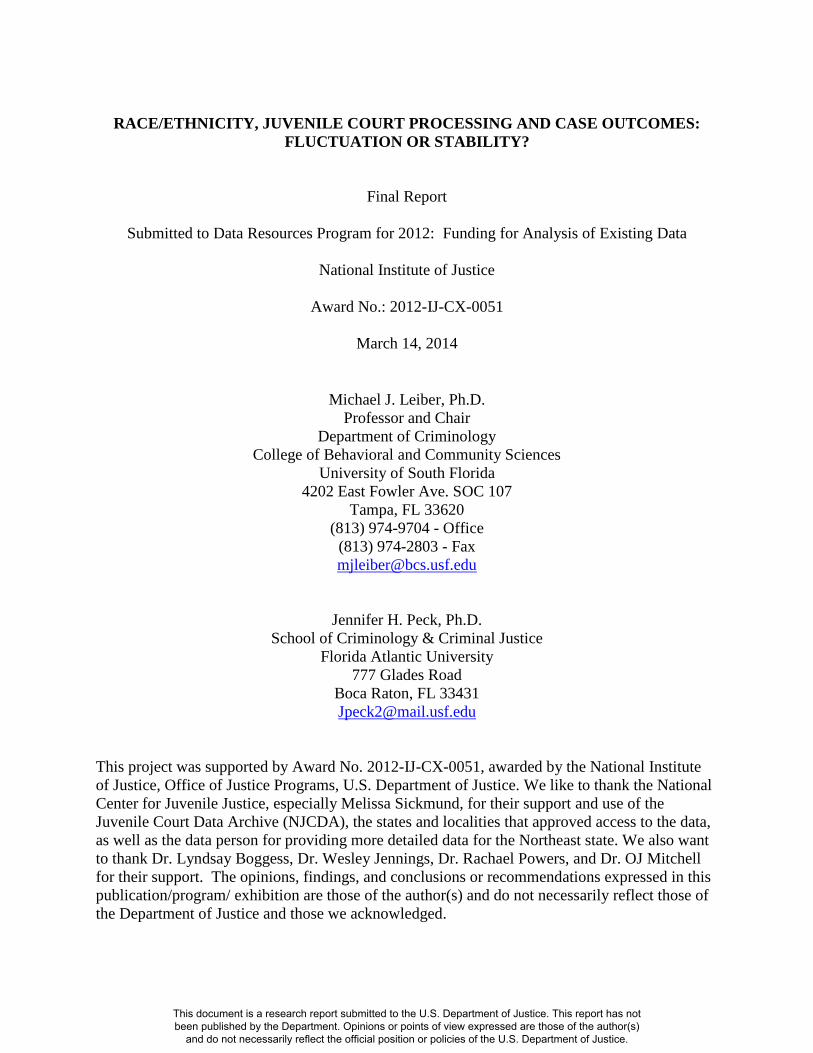
RACE/ETHNICITY, JUVENILE COURT PROCESSING AND CASE OUTCOMES:
FLUCTUATION OR STABILITY?
ABSTRACT
Sampson and Laub’s (1993) perspective contends that community characteristics, especially
underclass poverty and racial inequality, influence the social control of youth in juvenile justice
proceedings. Structural factors are believed to enhance class and race stereotypes of the poor and
Blacks as either criminals or drug offenders, but can also be characterized as sexual, aggressive,
etc. In turn, these actual and/or perceived threats to middle class values result in the poor and
Blacks being subjected to greater social control in communities evidencing impoverishment and
racial inequality. An interpretation of the perspective is that the social control of youth, and
especially minority youth, will fluctuate over time due to associations with and changes in the
economic and racial/ethnic inequality of communities. The main objective of the present study
was to use Sampson and Laub’s structural theory of inequality to examine whether
characteristics of communities explain the social control of youth in general but also focuses on
potential racial/ethnic and drug offending disparities across White, Black, and Hispanic youth
within juvenile justice proceedings. In anticipation of these possible relationships, an assessment
was done to see to what extent these relationships vary or remain relatively stable over time, and
if they are race and/or ethnic specific with drug offending.
Data was provided by the National Juvenile Court Archive (NJCA) and represented county-level
aggregated information for sixteen states involving 172 counties for over thirty years (1985,
1995, 2005, and 2009). Ordinary Least Squares (OLS) regression was used to predict the
proportion of referrals petitioned, detained, received out-of-home placement, and change models
to understand how changes in the independent variables over time influenced changes in the
dependent variables over time. A second data set, also provided by NJCA, was used that
represented individual-level data of all delinquent referrals in 67 counties in a Northeast state
from January 2000 through December 2010. Legal variables (e.g. crime severity, prior record),
extralegal considerations (e.g. gender, age), and decision-making at intake, adjudication, and
judicial disposition were captured. Hierarchical generalized linear modeling (HGLM) was used
to analyze the data for the purpose of simultaneously estimating the amount of variation of both
the individual (level-1) and county (level-2) measures at three processing junctures. In addition
to the estimation of main and interaction effects, cross-level interactions were also estimated to
examine how youth from different racial/ethnic backgrounds are treated in the juvenile court
depending on county of residence.
In short, minimal to modest support was found for Sampson and Laub’s (1993) perspective.
Macro-level variables were at times found to be determinants of social control at each of the four
time frames and to a somewhat greater extent in explaining case outcomes in the 67counties in a
Northeast state. However, the effects were sporadic and not always in the predicted direction. In
fact, underclass poverty and racial/ethnic inequality most often were not statistically significant
determinants of social control. Limited evidence was also found for anticipated relationships
between community characteristics and disadvantaged treatment of minorities and drug
offenders. When community characteristics significantly impacted the treatment of Blacks,
Hispanics, and/or drug offenders and decision-making, the effects at times resulted in leniency
This document is a research report submitted to the U.S. Department of Justice. This report has not been published by the Department. Opinions or points of view expressed are those of the author(s)
and do not necessarily reflect the official position or policies of the U.S. Department of Justice.

ii
rather than greater social control. An examination of the results across thirty years showed, with
a few exceptions, stability in the relationships rather than fluctuation or change.
At the individual-level, Black drug offenders were subjected to greater social control at intake
than other offenders. Hispanics and Hispanic drug offenders were also found to have a greater
odds of being adjudicated compared to similarly situated Whites. At judicial disposition, Blacks
and Hispanics had a greater likelihood of receiving the more severe outcome of out-home-
placement compared to Whites. These effects were enhanced if a minority youth was charged
with a drug offense. In addition, drug offenders and in particular, Black drug offenders and
Hispanic drug offenders, were responded to differently throughout court proceedings than other
types of offenders. The findings reported here indicate that underclass poverty and racial/ethnic
inequality alone (or if at all) do not seem to account for these occurrences.
This document is a research report submitted to the U.S. Department of Justice. This report has not been published by the Department. Opinions or points of view expressed are those of the author(s)
and do not necessarily reflect the official position or policies of the U.S. Department of Justice.
iii
TABLE OF CONTENTS
EXECUTIVE SUMMARY ...........................................................................................................1
INTRODUCTION ....................................................................................................................................... 1
Sampson and Laub’s (1993) Macro-Level Theory of Inequality and Social
Control ................................................................................................................................3
JUSTIFICATION AND IMPLICATIONS FOR PRESENT RESEARCH .............................4
METHODS .....................................................................................................................................6
Data .....................................................................................................................................6
Analyses ..............................................................................................................................7
Limitations ..........................................................................................................................9
RESULTS .....................................................................................................................................10
Aggregated Counts of Delinquent Referrals over 30-Years ........................................10
County-Level Data and Individual-Level Data .............................................................10
DISCUSSION AND POLICY IMPLICATIONS ......................................................................11
FULL REPORT ...........................................................................................................................16
I. INTRODUCTION............................................................................................................16
1.1 Sampson and Laub’s Macro-Level Theory of Inequality and Social Control .....18
II. REVIEW OF LITERATURE .........................................................................................20
2.1 Tests of Sampson and Laub’s Inequality Perspective ............................................20
2.2 Macro-Level Research on Juvenile Court Outcomes .............................................25
2.3 Summary .....................................................................................................................31
III. IMPLICATIONS FOR THE PRESENT STUDY ........................................................32
3.1 Research Questions and Hypotheses ........................................................................33
IV. METHODOLOGY ..........................................................................................................35
V. AGGREGATED COUNTS OF DELINEQUENT REFERRALS ...............................36
5.1 Data and Sample ........................................................................................................36
5.2 Case Variables ............................................................................................................38
5.3 Contextual Variables .................................................................................................41
5.4 County-Level Control Variables ..............................................................................43
5.5 Dependent Variables ..................................................................................................44
5.6 Missing Data ...............................................................................................................45
5.7 Analytic Procedure ....................................................................................................47
5.8 Results .........................................................................................................................48
5.9 Distributions of Variables of Interest by Time........................................................48
5.10 OLS Regression Results Differentiated by Time ..................................................50
5.11 Summary ...................................................................................................................62
5.12 Changes in Effects Over Time ................................................................................63
This document is a research report submitted to the U.S. Department of Justice. This report has not been published by the Department. Opinions or points of view expressed are those of the author(s)
and do not necessarily reflect the official position or policies of the U.S. Department of Justice.
iv
VI. COUNTY-LEVEL DATA AND INDIVIDUAL-LEVEL DATA ................................66
6.1 Data and Sample ........................................................................................................66
6.2 Case Variables ............................................................................................................66
6.3 Contextual Variables .................................................................................................69
6.4 Dependent Variables ..................................................................................................70
6.5 Analytic Procedure ....................................................................................................71
6.6 Results .........................................................................................................................73
6.7 Results Involving Cross-Level Interactions .............................................................79
6.8 Summary .....................................................................................................................81
VII. DISCUSSION ...................................................................................................................82
7.1 Implications for Policy ...............................................................................................87
7.2 Directions for Future Research ................................................................................89
7.3 Dissemination of Research ........................................................................................96
TABLES
Table 1 ....................................................................................................................... 39-40
Table 2 .............................................................................................................................49
Table 3 .............................................................................................................................52
Table 3a ...........................................................................................................................53
Table 4 .............................................................................................................................55
Table 4a ...........................................................................................................................56
Table 5 .............................................................................................................................59
Table 5a ...........................................................................................................................60
Table 6 .............................................................................................................................61
Table 7 .............................................................................................................................65
Table 8 ....................................................................................................................... 67-68
Table 9 .............................................................................................................................74
Table 10 ...........................................................................................................................77
Table 11 ...........................................................................................................................78
Table 12 ...........................................................................................................................80
APPENDIX 1. ...............................................................................................................................97
REFERENCES .............................................................................................................................98
This document is a research report submitted to the U.S. Department of Justice. This report has not been published by the Department. Opinions or points of view expressed are those of the author(s)
and do not necessarily reflect the official position or policies of the U.S. Department of Justice.
1
EXECUTIVE SUMMARY
INTRODUCTION
One of the most well documented and controversial features of the juvenile justice
system and the criminal justice system is the disproportionate representation of African
Americans and to a lesser extent, Latinos, Native Americans and other minority youth among
those subjected to social control (Bishop, Leiber, & Johnson, 2010; Bridges & Steen, 1998;
Hartley, Maddan, & Spohn, 2007; Huizinga et al., 2007; Kempf-Leonard, 2007; Mauer & King,
2007; Pope & Feyerherm, 1993; Steffensmeier, Ulmer, & Kramer, 1998). Many studies have
discovered that legal criteria (i.e. crime severity), and to some degree extralegal factors (i.e.
assessments about the family, school status); explain some of the overrepresentation in the
juvenile justice system (Pope, Lovell, Stojkovic, & Rose, 1996; Pope & Snyder, 2003; Tracy,
2005; Cohen & Kluegel, 1979; Rodriguez, Smith, & Zatz, 2009). A number of comprehensive
reviews of this literature, however, report that legal and extralegal factors alone are unable to
account for race differentials in involvement in juvenile court proceedings (Bishop & Leiber,
2012; Bishop, 2005; Engen, Steen, & Bridges, 2002; Leiber, 2002; Pope & Feyerherm, 1993;
Pope, Lovell, & Hsia, 2002; Pope & Leiber, 2005).
These overall findings indicate that both delinquency and the administration of social
control of youth need to be placed within historical, structural, political, and organizational
contexts. Furthermore, race stereotyping is often fostered by these same contexts and are
important in understanding the relationship between when race and ethnicity matter and
increased social control (e.g., Bridges & Steen, 1998; Fagan, 2010; Feld, 1999; Graham &
Lowery, 2004; Leiber, 2003; Rodriguez, 2010; Sampson & Laub, 1993).
This document is a research report submitted to the U.S. Department of Justice. This report has not been published by the Department. Opinions or points of view expressed are those of the author(s)
and do not necessarily reflect the official position or policies of the U.S. Department of Justice.
2
Most of the research conducted has overwhelmingly focused on the influence of macro-
level factors on criminal justice sentencing. The relative neglect of the effects of the social
contexts on juvenile justice decision-making is surprising, given the “loosely coupled” structure
of the juvenile court. In particular, the parens patriae foundation of the juvenile court and
reliance on a host of legal and extralegal considerations by decision-makers allows for wide-
spread discretion and possible race and/or ethnic differences in case outcomes (e.g., Bishop et
al., 2010; Feld, 1999; Harris, 2007). The economic conditions of a jurisdiction would seem and
have been found to be viable explanatory factors in the increased social control of youth and in
particular, minorities, in the juvenile justice system (Rodriguez, 2013; Sampson & Laub, 1993).
Yet, little is known concerning the extent that economic macro-level considerations as a
contextual framework hold influence over juvenile court decision-making.
An exception is the work by Sampson and Laub (1993), who provide a modified conflict
theory that emphasized the interplay between the war on drugs, the macro-structural
characteristics of communities, and racial stereotyping, to explain the increased social control of
youth and in particular, minority youth who are involved in drug offending. Little research has
been conducted that tests Sampson and Laub’s (1993) structural inequality perspective.
Furthermore, inherent within their perspective is the assumption that the social control of youth
should fluctuate over time. That is, changes in social control are thought to be in response to, or
at least associated with, changes in the macro-level structural characteristics of a community
(e.g., inequality, racial/ethnic inequality). To date, research has not been conducted to assess the
validity of this assumption. In the present study, these voids in the literature are addressed.
More specific, the main purpose of the present study is to use Sampson and Laub’s
structural theory of inequality to examine whether characteristics of communities explain the
This document is a research report submitted to the U.S. Department of Justice. This report has not been published by the Department. Opinions or points of view expressed are those of the author(s)
and do not necessarily reflect the official position or policies of the U.S. Department of Justice.
3
social control of youth, especially minority youth, in juvenile justice proceedings. In anticipation
of these possible relationships, an assessment is done to see to what extent these relationships are
race and/or ethnic specific and whether the effects vary or remain relatively stable over time.
Data from the National Juvenile Court Data Archive (NJCDA) is used for the study. The time-
frames examined are 1985, 1995, 2005 and 2009.
Sampson & Laub’s (1993) Macrolevel Theory of Inequality and Social Control
Sampson and Laub (1993) put forth a perspective that contends that community
characteristics, such as poverty and inequality, will influence social control in the form of
juvenile justice proceedings. Structural factors will also fuel or augment class and race
stereotypes of the poor and Blacks as either criminals, drug offenders, and/or as sexual,
aggressive, etc. These actual and perceived threats to middle-class values in turn result in the
poor and Blacks being subjected to greater social control in counties evidencing impoverishment
and racial inequality. Inherently, the social control of youth and especially minority youth should
fluctuate over time due to associations with and changes in the economic and racial/ethnic
inequality of communities. The overall goal of the present study is to examine if this premise is
true.
Furthermore, although macro-level contextual approaches have been used to study race
and social control in the criminal justice system, very few studies have been conducted to assess
the relationships between community characteristics, race, ethnicity, and juvenile court
outcomes. Moreover, only a few studies exist that have specifically applied Sampson and Laub’s
(1993) theoretical perspective to understand juvenile justice outcomes. Last and more
importantly, no study has assessed the fluctuation or the stability of race or ethnic effects on the
This document is a research report submitted to the U.S. Department of Justice. This report has not been published by the Department. Opinions or points of view expressed are those of the author(s)
and do not necessarily reflect the official position or policies of the U.S. Department of Justice.
4
social control of youth in the juvenile justice system within the context of structural community
characteristics over time.
Of the few studies conducted to date, mixed results have been produced that
characteristics of communities in the form of concentrated disadvantage and racial inequality
hold relevance over juvenile court outcomes. For example, Sampson and Laub’s (1993) initial
test of the theory discovered that youth, especially Black drug offenders, were subjected to
increased social control at the stages of detention and judicial disposition. Additional research
has shown some evidence that youth processed in courts located in communities characterized by
underclass poverty and racial inequality results in the increased social control of minority youth.
However, other studies have indicated that relationships may be conditioned by the amount of
variation in the structural characteristics across jurisdictions and the stage examined.
Other studies that have used macro-level indicators based somewhat on measures tapping
into concentrated poverty and inequality have also yielded inconsistent results. Some studies find
support, while others find little to no support. Also, some studies have reported that the control
of minority youth at the individual level occurs regardless of structural characteristics and often
involves both more severe and lenient treatment.
JUSTIFICATION AND IMPLICATIONS FOR PRESENT RESEARCH
The need for the present research rests on several factors. First, only a few tests of
Sampson and Laub’s macro-inequality and social control perspective have been conducted. Of
those studies, support for the perspective has been mixed (Sampson & Laub, 1993; Leiber &
Jamieson, 1995; Leiber & Stairs, 1999; Leiber, 2003; Sutton, 2013) but this body of research has
limitations. For example, Sutton (2013) used the perspective as a framework to study criminal
justice proceedings, and despite non-findings, concluded that Sampson and Laub’s (1993)
This document is a research report submitted to the U.S. Department of Justice. This report has not been published by the Department. Opinions or points of view expressed are those of the author(s)
and do not necessarily reflect the official position or policies of the U.S. Department of Justice.
5
perspective and structural contexts in general should be subjected to further inquiry. This is
especially true concerning juvenile justice proceedings where greater discretion and informality
exists compared to the criminal courts. The research by Leiber (2003), Leiber and Jamieson
(1995), and Leiber and Stairs (1999) examined counties in one state that were more
homogeneous in composition than different. This limitation could account for the limited support
for Sampson and Laub’s (1993) perspective. Recall that Sampson and Laub (1993) examined
data from 1985 consisting of aggregated individual-level juvenile court records involving over
200 counties across the United States and found support for their perspective. Last and more
importantly, no study has assessed the fluctuation or the stability of the social control of youth,
especially minority youth, in the juvenile justice system within the context of structural
community characteristics over time. These limitations served as the impetus for the present
research.
The main purpose of the present study is to use Sampson and Laub’s structural theory of
inequality to examine whether characteristics of communities explain the social control of youth,
especially minority youth, in juvenile justice proceedings. In anticipation of these possible
relationships, an assessment is done to see to what extent these relationships are race and/or
ethnic specific and whether the effects vary or remain relatively stable over time. The objectives
of the research are: (1) to examine whether macro-level factors in the form of structural
characteristics of communities explain the social control of youth in juvenile justice proceedings;
(2) to investigate the extent to which these relationships are similar or different for various
racial/ethnic groups, and (3) to assess if these effects predict decision-making over time.
In particular, the current study examines three broad research questions. First, do
disadvantaged structural characteristics of communities explain the social control of youth
This document is a research report submitted to the U.S. Department of Justice. This report has not been published by the Department. Opinions or points of view expressed are those of the author(s)
and do not necessarily reflect the official position or policies of the U.S. Department of Justice.
6
throughout juvenile justice proceedings? Second, does greater social control result in counties
with larger proportions of Black, Hispanic, and drug referrals within communities characterized
by underclass poverty and racial/ethnic inequality? Third, to what extent do the reported
relationships predict social control over time? That is, do the effects vary or remain relatively
stable over a 30-year time period? Based on the research questions, it is hypothesized that
counties characterized by underclass poverty and racial/ethnic inequality will have higher rates
of social control compared to counties evidencing less underclass poverty and racial/ethnic
inequality. We also predict that counties characterized by larger proportions of Black, Hispanic,
and drug referrals to the juvenile court, as well as underclass poverty, and racial/ethnic inequality
will correspond to greater social control, and when applicable, more severe juvenile court
outcomes. Last, it is hypothesized that changes in the level of social control within communities
will be dependent upon changes in communities’ levels of underclass poverty and racial/ethnic
inequality.
METHODS
Data
Data for the current study was provided by the National Juvenile Court Archive
(NJCDA) located at the National Center for Juvenile Justice (NCJJ) and information from the
1980, 1990, and 2000 U.S. Census. Note that at the writing of this report, data needed for more
specific racial and ethnic measures from the 2010 U.S Census has not yet been released. Two
separate types of data were provided from the NCJDA. The first data set was created by NJCDA
who aggregated all individual-level case records in 1985, 1995, 2005, and 2009 to the county-
level in sixteen states throughout the U.S. for a total of 172 counties. The second data set
This document is a research report submitted to the U.S. Department of Justice. This report has not been published by the Department. Opinions or points of view expressed are those of the author(s)
and do not necessarily reflect the official position or policies of the U.S. Department of Justice.
7
included all delinquent referrals in a Northeast state from January 2000 through December 2010
(n = 302, 531) for a final sample size of 302,531.
Analyses
The analysis plan consisted of three steps. First, Ordinary least squares (OLS) regression
models were examined to predict the relationship between the independent and control variables
at the individual-level and community-level on the proportion of youth within each county that
were petitioned, detained, and sentenced to placement. This first step was replicated for the
referral data from 1985, 1995, 2005, and 2009. Second, a reduced model was predicted across all
three court outcomes and all four-time frames. The reduced models included the proportion of
Black referrals, proportion of drug referrals, underclass poverty, racial inequality, and percent
Black residents within the 1985 and 1995 referral data. The reduced models within the 2005 and
2009 referral data included the proportion of Black referrals, proportion of Hispanic referrals,
proportion of drug referrals, underclass poverty, racial inequality, ethnic inequality, and percent
Black residents. The third step in the analyses procedure was to estimate OLS change models to
understand how changes in the independent variables over time may influence changes in the
dependent variables over time (1980/1985-1990/1995; 1980/1985-2000/2005; 1980/1985-
2000/2009). Four variables of interest were included in each change model depending on the
years examined: changes in the proportion of Black referrals, changes in the proportion of drug
referrals, changes in underclass poverty, and changes in racial inequality.
Since the data provided from the Northeast state comprises individual referrals compared
to the other data that is aggregated counts of individual referrals in 172 counties, a different
analytic procedure is needed to analyze over 300,000 referrals within 67 counties. Due to the
nested nature of the data that includes juveniles residing within counties, a 2-level hierarchical
This document is a research report submitted to the U.S. Department of Justice. This report has not been published by the Department. Opinions or points of view expressed are those of the author(s)
and do not necessarily reflect the official position or policies of the U.S. Department of Justice.
8
linear structure and hierarchical linear modeling (HLM) was used to analyze the data. Since each
of the dependent variables have binary outcomes, hierarchical generalized linear modeling
(HGLM) were used to assess the effect of individual (Level-1) and community level (Level-2)
data on each court outcome.
The HGLM analysis plan also consisted of several steps. Each of these steps was
conducted for each of the dependent variables (intake, adjudication, and judicial disposition).
First, an intercept-only, unconditional model was estimated to determine if the mean rate of each
dependent variable varied across counties. The results of each model were significant and
confirmed the use of multi-level models. Second, the community-level variables (Level-2) were
included in the model to estimate the effect of county-level measures on each dependent
variable.
Third, all individual-level measures (Level-1) were included in the model to assess the
effect of offender and offense characteristics on the court outcome while controlling for
community-level characteristics. Fourth, an interaction term between the race/ethnicity of the
offender and drug crimes were predicted to see if being a Black or Hispanic drug offender
received disadvantaged court outcomes compared to other types of offenders. Fifth, cross-level
interactions between a youth’s race/ethnicity, drug offenses, and community-level variables of
interest were estimated to understand how youth of specifically racial and ethnic backgrounds
(with and without drug offenses) are treated within counties characterized by underclass poverty,
racial inequality, ethnic inequality, and the percent of Black and Hispanic residents within
counties.
This document is a research report submitted to the U.S. Department of Justice. This report has not been published by the Department. Opinions or points of view expressed are those of the author(s)
and do not necessarily reflect the official position or policies of the U.S. Department of Justice.
9
Limitations
It is important to note that there were limitations concerning the aggregated data over the
30-year time frame. Due to issues with missing data, not all counties were able to be included
within each statistical model. Furthermore, numerous counties did not collect information about
certain variables included in the present study, and were removed from the analyses for different
time frames. In other situations, depending on the nature of the variable, missing data was
imputed with the mean or the mode. Since the data provided are counts of referrals within each
county instead of individual case records, traditional imputation methods for missing data that
have been used previously by OJJDP (i.e. record and format-level imputation) and prior
criminological research were unable to be performed.
There were also limitations of the county-level data that pertained specifically to
Hispanics in the 1980 and 1990 U.S. Census because numerous counties did not collect
Hispanic-specific information until the 2000 U.S. Census. In addition, the aggregated referral
data from 1985 and 1995 was also problematic concerning the Hispanic measure. This limitation
prevented the inclusion of the proportion of Hispanic youth as a measure when predicting
juvenile court outcomes in 1985 and 1995. Data pertaining to the detention stage was also
problematic in a number of counties. For each of the four time frames, different counties were
included to predict detention compared to the other outcome stages. The counties with missing
detention data were dropped from the analysis when predicting the likelihood of detention. A
more detailed description about missing data issues can be found in the final technical report.
This document is a research report submitted to the U.S. Department of Justice. This report has not been published by the Department. Opinions or points of view expressed are those of the author(s)
and do not necessarily reflect the official position or policies of the U.S. Department of Justice.
10
RESULTS
Aggregated Counts of Delinquent Referrals over 30-Years
In regards to the results using aggregated counts of referrals over a 30-year time frame,
modest to minimal support was found for the hypotheses. Although macro-level variables were
at times found to be determinants of social control at each of the four time frames, the effects
were sporadic (H1). In terms of whether social control increased in counties with larger Black,
Hispanic, and drug referrals, as well underclass poverty and racial/ethnic inequality, the answer,
for the most part, is no (H2). There are four exceptions to this conclusion. A significant
interaction was discovered involving the percent of Black referrals and racial inequality with an
increased level of detention in 1985. In addition, for the same time frame, the percent of Black
referrals interacted with detention to decrease the proportion referrals receiving out-of-home
placement. In 1995, the percent of Black referrals jointly with the percent of drug referrals
corresponded to an increase in petitions. The fourth interaction effect involved the percent of
Hispanic referrals and the percent of drug referrals with a decrease in the percent of petitions.
Due to very few statistically significant effects involving underclass poverty and racial/ethnic
inequality with the dependent variables (n=5) within each time frame, not much can be said
concerning the stability and/or fluctuation in social control (H3). The third hypothesis was
specifically explored in the change models. With a few exceptions, stability in the effects rather
than fluctuation or change occurred over time from 1985-2009.
County-Level Data and Individual-Level Data
In regards to the results of the multi-level examination of Sampson and Laub’s (1993)
perspective with both individual and county-level data, underclass poverty and racial/ethnic
inequality were most often not statistically significant determinants of social control. Estimations
This document is a research report submitted to the U.S. Department of Justice. This report has not been published by the Department. Opinions or points of view expressed are those of the author(s)
and do not necessarily reflect the official position or policies of the U.S. Department of Justice.
11
of cross-level interactions between the community-level variables (underclass poverty,
racial/ethnic inequality, percent Black/Hispanic), and the individual-level variables (Black,
Hispanic, drug offenses) yielded eight significant relationships with social control. These joint
relationships, however, sometimes involved less social control rather than increased social
control.
Although modest, some support is offered for the expectation that macro-level county
characteristics predict juvenile court outcomes (H1). Furthermore, these effects temper the
treatment of drug offenders and to a much lesser degree, Blacks, Hispanics, and Black/Hispanic
drug offenders. Similar to the results from using the aggregate count data, the percent
racial/ethnic makeup of a community was at times predictive of social control. In addition,
race/ethnicity alone and combination with drug offending influenced case outcomes depending
on the stage examined. Last, the overall effects sometimes involved increased and decreased
social control and the relationships vary by the stage in the proceedings. Thus, consideration of
these findings leads to a conclusion of mixed support for the expectation that community
characteristics condition the treatment of Blacks and Hispanics and in particular if these
race/ethnic groups are involved in drug offending (H2). Once again, it is important to note until
data for the 2010 U.S. Census is released, this section of the analyses is unable to test the third
hypothesis concerning the extent these relationships predict social control over time.
DISCUSSION AND POLICY IMPLICATIONS
Overall, minimal to modest support was found for Sampson and Laub’s (1993)
perspective and the hypotheses framing the research. Macro-level variables were at times found
to be determinants of social control at each of the four time frames and to a somewhat greater
extent in explaining case outcomes in the 67counties in a Northeast state. But, the effects were
This document is a research report submitted to the U.S. Department of Justice. This report has not been published by the Department. Opinions or points of view expressed are those of the author(s)
and do not necessarily reflect the official position or policies of the U.S. Department of Justice.
12
sporadic and not always in the predicted direction. In fact, the macro-level variables of interest
and in particular, underclass poverty and racial/ethnic inequality, most often were not statistically
significant determinants of social control. While contrary to the results reported by Sampson and
Laub (1993) and some other research, the failure to find community characteristics to be
predictive of social control is consistent with those reported elsewhere.
Limited evidence was also found for anticipated relationships between community
characteristics and disadvantaged treatment of minorities and drug offenders. When community
characteristics significantly impacted the treatment of Blacks, Hispanics, and/or drug offenders
and decision-making, the effects at times resulted in less rather than more social control.
Findings indicating leniency instead of harsh outcomes was also present involving direct or main
effects of community characteristics with the treatment of youth. This inconsistency in the
direction of the relationships involving minorities and case outcomes has been frequently
discovered by prior research in the juvenile justice system. That is, minorities are disadvantaged
at some stages in processing but not others or, depending on which stages are examined;
minorities receive both more severe and more lenient outcomes. The interpretations offered in
those studies suggested that decision-makers may compensate or correct racial inequities that
they are aware were introduced at earlier stages.
In addition, Black drug offenders received more social control at intake than other
offenders. Hispanics and Hispanic drug offenders were also found to be more likely to be
adjudicated once all relevant controls were considered. At judicial disposition, Blacks and
Hispanics had a greater likelihood of receiving the more severe outcome of out-home-placement.
These effects were enhanced if a minority youth was charged with a drug offense. These findings
highlight that race/ethnicity still matters in juvenile justice proceedings and is also consistent
This document is a research report submitted to the U.S. Department of Justice. This report has not been published by the Department. Opinions or points of view expressed are those of the author(s)
and do not necessarily reflect the official position or policies of the U.S. Department of Justice.
13
with prior research. Drug offenders and in particular, Black drug offenders and Hispanic drug
offenders, were also responded to differently than other types of offenders. The findings reported
here indicate that underclass poverty and racial/ethnic inequality alone (or if at all) do not seem
to account for these occurrences.
Although little support was provided for Sampson and Laub’s (1993) perspective,
race/ethnicity individually and at times, in combination with drug offending, were found to
explain the treatment of youth even after taking into account important legal and extralegal
factors. In short, both legal considerations and race/ethnicity were determinants of case
proceedings. Therefore, policy should be developed that is multi-prong in that efforts should
continue to be made that address both the prevention of delinquent behavior and inequities in the
handling of minority youth.
Therefore, to reduce the number of minority youth coming into contact with the system,
community-based resources and programs need to be established and/or continued to be funded
that focus on delinquency prevention and recidivism. It is important to establish outreach efforts
to both parents and youth to connect them with activities that already exist. Most important is
that minority youth have access to and the opportunity to participate in these programs. For
example, services should continue to be funded and implemented that attempt to improve the life
chances of youth such as skill development, educational attainment, and positive relationships
with family and peers and those that address poverty and the social institutions within
impoverished neighborhoods that are conducive for delinquent behavior (Bishop & Leiber, 2012;
Welsh & Farrington, 2012).
The Disproportionate Minority Contact Mandate (DMC) is one policy implication that
investigates the overrepresentation of minorities throughout the juvenile justice system, with an
This document is a research report submitted to the U.S. Department of Justice. This report has not been published by the Department. Opinions or points of view expressed are those of the author(s)
and do not necessarily reflect the official position or policies of the U.S. Department of Justice.
14
underlying goal for the equitable treatment of all youth. On the basis of the results from the
present study, interventions could involve cultural sensitivity training of key personnel within the
juvenile justice system and change in the system itself. Changes that have been implemented
elsewhere include legislative reform, administrative changes, and structural and procedural
changes that impact decision-making. Efforts such as these should continue to be implemented as
methods to address and possible reduce inequities in the treatment of minority youth.
The current research also has implications for future research. Some of the statistical
models were based on a relatively small sample of counties. Furthermore, the counties used in
the present research may lack variability in terms of the indicators of underclass poverty and
racial/ethnic inequality. That is, the counties were more similar in terms of community
characteristics than different. Therefore, future research is needed that incorporates a larger
number of counties that also show sufficient variability in the Census measures. Future research
should attempt to conduct additional analyses using 2010 Census information. Research may
also want to consider the use of zip-codes, census tracts, segregation measures (i.e. a segregation
index), and other information that can be obtained from units of analysis smaller than counties
better identify possible pockets of disadvantage. Smaller units of analysis have the potential to
unmask community and/or race/ethnic effects that were not found in the present study of
counties.
Lastly, it is also possible that Sampson and Laub’s (1993) inequality perspective needs
theoretical refinement. For example, one avenue for theory development and future research may
be to expand the notion of “threat” beyond the symbolic aspect to include multiple perceived
threats, (e.g., political, cultural) that may be intertwined and possibly racialized. The
consideration of multiple types of threats may place the perspective in a better position to
This document is a research report submitted to the U.S. Department of Justice. This report has not been published by the Department. Opinions or points of view expressed are those of the author(s)
and do not necessarily reflect the official position or policies of the U.S. Department of Justice.
15
account for why (in addition to Blacks) certain populations are targeted for increased social
control. Hispanics and the poor may be other groups that are perceived as threatening and in
need of social control based on the decisions of court actors. Concomitantly, linkage to mid-level
(e.g., focal concerns perspective) and micro-level (e.g., attribution theory) explanations may
improve our understanding of social control. Support for potential theoretical refinements may
also be found through the use of both quantitative and qualitative analyses. Observational studies
of court decision-making, including police and school referrals, interviews with decision-makers,
and content analyses of case files could provide additional insights into the contexts of when
race/ethnicity influences case outcomes.
This document is a research report submitted to the U.S. Department of Justice. This report has not been published by the Department. Opinions or points of view expressed are those of the author(s)
and do not necessarily reflect the official position or policies of the U.S. Department of Justice.
16
FINAL REPORT
I. INTRODUCTION
One of the most well documented and controversial features of the juvenile justice
system and the criminal justice system is the disproportionate representation of African
Americans and to a lesser extent, Latinos, Native Americans and other minority youth among
those subjected to social control (Bishop, Leiber, & Johnson, 2010; Bridges & Steen, 1998;
Hartley, Maddan, & Spohn, 2007; Huizinga et al., 2007; Kempf-Leonard, 2007; Mauer & King,
2007; Pope & Feyerherm, 1993; Steffensmeier, Ulmer, & Kramer, 1998). Many studies have
discovered that legal criteria (i.e. crime severity), and to some degree extralegal factors (i.e.
assessments about the family, school status), explain some of the overrepresentation in the
juvenile justice system (Pope, Lovell, Stojkovic, & Rose, 1996; Pope & Snyder, 2003; Tracy,
2005; Cohen & Kluegel, 1979; Rodriguez, Smith, & Zatz, 2009). A number of comprehensive
reviews of this literature, however, report that legal and extralegal factors alone are unable to
account for race differentials in involvement in juvenile court proceedings (Bishop & Leiber,
2012; Bishop, 2005; Engen, Steen, & Bridges, 2002; Leiber, 2002; Pope & Feyerherm, 1993;
Pope, Lovell, & Hsia, 2002; Pope & Leiber, 2005).
These overall findings indicate that both delinquency and the administration of social
control of youth need to be placed within historical, structural, political, and organizational
contexts. Furthermore, race stereotyping is often fostered by these same contexts and are
important in understanding the relationship between when race and ethnicity matter and
increased social control (e.g., Bridges & Steen, 1998; Fagan, 2010; Feld, 1999; Graham &
Lowery, 2004; Leiber, 2003; Rodriguez, 2010; Sampson & Laub, 1993). In addition, legal
criteria, extralegal factors, and process variables (i.e., detention) may be racially tainted to the
disadvantage of minorities (e.g., Armstrong & Rodriguez, 2005; Frazier & Bishop, 1995; Leiber
This document is a research report submitted to the U.S. Department of Justice. This report has not been published by the Department. Opinions or points of view expressed are those of the author(s)
and do not necessarily reflect the official position or policies of the U.S. Department of Justice.
17
& Fox, 2005; Leiber & Johnson, 2008). In conjunction with the pervasiveness of these results,
Bishop’s (2005) review of over 150 studies of literature on race and juvenile justice decision-
making led to the conclusion: “The issue is no longer simply whether White and youths of color
are treated differently. Instead, the preeminent challenge for scholars is to explain how these
differences come about” (2005, p. 24). The objective of the present research is to do this by
assessing the extent to which structural characteristics of communities impact juvenile justice
decision-making and in particular, the treatment of youth and especially minority youth.
Most of the research conducted has overwhelmingly focused on the influence of macro-
level factors on criminal justice sentencing. The relative neglect of the effects of the social
contexts on juvenile justice decision-making is surprising, given the “loosely coupled” structure
of the juvenile court. In particular, the parens patriae foundation of the juvenile court and
reliance on a host of legal and extralegal considerations by decision-makers allows for wide-
spread discretion and possible race and/or ethnic differences in case outcomes (e.g., Bishop et
al., 2010; Feld, 1999; Harris, 2007). The economic conditions of a jurisdiction would seem and
have been found to be viable explanatory factors in the increased social control of youth and in
particular, minorities, in the juvenile justice system (Rodriguez, 2013; Sampson & Laub, 1993).
Yet, little is known concerning the extent that economic macro-level considerations as a
contextual framework hold influence over juvenile court decision-making.
An exception is the work by Sampson and Laub (1993), who provide a modified conflict
theory that emphasized the interplay between the war on drugs, the macro-structural
characteristics of communities, and racial stereotyping, to explain the increased social control of
youth and in particular, minority youth who are involved in drug offending. Little research has
been conducted that tests Sampson and Laub’s (1993) structural inequality perspective.
This document is a research report submitted to the U.S. Department of Justice. This report has not been published by the Department. Opinions or points of view expressed are those of the author(s)
and do not necessarily reflect the official position or policies of the U.S. Department of Justice.
18
Furthermore, inherent within their perspective is the assumption that the social control of youth
should fluctuate over time. That is, changes in social control are thought to be in response to, or
at least associated with, changes in the macro-level structural characteristics of a community
(e.g., inequality, racial/ethnic inequality). To date, research has not been conducted to assess the
validity of this assumption. In the present study, these voids in the literature are addressed.
More specific, the main purpose of the present study is to use Sampson and Laub’s
structural theory of inequality to examine whether characteristics of communities explain the
social control of youth, especially minority youth, in juvenile justice proceedings. In anticipation
of these possible relationships, an assessment is done to see to what extent these relationships are
race and/or ethnic specific and whether the effects vary or remain relatively stable over time.
Data from the National Juvenile Court Data Archive (NJCDA) is used for the study. The time-
frames examined are 1985, 1995, 2005 and 2009.
1.1 Sampson and Laub’s Macro-Level Theory of Inequality and Social Control
Sampson and Laub (1993) developed a modified integrated conflict perspective
consisting of macro-structural contexts with racial stereotyping based on an interpretation of
Tittle and Curran’s (1988) symbolic threat thesis and effects of the war on drugs on increased
social control. Underlying the relationships between structural conditions with decision-making
is an emphasis on class and race stereotyping. Sampson and Laub (1993) suggest that the poor,
underclass, and minorities will be perceived by decision-makers as threatening and in need of
social control in communities ranking high on economic and racial inequality.
Rather than perceiving youth as directly undermining positions of authority (as proposed
by some versions of conflict theory) Sampson and Laub, similar to Tittle and Curran (1988),
emphasize what youth and minorities symbolize to decision-makers: aggressive, sexual, and
This document is a research report submitted to the U.S. Department of Justice. This report has not been published by the Department. Opinions or points of view expressed are those of the author(s)
and do not necessarily reflect the official position or policies of the U.S. Department of Justice.
19
lack discipline. Thus, what is stressed is the interplay between the characteristics of youth,
especially Blacks, and the social psychological emotions of juvenile court officers. These
emotions include fear and jealousy and are thought to manifest in beliefs that youth, the poor,
and in particular minority youth, pose symbolic threats to White middle-class standards and
public safety (Sampson and Laub, 1993, pp. 289–290).
Sampson and Laub (1993) further refine the symbolic threat concept by emphasizing
decision-makers’ use of stereotyping within a larger context symbolized by the “war on drugs”
and the characteristics of the social structure. Sampson and Laub (1993) discuss the evolving
stereotype of the poor black male as a drug user and drug dealer. Race, class, and drugs are seen
as intertwined and difficult to disentangle (Sampson and Laub, 1993, pp. 290). Thus, perceptions
that minorities are disproportionately involved in crime and drugs, and overall are believed to be
linked to an urban underclass consisting of a population largely represented by the poor,
minorities and female-headed African American families with children. The overall effect of this
characterization of the poor and minorities in this manner translates into the greater social control
of these disadvantaged groups. This effect is anticipated to be especially true in counties with
greater underclass poverty and racial inequality (pp. 293).
In summary, Sampson and Laub (1993) put forth a perspective that contends that
community characteristics, such as poverty and inequality, will influence social control in the
form of juvenile justice proceedings. Structural factors will also fuel or augment class and race
stereotypes of the poor and Blacks as either criminals, drug offenders, and/or as sexual,
aggressive, etc. These actual and perceived threats to middle-class values in turn result in the
poor and Blacks being subjected to greater social control in counties evidencing impoverishment
and racial inequality. Inherently, the social control of youth and especially minority youth should
This document is a research report submitted to the U.S. Department of Justice. This report has not been published by the Department. Opinions or points of view expressed are those of the author(s)
and do not necessarily reflect the official position or policies of the U.S. Department of Justice.
20
fluctuate over time due to associations with and changes in the economic and racial/ethnic
inequality of communities. The overall goal of the present study is to examine if this premise is
true. The objectives of the research are: (1) examine whether macro-level factors in the form of
structural characteristics of communities explain the social control of youth in juvenile justice
proceedings; (2) to investigate the extent to which these relationships are similar or different for
various racial/ethnic groups, and (3) to assess if these effects predict decision-making over time.
II. REVIEW OF LITERATURE
Although macro-level contextual approaches have been used to study race and social
control in the criminal justice system, very few studies have been conducted to assess the
relationships between community characteristics, race, ethnicity, and juvenile court outcomes.
Further, only a few studies exist that have specifically applied Sampson and Laub’s (1993)
theoretical perspective to understand juvenile justice outcomes. Last and more importantly, no
study has assessed the fluctuation or the stability of race or ethnic effects on the social control of
youth in the juvenile justice system within the context of structural community characteristics
over time. Next, tests of Sampson and Laub’s (1993) perspective are reviewed, followed by an
assessment of research using macro-level factors in general to understand race, ethnicity, and
social control in juvenile proceedings.
2.1 Tests of Sampson and Laub’s (1993) Inequality Perspective
Sampson and Laub (1993) used data from 1985 consisting of aggregated individual-level
juvenile court records involving over 200 counties across the United States. Drawing upon the
1980 U.S. Census and 1983 County and City Data Book, a measure of underclass poverty was
developed based on the county-level proportions of residents receiving public assistance, Black
residents, female-headed families with children, individuals in poverty, families with less than
This document is a research report submitted to the U.S. Department of Justice. This report has not been published by the Department. Opinions or points of view expressed are those of the author(s)
and do not necessarily reflect the official position or policies of the U.S. Department of Justice.
21
$5,000 income, non-married households, and female-headed families in poverty. A racial
inequality measure was also constructed based on a ratio of Black to White individuals in
poverty and the percent of Black families in poverty.
Other county characteristics were also included, such as wealth (measured by the percent
of families in each county that had more than a $50,000 yearly income and the median per capita
income), residential mobility (an index that included the percentage of residents that moved
within the last five years, the county population change from 1980-1984, and the net county
migration), the degree of urbanism in counties (measured by the percentage of a county that
residents in an urbanized area, the population size, and the population size per square mile), a
measure of youth (the percentage of individual who are between the ages of 15-18 and the ratio
of juveniles to adults in each county), and an indicator of criminal justice resources (per capita
of county revenues, per capita spending on police, and per capital spending on state and local
corrections).
Overall, the regression results showed both underclass poverty and racial inequality, to
varying degrees, were predictive of the treatment of youth and in particular drug offenders at
formal petition, secure detention, and out-of-home placement. When the results were
disaggregated by race, counties characterized by underclass poverty was not found to be
predictive of the detention of White youth, but was a determinant of the decision to detain non-
petitioned Black youth. Counties with high levels of racial inequality were more likely to detain
Black non-petitioned drug and property offenders compared to Whites. At judicial disposition,
underclass poverty was positively related to rates of out-of-home placement for Black personal
and drug offenders, but for White property offenders an inverse effect was reported. The overall
findings lend some support for Sampson and Laub’s (1993) theoretical perspective.
This document is a research report submitted to the U.S. Department of Justice. This report has not been published by the Department. Opinions or points of view expressed are those of the author(s)
and do not necessarily reflect the official position or policies of the U.S. Department of Justice.
22
Three studies conducted by Leiber (2003), Leiber and Jamieson (1995), and Leiber and
Stairs(1999), yielded mixed support for Sampson and Laub’s (1993) structural inequality
perspective. Leiber and Jamieson (1995), for example, used the theory to examine juvenile
justice outcomes in four urban counties with the largest non-White populations in the state of
Iowa. The sample consisted of delinquent referrals from 1980-1991. Various structural indicators
of communities, beliefs of juvenile court decision-makers, and relevant legal and extra-legal
variables were examined to predict case outcomes. Beliefs of juvenile court decision-makers
consisted of attitudes towards the importance of punishing juvenile offenders for their crimes and
attitudes towards racial differences in the behavior and attitudes of juveniles. Underlying the
justification for the research was the inclusion of attitudinal beliefs. Sampson and Laub (1993)
inferred the perceived threat of youth felt by decision-makers by evidence of race effects rather
than directly asking decision-makers themselves about their attitudes toward punishment and
their beliefs and fears concerning minorities and crime.
Race effects between Black youth and White youth were evident across some stages of
justice proceedings. Minorities, however, were not always subjected to increased social control
as predicted by the inequality and social control perspective. In addition, depending on the stage
examined, disadvantaged community measures predicted both harsh and lenient outcomes, and at
times were not significantly predictive of the dependent variable at all. Similar effects were
discovered concerning race and decision-makers attitudes. Despite these findings, Leiber and
Jamieson (1995) provided a direct test of Sampson and Laub’s (1993) perspective and yielded
some support for the contention that structural characteristics of communities involving
underclass populations, inequality, and stereotyping by decision-makers impact the social control
of the poor and minority youth.
This document is a research report submitted to the U.S. Department of Justice. This report has not been published by the Department. Opinions or points of view expressed are those of the author(s)
and do not necessarily reflect the official position or policies of the U.S. Department of Justice.

23
In the second study, Leiber and Stairs (1999) focused on three of the jurisdictions
included in the research by Leiber and Jamieson (1995). This study conducted an in-depth
analysis of the intake stage and the use of diversion. Previous studies often collapse release and
diversion into one category at the stage of intake and then compare to those youth referred for
further court proceedings. Leiber and Stairs (1999) argued that combining both release and
diversion outcomes at intake may mask potential race effects. It was believed that Black youth
would not receive diversion relative to similarly situated Whites, but this traditionally would not
be captured when collapsing release into diversion. Leiber and Stairs (1999) hypothesized that
communities characterized by an underclass population and racial inequality would subject
Black youth to increased social control. Blacks were also anticipated to be less likely to receive
diversion than similar Whites.
Results indicated that consistent with expectations, Black youth were more likely to be
referred on for further court proceedings compared to Whites in the jurisdiction with the greatest
inequality and underclass populations. Contrary to expectations, drug offenders received the
lenient outcome of “no probation” versus “probation” in the community ranked last on the
inequality and underclass measures. Also, race did not impact diversionary outcomes in the most
disadvantaged community. In fact, in one jurisdiction, Blacks were subjected to less social
control compared to Whites across all three potential diversionary outcomes. Similar to Leiber
and Jamieson (1995), Leiber and Stairs (1999) reported partial support for Sampson and Laub’s
(1993) perspective.
In the third study by Leiber (2003), both quantitative and qualitative methods were used
to examine four counties in Iowa with a random sample of White and a disproportionate random
sample of Black court referrals. Sampson and Laub (1993) were able to maximize the amount of
This document is a research report submitted to the U.S. Department of Justice. This report has not been published by the Department. Opinions or points of view expressed are those of the author(s)
and do not necessarily reflect the official position or policies of the U.S. Department of Justice.
24
variation across community characteristics by using a nationally representative sample of U.S.
counties. Leiber (2003) provided a more strict empirical examination of Sampson and Laub’s
(1993) perspective by testing the theory with four jurisdictions that were more homogenous in
regards to racial composition. In addition, qualitative analyses in the form of responses by
decision-makers through interviews and questionnaires were used to provide insights into race
and social control.
Leiber (2003) concluded that Sampson and Laub’s (1993) perspective was unable to
account for race differences across the four counties in Iowa. Community characteristics
predicted the treatment of youth in certain counties in some instances, but the results were not
always in the expected direction. More importantly, race differences were reported in court
outcomes in all four counties, irrespective of the levels of disadvantage within each county.
Leiber (2003) also failed to find a relationship between being a minority youth, drug offending,
and social control. In the four counties, drug offending, for the most part, was either not
predictive of court outcomes or youth referred to the juvenile court for a drug offense received
lenient outcomes compared to other types of offenses.
Results from the qualitative analyses of decision-makers provided further insights into
the reported quantitative findings. The most prominent qualitative finding was that the role of
race in juvenile justice decision-making played out differently in each county. For instance,
depending on the jurisdiction examined, decision-makers perceived that Black referrals
compared to Whites were delinquent, did not abide by middle-class standards, did not respect
authority, and resided in dysfunctional families (Leiber, 2003). Leiber (2003) concluded that the
relationship between race and social control is multifaceted and court outcomes are based on a
mixture of the historical context of race, community influences, organizational characteristics of
This document is a research report submitted to the U.S. Department of Justice. This report has not been published by the Department. Opinions or points of view expressed are those of the author(s)
and do not necessarily reflect the official position or policies of the U.S. Department of Justice.
25
the courts, legal criteria, and extra-legal factors. Each of these aspects may impact the treatment
of youth and in particular, minority youth, in different ways depending on each decision-making
stage.
Sutton (2013), also attempted to test the relevancy of Sampson and Laub’s (1993)
structural inequality perspective to pretrial detention outcomes, guilty pleas, and sentence
severity of adult felony offenders in 40 counties in the year 2000. Racial income inequality and
poverty concentration did not influence the social control of minority defendants across the three
outcome measures. Income inequality in general had some effects with the dependent variables
but the relationships were not always in the anticipated direction. In addition, race and sentence
severity were not conditioned by structural context. In short, community characteristics had at
best modest effects on criminal justice proceedings and the social control of minorities as
measured in his study.
2.2 Macro-Level Research on Juvenile Court Outcomes
Dannefer and Schutt (1982) used Blalock’s power threat thesis in their study of two
counties and three police bureaus from each county in New Jersey. Blalock (1967) argues that
the larger the proportion of the population made up by the minority group, the greater the
competition over resources (i.e., money, property, prestige, voting rights) and the perceived
challenges to the dominant group’s status. The second group-level factor linked to minority
group threat is economic equality. The traditional interpretation of this concept is that increases
in the income and wealth of minorities relative to whites should make the latter group feel more
threatened. Consequently, prejudicial attitudes will develop and discriminatory practices will be
employed by the dominant group to diffuse the minority group threat. The likelihood of the
dominant group perceiving and acting upon a minority group threat is dependent on the existing
This document is a research report submitted to the U.S. Department of Justice. This report has not been published by the Department. Opinions or points of view expressed are those of the author(s)
and do not necessarily reflect the official position or policies of the U.S. Department of Justice.
26
political and economic relations between the groups. Dannefer and Schutt (1982) discovered that
in the community with the higher proportion of minorities, police responded in a biased manner
toward minority youth. Yet, in this same county, the bias was corrected, to some extent, by the
courts.
Frazier and colleagues (1992) examined the case processing of youth in Florida with the
specific objective of testing Hawkins’ (1987) version of the power threat thesis. Hawkins (1987)
called for a revised conflict theory that incorporates the historical contexts of race and
punishment with the concept of Blalock’s (1967) power-threat thesis to account for the
anomalous findings in the criminal justice system. Hawkins’ (1987) argued that as minority
populations gain greater visibility through increased numbers and through gains in social,
economic, and political domains, their threat to the advantage of majority groups becomes more
intense (as does competition for resources). Under these conditions, the criminal justice system
will exert greater social control as a method of diffusing this perceived or actual threat. As a
result, discriminatory treatment will be more evident in settings where minority presence and
economic equality is greater.
Frazier and colleagues (1992) argued that Hawkins’ (1987) thesis actually stands in direct
opposition to several traditional conflict theories, which posit that a lower proportion of
minorities in the population allows this relatively powerless group to be subjected to greater
social control. Hawkins’ (1987) thesis contends that racial differences in social control will be
evident in communities with greater numbers of minorities and racial economic equality. Frazier
et al. (1992) tested this thesis by incorporating case-level variables and a number of social
contextual variables (e.g., racial income inequality, percent white, white/black poverty, index
crime rate, and juvenile arrest rate) to assess the case outcomes of Blacks compared to Whites at
This document is a research report submitted to the U.S. Department of Justice. This report has not been published by the Department. Opinions or points of view expressed are those of the author(s)
and do not necessarily reflect the official position or policies of the U.S. Department of Justice.
27
intake, court referral, and court dispositions. Although not always consistent, the contextual
variables were found to be significant determinants of case outcomes. Racial disparity in each of
the three case outcomes was evident, and to some degree, was conditioned by the percent of
White residents living in a jurisdiction. However, the result was consistent with a traditional
conflict interpretation rather than a power threat thesis. Frazier et al. (1992) argued that as White
majority populations increase in a jurisdiction, so does their ability to exert social control over
minorities (see also Bridges and Crutchfield, 1988). Frazier and colleagues (1992) conclude with
the view that Black powerlessness may be a better explanatory factor of black disadvantage in
juvenile justice proceedings than the notion of power threat.
Bridges and colleagues (1995) also found mixed support for the effects of macro-level
contexts in their examination of the rates of confinement in juvenile correctional facilities for
whites and minorities for all counties in the state of Washington for the years 1990 through 1991.
The racial composition of a community and urban concentration did not have effects on the level
of confinement for minority youth. Both structural factors, however, were discovered to have
inverse statistically significant effects on the rate of confinement for White youth. Bridges and
colleagues (1995) also found that youth in communities that experienced higher levels of violent
crime were more likely to be confined, and the effect was strongest for minorities living in
violent crime communities. This pattern held even after controlling for differences in white and
minority rates of referral to the juvenile court.
Crawford and associates (1998) rely on Blalock’s (1967) concept of minority group threat
and Sampson and Laub’s (1993) emphasis on the perceptions of African Americans as racially
threatening to “mainstream America”, to examine African Americans likelihood of being
classified as habitual offenders, especially for crimes involving drugs and violence. They found
This document is a research report submitted to the U.S. Department of Justice. This report has not been published by the Department. Opinions or points of view expressed are those of the author(s)
and do not necessarily reflect the official position or policies of the U.S. Department of Justice.
28
race effects for drug offenses and property offenses. All significant race effects, however, were
found in communities that were presumed to be low in terms of the racial threat (i.e., low in
terms of percent African American, racial income inequality, drug arrest rates, and violent crime
rates). The racial threat was greatest where the actual threat of crime itself was low.
Tittle and Curran (1988) found some support for the symbolic threat thesis in their
examination of juvenile court dispositions in 31 jurisdictions in Florida. Recall that Tittle and
Curran (1988) focus on the contexts of crime and official perceptions and the conditions under
which the perceived threats result into social control. Tittle and Curran (1988) contend that rather
than perceiving youth as directly undermining their position of dominance and authority because
of power or powerlessness, decision-makers instead feel a psychological discomfort or
uneasiness as a consequence of specific behaviors and characteristics displayed by the youth.
Tittle and Curran (1998) hypothesize that “nonwhites and youth symbolize to white adults
resentment-provoking or fear-provoking qualities like aggressiveness, sexuality, and absence of
personal discipline” (1988: 53).
These stereotypical perceptions of youth are assumed to be "threatening” because justice
officials are unable to identify with Blacks or experience such a lifestyle as adults. Specific
forms of behavior may also make decision-makers fearful of youth especially, minority youth.
The primary emphasis, however, is on the perception and stereotyping of youth and categories of
youth as well as their specific behavior. Overall, the perceived threat is more symbolic than real.
Class and race differentials in sanctioning practices are conditioned by decision-makers’
perceptions of and reactions to stereotypical notions and behaviors concerning the poor and
minority youth. Tittle and Curran (1988) discovered that a selection bias in dispositions was
influenced by the type of crime and two contextual variables: (1) the size of the non-White
This document is a research report submitted to the U.S. Department of Justice. This report has not been published by the Department. Opinions or points of view expressed are those of the author(s)
and do not necessarily reflect the official position or policies of the U.S. Department of Justice.
29
population, and (2) the age of the population. A larger non-White population and a younger
population overall result in different case outcomes of minority youths charged with status
offenses, drug offenses, and sex offenses.
Rodriguez (2010, 2013) conducted two studies to examine the relationships of structural
disadvantage on juvenile court outcomes in Arizona. In one study, Rodriguez (2010) found that
structural disadvantage of youths’ communities (e.g. percent unemployed and percent living in
poverty) predicted decisions at detention. Structural disadvantage was not directly associated
with case outcomes at petition, adjudication, and out-of-home placement at judicial disposition.
However, indirect relationships were discovered involving youth who lived in structurally
disadvantaged areas and were detained at some point of the justice proceedings, were treated
more severely at subsequent stages.
In the second study, Rodriguez (2013) utilized an index of concentrated disadvantage to
examine the applicability of attribution theory, racial effects, and rates of correctional
confinement. It was hypothesized that minority youth who reside in underclass communities
would receive the more disadvantaged outcome (i.e. confined at judicial disposition) than Whites
who reside in similar communities. Similar to Bridges and colleagues (1995), Rodriguez (2013)
argued that decision-makers would perceive youth in these communities as needing more help
and need to be removed from their communities because they are more likely to be exposed to
negative role models and criminal opportunities (2013, pg. 7). Rodriguez (2013) reported that
youth who resided in zip codes characterized by concentrated disadvantage had a higher
probability of receiving a sentence of confinement at judicial disposition, but this effect was not
conditioned by race/ethnicity.
This document is a research report submitted to the U.S. Department of Justice. This report has not been published by the Department. Opinions or points of view expressed are those of the author(s)
and do not necessarily reflect the official position or policies of the U.S. Department of Justice.
30
Freiburger and Jordan (2011) focused on the symbolic threat hypothesis at the macro-
level to study the relationship between race and the decision to petition a youth for further court
proceedings. Misdemeanor and felony cases in 2005 in the state of West Virginia comprised the
sample, and included county-levels of urbanism, the percentage of Black residents, the
percentage of residents living in poverty, and percentage of households with only a single-
mother present. Overall, they found modest support for the effects of macro-level factors with
the decision to file a petition. Race was not a determinant of the dependent variable. While
counties characterized by high levels of poverty and female-headed households significantly
influenced the mean rate of petition, the findings often showed a lenient outcome rather than a
harsh petition outcome. The study, however, did reveal that Black youth who reside in counties
characterized by high levels of poverty were more likely to be petitioned to the juvenile court
than Whites who reside in similarly situated communities. This specific finding is consistent
with Sampson and Laub’s (1993) theory and expectations.
Thomas and colleagues (2013) compare Blalock’s (1967) racial threat thesis and
elements of Sampson and Laub’s (1993) and Tittle and Curran’s (1988) symbolic threat
perspective. The sample consisted of data from 2000 and 2008 within 34 counties in a
Southeastern state. A hierarchical generalized linear model (HGLM) was estimated based on the
impact of individual-level (Level-1) and community-level (Level-2) data on each juvenile court
outcome. Results failed to produce evidence that community characteristics influenced the rate
of detention. However, results from cross-level interactions did yield support for the symbolic
threat hypothesis. Black youth who resided in communities characterized by racial
socioeconomic inequality were more likely to be detained compared to White youth who resided
This document is a research report submitted to the U.S. Department of Justice. This report has not been published by the Department. Opinions or points of view expressed are those of the author(s)
and do not necessarily reflect the official position or policies of the U.S. Department of Justice.
31
in disadvantaged counties. According to Thomas and colleagues (2013), racial inequality fosters
racial stereotypes and in turn leads to increased social control.
Leiber, Peck, and Rodriguez (forthcoming) also found nonsupport for the Blalock’s
(1967) power threat perspective in an examination of counties from a Midwest state, Northeast
state, and Southwest state. Results indicated that increases in Black and Hispanic populations
were not found to be determinants of the social control of youth. Likewise, measures of
economic threat (in the form of White-to-Black and White-to-Hispanic unemployment ratios) did
not predict harsh juvenile court outcomes for minority youth in the expected direction. For
example, at the stage of intake, as the White-to-Black unemployment ratio increased, the
probability that a youth received an intake referral decreased and this relationship was not
tempered by the race/ethnicity of the juvenile offender. Blalock’s (1967) perspective argues that
this relationship should result in severe outcomes rather than lenient outcomes. The results once
again contradicted expectations derived from Blalock (1967) when assessing the White-to-
Hispanic unemployment ratio on intake decisions. Hispanic economic threat resulted in an
increased probability of intake referrals for all youth (instead of more severe outcomes followed
by lenient outcomes).
2.3 Summary
A review of prior research that tests the validity of Sampson and Laub’s (1993) macro-
level inequality perspective to understand the social control of youth and in particular minority
youth have been limited. Of the few studies conducted to date, mixed results have been produced
that characteristics of communities in the form of concentrated disadvantage and racial inequality
hold relevance over juvenile court outcomes. For example, Sampson and Laub’s (1993) initial
test of the theory discovered that youth, especially Black drug offenders, were subjected to
This document is a research report submitted to the U.S. Department of Justice. This report has not been published by the Department. Opinions or points of view expressed are those of the author(s)
and do not necessarily reflect the official position or policies of the U.S. Department of Justice.
32
increased social control at the stages of detention and judicial disposition. Research by Leiber
and Jamieson (1995) and Thomas and colleagues (2013) also showed some evidence that youth
processed in courts located in communities characterized by underclass poverty and racial
inequality results in the increased social control of minority youth. But, research by Leiber
(2003) and Leiber and Stairs (1999) also indicates the relationships may be conditioned by the
amount of variation in the structural characteristics across jurisdictions and the stage examined.
Other studies that have used macro-level indicators based somewhat on measures tapping
into concentrated poverty and inequality have also yielded inconsistent results. Some studies find
support (Armstrong & Rodriguez, 2005; Rodriguez, 2010, 2013) while others find little to no
support (Hayes-Smith & Hayes-Smith, 2013; Leiber et al., forthcoming; Rodriguez, 2007). Also,
some studies have reported that the control of minority youth at the individual level occurs
regardless of structural characteristics and often involves both more severe and lenient treatment
(Leiber, 2003; Rodriguez, 2007).
III. IMPLICATIONS FOR THE PRESENT STUDY
The need for the present research rests on several factors. First, only a few tests of
Sampson and Laub’s macro-inequality and social control perspective have been conducted. Of
those studies, support for the perspective has been mixed (Sampson & Laub, 1993; Leiber &
Jamieson, 1995; Leiber & Stairs, 1999; Leiber, 2003; Sutton, 2013) but this body of research has
limitations. For example, Sutton (2013) used the perspective as a framework to study criminal
justice proceedings, and despite non-findings, concluded that Sampson and Laub’s (1993)
perspective and structural contexts in general should be subjected to further inquiry. This is
especially true concerning juvenile justice proceedings where greater discretion and informality
exists compared to the criminal courts. The research by Leiber (2003), Leiber and Jamieson
This document is a research report submitted to the U.S. Department of Justice. This report has not been published by the Department. Opinions or points of view expressed are those of the author(s)
and do not necessarily reflect the official position or policies of the U.S. Department of Justice.
33
(1995), and Leiber and Stairs (1999) examined counties in one state that were more
homogeneous in composition than different. This limitation could account for the limited support
for Sampson and Laub’s (1993) perspective. Recall that Sampson and Laub (1993) examined
data from 1985 consisting of aggregated individual-level juvenile court records involving over
200 counties across the United States and found support for their perspective. Last and more
importantly, no study has assessed the fluctuation or the stability of the social control of youth,
especially minority youth, in the juvenile justice system within the context of structural
community characteristics over time. These limitations serve as the impetus for the present
research.
3.1 Research Questions and Hypotheses
The primary goal of the proposed research is to examine the ability of Sampson and
Laub’s (1993) macro-structural conflict perspective to better understand the relationships
between community characteristics (i.e., inequality, racial inequality) and race/ethnicity with
social control in the juvenile justice system at four points in time. The proposed study will
attempt to answer three general research questions. First, do disadvantaged structural
characteristics of communities explain the social control of youth throughout juvenile justice
proceedings? To address this question, the first hypothesis is:
H1: Counties characterized by underclass poverty and racial/ethnic inequality will have
higher rates of social control compared to counties evidencing less underclass poverty
and racial/ethnic inequality.
The first hypothesis (H1) rests on the tenets of Sampson and Laub’s (1993) perspective and
findings from their research. Recall that counties characterized by high underclass poverty and
racial inequality were found to be significantly related to increased social control of youth
This document is a research report submitted to the U.S. Department of Justice. This report has not been published by the Department. Opinions or points of view expressed are those of the author(s)
and do not necessarily reflect the official position or policies of the U.S. Department of Justice.
34
referred to the juvenile court. Sampson and Laub (1993) interpreted these findings as evidence
that juvenile court decision-makers perceive youth who reside in communities with these
characteristics (underclass poverty, racial inequality) as threatening, offensive, and in need of
social control.
The second research question is couched within the context of Sampson and Laub’s
primary theoretical position: Does greater social control result in counties with larger proportions
of Black, Hispanic, and drug referrals within communities characterized by underclass poverty
and racial/ethnic inequality? The second hypothesis states:
H2: Counties characterized by larger proportions of Black, Hispanic, and drug referrals
to the juvenile court, as well as underclass poverty, and racial/ethnic inequality will
correspond to greater social control, and when applicable, more severe juvenile court
outcomes.
Recall in the justification for the first hypothesis, Sampson and Laub’s (1993) main theoretical
thesis was that counties high in underclass poverty and racial inequality will subject youth to
greater social control because these counties contain threatening populations. Furthermore, Black
and Hispanic youth who reside in what decision-makers perceive as “threatening communities”
will be discriminated against, seen as more problematic, and receive greater social control
compared to Whites who also reside in disadvantaged communities (see also Bridges et al., 1995;
Freiburger & Jordan, 2011; Leiber & Jamieson, 1995; Tittle & Curran, 1988). In additional and
more detailed analyses, the study will also examine the proposition that Black drug offenders
(and when available, Hispanic drug offenders) who reside in communities characterized by
underclass poverty and racial inequality result in increased social control.
This document is a research report submitted to the U.S. Department of Justice. This report has not been published by the Department. Opinions or points of view expressed are those of the author(s)
and do not necessarily reflect the official position or policies of the U.S. Department of Justice.
35
The third and final research question inquires about the stability or fluctuation of social
control over time. Specifically, to what extent do the reported relationships predict social control
over time? That is, do the effects vary or remain relatively stable over a 30-year time period? The
third hypothesis states:
H3: Changes in the level of social control within communities will be dependent upon
changes in communities’ levels of underclass poverty and racial/ethnic inequality.
An underlying tenet of Sampson and Laub’s (1993) inequality perspective, as well as some other
macro-level perspectives (Blalock, 1967; Tittle & Curran, 1988), is that social control is
contingent, in part, on the extent structural characteristics of communities (captured here by
underclass poverty and racial/ethnic inequality) vary across communities and implicitly within
communities over time. One objective of the present research is to examine whether in fact the
relationship between these community characteristics and social control is stable, or fluctuates.
IV. METHODOLOGY
Data for the current study was provided by the National Juvenile Court Archive
(NJCDA) located at the National Center for Juvenile Justice (NCJJ). County-level data were
taken from the 1980, 1990, and 2000 U.S. Census. Note that at the writing of this report, data
needed for more specific racial and ethnic measures from the 2010 U.S. Census has not yet been
released. Once released, future research will use the 2010 Census data as part of the analyses.
The referral data provided to the authors mirrors the variable construction of Sampson
and Laub’s (1993) initial analyses. While one of the initial objectives was to replicate Sampson
and Laub’s (1993) analyses throughout thirty years of data, we were unable to perform identical
analyses since we were provided aggregated counts of delinquent referrals instead of individual-
level case data as used by Sampson and Laub. For example, while Sampson and Laub (1993)
This document is a research report submitted to the U.S. Department of Justice. This report has not been published by the Department. Opinions or points of view expressed are those of the author(s)
and do not necessarily reflect the official position or policies of the U.S. Department of Justice.
36
reported that Black youth, and in particular, Black drug offenders received disadvantaged
outcomes at the stages of detention and judicial disposition, we are unable to identify the race,
gender, age, etc. of drug offenders referred to the juvenile court within each county. We only
know the count of Black referrals, referrals for drug offenses, etc., not the demographic
characteristics of delinquent referrals across offense types. This limitation prevented us from
replicating Sampson and Laub’s (1993) original analyses. It is important to note though, that
individual-level data was provided from NJCDA of all delinquent referrals in a Northeast state
from January 2000 through December 2010. The decision to include these data in additional
analyses is to provide a more in-depth examination of Sampson and Laub’s (1993) perspective to
explain the social control of youth and especially minority youth and those involved in drug
offending in juvenile justice proceedings.
For the purpose of clarity, the research is conducted in two phases. The first phase
focuses on the thirty years of aggregated data, the analysis procedures, and results involving the
aggregated counts of delinquent referrals. The second phase is comprised of the data, sample,
analysis procedures, and results for the individual-level data for the Northeast state.
V. AGGREGATED COUNTS OF DELINQUENT REFERRALS
5.1 Data and Sample
Rather than the collection of new data, data for the current study relies on the use of
existing state maintained databases and information from the U.S. Census. Data was provided
from sixteen states throughout the U.S. for a total of 172 counties. Only counties with a
minimum population of 6,000 youth between the ages of 10-17 throughout all four stages of data
collection (1985, 1995, 2005, and 2009) were included in the final sample. The decision to focus
This document is a research report submitted to the U.S. Department of Justice. This report has not been published by the Department. Opinions or points of view expressed are those of the author(s)
and do not necessarily reflect the official position or policies of the U.S. Department of Justice.
37
on these specific years (1985, 1995, 2005 and 2009) was to allow for time to assess for possible
changes in community characteristics (e.g., racial inequality) and in the levels of social control.
Even though the original goal of the study was to examine the same jurisdictions from
Sampson and Laub (1993), each county needed to maintain the threshold of 6,000 youth ages 10-
17 throughout all four time frames. Therefore, if a county met this criterion, it was included in
the final sample even if it was not a part of Sampson and Laub’s original sample. The states and
number of counties/districts that comprised the final sample included: Alabama (16), Arizona
(1), California (11), Hawaii (3), Missouri (12), New Jersey (18), Pennsylvania (38), South
Carolina (22), South Dakota (2), Tennessee (1), Virginia (15), Washington (15), Connecticut (8),
District of Columbia (1), Utah (8), and Michigan (1).
While the initial purpose was to collect a nationally representative sample of all U.S.
states, not all states were able to provide complete measures of the necessary data to the NJCDA,
or had permission to provide data to NJCDA. In only two instances, data were not available for
sixteen counties within the exact time frame, so a later year of data was collected. In this
instance, data from 2006 instead of 2005 were included for the sixteen total jurisdictions in
Connecticut and Utah. The remaining data from each of the other three time frames were from
the originally requested years (i.e. 1985, 1995, and 2009). A data set was created by NJCDA
who aggregated all individual-level case records to the county-level. The aggregated counts of all
delinquent referrals within each of the 172 counties throughout the four data collection years
comprised the final data set that was sent to the authors with counties as the unit of analysis.
Approximately 299,000 individual cases in 1985 were aggregated to the county-level, compared
to 428,000 records in 1995, 363,000 cases in 2005, and 325,000 cases in 2009.
This document is a research report submitted to the U.S. Department of Justice. This report has not been published by the Department. Opinions or points of view expressed are those of the author(s)
and do not necessarily reflect the official position or policies of the U.S. Department of Justice.
38
5.2 Case Variables
Table 1 presents the distribution of all individual and county-level variables throughout
the time frames of 1985 (with 1980 census data), 1995 (with 1990 census data), 2005 (with 2000
census data), and 2009 (with 2000 census data). Recall that 2010 census data has not yet been
released; otherwise, 2010 census data would have been used with the 2009 data.
Following Sampson and Laub (1993), the total number of delinquent referrals within
each county was disaggregated by race, ethnicity, offense type, gender, and age. Separate race
measures were constructed based on the proportion of youth who were referred to the juvenile
court within each county who were characterized as White, Black, American Indian or Native
American, Asian or Pacific Islander, Other race, and mixed race. The categories of American
Indian or Native American, Asian or Pacific Islander, Other race, and mixed race were combined
into one racial category, “Other race”. Three final variables distinguished across racial groups
and included White, Black, and Other. It is important to note that in the 1985 data, 47 counties
did not report the proportion of youth from “Other” racial backgrounds. In order to include the
47 counties in all analyses, the “Other” race variable was not included in any models with 1985
data.
Ethnicity was captured by the proportion of youth referred within each county who were
identified as Hispanic. Due to data limitations, we were not able to distinguish between youth
who identified as Hispanic and a specific race category. For example, it is possible that youth
who identified as White and Hispanic are represented in the aggregated counts of both measures.
Table 1 – Next Page
This document is a research report submitted to the U.S. Department of Justice. This report has not been published by the Department. Opinions or points of view expressed are those of the author(s)
and do not necessarily reflect the official position or policies of the U.S. Department of Justice.
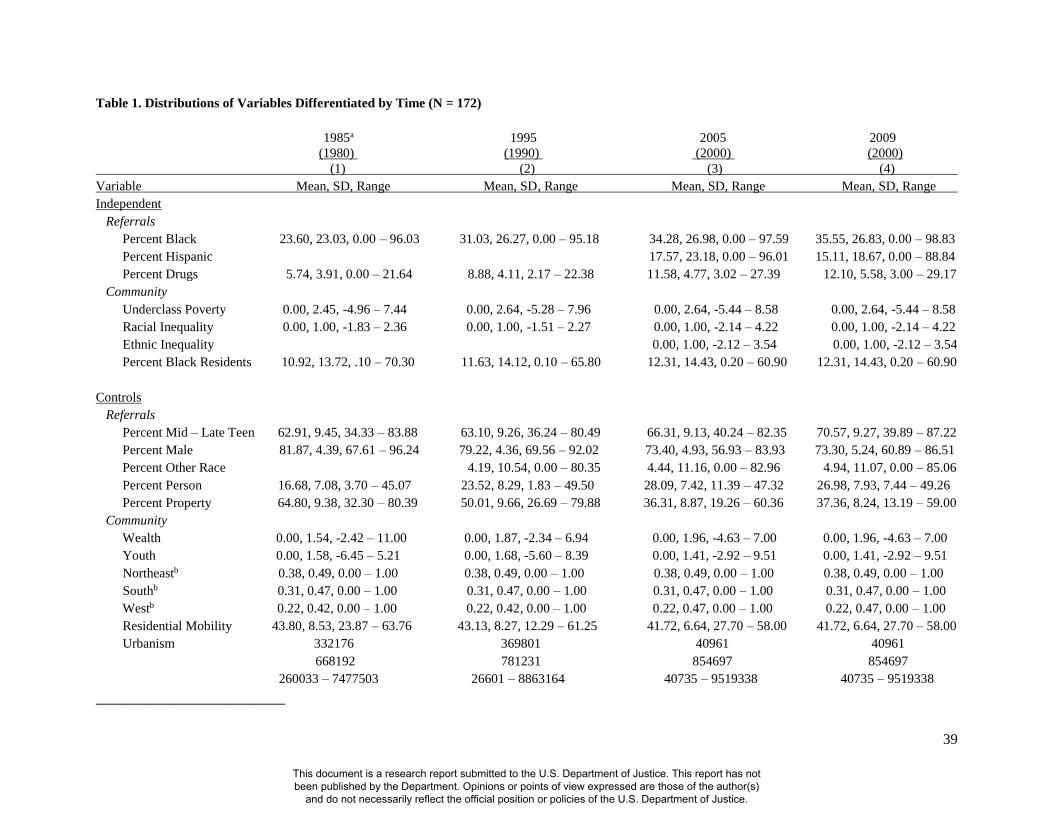
39
Table 1. Distributions of Variables Differentiated by Time (N = 172)
1985a 1995 2005 2009
(1980) (1990) (2000) (2000)
(1) (2) (3) (4)
Variable Mean, SD, Range Mean, SD, Range Mean, SD, Range Mean, SD, Range
Independent
Referrals
Percent Black 23.60, 23.03, 0.00 – 96.03 31.03, 26.27, 0.00 – 95.18 34.28, 26.98, 0.00 – 97.59 35.55, 26.83, 0.00 – 98.83
Percent Hispanic 17.57, 23.18, 0.00 – 96.01 15.11, 18.67, 0.00 – 88.84
Percent Drugs 5.74, 3.91, 0.00 – 21.64 8.88, 4.11, 2.17 – 22.38 11.58, 4.77, 3.02 – 27.39 12.10, 5.58, 3.00 – 29.17
Community
Underclass Poverty 0.00, 2.45, -4.96 – 7.44 0.00, 2.64, -5.28 – 7.96 0.00, 2.64, -5.44 – 8.58 0.00, 2.64, -5.44 – 8.58
Racial Inequality 0.00, 1.00, -1.83 – 2.36 0.00, 1.00, -1.51 – 2.27 0.00, 1.00, -2.14 – 4.22 0.00, 1.00, -2.14 – 4.22
Ethnic Inequality 0.00, 1.00, -2.12 – 3.54 0.00, 1.00, -2.12 – 3.54
Percent Black Residents 10.92, 13.72, .10 – 70.30 11.63, 14.12, 0.10 – 65.80 12.31, 14.43, 0.20 – 60.90 12.31, 14.43, 0.20 – 60.90
Controls
Referrals
Percent Mid – Late Teen 62.91, 9.45, 34.33 – 83.88 63.10, 9.26, 36.24 – 80.49 66.31, 9.13, 40.24 – 82.35 70.57, 9.27, 39.89 – 87.22
Percent Male 81.87, 4.39, 67.61 – 96.24 79.22, 4.36, 69.56 – 92.02 73.40, 4.93, 56.93 – 83.93 73.30, 5.24, 60.89 – 86.51
Percent Other Race 4.19, 10.54, 0.00 – 80.35 4.44, 11.16, 0.00 – 82.96 4.94, 11.07, 0.00 – 85.06
Percent Person 16.68, 7.08, 3.70 – 45.07 23.52, 8.29, 1.83 – 49.50 28.09, 7.42, 11.39 – 47.32 26.98, 7.93, 7.44 – 49.26
Percent Property 64.80, 9.38, 32.30 – 80.39 50.01, 9.66, 26.69 – 79.88 36.31, 8.87, 19.26 – 60.36 37.36, 8.24, 13.19 – 59.00
Community
Wealth 0.00, 1.54, -2.42 – 11.00 0.00, 1.87, -2.34 – 6.94 0.00, 1.96, -4.63 – 7.00 0.00, 1.96, -4.63 – 7.00
Youth 0.00, 1.58, -6.45 – 5.21 0.00, 1.68, -5.60 – 8.39 0.00, 1.41, -2.92 – 9.51 0.00, 1.41, -2.92 – 9.51
Northeastb 0.38, 0.49, 0.00 – 1.00 0.38, 0.49, 0.00 – 1.00 0.38, 0.49, 0.00 – 1.00 0.38, 0.49, 0.00 – 1.00
Southb 0.31, 0.47, 0.00 – 1.00 0.31, 0.47, 0.00 – 1.00 0.31, 0.47, 0.00 – 1.00 0.31, 0.47, 0.00 – 1.00
Westb 0.22, 0.42, 0.00 – 1.00 0.22, 0.42, 0.00 – 1.00 0.22, 0.47, 0.00 – 1.00 0.22, 0.47, 0.00 – 1.00
Residential Mobility 43.80, 8.53, 23.87 – 63.76 43.13, 8.27, 12.29 – 61.25 41.72, 6.64, 27.70 – 58.00 41.72, 6.64, 27.70 – 58.00
Urbanism 332176 369801 40961 40961
668192 781231 854697 854697
260033 – 7477503 26601 – 8863164 40735 – 9519338 40735 – 9519338
__________________________
This document is a research report submitted to the U.S. Department of Justice. This report has not been published by the Department. Opinions or points of view expressed are those of the author(s)
and do not necessarily reflect the official position or policies of the U.S. Department of Justice.
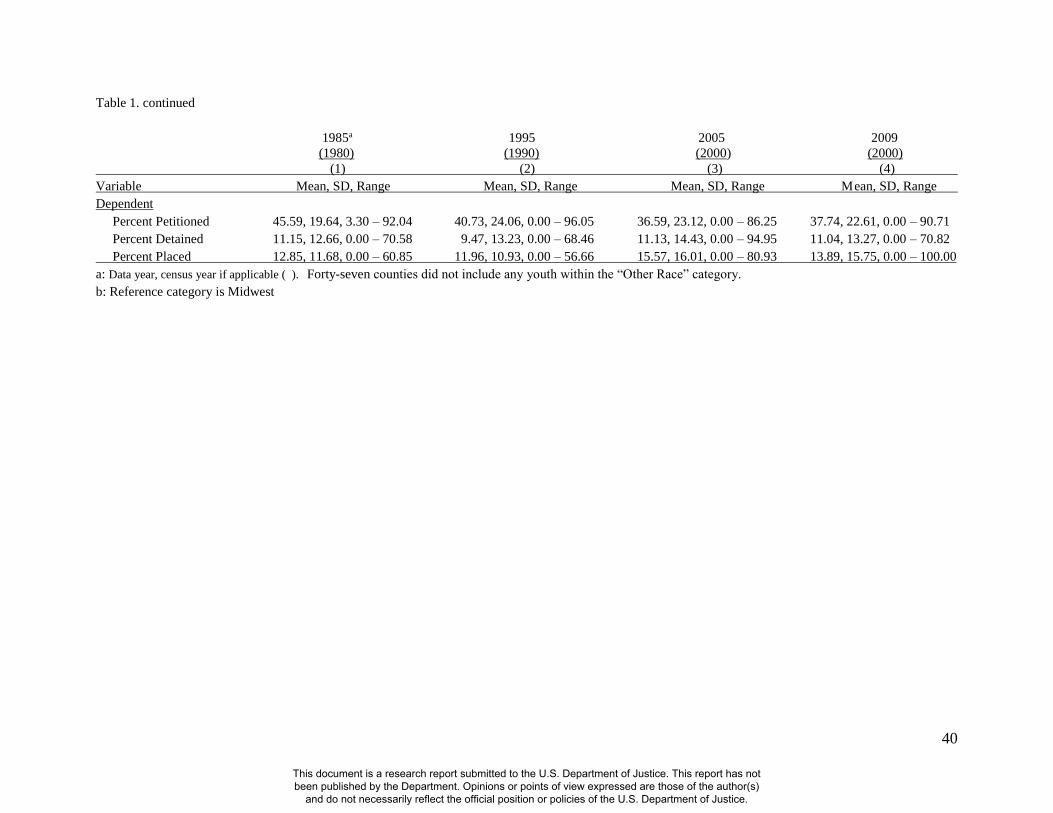
40
Table 1. continued
1985a 1995 2005 2009
(1980) (1990) (2000) (2000)
(1) (2) (3) (4)
Variable Mean, SD, Range Mean, SD, Range Mean, SD, Range Mean, SD, Range
Dependent
Percent Petitioned 45.59, 19.64, 3.30 – 92.04 40.73, 24.06, 0.00 – 96.05 36.59, 23.12, 0.00 – 86.25 37.74, 22.61, 0.00 – 90.71
Percent Detained 11.15, 12.66, 0.00 – 70.58 9.47, 13.23, 0.00 – 68.46 11.13, 14.43, 0.00 – 94.95 11.04, 13.27, 0.00 – 70.82
Percent Placed 12.85, 11.68, 0.00 – 60.85 11.96, 10.93, 0.00 – 56.66 15.57, 16.01, 0.00 – 80.93 13.89, 15.75, 0.00 – 100.00
a: Data year, census year if applicable ( ). Forty-seven counties did not include any youth within the “Other Race” category.
b: Reference category is Midwest
This document is a research report submitted to the U.S. Department of Justice. This report has not been published by the Department. Opinions or points of view expressed are those of the author(s)
and do not necessarily reflect the official position or policies of the U.S. Department of Justice.
41
The NJCDA categorizes all delinquent referrals into four types of offenses: crimes
against persons, crimes against property, drug offenses, and public order offenses. Four variables
were constructed based on the proportion of all delinquent referrals that comprised each of
offense type: person, property, drugs, and public order. The proportion of all four offense types
equated to 100 percent within each county. Person, property, and drug offenses were included in
each statistical model. Two measures of gender were constructed to distinguish between the
proportion of male referrals and female referrals. As with the offense type variables, the
proportion of male and female referrals equated to 100 percent within each county. Male
referrals were included in each statistical model.
In regards to age, the data originally produced twenty-one variables that measured the
number of delinquent referrals within each separate age category (ages 1-21). The original
twenty-one variables were collapsed into an age range of 10-17 (Sampson & Laub, 1992), then
three separate variables were constructed to capture the percentage of different age groupings of
youth referred within each county: Pre-teen (under 12 years old), early-teen (13-14 years old),
and middle-to-late teen (16-17 years old). The three categorizations mirror the coding schemes
utilized by the Office of Juvenile Justice and Delinquency Prevention (OJJDP) (Butts & Snyder,
1997). To produce more parsimonious results and prior research that has suggested this this age
group is the most at-risk to be involved in delinquent behavior, only the middle-to-late teen
measure was included in statistical analyses.
5.3 Contextual Variables
Following the variables included in Sampson and Laub’s (1993) initial examination,
various county-level measures were constructed based on information provided from the 1980,
1990, and 2000 U.S. Census for all 172 counties (see Appendix 1). Recall, while the authors’
This document is a research report submitted to the U.S. Department of Justice. This report has not been published by the Department. Opinions or points of view expressed are those of the author(s)
and do not necessarily reflect the official position or policies of the U.S. Department of Justice.

42
intended to include data from the 2010 U.S. Census, not all of the necessary measures were
released from the U.S. Census at the current time. All multi-item scales were created based on z-
scores of the individual measures, and higher levels on all indexes correspond to higher levels of
each measure within each county.
Mirroring and extending the measures constructed by Sampson and Laub (1993), an
index of underclass poverty was constructed based on three interrelated measures: percent of
female-headed households with children under 18 years old, percent individuals living in
poverty, and percent of household incomes less than $10,000. For the underclass poverty index
based on 1980 U.S. census measures, results from a principle components analysis (PCA)
revealed a one-factor solution that accounted for 76% of the variance, with an eigenvalue of 2.28
(α = .75). For the underclass poverty index based on 1990 U.S. census measures, results from a
principle components analysis (PCA) revealed a one-factor solution that accounted for 78% of
the variance, with an eigenvalue of 2.39 (α = .86). For the underclass poverty index based on
2000 U.S. census measures, results from a principle components analysis (PCA) revealed a one-
factor solution that accounted for 78% of the variance, with an eigenvalue of 2.35 (α = .86).
Two separate measures of racial and ethnic inequality were also constructed. Racial
inequality was measured by the sum of the ratio of Black to White individuals living in poverty
and percent of Black families living in poverty. Ethnic inequality was measured by the sum of
Hispanic to White individuals living in poverty and percent of Hispanic families living in
poverty. Once again, due to data limitations, ethnic inequality was only included in data from the
2000s.
While Sampson and Laub (1993) included the proportion of Black residents within the
underclass poverty measures, more recent research has argued that including this measure in a
This document is a research report submitted to the U.S. Department of Justice. This report has not been published by the Department. Opinions or points of view expressed are those of the author(s)
and do not necessarily reflect the official position or policies of the U.S. Department of Justice.
43
disadvantaged index is problematic. This is due to the assumption that the proportion of Black
residents in a county is indicative of counties characterized by underclass poverty. From this
argument, we included both the proportion of Black residents as a separate county-level measure
of interest. Unfortunately, while the 1980 and 1990 U.S. Census recorded the proportion of
Hispanic residents within each county, numerous counties were missing more specific Hispanic
measures (i.e. percent of Hispanic individuals living in poverty) in the 1980 and 1990 U.S.
Census. For example, 55 out of the 172 counties (32%) did not have data that measured the
percent of Hispanic families and the percent of Hispanic individuals living in poverty in 1990.
Therefore, these data limitations preclude the inclusion of the Hispanic measures in the data for
juvenile referrals from the 1980s and 1990s. All Hispanic measures were included in the data
from the 2000s.
5.4 County-Level Control Variables
The remaining community-level variables were treated as controls. A wealth measure
was created based on the median household income within each county summed with the percent
of families within each county with household incomes larger than $50,000 (for 1980s data),
$100,000 (for 1990s data), and $200,000 (for 2000s data). The U.S. Census only provided
information in 1980 for household incomes larger than $50,000 and $100,000 in 1990. The
amount of $200,000 for the 2000s data was decided as a proxy for “wealth” based on the
changing economy in the last 30 years. A measure of residential mobility was constructed based
on the percentage of residents that have moved households in the past five years. Urbanism was
captured by the population of residents within each county. Density of youth was constructed
based on the sum of youth between the ages of 15 and 18 within each county and the ratio of
juveniles to adults. The final control variable, region, differentiated between jurisdictions located
This document is a research report submitted to the U.S. Department of Justice. This report has not been published by the Department. Opinions or points of view expressed are those of the author(s)
and do not necessarily reflect the official position or policies of the U.S. Department of Justice.
44
in the Northeast (65 counties), South (54 counties), Midwest (15 counties), and West (38
counties). The Midwest region constituted the reference category.
5.5 Dependent Variables
Four stages of juvenile justice decision-making (petition, detention, adjudication, and
judicial disposition) were initially considered as the dependent variables for the current study.
Unfortunately, not all counties were able to provide complete data for all four stages throughout
each of the four data collection time frames. For example, in 1985 and 1995, more than 80 of the
172 counties were missing over fifty percent of adjudication data. In 2005 and 2009, twenty
counties (twelve percent of the 172 counties) were missing over thirty percent of adjudication
data. In order to feel comfortable with the stability of the data and confidence in the statistical
models, the authors chose to remove adjudication as a decision-making stage. At the stage of
judicial disposition, counts were originally provided that distinguished between youth who were
placed or securely placed. The two variables were collapsed to represent the proportion of youth
who received a placement at judicial disposition. The final dependent variables included the
proportion of youth referred to the juvenile court who received a petition (petitioned), held in
secure detention (detention), or received a placement at judicial disposition (placement).
The selected dependent variables mirror and also extend the research by Sampson and
Laub (1993). In their initial examination, Sampson and Laub (1993) examined the stages of
secure predisopositional detention and outcome of out-of-home placement at judicial disposition.
While Sampson and Laub (1993) disaggregated cases at petition between non-petitioned and
petitioned youth and separately examined the outcomes of these two different types of cases at
detention and disposition, we decided to predict the likelihood of formal petition (petitioned).
Predicting the likelihood of non-petitioned cases would produce the same results as predicting
This document is a research report submitted to the U.S. Department of Justice. This report has not been published by the Department. Opinions or points of view expressed are those of the author(s)
and do not necessarily reflect the official position or policies of the U.S. Department of Justice.

45
formal petition, except that the signs of the coefficients would be reversed. To confirm this
claim, additional regression equations were estimated predicting non-petitioned cases, and all
coefficients were the same but in the opposite direction of the coefficients that predicted
petitioned cases.
5.6 Missing Data
It is important to note that due to issues with missing data, not all counties were able to
be included within each statistical model. Furthermore, numerous counties did not collect
information about certain variables included in the present study, and were removed from the
analyses for different time frames. In other situations, depending on the nature of the variable,
missing data was imputed with the mean or the mode. For example, if less than ten percent of
data on the gender of the youth was missing for a certain county, the missing counts were
recoded to the modal category. For the race and offense type variables, the counts of missing
data were assigned to each race and offense type measure based on the proportion of data that
was complete within each measure. For example, the count of missing data for offense type
within each county was divided and imputed into the person, property, drug, and public order
measures depending on the proportion of complete data within each measure.
Two counties in California did not provide any information for 1995. In light of this
limitation, the mean of the other three years of data collection were imputed into the data for
these two counties in 1995. Also, one county in California did not report the ages of youth
referred, therefore the mean of the other three years were imputed for 1995. In addition, all
counties in South Carolina and South Dakota did not report information on the ethnicity of youth
in 2005 (n = 24). The proportion of Hispanic youth within these two states in 2009 was imputed
into the Hispanic measure for 2005 to allow for the counties in these two states to be included in
This document is a research report submitted to the U.S. Department of Justice. This report has not been published by the Department. Opinions or points of view expressed are those of the author(s)
and do not necessarily reflect the official position or policies of the U.S. Department of Justice.
46
the 2005 analyses. However, if the flagged variable for missing ethnicity data (see below for
description of flagged variables) was a significant predictor of any court outcome, the counties
for these two states were removed from the analysis when predicting court outcomes in 2005.
As with the limitations of the county-level data that pertained specifically to Hispanics in
the 1980 and 1990 U.S. Census, the aggregated referral data from 1985 and 1995 was also
problematic concerning the Hispanic measure. More specific, 140 counties in 1985 and 121
counties in 1995 did not collect data identifying the ethnicity (Hispanic versus Non-Hispanic) of
youth. This limitation prevented the inclusion of the proportion of Hispanic youth as a measure
when predicting juvenile court outcomes in 1985 and 1995.
Data pertaining to the detention stage was also problematic in a number of counties. For
each of the four time frames, different counties were included to predict detention compared to
the other outcome stages. Fifty counties in 1985, 74 counties in 1995, 79 counties in 2005, and
78 counties in 2009 did not collect information on detention status. These counties were dropped
from the analysis when predicting the likelihood of detention.
For data that was originally missing (then later imputed), three flagged variables were
originally constructed (0 = no, 1 = missing more than ten percent; 1= missing more than thirty
percent; 1 = missing more than fifty percent). If the flagged variable for counties that were
missing more than ten percent of data for any variable (age, gender, race, ethnicity, offense type)
were statistically significant predictors of any of the dependent variables, then the flagged
counties were dropped from the individual final models. This was to be more conservative in the
results (instead of including flags that represented more than 30% or 50% missing data instead of
10%) and to determine if the counties that originally had missing data affected the estimates of
the coefficients. If we were to include the counties that were represented by significant flagged
This document is a research report submitted to the U.S. Department of Justice. This report has not been published by the Department. Opinions or points of view expressed are those of the author(s)
and do not necessarily reflect the official position or policies of the U.S. Department of Justice.
47
variables, these counties would bias the estimates of the other variables included in the model
(Allison, 2002). Since the data provided are counts of referrals within each county instead of
individual case records, traditional imputation methods for missing data that have been used
previously by OJJDP (i.e. record and format-level imputation) and prior criminological research
were unable to be performed (Fox, 2004; Fox & Swatt, 2008; Johnson & Young, 2011; Stahl et
al., 2007).
5.7 Analytic Procedures
The analysis plan with the data over a 30-year time frame was guided by the three
research questions. First, Ordinary least squares (OLS) regression models were examined to
predict the relationship between the independent and control variables at the individual-level and
community-level on the proportion of youth within each county that were petitioned, detained,
and sentenced to placement. This first step was replicated for the referral data from 1985, 1995,
2005, and 2009. Second, a reduced model was predicted across all three court outcomes and all
four-time frames. The reduced models included the proportion of Black referrals, proportion of
drug referrals, underclass poverty, racial inequality, and percent Black residents within the 1985
and 1995 referral data. The reduced models within the 2005 and 2009 referral data included the
proportion of Black referrals, proportion of Hispanic referrals, proportion of drug referrals,
underclass poverty, racial inequality, ethnic inequality, and percent Black residents. Both linear
and non-linear terms of underclass poverty and racial inequality were included in the analyses to
test for any potential curvelinear effects.
The third step in the analyses procedure was to estimate OLS change models to
understand how changes in the independent variables over time may influence changes in the
dependent variables over time. Changes in the independent variables in referral data between
This document is a research report submitted to the U.S. Department of Justice. This report has not been published by the Department. Opinions or points of view expressed are those of the author(s)
and do not necessarily reflect the official position or policies of the U.S. Department of Justice.
48
1985 and 1995 and U.S. census data between 1980 and 1990 were used to predict changes in the
dependent variables from 1985 to 1995. In addition, changes in the independent variables in
referral data between 1985 and 2005 and U.S. census data between 1980 and 2000 were used to
predict changes in the dependent variables from 1985 to 2005. This step was also repeated to
estimate the changes in the independent variables in referral data between 1985 and 2009 and
U.S. census data between 1980 and 2000 on the changes in court outcomes from 1985 to 2009.
Four variables of interest were included in each change model depending on the years examined:
changes in the proportion of Black referrals, changes in the proportion of drug referrals, changes
in underclass poverty, and changes in racial inequality.
5.8 Results
Before the OLS regression results are discussed, the discussion first examines by time the
distributions of the central variables of interest: referrals, community indicators, and the
decision-making stages. Following this discussion, the findings from the multivariate analyses
are detailed.
5.9 Distributions of Variables of Interest by Time
Table 2 (next page) provides the distributions of variables of interest by the four time
periods. The information is reproduced from Table 1. These variables represent referrals (%
Black, % Hispanic, % Drugs), community characteristics (underclass poverty, racial inequality,
ethnic inequality, % Black), and decision making stages (% petitioned, % detained, % placed).
This document is a research report submitted to the U.S. Department of Justice. This report has not been published by the Department. Opinions or points of view expressed are those of the author(s)
and do not necessarily reflect the official position or policies of the U.S. Department of Justice.
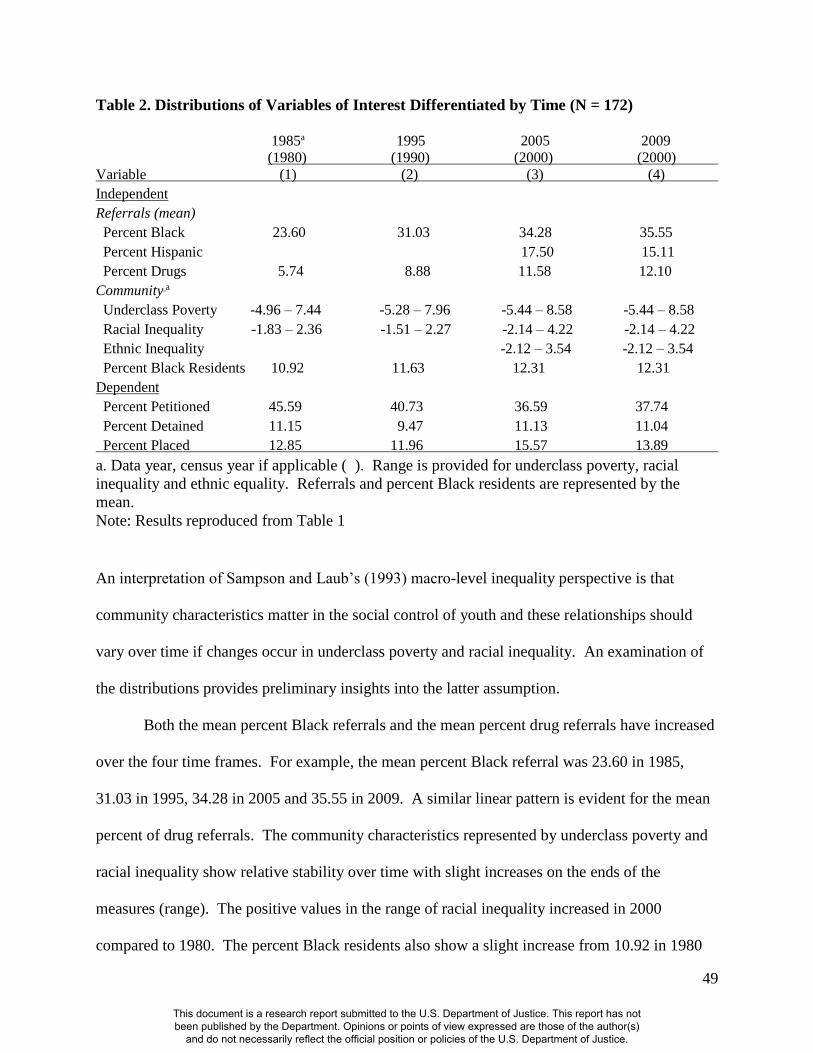
49
Table 2. Distributions of Variables of Interest Differentiated by Time (N = 172)
1985a 1995 2005 2009
(1980) (1990) (2000) (2000)
Variable (1) (2) (3) (4)
Independent
Referrals (mean)
Percent Black 23.60 31.03 34.28 35.55
Percent Hispanic 17.50 15.11
Percent Drugs 5.74 8.88 11.58 12.10
Community a
Underclass Poverty -4.96 – 7.44 -5.28 – 7.96 -5.44 – 8.58 -5.44 – 8.58
Racial Inequality -1.83 – 2.36 -1.51 – 2.27 -2.14 – 4.22 -2.14 – 4.22
Ethnic Inequality -2.12 – 3.54 -2.12 – 3.54
Percent Black Residents 10.92 11.63 12.31 12.31
Dependent
Percent Petitioned 45.59 40.73 36.59 37.74
Percent Detained 11.15 9.47 11.13 11.04
Percent Placed 12.85 11.96 15.57 13.89
a. Data year, census year if applicable ( ). Range is provided for underclass poverty, racial
inequality and ethnic equality. Referrals and percent Black residents are represented by the
mean.
Note: Results reproduced from Table 1
An interpretation of Sampson and Laub’s (1993) macro-level inequality perspective is that
community characteristics matter in the social control of youth and these relationships should
vary over time if changes occur in underclass poverty and racial inequality. An examination of
the distributions provides preliminary insights into the latter assumption.
Both the mean percent Black referrals and the mean percent drug referrals have increased
over the four time frames. For example, the mean percent Black referral was 23.60 in 1985,
31.03 in 1995, 34.28 in 2005 and 35.55 in 2009. A similar linear pattern is evident for the mean
percent of drug referrals. The community characteristics represented by underclass poverty and
racial inequality show relative stability over time with slight increases on the ends of the
measures (range). The positive values in the range of racial inequality increased in 2000
compared to 1980. The percent Black residents also show a slight increase from 10.92 in 1980
This document is a research report submitted to the U.S. Department of Justice. This report has not been published by the Department. Opinions or points of view expressed are those of the author(s)
and do not necessarily reflect the official position or policies of the U.S. Department of Justice.
50
to 12.31 in 2000. In regards to the decision-making stages, although there is some slight
variability over time, the percent of detained referrals and percent of placed referrals have
remained relatively stable. Yet, the percent petitioned, with one exception in 2009, has an
inverse relationship over time. In 1985, the percent petitioned was 45.59 compared to 37.74 in
2009.
In short, in terms of social control, the percent Black referrals and the percent drug
referrals have increased over time. The percent of detained referrals and percent of placed
referrals have remained relatively the same. With one exception, the percentage of petitioned
referrals has decreased. The extent of underclass poverty and racial inequality in terms of larger
values at the positive end of the range has increased, in particular the latter, in 2000 compared to
1980. Next, multivariate analyses are used to assess the extent to which (1) these factors predict
social control, (2) if these relationships are similar or different for various racial/ethnic groups,
and (3) if these effects predict decision-making over time.
5.10 OLS Regression Results Differentiated by Time
Table 3 through Table 6 present the OLS regression results for each stage (petition,
detention, placement) by each year (1985, 1995, 2005, 2009). Additive models were first
estimated, followed by estimation involving reduced modeling, and then tests for interaction
models involving underclass poverty and racial inequality with Black referrals, drug referrals and
when applicable, detention. Because the relatively small number of counties (n= 172 or less)
may produce unreliable results, reduced modeling was performed. For the purpose of clarity, the
discussion will center on the results from the central variables of interest from the main models
and the interaction models. Recall, due to the small number of counties within some of the
models (which could affect the stability of the results) the reduced models that were estimated
This document is a research report submitted to the U.S. Department of Justice. This report has not been published by the Department. Opinions or points of view expressed are those of the author(s)
and do not necessarily reflect the official position or policies of the U.S. Department of Justice.
51
and presented are strictly exploratory in nature. Interaction models were only produced if they
resulted in significant effects. It is important to note that all potential interaction models were
estimated, but non-findings were not produced in the form of a table.
Table 3 provides the additive results for case outcomes for 1985 and Table 3a details the
interaction effects. As can be seen in column 1 of Table 3, an increase in the percent of drug
referrals leads to an increase in the level of petitioned cases. In addition, an increase in the
percent Black residents comprising a community leads to increases in the level of detained cases
(column 2) and cases receiving out-of-home placement (column 3).
Concerning the control measures, an increase in the percent of mid-late teen referrals,
males, property offenses, density of youth, referrals from the Northwest, South, and West leads
to decreases in the level of petitioned cases (column 1). An increase in the population size of
counties corresponds to increases in the level of petitioned cases (column 1). The density of
youth within a county leads to decreases in the level of detained cases, while an increase in
referrals from the West and residential mobility leads to increases in the level of detained cases
(column 2). An increase in property offenses, referrals from the West, and residential mobility
corresponds to increases in cases receiving residential placement (column 3). A greater density
of youth in a county is inversely related to judicial disposition (column 3).
Table 3 and Table 3a – Next Page
This document is a research report submitted to the U.S. Department of Justice. This report has not been published by the Department. Opinions or points of view expressed are those of the author(s)
and do not necessarily reflect the official position or policies of the U.S. Department of Justice.
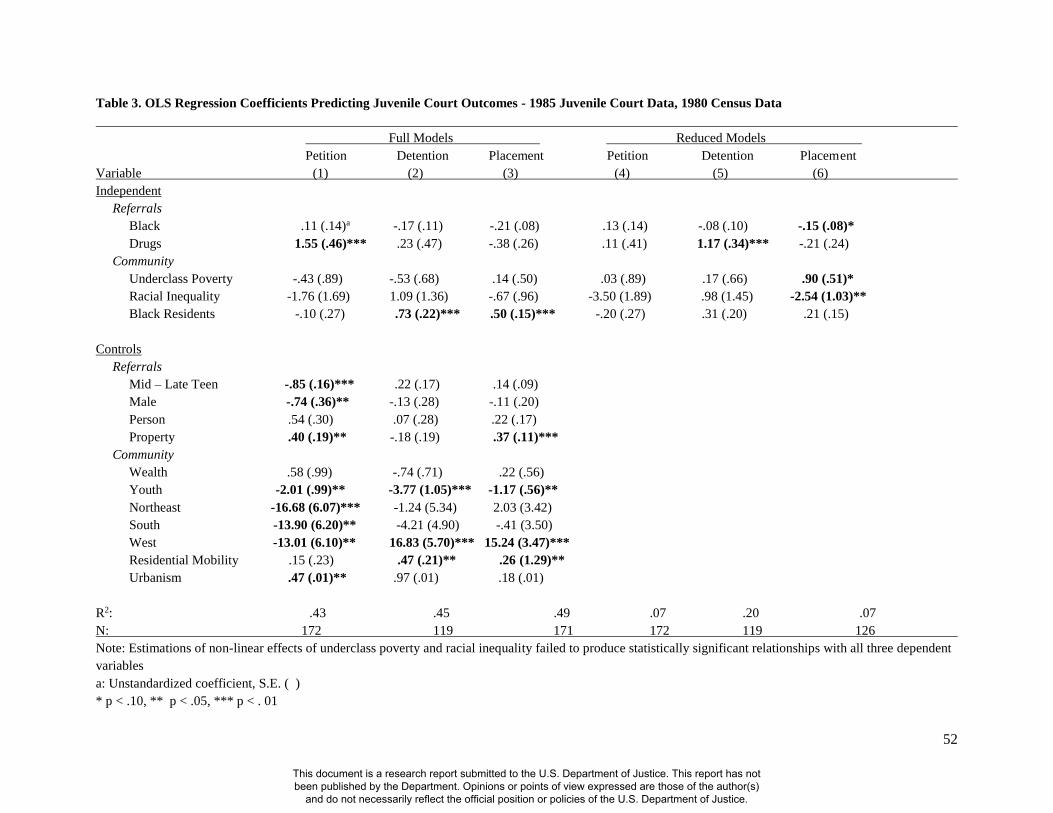
52
Table 3. OLS Regression Coefficients Predicting Juvenile Court Outcomes - 1985 Juvenile Court Data, 1980 Census Data
Full Models Reduced Models
Petition Detention Placement Petition Detention Placement
Variable (1) (2) (3) (4) (5) (6)
Independent
Referrals
Black .11 (.14)a -.17 (.11) -.21 (.08) .13 (.14) -.08 (.10) -.15 (.08)*
Drugs 1.55 (.46)*** .23 (.47) -.38 (.26) .11 (.41) 1.17 (.34)*** -.21 (.24)
Community
Underclass Poverty -.43 (.89) -.53 (.68) .14 (.50) .03 (.89) .17 (.66) .90 (.51)*
Racial Inequality -1.76 (1.69) 1.09 (1.36) -.67 (.96) -3.50 (1.89) .98 (1.45) -2.54 (1.03)**
Black Residents -.10 (.27) .73 (.22)*** .50 (.15)*** -.20 (.27) .31 (.20) .21 (.15)
Controls
Referrals
Mid – Late Teen -.85 (.16)*** .22 (.17) .14 (.09)
Male -.74 (.36)** -.13 (.28) -.11 (.20)
Person .54 (.30) .07 (.28) .22 (.17)
Property .40 (.19)** -.18 (.19) .37 (.11)***
Community
Wealth .58 (.99) -.74 (.71) .22 (.56)
Youth -2.01 (.99)** -3.77 (1.05)*** -1.17 (.56)**
Northeast -16.68 (6.07)*** -1.24 (5.34) 2.03 (3.42)
South -13.90 (6.20)** -4.21 (4.90) -.41 (3.50)
West -13.01 (6.10)** 16.83 (5.70)*** 15.24 (3.47)***
Residential Mobility .15 (.23) .47 (.21)** .26 (1.29)**
Urbanism .47 (.01)** .97 (.01) .18 (.01)
R2: .43 .45 .49 .07 .20 .07
N: 172 119 171 172 119 126
Note: Estimations of non-linear effects of underclass poverty and racial inequality failed to produce statistically significant relationships with all three dependent
variables
a: Unstandardized coefficient, S.E. ( )
* p < .10, ** p < .05, *** p < . 01
This document is a research report submitted to the U.S. Department of Justice. This report has not been published by the Department. Opinions or points of view expressed are those of the author(s)
and do not necessarily reflect the official position or policies of the U.S. Department of Justice.

53
Table 3a. OLS Regression Coefficients Predicting Juvenile Court Outcomes - Main and Interaction Models – 1985 Juvenile Court Data, 1980 Census
Data Detention Placement
Main Interaction Main Interaction
Variable (1) (2) (3) (4)
Independent
Referrals
Black -.17 (.11)a -.25 (.14)* -.21 (.08) .04 (.08)
Drugs .23 (.47) .03 (.60) -.38 (.26) -.89 (.31)***
Community
Underclass Poverty -.53 (.68) -.46 (.99) .03 (.89) .21 (.46)
Racial Inequality 1.09 (1.36) -.40 (1.58) -.67 (.96) -.35 (.90)
Black Residents .73 (.22)*** .82 (.25)*** .50 (.15)***
Controls
Referrals
Mid – Late Teen -.74 (.71) .32 (.17)* .14 (.09) .15 (.12)
Male -.13 (.28) -.23 (.27) -.11 (.20) .15 (.19)
Person .07 (.28) .23 (.28) .22 (.17) -.34 (.19)*
Property -.18 (.19) -.04 (.19) .37 (.11)*** -.20 (.13)
Detention .43 (.10)***
Community
Wealth -.74 (.71) -.71 (.72) .22 (.56) -.45 (.48)
Youth -3.77 (1.05)*** -4.09 (1.13)*** -1.17 (.56)** 1.42 (.80)*
Northeast -1.24 (5.34) -4.08 (5.26) 2.03 (3.42) -1.79 (3.54)
South -4.21 (4.90) -5.60 (5.04) -.41 (3.50) -7.71 (3.37)**
West 16.83 (5.70)*** 20.70 (5.89) 15.24 (3.47)*** 6.00 (4.24)
Residential Mobility .47 (.21)** .40 (.21)** .26 (1.29)** -.06 (.14)
Urbanism .97 (.01) -.28 (.01) .18 (.01) .35 (.01)***
Interactions
Black Referrals x Underclass Poverty -.03 (.02)
Black Referrals x Racial Inequality .14 (.07)*
Black Referrals x Drug Referrals .01 (.01)
Black Referrals x Detention -.01 (.01)***
R2: .45 .50 .49 .45
N: 119 116 171 116
a: Unstandardized coefficient, S.E. ( ); * p < .10, ** p < .05, *** p < . 01
This document is a research report submitted to the U.S. Department of Justice. This report has not been published by the Department. Opinions or points of view expressed are those of the author(s)
and do not necessarily reflect the official position or policies of the U.S. Department of Justice.
54
In column 2 of Table 3a, the interaction results show a positive statistically significant
effect involving a joint relationship between the percent Black referrals and racial inequality with
increases in detention (p < .10). That is, in communities with a greater percent of Black referrals
and greater racial inequality, greater levels of detention exist. Estimations of interactions also
revealed an inverse relationship involving Black referrals and detention with out-of-home
placement (p < .01) (column 4).
The results for juvenile court outcomes for 1995, using 1990 Census data, are presented
in Table 4. Looking across the findings for all three stages, it can be seen that three additive
statistically significant relationships exist. Drug referrals leads to an increase in the level of
petitioned cases (column 1). Underclass poverty is a positive determinant of out-of-home
placement, while racial inequality has inverse effect on out-of-home placement (column 3).
In regards to the control measures, the proportion of mid-late teen referrals, “other” racial
groups, and referrals from the Northeast and South have an inverse effect on petition (column 1),
while the proportion of property offenses, person offenses, and residential mobility have a
positive effect on petition (column 1). The percent of male referrals corresponds to an increase in
detained cases (column 2), while referrals from the South corresponds to a decrease in detained
cases (column 2). Concerning residential placement, and increase in the proportion of mid-late
teens, person offenses, wealthy counties, density of youth, referrals from the West, and urban
counties leads to an increase in out-of-home placement (column 3).
Estimations of interaction effects produced one statistically significant relationship with
decision making at petition. These results are presented in Table 4a. An interaction relationship
exists between Black referrals and drug referrals with petition and the effect is positive (column
2).
This document is a research report submitted to the U.S. Department of Justice. This report has not been published by the Department. Opinions or points of view expressed are those of the author(s)
and do not necessarily reflect the official position or policies of the U.S. Department of Justice.
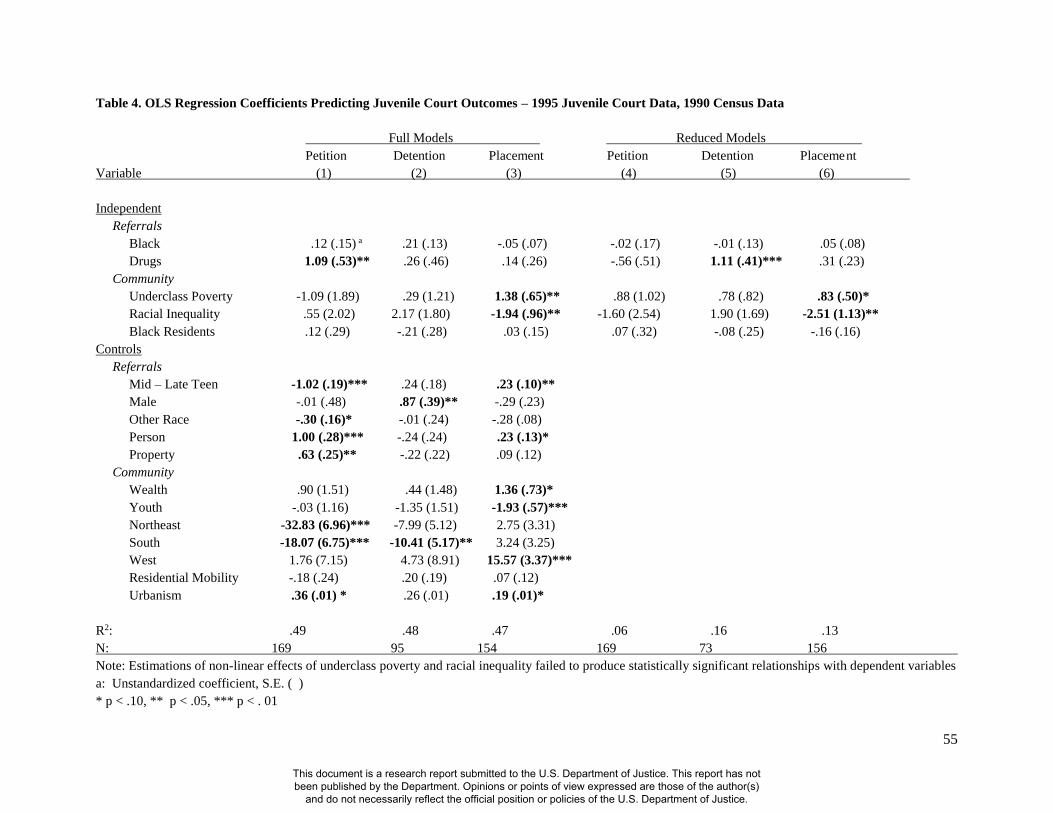
55
Table 4. OLS Regression Coefficients Predicting Juvenile Court Outcomes – 1995 Juvenile Court Data, 1990 Census Data
Full Models Reduced Models
Petition Detention Placement Petition Detention Placement
Variable (1) (2) (3) (4) (5) (6)
Independent
Referrals
Black .12 (.15) a .21 (.13) -.05 (.07) -.02 (.17) -.01 (.13) .05 (.08)
Drugs 1.09 (.53)** .26 (.46) .14 (.26) -.56 (.51) 1.11 (.41)*** .31 (.23)
Community
Underclass Poverty -1.09 (1.89) .29 (1.21) 1.38 (.65)** .88 (1.02) .78 (.82) .83 (.50)*
Racial Inequality .55 (2.02) 2.17 (1.80) -1.94 (.96)** -1.60 (2.54) 1.90 (1.69) -2.51 (1.13)**
Black Residents .12 (.29) -.21 (.28) .03 (.15) .07 (.32) -.08 (.25) -.16 (.16)
Controls
Referrals
Mid – Late Teen -1.02 (.19)*** .24 (.18) .23 (.10)**
Male -.01 (.48) .87 (.39)** -.29 (.23)
Other Race -.30 (.16)* -.01 (.24) -.28 (.08)
Person 1.00 (.28)*** -.24 (.24) .23 (.13)*
Property .63 (.25)** -.22 (.22) .09 (.12)
Community
Wealth .90 (1.51) .44 (1.48) 1.36 (.73)*
Youth -.03 (1.16) -1.35 (1.51) -1.93 (.57)***
Northeast -32.83 (6.96)*** -7.99 (5.12) 2.75 (3.31)
South -18.07 (6.75)*** -10.41 (5.17)** 3.24 (3.25)
West 1.76 (7.15) 4.73 (8.91) 15.57 (3.37)***
Residential Mobility -.18 (.24) .20 (.19) .07 (.12)
Urbanism .36 (.01) * .26 (.01) .19 (.01)*
R2: .49 .48 .47 .06 .16 .13
N: 169 95 154 169 73 156
Note: Estimations of non-linear effects of underclass poverty and racial inequality failed to produce statistically significant relationships with dependent variables
a: Unstandardized coefficient, S.E. ( )
* p < .10, ** p < .05, *** p < . 01
This document is a research report submitted to the U.S. Department of Justice. This report has not been published by the Department. Opinions or points of view expressed are those of the author(s)
and do not necessarily reflect the official position or policies of the U.S. Department of Justice.
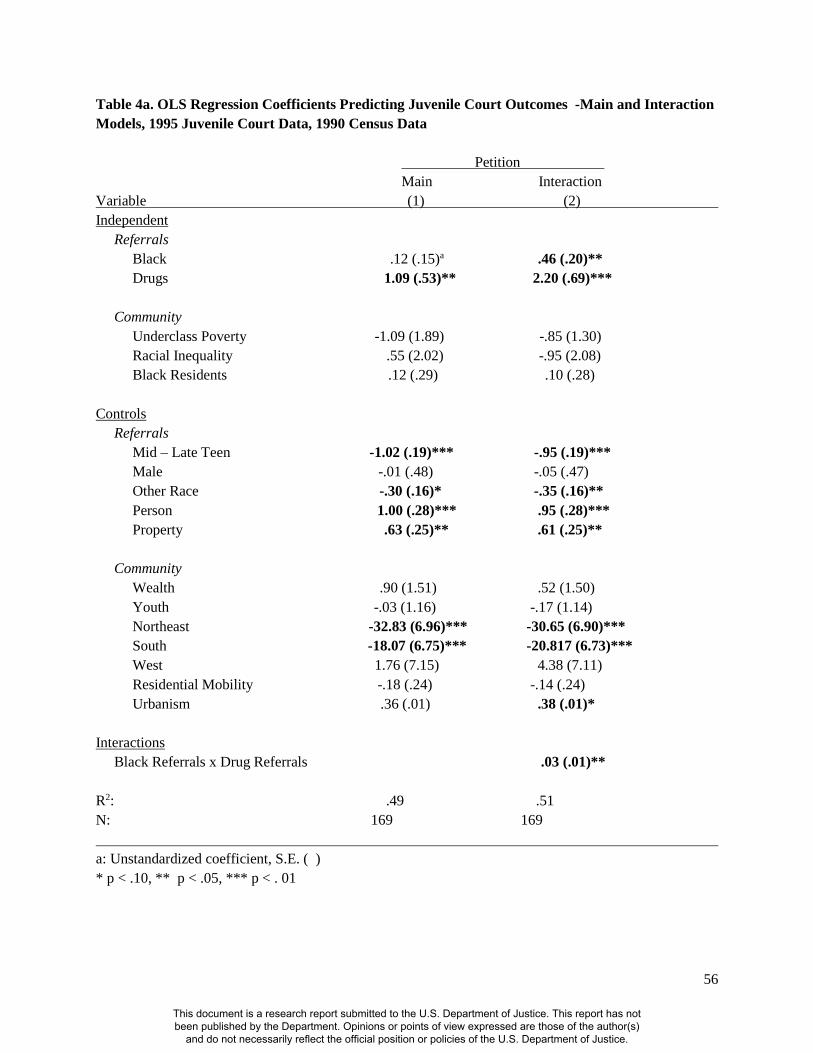
56
Table 4a. OLS Regression Coefficients Predicting Juvenile Court Outcomes -Main and Interaction
Models, 1995 Juvenile Court Data, 1990 Census Data
Petition
Main Interaction
Variable (1) (2)
Independent
Referrals
Black .12 (.15)a .46 (.20)**
Drugs 1.09 (.53)** 2.20 (.69)***
Community
Underclass Poverty -1.09 (1.89) -.85 (1.30)
Racial Inequality .55 (2.02) -.95 (2.08)
Black Residents .12 (.29) .10 (.28)
Controls
Referrals
Mid – Late Teen -1.02 (.19)*** -.95 (.19)***
Male -.01 (.48) -.05 (.47)
Other Race -.30 (.16)* -.35 (.16)**
Person 1.00 (.28)*** .95 (.28)***
Property .63 (.25)** .61 (.25)**
Community
Wealth .90 (1.51) .52 (1.50)
Youth -.03 (1.16) -.17 (1.14)
Northeast -32.83 (6.96)*** -30.65 (6.90)***
South -18.07 (6.75)*** -20.817 (6.73)***
West 1.76 (7.15) 4.38 (7.11)
Residential Mobility -.18 (.24) -.14 (.24)
Urbanism .36 (.01) .38 (.01)*
Interactions
Black Referrals x Drug Referrals .03 (.01)**
R2: .49 .51
N: 169 169
a: Unstandardized coefficient, S.E. ( )
* p < .10, ** p < .05, *** p < . 01
This document is a research report submitted to the U.S. Department of Justice. This report has not been published by the Department. Opinions or points of view expressed are those of the author(s)
and do not necessarily reflect the official position or policies of the U.S. Department of Justice.
57
The OLS regression results for the main effects involving the predictors of petition,
detention and out-of-home placement for 2005 using 2000 Census data are provided in Table 5.
Three statistically significant effects are present. The variable Hispanic referral has an inverse
relationship with petition (column 1). At detention, both racial inequality and the percent Black
residents have positive statistically significant relationships (column 2). Concerning the control
measures, the percent of mid-late teen referrals, “other” racial groups, and referrals from the
Northeast and South have an inverse relationship with petition (column 1), while wealthy
counties have a positive relationship with petition (column 1). At detention (column 2), as the
percent of mid-late teens, “other” racial groups, and referrals from the Northeast increases, the
proportion of detained cases increases as well. Furthermore, the percent of mid-late teen referrals
and wealthy counties have positive and significant relationships with placement (column 3).
The additive relationship between Hispanic referrals with petition appears to be
conditioned by drug referrals as shown by a significant interaction. As presented in Table 5a, an
inverse statistically significant effect exists between the percent Hispanic referrals and drug
referrals with the percent petitioned.
Juvenile court outcomes for 2009, using Census data from 2000 is the last time frame that
was examined. The findings for the additive or main models are detailed in Table 6. Estimations
involving tests for interaction relationships failed to produce statistically significant effects.
These non-findings are not presented. In Table 6, only two statistically significant effects are
found and both occur at petition (p < .10). An inverse relationship exists between drug referrals
with the dependent variable as does such an effect involving racial inequality. Therefore, an
increase in racial inequality corresponds to a decrease in the percent of petitioned referrals.
This document is a research report submitted to the U.S. Department of Justice. This report has not been published by the Department. Opinions or points of view expressed are those of the author(s)
and do not necessarily reflect the official position or policies of the U.S. Department of Justice.
58
Concerning the control variables, an increase in the proportion of mid-late teen referrals,
“other” racial groups, density of youth, and referrals from the Northeast and South correspond to
a decrease in the percent of petitioned cases (column 1). A positive relationship exists between
the percent of male referrals, youth from “other” racial groups, and referrals from the Northeast
and the detention outcome (column 2). The proportion of mid-late teens, “other” racial groups,
and counties with residential mobility and urbanism correspond to increases in out-of-home
placement cases (column 3), while the proportion of person offenses, property offenses, and
referrals from the South and West have a positive relationship with out-of-home placement.
Table 5, Table 5a, Table 6 – Next Page
This document is a research report submitted to the U.S. Department of Justice. This report has not been published by the Department. Opinions or points of view expressed are those of the author(s)
and do not necessarily reflect the official position or policies of the U.S. Department of Justice.
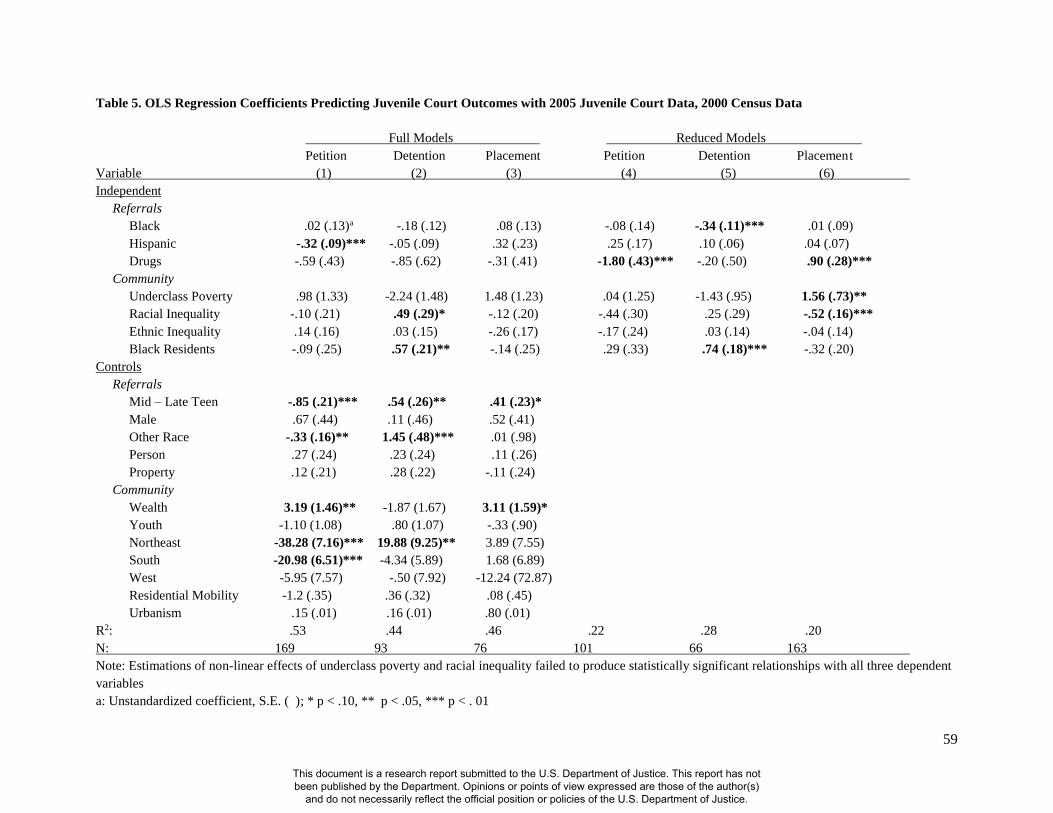
59
Table 5. OLS Regression Coefficients Predicting Juvenile Court Outcomes with 2005 Juvenile Court Data, 2000 Census Data
Full Models Reduced Models
Petition Detention Placement Petition Detention Placement
Variable (1) (2) (3) (4) (5) (6)
Independent
Referrals
Black .02 (.13)a -.18 (.12) .08 (.13) -.08 (.14) -.34 (.11)*** .01 (.09)
Hispanic -.32 (.09)*** -.05 (.09) .32 (.23) .25 (.17) .10 (.06) .04 (.07)
Drugs -.59 (.43) -.85 (.62) -.31 (.41) -1.80 (.43)*** -.20 (.50) .90 (.28)***
Community
Underclass Poverty .98 (1.33) -2.24 (1.48) 1.48 (1.23) .04 (1.25) -1.43 (.95) 1.56 (.73)**
Racial Inequality -.10 (.21) .49 (.29)* -.12 (.20) -.44 (.30) .25 (.29) -.52 (.16)***
Ethnic Inequality .14 (.16) .03 (.15) -.26 (.17) -.17 (.24) .03 (.14) -.04 (.14)
Black Residents -.09 (.25) .57 (.21)** -.14 (.25) .29 (.33) .74 (.18)*** -.32 (.20)
Controls
Referrals
Mid – Late Teen -.85 (.21)*** .54 (.26)** .41 (.23)*
Male .67 (.44) .11 (.46) .52 (.41)
Other Race -.33 (.16)** 1.45 (.48)*** .01 (.98)
Person .27 (.24) .23 (.24) .11 (.26)
Property .12 (.21) .28 (.22) -.11 (.24)
Community
Wealth 3.19 (1.46)** -1.87 (1.67) 3.11 (1.59)*
Youth -1.10 (1.08) .80 (1.07) -.33 (.90)
Northeast -38.28 (7.16)*** 19.88 (9.25)** 3.89 (7.55)
South -20.98 (6.51)*** -4.34 (5.89) 1.68 (6.89)
West -5.95 (7.57) -.50 (7.92) -12.24 (72.87)
Residential Mobility -1.2 (.35) .36 (.32) .08 (.45)
Urbanism .15 (.01) .16 (.01) .80 (.01)
R2: .53 .44 .46 .22 .28 .20
N: 169 93 76 101 66 163
Note: Estimations of non-linear effects of underclass poverty and racial inequality failed to produce statistically significant relationships with all three dependent
variables
a: Unstandardized coefficient, S.E. ( ); * p < .10, ** p < .05, *** p < . 01
This document is a research report submitted to the U.S. Department of Justice. This report has not been published by the Department. Opinions or points of view expressed are those of the author(s)
and do not necessarily reflect the official position or policies of the U.S. Department of Justice.
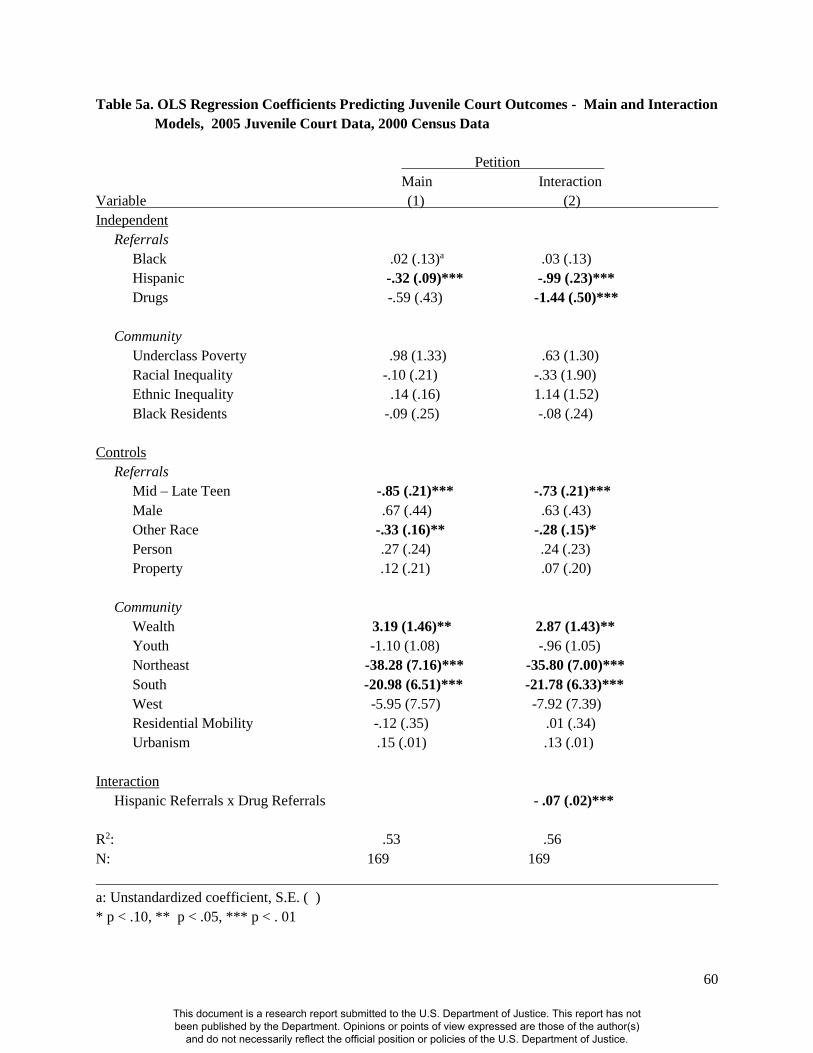
60
Table 5a. OLS Regression Coefficients Predicting Juvenile Court Outcomes - Main and Interaction
Models, 2005 Juvenile Court Data, 2000 Census Data
Petition
Main Interaction
Variable (1) (2)
Independent
Referrals
Black .02 (.13)a .03 (.13)
Hispanic -.32 (.09)*** -.99 (.23)***
Drugs -.59 (.43) -1.44 (.50)***
Community
Underclass Poverty .98 (1.33) .63 (1.30)
Racial Inequality -.10 (.21) -.33 (1.90)
Ethnic Inequality .14 (.16) 1.14 (1.52)
Black Residents -.09 (.25) -.08 (.24)
Controls
Referrals
Mid – Late Teen -.85 (.21)*** -.73 (.21)***
Male .67 (.44) .63 (.43)
Other Race -.33 (.16)** -.28 (.15)*
Person .27 (.24) .24 (.23)
Property .12 (.21) .07 (.20)
Community
Wealth 3.19 (1.46)** 2.87 (1.43)**
Youth -1.10 (1.08) -.96 (1.05)
Northeast -38.28 (7.16)*** -35.80 (7.00)***
South -20.98 (6.51)*** -21.78 (6.33)***
West -5.95 (7.57) -7.92 (7.39)
Residential Mobility -.12 (.35) .01 (.34)
Urbanism .15 (.01) .13 (.01)
Interaction
Hispanic Referrals x Drug Referrals - .07 (.02)***
R2: .53 .56
N: 169 169
a: Unstandardized coefficient, S.E. ( )
* p < .10, ** p < .05, *** p < . 01
This document is a research report submitted to the U.S. Department of Justice. This report has not been published by the Department. Opinions or points of view expressed are those of the author(s)
and do not necessarily reflect the official position or policies of the U.S. Department of Justice.
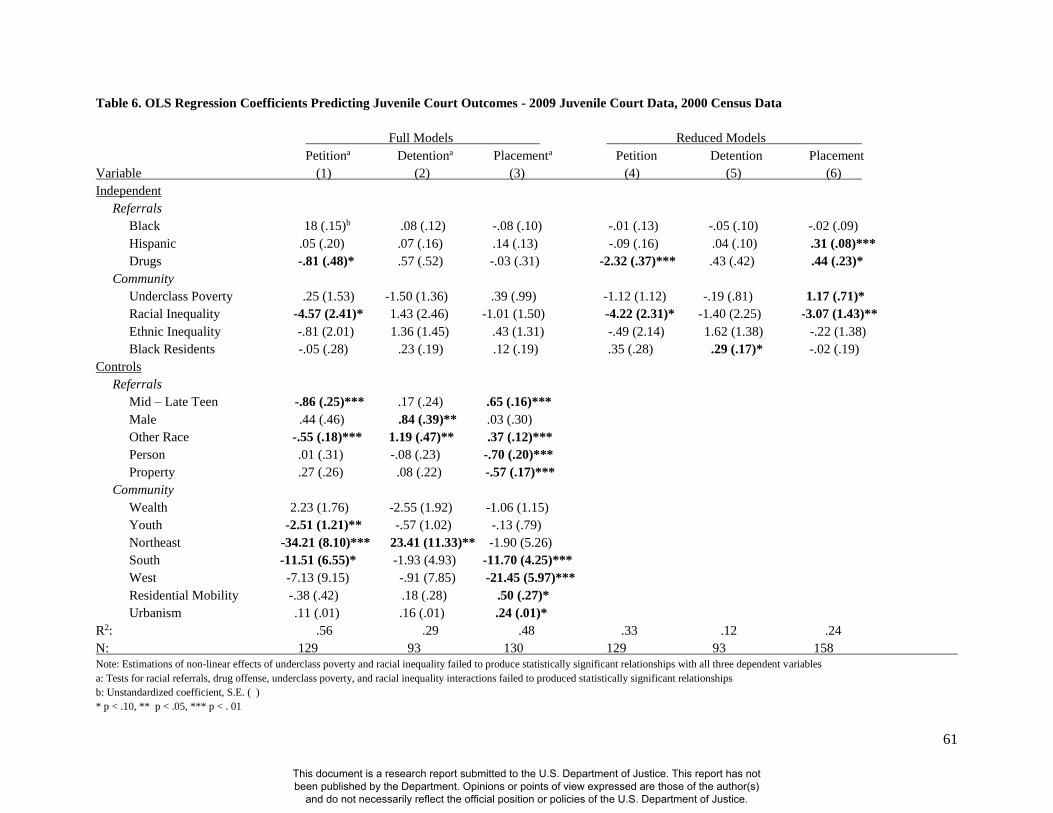
61
Table 6. OLS Regression Coefficients Predicting Juvenile Court Outcomes - 2009 Juvenile Court Data, 2000 Census Data
Full Models Reduced Models
Petitiona Detentiona Placementa Petition Detention Placement
Variable (1) (2) (3) (4) (5) (6)
Independent
Referrals
Black 18 (.15)b .08 (.12) -.08 (.10) -.01 (.13) -.05 (.10) -.02 (.09)
Hispanic .05 (.20) .07 (.16) .14 (.13) -.09 (.16) .04 (.10) .31 (.08)***
Drugs -.81 (.48)* .57 (.52) -.03 (.31) -2.32 (.37)*** .43 (.42) .44 (.23)*
Community
Underclass Poverty .25 (1.53) -1.50 (1.36) .39 (.99) -1.12 (1.12) -.19 (.81) 1.17 (.71)*
Racial Inequality -4.57 (2.41)* 1.43 (2.46) -1.01 (1.50) -4.22 (2.31)* -1.40 (2.25) -3.07 (1.43)**
Ethnic Inequality -.81 (2.01) 1.36 (1.45) .43 (1.31) -.49 (2.14) 1.62 (1.38) -.22 (1.38)
Black Residents -.05 (.28) .23 (.19) .12 (.19) .35 (.28) .29 (.17)* -.02 (.19)
Controls
Referrals
Mid – Late Teen -.86 (.25)*** .17 (.24) .65 (.16)***
Male .44 (.46) .84 (.39)** .03 (.30)
Other Race -.55 (.18)*** 1.19 (.47)** .37 (.12)***
Person .01 (.31) -.08 (.23) -.70 (.20)***
Property .27 (.26) .08 (.22) -.57 (.17)***
Community
Wealth 2.23 (1.76) -2.55 (1.92) -1.06 (1.15)
Youth -2.51 (1.21)** -.57 (1.02) -.13 (.79)
Northeast -34.21 (8.10)*** 23.41 (11.33)** -1.90 (5.26)
South -11.51 (6.55)* -1.93 (4.93) -11.70 (4.25)***
West -7.13 (9.15) -.91 (7.85) -21.45 (5.97)***
Residential Mobility -.38 (.42) .18 (.28) .50 (.27)*
Urbanism .11 (.01) .16 (.01) .24 (.01)*
R2: .56 .29 .48 .33 .12 .24
N: 129 93 130 129 93 158
Note: Estimations of non-linear effects of underclass poverty and racial inequality failed to produce statistically significant relationships with all three dependent variables
a: Tests for racial referrals, drug offense, underclass poverty, and racial inequality interactions failed to produced statistically significant relationships
b: Unstandardized coefficient, S.E. ( )
* p < .10, ** p < .05, *** p < . 01
This document is a research report submitted to the U.S. Department of Justice. This report has not been published by the Department. Opinions or points of view expressed are those of the author(s)
and do not necessarily reflect the official position or policies of the U.S. Department of Justice.
62
5.11 Summary
The present study was guided by Sampson and Laub’s (1993) macro-level inequality
perspective of social control and three hypotheses. The first hypothesis centered on the
expectations that underclass poverty and racial/ethnic inequality would predict social control
throughout juvenile justice proceedings. The second hypothesis predicted that counties
characterized by larger proportions of Black, Hispanic, and drug referrals will result in greater
social control in communities that evidence underclass poverty and racial/ethnic inequality. The
third hypothesis stated that changes in the level of social control will be contingent upon changes
in communities’ level of underclass poverty and racial/ethnic inequality. Up to this point in the
analyses, modest to minimal support has been found for the hypotheses.
Although macro-level variables were at times found to be determinants of social control
at each of the four time frames, the effects were sporadic (H1). In terms of whether social control
increased in counties with larger Black, Hispanic, and drug referrals, as well underclass poverty
and racial/ethnic inequality, the answer, for the most part, is no (H2). There are four exceptions
to this conclusion. A significant interaction was discovered involving the percent of Black
referrals and racial inequality with an increased level of detention in 1985. In addition, for the
same time frame, the percent of Black referrals interacted with detention to decrease the
proportion referrals receiving out-of-home placement. In 1995, the percent of Black referrals
jointly with the percent of drug referrals corresponded to an increase in petitions. The fourth
interaction effect involved the percent of Hispanic referrals and the percent of drug referrals with
a decrease in the percent of petitions. However, it is important to note that the lack of race effects
on social control with data from the 1980s and 1990s could be due to Hispanic youth being
labeled as White and/or Black youth. This limitation may distort, to some degree, the
This document is a research report submitted to the U.S. Department of Justice. This report has not been published by the Department. Opinions or points of view expressed are those of the author(s)
and do not necessarily reflect the official position or policies of the U.S. Department of Justice.
63
relationship between the proportion of Black youth on social control, and the overall proportion
of White youth that comprised the aggregated count of referrals within in each county.
Furthermore, due to very few statistically significant effects involving underclass poverty and
racial/ethnic inequality with the dependent variables (n=5) within each time frame, not much can
be said concerning the stability and/or fluctuation in social control as posited in the third
hypothesis. More specific, underclass poverty and racial/ethnic inequality do not appear to be
predictors of social control of youth in juvenile justice proceedings. This conclusion, however, is
based on results or non-results obtained from OLS regression conducted within each time frame.
To better assess the stability/fluctuation premise as stated in the third hypothesis, changes in the
effects over-time are examined.
5.12 Changes in Effects Over-Time
The third step in the analyses was to estimate OLS change models to understand how
changes in the independent variables over time may influence changes in the dependent variables
over time. Changes in the independent variables in referral data between 1985 and 1995 and U.S.
census data between 1980 and 1990 were used to predict changes in the dependent variables
from 1985 to 1995. Furthermore, changes in the independent variables in referral data between
1985 and 2005 and U.S. census data between 1980 and 2000 were used to predict changes in the
dependent variables from 1985 to 2005. Last, the procedure was repeated to estimate the
changes in the independent variables in referral data between 1985 and 2009 and U.S. census
data between 1980 and 2000 on the changes in court outcomes from 1985 to 2009. Recall that
Sampson and Laub (1993) discovered macro-level effects with social control using data for
1985. Thus, the earliest year (1985) compared to each of the three later time periods was
This document is a research report submitted to the U.S. Department of Justice. This report has not been published by the Department. Opinions or points of view expressed are those of the author(s)
and do not necessarily reflect the official position or policies of the U.S. Department of Justice.
64
anticipated to be most suitable to capture where the "most change" in terms of social control was
anticipated to be evident.
Table 7 presents the OLS regression coefficients predicting change in juvenile court
outcomes overtime. An examination of the results across each stage of petition (column 1),
detention (column 2), placement without detention (column 3), and placement with detention
(column 4), with change over time comparisons of change from 1985 to 2009 (Part A), change
from 1985 to 2005 (Part B), and change from 1985 to 1995 (Part C) reveals, with a few
exceptions, stability in the effects rather than fluctuation or change. The few exceptions involve
decision- making at the earlier stages of petition and detention within the juvenile justice system.
In communities with higher racial inequality from 1985 to 1995, 1985 to 2005, and 1985 to
2009, resulted in less social control as measured by the change in percent petitioned referrals
between 1985 and 1995, 1985 and 2005, and 1985 and 2009 (column 1). Another exception
reported in column 1 is that an increase in drug referrals from 1985 to 1995 corresponds to an
increase in petitions from 1985 to 1995. The final exception is at detention where an inverse
relationship exists between the percent Black referrals and decision making at this stage when
the effects for 2005 are compare to 1985. In other words, an increase in the proportion of Black
referrals from 1985 to 2005 results in a decrease in detention from 1985 to 2005. Thus,
nonsupport is provided for the third hypothesis (H3).
Table 7 – Next Page
This document is a research report submitted to the U.S. Department of Justice. This report has not been published by the Department. Opinions or points of view expressed are those of the author(s)
and do not necessarily reflect the official position or policies of the U.S. Department of Justice.

65
Table 7. OLS Regression Coefficients Predicting Change in Juvenile Court Outcomes Over Time (N = 48)
Petition Detention Placement Placement
Variable (1) (2) (3) (4)
Part A: Change from 1985 to 2009
Referrals
Black -.10 (.30) -.78 (.21) -.08 (.09) -.05 (.09)
Drugs -.73 (.74) .04 (.52) .31 (.22) .30 (.22)
Detention .09 (.07)
Community
Underclass Poverty 1.44 (2.79) .54 (1.97) .77 (.84) .73 (.84)
Racial Inequality -13.11 (6.15)** -7.74 (4.34) -.57 (1.86) .11 (1.91)
R2: .10 .12 .07 .11
Part B: Change from 1985 to 2005
Referrals
Black -.16 (.32) -.55 (.21)*** -.13 (.15) -.07 (.16)
Drugs .70 (1.06) .43 (.67) -.19 (.48) -.23 (.48)
Detention .10 (.11)
Community
Underclass Poverty 4.65 (2.94) -1.50 (1.87) -.57 (1.33) -.42 (1.34)
Racial Inequality -17.48 (6.80)** -3.382 (4.32) 3.37 (3.61) 3.71 (3.10)
R2: .15 .22 .06 .08
Part C: Change from 1985 to 1995
Referrals
Black .14 (.34) -.11 (.17) -.02 (.13) -.01 (.14)
Drugs 2.10 (.84)** .55 (.43) .10 (.33) .06 (.34)
Detention .07 (.11)
Community
Underclass Poverty 2.88 (3.90) 2.32 (1.99) .70 (1.54) .54 (1.57)
Racial Inequality -7.90 (4.63)* -2.79 (2.36) 2.67 (1.83) 2.86 (1.87)
R2: .16 .07 .08 .09
Note: Due to issues with missing data, only 48 counties had complete data across all variables and years to permit inclusion in each model
a: Unstandardized coefficient, S.E. ( ); * p < .10, ** p < .05, *** p < . 01
This document is a research report submitted to the U.S. Department of Justice. This report has not been published by the Department. Opinions or points of view expressed are those of the author(s)
and do not necessarily reflect the official position or policies of the U.S. Department of Justice.
66
VI. COUNTY-LEVEL DATA AND INDIVIDUAL-LEVEL DATA
Recall that individual-level data was also obtained for all delinquent referrals in a
Northeast state from January 2000 through December 2010. The decision to include these data
in additional analyses was to provide a more in-depth examination of Sampson and Laub’s
(1993) perspective to explain the social control of youth and especially minority youth and those
involved in drug offending in juvenile justice proceedings. The sections that follow detail the
sample, variables and analysis procedures for data pertaining to the Northeast state.
6.1 Data and Sample
Individual-level data was also provided by the National Juvenile Court Archive (NJCDA)
located at the National Center for Juvenile Justice (NCJJ). All delinquent referrals in a Northeast
state from January 2000 through December 2010 (n = 302, 531) comprise the sample.
6.2 Case Variables
The operationalization and distributions of both individual and county-level variables are
presented in Table 8. Race and ethnicity were coded to differentiate between White, Black, and
Hispanic youth, with Whites constituting as the reference group. Fifty-two percent of the sample
were White, 39% were Black, and 9% were Hispanic. Drug offenses (0 = no, 1 = yes) were
captured by a dummy variable that represented different types of offenses. Drug offenses
represented 18% of all offenses. To demonstrate that interactions between race/ethnicity and
drug offenses provided enough statistical power to produce meaningful results, Table 8 also
shows the number and proportion of all race/ethnicity and drug offenses subgroups. Fifty-three
percent of all drug offenders were White, 38% were Black, and 9% were Hispanic. This
proportion mirrors the overall racial and ethnic representation of all delinquent referrals.
This document is a research report submitted to the U.S. Department of Justice. This report has not been published by the Department. Opinions or points of view expressed are those of the author(s)
and do not necessarily reflect the official position or policies of the U.S. Department of Justice.
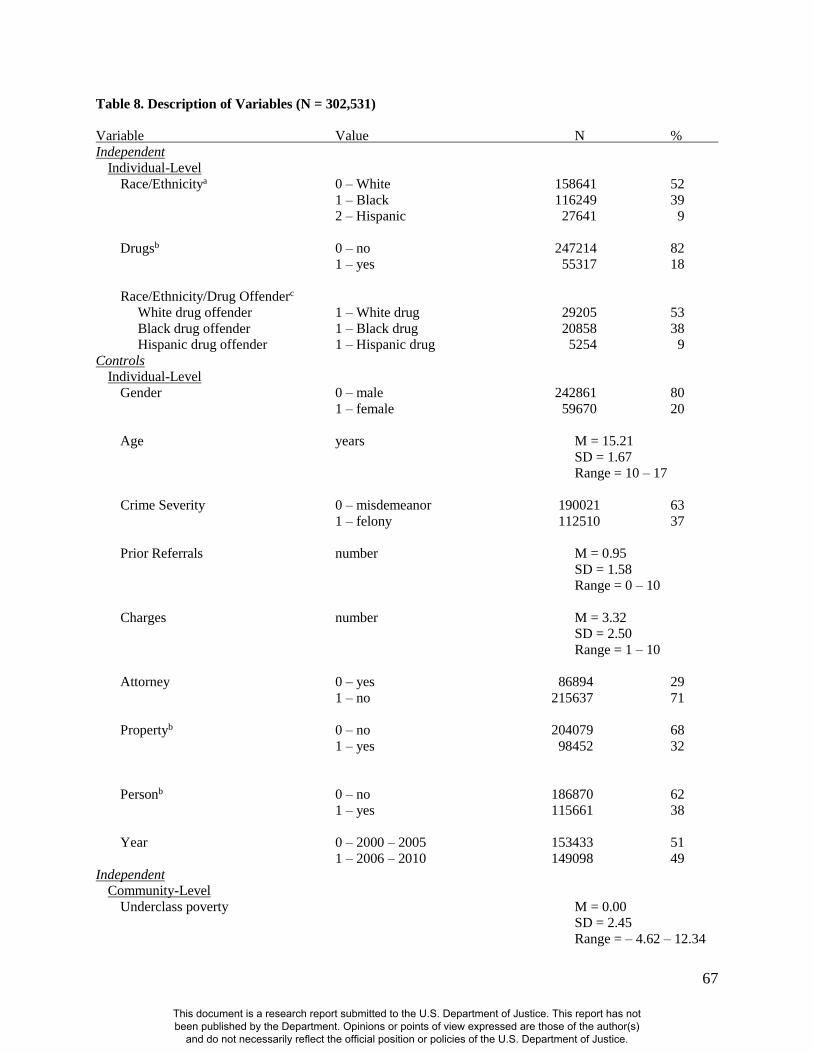
67
Table 8. Description of Variables (N = 302,531)
Variable Value N %
Independent Individual-Level
Race/Ethnicitya 0 – White 158641 52
1 – Black 116249 39
2 – Hispanic 27641 9
Drugsb 0 – no 247214 82
1 – yes 55317 18
Race/Ethnicity/Drug Offenderc
White drug offender 1 – White drug 29205 53
Black drug offender 1 – Black drug 20858 38
Hispanic drug offender 1 – Hispanic drug 5254 9
Controls
Individual-Level
Gender 0 – male 242861 80
1 – female 59670 20
Age years M = 15.21
SD = 1.67
Range = 10 – 17
Crime Severity 0 – misdemeanor 190021 63
1 – felony 112510 37
Prior Referrals number M = 0.95
SD = 1.58
Range = 0 – 10
Charges number M = 3.32
SD = 2.50
Range = 1 – 10
Attorney 0 – yes 86894 29
1 – no 215637 71
Propertyb 0 – no 204079 68
1 – yes 98452 32
Personb 0 – no 186870 62
1 – yes 115661 38
Year 0 – 2000 – 2005 153433 51
1 – 2006 – 2010 149098 49
Independent Community-Level
Underclass poverty M = 0.00
SD = 2.45
Range = – 4.62 – 12.34
This document is a research report submitted to the U.S. Department of Justice. This report has not been published by the Department. Opinions or points of view expressed are those of the author(s)
and do not necessarily reflect the official position or policies of the U.S. Department of Justice.
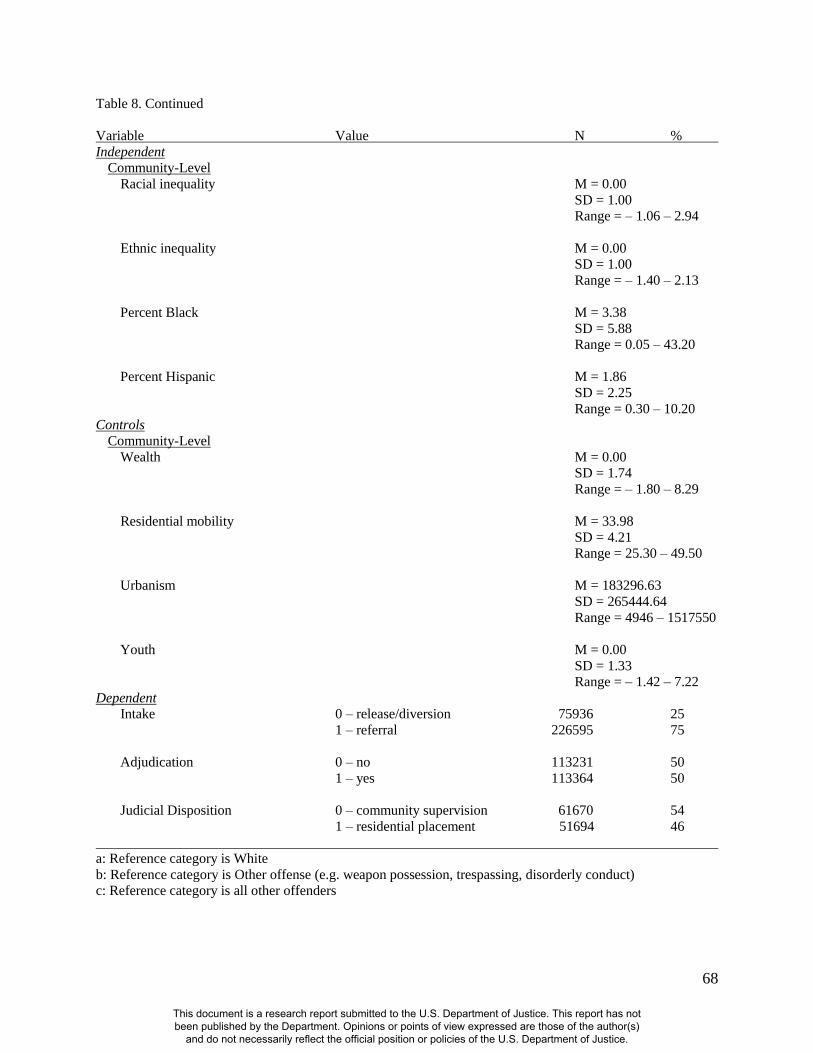
68
Table 8. Continued
Variable Value N %
Independent Community-Level
Racial inequality M = 0.00
SD = 1.00
Range = – 1.06 – 2.94
Ethnic inequality M = 0.00
SD = 1.00
Range = – 1.40 – 2.13
Percent Black M = 3.38
SD = 5.88
Range = 0.05 – 43.20
Percent Hispanic M = 1.86
SD = 2.25
Range = 0.30 – 10.20
Controls
Community-Level
Wealth M = 0.00
SD = 1.74
Range = – 1.80 – 8.29
Residential mobility M = 33.98
SD = 4.21
Range = 25.30 – 49.50
Urbanism M = 183296.63
SD = 265444.64
Range = 4946 – 1517550
Youth M = 0.00
SD = 1.33
Range = – 1.42 – 7.22
Dependent Intake 0 – release/diversion 75936 25
1 – referral 226595 75
Adjudication 0 – no 113231 50
1 – yes 113364 50
Judicial Disposition 0 – community supervision 61670 54
1 – residential placement 51694 46
a: Reference category is White
b: Reference category is Other offense (e.g. weapon possession, trespassing, disorderly conduct)
c: Reference category is all other offenders
This document is a research report submitted to the U.S. Department of Justice. This report has not been published by the Department. Opinions or points of view expressed are those of the author(s)
and do not necessarily reflect the official position or policies of the U.S. Department of Justice.
69
Numerous individual-level control variables were also taken into consideration.
Demographic variables included gender and age. Gender was coded to differentiate between
males (80%) and females (20%), while age was coded in years. The average referral was 15
years old. In addition, various legal factors were included as controls: crime severity (0 =
misdemeanor, 1 = felony), number of prior referrals, number of current charges, and if the
youth was represented by an attorney (0 = no, 1 = yes). Property (0 = no, 1 = yes) and person (0
= no, 1 = yes) offenses represented the other two offense type dummy variables, with Other
offenses constituting the reference group. On average, a delinquent referral was a misdemeanor
offense, 0.95 prior referrals, 3.32 current charges, did not have an attorney present throughout
court hearings, and committed a property offense.
It is important to note that the number of prior referrals could only be constructed starting
in 2000. This variable can be considered more of a conservative measure, considering that there
may be referrals in the sample that were referred to the juvenile court prior to 2000. In addition, a
variable was also constructed to control for referral year (0 = 2000-2005, 1 = 2006-2010). Fifty-
one percent of all referrals occurred between 2000-2005. Ten dummy variables were also
constructed to represented referral year, with 2000 representing the reference category.
Regression analyses produced similar results with the inclusion of the 10 variables to represent
referral year, or the single variable that represented referral year. To increase parsimony in each
statistical model, only the regression equation with the single variable of referral year will be
presented in each table.
6.3 Contextual Variables
The contextual variables of interest include the same constructed indices and individual
measures that were included in the aggregated 30-year data described earlier (see Appendix 1).
This document is a research report submitted to the U.S. Department of Justice. This report has not been published by the Department. Opinions or points of view expressed are those of the author(s)
and do not necessarily reflect the official position or policies of the U.S. Department of Justice.
70
Data was collected from the 2000 U.S. census from each of the 67 counties in the Northeast state
and include measures of underclass poverty (α = .91), racial inequality, and ethnic inequality.
For the underclass poverty index, results from a principle components analysis (PCA) revealed a
one-factor solution that accounted for 48% of the variance, with an eigenvalue of 1.43. In
addition, the proportion of Black residents within each county and proportion of Hispanic
residents were included as county-level variables of interest. Various county-level variables were
also included as controls and mirror the earlier macro-level measures described earlier in the
report. Indicators of county-level wealth, residential mobility, urbanism, and density of youth
were included in each regression analysis.
6.4 Dependent Variables
Decision-making was predicted at three processing junctures: intake, adjudication and
judicial disposition. Each of the three court stages constitutes the dependent variable. The intake
stage was coded to differentiate between youth who were released or diverted from the juvenile
justice system (coded as 0) versus those who received an intake referral and were referred on for
further court proceedings (coded as 1). Seventy-five percent of youth referred to the juvenile
court received an intake referral. Adjudication was differentiated by youth who were not
adjudicated guilty (coded as 0) compared to those who were adjudicated guilty (coded as 1).
Fifty percent of youth who made it to the adjudications stage were subsequently adjudicated
guilty. The final stage, judicial disposition, differentiated between youth who received
community sanctions (coded as 0) versus those who were sentenced to residential or out-of-home
placement (coded as 1). Fifty-four percent of youth at judicial disposition received community
sanctions, compared to 46% of youth who were placed outside of the home.
This document is a research report submitted to the U.S. Department of Justice. This report has not been published by the Department. Opinions or points of view expressed are those of the author(s)
and do not necessarily reflect the official position or policies of the U.S. Department of Justice.
71
6.5 Analytic Procedures
Since the data provided from the Northeast state comprises individual referrals compared
to the other data that is aggregated counts of individual referrals in 172 counties, a different
analytic procedure is needed to analyze over 300,000 referrals within 67 counties. Due to the
nested nature of the data that includes juveniles residing within counties, a 2-level hierarchical
linear (HL) structure and hierarchical linear modeling (HLM) was used to analyze the data. HLM
is favorable over the traditional regression techniques utilized when analyzing the 30-year data
of 172 counties because HLM is able to estimate the amount of variation of both the individual
(level-1) and county (level-2) measures at the same time (Bryk & Raudenbush, 1992).
Since each of the dependent variables have binary outcomes, hierarchical generalized
linear modeling (HGLM) were used to assess the effect of individual (Level-1) and community
level (Level-2) data on each court outcome (Raudenbush & Bryk, 2002). HGLM models mirror
the log odds coefficients produced in binary logistic regression equations (Armstrong &
Rodriguez, 2005). Where significant log odds are reported, the coefficients were converted into
odds ratios when discussing the results. Following prior research (e.g. Freiburger & Jordan,
2011; Rodriguez, 2010), grand mean centering was used on all level-1 predictors. Grand mean-
centering assesses the effect of unrestrained county-level characteristics (level-2) on court
outcomes while controlling for all level-1 measures (Luke, 2004).
To answer the research questions, the analysis procedure will include several steps. Each
of these steps was conducted for each of the dependent variables (intake, adjudication, and
judicial disposition). First, an intercept-only, unconditional model was estimated to determine if
the mean rate of each dependent variable varied across counties. The results of each model (not
shown) were significant and confirmed the use of multi-level models. Second, the community-
This document is a research report submitted to the U.S. Department of Justice. This report has not been published by the Department. Opinions or points of view expressed are those of the author(s)
and do not necessarily reflect the official position or policies of the U.S. Department of Justice.
72
level variables (Level-2) were included in the model to estimate the effect of county-level
measures on each dependent variable.
Third, all individual-level measures (Level-1) were included in the model to assess the
effect of offender and offense characteristics on the court outcome while controlling for
community-level characteristics. Fourth, an interaction term between the race/ethnicity of the
offender and drug crimes were predicted to see if being a Black or Hispanic drug offender
received disadvantaged court outcomes compared to other types of offenders. Fifth, cross-level
interactions between a youth’s race/ethnicity, drug offenses, and community-level variables of
interest were estimated to understand how youth of specifically racial and ethnic backgrounds
(with and without drug offenses) are treated within counties characterized by underclass poverty,
racial inequality, ethnic inequality, and the percent of Black and Hispanic residents within
counties (e.g. Black x Underclass Poverty, Hispanic x Drugs x Ethnic Inequality).
Also important, Heckman’s (1974, 1976) two-stage analytic procedure was employed at
the stage of judicial disposition to create a hazard rate as an additional predictor at the sentencing
stage. The addition of the hazard rate when predicting judicial disposition corrects for potential
sample selection bias from the stage of adjudication to judicial disposition. However, including
the hazard rate has the potential to introduce multicollinearity and bias parameter estimates.
Multicollinearity diagnostics in the form of VIF and tolerance statistics confirmed the use of the
hazard rate (VIF = 2.28, tolerance = .438) at judicial disposition. None of the other variables had
a VIF larger than 3.71 or a tolerance less than .269 (property offenses). Although not shown,
models were re-estimated without the hazard rate and the results parallel those reported with the
inclusion of the hazard rate.
This document is a research report submitted to the U.S. Department of Justice. This report has not been published by the Department. Opinions or points of view expressed are those of the author(s)
and do not necessarily reflect the official position or policies of the U.S. Department of Justice.
73
6.6 Results
Table 9 presents the HGLM results for decision making at intake. Column 1 represents the
findings involving the community-level data with the dependent variable. Column 2 provides
the results with both the community-level (Level-2) data and the individual-level (Level-1) data
with intake decision-making. Column 3 and Column 4 details the models involving the
Black/Drug and Hispanic/Drug interaction effects. The discuss will first focus on the results for
the additive full model, followed by a discussion of the interaction models.
As can be seen in column 2 of Table 9, of the nine community-level variables, percent
Black and percent Hispanic have positive statistically significant relationships with decision-
making at intake. None of the community-level control variables significant predict the mean
rate of intake. At the individual level, neither being a Black, Hispanic, or drug offender is a
predictor of the dependent variable. As shown on column 2, older youth, those with more prior
referrals, and were referred to the juvenile court between 2005-2010 have a lower odds of the
more severe outcome at intake, while youth charged with a felony is positively related to the
intake outcome compared to those charged with a misdemeanor offense. Tests for the presence
of a joint relationship involving Blacks and Drugs and Hispanic and Drugs with intake outcomes,
however, produced one statistically significant effect. Specifically, Black youth who are charged
with a drug offense have greater odds of being referred on for further court proceedings at intake.
Table 9 – Next Page
This document is a research report submitted to the U.S. Department of Justice. This report has not been published by the Department. Opinions or points of view expressed are those of the author(s)
and do not necessarily reflect the official position or policies of the U.S. Department of Justice.
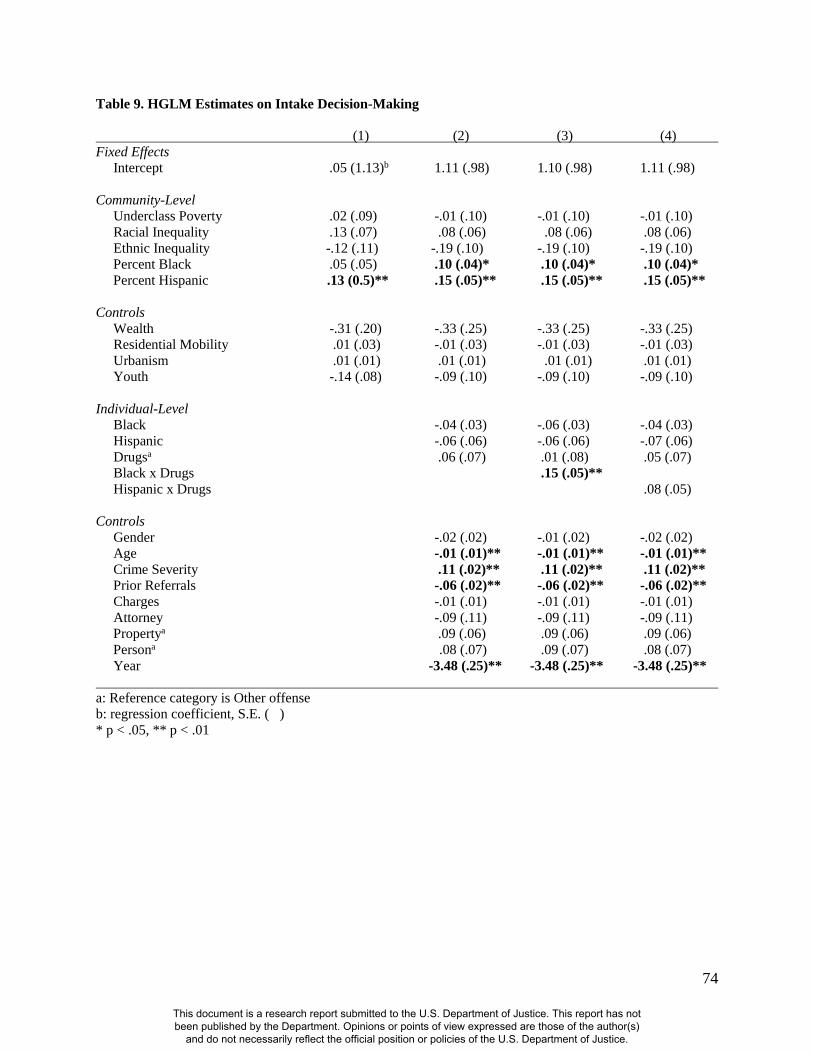
74
Table 9. HGLM Estimates on Intake Decision-Making
(1) (2) (3) (4)
Fixed Effects Intercept .05 (1.13)b 1.11 (.98) 1.10 (.98) 1.11 (.98)
Community-Level Underclass Poverty .02 (.09) -.01 (.10) -.01 (.10) -.01 (.10)
Racial Inequality .13 (.07) .08 (.06) .08 (.06) .08 (.06)
Ethnic Inequality -.12 (.11) -.19 (.10) -.19 (.10) -.19 (.10)
Percent Black .05 (.05) .10 (.04)* .10 (.04)* .10 (.04)*
Percent Hispanic .13 (0.5)** .15 (.05)** .15 (.05)** .15 (.05)**
Controls
Wealth -.31 (.20) -.33 (.25) -.33 (.25) -.33 (.25)
Residential Mobility .01 (.03) -.01 (.03) -.01 (.03) -.01 (.03)
Urbanism .01 (.01) .01 (.01) .01 (.01) .01 (.01)
Youth -.14 (.08) -.09 (.10) -.09 (.10) -.09 (.10)
Individual-Level Black -.04 (.03) -.06 (.03) -.04 (.03)
Hispanic -.06 (.06) -.06 (.06) -.07 (.06)
Drugsa .06 (.07) .01 (.08) .05 (.07)
Black x Drugs .15 (.05)**
Hispanic x Drugs .08 (.05)
Controls
Gender -.02 (.02) -.01 (.02) -.02 (.02)
Age -.01 (.01)** -.01 (.01)** -.01 (.01)**
Crime Severity .11 (.02)** .11 (.02)** .11 (.02)**
Prior Referrals -.06 (.02)** -.06 (.02)** -.06 (.02)**
Charges -.01 (.01) -.01 (.01) -.01 (.01)
Attorney -.09 (.11) -.09 (.11) -.09 (.11)
Propertya .09 (.06) .09 (.06) .09 (.06)
Persona .08 (.07) .09 (.07) .08 (.07)
Year -3.48 (.25)** -3.48 (.25)** -3.48 (.25)**
a: Reference category is Other offense
b: regression coefficient, S.E. ( )
* p < .05, ** p < .01
This document is a research report submitted to the U.S. Department of Justice. This report has not been published by the Department. Opinions or points of view expressed are those of the author(s)
and do not necessarily reflect the official position or policies of the U.S. Department of Justice.
75
The HGLM results for adjudication decision making are detailed in Table 10. Although
the percentage of Black residents was initially a statistically significant determinant of the
dependent variable (column 1) when only accounting for community characteristics, the effect
disappeared once the individual-level data was included in the model. In fact, not one of the
central community-level variables is a significant predictor of the adjudication decision (column
2). Counties characterized by urbanism have lower odds of adjudicating youth, while counties
with a large density of youth have greater odds of adjudicating juveniles (column 2). At the
individual-level, being Hispanic has a positive statistically significant relationship with the
chances of being adjudicated (odds ratio = 1.17). Being Black or a drug offender has no effect on
the likelihood of adjudication (column 2). Males, youth charged with a felony, have a prior
record, a greater number of charges, are represented by legal counsel, and were referred to the
court between 2000-2004 have a greater odds of adjudication (column 2). A combination
interaction effect does exist between being a Hispanic and a drug offender in that the odds ratio
of being adjudicated for a Hispanic drug offender is 1.22 (column 4).
Table 11 presents the findings for decision-making at judicial disposition. Of the central
community characteristics, only racial inequality is a statistically significant predictor of the
dependent variable (column 2). Contrary to expectations, the effect is inverse rather than
positive. Counties characterized by racial inequality negatively affected the mean rate of judicial
disposition. In particular, counties with greater levels of racial inequality have a lower odds of
sentencing youth to residential placement (odds ratio = 0.82). Counties characterized by a greater
density of youth have lower odds of youth receiving residential placement (column 2). At the
individual-level while controlling for community characteristics, the log odds of receiving out-
of-home placement for Blacks and Hispanics are greater compared to Whites (column 2). Both
This document is a research report submitted to the U.S. Department of Justice. This report has not been published by the Department. Opinions or points of view expressed are those of the author(s)
and do not necessarily reflect the official position or policies of the U.S. Department of Justice.
76
of these effects appear to be tempered by being charged with a drug offense (column 3, column
4) in that the odds ratios of residential placement for Black and Hispanic drug offenders are 1.22.
In terms of the control variables, being female and an older youth have a significant inverse
effect with the disposition outcome. Youth charged with a felony, have a greater number of prior
referrals, a greater number of charges, and are represented by legal counsel have a greater log
odds of receiving residential placement.
Table 10 and Table 11 – Next Page
This document is a research report submitted to the U.S. Department of Justice. This report has not been published by the Department. Opinions or points of view expressed are those of the author(s)
and do not necessarily reflect the official position or policies of the U.S. Department of Justice.

77
Table 10. HGLM Estimates on Adjudication Decision-Making
(1) (2) (3) (4)
Fixed Effects Intercept .17 (1.04)b .45 (1.51) .44 (1.51) .45 (1.51)
Community-Level Underclass Poverty -.04 (.07) -.01 (.10) -.01 (.10) -.01 (.10)
Racial Inequality -.11 (.09) -.11 (.10) -.11 (.10) -.11 (.10)
Ethnic Inequality .02 (.10) .10 (.12) .10 (.12) .10 (.12)
Percent Black .08 (.04)* .06 (.04) .06 (.04) .06 (.04)
Percent Hispanic -.03 (.06) -.10 (.07) -.10 (.07) -.10 (.07)
Controls
Wealth .30 (.14)* .38 (.21) .38 (.21) .38 (.21)
Residential Mobility .01 (.03) .02 (.04) .02 (.04) .02 (.04)
Urbanism -.01 (.01)** -.01 (.01)** -.01 (.01)** -.01 (.01)**
Youth .19 (.06)** .18 (.09)* .18 (.09)* .18 (.09)*
Individual-Level Black .08 (.04) .06 (.05) .08 (.04) *
Hispanic .16 (.03)** .16 (.02)** .12 (.02)**
Drugsa .20 (.14) .14 (.12) .18 (.14)
Black x Drugs .13 (.12)
Hispanic x Drugs .20 (.06)**
Controls
Gender -.25 (.08)** -.25 (.08)** -.25 (.08)**
Age .01 (.01) .01 (.01) -.01 (.01)
Crime Severity .28 (.06)** .28 (.06)** .27 (.06)**
Prior Referrals .23 (.03)** .23 (.03)** .23 (.03)**
Charges .05 (.01)** .05 (.01)** .05 (.01)**
Attorney 2.43 (.22)** 2.42 (.22)** 2.43 (.22)**
Propertya .08 (.11) .08 (.11) .08 (.11)
Persona .05 (.15) .06 (.16) .05 (.15
Year -.48 (.10)** -.48 (.10)** -.48 (.10)**
a: Reference category is Other offense
b: regression coefficient, S.E. ( )
* p < .05, ** p < .01
This document is a research report submitted to the U.S. Department of Justice. This report has not been published by the Department. Opinions or points of view expressed are those of the author(s)
and do not necessarily reflect the official position or policies of the U.S. Department of Justice.
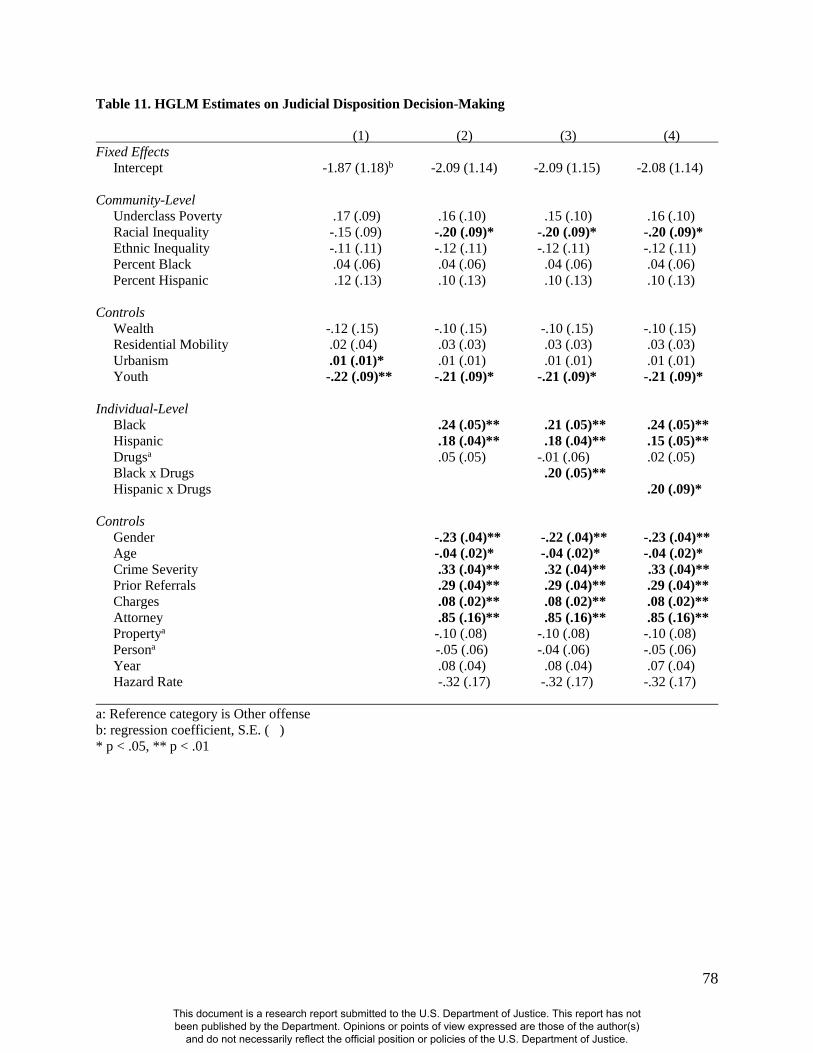
78
Table 11. HGLM Estimates on Judicial Disposition Decision-Making
(1) (2) (3) (4)
Fixed Effects Intercept -1.87 (1.18)b -2.09 (1.14) -2.09 (1.15) -2.08 (1.14)
Community-Level Underclass Poverty .17 (.09) .16 (.10) .15 (.10) .16 (.10)
Racial Inequality -.15 (.09) -.20 (.09)* -.20 (.09)* -.20 (.09)*
Ethnic Inequality -.11 (.11) -.12 (.11) -.12 (.11) -.12 (.11)
Percent Black .04 (.06) .04 (.06) .04 (.06) .04 (.06)
Percent Hispanic .12 (.13) .10 (.13) .10 (.13) .10 (.13)
Controls
Wealth -.12 (.15) -.10 (.15) -.10 (.15) -.10 (.15)
Residential Mobility .02 (.04) .03 (.03) .03 (.03) .03 (.03)
Urbanism .01 (.01)* .01 (.01) .01 (.01) .01 (.01)
Youth -.22 (.09)** -.21 (.09)* -.21 (.09)* -.21 (.09)*
Individual-Level Black .24 (.05)** .21 (.05)** .24 (.05)**
Hispanic .18 (.04)** .18 (.04)** .15 (.05)**
Drugsa .05 (.05) -.01 (.06) .02 (.05)
Black x Drugs .20 (.05)**
Hispanic x Drugs .20 (.09)*
Controls
Gender -.23 (.04)** -.22 (.04)** -.23 (.04)**
Age -.04 (.02)* -.04 (.02)* -.04 (.02)*
Crime Severity .33 (.04)** .32 (.04)** .33 (.04)**
Prior Referrals .29 (.04)** .29 (.04)** .29 (.04)**
Charges .08 (.02)** .08 (.02)** .08 (.02)**
Attorney .85 (.16)** .85 (.16)** .85 (.16)**
Propertya -.10 (.08) -.10 (.08) -.10 (.08)
Persona -.05 (.06) -.04 (.06) -.05 (.06)
Year .08 (.04) .08 (.04) .07 (.04)
Hazard Rate -.32 (.17) -.32 (.17) -.32 (.17)
a: Reference category is Other offense
b: regression coefficient, S.E. ( )
* p < .05, ** p < .01
This document is a research report submitted to the U.S. Department of Justice. This report has not been published by the Department. Opinions or points of view expressed are those of the author(s)
and do not necessarily reflect the official position or policies of the U.S. Department of Justice.
79
6.7 Results Involving Cross-Level Interactions
Table 12 provides the results from estimating cross-level interactions between individual-
level (Level-1) and community-level (Level-2) measures with decision-making at intake,
adjudication, and disposition. At intake, being a drug offender and processed in communities
characterized by: underclass poverty, ethnic inequality or a larger percent of Hispanics increases
the odds of receiving a severe outcome (column1). In other words, drug offenders who reside in
counties with underclass poverty, ethnic inequality, and a large proportion of Hispanic residents
have greater log odds of receiving an intake referral, respectively. Tests also produced a three-
way interaction between Hispanic youth, drug offending, and ethnic inequality (column 1). That
is, Hispanic drug offenders who reside in counties with greater ethnic inequality have greater log
odds of being referred for further court proceedings at intake.
At adjudication, Black drug offenders who reside in communities evidencing a larger
proportion of Black residents have lower logged odds of being adjudicated guilty (column 2).
Further, Hispanic drug offenders who come from communities with a larger percentage of
Hispanic residents results in a greater log odds (odds ratio = 1.03) of being adjudicated (column
2). In regards to judicial disposition, two inverse cross-level interactions between the individual-
level and community-level exist at this specific stage (column 3). Hispanic youth who reside in
counties characterized by ethnic inequality have lower log odds of being sentenced to out-of-
home placement. Likewise, counties characterized by underclass poverty were less likely to
sentence Black drug offenders to the more severe outcome at judicial disposition.
Table 12 – Next Page
This document is a research report submitted to the U.S. Department of Justice. This report has not been published by the Department. Opinions or points of view expressed are those of the author(s)
and do not necessarily reflect the official position or policies of the U.S. Department of Justice.
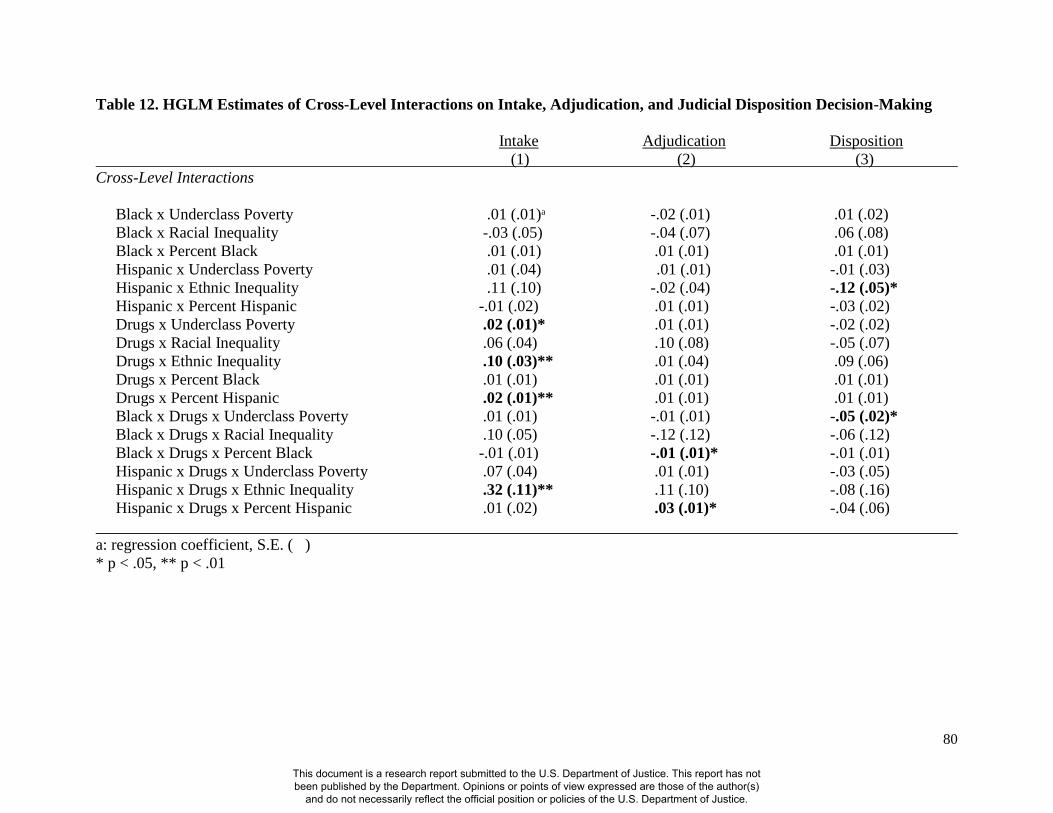
80
Table 12. HGLM Estimates of Cross-Level Interactions on Intake, Adjudication, and Judicial Disposition Decision-Making
Intake Adjudication Disposition
(1) (2) (3)
Cross-Level Interactions
Black x Underclass Poverty .01 (.01)a -.02 (.01) .01 (.02)
Black x Racial Inequality -.03 (.05) -.04 (.07) .06 (.08)
Black x Percent Black .01 (.01) .01 (.01) .01 (.01)
Hispanic x Underclass Poverty .01 (.04) .01 (.01) -.01 (.03)
Hispanic x Ethnic Inequality .11 (.10) -.02 (.04) -.12 (.05)*
Hispanic x Percent Hispanic -.01 (.02) .01 (.01) -.03 (.02)
Drugs x Underclass Poverty .02 (.01)* .01 (.01) -.02 (.02)
Drugs x Racial Inequality .06 (.04) .10 (.08) -.05 (.07)
Drugs x Ethnic Inequality .10 (.03)** .01 (.04) .09 (.06)
Drugs x Percent Black .01 (.01) .01 (.01) .01 (.01)
Drugs x Percent Hispanic .02 (.01)** .01 (.01) .01 (.01)
Black x Drugs x Underclass Poverty .01 (.01) -.01 (.01) -.05 (.02)*
Black x Drugs x Racial Inequality .10 (.05) -.12 (.12) -.06 (.12)
Black x Drugs x Percent Black -.01 (.01) -.01 (.01)* -.01 (.01)
Hispanic x Drugs x Underclass Poverty .07 (.04) .01 (.01) -.03 (.05)
Hispanic x Drugs x Ethnic Inequality .32 (.11)** .11 (.10) -.08 (.16)
Hispanic x Drugs x Percent Hispanic .01 (.02) .03 (.01)* -.04 (.06)
a: regression coefficient, S.E. ( )
* p < .05, ** p < .01
This document is a research report submitted to the U.S. Department of Justice. This report has not been published by the Department. Opinions or points of view expressed are those of the author(s)
and do not necessarily reflect the official position or policies of the U.S. Department of Justice.
81
6.8 Summary
Using various HGLM models to predict case outcomes in 67 counties in a northeast state,
the results involving the additive or main models in many ways parallel those reported using
OLS regression and the count-level data. That is, the macro-level variables of interest, and in
particular, underclass poverty and racial/ethnic inequality, were most often not statistically
significant determinants of social control. Estimations of cross-level interactions between the
community-level variables (underclass poverty, racial/ethnic inequality, percent Black/Hispanic),
and the individual-level variables (Black, Hispanic, drug offenses) yielded eight significant
relationships with social control. These joint relationships, however, sometimes involved less
social control rather than increased social control.
In communities characterized by underclass poverty, racial inequality or a large Hispanic
population, drug offenders received severe intake outcomes at intake. Hispanic drug offenders
who reside in communities with greater ethnic inequality were also found to receive greater
social control at this stage. At adjudication, Hispanic drug offenders were more likely to be
adjudicated in communities with a larger Hispanic population. Three other joint relationships
between community characteristics and race/ethnicity and drug offending show evidence of less
social control. Black drug offenders were less likely to be adjudicated in communities with a
larger Black population. In communities characterized by underclass poverty, Black drug
offenders were less likely to receive a disposition of out-of-home placement. Last, Hispanic
youth who live in communities characterized by ethnic inequality were more likely to receive an
outcome of community-based corrections than out-of-home placement at judicial disposition.
At the individual-level, Black drug offenders received more social control at intake than
other offenders. Blacks, Hispanics, and in particular, Hispanic drug offenders were more likely
This document is a research report submitted to the U.S. Department of Justice. This report has not been published by the Department. Opinions or points of view expressed are those of the author(s)
and do not necessarily reflect the official position or policies of the U.S. Department of Justice.
82
to be adjudicated once all controls were considered. At judicial disposition, Blacks and
Hispanics are likely to receive out-home-placement and these effects are enhanced if both
minority groups were charged with a drug offense. In regards to the individual-level control
variables, legal factors (e.g. crime severity, prior record, charges, and attorney) at the stages of
adjudication and disposition consistently resulted in greater social control for youth.
In summary, although modest, some support is offered for the expectation that macro-
level county characteristics predict juvenile court outcomes (H1). Furthermore, these effects
temper the treatment of drug offenders and to a much lesser degree, Blacks, Hispanics, and
Black/Hispanic drug offenders. Similar to the results from using the aggregate count data, the
percent racial/ethnic makeup of a community was at times predictive of social control. In
addition, race/ethnicity alone and combination with drug offending influenced case outcomes
depending on the stage examined. Last, the overall effects sometimes involved increased and
decreased social control and the relationships vary by the stage in the proceedings. Thus,
consideration of these findings leads to a conclusion of mixed support for the expectation that
community characteristics condition the treatment of Blacks and Hispanics and in particular if
these race/ethnic groups are involved in drug offending (H2). Once again, it is important to note
until data for the 2010 U.S. Census is released, this section of the analyses is unable to test the
third hypothesis concerning the extent these relationships predict social control over time.
VII. DISCUSSION
Sampson and Laub’s (1993) perspective contends that community characteristics,
especially underclass poverty and racial inequality, influence the social control of youth in
juvenile justice proceedings. Structural factors are believed to enhance class and race stereotypes
of the poor and Blacks as either criminals or drug offenders, but can also be characterized as
This document is a research report submitted to the U.S. Department of Justice. This report has not been published by the Department. Opinions or points of view expressed are those of the author(s)
and do not necessarily reflect the official position or policies of the U.S. Department of Justice.
83
sexual, aggressive, etc. In turn, these actual and/or perceived threats to middle class values result
in the poor and Blacks being subjected to greater social control in communities evidencing
impoverishment and racial inequality. An interpretation of Sampson and Laub’s (1993)
perspective is that the social control of youth, and especially minority youth, will fluctuate over
time due to associations with and changes in the economic and racial/ethnic inequality of
communities. The overall goal of this research was to examine the following research questions:
(1) Do structural characteristics of communities explain the social control of youth in juvenile
justice proceedings? (2) To what extent are these relationships similar or different for various
racial/ethnic groups? (3) Do the effects predict decision-making over time?
From Sampson and Laub’s (1993) theoretical perspective and our exploratory research
questions, we derived three hypothesized relationships. The hypotheses anticipated that
underclass poverty and racial/ethnic inequality would predict case outcomes within and across
time, and these relationships would increase individually and in combination the social control of
Blacks, Hispanics, and drug offenders. Last, fluctuation in social control was expected to occur
as the structural characteristics of communities would change over time. Two different data sets,
involving a number of years and various statistical techniques were used to test the validity of
these anticipated relationships.
More specific, data was provided by the National Juvenile Court Archive (NJCDA) that
represented county-level aggregated information for sixteen states involving 172 counties. Data
was for the years 1985, 1995, 2005, and 2009. Census information was used for 1980, 1990 and
2000 to construct the contextual variables. Ordinary Least Squares (OLS) regression was used to
predict the proportion of referrals petitioned, proportion detained, and the proportion receiving
out-of-home placement. An additional step in the analyses was to estimate OLS regression
This document is a research report submitted to the U.S. Department of Justice. This report has not been published by the Department. Opinions or points of view expressed are those of the author(s)
and do not necessarily reflect the official position or policies of the U.S. Department of Justice.
84
change models to understand how changes in the independent variables over time influenced
changes in the dependent variables over time.
The second data set, also provided by National Juvenile Court Archive, represented
individual-level data in the form of all delinquent referrals in a Northeast state from January
2000 through December 2010. Legal variables (e.g., crime severity, crime type, etc.), extralegal
considerations (e.g., age, gender, etc.) and three decision-making stages (intake, adjudication,
judicial disposition) were captured. The contextual variables of interest included the same
constructed indices and individual measures that were included in the aggregated 30-year data.
Data was collected from the 2000 U.S. census from each of the 67 counties in the Northeast
state. Hierarchical linear modeling (HLM) was used to analyze the data for the purpose of
estimating the amount of variation of both the individual (level-1) and county (level-2) measures
at the same time (Bryk & Raudenbush, 1992). In addition to the estimation of main and
interaction effects, cross-level interactions were also estimated. In short, minimal to modest
support was found for Sampson and Laub’s (1993) perspective and the hypotheses framing the
research.
Macro-level variables were at times found to be determinants of social control at each of
the four time frames and to a somewhat greater extent in explaining case outcomes in the
67counties in a Northeast state. But, the effects were sporadic and not always in the predicted
direction. In fact, the macro-level variables of interest and in particular, underclass poverty and
racial/ethnic inequality, most often were not statistically significant determinants of social
control. While contrary to the results reported by Sampson and Laub (1993) and some other
research (e.g., Bridges et al., 1995; Rodriguez, 2013, 2010), the failure to find community
This document is a research report submitted to the U.S. Department of Justice. This report has not been published by the Department. Opinions or points of view expressed are those of the author(s)
and do not necessarily reflect the official position or policies of the U.S. Department of Justice.
85
characteristics to be predictive of social control is consistent with those reported elsewhere (e.g.,
Hayes-Smith & Hayes-Smith, 2009; Sutton, 2013).
Limited evidence was also found for anticipated relationships between community
characteristics and disadvantaged treatment of minorities and drug offenders. These findings
parallel those reported by prior research (e.g., Bridges & Crutchfield, 1988; Hayes-Smith &
Hayes-Smith, 2009; Leiber et al., forthcoming; Wang & Mears, 2010). When community
characteristics significantly impacted the treatment of Blacks, Hispanics, and/or drug offenders
and decision-making, the effects at times resulted in less rather than more social control.
Findings indicating leniency instead of harsh outcomes was also present involving direct or main
effects of community characteristics with the treatment of youth. This inconsistency in the
direction of the relationships involving minorities and case outcomes has been frequently
discovered by prior research in the juvenile justice system. That is, minorities are disadvantaged
at some stages in processing but not others or, depending on which stages are examined;
minorities receive both more severe and more lenient outcomes (Bell & Lang, 1985; Dannefer &
Schutt, 1982; Leiber, 1994; Rodriguez, 2007).
The interpretations offered in those studies suggested that decision-makers may
compensate or correct racial inequities that they are aware were introduced at earlier stages.
Underlying this thinking is the “loosely coupled” nature of juvenile justice system (Bishop et al.,
2010). That is, the relative effects of legal, demographic, and contextual factors (such as
community factors) on case processing may be a function of: (1) the goals at each stage, (2) the
training and philosophies of court actors or decision-makers at each stage, and (3) the extent of
discretion available to decision-makers at each stage in the proceedings. Different decision-
makers at each stage of court proceedings may either enhance the effects of structure on court
This document is a research report submitted to the U.S. Department of Justice. This report has not been published by the Department. Opinions or points of view expressed are those of the author(s)
and do not necessarily reflect the official position or policies of the U.S. Department of Justice.
86
outcomes, or attenuate racial/ethnic effects from potential biases evident at earlier stages. In
particular, Bishop and colleagues (2010) put forth an integrated theory that combined aspects of
the focal concerns perspective (Steffensmeier et al., 1998) with the organizational coupling
framework (Aldrich, 1979; Aldrich & Whetten, 1981) to explain inconsistencies in the outcomes
of youth across numerous decision-making stages. As introduced above, each court actor has
varying goals, concerns, and attitudes that are taken into consideration depending on the stage
examined. For example, “loosely coupled” stages (i.e. intake, disposition) are considered to have
greater levels of discretion (and the potential for race/ethnic effects) because multiple court
personnel (e.g. police officers, social service workers) are providing their input to the decision-
maker (e.g. intake officers, judges). “Tightly coupled” stages (e.g. formal charging, adjudication)
are more likely to base decisions on legal factors (e.g. crime severity, prior record) than extra-
legal characteristics (e.g. race/ethnicity, gender) and potentially result in fewer biased and
stereotypically decisions.
An example in the present study corresponds to the relationship between legal factors and
adjudication decision-making. Specifically, youth who were charged with a felony, had a larger
number of prior referrals and current charges, and who were represented by legal counsel were
subjected to greater social control at adjudication. Therefore, Bishop and colleagues (2010)
perspective has the potential to account for the presence of harsh, lenient, and lack of consistent
outcomes of youth based on the composition of the juvenile court’s variety of personnel.
An examination of the results across the stages of petition, detention, and placement by
time change comparisons showed, with a few exceptions, stability in the relationships rather than
fluctuation or change. The few exceptions involve decision-making at the front-end of the system
(i.e. petition and detention) comparing the 2005 and 2009 time periods relative to 1985. These
This document is a research report submitted to the U.S. Department of Justice. This report has not been published by the Department. Opinions or points of view expressed are those of the author(s)
and do not necessarily reflect the official position or policies of the U.S. Department of Justice.
87
findings showed less social control. Keep in mind that very few statistically significant effects
were found involving underclass poverty and racial/ethnic inequality with the case outcomes.
At the individual-level, Black drug offenders received more social control at intake than
other offenders. Hispanics and Hispanic drug offenders were also found to be more likely to be
adjudicated once all relevant controls were considered. At judicial disposition, Blacks and
Hispanics had a greater likelihood of receiving the more severe outcome of out-home-placement.
These effects were enhanced if a minority youth was charged with a drug offense. These findings
highlight that race/ethnicity still matters in juvenile justice proceedings and is also consistent
with prior research (Bishop, 2005; Bishop & Leiber, 2012; Pope & Leiber, 2005; Leiber, 2002;
Steen et al., 2005). In addition, drug offenders and in particular, Black drug offenders and
Hispanic drug offenders, are responded to differently than other types of offenders (Feld, 1999;
Leiber & Fox, 2005; Miller, 1996; Mitchell, 2009; Mitchell & Caudy, 2013; Tittle & Curran,
1988; Sampson & Laub, 1993). The findings reported here indicate that underclass poverty and
racial/ethnic inequality alone (or if at all) do not seem to account for these occurrences.
7.1 Implications for Policy
The present research was driven by a test of Sampson and Laub’s (1993) macro-level
theory of the social control of youth within the juvenile justice system that emphasizes the
impact of community characteristics (e.g., underclass poverty, racial/ethnic inequality) on case
outcomes. Although little support was provided for the perspective, race/ethnicity individually
and at times, in combination with drug offending, were found to explain the treatment of youth
even after taking into account important legal and extralegal factors. In short, both legal
considerations and race/ethnicity were determinants of case proceedings. Therefore, policy
This document is a research report submitted to the U.S. Department of Justice. This report has not been published by the Department. Opinions or points of view expressed are those of the author(s)
and do not necessarily reflect the official position or policies of the U.S. Department of Justice.
88
should be developed that is multi-prong in that efforts should continue to be made that address
both the prevention of delinquent behavior and inequities in the handling of minority youth.
The finding that certain legal factors (e.g. crime severity, prior record, number of current
charges) explained decision-making in the current study suggests that minority youth may be
involved in the juvenile justice system, in part, because of their involvement in crime and/or the
kinds of crime that they are charged with. Therefore, to reduce the number of minority youth
coming into contact with the system, community-based resources and programs need to be
established and/or continued to be funded that focus on delinquency prevention and recidivism.
It is important to establish outreach efforts to both parents and youth to connect them with
activities that already exist. Most important is that minority youth have access to and the
opportunity to participate in these programs. For example, services should continue to be funded
and implemented that attempt to improve the life chances of youth such as skill development,
educational attainment, and positive relationships with family and peers and those that address
poverty and the social institutions within impoverished neighborhoods that are conducive for
delinquent behavior (Bishop & Leiber, 2012; Welsh & Farrington, 2012).
In 1989, the Disproportionate Minority Confinement Mandate (DMC) was passed as part
of the reauthorization of the Juvenile Justice and Delinquency Prevention Act (JJCPA) of 1974.
In 2002, the JJDP Act was modified, shifting the emphasis from “disproportionate minority
confinement” to “disproportionate minority contact” requiring the examination of possible
minority youth overrepresentation throughout all decision points in the juvenile justice system.
This examination is continuously conducted throughout five interconnected phases of the DMC
mandate: (1) identification of DMC, (2) assessment into possible causes, (3) intervention, (4)
evaluation, and (5) monitoring. Throughout DMC’s history and continuing today, the underlying
This document is a research report submitted to the U.S. Department of Justice. This report has not been published by the Department. Opinions or points of view expressed are those of the author(s)
and do not necessarily reflect the official position or policies of the U.S. Department of Justice.
89
goals of the mandate are the prevention of delinquency and the equitable treatment of all youth
within the juvenile justice system (Department of Justice, 2009). The present study falls broadly
within the assessment component of the DMC mandate.
On the basis of the results from the present study, interventions could involve cultural
sensitivity training of key personnel within the juvenile justice system and change in the system
itself. Changes that have been implemented elsewhere include legislative reform, administrative
changes, and structural and procedural changes that impact decision-making (Department of
Justice, 2009; Leiber & Rodriguez, 2011). Efforts such as these should continue to be
implemented as methods to address and possible reduce inequities in the treatment of youth in
general and in particular, minority youth.
One of the most popular changes involving the DMC mandate has focused on changing
detention procedures with an emphasis on alternatives to secure detention, which in the present
research, at times, detention was found to disadvantage youth relative to non-detained youth
(Leiber & Peck, forthcoming). The utilization of standardized screening instruments has been a
prominent strategy stressed by the Annie E. Casey Foundation (including the Juvenile Detention
Alternatives Initiative), the MacArthur Foundation, and the Office of Juvenile Justice &
Delinquency Prevention to reduce the reliance on secure detention, and when it is employed, that
there is greater consistency in the justification for its use (Mendel, 2009).
7.2 Directions for Future Research
As noted few studies have been conducted within juvenile justice proceedings to explain
the social control of youth and in particular, the poor and minorities, using a macro-level
perspective, including tests of Sampson and Laub’s (1993) theory. Although the findings
reported here and those by other studies have yielded little support for Sampson and Laub’s
This document is a research report submitted to the U.S. Department of Justice. This report has not been published by the Department. Opinions or points of view expressed are those of the author(s)
and do not necessarily reflect the official position or policies of the U.S. Department of Justice.
90
perspective, other studies have produced favorable results. The lack of research, the
inconsistency in the findings, and the weaknesses of the current study pave the way for
additional research in this area surrounding community characteristics, race/ethnicity, and social
control.
More specific, in the present research, some of the statistical models were based on a
relatively small sample of counties, especially those (i.e. the change models) that were
examining changes in social control based on changes in community measures over time (n=49).
In addition, the data that was obtained had to be approved and “released” from the data collectors
within each county. To some degree, this produced a final sample that is different than the
counties included in Sampson and Laub’s (1993) initial examination, but also translates to a
limited coverage of both states and counties. Therefore, the data in the current study are not
representative of all counties in the United States, and may produce potentially biased results and
limited generalizability.
Furthermore, the counties used in the present research may lack variability in terms of the
indicators of underclass poverty and racial/ethnic inequality. That is, the counties were more
similar in terms of community characteristics than different. The lack of variation across all
counties included in the final sample could be attributed to the absence of results that underclass
poverty and racial/ethnic inequality exerted on social control. In other words, the most
disadvantaged counties across the U.S. may not have been captured in the final sample, and
therefore may not provide a true test of Sampson and Laub’s (1993) perspective. From this
limitation, future research is needed that incorporates a larger number of counties that also show
sufficient variability in the Census measures. This advancement would allow for greater faith in
the findings reported here that involved the aggregated count data.
This document is a research report submitted to the U.S. Department of Justice. This report has not been published by the Department. Opinions or points of view expressed are those of the author(s)
and do not necessarily reflect the official position or policies of the U.S. Department of Justice.
91
In addition, in Sampson and Laub (1993)’s initial test of their perspective, they were able
to use both county and case level data. In other words, individual-level data was aggregated to
the county-level. In the present study, with the exception of the analyses conducted with the
northeast state, this was not possible. Thus, additional research is needed that is able to test
Sampson and Laub’s (1993) perspective with the inclusion of case level information within a
larger sample of counties. At the individual-level, the inclusion of additional case level
information would help to decrease the potential of omitted variable bias. While the omission of
potentially important macro-level variables will be discussed in detail later in this section, there
is also the issue that certain case level measures (e.g. family status, school status) were missing
from the current study as well that have been shown in prior research to impact case outcomes
(Bishop, 2005; Bishop & Leiber, 2012).
The present research was also limited by not being able to use information from the 2010
U.S. census when conducting analyses with both the aggregate count data and the county/case-
level data. Future research should attempt to conduct additional analyses using 2010 Census
information. Future research would also benefit from the utilization of the 1, 3, or 5 year data
from the American Community Survey (ACS). It may be that ACS data can complement the
measures included from the 1980, 1990, and 2000 census. Therefore, if census data is not
obtainable based on the specific race/ethnic measures needed to perform statistical analyses, the
ACS may be considered a useful alternative data collection method for community-level
measures.
Future research may also want to consider the use of zip codes, census tracts, and other
information that can be obtained from smaller units of analysis than counties. This modification
can potentially identify possible pockets of disadvantage more so than county-level indicators.
This document is a research report submitted to the U.S. Department of Justice. This report has not been published by the Department. Opinions or points of view expressed are those of the author(s)
and do not necessarily reflect the official position or policies of the U.S. Department of Justice.
92
The utilization of county-level measures may mask potential differences within counties that
were not captured by county-level census data. Smaller units of analysis have the potential to
unmask community and/or race/ethnic effects that were not found in the present study of
counties. For example, even though Sampson and Laub (1993) argued that counties characterized
by underclass poverty and racial inequality would subject youth to greater social control,
meaningful differences in these county-level measures may be more evident across zip codes
and/or census tracts. Rodriguez (2013) examined structural indicators of disadvantage across zip
codes rather that counties because policy initiatives for at-risk youth are targeted based on zip
codes, not counties. Therefore, support for Sampson and Laub’s (1993) theoretical model may be
found with more finite measures of disadvantage.
There may also be the need to include various additional indicators of disadvantage and
threat in future examinations of Sampson and Laub’s (1993) perspective. For example, the index
of dissimilarity (D) is an important yet unmeasured variable in the current study that could
attribute to future support for Sampson and Laub’s (1993) theory. The index of dissimilarity is
included in examinations of other threat perspectives because it measures the degree of
distribution between two groups (e.g. Black versus White) across various geographical locations
(Massey & Denton, 1993, Ousey, 1999; Peterson & Krivo, 1993). Therefore, the amount of
racial and/or ethnic segregation may be a significant indicator and “tool” of social control. Future
research should attempt to better measure structural indicators of threat above and beyond the
measures in the current study, and Sampson and Laub’s (1993) initial examination.
It is also important to note that a number of potentially important control measures at the
community-level were not included in the current study and should be considered in future
research. For example, the county crime rate, trends in gang membership/activity, drug markets,
This document is a research report submitted to the U.S. Department of Justice. This report has not been published by the Department. Opinions or points of view expressed are those of the author(s)
and do not necessarily reflect the official position or policies of the U.S. Department of Justice.
93
measures to indicate the war on drugs, and additional indicators of concentrated disadvantage
may provide potential insight into support or non-support for Sampson and Laub’s (1993)
perspective. Even if future examinations do not specifically test Sampson and Laub’s (1993)
theoretical model, the macro-level measures indicated above could establish whether there is a
connection between community context and the social control of youth in general, and in
particular, minorities.
In addition, the current study utilized traditionally regression techniques (OLS
regression) with aggregated county-level data from 1985-2009, and hierarchical generalized
linear modeling (HGLM) from individual and county-level data from a Northeast state from
2000-2010. One possible suggestion for future research is the utilization of a pooled time series
cross-section analysis (TSCS) with the counties that comprised the aggregated level of analyses
across the four time frames. Due to the limitation that some models only included 49 counties,
TSCS has the ability to combine the cross-sectional data of the counties across the four time
frames to produce a greater number of observations. While OLS regression was employed
instead of TSCS in the current study, a task for future research would be to utilize this additional
form of data analysis to assess if similar or different results are produced based on a different
type of statistical analysis.
It is also possible that Sampson and Laub’s (1993) inequality perspective needs
theoretical refinement. For example, one avenue for theory development and future research may
be to expand the notion of “threat” beyond the symbolic aspect to include multiple perceived
threats, (e.g., political, cultural) that may be intertwined and possibly racialized. The
consideration of multiple types of threats may place the perspective in a better position to
account for why (in addition to Blacks) certain populations are targeted for increased social
This document is a research report submitted to the U.S. Department of Justice. This report has not been published by the Department. Opinions or points of view expressed are those of the author(s)
and do not necessarily reflect the official position or policies of the U.S. Department of Justice.
94
control. Hispanics and the poor may be other groups that are perceived as threatening and in
need of social control based on the decisions of court actors.
Paralleling this suggestion, temporal changes in social control based on perceptions of
threat may also be affected in the composition of juvenile justice personnel. In other words,
certain characteristics of juvenile court decision-makers may influence how various racial/ethnic
groups are considered threatening across time. For example, in the adult criminal justice
literature (Johnson, 2014; Steffensmeier & Hebert, 1999), research suggests that police officer
characteristics (e.g. race, gender) may play an important role in racial disparities of arrest
patterns (Engel, Calnon, & Bernard, 2002; Tillyer, Klahm, & Engel, 2012). Within the juvenile
justice realm, only a handful of studies have examined how characteristics of juvenile court
actors may influence race/ethnic differences in social control (Davis, Severy, Kraus, & Whitaker,
1993; Leiber & Brubaker, 2010). Future research should consider this additional line of inquiry
to examine how threat at the organizational or “decision-maker” level may influence how youth
of different racial/ethnic backgrounds are treated once referred to the juvenile court.
Concomitantly, linkage to mid-level (e.g., focal concerns perspective) and micro-level
(e.g., attribution theory) explanations may improve our understanding of social control.
Specifically, a theoretical perspective that explains how multiple historical, cultural, community,
courts, and decision-making factors may interact to influence case outcomes. Recall that the
macro-level variables, for the most part, failed to explain specifically the treatment of Blacks and
Hispanics at the individual-level. A theoretical elaboration (as described above), may provide the
bridge to the contextual mechanisms that interact with legal and extra-legal factors to justify the
need to control and/or help perceived threatening populations (e.g., Bridges & Steen, 1998;
Rodriguez, 2010, 2013; Steffensmeier et al., 1998; Stolzenberg, D’Alessio, & Eitle, 2004).
This document is a research report submitted to the U.S. Department of Justice. This report has not been published by the Department. Opinions or points of view expressed are those of the author(s)
and do not necessarily reflect the official position or policies of the U.S. Department of Justice.
95
In the present study, the size of a counties’ minority population was at times predictive of
social control. The size of the minority population of a community is one central element of the
minority group threat perspective as espoused by Blalock (1967). Many studies have discovered
that increases in the minority population(s) of a community to explain increases in police
expenditures (e.g., Chamlin, 1989), police force size (e.g., Stults & Baumer, 2007), prison
sentences (e.g., Wang & Mears, 2010), and sentence lengths (e.g., Ulmer & Johnson, 2004).
Within the juvenile justice system, the presence of minority populations has been predictive of
pre-adjudication detention (e.g., Armstrong & Rodriguez, 2005) and severe case outcomes (e.g.
Tittle & Curran, 1988). Other research, however, has reported no support for the premise that
minority presence is related to increased punishment (e.g., Bridges et al., 1995; Britt, 2000;
Hayes-Smith & Hayes-Smith, 2009; Kautt, 2002; Leiber et al., forthcoming). Still, given the
inconsistent support for the power-threat perspective and the results reported here, future studies
may want to consider exploring the extent the presence of minorities in a community as well as
the influence of minorities as a political threat may have on the social control of youth.
A final suggestion for future research rests with the need to compliment the use of
quantitative analyses with qualitative analyses in the study of race/ethnicity and the treatment of
youth in juvenile justice proceedings. The findings reported in the current study revealed that
Blacks and Hispanics were treated differently once relevant legal and extralegal considerations
were taking into account. These findings often occurred irrespective of county-level
characteristics. Observational studies of court decision-making, including police and school
referrals, interviews with decision-makers, and content analyses of case files could provide
additional insights into the contexts of when race/ethnicity influences case outcomes (Bridges &
Steen, 1998; Graham & Lowery, 2004; Harris, 2007, 2009; Leiber, 2003).
This document is a research report submitted to the U.S. Department of Justice. This report has not been published by the Department. Opinions or points of view expressed are those of the author(s)
and do not necessarily reflect the official position or policies of the U.S. Department of Justice.
96
7.3 Dissemination of Research
This research has significant implications for the social control of youth and in particular,
minority youth. Several avenues will be pursued to disseminate the findings. In addition to the
disseminating of the current findings in this Final Report to the National Institute of Justice,
additional efforts will include conference presentations (e.g., American Society of Criminology,
ASC; Academy of the Criminal Justice Sciences, ACJS) and journal publications (e.g.,
Criminology, Journal of Research in Crime and Delinquency, etc.). A third effort to disseminate
the findings will be through additional reports that will be provided to the National Center for
Juvenile Justice (NCJJ) and counties and states that permitted the use of the data.
This document is a research report submitted to the U.S. Department of Justice. This report has not been published by the Department. Opinions or points of view expressed are those of the author(s)
and do not necessarily reflect the official position or policies of the U.S. Department of Justice.
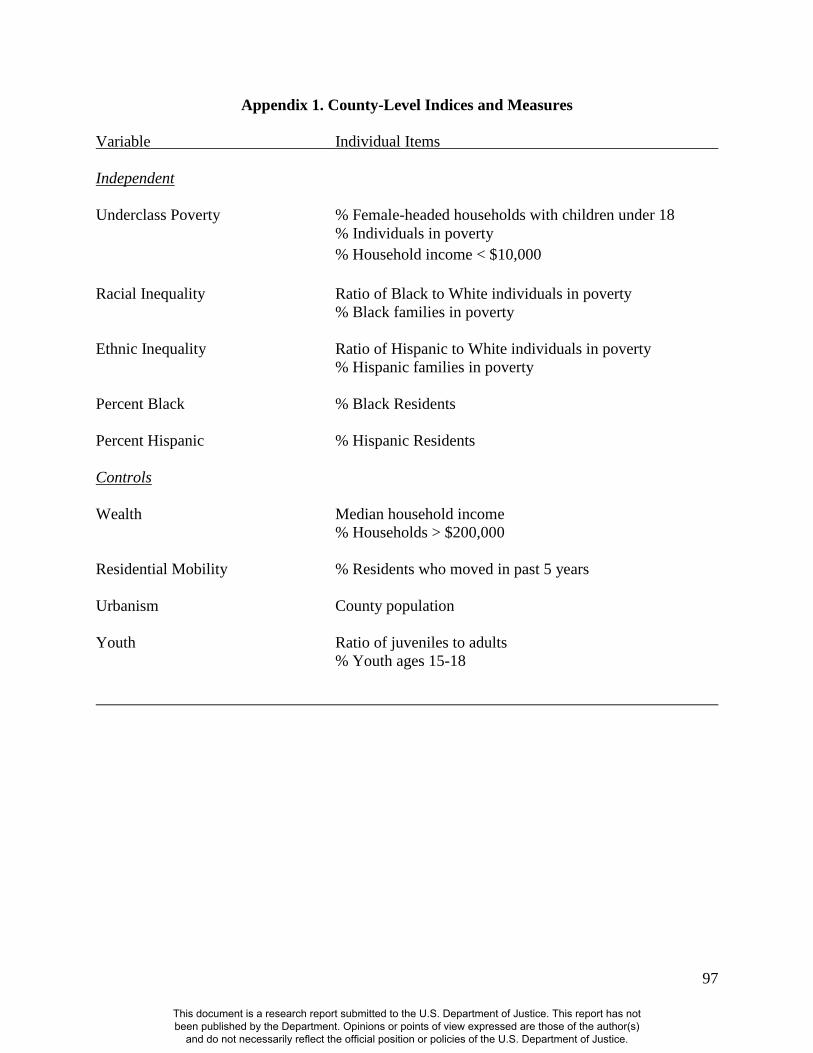
97
Appendix 1. County-Level Indices and Measures
Variable Individual Items
Independent
Underclass Poverty % Female-headed households with children under 18
% Individuals in poverty
% Household income < $10,000
Racial Inequality Ratio of Black to White individuals in poverty
% Black families in poverty
Ethnic Inequality Ratio of Hispanic to White individuals in poverty
% Hispanic families in poverty
Percent Black % Black Residents
Percent Hispanic % Hispanic Residents
Controls
Wealth Median household income
% Households > $200,000
Residential Mobility % Residents who moved in past 5 years
Urbanism County population
Youth Ratio of juveniles to adults
% Youth ages 15-18
This document is a research report submitted to the U.S. Department of Justice. This report has not been published by the Department. Opinions or points of view expressed are those of the author(s)
and do not necessarily reflect the official position or policies of the U.S. Department of Justice.
98
References
Aldrich, H. (1979). Organizations and environments. Englewood Cliffs, NJ: Prentice-Hall.
Aldrich, H., & Whetton, D. (1981). Organization-sets, action-sets, and networks: Making the
most of simplicity. In P. Nystrom & W. Starbuck (Eds.), Handbook of organizational
design (pp. 385-408). New York, NY: Oxford University Press.
Allison, P.D. (2002) Missing data. Thousand Oaks, CA: Sage.
Armstrong, G.S., & Rodriguez, N. (2005). Effects of individual and contextual characteristics on
preadjudication detention of juvenile delinquents. Justice Quarterly, 22, 521-539.
Bell, D., & Lang, K. (1985). The intake dispositions of juvenile offenders. Journal of
Research in Crime in Delinquency, 22, 309-328.
Bishop, D. (2005). The role of race and ethnicity in juvenile justice processing. In D.
Hawkins & K. Kempf-Leonard (Eds.), Our children, their children: Confronting racial
and ethnic differences in American juvenile justice (pp. 23-82). Chicago: University of
Chicago Press.
Bishop, D. & Leiber, M. (2012). Race, ethnicity, and juvenile justice: Racial and ethnic
differences in delinquency and justice system responses. In D.Bishop & B. Feld (Eds.),
Juvenile Justice. (pp. 445-484). New York: Oxford University Press.
Bishop, D., Leiber, M., & Johnson, J. (2010). Contexts of decision making in the juvenile
justice system: An organizational approach to understanding minority overrepresentation.
Journal of Youth Violence & Juvenile Justice, 8, 213–233.
Blalock, H.M. (1967) Toward a theory of minority group relations. New York, NY: Wiley.
Bridges, G.S., & Crutchfield, R.D. (1988). Law, social standing and racial disparities in
imprisonment. Social Forces, 66, 699-724.
This document is a research report submitted to the U.S. Department of Justice. This report has not been published by the Department. Opinions or points of view expressed are those of the author(s)
and do not necessarily reflect the official position or policies of the U.S. Department of Justice.
99
Bridges, G., Conley, D., Engen, R., & Price-Spratlen, T. (1995). Racial disparities in the
confinement of juveniles: Effects of crime and community social structure of punishment.
In K. Kempf-Leonard, C.E., Pope, & W.H. Feyerherm, (Eds.), Minorities in Juvenile
Justice (pp. 128-152). Thousand Oaks, CA: Sage Publications.
Bridges, G., & Steen, S. (1998). Racial disparities in official assessments of juvenile offenders:
Attributional stereotypes as mediating mechanisms. American Sociological Review, 63,
554-570.
Britt, C. (2000). Social context and racial disparities in punishment decisions. Justice
Quarterly, 17, 707-732.
Bryk, A.S., & Raudenbush, S.W. (1992). Hierarchical linear models in social and
behavioral research: Applications and data analysis methods. Newbury Park, CA: Sage
Publications.
Butts, J., & Snyder, H. (1997, September). The youngest delinquents: Offenders under age 15.
In Juvenile Justice Bulletin. Washington, DC: US Department of Justice, Office of
Justice Programs, Office of Juvenile Justice and Delinquency Prevention.
Chamlin, M. B. (1989). A macro social analysis of change in police force size, 1972–1982:
Controlling for static and dynamic influences. The Sociological Quarterly, 30, 615-624.
Cohen, L.E., & Kluegel, J.R. (1979). The detention decision: A study of the impact of social
characteristics and legal factors in two metropolitan juvenile courts. Social Forces, 58,
146-161.
Crawford, C., Chiricos, C., & Kleck, G. (1998). Race, racial threat, and sentencing of
habitual offenders. Criminology, 36, 481-511.
This document is a research report submitted to the U.S. Department of Justice. This report has not been published by the Department. Opinions or points of view expressed are those of the author(s)
and do not necessarily reflect the official position or policies of the U.S. Department of Justice.
100
Dannefer, D., & Schutt, R. (1982). Race and juvenile justice processing in court and police
agencies. American Journal of Sociology, 87, 1113-1132.
Davis, T. L., Severy, L. J., Kraus, S. J., & Whitaker, J. M. (1993). Predictors of sentencing
decisions: The beliefs, personality variables, and demographic factors of juvenile
justice. Journal of Applied Social Psychology, 23, 451-477.
Engel, R. S., Calnon, J. M., & Bernard, T. J. (2002). Theory and racial profiling: Shortcomings
and future directions in research. Justice Quarterly, 19, 249-273
Engen, R., Steen, S., & Bridges, G. (2002). Racial disparities in the punishment of youth: A
theoretical and empirical assessment of the literature. Social Problems, 49, 194-220.
Fagan, J. (2010). The contradictions of juvenile crime & punishment. Dædalus (Summer), 43-61.
Feld, B. (1999). Bad kids: Race and the transformation of the juvenile court. New York: Oxford
University Press.
Fox, J. A. (2004). Missing data problems in the SHR: Imputing offender and relationship
characteristics. Homicide Studies, 8, 214-254.
Fox, J.A., & Swatt, M.L. (2009). Multiple imputation of the supplementary homicide reports,
1976-2005. Journal of Quantitative Criminology, 25, 51-77.
Frazier, C.E., & Bishop, D.M. (1995) Reflections on Race Effects in Juvenile Justice. In K.
Kempf-Leonard, C.E. Pope, & W.H. Feyerherm (Eds.), Minorities in juvenile justice (pp.
16-46). Thousand Oaks, CA: Sage.
Frazier, C.E., Bishop, D.M., & Henretta, J.C. (1992). The social context of race differentials in
juvenile justice dispositions. The Sociological Quarterly, 33, 447-458.
Freiburger, T. L., & Jordan, K. L. (2011). A multilevel analysis of race on the decision to
petition a case in the juvenile court. Race and Justice, 1, 185-201.
This document is a research report submitted to the U.S. Department of Justice. This report has not been published by the Department. Opinions or points of view expressed are those of the author(s)
and do not necessarily reflect the official position or policies of the U.S. Department of Justice.
101
Graham, S., & Lowery, B. (2004). Priming unconscious racial stereotypes about adolescent
offenders. Law & Human Behavior 28, 483-504.
Harris, A. (2007). Diverting and abdicating judicial discretion: Cultural, political, and procedural
dynamics in California juvenile justice. Law and Society Review, 41, 387-428.
Harris, A. (2009). Attributions and institutional processing: How focal concerns guide decision-
making in the juvenile court. Race and Social Problems, 1, 243-256.
Hartley, R., Maddan, S., & Spohn, C. (2007). Concerning conceptualization and
operationalization: Sentencing data and the focal concerns perspective. Southwest
Journal of Criminal Justice, 4, 58-78.
Hawkins, D. F. (1987). Beyond anomalies: Rethinking the conflict perspective on race
and criminal punishment. Social Forces, 65, 719-745.
Hayes-Smith, J., & Hayes-Smith, R. (2009). Race, racial context, and withholding
adjudication in drug cases: A multilevel examination of juvenile justice. Journal of
Ethnicity in Criminal Justice, 7, 163-185.
Huizinga, D., Thornberry, T.P., Knight, K.E., Lovegrove, P., Loeber, R., Hill, K., & Farrington,
D.P. (2007). Disproportionate Minority Contact in the Juvenile Justice System: A Study
of Differential Minority Arrest/Referral to Court in Three Cities. Washington, DC: U.S.
Department of Justice, Office of Juvenile Justice and Delinquency Prevention.
Johnson, B. (2014). Judges on Trial: A reexamination of judicial race and gender effects
across modes of conviction. Criminal Justice Policy Review, 25, 159-184.
Johnson, D. R., & Young, R. (2011). Toward best practices in analyzing datasets with missing
data: Comparisons and recommendations. Journal of Marriage and Family, 73, 926-945.
This document is a research report submitted to the U.S. Department of Justice. This report has not been published by the Department. Opinions or points of view expressed are those of the author(s)
and do not necessarily reflect the official position or policies of the U.S. Department of Justice.
102
Kempf - Leonard, K. (2007). Minority youths and juvenile justice: Disproportionate
minority contact after nearly 20 years of reform efforts. Youth Violence and
Juvenile Justice, 5, 71.
Kautt, P. M. (2002). Location, location, location: Interdistrict and intercircuit variation in
sentencing outcomes for federal drug-trafficking offenses. Justice Quarterly, 19, 633-
671.
Leiber, M. J. (1994). A comparison of juvenile court outcomes for Native Americans, African
Americans, and Whites. Justice Quarterly, 11, 257-279.
Leiber, M. (2002). Disproportionate minority confinement (DMC) of youth: An analysis of state
and federal efforts to address the issue. Crime and Delinquency, 48, 3-45.
Leiber, M. (2003). The contexts of juvenile justice decision making: When race matters. State
University of New York Press. Albany: NY.
Leiber, M. J., & Brubaker, S. J. (2010). Does the gender of the intake probation officer
contextualize the treatment of black Youth? Justice Research and Policy, 12, 51-76.
Leiber, M., & Fox, K. (2005). Race and the impact of detention on juvenile justice decision
making. Crime & Delinquency, 51, 470-497.
Leiber, M. J., & Jamieson, K. M. (1995). Race and decision making within juvenile justice: The
importance of context. Journal of Quantitative Criminology, 11, 363- 384.
Leiber, M., & Johnson. J. (2008). Being young and Black: What are their effects on juvenile
justice decision making? Crime & Delinquency, 54, 560-581.
Leiber, M.J., Peck, J.H., & Rodriguez, N. (forthcoming). Minority threat and juvenile
court outcomes. Crime & Delinquency. DOI: 10.1177/0011128713495776.
This document is a research report submitted to the U.S. Department of Justice. This report has not been published by the Department. Opinions or points of view expressed are those of the author(s)
and do not necessarily reflect the official position or policies of the U.S. Department of Justice.
103
Leiber, M. J., & Peck, J. H. (2013). Probation violations and juvenile justice decision-making:
Implications for blacks and Hispanics. Youth Violence and Juvenile Justice, 11, 60-78.
Leiber, M., & Rodriguez, N. (2011). The implementation of the disproportionate minority
confinement contact (DMC) mandate: A failure or success? Race and Justice, 1, 103-
124.
Leiber, M. J., & Stairs, J. M. (1999). Race, contexts, and the use of intake diversion. Journal of
Research in Crime and Delinquency, 36, 56-86.
Luke, D. A. (2004). Multilevel modeling. Thousand Oaks, CA: Sage Publications.
Massesy, D.S., & Denton, N.A. (1993). American apartheid: Segregation and the making of the
underclass. Cambridge, MA: Harvard University Press.
Mauer, M., & King, R.S. (2007). Uneven justice: State rates of incarceration by race and
ethnicity. Washington, DC: The Sentencing Project.
Mendel, R. (2009). Two decades of JDAI: A progress report. Baltimore: Annie E. Casey
Foundation.
Miller. J.G. (1996). Search and destroy: African American males in the criminal justice
system. New York, NY: Cambridge University Press.
Mitchell, O. (2009). Is the war on drugs racially biased? Journal of Crime and Justice, 32,
49-75.
Mitchell, O., & Caudy, M.S. (2013). Examining Racial Disparities in Drug Arrests, Justice
Quarterly, DOI: 10.1080/07418825.2012.761721.
Ousey, G. C. (1999). Homicide, structural factors, and the racial invariance assumption.
Criminology, 37, 405-426.
This document is a research report submitted to the U.S. Department of Justice. This report has not been published by the Department. Opinions or points of view expressed are those of the author(s)
and do not necessarily reflect the official position or policies of the U.S. Department of Justice.
104
Peterson, R.D., & Krivo, L.J. (1993). Racial segregation and black urban homicide. Social
Forces, 71, 1001-1026.
Pope, C. E., & Feyerherm, W. (1993). Minorities and the juvenile justice system: Full report.
Washington, DC: U.S. Department of Justice, Office of Juvenile Justice and Delinquency
Prevention.
Pope, C. E., & Leiber, M. (2005). Disproportionate minority confinement/contact (DMC): The
federal initiative. In D. Hawkins & K. Kempf-Leonard (Eds.), Our children, their
children: Confronting racial and ethnic differences in American juvenile justice (pp. 351-
389). Chicago: University of Chicago Press.
Pope, C. E., Lovell, R. D., & Hsia, H. M. (2002). Disproportionate minority confinement: A
review of the research literature from 1989 through 2001. Washington, DC: US
Department of Justice, Office of Justice Programs, Office of Juvenile Justice and
Delinquency Prevention.
Pope, C.E., Lovell, R., Stojkovic, S., and Rose, H. (1996). Minority Overrepresentation: Phase
II Study Final Report. Milwaukee, WI: Wisconsin. Office of Justice Assistance,
Governor’s Commission on Juvenile Justice.
Pope, C.E., & Snyder, H.N. (2003). Race as a factor in juvenile arrests. Washington, DC: U.S.
Department of Justice, Office of Juvenile Justice and Delinquency Prevention.
Rodriguez, N. (2007). Juvenile court context and detention decisions: Reconsidering the role of
race, ethnicity, and community characteristics in juvenile court processes. Justice
Quarterly, 24, 629-656.
This document is a research report submitted to the U.S. Department of Justice. This report has not been published by the Department. Opinions or points of view expressed are those of the author(s)
and do not necessarily reflect the official position or policies of the U.S. Department of Justice.
105
Rodriguez, N. (2010). The cumulative effect of race and ethnicity in juvenile court outcomes and
why preadjudication detention matters. Journal of Research in Crime and Delinquency,
47, 391-413.
Rodriguez, N. (2013). Concentrated disadvantage and the incarceration of youth: Examining how
context affects juvenile justice. Journal of Research in Crime and Delinquency, 50, 189-
215.
Rodriguez, N., Smith, H. & Zatz, M. (2009). Youth is enmeshed in a highly dysfunctional family
system: Exploring the relationship among dysfunctional families, parental incarceration,
and juvenile court decision making. Criminology, 47, 177–207.
Sampson, R. J., & Laub, J. H. (1993). Structural variations in juvenile court processing:
Inequality, the underclass, and social control. Law & Society Review, 27, 285– 311.
Stahl, A. L., Puzzanchera, C., Livsey, S., Sladky, A., Finnegan, T.A, Tierney, N., & Snyder,
H.N. (2007). Juvenile Court Statistics 2003–2004. Pittsburgh, PA: National Center for
Juvenile Justice.
Steen, S., Engen, R. L., & Gainey, R. R. (2005). Images of danger and culpability: Racial
stereotyping, case processing, and criminal sentencing. Criminology, 43, 435-468.
Steffensmeier, D., & Hebert, C. (1999). Women and men policymakers: Does the judge's gender
affect the sentencing of criminal defendants? Social Forces,77, 1163-1196.
Steffensmeier, D., Ulmer, J. & Kramer, J. (1998). The Interaction of r, gender, and age, in
criminal sentencing: The punishment cost of being young, black, and male. Criminology,
36, 763-797.
Stolzenberg, L., D'Alessio, S. J., & Eitle, D. (2004). A multilevel test of racial threat
theory. Criminology, 42, 673-698.
This document is a research report submitted to the U.S. Department of Justice. This report has not been published by the Department. Opinions or points of view expressed are those of the author(s)
and do not necessarily reflect the official position or policies of the U.S. Department of Justice.
106
Stults, B. J., & Baumer, E. P. (2007). Racial context and police force size: Evaluating the
empirical validity of the minority threat perspective. American Journal of
Sociology, 113, 507-546.
Sutton, J.R. (2013). Structural bias in the sentencing of felony defendants. Social Science
Research, 42, 1207-1221.
Thomas, S. A., Moak, S. C., & Walker, J. T. (2013). The contingent effect of race in juvenile
court detention decisions: The role of racial and symbolic threat. Race and Justice, 3,
239-265.
Tillyer, R., Klahm, C. F., & Engel, R. S. (2012). The discretion to Search: A multilevel
examination of driver demographics and officer characteristics. Journal of Contemporary
Criminal Justice, 28, 184-205.
Tittle, C.R., & Curran, D.A. (1988). Contingencies for dispositional disparities in juvenile
justice. Social Forces, 67, 23-58.
Tracy, P. (2005). Race, ethnicity, and juvenile justice. In D. F. Hawkins & K. Kempf-
Leonard (Eds.), Our children, their children: Confronting racial and ethnic differences
in American juvenile justice (pp. 245-269). Chicago: University of Chicago Press.
Ulmer, J. T., & Johnson, B. (2004). Sentencing in context: A multilevel analysis.
Criminology, 42(1), 137-178.
U.S. Department of Justice. (2009). Disproportionate minority contact technical assistance
manual (4th Eds). Rockville, MD: U.S. Department of Justice, Office of Juvenile Justice
and Delinquency Prevention.
Wang, X., & Mears, D. P. (2010). A multilevel test of minority threat effects on sentencing.
Journal of Quantitative Criminology, 26, 191-215.
This document is a research report submitted to the U.S. Department of Justice. This report has not been published by the Department. Opinions or points of view expressed are those of the author(s)
and do not necessarily reflect the official position or policies of the U.S. Department of Justice.
107
Welsh, Brandon C., Farrington, D.P. (2012). The Oxford Handbook of Crime Prevention. New
York, Oxford University Press.
This document is a research report submitted to the U.S. Department of Justice. This report has not been published by the Department. Opinions or points of view expressed are those of the author(s)
and do not necessarily reflect the official position or policies of the U.S. Department of Justice.