Embed Size (px)
Citation preview

Rachel Klein and Tasha Magloire

Chemical structure of Ascorbic acid
• Ascorbic acid (also known as Vitamin C):– Is a water soluble vitamin– An antioxidant and dietary
supplement– Needed for the growth and
repair of tissues in the body– Naturally present in some
fruits and vegetables– Protects against
• Scurvy• Heart disease• Cancer• Common cold• High blood pressure
– In some commercial juices

To evaluate and analyze the Vitamin C content in four commercial fruit juices using Raman scattering and High Performance Liquid Chromatography (HPLC), and construct a calibration plot relating peak area for the ascorbic acid peak against concentration.

Advantage of low sensitivity to water Has narrow and highly resolved bands Allows for nondestructive extraction of
chemical compositions Gives physical information about
samples and aides in rapid on-line analysis

An efficient and quick way to determine compositions
Simultaneously handles many analytes in a single test
HPLC is highly precise and accurate Can be used to determine quantities of
compositions

Materials:• Ascorbic acid• Ten 250 ml Volumetric
flasks• Five 100 ml Volumetric
flasks• Five 50 ml Volumetric
flasks• Pipettes• Fruit juice(s):–Orange–Apple–Grape–Cranberry
Instruments:•FT-Raman•HPLC

Day 1: Concentrations of Ascorbic acid we made
Ppm = mg/L ----> 1000 ppm = mg/0.250L = 250 mg of ascorbic acid
We made 5 standard concentrations of ascorbic acid
10 ppm – 0.5 ml 20 ppm – 1 ml 30 ppm – 1.5 ml 40 ppm – 2 ml 50 ppm – 2.5 ml

• Day 2:–Made higher concentrations of our standards
• 50 ppm – 2.5 ml• 100 ppm – 5 ml• 150 ppm – 7.5 ml• 200 ppm – 10 ml• 250 ppm – 12.5 ml— Tested samples of cranberry, apple, grape, and
orange juices
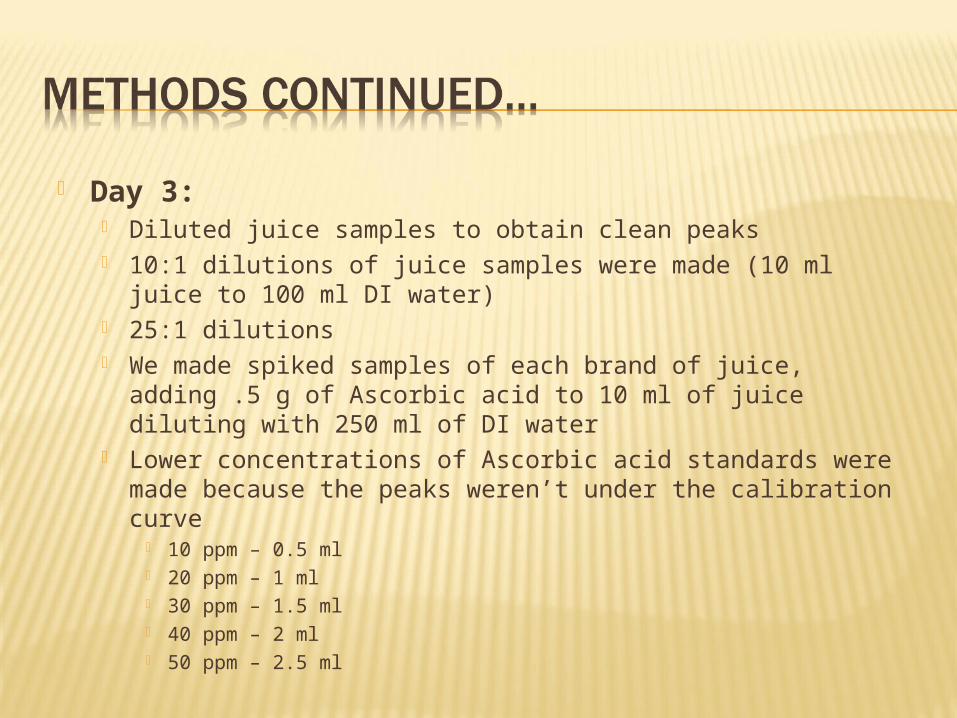
Day 3: Diluted juice samples to obtain clean peaks 10:1 dilutions of juice samples were made (10 ml juice to
100 ml DI water) 25:1 dilutions We made spiked samples of each brand of juice, adding .5 g
of Ascorbic acid to 10 ml of juice diluting with 250 ml of DI water
Lower concentrations of Ascorbic acid standards were made because the peaks weren’t under the calibration curve
10 ppm – 0.5 ml 20 ppm – 1 ml 30 ppm – 1.5 ml 40 ppm – 2 ml 50 ppm – 2.5 ml

• Day 4:– All standard concentrations of Ascorbic acid and non-
spiked juice samples were tested on the FT-Raman
• Day 5:— All spiked samples of cranberry, apple, orange, and
grape juices were ran on the FT-Raman
• Day 6:— Juice concentrations were changed because the peaks
had to be within the calibration curve. We retested two spiked samples of apple juice and orange juice on the HPLC, adding only .05 g of Ascorbic acid to obtain clean peaks that fit under the calibration curve


Ret. Time Area Area % Height Height %
10 ppm 1.408 307100 99.572 30690 99.66220 ppm 1.458 745400 81.378 69914 90.04230 ppm 1.483 1132929 87.917 106560 93.52240 ppm 1.508 1606466 92.306 153740 92.21450 ppm 1.533 2205540 99.994 217231 99.950
Table 1. Standard calibration
Table 2. Fruit juice conc.Concentration % Recovery1 % Recovery2
Orange 49 ppm 42.68% 120.4%Grape 23 ppm 26.73% ---Apple 12 ppm 0.42% 109.16%Cranberry 26 ppm 3.33% ---
1. 500 mg spike2. 50 mg spike

Ret. Time Area Area % Height Height %
Apple 1.567 344054 75.934 47568 91.205
Orange 1.683 2077012 98.501 148930 97.449
Grape 1.625 853583 67.686 107219 74.607
Cranberry 1.633 1021223 76.418 142170 81.828
Spiked Apple 1.600 6528139 99.821 824785 99.860
Spiked Orange 1.600 4365632 97.055 536584 99.110
Spiked Grape 1.883 27333634 91.225 999298 84.689
Spiked Cranberry 1.675 11326920 99.762 998171 99.545
Table 3. Summary table of information of fruit juices and fruit juices spiked with ascorbic acid

Example calculation of fruit juice concentration
Apple:
y= 46579x-197897

Example calc. of % Recovery (500mg) Example calc. of % Recovery (50mg)
Mg in Spiked Apple: ppm = mg/ L mg= (114 ppm)(0.250L) = 28.5 mg
Mg in Spiked Apple: mg = (225 ppm)(0.250L)=56.25 mg

Errors that occurred: Adding too much ascorbic acid to spiked juice
samples created peaks that were outside of the calibration curve
Not diluting the regular juice samples right away created flat-top peaks

Ascorbic Acid was successfully identified in all samples using Raman Ascorbic Acid was successfully quantified in all samples using HPLCThe concentration of juices were as expected Percent Recovery was exceptionally lower with 500 mg spiked juices Percent Recovery was as expected with 50 mg spiked juices