Embed Size (px)
Citation preview

Racial and Ethnic Admission Preferences at Arizona State University College of Law By Althea K. Nagai, Ph.D. Research Fellow Center for Equal Opportunity
Linda Chavez, Chairman Roger Clegg, President 7700 Leesburg Pike, Suite 231 Falls Church, VA 22043 Phone 703-442-0066 Fax 703-442-0449 www.ceousa.org
Embargoed
Until October 1, 2008
Arizona State University College of Law
i
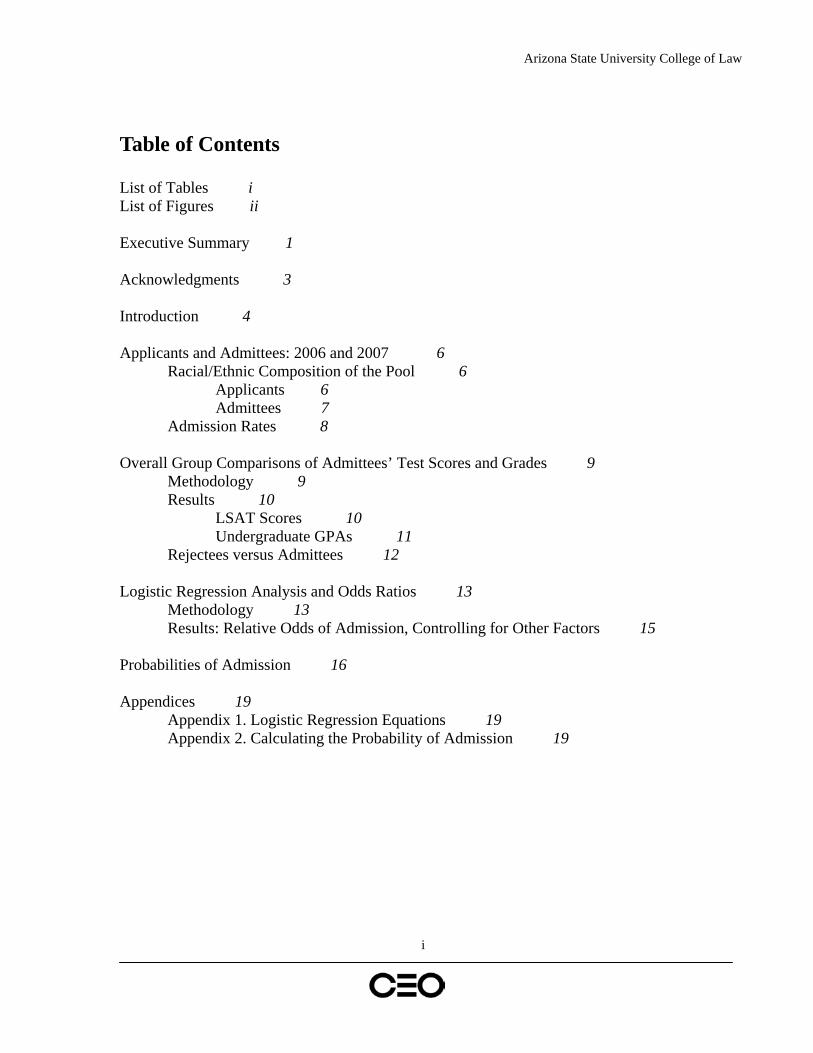
Table of Contents List of Tables i List of Figures ii Executive Summary 1 Acknowledgments 3 Introduction 4 Applicants and Admittees: 2006 and 2007 6
Racial/Ethnic Composition of the Pool 6 Applicants 6 Admittees 7
Admission Rates 8 Overall Group Comparisons of Admittees’ Test Scores and Grades 9
Methodology 9 Results 10
LSAT Scores 10 Undergraduate GPAs 11
Rejectees versus Admittees 12 Logistic Regression Analysis and Odds Ratios 13
Methodology 13 Results: Relative Odds of Admission, Controlling for Other Factors 15
Probabilities of Admission 16 Appendices 19
Appendix 1. Logistic Regression Equations 19 Appendix 2. Calculating the Probability of Admission 19

Arizona State University College of Law
ii
List of Tables Table 1. Racial Composition of Applicants and Admittees 6 Table 2. Rejectees with Scores and GPAs Higher than the Median for
Black Admittees 12 Table 3. Odds Ratios of Blacks, Hispanics, and Asians Being Admitted
over White Applicants, Controlling for Other Factors 15
List of Figures Figure 1. Probability of Admission 2 Figure 2. ASU College of Law Admission Rates 8 Figure 3. LSAT Scores for Admittees 10 Figure 4. Undergraduate GPAs for Admittees 11 Figure 5. Probabilities of Admission 17

Arizona State University College of Law
1
Executive Summary The Arizona State University (ASU) College of Law awarded an extraordinarily large degree of preference to blacks and Hispanics over whites and Asians with the same credentials and background in its 2006 and 2007 entering classes. Grades and LSATs. In 2006 and 2007:
• Black admittees generally had lower LSAT scores and college GPAs than did Hispanic, Asian, and white admittees.
• Hispanic admittees’ scores and GPAs were lower than those of Asian and white admittees.
• Asian admittees generally had lower scores and GPAs than white admittees. In these two years, ASU’s law school rejected one Hispanic, 16 Asian, and 232 white applicants having higher LSAT scores and college GPAs compared to the average black admittee. Odds Ratios. Odds ratios favoring black over white candidates in admission were the largest ever found by CEO, controlling for year of admission, test scores, grades, Arizona residency, and sex. The odds ratio favoring black over white applicants with the same background and academic credentials was over 1,100 to 1. The law school also favored Hispanics and Asians over whites. The odds ratio favoring Hispanic over white applicants (controlling for background and qualifications) was 85 to 1. In contrast, the Asian-over-white odds ratio for these years was a modest 2 to 1. Probability of Admission. Converting odds ratios into probabilities of admission, for an applicant with the credentials of the average black admittee, we note that race is given much more weight in admission than is Arizona residency (see Figure 1, next page).

Arizona State University College of Law
2
Figure 1. Probability of Admission
With the same credentials as the average black admittee:
• Hispanic, Asian, and white residents are all less likely to be admitted compared to black residents and even when compared to black non-residents.
• Among residents, the largest gap is between white residents compared to black residents (and black non-residents, for that matter) with the same credentials as the average black admittee.
For example, a white resident in 2006, with the same credentials as the average black admittee, had only a 2% chance of admission – versus a 96% chance for a black resident and a 92% chance for a black non-resident. In 2007, the probabilities of admission were 8% for a white resident, 99% chance for a black resident, and 98% chance for a black non-resident, comparing applicants with the same credentials as the average black admittee.

Arizona State University College of Law
3
Acknowledgments On behalf of the Center for Equal Opportunity, I would like to thank the Scale and Effect of Admissions Preferences in Higher Education (SEAPHE) Project at UCLA, for sharing the data analyzed here and obtained originally from ASU’s law school. CEO and I also thank the National Association of Scholars and its Arizona chapter for their efforts and help in this project. I would also like to thank Linda Chavez and the staff at the Center for Equal Opportunity for giving me the chance to work on another major study of racial and ethnic preferences in university admissions. I especially would like to thank Rudy Gersten, who handled numerous tasks related to the report, and Roger Clegg, who provided useful suggestions on the manuscripts.

Arizona State University College of Law
4
Introduction For over thirty years, racial and ethnic preferences have played a key role in how admissions officers at many of the nation’s public and private institutions of higher learning have chosen their classes. A system of racial and ethnic preferences in admissions operates by establishing different standards of admission for individuals based upon their racial or ethnic background, with some students held to a higher standard and others admitted at a lower standard. Earlier in this century, some colleges and universities denied admission to Jews, blacks, women, and members of other groups even when their grades, test scores, and other measures of academic achievement surpassed those of white males who were offered an opportunity to enroll. The passage of new civil rights legislation in the 1960s made this kind of discrimination illegal. Since then, however, many colleges, universities, and professional schools have created programs meant to boost the enrollment of students whose backgrounds previously had excluded them from pursuing a higher education – especially blacks and, to a lesser extent, Hispanics – by granting them preferences during the admissions process. These policies, when their existence was made public, immediately became controversial, and they remain so today. Defenders of racial and ethnic preferences claim that these policies are not discriminatory and help administrators choose between equally or almost equally qualified students, giving a slight edge to applicants who likely have faced discrimination or have come from disadvantaged backgrounds. Critics of preferences say that these policies are no better than the discriminatory ones they replaced and that, in any event, the advantages they confer upon certain applicants are much greater than supporters are willing to admit. In the last decade or so, public institutions of post-secondary and professional education have seen their ability to use racial and ethnic preferences increasingly restricted. The 1996 enactment of California’s Proposition 209 (also known as the California Civil Rights Initiative) forbids discrimination against or granting special treatment to any applicant on the bases of race, ethnicity, or sex in the public programs of the country’s most populous state. Large majorities of voters approved similar ballot initiatives in the state of Washington in 1998 and in the state of Michigan in 2006. Other states such as Florida and Texas (for a period) have created policies that end explicit preferences and guarantee admission to the state university system to the top graduates of their respective state’s high schools regardless of race or ethnicity. The question of the legality of racial and ethnic preferences in higher education came to a head in 2003, when the U.S. Supreme Court ruled in two major cases on the legality of racial preferences in higher education admission. In the first case, Gratz v. Bollinger, the Court found that a point-system of preferences–used by the University of Michigan in its undergraduate admissions–was unconstitutional. In the second case, Grutter v. Bollinger,

Arizona State University College of Law
5
the Court upheld a system of preferences used by the University of Michigan Law School that it found to be less mechanical.1
This study of Arizona State University’s law school
The Gratz and Grutter decisions make it appropriate to monitor universities’ use of racial and ethnic preferences for at least three reasons. First, as the split holdings demonstrate, if race is weighed too heavily or too mechanically, the law is violated. Second, since racial preferences are only allowed but not required under current law, the question remains whether universities should use them, even when they are allowed to. This policy question cannot be answered if the decisionmakers – particularly those outside the university admissions office, including, in the case of public universities, the general public – do not have all the facts. Third, at the conclusion of her majority opinion in Grutter, Justice Sandra Day O’Connor wrote, “We expect that 25 years from now, the use of racial preferences will no longer be necessary.” Accordingly, one would expect to see the use of preferences and the weight afforded them to decline over time (five years of the grace period Justice O’Connor allowed have now lapsed).
2 builds on previous work on racial and ethnic preferences done for the Center for Equal Opportunity and is one of several CEO studies since the Grutter decision.3
1 In response to these decisions, Michigan voters in 2006 passed Proposal 2, banning race, ethnic, and gender preferences in Michigan public contracting, public employment, and public education, including university admissions.
As with CEO’s reports on three Virginia public law schools and the University of Michigan law school, CEO sought the data on individual applicants’ admission status, matriculation status, racial/ethnic group membership, sex, in-state or out-of-state residency, LSAT scores, and undergraduate GPAs. The Scale and Effect of Admissions Preferences in Higher Education (SEAPHE) Project at UCLA law school provided CEO with a copy of the data originally obtained from ASU for 2006 and 2007. We have omitted from the data analyses those cases for which race or ethnicity is listed as “Other,” missing, or unknown. American Indians and Native Hawaiians were also omitted because of their small numbers in this context. Also, cases with missing academic data were dropped from the statistical analyses. Lastly, where instances might lead to the identification of an individual, the law school excluded the data from disclosure.
2 The law school’s full name is the Sandra Day O’Connor College of Law (see http://www.law.asu.edu/). 3 The studies are found on CEO’s website, www.ceousa.org.

Arizona State University College of Law
6
Applicants and Admittees: 2006 and 2007
Racial/Ethnic Composition of the Pool Table 1 displays the racial composition of the law school’s pool of applicants and admittees in 2006 and 2007. Table 1. Racial Composition of Applicants and Admittees4
Applicants Admittees 2006 Black 5% 5% Hispanic 10% 13% Asian 12% 8% White 74% 73% 2007 Black 5% 6% Hispanic 10% 13% Asian 12% 8% White 73% 74%
Applicants In 2006 and 2007, blacks were 5% of all applicants and Hispanics made up 10%. Asians were 12%, while whites were 74% in 2006 and 73% in 2007.5
4 “No Response,” “American Indian,” “Native Hawaiian,” “Alaskan Native,” and “Other” were dropped from the analysis. The number of applicants and admittees is below. Applicants Admittees 2006 2007 2006 2007 Black 96 113 22 30 Hispanic 249 286 55 67 Asian 210 230 32 39 White 1,577 1,705 302 384 5 Total percentages are sometimes not equal to 100 due to rounding.

Arizona State University College of Law
7
Admittees Blacks were 5% of those admitted to ASU’s law school in 2006 and 6% of those admitted in 2007. Hispanics were 10% of applicants but constituted 13% of all those admitted in both years. While Asians were 12% of applicants, they were 8% of admittees in 2006 and 2007. Whites made up the large majority of those admitted in both years. They were 73% in 2006 and 74% in 2007 – making up roughly the same percentage of admittees as applicants.

Arizona State University College of Law
8
Admission Rates Figure 2. ASU College of Law Admission Rates
Admission rates for blacks and Hispanics were equal to or greater than those for Asian and white applicants in both years. In 2006, 23% of black applicants were admitted to ASU’s law school. In 2007, it rose by 4 points, to 27%. The admission rate for Hispanic applicants was 22% in 2006 and 23% in 2007. In contrast, 15% of Asians were admitted to ASU’s law school in 2006, which was 8 points lower than the admission rate for black applicants in the same year and 7 points lower than the admission rate for Hispanics. The differential admission rate widens in 2007. In 2007, the admission rate for Asians rose to 17%, which was 10 points lower than the black admission rate and 8 points lower than the Hispanic admission rate. There is also a differential admission rate between blacks and whites in 2006 and 2007. The admission rate for white applicants in 2006 was 19% and 23% in 2007 – 4 points lower than the black admission rate in both years. The white admission rate was also 3 points lower than the rate for Hispanics for the same year. In 2007, the white admission rate was 23%, which was equal to the admission rate for Hispanics in that same year.

Arizona State University College of Law
9
Overall Group Comparisons of Admittees’ Test Scores and Grades Methodology Just as high school seniors seeking college admission take the SAT or the ACT, prospective law school students must take the Law School Admission Test (LSAT). The LSAT is a standardized multiple-choice test consisting of questions that aim to measure analytical reasoning, logical reasoning, and reading comprehension skills. Law school admission offices usually look carefully at the undergraduate grades and LSAT scores of their applicants. LSAT scores range from 120 to 180. The mean score for LSAT test takers is 150. An LSAT score of 160 is at the 84th percentile of all test takers, while a score of 140 is at the 36th percentile. An LSAT score of 170 is at the 98th percentile. In the following section, we report group medians and related percentiles for LSAT scores and undergraduate GPAs of those admitted to the law school rather than reporting group means. Using group means places greater weight on extreme values than is warranted. That is, a few unusually high or low scores can have a substantial effect on the value of the mean. The median and related statistics, however, are far less affected by the values of extreme cases. For example, the median LSAT score (i.e., the score at the 50th percentile) is that score where half the group scored above that number and half scored below it. Similarly, the median undergraduate GPA is that grade-point average where half of those in a particular group had GPAs above it and half below it. We also report scores at the 25th and 75th percentiles, again to deal with the problem of extreme cases. While the median represents the middle of the distribution of scores, the 25th and 75th percentile scores taken together represent the actual spread of scores. For example, a GPA of 3.2 at the 25th percentile means that 25 percent of GPAs were below 3.2, while 75 percent of scores were above it. A GPA of 3.9 at the 75th percentile means that 75 percent of scores were below 3.9, while 25 percent were above it. The next section compares the LSAT scores and undergraduate GPAs of admittees by racial and ethnic group. That is, these are the test scores and grades of those admitted to the law school at the 25th, 50th, and 75th percentiles. Each year (2006 and 2007) is grouped separately.
Arizona State University College of Law
10
Results
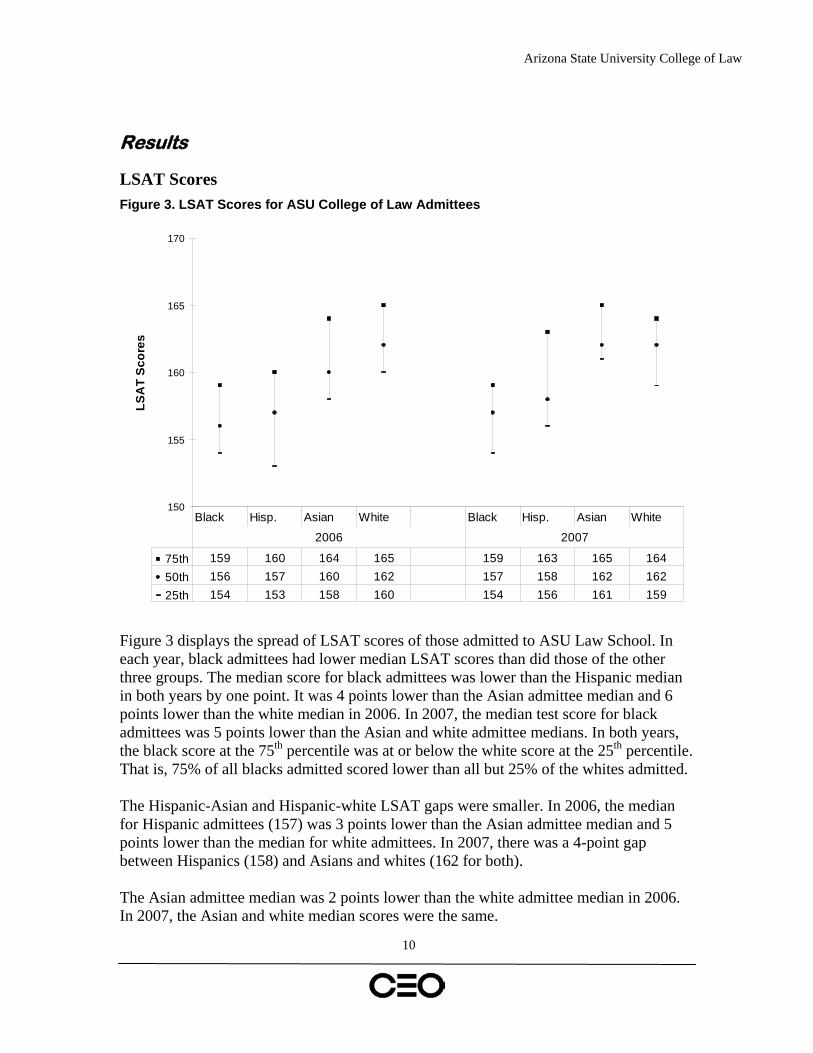
LSAT Scores Figure 3. LSAT Scores for ASU College of Law Admittees
150
155
160
165
170
LSA
T Sc
ores
75th 159 160 164 165 159 163 165 16450th 156 157 160 162 157 158 162 16225th 154 153 158 160 154 156 161 159
Black Hisp. Asian White Black Hisp. Asian White
2006 2007
Figure 3 displays the spread of LSAT scores of those admitted to ASU Law School. In each year, black admittees had lower median LSAT scores than did those of the other three groups. The median score for black admittees was lower than the Hispanic median in both years by one point. It was 4 points lower than the Asian admittee median and 6 points lower than the white median in 2006. In 2007, the median test score for black admittees was 5 points lower than the Asian and white admittee medians. In both years, the black score at the 75th percentile was at or below the white score at the 25th percentile. That is, 75% of all blacks admitted scored lower than all but 25% of the whites admitted. The Hispanic-Asian and Hispanic-white LSAT gaps were smaller. In 2006, the median for Hispanic admittees (157) was 3 points lower than the Asian admittee median and 5 points lower than the median for white admittees. In 2007, there was a 4-point gap between Hispanics (158) and Asians and whites (162 for both). The Asian admittee median was 2 points lower than the white admittee median in 2006. In 2007, the Asian and white median scores were the same.

Arizona State University College of Law
11
Undergraduate GPAs Figure 4. Undergraduate GPAs for ASU College of Law Admittees
2.5
3.0
3.5
4.0
Col
lege
GPA
s
75th 3.4 3.8 3.8 3.8 3.7 3.7 3.7 3.950th 3.3 3.5 3.6 3.7 3.4 3.4 3.5 3.725th 3.1 3.3 3.3 3.4 3.1 3.2 3.2 3.4
Black Hisp. Asian White Black Hisp. Asian White
2006 2007
The median college GPAs of blacks, Hispanics, and Asians admitted to ASU’s College of Law were lower than those of white admittees in 2006 and 2007. In 2006, the median black college GPA was a 3.3, which was two-tenths of a point lower than the median GPA of Hispanics, three-tenths lower than the GPA of Asian admittees, and four-tenths lower than the median GPA of whites admitted to ASU’s law school. In 2007, the black and Hispanic medians were the same (3.4) and lower than the median GPA for Asians (3.5) and whites (3.7) admitted to the law school.

Arizona State University College of Law
12
Rejectees versus Admittees Table 2. Rejectees with Scores and GPAs Higher than the Black Admittee Median
2006 2007 Total Black 0 0 0 Hispanic 1 0 1 Asian 12 4 16 White 170 62 232 Next we compare the test scores and college grades of those rejected by the law school to the median test scores and GPAs of black admittees. That is, we are looking at applicants who were rejected despite having higher LSAT scores and GPAs than the average black admittee. As Table 2 shows, ASU Law rejected no blacks, 1 Hispanic, and 12 Asians in 2006, and 4 Asians in 2007, with higher LSAT scores and higher college GPAs compared to the median LSAT scores and college GPAs of black admittees. The number of whites rejected by the law school despite higher LSAT scores and better grades was larger, by a considerable amount: 170 in 2006 and 62 in 2007. This results in a combined total of 232 whites rejected by the law school despite higher LSAT scores and college GPAs compared to the average for black admittees.
Arizona State University College of Law
13
Logistic Regression Analysis and Odds Ratios
Methodology Admitting students based on racial and ethnic preferences results in schools accepting preferred minorities with lower test scores and grades than those of nonpreferred minorities and white students at the same school. Admission officers essentially reach down into the applicant pool and pull up certain students, a practice that necessarily results in at least some whites with better credentials than preferred minority admittees being rejected from the same schools, despite their superior qualifications. Although the data presented thus far provide substantial evidence of the operation of racial and ethnic preferences in admissions at ASU’s College of Law, it is possible to make the case even stronger and considerably more precise. The most powerful means of assessing the degree of racial and ethnic preference in admissions is to develop a statistical model that predicts the probability of admission at a school for members of the different ethnic and racial groups, holding constant their qualifications. Computing a multiple logistic regression equation that predicts admission decisions by race and ethnicity and that includes LSAT scores and undergraduate GPAs, among other things, as statistical control variables does this. Multiple logistic regression analysis was used as the preferred statistical technique because of the nature of the data provided. One way of conventionally expressing a relationship between the independent and dependent variable is by using correlation coefficients. A negative correlation coefficient of -1.0 signifies a perfect negative relationship between the independent (predictor) variable and the dependent (or outcome) variable, whereby an increase in the value of the independent variable yields a decrease in the value of the dependent variable. A positive correlation coefficient of 1.0 signifies a perfect positive relationship between the two variables; as the independent variable increases, so does the dependent variable. Strictly speaking, however, one cannot use correlations to analyze admissions data because correlations and standard multiple regression analysis requires a dependent variable that is non-binary in form. In the case of an applicant’s admission status, the dependent variable (individual admission status) is a

Arizona State University College of Law
14
binary dependent variable—reject versus admit. To address this binary-variable problem, we rely on multiple logistic regression equations and their corresponding odds ratios. The odds ratio is somewhat like a correlation coefficient, except instead of varying from 1.0 to –1.0, it varies between zero and infinity. An odds ratio of 1.0 to 1 means that the odds of admissions for the two groups are equal. It is equivalent to a correlation of zero. An odds ratio greater than 1.0 to 1 means that the relative odds of members of Group A being admitted are greater than those for members of Group B, in precisely the amount calculated. An odds ratio of less than 1.0 to 1 means the members of Group A are less likely to be admitted than those in Group B. The former is similar to a positive correlation, the latter similar to a negative correlation. The statistical technique of multiple logistic regression allows us to present admissions data in terms of the relative odds of those in Group A being admitted as compared to Group B while simultaneously controlling for a host of other possibly confounding variables. The value of the odds ratio is that it provides a relatively direct summary measure of the degree of racial or ethnic preference given in the admissions process for a given group at a particular school. Logistic regression equations predicting the likelihood of admissions were computed for the 2006 and 2007 applicant pools, controlling for LSAT scores, undergraduate grade-point averages, sex, and in-state residency. We were able to derive the odds of admission from these equations for each minority group relative to that of whites, while simultaneously controlling for the effects of these other variables.6
In the next section, we discuss odds ratios derived from comparing blacks to whites, Hispanics to whites, and Asians to whites in the College of Law’s admission process.
Logistic regression analysis also allows us to test for statistical significance. Statistical calculations always include what is called a p-value. When results are deemed to be statistically significant, this means that the calculated p-value is less than some pre-determined cutoff level of significance. The level of significance conventionally is reported in the form of “p < .05.” This value means that, with these data, there is a probability equal to or less than 5 percent that the difference found between one group and another (e.g., blacks versus whites, Hispanics versus whites, or Asians versus whites, since minority groups are being compared to whites) is due to chance. It is a convention in statistical studies to use the 0.05 value. In more stringent analyses, 0.01 (one in 100) or occasionally 0.001 (one in 1,000) or even 0.0001 (one in 10,000) can be used as the cutoff. Any p value greater than 0.05 (or the more stringent 0.01) is rejected, and the results are said to be nonsignificant. A difference that is statistically significant, however, has very little chance of being the result of chance—that is, a statistical fluke.
6 For a discussion of logistic regression and a more complete discussion of odds ratios, see Alan Agresti, Introduction to Categorical Data Analysis (New York: John Wiley and Sons, 1996).

Arizona State University College of Law
15
Statistical significance is also noted. The size of the odds ratio reflects the strength of the association between race or ethnicity and admission status. Another way to state this is that the odds ratio measures the magnitude of the preference given relative to the baseline group (here, whites). An odds ratio equal to or greater than 3.0 to 1 is commonly thought to reflect a strong association; an odds ratio less than 3.0 to 1 but greater than 1.5 to 1 reflects a moderate association; while a relative odds ratio of 1.5 or less to 1 indicates a weak association. Of course, an odds ratio of 1.0 to 1 indicates no relationship.7 Note that a very strong association might be taken to be the rough equivalent of the relative odds of smokers versus nonsmokers dying from lung cancer, which in one well-known study is calculated as 14 to 1.8
Results: Relative Odds of Admission, Controlling for Other Factors
Table 3. Odds of Blacks, Hispanics, and Asians Being Admitted over White Applicants, Controlling for Other Factors
Odds Ratio Black over White 1,115 to 1** Hispanic over White 85 to 1** Asian over White 2 to 1* Note: * p-value <0.01; **p-value <0.0001. Table 3 displays the odds ratios of blacks, Hispanics, and Asians being admitted over white applicants with the same test scores and grades, controlling for other factors. When controlling for year of admission, LSAT scores, college GPA, residency, and sex, the black-over-white odds ratio is 1,115 to 1. This displays an extremely large preference of black over white applicants with identical qualifications. The Hispanic-over-white odds ratio is also extremely large. Hispanic applicants are clearly favored over whites with the same academic qualifications and background, by an odds ratio of roughly 85 to 1. In contrast, the Asian-over-white odds ratio is only a modest association of 2 to 1.
7 See David E. Lilienfeld and Paul D. Stolley, Foundations of Epidemiology, 3rd edition (New York: Oxford University Press, 1994): 200-202. 8 Taken from a 20-year longitudinal study of British male physicians by R. Doll and R. Peto, as quoted in Agresti, Introduction to Categorical Data Analysis, p. 47.

Arizona State University College of Law
16
Probabilities of Admission The meaning of logistic regression equations and their associated odds ratios may be difficult to grasp because the equations are complex and hard to explain without resorting to mathematical formulations. A more intuitive way to grasp the underlying dynamic of preferential admissions is to convert these logistic regression equations into estimates of the probabilities of admission for individuals with different racial/ethnic group membership, given the same LSAT scores and grades. In this section, we compare the probabilities of admission for individuals belonging to these different groups, using the logistic regression equation specific to each year. The probability calculations provide an estimate of the admission chances for members of each group, all with the same test scores and grades, residency status, and sex. We chose to examine the probabilities for in-state and out-of-state male applicants with the same LSAT score and undergraduate GPA as the median for black admittees of each year.9
9 One can compare probabilities of admission for any combination of academic qualifications, residency status, and sex. Equations for calculating probabilities for each year and each racial/ethnic group are provided in Appendix 2.
The same set of test scores and undergraduate GPAs is entered for blacks, whites, Hispanics, and Asians. Chances of admission were then calculated for a black applicant, a white applicant, a Hispanic applicant, and an Asian applicant with those academic qualifications. These calculations do not change the statistical results reported in the earlier section on odds ratios. They simply provide an easier-to-understand interpretation of their meaning. The differences in odds ratios illuminate large differences in the probability of admission based on an applicant’s race. The probability of admission is presented in Figure 5. It shows the probability of admission for blacks, Hispanics, Asians, and whites, for the same test scores and grades in a particular year.

Arizona State University College of Law
17
Figure 5. Probabilities of Admission *
*Assumes applicant is male with the same LSAT score and college GPA as the median for black admittees in that particular year. Figure 5 shows the likelihood of admission for the four groups, divided into in-state and out-of-state applicants. Applicants were assumed to have an LSAT score and college GPA equal to the median of black admittees in 2006 and 2007.10 The extremely large weight given to race can be particularly appreciated when comparing the likelihood of admission of black, Hispanic, Asian and white Arizona applicants with out-of-state applicants of the same racial and ethnic groups, all with the same academic credentials as the average black admittee. The odds ratios favoring blacks and Hispanics over whites,11 for example, are much larger than the 2 to 1 odds ratio favoring Arizona residents over non-residents (controlling for all other factors). 12
10 The median LSAT score for black admittees was 156 in 2006 and 157 in 2007. The median GPA for black admittees was 3.3 in 2006 and 3.4 in 2007. 11 1,115 to 1 and 85 to 1, respectively. 12 The odds ratio favoring female applicants is also 2 to 1.
Accordingly, the results are that, with the same credentials as the average black admittee, Hispanic, Asian, and white residents were all less likely to be admitted compared to black residents and even when compared to black non-residents in 2006 and 2007.

Arizona State University College of Law
18
In 2006, with the same scores and grades as the average black admittee, a black resident would have a 96% chance of admission, while a black non-resident would have a 92% chance of admission. Hispanic in-state applicants in 2006 with the same academic credentials as the average black admittee had a 64% chance of admission – a smaller probability of admission compared to black applicants, both in-state and out-of-state (96% and 92%, respectively). Asian in-state applicants in 2006 with these academic credentials had a 4% chance of admission. This was significantly smaller compared to black in-state and out-of-state applicants (again, 96% and 92%, respectively), and also compared to in-state and out-of-state Hispanics (64% and 46%, respectively). White in-state applicants in 2006 with the same credentials as the average black admittee had the smallest chance of admission among all in-state applicant groups (2%). It is significantly smaller than the 96% chance for black residents, the 64% chance for Hispanic residents, and the 4% chance for Asian residents. Moreover, white in-state applicants in 2006 also had a smaller chance of admission compared to out-of-state blacks (92%) and out-of-state Hispanics (46%), and the same chance of admission as out-of-state Asians (2%). The pattern is more or less the same in 2007. A black resident in 2007 had a 99% chance of admission with the same test scores and grades as the average black admittee, while a black non-resident had a 98% chance. Hispanic residents in 2007 with the same credentials as the average black admittee had an 88% chance – a smaller chance of admission than black residents and non-residents (99% and 98%, respectively). Asian residents in 2007 with the same academic credentials had a significantly smaller chance (16%) than the chances for black residents and non-residents (again, 99% and 98%, respectively). They were also less likely to be admitted compared to Hispanic residents and non-residents (88% and 79%, respectively). White residents in 2007 with these same scores and grades had the smallest admissions probability of all in-state groups. White residents had an 8% chance of admission, compared to a 99% chance for black residents, an 88% chance for Hispanic residents, and a 16% chance for Asian residents. White in-state applicants also had a smaller chance of admission compare to out-of-state blacks (98%), Hispanics (79%), and Asians (9%).

Arizona State University College of Law
19
Appendices Appendix 1. Logistic Regression Equations
Unstandardized Regression Coefficients Odds Ratio
Year 0.1606 1.1742ns LSAT 0.6997 2.0132** GPA 6.1531 470.1643** Black 7.0170 1115.4345** Asian 0.7791 2.1795* Hispanic 4.4420 84.9489** Gender 0.6453 1.9066** Resident 0.7226 2.0597** Constant -456.2243 — Note: nsNot statistically significant; *P-value<0.01; **P-values <0.0001.
Appendix 2. Calculating the Probability of Admission A = EXP((0.1606*Year) + (0.6997*LSAT) + (6.1531*GPA) + (7.0170*Black) + (0.7791*Asian) + (4.4420*Hisp.) + (0.6453*Gender) + (0.7226*Resident) + (-456.2243)) Probability of Admission to ASU’s law school = A/(1+A)

Arizona State University College of Law
20
CENTER FOR EQUAL OPPORTUNITY
The Center for Equal Opportunity (CEO) is a non-profit research institution established under Section 501(c)(3) of the Internal Revenue Code. CEO sponsors
conferences, supports research, and publishes policy briefs and monographs on issues related to race, ethnicity, and public policy.
Linda Chavez, Chairman