Embed Size (px)
Citation preview

Connecticut Department of Mental Health and Addiction Services Office of Multicultural Affairs
Health Disparities Initiative
An Evaluation of Racial and Ethnic Health Disparities in State Inpatient Services
Submitted by Yale University Program for Recovery and Community Health
January 2008

Executive Summary Throughout the U.S. healthcare system, racial and ethnic disparities are pervasive and well documented. Numerous federal reports and studies have outlined significant mental health and substance abuse inequities in access, service quality and treatment outcomes. In consideration with the most current literature and specific recommendations of the 2003 New President’s Freedom Commission Report (New Freedom Commission on Mental Health, 2003) which puts forth the national goal of healthcare systems transformation, DMHAS is committed to developing and instituting an ongoing process for identifying and eliminating behavioral health disparities. This is a critical undertaking given that, relative to their numbers in the Connecticut population (approximately 17%), individuals of color are disproportionately represented within the DMHAS system of care, comprising 38% of those receiving mental health services and 43% of individuals accessing substance abuse services. Given the importance of these issues, the Office of Multicultural Affairs (OMA) staff at Connecticut DMHAS developed a three year strategic plan for identifying and eliminating behavioral health disparities. Goal #2 of this plan was to conduct a baseline assessment of behavioral health disparities in Connecticut using statewide datasets to examine disparities in access, retention and engagement, service quality and outcomes. This analysis was conducted by the Yale Program for Recovery and Community Health (PRCH) in collaboration with OMA, the Information Systems Department (ISD) and the Office of Quality Management and Improvement (QMI). The findings from this analysis are summarized in this report. Conclusions and Recommendations The data analysis conducted for this report show that there appear to be substantial racial/ethnic disparities within the DMHAS inpatient mental health and substance abuse services. Most of the findings in this report are similar to what has been found in previous studies of racial/ethnic disparities. Additional research is recommended to more fully understand the nature and specific meanings of the differences observed in the reported data. Mental Health Settings Within mental health settings, disparities were found for five demographic variables (i.e., age, marital status, education level, housing status, employment status), one symptom-severity variable (i.e., GAF at discharge), and nine treatment-related variables (i.e., referral source, legal status at admission, primary Axis I admission diagnosis, primary Axis II admission diagnosis, length of stay, facility concurring with discharge, alert status at discharge, primary Axis I discharge diagnosis, primary Axis II discharge diagnosis), after controlling for demographic variables and symptom severity. Referral Source. Our referral-sources findings that 1) Hispanics/Latinos were less likely to be self-referred, 2) Hispanics/Latinos(as) were less likely to be referred by other sources (i.e., family, outpatient, residential, other), and 3) Hispanics/Latinos were more likely to be referred by crisis-emergency sources, suggest that Hispanics/Latinos(as) are being underserved by the

mental health system and are likely to be delaying entry to treatment until they are in crisis. These findings are similar to previous studies that found low use of inpatient services among Latino Americans (Snowden & Cheung, 1990), and low use of community mental health services by Latino Americans (Breaux & Ryujin, 1999; Cheung & Snowden, 1990) even among those with insurance (Padgett, Patrick, Burns, & Schlesinger, 1994; Scheffler & Miller, 1989). Diagnosis Axis I. Our analysis found that African Americans were more likely to be diagnosed with Schizophrenia and less likely to be diagnosed with Mood Disorders or Other Disorders as compared with White Americans (non-Hispanic) and in some cases Hispanics/Latinos(as). Previous studies have found that African Americans were more likely to be diagnosed with psychotic disorders and less likely to be diagnosed with mood disorders and other disorders (e.g., anxiety disorders) than White Americans (non-Hispanic) (Loring & Powell, 1988; Minsky, Vega, Miskimen, Gara, & Escobar, 2003; Neighbors, Jackson, Campbell, & Williams, 1989; Strakowski et al., 1997; Strakowski, Shelton, & Kolbrener, 1993; West et al., 2006; Worthington, 1992), although some studies found that the effect was no longer significant once socioeconomic status, age, sex, and education were controlled (Adebimpe, 1981; Strakowski et al., 1995). Diagnosis Axis II-Personality. The Axis II findings that 1) African Americans are less likely to have a diagnosis of Personality Disorder NOS at admission and discharge, 2) Hispanics were less likely to have a Cluster B diagnosis at discharge, and 3) Hispanics were more likely to have no diagnosis, diagnosis deferred, or diagnosis unclear at discharge are similar to other studies that have found that personality factors are under-assessed and are less likely to be treatment target among racial/ethnic minorities. Diagnosis Axis II-Mental Retardation. Our findings that African Americans were more likely than White Americans to have a diagnosis of Mental Retardation and Borderline IQ at both admission and discharge concurs with a long history of racial/ethnic bias in IQ and learning disability assessment. Despite findings that IQ tests are biased against minority group members (Guthrie, 1998; Helms, 1992), they are still being given. In addition, in many cases IQ tests are not given and Mental Retardation or Borderline IQ is merely assumed from interpersonal interactions. Without more information, we cannot know whether the African Americans in this sample who received the diagnosis of Mental Retardation/Borderline IQ were assessed with IQ tests, and, if IQ tests were given, whether the tests or norms used were culturally appropriate. Treatment Variables. Our findings that, in mental health settings, 1) African Americans and Hispanics/Latinos(as) have shorter length of stay than White Americans (non-Hispanic), 2) African Americans were more likely than White Americans (non-Hispanic) to leave treatment without the facility concurring with discharge, and 3) African Americans were discharged with significantly lower GAF at discharge than White Americans (non-Hispanic) are similar to other studies that have found that African Americans and Hispanics/Latinos(as) are more likely to leave treatment prematurely (Sue, Zane, & Young, 1994).

Substance Abuse Settings Within substance abuse settings, our analysis found racial/ethnic disparities for 3 demographic variables (i.e., gender, age, and education level), one symptom-severity variable (i.e., GAF at discharge) and 7 treatment-related variables (i.e., referral source, Axis I admission diagnosis, Axis II admission diagnosis, number of mental health admissions, length of stay, Axis I discharge diagnosis, Axis II discharge diagnosis), after controlling for demographic variables and symptom severity. Referral Source. Our findings were the opposite of national findings—that Hispanics were more likely to be self-referred or referred by other sources and less likely to be referred by crisis-emergency sources. Our finding that African Americans were more likely to be referred by criminal justice sources matches national findings. Wells et al., (2001) found that, compared to White Americans, African-Americans were more likely to have “no access” to alcoholism or drug abuse care and Hispanics/Latinos(as) were more likely to have “less care than needed or delayed care” for alcoholism and drug abuse. Diagnosis Axis I. Our analysis showed that White Americans were more likely to have alcohol-related diagnoses and African Americans and Hispanics were more likely to have drug-related diagnoses. These findings persisted at admission and discharge. Similarly, West et al., (2006) found that African-Americans were more likely to be diagnosed as having a nonalcohol substance use disorder, even after adjusting for sociodemographic and care setting/payment factors. In addition, another study (Alvidrez & Havassy, 2005) found that African Americans were more likely than White Americans to be diagnosed with cocaine, amphetamine, and opiate abuse or dependence. On the other hand, Minsky et al., (2003) did not find racial/ethnic differences in self-reported substance abuse using the BASIS-32 questionnaire. Diagnosis Axis II. In this analysis, we found that African Americans were more likely to be diagnosed with Personality Disorder NOS at admission and then, at discharge, they were more likely to have a Cluster B diagnosis and showed a trend (p=.06) towards being less likely to have no Axis II diagnosis. Hispanics were more likely to come in without an Axis II diagnosis at admission, and then to be less likely to have no Axis II diagnosis at discharge and instead to receive a diagnosis of Cluster B at discharge. Follow-up analysis showed that the primary Cluster B diagnosis used for both African Americans and Hispanics was Antisocial. As mentioned previously, Iwamasa (Iwamasa et al., 2000) found that antisocial personality disorder was more likely to be associated with African-Americans and no personality disorders were associated with Latinos. Other studies found no effect of race on diagnosis of personality disorders (Bamgbose et al., 1980; Littlewood, 1992; Warner, 1979), ratings of impulse control (Umbenhauer & DeWitte, 1978), or ratings of hostility, anxiety or fear (Jenkins-Hall & Sacco, 1991). Treatment-related variables. In addition, our analysis showed that African Americans had a longer length of stay, were more likely to be diagnosed with a personality disorder (NOS at admission and Cluster B at discharge), and had a higher Global Assessment of Functioning score at discharge. These findings concur with previous studies that African Americans are more

likely to be kept longer in more restrictive settings despite less psychopathology and are more likely to be seen as threatening in these settings and receive stigmatizing diagnoses such as personality disorders Implications and Future Directions First, because the meaning and implications of disparities related findings are difficult to interpret additional research and exploration is needed to more fully understand the findings discussed in the report. For instance, ethnic differences in several demographic variables need to be compared to CT and U.S. census data to better understand whether the observed differences in housing status or employment, for instance, are reflective of nuances within the DMHAS system of care specifically and are different from broader CT and national findings or whether they mirror CT and national findings. Understanding the observed findings within this broader context will assist with developing targeted interventions to address specific disparities. Further, as a means of better understanding factors contributing to the disparities identified, it is recommended that focus groups be conducted with consumers and providers to help explain clinical decision making and help seeking nuances that may be contributing to the observed disparities. For instance, because previous research suggests that clinician bias and delayed help seeking may contribute to the overdiagnosis of schizophrenia in African Americans, focus groups could explore such areas as help seeking preferences of African Americans, attitudes towards seeking formal mental health services and provider decisional patterns and expectancies in diagnosing schizophrenia. Additional areas for exploration in focus groups could include: factors contributing to African American consumers being more likely to leave treatment against medical advice in mental health settings, and factors contributing to Hispanics being more likely to self refer for substance abuse treatment and being less likely to self refer in mental health settings. As an additional means of understanding the disparities presented and how best to eliminate them, further research should investigate the occurrence of these disparities longitudinally by following the treatment history of an individual person across time to determine possible reasons for these disparities, the context in which they occur, and how multiple racial/ethnic disparities can impact one person. This exploratory longitudinal analysis could be done prospectively or retrospectively through client chart reviews and by conducting interviews with clients and providers. Further, chart reviews, either retrospectively or prospectively, could lend to an increased understanding of idiosyncratic decision making styles that may contribute to clinical bias. As with the proposed focus groups, observed findings could inform the intervention development process. Several findings discussed in this report mirror disparities observed at the national level and though additional exploration will lend to an increased understanding of their meaning, on a preliminary basis DMHAS disparities that match national findings should be disseminated widely throughout the DMHAS system of care. Dissemination of disparities data can serve the important function of raising awareness of the potential role of bias in the clinical decision making process, which in turn can help to minimize its impact over time. A similar phenomenon was observed in CT in 2004 when disparities in medication prescribing patterns were eliminated

following system-wide dissemination of data indicating inequities in prescribing atypical antipsychotic medications. Similar to 2004 dissemination efforts, strategies for distributing current findings can include disseminating results throughout the DMHAS system in summary reports and newsletters, presenting findings at in-service programs and cultural competence education and training sessions, and discussing findings at state and national conferences and key state or national meetings. Given that a number of findings mirror those found at the national level, it is recommended that policies be developed that state and contracted agencies develop formal structures to provide ongoing cultural competence education and training for all staff. Agencies could be asked to include ongoing training as a goal on their cultural competence plans and along with other goals, could be asked to submit biannual reports demonstrating progress in implementing their goals. Submission of these reports could coincide with agency contract renewals. In addition, agencies should be encouraged to include modules in their trainings that address the racial and ethnic disparities discussed in this document. Hopefully, if treatment professionals are aware of these racial/ethnic disparities and trained in how to address them, over time these disparities could be eliminated. As an additional strategy, incorporation of key cultural information in the outreach and peer mentoring process can help to increase both access to care and engagement once an individual has sought services. For instance, informing individuals about the culture of, and strategies for navigating formal mental health services can help to orient individuals to the process of seeking formal mental health care. This may be particularly important for individuals seeking formal help for the first time, or for individuals for whom seeking formal mental health services is incongruent with their cultural norms for coping with psychological distress. Thus, for some individuals having information about what can be expected when receiving inpatient care can help to dispel potential surprises about the care process which could help to minimize individuals leaving treatment against medical advice. Because previous research has shown provider bias to contribute to disparities in the overdiagnosis of schizophrenia among African Americans it is recommended that cultural assessments instruments or addendums be incorporated throughout the treatment process. Obtaining a range of cultural information such as an individual’s spiritual beliefs and preferences, cultural understanding of their distress, immigration history, acculturation level and family constellation, for instance, can help to minimize the potential of incorporating stereotypic information in the clinical decision making and treatment process. Several findings suggest that Hispanic Americans and African Americans may be underserved by the DMHAS system of care for mental health problems (i.e., Hispanics being less likely to self refer for mental health problems and being less likely to be referred by other sources, African Americans leaving treatment against medical advice). As a means of improving access and engagement into treatment several specific strategies could be employed. For instance, holding community picnics or information fairs and disseminating information about specific culturally responsive programs and services can help to increase awareness of existing services which could, in turn, increase access to care. In addition, disseminating information regarding the availability of bilingual/ bicultural providers may help to increase access and self referral

rates for Hispanic American individuals who may be monolingual Spanish speaking and have a preference for seeking help from a culturally similar provider. Further, because the overall numbers of bilingual/bicultural providers throughout the state are limited use of telemedicine technology can help to increase access to care for monolingual Spanish speaking individuals, particularly those that may be living in rural areas. Limitations These findings and the conclusions drawn from them should be tempered by the limitations of this data set. A primary limitation is the cross-sectional nature of these data: the data represent the treatment information associated with specific individuals at one specific inpatient admission but do not put these variables in context for an individual person over time or offer reasons for why they occur. Future investigations would benefit from looking at mental health information longitudinally within an individual person (see discussion of future directions). A second limitation to this analysis was the coding of the alert status at discharge variable. For the alert status at discharge variable, the only code in the data set was for “yes, alert status” and there was a large amount of missing data, so it was assumed that missing data meant “no alert status,” although it is possible and indeed likely that there is missing data for some people who were on alert status. Also, for legal status at admission, 47% of the mental health setting sample had missing data across race and ethnicities. A third limitation was that the analysis for the mental health setting was conducted with a smaller number of Hispanic individuals than African Americans and White Americans (non-Hispanic). The validity of chi-square and logistic regression data is quite good with an unequal number of individuals in each group but this inequality is nonetheless a limitation. A fourth limitation to this analysis was the large variability in some of the data, in particular the length of stay variable. In order to prevent the variability from skewing the statistical analysis conducted for this report, outliers whose length of stay were more than 2 standard deviations above the mean or equal to zero were removed from this analysis (see analysis plan).

Background Behavioral Health Disparities within the U.S. Healthcare System Disparities according to race, ethnicity and gender have been demonstrated at every level of behavioral health service delivery, including access to care, service utilization and quality, and subsequent health outcomes. Research documenting access to behavioral health care, reveals mixed results with some studies showing populations of color are less likely to use services, while others show service use rates comparable to White Americans, and still others show an over-utilization of certain forms of care. For example, Snowden (1999) found that although African Americans were more likely to be represented among groups with high need for mental health services, they were less likely than White Americans to receive regular, on-going care from a private therapist, or at a mental health center, and were more likely to have sought help on an emergency basis. Similarly, Wu, et al (2004) after controlling for treatment need and duration, found that African American and Latino methodone maintenance clients used fewer supplemental services (psychosocial and or behavioral health) than their White counterparts. Generally, research shows that the critical factor in understanding service use patterns is taking into account whether the findings are based on public versus private mental health data, inpatient versus outpatient data, and the type of problem for which services are sought (Neighbors & Jackson, 1996; Snowden, 1999). Research additionally suggests that populations of color experience inequities in the quality of care received. For instance, studies have consistently shown that relative to White Americans, African American and Latinos are more likely to be over-diagnosed and misdiagnosed with schizophrenia and tend to be underdiagnosed in the affective disorder categories (Flaskurud & Hu, 1992; Garb, 1998; Garretson, 1993). Disparities have additionally been demonstrated in medication prescribing patterns. Rothbard, Kuno, and Foley (2003) in their study based on a sample of individuals receiving Medicaid, and diagnosed with schizophrenia, found that African Americans were less likely than White Americans to receive atypical antipsychotics, and were more likely to receive older antipsychotic medications. Indeed, disparities in behavioral health service provision are pervasive and problematic for a number of reasons. Undoubtedly, their presence suggests that populations of color may experience numerous unmet behavioral health needs, and as a result may live with a greater disability burden (U.S. Department of Health and Human Services, 2001). Further, given that population projections suggest that individuals of color will comprise nearly 48% of the U.S. population by the year 2050, if left unaddressed, one may expect disparities in care to increase with increasing population numbers (U.S. Census Bureau, 2001; U.S. Department of Health and Human Services, 2001). Given this, a primary recommendation for eliminating disparities has been the need for more research into the causes of these healthcare inequities such that interventions may address identified root causes.

The Current Study In an effort to evaluate behavioral health disparities within the Connecticut DMHAS system, this analysis examined behavioral health data from consumers in inpatient mental health and inpatient substance abuse settings within the CT DMHAS mental health system. In total, data from 1000 Black, 984 Hispanic/Latino(a), and 1000 White (non-Hispanic) consumers were analyzed. Half of the data was from consumers who received services in inpatient mental health settings and half of the data was from consumers receiving services in substance abuse settings. (Note: because of fewer numbers of Hispanics/Latinos(as) in inpatient mental health settings, data from 484 consumers were compared to data from 500 African Americans and 500 White Americans (non-Hispanic) consumers). Data was obtained through a random extract from the DMHAS DPAS information system of patients admitted to DMHAS inpatient facilities during the years 2004-2005. Given the differences in nature of behavioral health services in these two settings, the analysis will be conducted separately for these two settings. Findings
Inpatient Mental Health Setting Preliminary Data Analysis The DPSS data extract for this setting included fewer Hispanics/Latinos(as) (N=487) than African Americans (N=500) and White Americans (non-Hispanic) (N=500) because data from 500 consumers was not available from this ethnicity. Length of stay was found to have large variability in this extract which was likely to affect subsequent analyses (M=109.2, SD=400.21). After removing 24 outliers with length of stay greater than 2 standard deviations above the mean, and after removing consumers with length of stay equal to 0, the following number of consumers was included in each ethnic/racial category: African Americans 494 Hispanics/Latinos(as) 411 White Americans (non-Hispanic) 478 Descriptive statistics The following table summarizes the descriptive statistics and chi-square or ANOVA analysis for the relevant variables included in this analysis. Table 1 Demographic and Treatment-Related Variables for Inpatient Mental Health Settings African Americans
Hispanics/Latinos White Americans (non-Hispanic)
N = 494 N = 411 N = 478

N or mean±SD % N or mean±SD % N or mean±SD % F or Χ2 df p
Male 335 68 280 68 303 63 2.93 2 .23
Mean Age 35.85 ±11.48 33.79±12.01 38.58±12.70 17.68 2, 1380 <.001
Marital Status
Unmarried 457 93 365 89 444 93
Married 36 7 46 11 32 7 6.74 2 .03
Education Level
Less than high school 152 36 210 59 88 22
At least a high school degree 271 64 146 41 311 78 110.15 2 <.001
Housing Status
Homeless 91 20 62 16 66 14
Housed 371 80 338 84 395 86 5.30 2 .07
Employment status
Unemployed 444 94 354 90 407 90
Employed (full or part time) 29 6 37 10 48 10 6.21 2 .05
GAF at admission 31.72±10.21 30.94±10.55 31.83±10.52 .834 2, 1202
.44
GAF at discharge 45.66±9.82 47.27±11.32 47.85±9.74 4.23 2, 995
.02
Referral Source
Self-referral 64 13 23 6 62 13 16.31 2 <.001
Other inpatient setting 63 13 38 9 87 18 15.55 2 <.001
Criminal justice system 74 15 58 14 57 12 2.02 2 .36
Crisis/emergency 234 47 260 63 230 48 27.96 2 <.001
Other 59 12 32 8 42 9 5.040 2 .08
Legal status at admission
Voluntary 124 25 69 17 115 24 10.31 2 .006
Department of corrections 71 14 56 14 56 12 1.57 2 .46
Emergency certification 85 17 79 19 79 17 1.18 2 .56
Primary Axis I diagnosis at admission
Schizophrenia 129 28 42 11 69 16 43.06 2 <.001
Other psychotic dis. 135 27 114 28 97 20 9.29 4 .05
Mood disorders 94 20 158 41 176 40 55.48 2 <.001
Alcohol-related disorders 16 3 18 4 25 5 2.37 2 .31
Drug-related disorders 71 14 32 8 38 8 14.65 2 .001
Other disorders 21 5 31 8 38 9 6.89 2 .03

Table 1 Demographic and Treatment-Related Variables for Inpatient Mental Health Settings African Americans
Hispanics/Latinos White Americans (non-Hispanic)
N = 494 N = 411 N = 478
N or mean±SD % N or mean±SD % N or mean±SD % F or Χ2 df p
Primary Axis II diagnosis at admission
Cluster A Personality Disorders 3 1 0 0 3 1 2.55 2 .28
Cluster B Personality Disorders 41 9 22 6 51 12 8.60 2 .01
Cluster C Personality Disorders 0 0 1 0 3 1 3.43 2 .18
Personality Disorders NOS 16 4 24 6 29 7 5.30 2 .07
Mental Retardation/ Borderline IQ
26 6 26 7 10 2 10.13 2 .006
Diagnosis deferred, unclear or no diagnosis
377 76 308 75 343 72 2.76 2 .25
Number of inpatient mental health admissions
3.86±6.21 3.17±4.10 3.68±5.74 1.87 2, 1380
.16
Number of inpatient substance abuse facilities
.56±1.45 .75±1.51 .56±1.46 2.27 2, 1380
.10
Number of inpatient forensic admissions
.10±.40 .07±.34 .03±.21 4.63 2, 1380
.01
Total number of inpatient admissions 4.516±6.56 3.98±4.67 4.27±5.89 .94 .39
Length of stay in current facility 59.08±98.39 61.87±111.32 74.78±112.07 2.91 2, 1380
.06
Facility concurs with discharge (#/%=no)
30 6 10 3 11 2 12.06 2 .002
Alert status at discharge (#/%=yes)
17 3 25 6 9 2 11.11 2 .004
Primary Axis I diagnosis at discharge
Schizophrenia 116 28 35 10 46 12 53.83 2 <.001
Other psychotic dis. 101 25 87 26 77 20 3.89 2 .14
Mood disorders 91 22 149 44 171 44 54.60 2 <.001
Alcohol-related disorders 19 4 12 3 27 6 4.61 2 .10
Drug-related disorders 69 14 27 7 28 6 23.69 2 <.001
Other disorders 21 5 36 11 37 10 8.69 2 .01
Primary Axis II diagnosis at discharge
Cluster A Personality Disorders 4 1 1 0 2 0 1.48 2 .48
Cluster B Personality Disorders 49 12 28 8 68 18 14.38 2 <.001
Cluster C Personality Disorders 0 0 3 1 3 1 3.46 2 .18
Personality Disorders NOS 34 8 31 9 46 12 3.150 2 .21
Mental Retardation/ Borderline IQ
28 7 27 8 11 3 9.92 2 .007
Diagnosis deferred, unclear or no diagnosis
295 60 247 60 256 54 5.153 2 .08
Listed first in Table 1 are the demographics for this sample as they varied across race and ethnicity. A one-way ANOVA showed that White Americans (non-Hispanic) were significantly

older than African Americans and Hispanics/Latinos(as), and African Americans were significantly older than Hispanics/Latinos(as). Chi-square test for independence showed that Hispanics/Latinos(as) were more likely to be married. In addition, Hispanics/Latinos(as) were less likely to have at least a high school degree than African Americans and White Americans (non-Hispanic). African Americans showed a trend (p=.07) towards being more likely to be homeless. Also, African Americans were less likely to be employed than Hispanics/Latinos(as) and White Americans (non-Hispanic). One way ANOVA with Tukey post-hoc tests showed that, at discharge, White Americans (non-Hispanic) were discharged with significantly higher GAF’s than African Americans. Next, the treatment-related variables investigated in this analysis are shown across race and ethnicity. Chi-square tests for independence showed that Hispanics/Latinos(as) were least likely to be self-referred. Also, Hispanics/Latinos(as) were least likely to be referred by another inpatient facility. Hispanics/Latinos(as) were most likely to be referred by crisis/emergency sources as compared to African Americans and White Americans (non-Hispanic). African Americans showed a trend (p=.08) towards being more likely to be referred by other sources (i.e., family, outpatient, residential, other). In addition, chi-square tests for independence showed that Hispanics were least likely to be admitted with a voluntary legal status. Notable in this analysis, however, was that legal status information was missing for 47% of the sample, across race and ethnicities. Across race/ethnicities, the most common kind of primary Axis I admission diagnosis (33.3%) was mood disorders (Depressive Disorders, Bipolar Disorders, Dysthymia, Cyclothymia, Mood Disorder NOS, Depressive Disorder NOS). Other psychotic disorders (Schizophreniform Disorder, Schizoaffective Disorder, Delusional Disorder, Shared Psychotic Disorder, Brief Psychotic Disorder, and Psychotic Disorder NOS) were the next most common primary Axis I diagnoses (26.9%). Schizophrenia was also a common primary Axis I diagnosis (18.7%). Alcohol and drug-related diagnoses were the primary Axis I diagnoses for 14.0% of the sample (within this category 28% of consumers had primary Alcohol-related diagnoses and 72% had primary Drug-related diagnoses). And 7.0% of the sample had other diagnoses as their primary diagnosis (e.g., anxiety disorders, eating disorders, somatization disorders, sexual disorders, adjustment disorder). Chi-square tests for independence showed that African Americans were most likely to have a primary Axis I admission diagnosis of Schizophrenia. Hispanics/Latinos(as) and African Americans were more likely than White Americans (non-Hispanic) to be diagnosed with Other Psychotic Disorders (see previous paragraph for list of diagnoses included in this category). African Americans were less likely than Hispanics/Latinos(as) and White Americans (non-Hispanic) to be diagnosed with Mood Disorders. African Americans were more likely than Hispanics/Latinos(as) and White Americans (non-Hispanic) to be diagnosed with Alcohol or Drug-Related Disorders. African Americans were less likely than White Americans (non-Hispanic) and Hispanics/Latinos(as) to be diagnosed with Other Diagnoses (see above for sample diagnoses).

Across race/ethnicities, the most common kind of primary Axis II admission diagnosis was Diagnosis Deferred (57.7%) and No Diagnosis (22.4%). Among the personality disorders, the Cluster B diagnoses (i.e., Borderline, Histrionic, Antisocial, Narcissistic) were the most common (8.9%) primary Axis II admission diagnoses across race/ethnicity, followed by Personality Disorder NOS (5.4%), Cluster A diagnoses (i.e., Paranoid, Schizoid, Schizotypal—0.5%), and Cluster C diagnoses (i.e., Avoidant, Obsessive-Compulsive PD, Dependent—0.3%). Mental Retardation and Borderline IQ were primary Axis II admission diagnoses for 4.8% of the sample, across race/ethnicity. Chi-square tests for independence showed that Hispanics/Latinos(as) were least likely to be diagnosed with Cluster B Personality Disorders. There was a trend (p=.07) towards African Americans being less likely to be diagnosed with Personality Disorder NOS. White Americans were less likely than African Americans and Hispanics/Latinos(as) to be diagnosed with Mental Retardation or Borderline IQ. A count was conducted of the number of times that an individual consumer was admitted to inpatient mental health facilities, inpatient substance abuse facilities, and inpatient forensic facilities. Then, a total number of inpatient admissions was calculated, comprised of a sum of the three previous variables (i.e., sum of total number of inpatient mental health, substance abuse, and forensic admissions). One-way ANOVAs showed that the average number of inpatient mental health admissions, substance abuse admissions, and total inpatient admissions did not vary across race/ethnicities (see Table 1). However, African Americans had significantly more admissions to forensic facilities than White Americans (p=.007, Tukey post-hoc tests). Across ethnicities, the average length of stay in the current inpatient mental health facility was 65.33 (SD=107.30) days (range 1 to 915). (Note: before this analysis was conducted, outliers were removed for people with length of stays greater than 2 standard deviations above the mean and length of stays equal to zero (see analysis plan) so the reported range and standard deviation reported here is truncated from the dispersion of the original data). A one-way ANOVA showed a trend (p=.06) towards African Americans having significantly shorter length of stay than White Americans (non-Hispanic) (p=.058, Tukey post hoc tests). A chi-square test for independence showed that African Americans were more likely to be discharged with the facility NOT concurring with discharge. In addition, we investigated whether race/ethnicity was related to being discharged with an alert status (i.e., parole, probation, on bail, correctional hold, secret service hold, general alert). However, in this data set, only “yes, on alert status” was coded and alert status information was missing for most of the participants (96.3%). We assumed that missing data meant that the consumer was discharged with no alert status although this assumption is potentially problematic (see limitations section at end of report). A chi-square test for independence showed that Hispanics/Latinos(as) were most likely to have an alert status at discharge. At discharge, across race/ethnicity, the percentage of people having each type of primary Axis I diagnosis was similar to the admission data: Mood Disorders were most common (36.2%), followed by Other Psychotic Disorders (23.3%), Schizophrenia (17.4%), Alcohol and Drug-

related Disorders (14.8%--within this category 30% of consumers has Alcohol-related diagnoses and 70% had Drug-related diagnoses), and Other Diagnoses (8.3%--see results from primary Axis I admission diagnosis for a list of the disorders that are included in each category of diagnoses). Chi-square tests for independence showed that African Americans were most likely to have a primary Axis I discharge diagnosis of Schizophrenia. African Americans were least likely to be diagnosed with Mood Disorders. African Americans were most likely to be diagnosed with Alcohol- or Drug-related Disorders. Finally, African Americans were least likely to be diagnosed with Other Disorders. Also, with Axis II, the distribution of the primary discharge diagnoses was similar to the primary admission diagnoses across race/ethnicity: No Diagnosis and Diagnosis Deferred were most common, followed by Cluster B diagnoses (12.8%), Personality Disorder NOS (9.8%), Cluster A diagnoses (0.6%), Cluster C diagnoses (0.5%). Mental Retardation and Borderline IQ were primary Axis II discharge diagnoses for 5.8% of the sample. Chi-square tests for independence showed that Hispanics/Latinos(as) were least likely to be have a primary Axis II discharge diagnosis of Cluster B Personality Disorders, White Americans (non-Hispanic) were least likely to be diagnosed with Mental Retardation/Borderline IQ, and there was a trend (p=.08) towards White Americans (non-Hispanic) being less likely to have Diagnosis Deferred, Unclear, or No Diagnosis on Axis II at discharge. Analysis Plan: Our goal in this analysis was to investigate whether treatment-related variables (e.g., referral source at admission, length of stay, diagnosis) differed as a function of race/ethnicity after controlling for demographic variables and symptom severity, since demographic variables are often correlated with race/ethnicity. For this analysis, we decided to control for variables that have been shown in previous studies to be related to race/ethnicity: Sex Marital status (yes/no) Education level (no high school degree vs. at least high school degree/GED) Employment status (no/yes--full or part time) Living arrangement (homeless/housed) Age at admission Admission Global Assessment of Functioning (GAF) If the relationship between race/ethnicity and treatment-related variables still exists even after controlling for demographic variables and symptom severity, this gives stronger evidence for behavioral health disparities and suggests that the differences are not an artifact of demographic variables or symptom severity. Presented in the following tables is the expected beta or standardized beta and associated statistics for all variables included in the second model (i.e., demographics, symptom severity, race/ethnicity). Only regression analyses that have significant race/ethnicity factors are presented in the tables.

Referral source at admission: Self-Referral Predictor Exp(B) 95%
CI Lower
95% CI Upper
Sig -2 log likely-hood
I. Demographic Variables 564.212 Sex 1.034 .644 1.663 .889 Marital Status 1.204 .554 2.617 .640 Education Level (-hs vs. hs+) 1.594 .935 2.715 .086 Employment Status 1.513 .773 2.961 .227 Housing Status 1.254 .659 2.386 .490 Admission Age 1.012 .993 1.032 .209 Admission GAF 1.097 1.075 1.120 .000 II. Race/Ethnicity 553.357 Black vs. White (non-Hispanic) 1.285 .787 2.100 .316 Hispanic vs. White (non-Hispanic) .460 .236 .896 .022 Predictor Exp(B) 95%
CI Lower
95% CI Upper
Sig -2 log likely-hood
II. Race/Ethnicity 553.357 Black vs. Hispanic 2.794 1.470 5.312 .002 White (non-Hispanic) vs. Hispanic 2.174 1.116 4.236 .022 Logistic regression showed that, after controlling for demographic variables and symptom severity, African Americans were significantly more likely to be self-referred than Hispanics/Latinos(as). In fact, African Americans were 179% more likely to be self-referred than Hispanics/Latinos(as). Also, White Americans (non-Hispanic) were significantly more likely to be self-referred than Hispanics/Latinos(as). In fact, White Americans (non-Hispanic) were 117% more likely to be self-referred than Hispanics/Latinos(as). Examination of the controlling variables showed that Admission GAF was also significantly related to self-referral. As Admission GAF increased by one point, likelihood of self-referral increased by 9%. Inpatient referral Predictor Exp(B) 95%
CI Lower
95% CI Upper
Sig -2 log likely-hood
I. Demographic Variables 707.00 Sex 1.484 .998 2.207 .051 Marital Status .957 .470 1.952 .904

Education Level (-hs vs. hs+) 1.257 .807 1.957 .311 Employment Status .224 .069 .728 .013 Housing Status .811 .498 1.318 .397 Admission Age 1.019 1.002 1.036 .028 Admission GAF 1.003 .984 1.022 .769 II. Race/Ethnicity 701.88 Black vs. White (non-Hispanic) .630 .398 .995 .048 Hispanic vs. White (non-Hispanic) .617 .368 1.034 .067 Predictor Exp(B) 95%
CI Lower
95% CI Upper
Sig -2 log likely-hood
II. Race/Ethnicity 701.88 Black vs. Hispanic 1.020 .600 1.737 .941 White (non-Hispanic) vs. Hispanic 1.620 .967 2.714 .067 Logistic regression showed that, after controlling for demographic variables and symptom severity, African Americans were significantly less likely to be referred by inpatient sources than White Americans (non-Hispanic). In fact, African Americans were 37% less likely to be referred by inpatient sources than White Americans (non-Hispanic). Examination of the significance of the controlling variables shows that employment status and admission age were significantly related to inpatient referral. In fact, employed people were 78% less likely to be referred by another inpatient facility. Also, with each increasing year of age, patients were 2% more likely to be referred by another inpatient facility. Criminal justice referral Logistic regression showed that, after controlling for demographic variables and symptom severity, criminal justice system referral was not related to race/ethnicity (all p’s>.05). Crisis/emergency sources Predictor Exp(B) 95%
CI Lower
95% CI Upper
Sig -2 log likely-hood
I. Demographic Variables 1189.12 Sex 1.205 .893 1.626 .222 Marital Status .963 .579 1.601 .885 Education Level (-hs vs. hs+) 1.387 1.018 1.888 .038 Employment Status 2.345 1.379 3.987 .002 Housing Status .667 .463 .961 .030 Admission Age .968 .956 .980 .000 Admission GAF .934 .921 .948 .000 II. Race/Ethnicity 1171.71

Black vs. White (non-Hispanic) .926 .665 1.290 .650 Hispanic vs. White (non-Hispanic) 1.887 1.303 2.731 .001 Predictor Exp(B) 95%
CI Lower
95% CI Upper
Sig -2 log likely-hood
II. Race/Ethnicity 1171.71 White(non-Hispanic) vs. Black 1.080 .775 1.505 .650 Hispanic vs. Black 2.037 1.424 2.915 .000 Logistic regression showed that, after controlling for demographic variables and symptom severity, Hispanics/Latinos(as) were significantly more likely to be referred by crisis/emergency sources than White Americans (non-Hispanic) and African Americans. In fact, Hispanics/Latinos(as) were 89% more likely than White Americans (non-Hispanic) and 103% more likely than African Americans to be referred by crisis/emergency sources. Examination of controlling variables showed that education level, employment status, housing status, admission age, and admission GAF were all related to crisis/emergency referral. In fact, with each increasing year of admission age, people were 3% less likely to be referred by crisis/emergency sources. Also, as the admission GAF score increased, people were 7% less likely to be referred by crisis/emergency sources. In addition, people with at least a high school education were 39% more likely, employed people were 135% more likely, and people who were housed were 33% less likely to be referred by crisis/emergency sources. Referral by Other Sources (i.e., Family, Outpatient, Residential, Other) Predictor Exp(B) 95%
CI Lower
95% CI Upper
Sig -2 log likely-hood
I. Demographic Variables 612.53 Sex 1.074 .679 1.699 .761 Marital Status .959 .422 2.181 .921 Education Level (-hs vs. hs+) .766 .478 1.226 .267 Employment Status .932 .425 2.044 .861 Housing Status 1.142 .635 2.054 .656 Admission Age 1.003 .984 1.022 .747 Admission GAF 1.017 .997 1.037 .092 II. Race/Ethnicity 606.91 Black vs. White (non-Hispanic) 1.169 .713 1.916 .537 Hispanic vs. White (non-Hispanic) .596 .323 1.097 .096 Predictor Exp(B) 95%
CI Lower
95% CI Upper
Sig -2 log likely-hood
II. Race/Ethnicity 606.91 Black vs. Hispanic 1.962 1.101 3.496 .022

White (non-Hispanic) vs. Hispanic 1.679 .912 3.093 .096 Logistic regression showed that, after controlling for demographic variables and symptom severity, African Americans were significantly more likely to be referred by other sources than Hispanics/Latinos(as). In fact, African Americans were 96% more likely to be referred by other sources than Hispanics/Latinos(as). No controlling variables were significantly related to referral by other sources (all p’s >.05). Legal Status at Admission Voluntary admission Predictor Exp(B) 95%
CI Lower
95% CI Upper
Sig -2 log likely-hood
I. Demographic Variables 936.13 Sex 1.356 .963 1.910 .081 Marital Status 1.263 .705 2.261 .433 Education Level (-hs vs. hs+) 1.114 .772 1.609 .564 Employment Status 2.087 1.253 3.476 .005 Housing Status 1.556 .973 2.489 .065 Admission Age .995 .981 1.009 .468 Admission GAF 1.073 1.056 1.090 .000 II. Race/Ethnicity 922.43 Black vs. White (non-Hispanic) .997 .687 1.447 .986 Hispanic vs. White (non-Hispanic) .480 .307 .751 .001 Predictor Exp(B) 95%
CI Lower
95% CI Upper
Sig -2 log likely-hood
II. Race/Ethnicity 922.43 White (non-Hispanic) vs. Black 1.003 .691 1.456 .986 Hispanic vs. Black .482 .312 .745 .001 After controlling for demographic variables and symptom severity, Hispanics/Latinos(as) were significantly less likely to be admitted with a voluntary legal status than White Americans (non-Hispanic) and African Americans. In fact, Hispanics/Latinos(as) were 52% less likely than both White Americans (non-Hispanic) and African Americans to be admitted with a voluntary legal status. Examination of the relationship between demographic/symptom severity and voluntarily admission showed that employment status and admission GAF were significantly related to voluntary legal status at admission. In fact, people who were employed were 109% more likely to be admitted with voluntary legal status than people who were unemployed. Also, as admission GAF increased, people were 7% more likely to be admitted voluntarily.

Criminal Justice Legal Status Logistic regression showed that, after controlling for demographic variables and symptom severity, criminal justice legal status was not related to race/ethnicity (all p’s>.05). Emergency Citation Legal Status Logistic regression showed that, after controlling for demographic variables and symptom severity, emergency citation legal status was not related to race/ethnicity (all p’s>.05). Primary Axis I Diagnosis at Admission Schizophrenia Predictor Exp(B) 95%
CI Lower
95% CI Upper
Sig -2 log likely-hood
I. Demographic Variables 869.65 Sex .505 .341 .749 .001 Marital Status .354 .149 .843 .019 Education Level (-hs vs. hs+) .789 .547 1.137 .204 Employment Status .438 .194 .990 .047 Housing Status .681 .454 1.023 .064 Admission Age 1.029 1.014 1.044 .000 Admission GAF .985 .969 1.002 .091 II. Race/Ethnicity 846.75 Black vs. White (non-Hispanic) 2.013 1.349 3.004 .001 Hispanic vs. White (non-Hispanic) .766 .468 1.255 .291 Predictor Exp(B) 95%
CI Lower
95% CI Upper
Sig -2 log likely-hood
II. Race/Ethnicity 846.75 Black vs. Hispanic 2.627 1.681 4.104 .000 White (non-Hispanic) vs. Hispanic 1.305 .797 2.138 .291 Logistic regression showed that, after controlling for demographic variables and symptom severity, African Americans were significantly more likely to have a primary Axis I admission diagnosis of Schizophrenia than White Americans (non-Hispanic) and Hispanics/Latinos(as). Specifically, African Americans were 113% more likely than White Americans and 162% more likely than Hispanics to have a primary Axis I admission diagnosis of Schizophrenia. Examination on the controlling variables shows that sex, marital status, employment status, and admission age are also related to having a primary Axis I diagnosis of Schizophrenia at admission. Females were 49% less likely than males, married people were 65% less likely than

unmarried people, and employed people were 66% less likely than unemployed people to have a primary Axis I diagnosis of Schizophrenia at admission. In addition, the likelihood of having a primary Axis I diagnosis of schizophrenia increased by 3% with each increasing year of admission age. Other Psychotic Disorders Predictor Exp(B) 95%
CI Lower
95% CI Upper
Sig -2 log likely-hood
I. Demographic Variables 1087.05 Sex .926 .678 1.264 .628 Marital Status 1.000 .585 1.708 .999 Education Level (-hs vs. hs+) 1.345 .975 1.856 .071 Employment Status .338 .174 .657 .001 Housing Status 1.614 1.076 2.422 .021 Admission Age .991 .978 1.003 .150 Admission GAF .962 .947 .977 .000 II. Race/Ethnicity 1082.92 Black vs. White (non-Hispanic) 1.297 .905 1.857 .156 Hispanic vs. White (non-Hispanic) 1.472 1.002 2.162 .049 Predictor Exp(B) 95%
CI Lower
95% CI Upper
Sig -2 log likely-hood
II. Race/Ethnicity 1082.92 Black vs. Hispanic .881 .613 1.266 .493 White (non-Hispanic) vs. Hispanic .679 .463 .998 .049 Hispanics/Latinos(as) were significantly more likely to have a primary Axis I admission diagnosis of Other Psychotic Disorders than White Americans (non-Hispanic). Specifically, Hispanics/Latinos(as) were 47% more likely to have a primary Axis I admission diagnosis of Other Psychotic Disorders than White Americans (non-Hispanic). Examination of the controlling variables showed that employment status, housing status, and admission GAF were all related to have a primary Axis I admission diagnosis of Other Psychotic Disorders. In fact, employed people were 66% less likely and people who had housing were 61% more likely to have a primary Axis I admission diagnosis of Other Psychotic Disorders. In addition, as GAF increased by one point, patients were 4% less likely to have a primary Axis I admission diagnosis of Other Psychotic Disorders. Mood Disorders Predictor Exp(B) 95%
CI Lower
95% CI Upper
Sig -2 log likely-hood

I. Demographic Variables 1191.27 Sex 1.565 1.167 2.100 .003 Marital Status 1.221 .742 2.007 .432 Education Level (-hs vs. hs+) 1.171 .857 1.602 .322 Employment Status 1.819 1.142 2.900 .012 Housing Status 1.018 .701 1.479 .924 Admission Age .995 .982 1.007 .392 Admission GAF .988 .975 1.002 .084 II. Race/Ethnicity 1160.66 Black vs. White (non-Hispanic) .472 .331 .671 .000 Hispanic vs. White (non-Hispanic) 1.212 .855 1.720 .280 Predictor Exp(B) 95%
CI Lower
95% CI Upper
Sig -2 log likely-hood
II. Race/Ethnicity 1160.66 Black vs. Hispanic .389 .270 .561 .000 White (non-Hispanic) vs. Hispanic .825 .582 1.170 .280 African Americans were significantly less likely to have a primary Axis I admission diagnosis of Mood Disorders than White Americans (non-Hispanic) and Hispanics/Latinos(as). Specifically, African Americans were 53% less likely than White Americans (non-Hispanic) and 61% more likely than Hispanics/Latinos(as) to have a primary Axis I admission diagnosis of Mood Disorders. Examination of the controlling variables showed that sex and employment status were also related to having a primary Axis I admission diagnosis of a mood disorder. Women were 57% more likely and employed people were 82% more likely to have a primary Axis I admission diagnosis of a mood disorder. Alcohol-related Disorders Logistic regression showed that, after controlling for demographic variables and symptom severity, primary Axis I admission diagnosis of Alcohol-related disorders was not related to race/ethnicity (all p’s>.05). Drug-related Disorders Predictor Exp(B) 95%
CI Lower
95% CI Upper
Sig -2 log likely-hood
I. Demographic Variables 634.70 Sex 1.207 .772 1.888 .410 Marital Status 2.057 1.049 4.035 .036 Education Level (-hs vs. hs+) .728 .460 1.207 .176 Employment Status 1.655 .869 3.154 .125

Housing Status 1.018 .575 1.803 .951 Admission Age .984 .966 1.004 .112 Admission GAF 1.067 1.048 1.087 .000 II. Race/Ethnicity 618.87 Black vs. White (non-Hispanic) 1.895 1.160 3.097 .011 Hispanic vs. White (non-Hispanic) .682 .371 1.253 .218 Predictor Exp(B) 95%
CI Lower
95% CI Upper
Sig -2 log likely-hood
II. Race/Ethnicity 618.87 Black vs. Hispanic 2.778 1.607 4.803 .000 White (non-Hispanic) vs. Hispanic 1.466 .798 2.693 .218 African Americans were significantly more likely to have a primary Axis I admission diagnosis of a Drug-Related Disorders than White Americans (non-Hispanic) and Hispanics/Latinos(as). Specifically, African Americans were 90% more likely to have a primary Axis I admission diagnosis of Drug-Related Disorders than White Americans (non-Hispanic) and 178% more likely to have a primary Axis I admission diagnosis of Drug-related Disorders than Hispanics/Latinos(as). Examination of the controlling variables showed that marital status and admission GAF was also related to having a primary Axis I admission diagnosis of Drug-related disorders. People who were married were 105% more likely than people who were unmarried to have a primary Axis I admission diagnosis of Drug-related disorders. In addition, as GAF increased by one point, people were 2% less likely to have a primary Axis I admission diagnosis of Drug-related disorders. Other Disorders (e.g., Anxiety Disorders, Eating Disorders, Cognitive Disorders) Predictor Exp(B) 95%
CI Lower
95% CI Upper
Sig -2 log likely-hood
I. Demographic Variables 477.65 Sex 1.191 .695 2.042 .525 Marital Status .863 .297 2.504 .786 Education Level (-hs vs. hs+) .473 .272 .822 .008 Employment Status .724 .274 1.917 .516 Housing Status 1.349 .646 2.819 .426 Admission Age .978 .955 1.000 .054 Admission GAF 1.022 .998 1.046 .074 II. Race/Ethnicity 468.00 Black vs. White (non-Hispanic) .364 .187 .708 .003 Hispanic vs. White (non-Hispanic) .581 .314 1.076 .084

Predictor Exp(B) 95% CI Lower
95% CI Upper
Sig -2 log likely-hood
II. Race/Ethnicity 468.00 Black vs. Hispanic .625 .310 1.261 .190 White (non-Hispanic) vs. Hispanic 1.720 .930 3.182 .084 African Americans were significantly less likely to have a primary Axis I admission diagnosis of Other Disorders than White Americans (non-Hispanic). Specifically, African Americans were 64% less likely to have a primary Axis I admission diagnosis of Other Disorders than White Americans (non-Hispanic). Examination of the controlling variables showed that education level and admission age were also related to having a primary Axis I admission diagnosis of Other Disorders. People with at least a high school degree were 53% less likely than people without a high school degree to have a primary Axis I admission diagnosis of Other Disorders. In addition, as admission age increased, people were 2% less likely to have a primary Axis I admission diagnosis of Other Disorders. Primary Axis II Diagnosis at Admission Again, only regression analyses with a significant effect of race/ethnicity are reported here. Personality Disorder NOS Predictor Exp(B) 95%
CI Lower
95% CI Upper
Sig -2 log likely-hood
I. Demographic Variables 428.00 Sex 1.542 .885 2.684 .126 Marital Status .483 .113 2.062 .326 Education Level (-hs vs. hs+) .744 .418 1.322 .313 Employment Status .585 .175 1.958 .384 Housing Status .482 .263 .883 .018 Admission Age .973 .949 .998 .034 Admission GAF .993 .966 1.020 .602 II. Race/Ethnicity 422.55 Black vs. White (non-Hispanic) .460 .227 .932 .031 Hispanic vs. White (non-Hispanic) .867 .455 1.653 .665 Predictor Exp(B) 95%
CI Lower
95% CI Upper
Sig -2 log likely-hood
II. Race/Ethnicity 422.55 Black vs. Hispanic .531 .258 1.092 .085

White (non-Hispanic) vs. Hispanic 1.153 .605 2.199 .665 African Americans were significantly less likely to have a primary Axis II admission diagnosis of Personality Disorder NOS than White Americans (non-Hispanic). Specifically, African Americans were 54% less likely to have a primary Axis II admission diagnosis of Personality Disorder NOS than White Americans (non-Hispanic). Examination of controlling variables showed that housing status was significantly related to having a primary Axis II admission diagnosis of Personality Disorder NOS. People who were housed were 52% less likely than those who were homeless to have a primary Axis II admission diagnosis of Personality Disorder NOS. In addition, as admission age increased, people were 3% less likely to have a primary Axis II admission diagnosis of Personality Disorder NOS. Mental Retardation/Borderline IQ Predictor Exp(B) 95%
CI Lower
95% CI Upper
Sig -2 log likely-hood
I. Demographic Variables 323.68 Sex .803 .391 1.650 .551 Marital Status 1.288 .364 4.553 .694 Education Level (-hs vs. hs+) .261 .129 .530 .000 Employment Status .000 .000 .000 .996 Housing Status 1.868 .712 4.902 .204 Admission Age .947 .917 .978 .001 Admission GAF 1.005 .975 1.036 .758 II. Race/Ethnicity 318.91 Black vs. White (non-Hispanic) 2.657 1.030 6.850 .043 Hispanic vs. White (non-Hispanic) 2.203 .842 5.769 .108 Predictor Exp(B) 95%
CI Lower
95% CI Upper
Sig -2 log likely-hood
II. Race/Ethnicity 318.91 Black vs. Hispanic 1.206 .617 2.357 .584 White (non-Hispanic) vs. Hispanic .454 .173 1.188 .108 African Americans were significantly more likely to have a primary Axis II admission diagnosis of Mental Retardation/Borderline IQ than White Americans (non-Hispanic). Specifically, African Americans were 166% more likely to have a primary Axis II admission diagnosis of Mental Retardation/Borderline IQ than White Americans (non-Hispanic). Examination of the controlling variables showed that education level and admission age were related to a primary Axis II admission diagnosis of Mental Retardation/Borderline IQ. People who had at least a high school education were 74% less likely to have a primary Axis II admission diagnosis of Mental Retardation/Borderline IQ. In addition, with each increasing year

of admission age, people were 5% less likely to have a primary Axis II admission diagnosis of Mental Retardation/Borderline IQ. Total Number of Admissions at Various Facilities Logistic regression showed that, after controlling for demographic variables and symptom severity, the number of inpatient mental health admissions, inpatient substance abuse admissions, inpatient forensic admissions, and total inpatient admissions (across type of setting) was not related to race/ethnicity (all p’s>.05). Length of Stay in Current Mental Health Inpatient Facility Predictor Std(B) Sig F-test Sig F Rsq. I. Demographic Variables 6.963 .000 .042 Sex -.041 .201 Marital Status -.050 .116 Education Level -.107 .002 Employment Status -.109 .001 Housing Status -.005 .881 Admission Age .136 .000 Admission GAF -.059 .065 II. Race/Ethnicity 6.605 .000 .050 Black vs. White (non-Hispanic) -.111 .002 Hispanic/Latino(a) vs. White (non-Hispanic) -.090 .018 Predictor Std(B) Sig F-test Sig
F Rsq.
II. Race/Ethnicity 6.605 .000 .050 Black vs. Hispanic/Latino(a) -.018 .631 White (non-Hispanic) vs. Hispanic/Latino(a) .093 .018 After controlling for demographic variables and symptom severity, African Americans and Hispanics/Latinos(as) had a significantly shorter length of stay than White Americans (non-Hispanic). Education level, employment status, and admission age were also significantly related to length of stay at current facility. People with at least a high school degree had shorter length of stays, employed people had a shorter length of stay, and older people had longer length of stays Does the Facility Concur with Discharge? Predictor Exp(B) 95%
CI Lower
95% CI Upper
Sig -2 log likely-hood
I. Demographic Variables 250.29 Sex 1.302 .598 2.838 .506

Marital Status .460 .061 3.485 .452 Education Level (-hs vs. hs+) 1.091 .483 2.465 .834 Employment Status 1.017 .230 4.492 .983 Housing Status .439 .197 .979 .044 Admission Age 1.005 .972 1.040 .752 Admission GAF .971 .933 1.011 .149 II. Race/Ethnicity 241.11 Black vs. White (non-Hispanic) 2.667 1.079 6.589 .034 Hispanic vs. White (non-Hispanic) .672 .187 2.417 .542 Predictor Exp(B) 95%
CI Lower
95% CI Upper
Sig -2 log likely-hood
II. Race/Ethnicity 241.11 Black vs. Hispanic 3.971 1.301 12.117 .015 White (non-Hispanic) vs. Hispanic 1.489 .414 5.358 .542 African Americans were significantly more likely to be discharged with the facility NOT concurring with discharge than White Americans (non-Hispanic) and Hispanics/Latinos(as). Specifically, African Americans were 167% more likely than White Americans (non-Hispanic) and 297% more likely than Hispanics/Latinos(as) to be discharged with the facility NOT concurring with discharge. Examination of the controlling variables showed that housing status was related to facility concurring with discharge. People who were housed were 66% less likely than those who were homeless to be discharged with the facility NOT concurring with discharge. Alert Status at Discharge? Predictor Exp(B) 95%
CI Lower
95% CI Upper
Sig -2 log likely-hood
I. Demographic Variables 319.04 Sex .428 .185 .989 .047 Marital Status 1.028 .297 3.555 .965 Education Level (-hs vs. hs+) .832 .425 1.627 .591 Employment Status .538 .124 2.333 .408 Housing Status .894 .398 2.010 .786 Admission Age .967 .937 .998 .040 Admission GAF .962 .929 .996 .031 II. Race/Ethnicity 314.98 Black vs. White (non-Hispanic) 1.414 .570 3.508 .455 Hispanic vs. White (non-Hispanic) 2.333 .967 5.626 .059 Predictor Exp(B) 95% 95% Sig -2 log

CI Lower
CI Upper
likely-hood
II. Race/Ethnicity 314.98 Black vs. Hispanic .606 .288 1.273 .186 White (non-Hispanic) vs. Hispanic .429 .178 1.034 .059 Hispanics/Latinos(as) approached significance (p=.059) in being more likely to have an alert status at discharge than White Americans (non-Hispanic). Specifically, Hispanics/Latinos(as) were 133% more likely to have an alert status at discharge than White Americans (non-Hispanic). Examination of the significance of the controlling variables showed that sex, age at admission, and GAF admission score were related to having an alert status at discharge. Specifically, women were 57% less likely than men to have an alert stats at discharge. In addition, as age increased people were 3% less likely to have an alert status at discharge and, as admission GAF increased people were 4% less likely to have an alert status at discharge. Primary Axis I Diagnosis at Discharge Schizophrenia Predictor Exp(B) 95%
CI Lower
95% CI Upper
Sig -2 log likely-hood
I. Demographic Variables 731.71 Sex .439 .281 .685 .000 Marital Status .394 .152 1.020 .055 Education Level (-hs vs. hs+) .914 .612 1.366 .662 Employment Status .422 .175 1.019 .055 Housing Status .741 .473 1.161 .190 Admission Age 1.022 1.005 1.039 .009 Admission GAF .975 .957 .994 .010 II. Race/Ethnicity 702.91 Black vs. White (non-Hispanic) 2.880 1.829 4.536 .000 Hispanic vs. White (non-Hispanic) 1.070 .618 1.854 .808 Predictor Exp(B) 95%
CI Lower
95% CI Upper
Sig -2 log likely-hood
II. Race/Ethnicity 702.91 Black vs. Hispanic 2.691 1.666 4.345 .000 White (non-Hispanic) vs. Hispanic .934 .539 1.618 .808

Logistic regression showed that, after controlling for demographic variables and symptom severity, African Americans were significantly more likely to have a primary Axis I discharge diagnosis of Schizophrenia than White Americans (non-Hispanic) and Hispanics/Latinos(as). Specifically, African Americans were 188% more likely than White Americans and 169% more likely than Hispanics to have a primary Axis I discharge diagnosis of Schizophrenia. Examination on the controlling variables shows that sex, admission age, and admission GAF are also related to having a primary Axis I diagnosis of Schizophrenia at discharge. Females were 56% less likely than males to have a primary Axis I diagnosis of Schizophrenia at discharge. In addition, the likelihood of having a primary Axis I diagnosis of schizophrenia increased by 2% with each increasing year of admission age and decreased by 2% with each increasing GAF score. Other Psychotic Disorders Logistic regression showed that, after controlling for demographic variables and symptom severity, a primary Axis I discharge diagnosis of Other Psychotic Disorders was not related to race/ethnicity (all p’s>.05). Mood Disorders Predictor Exp(B) 95%
CI Lower
95% CI Upper
Sig -2 log likely-hood
I. Demographic Variables 1048.81 Sex 1.432 1.044 1.963 .026 Marital Status 1.392 .809 2.395 .232 Education Level (-hs vs. hs+) 1.138 .817 1.586 .445 Employment Status 1.687 1.025 2.775 .040 Housing Status .993 .669 1.473 .971 Admission Age 1.004 .991 1.018 .520 Admission GAF .968 .954 .982 .000 II. Race/Ethnicity 1015.67 Black vs. White (non-Hispanic) .383 .265 .556 .000 Hispanic vs. White (non-Hispanic) .964 .665 1.399 .847 Predictor Exp(B) 95%
CI Lower
95% CI Upper
Sig -2 log likely-hood
II. Race/Ethnicity 1015.67 Black vs. Hispanic .398 .269 .588 .000 White (non-Hispanic) vs. Hispanic 1.037 .715 1.505 .847 African Americans were significantly more likely to have a primary Axis I discharge diagnosis of Mood Disorders than White Americans (non-Hispanic) and Hispanics/Latinos(as).

Specifically, African Americans were 62% less likely than White Americans (non-Hispanic) and were 60% less likely to have a primary Axis I discharge diagnosis of Mood Disorders. Examination of controlling variables showed that sex, employment status, and admission GAF were related to having a primary Axis I discharge diagnosis of Mood Disorders. In fact, females 43% more likely than men, employed people were 69% more likely than unemployed people to have a primary Axis I discharge diagnosis of Mood Disorders. In addition, with each increasing GAF score, people were 3% less likely to have a primary Axis I discharge diagnosis of Mood Disorders. Alcohol-related Disorders Logistic regression showed that, after controlling for demographic variables and symptom severity, a primary Axis I discharge diagnosis of Alcohol-related Disorders was not related to race/ethnicity (all p’s>.05). Drug-related Disorders Predictor Exp(B) 95%
CI Lower
95% CI Upper
Sig -2 log likely-hood
I. Demographic Variables 546.41 Sex .893 .536 1.489 .665 Marital Status 1.759 .834 3.713 .138 Education Level (-hs vs. hs+) .707 .429 1.165 .174 Employment Status 1.814 .903 3.645 .095 Housing Status 1.158 .608 2.208 .655 Admission Age .984 .963 1.005 .139 Admission GAF 1.079 1.057 1.101 .000 II. Race/Ethnicity 525.41 Black vs. White (non-Hispanic) 3.215 1.786 5.786 .000 Hispanic vs. White (non-Hispanic) 1.214 .608 2.424 .582 Predictor Exp(B) 95%
CI Lower
95% CI Upper
Sig -2 log likely-hood
II. Race/Ethnicity 525.41 Black vs. Hispanic 2.647 1.496 4.683 .001 White (non-Hispanic) vs. Hispanic .823 .413 1.643 .582 African Americans were significantly more likely than White Americans (non-Hispanic) and Hispanics/Latinos(as) to have a primary Axis I discharge diagnosis of Drug-related Disorders. Specifically, African Americans were 222% more likely than White Americans (non-Hispanic) and 164% more likely than Hispanics/Latinos(as) to have a primary Axis I discharge diagnosis of Drug-related Disorders.

Examination of the controlling variables showed that admission GAF was significantly related to having a primary Axis I discharge diagnosis of Drug-related Disorders. With each increasing GAF score, the likelihood of a primary Axis I discharge diagnosis of Alcohol or Drug-related Disorders increased by 8%. Other Disorders Predictor Exp(B) 95%
CI Lower
95% CI Upper
Sig -2 log likely-hood
I. Demographic Variables 406.58 Sex 1.057 .591 1.888 .852 Marital Status .230 .031 1.729 .153 Education Level (-hs vs. hs+) .665 .372 1.189 .169 Employment Status .316 .093 1.079 .066 Housing Status 3.205 1.127 9.118 .029 Admission Age .943 .916 .969 .000 Admission GAF 1.028 1.003 1.054 .030 II. Race/Ethnicity 396.79 Black vs. White (non-Hispanic) .335 .163 .689 .003 Hispanic vs. White (non-Hispanic) .685 .362 1.295 .244 Predictor Exp(B) 95%
CI Lower
95% CI Upper
Sig -2 log likely-hood
II. Race/Ethnicity 396.79 Black vs. Hispanic .489 .232 1.031 .060 White (non-Hispanic) vs. Hispanic 1.460 .772 2.760 .244 African Americans were significantly less likely to have a primary Axis I discharge diagnosis of Other Disorders than White Americans (non-Hispanic). Specifically, African Americans were 66% less likely to have a primary Axis I discharge diagnosis of Other Disorders than White Americans (non-Hispanic). Examination of the controlling variables showed that housing status, admission age, and admission GAF were related to having a primary Axis I discharge diagnosis of Other Disorders. People who had housing were 221% more likely than people who were homeless to have a primary Axis I discharge diagnosis of Other Disorders. In addition, with each increasing year of age the likelihood of a primary Axis I discharge diagnosis of Other Disorders decreased by 6%, and with each increasing GAF score the likelihood of a primary Axis I discharge diagnosis of Other Disorders increased by 3%. Primary Axis II Diagnosis at Discharge Cluster B Personality Disorders

Predictor Exp(B) 95% CI Lower
95% CI Upper
Sig -2 log likely-hood
I. Demographic Variables 611.96 Sex 1.458 .939 2.265 .093 Marital Status .915 .376 2.227 .846 Education Level (-hs vs. hs+) .725 .458 1.146 .168 Employment Status .842 .381 1.861 .671 Housing Status .806 .473 1.373 .427 Admission Age .969 .950 .989 .002 Admission GAF .987 .966 1.008 .211 II. Race/Ethnicity 598.81 Black vs. White (non-Hispanic) .682 .423 1.100 .117 Hispanic vs. White (non-Hispanic) .351 .195 .632 .000 Predictor Exp(B) 95%
CI Lower
95% CI Upper
Sig -2 log likely-hood
II. Race/Ethnicity 592.81 Black vs. Hispanic 1.941 1.075 3.507 .028 White (non-Hispanic) vs. Hispanic 2.847 1.581 5.126 .000 African Americans and White Americans (non-Hispanic) were significantly more likely to have a primary Axis II discharge diagnosis of Personality Disorder Cluster B than Hispanics/Latinos(as). Specifically, African Americans were 94% more likely and White Americans were 185% more likely to have a primary Axis II discharge diagnosis of Personality Disorder Cluster B than Hispanics/Latinos(as). Personality Disorder NOS Predictor Exp(B) 95%
CI Lower
95% CI Upper
Sig -2 log likely-hood
I. Demographic Variables 543.99 Sex .589 .345 1.005 .052 Marital Status .474 .143 1.572 .222 Education Level (-hs vs. hs+) .773 .477 1.253 .296 Employment Status .778 .334 1.811 .561 Housing Status .384 .233 .634 .000 Admission Age .981 .961 1.002 .071 Admission GAF 1.003 .981 1.026 .765 II. Race/Ethnicity 538.30 Black vs. White (non-Hispanic) .523 .302 .906 .021 Hispanic vs. White (non-Hispanic) .652 .370 1.149 .139

Predictor Exp(B) 95% CI Lower
95% CI Upper
Sig -2 log likely-hood
II. Race/Ethnicity 538.30 Black vs. Hispanic .803 .440 1.465 .474 White (non-Hispanic) vs. Hispanic 1.534 .870 2.705 .139 African Americans were significantly less likely to have a primary Axis II discharge diagnosis of Personality Disorder NOS than White Americans (non-Hispanic). Specifically, African Americans were 48% less likely to have a primary Axis II discharge diagnosis of Personality Disorder NOS than White Americans (non-Hispanic). Examination of the controlling variables showed that sex and housing status were related to having a primary Axis II discharge diagnosis of Personality Disorder NOS. Specifically, women were 41% less likely than men and people who had housing were 62% less likely than people who were homeless to have a primary Axis II discharge diagnosis of Personality Disorder NOS. Mental Retardation/Borderline IQ at Discharge Predictor Exp(B) 95%
CI Lower
95% CI Upper
Sig -2 log likely-hood
I. Demographic Variables 313.99 Sex .951 .478 1.894 .887 Marital Status .375 .049 2.858 .344 Education Level (-hs vs. hs+) .603 .315 1.153 .126 Employment Status .000 .000 .000 .997 Housing Status 2.290 .793 6.612 .126 Admission Age .941 .909 .974 .000 Admission GAF .986 .956 1.018 .394 II. Race/Ethnicity 307.10 Black vs. White (non-Hispanic) 3.115 1.218 7.964 .018 Hispanic vs. White (non-Hispanic) 2.620 .992 6.921 .052 Predictor Exp(B) 95%
CI Lower
95% CI Upper
Sig -2 log likely-hood
II. Race/Ethnicity 307.10 Black vs. Hispanic .951 .478 1.894 .620 White (non-Hispanic) vs. Hispanic .375 .049 2.858 .052 African Americans and Hispanics/Latinos(as) were significantly more likely to have a primary Axis II discharge diagnosis of Mental Retardation/Borderline IQ than White Americans (non-Hispanic). Specifically, African Americans were 212% more likely and Hispanics/Latinos(as) were 162% more likely to have a primary Axis II discharge diagnosis of Mental Retardation/Borderline IQ than White Americans (non-Hispanic).

Examination of controlling variables showed that admission age was related to having a primary Axis II discharge diagnosis of Mental Retardation/Borderline IQ. Specifically, with each increasing year of admission age, people were 6% less likely to have a primary Axis II discharge diagnosis of Mental Retardation/Borderline IQ. No diagnosis, Diagnosis Deferred, or Diagnosis Unclear on Axis II at Discharge Predictor Exp(B) 95%
CI Lower
95% CI Upper
Sig -2 log likely-hood
I. Demographic Variables 1263.86 Sex 1.072 .807 1.424 .632 Marital Status 1.334 .799 2.227 .270 Education Level (-hs vs. hs+) 1.530 1.146 2.045 .004 Employment Status 1.845 1.108 3.070 .019 Housing Status 1.315 .934 1.853 .117 Admission Age 1.019 1.007 1.031 .002 Admission GAF 1.019 1.005 1.032 .006 II. Race/Ethnicity 1258.62 Black vs. White (non-Hispanic) 1.265 .918 1.743 .151 Hispanic vs. White (non-Hispanic) 1.493 1.053 2.116 .024 Predictor Exp(B) 95%
CI Lower
95% CI Upper
Sig -2 log likely-hood
II. Race/Ethnicity 1258.62 Black vs. Hispanic .847 .605 1.186 .334 White (non-Hispanic) vs. Hispanic .670 .473 .949 .024 Hispanics/Latinos(as) were significantly more likely than White Americans (non-Hispanic) to have a primary Axis II discharge diagnosis of No Diagnosis, Diagnosis Deferred, or Diagnosis Unclear. Specifically, Hispanics/Latinos(as) were 49% more likely than White Americans (non-Hispanic) to have a primary Axis II discharge diagnosis of No Diagnosis or Diagnosis Deferred Examination of the controlling variables found that education level, employment status, admission age and admission GAF were related to having a primary Axis II discharge diagnosis of No Diagnosis or Diagnosis Deferred. People with at least a high school education were 53% more likely than those without a high school ediation, employed people were 85% more likely than unemployed people to have a primary Axis II discharge diagnosis of No Diagnosis or Diagnosis Deferred. In addition, with each increasing year of admission age the likelihood of having a primary Axis II discharge diagnosis of No Diagnosis or Diagnosis Deferred increased by 2%, and with each increasing score on the GAF scale the likelihood of having a primary Axis II discharge diagnosis of No Diagnosis or Diagnosis Deferred also increased by 2%.
Inpatient Substance Abuse Setting

Descriptive Statistics The following table summarizes the descriptive statistics and chi-square or ANOVA analysis for the relevant variables included in this analysis. Table 1 Demographic and Clinical Variables Table Substance Abuse Setting African Americans Hispanics/Latinos White Americans (non-
Hispanic)
N = 495 N = 492 N = 497
N or mean±SD % N or mean±SD % N or mean±SD % F or Χ2 df p
Male 338 68 405 82 345 69 30.65 2 <.001
Mean Age 40.01±8.84 36.08±8.91 34.88±9.96 41.63 2, 1481
<.001
Marital Status
Unmarried 448 93 447 91 451 91
Married 37 8 45 9 46 9 1.25 2 .54
Education Level
Less than high school 178 37 280 58 124 26
At least a high school degree 310 64 205 42 362 75 108.65 2 <.001
Housing Status
Homeless 76 15 72 15 78 16
Housed 419 85 420 85 419 84 0.22 2 .89
Employment status
Unemployed 471 95 467 95 459 93
Employed (full or part time) 23 5 23 5 35 7 3.69 2 .16
GAF at admission 41.55±6.66 40.59±6.82 41.08±6.96 2.35 2, 1393
.10
GAF at discharge 50.64±10.63 49.02±10.11 49.35±11.13 3.11 2, 1426
.05
Referral Source
Self-referral 333 67 372 76 338 68 10.06 2 .01
Other inpatient setting 4 0.8 5 1 4 0.8 0.17 2 .92
Criminal justice system 54 11 28 6 30 6 12.07 2 .002
Crisis/emergency 80 16 59 12 117 24 23.72 2 <.001
Other 24 5 28 6 8 2 11.86 2 .003
Legal status at admission
Voluntary 399 84 403 85.2 371 80.0 5.02 2 .08

Table 1 Demographic and Clinical Variables Table Substance Abuse Setting African Americans Hispanics/Latinos White Americans (non-
Hispanic)
N = 495 N = 492 N = 497
N or mean±SD % N or mean±SD % N or mean±SD % F or Χ2 df p
Department of corrections 32 6.7 23 4.9 27 5.8 1.52 2 .47
Emergency certification 44 9.3 47 9.9 66 14.2 6.85 2 .03
Primary Axis I admission diagnosis
Alcohol-related disorders 186 39.9 77 16.8 205 42.4 82.78 2 <.001
Drug-related disorders 265 56.9 366 80.1 266 55.0 78.53 2 <.001
Mental health Axis I diagnoses
15 3.2 14 3.1 13 2.7 0.16 2 .93
Schizophrenia 3 0.6 1 0.2 0 0 3.57 2 .17
Other psychotic disorders 5 1.1 3 0.7 0 0 4.93 2 .09
Mood disorders 7 1.5 10 2.2 12 2.5 1.18 2 .56
Other disorders 0 0.0 0 0.0 1 0.2 1.91 2 .39
Primary Axis II admission diagnosis
Cluster A Personality Disorders
0 0 0 0 0 0 N/A
Cluster B Personality Disorders 10 2.1 4 0.9 7 1.4 2.54 2 .28
Cluster C Personality Disorders
0 0 0 0 1 0.2 1.91 2 .38
Personality Disorders NOS 16 3.4 6 1.3 13 2.7 4.40 2 .11
Mental Retardation/ Borderline IQ
0 0 0 0 1 0.2 1.91 2 .38
Diagnosis deferred, unclear or no diagnosis
440 94.4 447 97.8 461 95.4 7.05 2 .03
Number of inpatient mental health admissions
0.46±2.29 0.15±0.57 0.13±058 8.79 2, 1481
<.001
Number of inpatient substance abuse facilities
2.28±5.31 2.58±3.07 2.35±3.75 0.67 2, 1481
.51
Number of inpatient forensic admissions
0.0±0.5 0.0±0.6 0.0±0.6 0.20 2, 1481
.82
Total number of inpatient admissions
2.75±6.61 2.73±3.28 2.49±3.94 0.46 2, 1481
.63
Length of stay in current substance abuse facility
21.38±19.43 13.79±15.73 19.02±19.52 22.18 2, 1481
<.001
Facility concurs with discharge (#/%=yes)
414 83.6 398 80.9 408 82.1 1.28 2 .53
Alert status at discharge (#/%=yes)
20 4.0 24 4.9 24 4.8 0.50 2 .78
Primary Axis I discharge diagnosis
Alcohol-related disorders 202 41.7 83 17.4 211 43.3 89.99 2 <.001
Drug-related disorders 278 57.4 388 81.3 271 55.6 86.50 2 <.001
Mental health Axis I diagnoses
4 0.8 6 1.3 5 1.0 0.42 2 .81
Schizophrenia 0 0 0 0 0 0 N/A
Other psychotic disorders 1 0.2 2 0.4 0 0 2.05 2 .36

Table 1 Demographic and Clinical Variables Table Substance Abuse Setting African Americans Hispanics/Latinos White Americans (non-
Hispanic)
N = 495 N = 492 N = 497
N or mean±SD % N or mean±SD % N or mean±SD % F or Χ2 df p
Mood disorders 3 0.6 4 0.8 4 0.8 0.19 2 .91
Other disorders 0 0.0 0 0.0 1 0.2 1.98 2 .37
Primary Axis II discharge diagnosis
Cluster A Personality Disorders
1 0.2 0 0 0 0.0 1.99 2 .37
Cluster B Personality Disorders 35 7.2 32 6.7 21 4.3 4.09 2 .13
Cluster C Personality Disorders
0 0.0 0 0 1 0.2 1.98 2 .37
Personality Disorders NOS 29 6.0 35 7.3 31 6.4 0.75 2 .69
Mental Retardation/ Borderline IQ
0 0.0 0 0 1 0.2 1.98 2 .37
Diagnosis deferred, unclear or no diagnosis
419 86.6 410 85.9 432 88.9 2.07 2 .36
Racial/ethnic differences were found for demographic variables and symptom severity. Hispanics were more likely to be male (see Table 1). African Americans had significantly older age at admission than Hispanics/Latino(as) and White Americans (non-Hispanic). Hispanics/Latinos(as) were most likely to have less than a high school education. Finally, African Americans were discharged with significantly higher Global Assessment of Functioning than Hispanics/Latinos(as). Racial/ethnic differences were also found for treatment-related variables. With regards to referral source, after controlling for demographic variables and symptom severity, Hispanics/Latinos(as) were more likely to be self-referred than African Americans and White Americans (non-Hispanic). Also, African Americans were more likely than Hispanics/Latinos(as) and White Americans (non-Hispanic) to be referred by the criminal justice system. White Americans (non-Hispanic) were more likely than African Americans and Hispanics/Latinos(as) to be referred by crisis/emergency sources. White Americans (non-Hispanic) were less likely than African Americans and Hispanics/Latinos(as) to be referred by Other sources (i.e., family/friend, outpatient, partial hospitalization, supervised residential, supervised medical residential, hospital/medical, other/unknown) With regards to legal status at admission, Hispanics/Latinos(as) showed a trend (p=.08) toward being more likely to have a voluntary legal status at admission. White Americans (non-Hispanic) were more likely to be admitted by emergency citation than African Americans and Hispanics/Latinos(as). With regards to primary Axis I admission diagnosis, White Americans (non-Hispanic) were more likely to be admitted with a primary Axis I admission diagnosis of an alcohol-related disorder than African Americans and Hispanics/Latinos(as). Hispanics/Latinos(as) were more

likely than African Americans and White Americans (non-Hispanic) to have a primary Axis I admission diagnosis of a drug-related disorder. Analysis of primary Axis II admission diagnoses revealed that Hispanics/Latinos(as) were more likely to have a primary Axis II admission diagnosis of Diagnosis Deferred, Diagnosis Unclear, or No Diagnosis. With regards to treatment-related variables, African Americans had more mental health inpatient admissions than Hispanics/Latinos(as) and White Americans (non-Hispanic). In addition, Hispanics/Latinos(as) had shorter lengths of stay than African Americans and White Americans (non-Hispanic). With regards to primary Axis I discharge diagnosis, the results were highly similar to the results for primary Axis I admission diagnosis: White Americans (non-Hispanic) were most likely to have a primary Axis I discharge diagnosis of alcohol-related disorders, and Hispanics/Latinos(as) were most likely to have a primary Axis I discharge diagnosis of drug-related disorders. Analysis Plan: As with the mental health analysis, our goal was to investigate whether treatment-related variables (e.g., referral source at admission, length of stay, diagnosis) differed as a function of race/ethnicity. Since demographic variables are often correlated with race/ethnicity, we wanted to ensure that race/ethnicity was related to the outcome variables even after controlling for demographic variables and symptom severity. If the relationship still exists even after controlling for these variables, this gives stronger evidence for behavioral health disparities and suggests that the differences are not an artifact of demographic variables or symptom severity. Subsequently, in the regression analyses (multivariate or logistic), we controlled for the following variables: Sex Marital status (yes/no) Age at admission Education level (no high school degree vs. at least high school degree) Employment status (no/yes(full or part time)) Housing status (homeless/housed) Admission Global Assessment of Functioning (GAF) Presented in the following tables is the expected beta or standardized beta and associated statistics for all variables included in the second model (i.e., demographics, symptom severity, race/ethnicity). Only regression analyses that have significant race/ethnicity factors are presented in the tables. Referral source at admission: Self-referral Predictor Exp(B) 95% 95% Sig -2 log

CI Lower
CI Upper
likely-hood
I. Demographic Variables 1611.96 Sex 1.035 .787 1.360 .806 Marital Status 1.046 .681 1.605 .838 Education Level (-hs vs. hs+) .984 .762 1.269 .899 Employment Status .462 .285 .750 .002 Housing Status 1.494 1.088 2.050 .013 Admission Age .982 .970 .995 .007 Admission GAF 1.020 1.002 1.038 .028 II. Race/Ethnicity 1605.59 Black vs. White (non-Hispanic) 1.032 .772 1.378 .833 Hispanic vs. White (non-Hispanic) 1.439 1.055 1.965 .022 Predictor Exp(B) 95%
CI Lower
95% CI Upper
Sig -2 log likely-hood
II. Race/Ethnicity 1605.59 Black vs. Hispanic .717 .526 .976 .035 White (non-Hispanic) vs. Hispanic .695 .509 .948 .022 Logistic regression showed that, after controlling for demographic variables and symptom severity, Hispanics were significantly more likely to be self-referred than White Americans (non-Hispanic). In fact, Hispanics were 44% more likely to be self-referred than White Americans (non-Hispanic). Examination of the controlling variables showed that employment status, housing status, admission age, and admission GAF were significantly related to self-referral. In fact, people who were employed were 54% less likely and people who had housing were 49% more likely to self refer. In addition, with each increasing year of age people were 2% less likely to self-refer, and with each increasing GAF score people were 2% more likely to self-refer. Referral from other inpatient sources Logistic regression showed that, after controlling for demographic variables and symptom severity, race/ethnicity was not related to referral from other inpatient sources (p>.05). Criminal justice referral Predictor Exp(B) 95%
CI Lower
95% CI Upper
Sig -2 log likely-hood
I. Demographic Variables 700.67 Sex .956 .605 1.511 .846 Marital Status 1.079 .521 2.237 .838 Education Level (-hs vs. hs+) .924 .599 1.426 .722
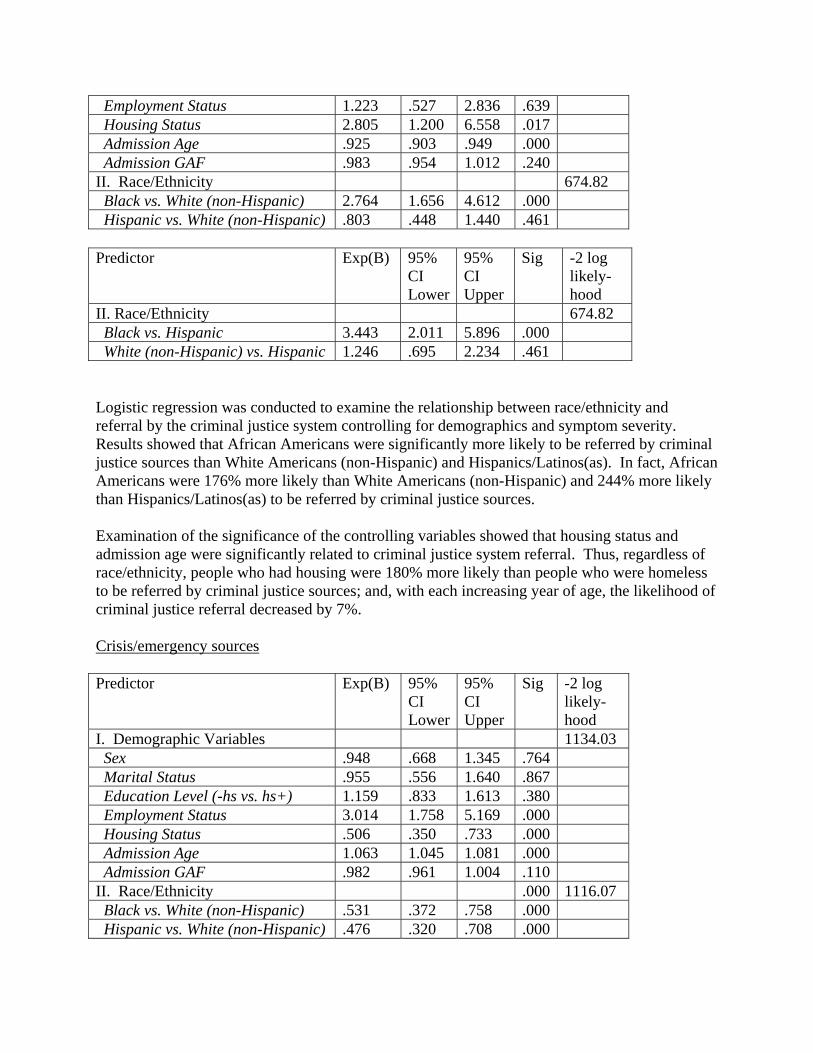
Employment Status 1.223 .527 2.836 .639 Housing Status 2.805 1.200 6.558 .017 Admission Age .925 .903 .949 .000 Admission GAF .983 .954 1.012 .240 II. Race/Ethnicity 674.82 Black vs. White (non-Hispanic) 2.764 1.656 4.612 .000 Hispanic vs. White (non-Hispanic) .803 .448 1.440 .461 Predictor Exp(B) 95%
CI Lower
95% CI Upper
Sig -2 log likely-hood
II. Race/Ethnicity 674.82 Black vs. Hispanic 3.443 2.011 5.896 .000 White (non-Hispanic) vs. Hispanic 1.246 .695 2.234 .461 Logistic regression was conducted to examine the relationship between race/ethnicity and referral by the criminal justice system controlling for demographics and symptom severity. Results showed that African Americans were significantly more likely to be referred by criminal justice sources than White Americans (non-Hispanic) and Hispanics/Latinos(as). In fact, African Americans were 176% more likely than White Americans (non-Hispanic) and 244% more likely than Hispanics/Latinos(as) to be referred by criminal justice sources. Examination of the significance of the controlling variables showed that housing status and admission age were significantly related to criminal justice system referral. Thus, regardless of race/ethnicity, people who had housing were 180% more likely than people who were homeless to be referred by criminal justice sources; and, with each increasing year of age, the likelihood of criminal justice referral decreased by 7%. Crisis/emergency sources Predictor Exp(B) 95%
CI Lower
95% CI Upper
Sig -2 log likely-hood
I. Demographic Variables 1134.03 Sex .948 .668 1.345 .764 Marital Status .955 .556 1.640 .867 Education Level (-hs vs. hs+) 1.159 .833 1.613 .380 Employment Status 3.014 1.758 5.169 .000 Housing Status .506 .350 .733 .000 Admission Age 1.063 1.045 1.081 .000 Admission GAF .982 .961 1.004 .110 II. Race/Ethnicity .000 1116.07 Black vs. White (non-Hispanic) .531 .372 .758 .000 Hispanic vs. White (non-Hispanic) .476 .320 .708 .000

Predictor Exp(B) 95% CI Lower
95% CI Upper
Sig -2 log likely-hood
II. Race/Ethnicity 1116.07 Black vs. Hispanic 1.116 .740 1.684 .601 White (non-Hispanic) vs. Hispanic 2.101 1.412 3.127 .000 Logistic regression showed that, after controlling for demographic variables and symptom severity, African Americans and Hispanics/Latinos(as) were significantly less likely to be referred by crisis-emergency sources than White Americans (non-Hispanic). In fact, African Americans were 47% less likely and Hispanics/Latinos(as) were 52% less likely to be referred by crisis-emergency sources than White Americans (non-Hispanic). Examination of the demographic variables showed that employment status, housing status, and admission age were also significantly related to admission by crisis/emergency sources, regardless of race/ethnicity. Specifically, people who were employed were 201% more likely and people who were housed were 49% less likely to be referred by crisis-emergency sources. And, with each increasing year of age, people were 6% more likely to be referred by crisis/emergency sources. Other referral sources (family, outpatient, residential, medical, other) Predictor Exp(B) 95%
CI Lower
95% CI Upper
Sig -2 log likely-hood
I. Demographic Variables 433.66 Sex 1.105 .571 2.135 .767 Marital Status .928 .324 2.659 .890 Education Level (-hs vs. hs+) .848 .474 1.516 .578 Employment Status .436 .059 3.243 .418 Housing Status .526 .271 1.018 .057 Admission Age 1.012 .982 1.044 .423 Admission GAF .980 .942 1.020 .323 II. Race/Ethnicity 424.59 Black vs. White (non-Hispanic) 1.960 .825 4.655 .127 Hispanic vs. White (non-Hispanic) 3.283 1.429 7.545 .005 Predictor Exp(B) 95%
CI Lower
95% CI Upper
Sig -2 log likely-hood
II. Race/Ethnicity 424.59 Black vs. Hispanic .597 .307 1.159 .128 White (non-Hispanic) vs. Hispanic .305 .133 .700 .005 Logistic regression showed that, after controlling for demographic variables and symptom severity, Hispanics/Latinos(as) were significantly more likely to be referred by other sources

than White Americans (non-Hispanic). In fact, Hispanics/Latinos(as) were 228% more likely to be referred by other sources than White Americans (non-Hispanic). No demographic variables were significantly related to referral by other sources. Legal status at admission Voluntary Predictor Exp(B) 95%
CI Lower
95% CI Upper
Sig -2 log likely-hood
I. Demographic Variables 1160.95 Sex .847 .609 1.178 .323 Marital Status 1.530 .848 2.760 .158 Education Level (-hs vs. hs+) .907 .660 1.248 .550 Employment Status .810 .442 1.483 .494 Housing Status 1.320 .895 1.947 .161 Admission Age 1.001 .986 1.017 .869 Admission GAF 1.082 1.057 1.109 .000 II. Race/Ethnicity 1155.19 Black vs. White (non-Hispanic) 1.352 .946 1.933 .098 Hispanic vs. White (non-Hispanic) 1.557 1.069 2.270 .021 Predictor Exp(B) 95%
CI Lower
95% CI Upper
Sig -2 log likely-hood
II. Race/Ethnicity 1155.19 Black vs. Hispanic .868 .590 1.278 .473 White (non-Hispanic) vs. Hispanic .642 .441 .936 .021 Logistic regression showed that, after controlling for demographics and symptom severity, Hispanics/Latinos(as) were significantly more likely to be admitted with a voluntary legal status than White Americans (non-Hispanic). In fact, Hispanics/Latinos(as) were 56% more likely to be admitted with a voluntary legal status than White Americans (non-Hispanic). Examination of the controlling variables shows that Admission GAF was significantly related to voluntary legal status at admission across race/ethnicity. In fact, as Admission GAF increased by 1 point, likelihood of voluntary legal status increased by 8%. Department of Corrections Logistic regression showed that, after controlling for demographic variables and symptom severity, race/ethnicity was not related to a Department of Corrections legal status at admission (all p’s>.05).

Emergency certification Predictor Exp(B) 95%
CI Lower
95% CI Upper
Sig -2 log likely-hood
I. Demographic Variables 876.05 Sex 1.073 .717 1.605 .733 Marital Status .729 .367 1.449 .367 Education Level (-hs vs. hs+) .986 .673 1.445 .944 Employment Status .835 .367 1.897 .666 Housing Status .834 .524 1.328 .445 Admission Age 1.020 1.001 1.040 .036 Admission GAF .909 .884 .935 .000 II. Race/Ethnicity 867.17 Black vs. White (non-Hispanic) .550 .356 .849 .007 Hispanic vs. White (non-Hispanic) .588 .376 .918 .020 Predictor Exp(B) 95%
CI Lower
95% CI Upper
Sig -2 log likely-hood
II. Race/Ethnicity 867.17 Black vs. Hispanic .936 .583 1.503 .784 White (non-Hispanic) vs. Hispanic 1.702 1.089 2.660 .020 Logistic regression showed that, after controlling for demographics and symptom severity, African Americans and Hispanics/Latinos(as) were significantly less likely to be admitted by emergency certification than White Americans (non-Hispanic). In fact, African Americans were 45% less likely and Hispanics/Latinos(as) were 41%less likely to be admitted by emergency certification than White Americans (non-Hispanic). Examination of the controlling variables shows that Admission Age and Admission GAF were significantly related to emergency citation at admission across race/ethnicity. In fact, with each increasing year of admission age, the likelihood of being admitted by emergency citation increased by 2%. Also, as Admission GAF increased by 1 point, likelihood of voluntary legal status decreased by 9%. Primary Axis I Diagnosis at Admission Alcohol-related disorders Predictor Exp(B) 95%
CI Lower
95% CI Upper
Sig -2 log likely-hood
I. Demographic Variables 1520.44 Sex .727 .544 .970 .030 Marital Status .612 .381 .982 .042

Education Level (-hs vs. hs+) .758 .576 .998 .048 Employment Status 2.154 1.271 3.653 .004 Housing Status 1.023 .723 1.446 .898 Admission Age 1.077 1.061 1.092 .000 Admission GAF 1.002 .984 1.021 .810 II. Race/Ethnicity 1439.58 Black vs. White (non-Hispanic) .602 .448 .808 .001 Hispanic vs. White (non-Hispanic) .213 .149 .304 .000 Predictor Exp(B) 95%
CI Lower
95% CI Upper
Sig -2 log likely-hood
II. Race/Ethnicity 1439.58 Black vs. Hispanic 2.826 1.997 4.000 .000 White (non-Hispanic) vs. Hispanic 4.695 3.288 6.704 .000 Logistic regression showed that, after controlling for demographic variables and symptom severity, African Americans and Hispanics/Latinos(as) were significantly less likely to have a primary admission diagnosis of an alcohol-related disorder than White Americans (non-Hispanic). In fact, African Americans were 40% less likely and Hispanics/Latinos(as) were 79% less likely to have a primary admission diagnosis of an alcohol-related disorder than White Americans (non-Hispanic). In addition, African Americans were significantly more likely than Hispanics/Latinos(as) to have a primary admission diagnosis of an alcohol-related disorder. In fact, African Americans were 183% more likely than Hispanics/Latinos(as) to have a primary admission diagnosis of an alcohol-related disorder. Examination of the controlling variables showed that sex, marital status, educational level, employment status, and admission age were also significantly related to having a primary admission diagnosis of an alcohol-related disorder. Females were 27% less likely than males, married people were 39% less likely than unmarried people, people with at least a high school degree were 24% less likely than those without a high school degree, employed people were 115% more likely than unemployed, and, with each increasing year of admission, people were 8% more likely to have a primary admission diagnosis of an alcohol-related disorder. Drug-related disorders Predictor Exp(B) 95%
CI Lower
95% CI Upper
Sig -2 log likely-hood
I. Demographic Variables 1571.45 Sex 1.263 .954 1.672 .102 Marital Status 1.580 .999 2.500 .051 Education Level (-hs vs. hs+) 1.212 .928 1.582 .158 Employment Status .412 .244 .697 .001 Housing Status 1.097 .784 1.535 .590 Admission Age .933 .920 .946 .000

Admission GAF 1.001 .983 1.019 .911 II. Race/Ethnicity 1498.16 Black vs. White (non-Hispanic) 1.559 1.166 2.084 .003 Hispanic vs. White (non-Hispanic) 4.118 2.930 5.787 .000 Predictor Exp(B) 95%
CI Lower
95% CI Upper
Sig -2 log likely-hood
II. Race/Ethnicity 1489.16 Black vs. Hispanic .379 .271 .528 .000 White (non-Hispanic) vs. Hispanic .243 .173 .341 .000 Logistic regression showed that, after controlling for demographic variables and symptom severity, African Americans and Hispanics/Latinos(as) were significantly more likely to have a primary admission diagnosis of a drug-related disorder than White Americans (non-Hispanic). In fact, African Americans were 56% more likely and Hispanics/Latinos(as) were 312% more likely to have a diagnosis of a drug-related disorder than White Americans (non-Hispanic). Also, African Americans were significantly less likely than Hispanics/Latinos(as) to have a primary admission diagnosis of a drug-related disorder. In fact, African Americans were 62% less likely than Hispanics/Latinos(as) to have a diagnosis of a drug-related disorder.
Examination of the significance of the controlling variables showed that marital status, employment status and admission age were significantly related to having a drug-related primary admission diagnosis. In fact, married people were 58% more likely than unmarried people, employed people were 59% less likely than unemployed people to have a drug-related primary admission diagnosis. In addition, with each increasing year of admission age, the likelihood of a primary admission diagnosis of a drug-related disorder decreased by 7% Mental Health Diagnoses as Primary Admission Diagnoses Axis I Mental Health Diagnoses
After controlling for demographics and symptom severity, logistic regression showed that race/ethnicity was not related to having a primary Axis I mental health diagnoses at admission in the following categories (all p’s>.05): Schizophrenia, Other Psychotic Disorders, Mood Disorders, or Other Disorders. Axis II Diagnoses After controlling for demographics and symptom severity, logistic regression showed that race/ethnicity was not related to having a primary Axis II mental health diagnoses at admission (all p’s>.05) with the following exceptions: Personality Disorder NOS as Primary Axis II Admission Diagnosis

Predictor Exp(B) 95% CI Lower
95% CI Upper
Sig -2 log likely-hood
I. Demographic Variables 273.48 Sex 1.443 .659 3.159 .359 Marital Status .399 .053 2.994 .372 Education Level (-hs vs. hs+) .680 .315 1.468 .326 Employment Status .693 .091 5.255 .723 Housing Status .721 .286 1.818 .488 Admission Age 1.006 .966 1.047 .787 Admission GAF .987 .936 1.041 .630 II. Race/Ethnicity 266.89 Black vs. White (non-Hispanic) 1.594 .678 3.748 .285 Hispanic vs. White (non-Hispanic) .408 .120 1.388 .151 Predictor Exp(B) 95%
CI Lower
95% CI Upper
Sig -2 log likely-hood
II. Race/Ethnicity 266.89 Black vs. Hispanic 3.910 1.244 12.290 .020 White (non-Hispanic) vs. Hispanic 2.453 .720 8.351 .151 African Americans were significantly more likely to have a primary Axis II admission diagnosis of Personality Disorder NOS than Hispanics/Latinos(as). In fact, African Americans were 291% more likely to have a primary Axis II admission diagnosis of Personality Disorder NOS than Hispanics/Latinos(as).
Diagnosis Deferred or Diagnosis Unclear or No Axis II Diagnosis as Primary Axis II Admission Diagnosis
Predictor Exp(B) 95%
CI Lower
95% CI Upper
Sig -2 log likely-hood
I. Demographic Variables 416.54 Sex .637 .351 1.158 .140 Marital Status 1.417 .429 4.686 .568 Education Level (-hs vs. hs+) 1.658 .920 2.989 .092 Employment Status 2.573 .347 19.113 .356 Housing Status 1.208 .571 2.555 .621 Admission Age 1.003 .972 1.035 .840 Admission GAF 1.010 .970 1.052 .620 II. Race/Ethnicity 407.76 Black vs. White (non-Hispanic) .747 .388 1.439 .383 Hispanic vs. White (non-Hispanic) 2.437 1.007 5.894 .048

Predictor Exp(B) 95% CI Lower
95% CI Upper
Sig -2 log likely-hood
II. Race/Ethnicity 407.76 White (non-Hispanic) vs. Black 1.338 .695 2.577 .383 Hispanic/Latino(a) vs. Black 3.261 1.405 7.569 .006 Hispanics/Latinos(as) were significantly more likely than White Americans (non-Hispanic) and African Americans to have a primary Axis II admission diagnosis of Diagnosis Deferred or Diagnosis Unclear or No Axis II Diagnosis. In fact, Hispanics/Latinos(as) were 144% more likely than White Americans (non-Hispanic) and 226% more likely than African Americans to have a primary Axis II diagnosis of Diagnosis Deferred or Diagnosis Unclear or No Axis II Diagnosis at admission. Total Number of Admissions at Various Facilities Linear regression analyses, after controlling for demographic variables and symptom severity, found no significant relationship (all p’s>.05) between race/ethnicity and the following variables: number of inpatient substance abuse admissions, number of inpatient forensic admission, and total number of inpatient admissions.
Total number of mental health admissions Predictor Std(B) Sig F-test Sig F Rsq. I. Demographic Variables 2.432 .018 .012 Sex .017 .526 Marital Status -.032 .238 Education Level .030 .275 Employment Status -.028 .327 Housing Status -.023 .393 Admission Age -.067 .013 Admission GAF -.048 .078 II. Race/Ethnicity 3.323 .001 .022 Black vs. White Americans (non-Hispanic)
.101 .002
Hispanic/Latinos(as) vs. White Americans
.003 .916
Predictor Std(B) Sig F-test Sig
F Rsq.
II. Race/Ethnicity 3.323 .001 .022 Black vs. Hispanic/Latinos(as) .097 .003 White vs. Hispanic/Latinos(as) -.003 .916 Linear regression analysis examining the relationship between the total number of mental health admissions and race/ethnicity showed that, even after controlling for demographic variables and

symptom severity, African Americans had significantly more mental health admissions than White Americans (non-Hispanic) and Hispanics/Latinos(as). Examination of the significance of the controlling variables showed that total number of mental health admission had a significant negative relationship with admission age and admission GAF: younger people were more likely to have more total mental health admissions and people with lower GAF’s at admission were more likely to have more total mental health admissions. Length of Stay in Current Substance Abuse Facility Predictor Std(B) Sig F-test Sig F Rsq. I. Demographic Variables 3.307 .002 .017 Sex .089 .001 Marital Status -.034 .207 Educ level -.042 .125 Employment status -.036 .190 Housing status -.001 .982 Admission Age .016 .557 Admission GAF -.045 .089 II. Race/Ethnicity 7.878 <.001 .050 Black vs. White (non-Hispanic) .078 .013 Hispanic/Latinos(as) vs. White -.140 .000 Predictor Std(B) Sig F-test Sig F Rsq. II. Race/Ethnicity 7.878 <.001 .050 Black vs. Hispanic/Latinos(as) .218 .000 White (non-Hispanic) vs. Hispanic/Latinos(as)
.139 .000
Linear regression analysis examining the relationship between length of stay and race/ethnicity showed that, after controlling for demographic variables and symptom severity, African Americans had significantly longer length of stay than White Americans (non-Hispanic) and Hispanics/Latinos(as). In addition, Hispanics/Latinos(as) had significantly shorter length of stay than White Americans (non-Hispanic). Examination of the controlling variables showed that sex was also significantly related to length of stay: females had longer lengths of stay. Does the Facility Concur with Discharge? After controlling for demographic variables and symptom severity, logistic regression showed that race/ethnicity was not related to facility concurring with discharge (p>.05). Alert Status at Discharge? Whether consumers were discharged with an alert status (i.e., parole, probation, on bail, correctional hold, secret service hold, general alert) was a variable we investigated. However, in the DPASS data set there was no code for “no alert status” and alert status information was missing for most of the participants (95.4%-See Table 1). We assumed that missing data meant that the consumer was discharged with no alert status. This assumption is potentially problematic (see limitations section at end of report). Nevertheless, we analyzed whether a

disparity existed between those who were discharged with an alert status (regardless of type) and those who had missing data. After controlling for demographic variables and symptom severity, logistic regression showed that race/ethnicity was not related to alert status with discharge (all p’s>.05) Primary Axis I Diagnosis at Discharge
Primary Axis I Discharge Diagnosis of Alcohol-related Disorders Predictor Exp(B) 95%
CI Lower
95% CI Upper
Sig -2 log likely-hood
I. Demographic Variables 1591.68 Sex .762 .575 1.008 .057 Marital Status .726 .461 1.143 .167 Education Level (-hs vs. hs+) .826 .634 1.077 .157 Employment Status 2.367 1.408 3.979 .001 Housing Status .927 .662 1.299 .661 Admission Age 1.066 1.052 1.081 .000 Admission GAF 1.004 .986 1.022 .670 II. Race/Ethnicity 1510.91 Black vs. White (non-Hispanic) .693 .521 .924 .012 Hispanic vs. White (non-Hispanic) .230 .163 .324 .000 Predictor Exp(B) 95%
CI Lower
95% CI Upper
Sig -2 log likely-hood
II. Race/Ethnicity 1510.91 Black vs. Hispanic/Latino(a) 3.012 2.153 4.214 .000 White (non-Hispanic) vs. Hispanic 4.345 3.084 6.120 .000 Logistic regression investigating the relationship between race/ethnicity and a primary Axis I discharge diagnosis of alcohol-related disorders, controlling for demographic variables and symptom severity, showed that: African Americans and Hispanics/Latinos(as) were significantly less likely than White Americans (non-Hispanic) to have a primary Axis I discharge diagnosis of an alcohol-related disorder. Specifically, African Americans were 31% less likely and Hispanics/Latinos(as) were 77% less likely to have a primary Axis I discharge diagnosis of an alcohol-related disorder. Also, African Americans were significantly more likely than Hispanics/Latinos(as) to have a primary Axis I discharge diagnosis of an alcohol-related disorder. Specifically, African Americans were 201% more likely than Hispanics/Latinos(as) to have a primary Axis I discharge diagnosis of an alcohol-related disorder. Examination of the controlling variables showed that employment status and admission age were also significantly related to having a primary Axis I discharge diagnosis of an alcohol-related disorder. Specifically, employed people were 137% more likely than unemployed people to have a primary Axis I discharge diagnosis of an alcohol-related disorder. Also, with each

increasing year of admission age, people were 7% more likely to have a primary Axis I discharge diagnosis of an alcohol-related disorder.
Primary Axis I Discharge Diagnosis of Drug-related Disorder Predictor Exp(B) 95%
CI Lower
95% CI Upper
Sig -2 log likely-hood
I. Demographic Variables 1598.05 Sex 1.362 1.030 1.802 .030 Marital Status 1.232 .788 1.924 .360 Education Level (-hs vs. hs+) 1.191 .914 1.551 .195 Employment Status .361 .214 .609 .000 Housing Status 1.095 .782 1.533 .598 Admission Age .937 .924 .950 .000 Admission GAF .992 .974 1.010 .402 II. Race/Ethnicity 1517.88 Black vs. White (non-Hispanic) 1.437 1.079 1.914 .013 Hispanic vs. White (non-Hispanic) 4.276 3.045 6.006 .000 Predictor Exp(B) 95%
CI Lower
95% CI Upper
Sig -2 log likely-hood
II. Race/Ethnicity 1517.88 Black vs. Hispanic .336 .241 .469 .000 White (non-Hispanic) vs. Hispanic .234 .166 .328 .000 Logistic regression investigating the relationship between race/ethnicity and a primary Axis I discharge diagnosis of a drug-related disorder, controlling for demographic variables and symptom severity, showed that: African Americans and Hispanics/Latinos(as) were significantly more likely to have a primary discharge diagnosis of a drug-related disorder than White Americans (non-Hispanic). Specifically, African Americans were 44% more likely and Hispanics were 328% more likely than White Americans (non-Hispanic) to have a primary Axis I discharge diagnosis of a drug-related disorder. In addition, African Americans were significantly less likely than Hispanics/Latinos(as) to have a primary Axis I discharge diagnosis of a drug-related disorder. Specifically, African Americans were 66% less likely than Hispanics/Latinos(as) to have a primary Axis I discharge diagnosis of a drug-related disorder. Examination of the controlling variables showed that sex, employment status and admission age were significantly related to having a primary Axis I discharge diagnosis of a drug-related disorder. In fact, women were 36% more likely and employed people who were employed were 64% less likely to have a primary Axis I discharge diagnosis of a drug-related disorder. In addition, the likelihood of a primary Axis I discharge diagnosis of a drug-related disorder decreased by 6% with each increasing year of admission age. Primary Mental Health Diagnoses at Discharge

Primary Axis I Mental Health Diagnoses at Discharge After controlling for demographics and symptom severity, logistic regression showed that race/ethnicity was not related to having a primary discharge diagnosis of an Axis I mental health diagnosis, regardless of the type of mental health diagnosis (i.e., schizophrenia, other psychotic disorders, mood disorder, other diagnoses--all p’s>.05). Primary Axis II Diagnoses at Discharge After controlling for demographics and symptom severity, logistic regression showed that race/ethnicity was not related to a primary Axis II mental health diagnoses at discharge (all p’s>.05) with the following exceptions: Primary Axis II Discharge Diagnosis of a Cluster B Personality Disorder Predictor Exp(B) 95%
CI Lower
95% CI Upper
Sig -2 log likely-hood
I. Demographic Variables 618.41 Sex 1.617 1.003 2.606 .048 Marital Status 1.543 .742 3.210 .246 Education Level (-hs vs. hs+) 1.058 .662 1.690 .814 Employment Status .997 .350 2.842 .996 Housing Status .531 .308 .917 .023 Admission Age .982 .957 1.007 .151 Admission GAF .995 .963 1.027 .740 II. Race/Ethnicity 611.18 Black vs. White (non-Hispanic) 2.105 1.149 3.854 .016 Hispanic vs. White (non-Hispanic) 1.987 1.068 3.696 .030 Predictor Exp(B) 95%
CI Lower
95% CI Upper
Sig -2 log likely-hood
II. Race/Ethnicity 611.18 Black vs. Hispanic 1.059 .620 1.810 .833 White (non-Hispanic) vs. Hispanic .503 .271 .936 .030 Logistic regression showed that, after controlling for demographic variables and symptom severity, African Americans and Hispanics/Latinos(as) were significantly more likely than White Americans (non-Hispanic) to have a primary Axis II discharge diagnosis of a Cluster B Personality Disorder. In addition, African Americans were significantly more likely to have a primary Axis II diagnosis of a Cluster B Personality Disorder at discharge than Hispanics/Latinos(as). In fact, African Americans were 52% less likely and Hispanics/Latinos(as) were 50% less likely to have a primary Axis II diagnosis of a Cluster B Personality Disorder at discharge than White Americans (non-Hispanic). Also, African

Americans were 198% more likely than Hispanics/Latinos(as) to have a primary Axis II diagnosis of a Cluster B Personality Disorder at discharge.
Primary Axis II Discharge Diagnosis of Diagnosis Deferred, Diagnosis Unclear, or No Diagnosis
Predictor Exp(B) 95%
CI Lower
95% CI Upper
Sig -2 log likely-hood
I. Demographic Variables 999.86 Sex .637 .447 .907 .012 Marital Status .908 .502 1.642 .749 Education Level (-hs vs. hs+) .966 .684 1.363 .842 Employment Status 1.049 .489 2.252 .902 Housing Status 1.945 1.301 2.906 .001 Admission Age 1.011 .993 1.030 .227 Admission GAF 1.006 .983 1.030 .601 II. Race/Ethnicity 994.36 Black vs. White (non-Hispanic) .663 .434 1.014 .058 Hispanic vs. White (non-Hispanic) .625 .406 .963 .033 Predictor Exp(B) 95%
CI Lower
95% CI Upper
Sig -2 log likely-hood
II. Race/Ethnicity 994.36 Black vs. Hispanic 1.061 .709 1.587 .774 White (non-Hispanic) vs. Hispanic 1.599 1.038 2.464 .033 Logistic regression showed that, after controlling for demographic variables and symptom severity, Hispanics/Latinos(as) were significantly less likely and African Americans showed a trend (p=.06) towards being less likely to have a primary Axis II discharge diagnosis of “Diagnosis Deferred,” “Diagnosis Unclear,” or “No Diagnosis” than White Americans (non-Hispanic). In fact, African Americans were 34% less likely and Hispanics/Latinos(as) were 37% less likely to have a primary Axis II discharge diagnosis of “Diagnosis Deferred,” “Diagnosis Unclear,” or “No Diagnosis” than White Americans (non-Hispanic). Examination of the significance of the controlling variables showed that sex and housing status were also significantly related to having a primary Axis II discharge diagnosis of “Diagnosis Deferred,” “Diagnosis Unclear,” or “No Diagnosis.” In fact, women were 36% less likely than men and people with housing were 95% more likely than those who were homeless to have a primary Axis II discharge diagnosis of “Diagnosis Deferred,” “Diagnosis Unclear,” or “No Diagnosis.” Discussion

The data analysis conducted for this report show that there appear to be substantial racial/ethnic disparities within the DMHAS inpatient mental health and substance abuse services. Most of the findings in this report are similar to what has been found in previous studies of racial/ethnic disparities. Additional research is recommended to more fully understand the nature and specific meanings of the differences observed in the reported data. Mental Health Settings Within mental health settings, disparities were found for five demographic variables (i.e., age, marital status, education level, housing status, employment status), one symptom-severity variable (i.e., GAF at discharge), and nine treatment-related variables (i.e., referral source, legal status at admission, primary Axis I admission diagnosis, primary Axis II admission diagnosis, length of stay, facility concurring with discharge, alert status at discharge, primary Axis I discharge diagnosis, primary Axis II discharge diagnosis), after controlling for demographic variables and symptom severity. Referral Source. Our referral-sources findings that 1) Hispanics/Latinos were less likely to be self-referred, 2) Hispanics/Latinos(as) were less likely to be referred by other sources (i.e., family, outpatient, residential, other), and 3) Hispanics/Latinos were more likely to be referred by crisis-emergency sources, suggest that Hispanics/Latinos(as) are being underserved by the mental health system and are likely to be delaying entry to treatment until they are in crisis. These findings are similar to previous studies that found low use of inpatient services among Latino Americans (Snowden & Cheung, 1990), and low use of community mental health services by Latino Americans (Breaux & Ryujin, 1999; Cheung & Snowden, 1990) even among those with insurance (Padgett, Patrick, Burns, & Schlesinger, 1994; Scheffler & Miller, 1989). Diagnosis Axis I. Our analysis found that African Americans were more likely to be diagnosed with Schizophrenia and less likely to be diagnosed with Mood Disorders or Other Disorders as compared with White Americans (non-Hispanic) and in some cases Hispanics/Latinos(as). Previous studies have found that African Americans were more likely to be diagnosed with psychotic disorders and less likely to be diagnosed with mood disorders and other disorders (e.g., anxiety disorders) than White Americans (non-Hispanic) (Loring & Powell, 1988; Minsky, Vega, Miskimen, Gara, & Escobar, 2003; Neighbors, Jackson, Campbell, & Williams, 1989; Strakowski et al., 1997; Strakowski, Shelton, & Kolbrener, 1993; West et al., 2006; Worthington, 1992), although some studies found that the effect was no longer significant once socioeconomic status, age, sex, and education were controlled (Adebimpe, 1981; Strakowski et al., 1995). Diagnosis Axis II-Personality. The Axis II findings that 1) African Americans are less likely to have a diagnosis of Personality Disorder NOS at admission and discharge, 2) Hispanics were less likely to have a Cluster B diagnosis at discharge, and 3) Hispanics were more likely to have no diagnosis, diagnosis deferred, or diagnosis unclear at discharge are similar to other studies that have found that personality factors are under-assessed and are less likely to be treatment target among racial/ethnic minorities.

Diagnosis Axis II-Mental Retardation. Our findings that African Americans were more likely than White Americans to have a diagnosis of Mental Retardation and Borderline IQ at both admission and discharge concurs with a long history of racial/ethnic bias in IQ and learning disability assessment. Despite findings that IQ tests are biased against minority group members (Guthrie, 1998; Helms, 1992), they are still being given. In addition, in many cases IQ tests are not given and Mental Retardation or Borderline IQ is merely assumed from interpersonal interactions. Without more information, we cannot know whether the African Americans in this sample who received the diagnosis of Mental Retardation/Borderline IQ were assessed with IQ tests, and, if IQ tests were given, whether the tests or norms used were culturally appropriate. Treatment Variables. Our findings that, in mental health settings, 1) African Americans and Hispanics/Latinos(as) have shorter length of stay than White Americans (non-Hispanic), 2) African Americans were more likely than White Americans (non-Hispanic) to leave treatment without the facility concurring with discharge, and 3) African Americans were discharged with significantly lower GAF at discharge than White Americans (non-Hispanic) are similar to other studies that have found that African Americans and Hispanics/Latinos(as) are more likely to leave treatment prematurely (Sue, Zane, & Young, 1994). Substance Abuse Settings Within substance abuse settings, our analysis found racial/ethnic disparities for 3 demographic variables (i.e., gender, age, and education level), one symptom-severity variable (i.e., GAF at discharge) and 7 treatment-related variables (i.e., referral source, Axis I admission diagnosis, Axis II admission diagnosis, number of mental health admissions, length of stay, Axis I discharge diagnosis, Axis II discharge diagnosis), after controlling for demographic variables and symptom severity. Referral Source. Our findings were the opposite of national findings—that Hispanics were more likely to be self-referred or referred by other sources and less likely to be referred by crisis-emergency sources. Our finding that African Americans were more likely to be referred by criminal justice sources matches national findings. Wells et al., (2001) found that, compared to White Americans, African-Americans were more likely to have “no access” to alcoholism or drug abuse care and Hispanics/Latinos(as) were more likely to have “less care than needed or delayed care” for alcoholism and drug abuse. Diagnosis Axis I. Our analysis showed that White Americans were more likely to have alcohol-related diagnoses and African Americans and Hispanics were more likely to have drug-related diagnoses. These findings persisted at admission and discharge. Similarly, West et al., (2006) found that African-Americans were more likely to be diagnosed as having a nonalcohol substance use disorder, even after adjusting for sociodemographic and care setting/payment factors. In addition, another study (Alvidrez & Havassy, 2005) found that African Americans were more likely than White Americans to be diagnosed with cocaine, amphetamine, and opiate abuse or dependence. On the other hand, Minsky et al., (2003) did not find racial/ethnic differences in self-reported substance abuse using the BASIS-32 questionnaire.

Diagnosis Axis II. In this analysis, we found that African Americans were more likely to be diagnosed with Personality Disorder NOS at admission and then, at discharge, they were more likely to have a Cluster B diagnosis and showed a trend (p=.06) towards being less likely to have no Axis II diagnosis. Hispanics were more likely to come in without an Axis II diagnosis at admission, and then to be less likely to have no Axis II diagnosis at discharge and instead to receive a diagnosis of Cluster B at discharge. Follow-up analysis showed that the primary Cluster B diagnosis used for both African Americans and Hispanics was Antisocial. As mentioned previously, Iwamasa (Iwamasa et al., 2000) found that antisocial personality disorder was more likely to be associated with African-Americans and no personality disorders were associated with Latinos. Other studies found no effect of race on diagnosis of personality disorders (Bamgbose et al., 1980; Littlewood, 1992; Warner, 1979), ratings of impulse control (Umbenhauer & DeWitte, 1978), or ratings of hostility, anxiety or fear (Jenkins-Hall & Sacco, 1991). Treatment-related variables. In addition, our analysis showed that African Americans had a longer length of stay, were more likely to be diagnosed with a personality disorder (NOS at admission and Cluster B at discharge), and had a higher Global Assessment of Functioning score at discharge. These findings concur with previous studies that African Americans are more likely to be kept longer in more restrictive settings despite less psychopathology and are more likely to be seen as threatening in these settings and receive stigmatizing diagnoses such as personality disorders Implications and Future Directions First, because the meaning and implications of disparities related findings are difficult to interpret additional research and exploration is needed to more fully understand the findings discussed in the report. For instance, ethnic differences in several demographic variables need to be compared to CT and U.S. census data to better understand whether the observed differences in housing status or employment, for instance, are reflective of nuances within the DMHAS system of care specifically and are different from broader CT and national findings or whether they mirror CT and national findings. Understanding the observed findings within this broader context will assist with developing targeted interventions to address specific disparities. Thus, if it is found that African Americans are more likely to be homeless or unemployed within CT and nationally, in addition to within the DMHAS system of care, then cross system cross agency interventions may be warranted along with DMHAS specific interventions to eliminate the observed inequities. Further, as a means of better understanding factors contributing to the disparities identified, it is recommended that focus groups be conducted with consumers and providers to help explain clinical decision making and help seeking nuances that may be contributing to the observed disparities. For instance, because previous research suggests that clinician bias and delayed help seeking may contribute to the overdiagnosis of schizophrenia in African Americans, focus groups could explore such areas as help seeking preferences of African Americans, attitudes towards seeking formal mental health services and provider decisional patterns and expectancies in diagnosing schizophrenia. Additional areas for exploration in focus groups could include:

factors contributing to African American consumers being more likely to leave treatment against medical advice in mental health settings, and factors contributing to Hispanics being more likely to self refer for substance abuse treatment and being less likely to self refer in mental health settings. Focus groups findings can then be used to inform the development of needed programs, policies, training sessions or other needed systems interventions. As an additional means of understanding the disparities presented and how best to eliminate them, further research should investigate the occurrence of these disparities longitudinally by following the treatment history of an individual person across time to determine possible reasons for these disparities, the context in which they occur, and how multiple racial/ethnic disparities can impact one person. This exploratory longitudinal analysis could be done prospectively or retrospectively through client chart reviews and by conducting interviews with clients and providers. Further, chart reviews, either retrospectively or prospectively, could lend to an increased understanding of idiosyncratic decision making styles that may contribute to clinical bias. As with the proposed focus groups, observed findings could inform the intervention development process. Several findings discussed in this report mirror disparities observed at the national level and though additional exploration will lend to an increased understanding of their meaning, on a preliminary basis DMHAS disparities that match national findings should be disseminated widely throughout the DMHAS system of care. Dissemination of disparities data can serve the important function of raising awareness of the potential role of bias in the clinical decision making process, which in turn can help to minimize its impact over time. A similar phenomenon was observed in CT in 2004 when disparities in medication prescribing patterns were eliminated following system-wide dissemination of data indicating inequities in prescribing atypical antipsychotic medications. Similar to 2004 dissemination efforts, strategies for distributing current findings can include disseminating results throughout the DMHAS system in summary reports and newsletters, presenting findings at in-service programs and cultural competence education and training sessions, and discussing findings at state and national conferences and key state or national meetings. Given that a number of findings mirror those found at the national level, it is recommended that policies be developed that state and contracted agencies develop formal structures to provide ongoing cultural competence education and training for all staff. Agencies could be asked to include ongoing training as a goal on their cultural competence plans and along with other goals, could be asked to submit biannual reports demonstrating progress in implementing their goals. Submission of these reports could coincide with agency contract renewals. In addition, agencies should be encouraged to include modules in their trainings that address the racial and ethnic disparities discussed in this document. Hopefully, if treatment professionals are aware of these racial/ethnic disparities and trained in how to address them, over time these disparities could be eliminated. As an additional strategy, incorporation of key cultural information in the outreach and peer mentoring process can help to increase both access to care and engagement once an individual has sought services. For instance, informing individuals about the culture of, and strategies for navigating formal mental health services can help to orient individuals to the process of seeking
formal mental health care. This may be particularly important for individuals seeking formal help for the first time, or for individuals for whom seeking formal mental health services is incongruent with their cultural norms for coping with psychological distress. Thus, for some individuals having information about what can be expected when receiving inpatient care can help to dispel potential surprises about the care process which could help to minimize individuals leaving treatment against medical advice. In addition, coaching individuals to ask questions about their diagnosis or medications can help to promote self-determination and choice in the care process, and in turn, can help to increase the cultural compatibility of care and help to reduce the potential impact of provider bias. Because previous research has shown provider bias to contribute to disparities in the overdiagnosis of schizophrenia among African Americans it is recommended that cultural assessments instruments or addendums be incorporated throughout the treatment process. Obtaining a range of cultural information such as an individual’s spiritual beliefs and preferences, cultural understanding of their distress, immigration history, acculturation level and family constellation, for instance, can help to minimize the potential of incorporating stereotypic information in the clinical decision making and treatment process. For instance, a provider understanding that a Haitian American client believes in and actively practices traditional Haitian religious and spiritual practices may be less likely to misdiagnose spiritual phenomena as psychopathology. Several findings suggest that Hispanic Americans and African Americans may be underserved by the DMHAS system of care for mental health problems (i.e., Hispanics being less likely to self refer for mental health problems and being less likely to be referred by other sources, African Americans leaving treatment against medical advice). As a means of improving access and engagement into treatment several specific strategies could be employed. For instance, holding community picnics or information fairs and disseminating information about specific culturally responsive programs and services can help to increase awareness of existing services which could, in turn, increase access to care. In addition, disseminating information regarding the availability of bilingual/ bicultural providers may help to increase access and self referral rates for Hispanic American individuals who may be monolingual Spanish speaking and have a preference for seeking help from a culturally similar provider. Further, because the overall numbers of bilingual/bicultural providers throughout the state are limited use of telemedicine technology can help to increase access to care for monolingual Spanish speaking individuals, particularly those that may be living in rural areas. Limitations These findings and the conclusions drawn from them should be tempered by the limitations of this data set. A primary limitation is the cross-sectional nature of these data: the data represent the treatment information associated with specific individuals at one specific inpatient admission but do not put these variables in context for an individual person over time or offer reasons for why they occur. Future investigations would benefit from looking at mental health information longitudinally within an individual person (see discussion of future directions). A second limitation to this analysis was the coding of the alert status at discharge variable. For the alert status at discharge variable, the only code in the data set was for “yes, alert status” and there was

a large amount of missing data, so it was assumed that missing data meant “no alert status,” although it is possible and indeed likely that there is missing data for some people who were on alert status. Also, for legal status at admission, 47% of the mental health setting sample had missing data across race and ethnicities. A third limitation was that the analysis for the mental health setting was conducted with a smaller number of Hispanic individuals than African Americans and White Americans (non-Hispanic). The validity of chi-square and logistic regression data is quite good with an unequal number of individuals in each group but this inequality is nonetheless a limitation. A fourth limitation to this analysis was the large variability in some of the data, in particular the length of stay variable. In order to prevent the variability from skewing the statistical analysis conducted for this report, outliers whose length of stay were more than 2 standard deviations above the mean or equal to zero were removed from this analysis (see analysis plan).

References Adebimpe, V. R. (1981). Overview: White norms and psychiatric diagnoses of black patients.
American Journal of Psychiatry, 138, 279-285. Alvidrez, J., & Havassy, B. E. (2005). Racial distribution of dual-diagnosis clients in public
sector mental health and drug treatment settings. Journal of Health Care for the Poor and Underserved, 16, 53-62.
Baker, F. M., & Bell, C. C. (1999). Issues in the psychiatric treatment of African-Americans. Psychiatric Services, 50, 362-368.
Bamgbose, O., Edwards, D., & Johnson, S. (1980). The effects of race and social class on clinical judgment. Journal of Clinical Psychology, 36, 605-609.
Borowsky, S. J., Rubenstein, L. V., Meredith, L. S., Camp, P., Jackson-Triche, M., & Wells, K. B. (2000). Who is at risk for nondetection of mental health problems in primary care? Journal of General Internal Medicine, 15, 381-388.
Breaux, C., & Ryujin, D. (1999). Use of mental health services by ethnically diverse groups within the United States. The Clinical Psychologist, 52, 4.
Cheung, F. K., & Snowden, L. (1990). Community mental health and ethnic minority populations. Community Mental Health Journal, 26, 277-291.
Cleary, T. A. (1968). Test bias: Prediction of grades of Negro and White students in integrated colleges. Journal of Educational Measurement, 5, 115-124.
Dohrenwend, B. (1995). The problem of validity in field studies of psychological disorders revisited. In M. T. Tsuang & M. Tohen & G. Zahner (Eds.), Textbook of psychiatric epidemiology (pp. 3-22). New York: John Wiley and Sons, Inc.
Eaton, W. W., & Kessler, L. G. (Eds.). (1985). Epidemiological field methods in psychiatry: The NIMH epidemiologic catchment area program. Orlando, FL: Academic Press Inc.
Flaskurud, J., & Hu, L. (1992). Relationship of ethnicity to psychiatric diagnosis. Journal of Nervous and Mental Disease, 180(5), 296-303.
Garb, H. N. (1998). Studying the clinician : judgment research and psychological assessment. Washington, DC: American Psychological Association.
Garretson, D. (1993). Psychological misdiagnosis of African Americans. Journal of Multicultural Counseling and Development, 21, 119-126.
Guthrie, R. V. (1998). Even the rat was white (2nd edition). Boston: Allyn & Bacon. Helms, J. E. (1992). Why is there no study of cultural equivalence in standard cognitive ability
testing? American Psychologist, 47, 1083-1101. Iwamasa, G. Y., Larrabee, A. L., & Merritt, R. D. (2000). Are personality disorder criteria
ethnically biased? A card-sort analysis. Cultural Diversity and Ethnic Minority Psychology, 6(3), 284-296.
Jenkins-Hall, K., & Sacco, W. P. (1991). Effect of client race and depression on evaluations by white therapists. Journal of Social and Clinical Psychology, 10, 322-333.
Jensen, A. R. (1980). Bias in mental testing. New York: Free Press. Kessler, R. C., Chiu, W. T., Demler, O., & Walters, E. E. (2005). Prevalence, Severity, and
Comorbidity of 12-Month DSM-IV Disorders in the National Comorbidity Survey Replication. Archives of General Psychiatry, 62(6), 617-627.
Littlewood, R. (1992). Psychiatric diagnosis and racial bias: Empirical and interpretive approaches. Social Science and Medicine, 34, 141-149.

Loring, M., & Powell, B. (1988). Gender, race, and DSM-III: A study of the objectivity of psychiatric diagnostic behavior. Journal of Health and Social Behavior, 22, 1-22.
Minsky, S., Vega, W., Miskimen, T., Gara, M., & Escobar, J. (2003). Diagnostic patterns in Latino, African American, and European American psychiatric patients. Archives of General Psychiatry, 60, 637-644.
Neighbors, H. W., & Jackson, J. S. (1996). Mental health in Black America. Thousand Oaks: Sage Publications.
Neighbors, H. W., Jackson, J. S., Campbell, L., & Williams, D. R. (1989). The influence of racial factors on psychiatric diagnosis: A review and suggestions for research. Community Mental Health Journal, 24, 301-311.
New Freedom Commission on Mental Health. (2003). Achieving the promise: Transforming mental health care in America. Rockville, MD: DHHS Pub. No. SMA-03-3832.
Padgett, D. K., Patrick, C., Burns, B. J., & Schlesinger, H. J. (1994). Ethnic differences in use of inpatient mental health services by African Americans, White Americans, and Hispanics in a national insured population. Health Services Research, 29, 135-153.
Regier, D. (Ed.). (1991). Psychiatric disorders in America: The epidemiologic catchment area study. New York: Free Press.
Rothbard, A. B., Kuno, E., & Foley, K. (2003). Trends in the rate and type of antipsychotic medications prescribed to persons with Schizophrenia Schizophrenia Bulletin, 29(3), 531-540.
Samuda, R. J. (1975). Psychological testing of American minorities. New York: Harper & Row. Scarr, S. (1981). Race, social class, and individual differences in IQ. Hillsdale, NJ: Erlbaum. Scheffler, R. M., & Miller, A. B. (1989). Demand analysis of service use among ethnic
subpopulations. Inquiry, 26, 202-215. Snowden, L. (1999). African American service use for mental health problems. Journal of
Community Psychology, 27, 303-313. Snowden, L., & Cheung, F. K. (1990). Use of inpatient mental health services by members of
ethnic minority groups. American Psychologist, 45, 347-355. Strakowski, S. M., Hawkins, J. M., Keck, P. E., McElroy, S. L., West, S. A., & Bourne, M. L.
(1997). The effects of race and information variance on disagreement between psychiatric emergency service and research diagnoses in first-episode psychosis. Journal of Clinical Psychiatry, 58, 457-463.
Strakowski, S. M., Lonczak, H., Sax, K., West, S. A., Crist, A., Mehta, R., & Thienhaus, O. (1995). The effects of race on diagnosis and disposition from a psychiatric emergency service. Journal of Clinical Psychiatry, 56, 101-107.
Strakowski, S. M., Shelton, R., & Kolbrener, M. (1993). The effects of race and comorbidity on clinical diagnosis in patients with psychosis. Journal of Clinical Psychiatry, 54, 96-102.
Sue, S., Zane, N., & Young, K. (1994). Research on psychotherapy with culturally diverse populations. In A. E. Bergin & S. L. Garfield (Eds.), Handbook of psychotherapy and behavior change, 4th edition (pp. 261-274). New York: John Wiley and Sons.
Trierweiler, S. J., Neighbors, H. W., Munday, C., Thompson, S. E., Binion, V. J., & Gomez, J. P. (2000). Clinical attributions associated with diagnosis of schizophrenia in African American and non-African American patients. Journal of Consulting and Clinical Psychology, 68, 171-175.
U.S. Census Bureau. (2001). Profiles of general demographic characteristics: 2000 census of population and housing, United States. from

http://www2.census.gov/census_2000/datasets/demographic_profile/0_National_Summary/. Retrieved, Retrieved June 22, 2001, from the World Wide Web:
U.S. Department of Health and Human Services. (2001). Mental health: Culture, race, and ethnicity--A supplement to Mental Health: A report of the surgeon general. Rockville, M.D.: U.S. Department of Health and Human Services, Public Health Service, Office of the Surgeon General.
Umbenhauer, S. L., & DeWitte, L. L. (1978). Patient race and social class: Attitudes and decisions among three groups of mental health professionals. Comprehensive Psychiatry, 19, 509-515.
Vega, W. A., Kolody, B., Aguilar-Gaxiola, S., Alderete, E., Catalano, R., & Carveo-Anduga, J. (1998). Lifetime prevalence of DSM-III-R psychiatric disorders among urban and rural Mexican Americans in California. Archives of General Psychiatry, 55, 771-778.
Warner, R. (1979). Racial and sexual bias in psychiatric diagnosis. Journal of Nervous and Mental Disease, 167, 303-310.
Wells, K., Klap, R., Koike, A., & Sherbourne, C. (2001). Ethnic disparities in unmet need for alcoholism, drug abuse, and mental health care. American Journal of Psychiatry, 158, 2027-2032.
West, J. C., Herbeck, D. M., Bell, C. C., Colquitt, W. L., Duffy, F. F., Fitek, D. J., Rae, D., Stipec, M. R., Snowden, L., Zarin, D. A., & Narrow, W. E. (2006). Race/ethnicity among psychiatric patients: Variations in diagnostic and clinical characteristics reported by practicing clinicians. Focus, 4, 48-56.
Worthington, C. (1992). An examination of factors influencing the diagnosis and treatment of Black patients in the mental health system. Archives of Psychiatric Nursing, 6, 195-204.
Wu, E., El-Bassel, N., Gilbert, L., Piff, J., & Sanders, G. (2004). Sociodemographic disparities in supplemental service utilization among male methadone patients Journal of Substance Abuse Treatment, 26(3), 197-202.
Zahner, G., Hsieh, C., & Fleming, J. (1995). Introduction to epidemiological research methods. In M. T. Tsuang & M. Tohen & G. Zahner (Eds.), Textbook in psychiatric epidemiology (pp. 23-54). New York: John Wiley & Sons, Inc.