Embed Size (px)
Citation preview
----------- - -- --- ---------- --
R-2947-NfC
Racial Disparities in the Criminal Justice System
Joan Petersilia
June 1983
jared for
\Jational Institute of Corrections, )epartment of Justice
... • M(
U.S. Department !Jf Justice National Institute of Justice
12711'1-
. been re roduced exactly as received from the ;~;~o~o~~:~~~i~~~on Origin~ting it. Points of view or opinions stat~d in this document are those of the authors and do. not nec~ssan y represent the official position or policies of the National Institute of Justice.
Permission to reproduce this copyrighted material in microficlle on!}, has been granted by •
The Kand Corporatlon
to the National Criminal Justice Reference Service (NCJRS) .
Further reproduction outside of the NCJRS system requires permission of the copyright owner.
If you have issues viewing or accessing this file contact us at NCJRS.gov.
PREFACE
Over the last three decades, social science researchers have repeatedly addressed the possibility of racial discrimination in the criminal justice system, but it remains an open question. Because of problems with data and methodology, no study has established definitively that the system does or does not discriminate against racial minorities.
This two-year study approached the issue by comparing the treatment of white and minority offenders at key decision points in the system, from arrest through release from custody, and by investigating possible racial differences in criminal behavior that might influence that treatment. It attempted to overcome the material and methodological limitations of earlier research in two ways:
• By using both official records and information from a large sample of prison inmat.('s nhollt nspl'C"t.s of t hl'ir hackground and t:riminal behaviur, and
• By using multiple regression techniques when possible to analyze the resulting data, techniques that allow the analyst to control for other factors besides race that might affect the system's handling of minority offenders.
The study was supported by the National Institute of Corrections, Bureau of Prisons, U.S. Department of Justice. The report should be of interest to criminal justice researchers who are investigating the system's operations, and to policymakers who are looking for mechanisms that will ensure equal treatment for offenders. regardless of race. Because the study deals with a complex and sensitive issue, the report describes the data, methodology, and findings in considerable, technical detail. To accommodate readers who are more concerned with policy than with research, ,~he report includes a short Executive Summary of the study's conclusivns and policy implications.
iii
EXECUTIVE SUMMARY
I. INTRODUCTION AND SUMMARY
Critics of the criminal justice system view the arrest and imprisonment rates for blacks and other minorities as evidence of racial discrimination. Although the laws governing the system contain no racial bias, these critics claim that where the system allows discretion to criminal justice officials in handling offenders, discrimination can, and often does, enter in. They argue that blacks, for example, who make up 12 percent of the national population, could not possibly commit 48 percent of the crime-but that is exactly what their arrest and imprisonment rates imply. Defenders of the system argue that the statistics do not lie, and that the system does not discriminate but simply reacts to the prevalence of crime in the black community.
Statistics on street crime lend support to this argument. An astonishing 51 percent of black males living in large cities are arrested at least once for an index crime during their lives, compared with only 14 percent of white males. 1 Fully 18 percent of black males serve time, either as juveniles or adults, compared with 3 percent of white males lGreenfeld, 1981). Blacks are also disproportionately victimized by crime: Murder is the leading cause of death for young black males, and is also high for young black females.
Crime, then, is a fact of life in the ghetto. Blacks and other minorities must deal with crime and the criminal justice system much more than whites. Moreover, as crime rates continue to rise, the nation's overcrowded prisons find their economic ~nd operational problems compounded by racial problems. In many prisons, racial gangs maneuver for dominance and victimize racial minorities-and whites are often a minority. These conditions have given rise to the question of racial discrimination; to address it., our study pursued three objectives:
(1) To discover whether there is any evidence that the criminal justice system systematically treats minorities differently from whites;
(2) If then' is such evidencp, t.o S{'{' whpt.h{'1' t.hat. t.n'at.nwnt. represents discrimination or is simply a reaction to the amount of crime committed by minorities: and
iBlumstein and Graddy, 1981. Index offenses are murder, rape, robbery, assault, burglary, larceny/theft, auto theft, and arson.
v
vi
(3) To discuss the policy implications for correcting any bias.
METHODOLOGY AND DATA
Social science researchers have been addressing the question of discrimination in the system for more than thirty years, but have failed to reach consensus on almost every point. Studies have offered evidence both for and against racial bias in arrest rates, prosecution, conviction, sentencing, corrections, and parole. There are many reasons for these contradictions. Some studies have data bases too small to permit any generalization. Others have failed to control for enough (or any) of the other factors that might account for apparent racial discrimination. Most studies have looked at only one or two levels of the system. And no studies have examined criminals' pre-arrest contact with the system-a point at which many believe the greatest racial differences in treatment exist.
We attempted to overcome those shortcomings by using data from official rec9rds and prisoner self-reports, by examining the evidence for discrimination throughout the criminal justice system, and by controlling for the major variables that might create the appearance of discrimination. Whenever the data were sufficient to do so, we used multiple regression analyses of system decisions and criminal behavior to control for the most obvious vari.ables. I:n the comparisons, then, the offenders were somewhat "interchangeable" except for race.
The study data came from two sources: the California OffenderBased Transaction Statistics (GBTS) for 1980, and the Rand Inmate Survey ~RIS). The OBTS is a computerized inIormation system maintained by the California Bureau of Criminal Statistics that tracks the processing of offenders from arrest to sentencing. The RIS consists of data obtained from self-reports of approximately 1400 male prison inmates in California, Michigan, and Texas.
MAJOR FINDINGS
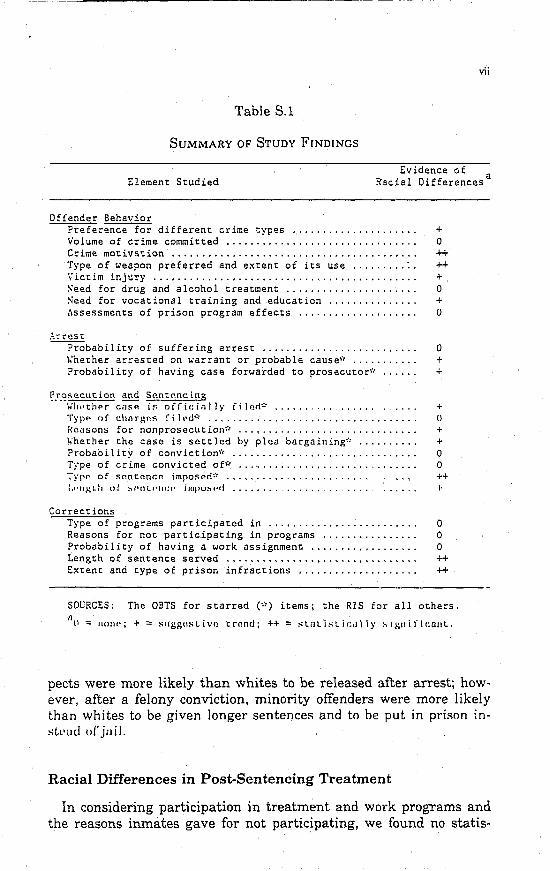
We found some racial differences in both criminal behavior and the treatment of offenders in the states involved. (See Table S.1.)
Racial Differences in Case Processing
Although the case processing system generally treated offenders similarly, we found racial differences at two key points: Minority sus-
vii
Table S.l
SUMMARY OF STUDY FINDINGS
Element Studied Evidence of
Racial Differencesa
Offender Behavior Preference for different crime types. ............... ..... + Volume of crime committed ........ .... .............. ...... 0 Crime motivation......................................... ++ Type of weapon preferred and extent of its use ......... :. ++ Victim injury ...•........................................ + Seed for drug and alcohol treatment. ............. ........ 0 Seed for vocational training and education .•............. + Assessments of prison program effects ............. , .. ,... 0
A~rest
---probability of suffering arrest ..... ......... ...... ...... 0 lihether arrested on warrant or probable cause'" ........... + Probability of having case forwarded to prosecutor* +
~_r_'2~ut:ion and Sa~cing \,'iI"tl'IPr casp. if; ofric:i.1 I Iy fi Inn'" ................ , .... + Typ" of chnrg.'" fi It,d':' ................................... () Heasons for nonprosecution* .......... '" ................. + I.'hether the case is settled by plea bargaining* .......... + Probability of conviction* .,. ..... .... ... ................ 0 Type of crime convicted of* .............................. 0 Typ" of snntnnen impospn'" ............ ' ..... ,...... ++ Lf·II~t.h of ':"PIILf'II(;" iwplJ!'Ipd ....... , ....... +
Corrections Type of programs participated in . ..... ....... ........ .... 0 Reasons for not participating in programs. ........ ....... 0 Probability of having a work assignment ........ .......... 0 Length of sentence served .•.•.•...•.••.•...•... •.•.....•. ++ Extent and type of prison infractions ........ ............ ++
SOCRCES: The OBTS for starred (*) items; the RIS for all others.
il(\ = IlOIH'; + = suggtl:.;t,iVCl trend; ++ = SUIt.iSLic:.J\ly slgllifi(;ant..
pects were more likely than whites to be released after arrest; however, after a felony conviction, minority offenders were more likely than whites to be given longer sentences and to be put in prison insLl'ud or jui I.
Racial Differences in Post-Sentencing Treatment
In considering participation in treatment and work programs and the reasons inmates gave for not participating, we found no statis-
viii
tically significant differences that implied discrimination against minorities in corrections. However, in looking at length of sentence served, we found significant racial differences in California and Texas, but none in Michigan. These findings held even when we controlled for other major factors that might affect release decisions. In California prisons, blacks and Hispanics serve longer sentences than whites-largely, however, because of racial differences in court-imposed sentences. In Texas, minorities also serve longer sentencesappreciably longer than their court-imposed minimum terms. In Michigan the reverse is true. There, blacks enter prison with longer sentences than whites, but serve roughly the same time.
Racial Similarities in Crime Commission Rates and Probability of Arrest
The high post-arrest release rates for minorities do not indicate that police overarrest minorities in proportion to the kind and amount of crime they actually commit. We found that annualized crime commission rates were much the same among white and minority criminals. Moreover, there are no consistent, statistically significant, racial differences in the probability of arrest, given that an offender has committed a crime.
Racial Differences in Offender Behavior
There are some evident racial differences in criminal motivation, weapons use, and prison behavior, but most are not statistically significant. Blacks rated economic distress higher than other motivations, but not significantly more so than other groups. Whites rated hedonistic motives for crime significantly higher than blacks or Hispanics. In weapons use, there were only two significant findings. Hispanics were much more likely than the other groups to use knives, and black burglars were less likely to be armed. Racial differences were strongest in prison behavior. In Texas, blacks had a higher rate of infractions; in California, whites did.
CONCLUSIONS
These findings raise some important questions and identify some patterns that, together with other research, suggest tentative conclusions.
IX
Disparities in Release Rates
Because we found that minorities do not have a higher probability of arrest, the release rates might be explained by evidentiary problems. Prior research indicates that prosecutors do have greater pr®blems making minority cases "stick" because victims often have difficulty identifying minority suspects. Moreover, minority victims and witnesses often refuse or fail to cooperate after an arrest is made. Some racial differences in release rates may also result from the'fact that police more often arrest white suspects than minority suspects "on warrant." Since the evidentiary criteria for issuing warrants approximate those for filing charges, it seems reasonable that fewer whites than minorities would be released without charges.
Disparities in Sentencing and Time Served
Controlling for the other major factors that might influence sentencing and time served, we found that minorities receive harsher sentences and serve longer in prison-other things being equal. However, racial differences in plea bargaining and jury trials may explain some of the difference in length and type of sentence. Plea bargaining resolves a higher percentage of felony cases involving white defendants, whereas jury trials resolve a higher percentage of cases involving minorities. Although plea bargaining ensures conviction, it also virtually guarantees a reduced charge or a lighter sentence, or both; conviction by a jury usually results in more severe sentencing.
Differences in sentencing and time served may also reflect the kinds of information that judges and parole boards use to make their decisions. Research has found that in 80 percent of cases, judges follow the sentencing recommendation made in the probation officer's pre-sentence investigation report (PSR). Moreover, in many states, the PSR becomes the heart of the parole board's case-summary file. These reports are usually very comprehensive "portraits" of offenders, containing personal and socioeconomic information, as well as any details the probation officer can get on their criminal habits and attitudes. This information can be, and evidently is, assessed for indicators of recidivism-that is, traits related to the probability that a released offender will return to crime. Blacks and Hispanics may have more such traits than whites (e.g., past unemployment).
The relation between court-imposed sentence and length of time served supports these conjectures. Minorities received longer minimum sentences than whites in all three states. However, that sen-
x
tence had varying effects on time finally served. In California, racial . differences in sentence served corresponded roughly to the differences in court-imposed sentences. In Texas, time served was appreciably longer for minorities than for whites-and appreciably longer than the court-imposed sentence. In Michigan, the reversl!l was true: There, blacks received longer court-imposed sentences than whites, but served roughly the same time.
California has a determinate sentencing policy, which explains the relation of sentence imposed to sentence served there. But the contrast between Texas and Michigan can perhaps be explained by parole practices. Texas has a highly individualized process that incorporates the full range of an inmate's criminal history and personal and socioeconomic characteristics. In contrast, Michigan has adopted a riskassessment formula for parole decisions that relies primarily on indicators of personal culpability such as juvenile record, violence of conviction crime, and prison behavior. This practice evidently avoids racial disparities in time served-and may overcome the racial dispar·· ity in court-imposed sentences.
Nevertheless, overcoming racial disparities in time served is not thEl definitive objective of parole boards. Their primary responsibility is to decide whether releasing an inmate will endanger society. By ignoring socioeconomic and other extra.legal indicators of recidivism, they may reduce racial disparities in parole decisions, but they may do so at the expense of putting probable recidivists back on the street.
Indicators of Recidivism
If recidivism indicators are valid and explain racial disparities in sentencing and time served, the system is not discriminating. It is simply reflecting the larger racial problems of society, and it can do little about the overrepresentation of minorities in prison. However, the RIS data and some other research contain suggestions that the recidivism indicators may not be so "racially neutral" after all.
Minorities are overrepresented in the criminal popula'i;ion, relative to their proportion of the national population. However, they do constitute roughly half the criminal population. Thus, within that population, their characteristics should have no more effect on empirically derived indicators of recidivism than the characteristics of white recidivists-unless minorities have higher crime commission rates. We have found, however, that minorities and whites have similar crime commission rates, and other research has established that whites and minorities have approximately the same probability of
xi
recidivism. It is apparent that some indicators of recidivism overlap with race in ways that deserve investigation.
IMPLICATIONS FOR FUTURE RESEARCH AND POLICY
These findings and conclusiom; su~gt.'sL sonw irnporlanL t'l'Sl';(l'ch
needs and policy initiatives. Among the research priorities are:
• Documenting the reasons for post-arrest/pre-filing release rates and controlling for race of the offender and type of arrest;
• Analyzing post-arrest problems with witnesses to discover whether and how the race of the suspect andiOr of the witness affects cooperation;
• Determining the relation of plea bargaining and jury trials to race, and why minority defendants are less likely to plea-bar-gain; .
4& Establishing the reasons why minorities receive and serve longer sen.~ences, paying particular attention to effects that length of court-imposed sentences, gang-related activities in prison, and prison infractions have on time served.
Although these and other issues deserve research attention, we believe that understanding why recidivism indicators more often work against minoriti9s has a particularly high priority. The system is moving to heavier reliance on these i-ndicators precisely to render sentencing and parole decisions more objective. Paradoxically, just the opposite may result if, as we suspect:some of these indicators overlap with race in ways largely unrelated to recidivism.
Definitive policy recommendations will not be possible until some of these research tasks are completed, but three interim policy initiati ves may be useful:
• Police and prosecutors should take into account the obstacles to filing charges after minority arrests, particularly the problems with witnesses, and try to find ways of ensuring that pre-arrest identifications will hold firm.
• Plea bargaining needs close monitoring, perhaps by a single deputy, for indications that minority defendants are consistently offered less attractive bargains than whites.
• Until the quality and predictive weight of recidivism indicators can be tested, probation officers, judges, and parole boards should give more weight to indicators of personal cul-
xii
pability than to indicators based on group classifications, such as education and family status.
Although this study shows that minorities are treated differently at a few points in the criminal justice system, it has not found evidence that this results from widespread and consistent racial prejudice in the system. Racial disparities seem to have developed because procedures were adopted without systematic attempts to find out whether they might affect different races differently. Consequently, future research and policy should be concerned with looking behind the scenes at the key actors in the system and their decisionmaking process, primarily at the kind of information they use, how valid it is, and· whether its use affects particular racial groups unfairly.
II. BACKGROUND, DATA, AND METHODOLOGY
BACKGROUND
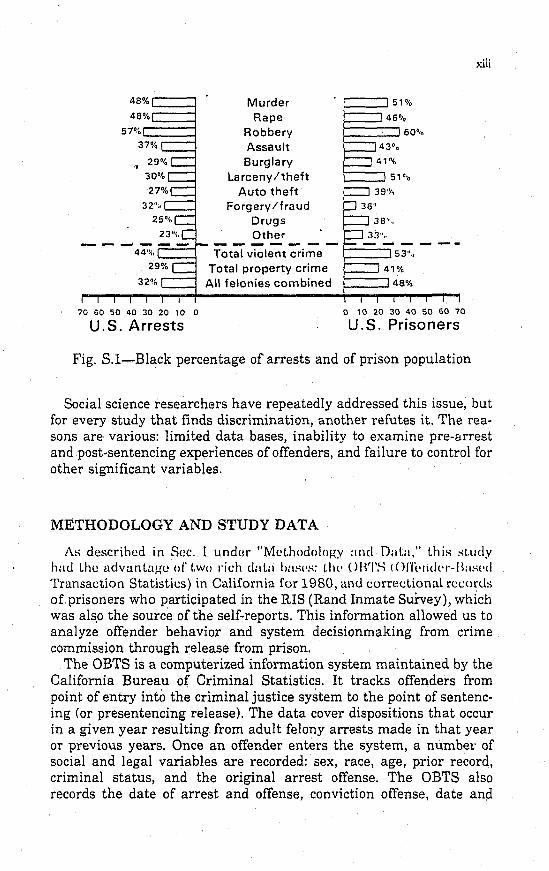
The criminal justice system allows policemen, prosecutors, judges, and parole boards a great deal of discretion in handling most criminal cases. The resulting statistics on minorities in prison have convinced many people that this discretion leads to discrimination. Figure S.l provides a provocative insight into this issue. Looking at the four top crimes, we find little disparity between the percentage of blacks arrested and the percentage serving prison terms for the crime. These figures suggest that between arrest and sentencing, at any rate, the criminal justice system is simply reacting to the relative number of blacks in the arrest population; however, these violent crimes allow agents of the system less discretion in handling or sentencing. When the crime is murder, forcible rape, robbery, or aggravated assault, a judge has less latitude in deciding about probation or sentence length, or whether the sentence will be served in jailor prison-no matter what color a man is.
Disparity crops up when we move down to lesser crimes. The most striking example is larceny: Blacks account for only 30 percent of the arrest poptllation, but for 51 percent ofthose serving time for larceny. Why the disparity? One explanation may be that judges can exercise more discretion in dealing with offenders convicted of lesser crimes. If so, the numbers lend some credibility to the charge that discretion leads to discrimination.
48%C~~~3 48%r-
57% ;:":===1 Murder
Rape Robbery Assault Burglary
Larceny Itheft Auto theft
Forgery/fraud Drugs Other
f-_-,51%
46·"
44% =--=-...r- Tot;i vTc;l~t -;;;i~e - f-----,
70 60 50 40 30 20 '0 0
U. S. Arrests
Total property crime All felonies combined
o '0 20 30 40 SO 60 70
U.S. Prisoners
Fig. S.l-Black percentage of arrests and of prison population
xiii
Social science researchers have repeatedly addressed this issue, but for every study that finds discrimination, another refutes it. The reasons are various: limited data bases, inability to examine pre-arrest and post-sentencing experiences of offenders, and failure to control for other significant variables.
METHODOLOGY AND STUDY DATA
As deRcribed in Sec. I under "Methodology and Dat.a," this st.udy had the advantage of' two d<:h datn I >:lSI'S: (,Ill' OB'I'S (O/'li.'ndl'r-Baspd Transaction Statisties) in California for 1980, and correctional reeord:-; of prisoners who participated in the RIS (Rand Inmate Survey), which was als,o the source of the self-reports. This information allowed us to analyze offender behavior and system decisionmaking from crime commission through release from prison.
The OBTS is a computerized information system maintained by the California Bureau of Criminal Statistics. It tracks offenders from point of entry into the criminal justice system to the point of sentencing (or presentencing release). The data cover dispositions that occur in a given year resulting from adult felony arrests made in that year or previous years. Once an offender enters the system, a number of social and legal variables are recorded: sex, race, age, prior record, criminal status, and the original arrest offense. The OBTS also records the date of arrest and offense, conviction offense, date and
xiv
point of disposition, type of proceeding, type .of final sentence, and length of prison sentence.
With the OBTS data, the study could not only track racial differences in case disposition from arrest to sentencing, but could also con
'. trol for factors such as type of crime and prior record. Both of these factors are essential in understandirig whether severity of sentence in average statistics indicates racial discrimination.
The RIS consists of data obtained from a self-administered questionnaire completed by approximately 1380 male prison inmates in California, Michigan, and Texas in 1978. Together, these three states house 22 percent of the national population of state prisons. In each state, the survey procedures produced a sample of inmates whose characteristics approximated the statewide intake of male p:dsoners. The self-reports elicited information about inmates' crimes, arrests, crimina:i motivations, drug and alcohol use, prior criminal record, prison experience, and the like.
Because self-reports inevitably raise questions about the respondents' veracity, the survey was constructed to allow for both internal and external checks on validity. The questionnaire included pairs of questions, wipely separated, that asked for essentially the same information about crimes the respondents had committed and about other topics. This made it possible to check for internal quality (inconsistency, omission, and confusion). Over 83 percent ofthe respondents filled out the questionnaire accurately, completely, and consistently. The responses were not anonymous, and the official records served not only as part of the analysis but also as an external check on the validity of the self-reports. Although the external check revealed more inconsistencies than the internal check, 59 percent of the respondents had an external error rate of less than 20 percent. However, for most disparities, the records were as questionable as the respondents' veracity. Records are often missing or incomplete, through no fault of the prisoners.
The cross-checking capability also permitted comparisons between inmate characteristics and the quality of the self-reports. One might suspect that some types of people would be less truthful than others. However, an earlier Rand study using the same data found that, with minor exceptions, such individual characteristics as conviction crime, self-image, activity in fraud or "illegal cons," and sociodemographic characteristics, were unrelated to the quality and validity of the response. It also showed no racial differences in validity based on external checks. However, the self-reports of black respondents had lower internal quality );han whites' or Hispanics' reports, primarily because of inconsistency and confusion rather than omissions (Chaiken and Chaiken, 1982).
xv
The RlS data perrniUed us Lo ('xarnirl(' r'i1l'ial din(~n'ncl'l' in l'rin\(' l:()mmi~bi()n rute~-as opposed to arrest ra Lcs--a nd t.ht· probai>i liLy of arrest. This information gave the study a considerable edge over much prior research because it provided a standard for assessing charges that minorities are overarrested. [t also enabled us to examilw questions of discrimination in corrl'ct.iol1s and I(·ngt.h of sl'nl.('n("(· served, and or racial differences in crime motivution, weapon lise, und in-prison behavior.
III. MAJOR FIND IN GS
As Table 8.1 indicated, we found some racial differences in the criminal justice system's handlin,f! of offenders, hut f('w statistically significant racial differences in criminal behavior. However, strong trends in some of the data raise important issues for policy and future research.
CASE PROCESSING: ARREST THROUGH SENTENCING
Each year, more than 1.5 million adults in the United States enter the felony disposition process. This process. beginning with an arrest and ending with release or sentencing, i::; the heart of the eriminal justice system. Although a great many people enter the process, very few remain at the end: About 30 percent are dismissed before the preliminary hearing; less than half of those who go to court are convicted; and less thun [) percent of those convicted are sentt~nc('d t.o prison (Greenwood, 1982l.
Analysis of the OBTS Data
As for racial differences in the disposition process, the OBTS data revealed an interesting pattern in California. As Table 8.2 shows, at the front end of the process, the system seems to treat white offenders more severely and minority offenders more "leniently"; at the back end, t1- e reverse is true.
White suspects are somewhat more likely than minority suspects to be arrested on warrant, and considerably less likely to be released without charges. Whites are also more likely than blacks or Hispanics to have felony charges filed. However, a greater percentage of whites
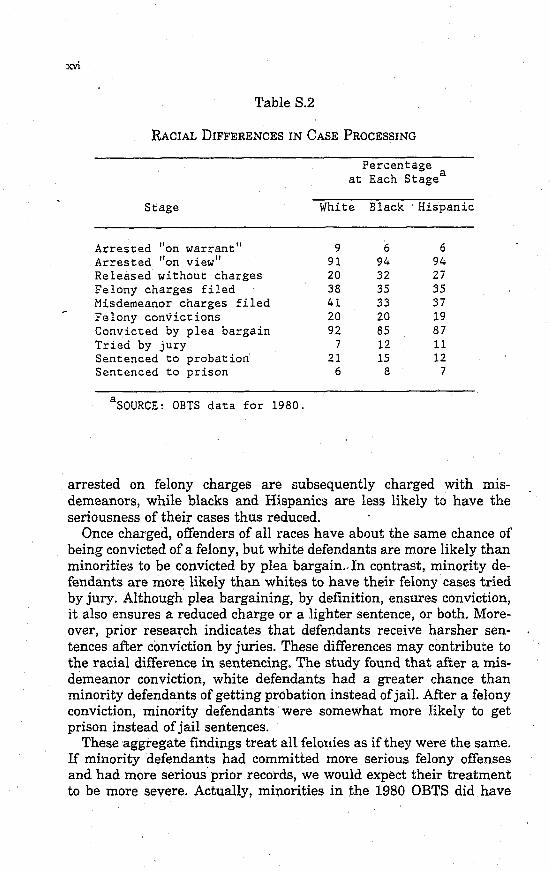
Table 8.2
RACIAL DIFFERENCES IN CASE PROCESSING
Stage
Arresced "on warrant" Arresced "on view" Released without charges Felony charges filed Misdemeanor charges filed Felony convictions Convicted by plea bargain Tried by jury Sentenced to probation Sentenced to prison
aSOURCE: OBTS data for 1980.
Percentage at Each Stagea
White Black Hispanic
9 6 6 91 94 94 20 32 27 38 35 35 41 33 37 20 20 19 92 85 87
7 12 11 21 15 12
6 8 7
arrested on felony charges are subsequently charged with misdemeanors, while blacks and Hispanics are less likely to have the seriousness of their cases thus reduced.
Once charged, offenders of all races have about the same chance of being convicted of a felony, but white defendants are more likely than minorities to be convicted by plea bargain .. In contrast, minority defendants are more likely than whites to have their felony cases tried by jury. Although plea bargaining, by definition, ensures conviction, it also ensures a reduced charge or a lig'hter sentence, or both. Moreover, prior research indicates that defendants receive harsher sentences after conviction by juries. These differences may contribute to the racial difference in sentencing. The study found that after a misdemeanor conviction, white defendants had a greater chance than minority defendants of getting probation instead of jail. After a felony conviction, minority defendants were somewhat more likely to get prison instead of jail sentences.
These aggregate findings treat all felonies as if they were the same. If minority defendants had committed more serious felony offenses and had more serious prior records, we would expect their treatment to be more severe. Actually, minorities in the 1980 OBTS did have
"""VII
rllO!"(' s('riOUH prior rC'('ordH; a gTl'al.l'r proport.101l of' Ilwlll had 1>1'1'1l
charged with violenL crime; and a greaLer number were on probaLion or parole. However, by controlling for these factors using multiple regression techniques, we determined that the racial differences in pm;l.-arrest and sentencing treatment still held. 1 Whitt, arn'sl./'es were mol'l' likC'ly t.hnn minorit.i(>R 1.0 h(' officially chargl,d fidlowing nrrf'sl .. HI:ll'k :lI"I"I'SI.I'I'S wI'n' 111\11'1.' likt'l.v to havl' 1.111'11" \':I~\'S ·lIlsl\lIss\·1I hy either police or prosecutor. After charges were filed. the conviction rates were similar across the races, but 4 percent more black defendants than whites or Hispanics were sentenced to prison.
Analysis of Court-Imposed Sentence Using RIS Data
Although the scope of our study and our data did not permit us to analyze casE' processing in all three of the RIS states. it did allow us to compare data on length of court-imposed sentences. And we preferred to use data that would yield findings on possible racial disparities in three states rather than only one. Regression analyses for each state revealed that minorities do receive longer sentences. Controlling for defendant's age, conviction crime, and prior record, we found that minority status alone accounted for 1 to 7 additional months in courtimposed sentences-relative to sentences imposed on white defendants,
CORRECTIONS AND LENGTH OF SENTENCE SERVED
From arrest to sentencing, the system duly records most major decisions 'involving offenders. Consequently, it is rather easy to see racial differences in handling. Howe-ver, once a. person is sentenced to prison, he is potentially subject to a range of decisions that are not systematically recorded. Prison guards and staff make decisions that strongly influence the quality of an offender's time in prison, and parole boards and other corrections officials decide how long that time lasts. The possibility of discrimination enters into all these decisions, but length of time served is the only one certain to be recorded. In
I Previous research using the OBTS file has :;hown significant differences in the processing of defendants from different counties and arrested for different crimes. Consequently, for the regression analysis, we wanted 8- sample from the same county and· charged with the same crime. We were able to obtain a large homogeneous sample (n==6652) by selecting defendants who were charged with robbery in Los Angeles County in 1980.
xvW
other words l corrections is a closed world in which discrimination could flourish.
That charge has frequently been brought against the system I and the steady increase of prison racial problems makes it imperative to examine the treatment that different races receive in prison and at parole. We examined prison treatment and length of sentence served using the RIS and the official records of our sample, where available. Our analysis revealed some racial differences for participation in work and treatment programs, but they were largely determined by the prisoners, not by guards or staff.
To create a larger framework for assessing possible discrimination, the study established criteria for identifying inmates who needed education, vocational training, and alcohol and drug treatment programs. We then compared the percentage who had need with with the percentage that participated for each racial group.
Although there were no significant racial differences in the overall rate of program participation, there were some differences in participation, relative to need. In all three states, .participation matched need most closely for education. In all three states, a greater percentage of minorities than of whites were identified as having high need for education. However, in Texas, blacks received significantly less education treatment. Moreover in two of the study states, ,blacks had a significantly higher need for vocational training than whites or Hispanics, but did not have significantly higher participation rates. Compared with the other racial group~, blacks who needed alcohol treatment had a significantly lower participation rate.
Nevertheless, the reasons respondents gave for not participating suggested that minorities were discriminating against the programs, not vice versa. Prisoners most often said they were "too busy" or "didn't need" to participate; few said that they did not participate because staff discouraged them. The findings for work assignments were similar.
We found, however, that although minorities received roughly equal treatment in prison, race consistently made a difference when it carne time for release. In Texas, blacks and Hispanics consistently served longer' time than whites-and the disparity was appreciably larger than the disparity in court-imposed sentences. In California, blacks served slightly le-.lger sentences, but the disparity largely reflected the original sentencing differences. In Michigan, the parole process evidently worked in favor of blacks. Although their courtimposed sentences were considerably longer than those of whites, they did not actually serve longer (see Table 8.3).
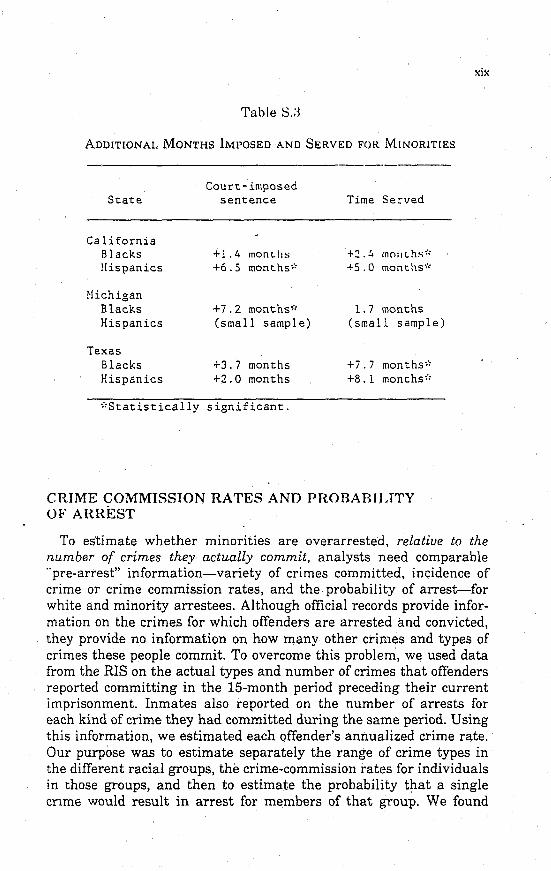
Table S.:l
ADDITIONAL MONTHS IMPOSED AND SERVED FOR MlNORlTlES
St:at:e
Ca 1ifornia Blacks Hispanics
Nichigan Blacks Hispanics
Texas Blacks Hispanics
Court:-imposed sent:ence
+1.4 monLlis +6.5 months":
+7.2 months": (small sampl e)
+3.7 months +2.0 months
*Stat:istically significant.
Time Served
+::!.4 mOil Lhs": +5.0 mont:hs'::
1.7 mont:hs (small sample)
+i . 7 months": +8.1 mont:hs":
CRIME COMMISSION RATES AND PROBABIUTY OF ARREST
xix
To estimate whether minorities are overarrested, relative to the number of crimes they actually commit, analysts need comparable "pre-arrest" information-variety of crimes committed, incidence of crime or crime commission rates, and the probability of arrest-for white and minority arrestees. Although official records provide information on the crimes for which offenders are arrested and convicted, they provide no information on how many other crimes and types of crimes these people commit. To overcome this problem, we used data from the RIS on the actual types and number of crimes that offenders reported committing in the I5-month period preceding their current imprisonment. Inmates also reported on the number of arrests for each kind of crime they had committed during the same period. Using this information, we estimated each offender's annualized crime rate. Our purpose was to estimate separately the range of crime types in the different racial groups, the crime-commission rates for individuals in those groups, and then to estimate the probability that a single crime would result in arrest for members of that group. We found
xx
strong evidence that in proportion to the kind and amount of crime they commit, minorities are not being overarrested.2
There are racial differences in the range of crime types committed:
• More Hispanics reported committing personal crimes-both personal robberies and aggravated assault.
• More whites and Hispanics reported involvement in both drug dealing and burglary.
• Signific~ntly more whites committed forg'ery and credit card and auto thefts.
We found few consistent, statistically significant, differences in crime commission rates among the racial groups. However, there were differences in rates for two particular crimes.
• Blacks reported committing fewer burglaries than whites or Hispanics.
• Hispanics reported fewer frauds and swindles than whites or blacks.
• Black and white offenders reported almost identical rates of robberies, grand larcenies, and auto thefts.
• Black and white off~nders were involved in more drug deals than Hispanics, but the differences were not statistically significant.
That last finding illustrates the difference between range of criminality and incidence of crime. The findings on range indicate that more Hispanics than blacks reported being involved in at least one drug deal. However, the annualized crime rates, which represent incidence, indicate that once involved in drug dealing, blacks committed more of it than Hispanics did. .
Even though minorities are not overarrested relative to the number of crimes they commit, it is still possible that they have a higher probability than whites of being arrested for those crimes. Critics of the system have argued that this explains why blacks are "overrepresented" in the arrest and prison populations. We found, however, that the probability of being arrested for a crime is extremely low regardless of race. For example, only 6 percent of the burglaries, 21 percent of the business robberies, 5 percent of the forgeries, and less than 1 percent of the drug sales reported by these offenders resulted in ar-
2The IDS has certain limitations as a means of calculating crime rates and of detecting racial differences in these rates. All the respondents were in prison and the sample was chosen to represent each state's male prison population. Therefore, it is not appropriate to view these crime rates as applicable to offenders in the community. They refer only to a cohort of incoming prisoners in the states chosen for. this study. Selection effects and other factors cause these rates to be substantially higher than those for "typical" offenders (Rolph, Chaiken, and Houchens, 1981).
xxi
rC!-it. Thil> finding held (l/' all racial groupl>. W(' ()ulld IlO sl.al.il>l.ically sibrniiicant racial difrerence~ in arrC!-iL probubi I ity f()t· the crime~ we studied with the exception of personal robbery. For personal robbery, blacks and Hispanics did report suffering more arrests relative to the number of crimes they committed.
MOTIVATION, WEAPON USE, AND PIUSON BEHAVIOR
Motivation, weapon use, and prison behavior seem likely to influence the impression a prisoner makes on probation officers, judges, and parole boards. Using RIS data, we examined these characteristics for racial differences that might help explain the differences we observed in sentencing and time served. The statistically significant differences were few and not very helpful in explaining those decisions.
All three racial groups rated economic distress as the primary motive for committing crime, with "high times" second and "temper" third. However, there was only one statistically significant difference in motivation: Whites rated "high times" much higher than blacks and Hispanics did. Nev~rtheless, there were some other, suggestive, differences. Blacks rated economic distress considerably higher than high times, while whites rated it only slightly higher. This suggests that socioeconomic conditions among blacks may be more consistently related to crime than they are among whites. That comes as no particular surprise; but if probation officers, judges, and parole boards see unemployment as an indicator of recidivism-rather Lhan as a miLigating circumstance in crime-blacks or any unemployed offenders are likely to receive harsher sentences and serve longer.
In weapons use, the data revealed a few clear racial differences, but if those differences influence sentencing or parole decisions, they do so inconsistently. Hispanics are more likely than whites to be sent to prison and to stay there longer, and Hispanics show a statistically significant preference for using knives in all crimes. Moreover, they indicated a greater tendency to seriously injure their victims. In contrast, the proportion of blacks in prison for burglary is considerably higher than the proportion of blacks arrested for that crime (see Fig. S.l). Yet, in our sample, blacks were the least likely to be armed during burglaries. Indeed, they were less likely than whites to use guns and less likely than Hispanics to use knives. If these differences indicate that blacks are less violent and, perhaps, less "professional" than the other groups, probation officers and judges apparently do not
xxii
recognize it. Our findings on prison violence raise similarly conflicting suggestions.
The percentage of inmates with behavioral infractions differs markedly across states-significantly for five of the seven infraction types we studied. We therefore examined each state separately. Racial differences were pronounced for prison behavior. However, in all three states, age was most strongly, and negatively, correlated with higher infractions. Younger prisoners in all three states got into the most trouble. After age came race', but not consistently for all states. In California, white inmates had the highest infraction rate; in Texas, blacks did. The high-rate infractors had the following profiles:
.. California: a young white inmate who has had limited exposure to treatment programs, and who currently has no prison work assignment.
• Michigan: A young inmate serving for nonviolent crime. • Texas: A young black inmate with few serious convictions,
who has had limited exposure to treatment programs and currently has no prison work assignment.
Racial differences in prison behavior had no apparent relation to length of sentence served. In California, whites have significantly higher infraction rates than blacks. In Texas, the reverse is true. Yet, in both states, blacks serve longer sentences. (In Michigan, where there were no statistically significant racial differences in prison behavior, race also had no bearing on length of time served.)
Having looked at the criminal justice system's treatment of offenders and at offenders' behavior, we have still been unable to account for racial differences in post-arrest release rates, in sentencing, and in some portion of time served. Section IV presents some conclusions drawn from our findings and from other research that may explain these differences.
IV. CONCLUSIONS OF THE STUDY
We again advise the reader that, whenever the data were sufficient to do so, our analyses of system decisions and criminal behavior controlled for the most obvious variables that could reasonably account for apparent racial differences. In these comparisons, then, our offenders are rather "interchangeable" except for race. We also want to stress again that both our findings and our conclusions reflect data from only three states. Further, our self-report data come from prison-
ers, and conclusions drawn from those data are not applicable to the criminal population at large.
EXPLAINING DISPARITIES IN CASE PROCESSING AND TIME SERVED
At most major decision points, the criminal justice system does not discriminate against minorities. However, race does affect post-arrest release, length and type of sentence imposed, and length of sentence served.
Our analysis of the RIS data found that minorities are not overrepresented in the arrest population, relative to the number of crimes they actually commit, nor are they more likely than whites to be arrested for those crimes. Nevertheless, the OBTS analysis raised a question that the study could not answer: If blacks and Hispanics are not being overarrested, why are police and prosecutors so much more likely to let them go without filing charges? One possibility is that the police more often arrest minorities on "probable-cause" evidence that subsequently fails to meet the filing standard of "evidence beyond a reasonable doubt."
Prior research may shed some light on this phenomenon. Earlier studies have shown that arrests depend heavily on witnesses' or victims' identifying or carefully describing the suspect (Greenwood, Petersilia, Chaiken, 1978). Prosecutors may have a more difficult time making cases against minorities "beyond a reasonable doubt" because of problems with victim and witness identifications. Frequently, witnesses or victims who were supportive at the arrest stage become less cooperative as the' case proceeds:
• White witnesses and victims appear to have a harder time making positive identifications of minority suspects than of white suspects.
• Crimes against minority victims are most often committed by minority suspects, often acquaintances. After the arrest, victims frequently refuse to prosecute, withdraw the identification, or refuse to testify.
• Witnesses also become uncooperative if they have been intimidated or feel threatened by the defendant or by aspects of the criminal justice system.
If) A major factor distinguishing cooperative from uncooperative witnesses is simple confusion about where they are supposed to appear or about what they are supposed to do when they get there.
xxiv
In addition to "evidentiary" problems, the study found another racial difference in case processing that may help explain a small proportion of the high release rates for minorities. A slightly higher percentage of white suspects than blacks ~'ere arrested with a warrant in the study period. Because the criteria for issuing warrants are essentially the same as the criteria for filing criminal charges, cases involving warrants would be less likely to develop evidentiary problems after arrest. However, there is only a 3 percentage point difference between whites and minorities for warrant arrests.
Nevertheless, this difference raises a provocative question: Why are the police apparently more hesitant to arrest white than minority suspects without a warrant? From the release rates, it appears that the police and pros~cutors have a harder time making a "filable" ease against minorities. Yet, by getting warrants more often to arrest whites, the police implicitly indicate that the reverse is true. Or, they may assume that minority suspects are less likely than white suspects to make false arrest charges or other kinds of trouble if a case is not filed.
Whatever their reasons, the racial differences in warrant arrests and release rates suggest that the police operate on different assumptions about minorities than about whites when they make arrests. Other study findings tend to reinforce the suggestion that the system regards minorities differently. Controlling for the factors most likely to influence sentencing and parole decisions, the analysis still found that blacks and Hispanics are less likely to be given probation, more likely to receive prison sentences, more likely to receive longer sen-· tences, and more likely to serve longer time.
As Fig. S.l showed, for very serious crimes, blacks are represented about equally in the arrest and prison populations. In other words, the prevalence of these crimes among blacks primarily dictates their numbers in the prison population. However, as we move to property crimes, the disparity between blacks' proportions of the arrest and prison populations widens considerably. This disparity suggests that probation officers, judges, and parole boards are exercising discretion in sentencing and/or release decisions in ways that result in de facto discrimination against blacks. The same is true for Hispanics, who serve even longer time than blacks.
Possibly, the racial differences in type and length of sentence imposed reflect racial differences in plea bargaining and jury trials. Fully 92 percent of white defendants were convicted by plea bargaining, compared with 85 percent for blacks and 87 percent for Hispanics. Those numbers imply the percentage that engaged in plea bargaining -since, by nature, plea bargaining virtually ensures conviction. However, it also virtually guarantees a reduced charge and/or lighter sen-
xxv
tencing. Defendants who go to trial generally receive harsher sentences, and our study found that only 7 percent of whites prosecuted in Superior Court were tried by jury, compared with 12 percent for' blacks and 11 percent for Hispanics.
However, even if these mechanisms did account for the apparent racial differences in sentencing, the implication of bias simply shifts to another node in the system. Why should minorities plea bargain less and go to jury trial more than whites? If the differences represent defendants' attitudes and decisions, then the system is not actively rpsponsible for this racial difference. If'these difTerences reflect decisions by prosecutors or decisions by default, then the isspe of bias returns. And it may reflect the kind of differences that ~re implied by the prefiling release rates for minorities.
The suggestion that the system regards whites and minorities differently may enter into sentencing in another way. Judges may hesitate to send white defendants to prison for two reasons. First, research indicates that in prisons where whites are the minority, they are often victimized by the dominant racial group, whether black or Hispanic. (In most states, blacks now outnumber whites in the prison population.) Second, judges may regard whites as better candidates for rehabili ta tion.
Research on sentence patterns supports the implication that the system "values" whites more than it does minorities. For example, Zimring, Eigen, and O'Malley (1976) found that blacks who kill whites receive life imprisonment· or the death sentence more than twice as often as when they kill blacks. Other research has tended to bear out this relationship for other crimes as well: Defendants get harsher sentences if the victim is white than if he is black.
INFORMAT~ON USED IN SENTENCING AND PAROLE
Putting aside the ambiguity of findings about post-arrest release, the study found strong racial differences only in length and type of sentence imposed and length of time served. If there is discrimination in the system, it is inconsistent. Minorities are no more likely than whites to be arrested or convicted of crimes nor to be treated differently by corrections. Yet, they are given longer, harsher sentences at conviction, and wind up serving longer terms than whites in two of our study states. It may be possible to explain these inconsistencies by considering who makes decisions at key points in the system and what kinds of information they use to make those decisions.
xxvi
As the accused moves through the system, more information about him is attached to his folder and that information is weighted differentially. Police and prosecutors are primarily concerned with 'Just deserts." Their legal mission is to ensure that criminals are convicted. They concentrate on the information they need to make arrest and conviction stick-primarily information about the crime and about the offender's prior record-according to strict legal rules. Judges also consider the nature of the crime and prior record in weighing just deserts, but they are further concerned with the defendant's potential for rehabilitation or recidivism. In other words, will returning him to society through probation or a lighter sentenee endanger society? In deciding on probation, jail, or prison for an offender, they consider his conviction crime, prior record, and his personal and socioeconomic characteristics.
To provide the latter material, probation officers in most counties prepare a presentence investigation report (PSR), which contains a sentence recommendation. Probation officers are more concerned with analyzing and understanding the person and his situation, and they tend to deemphasize the legal technicalities necessary to assess guilt and convict ability. The PSR describes the subject's family background, marital status, education and employment history, past encounters with the law, gang affiliation, drug and alcohol use, etc. In most states, it is the key document in sentencing and parole decisions. Its recommendations are generally followed by the sentencing judge, and its characterization of the defendant becomes the core of the parole board's case-summary file.
The influence of the PSR may help explain the racial differences in sentencing and time served: Minorities often do not show up well in PSR indicators of recidivism, such as family instability and unemployment. As a result, probation officers, judges, and parole boards are often impelled to identify minorities as higher risks . . These conjectures are supported by the comparison between length
of sentence imposed and time served. In California, determinate sentencing practices make length of time served depend primarily on length of sentence imposed. Thus, racial differences in time served there, especially for Hispanics, reflect racial disparities in sentencing. Minority defendants also receive longer sentences than whites in Texas, and parole decisions there lengthen those sentences even more, relative to time served by whites. In Michigan, we found a reverse effect. Blacks received sentences 7.2 months longer than white defendants, but they served roughly equal time.
This contrast can perhaps be explained by the parole practices in Texas and Michigan. Texas has a very individualized, highly discretionary, parole process that incorporates the full range of an inmate's
x.xvii
criminal history and personal and socioeconomic characteristics. Since 1976, Michigan parole decisions have been based almost exclusively on legal indicators of personal culpability, e.g., juvenile record, violence of conviction crime, and prison behavior. Evidently, this practice not only overcomes racial disparities in time served, but also even overcomes racial disparities in sentencing. Nevertheless, overcoming racial disparities in sentencing is not the primary, nor perhaps the proper, concern of parole boards. Their major responsibility is to decide whether an inmate can safely be returned to society. By putting aside the socioeconomic and other extra-legal indicators of recidivism, they may be setting potential recidivists loose.
ASSESSING THE INDICATORS OF RECIDIVISM
If the indicators of recidi vism are val id, the cri m i na I justice system is not discriminating against minorities in its sentencing and parole decisions; it is simply reflecting the larger racial problems of society. However, our research suggests that the indicators may be less objective (and certainly less "race-neutral") than past research and practice have indicated.
The overrepresentation of minorities in aggregate arrest statistics has tended to obscure the fact that the criminal justice system and criminal justice research are, nevertheless, dealing' with a criminal population that is half white and half minority. Unless minorities in that population have had higher recidivism rates than whites, there is no reason why minorities should consistently be seen as presenting a higher risk of recidivism. There is clearly a much higher prevalence of cnme within the minority portion of the national population-that prevalence largely accounts for their equal representation with whites in the criminal population. But there is no evidence that they have a higher recidivism rate.
The RIS data indicate that, once involved in crime, whites and minorities in the sample had virtually the same annual crime commission rates. This accords with Blumstein and Graddy's (1981) finding that the recidivism rate for index offenses is approximately 0.85 For hoth whites and nonwhites. Thus, the data suggest that large racial differences in aggregate arrest rates must be attributed primarily to differences in ever becoming involved ill crime al all and not to different patterns among those who do participate.
Under these circumstances, any empirically derived indicators of recidivism should target a roughly equal number of whites and minorities. The reason this does not happen may be the relative sizes
and diversity of the base populations. The black portion of the criminal population draws from a population base that is much smaller and more homogeneous, socioeconomically and culturally. That is, bla~k criminals are more likely than their white counterparts to have common socioeconomic and cultural characteristics. The white half of the criminal population comes from a vastly larger, more heterogeneous base. Individuals in it are motivated variously, and come from many different cultural, ethnic, and economic backgrounds. Consequently, the characteristics associated with "black criminality" are more consistent, more visible, and more "countable" than those associated with white criminality. Moreover, because prevalence of crime is so much higher than incidence of crime (or recidivism) among minorities, characteristics associated with prevalence of crime among blacks (e.g., unemployment, family instability) may overwhelm indicators of prevalence for the entire criminal population. They may also mask indicators of recidivism common to both blacks and whites.
The findings on criminal motivation and economic need lend support to this hypothesis. Blacks rated economic distress much higher than "high times" and very much higher than "temper" as their motive for committing crime. They also rated it more highly than either whites or Hispanics did. Moreover, the black inmates were consistently identified as economically distressed by the study's criteria for economic need. These findings imply that socioeconomic characteristics are more consistent and more consistently related to crime among blacks than they are among whites. Cortsidering that blacks make up approximately half of the criminal population, their characteristics may have the same effect on indicators of prevalence and recidivism that the extremely high crime rates of a few individuals have on average crime rates.
This is a real vicious circle: As long as the "black experience" conduces to crime, blacks will be identified as potential recidivists, will serve prison terms instead of jail terms, will serve longer time, and will thus be identified as more serious criminals.
V. IMPLICATIONS FOR FUTURE RESEARCH AND POLICY
These findings and conclusions r,aise some compelling issues for criminal justice research and policy. The first priority for both will be to examine the indicators used in sentencing and parole decisions.
xxi.x
QUBSTIONS FOR FUTURE RESBAltCH
Assessing the Indicators of Recidivism
The criminal justice system is moving toward greater use of prediction tables that measure an offender's risk of recidivism. These tables are based on the actuarially determined risk associated with factors such as prior record, employment, and education. This "categoric risk" technique does not assume that the facts of each case are unique. Rather, it assumes that the risk of recidivism is distributed fairly uni;onn~y among groups of individuals who share certain characteristics.
According to some experts, adopting this more objective technique reduces racial disparities because it-severely limits discretion and because the indicators are racially neutral. However, as we argued in Sec. IV, these indicators may appear racially neutral, but in practice they may overlap with racial status. Using factors that correlate highly with race will have the same effect as using race itself as an indicator.
We need to reexamine the statistical methods and the evidence used to develop these risk prediction schemes. The minority half of the criminal population probably has more characteristics in common, especially socioeconomic characteristics, than does the white half. Consequently, these characteristics may statistically overwhelm others that might indicate the risk of recidivism more precisely for both whites and blacks. Analysts will need a methodology that permits them to control for homogeneity in the minority (largely black) half of the criminal popUlation .
. If different recidivism indicators can be isolated using that methodology, researchers will then have to determine whether the resulting sentencing standards still lead to harsher treatment for minorities. Assuming that we want a system that can discriminate between high and low probability of recidivism, we also need some standard of judicial review that balances the state's interest in accurate identification of recidivists against the imperative that group classifications should not be implicit race classifications.
For each indicator that has racial links, we need to ask: How much pn·dicLive efliciency would t.he st.at.p IOHP hy ornil.t.ing t.hiH indicat.or from its sentencing standards? Thus framed, the question is not whether prediction tables could (or Hhould) he lIHed, hut. Lo what. extent the state should sacrifice a degree of predictive efficiency to racial equity. Obviously, characteristics showing personal culpability (for example, prior convictions) should always be seen as acceptable factors for assessing risk. Even if minorities have a disproportionate
=
number of them, these characteristics indicate individual, not group, status.
Post-Arrest Release Rates and Evidentiary Problems
Racial differences in post-arrest release rates should be explored. The RIS data show that the police are not simply overarresting minorities, relative to the crimes they commit, and then having to let them go. However, our findings do not discount the charge that the police arrest minorities on weaker evidence. Nevertheless, previous research suggests that the bulk of cases dismissed before filing involved uncooperative victims, and other research has suggested that minority cases more often have problems with victims and witnesses. Future research could'inquire why so many victims become uncooperative, whether the reasons differ in minority cases, and how often either the suspect or the criminal justice system itself intimidates victims or witnesses.
Racial Differences in Plea Bargaining and Sentence Severity
This study did not control for plea bargaining in analyzing racial differences in sentence severity. If future research establishes that plea bargaining contributes to those differences, the next important research task would be to discover why minority defendants are less likely than whites to plea bargain and more likely to have jury trials. Do prosecutors consistently offer less attractive plea bargains to minority defendants, or do minority defendants simply insist more on jury trials?
Effect of Prisons' Racial Mix on Sentencing
If judges are increasingly reluctant to send white offenders to prisons where blacks and Hispanics outnumber them, racial differences in sentence severity will widen, and the disproportion of minorities in prison will grow. This sensitive issue will not be easy to resolve empirically. The first task would be to establish that judges are indeed influenced by reports that white prisoners are often victimized. The second task would be to establish whether these reports are valid; if they are, the criminal justice system will face harder issues than sentencing practices. Among the most serious might be pressure for segregated facilities.
How Prison-Gang Membership Affects Length of Sentence Served
xxxi
We need to understand how gang-related activities affect length of sentence served and participation in prison treatment and work programs. In California, one out of every seven prisoners is currently held in administrative segregation, most of them for gang-related activities, and a greater proportion of the black and Hispanic inmates admit to gang membership. A greater proportion of minorities may be in segregation because of gang affiliation, and inmates in segregation may have restricted access to prison trea.tment and work programs. Since program participation affects release decisions, gang affiliation may contribute significantly to racial differences in time served.
The Prison Environment's Influence on In-Prison Behavior
Some inmates, predicted to be high infractors, exhibited rather exemplary behavior. To what extent can their good behavior be attributed to characteristics of the institution, e.g., specific security measures, inmate-to-staff ratio, recreational facilities, the total size of the institution, housing arrangements, and so forth? .
The Connection Between Prison Violence and Idleness
Prison administrators face both rising violence and shrinking budgets. Research can help them cope by finding out more about the relationship between idleness and prison violence and identifying the kinds of inmates whose participation in programs will bring about the greatest reduction in violence.
POLICY RECOMMENDATIONS
Definitive policy recommendations must await findings from some of these research studies, but we can recommend some interim policy initiatives.
(1) Police and prosecutors need to be more aware of the difficulty of getting adequate evidence with which to convict minority suspects. The high release rates for minorities suggest that minbrity suspects are not as likely as whites to be identified from lineups or elsewhere, and that victims or key witnesses in minority cases often prove uncoopera-
xxxii
tive after the arrest has taken place. Police and prosecutors may need to work harder at securing the trust and cooperation of minority victims and witnesses.
(2) The plea bargaining process needs to be closely monitored for any indications that minorities are offered less attractive plea bargains than those offered to whites. One way to assure greater uniformity is to have a single deputy review all the plea negotiations. Moreover, minorities' unfamiliarity with and distrust of the system may cause them to insist on a trial. If so, they should be informed that sentences resulting from jury trials are generally more severe.
(3) Judges and probation officers must begin to distinguish between information concerning the defendant's personal culpability and information that reflects his social status. The latter information may not be as racially neutral or objective as previous research has indicated. Until the indicators of recidivism have been reanalyzed, we recommend that officials weight the criminal's characteristics more heavily than socioeconomic indicators in sentencing and parole decisions:
(4) To reduce prison violence, prison administrators should allocate work and treatment programs, particularly prison jobs, to younger inmates, who are responsible for most prison violence.
(5) Finally, we recommend another look at rehabilitation. It is perhaps unfashionable to talk about rehabilitation when prison administrators are faced with shrinking budgets, increased population, and more fractious inmates. In this context, most administrators have been forced to assign low priorities to treatment programs. Although rehabilitation programs have not yet lived up to expectations, the implications of this trend are troubling. The RIS data indicated that most inmates do not get the treatment that they need. Two-thirds of the inmates who were chronically unemployed preceding their imprisonment failed to participste in vocational training programs. Twothirds of those with alcohol problems did not receive alcohol treatment. And about 95 percent of those with drug problems did not get drug treatment in Texas and California.1 Most inmates reported that they failed to participate in programs because they "didn't have time" or "didn't need" them. Drug treatment was the exception. About one-third of the inmates who needed drug treatment said they were not in drug programs because no programs were available. This is especially distressing, because over half of those who did participate in a drug program believed it had benefitted them and that it had reduced their likelihood of returning to crime after release.
Like other public institutions, the criminal justice system faces growing economic restrictions. It has had to make hard choices among
lIn Michigan, about balf of the drug-dependent inmates received treatment.

xxxiii
policies, programs, and research priorities. However. we helieve that there could be no more important priority for policy and research than attempting to identify those aspects of the system that permit harsher treatment of minorities.
This study leaves us with guarded optimism concerning the system and the personnel who operate it. We ·did not find widespread, conscious prejudice against certain racial groups. Instead, what racial disparities we found seem to be due to the system's adopting procedures without analyzing their possible effects on different racial groups. Criminal justice research and policy now need to look behind the scenes. They need to focus on the key actors and their decisionmaking: what information t.hey use, how accurate it is, and whether its imposition affects particular racial groups unfairly.
ACKNOWLEDGMENTS
l-'ort!mo~L, my ~incere appreciaLion gOt~S to ,Joyct' l'vLl'rson, a COIllmllnicat.ion~ Analyst. in Rand's Publicat.ions I)l'part.llH'nt.. 11('r 11I'Ipf'ulness in forging the preliminary draft into its linal form cannot be overstated.
Appreciation must also be extended to the hundreds of inmates willing to involve themselves in this study. They participated in numerous pretest sessions and in the final sample. It appears they responded candidly about themselves, their crimes, their treatment needs, and their prison experiences. Without their willingness to share this information, parts of this study could not have been undertaken.
This research required the extensive cooperation of prison officials in California, Michigan, and Texas. My gratitude is extended to Perry Johnson (Michigan), W. J. Estelle, Jr. (Texas), and Jiro Enomoto Iformerly of California). James M. Watson and James Rasmussen, Bureau of Criminal Statistics, were most generous in providing us with California's GBTS data for 1980.
Allen Breed, the former Director of the National Institute of Corrections, Department of Justice, provided the opportunity to pursue this research. Special thanks also go to Larry Soloman and Robert Smith, Assistant Directors, and John Wallace and Phyllis Modley, our grant monitors, for their sustained encouragement.
Many persons reviewed drafts of this report and made insightful suggestions concerning the analysis', presentation, and conclusions. They include: Abe Chavez, Alfred Blumstein, Cy Shain, Lowell Jensen, Maxine Singer, Nathaniel Trives, Rose Matsui Ochi, Lincoln Fortson, Horace McFall, Philip Cook, Stevens Clarke, James Q. Wilson, Daniel Glaser, Charles Wellford, Richard Dehais, James Col1ins, Scott Christianson, Franklin Zimring, Don Gottfredson, and Michael Tonry. Stevens Clarke was especially diligent in his review, and many of his suggestions improved the final product.
Several Rand colleagues aided the research in important ways. Sue Polich organized and operated the information retrieval system that permitted use of data from multiple sources. She also did the programming for the analysis, and gave advice about the appropriateness ()f the statistical packages used. Dr. Allan Abrahamse and Dr. John
. Rolph gave statistical advice in planning the multivariate analysis, and in the crime rate and arrest probability analysis. Dr. Stephen Klein's review was most helpful, and several additional analyses were
xxxv

performed as a result of his suggestions. Barbara Williams, Rand's current Criminal Justice Program Director, assisted in administrative matters whenever needed.
CONTENTS
PREFACE. . . . . . . . . . . . . . . . . . . . . . . . . . . . . . . . . . . . . . . . . . . . . . . iii
EXECUTIVE SUMMARy................................. v
ACKNOWLEDGMENTS .................................. x..xxv
FIGURES ............................................... xxxix
Tl\BLES ................................................ xli
Section 1. INTRODUCTION.................................... 1
II. BACKGROUND AND DATA FOR THE STUDy....... 5 The Offender-Based Transaction Statistics (OBTS) . . . . 7 The Rand Inmate Survey (RIS) ..................... 8
III. RACIAL DIFFERENCES IN CASE PROCESSING: . ARREST THROUGH SENTENCING. . . . . . . . . . . . . . 14
The Felony Disposition Process at Work ............. 14 Prior Research .................................... 17 Adult Felony Prosecution in California .............. 20 Length of Court-Imposed Sentence .................. 30 Conclusions and Implications . . . . . . . . . . . . . . . . . . . . . . . 31
IV. ANALYZING RACIAL DIFFERENCES IN CRIMES COMMITTED AND ARREST RATES............. 34
Findings from the Rand Inmate Survey. . . . . . . . . . . . . . 35 Probability of Arrest. . . . . . . . . . . . . . . . . . . . . . . . . . .. . . . 43 Conclusions. . . . . . . . . . . . . . . . . . . . . . . . . . . . . . . . . . . . . . . 46
V. RACIAL DIFFERENCES IN CORRECTIONS AND TIME SERVED . . . . .. . . . .. . .. .. . .. . .. .. .. . .. .. . . 49
Participation in Prison Programs ................... 50 Racial Differences in Length of Sentence Served . . . . . . 63 Conclusions. . . . . . . . . . . . . . . . . . . . . . . . . . . . . . . . . . . . . . . 68
VI. I{ACIAL DIFFERENCES IN CRIME MOTIVATIONS, WEAPONS USE, AND PRISON INFRACTIONS. . . 73
Crime Motivations ................................ 73 Racial Differences in Weapon Use and Victim Injury. 76 Racial Differences in Prison Violence. . . . . . . . . . . . . . . . 81 Conclusions. . . . . . . . . . . . . . . . . . . . . . . . . . . . . . . . . . . . . . . 87
xxxvii
x.xxviii
VII. CONCLUSIONS AND IMPLICATIONS OF THE STUDy ............................. :........... 89
Major Findings .................................... . Conclusions ....................................... . Implications of the Study for Research and Policy
Appendix A. OBTS REGRESSION ANALYSIS OF PRISONINOT
89 92 99
PRISON ........................................... 105 B. RIS REGRESSION ANALYSIS ON LENGTH OF
COURT-IMPOSED MINIMUM SENTENCE .......... 106 C. RIS REGRESSION ANALYSIS ON LENGTH OF
SENTENCE SERVED .............................. 112 D. RIS REGRESSION ANALYSIS OF PRISON VIOLENCE . 116
REFERENCES ........................................... 119
------------------- ----
FIGURES
S.l. Black Percentage of Arrests and of Prison Population ... xiii 1.1. Racial Distribution in the United States and the Prison
Population. . . . . . . . . . . . . . . . . . . . . . . . . . . . . . . . . . . . . . . . . . 1 1.2. Comparison of Blacks in Arrest and Prison Population .. 3 3.1. Dispositions of Adult Felony Arrests, 1980 System Fallout 21 3.2. Dispositions of Adult Felony Arrests. 1980, by Race/Eth-
nic Group ... '.' . . . . . . . . . . . . . . . . . . . . . . . . . . . . . .. . . . . . . .. 22 4.1. Robbery Commission Rates: The Number of Crimes Com-
mitted per Year of Street Time ....................... 39 5.1. Correspondence Between High Need for Treatment and
Treatment Received ................................. 54 5.2. Participation of High Need Inmates in Education Programs,
by Race............................................. 56 5.3. Participation of High Need Inmates in Vocational Train-
ing Programs, by Race ............................. " 57 5.4. Participation of High Need Inmates in Alcohol Rehabilita-
tion Programs, by Race .............................. 58 5.5. Participation of High Need Inmates in Drug Rehabilita-
tion Programs, by Race .............................. 59
S.l. S.2. S.3. 2.1.
2.2. 2.3. 3.1. 3.2. 3.3. 304.
3.6.
4.1.
4.2. 4.3.
404. 4.5.
5.1.
- ? 0._.
5.3. 504. 5.5. 6.1.
6.2.
6.:3. 6.4. 6.5. 6.6.
TABLES
Summary of Study Findings ......................... . Racial Differences in Case Processing ................ . Additional Months Imposed and Served for Minorities .. . Comparison of Inmate Characteristics Between Statewide Prison Population and Rand Samples ................. . Inmate Survey Response Rates ....................... . Final Sample Size, by State and Race ................ . Percentages of Arrestees Arrested "On View" ......... . Police/Prosecutor Actions ............................ . Reasons for Release, for All Felonies Combined ........ . Final Case Outcomes for All Felonies Combined, Los An-geles County Superior Court, 1980 ................... . Superior Court Sentences by Race, Los i\ngl..'!es County,
'1980 .............................................. . Additional Months Imposed by Court for Minority Defen-dants .. , .... ; ...................................... . Percent of Prisoners Committing Crime, by Crime Type and Race .......................................... . Annualized Crime Commission Rates for Active Offenders Distribution of Annualized Crime Commission Rates for Respondents Who Commit the Crimes ................ . Probability of Arrest by Race ........................ . Probability of Arrest by Race of Offender and Number of Crimes Committed ................................. . Time Served by Conviction Offense, Race, and Prior Record ............................................ . California Sentence-Length Served Model ............. . Texas Sentence-Length Served Model ................. . Michigan Sentence-Length Served Model ............. . Sentences for Minorities Relative to Those for Whites .. . Self-Reported Reasons for Committing Crimes, Three SLates Combined ................................... . Factors Rated as Very Important Crime Motivations, by Race; Three States Combined ........................ . Importance of Motivation Scales, by Race ............. . Type of Weapon Usually Used in Committing Crime ... . Percent Usually Carrying Weapons During Crimes .... . Types and Descriptions of Infractions ................. .
xli
vii xvi xix
10 11 12 23 24 25
27
28
31
37 38
41 45
47
66 68 69' 70 71
7tJ
75 77 79 79 82

xlii
6.7. Percent of Inmates with Infractions, by State and Type of Infraction . . . . . . . . . . . . . . . . . . . . . . . . . . . . . . . . . . . . . . . . . . . 83
6.8. Percent of Inmates Who Have at Least One Infraction, by Type and Race .. :................................... 84
7.1. Summary of Study Findings .......................... 90
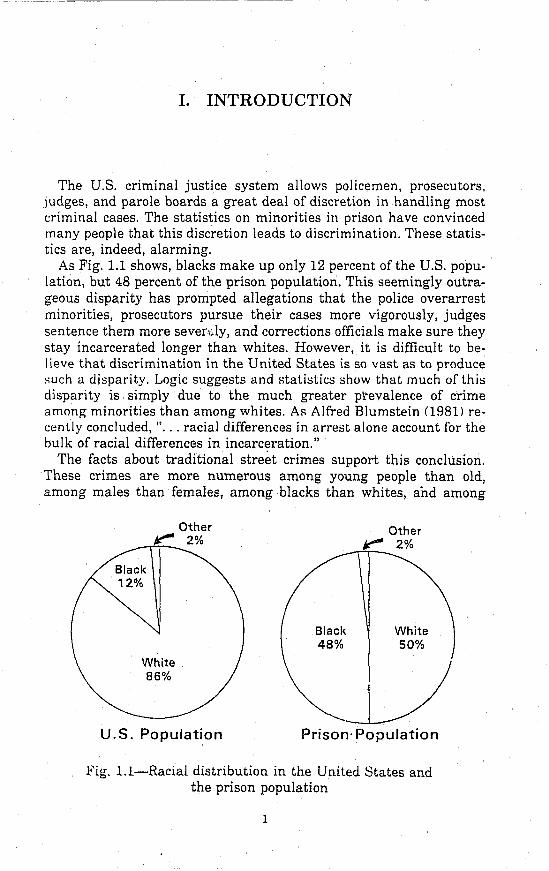
1. INTRODUCTION
The U.S. criminal justice system allows policemen, prosecutors. judges, and parole boards a great deal of discretion in handling most criminal cases. The statistics on minorities in prison have convinced many people that this discretion leads to discrimination. These statistics are, indeed, alarming.
As Fig. 1.1 shows, blacks make up only 12 percent of the U.S. population, but 48 percent of the prison population. This seemingly outrageous disparity has prompted allegations that the police overarrest minorities, prosecutors pursue their cases more vigorously, judges sentence them more sevenJy, and corrections officials make sure they stay incarcerated longer than whites. However, it is difficult to believe that discrimination in the United States is so vast as to produce such a disparity. Logic suggests and Htatistics show that much of this disparity is simply due to the much greater pl"evalence of crime among minorities than among whites. As Alfred Blumstein (1981) recently concluded, If ••• racial differences in arrest alone account for the bulk of racial differences in incarceration."
The facts about traditional street crimes support this conclusion. These crimes are more numerous among young people than old, among males than females, among blacks than whites, and among
White 86%
U.S. Population
Black White 48% 50%
Prison· Population
Fig. l.l-Racial distribution in the United States and the prison population
1
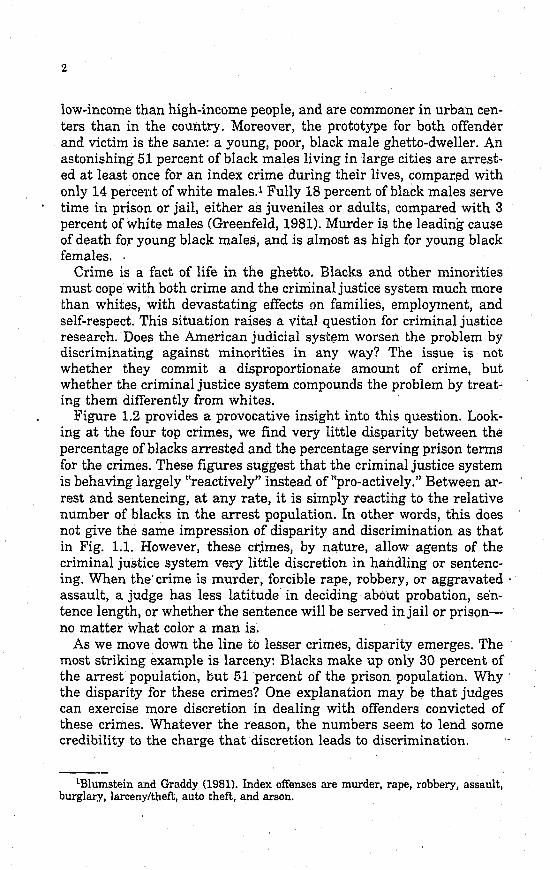
2
low-income than high-income people, and are commoner in urban centers than in the country. Moreover, the prototype for both offender and victim is the same: a young, poor, black male ghetto-dweller. An astonishing 51 percent of black males living in large cities are arrested at least once for an index crime during their lives, compar.~d with only 14 percent of white males. 1 Fully 18 percent of black males serve time in prison or jail, either as juveniles or adults, compared with 3 percent of white males (Greenfeld, 1981). Murder is the leading cause of death for young black males, and is almost as high for young black females ..
Crime is a fact of life in the ghetto. Blacks and other minorities must cope with both crime and the criminal justice system much more than whites, with devastating effects on families, employment, and self-respect. This situation raises a vital question for criminal justice research. Does the American judicial syst~m worsen the problem by discriminating against minorities in any way? The issue is not whether they commit a disproportionate amount of crime, but whether the criminal justice system compounds the problem by treating them differently from whites.
Figure 1.2 provides a provocative insight into this question. Looking at the four top crimes, we find very little disparity between the percentage of blacks arrested and the percentage serving prison terms for the crimes. These figures suggest that the criminal justice system is behaving largely "reactively" instead of "pro-actively." Between arrest and sentencing, at any rate, it is simply reacting to the relative number of blacks in the arrest population. In other words, this does not give the same impression of disparity and discrimination as that in Fig. 1.1. However, these crjmes, by nature, allow agents of the criminal justice system very little discretion in handling or sentencing. When the' crime is murder, forcible rape, robbery, or aggravated· assault, a judge has less latitude in deciding about probation, sentence length, or whether the sentence will be served injail or prisonno matter what color a man is.
As we move down the line to lesser crimes, disparity emerges. The most striking example is larceny; Blacks make up only 30 percent of the arrest population, but 51 percent of the prison population. Why the disparity for these crimes? One explanation may be that judges can exercise more discretion in dealing with offenders convicted of these crimes. Whatever the reason, the numbers seem to lend some credibility to the charge that discretion leads to discrimination.
lBlumstein and Graddy (1981). Index offenses are murder, rape, robbery, assault, burglary, larceny/theft, auto theft, and arson.
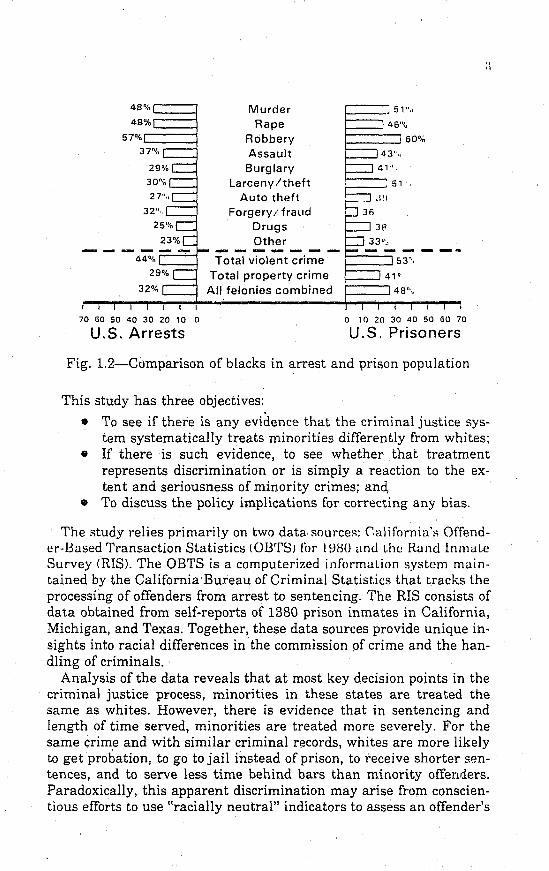
48%'-----'
48U%J'~~~ 57%"""; __ -l
37".
29%
Murder Rape
Robbery Assault Burglary
Larceny/theft Auto theft
Forgerylfraud Drugs Other
=--=-=--r-- - - - - - - --29%
I
70 60 50 40 30 20 10 0
U.S. Arrests
Total violent crime Total property crime All felonies combined
1,51""
46\1/0
60%
43 ....
41",
, 51' 6.1'" ' b36
38
33"~, - _ ... ---41 0
\-----,48"',
o 10 20 30 40 50 60 70
U. S. Prisoners
Fig. 1.2-Comparison of blacks in arrest and prison population
This study has three objectives:
• To see if there is any evidence that the criminal justice system systematically treats minorities differently from whites;
• If there is such evidence, to see whether that treatment represents discrimination or is simply a reaction to the extent and seriousness of minority crimes; and,
• To discuss the policy implications for correcting any bias.
The study relies primarily on two data sources; California's Offender-Based Transaction Statistics (OB'l'S) filr l!JHO and l.he Rand Inmate Survey (RIS)' The OBTS is a computerized information sygtcm maintained by the California Bureau of Criminal Statist.ics that tracks the processing of offenders from arrest to sentencing. The RIS consists of data obtained from self-reports of 1380 prison inmates in California, Michigan, and Texas. Together, these data sources provide unique insights into racial differences in the commission of crime and the handling of criminals.
Analysis of the data reveals that at most key decision points in the criminal justice process, minorities in these states are treated the same as whites. However, there is evidence that in sentencing and length of time served, minorities are treated more severely. For the same crime and with similar criminal r~cords, whites are more likely to get probation, to go to jail instead of prison, to receive shorter s~ntences, and to serve less time behind bars than minority offenders. Paradoxically, this apparent discrimination may arise from conscientious efforts to use "racially neutral" indicators to assess an offender's
4
susceptibility to treatment and the risk of returning him to society. Evidently, minority offenders are more likely than whites to be identified by these indicators as potential "recidivists."
If these indicators identify minorities as higher risks because they do have higher recidivism rates, there is little the criminal justice system can do about their overrepresentation in prison. Worse, as more states move to more objective criteria for sentencing and parole decisions, the percentage of minorities in prison could actually grow. However, analysis of the data and evidence from some prior research suggests that these indicators may not be so racially neutral after all. A fundamental recommendation of this study is that these indicators, and the analyses that led to them, must be carefully reconsidered.
Prior research on discrimination in the criminal justice system has produced controversial and contradictory findings. Section II discusses the problems with this research and briefly describes our data and methodology. Section III describes the workings of the criminal justice system and identifies racial differences in case processing revealed in the OBTS data. Section IV analyzes data from the RIS for racial differences in crime commission rates and the probability of being arrested. Section V I00ks at racial differences following the imposition of a court sentence, specifically participation in prison treatment and work programs and length of sentence actually served. Section VI explores racial differences in offender characteristics, specifically crime motivation, weapon use, and prison violence. Section VII summarizes our findings and conclusions, and draws implications for future research and policy. Appendixes A through D present the regression results.
II. BACKGROUND AND DATA FOR THE STUDY
Ours is not the first study of racial differences in crime and criminal ju::;tice processing. The ::;ubjed ha::; occupied rl!se~lrchers ::;ince Lhe l'urly 1900s; but despite the vast amount of energy that has been spent on the subject, few empirically based generalizations can be drawn. The research to date contains numerous contradictions and inconsistencies. Some studies purport to have found evidence of harsher treatment of minorities;l others have found reverse discrimination, with minorities treated more leniently than whites in particular cases and particular phases of judicial processing.2
What explains such inconsistent research findings? Perhaps foremost is poor methodology. Most of the research uses weak statistical tests and fails to control for confounding variables. For instance, research may show that blacks, once convicted, are more often sentenced to prison than nonblacks; some authors then conclude that the system is racist. Such a conclusion is highly questionable, because the analysis has usually failed to control for other relevant variables. It may be possible, for example, that blacks are sentenced more severely because they commit more serious crimes or because. they are more likely to have prior criminal records. Race may also be spuriously related to sanctions because it is related to other "extralegal" attributes of the defendant, such as socioeconomic status, that are themselves strongly related to sanctions.:1 Improved methodological rigor is essential for strengthening the findings in this research area.
Another problem, more Lmdamental and not as easily rectified as t.he methodological problem, is the inability of researchers to examine ciecisionmaking in the nonreviewable stages of the justice process. Previous research has concentrated almost exclusively on system processing from police arrest through imposition of sentence. Researchers usually generate a data base that begins with a sample of persons arrested. That "arrest cohort" is then tracked through to sentencing, where the handling of minority and nonminority persons is
lPiliavin and Briar (1964); Ferdinand and Luchterhand (1970): Thornberry (1973); Carroll and Mondrick (1976); Gibson (1978), Studies that found no evidence of discrimination include: Terry (1967); Black (1970); Black and Reiss (19701; Green (1970); Hagan f 1974); Clarke and Koch (1976, 1980); and Hindelang 119781.
2Greenwood et al. (1973); Morris and Tonry (1980); Zimring (1976). 3More complete reviews of previous research are contained in the relevant sections
of this report.
5
6
compared. Those familiar with the system know that these events include only part of the justice system.
Even if methodological rigor were applied to studying those events, one would still not have a grasp of the discrimination issue, since a formal,arrest is not the beginning of the defendant's interaction with the system. A number of important (and perhaps discriminatory) decisions have already been made. In fact, some have argued that these pre arrest decisions hold the most potential for discrimination, since they occur in one of the least visible phases of the justice system (Green, 1964). It is well known that the police exercise considerable discretion in enforcing the law. Officers may ignore certain offenses because of manpower limitations, public pressure, or simple preference. Police administrators rarely have formal arrest criteria, but usually rely on the individual officer's judgment. Given this latitude in decisionmaking, there is great potential for discrimination. Unfortunately, decisions reached in these early phases of the justice process go unrecorded, and researchers are unable to determine the extent to which members of racial minority groups are treated more harshly because of their race.
An equally important omission in previous research has been the failure to study the handling of minorities after sentencing. The sentencing decision is certainly not the end of the defendant's interaction with the system. For those sentenced to prison, it is just the beginning of many interactions that result in important decisions. Again, much of this decisionmaking goes unrecorded and is thus unreviewable. For example, a correctional officer frequently witnesses behavior that could qualify as a prison disciplinary infraction. Whether he chooses to record it formally or ignore it is almost totally discretionary. If he chooses to record it, he also has great latitude in meting out punishment. The range of punishments is wide: solitary confinement, loss of work assignment or other privileges, or time added to the sentence. These decisions profoundly affect the conditions under which an "inmate serves his sentence, and even the length of time he will serve.
This research project is designed to correct for both poor methodology and the lack of a system-wide approach. The data we will analyze bear on decisionmaking from crime commission through release from custody.
Our study uses the two sources of data described in the Introduction: California's Offender-Based Transaction Statistics (OBTS) for 1980, and the Rand Inmate Survey (RIS).4 We use the Inmate Survey
4The Rand Inmate Survey was originally funded by the National Institute of Justice to serve the needs of two research projects. The first project examined the characteristics of career criminals, and the second determined whether career criminals posed
7
to examine the pre arrest and postconviction process and the OETS for the process from formal arrest through final disposition. We briefly describe these data bases below.
THE OFFENDER· BASED TRANSACTION STATISTICS (OBTS)
The' OB'rS is a computeriwd inf(Jrmal.ion S,VSt.l'Ol rnainLaine·d by i.lw Bureau of Criminal Statistics tEes). It tracks an offender from the point of entry into the criminal justice system to the point of exit. (The unit of analysis is the case, not the individual. A single individual may be involved in more than one case.) The purpose is to collect statistical information on how the California criminal justice system deals with persons arrested on felony charges. The data reflect dispositions that occurred in a given year as a result of an adult felony arrest made in that year or in previous years.5
Once an offender enters the system, a number of social and legal variables are recorded. Descriptive information includes sex, race. age, prior record, criminal status, and the offense for which he was originally arrested (original charge). Prior record is a measure of previous exposure to the criminal justice system referring not onTy to the number but also to the seriousness of prior commitments. The measure ranges from 0 to 9, with 0 designating lack of previous arre's!.s or convictions and 9 designating three or more prior prison emnmitments. Intermediate categories represent various combinations qf arrests and sentences of increasing seriousness.
Criminal status refers to whether or not an offender was under some type of supervision (and the nature of that supervision) at the time of his arrest. Various possibilities include parole from the California Department of Corrections or the California Youth Authority. probation, and the like.
Once the offender begins to be formally processed by the system, information regarding each transaction is recorded. The system tracks the offender until his case is disposed of in either the lower or Superior Court. Section III describes the information recorded about disposition.
particular problems once incarcerated. The results from the analysis of these two previ. ous projects are contained in Chaiken and Chaiken (1982), Greenwood (1982). Peter· silia and Honig (1980), and Petersilia (1982).
,';This is different from arrest data. Arrest data are based upon t.he year in which the arrest took place. GBTS data are based upon the year of disposition, regardless of when the felony arrest occurred, and may be reported a year or more after the arrest was made.
8
OBTS information is forwarded by law enforcement, prosecutor, and court agencies in all 58 California counties. BCS estimates that it receives reports on no more than 70 percent of adult felony arrests that receive final dispositions during a calendar year. In spite of this underreporting, it is felt that the reports adequately describe the "statewide" processing of these arrestees (California Bureau of Criminal Statistics, 1980). The analysis in this report uses OBTS data for 1980.
THE RAND INMATE SURVEY (RIS)
Sample Selection
In 1978, Rand administered a questionnaire to selected prison inmates in California, Michigan, and Texas. These states were cho!>en for the Inmate Survey because they have large prison systems, they house 22 percent of all persons serving time in a state prison (Bureau of Justice Statistics, 1982), and they maintain computerized prison records, which facilitated the selection of the sample.
We identified three or four prisons in each state that provided an adequate cross-section of the male prison population. The prisons included all custody levels within each prison system. The prisons from which inmates were sampled include:
California:
Michigan:
Texas:
California Correctional Institution (Tehachapi) Correctional Training Facility (Soledad) Deuel 'Vocational Institution (Tracy) San Quentin Penitentiary (San Rafael)
Ionia Reformatory (Ionia) Michigan Training Unit (Ionia) State Prison of Southern Michigan (Jackson)
Ellis Unit (Huntsville) Coffield Unit (Tennessee Colony) Ferguson Unit (Midway) Wynne Unit (Huntsville)
In each state, our final inmate sample was representative of the statewide intake of male prisoners.s Table 2.1 compares the
GTo approximate an "incoming cohort" in ~ach state, it was not pO!lsible merely to select a random sample of current inmates. Such a sample, where each inmate serving
distribution of four characteristics-race, age. conviction offemie. and prior prison commitments-for the statewide prison population and the Rand samples. There are no statistically significant differences except in two instances: For California, the Rand sample contains a larger proportion of whites; and f(lr Texas, thp Rand sample is somewhat older IX" < .05).
Survey Administration
The RIS questionnaire contained 174 questions, some multiparted. It required one to two hours to complete. There were numeious skip patterns, and the majority of respondents were not required to answer all the questions. The survey elicited information about the inmate's crimes, arrests, crime motivations, drug and alcohol use, prior criminal record, and prison experiences.
The survey was not anonymous. It included only those inmates who signed an agreement indicating their understanding and their willingness to participate. Usually, the questionnaire was administered to groups ranging from only a few inmates to as many as 40 or 50 (20 was typical). Each inmate who completed the questionnaire received $5 as compensation.7
To complement the questionnaires, we compiled official records data from hardcopy corrections files on the participating inmates. We coded data relating to intake recommendations, prior criminal records, current prison infractions, and demographics. The official
aprison term has an equal likelihood of being selected. would overrepresent prisoncr~ sl'r\'inJ.! !onJ.! sentences and underrcprcscnt prisoners with Vt·I'Y short. Sl'nt.l'ncps. I)l)CHlIS('
those with long sentences are more likely to still be in prison. To compensate tilr thiS bias. we gave each current inmate a weight equal ~o the reciprocal of the expected length of his current term as a sample seleclion factor. These lists were sent to each institution so that the survey sessions could be scheduled; the institutions then notified these inmates about the sessions. Separate inmate notification was given by the Rand staff as well. To avoid bias in the sample, we devised a "replacement" procedure. For each inmate selected for the sample, another inmate of similar race, age, and county of commitment was also selected as his "replacement." When the initially selected sample member did not appear at the survey sessions, or chose not to participate, his replacement was sought.
'Because certain inmates within segregated custody were regarded by prison officials as posing security risks if assembled into a group, for the survey, the questionnaire was administered to them individually within their segregated custody. Completed questionnaires were obtained from nearly all selected inmates having this status. Also, some inmates could not read English; this was especially true of Spanish.;peaking inmates in California. The survey instrument was translated into Spanish for those persons,
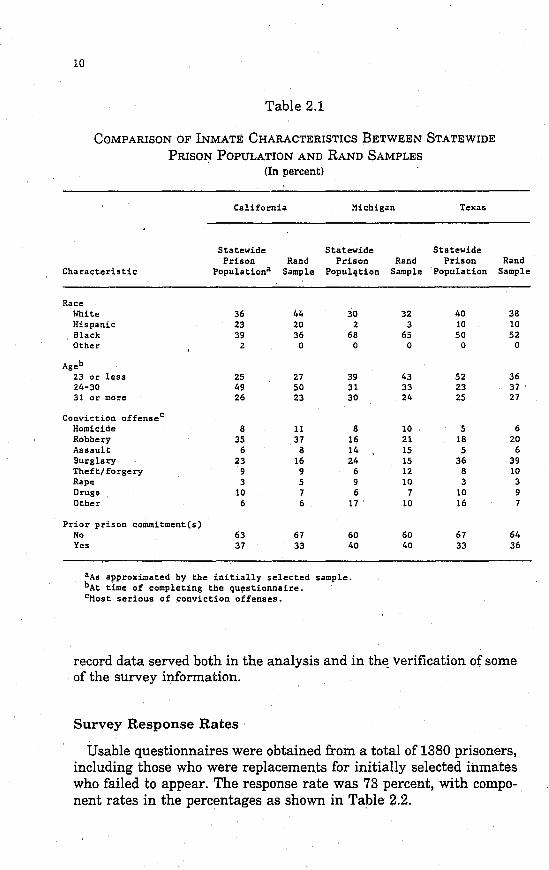
10
Table 2.1
COMPARISON OF INMATE CHARACTERISTICS BETWEEN STATEWIDE
PRISON POPULATION AND RAND SAMPLES (In percent)
California Michigan Texas
Statewide Statewide Statewide Prison Rand Prison Rand Prison Rand
Characteristic Populationa Sample Popul'ltion Sample Population Sample
Race White 36 44 30 32 40 38 Hispanic 23 20 2 3 10 10 Black 39 36 68 65 50 52 Other 2 0 0 0 0 0
Ageb 23 or less 25 27 39 43 52 36 24-30 49 50 31 33 23 37 31 or more 26 23 30 24 25 27
Conviction offensec
Homicide 8 11 8 10 5 6 Robbery 35 37 16 21 18 20 Assault. 6 8 14 15 5 6 Burglary 23 16 24 15 36 39 Theft/forgery 9 9 6 12 8 10 Rape 3 5 9 10 3 3 Drugs 10 7 6 7 10 9 Other 6 6 17 10 16 7
Prior prison commitment(s) No 63 67 60 60 67 64 Yes 37 33 40 40 33 36
aAs approximated by the initially selected bAt time of completing the qu~stionnaire.
sample.
cMost serious of conviction offenses.
record data served both in the analysis and in th~ verification of some of the survey information.
Survey Response Rates
Usable questionnaires were obtained from a total of 1380 prisoners, including those who were replacements for initially selected inmates who failed to appear. The response rate was 73 percent, with component rates in the percentages as shown in Table 2.2.
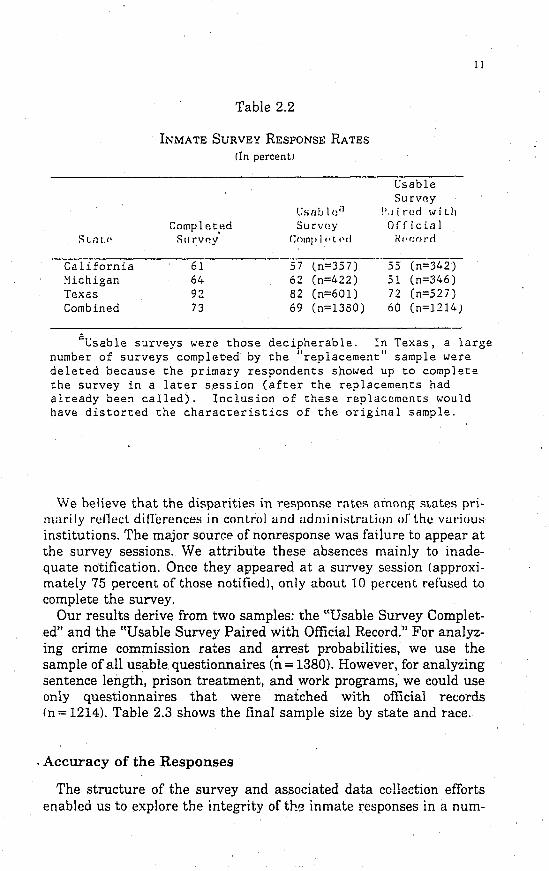
Sun.!'
ea lifornia ~lichigan
Texas Combined
Table 2.2
INMATE SURVEY RESPONSE RATES
fIn percent)
Completed SlIrvn.y·
61 64 92 73
US[JO I e il
Surv(!y C;Olnl' I "t .. d
Csable SurvflY
!'diruci will! Officiill I~('(:()rd
5"7 tn=35 7 )_ ... 55 (n=342) 62 (n=422) 51 Cn=346) 82 (n=601) 72 (n=527) 69 (n=1380) 60 (n=1214)
11
aCsable surveys were those decipherable. In Texas, a large number of surveys complet·ed by the "replacement" sample were deleted because the primary respondents showed up to complete the survey in a later session (after the replacements had already been called). Inclusion of these replacements would have distorted the characteristics of the original sample.
We helieve that the disparities in response rates among stateR primarily relled differences in control and administration o/" the various institutions. The major sourcp. of nonresponse was failure to appear at the survey sessions. We attribute these absences mainly to inadequate notification. Once they appeared at a survey session (approximately 75 percent of those notified), only about 10 percent refused to complete the survey.
Our results derive from two samples: the "Usable Survey Completed" and the "Usable Survey Paired with Official Record." For analyzing crime commission rates and arrest probabilities, we use the sample of all usable questionnaires (n = 1380). However, for analyzing sentence length, prison treatment, and work programs, we could use only questionnaires that were matched with official records (n = 1214). Table 2.3 shows the final sample size by state and race .
. Accuracy of the Responses
The structure of the survey and associated data collection efforts enabled us to explore the integrity of the inmate responses in a num-
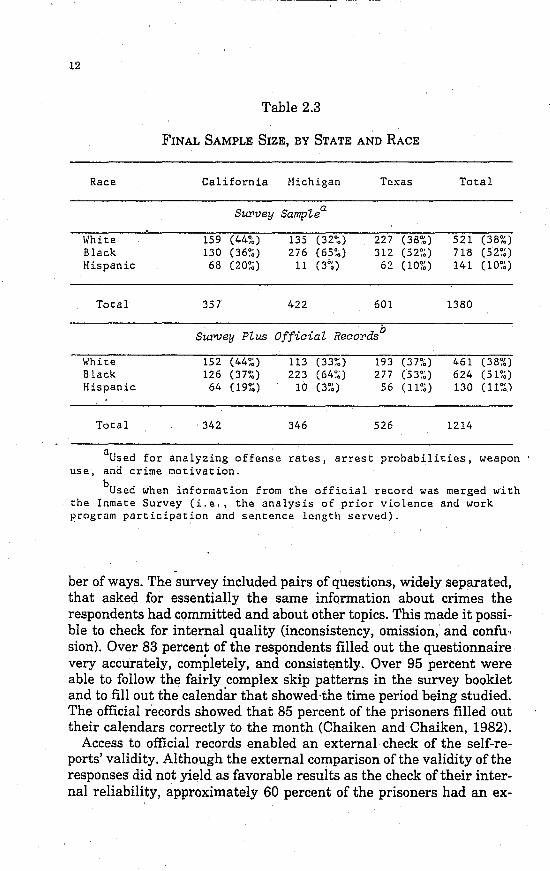
12
Race
\~hite
Black Hispanic
Total
White Black Hispanic
Total
Table 2.3
FINAL SAMPLE SIZE, BY STATE AND RACE
California Michigan
Survey Samplea
159 (44~.) 130 (36~~)
68 (20~~)
357
135 (32~~)
276 (65~.)
11 (3°~)
422
Tc:xas
227 (38%) 312 (52~~)
62 (10~~)
601
Survey Plus Official Recordsb
152 (44~~) 113 (33~~ ) 193 (37~~)
126 (3n~) 223 ( 64~~) 277 (53~~)
64 (l9~~) 10 (3?~) 56 (11~~)
342 346 526
Total
521 (38~~)
718 (52~~) 141 (10~~)
1380
461 (38~O
624 (51~~)
130 (11 ~~)
1214
aUsed for analyzing offense rates, arrest probabilities, weapon use, and crime motivation.
bUsed when information from the official record was merged with the Inmate Survey (i.e" the analysis of prior violence and work program participation and sentence length served) .
. ber of ways. The survey included pairs of questions, widely separated, that asked for essentially the same information about crimes the respondents had committed and about other topics. This made it possible to check for internal quality (inconsistency, omission, and confu .. sion). Over 83 percent of the respondents filled out the questionnaire very accurately, completely, and consistently. Over 95 percent were able to follow the fairly complex skip patterns in the survey booklet and to fill out the calendar that showed ·the time period being studied. The official records showed that 85 percent of the prisoners filled out their calendars correctly to the month (Chaiken and Chaiken, 1982).
Access to official records enabled an external check of the self-reports' validity. Although the external comparison of the validity of the responses did not yield as favorable results as the check of their internal reliability, approximately 60 percent of the prisoners had an ex-
ternal error rate ofless than 20 percent. (Nearly half had two or fewer disparities out of the 14 categories checked, less than 7 percent had between six and nine disparities, and none had more than nine.) However, for most disparities, the records' validity and completeness are as suspect as the respondent's veracity: Prisoners' records are often missing or incomplete-through no fault of theirs.H An analysis of the accuracy of the inmate self-reports showed that estimates of the numbers of arrests and convictions obtained from Relf-repol'ts were unbiaHed or, in a few instanceH, higher than \.11(' official r(,cord estimate (Marquis and Ebener, 1981). Chai~en and Chaiken (1982) analyzed two samples of inmates. The
first involved all respondents, and the second excluded the 42 percent whose truthfulness they had even the slightest reason to doubt (it excluded even the prisoners with missing or incomplete official records). Their purpose was to determine whether such exclusion would affect the estimates of the overall crime commission rates. They found that the estimates were not significantly or consistently affected when the suspect group was included.
Chaiken and Chaiken also compared several inmate characteristics with the indicators of the quality of the self-report data. One might suspect that some types of people would be less truthful in self-reports than others. With minor exceptions, such characteristics as conviction crime, self-image, activity in fraud or "illegal cons," and sociodemographic characteristics were unrelated to the quaiity and validity of the individuals' response.
We w~re particularly interested in whether the responses of minonty inmates were less valid and reliable than those from nonminorities. Minority persons accounted for a majority of the survey administration staff. We believe that minority representation on the Rand staff was important for gaining the tru::;t or the reHpondentH. (Survey administrators also had prior criminal justice experience.) Mexican~Americans proved to have no better or worse external va
lidity or internal quality than did other respondents. Black respondents were no better or worse than other respondents on external validity, but had worse internal quality, in particular with regard to confusion and inconsistency, but not to omissions (Chaiken and Chaiken, 1982).
In sum, we found r;e self-reports data sufficiently valid and reliable to serve as a credible basis for our study of racial disparities.
sJuvenile records suffer notably in this regard. In nearly all cases of disparity between the self-reports and juvenile records, the respondent admitted to juvenile crime~ or incarceration, but the record showed none (Chaiken and Chaiken, 1982).
III. RACIAL DIFFERENCES IN CASE PROCESSING: ARREST THROUGH
SENTENCING
Official records tell a limited story about the people involved in the criminal justice process and the legal and extralegal factors that may affect their treatment. As Sec. II indicated, one drawback is lack of information on the pre-arrest and post-sentencing stages. But even for those stages usually represented in official data, the information routinely collected is scant. Most records maintained by criminal justice agencies contain little more information about the offender than his age, race, prior record, and offense (usually one of a broad offense grouping). Nevertheless, official records provide the objective base for beginning a study of possible discrimination.
The OBTS data allowed us to· examine the felony disposition process in California for any indications that minorities are treated differently at key decision points. Specifically, this section will examine whether minorities have a greater probability of (1) having their case officially filed, once arrested; (2) being convicted, once charges are filed; (3) Teceiving a prison sentence, once convicted; and (4) serving a longer prison sentence after conviction. To investigate the last point, we used the wider data base provided by the RIS.
THE FELONY DISPOSITION PROCESS AT WORK
Each year more than 1.5 million adults in the United States enter the felony disposition process. This process, beginning with arrest and ending with either the dropping of charges or sentencing, is the heart of the criminal justice system. It is commonly referred to as a funnel or sieve because a great many persons enter the process but very few remain at the end. Approximately 30 percent of the arrestees are dismissed before the preliminary hearing; less than half of those who go to court are convicted; and lass than 5 percent of those convicted are sentenced to prison (Greenwood, 1982).
The California process resembles that of other states in all but a few aspects. Prosecution of a felony charge usu.ally begins with a police arrest, with or without a warrant. The police make arrests without warrants, "on-view" arrests, based on probable cause-that is, subjective belief that a felony has been committed by a specific person. To
14
Iii
make probable cause credible, there must be a set of facts that would justify that belief in a reasonable person. Arrests made with warrants differ in that the facts of the case are evaluated as they would be for filing a charge.1 Consequently, evidence for warrant arrests is generally stronger.
Within a set time after arrest (usually 48 to 96 hours), the police must obtain a formal complaint from the District Attorney or release the defendant. Under California law, the law enforcement agency that makes the arrest may release the person from custody if it is "satisfied that there are insufficient grounds for making a criminal complaint against the person arrested.":! If the police decide to seek a complaint, they present the case information to a deputy in· the District Attorney's office for screening. The deputy reviews the police reports and the defendant's prior record, and may talk to the officer about the case. He may then file a felony complaint, file a misdemeanor complaint, suggest that the police investigate further, or reject the case. The District Attorney files a felony charge if:
• There is legally sufficient, admissible evidence of the corpus delicti of the crime,
• There is legally sufficient, admissible evidence of the identity of the perpetrator of the crime,
8 The prosecutor believes that the evidence shows the guilt of the accused,
• The evidence is so convincing that it would warrant conviction by an objective fact-finder.
It is apparent that the charging standard that underlies a complaint is much higher than the probable-cause standard that supports an arrest. The complaint filing function is one of the most sensitive and important because it moves a case onto one of two largely irreversible tracks. If the complaint is rejected and the police agree, it is lost from the system without much chance for review. Once it is filed, the system presses on with it.
If a decision is made to file, the defendant is arraigned in Municipal Court, where he is informed of the charges. At this hearing, the defendant will usually apply for bailor for release on his own recognizance. He then either meets the release conditions (for example, posting bond) or is committed to pretrial detention (jaiIJ.
Although he is not required to plead at this time, and it is unusual for him to do so, he can enter a plea. If he pleads not guilty, a date is
I Indeed, in many cases, a warrant is issued by a court based on a complaint filed by the District Attorney.
:!Penal Code 849(b)( 11.
16
set, usually one week later, for a preliminary hearing at which the District Attorney presents evidence, either to the magistrate or the Grand Jury, that the defendant committed the felony. That evidence must be sufficient to establish a prima facie case-that is, sufficient to convict the defendant if it is unchallenged by the defense.
The end result of the preliminary hearing is either that the defendant is bound over to the Superior Court, the charge is reduced to a misdemeanor, or the felony charges are simply dropped. Only Superior Court judges can sentence upon felony cases. Thus, if the court decides that the District Attorney has a valid felony case, it binds the defendant over to Superior Court. However, a felony case can also reach the Superior Court if the defendant pleads guilty in Municipal Court. In such cases, the defendant is «certified" to the Superior Court for trial and sentence. Under California law (Penal Code 17(b», many felony charges can be handled as either felonies or misdemeanors. These so-called "wobblers" result in a number of cases that were cdgin ally charged as felonies being processed in the lower courts as misdemeanors and never reaching the Superior Court.
After a defendant is certified to the Superior Court, he is formally arraigned, defense counsel is appointed for him if he is indigent, and he I':;cust enter a plea. At some point between arraignment and trial, most defendants decide to plead guilty-usually the result of plea bargaining between the prosecutor and the defense. Plea bargaining usually results in less severe sentencing, reduction of charges, or both.
If plea bargaining fails, the case proceeds to trial, and the defendant is either convicted or acquitted of each of the charges. If convicted, the court imposes sentence. T.\1e sentencing decision includes imposing both the nature of the sentence (e.g., fine, jail, probation, prison) and its length.
In passing sentence, a judge usually follows the recommendation contained in a presentence investigation report (PSR) prepared by the Probation Officer. These reports differ in format, but a primary objective is to provide information for assessing the defendant's potenti.:.lity for rehabilitation or recidivism. Currently, many states are shortening PSRs, often employing objective checklists of recidivism indicators derived from actuarial tables. However, the traditional PSR in most states has been a lengthy, quasi-biographical document describing the defendant's background, history, and personal and socioeconomic characteristics. Although these are much more inclusive and impressionistic than simple checklists, evidence indicates that sentencing recommendations are based on only a few pieces of information (e.g., prior record, employment status, social stability, family history). PSRs are very influential documents: In over 80 percent of cases, judges follow their recommendations in passing sentence (Car-
17
ter, 1978), Not only that, the PSR provides a great deal of the material used by prison and parole boards to make parole decisions.
PRIOR RESEARCH
Previous research has a great deal to say about how minorities are treated as they pass through this system, but the findings on discrimination are highly contradictory. Some studies have found harsher treatment accorded to minorities, others have found no differences, and still others have found that minorities are treated more leniently. Despite these contradictions, there is general agreement in the literature about the factors that increase the likelihood of conviction and the severity of sentences, regardless of race:
• Severity of offense • Degree of violence involved • Multiple charges • Seriousness of initial charge • Seriousness of prior criminal record • Possession of weapons • Failure to make bail III Length of pretrial detention • Type of attorney (privately paid lawyer, publicly appointed
lawyer, or public defenderP
In a recent review of discrimination studies for a National Academy of Science panel on sentencing, Garber et al. conclude:
Virtually all the studies suggest that three factors are of particular importance in the processing of cases through th.: CJS: seriousness of the offense, quality of the evidence, and the prior record of the defendant. These factors are measured in various ways . .' .. Seriousness of the offense appears to be particularly relevant in the decision to prosecute, the charge, the size of bail, and in sentence (given conviction). It also appears to be an important factor affecting the defendant's choice of attorney .... The quality of the evidence appears to play an important role in the decision to prosecute, the choice of plea, and trial conviction .... Prior record plays an important role in the d~cision to prosecute, the size of the bail, sentencing, and (to some degree) in conviction (1982, p. 6).
:lSee Bernstein et aJ. (1977); Clarke (1982); Feeley (1979-'. Other researchers have Identified less generally recognized factol's. For example, Meyers' (1980) research on conviction decisions found that when victim and defendant were strangers or when victims were of high employment status or highly educated, there was greater likelihood of conviction.
18
Garber et al. further observe that other legal and quasi-legal factors are also important at some stages. Making bail consistently appears to affect case disposition. It presumably operates through the conviction process by affecting the defendant's ability to put together a successful defense. In some studies, the quality of legal representation and the type of plea also seem to be influential.
Despite general agreement on these factors, studies of possible discrimination in case disposition have failed to reach consensus on any other point. Ever since the 1960s, researchers have found some evidence for discrimination in sentencing for certain kinds of crime, and in particular points of the criminal justice process. But others find no consistent discrimination. In an ,evaluation of earlier research, Hindelang (1969) suggests that divergent findings in the literature published prior to 1966 might be explained by the fact that (1) studies finding racial discrimination used data from Southern states, (2) studies finding discrimination used data about ten years older than those in studies finding no race discrimination, and (3) studies finding no discrimination were more careful in controlling for nonracial variables. It may also be true that two studies that reach different conclusions on discrimination might both be correct. Discrimination is not uniform across judges' jurisdictions, parts of the system, or time periods. However, poor methodology appears to account for most of the inconclusiveness found in early work.
Although recent studies are generally more methodologically rigorous, use more recent data, and include a wider variety of offenses than the earlier studies did, their findings are still contradictory.4 Even when studies have rigorously controlled for many of the legal and quasi-legal factors noted above, they have still disagreed about how fairly the felony disposition system treats minorities. Lizotte's (1978) data on Chicago courts show "gross discrimination" on the basis of race and occupation. In that study, all other things being equal, blacks of low socioeconomic status (SES) received prison sentences at least eight months longer than whites who had higher SES.
These findings are consistent with a recent study by Zalman et al. (1979). Using Michigan data, they found statistically significant differences in the sentence type (in/out) and sentence length for defendants charged with sex crimes. Using regression equations, they found that 64 percent of whites can be e~pected to be incarcerated for a sex crime conviction, while 78 percent of nonwhites will be incar-
4For example, several studies find little or no effect of race on sentencing: Burke and Turk (1975); Chiricos and Waldo (1975); Bernstein, Kelly, and Doyle (1977); Perry (1977); Cohen and Kluegel (1978); McCarthy (1979); and Clarke and Koch (1977), Several others do find a relationship: Arnold (1971); Chiricos, Jackson, and Waldo (1972); Hagan (1975); Swigert and Farrell (1977); Lizotte (1978); and Zalman et al. (1979).
.---------------------------
19
cerated. White defendants convicted of sex crimes were sentenced to a mean term of 46 months, while nonwhites averaged 91 months. With respect to other crime types, they found that nonwhites receive harsher sentences for homicide, assault, robbery. burglary, and larceny. Nonwhites had anywhere from 0.07 to 0.15 higher probability of being incarcerated for these crimes than whites.
The analysis of sentence length by Zalman et a1. found fewer instances of racial disparity, although there were statistically significant differences in the crimes of sex, drug, burglary, and larceny. in all four instances, nonwhites were treated more harshly than whites (Zalman et al., 1979, p. 234). They conclude:
Taken together, the results of an analysis of the' IN/OUT and LENGTH decisions indicate that there is evidence of very distinct differences in the treatment of whites and nonwhites. Furthermore. in all cases in which the differences are statistically significant, nonwhites are being treated more severely.
In contrast, a study of sentencing in New Jersey concluded that:
Racially different but otherwise similar offenders convicted of similar offenses receive similar sentences. That is. when statistically accountinR for the effect of' key factors relatinR to the nature of thl! offender and offense, the data do not support the contention that minority race offenders receive more severe sentences than similar white offenders (McCarthy et a!., Ij3791. •
This agrees with the Clarke and Koch (1977) finding that in burglary and larceny sentences in Charlotte, North Carolina, offense, criminal history, and promptness of apprehension have predictive associations with prison sentences, but there is "no evidence that the defendant's age, race, or employment status had an important relationship to prison outcome."
Nevertheless, the only stage at which extralegal factors such as age, race, and SES have not been found to playa role, in one study or another, is the conviction stage (although only La Free (1980a, 1980b) studies convictions directly). Moreover, several studies emphasize the cumulative role of extralegal factors. By the time black and lowerstatus defendants reach the sentencing stage, they are claimed to be at a considerable disadvantage. They appear to face more serious charges, be more often induced to plead guilty, be less able to make bail and thus organize a successful defense, and have restricted access to good legal representation. All of these factors are believed to affect sentence and case disposition generally. Swigert and Farrell (1977) also note that discrimination can start a vicious cycle, contributing to
20
the creation and growth of a criminal record that in turn leads to haroner treatment in subsequent encounters with the criminal justice system.
ADULT FELONY PROSECUTION IN CALIFORNIA
The OBTS for 1980 provided the official data for our study of racial differences in case processing. The OBTS traces cases in which adults were arrested for felony offenses from the point of arrest through final disposition. The unit of analysis is a case, not a defendant. It is common for a defendant to be involved in multiple cases. The OBTS con-tains infonnation on the following case 'elements:5 -
a Race, sex • Prior criminal record (e.g., none, minor, major) • Criminal status (e.g., parole, probation) • Type of arrest charge • Point of disposition • Type of proceedings • Type of disposition • Type of sentence
As this list indicates, the OBTS does not provide infonnation on some ofth€ factors just described that could affect case processing. For example, it does not contain information related to bail or type of attorney.6 It did not allow us to go behind the initial charging decision to explore how often intentional overcharging occurs. Nor did it pennit us to assess the quality of evidence in the case, the defendant's SES or his demeanor, and other factors related to case processing. Thus, the OBTS has limitations for our purposes.
Nevertheless, the data were sufficient to raise some general questions about racial differences in case processing and allow us to determine whether defendants of different races who were charged with similar crimes and had similar records were treated differently. The data pennitted us to examine "system fallout" for California felony arrestees as a whole and to compare treatment of whites, blacks, and Hispanics at various key points in the felony disposition system. However, overall, these comparisons do not control simultaneously for crime type, prior record, age, 01' .criminal status. Without those con-
SIn addition to the elements listed, the OBTS also contains data on sentence length. However, we preferred to use the rus for this analysis because it represents sentencing practices in several states.
60BTS stopped collecting "type of attorney" information in 1978.
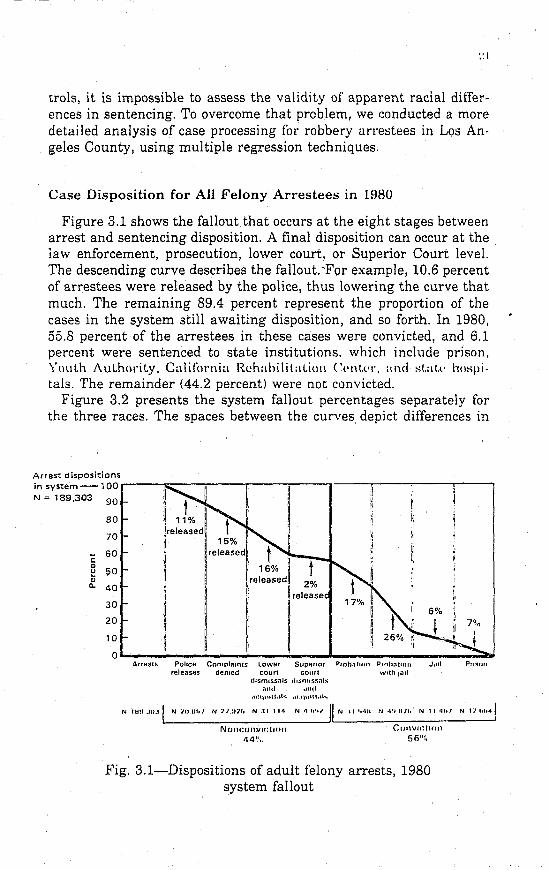
troIs, it is impossible to assess the validity of apparent racial differences in sentencing. To overcome that problem, we conducted a more detailed analysis of case processing for robbery arrestees in Los Angeles County, using multiple regression techniques.
Case Disposition for All Felony Arrestees in 1980
Figure 3.1 shows the fallout that occurs at the eight stages between arrest and sentencing disposition. A final disposition can occur at the law enforcement, prosecution, lower court, or Superior Court level. The descending curve describes the fallout. 'For example, 10.6 percent of arrestees were released by the police, thus lowering the curve that much. The remaining 89.4 percent represent the proportion of the cases in the system still awaiting disposition, and so forth. In 1980, 55.8 percent of the arrestees in these cases were convicted, and 6.1 percent were sentenced to state institutions. which include prison. Yout.h AuLhoriLy. California Rehabilil.aLiol\ (\'1\1.('1'. and sCaLp hospi· tals. The remainder (44.2 percent) were not convicted.
Figure 3.2 presents the system fallout percentages separately for the three races. The spaces between the curves depict differences in
Arrest dispositions in system -1 00 ...------1"'1 ,....--.,,-I---n---...,---'---.,-----,---....--.., N;189,303 90 ~ t
~ '" ~ " 0-
~ 11% ~ t !reteased! II 15% '\ released t ~,--__ ~ ! 16% ~ 1 IreJeased~ 2%
',,1 II release , ~
ij r ~ i
80
70
60
50
40
30
20
10 -
0
6%
Arrest,. Police Complaints lower SuperIOr Pmhatllll1 Proh:1tulIl J.III PrI:-;UII releases denied COUl't court with Jilll
cl!smlssills oisnussilis and .lIul
,u:qlnU.,t ... ,1\ I\\I\U.,'"
N litH .In.11 N :lU.Ubl N "J1.~J:lh N .11 111\ N 1\ h'.1 It-I N_"_"_"'_' _N_"-::",..."/_h_N_"_"._h/_N_'_'_hh-,"!
NOfU:UIUIII:IICHI COIlVII:IICUl
44 11.;, 56":,
Fig. 3.l-Dispositions of adult felony arrests, 1980 system fallout
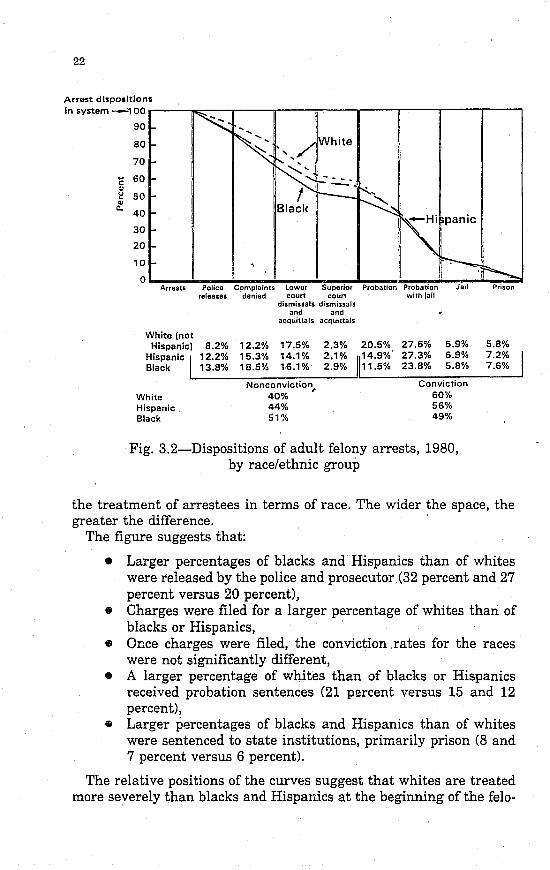
22
Arren disposition. In system --100
.. c: ., u ~ c.
90
80
70
60 -.. -.' 50
40
30
20
10
0 Arrests Police Complaints Lower Superior Probation Probation
releases denied court court with jail dismissals dismissals
and and acquittals acquittals
White (not 5.9% Hispanic) 8.2% 12.2% 17.5% 2.3% 20.5% 27.6%
Hispanic I 12.2% 15.3% 14.1% 2.1% /14.9%' 27.3% 6.9% 13.8% 18.5% 16.1% 2.9% 23.8% 5.8% 11.5% Black
Nonconviction Conviction 40%
, 60% White
Hispanic 44% 56% Black 51% 49%
Fig. 3.2-Dispositions of adult felony arrests, 1980, by race/ethnic group
5.8% 7.2% 7.6%
the treatment of arrestees in terms of race. The wider the space, the greater the difference.
The figure suggests that:
• Larger percentages of blacks and Hispanics than of whites were released by the police and prosecutor (32 percent and 27 percent versus 20 percent),
• Charges were filed for a larger percentage of whites than of blacks or Hispanics,
• Once charges were filed, the conviction rates for the races were not significantly different,
• A larger percentage of whites than of blacks or Hispanics received probation sentences (21 parcent versus 15 and 12 percent),
• Larger percentages of blacks and Hispanics than of whites were sentenced to state institutions, primarily prison (8 and 7 percent versus 6 percent).
The relative positions of the curves suggest that whites are treated more severely than blacks and Hispanics at the beginning of the felo-
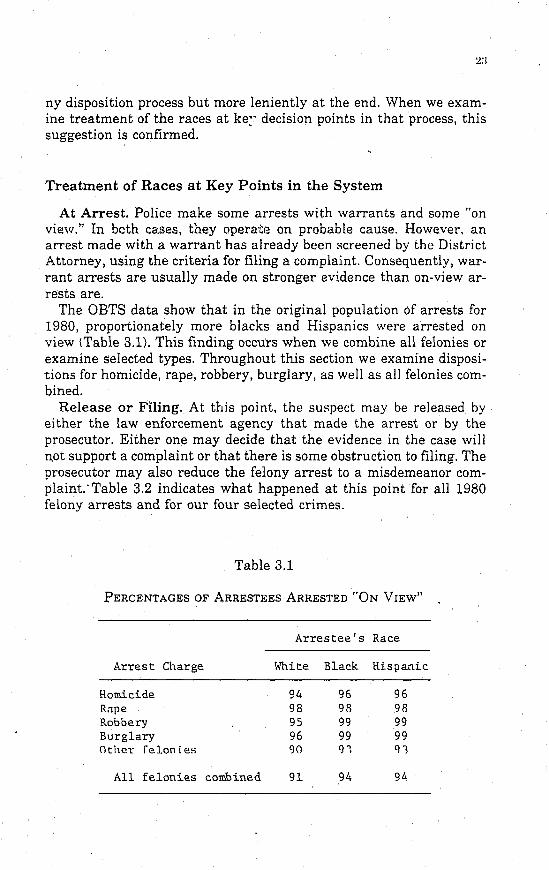
ny disposition process but more leniently at the end. When we examine treatment of the races at ke:- decision points in that process, this suggestion is confirmed.
Treatment of Races at Key Points in the System
At Arrest. Police make some arrests with warrants and some "on view." In beth cases, they operate on probable cause. However, an arrest made with a warrant has already been screened by the District Attorney, using the criteria for filing a complaint. Consequently, warrant arrests are usually made on stronger evidence than on-view arrests are.
The OBTS data show that in the original population of arrests for 1980, proportionately more blacks and Hispanics were arrested on view tTable 3.1). This finding occurs when we combine all felonies or examine selected types. Throughout this section we examine dispositions for homicide, rape, robbery, burglary, as well as all felonies combined.
Release or Filing. At this point, the suspect may be released by either the law enforcement agency that made the arrest or by the prosecutor. Either one may decide that the evidence in the case will not support a complaint or that there is some obstruction to filing. The prosecutor may also reduce the felony arrest to a misdemeanor complaint:Table 3.2 indicates what happened at this point for all 1980 felony arrests and for our four selected crimes.
Table 3.1
PERCENTAGES OF ARRESTEES ARRESTED "ON VIEW"
Arrestee's Race
Arrest Charge White Black Hispanic
Homicide 94 96 96 Rape 98 9R 9R Robbery 95 99 99 Burglary 96 99 99 Other felon ies 90 1)"\ gl
All felonies combined 91 94 94
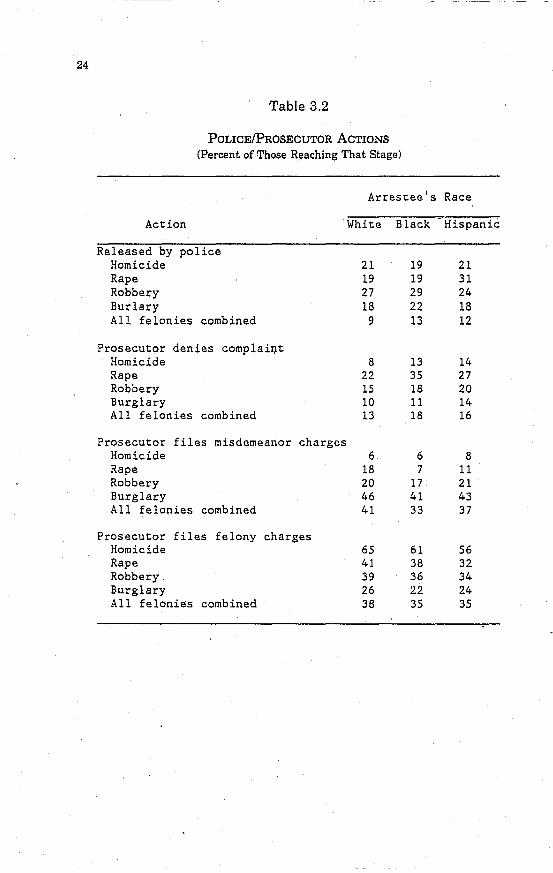
24
Table 3.2
POLICEIPROSECUTOR ACTIONS (Percent of-Those Reaching That Stage)
Arrestee I S Race
Action White Black Hispanic
Released by police Homicide 21 19 21 Rape 19 19 31 Robbery 27 29 24 Burlary 18 22 18 All felonies combined 9 13 12
Prosecutor denies complai~t Homicide 8 13 14 Rape 22 35 27 Robbery 15 18 20 Burglary 10 11 14 All felonies combined 13 18 16
Prosecutor files misdemeanor charges Homicide 6 6 8 Rape 18 7 11 Robbery 20 17 21 Burglary 46 41 43 All felonies combined 41 33 37
Prosecutor files felony charges Homicide 65 61 56 Rape 41 38 32 Robbery 39 36 34 Burglary 26 22 24 All felonies combined 38 35 35
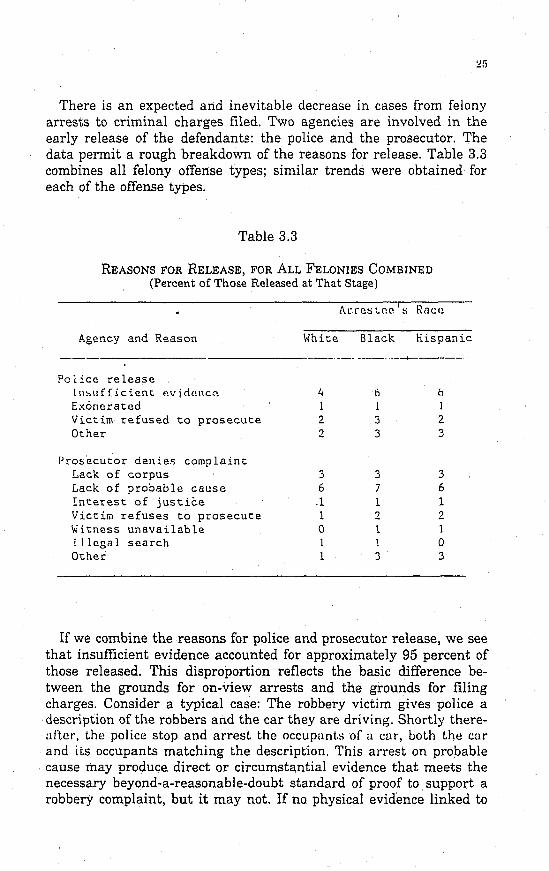
---- --- ----- ----
There is an expected and inevitable decrease in cases from felony arrests to criminal charges filed. Two agencies are involved in the early release of the defendants: the police and the prosecutor. The data permit a rough breakdown of the reasons for release. Table 3.3 combines all felony offense types; similar trends were obtained for each of the offense types.
Table 3.3
REASONS FOR RELEASE, FOR ALL FELONIES COMBINED (Percent of Those Released at That Stage)
Agency and Reason
Police release Insufficient evidence Exonerated Victim refused to prosecute Other
Prosecutor denies complaint Lack of corpus Lack of probable cause Interest of justice Victim refuses to prosecute Witness unavailable Illegal search Other
ArrCl;Lnc'H Rnce
White Black Hispanic
---_. ----_ .. _---_. 4 ti b
1 1 2 3 2 2 3 3
3 3 3 6 7 6 .1 1 1 1 2 2 0 1 1 1 0 1 3 3
If we combine the reasons for police and prosecutor release, we see that insufficient evidence accounted for approximately 95 percent of those released. This disproportion reflects the basic difference between the grounds for on-view arrests and the grounds for filing charges. Consider a typical case: The robbery victim gives police a description of the robbers and the car they are driving. Shortly therealler, the police stop and arrest the occupants of a car, both the car and its occupants matching the description. This arrest on propable cause may produce direct or circumstantial evidence that meets the necessary beyond-a-reasonable-doubt standard of proof to support a robbery complaint, but it may not. If no physical evidence linked to
26
the robbery turns up and the victim cannot identify the arrested persons in a line-up, no charge will be filed.
The data show racial disproportion in filing and release for on-view arrests. Of arrested whites, 21.2 percent were not charged, as opposed to 31.5 percent for blacks and 28.0 percent for Hispanics. These data suggest that blacks and Hispanics in California are more likely than whites to be arrested under circumstances that provide insufficient evidence to support criminal charges. We discuss the possible implications of this phenomenon later.
Lower Court Actions. Following a felony charge, the defendant appeal'S for a hearing in Municipal Court. After the District Attorney presents evidence to the magistrate or Grand Jury, the case may be dismissed, bound over to Superior Court as a felony, or tried in the lower court as a misdemeanor under Sec. 17(b) of the Penal Code. We found that once felony charges are filed, defendants of all races have roughly the same chance of being prosecuted on felony charges.
Adjudication. When defendants are prosecuted on a felony charge, chances of conviction are also fairly even for whites, blacks, and Hispanics. However, some defendants are acquitted, some convictions are for misdemeanor offenses only, and, again, some cases are dismissed. Plea bargaining strongly affects case disposition, and most cases reach disposition by plea. Cases go to trial (by jury or judge) only if a satisfactory plea bargain cannot be reached. Only 7 percent of the white defendants were tried by a jury, but 12 percent of the blacks and 11 percent ofthe Hispanics were. Table 3.4 shows the result of the adjudication of felony case's in 1980. These figures show that white defendants had a slightly higher conviction rate than minorities. However, that may be related to the fact that they also engaged more in plea bargaining, which virtually guarantees conviction. Similar trends were obtained for each of the separate crime types as well.
Sentencing. In the California system, the number of possible sentences is amazing. In addition to state prison, there are state-level dispositions involving custody in other state institutions; the California Youth Authority (CYA); the California Rehabilitation Center (CRC) for narcotic addicts; facilities for Mentally Disordered Sex Offenders (MDSO); and mental health facilities for persons found Not Guilty by Reason of Insanity (NG!). At the local level, there is the possibility of county jail either as a condition of probation or as a direct sentence, and, finally, there is the possibility of a disposition without a requirement of state or local custody.7
7There were 23 persons sentenced to death in 1980: 10 whites, 4 Hispanics, 8 blacks, 1 other.
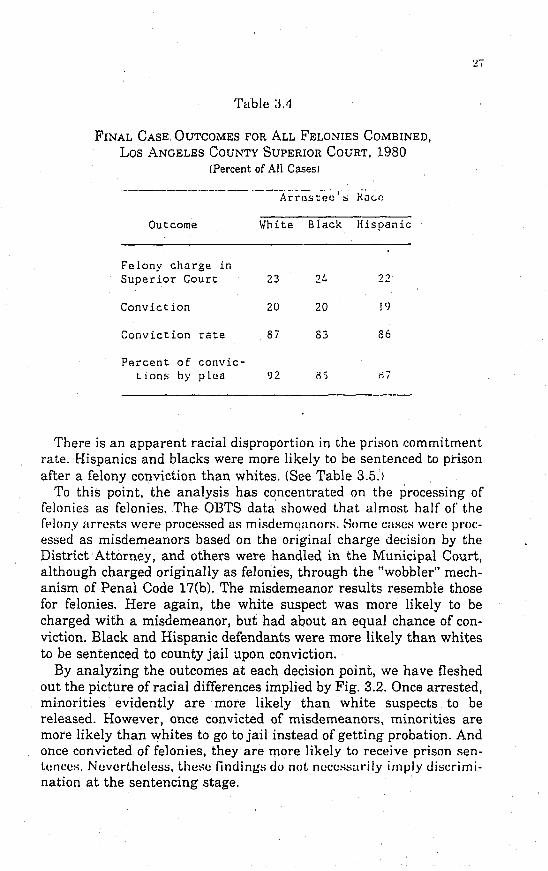
Table :lA
FINAL CASE OUTCOMES FOR ALL FELONIES COMBINED,
Los ANGELES COUNTY SUPERIOR COURT, 1980 (Percent of All Cases)
Ouccome White Black Hispanic
Felony charge in Superior Courc 23 24 22
Conviction 20 20 1 C)
Conviccion race 87 83 86
PercenC of convic-t ion:> by plea 92 HS f"' "
There is an apparent racial disproportion in the prison commitment rate. Hispanics and blacks were more likely to be sentenced to prison after a felony conviction than whites. (See Table 3.5.)
To this point, the analysis has concentrated on the processing of felonies as felonies. The OBTS data showed t.hat almost half of the fplony arrests were processed as misdemeanors. Somc cases were processed as misdemeanors based on the original charge decision by the District Attorney, and others were handled in the Municipal Court, although charged originally as felonies, through the "wobbler" mechanism of Penal Code 17(b). The misdemeanor results resemble those for felonies. Here again, the white suspect was more likely to be charged with a misdemeanor, but had about an equal chance of conviction. Black and Hispanic defendants were more likely than whites to be sentenced to county jail upon conviction.
By analyzing the outcomes at each decision point, we have fleshed out the picture of racial differences implied by Fig. 3.2. Once arrested, minorities evidently are more likely than white suspects to be released. However, once convicted of misdemeanors, minorities are more likely than whites to go to jail instead of getting probation. And once convicted of felonies, they are more likely to receive prison sentences. Nevertheless, the:;e finding:; do not nccc:;sarily imply discrimination at the sentencing stage.
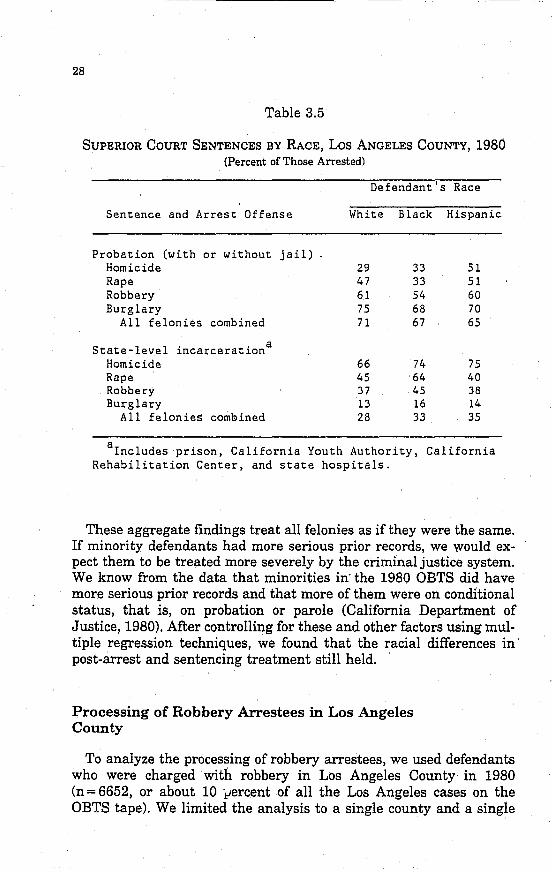
28
Table 3.5
SUPERIOR COURT SENTENCES BY RACE, Los ANGELES COUNTY, 1980 (Percent of Those Arrested)
Defendant's Race
Sentence and Arrest Offense White Black Hispanic
Probation (with or without jail) Homicide 29 33 51 Rape 47 33 51 Robbery 61 54 60 Burglary 75 68 70
All felonies combined 71 67 65
State-level incarceration a
Homicide 66 74 75 Rape 45 64 40 Robbery 37 45 38 Burglary 13 16 14
All felonies comhlined 28 33 35
alncludes prison, California Youth Authority, California Rehabilitation Center, and state hospitals.
These aggregate findings treat all felonies as if they were the same. If minority defendants had more serious prior records, we would expect them to be treated more severely by the criminal justice system. We know from the data that minorities in'the 1980 OBTS did have more serious prior records and that more of them were on conditional status, that is, on probation or parole (California Department of Justice, 1980). After controlling for these and other factors using multiple regression techniques, we found that the racial differences in post-arrest and sentencing treatment still held.
Processing of Robbery Arrestees in Los Angeles County
To analyze the processing of robbery arrestees, we used defendants who were charged with robbery in Los Angeles County in 1980 (n = 6652, or about 10 lJercent of all the Los Angeles cases on the OBTS tape). We limited the analysis to a single county and a single
29
crime type because of the expense in processing so large a data base as this one, and because previous research using the OBTS file had l-ihown significant difTerences in the pr()cm;~ing of dcfcndant~ from different counties and arrested on different charges (Pope, 1975b). To study racial differences, we wanted a population that was homogeneous with respect to county and arrest charge. The regression analysis was designed to test for racial differences in the probability of going to prison if convicted.
Our Los Angeles results are consistent with the statewide data. White suspects in Los Angeles County were more likely than minorities to be officially charged following a robbery arrest. Black arrestees were more likely to have their cases dismissed either by the police or prosecutor. Minority defendants were less likely to settle their cases through plea bargaining. Also, a greater proportion of minority arrestees were arrested "on view."
The conviction rates were similar across the races. Also, there were no statistically significant differences in the type of robbery that persons of the different races were convicted of, e.g., attempted robbery, robbery, or assault to rob.
To determine whether minorities were sentenced to prison more frequently, we selected persons from the arrest sample who were convicted in the Superior Court Cn = 2193). The sentences they received for some offense (as a result of a robbery arrest) were consistent with statewide data showing that white defendants are less Hkely to go to prison following a conviction in Superior Court. Black defendants are more likely than whites or Hispanics to serve their sentences in a state-level institution-a prison or a CYA facility.
Over the entire sample, the probability of receiving a prison sentence if arrested for robbery and convicted (of some crime) in Superior Court was 0.40. Of those who were convicted in Superior Court, 68 percent were convicted of robbery (in some form); 8 percent of aggravated assault; 17 percent of burglary/theft; and 6 percent were convicted of some other miscellaneous offense. There were no racial differences in the type of conviction offense.
Multiple regression analyses with these data permitted us to control simultaneously for the other factors and look at the independent effect of race on the probability of receiving a prison sentence, once convicted.s The following independent variables were included in the regression equation:
8We were not able to use a regression model prior to this point because most of the offender characteristics (e.g., prior record) were recorded only for defendants reaching the Superior Court.
30
• Current conviction crime type .. Prior criminal record • Defendant's age • Defendant's race • Defendant's current criminal status (e.g., on parole, proba-
tion)
Appendix A reproduces the complete regression results, which show that several factors are statistically related to the probability of receiving a prison sentence, once convicted in Superior Court:
.. The older the defendant, the more likely he was to be sentenced to prison.
fit The more serious the conviction crime, the more likely the defendant was to get a prison sentence.
• People on conditional status (e.g., parole, probation) were more likely to be sentenced to prison.
• People with prior prison records were more likely to be sentenced to prison.
• Most important for our study, when all other factors (available to us) were controlled, black defendants had a statistically significant higher chance of going to prison than whites or Hispanics.
LENGTH OF COURT-IMPOSED SENTENCE
Our analyses of the OBTS data yielded evidence of racial disparities in post-arrest release rates and in type of sentence imposed. The latter, especially, seems to substantiate charges that the criminal justice system does sentence minorities to prison more often than it does whites. But what of sentence length? Critics have also repeatedly claimed that judges sentence minorities to longer sentences. Although the scope of the study did not permit us to analyze all aspects of case processing in all three states, it did allow us to analyze and compare length of court-imposed sentence. Considering the seriousness of the issue, we preferred to use the RIS data rather than limit the findings to one state. .
To establish the minimum and maximum sentence imposed by the court for each inmate who completed the RIS questionnaire, we consulted his official corrections records. We used this information in separate regression analyses for the three states to assess possible racial disparities in those sentences.9 The regression models controlled for
9'fhe complete regression results are in Appendix B. They were similar whether we used minimum or maximum sentence, or their logarithms, as the dependent variable.
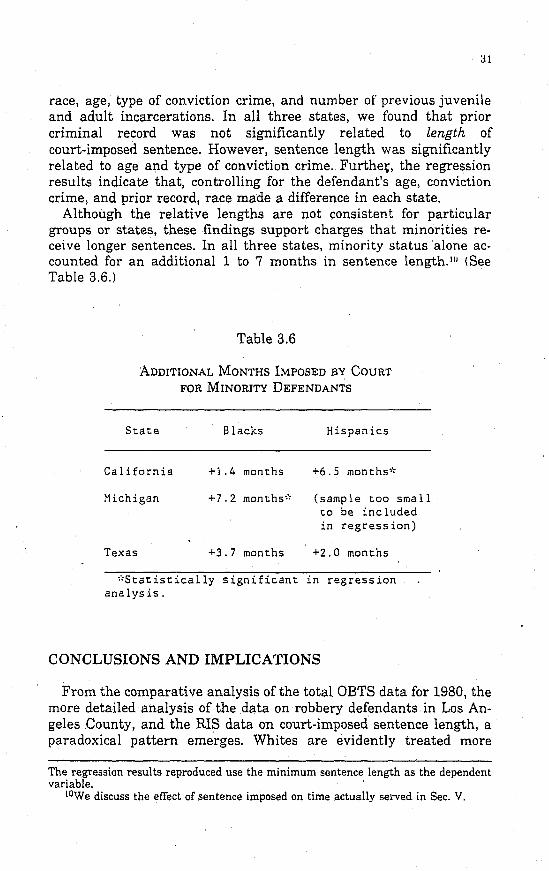
:31
race, age, type of con.viction crime, and number of previous juvenile and adult incarcerations. In all three states, we found that prior criminal record was not significantly related to length of court-imposed sentence. However, sentence length was significantly related to age and type of conviction crime. Furthet, the regression results indicate that, controlling for the defendant's age, conviction crime, and prior record, race made a difference in each state.
Although the relative lengths are not consistent for particular groups or states, these findings support charges that minorities receive longer sentences. In all three states, minority status alone accounted for an additional 1 to 7 months in sentence length. to (See Table 3.6.)
Table 3.6
ADDITIONAL MONTHS IMPOSED BY COURT
FOR MINORITY DEFENDANTS
State
Ca li fornie
~1ichigan
Texas
Blacks Hispanics
+1.4 months +6.5 months*
+7.2 months* (sample too small to be included in regression)
+3.7 months +2.0 months
*Statistically significant in regression analysis.
CONCLUSIONS AND IMPLICATIONS
From the comparative analysis of the total OBTS data for 1980, the more detailed analysis of the data on robbery defendants in Los Angeles County, and the RIS data on court-imposed sentence length, a paradoxical pattern emerges. Whites are evidently treated more
The regression results reproduced use the minimum sentence length as the dependent variable.
lOWe discuss the effect of sentence imposed on time actually sel-ved in Sec. V.
32
severely than biacks or Hispanics until the sentencing stage. White suspects are more likely to be arrested on warrant than on view, more likely to have the case accepted by the DA, and more likely to be formally charged with felonies or misdemeanors. After that point, however, the pictu.re changes. •
Once arraigned on feluny charges, the races have a roughly equal chance of being prosecuted on those charges in Superior Court and about an equal chance of being convicted. Whites have a slightly higher conviction rate for felonies, but they are also more likely than minorities to plea bargain-and, by definition, plea bargaining guarantees some kind of conviction. Hispanic and black defendants are more likely to be tried by judge or jury.
After conviction, the system treats blacks and Hispanics more severely than it does whites. If they are convicted of misdemeanor charges, blacks and Hispanics are much more likely to go to jail, while whites are more likely to receive probation. If convicted of felony charges, blacks and Hispanics are more likely than whites to receive prison sentences. In either case, they are likely to receive longer sentences.
It is possible that this apparent discrimination is actually a factor of racial differences in plea bargaining. Although white defendants give up their chances of acquittal by plea bargaining, the plea bargain guarantees them a reduction in charge andlor lighter sentences. By going to trial, blacks and Hispanics keep open the possibility of acquittal, but there is evidence that sentencing is more severe for judge or jury trials (California Legislature,'1980). We discuss this question at greater length in the final section.
Ifwha.t we have discovered in analyses of the OBTS and RIS data is discrimination, why should it operate in this apparently inconsistent fashion, treating white suspects more severely-at the early stages of the process and minorities more severely at -the later stages? If treatment severity is based on prior criminal record and violence of the offense, we would expect more severe treatment for violent offenders with serious prior records-but we would expect it to be consistent throughout the criminal justice process.
It is possible that minorities receive less severe treatment after arrest because the police are quicJH~r to assume probable cause where minorities are concerned, but many arrestees are released when the grounds for arrest prove insufficient. That conjecture draws some credibility from the fact that the police obtain warrants to arrest whites more often than they do to arrest minority suspects. In short, they overarrest minorities relative to the number of crimes minorities actually commit. If so, the lower charging rates for minorities are

ironically consistent with the harsher sentencing. Both may represent discrimination against minorities at these two key decision points.
The OBTS and RIS data do not allow us to resolve these questions. However, the RIS provides insights into the pre-arrest and post-sentencing experience of prisoners. By looking at these data, we learned a great deal more about possible discrimination in the criminal justice system from arrest through release from prison.
IV. ANALYZING RACIAL DIFFERENCES IN CRIMES COMMITTED AND
ARREST RATES
Research has not been able to establish incont.rovertible evidence for or against discrimination in arrests, largely because the necessary information is not readily available. To estimate whether minorities are overarrested relative to the number of crimes they actually commit, analysts need comparable "pre-arrest" information for both whites and minorities: prevalence of crime types committed, incidence of crime or crime commission rates, and the probability of arrest. While official records provide information on the crimes for which offenders are arrested and convicted, they provide no information on how many other crimes and types of crimes these peoplG commit; and they tell nothing, of course, about the race and criminal activities of offenders who are never arrested. .
The difficulty of obtaining pre-arrest information impedes research on possible discrimination in arrests and the overrepresentation of minorities in prisons. As a National Institute of Corrections conference on racial discrimination concluded, "There appears to be little payoff in understanding the incremental contribution of each processing level to differential incarceration rates given that the major variance involves prearrest factors" (National Institute of Con"ections, 1980).
To overcome this obstacle we used data from the Rand Inmate Survey (RIS) to answer four questions about the prisoners in the sample:
• Are there racial differences in the kinds of crimes that prisoners committed before arrest?
• Are there racial differences in the range of crime types they reported committing?
• Are there racial differences in crime commission rates reported in the sample?
• Are there racial differences in the probability that a single crime will result in arrest?
The answers indicate that, at least for our sample states, there is no consistent evidence that minorities are overarrested-in relation to white offenders or to the number of crimes they actually commit.
34
FINDINGS FROM THE RAND INMATE SURVEY
Eliciting the Data
• Our purposes were to estimate separately the range of crime types committed by the racial groups, the incidence of crime or crime commission rates for individuals in those groups, and then to estimate the probability that a single crime would result in arrest for members of that group. To collect the necessary data, the RIS asked'respondents to report on the number of crimes of various types that they had committed in a specified period, and what proportion of these crimes resulted in arrest. To begin, each respondent filled in a calendar covering a one-to-two-year period preceding the arrest that led to his current imprisonment. The calendar then showed for eacr. month whether he was incarcerated, hospitalized, or on the street. From the calendar, the offender could then determine his "street months"-all questions about his criminal behavior referred constantly to his "street months." (The average for street months was 15.) He was then asked whether or not he had committed the crimes of burglary, business or personal robbery, grand theft, auto theft, forgery, fraud, drug dealing, or assault. These behaviors were described in ordinary language rather than in legal terms. After answering "yes" that he had committed a given type of crime, say, burglary, during the study period, the respondent was asked to tell how many burglaries he had committed by specifying a range, either "1 to 10" or "11 or more," If the range was "1 to 10," he was asked, "How many?" If the range was "11 or more," he was led through a sequence of questions about the number of months in which he committed burglary and his daily, weekly, or monthly rate of commission. l
From that information, we estimated the respondent's annualized crime' commission rate. The annualized rate can be interpreted as the number of crimes committed per year of free time, since it takes into account the length of time the respondent was incarcerated during his measurement period. For example, if a respondent's measurement period lasted 14 months, of which he spent five months in jail, and he committed six burglaries, his annualized crime rate would be:
Annualized crime rate (6 burglaries) x (12 months)/(l4-Sl months
72/9 = 8,0 burglaries/year
ISe!! Chaiken and Chaiken (1982) for a description uf the exact wordinJ.: of the crime· related questions and a complete explanation of the manner in which the "study period" was calculated. Peterson et al. (1982) describe the pretests that led to this choice of questionnaire format.
36
Before we present our analysis, it is important to point out the limitations of the RIS as a means of calculating crime rates and of detecting racial differences in these rates. All the men who completed our survey were in prison; the sample was chosen to represent each state's male prison population. It is not appropriate, therefore, to view these crime rates as applicable to offenders in the community. They refer only to a cohort of incoming prisoners in the states chosen for this study. Selection effects and other factors cause these rates to be substantially higher than those for "typical" 'offenders (Rolph, Chaiken, and Houchens, 1981). This is an important limitation, and must be kept in mind in interpreting the results. Our results speak only to crime rates and racial differences apparent in the crimes committed by incarcerated males in a recent period preceding their current imprisonment.
Findings
Racial Differences in Range of Crime Types. Table 4.1 presents the percentages of each racial group that reported committing a particular crime at least once during the study period.
In the sample, the rlata revealed some differences in the kinds of crime the different races committed. In general:
• More Hispanics reported committing personal crimes-both personal robberies and aggravated assault.
• More whites and Hispanics reported involvement in both drug dealing and burglary.
• Significantly more whites committed forgery, theft of credit cards, and auto thefts.
Table 4.1 also indicates that certain crimes were committed by a very large percentage of the prisoners while other crimes were less "popular." Over half (52 percent) of the respondents report committing at least one burglary in the 12 to 24 months preceding their current imprisonment; 43 percent reported dealing in drugs, and 40 percent reported some theft. However, only ahout one-fourth reported doing a robbery (either of a person or business), and less than one-fifth reported involvement in frauds or swindles.
Crime Commission Rates. The data enabled us to compute the annualized crime commission rate for each racial group; these rates are technically referred to as "lambdas."
Six years ago, virtually no information was available on individual rates of criminal activity. Estimates of average offense rates, which were based on various methods of estimation from aggregate crime
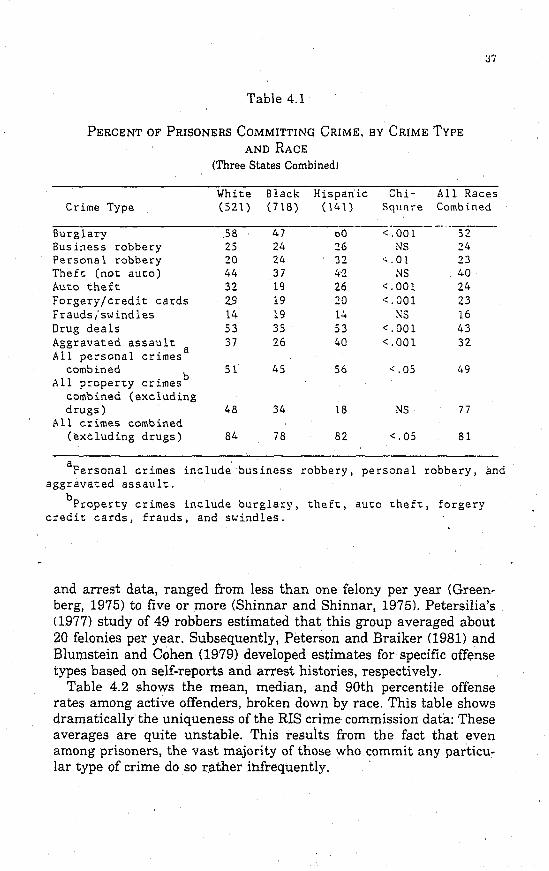
Table 4.1
PERCENT OF PRISONERS COMMITTING CRIME, BY CRIME TYPE
AND RACE
(Three States Combined)
J7
White Black Hispanic Chi- All Races Crime Type (521) (71B) (141 ) Squnre Combined
Burglary .5B 47 bO <'.~----' 52 Business robbery 25 24 26 NS 24 Personal robbery 20 24 32 <..01 23 Theft (not auto) 44 37 42 NS 40 Auto theft 32 19 26 <.001 24 Forgery/credit cards 29 19 20 <.001 23 Frauds/swindles 14 19 14 NS 16 Drug deals 53 35 53 <.001 43 Aggravated assault 37 26 40 <.001 32 All personal crimes a
combined b
51 45 56 <.05 49 All property crimes
combined (excluding drugs) 4B 34 1B NS 77
All crimes combined (excluding drugs) B4 iB B2 <.05 B1
apersonal crimes include business robbery, personal robbery, and aggravated assault.
bProperty crimes include burglary, theft, auto theft, forgery credit cards, frauds, and swindles.
and arrest data, ranged from less than one felony per year (Greenberg, 1975) to five or more (Shinnar and Shinnar, 1975), Petersilia's (1977) study of 49 robbers estimated that this group averaged about 20 felonies per year. Subsequently, Peterson and Braiker (1981) and Blumstein and Cohen (1979) developed estimates for specific offense types based on self-reports and arrest histories, respectively.
Table 4.2 shows the mean, median, and 90th percentile offense rates among active offenders, broken down by race. This table shows dramatically the uniqueness of the RIS crime commission data: These averages are quite unstable. This results from the fact that even among prisoners, the vast majority of those who commit any particu~ lar type of crime do so rather infrequently. .
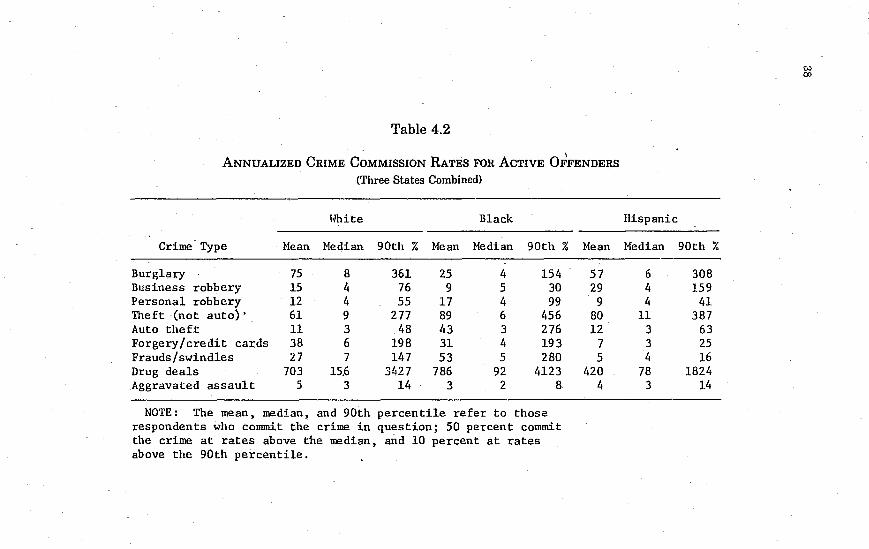
Table 4.2
ANNUALIZED CRIME COMMISSION RATES FOR ACTIVE OFFENDERS
(Three States Combined)
Iolhite Black
Crime Type Mean Median 90th % Mean Median 90th % Mean
Burglary 75 8 361 25 4 154 57 Business robbery 15 4 76 9 5 30 29 Personal robbery 12 4 55 17 4 99 9 Theft (not auto)' 61 9 277 89 6 456 80 Auto theft 11 3 48 43 3 276 12 Forgery/credit cards 38 6 198 31 4 193 7 Frauds/swindles 27 7 147 53 5 280 5 Drug deals 703 15.6 3427 786 92 4123 420 Aggravated assault 5 3 14 3 2 8 4
NOTE: The mean, median, and 90th percentile refer to those respondents who commit the crime in question; 50 percent commit the crime at rates above the median, and 10 percent at rates above the 90th percentile.
Hispanic
Median
6 4 4
11 3 3 4
78 3
90th %
308 159
41 387
63 25 16
1824 14
'" co
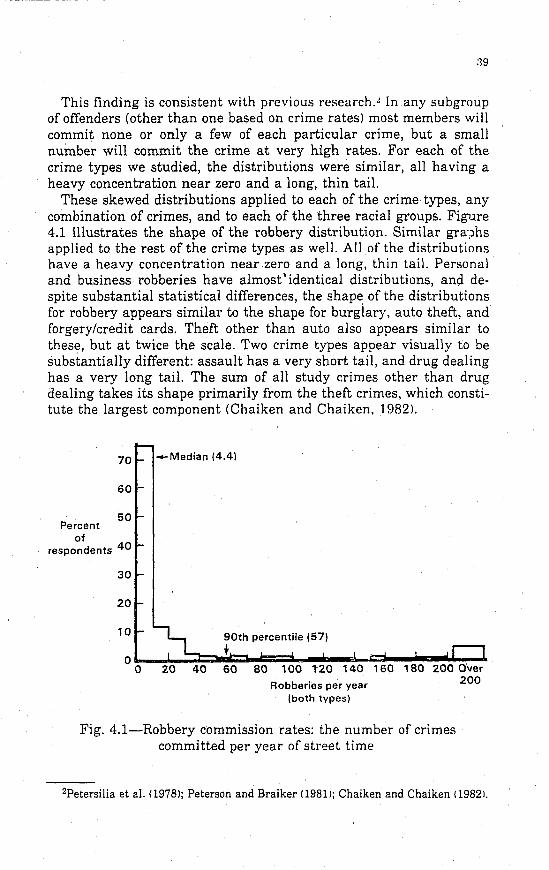
This finding is consistent with previous research.~ In any subgroup of offenders (other than one based on crime rates) most members will commit none or only a few of each particular crime, but a small number will commit the crime at very high rates. For each of the crime types we studied, the distributions were similar, all having a heavy concentration near zero and a long, thin tail.
These skewed distributions applied to each of the crime types, any combination of crimes, and to each of the three racial groups. Figure 4.1 illustrates the shape of the robbery distribution. Similar gra',)hs applied to the rest of the crime types as well. All of the distributions have a heavy concentration near zero and a long, thin tail. Personal and business robberies have almost \ identical distributions, and despite substantial statistical differences, the shape of the distributions for robbery appears similar to the shape for burglary, auto theft, and forgery/credit cards. Theft other than auto also appears similar to these, but at twice the scale. Two crime types appear visually to be substantially different: assault has a very short tail, and drug dealing has a very long tail. The sum of all study crimes other than drug dealing takes its shape primarily from the theft crimes, which constitute the largest component (Chaiken and Chaiken, 1982).
70 -Median (4.4)
60
50 Percent
of respondents 40
30
20
10 90th percentile (57)
+ o~~-=~~=-~~~~~~~~~~~ o 60 80 100 1"20 140 160
Robberies per year (both types)
Fig. 4.1-Robbery commission rates: the number of crimes committed per year of street time
2Petersilia et al. Cl978); Peterson and Braiker (1981); Chaiken and Chaiken (19821.
40
The extreme skewness of the distributions presents particular problems for standard statistics. In characterizing these distributions, the median is a poor. descriptor because its magnitude gives little hint of the crime commission rates of the most active offenders. The mean, too, is a poor descriptor because it is unduly sensitive to the values of a few outlier crime commission rates f04 the respondents who reported extremely high rates.' Excluding these high values as outliers in the analysis is not satisfactory because the people with high crime-commission propensities are the. very offenders who warrant the greatest policy interest. And the 90th percentile represents the rates of only the most serious offenders.3
Our concerns about response validity and the difficulties created by these skewed distributions caused us to treat the offense rates as categories rather than continuous variables. We believe that the offense rate data are useful in providing information about the general level of criminal activity. However, we are uncertain whether the respondents who reported committing 10 Or 20 robberies actually committed that exact number. However, respondents who reported 10 or 20 robberies probably ,did commit appreciably more robberies than those who reported one or two (assuming that both are attempting to provide accurate information). This reasoning suggested to us that the offense rate information should be used only to distinguish among . several levels of offense rates, i.e., low, medium, or high.
We thus grouped the crime commission rates into four categories: 1-3, 4-10, 11-20, and 21 +. Table 4.3 presents the percent of each racial group who reported committing that number of crimes per year of his street time. The data are presented for each crime type separately, for all personal and property crimes, and for all crimes (except drug sales) combined. We then used a chi-square test to determine whether there were significant racial differences using these grouped categories.
We found few consistent, statistically signIficant, differences in crime commission rates allOl'lg the racial groups. However, there were racial differences in rates for two particular crimes:
• Blacks reported committing fewer burglaries. • Hispanics reported fewer frauds and swindles. • Black and white offenders reported almost identical rates of
robberies, grand larcenies, and auto thefts. • Black and white offenders committed a greater number of
drug deals than Hispanics, although these differences were not statistically significant.
3See Rolph, Chaiken, and Houchens (1981) for a complete discussion of the statistical problems resulting from these unique distributions.
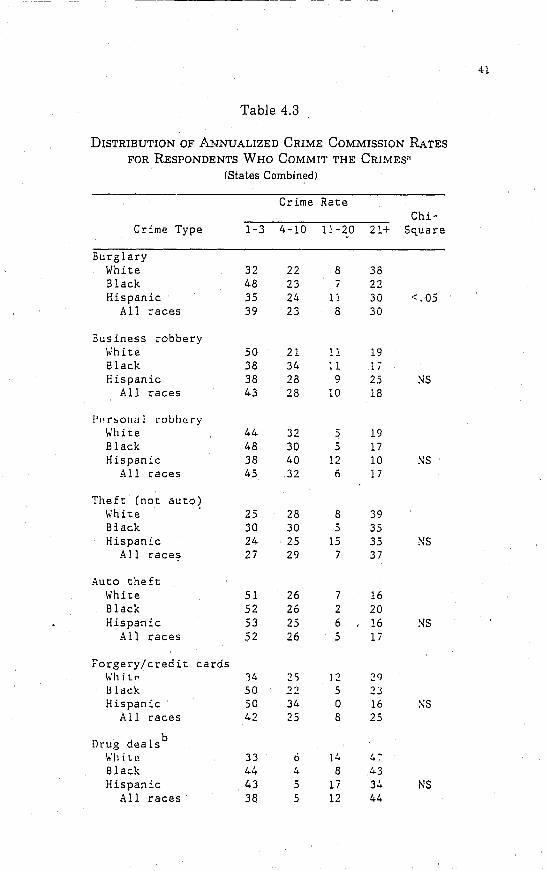
----------
41
Table 4.3
DISTRIBUTION OF ANNUALIZED CRIME COMMISSION RATES
FOR RESPONDENTS WHO COMMIT THE CRIMES"
(States Combined)
Crime Rate Chi-
Crime Type 1-3 4-10 11-20 21+ Square -Burglary
White 32 22 8 38 Black 48 23 7 22 Hispanic 35 24 11 30 <.05
All races 39 23 8 30
3usiness robbery \;~hi te 50 21 11 19 Black 38 34 11 17 Hispanic 38 28 9 25 NS
All races 43 28 10 18
I'l'r!>olld I roubC!ry white 44 32 5 19 Black 48 30 5 17 Hispanic 38 40 12 10 :-;S
All races 45 32 6 17
Theft (not auto~ White 25 28 8 39 Biack 30 30 5 35 Hispanic 24 25 15 35 NS
All race~ 27 29 7 37
Auto theft white 51 26 7 16 Black 52 26 2 20 Hispanic 53 25 6 16 !'IS
All races 52 26 5 17
Forgery/credit cards Wh i lC' 34 2'> J 2 2CJ Black 50 22 5 2j Hispanic 50 34 0 16 :\S
All races 42 .,-~::> 8 25
Drug deals b
\,11 i tll 33 6 14 ' -.. ,
Black 44 4 8 43 Hispanic 43 5 17 34 NS
All races 38 5 12 44
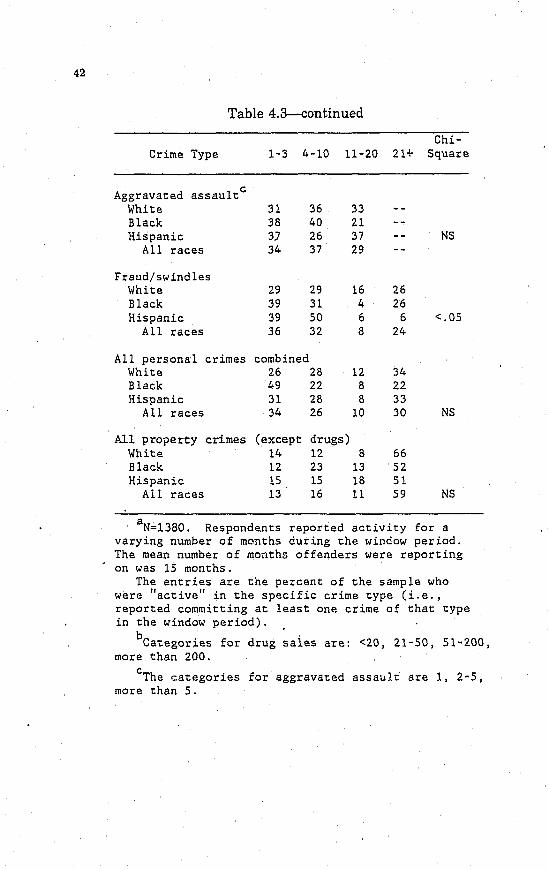
42
Table 4.3-continued
Chi-Crime Type 1-3 4-10 11-20 21+ Square
Aggravated assault C
White 31 36 33 Black 38 40 21 Hispanic 3J 26 37 NS
All races 34 37 29
Fraud/swindles White 29 29 16 26 Black 39 31 4 26 Hispanic 39 SO 6 6 <.05
All races 36 32 8 24
All personal crimes combined White 26 28 12 34 Black 49 22 8 22 Hispanic 31 28 8 33
All races 34 26 10 30 NS
All property crimes (except drugs) White 14 12 8 66 Black 12 23 13 52 Hispanic 15 IS 18 51
All races 13 16 11 59 NS
aN=1380. Respondents reported activity for a varying number of months during the window period. The mean number of months offenders were reporting on was 15 months.
The entries are the percent of the sample who were "active" in the specific crime type (i.e., reported committing at least one crime of that type in the window period).
bCategories for drug sales are: <20, 21-50, 51-200, more than 200.
cThe c.ategories for aggravated assault are 1, 2-5, more than 5.
43
That last finding permits a precise illustration of the difference between range of criminality and incidence of crime. The findings on range indicate that more Hispanics t.han blacks report.ed being involved in at least one drug deal. However, the annualized crime rates, which represent incidence, indicate that. once involved in drug dealing, blacks did more of it than Hispanics did.
In combining all the personal crimes or all the property crimes, we found no statistically significant differences among the races. However, when all the crimes (except drug dealing) were combined, we found that white respondents reported committing crimes at the highest rates, followed by blacks, and then Hispanics. This result appears to reflect the fact that whites reported committing a greater number of property crimes. Consequently, even though these differences were not statistically significant within the property crime category, when the property and personal crimes were combined, whites had higher rates primarily because of their greater involvement in burglary, forgery, and fraud.
After closely examining the data in a number of different waysmeans, medians, 90th percentiles, etc.-we found no strong evidence of any consistent, significant racial differences in crime commission rates. That is, once an offender became involved in a particular crime type, the rate at which he committed that crime while on the street was quite similar among the races.
PROBABILI'l'Y OF ARREST
Although these findings establish that the incidence of crime, once the person is involved, does not differ appreciably among the races, they still do not negate the possibility that the police overarrest minorities. It has been suggested that even if minorities commit about the same number of crimes as whites, they are more likely to be arrested.
Research on this issue has discovered some evidence that race affects the probability of arrest. In a study that is consistent with our OBTS findings, Hepburn (1976) concluded that "nonwhites are more likely than whites to be arrested under circumstances that will not constitute sufficient grounds for prosecution." Other studies have found that the decision to arrest appears to depend partly on nonlegal variables such as the suspect's attitude, race, and demeanor (Piliavin and Briar, 1964), Arrest has also been found to depend on the complainant's attitude (Black, 1970). Black complainants are more likely than white to want suspects arrested, and because crimes were gener-
44
ally intraracial, this can operate to the disadvantage of black suspects (Collins, 1977). Finally, Forslund (1969) found that blacks were charged with more offenses per arrest than whites.
It is difficult to estimate the probability of arrest for different subgroups of the population. An arrest probability is calculated by dividing the number of crimes of a particular type that an offender committed by the number of times he was arrested over the same period for that crime. As we have seen, that kind of information is difficult to come by. Consequently, very few attempts have been made to calculate arrest probabilities and compare them among racial groups.
In Petersilia et al. (1978) and Peterson and Braiker (1981), arrest probabilities were derived from prisoner self-reports.4 The sample in the Peterson and Braiker study was large enough to explore racial differences. They found that "There was some evidence to suggest that whites commit more crimes, and that white offenders have consistently lower probabilities of arrest than do either blacks or Mexican-Americans. This is particularly striking for armed robbery and burglary. Minority offenders are two or three times more likely to be arrested for an armed robbery or burglary than are whites." (Peterson and Braiker, 1981, p. 62.)
Research has repeatedly shown that criminals face a rather low chance of being arrested. Blumstein and Cohen (1979) estimated the probability of arrest for robbery tv be 0.07; for assault, 0.11; and for burglary, 0.05. Peterson and Braiker's (1981) estimates were in reasonable accord with these; they found further that the probability of arrest for forgery was 0.06, and for drug sales j 0.002. Previous drugcrime research has estimated the likelihood of arrest, given the commission of an offense, at less than one percent CInciardi and Chambers, 1972; Collins et al., 1982).
The arrest probabilities calculated from our Inmate Survey were ultimately quite consistent with previous research.5 Table 4.4 lists the average probabilities of arrest by race. .
4It is not absolutely necessary to have self-reports from offenders; an alternative is to "model" the arrest process by using information on the number of crimes reported and the number of offenders arrested. This approach is used by Blumstein and Cohen (1979). Both self-reports and the modeling approach undoubtedly involve errors, due, respectively, to self-report biases and assumptions about the arrest process. Nevertheless, the Blumstein and Cohen results are strikingly similar to those derived using offender self-reports.
51n our survey, each inmate who reported committing a crime (during the window period) was asked whether any of his crimes (specified by crime type) resulted in arrest. He was also asked to specify the number of arrests that occurred. For example, persons who reported robbing a business during the window period were then asked, "How many of these robberies were you arrested for? (Include all of the times you were arrested for robbing a business even if you were charged with something else.)"
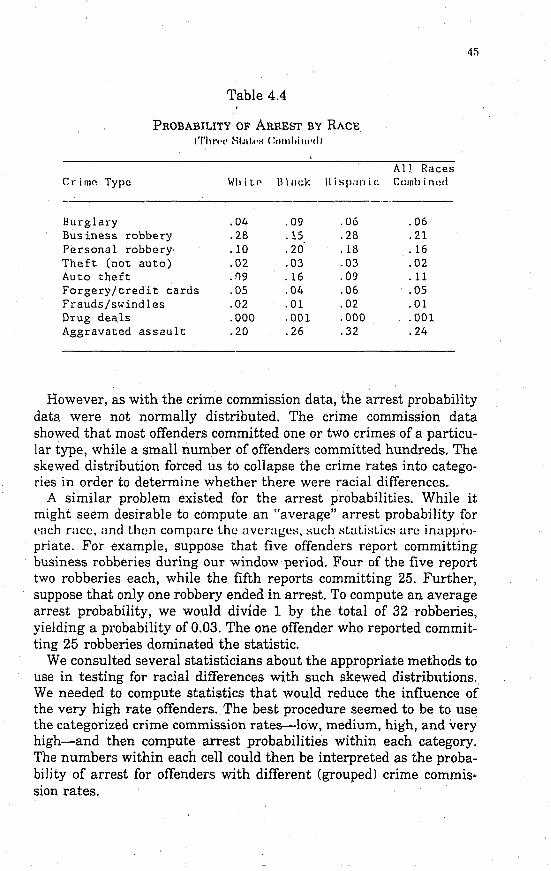
Table 4.4
PROBABILITY OF ARREST BY RACE ('I'hn'(' Sl.nl.('s COlllhilll·dl
All Races Crime Type WhiLP 1l1ilGk llispilrlic Cumbinud
Burglary .04 .09 .06 .06 Business robbery .28 .15 .28 .21 Personal robbery .10 .20 .18 .16 Theft (not auto) .02 .03 .03 .02 Auto theft .()9 .16 .09 .11 Forgery/credit cards .05 .04 .06 .05 Frauds/swindles .02 .01 .02 .01 Drug deals .000 .001 .000 .001 Aggravated assault .20 .26 .32 .24
However, as with the crime commission data, the arrest probability data were not normally distributed. The crime commission data showed that most offenders committed one or two crimes of a particular type, while a small number of offenders committed hundreds. The skewed distribution forced us to collapse the crime rates into categories in order to determine whether there were racial differences.
A similar problem existed for the arrest probabilities. While it might seem desirable to compute an "average" arrest probability for l':Ich race, and then compare the averages, such statistics are inappropriate. For example, suppose that five offenders report committing business robberies during our window period. Four of the five report two robberies each, while the fifth reports committing 25. Further, suppose that only one robbery ended in arrest. To compute an average arrest probability, we would divide 1 by the total of 32 robberies, yielding a probability of 0.03. The one offender who reported committing 25 robberies dominated the statistic.
We consulted several statisticians about the appropriate methods to use in testing for racial differences with such skewed distributions. We needed to compute statistics that would reduce the influence of the very high rate offenders. The best procedure seemed to be to use the categorized crime commission rates-lo'w, medium, high, and very high-and then compute arrest probabilities within each category. The numbers within each cell could then be interpreted as the probability of arrest for offenders with different (grouped) crime commission rates.
46
Table 4.5 presents the results, which illustrate the uniqueness of the arrest probability data. For most of the crime types, the probability of arrest is much higher for persons who committed only a few crimes, and decreases as the number of crimes increases.
Overall, we found no strong evidence of consistent racial differences in the probability of being arrested for any of the crimes we studied. In a few selected instances, there were statistically significant differ-. enees. For example, in personal robberies the data show that minority offenders falling in either the 4-10 or 11-20 crime commission category had a 10 to 20 percent higher chance of being arrested. Whites who committed frauds at a rate of 4 to 10 or 11 to 20 had about a 10 percent higher chance of being arrested than 'blacks or Hispanics. In combining all of the personal crimes, or all of the property crimes, we find few significant racial differences.
In general, in looking at any of the four crime commission categories or any of the eleven crime types, the probability of arrest does not differ by more than 10 percentage points among the races. If there were real racial differences in arrest probabilities, we would expect to see larger differences, and in a consistent direction (whites consistently lower than blacks or Hispanics). Our data, however, are not this obvious. The rates for the three races are quite similar, overall, within tp~ specific crime categories. When differences do result, the lower rates occur sometimes for whites, sometimes for blacks, and sometimes for Hispanics. From this data, we then conclude that there are no apparent racial differences in the probability of suffering an arrest, given that an offender committed one of our studied offenses.
CONCLUSIONS
The RIS data suggest that, relative to the prevalence and incidence of crime among white and minority offenders, the police do not generally overarrest minorities. There are some racial differences in the types of crimes committed, and some crimes for which each racial group seems to have a higher probability of arrest. However, these differences are not consistent-or, at least, not consistently, statistically, significant. This leads us to conclude that the high release rate for black and Hispanic suspects in the OBTS data has some other explanation than discrimination at the point of arrest. We discuss the possibilities in the final section of the report.
Although the RIS data offer no firm explanation for the high release rate, they counter the suspicion of discrim.ination in arrest rates, at least for the study states. In the next section, we examine them for evidence of racial differences in treatment at the corrections level.
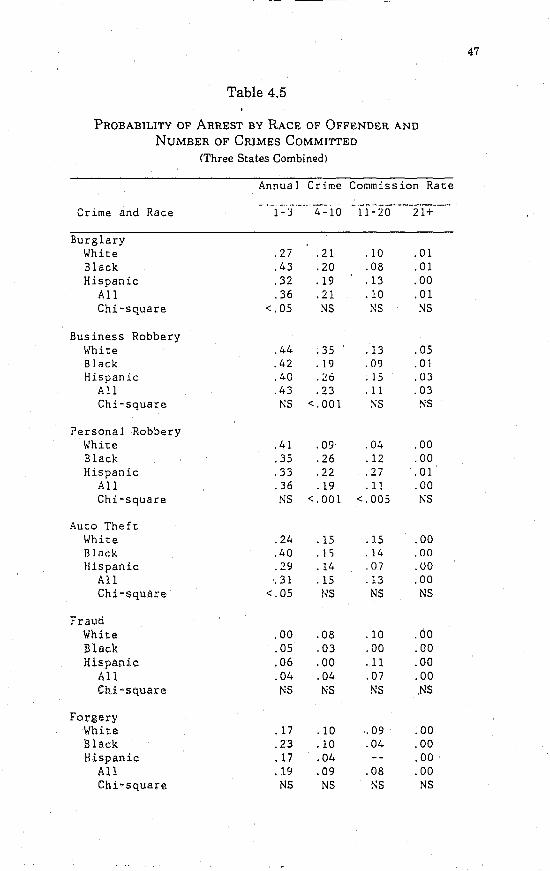
47
Table 4.5
PROBABILITY OF ARREST BY RACE OF OFFENDER AND
NUMBER OF CRIMES COMMITTED
(Three States Combined)
Annual Crime Commission Rate -.- .--~-.- ----.---.-----
Crime and Race 1-:; 4-10 11-20 21+
Burglary White .27 .21 .10 .01 Black .43 .20 .08 .01 Hispanic .32 .19 .13 .00
All .36 .21 .10 .01 Chi-square <.05 NS NS NS
Business Robbery White .44 .35 .13 .05 Black .42 .19 .09 .01 Hispanic .40 .26 .15 .03
All .43 .23 . 11 .03 Chi-square NS <.001 :-:S NS
Personal Robbery White .41 .09 .04 .00 Black .35 .26 .12 .00 Hispanic .33 .22 .27 .01
All .36 .19 .11 .00 Chi-square NS <.001 <.005 NS
Auto Theft Whit:e .24 .15 .15 .00 HIi1ck .40 .1') .14 .00 Hispanic .29 .14 .07 .00
All .31 .15 .13 .00 Chi-square <.05 NS NS NS
Fraud White .00 .08 .10 .00 Black .05 .03 .00 .00 Hispanic .06 .00 .11 .00
All .04 .04 .07 .00 Chi~square NS NS !'is NS
For~ery White .17 .10 .09 .00 Black .23 .10 .04 .00 Hispanic .17 .04 .00
All .19 .09 .08 .00 Chi-square NS NS :\S NS
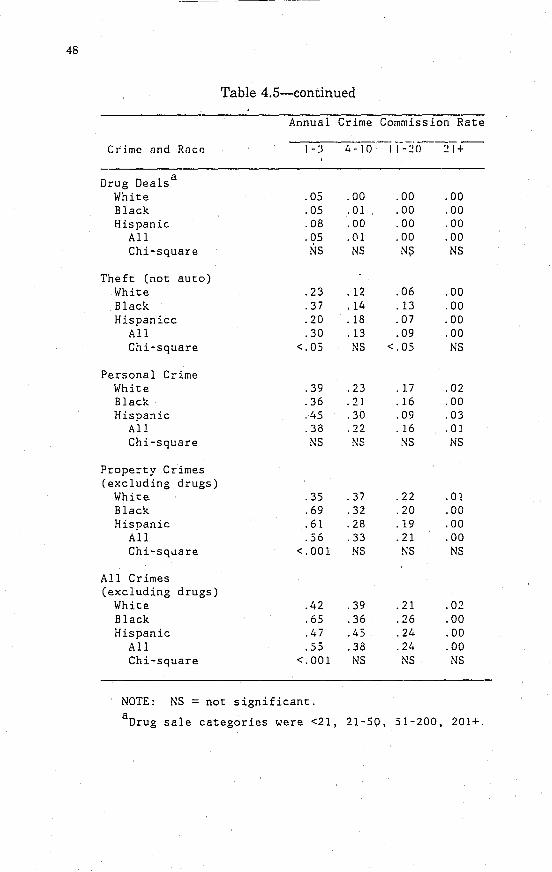
48
C I"i me and Race
Drug Deals a
White Black Hispanic
All Chi-square
Theft: (not auto) White Black Hispanicc
All Chi-square
Personal Crime White Black Hispanic
All Chi-square
Property Crimes (excluding drugs)
Whit:e Black Hispanic
All Chi-square
All Crimes (excluding drugs)
White Black Hispanic
All Chi-square
Table 4.5-continued
Annual Crime Commission Rate ______ • ____ 0 _____ _
1-:) 4-10 11-:!O
.05 .00 000
.05 .01 .00
.08 .00 .00
.05 .01 .00 NS NS N~
.23 .12 .06
.37 .14 .13
.20 .18 .07
.30 .13 .09 <.05 NS <.05
.39 .23 .17
.36 .21 .16
.45 .30 .09
.38 .22 .16 NS NS NS
.35 .37 .22
.69 .32 .20
.61 .28 .19
.56 .33 .21 <.001 NS NS
.42 .39 .21
.65 .36 .26
.47 .45 .24
.55 .38 .24 <.001 NS NS
:!l+
.00
.00
.00
.00 NS
.00
.00
.00
.00 NS
.02
.00
.03
.01 NS
.01
.00
.00
.00 NS
.02
.00
.00
.00 NS
NOTE: NS = not significant. a Drug sale categories were <21, 21-50, 51-200, 201+.
v. RACIAL DIFFERENCES IN CORRECTIONS' AND TIME SERVED
From arrest to sentencing, the system duly records most major decisions involving offenders. Consequent.ly, it is rather easy to see racial differences in handling-even if it is still difficult to tell whether those differences signify discrimination. However, once a person is sentenced to prison, he is potentially subject to many decisions that are not systematically, if ever, recorded. Prison guards and staff make decisions that strongly influence the quality of ·an offender's time in prison, and parole boards and other corrections officials decide how long that time lasts. The possibility of discrimination enters into all these decisions, but the length of time served is the only one certain to be recorded. In other words, corrections is a closed world in which discrimination could flourish.
That charge has frequently been brought against the system. In a recent report, the National Minority Advisory Council (1980) concluded that corrections discriminates against minorities in awarding good-time credits, allocating treatment and work programs, punishing infractions, and granting parole. Even if we put aside the questions of justice and equity raised by that charge, the steady increase·of racial problems in prison makes it imperative to examine the treatment that different races receive in prison and at parole.
Using data from official records, where available, and the RlS, we analyzed the in-prison treatment and length of sentence served for our study sample. We found some racial differences for participation in work and treatment programs, but they were largely determined by the prisoners, not by guards or staff. If prisoners needed and wanted to participate in programs, they generally could, regardless of race; and the rate of participation for major programs was not significantly biased racially.
However, it was evident that although minorities received equal treatment in prison, they did not when it came time for release. Controlling for factors that could affect the release decision (including participation in prison programs and prison violence), we found consistent evin!3nce that race made a difference. In Texas, all other things held equa.l, IDlacks and Hispanics consistently served longer sentences than whites for the same crimes. In California, minority inmates also served longer sentences, but that was largely determined by the length of sentence originally imposed. Michigan manifested an interesting reversal. Although blacks received longer court-imposed sen-
49
flO
tences than whites, they wound up serving about the same time. In Michigan, then, parQle decisions seemed to "favor" blacks-that is, blacks evidently served less of their original sentences than whites did.
PARTICIPATION IN PRISON PROGRAMS
The Research Background
There is little research on the breadth of treatment programs employed in prison and the racial or other characteristics of prisoners who participate. Reanalyzing data from 1974 Survey of Inmates in State Correctional Facilities, Petersilia determined that, nationwide, 22 percent of the inmates needed treatment for alcohol rehabilitation, 23 percent needed drug rehabilitation, 31 percent needed job training, and 68 percent needed further education. The study also determined that about one in five inmates with a serious need participated in a corresponding treatment program while in prison and that, nationwide, 40 percent of inmates participated in some treatment program while in prison (Petersilia, 1980).
The study also found some racial differences in treatment: Whites and nonblack minorities were more likely to receive needed alcohol treatment, but less likely to receive needed drug treatment. Twentytwo percent of the whites with serious alcohol problems received treatment but only 12 percent of the blacks. Black inmates, however, participated in drug programs more often than either whites or other minorities. With respect to job training and education programs, the "other" minority group-primarily Hispanics-had a much lower participation rate (Petersilia, 1980, p. 130).
To identify possible discrimination in treatment, one must look at some complex interrelationships, as well as data on who participates and why. To analyze these relationships, we addressed the following questions:
• What proportion of prison inmates need treatment in education, vocational training, alcohol rehabilitation, and drug rehabilitation? Are there racial differences in need?
• What proportion of inmates who need treatment participate in the appropriate treatment program? Are there racial differences in the proportion receiving needed treatment?
• When minorities fail to participate in needed programs, do their reasons differ from those of other inmates (e.g., staff discouraged participation)?
51
• How do the inmates of different races assess the effects of the programs they participated in?
• Do fewer minority inmates hold prison jobs? • Are there racial differences in work experiences, evaluations
of work, and reasons for not working?
The data necessary to answer these questions were provided by the inmate survey and information from official corrections files. Our "need" categories were determined in part from information recorded during the inmate's intake evaluation. Thus, all results in this section are based on those inmates whose surveys could be matched with their official records ("Survey Plus Official Records" sample equals 1214 persons).! .
A word of caution in interpreting our results: Our sample was selected to include people at random points in their current terms, not interviewed at the end of their prison terms. If inmates received treatme71t only toward the end of their terms, one would expect the program participation rates to increase as proportion of sentence served increased. In this case, sampling offenders at random points in their term would underestimate the percentage of the population who eventually became involved in programs. However, prior research indicates that programs are generally available to all inmates who wish to participate, regardless of sentence length or time served. Only in vocational training programs do participation rates increase slightly as the inmate nears the end of his sentence (Petersilia, 1980). Analysis of the RIS showed no association between the number of months an inmate had been in prison and his participation rate in either prison treatment or work programs. We therefore did not control for months served in the subsequent analysis.
Treatment Emphasis in Different States
The answers to our research questions must be viewed from the wider perspective of each state's overall inmate participation and main treatment type. Inmate participation in programs and work assignments varied across states:
• In Michigan, 80 percent of the inmates were in a major treatment program, an additional 5 percent in other prison programs, 5 percent in work assignments only, and 10 percent were idle. 2
lSee Petersilia and Honig (1980) for the specific questions asked in the survey. 2Major programs are education, vocational training, and alcohol and drug rehabili-
52
• In Texas, 66 percent were in a major program, 11 percent in other programs, 11 percent in work assignments only, and 12 percent were idle.
• In California, 64 percent were in a major treatment program, 14 percent in other minor prison programs, 13 percent had work assignments only, and 9 percent were idle.
e Basic adult education and vocational training are the main treatment program types in each of these states. Participation in alcohol rehabilitation programs varied from 11 to 20 percent of the inmates surveyed.
at Only in Michigan did a nontrivial proportion, 28 percent, of the inmates participate in a drug rehabilitation program.3
Needs Vs. Participation in Programs
Although a prisoner may need treatment of a certain type, he may not necessarily get to participate in the appropriate program. As we saw, some critics have charged that the system discriminates against minorities in allocating work and treatment assignments. One way of assessing that charge is to compare the proportions of different racial groups who need treatment with those who participate, and then to compare the participation rates of racial groups.
Criteria of Need. For prison staff, establishing an inmate's need for treatment involves complex, somewhat subjective considerations. However, our purposes required fairly simple, objective criteria, which we based on data available from the official records and the RIS. Our criteria for "high need" were:
Education: less than 9th-grade education, as shown by the official corrections record; or reading level at or below 9th grade.
Vocational training: no employment and no other legitimate activity (e.g., school attendance, military) during the "window" period (up to two years of street time) preceding the current term of imprisonment, as shown by Inmate Survey self-report.
Alcohol rehabilitation: self-report of serious drinking problems during the window period.
tation. Other programs are psychological counseling, self-help groups, horne visitations, etc. By idle, we mean that inmates were in neither work nor treatment programs.
3For a more complete discussion of these state differences, see Petersilia and Honig 11980).
53
Drug rehabilitation: self-report of daily use of' hard drugs (i.e., heroin, barbiturates, amphetamines) during the window period.
Need Compared with Participation for All Inmates. Once each inmate was classified as to his degree of need for a particular form of treatment, we were able to determine how many inmates with a high need for treatment actually participated in a corresponding treatment program. Figure 5.1 shows the percentage in each state classified as having a high need, and the percentage of those with a high need who participated in appropriate treatment prior to the survey.
In all three states, need and participation. were most closely matched for education. In Michigan, 71 percent of those with a high need for education had participated in an education program prior to the survey: in Texas, 59 percent; and in California, 45 percent.
In other programs, the match between high need and participation is progressively poorer. For vocational programs, only about 30 percent of the high-need inmates participat.ed, prior to the Hurvey, in all three states. Participation for alcohol also had a lower match with need: In all three states, about 30 percent of the population was classified as having a high need for treatment, but in Michigan only 37 percent of these participated; in Texas, 35 percent; and in California, 19 percent. In drug rehabilitation, there is even less correspondence between need and treatment received. In California and Texas, only about 5 percent of those with high need participated in a drug treatment program. Only in Michigan does there appear to be a serious attempt to involve inmates in drug programs: 55 percent of the highneed inmates participated.
Racial Differences in Treatment Need and Program Participation
Because of the sizable state differences in the participation rates, we were forced to analyze racial differences in each state separately. Michigan inmates participated more frequently in programs than inmates in the other states, and over half of the Michigan sample was black. If we combined all the states' results, we might find that blacks participate more frequently :n all program typeH. We could then erroneously conclude that whites and Hispanics were being denied treatment, when in fact the result was reflecting state, aH opposed to racial, differences.
An inmate's race and age have been repeatedly suggested by prison administrators as the factors most likely to affect the "match" be-
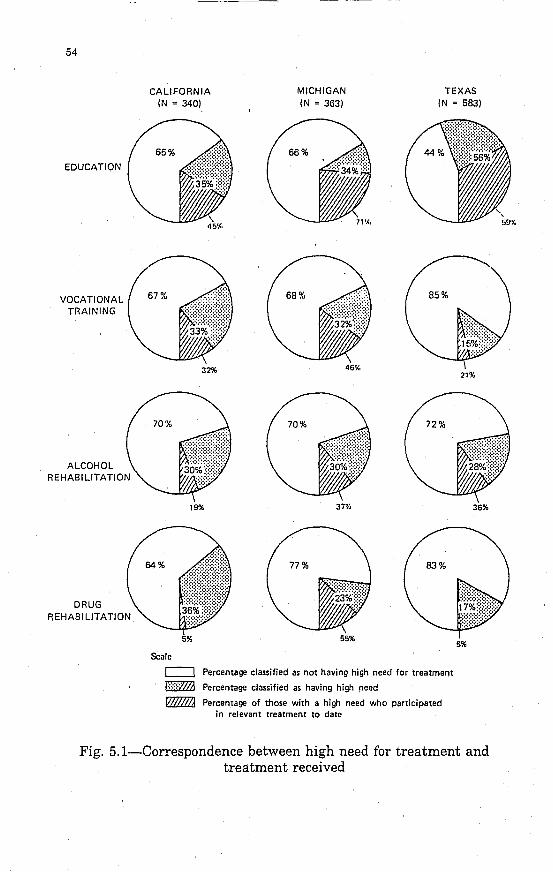
54
EDUCATION
VOCATIONAL TRAINING
ALCOHOL REHABILITATION
DRUG REHABILITATION
CALIFORNIA IN = 340)
MICHIGAN IN = 363)
TEXAS IN = 583)
32% 46%
19% 37%
77%
55%
Scale
c:J Percentage classified as not having high need for treatment
/::·::::zI/II Percentage classified as having high need
flZllllZJ Percentage of those with a high need who participated in relevant treatment to date
21%
36%
5%
Fig. 5.1-Correspondence between high need for treatment and treatment received
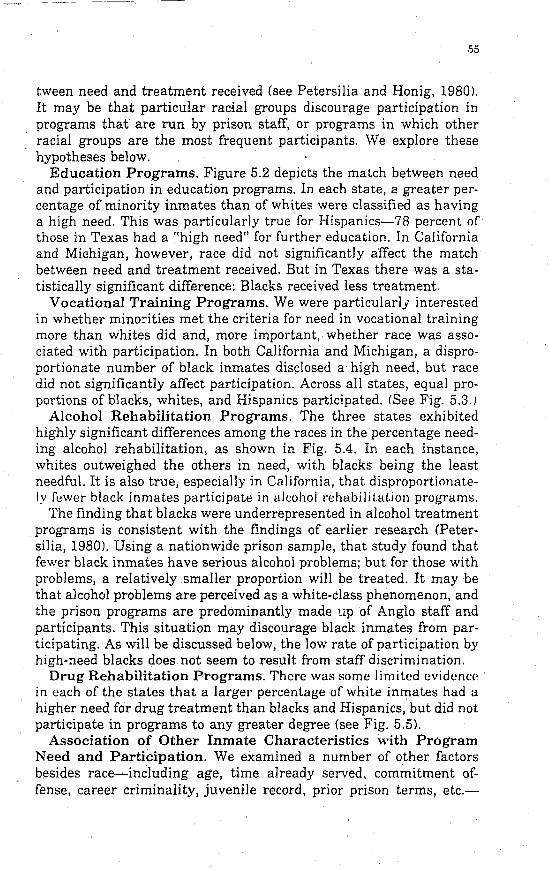
55
tween need and treatment received (see Petersilia and Honig, 1980)' It may be that particular radal groups discourage participation in programs that are run by prison staff, or programs in which other racial groups are the most frequent participants. We explore these hypotheses below.
Education Programs. Figure 5.2 depicts the match between need and participation in education programs. In each state, a greater percentage of minority inmates than of whites were classified as having a high need. This was particularly true for Hispanics-78 percent of those in Texas had a "high need" for further education. In California and Michigan, however, race did not significantly affect the match between need and treatment received. But in Texas there was a statistically significant difference: Blacks received less treatment.
Vocational Training Programs. We were particularlj interested in whether minodties met the criteria for need in vocational training more than whites did and, more important, whether race was associated with participation. In both California and Michigan, a disproportionate number of black inmates disclosed a high need, but race did not significantly affect participation. Across all states, equal proportions of blacks, whites, and Hispanics participated. (See Fig. 5.3.)
Alcohol Rehabilitation Programs. The three states exhibited highly significant differences among the races in the percentage needing alcohol rehabilitation, as shown in Fig. 5.4. In each instance, whites outweighed the others in need, with blacks being the least needful. It is also true, especially in California, that disproportionately fewer black inmates participate in alcohol rehabilitation programl:i.
The finding that blacks were underrepresented in alcohol treatment programs is consistent with the findings of earlier research (Petersilia, 1980). Using a nationwide prison sample, that study found that fewer black inmates have serious alcohol problems; but for those with problems, a relatively smaller proportion will be treated. It may be that alcohol problems are perceived as a white-class phenomenon, and the prison programs are predominantly made up of Anglo staff and participants. This situation may discourage black inmates from participating. As will be discussed below, the low rate of participation by high-need blacks does not seem to result from staff discrimination.
Drug Rehabilitation Programs. There was some limited evidence in each of the states that a larger percentage of white inmates had a higher need for drug treatment than blacks and Hispanics, but did not participate in programs to any greater degree (see Fig. 5.5).
Association of Other Inmate Characteristics with Program Need and Participation. We examined a number of other factors besides race-including age, time already served, commitment offense, career criminality, juvenile record, prior prison terms, etc.-
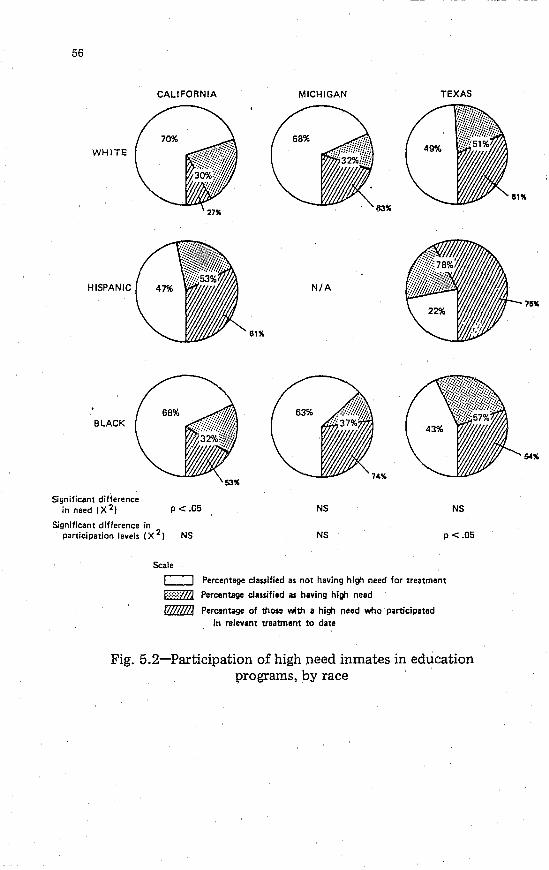
56
CALIFORNIA MICHIGAN TEXAS
WHlTE
HISPANIC N/A
6t%
BLACK
Significant difference in need (X 2) P < .05 NS NS
Significant difference in participation levels (X 2) NS NS p < .05
Scale
c:::::J Percentage classified as not having high need for treatment
(::::::::@ Percentage classified as having high need
f'Z2Zlll2J Percentage of !hoss with a high neod who participGted in relevant ueatment to date
Fig. 5.2-Participation of high need inmates in education programs, by race
111"
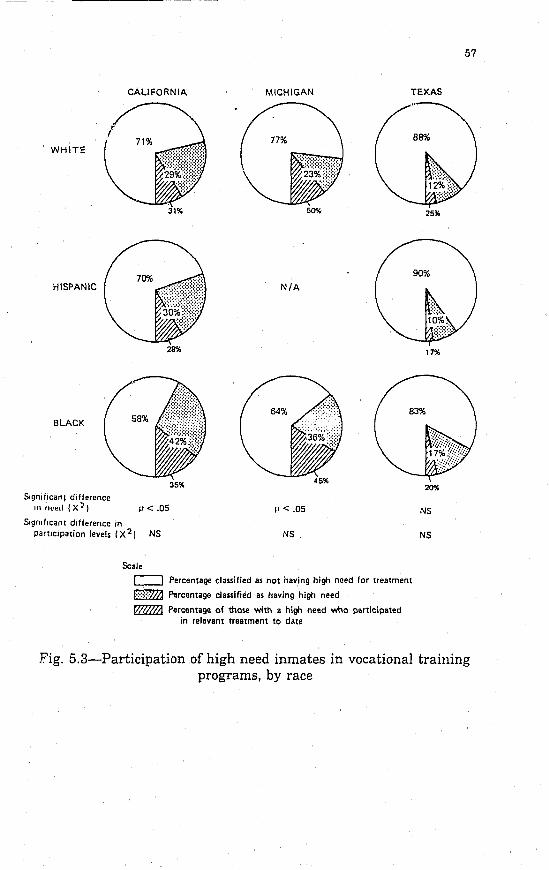
CAliFORNIA MICHIGAN TEX.AS
WHITE
50%
HISPANIC N/A
28%
BLACK
35%
Slgnifican! ditterence III I",.d (X ') p < .05 p < .05
SIgnificant difference in participation levels 'X 2) NS NS
Scale
C:J Percentage classified as not having high need for treatment
I::;:;:;:MJ Percentage classified as having high need
~ Percentage of those with a high need who participated in relevant Treatment to date
25~
17%
NS
NS
57
Fig. 5.3-Participation of high need inmates in vocational training programs, by race
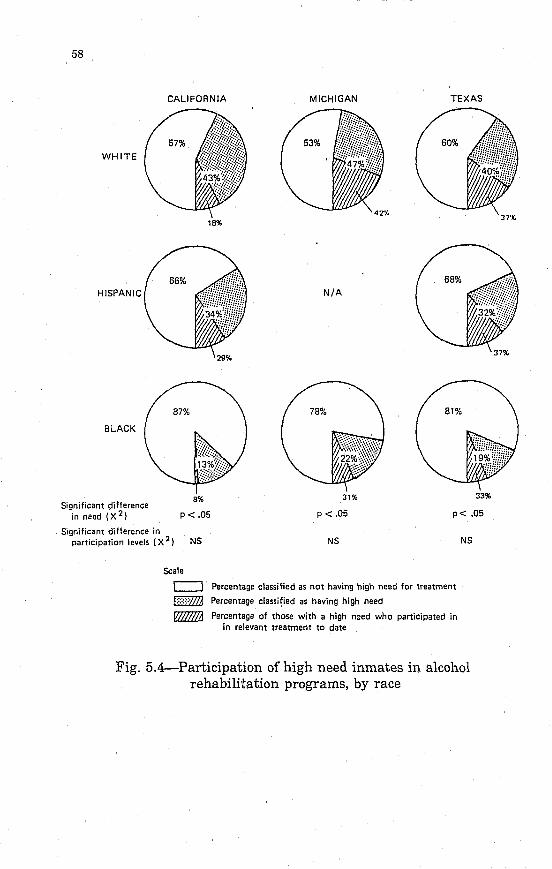
58
CALIFORNIA MICHIGAN TEXAS
WHITE
HISPANIC N/A
BLACK
8% 31% 33% Significant difference
in need (X 2) P < .05 P < .05 p< .05
Significant difference in participation levels (X 2) NS NS
Scale
c:::J Percentage classified as not having high need for treatment
E:::::::;y741 Percentage classified as having high need
!?lLZ!lill Percentage of those with a high need who participated in in relevant treatment to date
NS
Fig. 5.4-Participation of high need inmates in alcohol rehabilit'3.tion programs, by race
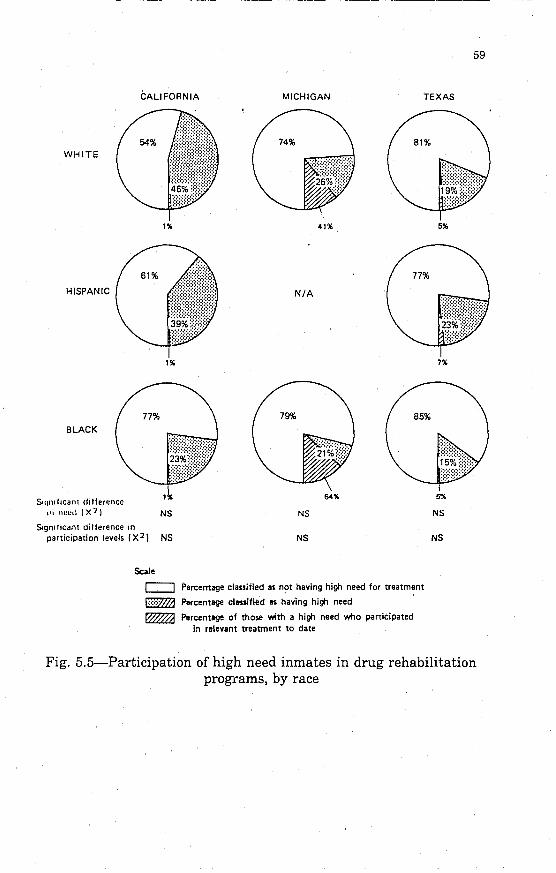
CALIFORNIA MICHIGAN TEXAS
WHITE
1%
HISPANIC N/A
1%
BLACK
s."nil.eanl ditterenee &4%
1'\ need (X 1 J NS NS
S.gntlieant ditterenee in participation levels (X 2) NS NS
Scale
c::::J Percernage clauified as not having high need for treatment
1::;:::;;/}I1 Parcentage classified as having high need
~ Percentage of those with a high need who participated in relevant treatment to date
7%
5':(.
NS
NS
59
Fig. 5.5-Participation of high need inmates in drug rehabilitation programs, by race
60
seeking to explain the as~ociation between need and participation. We found prison programs to be allocated quite randomly among inmates of varying ages, races, criminal histories, and sentence lengths. This was particularly true for education and vocational training. We found no evidence that inmates with these unique characteristics had more serious treatment needs or were participating less in corresponding treatments.
Motivations for and Reactions to Program Participation
According to our criteria, about one-third of the prison population had an acute need for at least one form of treatment under study here, and about one-fourth of that number received appropriate treatment. These statistics raise important questions for research:
• What factors motivate inmates who participate? • How do participants assess the results? • Why do so many "high need" inmates fail to participate? • Do the answers differ among the races?
The inmates surveyed were asked to rate on a four-point scale the importance of each of five reasons for their participating in the various rehabilitative programs. The results indicate that 40 to 60 percent cited "help me to make parole" as a very important reason; 15 to 20 percent said they participated to "break up prison boredom," about 10 percent to "be with friends," and 70 to 80 percent to "obtain the objectives of the program." There were no significant racial differences among the answers.
Participants were asked to assess how much each program had helped them in terms of adjusting to prison, reducing future criminality, dealing with personal problems, and obtaining a skill or education that would assist in future employment. Programs of all types were judged in those terms. For each type, about 20 percent of the participants said the program helped them "a lot" in adjusting to prison; about 50 percent said they had attained the intended goal of the program; and between 40 and 50 percent believe the programs would help them stay out of crime. Half ofthe participants in drug or alcohol programs said they had been helped in curtailing their dependency on these substances; less than 20 percent said these programs were of no help. As expeci0d, the program rated the best aid in getting a job after release was vocational training.
Most germane to our interests ue the reasons given by minorities for not participating in needed treatment programs. Are programs
(;1
unavailable to them, does the staff discourage participation, or do inmates feel they do not need treatment?
We found that 65 percent of the inmates we classified as having a high need for alcohol rehabilitation did not participate because they did not believe they needed such a program. This is particularly surprIsing, because oux criterion for need was the inmate's own assessment of whether he had an alcohol problem during the months prior to his imprisonment.
The same findirlg' applied to all of the other programs except drug rehabilitation: Inmates in need of treatm,ent simply chose not to participate. With drug rehabilitation, however, 33 percent of the inmates judged to have a high need said they did not participate because programs were unavailable. Some 8 to 19 percent of our high-need inmates were not in programs because they felt they were too busy.
We found no significant racial differences in all these reasons. Had discrimination existed, we would have expected to find a greater proportion of minorities reporting that "staff discouraged my participation." There was a slight but statistically insignificant tendency for white offenders to deny their problem more than minorities, claiming that "I don't need this program" for most of the program types studied.
Assessing Prison Work Assignments
We looked for any racial differences in work assignments, in reasons for not having a job, and in evaluations of the usefulness of jobs. The percentages of inmates who reported having a prison job were 59 percent in California, 45 percent in Michigan, and 58 percent in Texas. We found that a greater proportion of white inmates held prison jobs in both Texas and Michigan (statistically significant in both states). Black inmates, particularly in Texas, were less likely to hold a prison job. In California, no racial differences were evident.
There were interesting state differences in reasons that inmates gave for not having a job. In general, inmates without jobs do not appear to want them. In both California and Michigan, inmates without jobs said they were too busy with other activities, or simply did not want a job. Only about 20 percent said that jobs were unavailable. In Texas, about 25 percent said jobs were unavailable, and a greater percentage said they lost their jobs as a result of punishment. These figures raise interesting questions about the relatively low job assignments for blacks in Texas-especially in light of the high value that minorities placed on jobs in all three states. Nevertheless, we found no racial differences in any of the states in the reasons inmates gave for not having a prison job.
62
Although their primary purpose is maintenance of the institution, prison work assignments seem to be providing skills that the inmates believe will help them gain employment upon release. About onethird of the inmates with prison jobs thought they would provide "a lot" of help to them in terms of future employment. This is a rather large fraction, considering that only 66 percent of the inmates enrolled in vocational training programs judged them to be "a lot" of help in terms of future employment.
Across all three states, more minority inmates than whites rated their job assignments as helpful to them.
When the three states were compared, programs in Michigan and Texas were judged as more helpful than those.in California. The percentages of those who rated their work assignments as "no help" were 51 percent in California, 45 percent in Texas, and only 34 percent in Michigan.
Conclusions Concerning In-Prison Programs and Work Assignments
We found few racial differences in program participation or work assignments among prison inmates in our sample. Where we found differences, they seemed to result from inmates' priorities and attitudes instead of from prison staff decisions.
Among programs, there was a closer match between need and participation in educational and vocational training than in drug and alcohol rehabilitation progTams. Evidently, the desire to become more employable on the outside motivated prisoners more strongly than the objectives of the other rehabilitation programs we studied. Across states and races, we found that many prisoners with high need for alcohol and drug rehabilitation who did not participate generally claimed that they did not need help with their problems. This was especially true of blacks and alcohol programs. Even though they had a much lower need for alcohol rehabilitation than whites or Hispanics, a much lower proportion of blacks with need participated in alcohol programs. However, our examination of motives for failure to participate indicates that, if there was discrimination here, the black inmates were discriminating against the program, not vice versa. For drug rehabilitation programs, there was evidence that, in some prisons, programs were not available where prisoners with high need would have participated, but there was no suggestion of racial differences.
The picture for jobs was similar. Although a lower proportion of blacks had jobs in Michigan and Texas, inmates without jobs gener-
63
ally said that they were too busy, did not want jobs, or could not have jobs for other reasons. However, there were some interesting coincidences here that might bear investigating. In Texas, where blacks were significantly less likely than whites to have jobs, a high proportion of inmates said they did not work because jobs were unavailable or because of punishment. Further, Texas was also the state in which a smaller proportion of blacks with high need for education were in education programs. These coincidences could represent a pattern that implies discrimination.
Be that as it may, we found no statistic~lly significant racial differences in participation-in proportion of participants who had need, or in job assignments-that necessarily indicate discrimination. That picture changes when we look at length of sentence served.
RACIAL DIFFERENCES IN LENGTH OF SENTENCE SERVED
The final and perhaps most important test of discrimination is whether minorities serve longer in prison than their white counterparts. The National Minority Advisory Council (1980, p. 243) recently concluded:
The inequity of minority imprisonment is not only one of greater numbers, it is also one of greater duration of confinement once imprisoned. It has become increasingly evident that, proportionally, minority group members convicted of crimes are at greater risk of being: (al sentenced to a term of imprisonment, (bJ sentenced to a longer term of imprisonment, and (c) forced to serve a longer portion of any given term of imprisonment.
Those who argue that minorities serve longer prison sentences usually offer as "evidence" a comparison of the average length of sentence served by members of the different races.
As a measure of discrimination, however, average iength of time served is meaningless because the raceE' may differ on other factors that legitimately affect length of term. If a group of black offenders receives or serves longer sentences than a group of whites, we cannot conclude that the difference is due to race alone, unless the two groups are alike in all other respects that legitimately affect sentences. The critical question here is: When we statistically account for the effect of key factors relating to the nature of the offender and the offense, do we find that minorities end up serving longer sentences than similar white offenders?
Length of sentence served is obviously related to the court-imposed
64
sentence, and, as we saw, minorities received longer sentences in all three states. However, it can also be profoundly affected by in-prison behavior. If an offender is well behaved-has a good attitude, participates in treatment, etc.-his sentence can be signi.ficantly reduced, either as a result of being awarded good-time credits or being discharged at his earliest parole hearIng. The inmates in our sample certainly believed in these effects: Most of them gave "help me get parole" as an important reason for participating in treatment programs.
Nature of Our Analysis
We investigated racial differences in length of sentence served by comparing the average number of months served, while controlling for other related factors. For each inmate who cOhlpleted our Inmate Survey, we calculated the expected length of sentence in months.4
In California, the majority of inmates had originally been sentenced to prison when California's Indeterminate Sentencing Law was in effect. When Determinate Sentencing was adopted in 1977, the California Board of Prison Terms reviewed each inmate's case and computed a new sentence length based on the expected sentence he would have received if he had been sentenced under Determinate Sentencing. Each inmate was then informed of his expected release date. The actual time served will be very close to this number of months, since the expected sentence can only be altered slightly as a result of prison behavior in California. This recomputed sentence length is the number we used for length of sentence served. Unfortunately for analytic purposes, it combines aspects of both indeterminate and determinate sentencing.
For Texas and Michigan, the expected sentence length reflects the inmate's knowledge about when he will get out. In some instances, the sentence will be extended because of disciplinary problems. Estimates made by inmates who are nearing the end of their sentence are undoubtedly more accurate. However, officials in both Texas and Michigan evidently follow a policy of letting inmates know the actual time they will be required to serve as near to the beginning of their terms BS possible. Moreover, in these states, terms are usually extended significantly only for major violations, because extreme overcrowd-
4Expected sentence length was calculated by taking the respondents' answers to "how long have you been here" and "how much longer do you have left to serve" and adding the two numbers together. In ,addition, these numbers were compared with the expected "date of release" supplied by the correction departments in each state. The two estimates were very closely correlated (see Marquis and Ebener, 1981).
65
ing in prisons makes extension for minor violations impractical. Our data show that less than 10 percent of the inmates in these states commit serious infractions during their terms. Consequently, few inmates will have their imposed sentence significantly extended.
To discover whether these sentence lengths varied for whites and minorities, when other relevant factors were controlled, we began with a cross-tabular analysis. Because sentences served differ significantly for the states, we had to examine racial differences for each sta te separately. 5
In this analysis, we controlled for state, race, conviction type, and prior record. The results are shown in Table 5.l.
There are selected instances, particularly in Texas and California, where minorities appear to be serving longer terms, but they do not reach statistical significance. For example, in Texas, blacks with no prior prison record serve an average of 50 months for robbery, whereas whites serve 37 months. Blacks with a prior prison record serve 87 months for robbery, whereas whites serve 67 months. Hispanics appear to be serving longer terms in California, especially when compared with whites. In the case of robbery, for example, Hispanics with no prior prison record serve an average of 47 months compared with 44 months for whites. Hispanics with a prior prison record serve 54 months for robbery, compared with 47 for whites and 40 for blacks. For most crimes and prior record categories, Hispanics in California appear to serve longer terms than either whites or blacks. However, there are no obvious racial differences in Michigan. Moreover, this analysis yielded few statistically significant differences of any kind.
This cross-tabular approach has limitations. As more stratifications are introduced, the resulting tables have more and more cells; the number of inmates falling in each cell becomes smaller; the racial differences within each cell become more and more unstable; and it becomes difficult to estimate some "overall" racial differences. To overcome these limitations and see if there were any statistically significant racial differences in sentence served, we again turned to the multivariate regression technique. This was the technique we used in analyzing racial differences in court-imposed sentences, reported in Sec. III. This technique permitted us to control for all of the following independent variables:
5California inmates served less time for most crime types than inmates in either Texas or Michigan. For example, Texas and Michigan inmates served about 55 months for robbery and 40 for burglary, while California inmates served almost 10 months less on the average-46 months for robbery and 25 for burglary.
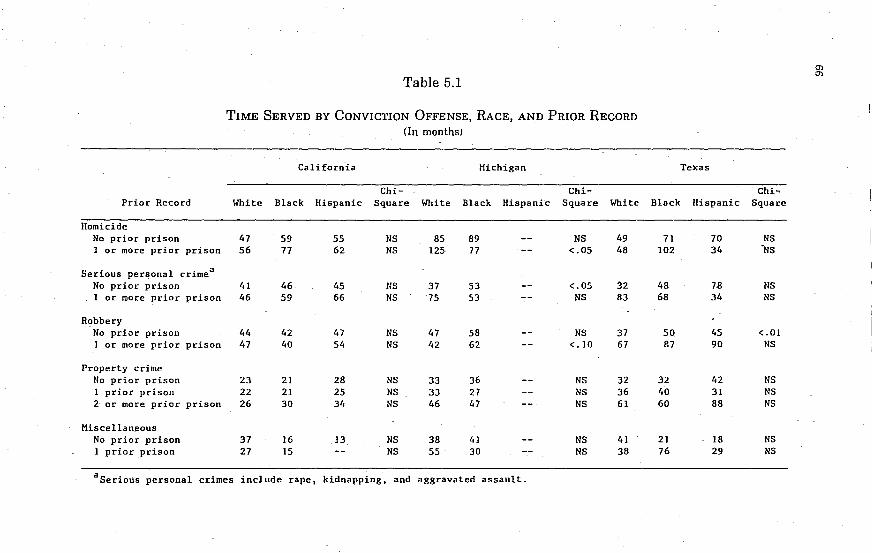
Ol en
Table 5.1
TIME SERVED BY CONVICTION OFFENSE, RACE, AND PRIOR RECORD (In months)
California Michigan Texas
Chi- Chi- Chi-Prior Record White Black Hispanic Square White Black Hispanic Square White Black Hispanic Square
Homicide No prior prison 47 59 55 NS 85 89 NS 49 71 70 NS 1 or more prior prison 56 77 62 NS 125· 77 <.05 48 102 34 'NS
Serious personal crimea No prior prison 41 46 45 ns 37 53 <.05 32 48 78 NS 1 or more prior prison 46 59 66 NS 75 53 NS 83 68 34 NS
Robbery No prior prison 44 42 47 NS 47 58 NS 37 50 45 <.01 1 or more prior prison 47 40 54 NS 42 62 <.10 67 87 90 NS
Property crime No prior prison 23 21 28 NS 33 36 NS 32 32 42 NS 1 prior prison 22 21 25 NS 33 27 NS 36 40 31 NS 2 or more prior prison 26 30 34 NS 46 47 NS 61 60 88 NS
Miscellaneous No prior prison 37 16 13 NS 38 41 NS 41 21 18 NS 1 prior prison 27 15 NS 55 30 NS 38 76 29 NS
aSerious personal crimes include rape, kidnapping, and aggravated assault.
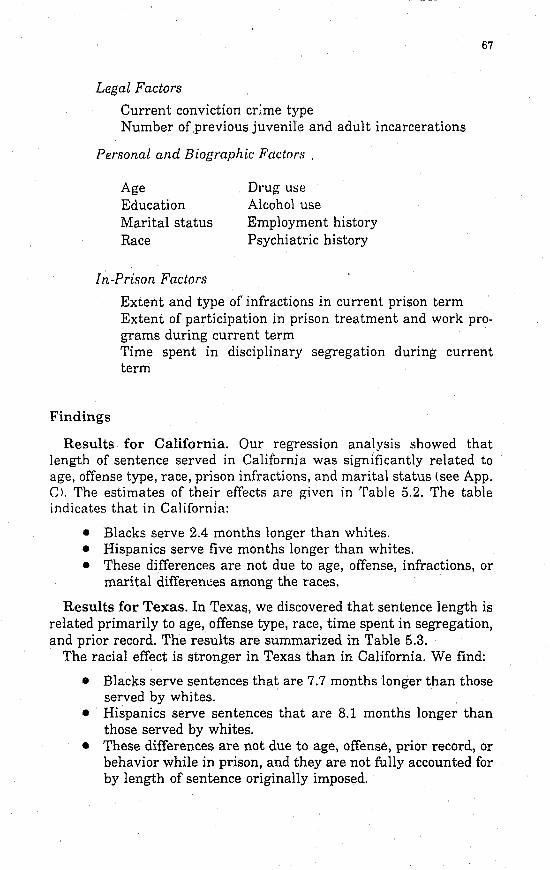
67
Legal Factors
Current conviction crime type Number of previous juvenile and adult incarcerations
Personal and Biographic Factors.
Age Education Marital status Race
Drug use Alcohol use Employment history Psychiatric history
Tn-Prison Factors
Findings
Extent and type of infractions in current prison term Extent of participation in prison treatment and work programs during current term Time spent in disciplinary segregation during current term
Results for California. Our regression analysis showed that length of sentence served in California was significantly related to age, offense type, race, prison infractions, and marital status (see App. el. The estimates of their effects are given in Table 5.2. The table indicates that in California:
• Blacks serve 2.4 months longer than whites. • Hispanics serve five months longer than whites. • These differencp.s are not due to age, offense, infractions, or
marital differenl!es among the races.
Results for Texas. In Texas, we discovered that sentence length is related primarily to age, offense type, race, time spent in segregation, and prior record. The results are summarized in Table 5.3.
The racial effect is stronger in Texas than in California. We find:
• Blacks serve sentences that are 7.7 months longer than those served by whites.
• Hispanics serve sentences that are 8.1 months longer than those served by whites.
• These differences are not due to age, offense, prior record, or behavior while in prison, and they are not fully accounted for by length of sentence originally imposed.
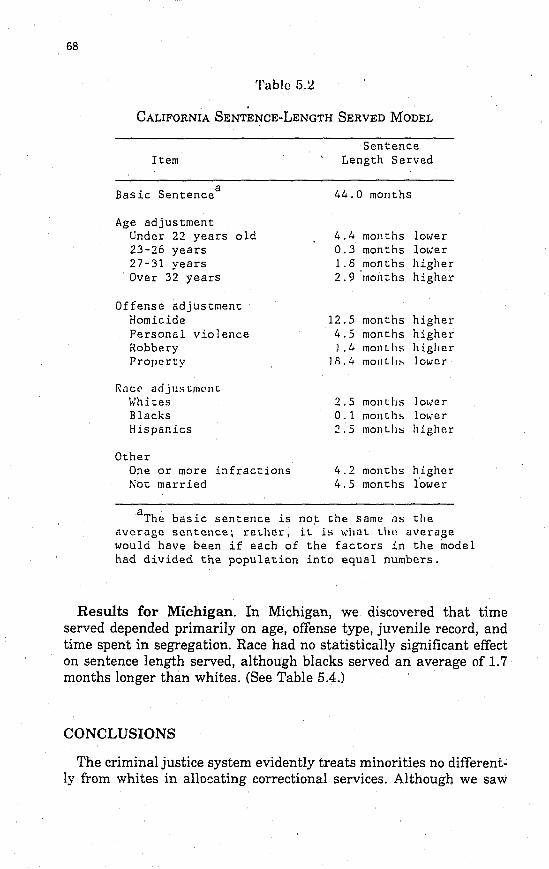
68
'I'able 5.2
. . CALIFORNIA SENTENCE-LENGTH SERVED MODEL
Item
Basic Sentencea
Age adjustment Under 22 years old 23-26 years 27-31 years Over 32 years
Offense adjustment Homicide Personal violence Robbery Property
RileI:' adjustml:'llL Whites Blacks Hispanics
Other One or more infractions Not married
Sentence Length Served
44.0 months
4.4 months lower 0.3 months lower 1.8 months higher 2.9 months higher
12.5 months higher 4.5 months higher J .4 mOI1Lh~ higher
1R.4 mOIlL11~ lower
2.5 monLlis lower 0.1 monLh!> lOt.'er '1 -_.;) monLhs higher
4.2 months higher 4.5 months lower
aThe basic sentence is not the same as the average sentence; rather, iL is \dUlL Lhe uverage would have been if each of the factors in the model had divided the popUlation into equal numbers.
Results for Michigan. In Michigan, we discovered that time served depended primarily on age, offense type, juvenile record, and time spent in segregation. Race had no statistically significant effect on sentence length served, although blacks served an average of 1.7 months longer than whites. (See Table 5.4.)
CONCLUSIONS
The criminal justice system evidently treats minorities no differently from whites in allocating correctional services. Although we saw
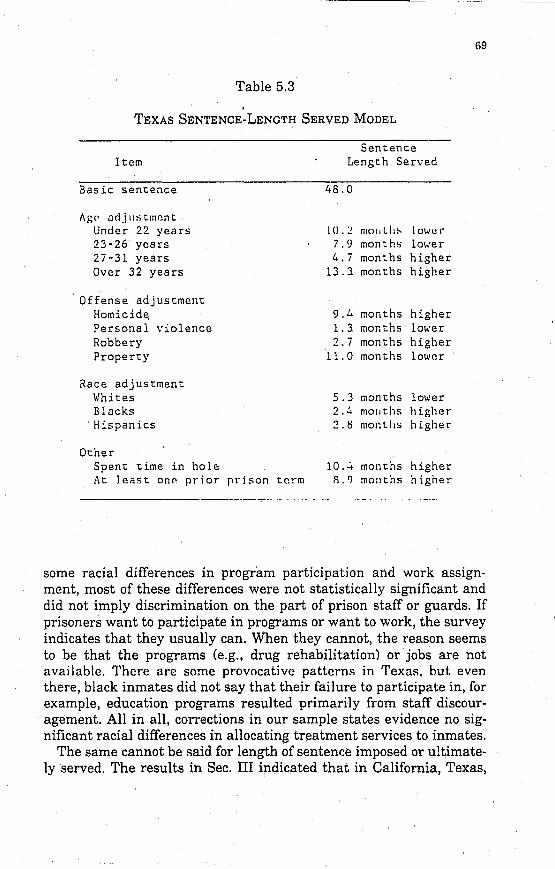
-----------------
Table 5.3
TEXAS SENTENCE-LENGTH SERVED MODEL
Item
Basic sentence
Age· adjllstment Under 22 years 23-26 years 2i-31 years Over 32 years
Offense adjustment Homicide Personal violence Robbery Property
Race adjustment Whites Blacks Hispanics
Other Spent time in hole At least onp prior prjson term
Sentence Length Served
48.0
10.:! OlOII Lh~ IOW!.!l·
7.9 months lo\,:er 4. i months higher
13.3 months higher
9.4 months higher 1.3 months lower ? -_. I months higher
11.0 months lower
5.3 months lower .., . ....... months higher 2.0 montlls higher
10.'::' months higher F.. I) months higher
69
some racial differences in program participation and work assignment, most of these differences were not statistically significant and did not imply discrimination on the part of prison staff or guards. If prisoners want to participate in programs or want to work, the survey indicates that they usually can. When they cannot, the reason seems to be that the programs (e.g., drug rehabilitation) or jobs are not available. There are some provocative patterns in Texas, but even there, black inmates did not say that their failure to participate in, for example, education programs resulted primarily from staff discouragement. All in all, corrections in our sample states evidence no significant racial differences in allocating treatment services to inmates.
The same cannot be said for length of sentence imposed or ultimately served. The results in Sec. III indicated that in California, Texas,
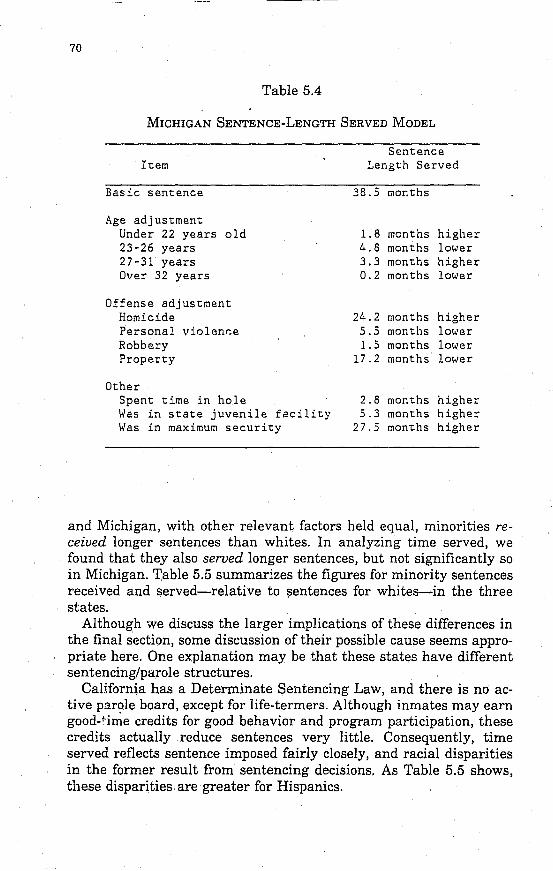
70
Table 5.4
MICHIGAN SENTENCE-LENGTH SERVED MODEL
Item
Basic sentence
Age adjustment Under 22 years old 23-26 years 27-31 years Over 32 years
Offense adjustment Homicide Personal violen~e Robbery Property
Other Spent time in hole Was in state juvenile facility Was in maximum security
Sentence 1ength Served
38.5 months
1.8 months higher 4.8 months lower 3.3 months higher 0.2 months lower
24.2 months higher 5.5 months lower 1.5 months lower
17.2 months lower
2.8 months higher 5.3 months higher
27.5 months higher
and Michigan, with other relevant factors held equal, minorities received longer sentences than whites. In analyzing time served, we found that they also served longer sentences, but not significantly so in Michigan. Table 5.5 summarizes the figures for minority sentences received and served-relative to sentences for whites-in the three states.
Although we discuss the larger implications of these differences in the final section, some discussion of their possible cause seems appropriate here. One explanation may be that these states have different sentencing/parole structures.
California has a Determinate Sentencing Law, and there is no active parole board, except for life-termers. Although inmates may earn good-f-irIie credits for good behavior and program participation, these credits actually reduce sentences very little. Consequently, time served reflects sentence imposed fairly closely, and racial disparities in the former result from sentencing decisions. As Table 5.5 shows, these disparities are greater for Hispanics.
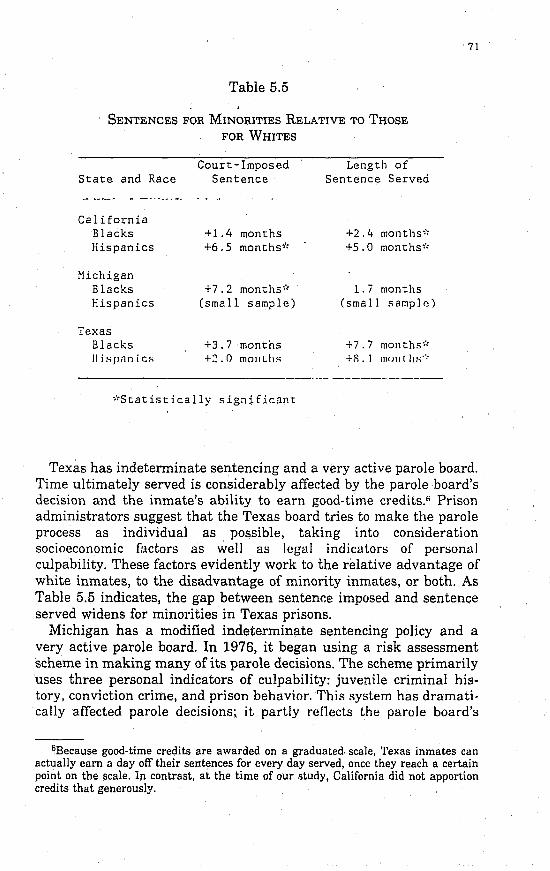
Table 5.5
SENTENCES FOR MINORITIES RELATIVE TO THOSE
FOR WHITES
State and Race
California Blacks Hispanics
~lichigan
Blacks Hispanics
Texas Blacks lIispnnics
Court-Imposed Sentence
+1.4 months +6.5 months'"
+7.2 months'" (small sample)
+3.7 months +2.0 mOIiLitf'
*Statistically significant
Length of Sentence Served
+2.4 months'" +5.0 months'"
1.7 months (small sample)
+7.7 months'" +IL 1 1I101lt it:· .. ·,
71
Texas has indeterminate sentencing and a very active parole board. Time ultimately served is considerably affected by the parole board's decision and the inmate's ability to earn good-time credits." Prison administrators suggest that the Texas board tries to make the parole process as individual as possible, taking into consideration socioeconomic factors as well as legal indicators of personal culpability. These factors evidently work to the relative advantage of white inmates, to the disadvantage of minority inmates, or both. As Table 5.5 indicates, the gap between sentence imposed and sentence served widens for minorities in Texas prisons.
Michigan has a modified indeterminate sentencing policy and a very active parole board. In 1976, it began using a risk assessment scheme in making many of its parole decisions. The scheme primarily uses three personal indicators of culpability: juvenile criminal history, conviction crime, and prison behavior. ThiR system has dramatically affected parole decisions; it partly reflects the parole board's
6Because good-time credits are awarded on a graduated. scale, Texas inmates can actually earn a day off their sentences for every day served, once they reach a certain point on the scale. In contrast, at the time of our study, California did not apportion credits that generously.
72
desire to see that offenders convicted for similar crimes should serve roughly equal time in prison,. As Table 5.5 suggests, this attitude and the risk-assessment system appear to have overcome racial disparities in court-imposed sentences for blacks. The regression analyses show that even though blacks are sentenc~d to 7.2 months more than whites, they serve roughly the same time. Commendable as the effort to overcome racial disparities in time served may be, it may not necessarily accord with the parole board's central mandate--to assess the risk that a criminal presents to society when he leaves prison. This is a dilemma we discuss further in the last section.
With the exception of crime commission rates and program participation, we have been looking so far at racial differences in the system's treatment of offenders rather than possible racial differences in behavior that might influence that treatment. In defending' the system against charges of discrimination, some people have argued that the racial differences in treatment result from racial differences in behavior. To assess that argument, the next section looks at the motivation for crime, use of weapons, and in-prison violence in our sample.
VI. RACIAL DIFFERENCES IN CRIME MOTIVATIONS, WEAPONS USE, AND
PRISON INFRACTIONS
It seems obvious that numerous aspects of an offender's behavior will influence the impression he makes on probation officers, judges, and parole boards. Section V indicated that infractions of prison rules and punishment suffered for those infractions were related to sentence served in two states. Added to the effects of race in California, for example, such infractions could result in black prisoners serving even longer terms. We believe that behavior, such as crime motivation and weapon use, might have a similar effect on sentencing. If there are racial differences in these kinds of behavior, they might help account for some of the racial differences we saW in sentencing and lenbrth of sentence served.
CRIME MOTIVATIONS
To explore crime motivations, we asked survey respondents to rate how important the potential reasons shown in Table 6.1 were for the crimes they had committed during the window period (the 12 to 24 months immediately preceding their current imprisonment). They rated them on a four-point scale from very important (scale score = 4) to not important at all (scale score = n In our motivational analysis, we combined the three states' results because preliminary analysis showed no significant differences in motivations among the states. We also combined the categories "somewhat" and "slightly" important, and the categories "not important" and "did not apply."
Our motivational question and our analysis plan are patterned after work done by Peterson and Braiker (1981). They posed a similar question to inmates in a survey conducted in 1976. Their sample included only California, was smaller than ours, and was for a period two years earlier. Nevertheless their results and ours are almost identical: The percent of their sample who rated specific reasons as "very important" is, in most instances, within 5 percent of that in our sample. The compatibility of the two studiel'i lendl'i credihility to this question, as well as confidence that it is in fact meal:mring rather consistently the array of reasons inmates have for engaging in crime.
73
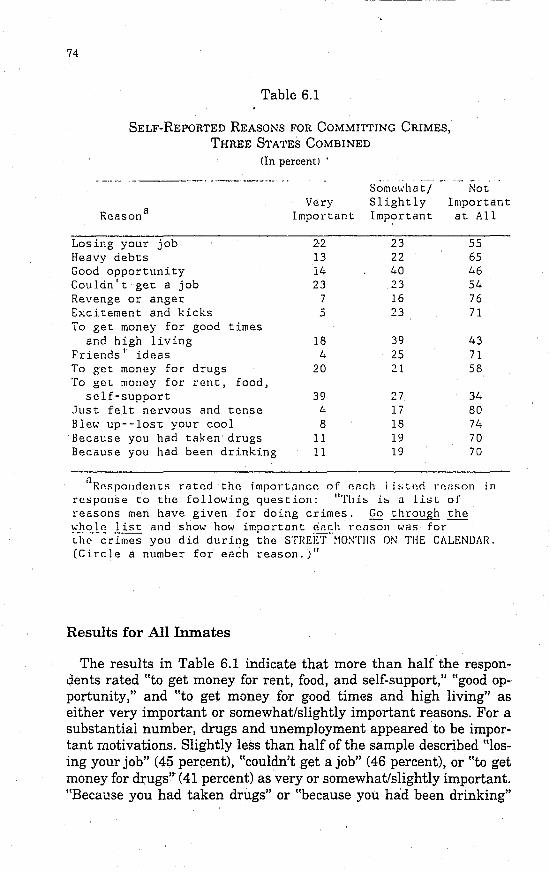
74
Table 6.1
SELF-REPORTED REASONS FOR COMMITTING CRIMES,
THREE STATES COMBINED
(In percent) .
----_ ... -----.. - ...
Reason a
Losing your job Heavy debts Good opportunity Couldn't get a job Revenge or anger Excitement and kicks To get money for good times
and high living Friends 1 ideas To get money for drugs To gel money for rent, food,
self-support Just felt nervous and tense Blew up--Iost your cool Because you had taken drugs Because you had been drinking
Very Important
2-2 13 14 23
7 5
18 4
20
39 4 8
11 11
Somewhat/ Slightly Important
23 22 40 23 16 23
39 25 21
27 17 18 19 19
Not Important at All
55 65 46 54 76 71
43 71 58
34 80 74 70 70
ilRp.spondents ratp.d the importance of ench 1 i:-;l(!<i l'C!lIson in rc~ponse to the following question: "Thi!:> i~ a li~l of reasons men have given for doing crimes. Go through the whole list and show how important ench renson was for ;:J1~-cr'imes you did during the STREET -~IO~TIIS ON THE CALENDAR. (Circle a number for each reason.)"
Results for All Inmates
The results in Table 6.1 indicate that more than half the respondents rated "to get money for rent, food, and self-support," "good opportunity," and "to get money for good times and high living" as either very important or somewhat/slightly important reasons. For a substantial number, drugs and unemployment appeared to be important motivations. Slightly less than half of the sample described "losing your job" (45 percent), "couldn't get a job" (46 percent), or "to get money for drugs" (41 percent) as very or somewhat/slightly important. "Because you had taken drugs" or "because you had been drinking"
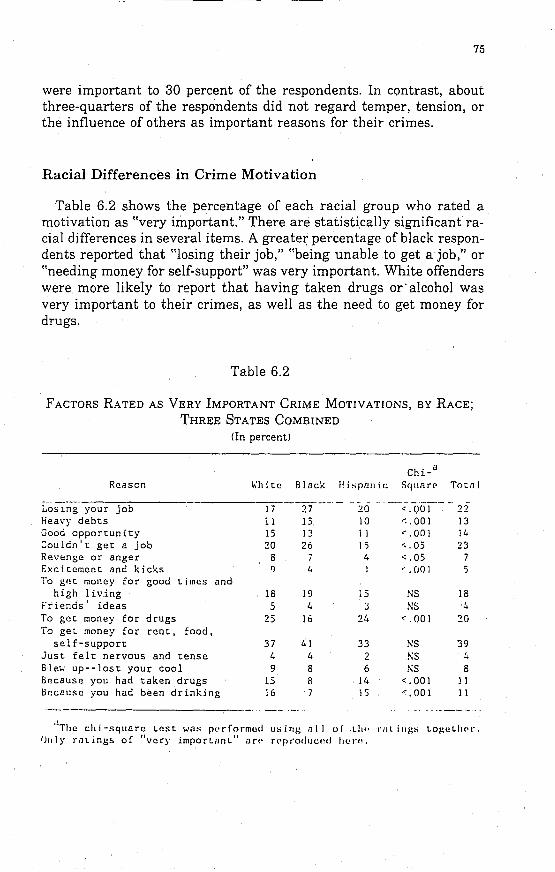
75
were important to 30 percent of the respondents. In contrast, about three-quarters of the respondents did not regard temper, tension, or the influence of others as important reasons for their crimes.
Racial Differences in Crime Motivation
Table 6.2 shows the percentage of each racial group who rated a motivation as "very important." There are statistically significant racial differences in several items. A greater percentage of black respondents reported that "losing their job," "being unable to get a job," or "needing money for self-support" was very important. White offenders were more likely to report that having taken drugs or' alcohol was very important to their crimes, as well as the need to get money for drugs.
Table 6.2
FACTORS RATED AS VERY IMPORTANT CRIME MOTIVATIONS, BY RACE;
THREE STATES COMBINED
(In percent)
Chi-a
Reilson \"hite Black II i SP;1I1 i c Square> Tot.11 ~, - - .- -- --- -- - .-~.-- ... -
Losing your job Ii 27 20 <.001 22 Heavy debts 11 15 10 <:.001 13 Good opportunity 15 IJ 11 <.001 14 :ouldn't get a job 20 26 15 '·.05 23 Revenge or anger 8 7 4 <.05 7 Excitement ilnd kicks 'J 4 ' ,001 To get money for good times and
high ;iving 18 19 15 NS 18 Fr-iends ideas 5 4 3 NS 4 To get money for drugs 25 16 24 <,001 20 To get money for rent, food,
self-support 37 41 33 NS 39 Just fell: nervous and tense 4 4 2 1\S 4 Ble,; up--lost your cool 9 8 6 KS 8 Because you had taken drugs 15 8 14 <.00] 11 Because you had been drinking 16 7 J 5 ".001 ]]
-_ ... _-
olThe chi-square test was pl'rformed using 0111 of tIll' ,·"tillg:; togetlw,'. (J1l1y ratings of "very importilnt" an' rt'pt'oducnd hel'l!.
76
To explore the dimensions of motivation, Peterson and Braiker conducted a factor analysis on their samples' responses that yielded three orthogonal factors, i.e., groups of items that were statistically unrelated t.o each other: economic distress, "high times," and t.emper. Because our preliminary analysis showed identi.cal results, we adopted their scales for our use. Table 6.3 shows the three orthogonal factors and the items that loaded on each.!
The entire sample and each racial group rated the reasons under "economic distress" as the most important to their crimes. The score was highest for blacks, but this racial ~ifference was not statistically significant. We must be cautious about these results, however. Many inmates may have seized on economic distress as a plausible excuse for their crimes. Nevertheless, by the study's own need criteria, a very high percentage of the inmates were identified as needing vocational training-blacks most of all, in the three states-and the criteria derived primarily from employment history (see Fig. 5.3).
The "high times" factor embodies hedonistic reasons for crime: excitement and "kicks," the influence of drugs or alcohol, or the challenge of a good opportunity. These reasons were rated as less important than economic distress, but more important than temper. White offenders scored higher on this scale.
The "temper" scale yielded no racial differences. Although most of these findings revealed no statistically significant
racial differences, they raise some provocative questions. Blacks rated economic distress considerably higher than high times, while whites rated economic distress only slightly higher. The suggestion is that socioeconomic conditions among blacks may be more consistent and more consistently related to crime than they are among whites. Certainly, that comes as no particular surprise; but if probation officers, judges, and parole boards see past unemployment as an indicator of recidivism-rather than as a mitigating circumstance in crimeblacks or any other unemployed offenders are likely to receive harsher sentences. We discuss the effects of recidivism indicators on sentencing and time served in the last section.
RACIAL DIFFERENCES IN WEAPON USE AND VICTIM INJURY
The type of weapon an offender uses and the frequency with which he uses it are important dimensions of his criminal behavior. They indicate in some measure his commitment to a criminal life-style, his
! In our analysis, friends' ideas did not clearly load on any single factor. This was also true with the Peterson and Braiker analysis.
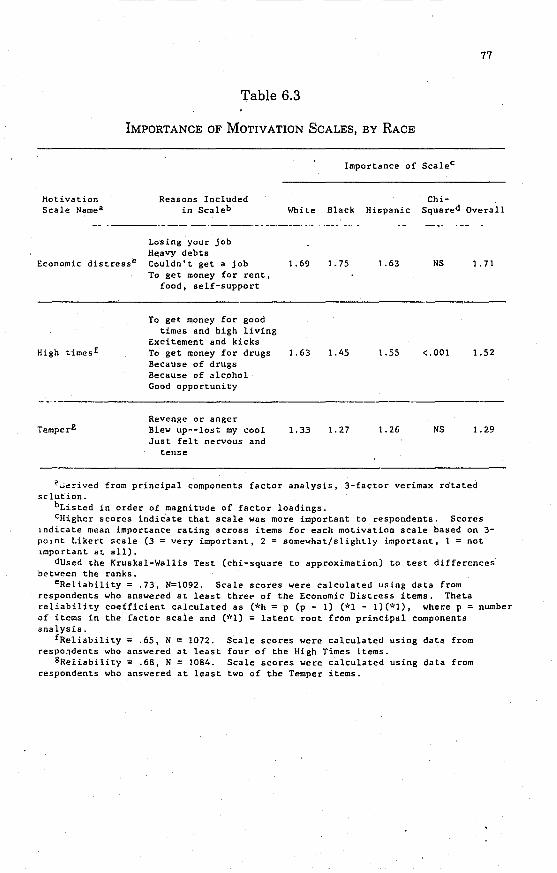
77
Table 6.3
IMPORTANCE OF MOTIVATION SCALES, BY RACE
Importance of Scalec
Chi-Motivation Scale Namea
Reasons Included in Scaleb White Black Hispanic Squared Overall
Losing your job Heavy debts
Economic distress e Couldn't get a job 1.69 To get money for rent,
food, self-support
To get money for good times and high living
Excitement and kicks High times f To get money for drugs 1.63
Because of drugs
Temperg
Because of alcohol Good opportunity
Revenge or anger Blew up--lost my cool Just felt nervous and
tense
1.33
1. 75 1.63 NS 1.71
1.45 1.55 <.001 1.52
1. 27 1.26 NS 1.29
?~erived from principal components factor analysis, 3-factor verimax rotated 5clut.ion.
bListed in order of magnitude of factor loadings. CHigher scores indicate that scale was more important to respondents. Scores
indicate mean importance rating across items for each motivation scale based on 3-pOInt Likert scale (3 = very important, 2 = somewhat/slightly important, 1 = not important at all).
dUsed the Kruskal-Wallis Test (chi-square to approximation) to test differences between the ranks.
eReliability = .73, N=1092. Scale scores were calculated using data from respondents who answered at least three of the Economic Distress items. Theta reliability coefficient calculated as (*h = p (p - 1) (*1 - 1)(*1), where p = number of items in the factor scale and (*1) = latent root from principal components analysis.
fReliability = .65, N = 1072. Scale scores were calculated using data from respondents who answered at least four of the High Times items.
gReliability = .68, N = 1084. Scale scores were calculated using data from respondents who answered at least two of the Temper items.
78
professionalism, and his attitude toward legal penalties for using weapons. Weapon use also says something about his motives and the context in which he anticipates committing his crimes (e.g., premeditated vs. impulsive).
These implied attitudes might be expected to affect the offender's sentence and time served. As we conjectured in looking at motivations, if there are racial differences in the kind and degree of weapon use, they might help explain racial differences in treatment. For that reason, the Inmate Survey asked each inmate who reported committing one or more crimes of burglary, ~obbery, or assault during the study period a series of questions concerning weapon use and victim injury.2
Weapon Use for Particular Crimes. Table 6.4 shows the results. In kind and degree of weapon use, business and personal robbery are very different from burglary. Robberies involve more weapons, with firearms predominating, and business robberies are seldom committed without a formidable weapon. It is also possible that older, more sophisticated offenders, tend to favor robbery-particularly commercial robbery-more than do younger, unsophisticated offenders. The patterns for aggravated assault are very similar to those for personal robberies.
Table 6.5 examines whether there are racial differences in the percentages who report that they were usually armed with a weapon (either "always" or "half or more" of the time) in their crimes. Few racial differences appear in the overall extent of weapon use. However, there is a suggestive trend, which reaches statistical significance only for burglary, in which Hispanics were those most likely to carry a weapon of some sort.
We found no statistically significant racial differences in gun use, but it is interesting to note that Hispanics were the least likely to use a gun, particularly in the two types of robbery. Among white offenders, 71 percent were "always" armed with a gun during a business robbery, whereas this was true for only 64 percent of the blacks and 51 percent of the Hispanics. The trends were similar for burglary and personal robbery.
Significant racial differences appeared in the frequency of knife use. For each of the four study crimes, Hispanics most often reported being armed with knives (statistically significant for each of the crime types). Blacks reported a very low incidence of knife use, especially in burglary and business robbery.
The analysis of the extent and type of weapons used revealed racial differences: Hispanics show a preference for knives; whites show a
2See Chaiken and Chaiken (1982) for exact questions asked.
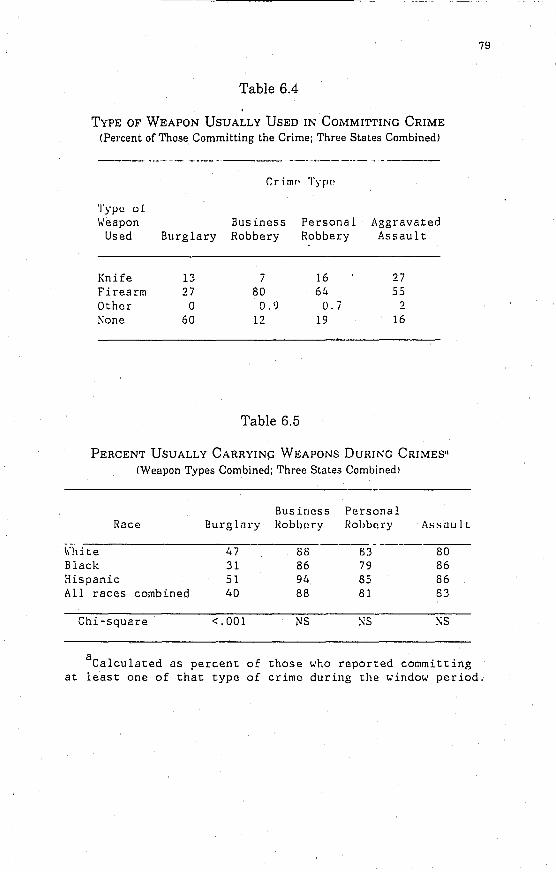
Table 6.4
TYPE OF WEAPON USUALLY USED IN COMMITTING CRIME
(Percent of Those Committing the Crime; Three States Combined)
Cr imp Ty[l<'
Type of \"eapon Business Personal Aggravated
Used Burglary Robbery Robbery Assault
Knife 13 7 16 27 Firearm 27 80 64 55 Other 0 0.9 0.7 2 None 60 12 19 16
Table 6.5
PERCENT USUALLY CARRYING WEAPONS DURING CRIMES"
(Weapon Types Combined; Three Slates Combined)
Business Personal Race Burglnry Robbory Hobu(!ry A!;:>LlulL
\\hi te 47 88 83 80 Black 31 86 79 86 Hispanic 51 94 85 86 All races combined 40 88 81 83
Chi-square <.001 NS NS NS
a Calculated as percent of those ~ho reported committing
79
at least one of that type of crime during the window period.
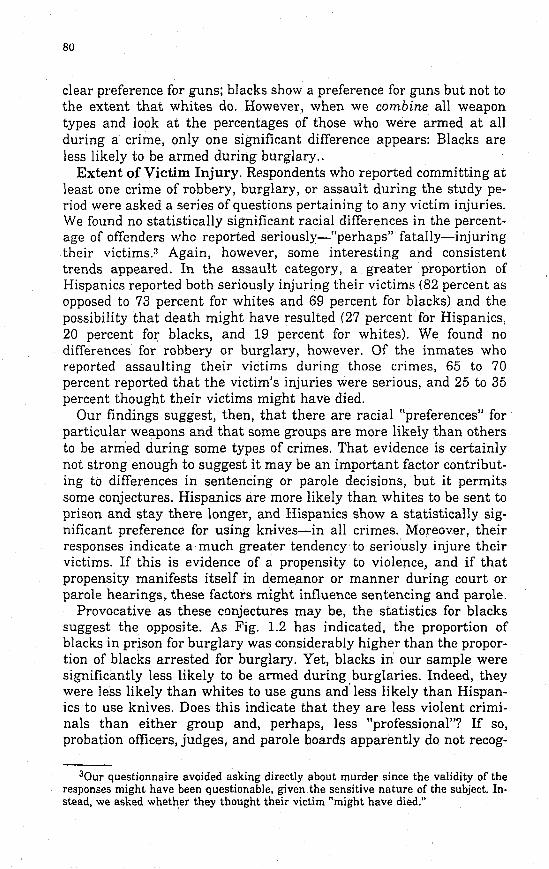
80
clear preference for guns; blacks show a preference for guns but not to the extent that whites do. However, when we combine all weapon types and look at the percentages of those who were armed at all during a crime, only one significant difference appears: Blacks are less likely to be armed during burglary ..
Extent of Victim Injury. Respondents who reported committing at least one crime of robbery, burglary, or assault during the study period were asked a series of questions pertaining to any victim injuries. We found no statistically significant racial differences in the percentage of offenders who reported seriously'-"perhaps" fatally-injuring their victims.3 Again, however, some interesting and consistent trends appeared. In the assault category, a. greater proportion of Hispanics reported both seriously injuring their victims (82 percent as opposed to 73 percent for whites and 69 percent for blacks) and the possibility that death might have resulted (27 percent for Hispanics, 20 percent for blacks, and 19 percent for whites). We found no differences for robbery or burglary, however. Of the inmates who reported assaulting their victims during those crimes, 65 to 70 percent reported that the victim's injuries were serious, and 25 to 35 percent thought their victims might have died.
Our findings suggest, then, that there are racial "preferences" for particular weapons and that some groups are more likely than others to be armed during some types of crimes. That evidence is certainly not strong enough to suggest it may be an important factor contributing to differences in sentencing or parole decisions, but it permits some conjectures. Hispanics are more likely than whites to be sent to prison and stay there longer, and Hispanics show a statistically significant preference for using knives-in all crimes. Moreover, their responses indicate a much greater tendency to seriously injure their victims. If this is evidence of a propensity to violence, and if that propensity manifests itself in demeanor or manner during court or parole hearings, these factors might influence sentencing and parole.
Provocative as these conjectures may be, the statistics for blacks suggest the opposite. As Fig. 1.2 has indicated, the proportion of blacks in prison for burglary was considerably higher than the proportion of blacks arrested for burglary. Yet, blacks in our sample were significantly less likely to be armed during burglaries. Indeed, they were less likely than whites to use guns and' less likely than Hispanics to use knives. Does this indicate that they are less violent criminals than either group and, perhaps, less "professional"? If so, probation officers, judges, and parole boards apparently do not recog-
30ur questionnaire avoided asking directly about murder since the validity of the responses might have been questionable, given the sensitive nature of the subject. Instead, we asked whether they thought their victim "might have died."
HI
nize these as mitigating characteristics. Our findings on prison violence raise similarly conflicting suggestions.
RACIAL DIFFERENCES IN PRISON'VIOLENCE
Despite a wide variation in research methodologies, a synthesis of the literature on prison behavior indicates that inmates involved in disciplinary problems tend to be young, to have juvenile arrest records, and to have started their criminal careers at an early age.4
There is no clear trend in the literature regarding the relationship between prison violence and race, type of commitment offense, and prior prison terms.
Institutional infractions provided our measure of prison behavior. Using that measure, we analyzed behavior of the different races by examining the effect that each component variable has on prison behavior. The analysis included such inmate characteristics as age, race, prior record, and commitment offense, and such in-prison variables as months in prison, prison work status, and level of participation in treatment programs.
Table 6.6 lists, in order of increasing severity, the seven types of infractions we used to code disciplinary reports. Each inmate's folder contains a copy of all the disciplinary reports he received during his current term; we recorded their numbers and types. Although the typical infraction fit more than one category (e.g., an inmate threat~ ened and seriously injured another inmate with a contraband weapon), for simplicity we recorded only the most serious infraction (e.g., major injury).
Differences in Prison Violence Among States
Table 6.7 shows the percentages of inmates in each state who had at least one officially recorded infraction. The percentages vary across states and differ significantly for five of the seven infraction types studied. Of those five, Michigan inmates had a much higher percentage than Texas or California inmates, except for infractions involving contraband. The percentage of Texas inmates with at least one infraction is less than one-third that of Michigan or California inmates. A greater percentage of Michigan inmates have at least one "write-up"
4See, for example. Myers and Levy (1978); Ellis et al. (1974); Bolte (1978); Brown and Spevacek (1969); Jaman (1972); Bennett (1976); Flanagan (1980, 1983); Cae (1961); and Fuller and Orsagh (1977).
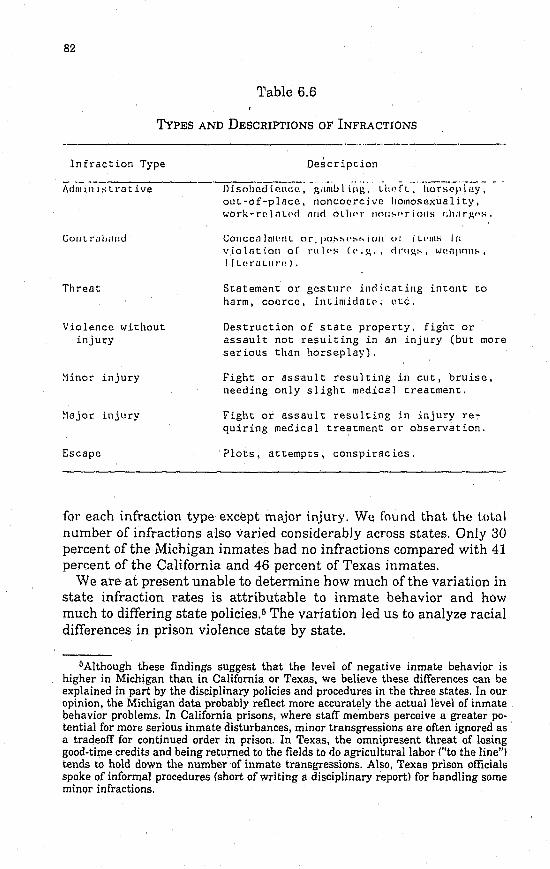
82
Table 6.6
TYPES AND DESCRIPTIONS OF INFRACTIONS
Infraction Type
CUIIL !"iJi>illld
Threat
Violence without injury
~!inor injury
~lajor inj ury
Escape
---_._--Descripcion
Disab'<i"d iCll(;~-:'g;l~l;b 1 ii,g. Lh,' rl·:~"i;;r;c.;·;TIlY ~ ~ . out-of-place, noncoercivc homosexuality, WOt-k-rcolIlL(,(j Illlcl aLllt'!" /Ioll,,"ri()ll!l r:hiJrgl''''
ConC;CQlnll'IIL or. po!-o:,t'!-o!-o iCIfl oj i LI'IIl" ill
vial<1tioll ar rllle·s (e'.g •• dl·IIi-\!-o. W(!IlPOIl!->,
1 i L!'t'i1LIII'C' ) '
Statement or gesture indicating intent to harm, coerce, intImidate, etc.
Destruction of state property. fight or assault not resulting in an injury (but more serious than horseplay).
Fight or assault resulting in cut, bruise, needing only slighc medical creacmenc.
Fight or assault resulting in injury requiring medical treatment or observation.
Plots, attempts, conspiracies.
for each infraction type except major injury. We found that the t.olal number of infractions also varied considerably across states. Only 30 percent of the Michigan inmates had no infractions compared with 41 percent of the California and 46 percent of Texas inmates.
We are at present unable to determine how much of the variation in state infraction rates is attributable to inmate behavior and how much to differing state policies.5 The variation led us to analyze racial differences in prison violence state by state.
5Although these findings suggest that the level of negative inmate behavior is higher in Michigan than in California or Texas, we believe these differences can be explained in part by the disciplinary policies and procedures in the three states. In our opinion, the Michigan data probably reflect more accurately the actual level of inmate behavior problems. In California prisons, where staff members perceive a greater potential for more serious inmate disturbances, minor transgressions are often ignored as a tradeoff for continued order in prison. In Texas, the omnipresent threat of losing good-time credits and being returned to the fields to do agricultural labor ("to the line") tends to hold down the number of inmate transgressions. Also. Texas prison officials spoke of informal procedures (short of writing a disciplinary report) for handling some minor infractions.
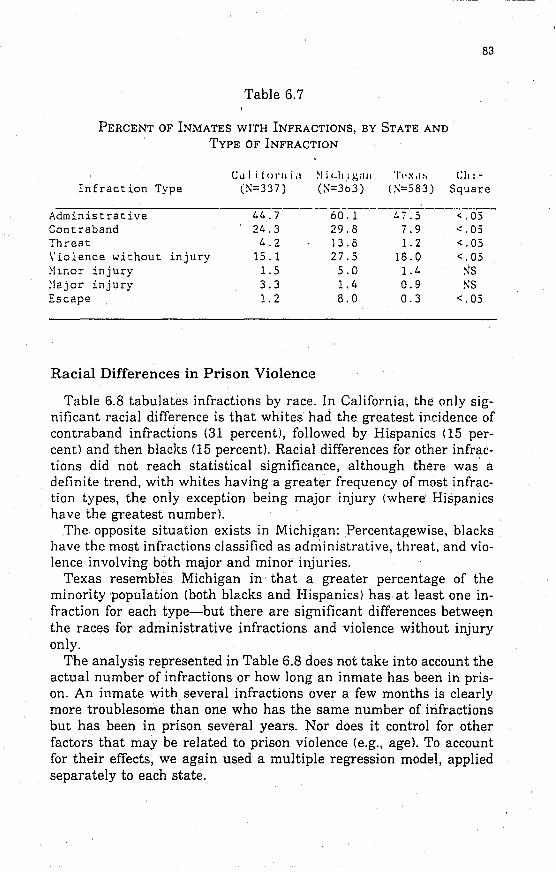
83
Table 6.7
PERCENT OF INMATES WITH INFRACTIONS, BY STATE AND
TYPE OF INFRACTION
Infraction Type
Administrative Contraband Threat Violence without injury ~linor injury ~laj or inj ury Escape
eLl Ii! ()I' II i il (S=337)
~I i L.III gilll
(:-':=363) 'I'"Xil:-'
(:-':=583) Chi
Square
44. 7------60:1---"-4;-.5 ----~_:05 24.3 29.8 ;.9 <.05 4.2 13.8 1.2 <.05
15.1 27.5 18.0 <.05 1.5 5.0 1.4 ~S
3.3 1.4 0.9 SS 1.2 8.0 0.3 <.05
Racial Differences in Prison Violence
Table 6.8 tabulates infractions by race. In California, the only significant racial difference is that whites had the greatest incidence of contraband infractions (31 percent), followed by Hispanics (15 percent) and then blacks (15 percent). Racial differences for other infractions did not reach statistical significance, although there was a definite trend, with whites having a greater frequency of most infraction types, the only exception being major injury (where Hispanics have the greatest number).
The opposite situation exists in Michigan: Percentagewise, blacks have the most infractions classified as administrative, threat. and violence involving both major and minor injuries.
Texas resembles Michigan in that a greater percentage of the minority population (both blacks and Hispanics) has at least one infraction for each type-but there are significant differences between the races for administrative infractions and violence without injury only.
The analysis represented in Table 6.8 does not tah into account the actual number of infractions or how long an inmate has been in prison. An inmate with several infractions over a few months is clearly more troublesome than one who has the same number of infractions but has been in prison several years. Nor does it control for other factors that may be related to prison violence (e.g., agel. To account for their effects, we again used a multiple regression model, applied separately to each state.
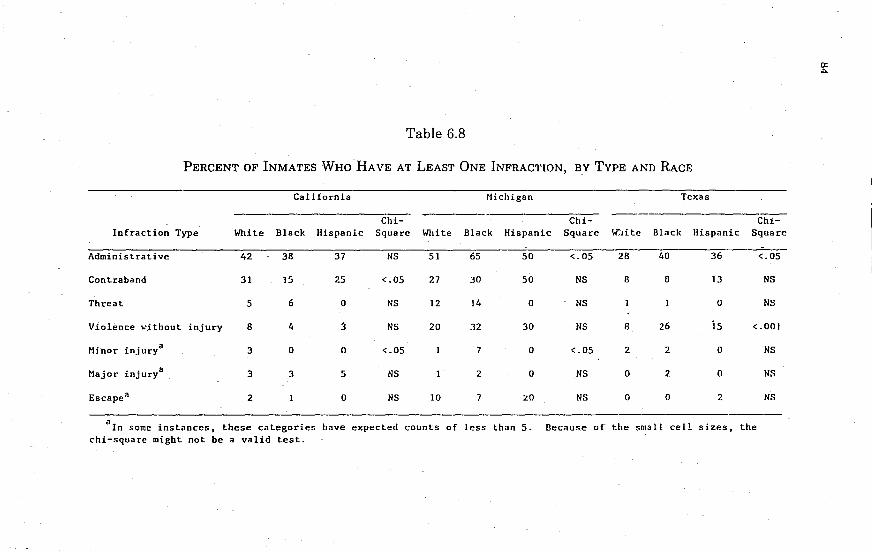
Table 6.8
PERCENT OF INMATES WHO HAVE AT LEAST ONE INFRACTION, BY TYPE AKD RACE
California Michigan Texas
Chi- Chi- Chi-Infraction Type White Black Hispanic Square White Black Hispanic Square W:lite Black Hispanic Square
Administrative 42 3B 37 NS 51 65 50 <.05 28 40 36 <.05
Contraband 31 15 25 <.05 27 30 50 NS 8 8 13 NS
Threat 5 6 0 NS 12 14 0 NS 0 NS
Violence ~ithout injury 8 4 3 NS 20 32 30 NS 8 26 is <.001
Mjnor injury a 3 0 0 <.05 7 0 <.05 2 2 0 NS
Major injury a 3 3 5 NS 2 0 NS 0 2 0 NS
Escapea 2 0 NS 10 7 ~O NS 0 0 2 NS
a ln some instances, these categories have expected counts of less than 5. Because of the small cell sizes, the chi-square might not be a valid test.
0: A
The Relation of Race and Other Factors to Prison Violence
85
For the regression analysis, we wanted our dependent variable to ref1ect both the number and seriousness of infractiuns. We therefore created a "weighted" infractions score by assigning administrative infractions a weight of 1, and adding a weight of 1 to each increasingly serious type of infraction. The infraction types thus had the following weights: administrative, 1; possession of contraband, 2; threat, 3; violence without injury, 4; minor injury, 5; I1.lajor injury, 6; and escape, 7. Each inmate's infractions were weighted, then summed, divided by the total number of months he had been in pris.on, and multiplied by 12 to get an annual rate. This weighted infractions rate is our dependent variable in the regression analysis. Our independent variables reflected both preprison and in-prison factors. They included:
• Age • Race • Prior adult and juvenile criminal record • Current conviction crime .. Age at first arrest • Having a prison work assignment • Extent of treatment program participation • Months served on this sentence
The complete regression results are reproduced in App. D. They show that in California, inmate age is most strongly (negatively) related to infractions. This is consistent with prior research. We also find significant inverse relationships for inmate race, prison work status, and treatment participation rates. Whites (the reference group) have significantly more infractions than blacks (although not substantially more than Hispanics). Further, all other things equal, inmates without prison jobs and with less exposure to treatment programs tend to have significantly higher infraction rates than their counterparts. The "idle" inmate represents the extreme case for these latter variables.
In Michigan, also, inmate age is most strongly (negatively) related to infractions. Further, only one of the four criminal history variables was statistically significant (p < .01): Criminals currently convicted of a nonviolent offense had higher infraction rates than those convicted of a violent offense. Unlike the results in California, inmate race was not significantly associated with infractions. Also, neither the degree to which the inmate had participated in treatment programs nor the inmate's prison work status was statistically associated with infractions.
86
In Texas, as in Michigan and California, there was a powerful (negative) relationship between inmate age and infraction rates. As was the case in California, race was statistically significant in Texas, but in the opposite direction: Black inmates in Texas had a higher infraction rate than whites. And, as in .Michigan, only one criminal history variable was significant: the number of prior convictions. Finally, as in California, Texas inmates with greater treatment program participation and prison work assignments had significantly lower rates of infractions than their counterparts.
In sum, the high-rate infractor for each state had the following profile:
• California: A young white inmate who has had limited exposure to treatment programs, and who currently has no prisun work assignment.
• Michigan: A young inmate serving a prison sentence for a nonviolent crime.
• Texas: A young black inmate with few serious convictions, who has had limited exposure to treatment programs and who currently has no prison work assignment.
These results show that criminal-history variables were less strongly related to infractions than certain inmate characteristics and in-prison variables. Of the six criminal history variables analyzed, none was significant in California, only one was significant in Michigan (conviction crime type), and only one in Texas (number of serious convictions). We conclude that knowing an inmate's criminal characteristics, other things being equal, does not appreciably increase our predictive capabilities regarding his negative prison behavior.
Of the other independent variables we examined, only inmate age was related to the infractions in all three states: As age increased, the level of infractions decreased. This powerful negative relationship with poor prison behavior confirms prior research.
Our findings on race were also consistent with earlier research; the data reveal mixed results. In Texas, black inmates had significantly higher scores than whites; the reverse was true in California. The sign of the race coefficient in Michigan, although not statistically significant, parallels that of Texas. One possible explanation for these inconsistent results may be different racial compositions in the three prison systems. In Texas and Michigan, blacks constitute the largest racial group; in California, whites are more prevalent. It would seem that the proportion of racial groups in prison is a factor worthy of further investigation in research on negative prison behavior.6
6We find some support for this notion already in the literature. One study of inmate behavior compared prisons where more than half of the inmates were white with pris-
87
We also found rather strong associations between idleness and infractions. Moreover, improvements in behavior were more related to having a work assignment than to treatment participation, but the best results were achieved by providing both. We make no causal inference here because our data do not permit us to determine whether idle inmates commit more violations than active inmates or whether inmates who commit more violations become idle, Le., lose their jobs or are removed from a treatment program as punishment.
Unravelling the causality in these relationships is vitally important, especially for examining racial differences in corrections. As we saw in looking at program participation, black inmates in Texas who had high need for education were less likely than whites to be in education programs. They were also less likely to have work assignments in Texas, and it is there that black inmates have a much higher percentage of infractions than whites.
All in all, our results for prison violence are more suggestive than conclusive. Like the findings on criminal motivation and weapon use, they imply that if officials are aware of and responding to these aspects of criminal behavior, they are doing so inconsistently. Blacks serve longer sentences than whites in California and Texas, but only in Texas do they have a higher percentage of infractions. The California and Texas sentencing models both showed that infractions (or punishment 00 were related to sentence length served. Yet, the black California inmates' relative lack of infractions evidently does not overcome any of the racial differences in sentence length.
CONCLUSIONS
Al though few of the findings are statistically significant, the study shows some racial differences in criminal motivation, weapon use, and prison behavior. However, these differences do little to explain why minorities are more likely than whites to go to prison and stay there longer.
All three groups rated economic distress as their strongest criminal motivation, and whites rated "high times" almost as high. One might expect probation officers, judges, and corrections officials to take a
ons where more than half were nonwhite. It found higher average levels of aggressive t.ntnsgressions, and was able lo explain 15 percenl more of lht, varialion. in high n.lnwhile facililies (Ellis et al., 1974), We find similar results despite the difl'ering foci. i.e .. state as opposed to institutional differences. Michigan (high black) has a higher average infraction rate than California (Jow black), although this does not hold true for Texas.
88
harsher view of "high times" as a motive. However, whites are not sentenced to prison as often or kept there as long. If economic distress is seen as an indicator of recidivism, one would expect prison rehabilitation efforts to focus on vocational training for blacks, who rated economic distress by far their strongest motivation. Yet, as Sec. 5 indicated, blacks were no more likely than whites to participate in vocational training programs.
The findings on weapon use are equally ambiguous. There were few' clear trends, but statistically significant racial differences. Hispanics strongly preferred knives and were more likely to report doing grievous harm to their victims. It seems possible that this behavior could legitimately lead to harsher sentences and longer time served. Blacks were much less likely than Hispanics to use a knife, and less likely than whites to use a gun. Indeed, when the study combined all crime types and looked at the overall percent of racial groups armed during a crime, there was only one statistically significant difference: Blacks were less likely to be armed in a burglary. Nevertheless, blacks make up a larger percent of the prison than of the arrest population for burglary.
We find very significant racial differences in prison behavior in the study states. Yet, those differences do not coincide with length of sentence served for similar crimes. For example, in California, whites have a signi5cantly higher rate of prison infractions than blacks. In Texas, the reverse is true. Yet in both states, blacks serve longer sentences.
Having looked at the criminal justice system's treatment of offenders and at offenders' behavior, we have still not been able to legitimately account for racial differences in post-arrest release rates, in sentencing, and in length of sentence served. In the next section, we summarize the major findings, draw some conclusions, and look at their impiications for future research.
VII. CONCLUSIONS AND IMPLICATIONS OF THE STUDY
For critics of the criminal justice system, the arrest and imprisonment rates for blacks and other minorities suggest that the system discriminates against those groups. They argue, for example, that blacks, who make up 12 percent of the national population, could not possibly commit 48 percent of the crime: Yet that is exactly what arrest and imprisonment rates imply about black criminality. Defenders of the system argue that the arrest and imprisonment rates do not lie; the system simply reacts to the prevalence of crime in the black community. As we have noted repeatedly, prior research has not. settled this controversy. For every study that finds discrimination in arrests, convictions, sentencing, prison treatment, or parole, another denies it.
This study has certainly not settled the issue. However, it has overcome the methodological limitations of most previous studies in two ways: ll) by controlling for more variables that may affect treatment
. of all offenders, and (2) by examining possible racial differences in handling at decision points throughout the system-not at merely one or two points. Further, it has a more comprehensive data base than many other studies because it includes information from both official records and prisoners' self-reports. The results indicate that there are some racial differences in criminal behavior and in the way offenders are treated in the study states. These findings raise important issues for the criminal justice system and suggest priorities for future research.
MAJOR FINDINGS
Before turning to the conclusions and their implications, it is useful to review the major findings. Table 7.1 summarizes particular findings in major categories.
Racial Differences in Case Processing
Although the case processing system generally treated offenders similarly, racial differences appeared at two key points, prefiling release and sentencing. White suspects were less likely than minorities
89
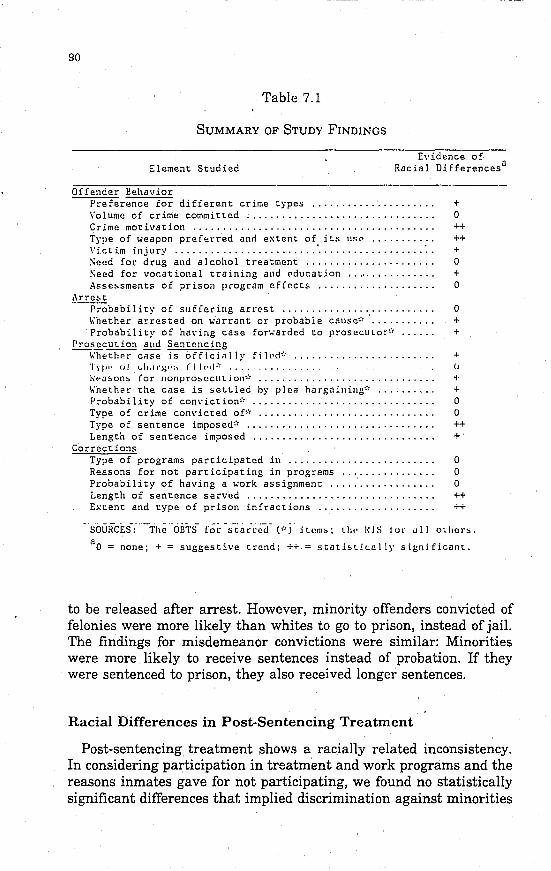
so
Table 7.1
SUMMARY OF STUDY FINDINGS
Element Studied Evidence of
Racial Differencesa
Offender Behavior Prefer~nce for different crime types..... ................ + Volume of crime committed................................ 0 Crime motivation......................................... ++ Type of weapon preferred and extent of its UR~ ........•.. ++ Victim injury ........................ · .................. ·.. + Seed for drug and alcohol treatment...................... 0 Seed for vocational training and pducation ..•............ + Asse~sments of prison p!'ogram eff!>ct5 .................... 0
Arre5t - Probability of suffering arrl?st .......................... 0
~hether arrested on warrant or probable cause* ........... + Probability of ha\'ing case fon. .. arded to prosecutor'" ...... +
Prosecution and Sentencing --\\'hethp.r cm is officiAlly filt,d;' ........................ +
Tyi'" 0/ <..1,.,,'.1;":' r i I,·d:' •.... (/ J.;,·u50n:' for 1I0npro:,ecution;' .............................. ~
"'hether the case is :,ettled hy plea bargainillg'" .......... + Probability of conviction* ............................... 0 Type of crime convicted of'" .............................. 0 Type of sentence imposed* ......................... ....... ++ Length of sentence imposed ...... ......................... +
Corrections Type of programs participated in ............... '" ....... 0 Reasons for not participating in programs................ 0 Probability of having a work assignment .... .............. 0 Length of sentence served ................................ ++ Extent and type of prison infractions.................... ++
"S6URCES-:'''-ihe'cii11'S [or's-tar'l:(;'d'U,j'it"m,,; tIlt· I~JS /01' illl otlte!'!;.
aO = none; + = suggestive trend; ++ = statistically significant.
to be released after arrest. However, minority offenders convicted of felonies were more likely than whites to go to prison, instead of jail. The findings for misdemeanor convictions were similar: Minorities were more likely to receive sentences instead of probation. If they were sentenced to prison, they also received longer sentences.
Racial Differences in Post-Sentencing Treatment
Post-sentencing treatment shows a racially related inconsistency. In considering participation in treatment and work programs and the reasons inmates gave for not participating, we found no statistically significant differences that implied discrimination against minorities
--------------------- ~
HI
in corrections. However, we found appreciable racial differences in length of sentence served. In California and Texas, when other major factors that might affect release decisions were controlled for, blacks and Hispanics consistently served longer than whites, and the disparity was even greater than the disparity in.sentences imposed. In California, blacks served slightly longer sentences, but the disparity largely reflected regional sentencing differences. In Michigan, corrections and parole decisions evidently worked in favor of black!-;. Alt.hough t.hpy init.i:dly n'c('iv(,(j s('nl.('nc('s (·ollsid(·r:dlly long(·,' t.h:1!1 those of whites, we found no racial differences in length of lime served. .
Racial Differences in Crime Commission Rates and Probability of Arrest
The high post-release rates for minorities do not indicate that police overarrest minorities in proportion to the kind and amount of crime they actually commit. Our analysis of the Inmate Survey data found that although different racial groups are more likely to commit particular crime types, there are no significant racial differences in crime commission rates. Annualized crime commission rates among white and minority criminals are about the same. Moreover, there are no consistent, statistically significant, racial differences in the probability of being arrested, given that a crime has been committed.
Racial Differences in Offender Behavior
There are some clear racial differences in criminal motivation, weapon use, and prison behavior, but most of them do not reach statistical significance. Blacks rated economic distress higher than other motivations for crime, but not significantly more so than other groups. Whites rated hedonistic motives significantly higher than did blacks or Hispanics. In weapons use, there were only two significant findings. Hispanics were much more likely than the other groups to use knives, and blacks were much less likely to be armed when committing burglary. Racial differences were strongest in prison behavior. In 'Texas, blacks had a much higher rate of infractions; in California, whites did.
92
CONCLUSIONS
Before discussing our conclusions, we emphasize again that, whenever the data were sufficient, our analyses of system decisions and criminal behavior controlled for the most obvious variables that could reasonably account for apparent racial differences. In these comparisons, then, our offenders are "interchangeable" except for race. It is also well to remember that our data came from only three states. Moreover, because our self-report data came from prisoners, conclusions drawn from those data are not. necessarily applicable to the criminal population at large.
Explaining Disparities in Case Processing and Time Served
At most major decision points, the criminal justice system does not discriminate against minorities, but race does affect prefiling release, sentence type and length imposed, and length of sentence served.
As Sec. IV indicated, minorities are clearly overrepresented in the arrest population, relative to their percentage of the general population. However, analysis of the RIS data shows that they are not overrepresented in the arrest population, relative to the number of crimes they actually commit. Nor do they have a higher probability than whites of being arrested for those crimes.
Despite these findings, the OBTS analysis raises a question that the study could not answer: If blacks and Hispanics are not being overarrested, why are police and prosecutors so much more likely to let them go without filing charges? One possibility is that the police more often arrest minorities on "probable-cause" evidence that subsequently fails to meet the filing standard of "evidence beyond a reasonable doubt." Assuming that the police arrest all races on similar evidence, why should that evidence fail to hold in minority cases?
Prior research may throw some light on this phenomenon. As Sec. IV showed, the vast majority of crimE:s committed do not result in arrest. For most types of crime, the probability of arrest is less than 15 percent. Research has shown that arrests depend heavily on witnesses or victims identifying or carefully describing the suspect (Greenwood, Chaiken, and Petersilia, 1977). The data show that prosecutors have a more difficult time making cases against minorities "beyond a reasonable doubt" because of problems with victim and witness identifications. Research has shown that both white and black witnesses and victims have a harder time making positive identifica-
tions of minority suspects than of white suspects. l Moreover, studies have shown that crimes against minority victims are most often committed by minority offenders, very often acquaintances. After the arrest, victims frequently refuse to prosecute, withdraw the identification, or refuse to testify.
Such "evidentiary" problems would help explain the disproportionate release rates for minorities, and the study found another racial difference in case processing that may account for more of this disproportion. The OBTS data show that more white than minority suspects were arrested with a warrant in the study period. Because the criteria for issuing a warrant are essentially the same as those for filing criminal charges, cases involving warrants would be less likely to develop evidentiary problems after arrest.
Although the use of warrants may explain why more minority than white suspects are released after arrest, it raises a provocative question: Why are the police apparently more hesitant to arrest white than minority suspects without a warrant? Again, it may be that it is harder to make a case worth filing against minority suspects. Yet, by taking the trouble to get warrants to arrest whites, the police implicitly indicate that the reverse is true. Or, their actions may reveal that they think it is "riskier" to arrest whites on "probable cause." They may assume that minorities are leSS likely than white suspects to make false arrest charges or other kinds of trouble if a case is not filed. Whatever their reasons, the racial differences in warrant arrests and release rates suggest that the police operate on different assumptions when arresting minorities and whites.
Other findings of the study tend to reinforce the hypothesis that the system implicitly regards minorities differently from white offenders. Controlling for seriousness of offense, for prior record, for prison violence-in short, the most important factors that are said to influence sentencing and parole decisions-the analysis still found that blacks and Hispanics are less likely to be given probation, more likely to receive prison sentences, more likely to get longer sentences, and more likely to serve a longer time in prison.
lFrequently, witnesses or victims who were supportive at the arrest stage become less cooperative as the case proceeds. In fact, one of the most important factors affecting case mortality is the victim's desire to want the criminal proceedings disbanded altogether (Gottfredson and Gottfredson, 1982). This is a common occurrence when there is a prior relationship between the victim and the defendant (Vera Institute of Justice, 1977), It also occurs when the victim has been intimidated or feels threatened by the defendant or by aspects of the criminal justice system. Research has also shown that a major factor distinguishing cooperative from uncooperative victims is simple confusion about where they were supposed to appear or what they were supposed to do when they got there (Hamilton, 1979). It is conceivable that these aspects might be more prevalent in cases involving minority defendants.
94
As Fig. 1.2 has shown, in very serious crimes·-where there is less room for discretion -in sentencing-blacks are represented about equally in the arrest and prison populations. In other words, the prevalence of these crimes among blacks primarily dictates their numbers in the prison population. However, as we move to property crimes, the disparity between the black proportion of the arrest population and the prison population becomes quite wide. This disparity implies that probation officers, judges, and parole boards are exercising discretion in sentencing and/or release decisions. In making these decisions, they are evidently responding to offenders in ways that result in de facto discrimination against blacks. The same is true for Hispanics, who served even longer time than blacks.
It is possible t~at the racial differences in the length and type of sentence imposed reflect in part the racial differences in plea bargaining and jury trials noted in Sec. III. Fully 92 percent of white defendants were convicted by plea bargaining, compared with 85 percent for black and 87 percent for Hispanic defendants. Those numbers imply the total percentages that engaged in plea bargaining-since, by nature, plea bargaining virtually ensures conviction. However, it also virtually guarantees a reduced charge and/or lighter sentencing. When defendants who do not plea bargain go to trial, they generally receive harsher sentences. As one study recently concluded:
The typical plea bargained case is much less likely to result in a state prison sentence, and is likely to receive a "much lighter" sentence at conviction than the typical case that goes to trial, and differences in sentencing between jury trials and plea bargained cases cannot be "explained away" by looking at the nature of the crime or the characteristics of the defendants in these cases (California Legislature, 1980, p. 59).
Our data show that of defendants prosecuted in Los Angeles County Superior Court, only 7 percent of whites were tried by jury, compared with 12 percent for blacks and 11 percent for Hispanics.
However, even if these mechanisms were found to account for some of the apparent racial differences in sentencing, the implication of racial bias simply shifts to another node in the system. Why should minorities plea bargain less and go to jury trial more than whites? If the differences represent defendants' attitudes and decisions, then the system is not actively responsible for this racial difference. However, it seems only just to try to find out why they make these decisions. If these differences reflect decisions by prosecutors or decisions by default, then the issue of bias returns. And it may reflect the kind of differences in the way minorities are regarded that are implied by the prefiling release rates for minorities.
95
The warrant and plea bargaining differences may indicate that white offenders simply know more about the system, and how to make it work for them, and that criminal justice officials are aware of this. However, in the case of plea bargaining, there may be other explanations. Other studies have shown that blacks are less able than whites to make bail and are more likely to have court appointed lawyers. Research has also shown that under those circumstances defendants are more likely to be convicted and to get harsher sentences. Apparently, both circumstances result in weaker cases for the defendant. In this situation, prosecutors may simply not be interested in plea bargaining. If the crime is serious enough and' the prosecution's case strong enough, the prosecutor's office has little to gain by offering the defendant a lower charge or a reduced sentence in exchange for a guilty plea. It is also possible that unless a minority defendant is represented by a sophisticated attorney, the prosecutor will not regard him as a candidate for plea bargaining.
It may be that discrimination enters into sentencing in another way, Judges may hesitate to send white defendants to prison for two reasons. First, research indicates that in prisons where whites are the minority, they are rather systematically and seriously victimized by the dominant racial group. Intuition suggests a straightforward, if cynical, explanation for this behavior. Minorities see the "white world" as responsible for all the deprivation and brutalization they have suffered. In the closed world of the prison, where guards cannot see everywhere all the time, minorities may push the right of "majority rule" to its logical extreme: They victimize white inmates to retaliate against the white world outside. In most states, blacks now out II II rnbl'r whitt's in t.he prison population. 'I'll!' nteial dill'cn'llccs in prison sentences may indicate judges' reluctance to send white defendants to black- or Hispanic-dominated facilities. Second, judges may regard whites as better candidates for rehabilitation, and therefore do not want to impose a prison sentence except as a last resort.
Research on sentence patterns lends support to the contention that the system "values" whites more than it does minorities. For example, Zimring, Eigen, and O'Malley (1976) found that black defendants who killed whites received life imprisonment or the death sentence more than twice as often as blacks who killed blacks. Other research has found this relationship for other crimes as well: Defendants receive harsher sentences if the victim is white and lesser sentences if he or she is black.:! If harsher sentences do indicate that minority status equals lower status in the criminal justice system, that equation may
2Records show also that the higher the status (education, profession, wealth) of a victim, the harsher the sentence.
96
also help explain why minorities serve longer terms, all other things held equal, than white prisoners.
This hypothesis makes a distinction between discrimination against minorities and the status accorded blacks in the system that may be too fine to be useful. If such perceptions of status do account for racial differences in prefiling release rates, sentence severity, and time served, the effect is much the same as it would be with overt and explicit racial bias-and probably harder to reform. Considering that the criminal justice system is supposed to represent "the people," it seems particularly unrealistic to expect,it to accord higher status than society in general does to people who characteristically occupy the bottom rungs of the socioeconomic ladder. However, the issue of socioeconomic characteristics provides another way of explaining the racial differences revealed by the study.
Information Used in Sentencing and Parole
Different officials are responsible for cases at v<:t.rious points in the system, and may have dissimilar objectives. They use different kinds of information to promote these objectives. As the accused moves through the system, more information about him is attached to his folder and that information is weighted differentially. Police and prosecutors are primarily concerned with 'Just deserts." Their legal mission is to assure that criminals are convicted. They concentrate on information they need to make arrests and secure convictions-primarily information about the crime and about the offender's prior record-according to strict legal rules.
The court must decide whether conviction is warranted and pass sentence. Judges also consider the nature of the crime and prior record in weighing just deserts, but they also weigh the defendant's potential for rehabilitation or recidivism. The central question is whether returning him to society through probation or a lighter sentence will create a serious risk for society. In deciding on probation, jail, or prison and sentence length for an offender, they consider his conviction crime, prior record, and his personal and socioeconomic characteristics.
To provide the latter material, probation officers in most counties prepare a pre-sentence investigation report (PSR) that contains a sentence recommendation. It is significant that probation officers, who have a social mission, not a prosecutorial one, handle the screening for sentencing. Probation officers are more concerned with analyzing and understanding the person and his situation, and they tend to deemphasize the legal technicalities of guilt and convictability, leaving that job to the prosecutor.
97
In intent and methodology, the PSR has been described as an effort to determine the "social credit rating of the individual" (Wallace, 1965). Its scope is practic¢lly unlimited. It describes the subject's family background, marital status, education and employment history, past encounters with the law, gang affiliation, drug and alcohol use. and the like. Most important, the PSR is the key document in S('1l t.('llci ng and paroll' decisions. I i.s n'('om !l1(,llcia t.iolls aI"(' g('lwra Ily followed by the sentencing judge, and in many si.at.('s it.s characteri7.ation of the defendant becomes the core of the parole board's case-summary file.
The influence of the PSR may help explain the racial differences in sentencing and time served: Minorities often appear in a bad light when they are assessed by such indicators of recidivism as family instability and unemployment. Blacks and Hispanics typically have more of the personal and socioeconomic characteristics associated with recidivism than white offenders have. When probation officers, judges, and parole boards use the PSR's objective indicators of recidivism as guides, they are often compelled to identify minorities as higher risks.
Our findings on time served suggest that these conjectures may be valid. Because of California's determinate sentencing policy, length of sentence imposed largely dictates length of time served. Thus, any racial disparities in time served there mostly reflect racial differences in sentencing. In contrast, Texas has 0. very individualized and highly discretionary parole proce$,S, which relies heavily on the kinds of information contained in the PSR. And there we find that parole decisions appreciably lengthen minority sentences-sentences that were longer at conviction to begin with.
Michigan provides the strongest evidence for our hypothesis. Since 1976, Michigan has based its parole considerations primarily on three indicators: length of juvenile record, violence of crime, and prison behavior. This practice seems to have overcome the racial disparity in length of time served. Although black defendants in Michigan receive sentences 7.2 months longer than those of whites (other factors held equaD, they do not serve significantly longer sentences. We need to examine the relation of indicators used and time served in other states. However, the Michigan experience suggests strongly that when parole decisions are guided by such indicators, racial disparities in time served might be reduced.
While it seems ideally desirable to eliminate these disparities, Home practical questions remain: By excluding socioeconomic and other extralegal indicators of recidivism, will parole boards be increasing the risk to society? Are those other indicators actually objective, race-
98
neutral indicators of recidivism that should be used to keep potential recidivists off the str.eets, regardless of the racial disparities they cause in sentencing and parole decisions?
If these apparently objective indicators of recidivism are valid, the criminal justice system is not discriminating against minorities in these sentencing and parole decisions. It is simply reflecting the larger racial problems of society. If we believe this is so, the system cannot do much about it, and criminal justice research can do little more than suggest that racial differences in the system are unlikely to disappear until society solves its racial problems. However, other research and the RIS data suggest that the indicators'ofrecidivism may themselves be less "race-neutral" than past research and practice have indicated.
Assessing the Indicators of Recidivism
The overrepresentation of minorities in aggregate arrest statistics has tended to obscure the fact that the criminal justice system and criminal justice research are, nevertheless, dealing with a criminal population that is half white and half minority. Unless minorities in that population have higher recidivism rates than whites, there is no reason why they should consistently be seen as presenting a higher risk of recidivism. There is clearly a much higher prevalence of crime among minorities, which largely accounts for their equal representation with whites in the criminal population. But there is no evidence that their recidivism rates are higher. \I
A minority male is almost four times more likely than a white male to have an index arrest in his lifetime: One in every two nonwhite males in large U.S. cities can expect to have at least one index arrest. However, the RIS data indicate that, once involved in crime, whites and minorities in the sample have virtually the same annual crime commission rates. This accords with Blumstein and Graddy's (1981) finding that the recidivism rate for index offenses is approximately .85 for both whites and nonwhites. Thus, the data suggest that large racial differences in aggregate arrest rates must be attributed primarily to differences in involvement, and not to different patterns among those who do participate. Under these circumstances, any empirically derived indicators of recidivism should target a roughly equal number of whites and minorities. In other words, even if recidivism among whites had different causes or correlates than recidivism among nonwhites, they should at least balance one another. They should not consistently identify nonwhites as more appropriate candidates for more severe treatment.
Then why does this happen? It may be due to the relative size and
99
diversity of the base populations. For example, the black portion of the criminal population draws from not only a much smaller but also a more homogeneous population, socioeconomically and culturally. That is, these people are more likely than their white counterparts to have common socioeconomic and cultural. characteristics. The white half of the criminal population domes from a vastly larger, more heterogeneous base. Individuals in it are motivated variously, and come from many different cultural, ethnic, and economic backgrounds. Consequently, the characteristics associated with "black criminality" are more consistent, more visible, more "countable," if you will, than those associated with white criminality. Moreover, because prevalence of crime is so much higher th~n incidence of crime {or recidivism) among minorities, characteristics associated with prevalence of crime among blacks (e.g., unemployment, family instability) may overwhelm indicators of prevalence for the entire criminal population. They may also mask indicators of recidivism that are common to both blacks and whites.
The findings on criminal motivation and economic need lend support to this hypothesis. Blacks rated economic distress much higher than "high times" and very much higher than "temper" as their motive for committing crime. They also rated it more highly than either whites or Hispanics did. Moreover, the black inmates were consistently identified as economically distressed by the study's criteria for economic need. These findings imply that socioeconomic characteristics are more consistently related to crime among blacks than they are among whites. Considering that blacks make up approximately half of the criminal population, their characteristics may have the same efIt'd on indicators of prevalence and recidivism that the extremely high crime rates of a few individuals have on mean crime rates.
This is a real vicious circle: As long as the "black experience" conduces to crime, blacks will be identified as potential recidivists, will serve prison terms instead of jail terms, will serve longer time, and will thus be identified as more serious criminals.
IMPLICATIONS OF THE STUDY FOR RESEARCH AND POLICY
These findings and conclusions raise some compelling issues for criminal justice research and policy. The first priority for both will be examination of the indicators used in sentencing and parole decisions.
100
Questions for Future Research
Assessing the Indicators of Recidivism. The criminal justice system is moving toward greater use of prediction tables that measure an offender's risk of recidivism. These tables are ba3ed on the actuarially determined risk associated with such factors as prior record and employment. This "categoric risk" technique does not assume that the facts of each case are unique. Rather, it assumes that the risk of recidivism is distributed fairly uniformly among groups of individuals who share certain characteristics. Some experts contend that this more objective technique reduces racial·disparities because it severely limits discretion and because the indicators ar:e racially neutral. We have argued, however, that these indicators may only appear racially neutral; in practice they may substantially overlap with racial status.
We need to reexamine the statistical methods and the evidence used to develop these risk-prediction schemes. As we just mentioned in discussing the indicators, the minority half of the criminal population probably has more characteristics in common, especially socioeconomic characteristics, than the whiLe half has. ConsequenUy, these characteristics statistically overwhelm others that might more precisely indicate the risk of recidivism for both whites and blacks. Worse, using socioeconomic factors that correlate highly with race will have the same effect as using race itself as an indicator. That would undoubtedly be ethically inappropriate.
To isolate these indicators of recidivism, analysts will need a methodology that permits them to control for homogeneity in the minority (largel'! black) half of the criminal population. Researchers will then have tu determine whether the resulting indicators still lead to more severe treatment of minorities. Assuming that we want a system that can discriminate between hgh and low probability of recidivism, we also need some standard of judicial review that balances the state's interest in accurate identification of recidivists against the imperative that group classifications should not be implicit race classifications.
For each indicator that has racial links, we need to ask: How much predictive efficiency would the state lose by omitting this indicator from its sentencing standards? Without it, could the state still adequately assess an offender's risk of recidivism? Thus framed, the issue is not whether prediction tables could (or should) be used, but to what extent the state should sacrifice a degree of prcdicLive efficiency Lo promote racial equity. Obviously, characteristics showing personal culpability (for example, prior convictions) should always be seen as acceptable factors for assessing risk. Even if minorities have a disproportionate number of them, these characteristics indicate individual not group status.
101
Post-Arrest Release Rates and Evidentiary Problems. Research should be done on racial differences in post-arrest release rates. The RIS data show that the police are not simply overarresting minorities, relative to the crimes they commit, and then having to let them go. However, our findings do not discount the charge that the police arrest minorities on weaker evidence. Nevertheless, previous research suggests that the bulk of cases dismissed before filing involved uncooperative victims, and other research has suggested that minority cases more often have problems with victims and witnesses. Future research could help resolve thege issues by asking why so many victims become uncooperative, whether the reasons differ in minority cases, and how often either the suspect or the criminal justice system itself intimidates victims or witnesses (Porter, 1982).
Racial Differences in Plea Bargaining and Sentence Severity. Racial differences in plea bargaining and jury trials might help explain why minorities receive harsher sentences. This study did not control for plea bargaining in analyzing racial differences in sentence severity. If future research establishes that plea bargaining does contribute to those differences, the next important research task would be to discover why minority defendants are less likely than whites to plea bargain and more likely to have jury trials. Do prosecutors consistently offer less attractive plea bargains to minority defendants, or do minority defendants simply insist more on jury trials?
Effect of Prisons' Racial Mix on Sentencing. This question deserves research attention: If judges become increasingly reluctant to send white offenders to prisons where blacks and Hispanics outnurn-1)('1' them, racial differences in sent.ence sl'vl'rit.y will widl'lI, and racial disproportions in prisons will grow. It will not be easy to resolve this sensitive question empirically. The first task would be to establish that judges are indeed influenced by reports that white prisoners are commonly and seriously victimized where they are the minority race. The second task would be to establish whether these reports are valid. That will be even more difficult because prisons are closed societies where much that happens is never known, much less recorded, by administrators. If research did establish that those reports are valid, the criminal justice system would face harder issues than sentencing practices. Among the most serious might be pressure for segregated facilities.
How Prison-Gang Membership Affects Length of Sentence Served. We need to look at the influence of gang-related activities on length of sentence served and participation in prison treatment and work programs. We found that minorities serve longer terms in some states--even when we controlled for other factors. However, we did
102
not have information on gang affiliation. In California, one out of every seven prisoners is currently held in administrative segregation, mostly for gang-related activities. Also, a greater proportion of the black and Hispanic inmates admit to gang membership. It may be that a greater proportion of minorities are in segregation because of gang affiliation, and that persons in segregation have restricted access to prison treatment and work programs. Since program participation affects release decisions--either in earning good-time credits or gaining parole release--gang affiliation may be an important contributing factor to racial differences in . length of sentence served.
The Prison Environment's Influence on In-Prison Behavior. Some inmates who were predicted to be high infractors exhibited rather exemplary behavior. The question here is the extent to which their good behavior can be attributed to their physical surroundings, e.g., specific security measures, inmate-to-staff ratio, recreational facilities, the total size of their institution, the particular housing arrangements, and so forth.
The Connection Between Prison Violence and Idleness. Prison administrators face both rising violence and shrinking budget.s. Research can help them cope by linding out more about the relaLiom;hip between idleness and prison violence and by identifying the kinds of inmates whose participation in programs will reduce violence the most. It may be that participation in prison treatment progrc~ms significantly reduces infractions for older inmates, while work assignments have similar effects for younger inmates. Being totally "idle" may cause the most violence in inmates younger than 25. Empirically based models of the relationship between inmate characteristics, programs, and violence could help prison administrators allocate their resources to combat violence. These models are also needed as a longrange planning tool. Prison administrators need "baseline" data upon which to predict the effects that particular changes might have on the level of prison violence (e.g., changes in inmate characteristics, reductions in prison programming budgets).
Policy Recommendations
Definitive policy recommendations must await findings from some of these research tasks, but we can recommend some interim policy initiatives.
Police and prosecutors need to be more aware of the difficulty of getting adequate evidence with which to convict minority suspects. The high release rates for minorities suggest that minority suspects are not as likely as whites to be identified from lineups or elsewhere, and
103
that victims or key witnesses in minority cases often prove uncooperative after the arrest has taken'place. Police and prosecutors may have to take greater pains to secure trust and cooperation of minority victims and witnesses.
The process of plea bargaining needs to ·be closely monitored for any indications that the plea agreements offered minorities are less attractive than those offered to whites. One means of assuring greater uniformity is to have a single deputy review all the plea negotiations. Again, their unfamiliarity with and distrust of the system may cause minorities to insist on a trial. If so, they should be informed that sentences resulting from jury trials are generally more severe.
Judges and probation officers must begin to distinguish between information concerning the defendant's personal culpability and information that reflects his social status. The latter information may not be as racially neutral or objective as previous research has indicated. Until the indicators of recidivism presently used have been reanalyzed, we recommend that officials weight the criminal's characteristics more heavily than socioeconomic indicators in sentencing and parole decisions-but not so heavily that they ignore clear indications that the defendant presents a risk to society.
To reduce prison violence, prison administrators should allocate available programs, particularly prison jobs, to young inmates. We know that younger inmates are responsible for most prison violence and that the level of violence can be reduced by having inmates participate in work and treatment programs.
Finally, rehabilitation should be given another look. It is perhaps unfashionable to speak of rehabilitation when prison administrators are faced with shrinking budgets, increased population, and more troublesome inmates. Most administrators have been forced to assign low priorities to treatment programs. Although rehabilitation programs have not yet fulfilled their initial promise, this trend's longrange implications are troubling. How can we hope to reduce an offender's propensity for crime if his ability to secure empJoyment or abstain from daily drug and alcohol use has not changed or has grown weaker since he was imprisoned?
The RIS data show that most inmates do not receive the treatment that they need. Two-thirds of the inmates who were chronically unemployed preceding their imprisonment failed to participate in vocational training programs. Two-thirds of those with alcohol problems did not receive alcohol treatment. And perhaps the biggest and most disturbing gap is in drug treatment. Approximately 20 to 40 percent of the inmates were very active drug users by their own admission and by official classifications, and they related drug use to their criminal activities. But in both California and Texas, 95 percent of inmates
104
who needed drug treatment failed to get it. (In Michigan, about half of the drug-dependent inmates received treatment.) For most programs, inmates who needed treatment reported that they failed to participate because they "did not have time" or believed they did not need the program. However, about one-third repo:rted that they did not participate in drug programs because there were no programs. This is especially disturbing in light of the fact that over half of those who did participate in drug programs believed that the program had benefited them in a number of ways, including an expected reduction in future criminality.
Our data show further that advances in treating the drug-dependent offender could significantly reduce crime. The RIS data on inmates show that the extent of drug use is one of the strongest predictors of a person's involvement in serious and frequent crime (Chaiken and Chaiken, 1982). Given this evidence, it seems imperative that prison administrators resist the current trend of cutting rehabilitation programs in general, and drug treatment programs specifically, in order to stretch the funds they have available. Such "economy" may prove very expensive in the end.
Like other public institutions, the criminal justice system faces tightening economic restrictions. It has had to make hard choices among policies, programs, and research priorities. However, we believe that there could be no more important priority for policy and research than attempting to identify those aspects of the system that permit harsher treatment of minorities.
This study leaves us with guarded optimism concerning the system and the personnel who operate it. We did not find widespread, conscious prejudice against certain racial groups. Rather, when we found racial disparities, they seem to have developed because the system adopted procedures without analyzing their possible effects on different racial groups. Criminal justice research and policy now need to look behind the scenes. They need to focus on the key actors and their decisionmaking: what information they use, how accurate it is, and whether its imposition affects particular racial groups unfairly_
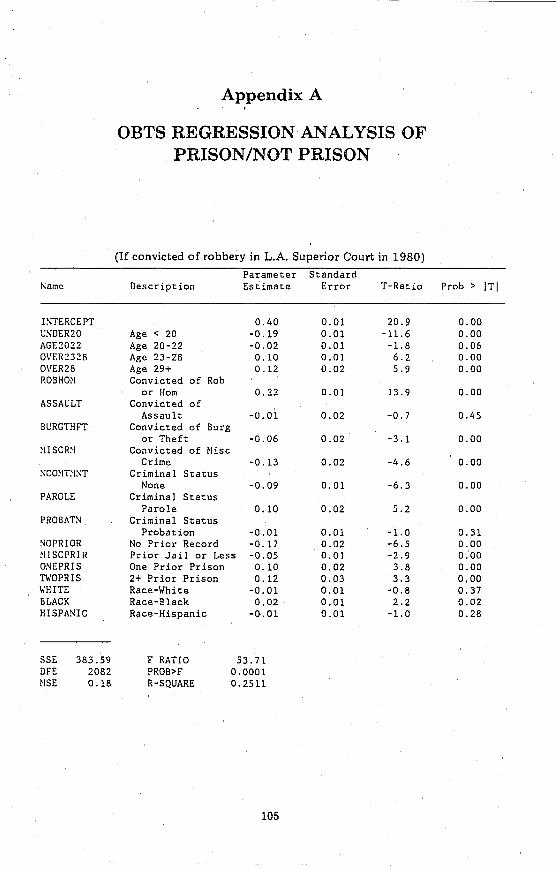
f,;amc
I:\TERCEPT USDER20 AGE2022 OVER2328 OVER28 ROBHON
ASSACLT
BURGTHFT
~!I SCR~I
!'lCO~tT~IST
PAROLE
PRO BATS
NOPRIOR ~IISCPRIR
ONEPRIS TWOPRIS WHITE BLACK HISPANIC
SSE 383.59 DFE 2082 ~tSE 0.18
Appendix A
OBTS REGRESSION ANALYSIS OF PRISON/NOT PRISON
(If convicted of robbery in L.A. Superior Court in 1980)
Parameter Standard Description Estimate Error T-Ratio
0.40 0.01 20.9 Age < 20 -0.19 0.01 -11. 6 Age 20-22 -0.02 0.01 -1.8 Age 23-28 0.10 0.01 6.2 Age 29+ 0.12 0.02 5.9 Convicted of Rob
or Hom 0.22 0.01 13.9 Convicted of
Assault -0.01 0.02 -0.7 Convicted of Burg
or Theft -0.06 0.02 -3.1 Convicted of msc
Crime -0.13 0.02 -4.6 Criminal Status
None -0.09 0.01 -6.3 Criminal Status
Parole 0.10 0.02 5.2 Criminal Status
Probation -0.01 0.01 -1.0 No Prior Record -0.17 0.02 -6.5 Prior Jail or Less -0.05 0.01 -2.9 One Prior Prison 0.10 0.02 3.8 2+ Prior Prison 0.12 0.03 3.3 Race-White -0.01 0.01 -0.8 Race-Black 0.02 0.01 2.2 Race-Hispanic -0.01 0.01 -1.0
F RATIO 53.71 PROB>F 0.0001 R-SQUARE 0.2511
105
Prob > ITI
0.00 0.00 0.06 0.00 0.00
0.00
0.45
0.00
0.00
0.00
0.00
0.31 0.00 0.00 0.00 0.00 0.37 0.02 0.28
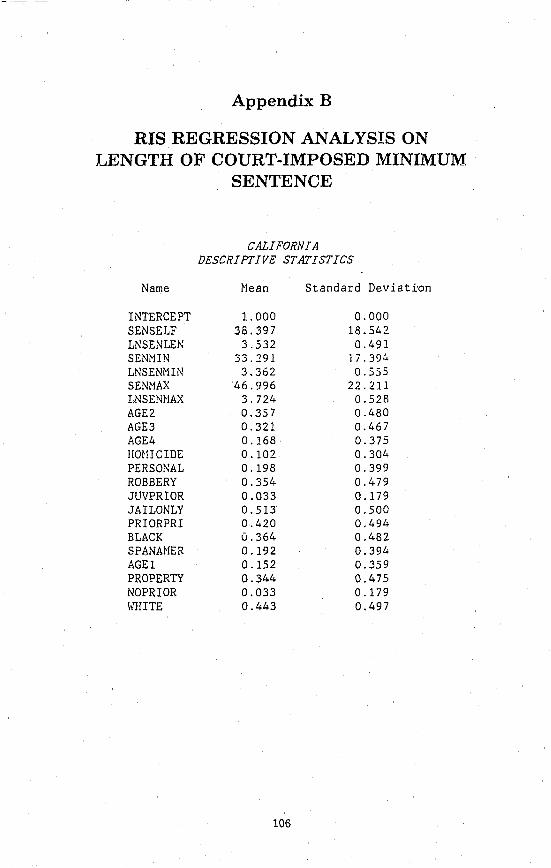
Appendix B
RIS REGRESSION ANALYSIS ON LENGTH OF COURT-IMPOSED MINIMUM
SENTENCE
CALIFORNIA DESCRIPTIVE STATISTICS
Name Nean Standard Deviation
INTERCEPT 1.000 0.000 SENSELF 38.397 18.542 LNSENLEN 3.532 0.491 SENMIN 33.291 17.394 LNSENMIN 3.362 0.555 SENMAX 46.996 22.211 LNSENNAX 3.724 0.528 AGE2 0.357 0.480 AGE3 0.321 0.467 AGE4 0.168 0.375 HOmCIDE 0.102 0.304 PERSONAL 0.198 0.399 ROBBERY 0.354 0.479 JUVPRIOR 0.033 0.179 JAILONLY 0.513 0.500 PRIORPRI 0.4.20 0.494 BLACK u.364 0.482 SPANANER 0.192 0.394 AGEl 0.152 0.359 PROPERTY 0.344 0.475 NOPRIOR 0.033 0.179 \VHITE 0.443 0.497
106
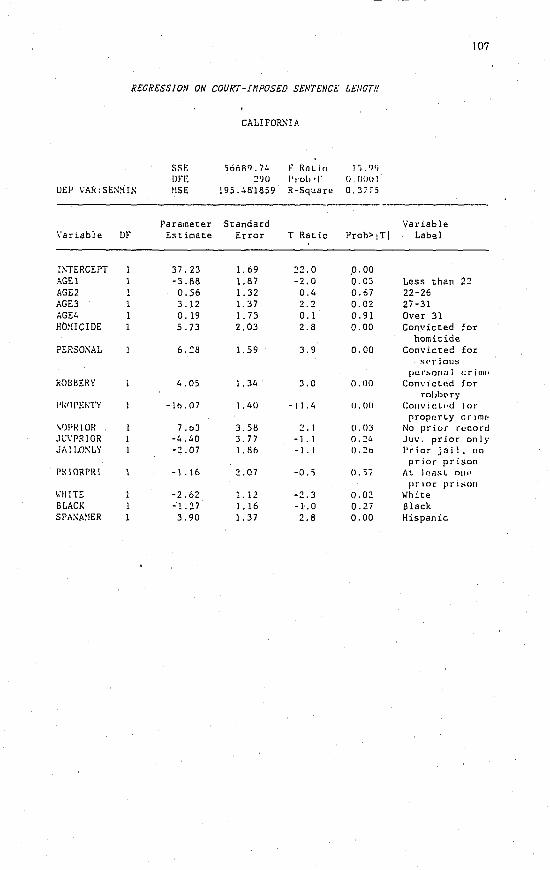
107
REGRESSJON ON COURT-JI1POSED SENTENCS U'NGTIf
CALIFOR!\IA
SSr: )hnBfJ.74 F RnL in 1 j. (Jq
DFE ~IJU l'rob·1' O.O()()I DEP VAR:SE:-';~IN NSE 195.481659 R-Square 0.37;5
Parameter Standard Variable \'ariable OF Estimate Error T Ratio Prob>ITI Label
r:--'TERCEPT 37.23 1.69 ~2.0 .0.00 AGEl -3.88 1. 87 -2.0 0.03 Less than 22 AGE2 0.36 1. 32 0.4 0.67 22-26 AGE3 3.12 1. 37 2.2 0.02 27-31 AGE4 0.19 1. 73 0.1 0.91 Over 31 HOmCIDE 3.73 2.03 2.8 0.00 Convicted for
homicide PERSO!\AL 6.~8 1. 39 3.9 0.00 Convicted for
spriolls pur~or1ill t,;r illl!'
ROBBERY 4.05 1. 34 3.0 n.oo Convicted for robbl'TY
1'1,r)PI·:l.:1'Y -lb.O] 1. 40 - I I. 4 !J.DI) COIIV i<:l"d for properly cr Imp
\OI'RIUR i.b3 3.58 2.1 (J.03 No prior record Jt.:\·PRIOR -4.40 3.77 -1.1 0.24 Juv. prior only JA I I.OSLY -2.07 1.1If> - I . I O.2b l'r ior ja i 1, no
pr ior prison PRIORPRI -1.16 2.07 -O.S O.';! III 1 (!IlSL 0111 1
pr lor pl' bOil
... HITE -2.62 1. 12 -2.3 0.02 White BLACK -1. 27 1. 16 -1.0 0.27 Black SPA:-';A~IER 3.90 1. 37 2.8 0.00 Hispanic
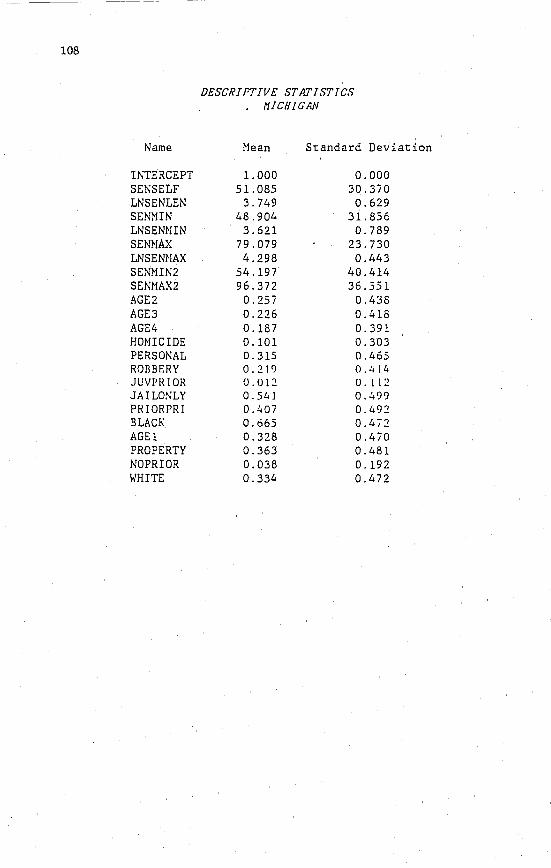
108
Name
INTERCEPT SEKSELF LNSENLEN SENNIN LNSENNIN SENNAX LNSENNAX SENNIN2 SENNAX2 AGE2 AGE3 AGE4 HmnCIDE PERSONAL ROIlBERY JUVI'RIOR JAILONLY PIUORPRI BLACK AGEl PROPERTY NOPRIOR WHITE
DESCRIPTIVE STATISTICS . I1JCHJ6'AN
~lean Standard Deviation
1.000 0.000 51. 085 30.370
3.749 0.629 48.904 31. 856
3.621 0.789 79.079 23.730 4.298 0.443
54.197 40.414 96.372 36.551
0.257 0.438 0.226 0.418 0.187 0.391 0.101 0.303 0.315 0.465 0.219 0.414 0.012 O. 112 0.541 0.499 0.407 0.492 0.665 0.472 0.328 0.470 0.363 0.481 0.038 0.192 0.334 0.472
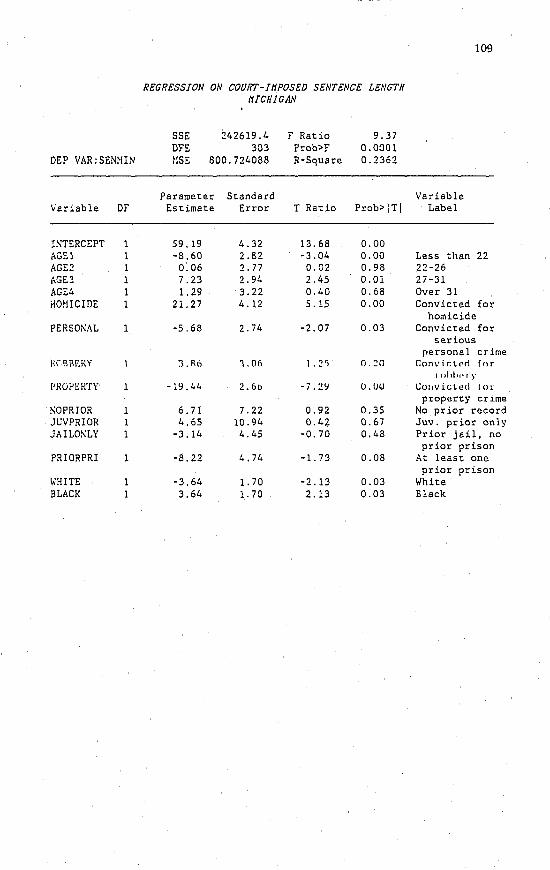
109
REGRESSION ON COORT-IHPOSED SENTENCE LENGTH HICHIGAN
SSE 242619.4 F Ratio 9.37 DFE 303 Prob>F 0.0001
DEP VAR: SENNIN ~!SE 800.724088 R-Square 0.2362
Parameter Standard Variable Variable DF Est:imate Error T Rat:io Prob>]T] Label
INTERCEPT 59.19 4.32 13.68 0.00 AGEl -8.60 2.82 -3.04 0.00 Less t:han 22 AGE::! 1 0.06 2.77 0.02 0.98 22-26 AGE3 1 7.23 2.94 2.45 0.01 27-31 AGE4 1 1. 29 3.22 0.40 0.68 Over 31 HONICIDE 21. 27 4.12 5.15 0.00 Convict:ed for
homicide PERSONAL -5.68 2.74 -2.07 0.03 Convict:ed for
serious personal crime
\,c:!lm,RY 3.1'6 1.06 1.:!1l n.::!o r.on\· i r.lI'Ci (rH'
I uhll.' ry PROPI::lffY -19.44 2.6b -7.:!Y U.UU CUlIvicted lot
propert:y crime SOPRIOR 1 6.71 7.22 0.92 0.35 No prior record JCVPRIOR 1 4.65 10.94 0.42 0.67 Juv. prior only JAILONLY 1 -3.14 4.45 -0.70 0.48 Prior jail, no
prior prison PRIORPRI 1 -8.22 4.74 -1. 73 0.08 At least: one
prior prison ImITE 1 -3.64 1. 70 -2.13 0.03 Whit:e BLACK 1 3.64 1. 70 2.13 0.03 Black
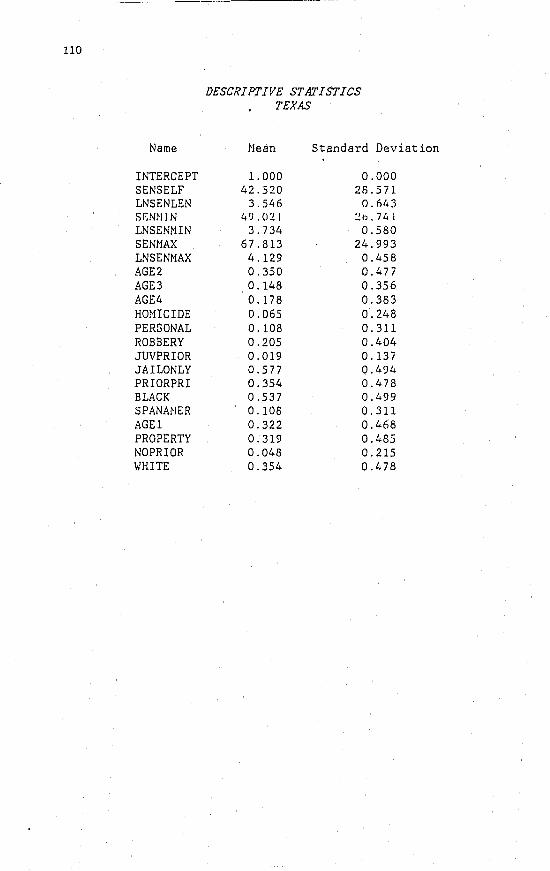
110
DESCRIPTIVE STATISTICS TEXAS
Name Nean Standard Deviation
INTERCEPT 1.000 0.000 SENSELF 42.520 28.571 LNSENLEN 3.546 0.643 SEN~IJ N 49.021 :.!b.74J
LNSENNIN 3.734 0.580 SENMAX 67.813 24.993 LNSENMAX 4.129 0.458 AGE2 0.350 0.477 AGE3 0.148 0.356 AGE4 0.178 0.383 HOmCIDE 0.065 0.248 PERSONAL 0.108 0.311 ROBBERY 0.205 0.404 JUVPRIOR 0.019 0.137 JAILONLY 0.577 0.494 PRIORPRI 0.354 0.478 BLACK 0.537 0.499 SPANANER 0.108 0.311 AGEl 0.322 0.468 PROPERTY 0.319 0.485 NOPRIOR 0.048 0.215 WHITE 0.354 0.478
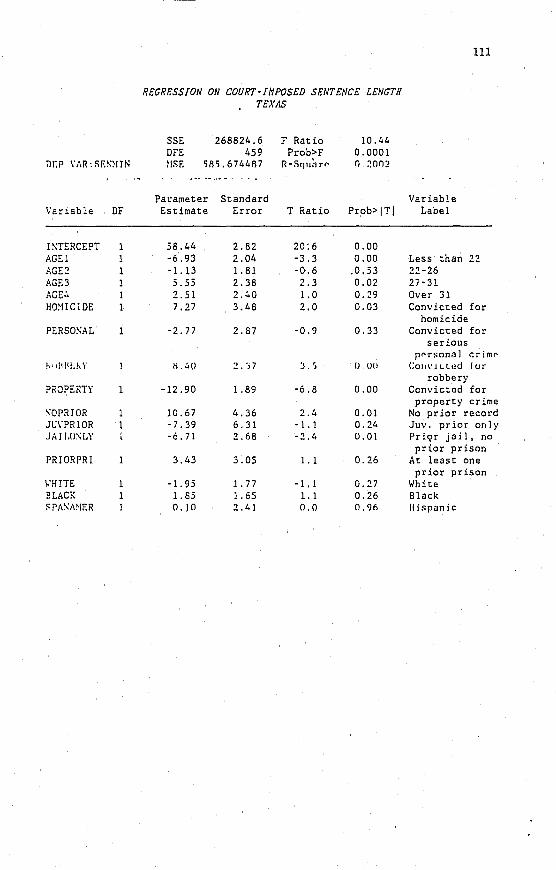
111
REGRESSION ON COURT-Iff POSED SENTENCE LENGTH TEXAS
SSE 268824.6 F Ratio 10.44 DFE 459 Prob>F 0.0001
nr.r \'AR: !'F.~mN ~I!'F. 5R5.6744R7 R-!''llJnr r 0 ~on2
.. ~ ~~ -~ .. -Parameter Standard Variable
Variable DF Estimate Error T Ratio Prob>ITI Label
I~TERCEPT 58.44 2.82 20:6 0.00 AGEl -6.93 2.04 -3.3 0.00 Less than 22 AGE::! 1 -1.13 1. 81 -0.6 .0.53 22-26 AGE3 1 5.55 2.38 2.3 0.02 2i-3l AGE:' 1 2.51 2.40 1.0 0.29 Over 31 HO~!lC] DE 1 7.27 3.48 2.0 0.03 Convicted for
homicide PERSO:\AL -2.77 2.87 -0.9 0.33 Convicted for
ser ious pf"rl'Onil] c:rimp
h' ,Jqq.h Y 1 ... :'0 :!. '; 7 :.L'j o,uo (;0111' J <.l !!d for robbery
PilOPERTY -12.90 1.89 -6.8 0.00 Convicted for property crime
SOrRIOR 10.67 4.36 2.4 0.0] No prior record Jl:\'PRIOR -7.39 6.31 - 1. 1 0.24 Juv. prior only JA r LOSLY -6.71 2.68 -2.4 0.01 Pri,\,r jai] • no
prior prison PRIORPRI 3.43 3.05 1.1 0.26 At least one
prior prison II'HITE -1. 95 1.i7 - 1. 1 0.27 White BLACK 1. 85 1. 65 1.1 0.26 Black !'rASA~IER 0.10 2.41 0.0 0.96 Hil'panic
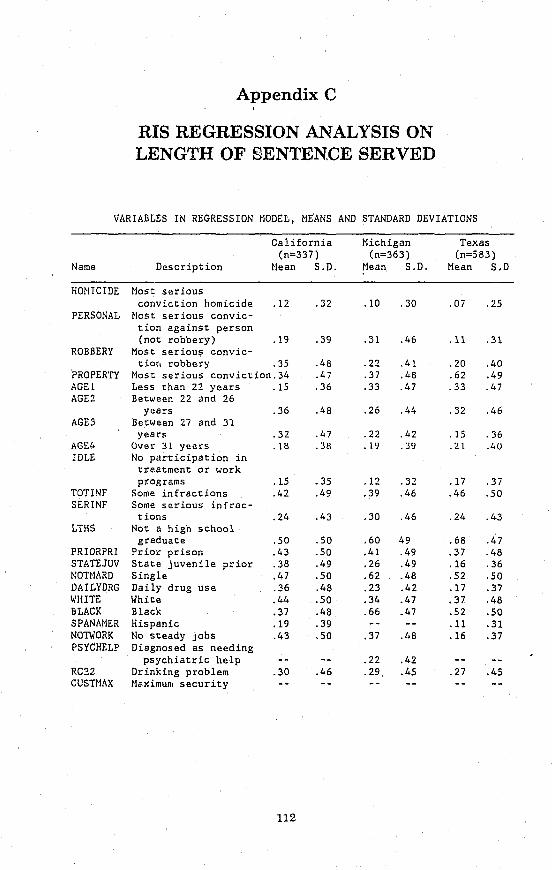
Appendix C
RIS REGRESSION ANALYSIS ON LENGTH OF 8ENTENCE SERVED
VARIABLES IN REGRESSION ~lODEL. MEANS AND STANDARD DEVIATIONS
California Michigan Texas (n=337) (n=363) (n=583)
Name Description Nean S.D. Nean S.D. Mean S.D
HmnCIDE Most serious conviction homicide .12 .32 .10 .30 .07 .25
PERSONAL ~lost serious convic-tion against person (not robbery) .19 .39 .31 .46 .ll .31
ROBBERY Most serious convic-tior, robbery .35 .48 .22 .41 .20 .40
PROPERTY Most serious conviction.34 .47 .37 .48 .62 .49 AGEL Less than 22 years .15 .36 .33 .47 .33 .47 AGE:! Between 22 and 26
years .36 .48 .26 .44 .32 .46 AGE3 Between 27 and 31
years .32 .47 .22 .42 .15 .36 AG!::4 Over 31 years .18 .38 .1'1 .3'1 .21 .40 IDLE No participation in
treatment or work pr,ograms .15 .35 .12 .32 .17 .37
TOTINF Some infractions .42 .49 .39 .46 .46 .50 SERINF Some serious infrac-
tions .24 .43 ,30 .46 .24 .43 LTHS Not a high school
graduate .50 .50 .60 49 .68 .47 PRIORPRI Prior prison .43 .50 ,41 .49 .37 .48 STATEJUV State juvenile prior .38 .49 .26 .49 .16 .36 NOTMARD Single .47 .50 ,62 .48 .52 .50 DAILYDRG Daily drug use .36 .48 ,23 .42 .17 .37 WHITE White .44 .50 ,34 .47 .37 .48 BLACK Black .37 .48 .66 .47 .52 .50 SPANM1ER Hispanic .19 .39 .11 .31 NOn/aRK No steady jobs .43 .50 .37 .48 .16 .37 PSYCHELP Diagnosed as needing
psychiatric help .22 .42 RC22 Drinking problem .30 .46 .29 .45 .27 .45 CUSnlAX M6.ximum security
112
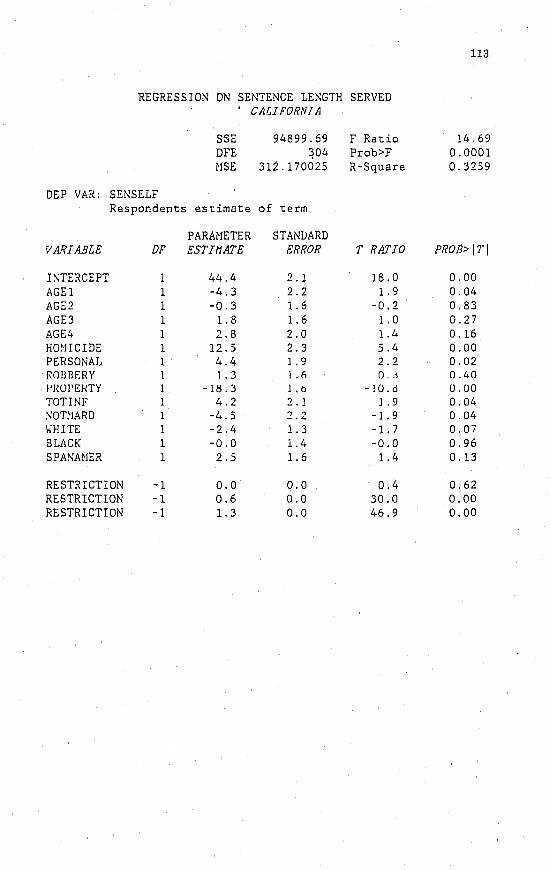
113
REGRESSION ON SENTENCE LE~GTH SERVED CAUFORNJA
SSE 94899.69 F Ratio 14.69 DFE ~04 Prob>F 0.0001 NSE 312.170025 R-Square 0.3259
DEP VAR: SEN SELF Respondents estimate of term
PARAMETER STANVARD VARIABLE DF ESTII1ATE ERROR T RATIO PROB>ITI
I:\TERCEPT 1 44.4 2.1 18.0 0.00 AGEl 1 -4.3 2.2 1.9 0.04 AGE2 1 -0.3 1.6 -0.2 0.83 AGE3 1 1.8 1.6 1.0 0.27 AGE4 1 2.8 2.0 1.4 0.16 HONICIDE 1 12.5 2.3 5.4 0.00 PERSONAL 1 4.4 l.9 2.2 0.02 ROBBERY 1.3 1.6 O .. ~ 0.40 I'IWI'ENTY -18.3 1. b -10.0 0.00 TOTINF 4.2 2.1 ] .9 0.04 ;-;OT~IARD 1 -4.5 ? ... _.<. -1.9 0.04 II"HITE 1 -2.4 l.3 -1. 7 0.07 BLACK 1 -0.0 1.4 -0.0 0.96 SPA!>:M!ER 1 2.5 l.6 1.4 0.13
RESTRICTION -1 0.0 0.0 0.4 0.62 RESTRICTION -1 0.6 0.0 30.0 0.00 RESTRICTION -1 1.3 0.0 46.9 0.00
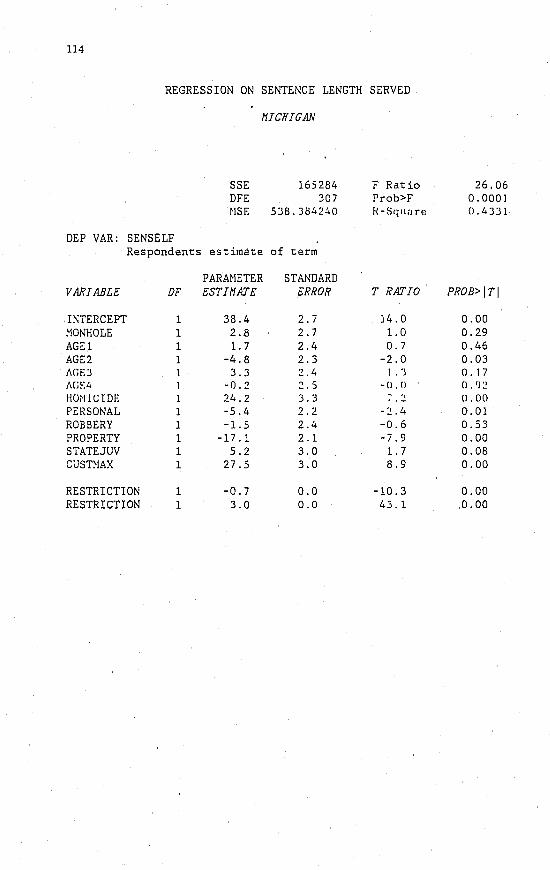
114
REGRESSION ON SENTENCE LENGTH SERVED
I1ICHIGAN
SSE 165284 F Ratio 26.06 DFE 307 Prob>F 0.0001 ~lSE 538.384:!40 X-Sqllare 0.4331
DEP VAR: SENSELF Respondents estimate of term
PARMIETER STANDARD VARIABLE DF ESTII1ATE ERROR T RATIO PROB>iTi
IKTERCEPT 1 38.4 2.i 14.0 0.00 ~IONHOLE 1 2.8 2.7 1.0 0.29 AGEl 1 1.7 2.4 0.7 0.46 AGE2 1 -4.8 2.3 -2.0 0.03 IIGE3 3.3 2.4 1 .• J 0.17 /1[;1-:4 -0.2 ~.5 -().o O. C):!
HmllCIDE 1 24.2 3.3 7.:! 0.00 PERSONAL 1 -5.4 2.2 -:!.4 0.01 ROBBERY 1 -1. 5 2.4 -0.6 0.53 PROPERTY 1 -17.1 2.1 -i.9 0.00 STATEJUV 1 5.2 3.0 1.7 0.08 CUST~IAX 1 27.5 3.0 8.9 0.00
RESTRICTION 1 -0.7 0.0 -10.3 0.00 RESTRICTION 1 3.0 0.0 43.1 0.00
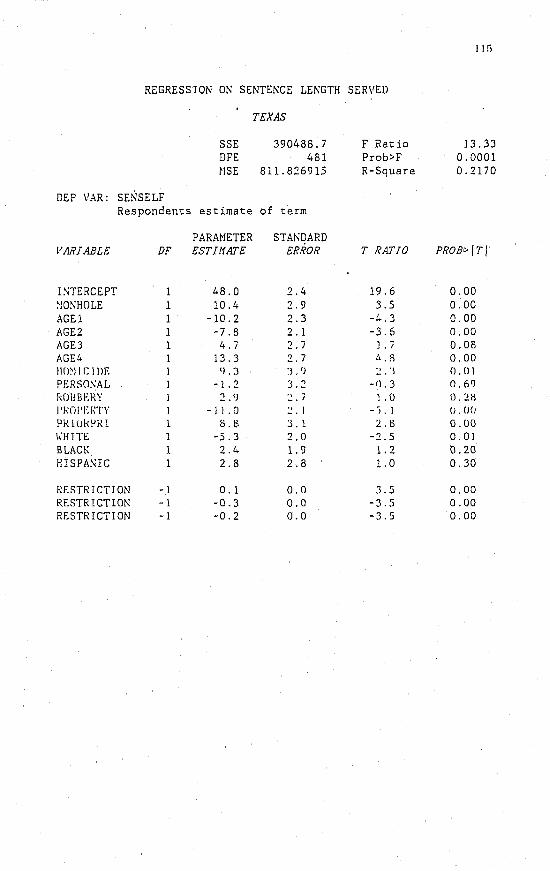
II :)
REGRESSION Or-; SENTENCE LEr-;GTH SERVED
TEXAS
SSE 390488.7 F Ratio 13.33 DFE 481 Prob>F 0.0001 ~lSE 811.826915 R-Square 0.2170
DEP VAR: SENSELF Respondents estimate of term
PARM1ETER STAKDARD VARIABLE DF ESTJI1ATE ERROR T RATIO PROB>ITI
I!'<TERCEPT 48.0 2.4 19.6 0.00 ~IOSHOLE 1 10.4 2.9 3.5 0.00 AGEl 1 -10.2 2.3 -!..3 0.00 AGE2 1 -7.8 2.1 -3.6 0.00 AGE3 1 4.7 2.7 1.7 0.08 AGE4 13.3 2.7 ~.R 0.00 1I0~11 r: IDE ').3 :J • ') :!.:l D.DI PERSO~AL -1.2 3.2 -0.3 0.6') f~OBBERY J 2. 'J ., -_. I 1 . () O.:!H 1'I\nl'J:r~TY I - J 1. 0 :!. J _.,. 1 ().()(J
PkiukPKl 1 0.0 3.1 2..0 0.00 liHITE 1 -5.3 2.0 -2.5 O.OJ BLACK 1 2.4 1.9 1.2 0.20 HISPA!\IC 1 2.8 2.8 1.0 0.30
RESTRTCTJON -1 0.1 0.0 3.5 0.00 RESTRICTION -1 -0.3 0.0 -3.5 0.00 RESTRICTION -1 -0.2 0.0 -3.5 0.00
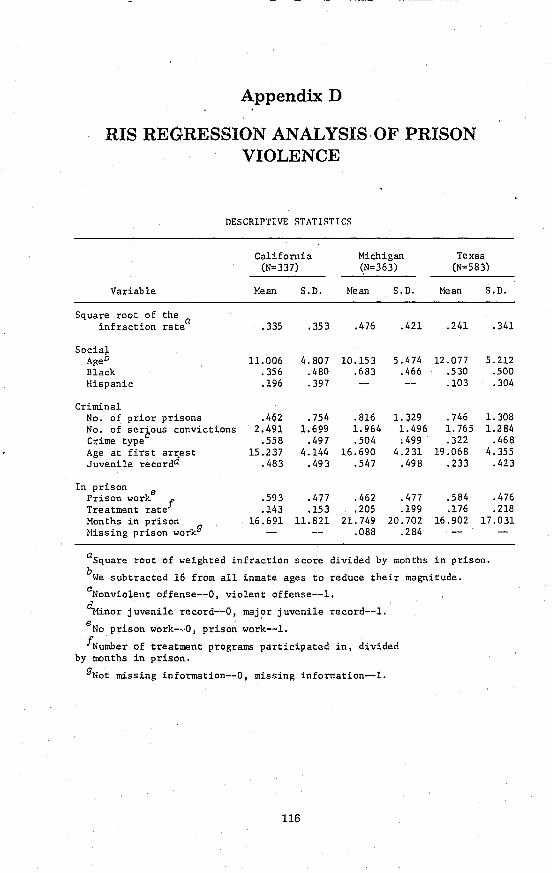
Appendix D . RIS REGRESSION ANALYSIS OF PRISON
VIOLENCE
nESCRIPTIVE STATISTICS
California Michigan Texas (N=337) (N=363) (N=583)
Variable Mean S.D. Mean S.D. Mean S.D.
Square root of the infraction ratea .335 .353 .476 .421 .241 .341
Social Ap.eo 11.006 4.807 10.153 5.474 12.077 5.212 Black .356 .480 .683 .466 .530 .500 Hispanic .196 .397 .103 .304
Criminal No. of prior prisons .462 .754 .816 1. 329 .746 1.308 No. of serious convictions 2.491 1.699 1. 964 1. 496 1. 765 1.284 Crime typeC .558 .497 .504 .499 .322 .468 Age at first arrest 15.237 4.144 16.690 4.231 19.068 4.355 Juvenile recordd .483 .493 .547 .498 .233 .423
In prison e .593 .477 .462 .477 .584 .476 Prison work
Treatment rate! .143 .153 .205 .199 .176 .218 Months in prison 16.691 11.821 21. 749 20.702 16.902 17.031 Missing prison workg .088 .284
aSquare root of weighted infraction score divided by months in prison.
OWe subtracted 16 from all inmate ages to reduce their magnitude.
cNonviolent offense--O, violent offense--1.
~nor juvenile record--O, major juvenile record--1.
e No prison work-·.·O, prison work--1.
!Number of treatment programs participated in, divided by months in prison.
gNot missing information--O, missing information-I.
l16
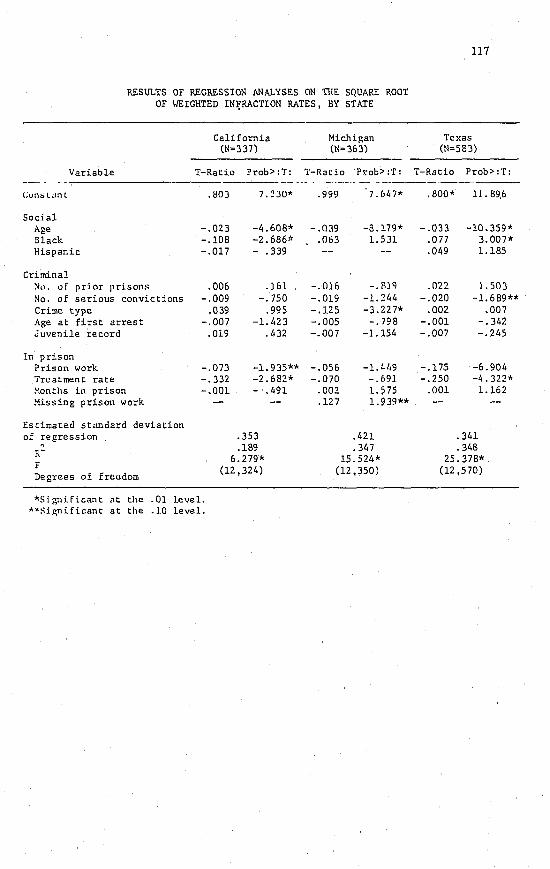
Variable
RESULTS OF REGRESSION ANALYSES ON TIlE SQUARE ROOT OF ~IGHTED IN~RACTION RATES, BY STATE
California (N=337)
T-Ratio Prob:>:T:
Michigan (N=363)
T-Ratio Pr.-ob>:T:
117
Texas (N=583)
T-Ratio Prob> :T: --. -. -- . --.-._-. - .------~.
CUllb L,Jlll .803 7.230*
Social Age -.023 -4.608* Black -.10B -2.686" Hispanic -.017 - . 339
Criminal ~~, . of prior prisons .006 .161 No. of serious convictions -.009 -.750 Crime type .039 .995 Age at first arrest -.007 -1. 423 Juvenile record .019 .432
In prison Prison work -.073 -1.935** Treatmen t rate -.332 -2.682* Months in prison -.001 - .491 Missing prison work
Estimated standard deviation of regression .353
~ .189 R-6.279*
F (12,324) Degrees of freedom
*SignifLcant at the .01 level. **Significant at the .10 level.
.999 7.6/'7* .BOO* 11.89.6
-.039 -8.179* -.033 -10.359* .063 1.531 .077 3.007*
.049 1.185
-.016 -.f'.1<J .022 1.503 -.019 -1. 24/, -.020 -1. 689** -.125 -3.227* .002 .007 -.005 -.798 -.001 -.342 -.007 -LIS/' -.007 -.2/'5
-.056 -1. 41,9 -.175 -6.904 -.070 -.69] -.250 -/'.322*
.002 1. 575 .001 1.162
.127 1.939**
./,21 .3/'1
.347 .348 15.524* 25.378*
(12,350) (12,570)
REFERENCES
Arnold, William R, "Race and Ethnicity Relative to Other Factors in J1.1vt:mile Court Dispositions," American Journal of Sociology, Vol. 77, 1971. .
Atkins, Burton, and Mark Pogrebin (eds.), The Invisible Justice System: Discretion and the Law, Ande~son Publishing Co., Cincinnati, Ohio, 1978.
Bailey, D'Army, "Inequities of the Parole System in California," Howard Law Journal, Vol. 17, 1973.
Baker, Timothy, Fredrica Mann, and C. Jack Friedman, "Selectivity in the Criminal Justice System," Prison Journal, Vol. 55, No.1, 1975.
Bennett, Lawrence, "The Study of Violence in California Prisons: A Review with Policy Implications," in Albert K. Cohen (ed.), Prison Violence. D.C. Heath and Company, Lexington, Massachusetts, 1976.
Bernstein, Ilene N., W. R Kelly, and P. A. Doyle, "Societal Reaction to Deviants: The Case of Criminal Defendants," American Sociological Review, Vol. 42, 1977.
Black, Donald J., "The Production of Crime Rates," American Sociological Review, Vol. 35, 1970.
Black, Donald J., and Albert J. Reiss, Jr., "Police Control of Juveniles," American Sociological Review, Vol. 35, 1970.
Blumstein, Alfred, "On the Racial Disproportionality of United States Prison Populations," The Journal of Criminal Law and Criminology, Vol. 73, No.3, 1982.
Blumstein, Alfred, and Jacqueline Cohen, "Estimation of Individual Crime Rates from Arrest Records," Journal of Criminal Law and Criminology, Vol. 70, No.4, 1979.
Blumstein, Alfred, and Elizabeth Graddy, "Prevalence and Recidivism in Index Arrests: A Feedback Model Approach," Law and Society Review, Vol. 16, No.2, 1982.
Bolte, Gordon, "Institutional Disobedience in a Maximum-Security Prison," Offender Rehabilitation, Vol. 3, Fall 1978.
Brewer, David, "Race and Prison Terms," unpublished manuscript, California Youth Authority, Sacramento, 1979.
Brown, Barry, and John Spevacek, Disciplinary Offenses and Disciplinary Offenders Under Two Correctional Climates, District of
119
120
Columbia Department of Corrections, Research Report No. 17, September 1969.
Bullock, Henry Allen, "Significance of the Racial Factor in the Length of Prison Sentences," Journal of Criminal Law, Criminology, and Police Science, Vol. 52, 1961..
Burke, Peter J., and Austin T. Turk, "Factors Affecting Postarrest Dispositions: A Model for Analysis," Social Problems, Vol. 2, 1975.
California Department of Justice, Adult Felony Arrest Dispositions in California, Bureau of Criminal Statistics and Special Services, Sacramento, California, 1981. .
--, Crime and Delinquency in California, Bqreau of Criminal Statistics and Special Services, Sacramento, California, 1978, 1979.
California State Legislature, Plea Bargaining, Sacramento, California,1980.
Carroll, Leo, and Margaret E. Mondrick, "Racial Bias in the Decision to Grant Parole," Law and Society Review, Vol. 11, No. I, Fall 1976, pp. 93-107.
Carter, Robert, "The Presentence Report and the Decisionmaking Process," Journal of Research in Crime and Delinquency, Vol. 4, 1967.
--, The Presentence Investigation Handbook, U.S. Department of Justice, Washington, D.C., 1978.
Chaiken, Jan, and Marcia Chaiken, Varieties of Criminal Behavior, The Rand Corporation, R-2814-NIJ, 1982.
Chaiken, Jan M., John E. Rolph, and Robert L. Houchens, Methods for Estimating Crime Rates of Individuals, The Rand Corporation, R-2730-NIJ, March 1981.
Chambliss, W. J., and R. H. Nagasawa, "On the Validity of Official Statistics: A Comparative Study of White, Black, and Japanese High School Boys," Journal of Research in Crime and Delinquency, Vol. 6, 1969.
Chiricos, Theodore B., and Gordon P. Waldo, "Socioeconomic Status and Criminal Sentencing: An Empirical Assessment of a Conflict Proposition," American Sociological Review, Vol. 40, 1975.
Christianson, Scott, "Corrections Law Developments: Legal Implications of Racially Disproportionate Incarceration Rates," Criminal Law Bulletin, Vol. 16, No.6, November-December 1980.
-- (ed.), Index to Minorities and Criminal Justice, The Center on Minorities and Criminal Justice, School of Criminal Justice, State University of New York at Albany, 1981.
--, "Racial Discrimination and Prison Confinement-A Follow-Up," Criminal Law Bulletin, Vol. 16, No. I, 1980.
Christianson, Scott, and Richard Dehais, The B lack Incarceration Rate in the United States: A Nationwide Problem, Office of
121
Criminal Justice Education and Training, U.S. Department of Justice, Washington, D.C:, August 1980.
Clarke, Stevens H., et al., "Felony Prosecution and Sentencing in North Carolina," University of North Carolina at Chapel Hill, 1982.
Clarke, Stevens H., and Gary G. Koch, "The Influence of Income and Other Factors on Whether Criminal Defendants Go to Prison," Law and Society Review, Vol. 11, No.1, Fall 1976.
Coe, Rodney, "Characteristics of Well Adjusted and Poorly Adjusted Inmates," Journal of Criminal Law, Criminology and Police Science, Vol. 52, No.2, July-August' 1961.
Coffee, John C., "The Future of Sentencing Reform: Emerging Legal Issues in the Individualization of Justice," Michigan Law Review 1361, Vol. 73, 1975.
Cohen, Lawrence, "Conferring the Delinquent Label: The Relative Importance of Social and Legal Factors in the Processing of Juvenile Offenders," Ph.D. Dissertation, University of Washington, Seattle, 1974.
Cohen, Lawrence E., and James R. Kluegel, "Determinants of Juvenile Court Dispositions: Ascriptive and Achieved Factors in Two Metropolitan Courts," American Sociological Review, Vol. 43, 1978.
Cohen, Lawrence E., James E. Kluegel, and Kenneth C. Land, "Social Inequality and Predatory Criminal Victimization: An Exposition and Test of a Formal Theory," American Sociological Review, Vol. 46, No.5, October 1981.
Collins, James, A Comparison of the Racial Distribution of Rape, Robbery, and Assault Offenders in Police and Victimization Data, Research Triangle Institute, Triangle Park, North Carolina, 1977.
Collins, James, et al., Criminality in a Drug Treatment Sample: Measurement Issues and Initial Findings, Research Triangle Institute, Triangle Park, North Carolina, 1982.
Conklin, John E., Robbery and the Criminal Justice System, J.B. Lippincott Co., Philadelphia, New York, Toronto, 1972.
Cook, Philip J., "A Strategic Choice Analysis of Robbery," Chap. 10 in Wesley G. Skogan (ed.), Sample Surveys of the Victims of Crime, Ballinger Publishing Co., Cambridge, Massachusetts, 1976.
--, The Role of Firearms in Violent Crimes: An Interpretive Review of the Literature, with Some New Findings and Suggestions for Future Research, Duke University, Durham, North Carolina, May 1981.
Cook, Philip, and Daniel Nagin, Does the Weapon Matter? Institute for Law and Social Research, Washington, D.C., 1979.
122
Crosby, Faye, Stephanie Bromley, and Leonard Saxe, "Recent Unobtrusive Studies of Black and White Discrimination and Prejudice: A Literature Review," Psychological Bulletin, Vol. 87, No. 3, 1980.
Curtis, Lynn A., Violence, Race, and Culture, D.C. Heath and Co., Lexington, Massachusetts, 1975.
Dannefer, Dale, and Russell K. Schutt, "Race and Juvenile Justice Processing in Court and Police Agencies," American Journal of Sociology, Vol. 87, No.5, 1982.
Dunbaugh, Frank M., "Racially Disproportionate Rates of Incarceration in the United States," Prison Law Monitor, Vol. 1, No.9, March 1979.
Elion, Victor H., and Edwin 1. Megargee, "Racial Identity, Length of Incarceration and Parole Decision Making," Journal of Research in Crime and Delinquency, July 1979.
Elliott, Delbert S., and Suzanne S. Ageton, "Reconciling Race and Class Differences in Self-Reported and Official Estimates of Delinquency," American Sociological Review, Vol. 45, No.1, February 1980.
Ellis, D., et al., "Violence in Prisons: A Sociological Analysis," American Journal of Sociology, Vol. 80, No.1, July 1974.
Feeley, Malcolm M., The Process Is the Punishment, Sage Publications, Beverly Hills, California, 1979.
Fehr, Larry, "The Disproportionate Representation of Racial Minorities in the Criminal Justice System of Washington State," Washington Council on Crime, Seattle, Washington, 1982.
Ferdinand, T. N., and E. G. Luchterhand, "Inner-City Youths, the Police, the Juvenile Court, and Justice," Social Problems, Vol. 17,1970.
Flanagan, Timothy J., Sentencing in Prison: The Relationship Between Conduct and Disposition in Prison Disciplinary Proceedings, Criminal Justice Research Center, New York, 1980.
--, "Correlates of Institutional Misconduct Among State Prisoners," Criminology, Vol. 21, No.1, 1983.
Foley, Linda A., The Effect of Extra-Legal Factors on Jurors' Decisions, University of North Florida, November 1980.
Forslund, Morris A., "Age, Occupation and Conviction Rates of White and Negro Males: A Case Study," The Rocky Mountain Social Science Journal, 1969.
Forst, B., J. Lucianovic, and S. Cox, What Happens After Arrest, Institute for Law and Social Research, Washington, D.C., August 1977.
Frazier, Charles E., E. Wilbur Bock, and John C. Henretta, "Pretrial Release and Bail Decisions," Criminology, Vol. 18, No.2, August 1980.
Fuller, Dan, and Thomas Orsagh, "Violence and Victimization Within a State Prison System," Criminal Justice Review, Vol. 2, No.2, Fall 1977.
Garber, Steven, Steven Klepper, and Daniel Nagin, The Role of Extralegal Factors in Determining Cr-iminal Case Disposition: Toward More Iieliable Statistical Inference, Carnegie-Mellon University, Pittsburgh, Pennsylvania, 1982.
Gibson, James L., "Race as a Determinant of Criminal Sentences: A Methodological Critique and a Case Study," Law and Society Review, Vol. 12, No.3, Spring 1978 ..
Gold, M., and D. J. Reimer, "Changing Patterns of Delinquent Behavior Among Americans 13 Through 16 Years Old: 1967-72," Crime and Delinquency Literature, Vol. 7, 1975.
Gordon, Robert A., "Prevalence: The Rare Datum in Delinquency Measurement and its Implications for the Theory of Delinquency," Chap. 8 in Malcolm W. Klein (ed.), The Juvenile Justice System, Sage Publications, Beverly Hills, California, 1976.
Gntti'redlion, Michael, and Don Gottfredson, Decision making in Criminal Justice: Toward the Rational Exercise 0/ Discretion, Ballinger, New York, 1982.
Green, Edward, "Inter- and Intra-Racial Crime Relative to Sentencing," Journal of Criminal Law, Criminology and Police Science, Vol. 55, 1964.
--, "Race, Social Status, and Criminal Arrest," American Sociological Review, Vol. 35, June 1970.
Greenberg, David, "The Incapacitative Effect of Imprisonment: Some Estimates," Law and Society Review, Vol. 9, No.4, 1975.
Greenfeld, Lawrence A., "Measuring the Application and Use of Punishment" (draft), National Institute of Justice, Washington, D.C., November 1981.
Greenwood, Peter W., "The Violent Offender in the Criminal Justice System," in Marvin E. Wolfgang and Neil Alan Weiner (eds.), Criminal Violence, Sage Publications, Beverly Hills, California, 1982.
Greenwood, Peter W., Jan M. Chaiken, and Joan Petersilia, The Criminal Investigation Process, D.C. Heath and Company, Lexington, Massachusetts, 1977.
Greenwood, Peter W., et a1., Prosecution of Adult Felony Defendants in Los Angeles Counly: A Policy Perspective, NaLionallnsliLule of' Law Enforcement and Crimina.l Justice, LEAA, U.S. Department of Justice, Washington, D.C., October 1973.
Hagan, John, "Extra-legal Attributes and Criminal Sentencing: An Assessment of Sociological Viewpoint," Law and Society Review, Vol. 8, 1974.
121\
Hamilton, William A., "Highlights of PROMIS Research," in William F. McDonald (ed.), The Prosecutor, Sage Publications, Beverly Hills, California, 1979.
lIindclang, M .• 1., Criminal Vi('timization in RiMht AlIlI'l'i('(111 Cities. Ballinger Publishing Co., Cambridge, Massachusetts, 197fi.
--, "Race and Involvement in Common Law Personal Crimes," American Sociological Review, Vol. 43, 1978.
Hindelang, M. J., Travis Hirschi, and Joseph G. Weis, "Correlates of Delinquency: The Illusion of Discrepancy Between Self-Report and Official Measures," American Sociological Review, Vol. 44, 1979.
--, Measuring Delinquency, Sage Library of Social Research, Vol. 123, Sage Publications, Beverly Hills, California, 1981.
Hindelang, M. J., and M. Joan McDermott, Juvenile Criminal Behavior: An Analysis of Rates and Victim Characteristics, Analysis of National Crime Victimization Survey Data to Study Serious Delinquent Behavior, Research Monograph 2, National Institute for Juvenile Justice and Delinquency Prevention, U.S. Department of Justice, Washington, D.C., 1981.
Hirschi, Travis, Causes of Delinquency, University of California Press, Berkeley, 1969.
Hoffman, Peter B., and Sheldon Adelberg, "The Salient Factor Score: A Nontechnical Overview," Federal Probation, Vol. 44, Table IV, March 1980, pp. 44-52.
Hoffman, Peter B., and Lucille K. DeGostin, "Parole Decisionmaking: Structuring Discretion," Federal Probation, Vol. 38, December 1974.
Holland, T. R., and N. S. Johnson, "Offender Ethnicity and Presentence Decisionmaking," Criminal Justice and Behavior, Vol. 6, 1979.
Honig, Paul K., The Prison Experience of Career Criminals: Current Practice and Future Considerations, The Rand Corporation, P-6178, July 1978.
Inciardi, J., and C. Chambers, "Unreported Criminal Involvement of Narcotic Addicts," Journal of Drug Issues, Vol. 2, 1972.
Jacob, Herbert, and James Eisenstein, "Sentences and Other Sanctions in the Criminal Courts of Baltimore, Chicago, and Detroit," Political Science Quarterly, Vol. 90, No.4, Winter 1975-76.
Jaman, Dorothy, Behavior During the First Year in Prison, Report III-Background Characteristics as Predictors of Behavior and Misbehavior, California Department of Corrections, Sacramento, California, March 1972.
Johnson, Elmer H., "Pilot Study: Age, Race and Recidivism as Factors
125
in Prisoner Infractions," Canadian Journal of Corrections. Vol. 8,1966.
Just, Bernice, "Bail and Pre-trial Detention in the District of Columbia: An Empirical Analysis," Howard Law Journal, Vol. 17, 1973.
Kalish, C., Prisoners at Midyear 1981, Bureau of Justice Statistics Bulletin, U.S. Department of Justice, Washington, D.C., September 1981.
Kleck, Gary, "Racial Discrimination in Criminal Sentencing: Critical Evaluation of the Evidence with A-dditional Evidence on the Death Penalty," American Sociological Review, Vol. 46, December 1981.
Klepper, Steven, Daniel Nagin, and Luke Tierney, Discrimination in the Criminal Justice System: Critical Appraisal of the Literature and Suggestions for Future Research, Carnegie-Mellon University, Pittsburgh, Pennsylvania, 1982.
La Free, Gary D., "The Effect of Sexual Stratification by Race on Official Reactions to Rape," American Sociological Review, Vol. 45, No.5, October 1980a.
--, "Variables Affecting Guilty Pleas and Convictions in Rape Cases: Toward a Social Theory of Rape Processing," Social Forces, Vol. 58, No.3, March 1980b.
Lizotte, Alan J., "Extra-Legal Factors in Chicago's Criminal Courts: Testing the Conflict Model of Criminal Justice," Social Problems, Vol. 25, No.5, 1977.
Loftus, Elizabeth, Eyewitness Testimony, Harvard University Press, Boston, Massachusetts, 1979.
Marquis, Kent H., and Patricia Ebener, Quality of Prisoner Self-Reports: Arrest and Conviction Response Errors, The Rand Corporation, R-2637-DOJ, 1981.
McCarthy, John P., Jr., Report of the Sentencing Guidelines Project on the Relationship Between Race and Sentencing, Administrative Office of the Courts, State of New Jersey, 1979.
McCarthy, John, and Neil Sheflin, "Report on the Relationship Between Race and Sentencing," Administrative Office of the Courts, State of New Jersey, 1979.
McDonald, William F., Henry H. Rossman, and James A. Cramer, Police-Prosecutor Relations in the United States, Institute of Criminal Law and Procedure, University Law Center, Georgetown University, Washington, D.C., 1981.
Meyers, Martha A., "Predicting the Behavior of Law: A Test of Two Models," Law and Society Review, Vol. 14, 1980.
Monahan, John, Stanley L. Brodsky, and Saleem A. Shah, Predicting Violent Behavior: An Assessment of Clinical Techniques, Sage Publications, Beverly Hills, California, 1982.
126
Morris, Norval, and Michael Tonry (eds.), Crime and Justice, Vol. 2, The University of Chicago Press, Chicago, Illinois, 1980.
Myers, Louis, and Girard Levy, "Description and Prediction of the Intractable Inmate," Journal of Research in Crime and Delinquency, Vol. 15, No.2, July 1978 ..
National Institute of Corrections, United States Department of Justice, "Minutes of Conference on Incarcerated Minorities," uno. published memorandum, 1979.
National Minority Advisory Council on Criminal Justice, The Inequality of Justice: A Report on Cr.ime and the Administration of Justice. in the Minority Community, Office of Justice Assistance, Research and Statistics, U.S. Department of Justice, Washington, D.C., September 1980.
Owens, Charles E., and Jimmy Bell (eds.), Blacks and Criminal Justice, D.C. Heath and Co., Lexington, Massachusetts, 1977.
Pannell, William C., Sentencing Practices Under the Determinate Sentencing Law, Board of Prison Terms, State of California, Sacramento, 1981.
Petersen, David M., and Paul C. Friday, "Early Release from Incarceration: Race as a Factor in the URe of Shock Probation," The Journal of Criminal Law and Criminology, Vol. 66, No.1, 1975.
Petersilia, Joan, "Which Inmates Participate in Prison Treatment Programs," Journal of Offender Counseling and Rehabilitation, Vol. 4, No.2, 1980.
--, "The Validity of Criminality Data Derived from Personal Interviews," in Charles F. Wellford (ed.), Quantitative Studies in Criminology, Sage Publications, Beverly Hills, California, 1978.
Petersilia, Joan, and Peter W. Greenwood, with Marvin Lavin, Criminal Careers of Habitual Felons, The Rand Corporation, R-2144-DOJ, August 1977.
Petersilia, Joan, Paul Honig, and C. A. Hubay, Jr., The Prison Experience of Career Criminals, The Rand Corporation, R-2511-DOJ, May 1980.
Peterson, Mark A., and Harriet B. Braiker, with Suzanne M. Polich, Who Commits Crimes: A Survey of Prison Inmates, Oelgeschlager, Gunn & Hain Publishers, Inc., Cambridge, Massachusetts, 1981.
Peterson, Mark, et al., Survey of Prison and Jail Inmates: Background and Method, The Rand Corporation, N-1635-NIJ, 1982.
Piliavin, Irving, and Scott Briar, "Police Encounters with Juveniles," American Journal of Sociology, Vol. 70, September 1964.
Pope, Carl E., "The Influence of Social and Legal Factors on Sentence Dispositions: A Preliminary Analysis of Offender-Based Transaction Statistics," Journal of Criminal Justice, Vol. 4, 1976.
127
--, Offender-Based Transaction Statistics: New Directions in Data Collection and Reporting, National Criminal Justice Information and Statistics Service, LEAA, U.S. Department of Justice, Washington, D.C., 1975a.
--, "Postarrest Release Decisions: An EIlfpirical Examination of Social and Legal Criteria," Journal of Research in Crime and Delinquency, Vol. 15, January 1978.
--, "Race and Crime Revisited," Journal of Research in Crime and Delinquency, Vol. 16, July 1979.
--, Sentencing of California Felony Offenders, National Criminal Justice Information and Statistics Service, LEAA, U.S. Department of Justice, Washington, D.C., 1975b ..
Pope, Carl E., and William H. Feyerherm, "Race and Juvenile Court Dispositions: An Examination of Initial Screening Decisions," Criminal Justice and Behavior, Vol. 8, No.3, September 1981.
Porter, Bruce, "California Prison Gangs," Corrections Magazine, Vol. 8, No.6, December 1982.
Radelet, Michael L., "Racial Characteristics and the Imposition of the Death Penalty," American Sociological Review, Vol. 46, December 1981.
Reiss, Albert J., Jr., "Discretionary Justice in the United States," Internq,tional Journal of Criminology and Penology, Vol. 2, 1974.
Rolph, John E., Jan M. Chaiken, and Robert L. Houchens, Methods for Estimating Crime Rates of Individuals, The Rand Corporation, R-2730-NIJ, March 1981.
Scott, Joseph E., "The Use of Discretion in Determining the Severity of Punishment for Incarcerated Offenders," The Journal of Criminal Law and Criminology, Vol. 65, No.2, 1974.
Sellin, Thorsten, and Marvin E. Wolfgang, The Measurement of Delinquency, John Wiley & Sons, New York, 1964.
Shinnar, S., and R. Shinnar, "The Effects of the Criminal Justice System on the Control of Crime: A Quantitative Approach," Law and Society Review, Vol. 9, 1975.
Silberman, Charles E., Criminal Violence, Criminal Justice, Random House, New York, 1978.
Spohn, Cassia, John Gruhl, and Susan Welch, "The Effect of Race on Sentencing: A Re-Examination of an Unsettled Question," Law and Society Review, Vol. 16, No.1, 1981-82.
Swigert, Victoria L., and Ronald A. Fatrell, "Normal Homicides and the Law," American Sociological Review, Vol. 42, No.1, February 1977.
Terry, Robert, "Discrimination in the Handling of Juvenile Offenders by Social-Control Agencies," Journal of Research in Crime and Delinquency, Vol. 4, 1967.
128
Thornberry, Terence P., "Race, Socioeconomic Status and Sentencing in the Juvenile Justice System," The Journal of Criminal Law and Criminology, Vol. 64, No.1, 1973.
Tiffany, Lawrence P., Yakov Avichai, and Geoffrey W. Peters, "A Statistical Analysis of Sentencing in. Federal Courts: Defendants Convicted After Trial, 1967-1968," Journal of Legal Studies, Vol. 4, No.2, June 1975.
U.S. Department of Justice, "The Prevalence of Crime," Bureau of Justice Statistics, Vol. 4, Washington, D.C., 1982.
Un never, James D., Charles E. Frazier, and John C. Henretta, "Race Differences in Criminal Sentencing," The Sociological Quarterly 21, Vol. 21, Spring 1980.
Vera Institute of Justice, Felony Arrests: Their Prosecution and Disposition in New York City's Courts, New York, New York, 1977; rev. ed., Longman, Inc., New York, 1981.
Wallace, John, Aids in Sentencing, 40 F.RD., 433, at 433, 1965. Williams, J. R, and M. Gold, "From Delinquent Behavior to Official
Delinquency," Social Problems, Vol. 20, 1972. Wolfgang, Marvin, "Quantitative Analysis 0(' Adjust.menL Lo Lilt' Pris
on Community," Journal o/'Criminal Law, Criminology and ?vlice Science, Vol. 51, 1961.
Wolfgang, M., R M. Figlio, and T. Sellin, Delinquency in a Birth Cohort, University of Chicago Press, Chicago, 1972.
Wolfgang, Marvin E., and Paul E. Tracy, The 1945 and 1958 Birth Cohorts: A Comparison of the Prevalence, Incidence, and Severity of Delinquent Behavior, Harvard University and the John F. Kennedy School of Government, Cambridge, Massachusetts, 1982.
Wright, James D., and P. Rossi, Weapons, Crime, and Violence in America, U.S. Department of Justice, Washington, D.C., 1981.
Zalman, Marvin, et aI., Sentencing in Michigan, State Court Administrative Office, Lansing, Michigan, 1979.
Zeisel, Hans, "The Disposition of Felony Arrests," American Bar Foundation Research Journal, No.2, Spring 1981.
Zimring, Franklin E., Joel Eigen, and Sheila O'Malley, "Punishing Homicide in Philadelphia: Perspectives on the Death Penalty," The University of Chicago L~w Review, Vol. 43, No.2, Winter 197b.


![DNA, RACIAL DISPARITIES, AND BIASES IN CRIMINAL … · 95 DNA, RACIAL DISPARITIES, AND BIASES IN CRIMINAL JUSTICE: SEARCHING FOR SOLUTIONS Jennifer K. Wagner.1 “[W]e remain imprisoned](https://img.pdfslide.net/doc/110x75/5c552ba693f3c32d6821abb6/dna-racial-disparities-and-biases-in-criminal-95-dna-racial-disparities.jpg)