Embed Size (px)
Citation preview
570
Racial/ethnic minority groups now make up 36% of the US population and are expected to reach 53% by 2050.1,2
The 2 most rapidly growing racial/ethnic minority groups are Hispanic/Latino and Asian Americans (Asian Indian, Chinese, Filipino, Japanese, Korean, Vietnamese), which are expected to double in size by 2050 to 110 million and 30 million, respectively.1,2 A growing body of evidence indicates variation in cardiovascular disease (CVD) burden among racial/ethnic subgroups, with blacks,3,4 Asian Indians,5,6 and Filipinos5,6 having higher coronary heart disease (CHD) burden than other subgroups and non-Hispanic whites (NHWs). Filipinos,6 Hispanics/Latinos,3,7,8 and blacks3,8 also have a higher burden of stroke than NHWs.
Clinical Perspective on p 579
More than 1 of every 3 adults in the United States has dyslip-idemia,9 one of the major risk factors for CVD.10 The National Health and Examination Survey (NHANES) is the primary data source for national prevalence rates of dyslipidemia in the United States, with accurate sampling data for blacks and
Mexican Americans.11 The NHANES data show higher preva-lence rates of low high-density lipoprotein cholesterol (HDL-C) and high triglycerides for Mexican Americans.3 Although lower prevalence rates of low HDL-C and high triglycerides are seen for blacks, this does not appear to be protective against CVD.3 NHANES does not currently include data spe-cifically for Asian Americans,12 and sample sizes are too small to examine specific Asian or Hispanic/Latino subgroups.11
Previous research examining the prevalence of dyslipid-emia subtypes for racial/ethnic minorities has focused on the black and Mexican American populations, with limited information on Asian subgroups.13–21 The majority of stud-ies for Asians have been conducted in their country of origin, with Asian Indians and Filipinos having a higher prevalence of low HDL-C and of high triglycerides,13–16 which has been suggested as a partial explanation for their increased CHD risk.5,6 Chinese have lower levels of low-density lipoprotein cholesterol (LDL-C) and triglycerides,16–18 and Japanese have higher levels of HDL-C16 than NHWs, which may help explain the lower risk of CHD in these Asian subgroups. The
Background—No studies have comprehensively examined the prevalence of dyslipidemia, a major risk factor for cardiovascular disease, among diverse racial/ethnic minority groups. The primary aim of this study was to identify racial/ethnic differences in dyslipidemia among minorities including Asian Americans (Asian Indian, Chinese, Filipino, Japanese, Korean, or Vietnamese), Mexican Americans, and blacks compared with non-Hispanic whites.
Methods and Results—Using a 3-year cross section (2008–2011), we identified 169 430 active primary care patients (35 years or older) from an outpatient healthcare organization in northern California. Age-standardized prevalence rates were calculated for 3 dyslipidemia subtypes: high triglycerides (fasting laboratory value ≥150 mg/dL), low levels of high-density lipoprotein cholesterol (fasting laboratory value <40 mg/dL [men] and <50 mg/dL [women]), and high levels of low-density lipoprotein cholesterol (fasting laboratory value ≥130 mg/dL or taking low-density lipoprotein–lowering agents). Odds ratios were calculated by multivariable logistic regression, with adjustment for patient characteristics (age, measured body mass index, smoking). Compared with non-Hispanic whites, every minority subgroup had an increased prevalence of high triglycerides except blacks. Most minority groups had an increased prevalence of low high-density lipoprotein cholesterol, except for Japanese and blacks. The prevalence of high low-density lipoprotein cholesterol was increased among Asian Indians, Filipinos, Japanese, and Vietnamese compared with non-Hispanic whites.
Conclusions—Minority groups, except for blacks, were more likely to have high triglyceride/low high-density lipoprotein cholesterol dyslipidemia. Further research is needed to determine how racial/ethnic differences in dyslipidemia affect racial/ethnic differences in cardiovascular disease rates. (Circulation. 2014;129:570-579.)
Key Words: epidemiology ◼ hyperlipoproteinemias ◼ lipids ◼ lipoproteins ◼ pharmaceutical preparations ◼ risk factors
© 2013 American Heart Association, Inc.
Circulation is available at http://circ.ahajournals.org DOI: 10.1161/CIRCULATIONAHA.113.005757
Received August 19, 2013; accepted October 21, 2013.From the Palo Alto Medical Foundation Research Institute, Palo Alto, CA (A.T.H.F., B.Z., P.O.J., K.M.J.A., L.P.P.) and Kaiser Permanente Center for
Health Research Northwest, Portland, OR (S.P.F.).The online-only Data Supplement is available with this article at http://circ.ahajournals.org/lookup/suppl/doi:10.1161/CIRCULATIONAHA.
113.005757/-/DC1.Correspondence to Latha P. Palaniappan, MD, MS, Palo Alto Medical Foundation Research Institute, Ames Bldg, 795 El Camino Real, Palo Alto, CA
94301. E-mail [email protected]
Racial/Ethnic Differences in Dyslipidemia PatternsAriel T.H. Frank, BA; Beinan Zhao, MS; Powell O. Jose, MD;
Kristen M.J. Azar, MSN, MPH; Stephen P. Fortmann, MD; Latha P. Palaniappan, MD, MS
at CONS CALIFORNIA DIG LIB on December 16, 2014http://circ.ahajournals.org/Downloaded from at CONS CALIFORNIA DIG LIB on December 16, 2014http://circ.ahajournals.org/Downloaded from at CONS CALIFORNIA DIG LIB on December 16, 2014http://circ.ahajournals.org/Downloaded from at CONS CALIFORNIA DIG LIB on December 16, 2014http://circ.ahajournals.org/Downloaded from at CONS CALIFORNIA DIG LIB on December 16, 2014http://circ.ahajournals.org/Downloaded from
Frank et al Disparities in Dyslipidemia 571
American Heart Association,22 the US Department of Health and Human Services,23 and the Institute of Medicine24 have all acknowledged that national vital statistics data for racial/ethnic minority populations must be supplemented with popu-lation-based local-level data to inform and guide the develop-ment, implementation, and evaluation of programs to address health disparities. Despite known heterogeneity in CVD risk among racial/ethnic subgroups, no studies have comprehen-sively examined the prevalence of dyslipidemia subtypes and treatment across the major racial/ethnic groups in the United States. The primary aim of the present study was to identify racial/ethnic differences in dyslipidemias to guide prevention, detection, and treatment efforts.
MethodsSettingThe present study was conducted in a mixed-payer, outpatient health-care organization that serves ≈800 000 active patients in northern California, which has been using the EpicCare electronic health record system since 2000. This healthcare organization is unique among large clinical data resources because >30% of the overall patient population self-identifies as Asian American. The demo-graphic characteristics of the patients are generally similar to those of residents in the surrounding service area (Alameda, San Mateo, and Santa Clara counties). The patient population is insured (58% by pre-ferred provider organizations, 23% by an HMO, 16% by Medicare, 2% self-pay, and 1% by Medicaid) and thus underrepresents the med-ically underserved. However, in this setting, access to care is unlikely to confound subgroup comparisons.
Study DesignA 3-year, cross-sectional sample of patients was identified and included patients aged ≥35 years with ≥1 primary care visit occurring between June 1, 2008, and May 31, 2011. Patient race and ethnicity was identified, either by self-report25 (67%) or name analysis26 (33%), as Asian Indian, Chinese, Filipino, Japanese, Korean, Vietnamese, black/African American, Hispanic/Latino, or NHW. Patients identi-fied as Hispanic/Latino and who further self-classified as Mexican were included in the analysis, whereas other Hispanic subgroups were not because of small sample sizes (n<1000). Using diagno-sis codes from problem lists and encounters listed in the electronic health record, we excluded patients who were pregnant or had any previous history of cancer, end-stage kidney disease or dialysis, or active liver disease (except for fatty liver). All data sets analyzed by the research team were deidentified according to the Health Insurance Portability and Accountability Act (HIPAA) standard; the organiza-tion’s Institutional Review Board approved the study.
Clinical DefinitionsData on patient demographics, anthropometric measures, physician diagnoses, laboratory results, and prescription medications were extracted from the electronic health record. Three dyslipidemia sub-types were identified on the basis of fasting laboratory results for each individual found during the study period: High triglycerides (≥150 mg/dL), low HDL-C (<40 mg/dL [men] and <50 mg/dL [women]), and high LDL-C (≥130 mg/dL or ever taking low-density lipoprotein [LDL]–lowering agents). LDL-lowering agents (LLAs), including statins, bile acid resins, cholesterol absorption inhibitors, and combi-nations, accounted for 78% of all lipid-modifying agents prescribed. LLA use was included in the definition of high LDL-C to avoid missing treated patients with controlled LDL-C after initial analyses indicated that using only laboratory data produced prevalence rates below those found in national data27 and that treatment rates differed by subgroup. Treatment with other lipid-modifying agents (fibric acid derivatives, niacin, and omega 3 fish oil) was not included in the definition of high LDL-C, low HDL-C, or high triglycerides because
they are not specific to 1 dyslipidemia subtype,10 which could lead to misclassification. The following patient characteristics were iden-tified: Self-reported race/ethnicity, age in 2008, primary insurance (preferred provider organization, HMO, and other), and self-reported smoking status (ever or never). Weight and height data recorded in the electronic health record were used to calculate body mass index (in kg/m2), categorized as follows: Underweight, <18.5 kg/m2; nor-mal weight, ≥18.5 and <25 kg/m2; overweight, ≥25 and <30 kg/m2; and obese, ≥30 kg/m2). The prevalence of CVD was identified by use of physician-recorded International Classification of Diseases, 9th Revision diagnosis codes (CHD, 410–414; stroke, 430–434; and peripheral vascular disease, 415, 440.2, 440.3, 443.9, 451, 453) dur-ing the study period. Type 2 diabetes mellitus was identified with International Classification of Diseases, 9th Revision codes (250.X0, 250.X2) or 2 abnormal glucose measurements according to American Diabetes Association guidelines (hemoglobin A
1c results >6.5%, fast-
ing blood glucose results >126 mg/dL, random blood glucose >200 mg/dL, or oral glucose tolerance test >200 mg/dL)28 or use of any antidiabetic medications.
Statistical AnalysisFor our primary race/ethnic subgroup comparisons, we calculated age-adjusted prevalence rates of dyslipidemia subtypes (high LDL-C, low HDL-C, and high triglycerides) among men and women using direct standardization to the NHW population. Broad age categories (35 to 44, 45 to 54, 55 to 64, 65 to 74, and ≥75 years) were used to achieve stratum-specific rates for direct standardization. Categorical variables (Table 1) were compared with pairwise χ2 tests, and non-parametric Wilcoxon tests were used to compare ages and lipid results between racial/ethnic groups that did not follow a normal dis-tribution. Odds ratios were calculated by use of multivariable logis-tic regression with adjustment for patient age, body mass index, and smoking status. In secondary analyses, we examined prevalence rates stratifying patients with and without a history of vascular disease. We also conducted additional analyses adjusting the model for prevalent type 2 diabetes mellitus or treatment with any lipid-modifying agents. Results are presented by sex across all racial/ethnic minority groups, and all comparisons are to NHWs. Using logistic regression models with the product terms, we tested whether race/ethnicity was a signifi-cant effect modifier of the association between dyslipidemia subtypes and CVD after adjusting for common CVD risk factors. Because of the multiple comparisons included in this descriptive study, 99.9% confidence intervals are reported when appropriate. Statistical analy-ses were performed with SAS 9.3 (Cary, NC).
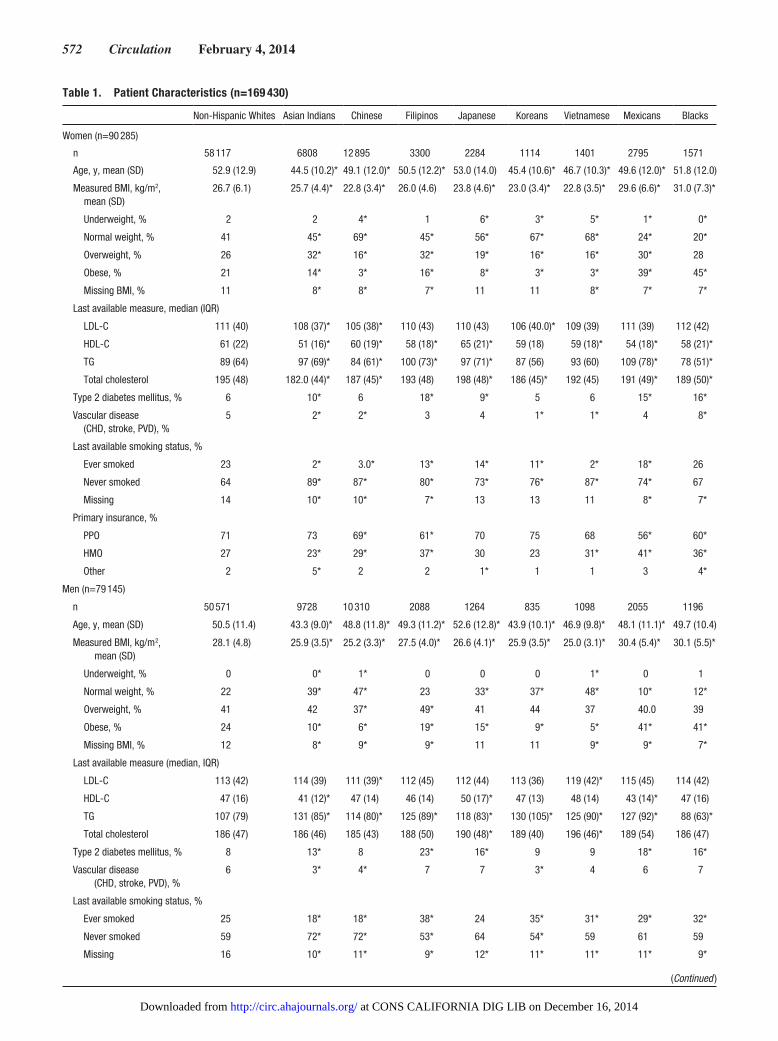
ResultsA total of 169 430 patients were included in the analysis, with patient characteristics reported in Table 1. Mexicans and every Asian subgroup except for Japanese were younger than NHWs. With the exception of Filipino women, all Asian subgroups had significantly lower mean body mass index than NHWs, whereas Mexicans and blacks had higher mean body mass index. Filipino, Korean, Vietnamese, and black men were more likely to have ever smoked and all Asian and Mexican women were less likely to have ever smoked than NHWs. Three Asian subgroups (Asian Indians, Filipinos, and Japanese), as well as Mexicans and blacks, had higher rates of type 2 diabetes mellitus than NHWs.
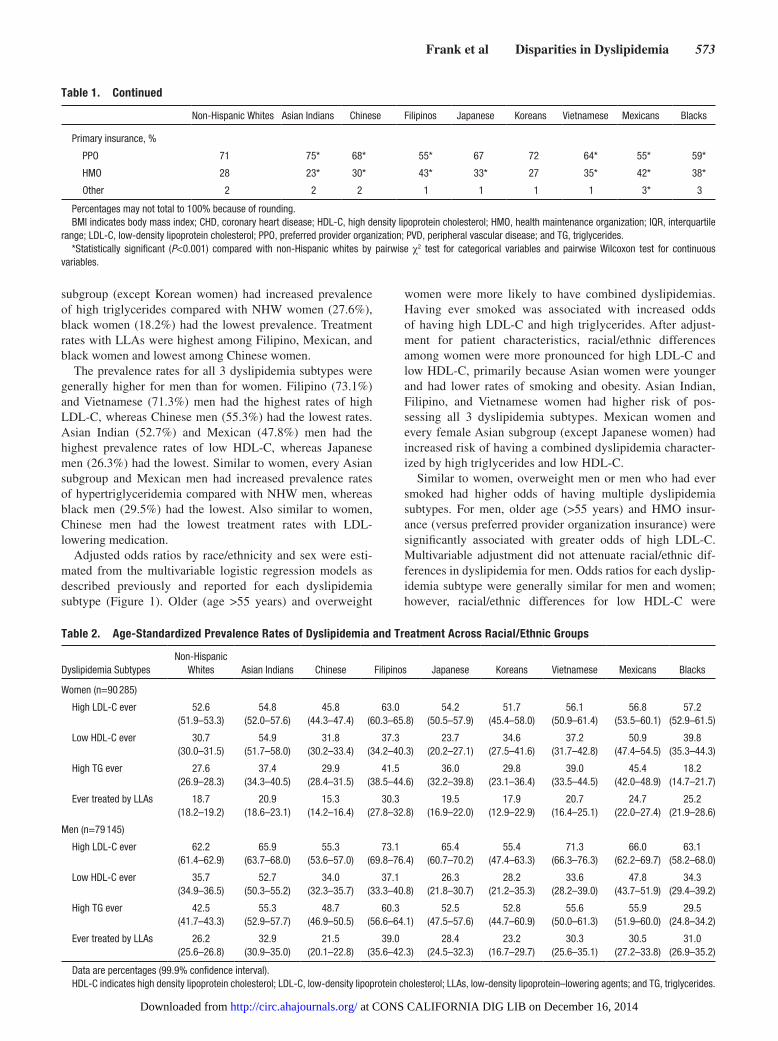
Age-adjusted prevalence rates of dyslipidemia subtypes and LDL-lowering treatment across racial/ethnic subgroups are described in Table 2. Filipino and Mexican women had the highest prevalence rates of both high LDL-C and high tri-glycerides. With regard to low HDL-C, Asian Indian (54.9%) and Mexican (50.9%) women in particular stood out, hav-ing over twice the prevalence of Japanese women (23.7%). Although Mexican women (45.4%) and nearly every Asian
at CONS CALIFORNIA DIG LIB on December 16, 2014http://circ.ahajournals.org/Downloaded from
572 Circulation February 4, 2014
Table 1. Patient Characteristics (n=169 430)
Non-Hispanic Whites Asian Indians Chinese Filipinos Japanese Koreans Vietnamese Mexicans Blacks
Women (n=90 285)
n 58 117 6808 12 895 3300 2284 1114 1401 2795 1571
Age, y, mean (SD) 52.9 (12.9) 44.5 (10.2)* 49.1 (12.0)* 50.5 (12.2)* 53.0 (14.0) 45.4 (10.6)* 46.7 (10.3)* 49.6 (12.0)* 51.8 (12.0)
Measured BMI, kg/m2, mean (SD)
26.7 (6.1) 25.7 (4.4)* 22.8 (3.4)* 26.0 (4.6) 23.8 (4.6)* 23.0 (3.4)* 22.8 (3.5)* 29.6 (6.6)* 31.0 (7.3)*
Underweight, % 2 2 4* 1 6* 3* 5* 1* 0*
Normal weight, % 41 45* 69* 45* 56* 67* 68* 24* 20*
Overweight, % 26 32* 16* 32* 19* 16* 16* 30* 28
Obese, % 21 14* 3* 16* 8* 3* 3* 39* 45*
Missing BMI, % 11 8* 8* 7* 11 11 8* 7* 7*
Last available measure, median (IQR)
LDL-C 111 (40) 108 (37)* 105 (38)* 110 (43) 110 (43) 106 (40.0)* 109 (39) 111 (39) 112 (42)
HDL-C 61 (22) 51 (16)* 60 (19)* 58 (18)* 65 (21)* 59 (18) 59 (18)* 54 (18)* 58 (21)*
TG 89 (64) 97 (69)* 84 (61)* 100 (73)* 97 (71)* 87 (56) 93 (60) 109 (78)* 78 (51)*
Total cholesterol 195 (48) 182.0 (44)* 187 (45)* 193 (48) 198 (48)* 186 (45)* 192 (45) 191 (49)* 189 (50)*
Type 2 diabetes mellitus, % 6 10* 6 18* 9* 5 6 15* 16*
Vascular disease (CHD, stroke, PVD), %
5 2* 2* 3 4 1* 1* 4 8*
Last available smoking status, %
Ever smoked 23 2* 3.0* 13* 14* 11* 2* 18* 26
Never smoked 64 89* 87* 80* 73* 76* 87* 74* 67
Missing 14 10* 10* 7* 13 13 11 8* 7*
Primary insurance, %
PPO 71 73 69* 61* 70 75 68 56* 60*
HMO 27 23* 29* 37* 30 23 31* 41* 36*
Other 2 5* 2 2 1* 1 1 3 4*
Men (n=79 145)
n 50 571 9728 10 310 2088 1264 835 1098 2055 1196
Age, y, mean (SD) 50.5 (11.4) 43.3 (9.0)* 48.8 (11.8)* 49.3 (11.2)* 52.6 (12.8)* 43.9 (10.1)* 46.9 (9.8)* 48.1 (11.1)* 49.7 (10.4)
Measured BMI, kg/m2, mean (SD)
28.1 (4.8) 25.9 (3.5)* 25.2 (3.3)* 27.5 (4.0)* 26.6 (4.1)* 25.9 (3.5)* 25.0 (3.1)* 30.4 (5.4)* 30.1 (5.5)*
Underweight, % 0 0* 1* 0 0 0 1* 0 1
Normal weight, % 22 39* 47* 23 33* 37* 48* 10* 12*
Overweight, % 41 42 37* 49* 41 44 37 40.0 39
Obese, % 24 10* 6* 19* 15* 9* 5* 41* 41*
Missing BMI, % 12 8* 9* 9* 11 11 9* 9* 7*
Last available measure (median, IQR)
LDL-C 113 (42) 114 (39) 111 (39)* 112 (45) 112 (44) 113 (36) 119 (42)* 115 (45) 114 (42)
HDL-C 47 (16) 41 (12)* 47 (14) 46 (14) 50 (17)* 47 (13) 48 (14) 43 (14)* 47 (16)
TG 107 (79) 131 (85)* 114 (80)* 125 (89)* 118 (83)* 130 (105)* 125 (90)* 127 (92)* 88 (63)*
Total cholesterol 186 (47) 186 (46) 185 (43) 188 (50) 190 (48)* 189 (40) 196 (46)* 189 (54) 186 (47)
Type 2 diabetes mellitus, % 8 13* 8 23* 16* 9 9 18* 16*
Vascular disease (CHD, stroke, PVD), %
6 3* 4* 7 7 3* 4 6 7
Last available smoking status, %
Ever smoked 25 18* 18* 38* 24 35* 31* 29* 32*
Never smoked 59 72* 72* 53* 64 54* 59 61 59
Missing 16 10* 11* 9* 12* 11* 11* 11* 9*
(Continued )
at CONS CALIFORNIA DIG LIB on December 16, 2014http://circ.ahajournals.org/Downloaded from
Frank et al Disparities in Dyslipidemia 573
subgroup (except Korean women) had increased prevalence of high triglycerides compared with NHW women (27.6%), black women (18.2%) had the lowest prevalence. Treatment rates with LLAs were highest among Filipino, Mexican, and black women and lowest among Chinese women.
The prevalence rates for all 3 dyslipidemia subtypes were generally higher for men than for women. Filipino (73.1%) and Vietnamese (71.3%) men had the highest rates of high LDL-C, whereas Chinese men (55.3%) had the lowest rates. Asian Indian (52.7%) and Mexican (47.8%) men had the highest prevalence rates of low HDL-C, whereas Japanese men (26.3%) had the lowest. Similar to women, every Asian subgroup and Mexican men had increased prevalence rates of hypertriglyceridemia compared with NHW men, whereas black men (29.5%) had the lowest. Also similar to women, Chinese men had the lowest treatment rates with LDL-lowering medication.
Adjusted odds ratios by race/ethnicity and sex were esti-mated from the multivariable logistic regression models as described previously and reported for each dyslipidemia subtype (Figure 1). Older (age >55 years) and overweight
women were more likely to have combined dyslipidemias. Having ever smoked was associated with increased odds of having high LDL-C and high triglycerides. After adjust-ment for patient characteristics, racial/ethnic differences among women were more pronounced for high LDL-C and low HDL-C, primarily because Asian women were younger and had lower rates of smoking and obesity. Asian Indian, Filipino, and Vietnamese women had higher risk of pos-sessing all 3 dyslipidemia subtypes. Mexican women and every female Asian subgroup (except Japanese women) had increased risk of having a combined dyslipidemia character-ized by high triglycerides and low HDL-C.
Similar to women, overweight men or men who had ever smoked had higher odds of having multiple dyslipidemia subtypes. For men, older age (>55 years) and HMO insur-ance (versus preferred provider organization insurance) were significantly associated with greater odds of high LDL-C. Multivariable adjustment did not attenuate racial/ethnic dif-ferences in dyslipidemia for men. Odds ratios for each dyslip-idemia subtype were generally similar for men and women; however, racial/ethnic differences for low HDL-C were
Table 2. Age-Standardized Prevalence Rates of Dyslipidemia and Treatment Across Racial/Ethnic Groups
Dyslipidemia SubtypesNon-Hispanic
Whites Asian Indians Chinese Filipinos Japanese Koreans Vietnamese Mexicans Blacks
Women (n=90 285)
High LDL-C ever 52.6(51.9–53.3)
54.8(52.0–57.6)
45.8(44.3–47.4)
63.0(60.3–65.8)
54.2(50.5–57.9)
51.7(45.4–58.0)
56.1(50.9–61.4)
56.8(53.5–60.1)
57.2(52.9–61.5)
Low HDL-C ever 30.7(30.0–31.5)
54.9(51.7–58.0)
31.8(30.2–33.4)
37.3(34.2–40.3)
23.7(20.2–27.1)
34.6(27.5–41.6)
37.2(31.7–42.8)
50.9(47.4–54.5)
39.8(35.3–44.3)
High TG ever 27.6(26.9–28.3)
37.4(34.3–40.5)
29.9(28.4–31.5)
41.5(38.5–44.6)
36.0(32.2–39.8)
29.8(23.1–36.4)
39.0(33.5–44.5)
45.4(42.0–48.9)
18.2(14.7–21.7)
Ever treated by LLAs 18.7(18.2–19.2)
20.9(18.6–23.1)
15.3(14.2–16.4)
30.3(27.8–32.8)
19.5(16.9–22.0)
17.9(12.9–22.9)
20.7(16.4–25.1)
24.7(22.0–27.4)
25.2(21.9–28.6)
Men (n=79 145)
High LDL-C ever 62.2(61.4–62.9)
65.9(63.7–68.0)
55.3(53.6–57.0)
73.1(69.8–76.4)
65.4(60.7–70.2)
55.4(47.4–63.3)
71.3(66.3–76.3)
66.0(62.2–69.7)
63.1(58.2–68.0)
Low HDL-C ever 35.7(34.9–36.5)
52.7(50.3–55.2)
34.0(32.3–35.7)
37.1(33.3–40.8)
26.3(21.8–30.7)
28.2(21.2–35.3)
33.6(28.2–39.0)
47.8(43.7–51.9)
34.3(29.4–39.2)
High TG ever 42.5(41.7–43.3)
55.3(52.9–57.7)
48.7(46.9–50.5)
60.3(56.6–64.1)
52.5(47.5–57.6)
52.8(44.7–60.9)
55.6(50.0–61.3)
55.9(51.9–60.0)
29.5(24.8–34.2)
Ever treated by LLAs 26.2(25.6–26.8)
32.9(30.9–35.0)
21.5(20.1–22.8)
39.0(35.6–42.3)
28.4(24.5–32.3)
23.2(16.7–29.7)
30.3(25.6–35.1)
30.5(27.2–33.8)
31.0(26.9–35.2)
Data are percentages (99.9% confidence interval). HDL-C indicates high density lipoprotein cholesterol; LDL-C, low-density lipoprotein cholesterol; LLAs, low-density lipoprotein–lowering agents; and TG, triglycerides.
Primary insurance, %
PPO 71 75* 68* 55* 67 72 64* 55* 59*
HMO 28 23* 30* 43* 33* 27 35* 42* 38*
Other 2 2 2 1 1 1 1 3* 3
Percentages may not total to 100% because of rounding. BMI indicates body mass index; CHD, coronary heart disease; HDL-C, high density lipoprotein cholesterol; HMO, health maintenance organization; IQR, interquartile
range; LDL-C, low-density lipoprotein cholesterol; PPO, preferred provider organization; PVD, peripheral vascular disease; and TG, triglycerides.*Statistically significant (P<0.001) compared with non-Hispanic whites by pairwise χ2 test for categorical variables and pairwise Wilcoxon test for continuous
variables.
Table 1. Continued
Non-Hispanic Whites Asian Indians Chinese Filipinos Japanese Koreans Vietnamese Mexicans Blacks
at CONS CALIFORNIA DIG LIB on December 16, 2014http://circ.ahajournals.org/Downloaded from
574 Circulation February 4, 2014
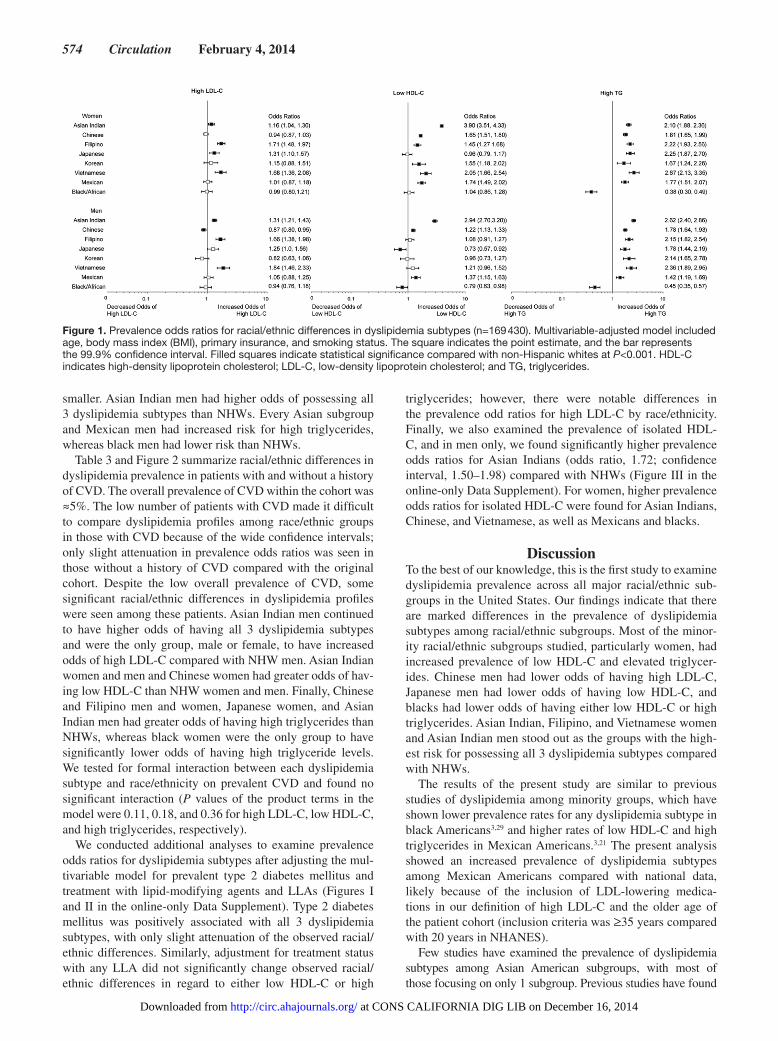
smaller. Asian Indian men had higher odds of possessing all 3 dyslipidemia subtypes than NHWs. Every Asian subgroup and Mexican men had increased risk for high triglycerides, whereas black men had lower risk than NHWs.
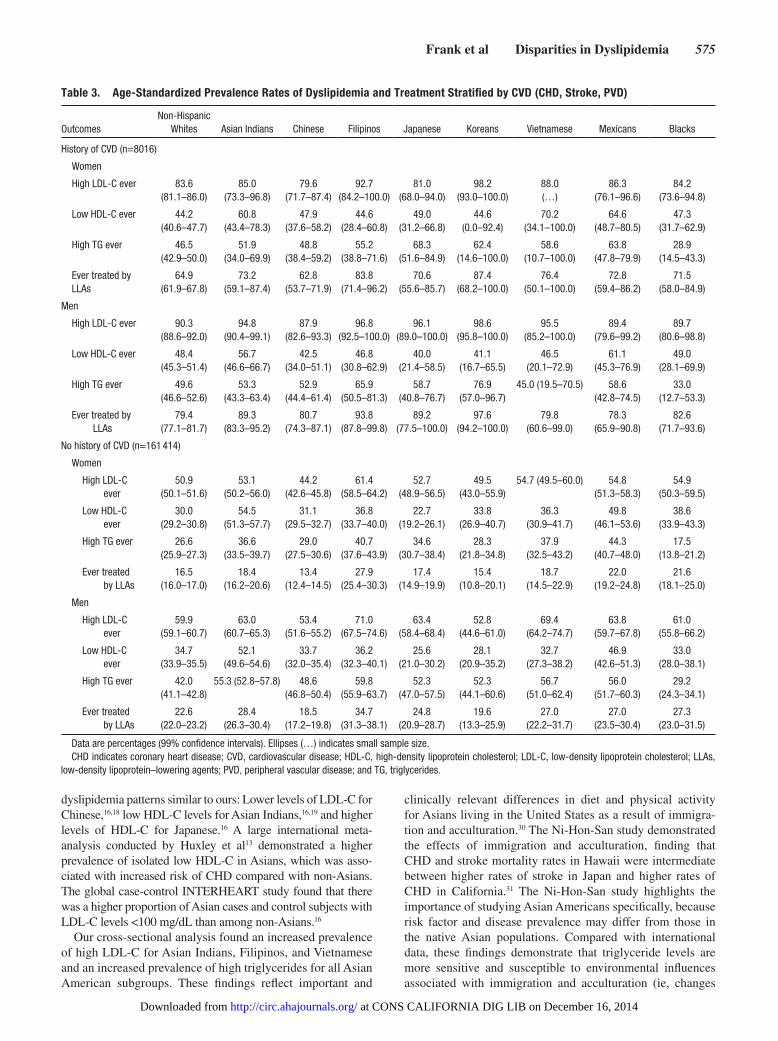
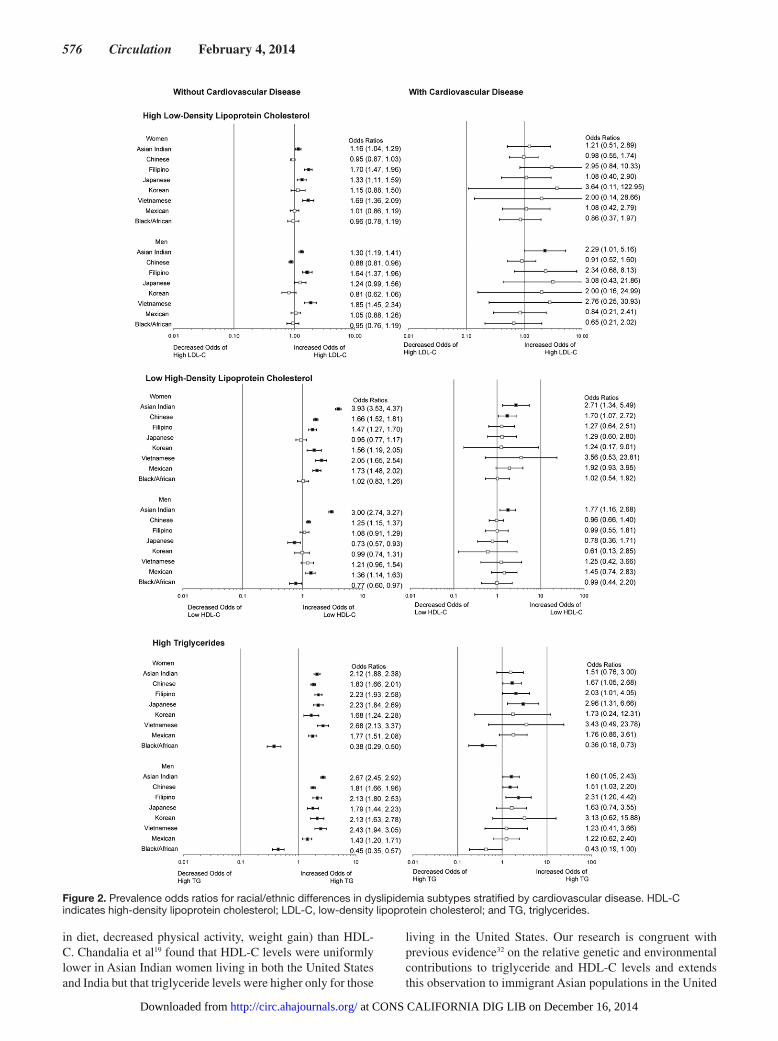
Table 3 and Figure 2 summarize racial/ethnic differences in dyslipidemia prevalence in patients with and without a history of CVD. The overall prevalence of CVD within the cohort was ≈5%. The low number of patients with CVD made it difficult to compare dyslipidemia profiles among race/ethnic groups in those with CVD because of the wide confidence intervals; only slight attenuation in prevalence odds ratios was seen in those without a history of CVD compared with the original cohort. Despite the low overall prevalence of CVD, some significant racial/ethnic differences in dyslipidemia profiles were seen among these patients. Asian Indian men continued to have higher odds of having all 3 dyslipidemia subtypes and were the only group, male or female, to have increased odds of high LDL-C compared with NHW men. Asian Indian women and men and Chinese women had greater odds of hav-ing low HDL-C than NHW women and men. Finally, Chinese and Filipino men and women, Japanese women, and Asian Indian men had greater odds of having high triglycerides than NHWs, whereas black women were the only group to have significantly lower odds of having high triglyceride levels. We tested for formal interaction between each dyslipidemia subtype and race/ethnicity on prevalent CVD and found no significant interaction (P values of the product terms in the model were 0.11, 0.18, and 0.36 for high LDL-C, low HDL-C, and high triglycerides, respectively).
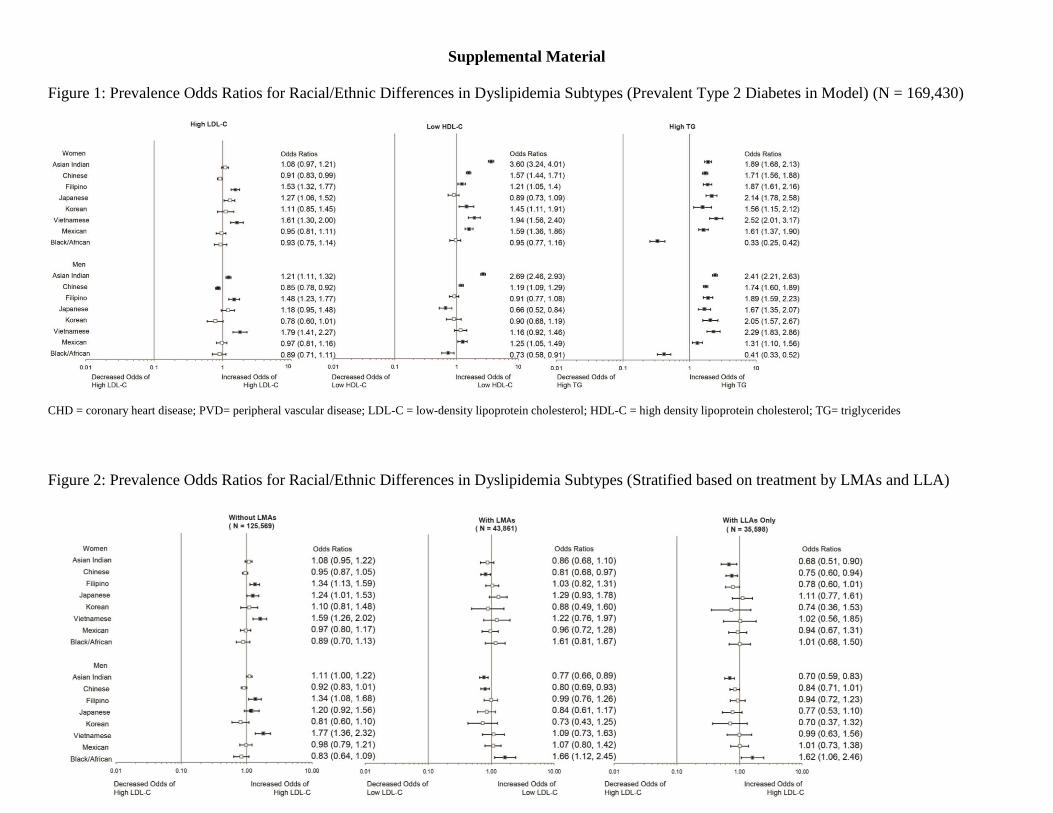
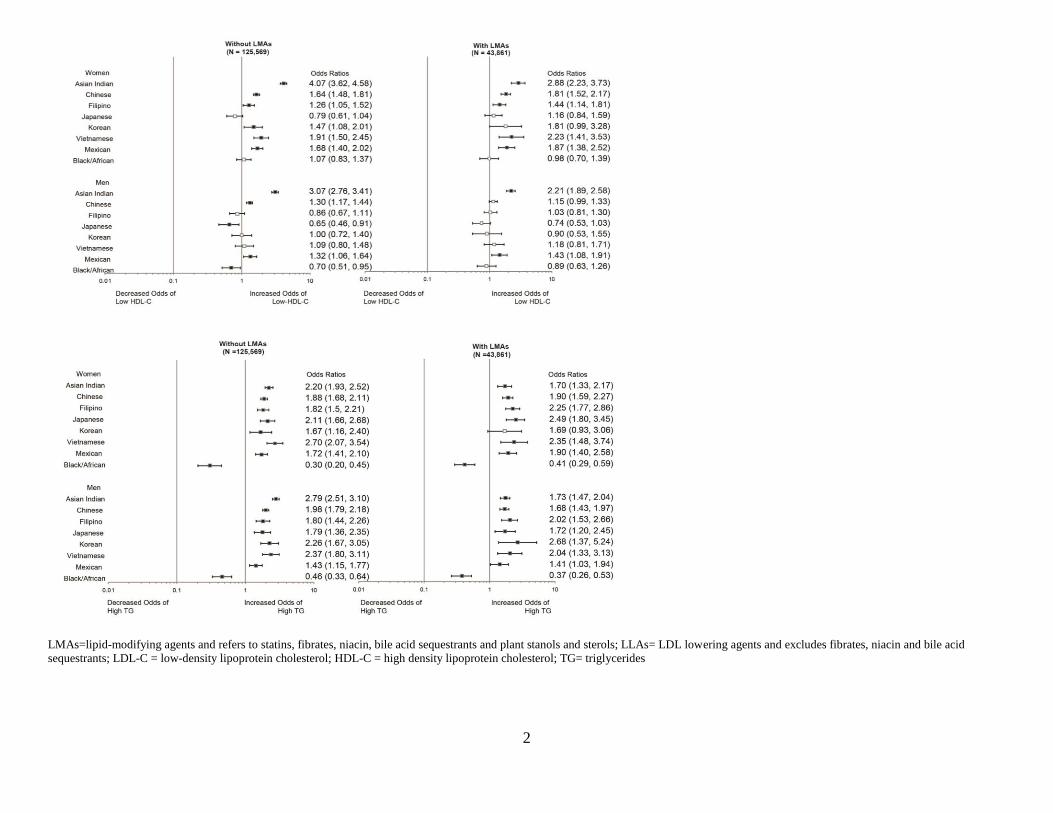
We conducted additional analyses to examine prevalence odds ratios for dyslipidemia subtypes after adjusting the mul-tivariable model for prevalent type 2 diabetes mellitus and treatment with lipid-modifying agents and LLAs (Figures I and II in the online-only Data Supplement). Type 2 diabetes mellitus was positively associated with all 3 dyslipidemia subtypes, with only slight attenuation of the observed racial/ethnic differences. Similarly, adjustment for treatment status with any LLA did not significantly change observed racial/ethnic differences in regard to either low HDL-C or high
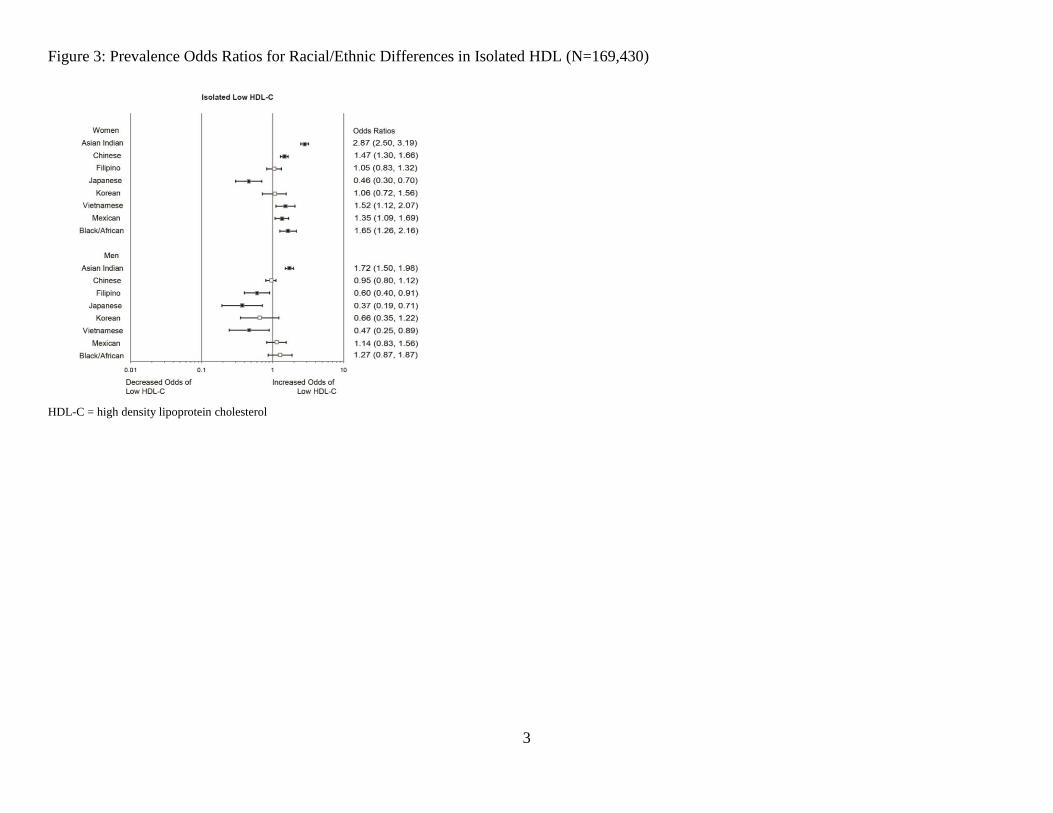
triglycerides; however, there were notable differences in the prevalence odd ratios for high LDL-C by race/ethnicity. Finally, we also examined the prevalence of isolated HDL-C, and in men only, we found significantly higher prevalence odds ratios for Asian Indians (odds ratio, 1.72; confidence interval, 1.50–1.98) compared with NHWs (Figure III in the online-only Data Supplement). For women, higher prevalence odds ratios for isolated HDL-C were found for Asian Indians, Chinese, and Vietnamese, as well as Mexicans and blacks.
DiscussionTo the best of our knowledge, this is the first study to examine dyslipidemia prevalence across all major racial/ethnic sub-groups in the United States. Our findings indicate that there are marked differences in the prevalence of dyslipidemia subtypes among racial/ethnic subgroups. Most of the minor-ity racial/ethnic subgroups studied, particularly women, had increased prevalence of low HDL-C and elevated triglycer-ides. Chinese men had lower odds of having high LDL-C, Japanese men had lower odds of having low HDL-C, and blacks had lower odds of having either low HDL-C or high triglycerides. Asian Indian, Filipino, and Vietnamese women and Asian Indian men stood out as the groups with the high-est risk for possessing all 3 dyslipidemia subtypes compared with NHWs.
The results of the present study are similar to previous studies of dyslipidemia among minority groups, which have shown lower prevalence rates for any dyslipidemia subtype in black Americans3,29 and higher rates of low HDL-C and high triglycerides in Mexican Americans.3,21 The present analysis showed an increased prevalence of dyslipidemia subtypes among Mexican Americans compared with national data, likely because of the inclusion of LDL-lowering medica-tions in our definition of high LDL-C and the older age of the patient cohort (inclusion criteria was ≥35 years compared with 20 years in NHANES).
Few studies have examined the prevalence of dyslipidemia subtypes among Asian American subgroups, with most of those focusing on only 1 subgroup. Previous studies have found
Figure 1. Prevalence odds ratios for racial/ethnic differences in dyslipidemia subtypes (n=169 430). Multivariable-adjusted model included age, body mass index (BMI), primary insurance, and smoking status. The square indicates the point estimate, and the bar represents the 99.9% confidence interval. Filled squares indicate statistical significance compared with non-Hispanic whites at P<0.001. HDL-C indicates high-density lipoprotein cholesterol; LDL-C, low-density lipoprotein cholesterol; and TG, triglycerides.
at CONS CALIFORNIA DIG LIB on December 16, 2014http://circ.ahajournals.org/Downloaded from
Frank et al Disparities in Dyslipidemia 575
dyslipidemia patterns similar to ours: Lower levels of LDL-C for Chinese,16,18 low HDL-C levels for Asian Indians,16,19 and higher levels of HDL-C for Japanese.16 A large international meta-analysis conducted by Huxley et al13 demonstrated a higher prevalence of isolated low HDL-C in Asians, which was asso-ciated with increased risk of CHD compared with non-Asians. The global case-control INTERHEART study found that there was a higher proportion of Asian cases and control subjects with LDL-C levels <100 mg/dL than among non-Asians.16
Our cross-sectional analysis found an increased prevalence of high LDL-C for Asian Indians, Filipinos, and Vietnamese and an increased prevalence of high triglycerides for all Asian American subgroups. These findings reflect important and
clinically relevant differences in diet and physical activity for Asians living in the United States as a result of immigra-tion and acculturation.30 The Ni-Hon-San study demonstrated the effects of immigration and acculturation, finding that CHD and stroke mortality rates in Hawaii were intermediate between higher rates of stroke in Japan and higher rates of CHD in California.31 The Ni-Hon-San study highlights the importance of studying Asian Americans specifically, because risk factor and disease prevalence may differ from those in the native Asian populations. Compared with international data, these findings demonstrate that triglyceride levels are more sensitive and susceptible to environmental influences associated with immigration and acculturation (ie, changes
Table 3. Age-Standardized Prevalence Rates of Dyslipidemia and Treatment Stratified by CVD (CHD, Stroke, PVD)
OutcomesNon-Hispanic
Whites Asian Indians Chinese Filipinos Japanese Koreans Vietnamese Mexicans Blacks
History of CVD (n=8016)
Women
High LDL-C ever 83.6(81.1–86.0)
85.0(73.3–96.8)
79.6(71.7–87.4)
92.7(84.2–100.0)
81.0(68.0–94.0)
98.2(93.0–100.0)
88.0(…)
86.3(76.1–96.6)
84.2(73.6–94.8)
Low HDL-C ever 44.2(40.6–47.7)
60.8(43.4–78.3)
47.9(37.6–58.2)
44.6(28.4–60.8)
49.0(31.2–66.8)
44.6(0.0–92.4)
70.2(34.1–100.0)
64.6(48.7–80.5)
47.3(31.7–62.9)
High TG ever 46.5(42.9–50.0)
51.9(34.0–69.9)
48.8(38.4–59.2)
55.2(38.8–71.6)
68.3(51.6–84.9)
62.4(14.6–100.0)
58.6(10.7–100.0)
63.8(47.8–79.9)
28.9(14.5–43.3)
Ever treated by LLAs
64.9(61.9–67.8)
73.2(59.1–87.4)
62.8(53.7–71.9)
83.8(71.4–96.2)
70.6(55.6–85.7)
87.4(68.2–100.0)
76.4(50.1–100.0)
72.8(59.4–86.2)
71.5(58.0–84.9)
Men
High LDL-C ever 90.3(88.6–92.0)
94.8(90.4–99.1)
87.9(82.6–93.3)
96.8(92.5–100.0)
96.1(89.0–100.0)
98.6(95.8–100.0)
95.5(85.2–100.0)
89.4 (79.6–99.2)
89.7 (80.6–98.8)
Low HDL-C ever 48.4(45.3–51.4)
56.7(46.6–66.7)
42.5(34.0–51.1)
46.8(30.8–62.9)
40.0(21.4–58.5)
41.1(16.7–65.5)
46.5(20.1–72.9)
61.1(45.3–76.9)
49.0(28.1–69.9)
High TG ever 49.6(46.6–52.6)
53.3(43.3–63.4)
52.9(44.4–61.4)
65.9(50.5–81.3)
58.7 (40.8–76.7)
76.9(57.0–96.7)
45.0 (19.5–70.5) 58.6(42.8–74.5)
33.0(12.7–53.3)
Ever treated by LLAs
79.4(77.1–81.7)
89.3(83.3–95.2)
80.7(74.3–87.1)
93.8(87.8–99.8)
89.2(77.5–100.0)
97.6(94.2–100.0)
79.8(60.6–99.0)
78.3(65.9–90.8)
82.6(71.7–93.6)
No history of CVD (n=161 414)
Women
High LDL-C ever
50.9 (50.1–51.6)
53.1(50.2–56.0)
44.2(42.6–45.8)
61.4(58.5–64.2)
52.7(48.9–56.5)
49.5 (43.0–55.9)
54.7 (49.5–60.0) 54.8(51.3–58.3)
54.9(50.3–59.5)
Low HDL-C ever
30.0 (29.2–30.8)
54.5(51.3–57.7)
31.1(29.5–32.7)
36.8(33.7–40.0)
22.7(19.2–26.1)
33.8(26.9–40.7)
36.3(30.9–41.7)
49.8(46.1–53.6)
38.6(33.9–43.3)
High TG ever 26.6 (25.9–27.3)
36.6(33.5–39.7)
29.0(27.5–30.6)
40.7(37.6–43.9)
34.6(30.7–38.4)
28.3 (21.8–34.8)
37.9(32.5–43.2)
44.3(40.7–48.0)
17.5(13.8–21.2)
Ever treated by LLAs
16.5(16.0–17.0)
18.4(16.2–20.6)
13.4(12.4–14.5)
27.9(25.4–30.3)
17.4(14.9–19.9)
15.4(10.8–20.1)
18.7(14.5–22.9)
22.0(19.2–24.8)
21.6(18.1–25.0)
Men
High LDL-C ever
59.9(59.1–60.7)
63.0(60.7–65.3)
53.4(51.6–55.2)
71.0(67.5–74.6)
63.4(58.4–68.4)
52.8(44.6–61.0)
69.4(64.2–74.7)
63.8(59.7–67.8)
61.0(55.8–66.2)
Low HDL-C ever
34.7(33.9–35.5)
52.1(49.6–54.6)
33.7(32.0–35.4)
36.2(32.3–40.1)
25.6(21.0–30.2)
28.1(20.9–35.2)
32.7(27.3–38.2)
46.9(42.6–51.3)
33.0(28.0–38.1)
High TG ever 42.0(41.1–42.8)
55.3 (52.8–57.8) 48.6(46.8–50.4)
59.8(55.9–63.7)
52.3(47.0–57.5)
52.3 (44.1–60.6)
56.7(51.0–62.4)
56.0(51.7–60.3)
29.2(24.3–34.1)
Ever treated by LLAs
22.6(22.0–23.2)
28.4(26.3–30.4)
18.5(17.2–19.8)
34.7(31.3–38.1)
24.8(20.9–28.7)
19.6(13.3–25.9)
27.0(22.2–31.7)
27.0(23.5–30.4)
27.3(23.0–31.5)
Data are percentages (99% confidence intervals). Ellipses (…) indicates small sample size. CHD indicates coronary heart disease; CVD, cardiovascular disease; HDL-C, high-density lipoprotein cholesterol; LDL-C, low-density lipoprotein cholesterol; LLAs,
low-density lipoprotein–lowering agents; PVD, peripheral vascular disease; and TG, triglycerides.
at CONS CALIFORNIA DIG LIB on December 16, 2014http://circ.ahajournals.org/Downloaded from
576 Circulation February 4, 2014
in diet, decreased physical activity, weight gain) than HDL-C. Chandalia et al19 found that HDL-C levels were uniformly lower in Asian Indian women living in both the United States and India but that triglyceride levels were higher only for those
living in the United States. Our research is congruent with previous evidence32 on the relative genetic and environmental contributions to triglyceride and HDL-C levels and extends this observation to immigrant Asian populations in the United
Figure 2. Prevalence odds ratios for racial/ethnic differences in dyslipidemia subtypes stratified by cardiovascular disease. HDL-C indicates high-density lipoprotein cholesterol; LDL-C, low-density lipoprotein cholesterol; and TG, triglycerides.
at CONS CALIFORNIA DIG LIB on December 16, 2014http://circ.ahajournals.org/Downloaded from
Frank et al Disparities in Dyslipidemia 577
States. A better understanding of these contributions may pro-vide better insight into how to direct and improve prevention efforts in minority groups.
The variation in dyslipidemia prevalence among minority groups appears to correlate with the rates of CHD. Among Asian Americans, Asian Indians and Filipinos have consis-tently been shown to have increased risk for CHD,5,6 with higher mortality rates than other racial/ethnic groups in the United States.33,34 In contrast, CHD incidence and mortal-ity rates are lower for Chinese and Japanese,35,36 which may be explained in part by the protective effects of having low LDL-C and high HDL-C in these subgroups.16 Similar to Asian Americans, Mexican Americans who exhibit combined dyslipidemia, particularly the atherogenic high triglyceride/low high-density lipoprotein profile, appear to have increased CHD risk. The Hispanic Community Health Study/Study of Latinos found increased CHD risk (self-reported) among Hispanic/Latino participants with hypercholesterolemia.21 The INTERHEART study also found abnormal lipids to be strongly associated with increased risk of acute myocardial infarction in subjects from Latin America.37 However, for blacks who have relatively benign dyslipidemia patterns (low LDL-C, high HDL-C, low triglycerides), higher prevalence rates of hypertension, diabetes mellitus, and obesity may play a greater role in explaining CHD risk.3,21 Rates of hyperten-sion for blacks are almost twice as high as NHWs,38 and blood pressure was shown to be more predictive of CHD in black women than in NHW women.39
LDL-C has been the primary target of CVD prevention and treatment, with statins being the most widely prescribed choles-terol-lowering medications in the United States.10,40 The national prevalence of lipid-lowering medication use for all adults is 15.5% (2007–2010 NHANES),27 which is slightly lower than we found, most likely because of the older age of our cohort. Contrary to national findings, however, treatment rates were higher for the majority of minority groups, which may be a reflection of increased access to care for this insured population. The higher prevalence of elevated LDL-C seen among Asian Indians, Filipinos, and Vietnamese may represent an especially important target for CVD prevention in Asian Americans.
Asian and Mexican Americans, but not blacks, appear to possess the high triglycerides/low HDL-C dyslipidemia pat-tern, which has been characterized as atherogenic and associ-ated with insulin resistance/metabolic syndrome.41,42 There is currently a lack of specific treatment options for low HDL-C and elevated triglycerides because of a lack of efficacy data. Lipid medications that specifically target triglycerides and HDL-C, such as fibrates and niacin, have demonstrated a reduc-tion of CVD events in some trials but not in many others.43–47 Guidelines for dyslipidemia management and treatment have largely been derived from clinical trials composed of mostly NHW populations, which have often underrepresented minor-ity groups. Future clinical trials should include minority sub-groups to further examine the potential benefits of HDL-C and triglyceride treatment for these groups specifically.
Study limitations include the use of data from a single geographic area (northern California), with smaller sample sizes in the black, Mexican, Korean, and Vietnamese popula-tions; however, this region has the most diversity in minority
subgroups in the United States. The study population is also insured and underrepresentative of the medically underserved, but these geographic and socioeconomic limitations also mini-mize unmeasured confounding between subgroups. Because clinical and administrative records rarely include any socio-economic data on the individual level, this relative homoge-neity in economic status improves the internal validity of our comparisons. We adjusted the significance level to P<0.001 to account for multiple comparisons. We were not able to include lifestyle information, such as physical activity or dietary habits, for comparison between minority groups. As a cross-sectional analysis, we were unable to examine the temporal relationships between dyslipidemias and development of comorbidities such as CVD. Finally, we could not account for patients who during the study period may have been started taking LLAs for reasons other than high LDL (CVD, stroke, peripheral vascular disease, etc), which may have resulted in an overestimation of preva-lence rates. The present findings regarding high LDL-C must be interpreted with caution because of the inclusion of LLAs in our definition of the high LDL-C subtype. When stratified by treatment (Figure II in the online-only Data Supplement), there were differences in the prevalence odds ratios by race/ethnicity for having a high LDL-C laboratory test that are dif-ficult to explain given our cross-sectional design. Unlike LDL-C, the racial/ethnic differences in prevalence odds ratios for having low HDL-C or high triglycerides are consistent with and without medication adjustment and therefore may offer unique opportunities for improving prevention efforts and fur-ther research in minority populations.
ConclusionsMost minority subgroups have higher prevalence rates of dyslip-idemia than do NHWs. Asian Indian, Filipino, and Vietnamese women and Asian Indian men stood out as Asian subgroups with increased risk of having combined dyslipidemias (high LDL-C, low HDL-C, and high triglycerides). Although varia-tion was seen among minority groups for the high LDL-C and low HDL-C dyslipidemia subtypes, every minority group except blacks had high triglycerides compared with NHWs. Further research is needed to determine the role of dyslipidemia sub-types and other risk factors in explaining the higher risk of CVD for Asian Indians, Filipinos, Hispanics, and black Americans. Additionally, clinical trials should recruit and include partici-pants belonging to minority subgroups to increase our under-standing of dyslipidemia in CVD risk, as well as treatment goals and medication efficacy for these groups.
Sources of Funding This study was supported by a grant from the National Institute of Diabetes and Digestive and Kidney Diseases (1 R01 DK081371-01A1, “Identifying Disparities in Type 2 Diabetes Among Asian Americans: The Pan Asian Cohort Study”).
Disclosures None.
References 1. Humes KR, Jones NA, Ramirez RR. Overview of Race and Hispanic
Origin: 2010. Washington, DC: US Census Bureau; 2011.
at CONS CALIFORNIA DIG LIB on December 16, 2014http://circ.ahajournals.org/Downloaded from
578 Circulation February 4, 2014
2. US Census Bureau. Table 4: projections of the population by sex, race, and Hispanic origin for the United States: 2015 to 2060. In: 2012 National Population Projections: Summary Tables. Washington, DC: US Census Bureau; 2012.
3. Roger VL, Go AS, Lloyd-Jones DM, Benjamin EJ, Berry JD, Borden WB, Bravata DM, Dai S, Ford ES, Fox CS, Fullerton HJ, Gillespie C, Hailpern SM, Heit JA, Howard VJ, Kissela BM, Kittner SJ, Lackland DT, Lichtman JH, Lisabeth LD, Makuc DM, Marcus GM, Marelli A, Matchar DB, Moy CS, Mozaffarian D, Mussolino ME, Nichol G, Paynter NP, Soliman EZ, Sorlie PD, Sotoodehnia N, Turan TN, Virani SS, Wong ND, Woo D, Turner MB; American Heart Association Statistics Committee and Stroke Statistics Subcommittee. Heart disease and stroke statistics–2012 update: a report from the American Heart Association. Circulation. 2012;125:e2–e220.
4. Gillum RF, Mehari A, Curry B, Obisesan TO. Racial and geographic variation in coronary heart disease mortality trends. BMC Public Health. 2012;12:410.
5. Klatsky AL, Tekawa I. Health problems and hospitalizations among Asian-American ethnic groups. Ethn Dis. 2005;15:753–760.
6. Holland AT, Wong EC, Lauderdale DS, Palaniappan LP. Spectrum of cardiovascular diseases in Asian-American racial/ethnic subgroups. Ann Epidemiol. 2011;21:608–614.
7. Morgenstern LB, Smith MA, Lisabeth LD, Risser JM, Uchino K, Garcia N, Longwell PJ, McFarling DA, Akuwumi O, Al-Wabil A, Al-Senani F, Brown DL, Moyé LA. Excess stroke in Mexican Americans compared with non-Hispanic Whites: the Brain Attack Surveillance in Corpus Christi Project. Am J Epidemiol. 2004;160:376–383.
8. White H, Boden-Albala B, Wang C, Elkind MS, Rundek T, Wright CB, Sacco RL. Ischemic stroke subtype incidence among whites, blacks, and Hispanics: the Northern Manhattan Study. Circulation. 2005;111:1327–1331.
9. Cohen JD, Cziraky MJ, Cai Q, Wallace A, Wasser T, Crouse JR, Jacobson TA. 30-Year trends in serum lipids among United States adults: results from the National Health and Nutrition Examination Surveys II, III, and 1999-2006. Am J Cardiol. 2010;106:969–975.
10. Third Report of the National Cholesterol Education Program (NCEP) Expert Panel on Detection, Evaluation, and Treatment of High Blood Cholesterol in Adults (Adult Treatment Panel III) final report. Circulation. 2002;106:3143–3421.
11. Centers for Disease Control and Prevention. National Health and Examination Survey: note on 2007–2010 sampling methodology. Centers for Disease Control and Prevention Web site. http://www.cdc.gov/nchs/nhanes/nhanes2007-2008/sampling_0708.htm. Accessed April 11, 2013.
12. Holland AT, Palaniappan LP. Problems with the collection and interpreta-tion of Asian-American health data: omission, aggregation, and extrapola-tion. Ann Epidemiol. 2012;22:397–405.
13. Huxley RR, Barzi F, Lam TH, Czernichow S, Fang X, Welborn T, Shaw J, Ueshima H, Zimmet P, Jee SH, Patel JV, Caterson I, Perkovic V, Woodward M; Asia Pacific Cohort Studies Collaboration and the Obesity in Asia Collaboration. Isolated low levels of high-density lipoprotein cho-lesterol are associated with an increased risk of coronary heart disease: an individual participant data meta-analysis of 23 studies in the Asia-Pacific region. Circulation. 2011;124:2056–2064.
14. Rutherford JN, McDade TW, Feranil AB, Adair LS, Kuzawa CW. High prevalence of low HDL-c in the Philippines compared to the US: popula-tion differences in associations with diet and BMI. Asia Pac J Clin Nutr. 2010;19:57–67.
15. Misra A, Khurana L. Obesity-related non-communicable diseases: South Asians vs White Caucasians. Int J Obes (Lond). 2011;35:167–187.
16. Karthikeyan G, Teo KK, Islam S, McQueen MJ, Pais P, Wang X, Sato H, Lang CC, Sitthi-Amorn C, Pandey MR, Kazmi K, Sanderson JE, Yusuf S. Lipid profile, plasma apolipoproteins, and risk of a first myocardial infarc-tion among Asians: an analysis from the INTERHEART Study. J Am Coll Cardiol. 2009;53:244–253.
17. Truesdale KP, Stevens J, Cai J. Impact of body mass index levels on lipid abnormalities in Chinese Asians, American Blacks and American Whites: the People’s Republic of China (PRC) and Atherosclerosis Risk in Communities (ARIC) Studies. Atherosclerosis. 2011;218:517–523.
18. Goff DC Jr, Bertoni AG, Kramer H, Bonds D, Blumenthal RS, Tsai MY, Psaty BM. Dyslipidemia prevalence, treatment, and control in the Multi-Ethnic Study of Atherosclerosis (MESA): gender, ethnicity, and coronary artery calcium. Circulation. 2006;113:647–656.
19. Chandalia M, Mohan V, Adams-Huet B, Deepa R, Abate N. Ethnic dif-ference in sex gap in high-density lipoprotein cholesterol between Asian Indians and Whites. J Investig Med. 2008;56:574–580.
20. Derby CA, Wildman RP, McGinn AP, Green RR, Polotsky AJ, Ram KT, Barnhart J, Weiss G, Santoro N. Cardiovascular risk factor variation within a Hispanic cohort: SWAN, the Study of Women’s Health Across the Nation. Ethn Dis. 2010;20:396–402.
21. Daviglus ML, Talavera GA, Avilés-Santa ML, Allison M, Cai J, Criqui MH, Gellman M, Giachello AL, Gouskova N, Kaplan RC, LaVange L, Penedo F, Perreira K, Pirzada A, Schneiderman N, Wassertheil-Smoller S, Sorlie PD, Stamler J. Prevalence of major cardiovascular risk factors and cardiovascular diseases among Hispanic/Latino individuals of diverse backgrounds in the United States. JAMA. 2012;308:1775–1784.
22. Mensah GA. Eliminating disparities in cardiovascular health: six stra-tegic imperatives and a framework for action. Circulation. 2005; 111:1332–1336.
23. US Department of Health and Human Services. HHS Action Plan to Reduce Racial and Ethnic Disparities: A Nation Free of Disparities in Health and Health Care. Washington, DC: US Department of Health and Human Services; 2011.
24. Institute of Medicine. Unequal Treatment: Confronting Racial and Ethnic Disparities in Health Care (With CD). Washington, DC: National Academies Press; 2003.
25. Palaniappan LP, Wong EC, Shin JJ, Moreno MR, Otero-Sabogal R. Collecting patient race/ethnicity and primary language data in ambulatory care settings: a case study in methodology. Health Serv Res. 2009;44(pt 1):1750–1761.
26. Wong EC, Palaniappan LP, Lauderdale DS. Using name lists to infer Asian racial/ethnic subgroups in the healthcare setting. Med Care. 2010;48:540–546.
27. Carroll MD, Kit BK, Lacher DA, Shero ST, Mussolino ME. Trends in lipids and lipoproteins in US adults, 1988-2010. JAMA. 2012;308:1545–1554.
28. American Diabetes Association. Diagnosis and classification of diabetes mellitus. Diabetes Care. 2012;35:S64–S71.
29. Hyre AD, Muntner P, Menke A, Raggi P, He J. Trends in ATP-III-defined high blood cholesterol prevalence, awareness, treatment and control among US adults. Ann Epidemiol. 2007;17:548–555.
30. Palaniappan LP, Araneta MR, Assimes TL, Barrett-Connor EL, Carnethon MR, Criqui MH, Fung GL, Narayan KM, Patel H, Taylor-Piliae RE, Wilson PW, Wong ND; American Heart Association Council on Epidemiology and Prevention; American Heart Association Council on Peripheral Vascular Disease; American Heart Association Council on Nutrition, Physical Activity, and Metabolism; American Heart Association Council on Clinical Cardiology; American Heart Association Council on Cardiovascular Nursing; Council on Cardiovascular Nursing. Call to action: cardiovascular disease in Asian Americans: a science advisory from the American Heart Association. Circulation. 2010;122:1242–1252.
31. Benfante R. Studies of cardiovascular disease and cause-specific mortality trends in Japanese-American men living in Hawaii and risk factor com-parisons with other Japanese populations in the Pacific region: a review. Hum Biol. 1992;64:791–805.
32. Miller M, Stone NJ, Ballantyne C, Bittner V, Criqui MH, Ginsberg HN, Goldberg AC, Howard WJ, Jacobson MS, Kris-Etherton PM, Lennie TA, Levi M, Mazzone T, Pennathur S; American Heart Association Clinical Lipidology, Thrombosis, and Prevention Committee of the Council on Nutrition, Physical Activity, and Metabolism; Council on Arteriosclerosis, Thrombosis and Vascular Biology; Council on Cardiovascular Nursing; Council on the Kidney in Cardiovascular Disease. Triglycerides and cardiovascular disease: a scientific statement from the American Heart Association. Circulation. 2011;123:2292–2333.
33. Bainey KR, Jugdutt BI. Increased burden of coronary artery disease in South-Asians living in North America: need for an aggressive manage-ment algorithm. Atherosclerosis. 2009;204:1–10.
34. Dodani S. Excess coronary artery disease risk in South Asian immigrants: can dysfunctional high-density lipoprotein explain increased risk? Vasc Health Risk Manag. 2008;4:953–961.
35. Palaniappan L, Wang Y, Fortmann SP. Coronary heart disease mortal-ity for six ethnic groups in California, 1990-2000. Ann Epidemiol. 2004;14:499–506.
36. Wild SH, Laws A, Fortmann SP, Varady AN, Byrne CD. Mortality from coronary heart disease and stroke for six ethnic groups in California, 1985 to 1990. Ann Epidemiol. 1995;5:432–439.
37. Lanas F, Avezum A, Bautista LE, Diaz R, Luna M, Islam S, Yusuf S; INTERHEART Investigators in Latin America. Risk factors for acute myocardial infarction in Latin America: the INTERHEART Latin American study. Circulation. 2007;115:1067–1074.
at CONS CALIFORNIA DIG LIB on December 16, 2014http://circ.ahajournals.org/Downloaded from
Frank et al Disparities in Dyslipidemia 579
38. Hertz RP, Unger AN, Cornell JA, Saunders E. Racial disparities in hypertension prevalence, awareness, and management. Arch Intern Med. 2005;165:2098–2104.
39. Jones DW, Chambless LE, Folsom AR, Heiss G, Hutchinson RG, Sharrett AR, Szklo M, Taylor HA Jr. Risk factors for coronary heart disease in African Americans: the Atherosclerosis Risk in Communities study, 1987-1997. Arch Intern Med. 2002;162:2565–2571.
40. Ma J, Sehgal NL, Ayanian JZ, Stafford RS. National trends in statin use by coronary heart disease risk category. PLoS Med. 2005;2:e123.
41. Festa A, D’Agostino R Jr, Mykkänen L, Tracy R, Howard BV, Haffner SM. Low-density lipoprotein particle size is inversely related to plasmino-gen activator inhibitor-1 levels: the Insulin Resistance Atherosclerosis Study. Arterioscler Thromb Vasc Biol. 1999;19:605–610.
42. Biswas S, Ghoshal PK, Mandal SC, Mandal N. Association of low-density lipoprotein particle size and ratio of different lipoproteins and apolipopro-teins with coronary heart disease. J Cardiol. 2008;52:118–126.
43. Rubins HB, Robins SJ, Collins D, Fye CL, Anderson JW, Elam MB, Faas FH, Linares E, Schaefer EJ, Schectman G, Wilt TJ, Wittes J. Gemfibrozil for the secondary prevention of coronary heart disease in men with low
levels of high-density lipoprotein cholesterol: Veterans Affairs High-Density Lipoprotein Cholesterol Intervention Trial Study Group. N Engl J Med. 1999;341:410–418.
44. Coronary Drug Project Collaborators. Clofibrate and niacin in coronary heart disease. JAMA. 1975;231:360–381.
45. Keech A, Simes RJ, Barter P, Best J, Scott R, Taskinen MR, Forder P, Pillai A, Davis T, Glasziou P, Drury P, Kesäniemi YA, Sullivan D, Hunt D, Colman P, d’Emden M, Whiting M, Ehnholm C, Laakso M; FIELD study investigators. Effects of long-term fenofibrate therapy on cardiovascular events in 9795 people with type 2 diabetes mellitus (the FIELD study): randomised controlled trial. Lancet. 2005;366:1849–1861.
46. Boden WE, Probstfield JL, Anderson T, Chaitman BR, Desvignes-Nickens P, Koprowicz K, McBride R, Teo K, Weintraub W. Niacin in patients with low HDL cholesterol levels receiving intensive statin therapy. N Engl J Med. 2011;365:2255–2267.
47. HPS2-THRIVE Collaborative Group. HPS2-THRIVE randomized pla-cebo-controlled trial in 25 673 high-risk patients of ER niacin/laropiprant: trial design, pre-specified muscle and liver outcomes, and reasons for stop-ping study treatment. Eur Heart J. 2013; 34:1279–91.
CLINICAL PERSPECTIvEOur analysis offers insight on racial/ethnic differences in dyslipidemia, a major cardiovascular risk factor. Given the rapid increase in minority groups within the United States, especially the Hispanic/Latino and Asian American populations, a better understanding of these differences in dyslipidemia is crucial in tailoring optimal strategies in management and pre-vention, both at the individual and population levels. Despite known heterogeneity in cardiovascular risk and outcomes, no studies have comprehensively examined the prevalence of dyslipidemia subtypes and treatment across the major racial/eth-nic groups in the United States. Multiple organizations including the American Heart Association, US Department of Health and Human Services, and Institute of Medicine have all acknowledged the need for more data from minority populations to guide the development of programs to address health disparities. We not only found particular groups who were at increased risk for having combined dyslipidemias (high low-density lipoprotein cholesterol, low high-density lipoprotein cholesterol, high triglycerides) but that every minority group except blacks had higher risk of hypertriglyceridemia than non-Hispanic whites. Using a very diverse patient cohort, we offer a unique and contemporary insight into the prevalence of dyslipidemias among various minority subgroups in the United States that differs from international data. By knowing which racial/ethnic groups may be at higher risk for developing certain dyslipidemias, clinicians will be able to provide culturally competent recommendations on prevention and management.
at CONS CALIFORNIA DIG LIB on December 16, 2014http://circ.ahajournals.org/Downloaded from
1
Supplemental Material
Figure 1: Prevalence Odds Ratios for Racial/Ethnic Differences in Dyslipidemia Subtypes (Prevalent Type 2 Diabetes in Model) (N = 169,430)
CHD = coronary heart disease; PVD= peripheral vascular disease; LDL-C = low-density lipoprotein cholesterol; HDL-C = high density lipoprotein cholesterol; TG= triglycerides
Figure 2: Prevalence Odds Ratios for Racial/Ethnic Differences in Dyslipidemia Subtypes (Stratified based on treatment by LMAs and LLA)
2
LMAs=lipid-modifying agents and refers to statins, fibrates, niacin, bile acid sequestrants and plant stanols and sterols; LLAs= LDL lowering agents and excludes fibrates, niacin and bile acid
sequestrants; LDL-C = low-density lipoprotein cholesterol; HDL-C = high density lipoprotein cholesterol; TG= triglycerides
3
Figure 3: Prevalence Odds Ratios for Racial/Ethnic Differences in Isolated HDL (N=169,430)
HDL-C = high density lipoprotein cholesterol
Latha P. PalaniappanAriel T.H. Frank, Beinan Zhao, Powell O. Jose, Kristen M.J. Azar, Stephen P. Fortmann and
Racial/Ethnic Differences in Dyslipidemia Patterns
Print ISSN: 0009-7322. Online ISSN: 1524-4539 Copyright © 2013 American Heart Association, Inc. All rights reserved.
is published by the American Heart Association, 7272 Greenville Avenue, Dallas, TX 75231Circulation doi: 10.1161/CIRCULATIONAHA.113.005757
2014;129:570-579; originally published online November 5, 2013;Circulation.
http://circ.ahajournals.org/content/129/5/570World Wide Web at:
The online version of this article, along with updated information and services, is located on the
http://circ.ahajournals.org/content/suppl/2013/11/05/CIRCULATIONAHA.113.005757.DC1.htmlData Supplement (unedited) at:
http://circ.ahajournals.org//subscriptions/
is online at: Circulation Information about subscribing to Subscriptions:
http://www.lww.com/reprints Information about reprints can be found online at: Reprints:
document. Permissions and Rights Question and Answer this process is available in the
click Request Permissions in the middle column of the Web page under Services. Further information aboutOffice. Once the online version of the published article for which permission is being requested is located,
can be obtained via RightsLink, a service of the Copyright Clearance Center, not the EditorialCirculationin Requests for permissions to reproduce figures, tables, or portions of articles originally publishedPermissions:
at CONS CALIFORNIA DIG LIB on December 16, 2014http://circ.ahajournals.org/Downloaded from