Embed Size (px)
Citation preview

NBER WORKING PAPER SERIES
RACIAL/ETHNIC DIFFERENCES IN NON-WORK AT WORK
Daniel S. HamermeshKatie R. Genadek
Michael Burda
Working Paper 23096http://www.nber.org/papers/w23096
NATIONAL BUREAU OF ECONOMIC RESEARCH1050 Massachusetts Avenue
Cambridge, MA 02138January 2017
Hamermesh thanks the Alexander von Humboldt Stiftung for general financial support; Genadek was supported by the University of Colorado Population Center (HD066613), the Minnesota Population Center at the University of Minnesota (HD041023) and the Data Extract Builder of the ATUS (University of Maryland, HD053654), all funded by NICHD; Burda received general support from the Collaborative Research Center 649 “Economic Risk” of the Deutsche Forschungsgemeinschaft. None of these institutions provided funding for this project directly, nor did any other institution. The content is solely the responsibility of the authors and does not necessarily represent the official views of the institutions. We thank Kevin Carney, Christopher Gallo, Joanne Kleydish, Anna Maria Koukal, Michael Naef and participants in seminars at several universities for helpful comments. The views expressed herein are those of the authors and do not necessarily reflect the views of the National Bureau of Economic Research.
NBER working papers are circulated for discussion and comment purposes. They have not been peer-reviewed or been subject to the review by the NBER Board of Directors that accompanies official NBER publications.
© 2017 by Daniel S. Hamermesh, Katie R. Genadek, and Michael Burda. All rights reserved. Short sections of text, not to exceed two paragraphs, may be quoted without explicit permission provided that full credit, including © notice, is given to the source.

Racial/Ethnic Differences in Non-Work at WorkDaniel S. Hamermesh, Katie R. Genadek, and Michael BurdaNBER Working Paper No. 23096January 2017JEL No. J15,J22,J31
ABSTRACT
Evidence from the American Time Use Survey 2003-12 suggests the existence of small but statistically significant racial/ethnic differences in time spent not working at the workplace. Minorities, especially men, spend a greater fraction of their workdays not working than do white non-Hispanics. These differences are robust to the inclusion of large numbers of demographic, industry, occupation, time and geographic controls. They do not vary by union status, public-private sector attachment, pay method or age; nor do they arise from the effects of equal-employment enforcement or geographic differences in racial/ethnic representation. The findings imply that measures of the adjusted wage disadvantages of minority employees are overstated by about 10 percent.
Daniel S. HamermeshDepartment of EconomicsRoyal Holloway University of LondonEgham, TW20 0EXUNITED KINGDOMand [email protected]
Katie R. GenadekUniversity of ColoradoBoulder, CO [email protected]
Michael BurdaFaculty of Business and EconomicsHumboldt University BerlinSpandauer Str. 1D-10178 [email protected]

1
I. Hours on the Job and Hours Working
Commonly used statistics on labor productivity and real wages are normally computed by
dividing measures such as earnings by hours reported as having been worked. Estimates of
(adjusted) wage differentials (discrimination) across racial-ethnic-gender groups require
adjusting weekly earnings for differences in hours worked among these groups. In the United
States the commonly used measures of hours are either reported weekly hours in the monthly
household-based Current Population Survey (CPS), weekly, monthly or annual hours in other
household surveys, or weekly hours reported by employers in the monthly Current Employment
Statistics (CES).
The use of any of these measures may produce biased estimates of the outcomes of interest,
including time series of changes in labor productivity (examined by Burda et al, 2013 and 2016),
measures of growth in living standards per hour of work, and demographic wage differentials in
the cross section. If, for example, reported hours exceed actual hours worked by less among
minority and/or female workers than among others, estimates of adjusted hourly wage/earnings
differentials will understate the extent of discriminatory differences in earnings.
Until recently accounting for this potential difficulty was not possible—no nationally
representative data set provided information on what people do during the hours that they report
working. The American Time Use Survey (ATUS) (see Hamermesh et al, 2005) provides diary
information on over 400 possible activities engaged in by large samples of (former CPS)
respondents, including detailed information on a wide variety of different activities undertaken in
the workplace. We use these data from 2003-12 to examine differences among demographic
groups in the amount of time that they spend at the workplace but not working (Hofferth et al,
2015).

2
II. ATUS Measures of Time Use on the Job
As part of its daily diaries, the ATUS includes information on where during each of most of
the activities that were undertaken the respondent was located, with one possibility being “at the
workplace.” Work and work-related activities (including socializing, and eating and exercising
as a part of the job) constitute the primary activity for most time at the workplace, and we
assume it represents productive time; but respondents also indicate being at the workplace during
other primary activities such as eating at work, “socializing, relaxing and leisure,” “sports and
exercise” and “security procedures”. These categories also include employer-sanctioned breaks
or self-initiated “down time” in work schedules. We combine all time spent in primary activities
at work other than work or work-related activities and divide by reported (in the diary) total time
at the workplace to create η, the fraction of time while at the workplace that the person is not
working. This measure excludes time when the person might be working for pay but is not at the
workplace. One might regard some of these non-work activities as productive, as are many off-
the-job activities (e.g., exercise, sleep and many others); but we accept respondents’ notions of
what constitutes their regular work, as reflected in their diaries, and treat the residual time at
work as non-work.
The first decade of ATUS diaries, 2003-12, included over 135,000 respondents. Because we
require diaries from workdays, and because the ATUS oversamples weekend days, far fewer
diaries are usable for our purpose. Moreover, since our estimates can form the basis for adjusting
wage differentials, worker productivity, and other outcomes, we focus only on employees (thus
excluding the self-employed). These exclusions leave us with 35,548 workers who provided
daily diaries for days on which they were at their place of employment. We divide the sample by
gender, then divide workers in each gender into five mutually exclusive and exhaustive

3
racial/ethnic groups: Non-Hispanic white; African-American; Non-black Hispanic; Asian-
American, and Other. We classify any Non-black respondent listing his/her ethnicity as Hispanic
in the third category.
In Table 1 we present estimates of η, the fraction of the workday not working, by gender and
racial/ethnic group, constructed as means using BLS ATUS final weights. There are substantial
differences in the η within each gender across the racial ethnic groups, with Non-Hispanic whites
reporting less non-work time per hour at work than other groups. Of course, these differences do
not account for demographic or other differences across the groups, and we explore those in the
next section.
A notable feature in these statistics is that η is nearly identical between Non-Hispanic white
men and women. For workers of each gender about 6.5 percent of time at the workplace is spent
not working—about a half hour in a full work day.1 Among minority groups there is no obvious
general pattern of differences between male and female workers—African-American, Non-black
Hispanic and Other men spend greater fractions of their time in non-work activities than their
female counterparts, while Asian-American male workers spend less.
One might be concerned that the samples are unrepresentative in various ways, perhaps due
to the exclusion restrictions that we have used in creating this sub-sample. This concern should
be allayed, at least for male workers, by comparisons within columns of the fourth and fifth rows
in the upper half of Table 1. The weighted fractions of male workers in each of the five
racial/ethnic groups are very near those reported in the American Community Survey (ACS)
averaged over 2003-2012 (Ruggles et al, 2015). The differences between female workers’
representation in our ATUS sub-sample and the ACS are proportionately larger than the
1Remember that time eating during work hours is usually not at the workplace, which accounts for what might seem like a small fraction of worktime spent not working on the job.

4
differences among men; but they are fairly small absolutely among the three largest racial/ethnic
groups.
III. Accounting for Other Demographic, Industry and Occupational Influences
The raw differences shown in the top rows of each half of Table 1 are interesting but not
conclusive, because they could stem from differences in the amount of time spent at the
workplace or in the number of hours usually worked; from racial/ethnic differences in labor
supply due to family circumstances; from demand-side differences arising from differential
occupation/industry attachment by race/ethnicity; and perhaps even from differences in location,
or in the day of the week or month of the year for which the time diary is completed. In what
follows, we estimate OLS regressions for η to account for the roles played by these factors,
adding increasingly large numbers of vectors of covariates. We use Non-Hispanic whites within
each gender as the comparison group and examine how the addition of these covariates alters our
conclusions about racial/ethnic relative differences in non-work time at work.
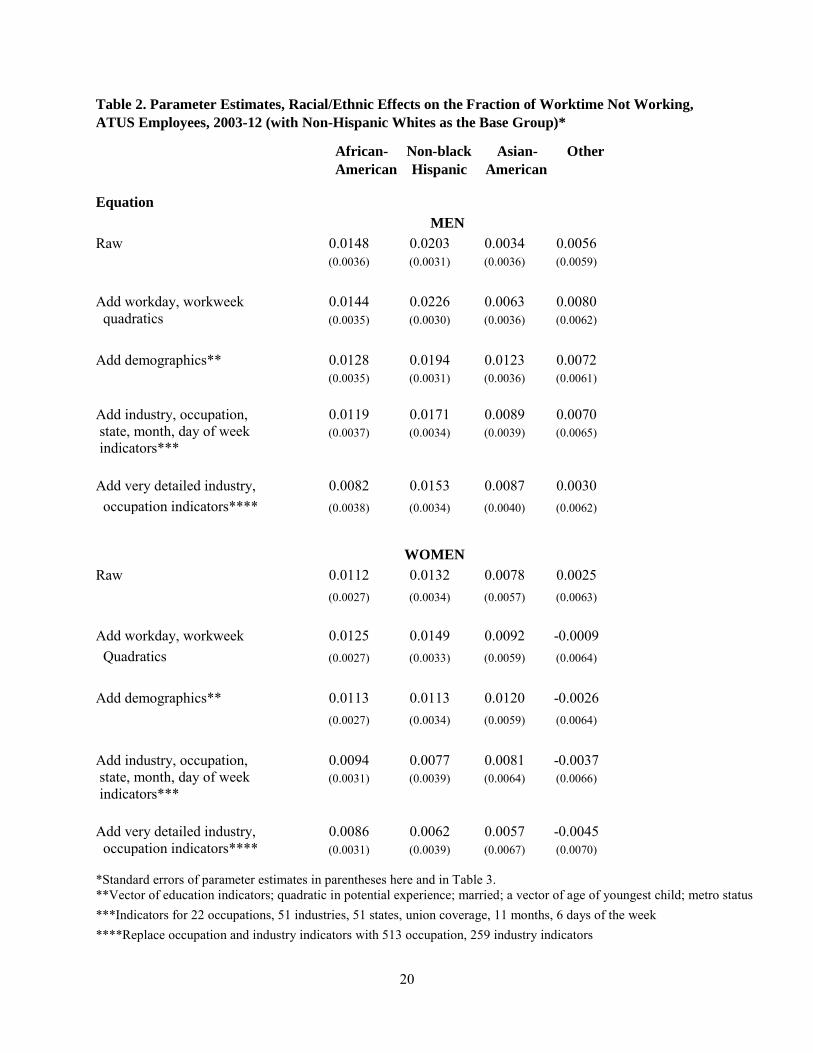
The first rows in the top and bottom parts of Table 2 present the differences in η between
workers in each of the four racial/ethnic minorities and that of Non-Hispanic whites, simply
reproducing the differences implicit in Table 1, plus adding their standard errors. They are thus
estimates of α1 in the equation:
(1) ηist = α0 + α1Xist + εist ,
where i is an individual, s a state, t a month, X is the vector of indicators of race/ethnicity, the α
are parameters to be estimated, and ε is the disturbance term. What is most intriguing in these
raw differences is that all four are positive—all the minorities that are identifiable in the CPS,
including those that may be viewed as not being disadvantaged, spend greater fractions of their
time at work not working when compared to non-Hispanic whites. They are largest, and

5
statistically greater than zero, for the two largest minority groups, African-Americans and Non-
black Hispanics. In the second rows of each half of the table we simply add pairs of quadratics in
the length of the respondent’s usual workweek, as recalled, and the time spent at the workplace
on the diary day, as recorded in the diary. These controls hardly alter the racial/ethnic differences
in η, suggesting if anything that the raw differences are understatements.
Because race and ethnicity are correlated with such demographic differences as marital
status, age and number of children, geography and others, the differentials in the second rows of
Table 2 may merely be reflecting familial and other incentives that alter the amount of non-work
on-the-job. To account for this possibility, the third rows include as covariates: Marital and
metropolitan status; a quadratic in potential experience; vectors of five indicators of the ages of
the children in the household, and four indicators of the respondent’s educational attainment.
Except for Asian-Americans, the inclusion of these covariates does reduce the estimated
differential in reported non-work time between minority groups and majority workers. The
differences remain statistically significant for the two largest groups, however, and they become
statistically significant among Asian-American workers. The greater propensity for on-the-job
non-work noted in Table 1 is not due to differences in demographic characteristics between
minority and majority workers.
The estimates thus far do not account for the possibility that the structure of labor demand by
race/ethnicity differs across industries and occupations; nor do they acknowledge, even with
workdays of the same length, that the extent of non-work may differ by day of week or time of
year; nor do they recognize that other characteristics may differ geographically. To account for
these possibilities we re-estimate the equations adding vectors of indicators of the month of the

6
year and day of the week on which the diary was kept; of geographic area (state); and of what are
essentially two-digit classifications of occupation and industry.
The results of adding these additional controls are shown in the fourth rows of Table 2.
Among men all of the estimated racial/ethnic differences in non-work decline, but for Non-
Hispanic black, Non-black Hispanic, and Asian-American men the significantly positive results
of the previous estimates persist; and the reductions of the differentials for the two largest
minority groups are quite small. Among female workers the reductions in the estimated effects
are large, but here too they remain statistically significant and positive for workers in the two
largest minority groups.
We can go further by replacing the vectors of two-digit occupation and industry indicators by
much longer vectors, accounting for over 500 occupations and over 250 industries. The results of
making these substitutions are presented in the bottom rows of the two parts of Table 2. Among
men including these much finer controls does reduce the estimated minority-majority
differentials in η; but those differentials that had been significantly positive remain so. Among
women workers including these additional covariates also reduces the estimated racial/ethnic
differentials, but the changes are small compared to the estimates based on including the broader
industry/occupation indicators.2
Do the differentials arise from a greater willingness of minorities to report non-work time on
the job or from cultural differences about what constitutes actual work? First, that all minorities
report more non-work would, if it stemmed from cultural differences, imply similar attitudes
2If we re-estimate these final equations dropping time spent eating at the workplace, the racial-ethnic differentials for male workers are proportionately even larger, while those for female workers are approximately the same. If we include both the quadratic in time at the workplace from the time diaries and total time reported in the diaries as working, the adjusted demographic differences are essentially unchanged. While all of the estimates reported in the tables and discussed in the text use the proportions of time at work spent not working, using the raw amounts of non-work time instead yields slightly larger and more statistically significant racial/ethnic differentials.

7
across the minority groups, which seems hard to credit. Second, if cultural differences between
minority groups and the majority workers are causing reporting differences, one would expect
that they would be greater among immigrant minority workers, who have had less time to
assimilate to the majority culture. Interactions of immigrant status with the race/ethnic indicators
are, however, far from statistically significant when added to the specifications in the bottom
rows of Table 2. Third, the findings do not stem from minorities’ greater willingness to report
different activities, including non-work on the job. Non-Hispanic whites report 19.78
(s.e.=0.032) different activities per day on average, while the average numbers of different
activities reported by minorities are: African-Americans, 18.77 (s.e.=0.078), Non-black
Hispanics, 18.05 (s.e.=0.071), Asian-Americans 18.90 (s.e.=0.134), Others, 19.63 (s.e.=0.188).
Minorities report fewer different activities per day than otherwise identical majority workers.
The best evidence that these results do not merely arise from differing willingness to report
non-work due to racial differences in the social desirability of work comes from analyses of the
General Social Surveys. They have included two questions that allow examining such
differences: 1) For all respondents, “If you were to get enough money to live as comfortably as
you would like for the rest of your life, would you continue to work or would you stop
working?” and 2) For workers, agreement with the statement, “My main satisfaction in life
comes from work.” Estimating a probit (ordered probit) on the responses to Question 1 (2) and
excluding racial groups other than whites and African-Americans, the latter are insignificantly
more likely to say they would stop work; but they are nearly significantly more likely to agree or
agree strongly with the statement about the importance of satisfaction with work. (See Appendix
Table A1 for results.) There is clearly no racial difference in how people view the desirability of

8
work, suggesting (but not proving) that differences in willingness to report non-work at work are
unimportant.
A number of institutional differences among the sample observations might account for or at
least minimize the findings implied in the bottom rows of the panels in Table 2. Trade unions
may provide more services to minority workers, perhaps for political reasons (at least to African-
American workers, who are more heavily unionized than other groups), perhaps arising from
preferences of union members and leaders to protect minority workers. To examine this
possibility we added an indicator of union status and its interactions with the four racial/ethnic
indicators. Among men (women) the F-statistic on the significance of these interactions yielded
p = 0.82 (p = 0.41), suggesting that these racial/ethnic differences in non-work arise in both
union and non-union environments.
Hourly workers may be monitored more closely, and this might account for racial/ethnic
differentials in non-work. We added an indicator of hourly pay status and its interactions with the
racial/ethnic indicators to the expanded equations shown in the bottom rows of Table 2. Among
women the F-statistic on the interactions yielded p = 0.30, but among men the vector of
interactions was statistically significant (p = 0.04). Its significance was, however, due entirely to
the significance of the interaction with the indicator for Asian-Americans. In a similar set of
expanded specifications distinguishing between the roughly one-sixth of workers in the public
sector and others there was again no significant difference in the racial/ethnic non-work
differentials by sector, with the F-statistic on the interaction terms for men (women) yielding p =
0.88 (p = 0.12).
Finally, the influence of age on non-work time may differ between majority and minority
workers. To examine this, we created an indicator, age ≤ 40, which divided the samples

9
essentially in halves. Including this indicator and its interactions in the expanded equations
shown in Table 2, we found no difference in the racial/ethnic non-work differentials by age:
Among men (women) the significance of the F-statistics describing the four interaction terms
was p = 0.33 (p = 0.36). All four re-specifications described in these paragraphs support the
robustness of the results presented in the bottom rows of each panel of Table 2 across various
cuts of the data.
While the descriptive statistics in Table 1 allow comparisons by racial/ethnic group of gender
differences in non-work, they do not account for differences that might arise from any male-
female differences in the large sets of controls that we added to generate most of the estimates in
Table 2. To obtain an adjusted gender difference in on-the-job non-work we estimate the
equation in the last rows of Table 2 for all 35,548 workers in the sample. All these other things
equal, male workers spend an additional fraction of 0.001 (s.e.= 0.002) of the workday not
working compared to female workers. The conclusion of little gender difference conveyed by the
raw differences in Table 1 is supported even after accounting for large numbers of possible
covariates. While there are significant racial/ethnic differentials in non-work on the job, there is
essentially no difference between otherwise identical male and female employees.
Aggregating the adjusted effects among men, the best estimate is that on average minority
male workers (based on a sample-weighted average of the parameter estimates in the bottom row
of the top half of Table 2) spend an additional 1.10 percent of each workday not working on-the-
job compared to their majority counterparts. Over a 250-day full-time work year this amounts to
an additional 22 hours per year of not working while at work. Taking all four female minority
groups together, these best estimates suggest that the average minority female worker spends

10
0.64 percent less of each additional hour at work actually working compared to her majority
counterparts, i.e., 14 hours of a full-time work year.3
IV. The Economic Significance of Racial-Ethnic Differences in Non-Work and Their
Cause(s)
A. The Economic Magnitude of the Differences in Non-Work
While statistically significant and robustly so, these racial/ethnic differences are not large. To
what extent do these results alter our conclusions about the extent of racial/ethnic differences in
outcomes, in particular in hourly earnings—the best measure of the price of labor of different
races/ethnicities? How do they compare to the impacts of various shocks to other outcomes of
interest generated in the literatures in labor and demographic economics?
On the first issue, a recent study (Anant et al, 2013) estimated adjusted black-white wage
differentials at around 14 percent, Hispanic- non-Hispanic white adjusted wage differentials at
around 15 percent, Asian-American wage differences at around 13 percent, and white-Other
differences at around 14 percent. D’Haultfoeuille et al (2014) find median estimates of the
black-white wage gap using samples from the NLSY79 and NLSY97 of around 12 percent. Thus
using our estimates for men, and adjusting reported hours worked for racial/ethnic differences in
on-the-job non-work, the measured extent of discrimination against African-Americans would be
reduced by more than 1 percentage point (about a 10 percent reduction), and among African-
American women by over one-half percentage point. In comparison, these are no smaller than
the adjustments/explanations that have been produced in studies that have examined the impacts
of unusual determinants of demographic differences in wages (e.g., Gielen et al, 2016). 3One might argue that the differences that we have identified arise because of racial/ethnic differences in time use away from the job. Minorities might spend more time commuting, might sleep less or might engage in more household production. These measures may well be endogenous with non-work time at work; nonetheless, to examine their relation to the racial/ethnic differences we have focused on, we include each separately in the expanded equations shown in the bottom of each panel of Table 2, then include them jointly. Including each separately actually raises slightly the estimated excess of minority over majority non-work time. Taking them together, their inclusion raises the excess among men (women) by about 10 (15) percent.

11
It is more difficult to compare the magnitudes of the impacts of the adjusted racial/ethnic
differences in on-the-job non-work to the impacts of shocks in other areas where there is no
monetary outcome to consider. Thus the best comparisons use differences measured in standard-
deviation units. Among men (women) the adjusted weighted average estimated differences in
non-work between minority and majority workers are 0.10 (0.06) of a standard deviation. These
are much greater than some produced in the demographic literature (e.g., Banerjee et al, 2010)
and comparable to the larger effects on educational outcomes (test scores) of variations in
teacher quality found in the education literature (e.g., Rivkin et al, 2005).
B. Sorting Out Possible Causes
Merely demonstrating the existence of significant differences in on-the-job non-work
between minority and majority workers does not establish their origins. In what follows, we first
examine several mechanisms by which incentives might generate the differentials that we have
identified: 1) Perhaps differential access to anti-discrimination protection leads minority workers
to alter their non-work in the workplace; 2) Perhaps having more similar workers in the
workplace and in the community alters the extent of non-work; 3) Yet a third possibility is that,
perceiving that discrimination reduces their chances for promotion, minority employees reduce
their effort at work
Before examining these alternatives we should note that, although we have held constant for
remarkably detailed industry and occupation characteristics, even within those narrow cells
minorities may be assigned to tasks that are inherently more strenuous and require more “down
time.” Clearly, with these data we cannot investigate this explanation. Still another alternative is
that the extra non-work time experienced by minority employees enables them to be more
productive than majority employees during the (lesser) amount of time per hour on the job that

12
they are actually working (consistent with some older, loosely related indirect evidence--
(Hellerstein et al, 1999).
Greater protection by more stringent enforcement of equal-employment legislation might
reduce the firing risk perceived by minority workers if caught not working at work. One would
thus expect that interactions of the strength of enforcement of EEO legislation in the labor
market where a worker resides with the indicators X in (1) would yield positive estimates, since
additional EEO charges would suggest that minority workers have more protection should they
engage in more non-work activities on the job. To examine this possibility we collected
information on EEOC filings by state for the available years (2009-12) (EEOC, 2015); for the
earlier years, 2003-08, we impute the average for 2009-12 in the state of the worker’s residence.
In the extension of (1) we include EEOC charges per year per thousand employees in the state
and year as a main effect and in interactions with the vector X. The mean of the EEO measure is
0.75 (s.d.=0.39), and it ranges between 0.01 and 2.08.
We present the results of including this term and the interactions for men and for women in
the upper two rows of the top and bottom halves of Table 3. Each equation also includes the
nearly 1000 covariates that were included in the estimates shown in the bottom rows of Table 2.
The standard errors are clustered on the EEOC charges variable.
Other things equal, workers of all races/ethnicities (especially men) do spend greater
fractions of the workday not working in states in which more EEOC charges are filed. Among
men three of the four interaction terms are not, however, significantly different from zero; but
because the interaction is statistically significant among Non-black Hispanics, an F-test of the
joint significance of the vector of four interactions rejects the hypothesis that they are zero. Three
of the four are, however, negative, contrary to our expectations that greater EEO enforcement

13
would raise incentives for non-work by minority workers. Among women the interactions are
also negative (again with the exception of the Other minority category), but none is statistically
significant individually, and the F-statistic testing the significance of the vector of interactions is
tiny. Taking all these results together, a reasonable conclusion is that the extent of EEOC
enforcement in an area does not appear to alter the on-the-job non-work behavior of minority
compared to majority workers.
The second possible explanation based on incentives is that the representation of a minority
group in an area might alter workers’ incentives for non-work and employers’ interest in
monitoring workers. If minority workers in an area are more numerous, they may feel protected
from firing or may feel peer pressure to work less on the job (Mathewson, 1931). On the other
hand, employers’ greater willingness to monitor minority workers where they are more visible is
consistent with the taste theory of discrimination (Becker, 1957) and would lead to less non-
work by minorities. To examine these ideas we include the percentages of employees in each
minority group (based on total ACS employment in the state and year) and their interactions with
the worker’s racial/ethnic indicator in expanded versions of the final equations in Table 2. The
means of the four racial/ethnic average fractions of male workers are: African-American, 0.096
(s.d.=0.065); Non-black Hispanic, 0.145 (s.d.=0.121); Asian-American, 0.044 (s.d.=0.040); and
Other groups, 0.021 (0.016).4
The estimates of the interactions in these expanded equations are shown in the third row in
each of the two panels in Table 3, with the significance of the F-statistic testing the four
interaction terms also shown. Only one of the interaction terms is statistically significantly
nonzero (again, among Non-black Hispanic men); and the interactions as groups are far from
4Among women the comparable statistics are: African-Americans, 0.127 (s.d.=0.087); Non-black Hispanics, 0.117 (s.d.=0.107); Asian-Americans, 0.045 (s.d.=0.047); other groups, 0.023 (s.d.=0.019).

14
statistically significantly nonzero. Moreover, even across the wide variation in the percentage
representations of minorities in different labor markets there is little impact on the amount of
non-work at work by minorities in the labor market. Perhaps the two opposite effects noted
above offset each other, or perhaps they just do not matter. Regardless, these tests make clear
that on net the importance of a racial/ethnic group in a labor market does not affect its members’
non-work time on the job.
A third possibility is that minorities spend more time not working on the job since
discriminatory promotion practices lower the returns to effort – especially regarding promotion
and long-term career prospects – and thus the long-term penalties for non-work. If this
explanation were correct, we would expect that self-employed minority workers would not differ
in their non-work on the job from majority self-employed workers. To examine this possibility
we re-estimated the equations at the bottom of the two panels of Table 2 over self-employed
workers, collapsing the indicators of minority status into one because of the relative paucity of
minority self-employed workers in the samples (only 504 minority men, 204 minority women).
We saw that the aggregate of minority male (female) employees spends 1.10 (0.64) percent
of the work-day more in non-work on the job than does the aggregate of majority male
employees. Among self-employed males (females), minority workers spend 1.2 (1.2) percent of
the work-day more in non-work than do majority self-employed workers. Because of the
relatively small samples of self-employed minority workers, the estimated relative differences
between majority and minority employed and self-employed workers are not statistically non-
zero. The point, estimates, however, suggest that there is no difference in the relative amounts of
non-work, implying that discrimination in promotion opportunities for minority employees is not
generating our results.

15
Perhaps minority employees exert less effort per hour on the job because their lives are more
stressful and the reduced effort at work compensates for their extra stress. We can examine this
possibility using two data sets. First, in 2003 the PSID included a question asking one respondent
per household, “How often do you feel rushed or pressed for time? Almost always; often;
sometimes; rarely; never.” (See Hamermesh and Lee, 2007). Other things equal, African-
American men are less likely to say that they are almost always or often stressed for time than
are other men, but the difference between them and whites is not quite statistically significant.
African-American women are significantly less likely to feel stressed for time than otherwise
identical women.
Second, in several years the ATUS asked respondents to indicate how stressed they were
while performing a particular activity at three randomly chosen times of the diary day, with
responses ranging from 0 indicating no stress to 6 indicating the respondent felt very stressed
during that activity. We estimate activity-level ordered probits over this measure. The estimates
suggest that, other things equal, African-Americans are significantly less likely to state that they
were stressed during randomly selected activities. The differences for Non-black Hispanics and
Asian-Americans are small and negative, with t-statistics below one, while that for Others is
positive and nearly significant statistically. These results from the PSID and the ATUS counter
the notion that lesser on-the-job effort by minorities is a response to general feelings of stress.5
Finally, yet an additional explanation is that these demographic differences arise from
differences in preferences of workers in different racial/ethnic groups. Obviously we cannot test
this notion on the available data. It is, however, consistent with cultural differences in which
5These ATUS results and the PSID estimates discussed in the preceding paragraph are presented in Appendix Table A2.

16
minorities are generally less stressed than similarity members of the majority group, a cultural
difference that leads them to be more relaxed about effort on the job.
V. Conclusions
We have demonstrated that minorities in the United States—African-Americans, Non-black
Hispanics, Asian-Americans and others—on average spend larger fractions of their time at work
engaged in non-work activities than do majority workers. These differences are robust to the
inclusion of large numbers of demographic variables, measures of work time and even extremely
detailed indicators of industry and occupational attachment. They are, moreover, not tiny—they
are large enough to suggest some modifications of our notions of the magnitudes of racial/ethnic
differences in pay per hour of effort, leading perhaps to reductions of 10 percent in the estimated
earnings/effort disadvantage of African-American and Hispanic men.
We rejected a large range of explanations for the differences in effort based on incentives at
work facing minorities. Similarly, they are not explained by differences in the amounts and kinds
of activities undertaken outside the workplace. Rather, they are consistent with cultural
differences that lead minorities to be more relaxed about life, including life in the workplace,
than are non-minority workers, and to be more willing to mix non-work with work.
The ATUS is the only nationally representative data set of which we are aware that provides
information on what large samples of workers are engaged in while at work. This uniqueness is
unfortunate—the questions that might be answered with more such data go well beyond pointing
out demographic differences in effort at work (although these differences are important for such
labor-market outcomes as worker productivity and wage differentials). Expanded information on
time use at work would enable much deeper study of the temporal dynamics of worker

17
productivity, putting the scientific management studies of the post-World War I era (e.g.,
Florence, 1924) on a much more general and more broadly applicable basis.

18
REFERENCES
Elizabeth Ananat, Shihe Fu and Stephen Ross, “Race-Specific Agglomeration Economics; Social Distance and the Black-White Wage Gap,” NBER Working Paper No. 18933, 2013.
Abhijit Banerjee, Esther Duflo, Gilles Postel-Vinay and Tim Watts, “Long Run Health Impacts of Income Shocks: Wine and Phylloxera in 19th Century France,” Review of Economics and Statistics, 92 (Nov. 2010): 714-28.
Gary Becker, The Economics of Discrimination. Chicago: University of Chicago Press, 1957.
Michael Burda, Katie Genadek and Daniel Hamermesh, “Not Working at Work: Loafing, Unemployment and Labor Productivity,” NBER Working Paper No. 21923, Jan. 2016.
Michael Burda, Daniel Hamermesh and Jay Stewart, “Cyclical Variation in Labor Hours and Productivity Using the ATUS,” American Economic Association: Papers & Proceedings, 103 (May 2013): 99-104.
P. Sargant Florence, Economics of Fatigue and Unrest. New York: Henry Holt, 1924.
Anne Gielen, Jessica Holmes and Caitlin Myers, “Testosterone and the Earnings of Men and Women,” Journal of Human Resources, 51 (Winter 2016): 30-61.
Daniel Hamermesh and Jungmin Lee. “Stressed Out on Four Continents: Time Crunch or Yuppie Kvetch?” Review of Economics and Statistics, 89 (May 2007): 374-83.
Daniel Hamermesh, Harley Frazis and Jay Stewart, “Data Watch: The American Time Use Survey,” Journal of Economic Perspectives, 19 (Winter 2005): 221-32.
Xavier D’Haultfoeuille, Arnaud Maurel and Yichong Zhang, “Extremal Quantile Regressions for Selection Models and the Black-White Wage Gap,” NBER Working Paper No. 20257, 2014.
Judith Hellerstein, David Neumark and Kenneth Troske, “Wages, Productivity and Worker Characteristics: Evidence from Plant-Level Production Functions and Wage Equations,” Journal
of Labor Economics, 17 (July 1999): 409-46.
Sandra L. Hofferth, Sarah M. Flood, and Matthew Sobek. 2015. American Time Use Survey Data Extract System: Version 2.5 [Machine-readable database]. Maryland Population Research Center, University of Maryland, College Park, Maryland, and Minnesota Population Center, University of Minnesota, Minneapolis, Minnesota.
Stanley Mathewson, The Restriction of Output Among Unorganized Workers. New York: Viking, 1931.
Steven Rivkin, Eric Hanushek and John Kain, “Teachers, Schools, and Academic Achievement,” Econometrica, 73 (March 2005): 417-58.
Steven Ruggles, Katie Genadek, Ronald Goeken, Josiah Grover, and Matthew Sobek. Integrated Public
Use Microdata Series: Version 6.0 [Machine-readable database]. Minneapolis: University of Minnesota, 2015.
U.S. Equal Opportunity Commission, FY 2009 - 2014 EEOC Charge Receipts by State (includes U.S.
Territories) and Basis. Washington: EEOC, 2015. https://www1.eeoc.gov/eeoc/statistics/enforcement/charges_by_state.cfm

19
Table 1. Non-work Time at Work and Ethnic Representation, ATUS Employees, 2003-12*
Non-Hispanic African- Non-black Asian- Other
White American Hispanic American
MEN (N = 17,777)
Fraction of Time Not Working 0.0645 0.0793 0.0848 0.0679 0.0701 (0.0022) (0.0063) (0.0055) (0.0099) (0.0133) N = 12,348 1830 2582 651 366 ATUS Sample Ethnic Mean 0.695 0.103 0.145 0.037 0.021 ACS Ethnic Mean 0.693 0.096 0.1454 0.044 0.021 WOMEN (N = 17,771) Fraction of Time Not Working 0.0646 0.0758 0.0779 0.0724 0.0649 (0.0023) (0.050) (0.0058) (0.105) (0.129) N = 11,877 2787 2137 605 365 ATUS Sample Ethnic Mean 0.668 0.156 0.120 0.034 0.021 ACS Ethnic Means 0.687 0.127 0.118 0.046 0.023
*Standard errors in parentheses here and in Tables 2 and 3.
20
Table 2. Parameter Estimates, Racial/Ethnic Effects on the Fraction of Worktime Not Working,
ATUS Employees, 2003-12 (with Non-Hispanic Whites as the Base Group)*
African- Non-black Asian- Other
American Hispanic American
Equation MEN Raw 0.0148 0.0203 0.0034 0.0056 (0.0036) (0.0031) (0.0036) (0.0059)
Add workday, workweek 0.0144 0.0226 0.0063 0.0080 quadratics (0.0035) (0.0030) (0.0036) (0.0062)
Add demographics** 0.0128 0.0194 0.0123 0.0072 (0.0035) (0.0031) (0.0036) (0.0061)
Add industry, occupation, 0.0119 0.0171 0.0089 0.0070 state, month, day of week (0.0037) (0.0034) (0.0039) (0.0065) indicators*** Add very detailed industry, 0.0082 0.0153 0.0087 0.0030 occupation indicators**** (0.0038) (0.0034) (0.0040) (0.0062)
WOMEN Raw 0.0112 0.0132 0.0078 0.0025 (0.0027) (0.0034) (0.0057) (0.0063) Add workday, workweek 0.0125 0.0149 0.0092 -0.0009 Quadratics (0.0027) (0.0033) (0.0059) (0.0064)
Add demographics** 0.0113 0.0113 0.0120 -0.0026 (0.0027) (0.0034) (0.0059) (0.0064)
Add industry, occupation, 0.0094 0.0077 0.0081 -0.0037 state, month, day of week (0.0031) (0.0039) (0.0064) (0.0066) indicators*** Add very detailed industry, 0.0086 0.0062 0.0057 -0.0045 occupation indicators**** (0.0031) (0.0039) (0.0067) (0.0070) *Standard errors of parameter estimates in parentheses here and in Table 3. **Vector of education indicators; quadratic in potential experience; married; a vector of age of youngest child; metro status ***Indicators for 22 occupations, 51 industries, 51 states, union coverage, 11 months, 6 days of the week
****Replace occupation and industry indicators with 513 occupation, 259 industry indicators

21
Table 3. Parameter Estimates, Experiments with EEO Charges and Union Coverage, ATUS
Employees, 2003-12 (Racial-Ethnic Effects with Non-Hispanic Whites as the Base Group, Mean
EEO Charges = 0.764/1000 Employees)
African- Non-black Asian- Other
American Hispanic American
Equation Main Effect MEN EEO Charges per 0.0403 0.0119 0.0344 0.0165 -0.0048 Employee: Own Effect (0.0244) (0.0101) (0.0078) (0.0080) (0.0099)
F-stat. p, and Interactions: 0.029 -0.0044 -0.0255 -0.0110 0.0106 (0.0093) (0.0086) (0.0104) (0.0134)
Interactions with Racial/Ethnic 0.0072 -0.1025 0.0385 0.0524 Fractions, F-stat. p 0.374 (0.0444) (0.0530) (0.0546) (0.1398) WOMEN EEO Charges per 0.0183 0.0139 0.0131 0.0001 0.0057 Employee: Own Effect (0.0299) (0.0079) (0.0085) (0.01115) (0.0146) F-stat. p, and Interactions 0.712 -0.0058 -0.0091 0.0083 -0.0131 (0.0088) (0.0103) (0.0207) (0.0159)
Interactions with Racial/Ethnic -0.0064 -0.0100 -0.0570 0.0265 Fractions, F-stat. p 0.889 (0.0340) (0.0453) (0.0614) (0.1516) *All equations include a vector of education indicators; a quadratic in potential experience; a vector of indicators of the age of the youngest child; indicators of metro and marital status; and vectors of indicators for 513 occupations, 259 industries, 51
States and 6 days of the week.

22
Appendix Table A1. Racial Effects on Attitudes Toward Work (Parameter Estimates on Indicator
for African-American), GSS Various Waves*
Dep. Var.:
Would continue to work if rich** -0.0223 (0.0345) N = 15,863 Work is main source of satisfaction*** 0.1168 (0.0693) N = 2,699
*Standard errors in parentheses below the parameter estimates here and in Appendix Table A2.
**Probit estimates based on data from 1973, 1974, 1976, 1977, 1980, 1982, 1984, 1985, 1987-91, 1993, and even-numbered years from 1994-2010. A quadratic in age, years of schooling, own income and indicators of gender and the year of the survey are included, and the estimation uses sampling weights.
***Ordered probit estimates based on data from 2002 and 2006. A quadratic in age, years of schooling, own income and indicators of gender and the year of the survey are included, and the estimation uses sampling weights.

23
Appendix Table A2. Parameter Estimates, Racial/Ethnic Effects on Stress (with non-Hispanic
Whites as the Base Group)*
African-American
Data Set and Dep. Var.: MEN WOMEN PSID 2003, Married* -0.0597 -0.1039
Probit on indicator (0.0354) (0.0271) always/often stressed N = 1,649 2,189
African-
American
Non-black
Hispanic
Asian-
American Other
ALL ATUS 2010, 2012** Ordered probit, stressed during -0.2447 -0.0037 -0.0132 0.1574 activity, 6 to 0 scale (0.0513) (0.0436) (0.1288) (0.0847) N = 40,817 *Includes each spouse’s earnings, hours of work and health status, and family income and the ages and numbers of children. **Includes all respondents who answered these questions in 2010 and 2012, The specification contains the same controls as the equations reported in the third rows of Table 2, a vector of the 18 major categories of time use indicating time spent on each major activity during the diary day, plus an indicator of gender and its interaction with marital status. Standard errors errors are clustered on the individual respondents.