Embed Size (px)
Citation preview

S O U T H E A S T E R N W I S C O N S I N R E G I O N A L P L A N N I N G C O M M I S S I O N
A N D T H E
R A C I N E C O U N T Y E C O N O M I C D E V E L O P M E N T C O R P O R A T I O N
RACINE COUNTYINDUSTRIAL PARK LANDABSORPTION STUDY
MEMORANDUM REPORT NO. 136(3rd Edition)

SOUTHEASTERN WISCONSINREGIONAL PLANNING COMMISSION
KENOSHA COUNTY RACINE COUNTY
MILWAUKEE COUNTY WALWORTH COUNTY
WASHINGTON COUNTY
Gilbert Bakke
David Eberle
Peggy L. Shumway
Thomas H. Buestrin
David W. Opitz
Gus W. Wirth, Jr.
OZAUKEE COUNTY
WAUKESHA COUNTY
Daniel S. Schmidt
Daniel W. Stoffel
David L. Stroik,
Chairman
Michael A. CrowleyJose Delgado
James T. Dwyer
SOUTHEASTERN WISCONSIN REGIONALPLANNING COMMISSION STAFF
AD HOC COMMITTEE ON-NEW INDUSTRIAL LANDS IN RACINE COUNTY
Adelene Greene,
Secretary
Robert W. Pitts
Michael J. Skalitzky
Marina Dimitrijevic
William R. Drew,
Vice Chairman
John Rogers
Charles L. Colman
Nancy Russell,
Treasurer
Linda J. Seemeyer
Kenneth R. Yunker, PE...................................Executive Director
Stephen P.Adams ..................................Public Involvement and
Outreach Manager
Nancy M.Anderson,AICP ...............................Chief Community
Assistance Planner
Michael G. Hahn, PE, PH .............Chief Environmental Engineer
Christopher T. Hiebert, PE...........Chief Transportation Engineer
ElizabethA. Larsen........................................Business Manager
John G. McDougall ................................Geographic Information
Systems Manager
Dr. Donald M. Reed. .............................................Chief Biologist
DavidA. Schilling ...................................Chief Land Use Planner
James Ladwig. . . . . . . . . . . . . . . . . Racine County Executive
Julie Anderson . . . . . . . . . . . . . . Director of Public Works and
Development Services,
Racine County
Tina Chitwood. . . . . . . . . Community Development Manager,
Racine County Economic
Development Corporation
Jon Henderson . . . . . . . . . . . . . . Jon Henderson Real Estate
Ray Leffler . . . . . . . . . . . . . . . . . Newport Development Corp.
Mike Mooney. . . . . . . . . . . . . . . . . . . . . . . . . . . . CapitalMLG
Todd Niedermeyer . . . . . . . Geographic Marketing Advantage
Eric Nitschke, P.E. . . . . . . . . . . . . Southeast Region Director,
Wisconsin Department of
Natural Resources
Chris Stamborski . . . . . . . . . . . . . . . . . . . . . . . . . . R.A. Smith
Jenny Trick . . . . . . . . . . . . . . . . . . . . . . . . Executive Director,
Racine County Economic
Development Corporation
Neil Young . . . . . . . . . . . . . . . . . . . . . . . Fair Oaks Consulting

MEMORANDUM REPORT NUMBER 136(3rd Edition)
RACINE COUNTY INDUSTRIAL PARK LANDABSORPTION STUDY
Prepared by the
Southeastern Wisconsin Regional Planning CommissionW239 N1812 Rockwood Drive
P.O. Box 1607Waukesha, Wisconsin 53187-1607
www.sewrpc.org
and the
Racine County Economic Development Corporation2320 Renaissance Boulevard
Sturtevant, WI 53177www.RacineCountyEDC.org
August 2014
Inside Region $ 5.00Outside Region $10.00

(This page intentionally left blank)


v
TABLE OF CONTENTS
Page
Introduction .............................................................................................................................................................. 1 Methodology ............................................................................................................................................................ 1 Study Findings .......................................................................................................................................................... 2 Historic Development Trends: Industrial/Business Parks that Meet All Criteria ................................................. 2 Projections ......................................................................................................................................................... 2 Industrial/Business Park Areas Located Within Planned Sanitary Sewer and Public Water Service Area ................................................................................... 3 Historic Development Trends: Industrial/Business Parks -
Not Served by Sanitary Sewer and Public Water............................................................................................... 3 Projections ......................................................................................................................................................... 4 Industrial/Business Parks and Industrial/Business Park Areas in the IH 94 Corridor ........................................... 4 Local and Regional Planning .................................................................................................................................... 4 Conclusion ................................................................................................................................................................ 4
LIST OF APPENDICES Appendix Page
A Industrial/Business Parks in Racine County that are not Served by Sanitary Sewer and Public Water .................................................................................... 41
LIST OF MAPS Map Page 1 Location of Industrial/Business Parks in Racine County That Meet All Criteria .............................. 6 2 Location of Industrial/Business Park Areas in Racine County That Are
Located Within Planned Sanitary Sewer and Public Water Service Areas ........................................ 26 3 Industrial/Business Parks and Industrial/Business Park Areas
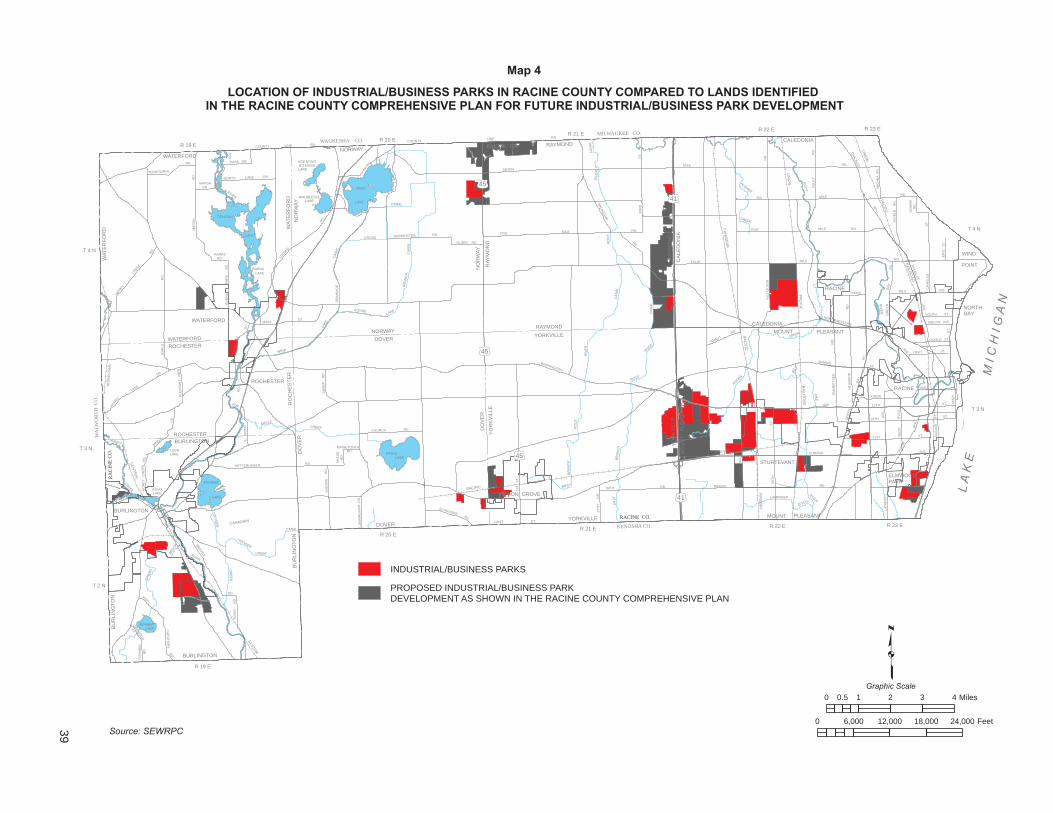
in Racine County That Are Located in the IH 94 Corridor ................................................................ 37 4 Location of Industrial/Business Parks in Racine County Compared to Lands Identified
in the Racine County Comprehensive Plan for Future Industrial/Business Park Development ........ 39
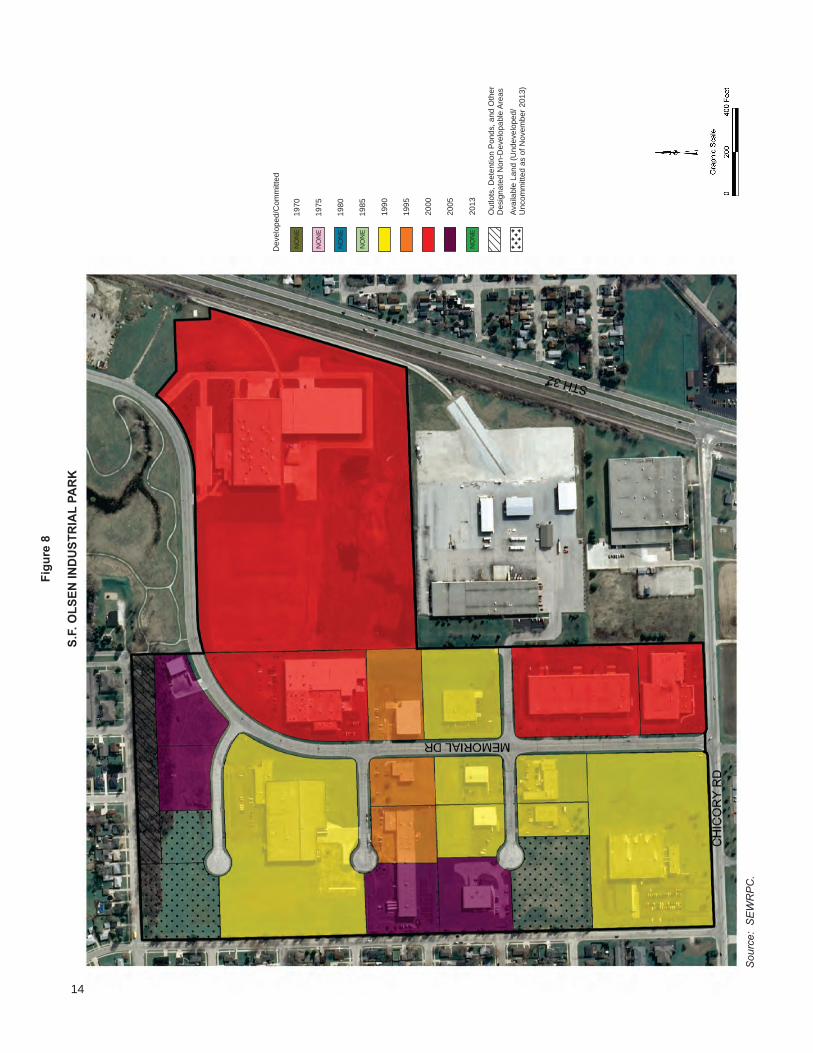
LIST OF FIGURES Figure Page 1 Burlington Industrial Complex .......................................................................................................... 7 2 Burlington Manufacturing and Office Park ....................................................................................... 8 3 Caledonia Business Park .................................................................................................................... 9 4 F.M. Young Industrial Park ............................................................................................................... 10 5 Grandview Business Park .................................................................................................................. 11 6 Huck Industrial Park .......................................................................................................................... 12 7 Land and Lakes Business Park ........................................................................................................... 13 8 S.F. Olsen Industrial Park .................................................................................................................. 14

vi
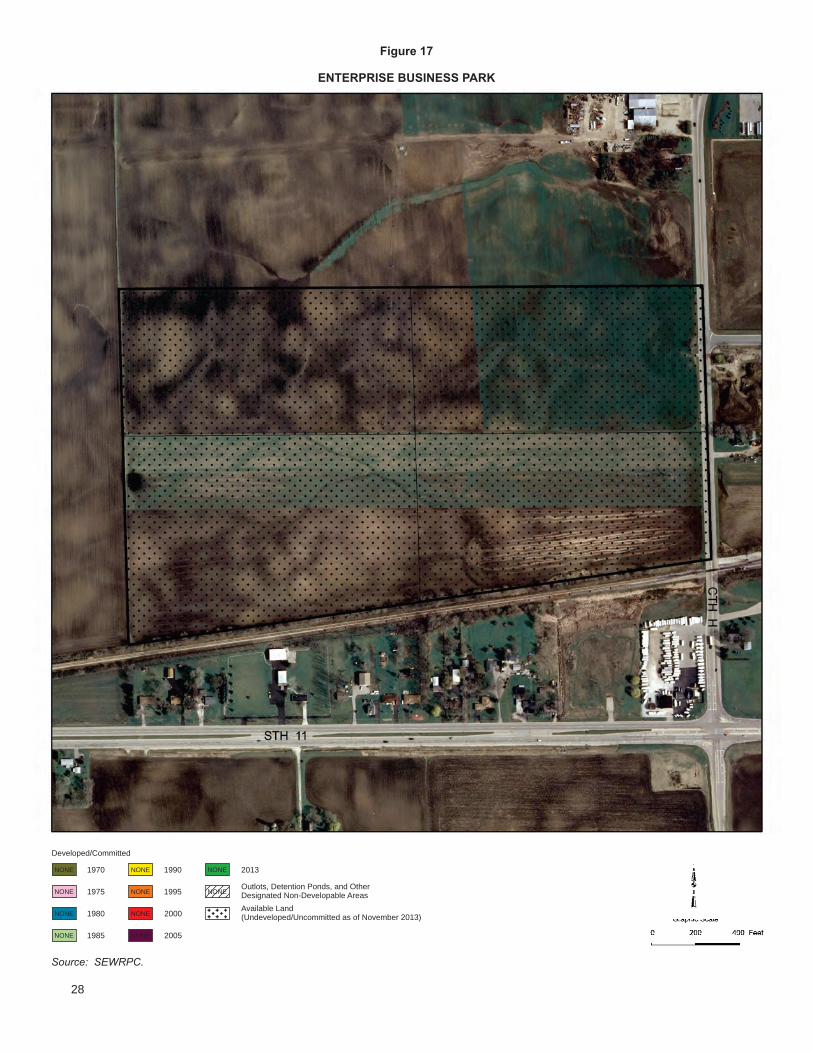
Figure Page 9 Southside Industrial Park ................................................................................................................... 15 10 The Renaissance ................................................................................................................................. 16 10a The Renaissance North and Renaissance North Addition .................................................................. 17 11 Union Grove Industrial Park and Annex ............................................................................................ 18 12 Washington Avenue Industrial Complex ........................................................................................... 19 13 Waterford Industrial Park ................................................................................................................... 20 14 Westerra Business Campus ................................................................................................................ 21 15 Wright-Wieczorek Industrial Park ..................................................................................................... 22 16 Chicory Road Industrial Park ............................................................................................................. 27 17 Enterprise Business Park .................................................................................................................... 28 18 Hughes Property ................................................................................................................................. 29 19 Mount Pleasant Commerce Center ..................................................................................................... 30 20 Park 94 at Mt. Pleasant ....................................................................................................................... 31 21 Park 94 at Mt. Pleasant North ............................................................................................................ 32 22 SINB Site ........................................................................................................................................... 33 23 Sisson Property................................................................................................................................... 34 24 Burlington Manufacturing and Office Park Phase 2 .......................................................................... 35
LIST OF TABLES Table Page 1 Historic Development of Industrial/Business
Parks in Racine County That Meet All Criteria ................................................................................. 23 2 Projected Number of Years Until Remaining Supply of
Available Developable Land in Industrial/Business Parks in Racine County That Meet All Criteria Will Be Exhausted Based Upon Selected Development Rates ......................................................................................... 24
3 Developable Land Remaining in Industrial/Business Parks in Racine County That Meet All Criteria ................................................................................. 25
4 Industrial/Business Park Areas Located Within Planned Sanitary Sewer and Public Water Service Areas .................................................................. 36
5 Development Rates at Industrial/Business Parks in Racine County That Meet All Planning Criteria and Are Located in the IH 94 Corridor .......................................... 38

SEWRPC Memorandum Report No. 136, 3rd Edition
Racine County Industrial Park Land Absorption Study
INTRODUCTION In March 2013, the Racine County Economic Development Corporation (RCEDC) requested assistance from the Southeastern Wisconsin Regional Planning Commission (SEWRPC) in updating SEWRPC Memorandum Report No. 136 (2nd Edition), dated December 2005, to determine current industrial land absorption rates within industrial/business parks in Racine County. The study was conducted under the guidance of the Ad-Hoc Committee on New Industrial Lands in Racine County appointed by the RCEDC. A Committee meeting was held on June 3, 2014, to review the draft of the updated Memorandum Report. The Committee membership is presented in the inside front cover of this report. METHODOLOGY The methodology for the industrial land absorption study included the following steps: 1. The list of industrial/business parks within Racine County that was included in the December 2005 report
was reviewed and updated to address changes that had occurred since the original report was issued. The updated list includes sites that were identified as having characteristics of planned industrial/business parks. The specific characteristics of planned industrial/business parks that were utilized include: 1) the presence of a planned publicly-owned internal street system, 2) the availability of sanitary sewer service and public water, 3) single ownership, 4) land that is available and on the market, 5) a buildable site, 6) a minimum of 10 acres for brownfield sites and 40 acres for greenfield sites, and 7) land that was platted or divided by certified survey maps except for brownfield sites. A total of 15 such sites were identified and analyzed in the main body of this report. The location of these sites is shown on Map 1.
2. This updated report also provides a separate analysis for lands available for industrial/business park
development located within planned public sanitary sewer and water service areas, but not currently served by public sanitary sewer or water. The location of these sites is shown on Map 2.
3. Five industrial/business parks within Racine County meet all of the planning criteria above except that they
did not have sanitary sewer service or public water available, and are located outside planned public sanitary sewer and water service areas. The location of these sites is shown on Map A-1 in Appendix A.
4. Site plans were analyzed for each industrial/business park and the date on which each park was created was
determined. In the case of a platted industrial/business park, the date the plat was recorded was used. In the case of an “unplatted” park, the date the first building permit was issued was considered the starting point.
5. Each of the industrial/business parks was delineated on one inch equals 400 feet scale 2010 digital aerial
photographs. 6. Aerial photographs for the years 1970, 1975, 1980, 1985, 1990, 1995, 2000, 2005, and 2010 were examined
to determine the amount of land developed/committed for industrial/business uses within each industrial/business park for each of the subject years. The amount of land developed/committed for industrial/business uses for each time period was delineated on the 2010 aerial photographs. In this step, lots were considered to be developed/committed if any improvements such as buildings, parking lots, and outside storage areas were identified on the lot.
7. Field checks were conducted for each industrial/business park, to identify and delineate additional land that
was developed/committed between April 2010, the date of the most recent aerial photography, and November 2013.

2
8. Undeveloped lots that were committed to industrial/business uses as of November 2013 were delineated. This included lots that had been purchased, but not developed, for industrial/business use as of November 2013. This was based on information provided by the RCEDC.
9. The acreage of land developed/committed for industrial/business uses as delineated in Steps 6 through 8
within each industrial/business park was determined, and used to calculate average absorption rates by time period for each industrial/business park and for all industrial/business parks combined.
10. Through the extrapolation of these past absorption rates, projections for when the supply of
industrial/business park land would be exhausted were made for each industrial/business park and for all areas combined.
STUDY FINDINGS Historic Development Trends: Industrial/Business Parks that Meet All Criteria
The historic development of the 15 industrial/business parks that meet all seven criteria is shown graphically on Figures 1 through 15. Related quantitative data are presented in Tables 1 through 3. A summary of the key inventory findings follows: The 15 industrial/business parks together encompass a gross site area of 2,223 acres. Gross site area
includes the entire area of each industrial/business park (see Table 1).
The 15 industrial/business parks together encompass a net site area of 1,766 acres. Net site area is defined as gross site area less land devoted to internal roads, outlots, detention ponds, and other designated non-developable areas and in the case of the Washington Avenue Industrial Complex, less undeveloped land reserved for S.C. Johnson development only (see Table 1).
As of November 2013, 1,152 acres, or 65 percent of the aggregate net site area of 1,766 acres, were developed/committed for industrial or business uses (see Table 3).
Among the 15 industrial/business parks, the rate of development, calculated over the life of the respective parks, ranged from one acre per year at the F.M. Young Industrial Park to 14 acres per year at The Renaissance (see Table 2).
As of November 2013, 614 acres, or 35 percent, remained available for purchase and development. Four of the 15 sites—Burlington Industrial Complex, Huck Industrial Park (Racine), Waterford Industrial Park, and the Wright-Wieczorek Industrial Park (Racine)—had no land available for purchase and development at that time (see Table 3).
Projections
This report shows that in November 2013 Racine County had a total of 614 acres of land in industrial/business parks available for purchase and development. As part of the study, alternative projections were made of the number of years before this supply of land at the 15 industrial/business parks that meet all planning criteria would be exhausted (see Table 2). Three scenarios were developed. One scenario assumed continuation of the rate of development observed between 1970 and 2013. The second assumed a continuation of the rate of development observed between 1980 and 2013. The third assumed a continuation of the rate of development observed between 1990 and 2013. Under these scenarios, the assumed rates of development were applied to the available developable area as of November 2013.
The results of this analysis are as follows: Assuming the growth rate observed in Racine County between 1970 and 2013, it would take 9.7 years
before all of the remaining available developable land in Racine County was developed/committed for industrial/business uses.

3
Assuming the growth rate observed in Racine County between 1980 and 2013, it would take 10.3 years before all of the remaining available developable land in Racine County was developed/committed for industrial/business uses.
Assuming the growth rate observed in Racine County between 1990 and 2013, it would take 10.4 years before all of the remaining available developable land in Racine County was developed/committed for industrial/business uses.
Industrial/Business Park Areas Located Within Planned Sanitary Sewer and Public Water Service Areas
Shown on Map 2 are the industrial/business park areas located within sanitary sewer and public water service areas, but not currently served by public sanitary sewer and water. Each area is shown graphically on Figures 16 through 24. Related quantitative data is presented in Table 4. A summary of the key inventory findings follows: The nine industrial/business park areas together encompass a gross site area of 823 acres. Gross site area
includes the entire area of each industrial/business park (see Table 4).
The nine industrial/business park areas together encompass a net site area of 685 acres. In this case, net site area is defined as gross site area less land devoted to detention ponds, and other designated non-developable areas (see Table 4).
As of November 2013, only 43 acres, or 6 percent of the aggregate net site area of 685, were developed/committed for industrial or business uses (see Table 4).
As of November 2013, 642 acres, or 94 percent, remained available for purchase and development. The development of these sites for industrial/business park uses will be significantly limited until detailed plans identifying an internal public street system and a parcel layout for the site have been developed and approved. In addition, the process of extending public sanitary sewer and water service by the community/utility involved will need to be completed. In most cases this process may require several years to complete before the land in the industrial/business park can effectively be marketed, sold, and developed. Historic Development Trends: Industrial/Business Parks – Not Served by Sanitary Sewer and Public Water
The location of industrial/business parks that are not served by sanitary sewer and public water and are located outside planned public sanitary sewer and water service areas, are shown on Map A-1 in Appendix A. The historic development of these five sites is shown graphically on Figures A-1 through A-5. A summary of the key inventory findings follows: The five industrial/business parks together encompass a gross site area of 262 acres. Gross site area
includes the entire area of each industrial/business park (see Table A-1).
The five industrial/business parks together encompass a net site area of 218 acres. Net site area is defined as gross site area less land devoted to internal roads, outlots, detention ponds, and other designated non-developable areas (see Table A-1).
As of November 2013, 169 acres, or 78 percent of the aggregate net site area of 218 acres, were developed/committed for industrial or business uses (see Table A-1).
Among the five industrial/business parks, the rate of development, calculated over the life of the respective parks, ranged from one acre per year at the Evergreen Commerce Park to over six acres per year at the Raymond Business Park (see Table A-2).
As of November 2013, 49 acres, or 22 percent, remained available for purchase and development. One site—Blackhawk Industrial Park—had no land available for purchase and development at that time (see Table A-3).
4
Projections
As noted above, 49 acres of land remained available for purchase and development in November 2013 at the five industrial/business parks not served by public sanitary sewer and water. Assuming the growth rate observed at these sites between 1990 and 2013, it would take about three years before all of the remaining available developable land was developed/committed for industrial/business uses (see Table A-4). Industrial/Business Parks and Industrial/Business Park Areas in the IH 94 Corridor
A number of the sites identified in this report are located near IH 94. In Racine County, IH 94 is the major transportation corridor connecting the metropolitan areas of Milwaukee and Chicago. In this report, the IH 94 corridor is defined as those areas lying within a distance of three miles from either side of IH 94. As shown on Map 3, the 10 industrial/business parks and industrial/business park areas located in the IH 94 corridor include:
1. Industrial/Business parks that meet all planning criteria—Grandview Business Park, Land and Lakes Business Park, and The Renaissance (231 acres available for purchase and development)
2. Industrial/Business park areas located in close proximity to sanitary sewer and public water service—
Enterprise Business Park, Mount Pleasant Commerce Center, Park 94 at Mount Pleasant, Park 94 at Mount Pleasant North, and the Sisson site (386 acres available for purchase and development)
3. Industrial/Business parks that are not served by sanitary sewer and public water—Blackhawk Industrial Park and Raymond Business Park (21 acres available for purchase and development)
As of November 2013, these sites together encompass a total of 638 acres that remained available for purchase and development. As noted earlier, the 386 acres associated with the sites in No. 2 above may not be immediately available for purchase and development.
With respect to the three industrial/business parks in the IH 94 corridor that meet all planning criteria (see No. 1 above), assuming the growth rate observed for these sites since the mid 1990’s (see Table 5), it would take 8.2 years before all the remaining developable land in the IH 94 corridor was developed/committed for industrial/business uses.
LOCAL AND REGIONAL PLANNING Any planning efforts to identify new industrial/business parks should take into account the recommendations of the adopted local, county, and regional land use plans with respect to future industrial development and redevelopment. A number of communities in Racine County have adopted local comprehensive plans that identify potential future development areas for industrial/business park uses. Map 4 identifies industrial/business park areas analyzed in this study, as well as undeveloped lands identified in both local and County comprehensive plans for future industrial/business uses. The areas planned for industrial/business uses as shown on Map 4 encompass 4,300 acres. Consequently, given the local endorsement for future development of these areas for industrial/business uses, these sites should be considered to have significant potential to meet future demands for such uses. The regional plan encourages the concentration of industrial activity in areas that have ready accessibility to arterial highways, power and water supply, and sanitary sewer service, and generally have good access to airports and railway facilities. In planning for industrial growth, due consideration should be given to the recommendations of the regional land use plan. CONCLUSION The second edition of this report, published in December 2005, estimated that Racine County at that time had 499 acres of land in industrial/business parks available for purchase and development, and it was projected that if the 1990-2005 development rate continued, all available industrial/business park land in Racine County would be fully developed in eight years. This new study, based on the industrial/business park lands available as of November 2013, has concluded that industrial/business park land may be fully developed within about 10 years.

5
This projection of time for remaining industrial/business park land to be fully utilized is based on alternative scenarios using average absorption rates over three different time periods: 1970-2013, 1980-2013, and 1990-2013. These are average rates that take into account all land sales within their respective time period. A variety of factors contribute to the sale of industrial/business park land—location, parcel size, access to the transportation infrastructure, current market conditions, and types of business at a given location. As such, it is important that each industrial/business park be evaluated in the context of these additional factors that contribute to the development patterns in the individual parks. In many cases, it may require up to three years to provide for new business parks in a community. Given the current supply of industrial/business park land in Racine County that is documented in this study, especially land in strategic locations such as the IH 94 corridor, it is recommended that Racine County and the RCEDC work with communities in Racine County in planning efforts to identify suitable sites for new industrial/business parks. Specific recommendations include: 1. Communities that are considering the construction of new industrial/business parks should examine the
absorption rates included herein in order to properly plan such parks. 2. Communities should be encouraged to phase the implementation of new industrial/business parks to ensure
that the supply of such land does not exceed the demand. 3. Based on the current adequacy of land shown herein, Racine County development officials should closely
monitor the absorption of industrial/business park land in the County to ensure an adequate supply of land throughout all of Racine County, as well as the IH 94 corridor.
4. Communities without land for new industrial/business park development should consider the provision of
such land in order to create a balanced tax base and, at a minimum, land for the expansion of local companies.

6
0141
0145
0145
0145
0141
SH
AR
PR
D.
RD.
RD.
AV
E.
RD
.
RD
.
BA
Y
ST.
ST.
ST.
AV
E.
AVE.
AVE.
MA
IN
AV
E.
AVE.
GR
EE
N
SPRING
RA
CIN
E
DURAND
LA
TH
RO
P
SH
EA
RD
R
D.
SEVEN
CH
ICA
GO
DO
UG
LA
S
BRAUN
FIVE
ER
IE
ST.
WASHINGTON
NORTHWESTERN
MILE
MILE
ST.
43R
D
RD
.
WA
UK
ES
HA
RD.
COUNTYLINE
RD.60TH
57T
H D
R.
ST.FIRST
RD.
SCHRODER
1S
TS
T.
CU
NN
ING
HA
M R
D.
CHURCH RD.
KETTERHAGENRD.
McK
EE
RD
.
MINNETONKA
RD.
BURMEISTER RD.
OLSEN RD.
LOO
MIS
RD
.
RD.COUNTY LINE
RAAB DR.
LAKE DR.NORTH
RD.
TERRITORIAL
RD
.M
AR
SH
MARSH
DR.
RANKE
RD.
BU
EN
AP
AR
KR
D.
MA
PLE
RD
.CR
EEK
RD
.
HO
NEY
MAINST.
JE
FF
ER
SO
N
ST.
HO
NEY
DR.
LAKE
VIE
WP
LE
AS
AN
T
RD
.
E. R
IVE
R
LN
.
MAPLE
HO
NE
YR
D.
CR
EE
KF
ISH
MA
N
RD
.
FISH
OA
KW
OO
D
RD.
HA
TC
HE
RY
ST.
RD
.R
IVE
R
RD.
BR
EVER
RD.
WE
ST
RD
.
90T
HS
T.
ST.21ST
ST.16TH B
VLD
.W
ES
TTAY
LO
R
12TH ST.
KINZIE
AVE.
RD
.E
MM
ER
TS
EN
RD
.S
TU
AR
T
RD
.N
EU
MA
NN
RD.MILETHREE
KRAUT
RD.
SIX MILE
RD.
FIVE MILE RD.
FOUR MILERD.
RD
.N
ICH
OLS
ON
FO
LE
YR
D.
MIC
HN
AR
D.
NO
WA
K
RD
.
MID
DLE
RD
.
ST.
CH
AR
LE
S
GR
EE
NB
AY
RD
.
ST.SOUTH
GOOLD ST.
MELVIN AVE.
ST.HIGH
CA
NA
DIA
N
UN
ION
CE
NT
RA
L
PA
CIF
IC
WIS
CO
NS
IN RA
ILR
OA
D
UN
ION
PACIFIC
RAILWAY
RA
ILW
AY
SY
STE
M
PA
CIF
IC
CANADIAN
PA
CIF
IC
RA
ILR
OA
D
RO
OT
RO
OT
PIK
E
EA
ST
WEST
CANAL
CA
NA
L
CREEK
CA
NA
L
CA
NA
L
HO
ODS
EAGLE
BR
OO
K
CR
EE
K
CANAL
CREEK
RIV
ER
RIV
ER
CREEK
CROSS
HUSH
ER
BR
AN
CH
BR
AN
CH
SP
RIN
G
HOOSIER
HO
OS
IER
BR
AN
CH
GOOSELAKE
FOX
CREEK
RIV
ER
CA
NA
L
ROOT
LAMPAREK
DITCH
RIV
ER
LAKE
BOHNER
LAKEECHO
LAKE
BROWNS
TICHIGAN
LAKE
LAKEWAUBEESEE
KEE NONGGO MONG
LAKE
BUENA
LAKE
EAGLE
LAKE
WIND
LAKE
LAKELONG
RIVER
WIND
LAKE
DR
AIN
AG
E
CREEK
HONEY
RIVER
LA
K E
M
I C
H I G
AN
CA
NA
L
RO
OT
RIV
ER
FO
X
BAY
WIND
NORTH
POINT
UNION GROVE
ELMWOOD
PARK
WATERFORD
ROCHESTER
STURTEVANT
DO
VE
R
DOVER
MO
UN
TP
LE
AS
AN
T
DO
VE
R
DOVER
MOUNT
NO
RW
AY
NORWAY
NORWAY
NO
RW
AY
RAYMOND
RA
YM
ON
D
RAYMOND
RA
YM
ON
D
PLEASANT
YORKVILLE
YO
RK
VIL
LE
YO
RK
VIL
LE
RO
CH
ES
TE
RW
AT
ER
FO
RD
ROCHESTER
ROCHESTER
WATERFORD
WA
TE
RF
OR
D
WATERFORD
YORKVILLE
CA
LE
DO
NIA
CALEDONIA
BU
RLIN
GT
ON
BU
RLIN
GT
ON
BURLINGTON
BURLINGTON
MOUNT PLEASANT
CALEDONIA
RACINE CO.
RACINE CO.
RA
CIN
E C
O.
RACINE CO.
RACINE CO.
RA
CIN
E C
O.
RACINE
BURLINGTON
RACINE
R 22 E R 23 E
T 4 N
R 20 E
R 21 E
R 19 E
T 3 N
T 4 N
T 2 N
R 20 E
R 19 E
R 21 ER 23 ER 22 E
T 3 N
MILWAUKEE CO.
WAUKESHA CO.
WA
LW
OR
TH
C
O.
KENOSHA CO.
Source: SEWRPC
3
2
4
1
5
F.M. YOUNG INDUSTRIAL PARK
HUCK INDUSTRIAL PARK
CALEDONIA BUSINESS PARK
S.F. OLSEN INDUSTRIAL PARK
GRANDVIEW BUSINESS PARK
BURLINGTON MANUFACTURING & OFFICE PARK
BURLINGTON INDUSTRIAL COMPLEX1
2
3
4
5
6
Graphic Scalep
0 1 2 3 40.5 Miles
0 6,000 12,000 18,000 24,000 Feet
Map 1
LOCATION OF INDUSTRIAL/BUSINESS PARKS IN RACINE COUNTY THAT MEET ALL CRITERIA
6
8
SOUTHSIDE INDUSTRIAL PARK
WRIGHT-WIECZOREK INDUSTRIAL PARK
WASHINGTON AVE INDUSTRIAL COMPLEX
THE RENAISSANCE
UNION GROVE INDUSTRIAL PARK AND ANNEX
WATERFORD INDUSTRIAL PARK
WESTERRA BUSINESS CAMPUS
15
14
13
12
10
11
9
7 LAND AND LAKES BUSINESS PARK
15
14
13
12
11
10
9
8
7

7
Source: SEWRPC.
Figure 1
BURLINGTON INDUSTRIAL COMPLEX
Developed/Committed
1970
1975
1980
1985
2000
2005
2013
Outlots, Detention Ponds, and Other
Designated Non-Developable Areas
Available Land
(Undeveloped/Uncommitted as of November 2013)
1990
1995
NONE
NONE
NONE NONE
NONE

8 Sourc
e: S
EW
RP
C.
Fig
ure
2
BU
RL
ING
TO
N M
AN
UFA
CT
UR
ING
AN
D O
FF
ICE
PA
RK
Develo
ped/C
om
mitte
d
1970
1975
1980
1985
2000
2005
2013
Outlots
, D
ete
ntion
Ponds, and O
ther
Desig
nate
d N
on-
Develo
pable
Are
as
Available
Land
(Undevelo
ped/
Uncom
mitte
d a
s o
f
Novem
ber
2013)
1990
1995
NO
NE
NO
NE
NO
NE
NO
NE
NO
NE
NO
NE

9
Source: SEWRPC.
Figure 3
CALEDONIA BUSINESS PARK
Developed/Committed
1970
1975
1980
1985
2000
2005
2013
Outlots, Detention Ponds, and Other
Designated Non-Developable Areas
Available Land
(Undeveloped/Uncommitted as of November 2013)
1990
1995
NONE
NONE

10
Source: SEWRPC.
Figure 4
F.M. YOUNG INDUSTRIAL PARK
Developed/Committed
1970
1975
1980
1985
2000
2005
2013
Outlots, Detention Ponds, and Other
Designated Non-Developable Areas
Available Land
(Undeveloped/Uncommitted as of November 2013)
1990
1995
NONE
NONENONE
NONE

11Source: SEWRPC.
Figure 5
GRANDVIEW BUSINESS PARK
Developed/Committed
1970
1975
1980
1985
2000
2005
2013
Outlots, Detention Ponds, and Other
Designated Non-Developable Areas
Available Land
(Undeveloped/Uncommitted as of November 2013)
1990
1995
NONE
NONENONE
NONE
NONE

12
Source: SEWRPC.
Figure 6
HUCK INDUSTRIAL PARK
Developed/Committed
1970
1975
1980
1985
2000
2005
2013
Outlots, Detention Ponds, and Other
Designated Non-Developable Areas
Available Land
(Undeveloped/Uncommitted as of November 2013)
1990
1995
NONE
NONENONE
NONE
NONE
NONE

13
Source: SEWRPC.
Figure 7
LAND AND LAKES BUSINESS PARK
Developed/Committed
1970
1975
1980
1985
2000
2005
2013
Outlots, Detention Ponds, and Other
Designated Non-Developable Areas
Available Land
(Undeveloped/Uncommitted as of November 2013)
1990
1995
NONE
NONE
NONE
NONE
NONE
NONE
NONE
NONE
14
Sourc
e: S
EW
RP
C.
Fig
ure
8
S.F
. O
LS
EN
IN
DU
ST
RIA
LP
AR
K
Develo
ped/C
om
mitte
d
1970
1975
1980
1985
2000
2005
2013
Outlots
, D
ete
ntion P
onds, and O
ther
Desig
nate
d N
on-D
evelo
pable
Are
as
Available
Land (
Undevelo
ped/
Uncom
mitte
d a
s o
f N
ovem
ber
2013)
1990
1995
NO
NE
NO
NE
NO
NE
NO
NE
NO
NE

15Source: SEWRPC.
Figure 9
SOUTHSIDE INDUSTRIAL PARK
Developed/Committed
1970
1975
1980
1985
2000
2005
2013
Outlots, Detention Ponds, and Other
Designated Non-Developable Areas
Available Land
(Undeveloped/Uncommitted as of November 2013)
1990
1995
NONE
NONE
NONE
NONE
NONE
NONE
NONE
NONE

16
Source: SEWRPC.
Figure 10
THE RENAISSANCE
Developed/Committed
1970
1975
1980
1985
2000
2005
2013
Outlots, Detention Ponds, and Other
Designated Non-Developable Areas
Available Land (Undeveloped/
Uncommitted as of November 2013)
1990
1995
NONE
NONE
NONE
NONE
NONE
NONE

17Source: SEWRPC.
Figure 10a
THE RENAISSANCE NORTH AND RENAISSANCE NORTH ADDITION
Developed/Committed
1970
1975
1980
1985
2000
2005
2013
Outlots, Detention Ponds, and Other
Designated Non-Developable Areas
Available Land
(Undeveloped/Uncommitted as of November 2013)
1990
1995
NONE
NONE
NONE
NONE
NONE
NONE
NONE
NONE

18
Sourc
e: S
EW
RP
C.
Fig
ure
11
UN
ION
GR
OV
E IN
DU
ST
RIA
LP
AR
KA
ND
AN
NE
X
Develo
ped/C
om
mitte
d
1970
1975
1980
1985
2000
2005
2013
Outlots
, D
ete
ntion P
onds, and O
ther
Desig
nate
d N
on-D
evelo
pable
Are
as
Available
Land (
Undevelo
ped/
Uncom
mitte
d a
s o
f N
ovem
ber
2013)
1990
1995
NO
NE
NO
NE
NO
NE

19
Sourc
e: S
EW
RP
C.
Fig
ure
12
WA
SH
ING
TO
NA
VE
NU
E IN
DU
ST
RIA
LC
OM
PL
EX
Develo
ped/C
om
mitte
d
1970
1975
1980
1985
2000
2005
2013
Outlots
, D
ete
ntion P
onds, and O
ther
Desig
nate
d N
on-D
evelo
pable
Are
as
Undevelo
ped/L
and R
eserv
ed for
S.C
. Johnson D
evelo
pm
ent only
1990
1995
NO
NE
NO
NE
NO
NE
NO
NE
NO
NE
Available
Land (
Undevelo
ped/
Uncom
mitte
d a
s o
f N
ovem
ber
2013)
NO
NE

20
Source: SEWRPC.
Figure 13
WATERFORD INDUSTRIAL PARK
Developed/Committed
1970
1975
1980
1985
2000
2005
2013
Outlots, Detention Ponds, and Other
Designated Non-Developable Areas
Available Land
(Undeveloped/Uncommitted as of November 2013)
1990
1995
NONE
NONE
NONE
NONE
NONE

21Source: SEWRPC.
Figure 14
WESTERRA BUSINESS CAMPUS
Developed/Committed
1970
1975
1980
1985
2000
2005
2013
Outlots, Detention Ponds, and Other
Designated Non-Developable Areas
Available Land
(Undeveloped/Uncommitted as of November 2013)
1990
1995
NONE
NONE
NONE
NONE
NONE
NONE
NONE
NONE

22
Sourc
e: S
EW
RP
C.
Fig
ure
15
WR
IGH
T-W
IEC
ZO
RE
K IN
DU
ST
RIA
LP
AR
K
Develo
ped/C
om
mitte
d
1970
1975
1980
1985
2000
2005
2013
Outlots
, D
ete
ntion P
onds, and O
ther
Desig
nate
d N
on-D
evelo
pable
Are
as
Available
Land (
Undevelo
ped/
Uncom
mitte
d a
s o
f N
ovem
ber
2013)
1990
1995
NO
NE
NO
NE
NO
NE
NO
NE
NO
NE
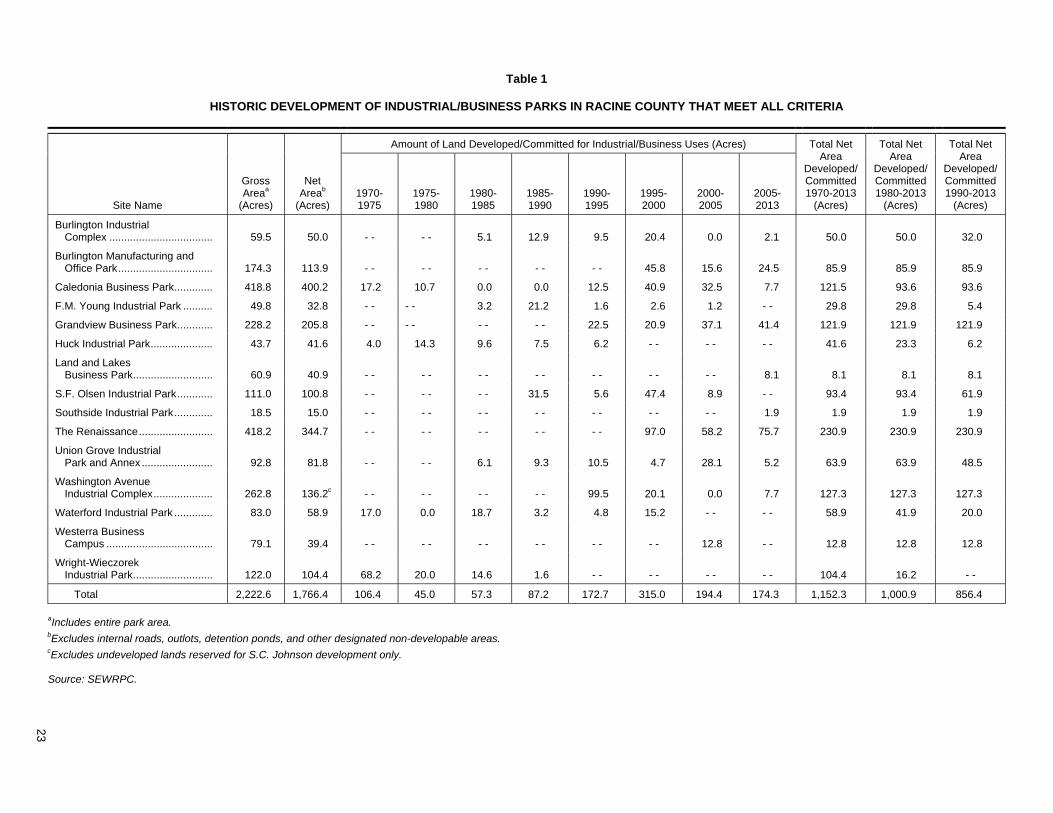
Table 1
HISTORIC DEVELOPMENT OF INDUSTRIAL/BUSINESS PARKS IN RACINE COUNTY THAT MEET ALL CRITERIA
Site Name
Gross Areaa
(Acres)
Net Areab
(Acres)
Amount of Land Developed/Committed for Industrial/Business Uses (Acres) Total Net Area
Developed/ Committed 1970-2013
(Acres)
Total Net Area
Developed/ Committed 1980-2013
(Acres)
Total Net Area
Developed/ Committed 1990-2013
(Acres) 1970-1975
1975-1980
1980-1985
1985-1990
1990-1995
1995-2000
2000-2005
2005-2013
Burlington Industrial Complex ................................... 59.5 50.0 - - - - 5.1 12.9 9.5 20.4 0.0 2.1 50.0 50.0 32.0
Burlington Manufacturing and Office Park ................................ 174.3 113.9 - - - - - - - - - - 45.8 15.6 24.5 85.9 85.9 85.9
Caledonia Business Park ............. 418.8 400.2 17.2 10.7 0.0 0.0 12.5 40.9 32.5 7.7 121.5 93.6 93.6
F.M. Young Industrial Park .......... 49.8 32.8 - - - - 3.2 21.2 1.6 2.6 1.2 - - 29.8 29.8 5.4
Grandview Business Park ............ 228.2 205.8 - - - - - - - - 22.5 20.9 37.1 41.4 121.9 121.9 121.9
Huck Industrial Park ..................... 43.7 41.6 4.0 14.3 9.6 7.5 6.2 - - - - - - 41.6 23.3 6.2
Land and Lakes Business Park ........................... 60.9 40.9 - - - - - - - - - - - - - - 8.1 8.1 8.1 8.1
S.F. Olsen Industrial Park ............ 111.0 100.8 - - - - - - 31.5 5.6 47.4 8.9 - - 93.4 93.4 61.9
Southside Industrial Park ............. 18.5 15.0 - - - - - - - - - - - - - - 1.9 1.9 1.9 1.9
The Renaissance ......................... 418.2 344.7 - - - - - - - - - - 97.0 58.2 75.7 230.9 230.9 230.9
Union Grove Industrial Park and Annex ........................ 92.8 81.8 - - - - 6.1 9.3 10.5 4.7 28.1 5.2 63.9 63.9 48.5
Washington Avenue Industrial Complex .................... 262.8 136.2c - - - - - - - - 99.5 20.1 0.0 7.7 127.3 127.3 127.3
Waterford Industrial Park ............. 83.0 58.9 17.0 0.0 18.7 3.2 4.8 15.2 - - - - 58.9 41.9 20.0
Westerra Business Campus .................................... 79.1 39.4 - - - - - - - - - - - - 12.8 - - 12.8 12.8 12.8
Wright-Wieczorek Industrial Park ........................... 122.0 104.4 68.2 20.0 14.6 1.6 - - - - - - - - 104.4 16.2 - -
Total 2,222.6 1,766.4 106.4 45.0 57.3 87.2 172.7 315.0 194.4 174.3 1,152.3 1,000.9 856.4
aIncludes entire park area. bExcludes internal roads, outlots, detention ponds, and other designated non-developable areas. cExcludes undeveloped lands reserved for S.C. Johnson development only. Source: SEWRPC.
23

Table 2
PROJECTED NUMBER OF YEARS UNTIL REMAINING SUPPLY OF AVAILABLE DEVELOPABLE LAND IN INDUSTRIAL/BUSINESS PARKS IN RACINE COUNTY
THAT MEET ALL CRITERIA WILL BE EXHAUSTED BASED UPON SELECTED DEVELOPMENT RATES
Site Name
1970-2013 Development
Rate
Available Developable Area
1980-2013 Development
Rate
Available Developable Area
1990-2013 Development
Rate
Available Developable Area
Area Remaining:
2013 (Acres)
No. of Years Until Fully Developed
Area Remaining:
2013 (Acres)
No. of Years Until Fully Developed
Area Remaining:
2013 (Acres)
No. of Years Until Fully Developed
Burlington Industrial Complex .......................... 3.3 0.0 - - 3.3 0.0 - - 3.7 0.0 - -
Burlington Manufacturing and Office Park ................ 5.1 28.0 5.5 5.1 28.0 5.5 5.1 28.0 5.5
Caledonia Business Park .... 3.1 278.7 NA 2.8 278.7 NA 4.1 278.7 NA
F.M. Young Industrial Park .. 0.9 3.0 3.3 0.9 3.0 3.3 0.2 3.0 15.0
Grandview Business Park ... 6.4 83.9 13.1 6.4 83.9 13.1 6.4 83.9 13.1
Huck Industrial Park ............ 1.9 0.0 - - 1.6 0.0 - - 1.2 0.0 - -
Land and Lakes Business Park ................. 8.1 32.8 4.0 8.1 32.8 4.0 8.1 32.8 4.0
S.F. Olsen Industrial Park ... 3.3 7.4 2.2 3.3 7.4 2.2 2.7 7.4 2.7
Southside Industrial Park .... 0.1 13.1 NA 0.1 13.1 NA 0.1 13.1 NA
The Renaissance ................ 13.6 113.8 8.4 13.6 113.8 8.4 13.6 113.8 8.4
Union Grove Industrial Park and Annex ............... 2.3 17.9 7.8 2.3 17.9 7.8 3.7 17.9 4.8
Washington Avenue Industrial Complex ........... 6.4 8.9 1.4 6.4 8.9 1.4 6.4 8.9 1.4
Waterford Industrial Park..... 2.0 0.0 - - 2.3 0.0 - - 2.5 0.0 - -
Westerra Business Campus ........................... 1.0 26.6 NA 1.0 26.6 NA 1.0 26.6 NA
Wright-Wieczorek Industrial Park ................. 5.8 0.0 - - 2.3 0.0 - - - - 0.0 - -
Total 63.3 614.1 9.7 59.5 614.1 10.3 58.8 614.1 10.4 Source: SEWRPC.
24

Table 3
DEVELOPABLE LAND REMAINING IN INDUSTRIAL/BUSINESS PARKS IN RACINE COUNTY THAT MEET ALL CRITERIA
Site Name Net Site Areaa (Acres)
Area Developed/ Committed for Industrial/ Business Uses (Acres)
Remaining Available Developable Area
(Acres) Burlington Industrial Complex ..................................... 50.0 50.0 0.0 Burlington Manufacturing and Office Park ................... 113.9 85.9 28.0 Caledonia Business Park ............................................ 400.2 121.5 278.7 F.M. Young Industrial Park .......................................... 32.8 29.8 3.0 Grandview Business Park ........................................... 205.8 121.9 83.9 Huck Industrial Park .................................................... 41.6 41.6 0.0 Land and Lakes Business Park ................................... 40.9 8.1 32.8 S.F. Olsen Industrial Park............................................ 100.8 93.4 7.4 Southside Industrial Park............................................. 15.0 1.9 13.1 The Renaissance ......................................................... 344.7 230.9 113.8 Union Grove Industrial Park and Annex ...................... 81.8 63.9 17.9 Washington Avenue Industrial Complex ..................... 136.2b 127.3 8.9 Waterford Industrial Park ............................................. 58.9 58.9 0.0 Westerra Business Campus ........................................ 39.4 12.8 26.6 Wright-Wieczorek Industrial Park ................................ 104.4 104.4 0.0
Total 1,766.4 1152.3 614.1 aExcludes internal roads, outlots, detention ponds, and other designated non-developable areas. bExcludes undeveloped lands reserved for S.C. Johnson development only. Source: SEWRPC.
25

26
0141
0145
0145
0145
0141
SH
AR
PR
D.
RD.
RD.
AV
E.
RD
.
RD
.
BA
Y
ST.
ST.
ST.
AV
E.
AVE.
AVE.
MA
IN
AV
E.
AVE.
GR
EE
N
SPRING
RA
CIN
E
DURAND
LA
TH
RO
P
SH
EA
RD
R
D.
SEVEN
CH
ICA
GO
DO
UG
LA
S
BRAUN
FIVE
ER
IE
ST.
WASHINGTON
NORTHWESTERN
MILE
MILE
ST.
43
RD
RD
.
WA
UK
ES
HA
RD.
COUNTYLINE
RD.60TH
57T
H D
R.
ST.FIRST
RD.
SCHRODER
1S
TS
T.
CU
NN
ING
HA
M R
D.
CHURCH RD.
KETTERHAGENRD.
McK
EE
RD
.
MINNETONKA
RD.
BURMEISTER RD.
OLSEN RD.
LOO
MIS
RD
.
RD.COUNTY LINE
RAAB DR.
LAKE DR.NORTH
RD.
TERRITORIAL
RD
.M
AR
SH
MARSH
DR.
RANKE
RD.
BU
EN
AP
AR
KR
D.
MA
PLE
RD
.CR
EEK
RD
.
HO
NEY
MAINST.
JE
FF
ER
SO
N
ST.
HO
NEY
DR.
LAKE
VIE
WP
LE
AS
AN
T
RD
.
E. R
IVE
R
LN
.
MAPLE
HO
NE
YR
D.
CR
EE
KF
ISH
MA
N
RD
.
FISH
OA
KW
OO
D
RD.
HA
TC
HE
RY
ST.
RD
.R
IVE
R
RD.
BR
EVER
RD.
WE
ST
RD
.
90T
HS
T.
ST.21ST
ST.16TH
BV
LD
.W
ES
TTAY
LO
R
12THST.
KINZIE
AVE.
RD
.E
MM
ER
TS
EN
RD
.S
TU
AR
T
RD
.N
EU
MA
NN
RD.MILETHREE
KRAUT
RD.
SIX MILE
RD.
FIVE MILE RD.
FOUR MILERD.
RD
.N
ICH
OL
SO
N
FO
LE
YR
D.
MIC
HN
AR
D.
NO
WA
K
RD
.
MID
DL
E
R
D.
ST.
CH
AR
LE
S
GR
EE
NB
AY
RD
.
ST.SOUTH
GOOLD ST.
MELVIN AVE.
ST.HIGH
CA
NA
DIA
N
UN
ION
CE
NT
RA
L
PA
CIF
IC
WIS
CO
NS
IN
RA
ILR
OA
D
UN
ION
PACIFIC
RAILWAY
RA
ILW
AY
SY
STE
M
PA
CIF
IC
CANADIAN
PA
CIF
IC
RA
ILR
OA
D
RO
OT
RO
OT
PIK
E
EA
ST
WEST
CANAL
CA
NA
L
CREEK
CA
NA
L
CA
NA
L
HO
ODS
EAGLE
BR
OO
K
CR
EE
K
CANAL
CREEK
RIV
ER
RIV
ER
CREEK
CROSS
HUSH
ER
BR
AN
CH
BR
AN
CH
SP
RIN
G
HOOSIER
HO
OS
IER
BR
AN
CH
GOOSELAKE
FOX
CREEK
RIV
ER
CA
NA
L
ROOT
LAMPAREK
DITCH
RIV
ER
LAKE
BOHNER
LAKE
ECHO
LAKE
BROWNS
TICHIGAN
LAKE
LAKEWAUBEESEE
KEE NONG
GO MONG
LAKE
BUENA
LAKE
EAGLE
LAKE
WIND
LAKE
LAKE
LONG
RIVER
WIND
LAKE
DR
AIN
AG
E
CREEK
HONEY
RIVER
LA
K E
M
I C
H I G
AN
CA
NA
L
RO
OT
RIV
ER
FO
X
BAY
WIND
NORTH
POINT
UNION GROVE
ELMWOOD
PARK
WATERFORD
ROCHESTER
STURTEVANT
DO
VE
R
DOVER
MO
UN
TP
LE
AS
AN
T
DO
VE
R
DOVER
MOUNT
NO
RW
AY
NORWAY
NORWAY
NO
RW
AY
RAYMOND
RA
YM
ON
D
RAYMOND
RA
YM
ON
D
PLEASANT
YORKVILLE
YO
RK
VIL
LE
YO
RK
VIL
LE
RO
CH
ES
TE
RW
AT
ER
FO
RD
ROCHESTER
ROCHESTER
WATERFORD
WA
TE
RF
OR
D
WATERFORD
YORKVILLE
CA
LE
DO
NIA
CALEDONIA
BU
RLIN
GT
ON
BU
RL
ING
TO
N
BURLINGTON
BURLINGTON
MOUNT PLEASANT
CALEDONIA
RACINE CO.
RACINE CO.
RA
CIN
E C
O.
RACINE CO.
RACINE CO.
RA
CIN
E C
O.
RACINE
BURLINGTON
RACINE
R 22 E R 23 E
T 4 N
R 20 E
R 21 E
R 19 E
T 3 N
T 4 N
T 2 N
R 20 E
R 19 E
R 21 ER 23 ER 22 E
T 3 N
MILWAUKEE CO.
WAUKESHA CO.
WA
LW
OR
TH
C
O.
KENOSHA CO.
Source: SEWRPC
MOUNT PLEASANT COMMERCE CENTER
HUGHES PROPERTY
PARK 94 AT MOUNT PLEASANT
ENTERPRISE BUSINESS PARK
CHICORY ROAD INDUSTRIAL PARK
Graphic Scalep
0 1 2 3 40.5 Miles
0 6,000 12,000 18,000 24,000 Feet
Map 2
LOCATION OF INDUSTRIAL/BUSINESS PARK AREAS IN RACINE COUNTY THAT ARE
LOCATED WITHIN PLANNED SANITARY SEWER AND PUBLIC WATER SERVICE AREAS
PARK 94 AT MOUNT PLEASANT NORTH
SINB SITE
SISSON SITE
16
17
18
19
20
21
22
23
16
17
2322
18
19 20
21
24
24BURLINGTON MANUFACTURING AND
OFFICE PARK PHASE 2

27
Source: SEWRPC.
Figure 16
CHICORY ROAD INDUSTRIAL PARK
Developed/Committed
1970
1975
1980
1985 2000
2005
2013
Outlots, Detention Ponds, and Other
Designated Non-Developable Areas
Available Land (Undeveloped/
Uncommitted as of November 2013)1990
1995
NONE
NONE
NONE
NONENONE
NONE
NONE
NONE
NONE
NONE
28
Source: SEWRPC.
Figure 17
ENTERPRISE BUSINESS PARK
Developed/Committed
1970
1975
1980
1985
2000
2005
2013
Outlots, Detention Ponds, and Other
Designated Non-Developable Areas
Available Land
(Undeveloped/Uncommitted as of November 2013)
1990
1995
NONE
NONE
NONE
NONE
NONE
NONE
NONE
NONE
NONE
NONE

29
Source: SEWRPC.
Figure 18
HUGHES PROPERTY
Developed/Committed
1970
1975
1980
1985
2000
2005
2013
Outlots, Detention Ponds, and Other
Designated Non-Developable Areas
Available Land
(Undeveloped/Uncommitted as of November 2013)
1990
1995
NONE
NONE
NONE
NONE
NONE
NONE
NONE
NONE
NONE

30
Source: SEWRPC.
Figure 19
MOUNT PLEASANT COMMERCE CENTER
Developed/Committed
1970
1975
1980
1985
2000
2005
2013
Outlots, Detention Ponds, and Other
Designated Non-Developable Areas
Available Land
(Undeveloped/Uncommitted as of November 2013)
1990
1995
NONE
NONE
NONE
NONE
NONE
NONE
NONE
NONE
NONE
NONE

31
Source: SEWRPC.
Figure 20
PARK 94 AT MT. PLEASANT
Developed/Committed
1970
1975
1980
1985
2000
2005
2013
Outlots, Detention Ponds, and Other
Designated Non-Developable Areas
Available Land
(Undeveloped/Uncommitted as of November 2013)
1990
1995
NONE
NONE
NONE
NONE
NONE
NONE
NONE
NONE

32
Source: SEWRPC.
Figure 21
PARK 94 AT MT. PLEASANT NORTH
Developed/Committed
1970
1975
1980
1985
2000
2005
2013
Outlots, Detention Ponds, and Other
Designated Non-Developable Areas
Available Land
(Undeveloped/Uncommitted as of November 2013)
1990
1995
NONE
NONE
NONE
NONE
NONE
NONE
NONE
NONE
NONE
NONE

33
Source: SEWRPC.
Figure 22
SINB SITE
Developed/Committed
1970
1975
1980
1985
2000
2005
2013
Outlots, Detention Ponds, and Other
Designated Non-Developable Areas
Available Land
(Undeveloped/Uncommitted as of November 2013)
1990
1995
NONE
NONE
NONE
NONE
NONE
NONE
NONE
NONE
NONE
NONE

34
Source: SEWRPC.
Figure 23
SISSON PROPERTY
Developed/Committed
1970
1975
1980
1985
2000
2005
2013
Outlots, Detention Ponds, and Other
Designated Non-Developable Areas
Available Land
(Undeveloped/Uncommitted as of November 2013)
1990
1995
NONE
NONE
NONE
NONE
NONE
NONE
NONE
NONE
NONE
NONE

35Source: SEWRPC.
Figure 24
BURLINGTON MANUFACTURING AND OFFICE PARK PHASE 2
Developed/Committed
1970
1975
1980
1985
2000
2005
2013
Outlots, Detention Ponds, and Other
Designated Non-Developable Areas
Available Land
(Undeveloped/Uncommitted as of November 2013)
1990
1995
NONE
NONE
NONE
NONE
NONE
NONE
NONE
NONE
NONE

Table 4
INDUSTRIAL/BUSINESS PARK AREAS LOCATED WITHIN PLANNED SANITARY SEWER AND PUBLIC WATER SERVICE AREAS
Site Name Gross Areaa
(Acres) Net Areab (Acres)
Amount of Land Developed Committed for Industrial/Business
Uses 2005-2013 (Acres)
Area Remaining
2013 (Acres) Burlington Manufacturing and Office Park Phase 2 ....... 174.3 102.2 - - 102.2 Chicory Road Industrial Park .......................................... 80.0 80.0 - - 80.0 Enterprise Business Park ............................................... 86.9 86.9 - - 86.9 Hughes Property ............................................................. 85.6 29.9 - - 29.9 Mount Pleasant Commerce Center ................................ 136.0 136.0 - - 136.0 Park 94 at Mount Pleasant ............................................. 83.3 72.7 42.8 29.9 Park 94 at Mount Pleasant North ................................... 100.8 100.8 - - 100.8 SINB Site ........................................................................ 44.1 44.1 - - 44.1 Sisson Site ...................................................................... 32.2 32.2 - - 32.2
Total 823.2 684.8 42.8 642.0 aIncludes entire park area.
bExcludes internal roads, outlots, detention ponds, and other designated non-developable areas. Source: SEWRPC.
36

37
0141
0145
0145
0145
0141
SH
AR
PR
D.
RD.
RD.
AV
E.
RD
.
RD
.
BA
Y
ST.
ST.
ST.
AV
E.
AVE.
AVE.
MA
IN
AV
E.
AVE.
GR
EE
N
SPRING
RA
CIN
E
DURAND
LA
TH
RO
P
SH
EA
RD
R
D.
SEVEN
CH
ICA
GO
DO
UG
LA
S
BRAUN
FIVE
ER
IE
ST.
WASHINGTON
NORTHWESTERN
MILE
MILE
ST.
43R
D
RD
.
WA
UK
ES
HA
RD.
COUNTYLINE
RD.60TH
57T
H D
R.
ST.FIRST
RD.
SCHRODER
1S
TS
T.
CU
NN
ING
HA
M R
D.
CHURCH RD.
KETTERHAGENRD.
McK
EE
RD
.
MINNETONKA
RD.
BURMEISTER RD.
OLSEN RD.
LOO
MIS
RD
.
RD.COUNTY LINE
RAAB DR.
LAKE DR.NORTH
RD.
TERRITORIAL
RD
.M
AR
SH
MARSH
DR.
RANKE
RD.
BU
EN
AP
AR
KR
D.
MA
PLE
RD
.CR
EEK
RD
.
HO
NEY
MAINST.
JE
FF
ER
SO
N
ST.
HO
NEY
DR.
LAKE
VIE
WP
LE
AS
AN
T
RD
.
E. R
IVE
R
LN
.
MAPLE
HO
NE
YR
D.
CR
EE
KF
ISH
MA
N
RD
.
FISH
OA
KW
OO
D
RD.
HA
TC
HE
RY
ST.
RD
.R
IVE
R
RD.
BR
EVER
RD.
WE
ST
RD
.
90T
HS
T.
ST.21ST
ST.16TH B
VLD
.W
ES
TTAY
LO
R
12TH ST.
KINZIE
AVE.
RD
.E
MM
ER
TS
EN
RD
.S
TU
AR
T
RD
.N
EU
MA
NN
RD.MILETHREE
KRAUT
RD.
SIX MILE
RD.
FIVE MILE RD.
FOUR MILERD.
RD
.N
ICH
OLS
ON
FO
LE
YR
D.
MIC
HN
AR
D.
NO
WA
K
RD
.
MID
DLE
RD
.
ST.
CH
AR
LE
S
GR
EE
NB
AY
RD
.
ST.SOUTH
GOOLD ST.
MELVIN AVE.
ST.HIGH
CA
NA
DIA
N
UN
ION
CE
NT
RA
L
PA
CIF
IC
WIS
CO
NS
IN RA
ILR
OA
D
UN
ION
PACIFIC
RAILWAY
RA
ILW
AY
SY
STE
M
PA
CIF
IC
CANADIAN
PA
CIF
IC
RA
ILR
OA
D
RO
OT
RO
OT
PIK
E
EA
ST
WEST
CANAL
CA
NA
L
CREEK
CA
NA
L
CA
NA
L
HO
ODS
EAGLE
BR
OO
K
CR
EE
K
CANAL
CREEK
RIV
ER
RIV
ER
CREEK
CROSS
HUSH
ER
BR
AN
CH
BR
AN
CH
SP
RIN
G
HOOSIER
HO
OS
IER
BR
AN
CH
GOOSELAKE
FOX
CREEK
RIV
ER
CA
NA
L
ROOT
LAMPAREK
DITCH
RIV
ER
LAKE
BOHNER
LAKEECHO
LAKE
BROWNS
TICHIGAN
LAKE
LAKEWAUBEESEE
KEE NONGGO MONG
LAKE
BUENA
LAKE
EAGLE
LAKE
WIND
LAKE
LAKELONG
RIVER
WIND
LAKE
DR
AIN
AG
E
CREEK
HONEY
RIVER
LA
K E
M
I C
H I G
AN
CA
NA
L
RO
OT
RIV
ER
FO
X
BAY
WIND
NORTH
POINT
UNION GROVE
ELMWOOD
PARK
WATERFORD
ROCHESTER
STURTEVANT
DO
VE
R
DOVER
MO
UN
TP
LE
AS
AN
T
DO
VE
R
DOVER
MOUNT
NO
RW
AY
NORWAY
NORWAY
NO
RW
AY
RAYMOND
RA
YM
ON
D
RAYMOND
RA
YM
ON
D
PLEASANT
YORKVILLE
YO
RK
VIL
LE
YO
RK
VIL
LE
RO
CH
ES
TE
RW
AT
ER
FO
RD
ROCHESTER
ROCHESTER
WATERFORD
WA
TE
RF
OR
D
WATERFORD
YORKVILLE
CA
LE
DO
NIA
CALEDONIA
BU
RLIN
GT
ON
BU
RLIN
GT
ON
BURLINGTON
BURLINGTON
MOUNT PLEASANT
CALEDONIA
RACINE CO.
RACINE CO.
RA
CIN
E C
O.
RACINE CO.
RACINE CO.
RA
CIN
E C
O.
RACINE
BURLINGTON
RACINE
R 22 E R 23 E
T 4 N
R 20 E
R 21 E
R 19 E
T 3 N
T 4 N
T 2 N
R 20 E
R 19 E
R 21 ER 23 ER 22 E
T 3 N
MILWAUKEE CO.
WAUKESHA CO.
WA
LW
OR
TH
C
O.
KENOSHA CO.
Source: SEWRPC
BLACKHAWK INDUSTRIAL PARK
THE RENAISSANCE
RAYMOND BUSINESS PARK
LAND AND LAKES BUSINESS PARK
GRANDVIEW BUSINESS PARK
Graphic Scalep
0 1 2 3 40.5 Miles
0 6,000 12,000 18,000 24,000 Feet
Map 3
INDUSTRIAL/BUSINESS PARKS AND INDUSTRIAL/BUSINESS PARK AREASIN RACINE COUNTY THAT ARE LOCATED IN THE IH 94 CORRIDOR
ENTERPRISE BUSINESS PARK
MOUNT PLEASANT COMMERCE CENTER
PARK 94 AT MOUNT PLEASANT
INDUSTRIAL/BUSINESS PARKS THAT MEET ALL PLANNING CRITERIA
1
2
INDUSTRIAL/BUSINESS PARKS THAT ARE NOT SERVED BY SANITARY SEWER
AND PUBLIC WATER
3
INDUSTRIAL/BUSINESS PARK AREAS IN CLOSE PROXIMITY TO SANITARY SEWER
AND PUBLIC WATER SERVICE
6
7
8
9
10
PARK 94 AT MOUNT PLEASANT NORTH
SISSON SITE
1 2
3
6
10
87
9
4
5
5
4

Table 5
DEVELOPMENT RATES AT INDUSTRIAL/BUSINESS PARKS IN RACINE COUNTY THAT MEET ALL PLANNING CRITERIA AND ARE LOCATED IN THE IH 94 CORRIDOR
Site Name
Year Available
for Development
Year When Fully
Developed/ Committed
Development Ratea (Acres/Year)
1970-1975
1975-1980
1980-1985
1985-1990
1990-1995
1995-2000
2000-2005
2005-2013
1990-2013
Grandview Business Park ...................... 1994 - - - - - - - - - - 22.5 4.2 7.4 5.2 6.4
Land and Lakes Business Park .............. 2013 - - - - - - - - - - - - - - - - 8.1 8.1
The Renaissance ................................... 1996 - - - - - - - - - - - - 24.3 11.6 9.5 13.6
Total 28.1 Note: The IH 94 Corridor is defined as those areas lying within a distance of three miles from either side of IH 94. aRate based upon the area developed/committed for industrial/business uses divided by the number of years that the land was available for development. Source: SEWRPC.
38
39
0141
0145
0145
0145
0141
SH
AR
PR
D.
RD.
RD.
AV
E.
RD
.
RD
.
BA
Y
ST.
ST.
ST.
AV
E.
AVE.
AVE.
MA
IN
AV
E.
AVE.
GR
EE
N
SPRING
RA
CIN
E
DURAND
LA
TH
RO
P
SH
EA
RD
R
D.
SEVEN
CH
ICA
GO
DO
UG
LA
S
BRAUN
FIVE
ER
IE
ST.
WASHINGTON
NORTHWESTERN
MILE
MILE
ST.
43R
D
RD
.
WA
UK
ES
HA
RD.
COUNTYLINE
RD.60TH
57T
H D
R.
ST.FIRST
RD.
SCHRODER
1S
TS
T.
CU
NN
ING
HA
M R
D.
CHURCH RD.
KETTERHAGENRD.
McK
EE
RD
.
MINNETONKA
RD.
BURMEISTER RD.
OLSEN RD.
LOO
MIS
RD
.
RD.COUNTY LINE
RAAB DR.
LAKE DR.NORTH
RD.
TERRITORIAL
RD
.M
AR
SH
MARSH
DR.
RANKE
RD.
BU
EN
AP
AR
KR
D.
MA
PLE
RD
.CR
EEK
RD
.
HO
NEY
MAINST.
JE
FF
ER
SO
N
ST.
HO
NEY
DR.
LAKE
VIE
WP
LE
AS
AN
T
RD
.
E. R
IVE
R
LN
.
MAPLE
HO
NE
YR
D.
CR
EE
KF
ISH
MA
N
RD
.
FISH
OA
KW
OO
D
RD.
HA
TC
HE
RY
ST.
RD
.R
IVE
R
RD.
BR
EVER
RD.
WE
ST
RD
.
90T
HS
T.
ST.21ST
ST.16TH B
VLD
.W
ES
TTAY
LO
R
12TH ST.
KINZIE
AVE.
RD
.E
MM
ER
TS
EN
RD
.S
TU
AR
T
RD
.N
EU
MA
NN
RD.MILETHREE
KRAUT
RD.
SIX MILE
RD.
FIVE MILE RD.
FOUR MILERD.
RD
.N
ICH
OLS
ON
FO
LE
YR
D.
MIC
HN
AR
D.
NO
WA
K
RD
.
MID
DLE
RD
.
ST.
CH
AR
LE
S
GR
EE
NB
AY
RD
.
ST.SOUTH
GOOLD ST.
MELVIN AVE.
ST.HIGH
CA
NA
DIA
N
UN
ION
CE
NT
RA
L
PA
CIF
IC
WIS
CO
NS
IN
RA
ILR
OA
D
UN
ION
PACIFIC
RAILWAY
RA
ILW
AY
SY
STE
M
PA
CIF
IC
CANADIAN
PA
CIF
IC
RA
ILR
OA
D
RO
OT
RO
OT
PIK
E
EA
ST
WEST
CANAL
CA
NA
L
CREEK
CA
NA
L
CA
NA
L
HO
ODS
EAGLE
BR
OO
K
CR
EE
K
CANAL
CREEK
RIV
ER
RIV
ER
CREEK
CROSS
HUSH
ER
BR
AN
CH
BR
AN
CH
SP
RIN
G
HOOSIER
HO
OS
IER
BR
AN
CH
GOOSELAKE
FOX
CREEK
RIV
ER
CA
NA
L
ROOT
LAMPAREK
DITCH
RIV
ER
LAKE
BOHNER
LAKEECHO
LAKE
BROWNS
TICHIGAN
LAKE
LAKEWAUBEESEE
KEE NONGGO MONG
LAKE
BUENA
LAKE
EAGLE
LAKE
WIND
LAKE
LAKELONG
RIVER
WIND
LAKE
DR
AIN
AG
E
CREEK
HONEY
RIVER
LA
K E
M
I C
H I G
AN
CA
NA
L
RO
OT
RIV
ER
FO
X
BAY
WIND
NORTH
POINT
UNION GROVE
ELMWOOD
PARK
WATERFORD
ROCHESTER
STURTEVANT
DO
VE
R
DOVER
MO
UN
TP
LE
AS
AN
T
DO
VE
R
DOVER
MOUNT
NO
RW
AY
NORWAY
NORWAY
NO
RW
AY
RAYMOND
RA
YM
ON
D
RAYMOND
RA
YM
ON
D
PLEASANT
YORKVILLE
YO
RK
VIL
LE
YO
RK
VIL
LE
RO
CH
ES
TE
RW
AT
ER
FO
RD
ROCHESTER
ROCHESTER
WATERFORD
WA
TE
RF
OR
D
WATERFORD
YORKVILLE
CA
LE
DO
NIA
CALEDONIA
BU
RLIN
GT
ON
BU
RLIN
GT
ON
BURLINGTON
BURLINGTON
MOUNT PLEASANT
CALEDONIA
RACINE CO.
RACINE CO.
RA
CIN
E C
O.
RACINE CO.
RACINE CO.
RA
CIN
E C
O.
RACINE
BURLINGTON
RACINE
R 22 E R 23 E
T 4 N
R 20 E
R 21 E
R 19 E
T 3 N
T 4 N
T 2 N
R 20 E
R 19 E
R 21 ER 23 ER 22 E
T 3 N
MILWAUKEE CO.
WAUKESHA CO.
WA
LW
OR
TH
C
O.
KENOSHA CO.
Source: SEWRPC
INDUSTRIAL/BUSINESS PARKS
Graphic Scalep
0 1 2 3 40.5 Miles
0 6,000 12,000 18,000 24,000 Feet
Map 4
LOCATION OF INDUSTRIAL/BUSINESS PARKS IN RACINE COUNTY COMPARED TO LANDS IDENTIFIEDIN THE RACINE COUNTY COMPREHENSIVE PLAN FOR FUTURE INDUSTRIAL/BUSINESS PARK DEVELOPMENT
PROPOSED INDUSTRIAL/BUSINESS PARK
DEVELOPMENT AS SHOWN IN THE RACINE COUNTY COMPREHENSIVE PLAN

(This page intentionally left blank)

APPENDIX

(This page intentionally left blank)

Appendix A
INDUSTRIAL/BUSINESS PARKS IN RACINE COUNTY THAT ARE NOT SERVED BY SANITARY SEWER AND PUBLIC WATER

(This page intentionally left blank)

45
0141
0145
0145
0145
0141
SH
AR
PR
D.
RD.
RD.
AV
E.
RD
.
RD
.
BA
Y
ST.
ST.
ST.
AV
E.
AVE.
AVE.
MA
IN
AV
E.
AVE.
GR
EE
N
SPRING
RA
CIN
E
DURAND
LA
TH
RO
P
SH
EA
RD
R
D.
SEVEN
CH
ICA
GO
DO
UG
LA
S
BRAUN
FIVE
ER
IE
ST.
WASHINGTON
NORTHWESTERN
MILE
MILE
ST.
43R
D
RD
.
WA
UK
ES
HA
RD.
COUNTYLINE
RD.60TH
57T
H D
R.
ST.FIRST
RD.
SCHRODER
1S
TS
T.
CU
NN
ING
HA
M R
D.
CHURCH RD.
KETTERHAGENRD.
McK
EE
RD
.
MINNETONKA
RD.
BURMEISTER RD.
OLSEN RD.
LOO
MIS
RD
.
RD.COUNTY LINE
RAAB DR.
LAKE DR.NORTH
RD.
TERRITORIAL
RD
.M
AR
SH
MARSH
DR.
RANKE
RD.
BU
EN
AP
AR
KR
D.
MA
PLE
RD
.CR
EEK
RD
.
HO
NEY
MAINST.
JE
FF
ER
SO
N
ST.
HO
NEY
DR.
LAKE
VIE
WP
LE
AS
AN
T
RD
.
E. R
IVE
R
LN
.
MAPLE
HO
NE
YR
D.
CR
EE
KF
ISH
MA
N
RD
.
FISH
OA
KW
OO
D
RD.
HA
TC
HE
RY
ST.
RD
.R
IVE
R
RD.
BR
EVER
RD.
WE
ST
RD
.
90T
HS
T.
ST.21ST
ST.16TH B
VLD
.W
ES
TTAY
LO
R
12TH ST.
KINZIE
AVE.
RD
.E
MM
ER
TS
EN
RD
.S
TU
AR
T
RD
.N
EU
MA
NN
RD.MILETHREE
KRAUT
RD.
SIX MILE
RD.
FIVE MILE RD.
FOUR MILERD.
RD
.N
ICH
OLS
ON
FO
LE
YR
D.
MIC
HN
AR
D.
NO
WA
K
RD
.
MID
DLE
RD
.
ST.
CH
AR
LE
S
GR
EE
NB
AY
RD
.
ST.SOUTH
GOOLD ST.
MELVIN AVE.
ST.HIGH
CA
NA
DIA
N
UN
ION
CE
NT
RA
L
PA
CIF
IC
WIS
CO
NS
IN RA
ILR
OA
D
UN
ION
PACIFIC
RAILWAY
RA
ILW
AY
SY
STE
M
PA
CIF
IC
CANADIAN
PA
CIF
IC
RA
ILR
OA
D
RO
OT
RO
OT
PIK
E
EA
ST
WEST
CANAL
CA
NA
L
CREEK
CA
NA
L
CA
NA
L
HO
ODS
EAGLE
BR
OO
K
CR
EE
K
CANAL
CREEK
RIV
ER
RIV
ER
CREEK
CROSS
HUSH
ER
BR
AN
CH
BR
AN
CH
SP
RIN
G
HOOSIER
HO
OS
IER
BR
AN
CH
GOOSELAKE
FOX
CREEK
RIV
ER
CA
NA
L
ROOT
LAMPAREK
DITCH
RIV
ER
LAKE
BOHNER
LAKEECHO
LAKE
BROWNS
TICHIGAN
LAKE
LAKEWAUBEESEE
KEE NONGGO MONG
LAKE
BUENA
LAKE
EAGLE
LAKE
WIND
LAKE
LAKELONG
RIVER
WIND
LAKE
DR
AIN
AG
E
CREEK
HONEY
RIVER
LA
K E
M
I C
H I G
AN
CA
NA
L
RO
OT
RIV
ER
FO
X
BAY
WIND
NORTH
POINT
UNION GROVE
ELMWOOD
PARK
WATERFORD
ROCHESTER
STURTEVANT
DO
VE
R
DOVER
MO
UN
TP
LE
AS
AN
T
DO
VE
R
DOVER
MOUNT
NO
RW
AY
NORWAY
NORWAY
NO
RW
AY
RAYMOND
RA
YM
ON
D
RAYMOND
RA
YM
ON
D
PLEASANT
YORKVILLE
YO
RK
VIL
LE
YO
RK
VIL
LE
RO
CH
ES
TE
RW
AT
ER
FO
RD
ROCHESTER
ROCHESTER
WATERFORD
WA
TE
RF
OR
D
WATERFORD
YORKVILLE
CA
LE
DO
NIA
CALEDONIA
BU
RLIN
GT
ON
BU
RLIN
GT
ON
BURLINGTON
BURLINGTON
MOUNT PLEASANT
CALEDONIA
RACINE CO.
RACINE CO.
RA
CIN
E C
O.
RACINE CO.
RACINE CO.
RA
CIN
E C
O.
RACINE
BURLINGTON
RACINE
R 22 E R 23 E
T 4 N
R 20 E
R 21 E
R 19 E
T 3 N
T 4 N
T 2 N
R 20 E
R 19 E
R 21 ER 23 ER 22 E
T 3 N
MILWAUKEE CO.
WAUKESHA CO.
WA
LW
OR
TH
C
O.
KENOSHA CO.
Source: SEWRPC
32
4
1
5
BLACKHAWK INDUSTRIAL PARK
NORWAY INDUSTRIAL PARKEVERGREEN COMMERCE PARK
HAAG INDUSTRIAL PARK1
2
3
4
RAYMOND BUSINESS PARK5
Graphic Scalep
0 1 2 3 40.5 Miles
0 6,000 12,000 18,000 24,000 Feet
Map A-1
LOCATION OF INDUSTRIAL/BUSINESS PARKS IN RACINE COUNTY THAT ARE NOTSERVED BY SANITARY SEWER AND PUBLIC WATER

46
Source: SEWRPC.
Figure A-1
BLACKHAWK INDUSTRIAL PARK
Developed/Committed
1970
1975
1980
1985
2000
2005
2013
Outlots, Detention Ponds, and Other
Designated Non-Developable Areas
Available Land
(Undeveloped/Uncommitted as of November 2013)
1990
1995
NONE
NONE
NONE
NONE
NONE
NONE
NONE
NONE

47
Source: SEWRPC.
Figure A-2
EVERGREEN COMMERCE PARK
Developed/Committed
1970
1975
1980
1985
2000
2005
2013
Outlots, Detention Ponds, and Other
Designated Non-Developable Areas
Available Land
(Undeveloped/Uncommitted as of November 2013)
1990
1995
NONE
NONE
NONE
NONE
NONE
NONE

48
Sourc
e: S
EW
RP
C.
Fig
ure
A-3
HA
AG
IN
DU
ST
RIA
LP
AR
K
Develo
ped/C
om
mitte
d
1970
1975
1980
1985
2000
2005
2013
Outlots
, D
ete
ntion P
onds, and O
ther
Desig
nate
d N
on-D
evelo
pable
Are
as
Available
Land (
Undevelo
ped/
Uncom
mitte
d a
s o
f N
ovem
ber
2013)
1990
1995
NO
NE
NO
NE
NO
NE
NO
NE
NO
NE
NO
NE

49
Source: SEWRPC.
Figure A-4
NORWAY INDUSTRIAL PARK
Developed/Committed
1970
1975
1980
1985
2000
2005
2013
Outlots, Detention Ponds, and Other
Designated Non-Developable Areas
Available Land
(Undeveloped/Uncommitted as of November 2013)
1990
1995
NONE
NONE
NONE
NONE
NONE
NONE

50
Source: SEWRPC.
Figure A-5
RAYMOND BUSINESS PARK
Developed/Committed
1970
1975
1980
1985
2000
2005
2013
Outlots, Detention Ponds, and Other
Designated Non-Developable Areas
Available Land
(Undeveloped/Uncommitted as of November 2013)
1990
1995
NONE
NONE
NONE
NONE
NONE
NONE
NONE
NONE

Table A-1
HISTORIC DEVELOPMENT OF INDUSTRIAL/BUSINESS PARKS IN RACINE COUNTY THAT ARE NOT SERVED BY SANITARY SEWER AND PUBLIC WATER
Site Name
Gross Areaa
(Acres) Net Areab (Acres)
Amount of Land Developed/Committed for Industrial/Business Uses (Acres) Total Net Area
Developed/ Committed 1990-2013 (Acres) 1990-1995 1995-2000 2000-2005 2005-2013
Blackhawk Industrial Park ........ 48.8 44.3 22.6 18.1 3.6 - - 44.3 Evergreen Commerce Park ..... 33.7 25.3 - - 6.4 5.3 6.6 18.3 Haag Industrial Park ................ 19.4 16.3 5.7 2.0 2.7 3.7 14.1 Norway Industrial Park ............. 123.6 104.8 - - 21.7 48.9 15.3 85.9 Raymond Business Park ......... 36.3 27.5 - - - - - - 6.5 6.5
Total 261.8 218.2 28.3 48.2 60.5 32.1 169.1 aIncludes entire park area. bExcludes internal roads, outlots, detention ponds, and other designated non-developable areas. Source: SEWRPC.
51

Table A-2
DEVELOPMENT RATES AT INDUSTRIAL/BUSINESS PARKS IN RACINE COUNTY THAT ARE NOT SERVED BY SANITARY SEWER AND PUBLIC WATER
Site Name Year Available for
Development Year When Fully
Developed/Committed Development Ratea 1990-2013
(Acres/Year) Blackhawk Industrial Park.......................... 1990 2005 3.0 Evergreen Commerce Park ....................... 1996 - - 1.1 Haag Industrial Park .................................. 1990 - - 0.6 Norway Industrial Park............................... 1996 - - 5.1 Raymond Business Park ........................... 2013 - - 6.5
Total 16.3 aRate based upon the area developed/committed for industrial/business uses divided by the number of years that the land was available for development. Source: SEWRPC.
52

Table A-3
DEVELOPABLE LAND REMAINING IN INDUSTRIAL/BUSINESS PARKS IN RACINE COUNTY THAT ARE NOT SERVED BY SANITARY SEWER AND PUBLIC WATER
Site Name Net Site Areaa (Acres)
Area Developed/ Committed for
Industrial/ Business Uses (Acres)
Remaining Available Developable Area
(Acres) Blackhawk Industrial Park ................................. 44.3 44.3 0.0 Evergreen Commerce Park ............................... 25.3 18.3 7.0 Haag Industrial Park .......................................... 16.3 14.1 2.2 Norway Industrial Park ...................................... 104.8 85.9 18.9 Raymond Business Park ................................... 27.5 6.5 21.0
Total 218.2 169.1 49.1 aExcludes internal roads, outlots, detention ponds, and other designated non-developable areas. Source: SEWRPC.
53

Table A-4
PROJECTED NUMBER OF YEARS UNTIL REMAINING SUPPLY OF AVAILABLE DEVELOPABLE LAND IN INDUSTRIAL/BUSINESS PARKS IN RACINE COUNTY
THAT ARE NOT SERVED BY SANITARY SEWER AND PUBLIC WATER WILL BE EXHAUSTED
Site Name 1990-2013
Development Rate
Available Developable Area Area Remaining:
2013 (Acres) No. of Years Until Fully Developed
Blackhawk Industrial Park ................................. 3.0 0.0 - - Evergreen Industrial Park ................................. 1.1 7.0 6.4 Haag Industrial Park ......................................... 0.6 2.2 3.7 Norway Industrial Park ...................................... 5.1 18.9 3.1 Raymond Business Park ................................... 6.5 21.0 3.2
Total 16.3 49.1 3.0 Source: SEWRPC.
54