Embed Size (px)
Citation preview

RADAR MEASUREMENTS OF REPRESENTATIVE SMALL LIGHT PASSENGER VEHICLES
DRI-TM-14-70-1
J.Y. Silberling J.W. Zellner
J. Kelly J.F. Lenkeit
December 2014
355 Van Ness Ave • Torrance • California 90501 • 310-212-5211 • Fax 310-212-5046 • www.dynres.com

ii
TABLE OF CONTENTS
Page I. INTRODUCTION ........................................................................... 1
II. MEASUREMENT METHODS ........................................................... 2
A. Representative Vehicles .......................................................... 2 B. Measurement Equipment ........................................................ 5
1. Radar Sensor .................................................................. 5 2. Sensor Trolley ................................................................ 6
C. Sensor Alignment to Representative Vehicle ............................. 8 D. Measurement Matrix .............................................................. 11 E. Data Collection ...................................................................... 12
III. DATA ANALYSIS METHODS ......................................................... 13
A. Data Filtering ........................................................................ 13 B. Data Analysis ........................................................................ 15
1. Number of Detected Objects ............................................ 15 2. Classification of the Primary Object ................................... 18 3. Statistical Analysis .......................................................... 22
IV. MEASUREMENT RESULTS ............................................................. 23
V. DISCUSSION ............................................................................... 26
REFERENCES ...................................................................................... 27
APPENDIX A Histograms and Cumulative Distribution Plots ................ A-1
iii
LIST OF FIGURES
Page Figure 1. Representative Vehicles .......................................................... 4 Figure 2. Bosch LRR3 Radar Sensor ....................................................... 5 Figure 3. Sensor Trolley ....................................................................... 7 Figure 4. Sensor Alignment Device ........................................................ 8 Figure 5. Scope Sight Device ................................................................ 9 Figure 6. Scope Sight After Target Alignment ....................................... 10 Figure 7. Radar Measurement Viewing Angles ...................................... 11 Figure 8. Spatial Data Filtering ............................................................ 14 Figure 9. Example Data Filtering for Object Consistency ......................... 15 Figure 10. Number of Detected Objects for All Measurements ................ 16 Figure 11. Number of Detected Objects by Viewing Angle ...................... 17 Figure 12. Number of Detected Objects by Range ................................. 18 Figure 13. Definition of Near-Side and Far-Side Objects ......................... 20 Figure 14. Example of Primary Object Classification............................... 21 Figure 15. Summary of RCS by Range and Angle .................................. 25

iv
LIST OF TABLES
Page Table 1. Test Matrix ............................................................................ 3 Table 2. Bosch LRR3 Features .............................................................. 5 Table 3. Test Matrix .......................................................................... 11 Table 4. Summary of RCS by Range and Angle ..................................... 24

1
Section I INTRODUCTION
Testing of Advanced Driver Assistance Systems (ADAS) often requires the use of a surrogate vehicle to represent a real vehicle in conflict scenarios. Use of a surrogate vehicle is required if there is a potential for a collision during testing. In order to ensure that the test results are representative of what will occur on the road, the surrogate vehicle should appear to the test vehicle sensors as a real car.
Many ADAS technologies use data from several types of sensors, including camera, radar and laser. The task of making a surrogate vehicle appear to be a real vehicle to ADAS sensors requires that the surrogate vehicle be representative of a real production vehicle to each of the sensors being used.
This document describes a method for measuring and analyzing the radar signature of eight representative production vehicles in order to quantify the radar signatures of typical small light passenger vehicles. The representative vehicle radar measurements are taken from various viewing angles.
.

2
Section II MEASUREMENT METHODS
A. REPRESENTATIVE VEHICLES
Eight small light passenger vehicles were measured for this analysis, including three sedans, three hatchbacks, and two microcars. Small light passenger vehicles represent a worst case in terms of vehicle visibility to radar and other sensors as compared to midsize and large light passenger vehicles and medium and heavy trucks.
Table 1 lists the vehicles that were used. Figure 1 provides a photograph of each of the measured vehicles. These vehicles include several vehicles from the same generation as vehicles that were previously measured by the Michigan Tech Research Institute (MTRI) using a high resolution research grade radar device as reported in Ref 1. These vehicles were selected to provide maximum overlap between this document and the MTRI report (Ref 1). Other vehicles, such as the Smart Fortwo and Scion iQ were measured because they were under consideration for being used as models for a surrogate vehicle.

3
Table 1. Test Matrix
Make and Model Model Year
Toyota Corolla 2010
Honda Civic 2010
Ford Fiesta Sedan 2012
Ford Fiesta Hatchback 2014
Toyota Matrix 2014
Honda Fit 2013
Smart Fortwo 2014
Scion iQ 2014

4
Figure 1. Representative Vehicles
a) Toyota Corolla; b) Honda Civic; c) Ford Fiesta Sedan; d) Ford Fiesta Hatchback; e) Toyota Matrix; f) Honda Fit; g) Smart Fortwo; h) Scion iQ

5
B. MEASUREMENT EQUIPMENT
1. Radar Sensor
The radar sensor used for taking these measurements was the Bosch LRR3 Long-Range Radar sensor. The Bosch sensor is an in-production automotive-grade sensor that is currently in use in production vehicles. Using an automotive-grade sensor, as opposed to a research-grade sensor, allows for the data to be representative of what will be used in typical ADAS’s in terms of sensor quality, resolution and field of view. Figure 2 shows the LRR3 sensor and Table 2 lists the key features.
Figure 2. Bosch LRR3 Radar Sensor
Table 2. Bosch LRR3 Features
Technical Feature Value
Frequency range 76-77 GHz
Distance Accuracy
0.5-250 m ±0.1 m
Horizontal visual range 30° (-3 dB angle)
Vertical visual range 5° (-3 dB angle)
Typical cycle time 80-100 ms
Max. number of detected objects 32

6
The sensor was provided by Bosch with a custom firmware upgrade that included a CAN message output of the Radar Cross Section (RCS) area of each of the detected objects. The RCS output of the sensor includes corrections for antenna gain, antenna azimuth characteristics, and object distance.
2. Sensor Trolley
The sensor trolley consisted of a wheeled trolley base and a vertical structure which holds the sensor bracket and a laptop. The sensor trolley has 3 leveling feet that are used to make it a stationary device during measurements. The front two feet can be used for fine roll adjustment and the rear foot can be used for fine pitch adjustment. The sensor trolley also contains a 24 GHz radar sensor from Smart Micro and a laser scanner from IBEO, however, this document only discusses the Bosch LRR3 sensor that is more typical of contemporary radar sensors used in production vehicles.. The components that are part of the sensor trolley are:
– 12 volt battery (item 1 in Figure 3),
– Power distribution box (item 2),
– dSpace MicroAutoBox II, used for data acquisition of CAN messages (item 3, mounted behind the sensor bracket),
– Bosch LRR3 sensor, set at 18 inches off the ground to represent a typical radar installation height (item 4),
– Sensor bracket with roll angle level and scope sight (item 5),
– Scope sight (item 6), and
– Laptop for data capture and review (item 7).

7
Figure 3. Sensor Trolley
The radar sensor is aligned with the sensor bracket, which is calibrated to be parallel to the radar sensor. This is accomplished by using an alignment device (Figure 4) that contains a laser and a visual target that has the same lateral and vertical offset as the scope does relative to the mirror on the Bosch sensor. Note that the alignment device uses the same tripod base as the scope sight device (Figure 5) except the lateral and vertical offset of the target is relative to the sensor center instead of the sensor mirror. The steps to accomplish the alignment are:

8
1. Point the laser at the mirror on the Bosch sensor.
2. Adjust the pitch and yaw of the sensor trolley and/or bracket in order to cause the laser to reflect back onto itself.
3. Adjust the horizontal and elevation adjustments of the scope sight so that it is pointed at the visual target.
Figure 4. Sensor Alignment Device
C. SENSOR ALIGNMENT TO REPRESENTATIVE VEHICLE
In order to get repeatable results it is necessary to carefully aim the sensor at the vehicle. The procedure described in this section is used for aligning the sensor with the vehicle and eliminates any misalignment due to variation in the roadway surface or other sources of error.
1. The vehicle is placed with its geometric center at a known location (referred to as the origin). The vehicle heading angle can be in any direction relative to the sensor.

9
2. The sensor trolley is then positioned at a known distance from the origin and facing the vehicle.
3. Place the scope sight device centered over the line connecting the vehicle geometric center to the sensor (marking this with a chalk line is recommended). The scope sight device is similar to the alignment device in Figure 4, except that the offsets are based on the center of the sensor box itself as opposed to the sensor mirror.
Figure 5. Scope Sight Device
4. Extend the three leveling feet on the sensor trolley so that the wheels of the sensor trolley are not touching the ground.
5. Adjust the two front leveling feet to level the sensor bracket in roll using the bubble level.

10
6. Adjust pitch angle using the rear leveling foot such that the scope sight is vertically aligned with the visual target.
7. Adjust the sensor yaw using a fine yaw adjustment plate, which changes the relative yaw angle between the sensor bracket and the trolley.
8. Confirm that the scope sight is aligned with the target.
Figure 6. Scope Sight After Target Alignment
9. Move the scope sight device and any other equipment away from the vehicle to prevent confounding the radar measurement data.
10. Record the sensor data.

11
D. MEASUREMENT MATRIX
In order to capture the radar signature of the entire vehicle, the radar measurements were taken from five viewing angles as shown in Figure 7. In addition, the measurements were taken from distances of 20, 40, and 60 m. This will result in 15 measurements of each vehicle.
Figure 7. Radar Measurement Viewing Angles
Table 3. Test Matrix
Viewing Angle Ranges (m)
Front 0° 20, 40, 60
Front Oblique 45° 20, 40, 60
Side 90° 20, 40, 60
Rear Oblique 135° 20, 40, 60
Rear 180° 20, 40, 60

12
E. DATA COLLECTION
The Bosch LRR3 reports the data using CAN bus communication. For these measurements, a MicroAutoBox from dSpace was used to capture and record the data from the Bosch sensor. The sensor can track as many as 32 objects at a time and transmits the data approximately every 80 ms. For each object the following data were recorded:
– Longitudinal position (m)
– Lateral position (m)
– Probability of existence (0-1)
– Object validity (binary)
– RCS (dB-m2)

13
Section III DATA ANALYSIS METHODS
The recorded data for each measurement was processed using a two-step procedure. First, the raw data is filtered to remove any invalid measurements such as measurements of the surrounding environment. Second, the detected objects that appear to be inconsistent are removed.
This section describes the data filtering in detail as well as the data analysis methods used to objectively quantify the RCS of a fleet of representative vehicles.
A. DATA FILTERING
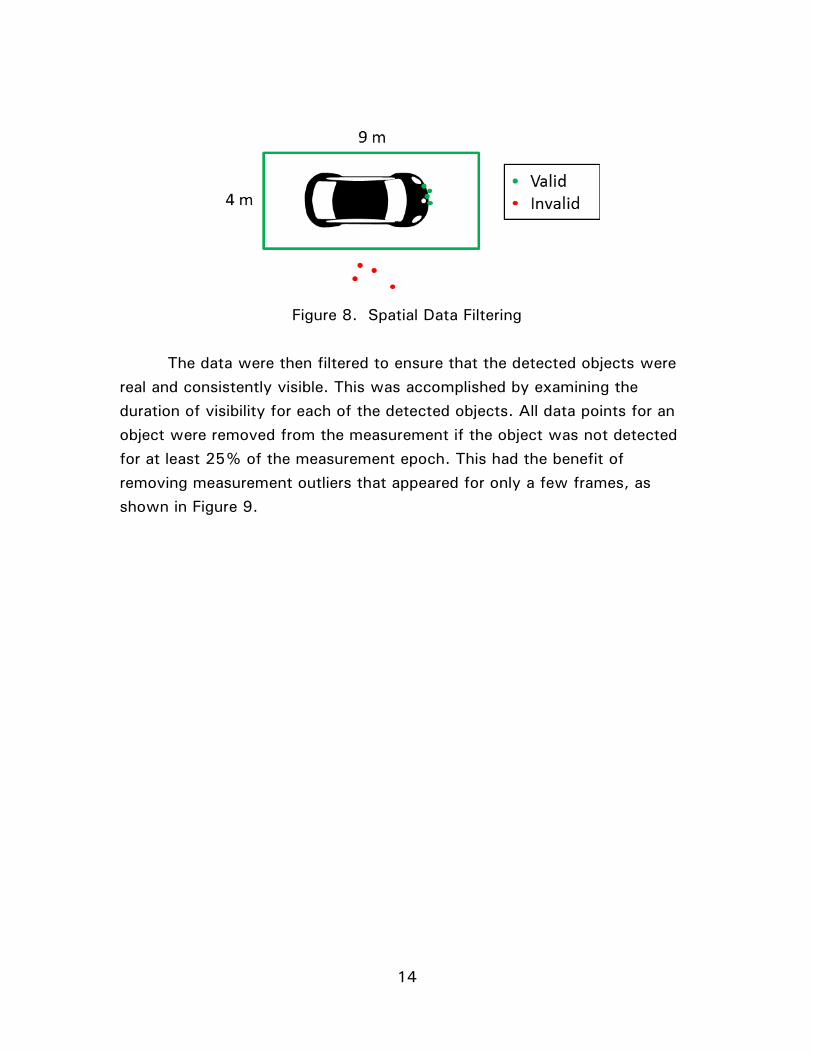
The raw data for each 5-second time epoch was first filtered to remove any invalid measurements or measurements not related to the representative vehicle. The invalid measurements were removed using the “Object Validity” output from the Bosch sensor. Additionally, the raw data points were spatially filtered by removing all data points that did not fall within an area around the vehicle. The size of the area was chosen to be a 9 meters long by 4 meters wide rectangle, which helped to ensure that there were no objects within the valid area except for the vehicle being measured, as shown in Figure 8.
14
Figure 8. Spatial Data Filtering
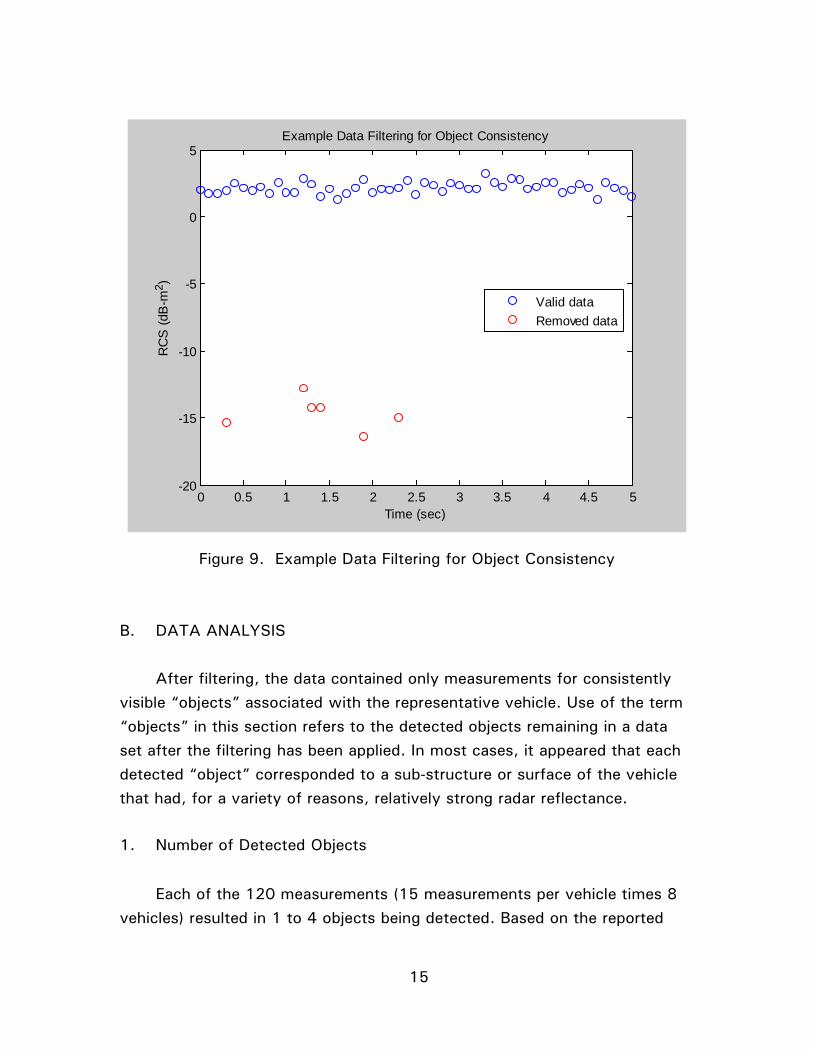
The data were then filtered to ensure that the detected objects were real and consistently visible. This was accomplished by examining the duration of visibility for each of the detected objects. All data points for an object were removed from the measurement if the object was not detected for at least 25% of the measurement epoch. This had the benefit of removing measurement outliers that appeared for only a few frames, as shown in Figure 9.
15
Figure 9. Example Data Filtering for Object Consistency
B. DATA ANALYSIS
After filtering, the data contained only measurements for consistently visible “objects” associated with the representative vehicle. Use of the term “objects” in this section refers to the detected objects remaining in a data set after the filtering has been applied. In most cases, it appeared that each detected “object” corresponded to a sub-structure or surface of the vehicle that had, for a variety of reasons, relatively strong radar reflectance.
1. Number of Detected Objects
Each of the 120 measurements (15 measurements per vehicle times 8 vehicles) resulted in 1 to 4 objects being detected. Based on the reported
0 0.5 1 1.5 2 2.5 3 3.5 4 4.5 5-20
-15
-10
-5
0
5
Time (sec)
RC
S (d
B-m
2 )
Example Data Filtering for Object Consistency
Valid dataRemoved data

16
spatial data it is clear that the dominant object was typically the nearest portion of the vehicle. However, for numerous measurements, other objects were visible further within or on the far side of the vehicle. Figure 10 shows the breakdown of the number of detected objects for all measurements (all viewing angles and ranges). Less than 5% of the measurements resulted in 3 or 4 objects while 60% had 1 object.
Figure 10. Number of Detected Objects for All Measurements
Looking at the data by viewing angle, Figure 11 shows that the oblique views are much more likely to result in more than one object being detected. The two oblique views (front and rear) resulted in 34 out of 48 measurements with 2 or more objects (over 70%). The direct viewing angles (front, side, and rear) resulted in 14 out of 72 measurements with 2 or more objects (less than 20%).

17
Figure 11. Number of Detected Objects by Viewing Angle
The number of detected objects can also be dependent on range. Figure 12 shows that measurements taken from a range of 20 meters are more likely to have multiple objects (over 50%) than measurements taken from 40 or 60 meters (less than 40%). This might be due to the fact that, at closer range, the reflections from the vehicle cover a larger angular field of view for the sensor, which might cause the sensor to classify the reflections as separate objects. It might also be the result of the higher power reflections that are detected by the sensor at closer range (radar power drops off with the 4th power of distance (Ref 1)).

18
Figure 12. Number of Detected Objects by Range
The presence of multiple sensed objects must be accounted for when developing an index for the RCS of representative vehicles. The sensor itself reports an RCS value for each object, so the presence of multiple detected objects associated with a single vehicle requires some additional steps be taken to be able to assign an RCS value to a given vehicle.
2. Classification of the Primary Object
In order to reduce the RCS variation caused by relatively lower power reflections from the far side of the vehicle, it was decided that only one object for each measurement should be used for the analysis. The “primary object”, as it is referred to, was selected as the object with the largest average RCS on the “near side” of the vehicle. The near side of the vehicle for front, rear, and side measurements was defined as the area between the sensor and the geometric center of the vehicle. The near side of the vehicle for oblique measurements was defined as the area between the sensor and

19
the longitudinal centerline of the vehicle as shown in Figure 13.
Figure 14 shows an example of a measurement that had multiple objects. For this rear view measurement, Object 1 was detected as the rear of the vehicle. Object 2 was detected as being on the far side of the vehicle with a relatively lower RCS. In this example, Object 1 was classified as the primary object and the data associated with Object 1 were used for further analysis.

20
Figure 13. Definition of Near-Side and Far-Side Objects

21
Figure 14. Example of Primary Object Classification (for One Vehicle, One Distance and One Viewing Angle)
Of the 120 measurements, review of the data indicates that 25 measurements contained at least one near-side object and one far-side object. On average, the near side object had a higher RCS than the far side object by an average of 11.26 dB-m2. However, 5 of the measurements had a far side object with a larger RCS than the near side object. These measurements were all for the oblique views (4 rear, 1 front) and had an average difference in RCS of 1.57 dB-m2 with a maximum difference of 2.44 dB-m2.
Additionally, 5 of the 120 measurements resulted in only a far side object being detected. These were all rear oblique view measurements. In the current analysis these measurements were not included (i.e., there was

22
no primary object). However, in other analysis it may be reasonable to consider the far side objects in these cases when classifying which object is the primary object for analysis.
3. Statistical Analysis
The data have been processed to include only data points for the primary object from each measurement. These data can then be used to calculate the statistical properties of the RCS for the representative vehicles. For each set of measurements at a given viewing angle and range, the RCS mean and standard deviation were calculated. These values are used to create an RCS band at each viewing angle to represent the range of RCS values for the representative vehicles.

23
Section IV MEASUREMENT RESULTS
The average RCS across all of the representative vehicles at each range and viewing angle is provided in Figure 15. In addition, the ±1-sigma (standard deviation) and ±2-sigma ranges are shown.
The mean RCS (µ) values for all measurements ranged from -11.5 to 15.0 dB-m2 with standard deviation ranging from 2.4 to 7.6 dB-m2. The side view had the largest mean RCS, ranging from 6.4 to 15.0 dB-m2 with a standard deviation ranging from 3.5 to 6.1 dB-m2. The oblique views (front and rear) had the smallest mean RCS, ranging from -11.5 to -6.7 dB-m2 with relatively small standard deviations, ranging from 2.4 to 4.8 dB-m2.
Table 4 provides a numeric summary of the data that are depicted in Figure 15.
In addition to the summary figure provided in this section, raw histogram and cumulative distributions plots are provided in Appendix A.

24
Table 4. Summary of RCS by Range and Angle
Angle Range [m]
RCS Mean (µ) [dB-m2]
RCS Std. Dev. (σ) [dB-m2]
Front 20 0.13 4.74 40 6.07 7.62 60 8.15 2.55 Front 20 -10.26 2.40 Oblique 40 -8.68 4.82 60 -6.66 3.91 Side 20 6.41 3.45 40 10.37 4.99 60 14.99 6.06 Rear 20 -11.51 2.45 Oblique 40 -7.19 3.32 60 -8.16 3.15 Rear 20 2.15 3.39 40 6.85 3.50 60 2.22 6.36

25
Figure 15. Summary of RCS by Range and Angle
26
Section V DISCUSSION
The data in this document indicate that the side view of a vehicle will generally have the largest RCS, the front and rear views of a vehicle will have a moderately high RCS, and the oblique views will have a very small RCS. These results seem intuitive because the side view provides the largest reflection surface and that surface is oriented mostly perpendicular to the sensor. The orientation of the oblique views is such that the radar will tend to be reflected away from the sensor. Because of the strong dependence of RCS on viewing angle, surrogate vehicles that are representative of passenger vehicles from all angles are more realistic for testing ADAS technologies that may function at one or more ranges of angles.
It is also quite clear from the data that there is a large variation between vehicles. The rear view RCS of one vehicle may be much smaller or larger than the rear view RCS of another vehicle, even if the vehicles are a similar size and similarly shaped. Therefore, it is important for ADAS’s to be able to accommodate large variations in radar signatures in order to be effective under real-world conditions.
The RCS measurement results for the representative vehicles that are presented here can be compared to similar measurements for surrogate vehicles. This method will confirm whether the RCS signature (i.e., from all angles and ranges) of a given surrogate vehicle is similar to and representative of real-world vehicles.

27
REFERENCES
1. Anonymous, Radar Measurements of NHTSA’s Surrogate Vehicle SS_V, US DOT Docket NHTSA-2012-0057, DTNH11-12-P-01638, December 2012.

A-1
APPENDIX A
Histograms and Cumulative Distribution Plots

−25 −20 −15 −10 −5 0 5 10 15 20 25 300
0.1
0.2
0.3
0.4
0.5
0.6
0.7
0.8
0.9
1
RCS (dBm2)
Cum
ulat
ive
Pro
babi
lity
Cumulative Probablity of Bosch RCS by VehicleAngle: Front, Range: 20 m
Eight Rep. VehiclesToyota CorollaHonda CivicFord Fiesta SedanFord Fiesta HatchbackSmart FortwoScion iQToyota MatrixHonda Fit
A-2

−25 −20 −15 −10 −5 0 5 10 15 20 25 300
0.1
0.2
0.3
0.4
0.5
0.6
0.7
0.8
0.9
1
RCS (dBm2)
Cum
ulat
ive
Pro
babi
lity
Cumulative Probablity of Bosch RCS by VehicleAngle: Front, Range: 40 m
Eight Rep. VehiclesToyota CorollaHonda CivicFord Fiesta SedanFord Fiesta HatchbackSmart FortwoScion iQToyota MatrixHonda Fit
A-3

−25 −20 −15 −10 −5 0 5 10 15 20 25 300
0.1
0.2
0.3
0.4
0.5
0.6
0.7
0.8
0.9
1
RCS (dBm2)
Cum
ulat
ive
Pro
babi
lity
Cumulative Probablity of Bosch RCS by VehicleAngle: Front, Range: 60 m
Eight Rep. VehiclesToyota CorollaHonda CivicFord Fiesta SedanFord Fiesta HatchbackSmart FortwoScion iQToyota MatrixHonda Fit
A-4

−25 −20 −15 −10 −5 0 5 10 15 20 25 300
10
20
30
40
50
60
RCS (dBm2)
Fre
quen
cy
Histogram of Bosch RCS by Vehicle, Eight Rep. VehiclesAngle: Front, Range: 20 m
Toyota CorollaHonda CivicFord Fiesta SedanFord Fiesta HatchbackSmart FortwoScion iQToyota MatrixHonda Fit
A-5

−25 −20 −15 −10 −5 0 5 10 15 20 25 300
20
40
60
80
100
120
140
RCS (dBm2)
Fre
quen
cy
Histogram of Bosch RCS of Eight Rep. VehiclesAngle: Front, Range: 20 m
A-6
−25 −20 −15 −10 −5 0 5 10 15 20 25 300
10
20
30
40
50
60
RCS (dBm2)
Fre
quen
cy
Histogram of Bosch RCS by Vehicle, Eight Rep. VehiclesAngle: Front, Range: 40 m
Toyota CorollaHonda CivicFord Fiesta SedanFord Fiesta HatchbackSmart FortwoScion iQToyota MatrixHonda Fit
A-7

−25 −20 −15 −10 −5 0 5 10 15 20 25 300
20
40
60
80
100
120
140
RCS (dBm2)
Fre
quen
cy
Histogram of Bosch RCS of Eight Rep. VehiclesAngle: Front, Range: 40 m
A-8

−25 −20 −15 −10 −5 0 5 10 15 20 25 300
10
20
30
40
50
60
RCS (dBm2)
Fre
quen
cy
Histogram of Bosch RCS by Vehicle, Eight Rep. VehiclesAngle: Front, Range: 60 m
Toyota CorollaHonda CivicFord Fiesta SedanFord Fiesta HatchbackSmart FortwoScion iQToyota MatrixHonda Fit
A-9

−25 −20 −15 −10 −5 0 5 10 15 20 25 300
20
40
60
80
100
120
140
RCS (dBm2)
Fre
quen
cy
Histogram of Bosch RCS of Eight Rep. VehiclesAngle: Front, Range: 60 m
A-10

−25 −20 −15 −10 −5 0 5 10 15 20 25 300
0.1
0.2
0.3
0.4
0.5
0.6
0.7
0.8
0.9
1
RCS (dBm2)
Cum
ulat
ive
Pro
babi
lity
Cumulative Probablity of Bosch RCS by VehicleAngle: Oblique Front, Range: 20 m
Eight Rep. VehiclesToyota CorollaHonda CivicFord Fiesta SedanFord Fiesta HatchbackSmart FortwoScion iQToyota MatrixHonda Fit
A-11

−25 −20 −15 −10 −5 0 5 10 15 20 25 300
0.1
0.2
0.3
0.4
0.5
0.6
0.7
0.8
0.9
1
RCS (dBm2)
Cum
ulat
ive
Pro
babi
lity
Cumulative Probablity of Bosch RCS by VehicleAngle: Oblique Front, Range: 40 m
Eight Rep. VehiclesToyota CorollaHonda CivicFord Fiesta SedanFord Fiesta HatchbackSmart FortwoScion iQToyota MatrixHonda Fit
A-12
−25 −20 −15 −10 −5 0 5 10 15 20 25 300
0.1
0.2
0.3
0.4
0.5
0.6
0.7
0.8
0.9
1
RCS (dBm2)
Cum
ulat
ive
Pro
babi
lity
Cumulative Probablity of Bosch RCS by VehicleAngle: Oblique Front, Range: 60 m
Eight Rep. VehiclesToyota CorollaHonda CivicFord Fiesta SedanFord Fiesta HatchbackSmart FortwoScion iQToyota MatrixHonda Fit
A-13

−25 −20 −15 −10 −5 0 5 10 15 20 25 300
10
20
30
40
50
60
RCS (dBm2)
Fre
quen
cy
Histogram of Bosch RCS by Vehicle, Eight Rep. VehiclesAngle: Oblique Front, Range: 20 m
Toyota CorollaHonda CivicFord Fiesta SedanFord Fiesta HatchbackSmart FortwoScion iQToyota MatrixHonda Fit
A-14
−25 −20 −15 −10 −5 0 5 10 15 20 25 300
20
40
60
80
100
120
140
RCS (dBm2)
Fre
quen
cy
Histogram of Bosch RCS of Eight Rep. VehiclesAngle: Oblique Front, Range: 20 m
A-15

−25 −20 −15 −10 −5 0 5 10 15 20 25 300
10
20
30
40
50
60
RCS (dBm2)
Fre
quen
cy
Histogram of Bosch RCS by Vehicle, Eight Rep. VehiclesAngle: Oblique Front, Range: 40 m
Toyota CorollaHonda CivicFord Fiesta SedanFord Fiesta HatchbackSmart FortwoScion iQToyota MatrixHonda Fit
A-16

−25 −20 −15 −10 −5 0 5 10 15 20 25 300
20
40
60
80
100
120
140
RCS (dBm2)
Fre
quen
cy
Histogram of Bosch RCS of Eight Rep. VehiclesAngle: Oblique Front, Range: 40 m
A-17

−25 −20 −15 −10 −5 0 5 10 15 20 25 300
10
20
30
40
50
60
RCS (dBm2)
Fre
quen
cy
Histogram of Bosch RCS by Vehicle, Eight Rep. VehiclesAngle: Oblique Front, Range: 60 m
Toyota CorollaHonda CivicFord Fiesta SedanFord Fiesta HatchbackSmart FortwoScion iQToyota MatrixHonda Fit
A-18
−25 −20 −15 −10 −5 0 5 10 15 20 25 300
20
40
60
80
100
120
140
RCS (dBm2)
Fre
quen
cy
Histogram of Bosch RCS of Eight Rep. VehiclesAngle: Oblique Front, Range: 60 m
A-19

−25 −20 −15 −10 −5 0 5 10 15 20 25 300
0.1
0.2
0.3
0.4
0.5
0.6
0.7
0.8
0.9
1
RCS (dBm2)
Cum
ulat
ive
Pro
babi
lity
Cumulative Probablity of Bosch RCS by VehicleAngle: Side, Range: 20 m
Eight Rep. VehiclesToyota CorollaHonda CivicFord Fiesta SedanFord Fiesta HatchbackSmart FortwoScion iQToyota MatrixHonda Fit
A-20

−25 −20 −15 −10 −5 0 5 10 15 20 25 300
0.1
0.2
0.3
0.4
0.5
0.6
0.7
0.8
0.9
1
RCS (dBm2)
Cum
ulat
ive
Pro
babi
lity
Cumulative Probablity of Bosch RCS by VehicleAngle: Side, Range: 40 m
Eight Rep. VehiclesToyota CorollaHonda CivicFord Fiesta SedanFord Fiesta HatchbackSmart FortwoScion iQToyota MatrixHonda Fit
A-21

−25 −20 −15 −10 −5 0 5 10 15 20 25 300
0.1
0.2
0.3
0.4
0.5
0.6
0.7
0.8
0.9
1
RCS (dBm2)
Cum
ulat
ive
Pro
babi
lity
Cumulative Probablity of Bosch RCS by VehicleAngle: Side, Range: 60 m
Eight Rep. VehiclesToyota CorollaHonda CivicFord Fiesta SedanFord Fiesta HatchbackSmart FortwoScion iQToyota MatrixHonda Fit
A-22

−25 −20 −15 −10 −5 0 5 10 15 20 25 300
10
20
30
40
50
60
RCS (dBm2)
Fre
quen
cy
Histogram of Bosch RCS by Vehicle, Eight Rep. VehiclesAngle: Side, Range: 20 m
Toyota CorollaHonda CivicFord Fiesta SedanFord Fiesta HatchbackSmart FortwoScion iQToyota MatrixHonda Fit
A-23

−25 −20 −15 −10 −5 0 5 10 15 20 25 300
20
40
60
80
100
120
140
RCS (dBm2)
Fre
quen
cy
Histogram of Bosch RCS of Eight Rep. VehiclesAngle: Side, Range: 20 m
A-24

−25 −20 −15 −10 −5 0 5 10 15 20 25 300
10
20
30
40
50
60
RCS (dBm2)
Fre
quen
cy
Histogram of Bosch RCS by Vehicle, Eight Rep. VehiclesAngle: Side, Range: 40 m
Toyota CorollaHonda CivicFord Fiesta SedanFord Fiesta HatchbackSmart FortwoScion iQToyota MatrixHonda Fit
A-25

−25 −20 −15 −10 −5 0 5 10 15 20 25 300
20
40
60
80
100
120
140
RCS (dBm2)
Fre
quen
cy
Histogram of Bosch RCS of Eight Rep. VehiclesAngle: Side, Range: 40 m
A-26

−25 −20 −15 −10 −5 0 5 10 15 20 25 300
10
20
30
40
50
60
RCS (dBm2)
Fre
quen
cy
Histogram of Bosch RCS by Vehicle, Eight Rep. VehiclesAngle: Side, Range: 60 m
Toyota CorollaHonda CivicFord Fiesta SedanFord Fiesta HatchbackSmart FortwoScion iQToyota MatrixHonda Fit
A-27

−25 −20 −15 −10 −5 0 5 10 15 20 25 300
20
40
60
80
100
120
140
RCS (dBm2)
Fre
quen
cy
Histogram of Bosch RCS of Eight Rep. VehiclesAngle: Side, Range: 60 m
A-28

−25 −20 −15 −10 −5 0 5 10 15 20 25 300
0.1
0.2
0.3
0.4
0.5
0.6
0.7
0.8
0.9
1
RCS (dBm2)
Cum
ulat
ive
Pro
babi
lity
Cumulative Probablity of Bosch RCS by VehicleAngle: Oblique Rear, Range: 20 m
Eight Rep. VehiclesToyota CorollaHonda CivicFord Fiesta SedanFord Fiesta HatchbackSmart FortwoScion iQToyota MatrixHonda Fit
A-29

−25 −20 −15 −10 −5 0 5 10 15 20 25 300
0.1
0.2
0.3
0.4
0.5
0.6
0.7
0.8
0.9
1
RCS (dBm2)
Cum
ulat
ive
Pro
babi
lity
Cumulative Probablity of Bosch RCS by VehicleAngle: Oblique Rear, Range: 40 m
Eight Rep. VehiclesToyota CorollaHonda CivicFord Fiesta SedanFord Fiesta HatchbackSmart FortwoScion iQToyota MatrixHonda Fit
A-30

−25 −20 −15 −10 −5 0 5 10 15 20 25 300
0.1
0.2
0.3
0.4
0.5
0.6
0.7
0.8
0.9
1
RCS (dBm2)
Cum
ulat
ive
Pro
babi
lity
Cumulative Probablity of Bosch RCS by VehicleAngle: Oblique Rear, Range: 60 m
Eight Rep. VehiclesToyota CorollaHonda CivicFord Fiesta SedanFord Fiesta HatchbackSmart FortwoScion iQToyota MatrixHonda Fit
A-31

−25 −20 −15 −10 −5 0 5 10 15 20 25 300
10
20
30
40
50
60
RCS (dBm2)
Fre
quen
cy
Histogram of Bosch RCS by Vehicle, Eight Rep. VehiclesAngle: Oblique Rear, Range: 20 m
Toyota CorollaHonda CivicFord Fiesta SedanFord Fiesta HatchbackSmart FortwoScion iQToyota MatrixHonda Fit
A-32

−25 −20 −15 −10 −5 0 5 10 15 20 25 300
20
40
60
80
100
120
140
RCS (dBm2)
Fre
quen
cy
Histogram of Bosch RCS of Eight Rep. VehiclesAngle: Oblique Rear, Range: 20 m
A-33

−25 −20 −15 −10 −5 0 5 10 15 20 25 300
10
20
30
40
50
60
RCS (dBm2)
Fre
quen
cy
Histogram of Bosch RCS by Vehicle, Eight Rep. VehiclesAngle: Oblique Rear, Range: 40 m
Toyota CorollaHonda CivicFord Fiesta SedanFord Fiesta HatchbackSmart FortwoScion iQToyota MatrixHonda Fit
A-34

−25 −20 −15 −10 −5 0 5 10 15 20 25 300
20
40
60
80
100
120
140
RCS (dBm2)
Fre
quen
cy
Histogram of Bosch RCS of Eight Rep. VehiclesAngle: Oblique Rear, Range: 40 m
A-35

−25 −20 −15 −10 −5 0 5 10 15 20 25 300
10
20
30
40
50
60
RCS (dBm2)
Fre
quen
cy
Histogram of Bosch RCS by Vehicle, Eight Rep. VehiclesAngle: Oblique Rear, Range: 60 m
Toyota CorollaHonda CivicFord Fiesta SedanFord Fiesta HatchbackSmart FortwoScion iQToyota MatrixHonda Fit
A-36

−25 −20 −15 −10 −5 0 5 10 15 20 25 300
20
40
60
80
100
120
140
RCS (dBm2)
Fre
quen
cy
Histogram of Bosch RCS of Eight Rep. VehiclesAngle: Oblique Rear, Range: 60 m
A-37

−25 −20 −15 −10 −5 0 5 10 15 20 25 300
0.1
0.2
0.3
0.4
0.5
0.6
0.7
0.8
0.9
1
RCS (dBm2)
Cum
ulat
ive
Pro
babi
lity
Cumulative Probablity of Bosch RCS by VehicleAngle: Rear, Range: 20 m
Eight Rep. VehiclesToyota CorollaHonda CivicFord Fiesta SedanFord Fiesta HatchbackSmart FortwoScion iQToyota MatrixHonda Fit
A-38

−25 −20 −15 −10 −5 0 5 10 15 20 25 300
0.1
0.2
0.3
0.4
0.5
0.6
0.7
0.8
0.9
1
RCS (dBm2)
Cum
ulat
ive
Pro
babi
lity
Cumulative Probablity of Bosch RCS by VehicleAngle: Rear, Range: 40 m
Eight Rep. VehiclesToyota CorollaHonda CivicFord Fiesta SedanFord Fiesta HatchbackSmart FortwoScion iQToyota MatrixHonda Fit
A-39

−25 −20 −15 −10 −5 0 5 10 15 20 25 300
0.1
0.2
0.3
0.4
0.5
0.6
0.7
0.8
0.9
1
RCS (dBm2)
Cum
ulat
ive
Pro
babi
lity
Cumulative Probablity of Bosch RCS by VehicleAngle: Rear, Range: 60 m
Eight Rep. VehiclesToyota CorollaHonda CivicFord Fiesta SedanFord Fiesta HatchbackSmart FortwoScion iQToyota MatrixHonda Fit
A-40

−25 −20 −15 −10 −5 0 5 10 15 20 25 300
10
20
30
40
50
60
RCS (dBm2)
Fre
quen
cy
Histogram of Bosch RCS by Vehicle, Eight Rep. VehiclesAngle: Rear, Range: 20 m
Toyota CorollaHonda CivicFord Fiesta SedanFord Fiesta HatchbackSmart FortwoScion iQToyota MatrixHonda Fit
A-41

−25 −20 −15 −10 −5 0 5 10 15 20 25 300
20
40
60
80
100
120
140
RCS (dBm2)
Fre
quen
cy
Histogram of Bosch RCS of Eight Rep. VehiclesAngle: Rear, Range: 20 m
A-42

−25 −20 −15 −10 −5 0 5 10 15 20 25 300
10
20
30
40
50
60
RCS (dBm2)
Fre
quen
cy
Histogram of Bosch RCS by Vehicle, Eight Rep. VehiclesAngle: Rear, Range: 40 m
Toyota CorollaHonda CivicFord Fiesta SedanFord Fiesta HatchbackSmart FortwoScion iQToyota MatrixHonda Fit
A-43

−25 −20 −15 −10 −5 0 5 10 15 20 25 300
20
40
60
80
100
120
140
RCS (dBm2)
Fre
quen
cy
Histogram of Bosch RCS of Eight Rep. VehiclesAngle: Rear, Range: 40 m
A-44

−25 −20 −15 −10 −5 0 5 10 15 20 25 300
10
20
30
40
50
60
RCS (dBm2)
Fre
quen
cy
Histogram of Bosch RCS by Vehicle, Eight Rep. VehiclesAngle: Rear, Range: 60 m
Toyota CorollaHonda CivicFord Fiesta SedanFord Fiesta HatchbackSmart FortwoScion iQToyota MatrixHonda Fit
A-45

−25 −20 −15 −10 −5 0 5 10 15 20 25 300
20
40
60
80
100
120
140
RCS (dBm2)
Fre
quen
cy
Histogram of Bosch RCS of Eight Rep. VehiclesAngle: Rear, Range: 60 m
A-46