Embed Size (px)
Citation preview
HAL Id: hal-01710856https://hal.archives-ouvertes.fr/hal-01710856
Submitted on 16 Feb 2018
HAL is a multi-disciplinary open accessarchive for the deposit and dissemination of sci-entific research documents, whether they are pub-lished or not. The documents may come fromteaching and research institutions in France orabroad, or from public or private research centers.
L’archive ouverte pluridisciplinaire HAL, estdestinée au dépôt et à la diffusion de documentsscientifiques de niveau recherche, publiés ou non,émanant des établissements d’enseignement et derecherche français ou étrangers, des laboratoirespublics ou privés.
Radar Propagation Experiment in the North Sea: TheSylt Campaign
Andreas Danklmayer, Jörg Förster, Vincent Fabbro, Gregor Biegel, ThorstenBrehm, Paul Colditz, Laurent Castanet, Yvonick Hurtaud
To cite this version:Andreas Danklmayer, Jörg Förster, Vincent Fabbro, Gregor Biegel, Thorsten Brehm, et al.. RadarPropagation Experiment in the North Sea: The Sylt Campaign. IEEE Transactions on Geoscienceand Remote Sensing, Institute of Electrical and Electronics Engineers, 2017, 56 (2), pp.835-846.�10.1109/TGRS.2017.2755506�. �hal-01710856�
1
Radar Propagation Experiment in the North Sea: The Sylt
Campaign
Andreas Danklmayer, Member, IEEE, Jörg Förster, Vincent Fabbro, Gregor Biegel, Thorsten Brehm, Paul Colditz,
Laurent Castanet, Yvonick Hurtaud
A. Danklmayer, G. Biegel, T. Brehm, P. Colditz are with the Fraunhofer Institute for High Frequency Physics and Radar Techniques FHR, Wachtberg,
Germany (phone: +49-228-9435-350; fax: +49-228-9435-521; e-mail: [email protected]).
J. Förster is with the Bundeswehr Technical Center for Ships and Naval Weapons, Naval Technology and Research (WTD 71), Eckernförde, Germany
(phone: +49-431-607-4123; fax: +49-431-607-4150; e-mail: [email protected]).
V. Fabbro and L. Castanet are with ONERA, The French Aerospace Lab, Electromagnetism and Radar Department (DEMR), F-31055 Toulouse, France
(e-mail: [email protected]).
Y. Hurtaud is with DGA, Maîtrise de l’Information CGN2/SDO, Bruz, France (phone: +33-(0)2-99-42-96-52; fax: +33-(0)2-99-42-90-06; e-mail:
Abstract— This paper describes an experiment that was carried out in the North Sea off the Sylt
island in May 2012 with the aim to study the influence of the maritime boundary layer (MBL)
conditions on the propagation of radar signals under low grazing angle geometry and to establish a
sea clutter data base at different frequencies with a view to contribute to new sea clutter models. The
radar measurements were carried out with the highly versatile radar called MEMPHIS operating in
sea configuration at X-, Ka- and W-band simultaneously. As concerns the oceanographic and
atmospheric characterization, the collection of measurements was done with a sophisticated suite of
sensors partly mounted on the research vessel (RV) Elisabeth Mann Borgese (EMB) and onboard
different types of buoys, a catamaran and a tethered balloon. Over a period of 4 days a
comprehensive and valuable dataset was successfully collected including clutter measurements under
different geometrical configurations and propagation runs with corner reflectors mounted onboard
RV EMB. An insight in the overall approach is given together with many measurement examples for
a very detailed oceanographic and meteorological characterization and a vast number of multi-
2
frequency radar acquisitions, showing the complexity of different parameters that have to be
considered for sensor performance assessment and prediction.
Index Terms— millimeter wave propagation, maritime boundary layer, ducting, refractive index,
tropospheric propagation effects, radar scattering, sea clutter
I. INTRODUCTION
It is well known that radar sensor performance in coastal and maritime environments is particularly affected
by meteorological and oceanographic conditions next to the sensor and by the geometry itself. In this
context a comprehensive campaign was set up covering several important aspects related to the
characterization of the maritime environment in terms of oceanographic and meteorological parameters.
The purpose of the North Sea measurement campaign conducted in May of 2012 was to generate a
comprehensive database that allows to investigate propagation effects in the maritime boundary layer as
well as to study the behavior of sea clutter under grazing angle and at different geometries. Fraunhofer
FHR (previously known as FGAN) has a long tradition in measurement campaigns over the past decades at
several locations worldwide Erreur ! Source du renvoi introuvable.-[5]. The reason for campaigns at
different geographical locations is that wave propagation may vary considerably depending on the climate
and the local tropospheric and oceanographic conditions as well as bathymetry.
The campaign reported in this contribution was carried out on four consecutive days starting from 27th
until
30th
of May 2012 at the Island of Sylt (Germany), more specifically at the WTD 71 hosted land based test
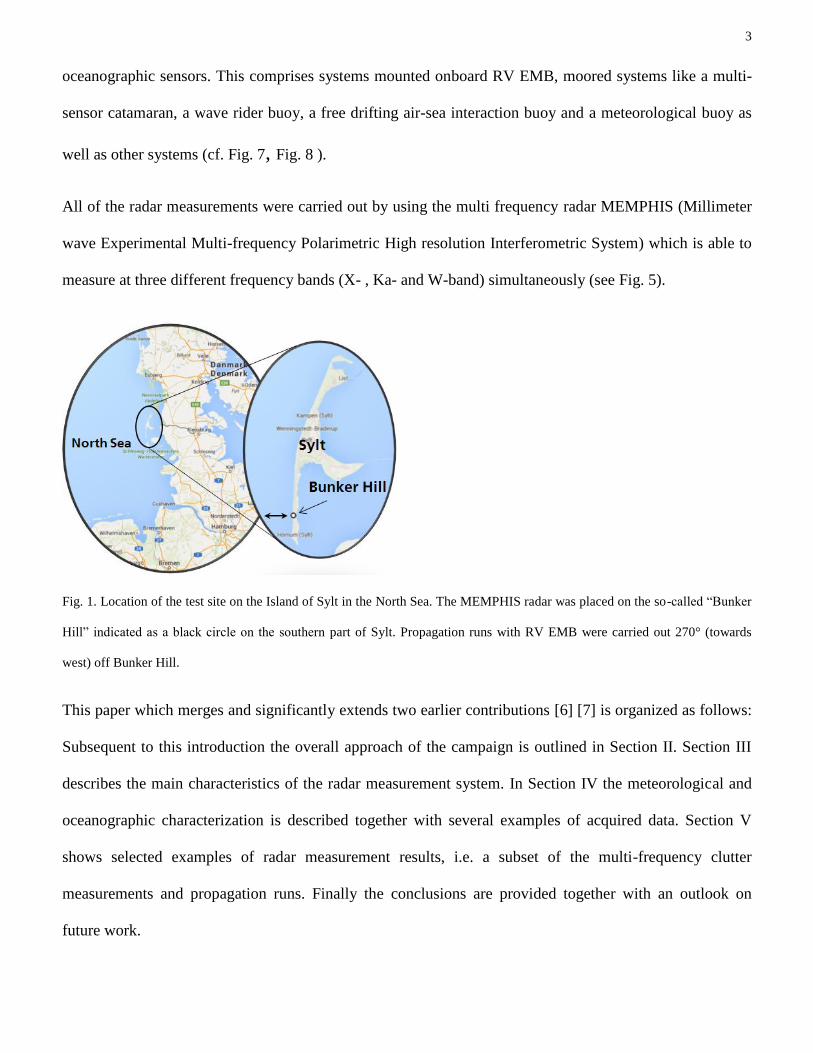
site Bunker Hill and the surrounding area in the North Sea (see Fig. 1). A series of sea clutter
measurements together with radar propagation measurements were carried out in collaboration with the
WTD 71 (Bundeswehr Technical Center for Ships and Naval Weapons, Naval Technology and Research)
being responsible for the oceanographic and meteorological characterization of the environment, i.e. the
characterization of the sea surface and the maritime boundary layer by using a set of meteorological and
3
oceanographic sensors. This comprises systems mounted onboard RV EMB, moored systems like a multi-
sensor catamaran, a wave rider buoy, a free drifting air-sea interaction buoy and a meteorological buoy as
well as other systems (cf. Fig. 7, Fig. 8 ).
All of the radar measurements were carried out by using the multi frequency radar MEMPHIS (Millimeter
wave Experimental Multi-frequency Polarimetric High resolution Interferometric System) which is able to
measure at three different frequency bands (X- , Ka- and W-band) simultaneously (see Fig. 5).
Fig. 1. Location of the test site on the Island of Sylt in the North Sea. The MEMPHIS radar was placed on the so-called “Bunker
Hill” indicated as a black circle on the southern part of Sylt. Propagation runs with RV EMB were carried out 270° (towards
west) off Bunker Hill.
This paper which merges and significantly extends two earlier contributions [6] [7] is organized as follows:
Subsequent to this introduction the overall approach of the campaign is outlined in Section II. Section III
describes the main characteristics of the radar measurement system. In Section IV the meteorological and
oceanographic characterization is described together with several examples of acquired data. Section V
shows selected examples of radar measurement results, i.e. a subset of the multi-frequency clutter
measurements and propagation runs. Finally the conclusions are provided together with an outlook on
future work.
4
Propagation Conditions above the Sea Surface
The measured radar signature of a target is dependent on several parameters. Not only the RCS (Radar
Cross Section) of the target itself and the characteristics of the radar system and the measurement geometry
are important but also the environmental conditions of the sea (e.g. sea state and temperature) and the
atmosphere, i.e. the propagation media. The maritime boundary layer covers the first tenths of meters above
the sea surface and is of significant importance for the sensor performance. Turbulent exchange processes
and vertical as well as horizontal temperature and humidity gradients may lead to propagation anomalies
like ducting, shift of the horizon, multipath, scintillation, extinction, attenuation and others. As a
consequence for the radar signal attenuation, signal fading and probably increase or limitation of detection
ranges as well as so-called radar holes, masking targets, may occur. One of the most important quantities to
describe the propagation conditions in the maritime boundary layer is the gradient of the so-called modified
refractive index M along the height coordinate z. A graph showing a number of different types of M-
profiles is provided in Fig. 2. In order to derive this quantity we start with a more fundamental term for the
refractivity N
N = 106. (n − 1), (1)
where n is called the refractive index or also index of refraction, a dimensionless number that describes
how waves propagate in a media with c the speed of light and v the phase velocity
𝑛 =𝑐
𝑣 (2)
Then the modified refractive index M can be written as
𝑀 = 106 ∙ (𝑛 − 1 +𝑧
𝑅) ≈ 𝑁 + 0,157 𝑧 (3)
where R ≈ 6371 km being the Earth radius.
In order to show the link between the refractive index and the meteorological parameters one can recall the
classical Debye formular according to
5
𝑁 =77,6
𝑇∙ (𝑝 + 4810
𝑒
𝑇) (4)
with temperature T in Kelvin, air pressure p and water vapor pressure in hPa [8].
Finally we arrive at the exact formulation of the gradient of M along the z coordinate
Rdz
de
de
dN
dz
dT
dT
dN
dz
dp
dp
dN
dz
dM 610 (5)
where again p is the air pressure, T corresponds to the air temperature, e represents the water vapor pressure
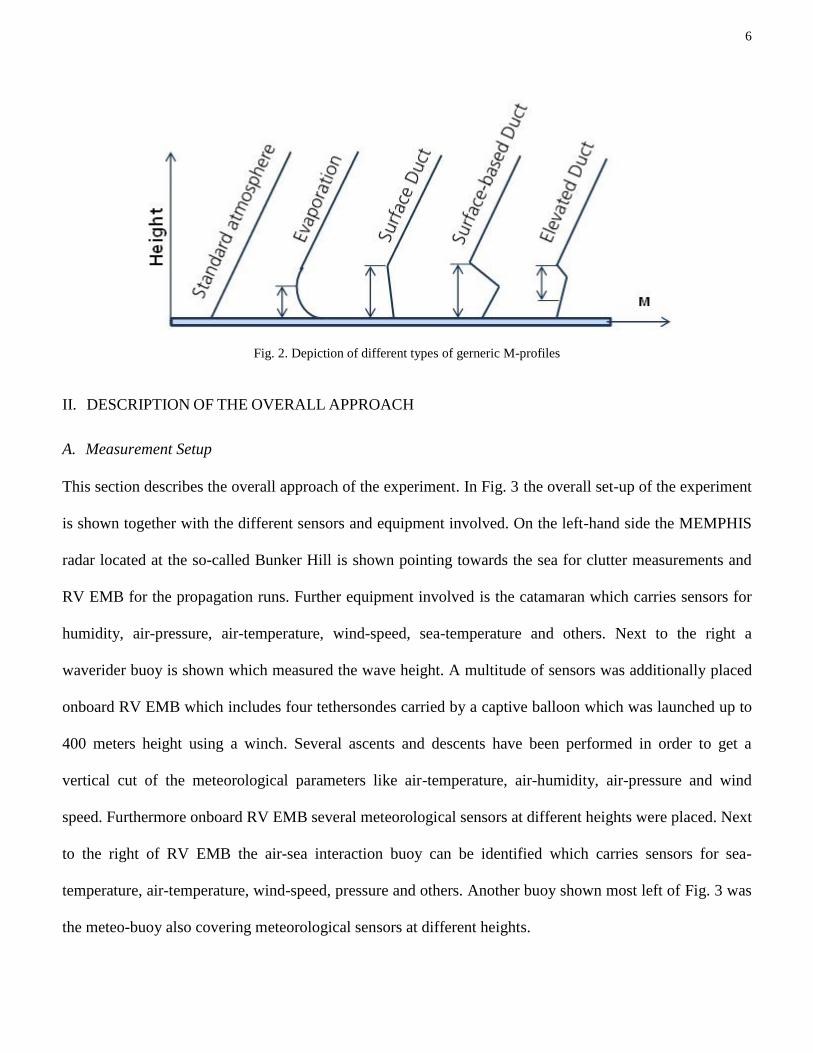
and R is Earth radius. The standard atmosphere corresponds to a set of models that define values for
atmospheric temperature, density, pressure and other properties over a wide range of altitudes, where in
this case the M-profile is gradually increasing in the lower altitudes, i.e. above the Earth surface (cf. Fig. 2)
[9]. Negative gradients lead to refracted rays towards the Earth surface and to ducting where the height of
the ducts are determined by the reverse of the negative to the positive sign of the M-gradients (dM/dz = 0).
Frequently observed in the maritime boundary layer are evaporation ducts with maximum duct heights of
about 40 m. Non-standard conditions where the gradient of the M-profile is not gradually increasing along
the vertical direction are surface based ducts, elevated ducts and complex combinations of different kind of
ducts. Ducting may increase the radar horizon and lead to detection range far beyond the geometrical
horizon. At the same time anomalous (non-standard) conditions may also increase the clutter return from
the sea surface [10].
6
Fig. 2. Depiction of different types of gerneric M-profiles
II. DESCRIPTION OF THE OVERALL APPROACH
A. Measurement Setup
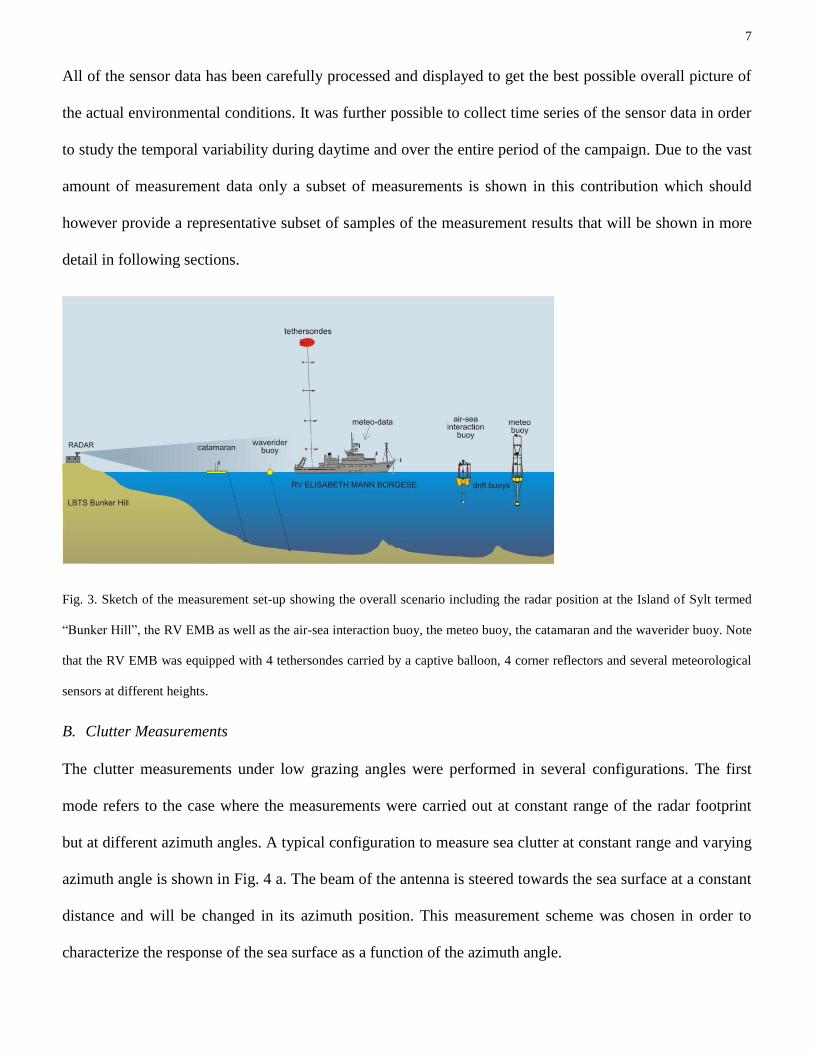
This section describes the overall approach of the experiment. In Fig. 3 the overall set-up of the experiment
is shown together with the different sensors and equipment involved. On the left-hand side the MEMPHIS
radar located at the so-called Bunker Hill is shown pointing towards the sea for clutter measurements and
RV EMB for the propagation runs. Further equipment involved is the catamaran which carries sensors for
humidity, air-pressure, air-temperature, wind-speed, sea-temperature and others. Next to the right a
waverider buoy is shown which measured the wave height. A multitude of sensors was additionally placed
onboard RV EMB which includes four tethersondes carried by a captive balloon which was launched up to
400 meters height using a winch. Several ascents and descents have been performed in order to get a
vertical cut of the meteorological parameters like air-temperature, air-humidity, air-pressure and wind
speed. Furthermore onboard RV EMB several meteorological sensors at different heights were placed. Next
to the right of RV EMB the air-sea interaction buoy can be identified which carries sensors for sea-
temperature, air-temperature, wind-speed, pressure and others. Another buoy shown most left of Fig. 3 was
the meteo-buoy also covering meteorological sensors at different heights.
7
All of the sensor data has been carefully processed and displayed to get the best possible overall picture of
the actual environmental conditions. It was further possible to collect time series of the sensor data in order
to study the temporal variability during daytime and over the entire period of the campaign. Due to the vast
amount of measurement data only a subset of measurements is shown in this contribution which should
however provide a representative subset of samples of the measurement results that will be shown in more
detail in following sections.
Fig. 3. Sketch of the measurement set-up showing the overall scenario including the radar position at the Island of Sylt termed
“Bunker Hill”, the RV EMB as well as the air-sea interaction buoy, the meteo buoy, the catamaran and the waverider buoy. Note
that the RV EMB was equipped with 4 tethersondes carried by a captive balloon, 4 corner reflectors and several meteorological
sensors at different heights.
B. Clutter Measurements
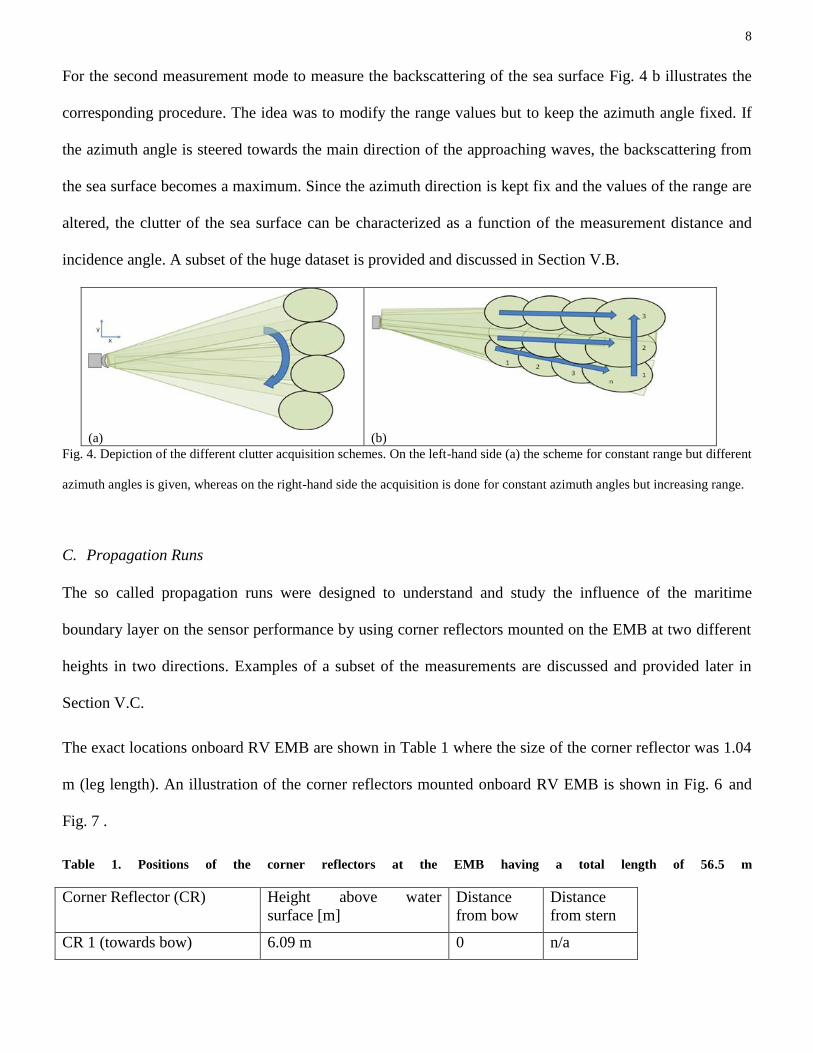
The clutter measurements under low grazing angles were performed in several configurations. The first
mode refers to the case where the measurements were carried out at constant range of the radar footprint
but at different azimuth angles. A typical configuration to measure sea clutter at constant range and varying
azimuth angle is shown in Fig. 4 a. The beam of the antenna is steered towards the sea surface at a constant
distance and will be changed in its azimuth position. This measurement scheme was chosen in order to
characterize the response of the sea surface as a function of the azimuth angle.
8
For the second measurement mode to measure the backscattering of the sea surface Fig. 4 b illustrates the
corresponding procedure. The idea was to modify the range values but to keep the azimuth angle fixed. If
the azimuth angle is steered towards the main direction of the approaching waves, the backscattering from
the sea surface becomes a maximum. Since the azimuth direction is kept fix and the values of the range are
altered, the clutter of the sea surface can be characterized as a function of the measurement distance and
incidence angle. A subset of the huge dataset is provided and discussed in Section V.B.
(a)
(b)
Fig. 4. Depiction of the different clutter acquisition schemes. On the left-hand side (a) the scheme for constant range but different
azimuth angles is given, whereas on the right-hand side the acquisition is done for constant azimuth angles but increasing range.
C. Propagation Runs
The so called propagation runs were designed to understand and study the influence of the maritime
boundary layer on the sensor performance by using corner reflectors mounted on the EMB at two different
heights in two directions. Examples of a subset of the measurements are discussed and provided later in
Section V.C.
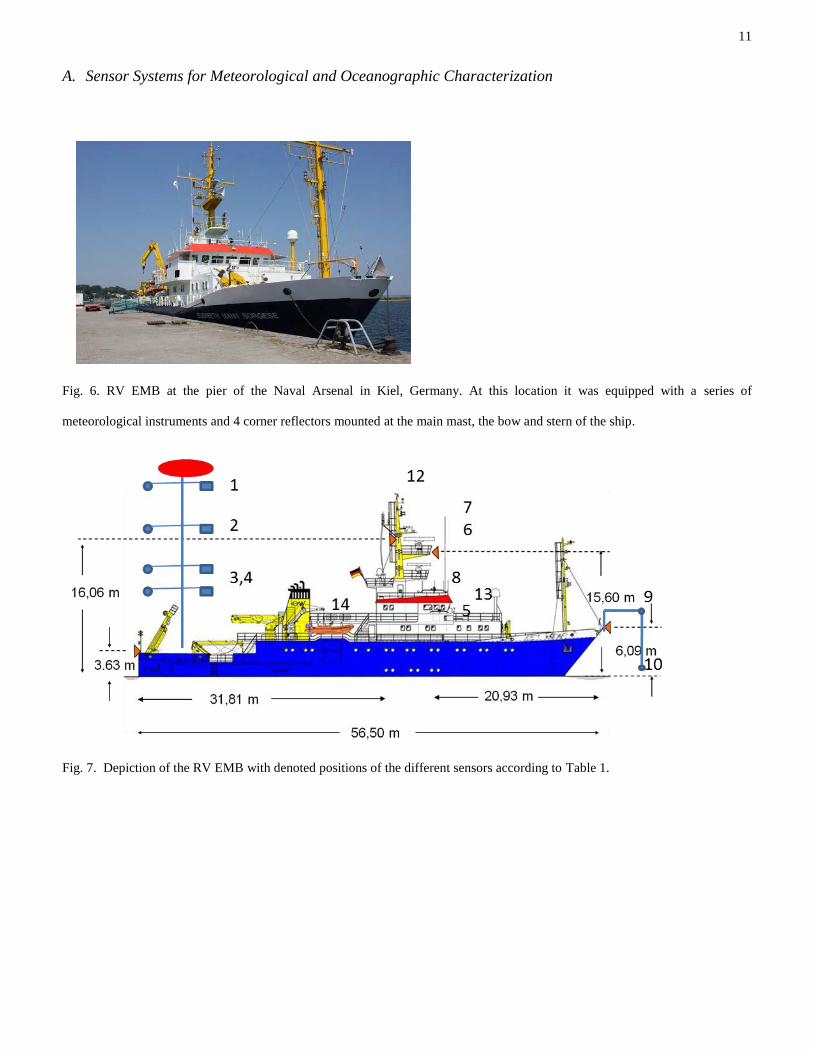
The exact locations onboard RV EMB are shown in Table 1 where the size of the corner reflector was 1.04
m (leg length). An illustration of the corner reflectors mounted onboard RV EMB is shown in Fig. 6 and
Fig. 7 .
Table 1. Positions of the corner reflectors at the EMB having a total length of 56.5 m
Corner Reflector (CR) Height above water
surface [m]
Distance
from bow
Distance
from stern
CR 1 (towards bow) 6.09 m 0 n/a
9
CR 2 (towards bow) 15.6 m 20.93 m n/a
CR 3 (towards stern) 16.06 m n/a 31.81 m
CR 4 (towards stern) 3.63 m n/a 0
III. MAIN CHARACTERISTICS OF THE MEMPHIS SYSTEM
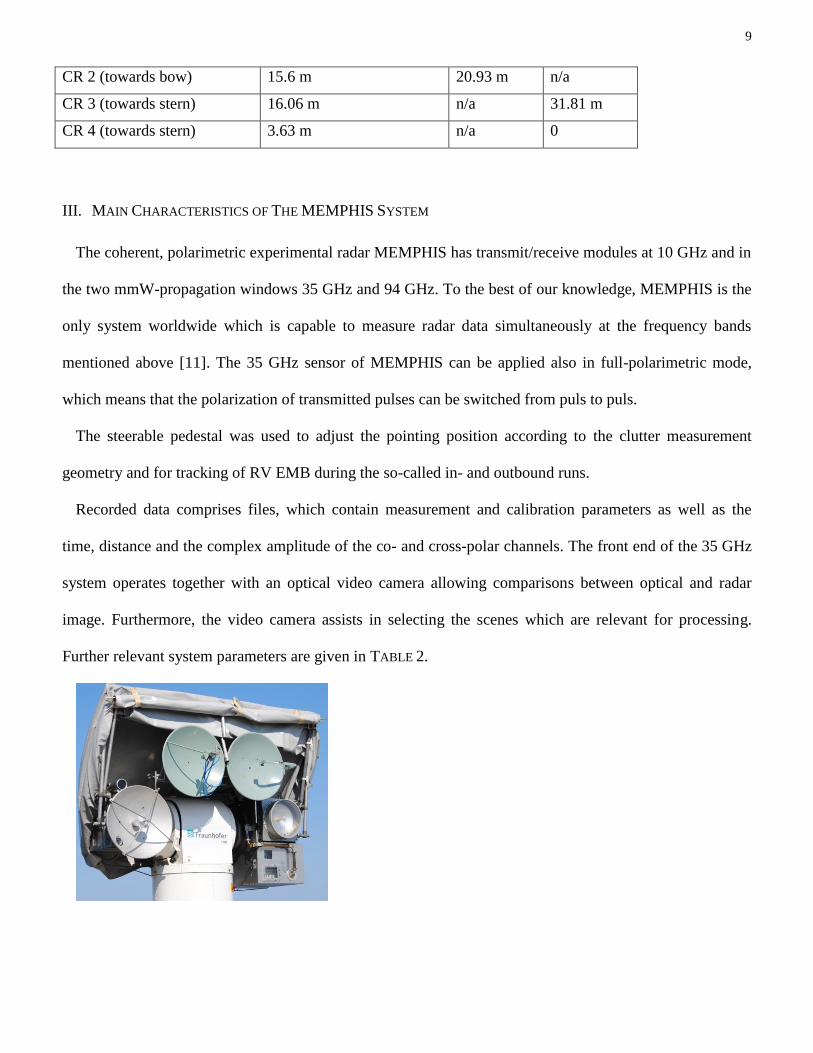
The coherent, polarimetric experimental radar MEMPHIS has transmit/receive modules at 10 GHz and in
the two mmW-propagation windows 35 GHz and 94 GHz. To the best of our knowledge, MEMPHIS is the
only system worldwide which is capable to measure radar data simultaneously at the frequency bands
mentioned above [11]. The 35 GHz sensor of MEMPHIS can be applied also in full-polarimetric mode,
which means that the polarization of transmitted pulses can be switched from puls to puls.
The steerable pedestal was used to adjust the pointing position according to the clutter measurement
geometry and for tracking of RV EMB during the so-called in- and outbound runs.
Recorded data comprises files, which contain measurement and calibration parameters as well as the
time, distance and the complex amplitude of the co- and cross-polar channels. The front end of the 35 GHz
system operates together with an optical video camera allowing comparisons between optical and radar
image. Furthermore, the video camera assists in selecting the scenes which are relevant for processing.
Further relevant system parameters are given in TABLE 2.
10
Fig. 5. Depiction of the Memphis front-end mounted on a steerable pedestal. The antenna on the left-hand side belongs to the Ka-
band system, the smallest antenna on the right hand side to the W-band. The two antennas in between are the quasi-monostatic
X-band dishes for transmitting (right) and receiving (left).
TABLE 2 MAIN SYSTEM PARAMETERS OF MEMPHIS
X-Band Ka-Band W-Band
Transmitter 9.6 GHz 35 GHz 94 GHz
Power 1500 W 700 W 500 W
PRF 2 kHz
Pulse Width 400 / 800 ns
Spectral Purity >70 dBc/Hz
Phase Stability 10° RMS
Polarization Linear or circular, H/V or L/R
switchable from Pulse to Pulse
Waveform Chirp (100/200 Hz) + stepped
Frequency BW 800 MHz
Receiver
Dynamic 60 dB
Noise Figure 15 dB (SSB)
Polarization Co and cross
Bandwidth 100 / 200 MHz
Channels 2 4
Antenna
Diameter 2 x 60 cm 60 cm 30 cm
IV. METEOROLOGICAL AND OCEANOGRAPHIC CHARACTERIZATION
In the marine boundary layer, air-sea interaction processes have an important impact on radar
propagation. The range performance near the sea surface depends on meteorological and sea surface
conditions whereas strong gradients of humidity and temperature close to the air-water interface are most
often the reason for propagation effects such as ducting. For ship borne radars the evaporation duct is the
dominant propagation mechanism affecting the maximum detection range. Ducting can also increase sea
clutter return within and beyond the geometric horizon [12][10]. Duct characteristics (duct heights, duct
structures, duct formation behavior, duct existence, duct vertical and horizontal variability) depend on
climatic zones and regional peculiarities.
11
A. Sensor Systems for Meteorological and Oceanographic Characterization
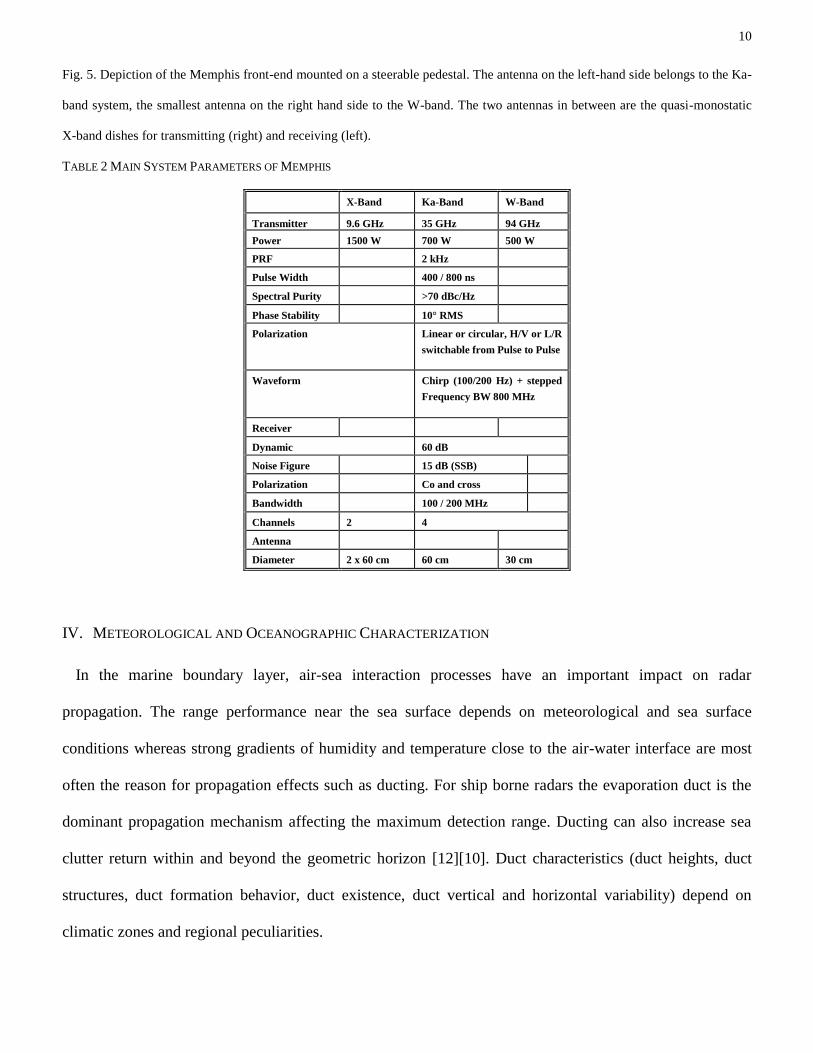
Fig. 6. RV EMB at the pier of the Naval Arsenal in Kiel, Germany. At this location it was equipped with a series of
meteorological instruments and 4 corner reflectors mounted at the main mast, the bow and stern of the ship.
Fig. 7. Depiction of the RV EMB with denoted positions of the different sensors according to Table 1.
12
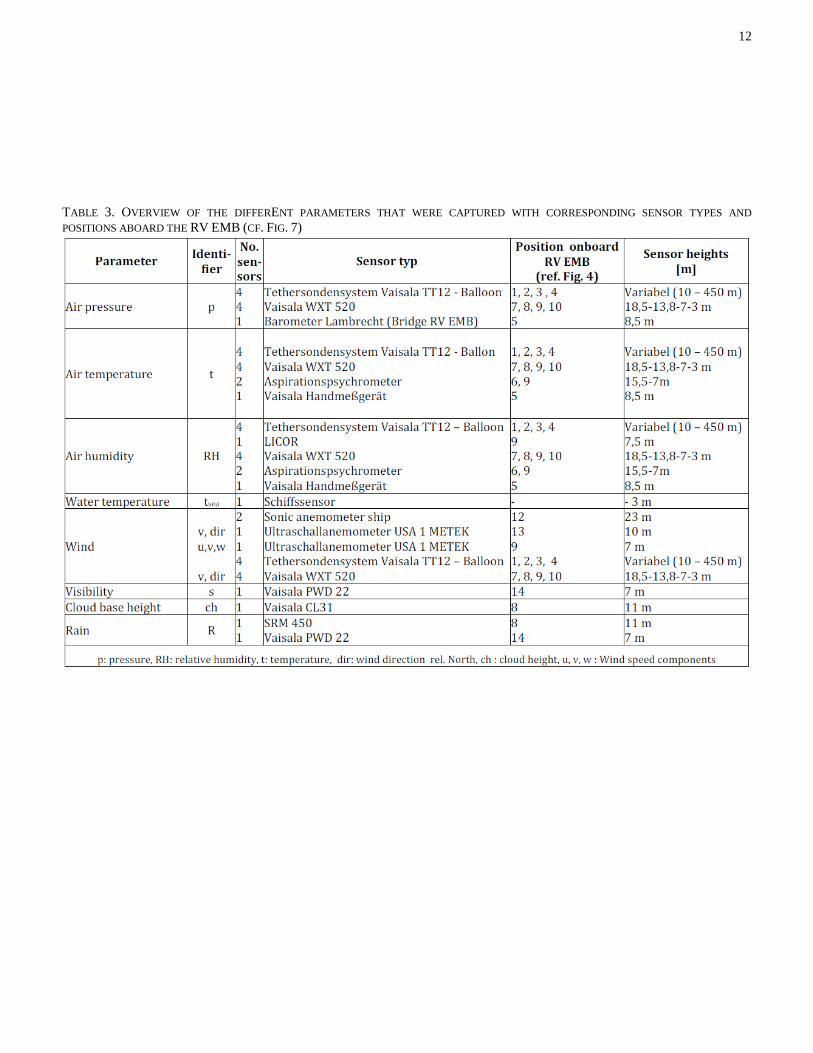
TABLE 3. OVERVIEW OF THE DIFFERENT PARAMETERS THAT WERE CAPTURED WITH CORRESPONDING SENSOR TYPES AND
POSITIONS ABOARD THE RV EMB (CF. FIG. 7)
13
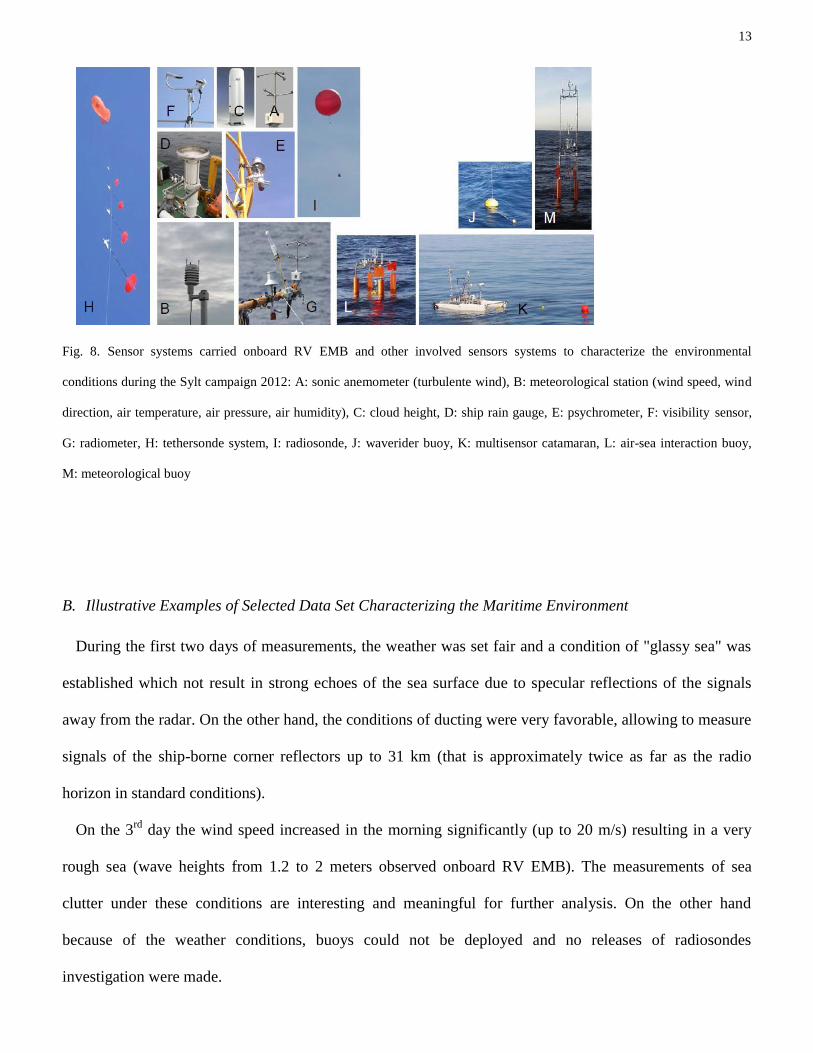
Fig. 8. Sensor systems carried onboard RV EMB and other involved sensors systems to characterize the environmental
conditions during the Sylt campaign 2012: A: sonic anemometer (turbulente wind), B: meteorological station (wind speed, wind
direction, air temperature, air pressure, air humidity), C: cloud height, D: ship rain gauge, E: psychrometer, F: visibility sensor,
G: radiometer, H: tethersonde system, I: radiosonde, J: waverider buoy, K: multisensor catamaran, L: air-sea interaction buoy,
M: meteorological buoy
B. Illustrative Examples of Selected Data Set Characterizing the Maritime Environment
During the first two days of measurements, the weather was set fair and a condition of "glassy sea" was
established which not result in strong echoes of the sea surface due to specular reflections of the signals
away from the radar. On the other hand, the conditions of ducting were very favorable, allowing to measure
signals of the ship-borne corner reflectors up to 31 km (that is approximately twice as far as the radio
horizon in standard conditions).
On the 3rd
day the wind speed increased in the morning significantly (up to 20 m/s) resulting in a very
rough sea (wave heights from 1.2 to 2 meters observed onboard RV EMB). The measurements of sea
clutter under these conditions are interesting and meaningful for further analysis. On the other hand
because of the weather conditions, buoys could not be deployed and no releases of radiosondes
investigation were made.
14
The change of the wind conditions in the middle of the campaign allowed obtaining interesting
conditions. At the beginning of the week ducting conditions prevailed and for the following days the
measurements of sea clutter was possible. On the third day, the characterization of the maritime boundary
layer was only possible by using ship sensors. Sea surface conditions were measured with the waverider
buoy.
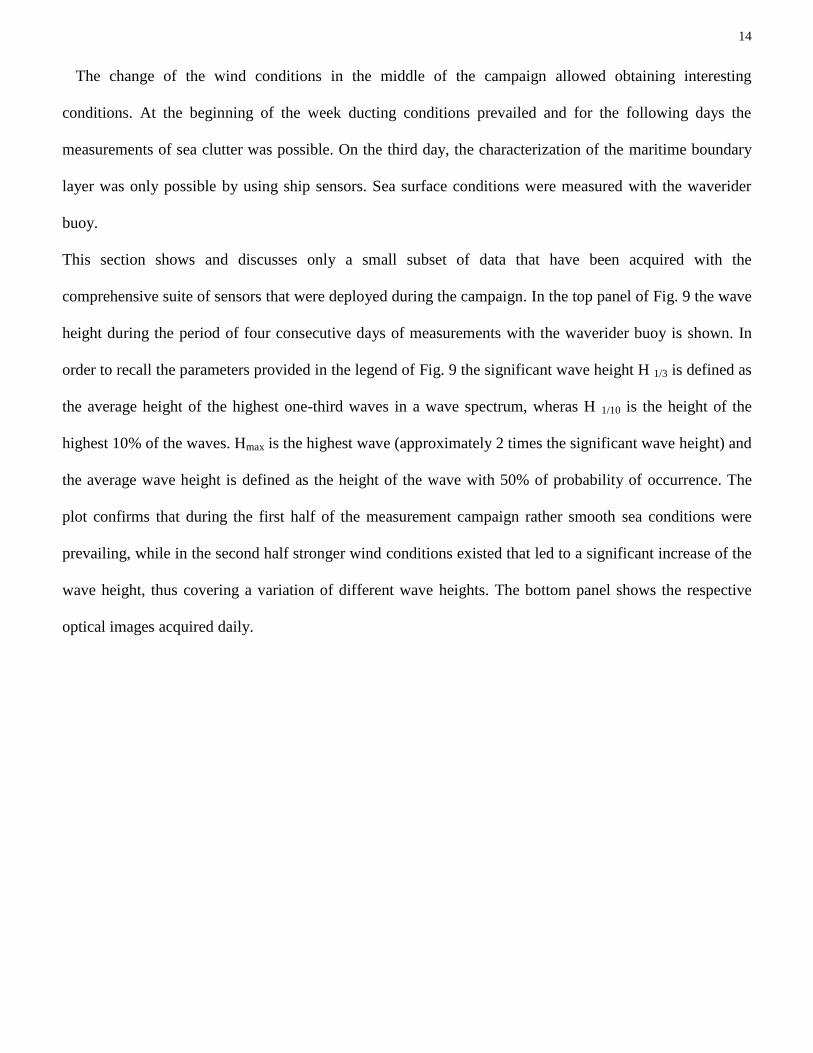
This section shows and discusses only a small subset of data that have been acquired with the
comprehensive suite of sensors that were deployed during the campaign. In the top panel of Fig. 9 the wave
height during the period of four consecutive days of measurements with the waverider buoy is shown. In
order to recall the parameters provided in the legend of Fig. 9 the significant wave height H 1/3 is defined as
the average height of the highest one-third waves in a wave spectrum, wheras H 1/10 is the height of the
highest 10% of the waves. Hmax is the highest wave (approximately 2 times the significant wave height) and
the average wave height is defined as the height of the wave with 50% of probability of occurrence. The
plot confirms that during the first half of the measurement campaign rather smooth sea conditions were
prevailing, while in the second half stronger wind conditions existed that led to a significant increase of the
wave height, thus covering a variation of different wave heights. The bottom panel shows the respective
optical images acquired daily.
15
Fig. 9. Top panel: depiction of the measurements by the waverider buoy during the campaign period starting from 26th
of May
until 31st of May. The plot confirms that during the first part of the campaign smooth conditions were prevailing whereas in the
second part the wave heights increased. Such variety is particularly very interesting in order to study the effects due to the
changes within the maritime environment. The lower panel shows corresponding photos of the sea surface for the different days
for visual impression.
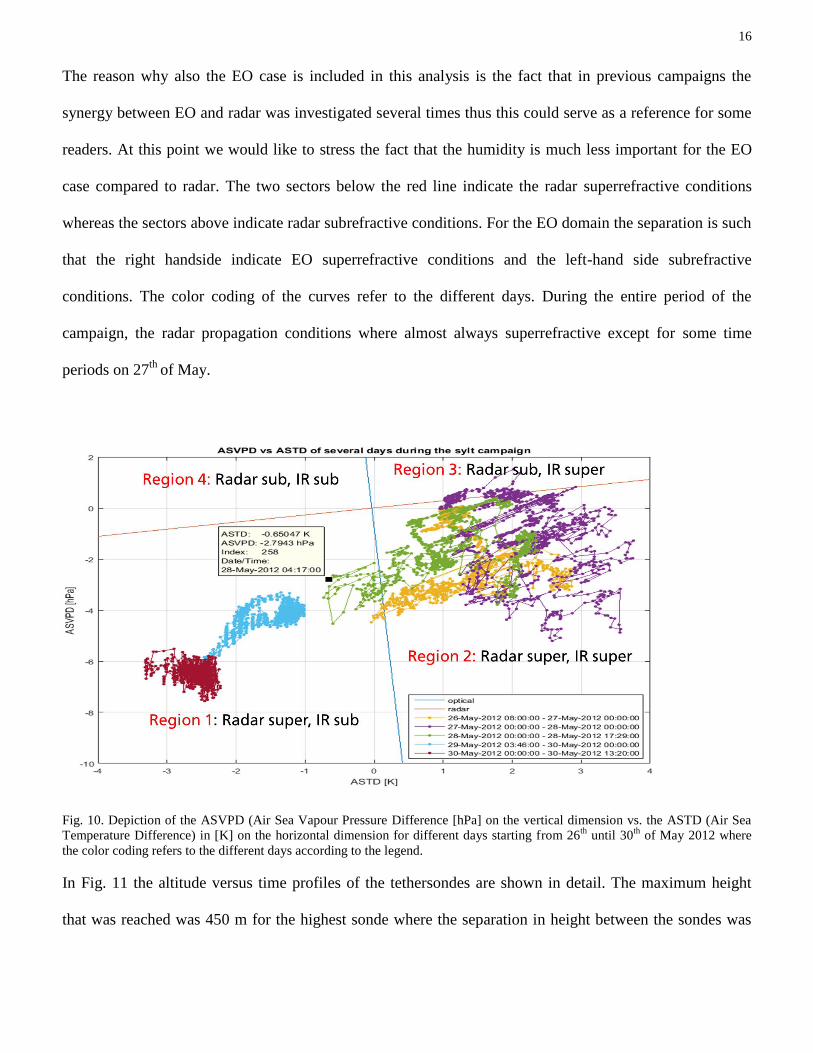
An interesting type of plot is given in Fig. 10 which displays the air to sea temperature difference (ASTD)
in Kelvin at the horizontal axes versus the air sea vapor pressure difference (ASVPD) in [hPa] on the
vertical [13].
This graphical illustration is used to characterize the overall propagation conditions in terms of Radar and
EO (Electrooptical) sub-/superrefraction conditions. The term subrefraction refers to the case where the
detection of Radar/EO systems is less than standard. However if superrefraction conditions prevail the
radar or EO system may exceed the detection ranges compared to standard conditions. For the radar case
the detection of objects far beyond the optical horizon might become feasible which was confirmed during
earlier campaigns.
16
The reason why also the EO case is included in this analysis is the fact that in previous campaigns the
synergy between EO and radar was investigated several times thus this could serve as a reference for some
readers. At this point we would like to stress the fact that the humidity is much less important for the EO
case compared to radar. The two sectors below the red line indicate the radar superrefractive conditions
whereas the sectors above indicate radar subrefractive conditions. For the EO domain the separation is such
that the right handside indicate EO superrefractive conditions and the left-hand side subrefractive
conditions. The color coding of the curves refer to the different days. During the entire period of the
campaign, the radar propagation conditions where almost always superrefractive except for some time
periods on 27th
of May.
Fig. 10. Depiction of the ASVPD (Air Sea Vapour Pressure Difference [hPa] on the vertical dimension vs. the ASTD (Air Sea
Temperature Difference) in [K] on the horizontal dimension for different days starting from 26th
until 30th
of May 2012 where
the color coding refers to the different days according to the legend.
In Fig. 11 the altitude versus time profiles of the tethersondes are shown in detail. The maximum height
that was reached was 450 m for the highest sonde where the separation in height between the sondes was
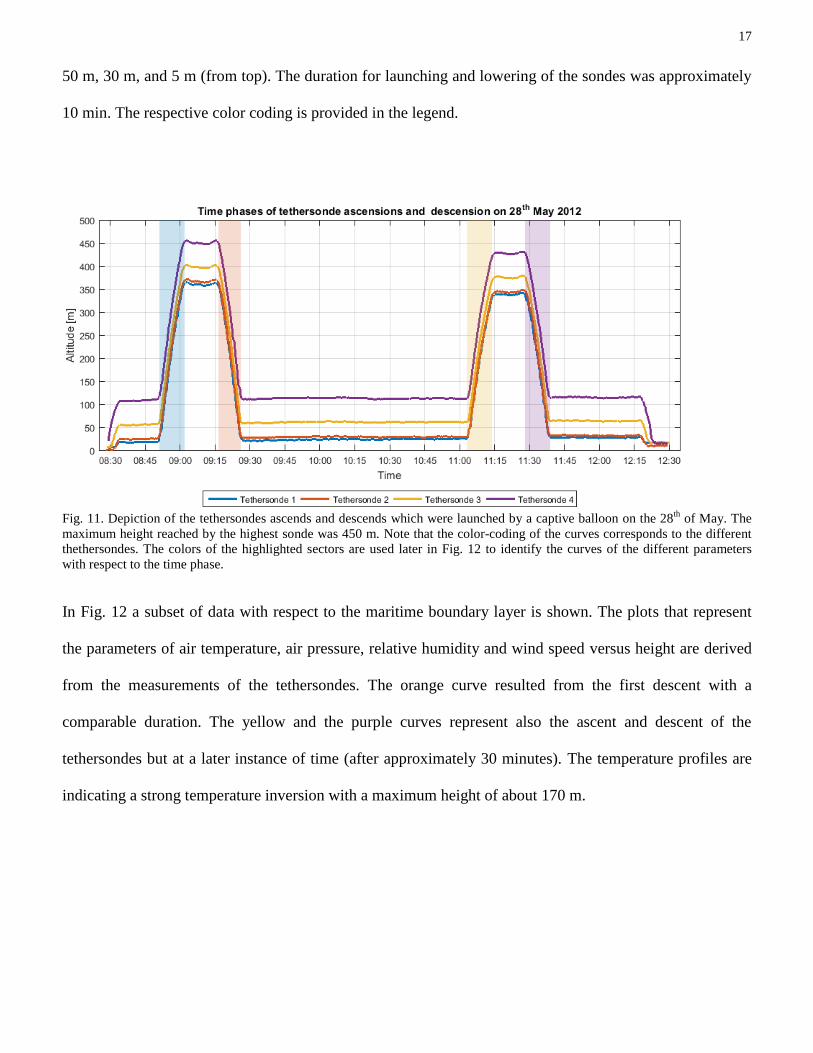
17
50 m, 30 m, and 5 m (from top). The duration for launching and lowering of the sondes was approximately
10 min. The respective color coding is provided in the legend.
Fig. 11. Depiction of the tethersondes ascends and descends which were launched by a captive balloon on the 28
th of May. The
maximum height reached by the highest sonde was 450 m. Note that the color-coding of the curves corresponds to the different
thethersondes. The colors of the highlighted sectors are used later in Fig. 12 to identify the curves of the different parameters
with respect to the time phase.
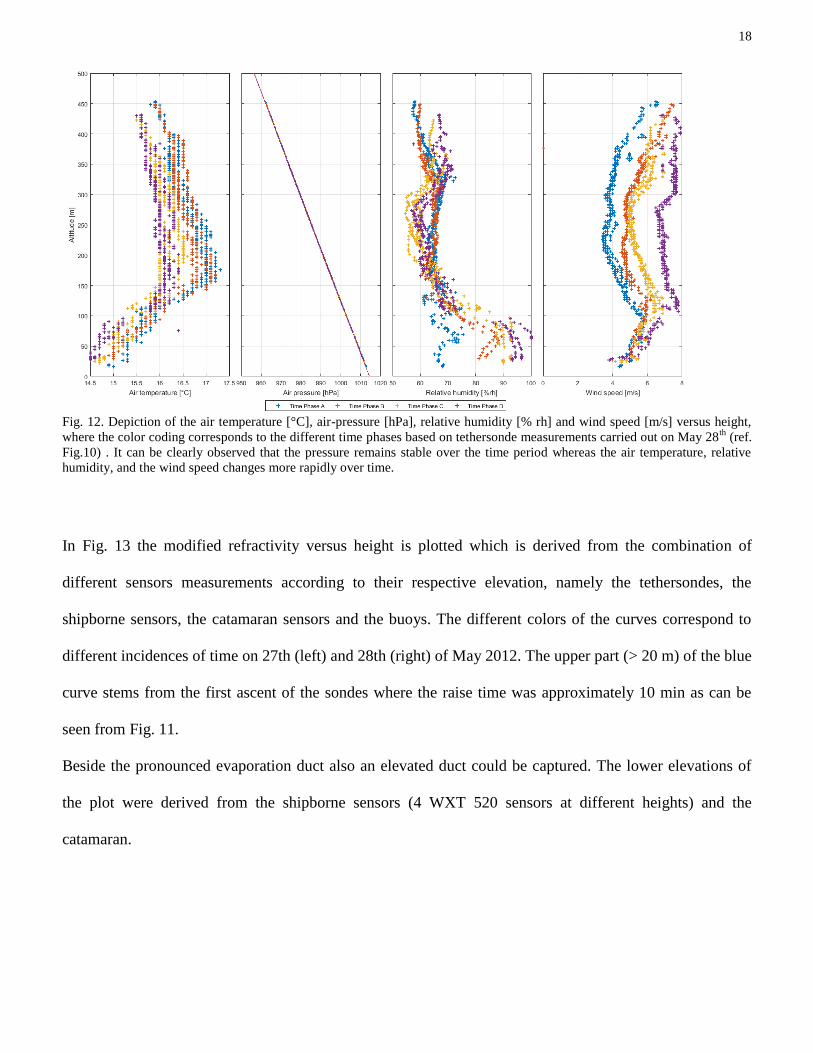
In Fig. 12 a subset of data with respect to the maritime boundary layer is shown. The plots that represent
the parameters of air temperature, air pressure, relative humidity and wind speed versus height are derived
from the measurements of the tethersondes. The orange curve resulted from the first descent with a
comparable duration. The yellow and the purple curves represent also the ascent and descent of the
tethersondes but at a later instance of time (after approximately 30 minutes). The temperature profiles are
indicating a strong temperature inversion with a maximum height of about 170 m.
18
Fig. 12. Depiction of the air temperature [°C], air-pressure [hPa], relative humidity [% rh] and wind speed [m/s] versus height,
where the color coding corresponds to the different time phases based on tethersonde measurements carried out on May 28th
(ref.
Fig.10) . It can be clearly observed that the pressure remains stable over the time period whereas the air temperature, relative
humidity, and the wind speed changes more rapidly over time.
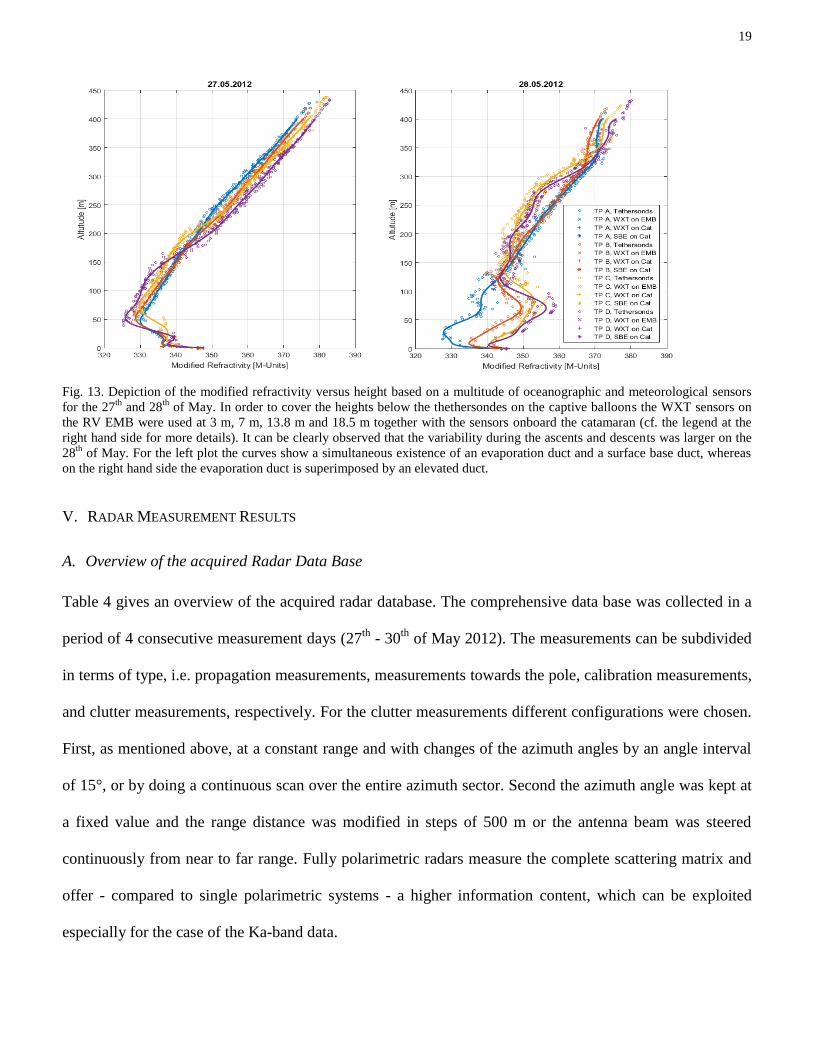
In Fig. 13 the modified refractivity versus height is plotted which is derived from the combination of
different sensors measurements according to their respective elevation, namely the tethersondes, the
shipborne sensors, the catamaran sensors and the buoys. The different colors of the curves correspond to
different incidences of time on 27th (left) and 28th (right) of May 2012. The upper part (> 20 m) of the blue
curve stems from the first ascent of the sondes where the raise time was approximately 10 min as can be
seen from Fig. 11.
Beside the pronounced evaporation duct also an elevated duct could be captured. The lower elevations of
the plot were derived from the shipborne sensors (4 WXT 520 sensors at different heights) and the
catamaran.
19
Fig. 13. Depiction of the modified refractivity versus height based on a multitude of oceanographic and meteorological sensors
for the 27th
and 28th
of May. In order to cover the heights below the thethersondes on the captive balloons the WXT sensors on
the RV EMB were used at 3 m, 7 m, 13.8 m and 18.5 m together with the sensors onboard the catamaran (cf. the legend at the
right hand side for more details). It can be clearly observed that the variability during the ascents and descents was larger on the
28th
of May. For the left plot the curves show a simultaneous existence of an evaporation duct and a surface base duct, whereas
on the right hand side the evaporation duct is superimposed by an elevated duct.
V. RADAR MEASUREMENT RESULTS
A. Overview of the acquired Radar Data Base
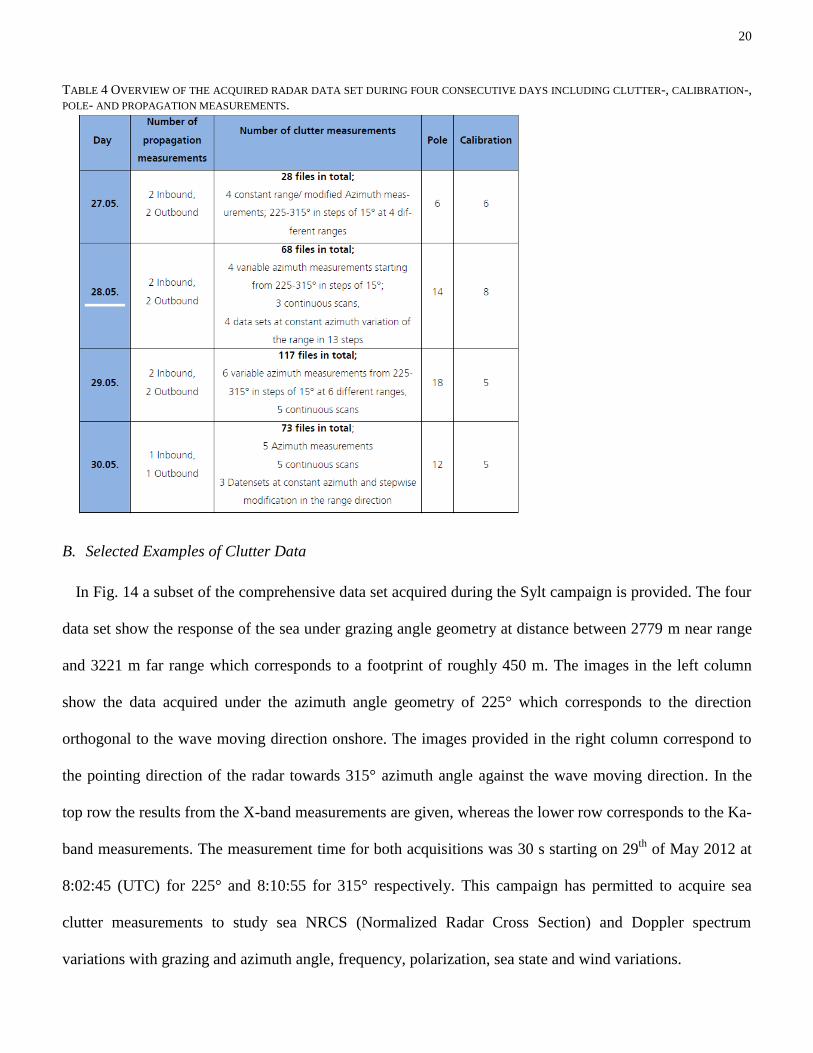
Table 4 gives an overview of the acquired radar database. The comprehensive data base was collected in a
period of 4 consecutive measurement days (27th
- 30th
of May 2012). The measurements can be subdivided
in terms of type, i.e. propagation measurements, measurements towards the pole, calibration measurements,
and clutter measurements, respectively. For the clutter measurements different configurations were chosen.
First, as mentioned above, at a constant range and with changes of the azimuth angles by an angle interval
of 15°, or by doing a continuous scan over the entire azimuth sector. Second the azimuth angle was kept at
a fixed value and the range distance was modified in steps of 500 m or the antenna beam was steered
continuously from near to far range. Fully polarimetric radars measure the complete scattering matrix and
offer - compared to single polarimetric systems - a higher information content, which can be exploited
especially for the case of the Ka-band data.
20
TABLE 4 OVERVIEW OF THE ACQUIRED RADAR DATA SET DURING FOUR CONSECUTIVE DAYS INCLUDING CLUTTER-, CALIBRATION-,
POLE- AND PROPAGATION MEASUREMENTS.
B. Selected Examples of Clutter Data
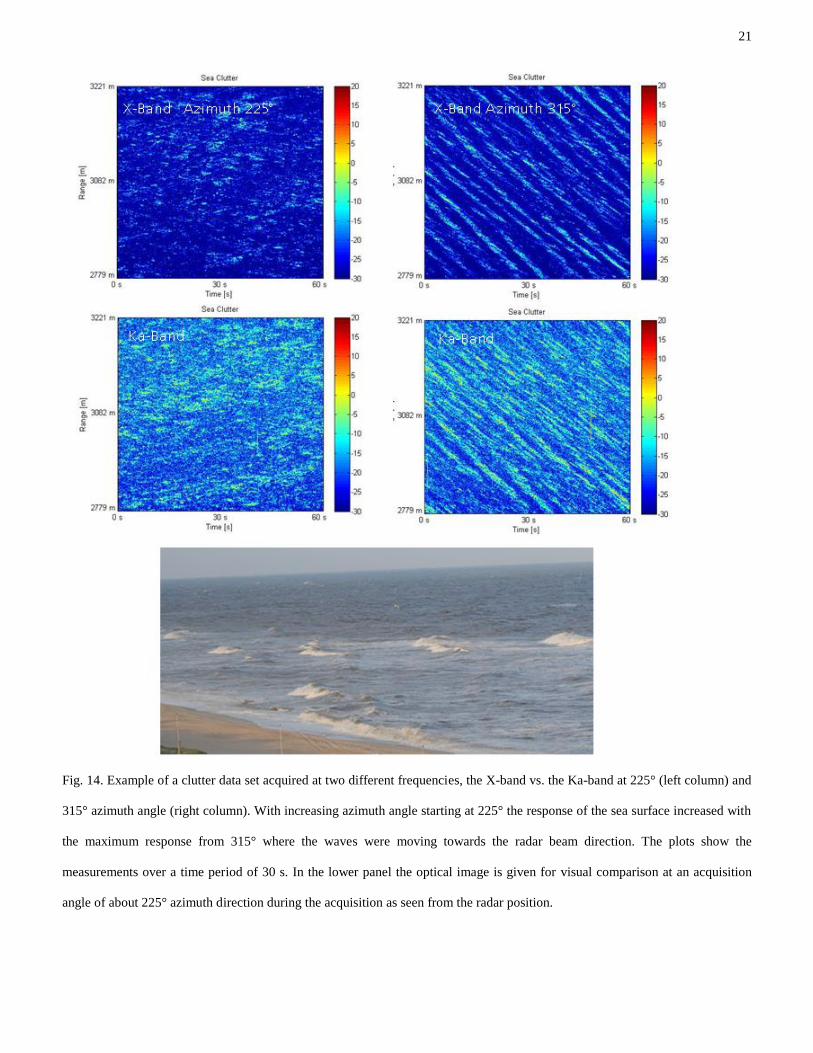
In Fig. 14 a subset of the comprehensive data set acquired during the Sylt campaign is provided. The four
data set show the response of the sea under grazing angle geometry at distance between 2779 m near range
and 3221 m far range which corresponds to a footprint of roughly 450 m. The images in the left column
show the data acquired under the azimuth angle geometry of 225° which corresponds to the direction
orthogonal to the wave moving direction onshore. The images provided in the right column correspond to
the pointing direction of the radar towards 315° azimuth angle against the wave moving direction. In the
top row the results from the X-band measurements are given, whereas the lower row corresponds to the Ka-
band measurements. The measurement time for both acquisitions was 30 s starting on 29th
of May 2012 at
8:02:45 (UTC) for 225° and 8:10:55 for 315° respectively. This campaign has permitted to acquire sea
clutter measurements to study sea NRCS (Normalized Radar Cross Section) and Doppler spectrum
variations with grazing and azimuth angle, frequency, polarization, sea state and wind variations.
21
Fig. 14. Example of a clutter data set acquired at two different frequencies, the X-band vs. the Ka-band at 225° (left column) and
315° azimuth angle (right column). With increasing azimuth angle starting at 225° the response of the sea surface increased with
the maximum response from 315° where the waves were moving towards the radar beam direction. The plots show the
measurements over a time period of 30 s. In the lower panel the optical image is given for visual comparison at an acquisition
angle of about 225° azimuth direction during the acquisition as seen from the radar position.
22
C. Selected Data of the Propagation Runs
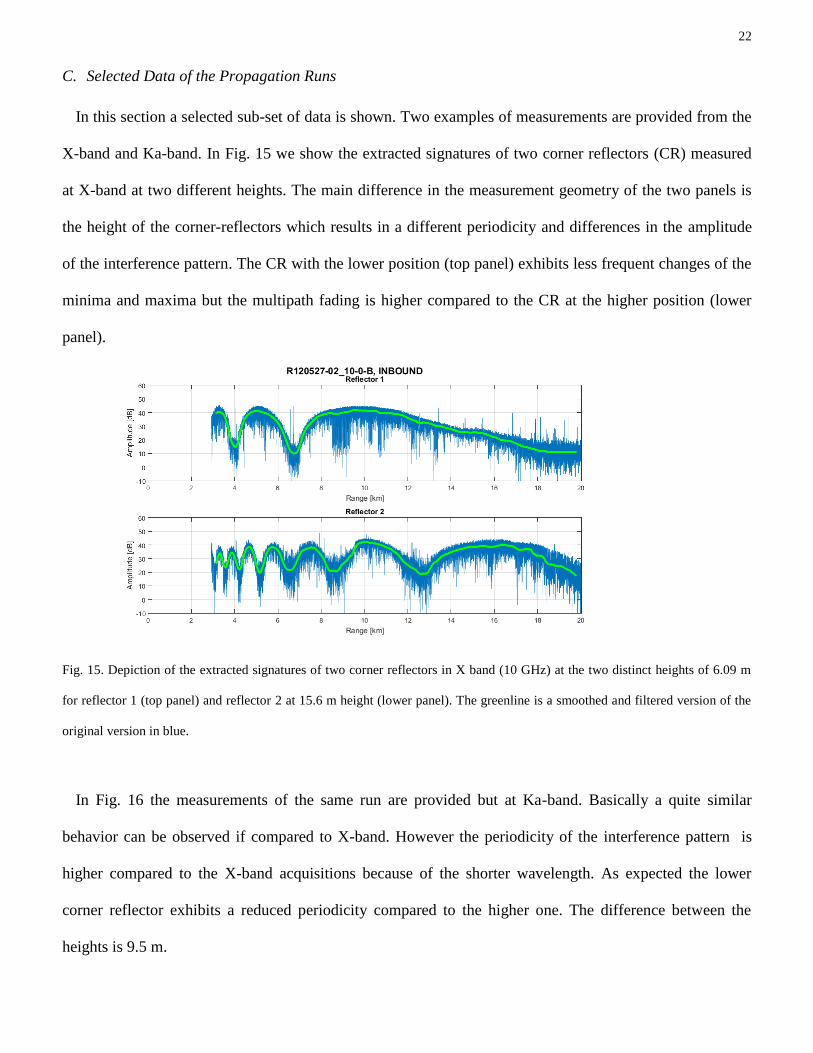
In this section a selected sub-set of data is shown. Two examples of measurements are provided from the
X-band and Ka-band. In Fig. 15 we show the extracted signatures of two corner reflectors (CR) measured
at X-band at two different heights. The main difference in the measurement geometry of the two panels is
the height of the corner-reflectors which results in a different periodicity and differences in the amplitude
of the interference pattern. The CR with the lower position (top panel) exhibits less frequent changes of the
minima and maxima but the multipath fading is higher compared to the CR at the higher position (lower
panel).
Fig. 15. Depiction of the extracted signatures of two corner reflectors in X band (10 GHz) at the two distinct heights of 6.09 m
for reflector 1 (top panel) and reflector 2 at 15.6 m height (lower panel). The greenline is a smoothed and filtered version of the
original version in blue.
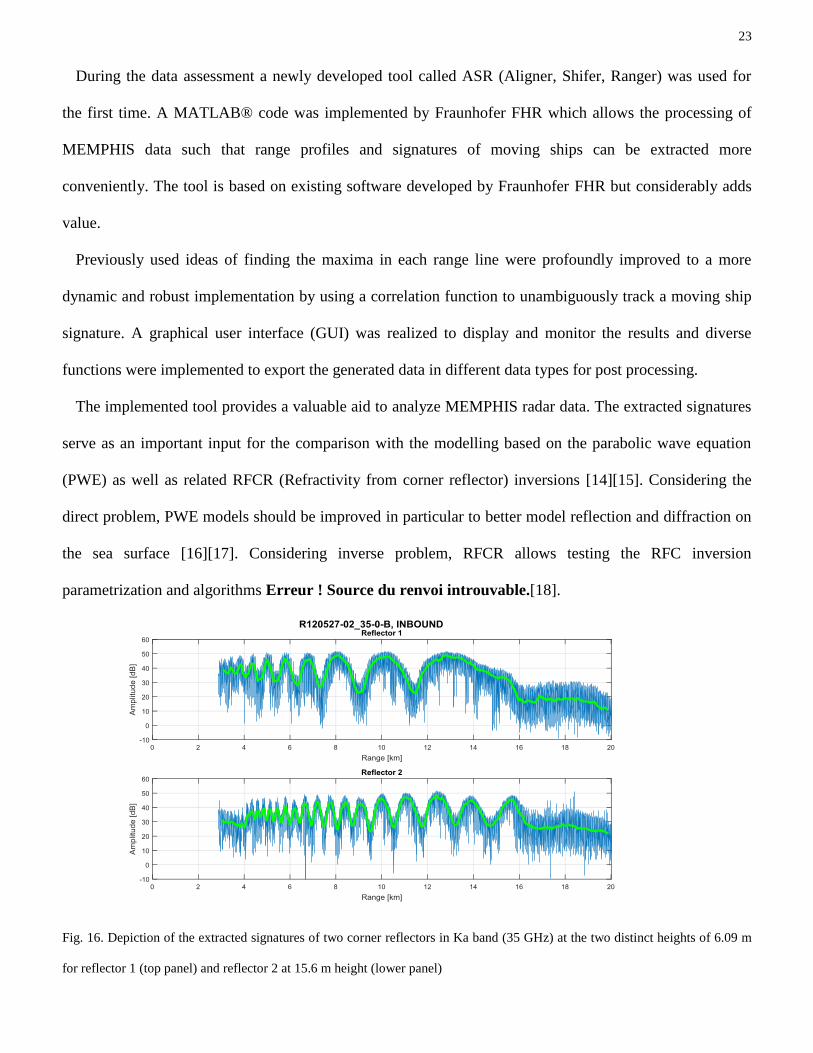
In Fig. 16 the measurements of the same run are provided but at Ka-band. Basically a quite similar
behavior can be observed if compared to X-band. However the periodicity of the interference pattern is
higher compared to the X-band acquisitions because of the shorter wavelength. As expected the lower
corner reflector exhibits a reduced periodicity compared to the higher one. The difference between the
heights is 9.5 m.
23
During the data assessment a newly developed tool called ASR (Aligner, Shifer, Ranger) was used for
the first time. A MATLAB® code was implemented by Fraunhofer FHR which allows the processing of
MEMPHIS data such that range profiles and signatures of moving ships can be extracted more
conveniently. The tool is based on existing software developed by Fraunhofer FHR but considerably adds
value.
Previously used ideas of finding the maxima in each range line were profoundly improved to a more
dynamic and robust implementation by using a correlation function to unambiguously track a moving ship
signature. A graphical user interface (GUI) was realized to display and monitor the results and diverse
functions were implemented to export the generated data in different data types for post processing.
The implemented tool provides a valuable aid to analyze MEMPHIS radar data. The extracted signatures
serve as an important input for the comparison with the modelling based on the parabolic wave equation
(PWE) as well as related RFCR (Refractivity from corner reflector) inversions [14][15]. Considering the
direct problem, PWE models should be improved in particular to better model reflection and diffraction on
the sea surface [16][17]. Considering inverse problem, RFCR allows testing the RFC inversion
parametrization and algorithms Erreur ! Source du renvoi introuvable.[18].
Fig. 16. Depiction of the extracted signatures of two corner reflectors in Ka band (35 GHz) at the two distinct heights of 6.09 m
for reflector 1 (top panel) and reflector 2 at 15.6 m height (lower panel)
24
VI. CONCLUSIONS
A valuable and complete dataset was successfully acquired during the campaign performed in the North
Sea region at the island of Sylt. Not only a variety of radar measurements were carried out including clutter
measurements and propagation measurements but also the sophisticated characterization of the tropospheric
parameters in the maritime layer was performed including the complex oceanographic characterization.
Next to the overall description of the campaign many illustrative examples of measurements have been
provided. This includes examples for the characterization of the atmosphere and the oceanographic
conditions. Furthermore examples of sea clutter data were provided at different frequencies and incidence
angles. For the study of propagation effects some examples of measurements at inbound and outbound runs
were shown in comparison for two different corner-reflector heights and at two different frequency bands:
X-band and Ka-band. The expected behavior of multipath due to constructive and destructive interference
was confirmed, thanks to an improved strategy and implementation of the extraction of signatures of single
corner reflectors installed at different heights and in different directions onboard RV EMB. The current
results already provide plentiful evidence of the suitability of the chosen experimental approach. In a future
contribution it is planned to focus on the in-depth scientific analysis of the sea clutter and to address further
the modelling aspect by using a model based on the parabolic wave equation [20][21] with the respective
concurrent meteorological input parameters. Possible topics of in-depth analysis could be to compare the
outputs of different evaporation duct models with the measured profiles as well as to compare refractivity
profiles computed by a Numerical Weather Prediction (NWP) model. Furthermore the RFC technique
could be possibly applied to the in- and outbound runs and compared with the meteorological
measurements. Finally the clutter data could be used to validate clutter models such as the GIT model. All
of the ideas above are possible candidates for further research but additional time and efforts respectively
funding is needed to make progress towards this endeavor.
25
ACKNOWLEDGEMENT
The measurement campaign was carried out as a part of and within the frame of a German French
Technical Agreement TA-119 “Modelling and measurements of sea clutter at centimeter and millimeter
bands; application to atmospheric refractivity assessment”, involving Fraunhofer FHR, WTD 71, DGA-MI,
and ONERA.
REFERENCES
[1] A. Danklmayer, G. Biegel, T. Brehm, S. Sieger and J. Förster, "Millimeter wave propagation above
the sea surface during the Squirrel campaign," 2015 16th International Radar Symposium (IRS),
Dresden, 2015, pp. 300-304. doi: 10.1109/IRS.2015.7226386
[2] H. Essen, H. H. Fuchs, “Two-way propagation within the marine boundary layer at X-, Ka- and W-
band,” in Proc. of European Conference on Propagation and Systems ECPS, 2005, vol. 15, 15 -18
March 2005, Brest, France
[3] A. Danklmayer, S. Sieger, “Propagation Experiment in the littoral at 94 GHz”, Proceedings of the
IEEE International Symposium on Antennas and Propagation and North American Radio Science
Meeting, Vancouver, BC, Canada, 2015
[4] H. Essen, H.-H. Fuchs, "Microwave and Millimeterwave propagation within Marine Boundary
Layers”, Proceedings of German Microwave Conference (GeMIC) 2006, Germany
[5] A. Danklmayer, T. Brehm, G. Biegel, J. Förster, “Multi-frequency propagation measurements over a
horizontal path above the sea surface in the Baltic Sea”, Proceedings of EUCAP 2013, Gothenberg,
Sweden
[6] A. Danklmayer, J. Förster, P. Colditz, G. Biegel, T. Brehm, “North Sea Millimeterwave Propagation
Experiment: The Sylt campaign”, Proceedings of the International Radar Conference (IRS) 2016,
Krakow, Poland
26
[7] A. Danklmayer, J. Förster, P. Colditz, G. Biegel, and Brehm, T., “Multi-frequency RF-Measurements
and Characterization of Propagation Conditions in the Maritime Boundary Layer”, Proceedings of the
AP-S/URSI International Symposion, San Juan, PR 2016
[8] B. B. Bean, and E. J. Dutton, 1968: Radio Meteorology. Dover Publications, 435 pp.
[9] Y. Hurtaud, & J. Claverie, (2015, June), “Geophysical Information Inputs for Computing the
Performance of EM Systems in Littoral Environments”, The Radio Science Bulletin No 353, pp. 10 -
16.
[10] I. M. Brooks, A. K. Goroch, and D. P. Rogers, 1999: “Observations of Strong Surface Radar Ducts
over the Persian Gulf”, J. Appl. Meteor. 38, 1293–1310, doi: 10.1175/1520-
0450(1999)038<1293:OOSSRD>2.0.CO;2.
[11] H. Schimpf, H. Essen, S. Böhmsdorff, and T. Brehm, “MEMPHIS – A Fully Polarimetric
Experimental Radar”, Proceedings of the IEEE International Geoscience and Remote Sensing
Symposium IGARSS, vol. 3, pp. 1714-1716, June 2002
[12] S. C. Lee, D. E. Maurer, & K. L. Musser (1988), “Predicting clutter during anomalous propagation
conditions”, Johns Hopkins APL Technical Digest, Volume 9, Number 2, pp. 101-109.
[13] J. L. Forand, A study into infrared search and track, Technical Report 2003-044, Defense R&D
Canada – Valcatier, DRDC, June 2002, Obtained via internet last visit on 2nd of August 2017,
http://cradpdf.drdc-rddc.gc.ca/PDFS/unc21/p519660.pdf
[14] H. Essen, A. Danklmayer, J. Förster, M. Behn, Y. Hurtaud, V. Fabbro, L. Castanet, “Joint French –
German Radar Measurements for the Determination of the Refractive Index in the Maritime Boundary
Layer”, Proc. SPIE 8535, Optics in Atmospheric Propagation and Adaptive Systems XV, 853505 (1
November 2012); doi: 10.1117/12.924793, 9 pages
[15] A. Danklmayer, H. Essen, G. Biegel, J. Förster, M. Behn, Y. Hurtaud, V. Fabbro, L. Castanet,
“Retrieval of the atmospheric propagation conditions over the sea surface based on sea clutter
27
measurements”, Proceedings of the International Geoscience and Remote Sensing Symposium
(IGARSS), Munich, Germany 2012
[16] R. Douvenot , V. Fabbro, P. Gerstoft, C. Bourlier, J. Saillard, “Real Time Refractivity from Clutter
Using a Best Fit Approach Improved with Physical Information,” RADIO SCIENCE, VOL. 45,
RS1007, doi:10.1029/2009RS004137, 2010
[17] R. Douvenot, V. Fabbro, and K. Elis, "Parameter-Based Rules for the Definition of Detectable Ducts
for an RFC System", IEEE Transactions on Antennas and Propagation, Vol. 62, No. 11, pp. 5696 -
5705, November 2014, doi: 10.1109/TAP.2014.2354680.
[18] V.Fabbro, M. Noblet, R. Lahaye, P. Nicolas, C. Bourlier,, "Propagation modeling using the Split Step
Fourier method: Ground boundary conditions analysis and acceleration by GPU," 2014 International
Radar Conference, Lille, 2014, pp. 1-6.
[19] V. Fabbro, C. Bourlier, P.F. Combes P, “Forward propagation modelling above rough surfaces by the
parabolic wave equation. Introduction of the shadowing effect,” Journal of Electromagnetic Waves
and Applications, Progress in Electromagnetic Research, Series Book vol. 58, pp 243-269, 2006.
[20] M. Levy, Parabolic Equation Methods for Electromagnetic Wave Propagation, IET 2000
[21] P. Zhang, L. Bai, Z. Wu, and L. Guo, “Applying the Parabolic Equation to Tropospheric Groundwave
Propagation, A review of recent achievements and significant milestones”, IEEE Antennas &
Propagation Magazine, June 2016, p. 31-44