Embed Size (px)
Citation preview

Radiation Carcinogenesis
Martin Brown

Two types of late effects of irradiation
• Deterministic (non-stochastic) effects– Severity increases with dose. There is a threshold.
Eg tissue fibrosis, cataracts.
– Mechanism involves effects (often cell kill) on many cells.
• Stochastic Effects– No threshold, probability increases with dose but
severity is independent of dose (eg cancer and genetic effects)

Both Marie Curie (the discoverer of radium) and her daughter Irene died of leukemia - probably due to their radiation exposures
It was known early after the discovery of radiation that it could cause cancer

Mutations produce Cancer
• H J Muller (1927) found that X-rays induce gene mutations in Drosophila (fruit flies) and that they do so linearly with dose.
“The effect of X-rays, in occasionally producing cancer, may also be associated with their action in producing mutations”.
• Bruce Ames. 1970’s: developed test in bacteria for potency of chemicals to cause mutations - these correlated with potency to cause cancer in rodents. Simple idea: mutagens = carcinogens.

Radiation induced cancers
• Spectrum of cancers is same as that occurring naturally.
• Severity of induced cancer is independent of dose.
• Probability of cancer induction increases with dose with no threshold.
• This is known as stochastic effect
• Mechanism is that cancer can arise from a single mutation in a single cell.

Risk Estimates for Radiation Induced Cancers
Information principally from…
• Occupationally Exposed: e.g., radium dial
painters, uranium miners, early x-ray users.
• Medically Exposed: e.g., ankylosing spondylitis,
tinea capitis, tuberculosis patients, children
irradiated for enlarged thymus
• Atomic Bomb Exposed: e.g., Hiroshima and
Nagasaki survivors.

Occupational exposure: Bone cancer developed in the “radium dial painters”

Thyroid cancer development in individuals given X-irradiation for enlarged thymus in childhood

Hiroshima immediately after the bomb

Hiroshima chamber of Commerce- before 1945

The A-bomb dome today
Latent Periods
• For leukemias: Rise started 2 yrs after bomb and reached peak 7-12 yrs after bomb. Most cases observed by 15 yrs
• Solid Cancers: Excess risk started about 10 years after bomb, excess still continues 60 years after bomb. Thyroid cancer in children has shorter latent period of ~5 yrs.

Breast cancer in A-bomb survivors 1958-1998
Preston et al, Rad Res.168 1-64,2007

Breast cancer in various irradiated populations
Relative vs Absolute Risk
A-bomb survivors1950-1990
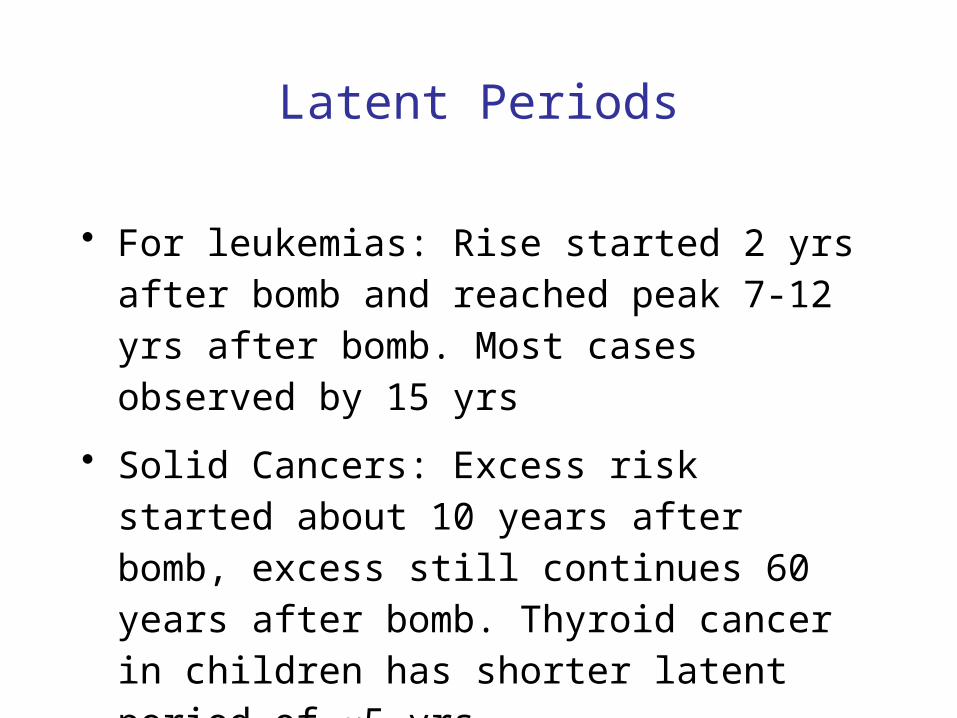
Dose response curve (relative risk) for all cancers in A-bomb survivors 1958-1998
Preston et al, Rad Res.168 1-64,2007
Data consistent with linear dose response curve

Compared to the number of people in H & N killed outright (~100,000) the number of
cancer deaths attributable to the radiation dose is small
Preston et al, Rad Res.168 1-64,2007

Shape of dose response curve
A linear, non threshold model is assumed for risk estimates and for
radiation protection
Dose Rate Effectiveness Factor (DREF) = Ratio of cancer risk at high compared to low dose or low dose rate.
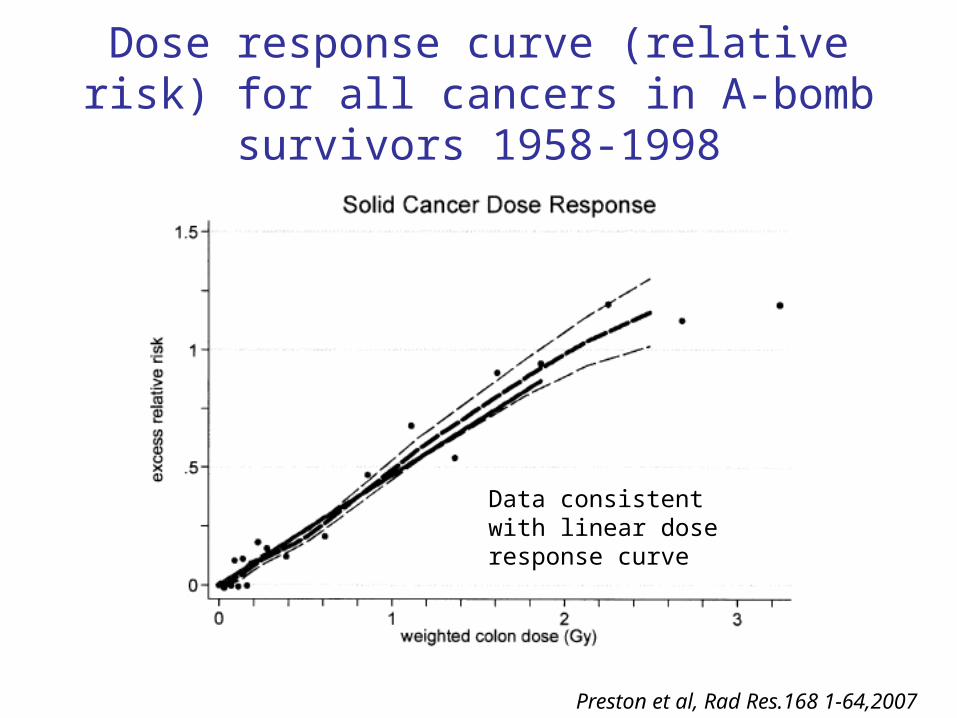
Best overall estimate of total radiation induced cancer mortality
10% per Sv (high doses/dose rates)
US Normal is ~ 16% for all cancers

Does this agree with 10% per Sv?

Cancer Risk after Radiotherapy 1
Increase in Relative Risk after Radiotherapy for Prostate Cancer

Second Cancers after Radiotherapy for Cervix Cancer (Boice et al, 1985)
Boice et al: JNCI: 74.955, 1985


Cancer risk is relatively independent of dose for high doses (Hall 2003)

Estimating cancer risk in any organ after radiotherapy
• Using a combination of the linear, non threshold estimates from the A-bomb survivors and actual cancer risk from Hodgkin’s disease patients treated at high doses (~ 40Gy), Schneider et al (Theoretical Biology and
Medical Modelling 2011, 8:27), constructed dose response data for all organs. Below is the one for all cancers. They considered 3 different models:


Organ doses from Medical Radiation
Brenner & Hall, NEJM, 2007

Cancer incidence from CT scans
Brenner & Hall, NEJM, 2007
Of the 62 million CT scans, 4 million are on small children.4 x 106 x 0.1% = 4 x 10³ excess ca deaths per year

Summary
• Radiation is both a mutagen and a carcinogen
• Human risk estimates are based on a linear, non threshold assumption for the dose response curve
• Human risks are based largely on the data from the A-bomb survivors.
• Rule of thumb: 1 Sv (= 1Gy of X-rays) gives 10% cancer death rate over spontaneous rate. Reduce by factor of 2 for low doses and/or low dose rates.
• Radiation induces genomic instability by as yet unknown mechanisms