Embed Size (px)
Citation preview

- 1 -
ANSTO - COMMERCIAL IN CONFIDENCE - Page 1 of 73
Radiological Assessment of Fill Materials at No. 11 Nelson Parade, Hunters Hill
For State Property Authority NSW
28th November 2011
Radiation Consultancy & Training Services
Health Physics Report on
By Robert Blackley
Radiation Consultancy & Training Services
Safety, Environmental and Radiological Assurance
Australian Nuclear Science & Technology Organisation


- iii -
ANSTO - COMMERCIAL IN CONFIDENCE -
REPORT DETAILS
Title: Radiological Assessment of Fill Materials at No. 11 Nelson Parade, Hunters Hill
Author(s): Robert Blackley
Client: State Property Authority NSW Client Contact: Jeff Goodchild Reference: 0073K-1-3-93 REVISION / CHECKING HISTORY
DISTRIBUTION – NUMBER OF COPIES REVISION NUMBER
DATE REVIEWED BY APPROVED FOR ISSUE
Client Site Auditor ANSTO File
1.0 14.11.2011 R Blackley n -- -- 1(e)
1.1 15.11.2011 S McIntosh y 1(e + h) 1(e) 1(e)
1.2 28.11.2011 R Blackley y 1(e + h) 1(e)
Table Notes: (e) – electronic copy (h) – hard copy


- v -
ANSTO - COMMERCIAL IN CONFIDENCE -
Executive Summary
The Australian Nuclear Science and Technology Organisation (ANSTO) was approached by
the NSW State Property Authority (SPA) to undertake a radiological and chemical
assessment of fill materials present at certain parts of the property located at No. 11 Nelson
Parade, Hunters Hill, NSW, for the purpose of assessing the materials for potential hazards
or requirements for remediation.
Review of historical land use and related recent studies undertaken in the area indicate that
some areas adjacent to the property at No. 11 Nelson Parade have been impacted by
radioactive residues from the processing of uranium bearing ore for extraction of radium by
the Radium Hill Company up until 1915.
The radiological and chemical assessment of the fill material is required to be undertaken to
assist in future decision making prior to the commencement of remediation activities on
adjacent properties.
Analysis of the site indicates background levels of naturally occurring radioactive material for
the majority of the building footprint, with some smaller areas under the driveway, pool and
patio having slightly elevated levels of radioactivity.
If these areas of slightly elevated radioactivity were to undergo remediation and the arising
material be disposed of, the material would be classified as Restricted Solid Waste in
accordance with the NSW waste classification system.


- vii -
ANSTO - COMMERCIAL IN CONFIDENCE -
Table of Contents
1. Introduction ...................................................................................... 12
1.1 General ..................................................................................... 12
1.2 Objectives................................................................................. 12
1.3 Scope of Work.......................................................................... 12
1.4 Limitations................................................................................ 12
2. Site Information ................................................................................ 12
2.1 Site Identification and Description ......................................... 12
2.2 Site History............................................................................... 12
2.3 Site Setting ............................................................................... 12
2.3.1 Site Area and Condition 12
2.3.2 Geology, Topography and Hydrogeology 12
2.4 Previous Investigations........................................................... 12
2.4.1 Radiation Branch of the Department of Health (1966) 12
2.4.2 Scott, W. B, Radiological Investigation (1977) 12
2.4.3 Sinclair Knight and Partners (1987) 12
2.4.4 Environmental Resources Management Australia Assessment (2008) 12
2.4.5 GHD Contamination Investigation (2009) 12
2.4.6 ANSTO Radiological Survey of Nelson Parade (2009) 12
2.4.7 ANSTO Waste Classification of Fill Materials at Nelson Parade, Hunters Hill (2011) 12
3. Contaminants of Concern and Investigation Criteria .................... 12
3.1 Contamination Sources........................................................... 12
3.1.1 Radiological 12
3.1.2 Chemical 12
3.1.3 Asbestos 12
3.2 Contaminants of Potential Concern ....................................... 12
3.3 Comparison of Fill Material to Natural Background Levels .. 12
3.4 Waste Classification Criteria................................................... 12

- viii -
ANSTO - COMMERCIAL IN CONFIDENCE -
3.4.1 Soil – Radiological 12
3.4.2 Soil – Chemical 12
3.4.3 Soil – Asbestos 12
3.5 Comparison of Analytical Data ............................................... 12
4. Assessment Methodology ............................................................... 12
4.1 Scope of Fieldwork .................................................................. 12
4.2 Data Quality Objectives (DQOs) Process............................... 12
4.2.1 Step 1 – State the Problem 12
4.2.2 Step 2 – Identify the Decision 12
4.2.3 Step 3 – Identify Inputs to the Decision 12
4.2.4 Step 4 – Define the Study Boundaries 12
4.2.5 Step 5 – Develop a Decision Rule 12
4.2.6 Step 6 – Specify the Limits on Decision Errors 12
4.2.7 Step 7 – Optimise the Design 12
4.3 Fieldwork Methodology........................................................... 12
4.3.1 Service Clearance 12
4.3.2 Sampling and Analytical Program 12
4.3.3 Sample Handling and Transport Methods 12
4.3.4 Field Equipment Calibration 12
4.3.5 Decontamination Methods 12
4.3.6 Field Quality Control / Quality Assurance 12
4.3.7 Chain of Custody Documentation 12
5. Investigation Results ....................................................................... 12
5.1 Field Observations................................................................... 12
5.2 Analytical Results .................................................................... 12
5.2.1 Assessment of Building Footprint Against Background 12
5.2.2 Assessment of the Building Footprint and the Remainder of the Property against Waste Classification Guidelines 12
5.2.3 Radiological Results – Waste classification 12
5.2.4 Chemical Results – Waste Classification 12
5.2.5 Toxicity Characteristic Leaching Procedure Results 12
5.3 Comparison of Statistical Data to Site Assessment Criteria 12

- ix -
ANSTO - COMMERCIAL IN CONFIDENCE -
5.3.1 LG2 – Statistical Data Assessment – Chemical Waste Classification 12
5.3.2 LG3 – Statistical Assessment – Chemical Waste Classification 12
5.3.3 Asbestos Results 12
5.4 Comparison of Statistical Data to Site Assessment Criteria 12
5.4.1 LG2 – Statistical Data Assessment – Radiological 12
5.4.2 LG3 (LG3.1 and LG3.2) – Statistical Data Assessment – Radiological 12
5.5 Data Quality Assessment ........................................................ 12
5.6 Summary of Chemical Waste Classification .......................... 12
5.6.1 LG2 – Chemical Waste Classification 12
5.6.2 LG3 – Chemical Waste Classification 12
5.7 Summary of Radiological Waste Classification..................... 12
5.7.1 LG2 – Radiological Waste Classification 12
5.7.2 LG3.1 – Radiological Waste Classification 12
5.7.3 LG3.2 – Radiological Waste Classification 12
6. Conclusions and Recommendations.............................................. 12
6.1.1 Chemical Waste Classification 12
6.1.2 Radiological Waste Classification 12
7. References........................................................................................ 12
8. Appendix A – Spatial Distribution of radioactive material............. 12
9. Appendix B – Borehole Locations .................................................. 12
10. Appendix C – Field Instruments Used ............................................ 12
11. Appendix D – Sample Analysis Results.......................................... 12
12. Appendix E – QA/QC Assessment .................................................. 12
13. Appendix F – Soil Borehole Logs.................................................... 12
14. Appendix G – Calibration Certificates............................................. 12
15. Appendix H – CoC and Laboratory Reports ................................... 12
16. Appendix I – Statistical Assessment............................................... 12

- x -
ANSTO - COMMERCIAL IN CONFIDENCE -
List of Figures
Figure 1 Locations of the soil materials classified and type of analysis
undertaken.
Figure 2 The Site location.
Figure 3 Borehole locations Level 4
Figure 4 Borehole locations Level 3
Figure 5 Borehole locations Level 1
Figure 6 Borehole locations Reduced building footprint Level 4
Figure 7 Borehole locations Reduced building footprint Level 3
Figure 8 Borehole locations Reduced building footprint Level 1
List of Tables
Tables within the report
Table 1 ANSTO Laboratory methods for proposed analysis
Table 2 Chemical Analytical Suites
Table 3 Waste Classification Criteria
Table 4 Summary of Soil Borings
Table 5 QA/QC Sample Frequency
Table 6 Visual Observation Summary
Table 7 Summary of Total Radioactivity Exceedances
Table 8 Summary of Heavy Metal Exceedances
Table 9 Summary of PAH and Benzo(a)pyrene Exceedances
Table 10 Summary of Scheduled TCLP Analysis
Table 11 Chemical Analysis Results (Appendix D)
Table 12 TCLP Results (Appendix D)
Table 13 Chemical QA/QC Intralab Duplicate Results (Appendix D)
Table 14 Chemical QA/QC Trip Blank and Trip Spike Results (Appendix D)
Table 15 Chemical QA/QC Interlab Duplicate Results (Appendix D)
Table 16 Chemical QA/QC Rinsate Results (Appendix D)
Table 17 Radiological Analysis Results (Appendix D)
Table 18 Radiological QA/QC Intralab Duplicate Results (Appendix D)
Table 19 Radiological 95% UCL Area LG2 (Appendix D)
Table 20 Radiological 95% UCL Area LG3 (Appendix D)

- xi -
ANSTO - COMMERCIAL IN CONFIDENCE -
Table 21 Radiological 95% UCL Area LG3.1 (Appendix D)
Table 22 Radiological 95% UCL Area LG3.2 (Appendix D)
Table 23 Radiological Background Samples LBGR (Appendix D)
Table 24 Radiological WRS Test Area LG2 (Appendix D)
Table 25 Radiological WRS Test Area LG3 (Appendix D)
Table 26 Radiological WRS Test Area LG3.1 (Appendix D)
Table 27 Radiological Secular Equilibrium (Appendix D)
List of Appendices
Appendix A Radiation Spatial Distribution
Appendix B Borehole locations
Appendix C Field Instrumentation Used
Appendix D Sample Analysis Results
Appendix E QA/QC Assessment
Appendix F Soil Borehole Logs
Appendix G Calibration Certificates
Appendix H CoC and Laboratory Certificates
Appendix I Statistical Assessment
Abbreviations
ACM Asbestos Containing Material
ANSTO Australian Nuclear Science and Technology Organisation
BaP Benzo(a)Pyrene
Bq Becquerel
BTEX Benzene, Toluene, Ethylbenzene and Toluene
CoC Chain of Custody
COPC Contaminants of Potential Concern
CT Contaminant Threshold
DECC Department of Environmental and Climate Change
mbgl Metres below ground level
PID Photoionisation Detector

- xii -
ANSTO - COMMERCIAL IN CONFIDENCE -
GHD GHD Pty Ltd
LG Location Grouping
LLD Lower Limit of Detection
LOR Laboratory Limit of Reporting
mg/kg Milligrams per kilogram
mSv millisievert
NORM Naturally Occurring Radioactive Material
OCP Organochlorine Pesticides
PAH Polycyclic Aromatic Hydrocarbons
PCB Polychlorinated Biphenyls
PPE Personal Protective Equipment
QA Quality Assurance
QC Quality Control
SCC Specific Contaminant Concentration
SOP Standard Operating Procedure
TCLP Toxicity Characteristic Leaching Procedure
TPH Total Petroleum Hydrocarbon
UCL Upper Confidence Limit
µg/L Micrograms per litre
µSv/hr Microsievert per hour
WCR Waste Classification Report

ANSTO - COMMERCIAL IN CONFIDENCE -
1. Introduction
1.1 General
The Australian Nuclear Science and Technology Organisation (ANSTO) was approached by
the NSW State Property Authority (SPA) to undertake a radiological and chemical assessment
of fill materials present at certain parts of the property located at No. 11 Nelson Parade,
Hunters Hill, NSW, for the purpose of assessing the materials for potential radiological or
chemical hazards or requirements for remediation.
Review of historical land use and related recent studies undertaken in the area indicate that
some adjacent areas surrounding the property at No. 11 Nelson Parade have been impacted
by radioactive residues from the processing of uranium bearing ore for extraction of radium by
the Radium Hill Company up until 1915. Subsequent to the adjacent area being vacated by the
Radium Hill Company, the area was landscaped and filled with materials of unidentified origin.
As a result, there is potential for non-uniform distribution of radiological and chemical materials
in the soil.
The radiological and chemical assessment of the fill material is required to be undertaken to
assist in future decision making prior to the commencement of remediation activities on
adjacent properties.
1.2 Objectives
The radiological assessment is being undertaken to provide suitable data to enable decisions to
be made regarding the future management of fill material underneath the building footprint of
No. 11 Nelson Parade.
The objective of the program is to assess the radiological content of fill material below the
building footprint and surrounding areas and compare this against natural levels of background
radiation in the surrounding environment.
This radiological assessment is designed to complement previous assessments undertaken on
adjacent properties.
The radiological and chemical contaminants of concern in the fill material during the analysis
are based upon a historical assessment of the site.
1.3 Scope of Work
The scope of work is to suitably assess the property at No. 11 Nelson Parade and compare the
results for significance against natural background levels. Further assessment of areas of
elevated levels of radioactivity may be undertaken, for both radiological and chemical
contaminants, in order to classify the material (in situ) that may undergo remediation if required,
in accordance with the NSW waste classification.
1.4 Limitations
This radiological assessment is given strictly in accordance with, and subject to, the following
limitations:
• The assessment was prepared for the SPA (“the Client”) in accordance with the scope of
work agreed between ANSTO and the Client.

- 14 -
ANSTO - COMMERCIAL IN CONFIDENCE -
• ANSTO assumes no responsibility for conditions it was not authorised and directed by the
Client to investigate.
• This report is based, in part, on unverified information supplied to ANSTO from several
sources during the project research. Therefore, ANSTO does not guarantee its
completeness or accuracy, and assumes no responsibility for errors or omissions related to
this externally supplied information.
• This report should not be altered, amended or abbreviated, issued in part or issued
incomplete in any way without the prior written consent of ANSTO. ANSTO accepts no
responsibility for any circumstances that arise from the issue of a modified report without
the permission of ANSTO.

- 15 -
ANSTO - COMMERCIAL IN CONFIDENCE -
2. Site Information
2.1 Site Identification and Description
The site consists of the following parcel of land in the residential suburb of Hunters Hill,
Sydney, as shown in Figure 1;
• No. 11 Nelson Parade, Hunters Hill, including under the residential building footprint;
The area in its pre-remediated state generally is a series of sloping terraces from the northern
perimeter and high point at Nelson Parade, sloping southward towards the Parramatta River.
The southern boundary of the study area is the cliff line separating the upper section of the
property from the foreshore area beside the Parramatta River.
The soil appears generally shallow in terms of loose sediment deposits to a depth of 1m below
ground level (BGL) in much of the area, with regions of rocky outcropping and retaining walls
that have been backfilled that contribute to the terracing. Mature trees are scattered around the
site. No 11 contains a functional dwelling, located on the upper section of the property.
Photo 1. Backyard of property at No. 11 Nelson Parade
Photo 2. Building on No. 11 Nelson Parade (from the backyard)

- 16 -
ANSTO - COMMERCIAL IN CONFIDENCE -
Figure 1. The locations of the soil materials classified and type of analysis undertaken
Areas J, K and L – Under No 11 building footprint
Foreshore No 11 Nelson Pde – not included in report
Area B – No 11 Nelson Pde
Parramatta River

- 17 -
ANSTO - COMMERCIAL IN CONFIDENCE -
2.2 Site History
In the early part of last century, the Radium Hill Company established a processing works in the
area of Nelson Parade at Hunters Hill in NSW for the purposes of extracting radium from
uranium-bearing ore for medical and other uses. The uranium came from Radium Hill in South
Australia and was shipped to the site in Hunters Hill. A report by Sinclair Knight and Partners in
1987 described the ores processed at the plant as being a mixture of ilmenite, magnetite and
rutile in association with black mica and carnotite. Historically the process has incorrectly been
described as being a smelting process; however, as described by Ratcliff (1914), the extraction
process was a chemical process. During the processing of the concentrates, a number of solid
and liquid waste streams were generated and disposed of on the site. The Radium Hill
Company went bankrupt and the plant was closed in June 1915, leaving some residual
materials containing isotopes of the uranium decay chain.
In addition to the radium extraction plant, from 1895 until 1966 a tin smelter operated on what is
now Kelly’s Bush Reserve, which borders Nelson Parade at Hunters Hill. The smelter
processed tin ore that contained thorium-bearing and uranium-bearing monazite minerals. Low
levels of these radiological contaminants remained in the resultant tin slag produced by the
smelter.
A carbolic acid plant also operated on reclaimed land on the lower portion of Lot 7 Nelson
Parade from the late 1880’s until 1900. The disposal of chemical contaminants from this plant is
not known, however chemical contaminants including hydrocarbons and metals are suspected
to be present in the area as a result.
When the potential hazards from the residual materials from the radium extraction plant were
recognised in the 1950's, the soil and associated material was relocated to one area,
predominately the current Lots 7 and 9 on Nelson Parade. Extensive soil relocation has
occurred on the properties adjacent to the study area during the construction of walls, terraces
and swimming pools.
Following a Parliamentary Inquiry in 2008, the NSW Department of Health engaged the
Australian Nuclear Science and Technology Organisation (ANSTO) to carry out an extensive
radiological survey and characterisation of the area on and surrounding Nelson Parade,
Hunters Hill, including in the Parramatta River immediately adjacent to the site.
2.3 Site Setting
This section provides an overview of the site area, topographical, hydrogeological and
geological setting.
2.3.1 Site Area and Condition
The land being assessed comprises of a single block of land, comprising of the building
footprint of the dwelling on No. 11 Nelson Parade and its surrounding grounds, as
shown in Figures 1 and 2.
The dwelling on No.11 Nelson Parade is a four storey residential dwelling on the upper
terraced section of the block, built in 1968 on previously vacant land.
The block of land is not currently privately owned and there is nobody currently residing
on this land.
The entire site is currently surrounded by a secure fence to prevent access to the area.

- 18 -
ANSTO - COMMERCIAL IN CONFIDENCE -
Figure 2: The Site Location
2.3.2 Geology, Topography and Hydrogeology
The 1:100,000 Soil Landscape Series (1993) map of Sydney identifies the localised
landscape as ‘undulating to rolling low hills on Hawkesbury sandstone and
discontinuous earthy sands’. Similarly, the 1:100,000 Geological Series Sheet (1983) of
Sydney shows the underlying bedrock to be Triassic Hawkesbury sandstone, which is
described as ‘medium to coarse-grained quartz sandstone with very minor shale and
laminate lenses’.
The Site is situated on a Hawkesbury sandstone outcrop on the banks of the Parramatta
River. The topography of foreshore land between Nelson Parade and the water’s edge
drops off sharply due to the outcropping sandstone and cutting activities undertaken
during development of the Site.
Due to the proximity of the Site to the Parramatta River, groundwater is expected to
infiltrate into the sandstone bedrock and flow in a southerly direction towards the river.
However, due to the steep topographical change from Nelson Parade to the river, it is
expected that only the immediate foreshore area of the Site would be affected by
groundwater infiltration.
Observations during the field investigation identified a silty sand fill layer over natural
sandstone bedrock. The depth of the fill layer varied from 0.00 m to 1.70 m. Refer to
Section 5.1 and Appendix F for detailed descriptions of the lithology.
N
The Site

- 19 -
ANSTO - COMMERCIAL IN CONFIDENCE -
2.4 Previous Investigations
The following previous relevant investigations have been undertaken at or around the Site:
• Radiation Branch of the Department of Health, 1966.
• Scott, B. W., Investigation of Radioactive contamination at Nelson Parade Woolwich,
September 1977.
• Sinclair Knight and Partners, Radium waste clean up Nelson Parade, Hunters Hill,
Review of Environmental Factors, August 1987.
• Environmental Resources Management Australia, Radiological Contamination
Assessment 11 Nelson Parade, Hunters Hill, NSW, Australia, August 2008.
• GHD Pty Ltd (GHD), Contamination Investigation of Foreshore Land Fronting 5 and 13
Nelson Parade, Hunters Hill, June 2009.
• ANSTO, Radiological survey of Nelson Parade, Hunters Hill – Stages 1 and 2, June
2009.
• ANSTO, Waste Classification of Fill Materials at Nelson Parade, Hunters Hill,
September 2011.
A review of these reports has been undertaken by ANSTO and CH2MHILL, with summaries
provided in the following section.
2.4.1 Radiation Branch of the Department of Health (1966)
Between September 1965 and May 1966 a radiological investigation was conducted by
officers of the Radiation Branch of the Department of Health. The investigation included
analysis of soil surveys for radium, dose rates inside private residential buildings
(including the then existing buildings on Nos 7 and 9 Nelson Parade) and analysis of
plants for radium content. The report concluded that although localised areas of higher
dose rates were observed, the average dose rates at the site did not constitute a
significant health hazard.
2.4.2 Scott, W. B, Radiological Investigation (1977)
At the request of the then Health Commission of NSW, Mr B W Scott undertook a
comprehensive radiological assessment of the former site of the radium extraction plant
and surrounding blocks of land, including monitoring for radon and radon decay
products inside the private residences of No.5, No.7, No.9 and No.11 Nelson Parade.
Elevated readings of radon were detected inside No.7 Nelson Parade, only. The
residential building on No.7 was subsequently vacated and demolished in 1983 (it is
unclear when No. 9 was demolished, but some time after No. 7).
2.4.3 Sinclair Knight and Partners (1987)
Sinclair Knight and Partners undertook an extensive radiological investigation of the
former site of the radium extraction plant and surrounding blocks of land in 1987. The
findings of the report are summarised as:
• 70% of the samples collected at the site contain more than 2 Bqg-1 of radium-
226, with an average of 4 Bqg-1 of radium-226 for the site. Some more elevated
levels were measured on No.9 and to a lesser extent on No.7 and No.11. The

- 20 -
ANSTO - COMMERCIAL IN CONFIDENCE -
spread of material was consistent with its use as fill behind retaining walls and
over rock shelves.
• The levels of activity were not higher than those typically encountered in uranium
mining and milling.
A detailed map of the distribution of radium-226 radioactivity across the site was
included in the report.
2.4.4 Environmental Resources Management Australia Assessment (2008)
Environmental Resources Management Australia (ERM) was commissioned by Henry
York Davis to undertake a radiological assessment of the property at No. 11 Nelson
Parade on behalf of the then private owners of the property. Australian Radiation
Services (ARS) undertook external dose rate monitoring across the backyard (only) of
No.11, where elevated dose rates of up to 1.49 µGy/h were detected, predominately
along the eastern boundary immediately adjacent to the property at No.9 Nelson
Parade. Soil samples were taken along this eastern boundary of the property and
analysed against a single background sample. Activities of up to 9 Bq/g of Ra-226 were
detected in the backyard of the property. Radon monitoring inside the dwelling indicated
levels at or close to natural background levels.
2.4.5 GHD Contamination Investigation (2009)
GHD was commissioned by the NSW Department of Commerce (DoC) to undertake a
contamination assessment of foreshore land fronting Nos 5 and 13 Nelson Parade,
Hunters Hill. A review of historical land use records undertaken by GHD indicated that
both properties could be contaminated through the presence of residual radioactive
materials from the extraction of uranium ore by the Radium Hill Company between 1911
and 1916. Numerous filling and reclamation activities were reported to have been
undertaken on the lower foreshore lands.
In order to characterise the foreshore fill material, a total of six soil borings were
completed using a hand auger. Two samples were collected from each boring location
and submitted for both chemical and radiological analysis. In addition, a gamma
radiation field survey was undertaken at each property using a SE Inspector EXP
handheld radiation detector unit.
Fill materials observed at the foreshore of each property were described as follows:
• No. 5 Nelson Parade foreshore: brown to tan fine-grained fill sands with
crushed sandstone, brick fragments, ash, charcoal and glassy black gravels.
• No. 13 Nelson Parade foreshore: dark brown sandy topsoil underlain by
orange / tan and white sands.
Asbestos containing material (ACM) was not observed on either property and a PID
screen at each sample interval indicated low (< 1.7 parts per million) readings.
Contaminants of potential concern (CoPC) that were identified at No. 5 and No. 13
Nelson Parade at concentrations exceeding the adopted human health investigation
(HIL – Residential [A]) or phytotoxicity assessment criteria included:
• No. 5 Nelson Parade foreshore: Lead, arsenic, mercury, zinc and PAH

- 21 -
ANSTO - COMMERCIAL IN CONFIDENCE -
• No. 13 Nelson Parade foreshore: Lead and arsenic
Lead concentrations above the HIL A criteria (300 mg/kg) were reported in one sample
collected at No. 5 Nelson Parade foreshore and two samples collected from No. 13
Nelson Parade foreshore. The maximum lead concentration was 570 mg/kg. A total of
four samples exceeded the HIL A criteria for arsenic (100 mg/kg). Two of the arsenic
exceedances were from No. 5 Nelson Parade foreshore and two were from No. 13
Nelson Parade foreshore. The maximum arsenic concentration was 470 mg/kg.
The following Provisional Phytotoxicity Investigation Level (PBIL) exceedances were
reported for arsenic, mercury and zinc:
• Arsenic: Two exceedances of the associated PBIL (20 mg/kg) in samples
collected at No. 5 Nelson Parade foreshore and two exceedances for samples
collected at No. 13 Nelson Parade
• Mercury: Four exceedances of the PBIL (1 mg/kg) in samples collected at No.5
Nelson Parade foreshore
• Zinc: Two exceedances of the PBIL (200 mg/kg) in samples collected at No.5
Nelson Parade foreshore
Total petroleum hydrocarbon (TPH) concentrations were reported above the laboratory
limit of reporting (LOR) in all samples collected from No. 5 Nelson Parade foreshore and
a single sample collected from No.13 Nelson Parade foreshore. The maximum TPH
(C10-C36) concentration was 940 mg/kg (sample 5HA1), less than the adopted criteria of
1000 mg/kg.
Total polycyclic aromatic hydrocarbon (PAH) concentrations were detected above the
adopted HIL A criteria (20 mg/kg) in all samples collected at No. 5 Nelson Parade
foreshore. The maximum PAH concentration was reported to be 216.9 mg/kg in the
near surface (0.1 metres below ground level [mbgl]) sample. Similarly, concentrations of
Benzo(a)pyrene (BaP) in all samples from No.5 Nelson Parade foreshore exceeded the
adopted HIL A criteria (1 mg/kg), with a maximum concentration of 16 mg/kg. All
samples analysed from No.13 Nelson Parade foreshore reported concentrations of total
PAH and BaP below the HIL A criteria.
Concentrations of benzene, toluene, ethylbenzene and xylene (BTEX), organochlorine
pesticides (OCP) and polychlorinated biphenyls (PCB) in all samples analysed were
less than the laboratory LOR.
GHD attributed the elevated concentrations of PAH, lead, arsenic, mercury, zinc and
PAH at No.5 Nelson Parade foreshore to the presence of ash and charcoal observed
within the fill materials.
Radiological analytical results were reported below the adopted site criterion for all
samples. The gamma ray field survey indicated a greater level of activity at the
foreshore of No. 13 Nelson Parade than No.5 Nelson Parade, with 12 out of 26
surveyed locations exceeding the assessment criterion of 0.7 microgray per hour
(µGy/hr).
All measured Toxicity Characteristic Leaching Potential (TCLP) results were below the
laboratory LOR.

- 22 -
ANSTO - COMMERCIAL IN CONFIDENCE -
GHD concluded that fill materials at No. 5 Nelson Parade foreshore could be disposed
of off-site under the general immobilisation approval (1999/05). The immobilisation
approval allows for waste classification of materials impacted by PAH using TCLP
values only.
Due to the elevated levels of gamma radiation in fill material at No.13 Nelson Parade
foreshore, GHD concluded that the material would require disposal as Restricted Solid
Waste at a suitable registered facility and subject to NSW DECCW approval.
2.4.6 ANSTO Radiological Survey of Nelson Parade (2009)
ANSTO was commissioned by the NSW Department of Health and the NSW DECC to
undertake a radiological survey of the areas surrounding the properties covered by this
report. Surveys were not undertaken on the Lots No's 5, 7, 9 and 11 Nelson Parade.
Surveys were completed in the yards and houses of residents in Nelson Parade
adjacent to the properties of No’s 5, 7, 9 and 11. The survey results within the survey
area varied significantly, depending upon their location. Most areas indicated nil or
negligible presence of radioactivity above natural background levels. The areas of the
highest radiological activity measured were from roadways in Hunters Hill; however this
was assessed to be a result of the inclusion of thorium-bearing slag from the tin smelter
formerly located in nearby Kelly’s Bush. The other areas of highest radiological readings
were from properties immediately adjacent to the former radium extraction plant site in
Nelson Parade.
The report details the areas surveyed, the methodology used and the potential exposure
levels arising from external gamma radiation and the internal exposure from potential
inhalation of radioactive dusts and radon, and the ingestion of particles and foodstuffs. It
also provides guidance on the spatial and vertical distribution of contamination and the
level of uranium and thorium in the soil.
The exposures from ingestion, dust inhalation and external exposure pathways were
analysed, with the total exposure assessed to be less than 1 mSv per year.
Indicative radon concentrations were measured inside targeted dwellings, with all
results being below the recommended action level for possible remediation action.
However, in one dwelling elevated radon levels which were just below this action level
were measured. Core samples were taken in the areas of elevated radioactivity and the
cores analysed. From the activity screening and analysis, the maximum activities were
calculated, the radionuclide ratios identified and the vertical extent of the contamination
estimated at each site. Elevated radiological results were detected on properties
immediately adjacent to the radium extraction plant site, including in the backyards of
No’s 13 and 15 Nelson Parade.
2.4.7 ANSTO Waste Classification of Fill Materials at Nelson Parade, Hunters Hill (2011)
ANSTO was commissioned by the NSW State Property Authority to undertake an in situ
radiological and chemical waste classification of the fill materials located on the former
site of the radium extraction plant, namely the properties at No’s. 7 and 9, the backyard
of No. 11 and the entire foreshore area fronting No’s. 5, 7, 9, 11 and 13 Nelson Parade.

- 23 -
ANSTO - COMMERCIAL IN CONFIDENCE -
The report identified that the nature of the fill materials across the site appeared to be
consistent. Field observations indicated that the only visual chemical contamination was
attributed to pockets of ash, charcoal and suspected coking waste. Chemical results
showed that elevated concentrations of heavy metals, BaP and Total PAH tended to
correlate with these isolated pockets of visually contaminated material. The nature of
the fill materials with regard to radiological content was variable across the site.
Localised concentrations of elevated radioactivity were present on the site, often where
historical back-filling behind walls had occurred. The average total radioactivity across
the site was 40 Bq/g (median activity of 13 Bq/g) with a 95% UCL value of 97 Bq/g,
which is below the criteria for Restricted Solid Waste (100 Bq/g). This figure is primarily
due to the high standard deviation of 66 Bq/g.
The following waste classifications were determined:
Chemical
• No’s. 11, 13, 15 and Foreshore areas = General Solid Waste
• No’s. 7 and 9 Nelson Pde = Material from one area was classified as Restricted
Solid Waste. The remaining material in the area was classified as General Solid
Waste.
Radiological
• No’s. 11 (excluding building footprint), 13, 15 and Foreshore areas =
Restricted Solid Waste
No’s. 7 and 9 had previously been classified as Restricted Solid Waste on a radiological
basis by the Site Auditor, based upon the results of the 1987 Sinclair Knight and
Partners report.

- 24 -
ANSTO - COMMERCIAL IN CONFIDENCE -
3. Contaminants of Concern and Investigation Criteria
3.1 Contamination Sources
Reviews of historical land use and related recent studies undertaken in the area indicate that
some of the area may be impacted by radioactive residues from the processing of uranium
bearing ore for extraction of radium by the Radium Hill Company up until 1915. In addition the
area may also be impacted by chemical residues from the carbolic acid plant. Subsequent to
the adjacent properties being vacated by the carbolic acid plant and Radium Hill Company, the
study area was landscaped and filled with materials of unidentified origin. As a result, there is
potential for non-uniform distribution of radiological materials and also the potential for chemical
impact on the soil.
The assessment is designed to complement previous assessments undertaken on adjacent
properties and to provide a suitable level of information to guide future decisions on the
management of the property.
3.1.1 Radiological
Radioactive material exists naturally within soils. These are due to the presence of
isotopes from the uranium, thorium and actinium decay chains, and from potassium-40.
Due to the transportation of uranium-bearing ores from the Radium Hill mines in South
Australia to the site at Hunters Hill and the subsequent processing for extraction of
radium-226, there is potential for elevated levels of radioactive material from the
uranium decay chain. No evidence exists to indicate the presence of significant amounts
of other isotopes. Therefore the radiological contaminants of concern are the isotopes of
the uranium-238, thorium-232 and uranium-235 decay chains. These are summarised in
Table 1 below, including the limits of reporting for the preferred laboratory assessment
methodology.
Table 1: ANSTO laboratory methods for proposed isotopic analysis and Limits of Reporting
Radionuclide Lab Method Lab Limit of Detection
(mg/kg)
Th-234 VP-2747 2.9
Pa-234m VP-2747 22
Th-230 VP-2747 14
Pb-214 VP-2747 0.3
Bi-214 VP-2747 0.3
Pb-210 VP-2747 5.4
Ac-228 VP-2747 0.7
Th-228 VP-2747 30
Ra-224 VP-2747 2.4
Pb-212 VP-2747 0.2
Bi-212 VP-2747 1.9
Tl-208 VP-2747 0.2

- 25 -
ANSTO - COMMERCIAL IN CONFIDENCE -
U-235 VP-2747 0.6
Th-227 VP-2747 0.8
K-40 VP-2747 6.0
3.1.2 Chemical
A carbolic acid plant was located on the foreshore area of No7 Nelson Parade. Due to
the subsequent relocation of soil around the site, and the potential contaminants from
the radium extraction plant and carbolic acid plant on surrounding properties, the
following broad range of analyte groups are the main chemical contaminants of concern,
as summarised in Table 2 below. CH2M Hill was contracted by ANSTO to undertake the
chemical analysis of material.
Table 2. Accredited laboratory methods for proposed chemical analytical suites and Limits of
Reporting
Analyte Group Lab Method Lab Limit of Reporting
(mg/kg)
Heavy Metals (As, Cd, Cr, Cu, Pb, Ni, Zn) EG005T 1-5
Mercury EG035T 0.1
Polycyclic Aromatic Hydrocarbons (PAH) EP075 (SIM) B 0.5
Total Petroleum Hydrocarbons (TPH) EP080/071 10-100
Organochlorine Pesticides (OCP) EP068A 0.05 – 0.2
Asbestos AS 4964 --
Total Polychlorinated Biphenyls (PCB) EP066 0.1
Total Characteristic Leaching Procedures (TCLP) – Heavy Metals
EG005C 0.1 mg/L
Total Characteristic Leaching Procedures (TCLP) – PAH
EP075 (SIM) B 0.5 – 1 µg/L
3.1.3 Asbestos
Although none was identified during previous investigations and from the historical
review, there does exist the possibility that asbestos from either former buildings or from
unknown fill materials used on adjacent properties may be present. However, no direct
evidence exists to indicate that asbestos is present. Asbestos is included in the
decision-making process only if visible asbestos-containing material is identified during
the site assessment.
3.2 Contaminants of Potential Concern
The predominant radiological contaminants of concern are from the uranium-238 decay chain,
and to a lesser extent uranium-235 and the thorium-232 decay chains, all of which are present
at some level as a result of the activities undertaken on the adjacent properties. As the ores
containing these isotopes have been processed, it is unknown if these decay chains are
currently in a status of secular equilibrium. Therefore isotopes from different parts of each of

- 26 -
ANSTO - COMMERCIAL IN CONFIDENCE -
the decay chains were analysed to determine the ratios between each isotope. This eliminated
the potential underestimation or overestimation of the total radioactivity present on the site if the
decay chains are not in secular equilibrium and only a single isotope is analysed.
The exact chemical contaminants that may be present on the site are not known. However,
from analysis of the historical uses of the site, particularly from the carbolic acid plant, and from
previous chemical assessments of the site, a broad range of chemical contaminants were
chosen for analysis, as listed in Table 2. There is no evidence which would suggest a need to
analyse for any other specific chemical contaminants.
3.3 Comparison of Fill Material to Natural Background Levels
Isotopes in the U-238, U-235 and Th-232 decay chains exist naturally in the environment.
Radiological contaminants from the radium extraction plant are also exclusively from the U-238,
U-235 and Th-232 decay chains. Unlike artificial radiological material which generally does not
occur in nature, the measured levels of radioactivity cannot be measured as total activity
without consideration of natural background levels. In addition, as the levels of radioactivity that
naturally occur can vary considerably, even within a small area, there is a need to determine if
measured levels are in excess of, or just a result of, this natural variability.
Initial survey results indicated minimal elevation in levels of radioactivity under the building
footprint at No.11 Nelson Parade when compared to natural background levels of radioactivity.
Therefore initial assessments were completed undertaken to determine if measured levels were
distinguishable from background levels.
The methodology for determining if radioactivity is indistinguishable from background,
contained in MARSSIM (2000) and the U.S. Nuclear Regulatory Commission NUREG-1505
Nonparametric Statistical Methodology for the Design and Analysis of Final Status
Decommissioning Surveys (1998), is known as ‘Scenario B’. The Null Hypothesis in Scenario B
is that ‘Measurements in the survey area are indistinguishable from those in the background
samples’.
For areas where levels of radioactivity in fill material were distinguishable from background
levels, further assessment was undertaken of the material and guidance provided on the waste
classification of the material, if future management of the site included disposal of fill material.
3.4 Waste Classification Criteria
The waste classification of fill materials is included in this report to provide additional guidance,
only, if any future decisions are made to remediate any part of the site. This inclusion does not
imply that remediation of any part of the site is required.
3.4.1 Soil – Radiological
The DECC Guideline ‘Waste Classification Guidelines, Part 3: Waste Containing
Radioactive Material’ (October 2008) defines how to classify wastes containing
radioactive material. Samples were analysed for the 238U decay chain, 232Th decay chain
and 235U decay chain and assessed against the protocol outlined in NSW DECC (2008)
‘Waste Classification Guidelines, Part 3: Waste Containing Radioactive Material’.
The Guideline states that ‘liquid or non-liquid wastes with:

- 27 -
ANSTO - COMMERCIAL IN CONFIDENCE -
• A Specific Activity of 100 Bq/g-1 AND;
• Consist of, or containing more than, the prescribed activity of a
radioactive element in Schedule 1 of the Radiation Control Regulation
2003 whether natural or artificial;
must be classified as hazardous waste’.
For material containing radionuclides in the U-238, Th-232 and U-235 decay chain, the
Total Specific Activity should be used, which is the sum of radioactivity for each
radionuclide present.
For material containing a total specific activity of less than 1 Bq/g-1, the material can be
classified as General Solid Waste, in accordance with the guidelines.
Material containing a total specific activity of between 1 Bq/g-1 and 100 Bq/g-1 can be
classified as Restricted Solid Waste, in accordance with the guidelines.
3.4.2 Soil – Chemical
Chemical analytical results were used to determine the potential waste classification of
the material in accordance with the NSW DECC, Waste Classification Guidelines, 2008.
Contaminant threshold (CT) values for waste classification without completion of
leaching tests have been adopted from Table 1 of NSW DECC (2008). Maximum
values for leachable concentrations (TCLP) and total concentrations (SCC) when used
together have been adopted from Table 2 of the NSW DECC (2008).
Table 3 summarises the adopted criteria for the CoPC associated with the Site.

- 28 -
ANSTO - COMMERCIAL IN CONFIDENCE -
Table 3
Waste Classification Criteria
Waste Classification Report
General Solid Waste Restricted Solid Waste
Analyte CT1 (mg/kg)
TCLP1 (mg/L)
SCC1 (mg/kg)
CT2 (mg/kg)
TCLP2 (mg/L)
SCC2 (mg/kg)
Monocyclic Aromatic Hydrocarbons
Benzene 10 0.5 18 40 2 72
Toluene 288 14.4 518 1152 57.6 2,073
Ethylbenzene 600 30 1080 2400 120 4,320
Xylene 1000 50 1800 4000 200 7,200
Total Petroleum Hydrocarbons
TPH (C6-C9) — — 650 — — 2,600
TPH (C10-C36) — — 10,000 — — 40,000
Polycyclic Aromatic Hydrocarbons
Benzo(a)pyrene 0.8 0.04 10 3.2 0.16 23
PAH Total — — 200 — — 800
Polychlorinated Biphenyls
Total PCB — — < 50 — — < 50
Organochlorine Pesticides
Aldrin + Dieldrin — — 250 — — 1,000
DDT — — < 50 — — < 50
DDD — — < 50 — — < 50
DDE — — < 50 — — < 50
Heavy Metals
Arsenic 100 5 500 400 20 2,000
Cadmium 20 1 100 80 4 400
Chromium (VI) 100 5 1,900 400 20 7,600
Lead 100 5 1,500 400 20 6,000
Mercury (inorganic) 4 0.2 50 16 0.8 200
Nickel 40 2 1,050 160 8 4,200

- 29 -
ANSTO - COMMERCIAL IN CONFIDENCE -
3.4.3 Soil – Asbestos
As noted above, asbestos was to be included in the assessment only if visible asbestos
containing materials (ACM) was identified during the field investigation. NSW DECC
(2008) states that if asbestos is detected in the sample collected, the material should be
designated as Special Waste – Asbestos and disposed of at a suitable waste receiving
facility.
3.5 Comparison of Analytical Data
The methodology, known as ‘Scenario B’, for determining if radioactivity is indistinguishable
from background is contained in MARSSIM (2000) and the U.S. Nuclear Regulatory
Commission NUREG-1505 Nonparametric Statistical Methodology for the Design and Analysis
of Final Status Decommissioning Surveys (1998). This methodology utilises the Wilcoxon Rank
Sum Test followed by the Quantile Test. The Null Hypothesis in Scenario B is that
‘Measurements in the survey area are indistinguishable from those in the background samples’,
which is rejected if the data fails either of the above mentioned statistical tests.
The statistical methodology used for the comparison of the analytical concentrations to the
adopted waste classification criteria is based on the methods referred to in the NSW EPA,
Contaminated Sites: Sampling Design Guidelines, 1995 and National Environment Protection
Council (NEPC), National Environment (Assessment of Site Contamination) Protection
Measure (NEPM), 1999, namely:
• comparison of the 95% upper confidence limit of the arithmetic mean concentration
(95% UCL) values of each contaminant (with the exception of asbestos) to the
nominated site criterion;
• comparison of the calculated standard deviations to a value of 50% of the nominated
site criteria; and
• determination of the required number of samples (Procedure B) to allow calculation of
an average concentration.

- 30 -
ANSTO - COMMERCIAL IN CONFIDENCE -
4. Assessment Methodology
4.1 Scope of Fieldwork
All fieldwork was conducted in accordance with ANSTO’s Quality Management system, CH2M
Hill’s standard operating procedures, and relevant State regulations. Each separate area of the
survey was slightly different. However the following general methodology was used:
1. Radiological mapping of the areas using 2 inch NaI detectors and Geiger-Muller
detectors mounted on a tripod at a distance of 1 metre above the ground for a count
time of 300 seconds each count;
2. A continuous ‘walk-over’ survey technique using 2 inch NaI detectors at a height of 5
centimetres above the ground along spatial lines at a nominal separation of 1 m, but
with allowance for inaccessible areas. The radiological mapping assisted in determining
the spatial distribution of radiological materials and reduction when determining the
critical size of radiological hotspots;
3. Soil sampling at regular intervals using a hand auger;
4. Laboratory analysis of soil samples for radiological and chemical impacts; and
5. Data interpretation and reporting.
4.2 Data Quality Objectives (DQOs) Process
The Data Quality Objectives (DQOs) process is a seven step planning approach used to
prepare plans for environmental data collection activities. The purpose of establishing Data
Quality Objectives (DQO) is to ensure that the field investigations and subsequent analyses
are undertaken in a way that ensures the reporting of data is reliable.
As identified in Appendix IV of the Guidelines for the NSW Site Auditor Scheme (2nd Edition)1
a series of steps are involved in the DQO process. They are:
1. State the problem
2. Identify the decision
3. Identify inputs to the decision
4. Define the study boundaries
5. Develop a decision rule
6. Specify limits on decision errors
7. Optimise the design for obtaining data
4.2.1 Step 1 – State the Problem
The radiological and chemical assessment is being undertaken to provide suitable data to
enable decisions to be made regarding the future management of fill material underneath the
building footprint of No. 11 Nelson Parade and the remainder of the surrounding property.
1 NSW DEC 2006, Contaminated Sites: Guidelines for NSW Site Auditors Scheme

- 31 -
ANSTO - COMMERCIAL IN CONFIDENCE -
The objective of the program is to assess the radiological and chemical content of fill material
below the building footprint and surrounding areas and compare this against natural levels of
background radiation in the surrounding environment and against radiological and chemical
waste classification guidelines.
4.2.2 Step 2 – Identify the Decision
The key decisions to be made as a result of the assessment are:
• Is the radiological content of the soil distinguishable from natural background levels;
and
• What are the radiological and chemical classifications of the soil with respect to the
relevant NSW waste classification guidelines?
4.2.3 Step 3 – Identify Inputs to the Decision
A number of inputs were required in the decision making process. These included:
• Historical information gained from previous related reports and historical records of
the area;
• Identification of elevated levels of radiological materials via direct probe monitoring;
• Intrusive sampling of soil to a depth of 2 m or bedrock;
• Quantitative data obtained from intrusive soil sampling and analytical investigation;
and
• Comparison of data with appropriate screening level criteria.
4.2.4 Step 4 – Define the Study Boundaries
The lateral boundaries of the survey area are described in the Introduction and viewed in
Figure 1.
The vertical boundaries of the survey were to a depth of 2 metres of soil or to bedrock.
Previous studies of adjacent areas indicated no clearly defined stratification of radiological
materials within the vertical profile.
4.2.5 Step 5 – Develop a Decision Rule
Project data collected were compared to the radiological data from the background samples
to determine if statistically the results are indistinguishable from background levels.
If the results of sampling areas are distinguishable above background levels, project data
collected from these areas were compared to the appropriate NSW DECC guidance
material for classification of chemical and radiological waste materials.
The classification of the soil in terms of potential waste was determined against the DECC
Waste classification guidelines, Part 1: Classifying Waste (2009) and Part 3: Waste
Containing Radioactive Material (2008)
Asbestos was reported only if it is visible on the site, and as either presence or absence of
friable and bonded asbestos. If friable or bonded asbestos were present, then this would

- 32 -
ANSTO - COMMERCIAL IN CONFIDENCE -
have been quantified and reported in terms of volume and location and its presence
assessed to allow for appropriate classification of the waste.
4.2.6 Step 6 – Specify the Limits on Decision Errors
Two primary decision errors may have occurred due to uncertainties or limitations in data:
• Type A error: An investigation area may have been assessed to pose no
unacceptable risk when in reality it did (a false negative). This may be due to
limitations in the sampling plan or unreliable data sets.
• Type B error: An investigation area may have been assessed to pose an
unacceptable risk when in reality it didn’t (a false positive). This may be due to
inappropriate sampling, sample handling or analytical procedures.
The reliability of both the field and laboratory programs were assessed in terms of the Data
Quality Indicators (DQIs - precision, accuracy, representativeness, completeness and
comparability), as set out in Appendix V of NSW DEC (2006).Guidelines for the NSW Site
Auditor Scheme (2nd edition). The laboratory program for analysis of radiological and
chemical impacts is separate, as the DQI’s for precision and accuracy are addressed
separately.
Precision
Precision is a measure of agreement among replicate measurements of the same property,
under prescribed similar conditions2.
Precision of Radiological data is achieved by collection and analysis of duplicate samples.
Blind duplicate samples are collected at a rate of not less than one per 20 (i.e. 5%) soil
samples and are assessed by comparing the relative percentage difference in activity
between the anonymous samples. Samples were mixed and homogenised on site before
being split into duplicates.
Precision of Chemical data is achieved by collection of Blind (one per 20 samples) and Split
(one per 20) duplicate samples. Analysis of samples for chemical impacts was undertaken
at NATA accredited laboratories for both Primary and Secondary samples.
Accuracy
Accuracy is a measure of the trueness of a measuring system, which is determined by the
closeness of measurements of standards compared to their known true value.
Accuracy of Radiological data was achieved by using ANSTO Building 21 Gamma Ray
Spectrometer in compliance with ANSTO procedure VP-2747 for sample preparation,
system operation and quality maintenance. This includes calibration of the instrument
against reference standards. The Gamma Ray Spectrometer system also scored ‘A’ under
annual International Atomic Energy Agency (IAEA), Worldwide Proficiency Testing for
‘trueness’ and ‘precision’.
Accuracy of Chemical data was achieved by using laboratory methodologies in accordance
with those stipulated by NATA accreditation scheme.
2 Multi Agency Radiation Survey and Site Investigation Manual (MARSSIM) 2000, Rev.1

- 33 -
ANSTO - COMMERCIAL IN CONFIDENCE -
Representativeness
Representativeness is a measure of the degree to which data accurately and precisely
represent a characteristic of a population parameter at a sampling point.
Representativeness of data was achieved by collecting samples and data in an appropriate
pattern across the site and by collecting a suitable number of samples to characterise the
site. This soil sampling program complied with the NSW EPA Sampling Design Guidelines3.
A systematic sampling pattern was used, as specified in Section 2.6 of the guidance
material MARSSIM (2000). Samples were collected every 10 metres external to the
building footprint and every 2.5 metres inside the building footprint, at a greater population
than the above mentioned NSW EPA, Sampling Design Guidelines recommends.
Completeness
Completeness is a measure of valid data obtained, expressed as a percentage of the total
measurements made.
Sufficient valid data was generated during the study.
Comparability
Comparability is a qualitative term expressing the confidence with which subsequent data
sets within a study may be compared, specifically with respect to field, laboratory and
interpretation.
Comparability was achieved through maintaining a level of consistency in sampling
techniques, sample handling techniques, analytical laboratory techniques and reporting
methodology.
4.2.7 Step 7 – Optimise the Design
To determine the most resource-effective sampling and analysis program, a sampling and
analysis plan was prepared. ANSTO and CH2M Hill conducted fieldwork in accordance with
their quality management system which specifies field techniques, sample collection,
analytical sample counting and assessment, and sample management (chain of custody).
The program was also prepared with guidance from MARSSIM (2000). The general
methodology is outlined in the ‘Methodology’ above.
4.3 Fieldwork Methodology
A continuous radiological survey was undertaken across the entire site using 2 inch NaI
detectors at a distance of approximately 5 centimetres above the ground, in lines 1 metre apart
across the site. Areas where access was not possible were omitted from the continuous survey.
Results were recorded manually at intervals of 1 metre on a map of the site. Additional results
were recorded if an area of significantly elevated radioactivity was detected, to identify the
boundaries of the elevated activity. All detectors were checked in accordance with ANSTO
Instruction S-ROH-I-006 Operational Checks – Health Physics Contamination Monitors prior to
use. All detectors performed satisfactorily during the radiological survey.
3 NSW EPA (1995), Contaminated Sites: Sampling Design Guidelines

- 34 -
ANSTO - COMMERCIAL IN CONFIDENCE -
Soil borings were advanced across the site using a concrete drill (if required) and hand auger to
a maximum depth of two mbgl or until refusal. Each soil boring was backfilled with the material
removed and each boring through the floor was capped with a steel plate.
Photo 3. Bore hole locations in pool area of the building
Photo 4. Bore hole through concrete floor slab, and soil sample inside the building
Sample locations were based on a systematic grid pattern. A site plan indicating the boring
locations is provided on Appendix B.
Soil samples were collected from every boring at a frequency of one sample per
0.5 mbgl or if visual or olfactory signs of contamination were observed. Samples scheduled for
analysis for volatile compounds were collected directly from the auger head to minimise
disturbance of the sample and the potential loss of volatile contaminants. The remaining soil
was then transferred to a stainless steel container to allow homogenisation of the sample prior
to collection. In addition, material for radiological analysis was collected in a laboratory-supplied

- 35 -
ANSTO - COMMERCIAL IN CONFIDENCE -
plastic jar. Samples for confirming the presence and / or absence of asbestos were placed in
laboratory-supplied re-sealable sample bags.
Photo 5. Capped bore holes in pathway beside the building
A soil boring log was completed at each location. It includes a description of the lithology
observed, details of the samples collected and any observations of visual or olfactory signs of
contamination (Appendix F).
All soil samples collected were screened in the field during sample collection for volatile organic
compounds with a photoionisation detector (PID). The reported PID readings for each sample
were noted on the corresponding boring log (Appendix F). Between each reading, the PID was
allowed to stabilise to normal background air quality conditions.
Table 4 summarises the number of soil borings per area of the Site.
Table 4
Summary of Soil Borings
Waste Classification Report
Area Identification Total No. of Soil Borings Maximum Depth Achieved (mbgl)
B 6
(B1, B2, B3, B4, B6, B8) 1.00
J 13
(J1, J2, J4, J6, J7, J8, J9, J10 , J12, J14, J15, J16, J17)
1.10
K 1
(K1) 0.30
L
15
(L1, L2, L4, L5, L7, L8, L9, L10, L11, L12, L13, L14, L15,
L16, L17)
1.30

- 36 -
ANSTO - COMMERCIAL IN CONFIDENCE -
4.3.1 Service Clearance
All sample locations were cleared for services using Dial-before-you-dig information and
an electromagnetic sweep by an accredited service locator. If services were identified at
a proposed sample location, the sample location was relocated to the nearest safe
location.
In addition a radiological survey was undertaken of the site prior to the collection of
samples, as specified in the risk assessment for the sampling program.
4.3.2 Sampling and Analytical Program
Radiological
Soil samples collected for radiological analysis were analysed at ANSTO’s
environmental analysis gamma spectroscopy laboratories in Sydney for the analysis
listed in Table 1.
Chemical
Soil samples collected for chemical analysis were submitted to ALS Laboratory Group
(ALS) in Sydney for the analysis listed in Table 2
ALS Laboratory Group was used as the primary laboratory and Envirolab Services
(Envirolab) was used as the secondary laboratory.
4.3.3 Sample Handling and Transport Methods
All samples were labelled with a unique identifier consisting of the sample location (i.e.
K1_1), date collected and sampler. A field worksheet was completed for each sample
including depth of sample, required analysis, time of sample collection and signature of
the sampler.
Samples for analysis of volatile compounds (i.e. BTEX and TPH (C6-C9)) were placed in
150 mL laboratory prepared and supplied glass jars. Samples for the analysis of heavy
metals, TPH (C10-C36), PAH, OCP and PCB were placed in 250 mL glass jars.
Soil samples collected for chemical analysis were kept cool in eskies containing ice and
sent on the day they were collected via courier to ALS. Each sample shipment had
accompanying chain of custody (CoC) documentation.
Samples of no less than 200g for analysis of radiological activity were placed in air-tight
sealable 1L plastic containers. As the radiological activity of the samples does not
degrade with temperature, there is no requirement to transport the samples for
radiological analysis packed in ice. Upon receipt of the samples for radiological analysis,
the samples were prepared by being crushed, large pieces of organic material removed
and then dried in an oven to reduce the moisture content of the sample. The 100g
samples were then weighed and re-sealed in their screw capped containers using a
silicone sealant for a period of at least 3 weeks to allow the in-growth of the radon decay
products present in each of the decay chains. Samples were then counted on the
calibrated gamma spectroscopy system for a period of 24 hours each sample.

- 37 -
ANSTO - COMMERCIAL IN CONFIDENCE -
4.3.4 Field Equipment Calibration
The PID used by CH2M HILL to screen for the presence of volatile contaminants was
calibrated on a daily basis using an isobutylene calibration gas and according to the
manufacturer’s instructions. Certificates recording the daily calibration results are
included in Appendix G.
Each of the radiological monitoring devices and electronic personal dosimeters was
calibrated and recorded on an annual basis in accordance with ANSTO Instrument
Calibration quality procedure S-RIC-P-001 against known standards.
Instruments underwent a daily instrument response check against natural background
radiation.
4.3.5 Decontamination Methods
The decontamination of personnel, personal protective equipment (PPE) and sampling
equipment was performed in accordance with the procedures outlined in CH2M HILL’s
standard operating procedures (SOP), to minimise risks to health and safety and
prevent cross-contamination of contaminants.
At each sample location a new set of disposable nitrile gloves was used to collect the
soil sample. Between each sample location, all soil sampling equipment was
decontaminated using a scrubbing brush and a solution of Decon90 and tap water to
remove soil material, followed by a rinse in deionised water. A rinsate sample was
collected by pouring deionised water over the decontaminated hand auger. This rinsate
sample was submitted for analysis to assess potential cross contamination which may
have occurred between sampling locations.
At the conclusion of each day of fieldwork, disposable sampling equipment and PPE,
including coveralls, gloves, PID bags and dust masks, were collected and scanned with
a radiation contamination monitor to determine whether any residual radiological
contamination was present. After the scan, the equipment was secured in a rubbish bag
and stored at the Site awaiting later disposal. In addition, to prevent potential exposure
to the courier driver, the samples that were to be dispatched to the laboratory were
scanned to ensure that residual radiological contamination was not present outside the
sample jars or on the outside of the esky.
- 38 -
ANSTO - COMMERCIAL IN CONFIDENCE -
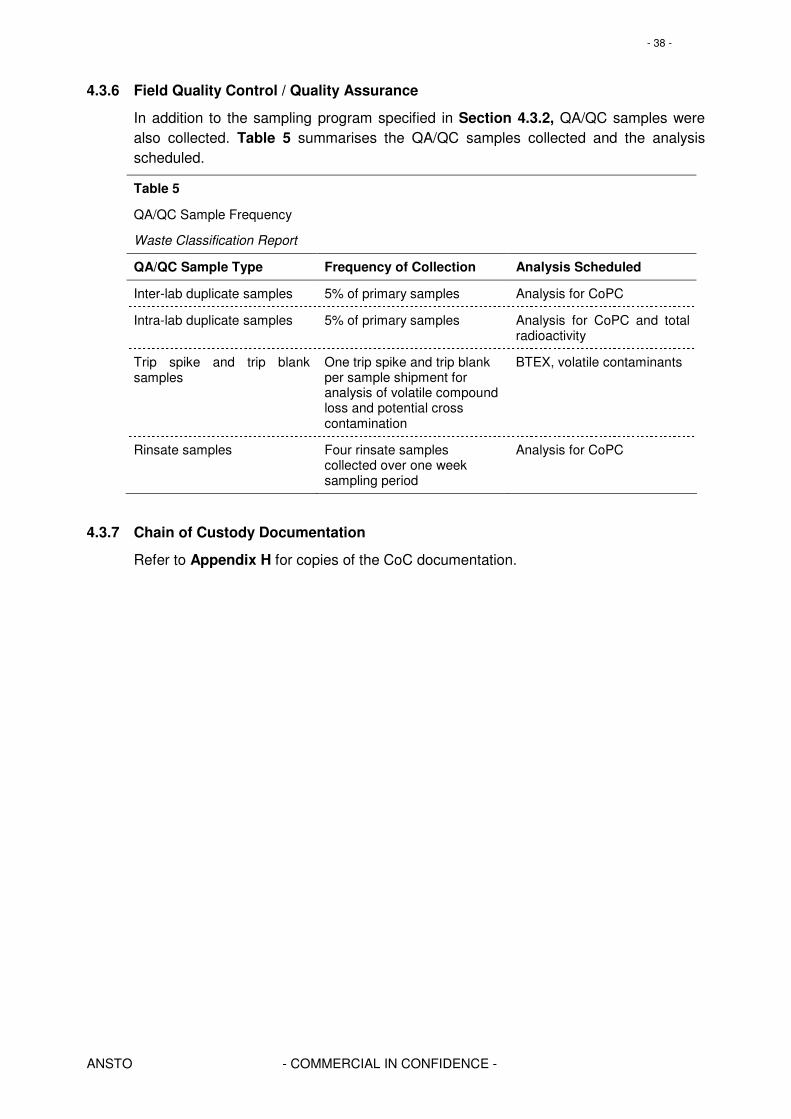
4.3.6 Field Quality Control / Quality Assurance
In addition to the sampling program specified in Section 4.3.2, QA/QC samples were
also collected. Table 5 summarises the QA/QC samples collected and the analysis
scheduled.
Table 5
QA/QC Sample Frequency
Waste Classification Report
QA/QC Sample Type Frequency of Collection Analysis Scheduled
Inter-lab duplicate samples 5% of primary samples Analysis for CoPC
Intra-lab duplicate samples 5% of primary samples Analysis for CoPC and total radioactivity
Trip spike and trip blank samples
One trip spike and trip blank per sample shipment for analysis of volatile compound loss and potential cross contamination
BTEX, volatile contaminants
Rinsate samples Four rinsate samples collected over one week sampling period
Analysis for CoPC
4.3.7 Chain of Custody Documentation
Refer to Appendix H for copies of the CoC documentation.

- 39 -
ANSTO - COMMERCIAL IN CONFIDENCE -
5. Investigation Results
The fieldwork undertaken as part of this investigation was completed between 23 and 27
August 2010. The location of each of the soil borings are shown in Appendix B. The following
sections describe the findings of the waste classification investigation at the Site.
5.1 Field Observations
The lithology encountered during the advancement of the soil borings was consistent across
the areas investigated. Fill materials consisted of orange / brown silt and sand topsoil with
frequent inclusions of angular sandstone fragments. Fill material was underlain by Hawkesbury
sandstone that outcrops along the banks of the Parramatta River.
PID readings reported during the investigation were low (< 2.3 ppm) and there were no
olfactory signs of chemical contamination observed. Infrequent glass, brick fragments and
gravel were identified in fill materials. Potential ACM was not identified at the locations
investigated or observed on the surface of the Site.
5.2 Analytical Results
The following sub-sections provide an assessment of the radiological and chemical results
against different adopted assessment criteria.
For the purpose of the results discussion, the areas of the site investigated have been
combined into the following location groupings (LG) based upon their property boundaries and
usage:
• LG2 – Outdoor area of No. 11 Nelson Parade (Area B), excluding foreshore.
• LG3 – Building footprint of No. 11 Nelson Parade (Areas J, K and L)
Area LG3 was sub-divided into two sub –areas:
� LG3.1 – Reduced Building footprint of No. 11 Nelson Parade (from Areas
J, K and L), see Figures 3 to 8;
� LG3.2 – Remainder of building footprint on No. 11 Nelson Parade
including the pool area, veranda and driveway (from Areas J and L), see
Figures 3 to 8.
5.2.1 Assessment of Building Footprint Against Background
As discussed previously, isotopes in the U-238, U-235 and Th-232 decay chains exist naturally
in the environment. The material underneath the building footprint of No.11 Nelson Parade was
assessed to determine if the isotopes present are at levels significantly above natural
background levels, i.e. are the concentrations distinguishable from background?
The methodology, known as ‘Scenario B’, for determining if radioactivity is indistinguishable
from background contained in MARSSIM (2000) and the U.S. Nuclear Regulatory Commission
NUREG-1505 Nonparametric Statistical Methodology for the Design and Analysis of Final
Status Decommissioning Surveys (1998) was used in the assessment.
The Null Hypothesis in Scenario B is that ‘Measurements in the survey area are
indistinguishable from those in the background samples’.

- 40 -
ANSTO - COMMERCIAL IN CONFIDENCE -
Five background samples were taken from an area adjacent to the site at Nelson Parade and
suburbs near Hunters Hill (Five Dock, Huntley’s Cove, Padstow and Ryde – See Table 23).
These background samples were grouped into two groups, with the two samples in closest
geographical proximity grouped together and the remaining three samples from surrounding
suburbs grouped together during comparisons.
A walk over radiation survey was conducted inside the building and underneath any accessible
areas under the building footprint. Variations in readings were detected inside the building,
however, due to the shielding of the fill material offered by the thick concrete floor slab, less
reliance could be placed upon these results than in the unshielded areas such as in the yard of
the property. In general, higher readings were detected on the eastern side of the building;
however after completing further investigation this was determined to likely be a result of
ambient dose rates from the previously identified radiological material on the adjacent property,
No. 9 Nelson Parade.
Soil samples were taken at an increased population (every 2.5 metres) through holes drilled
through the floor slab inside the building and through the driveway. Samples were only taken at
locations where bedrock or fill material were directly beneath the floor level. As a result no
sample locations were identified on Level 2 of the building.
A number of samples were unable to be analysed because that part of the building resided on
bedrock with no or insufficient amounts of loose fill material present (see Key in Figures 3, 4
and 5).
Samples were analysed using gamma spectroscopy, with the radiological results of different
isotopes within the same decay chain analysed to determine the ratios of isotopes and assess
if the decay chains were in a state of secular equilibrium. From this the total activity for all of the
isotopes in the U-238, U-235 and Th-232 decay chains were calculated and used as the
predominate driver in the assessments. The results are summarised in Appendix D.
The locations of the soil samples collected within the footprint of the building on each floor of
the building are shown in Figures 3, 4 and 5.
Each of the samples collected within the footprint of the building including the driveway area
and rear patio were analysed to determine if the levels of radioactivity were distinguishable
from the naturally occurring radioactivity present in the environment using both the Wilcoxon
Rank Sum (WRS) Test and the Quantile Test.
Analysis of all of the 35 samples in the footprint area (LG3.1 and LG3.2) indicated above,
compared against the background samples, resulted in the footprint passing the WRS test, as
the Rank Sum of 659 was below the Critical Value of 765. The results were also tested against
the Quantile Test and passed. As the null hypothesis was not rejected in either test, the fill
material beneath the building footprint (Areas 3.1 and 3.2 combined) is proven to be
indistinguishable from background.
The highest total radioactivity measured under the building footprint was from samples taken
from the driveway and pool area (LG3.2). Although not required, in order to provide additional
information on the spatial distribution and concentration of the radiological material, further
analysis of the samples was undertaken. Sections of the building footprint which were more
accessible such as the rear patio, the pool area and the driveway were excluded from the
analysis, as shown in Figures 6, 7 and 8.

- 41 -
ANSTO - COMMERCIAL IN CONFIDENCE -
Analysis of the remaining 14 (L1, L2, L2.2, L4, L4.2, L4.3, L5, L7, L10, L14, L15, K1, J6 and J9)
samples in the reduced footprint (LG3.1), directly beneath the main section of the building,
were tested using the WRS test and passed, as the Rank Sum of 105 was below the Critical
Value of 161, as shown in Appendix I. The results were also tested against the Quantile Test
and passed. As the null hypothesis was not rejected in either test, as expected, the fill material
beneath the reduced building footprint (Area LG3.1) is proven to be indistinguishable from
background.

ANSTO - COMMERCIAL IN CONFIDENCE -
L1 L2
L6
L10
L14
L4
L15 L17 L16
L13 L12 L11
L7 L9 L8
L5
L3
Key
Sample location Insufficient material for analysis
Figure 3. Borehole locations on Level 4 (top level) of the building footprint (LG 3.1 and LG 3.2)

- 43 -
ANSTO - COMMERCIAL IN CONFIDENCE -
K1
Figure 4. Borehole locations on Level 3 (middle level) of the building footprint (LG 3.1 and LG 3.2)

- 44 -
ANSTO - COMMERCIAL IN CONFIDENCE -
J17
J1
J16
J12 J14
J4
J7 J8
J20
J9
J6
J3 J2
J15
J13 J10
J18 J19
J5
J11
Figure 5. Borehole locations on Level 1 (lower level) of the building footprint (LG 3.1 and LG 3.2)

- 45 -
ANSTO - COMMERCIAL IN CONFIDENCE -
Figure 6. Samples on Level 4 (upper level) included in reduced footprint assessment (LG 3.1)
L1 L2
L10
L14
L4
L15
L7
L5

- 46 -
ANSTO - COMMERCIAL IN CONFIDENCE -
K1
Figure 7. Samples on Level 3 (middle level) included in reduced footprint assessment (LG 3.1)

- 47 -
ANSTO - COMMERCIAL IN CONFIDENCE -
J9
J6
Figure 8. Samples on Level 1 (lower level) included in reduced footprint assessment (LG 3.1)

ANSTO - COMMERCIAL IN CONFIDENCE -
The remainder of the property (Area LG2) external to the building footprint was assessed to
determine if the radioactivity in the fill material was indistinguishable from natural background
levels using both the Wilcoxon Rank Sum (WRS) Test and the Quantile Test.
Analysis of all of the 8 samples in the area external to the building footprint (Area LG2),
compared against the background samples, resulted in the footprint failing the WRS test, as the
Rank Sum of 71 was above the Critical Value of 69. As the results failed the WRS Test, they
were not tested against the Quantile Test. As the null hypothesis was rejected by the WRS test,
the fill material beneath the building footprint is not indistinguishable from background.
5.2.2 Assessment of the Building Footprint and the Remainder of the Property against Waste Classification Guidelines
To provide a suitable level of information to enable decisions to be made regarding the
management of this area, the reduced building footprint (LG3.1), the excluded sections of the
reduced building footprint (LG3.2) and the remainder of the site (LG2) were analysed and
compared against the State guidelines on classification of the material for disposal. The
following sub-sections provide an assessment of both the chemical and radiological results
against the adopted assessment criteria for each of the three areas. The waste classification of
fill materials is included in this report to provide additional guidance, only, if any future decisions
are made to remediate any part of the site. This inclusion does not imply that remediation of
any part of the site is required.
Chemical results were initially compared to Contaminant Threshold (CT) values for general and
restricted solid waste, prior to an assessment based on representative TCLP concentrations. It
is noted that some contaminants, such as total PAH, do not have an associated CT value. In
those cases, the Specific Contaminant Concentrations (SCC) were therefore adopted as the
most appropriate assessment value.
Based upon the walk over radiation survey results of the areas and previous survey results,
slightly elevated levels of activity were detected across the rear yard of No. 11 Nelson Parade.
Radiological results of different isotopes within the same decay chain were analysed to
determine the ratios of isotopes and assess if the decay chains were in a state of secular
equilibrium.
From this analysis the total radioactivity of the samples were calculated and compared against
the Contaminant Threshold values for general and restricted solid waste.
5.2.3 Radiological Results – Waste classification
Spatial Distribution
As described in the methodology above, radiological mapping was undertaken of all of the
areas surrounding the building footprint using 2 inch NaI detectors and Geiger-Muller detectors,
and a continuous ‘walk-over’ survey technique at a distance of approximately 5cm above the
ground along lines at a nominal separation of 1 m, but with allowance for inaccessible areas.
These results provided an increased representation of the spatial distribution of radioactive
material across the site. This allowed for significantly increased identification of contaminant
‘hotspots’ and aided in ensuring that samples were representative of the entire site. These
results have been plotted and presented in Appendix A in units of relative levels of
radioactivity (counts per second, cps). It should be noted that due to the shielding offered by

- 49 -
ANSTO - COMMERCIAL IN CONFIDENCE -
the concrete suspended floor slab the relative levels of radioactivity within the building were
measured but were not mapped.
As can be seen by the plot, the radioactivity is not distributed homogeneously across the site.
However it did provide additional confidence that the location of the soil sample sites provided a
suitable representation of the radiological contaminants present outside of the building footprint.
It also allowed the identification of the location and extent of any radiological ‘hotspots’ which
did not fall in a soil sample site.
Secular Equilibrium
Due to the history of the site, the predominant radiological contaminants of concern were
isotopes from the uranium-238 decay chain, and to a lesser extent isotopes from the thorium-
232 and uranium-235 decay chains.
If undisturbed for a suitable period of time, these decay chains will be in a state of secular
equilibrium, where the ratios between each isotope in the decay chain are the same. However if
the material has been processed it is probable that the equilibrium of the decay chain has been
disturbed. This can have a significant influence over the total activity of the sample being
analysed and the total activity of the sample at a later time period.
Soil samples collected were analysed for a number of isotopes from different parts of each of
the decay chains. This allowed a comparison of the ratios of the isotopes in a chain to
determine if they are in secular equilibrium and if not, where the decay chain has been
disrupted.
In the analysis of the samples by gamma spectroscopy, to determine the total activity of the
samples, the following assumptions were made:
• The concentration of Th-234 was assumed to be representative of U-238, Pa-234, U-
234 and Th-230 in the U-238 decay chain (Pa-234 and Th-230 were also measured).
• The concentration of Pb-210 was assumed to be representative of Rn-222, Po-218, Pb-
214, Bi-214, Po-214, Bi-210 and Po-210 in the U-238 decay chain.
• As Bi-214 and Pb-214 have very short half lives, they were comparable to Pb-210
measured activities (Pb-210, Bi-214 and Pb-214 were all measured) to confirm or reject
the above assumption in the U-238 decay chain.
• The concentration of Ra-224 was assumed to be representative of Th-232, Ra-228, Ac-
228 and Th-228 in the Th-232 decay chain (Th-228 was measured but had a high lower
limit of detection on the gamma spectrometer).
• As Th-228 and Ac-228 have relatively short half lives, they were comparable to Ra-224
measured activities (Ac-228, Th-228 and Ra-224 were all measured) to confirm or reject
the above assumption in the Th-232 decay chain.
• The concentration of B-212 was assumed to be representative of Rn-220, Po-216, Pb-
212, Bi-212, Po-212 (64%) and Tl-208 (36%) in the Th-232 decay chain.
• As Pb-212 and Tl-208 have relatively short half lives, they were comparable to Bi-212
measured activities (Pb-212, Bi-212 and Tl-208 were all measured) to confirm or reject
the above assumption in the Th-232 decay chain.

- 50 -
ANSTO - COMMERCIAL IN CONFIDENCE -
Therefore, comparison of the Th-234 activity (upper part of the U-238 decay chain) against the
Pb-210 activity (lower part of the U-238 decay chain), and the Ra-224 activity (upper part of the
Th-232 decay chain) against the Bi-212 activity (lower part of the Th-232 decay chain) provided
some indication of the level of secular equilibrium of the U-238 and Th-232 decay chains.
A number of the results were reported as ‘less than’ figures due to the lower limit of detection of
the detectors. Where possible, if a ‘less than’ figure was reported, another suitable isotope was
used for comparison, based on the above assumptions (See Table 27). Analysis of the 43
samples resulted in 16 samples from the U-238 decay chain and 4 samples from the Th-232
decay chain having the key isotopes reported as ‘less than’ figures. The 27 samples from the
U-238 decay chain and 39 samples from the Th-232 decay chain were therefore able to be
compared.
The average RPD% for the U-238 decay chain was 41% for samples where the upper part of
the decay chain was a higher ratio than the lower portion, and 50% where the lower part was a
higher ratio than the upper portion. On average the RPD% was 23%. The average RPD% for
the Th-232 decay chain was 13% for samples where the upper part of the decay chain was a
higher ratio than the lower portion, and 19% where the lower part was a higher ratio than the
upper portion. On average the RPD% was 12%.
Analysis suggests that the radioactive material from each of the decay chains is not quite in
secular equilibrium but in many cases is close. In general the majority of samples indicated a
slightly higher activity for the isotopes in the lower part of the decay chains than the upper part.
The total radioactivity of the sample from the different decay chains can be calculated by the
multiplication of an isotope’s activity by the number of isotopes present in the decay chain. In
the case of the U-238 decay chain the total activity is a multiplication of the Pb-210 activity, and
in the case of the Th-232 decay chain the total activity is a multiplication of the Bi-212 activity.
As the results indicate that the samples are close to a state of secular equilibrium, the total
activity of the samples, and as a consequence the results of the assessment, will not vary
significantly due to in-growth of decay products over time.
Where there is significant disequilibrium, overall there is a slight increase in the measured
activities of isotopes in the lower part of the decay chain in most samples. With regard to
change in activity over time due to ingrowth, this would only lead to a slight over-estimation of
total radioactivity of each sample, and not under-estimation.
Vertical Distribution
Across the site there existed no clear stratification of radiological material deposition. In some
sample locations stratification of material did exist; however this was generally localised and
not consistent across the site. Where a variation in activity was detected in a single borehole,
multiple samples were taken at differing depths and analysed separately. To represent the
material from a single bore hole being homogenised prior to assessment, the individual results
from samples taken at different depths in a single borehole were averaged. As the samples
containing the highest activity and second highest activities in each borehole were analysed,
this methodology would result in a slightly higher activity being reported than if all of the
samples from a single borehole were homogenised prior to analysis. However it did provide
additional information on the highest activities present on the site.

- 51 -
ANSTO - COMMERCIAL IN CONFIDENCE -
Radioactivity Results
The total activity of the soil samples was calculated by summing the total activity of isotopes
from the uranium-238, thorium-232 and uranium-235 decay chains. These were compared
against the total activity limits for classification as General Solid Waste and Restricted Solid
Waste. The results are reported as total activity and do not subtract background readings.
The total number of samples collected, as reported in Table 7 below, represents the total
number of boreholes sampled. The total number of samples analysed, including where multiple
samples were analysed for a single borehole are indicated in parenthesises in italics.
Table 7
Summary of Total Activity Exceedances
Waste Classification Report
Total Activity Limit (gross)
Location No. of Samples Collected
No. of Criteria Exceedances
Maximum Concentration
(Bq/g)
>1 Bq/g
LG2 6, (8) 5, (7) 115 (B6-1)
LG3 29 (35) 7 (7) 4 (J20-1)
Total 25 (34) 22 (31)
>100 Bq/g
LG2 6, (8) 1, (1) 115 (B6-1)
LG3 29 (35) 0 (0) 4 (J20-1)
Total 25 (34) 4 (5)
Note: The location(s) of the maximum concentration is indicated in the last column in parenthesises

- 52 -
ANSTO - COMMERCIAL IN CONFIDENCE -
5.2.4 Chemical Results – Waste Classification
Heavy Metals
Heavy metals that exceeded the CT1 and CT2 adopted assessment criteria included arsenic,
lead and mercury. All other heavy metals were below the respective criterion. A summary of the
number of exceedances and the maximum concentration detected in each of the LGs is
provided in Table 8.
Table 8
Summary of Heavy Metal Exceedances
Waste Classification Report
Analyte [CT1 Value] Location Grouping
No. of Samples Collected
No. of Criteria Exceedances
Maximum Concentration
(mg/kg)*
Arsenic [100 mg/kg]
LG2 8 1 106 (B6-1)
LG3 35 0 16 (J20-1)
Lead [100 mg/kg]
LG2 8 2 361 (B6-1)
LG3 35 0 92 (J1-1)
Mercury [4 mg/kg]
LG2 8 0 0.2 (B6-1 & B8-1)
LG3 35 0 0.4 (L7-1)
Table Notes: * - Sample location/s at which maximum concentration was detected is shown in parenthesises.
Organics
Organic contaminants in exceedance of the adopted waste classification criteria were limited to
BaP and total PAH. A summary of the number of exceedances and the maximum concentration
detected in each of the LGs is provided in Table 9.

- 53 -
ANSTO - COMMERCIAL IN CONFIDENCE -
Table 9
Summary of total PAH and Benzo(a)pyrene Exceedances
Waste Classification Report
Analyte [CT1 Value
Location Groupin
g
No. of Samples Collected
No. of Criteria Exceedances
Maximum Concentration
(mg/kg)
Benzo(a)pyrene [0.8 mg/kg]
LG2 8 2 1.6 (B8-1)
LG3 35 5 7.7 (L12-2)
Total PAH [200 mg/kg]*
LG2 8 0 20.6 (B8-1)
LG3 35 0 117.9 (J16-1)
Table Notes: Samples in which the maximum concentration was detected are shown in parenthesises. * No CT1 exists for Total PAH. Value shown is the associated SCC1 value.
Asbestos
Potential ACM was not observed at any of the sample locations or on the surface of the Site.
5.2.5 Toxicity Characteristic Leaching Procedure Results
Field observations and analytical results for each LG were reviewed with reference to
the NSW DECC (2008) guidelines. Analytical results reporting detections of
contaminants in excess of the laboratory LOR were compared against the respective CT
criteria. Contaminants with concentrations exceeding the CT criteria for General Solid
Waste were considered to be the CoPC likely to drive the waste classification process.
TCLP analysis was scheduled for samples with elevated contaminant concentrations in
each LG to determine the leaching potential of the contaminants. TCLP analysis was
scheduled for each LG where there were exceedances.
Samples identified for TCLP analysis included those with elevated concentrations of
arsenic, lead, mercury and BaP. TCLP results are presented in Appendix I attached to
this report. A summary of the TCLP analysis scheduled for each LG is provided in
Table 10.
Table 10
Summary of Scheduled TCLP Analysis
Waste Classification Report
Location Grouping Sample Location Sample ID TCLP Analysis
LG2 B6 B6-1 Arsenic, Lead
B8 B8-1 Lead, BaP

- 54 -
ANSTO - COMMERCIAL IN CONFIDENCE -
Table 10
Summary of Scheduled TCLP Analysis
Waste Classification Report
Location Grouping Sample Location Sample ID TCLP Analysis
LG3 J1 J1-1 BaP
J16 J16-1 BaP
TCLP results were reported less than the TCLP1 criteria for General Solid Waste as
specified in Table 2 of the NSW DECC (2008) guidelines. Further discussion in relation
to the TCLP results and influence upon the overall waste classification of material in
each LG is provided in Section 5.6.
5.3 Comparison of Statistical Data to Site Assessment Criteria
Chemical
For each LG with samples exceeding the relevant General Solid Waste criteria,
statistical assessment was performed where six or more primary samples were
analysed. A statistical assessment of chemical data was undertaken for LG2 and LG3
using the United States Environmental Protection Agency (USEPA) software package
ProUCL Version 4.0.
In accordance with NSW EPA (1995), the dataset was initially assessed to determine if
it represented a normal, log normal or non-parametric distribution, with the appropriate
method for determining the 95 % UCL value applied. Normal distribution provides a
representative description of data that is centred on the mean. It is the preferred
distribution due to the high probability that the statistical result represents the actual
data. Log-normal distribution is a probability distribution where the logarithm of the
distribution is normal. Log-normal distribution routinely includes variable results as
multiples of the mean. Non-parametric data does not fit any parameterised distribution,
such as normal or log-normal, as is common when heterogeneous fill material is
assessed. Non-parametric data does not invalidate any statistical analysis, but rather
requires that a degree of caution to be attached to the results.
Summary tables presenting the statistical assessment for each LG reporting criteria
exceedances are including in Appendix I.
5.3.1 LG2 – Statistical Data Assessment – Chemical Waste Classification
The statistical data assessment for CoPCs that exceeded the adopted criteria for
samples collected within LG2 is summarised below:
Arsenic – The dataset has a normal distribution with a 95% UCL of 56.96 mg/kg, less
than the SCC1 criterion for General Solid Waste (500 mg/kg). The standard deviation is
less than 50% of the criterion.
Lead – The dataset has a log normal distribution due to a coefficient of variation (1.3)
greater than 1.2. This marginal exceedance is not considered to affect the validity of the
dataset and the Chebyshev method was used to calculate the 95% UCL value of 283.2
mg/kg. This value is less than the SCC1 criterion for General Solid Waste (1,500
mg/kg). The standard deviation is less than 50% of the criterion.
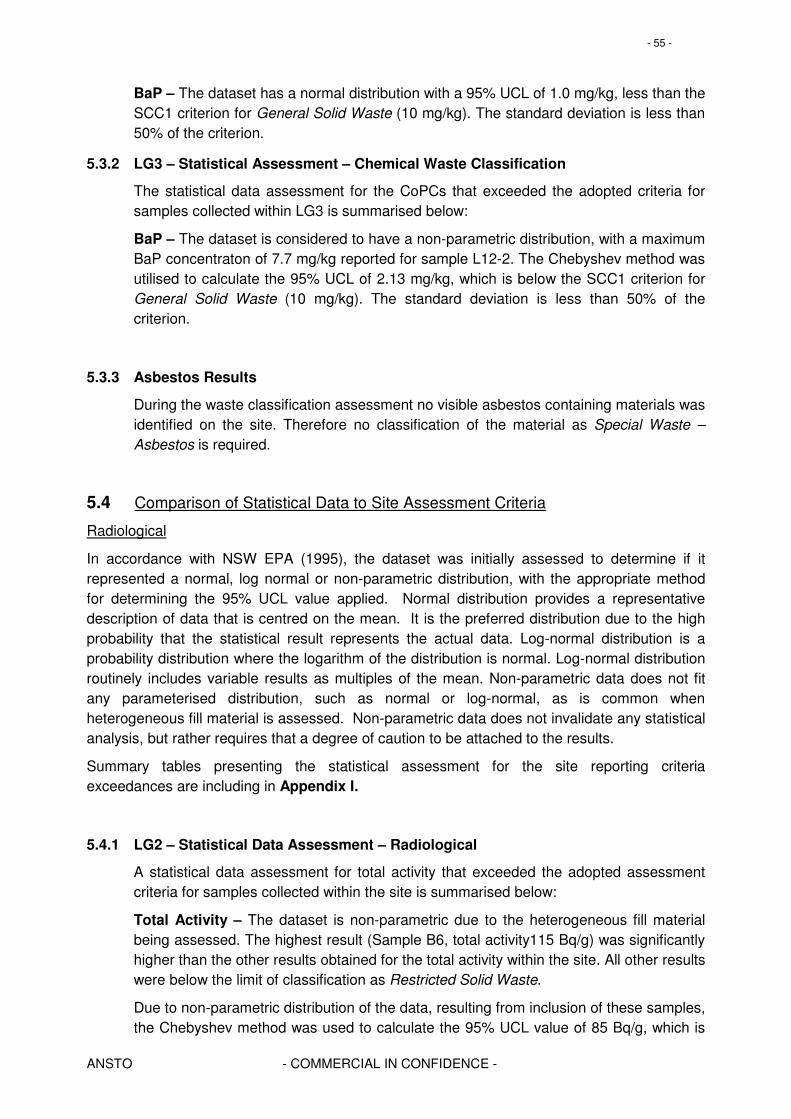
- 55 -
ANSTO - COMMERCIAL IN CONFIDENCE -
BaP – The dataset has a normal distribution with a 95% UCL of 1.0 mg/kg, less than the
SCC1 criterion for General Solid Waste (10 mg/kg). The standard deviation is less than
50% of the criterion.
5.3.2 LG3 – Statistical Assessment – Chemical Waste Classification
The statistical data assessment for the CoPCs that exceeded the adopted criteria for
samples collected within LG3 is summarised below:
BaP – The dataset is considered to have a non-parametric distribution, with a maximum
BaP concentraton of 7.7 mg/kg reported for sample L12-2. The Chebyshev method was
utilised to calculate the 95% UCL of 2.13 mg/kg, which is below the SCC1 criterion for
General Solid Waste (10 mg/kg). The standard deviation is less than 50% of the
criterion.
5.3.3 Asbestos Results
During the waste classification assessment no visible asbestos containing materials was
identified on the site. Therefore no classification of the material as Special Waste –
Asbestos is required.
5.4 Comparison of Statistical Data to Site Assessment Criteria
Radiological
In accordance with NSW EPA (1995), the dataset was initially assessed to determine if it
represented a normal, log normal or non-parametric distribution, with the appropriate method
for determining the 95% UCL value applied. Normal distribution provides a representative
description of data that is centred on the mean. It is the preferred distribution due to the high
probability that the statistical result represents the actual data. Log-normal distribution is a
probability distribution where the logarithm of the distribution is normal. Log-normal distribution
routinely includes variable results as multiples of the mean. Non-parametric data does not fit
any parameterised distribution, such as normal or log-normal, as is common when
heterogeneous fill material is assessed. Non-parametric data does not invalidate any statistical
analysis, but rather requires that a degree of caution to be attached to the results.
Summary tables presenting the statistical assessment for the site reporting criteria
exceedances are including in Appendix I.
5.4.1 LG2 – Statistical Data Assessment – Radiological
A statistical data assessment for total activity that exceeded the adopted assessment
criteria for samples collected within the site is summarised below:
Total Activity – The dataset is non-parametric due to the heterogeneous fill material
being assessed. The highest result (Sample B6, total activity115 Bq/g) was significantly
higher than the other results obtained for the total activity within the site. All other results
were below the limit of classification as Restricted Solid Waste.
Due to non-parametric distribution of the data, resulting from inclusion of these samples,
the Chebyshev method was used to calculate the 95% UCL value of 85 Bq/g, which is

- 56 -
ANSTO - COMMERCIAL IN CONFIDENCE -
below the criteria for Restricted Solid Waste (100 Bq/g). This figure is primarily due to
the high standard deviation of 39 Bq/g against the median activity of 11 Bq/g (average
activity 26 Bq/g) as a result of the inclusion of this sample.
As the identification and a reduction in the potential size of the radiological hotspots on
the area comprising of heterogeneously distributed fill material can be achieved by the
continuous walk over radiological survey of the site (unlike in chemical analysis), the
statistical Sign Test as outlined in MARSSIM was also utilised during the analysis of the
data.
Statistical analysis using the Sign Test (α=0.05) was utilised. Of the 8 samples from the
collective site, 7 of the samples were less than the criteria limit for Restricted Solid
Waste, which meets the requirements of the Sign Test. This, coupled with the results of
the continuous walk over radiological survey, indicates that the hot spots are relatively
small in area and when consideration is given to the total volume of soil present, the
collective site meets the requirements of the Restricted Solid Waste classification.
5.4.2 LG3 (LG3.1 and LG3.2) – Statistical Data Assessment – Radiological
A statistical data assessment for total activity that exceeded the adopted assessment
criteria for samples collected within the entire building footprint is summarised below:
Total Activity (LG3.1 + LG3.2) – The dataset is non-parametric due to the
radioactivities discussed above. The highest results are significantly higher than the
other results obtained for the total activity within the areas. All other results were below
the limit of classification as General Solid Waste.
Due to non-parametric distribution of the data, the Chebyshev method was used to
calculate the 95% UCL value of 1.6 Bq/g, which is below the criteria for Restricted Solid
Waste (100 Bq/g). This figure is primarily due to the standard deviation of 0.8 Bq/g
against the median activity of 0.8 Bq/g (average activity 1.0 Bq/g).
If background readings are subtracted from the samples, the 95% UCL value would be
0.6 Bq/g, which is below the criteria for General Solid Waste (1 Bq/g).
In accordance with MARSSIM, statistical analysis using the Sign Test was utilised. Of
the 35 samples from the collective site, 28 of the samples were less than the criteria
limit for General Solid Waste, which meets the requirements of the Sign Test. This,
coupled with the results of the continuous walk over radiological survey, indicates that
the hot spots are relatively small in area and when consideration is given to the total
volume of soil present and the subtraction of background levels, the collective building
footprint meets the requirements of General Solid Waste classification.
Total Activity (LG3.1 only) – The average activity of the reduced footprint (Area LG3.1
only) is 0.6 Bq/g (inclusive of background) with a standard deviation of 0.3 Bq/g. All of
the samples are below the level for General Solid Waste, as is anticipated from analysis
of the material against background levels in Section 5.2.1. Therefore no further
statistical analysis is required.
Total Activity (LG3.2 only) – The dataset of the areas excluded from the reduced
building footprint (Area LG3.2, see Section 5.2.1) is non-parametric due to the
radioactivities discussed above. The highest results are significantly higher than the
other results obtained for the total activity within the area. All other results were below
the limit of classification as General Solid Waste.
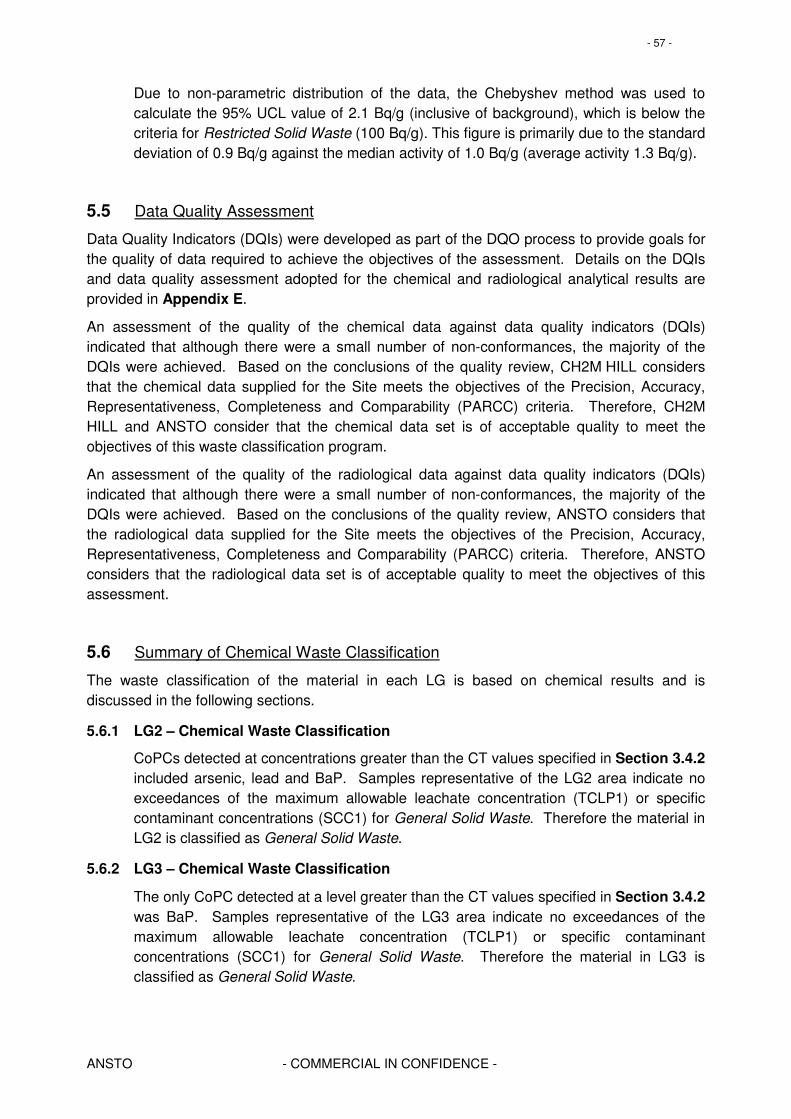
- 57 -
ANSTO - COMMERCIAL IN CONFIDENCE -
Due to non-parametric distribution of the data, the Chebyshev method was used to
calculate the 95% UCL value of 2.1 Bq/g (inclusive of background), which is below the
criteria for Restricted Solid Waste (100 Bq/g). This figure is primarily due to the standard
deviation of 0.9 Bq/g against the median activity of 1.0 Bq/g (average activity 1.3 Bq/g).
5.5 Data Quality Assessment
Data Quality Indicators (DQIs) were developed as part of the DQO process to provide goals for
the quality of data required to achieve the objectives of the assessment. Details on the DQIs
and data quality assessment adopted for the chemical and radiological analytical results are
provided in Appendix E.
An assessment of the quality of the chemical data against data quality indicators (DQIs)
indicated that although there were a small number of non-conformances, the majority of the
DQIs were achieved. Based on the conclusions of the quality review, CH2M HILL considers
that the chemical data supplied for the Site meets the objectives of the Precision, Accuracy,
Representativeness, Completeness and Comparability (PARCC) criteria. Therefore, CH2M
HILL and ANSTO consider that the chemical data set is of acceptable quality to meet the
objectives of this waste classification program.
An assessment of the quality of the radiological data against data quality indicators (DQIs)
indicated that although there were a small number of non-conformances, the majority of the
DQIs were achieved. Based on the conclusions of the quality review, ANSTO considers that
the radiological data supplied for the Site meets the objectives of the Precision, Accuracy,
Representativeness, Completeness and Comparability (PARCC) criteria. Therefore, ANSTO
considers that the radiological data set is of acceptable quality to meet the objectives of this
assessment.
5.6 Summary of Chemical Waste Classification
The waste classification of the material in each LG is based on chemical results and is
discussed in the following sections.
5.6.1 LG2 – Chemical Waste Classification
CoPCs detected at concentrations greater than the CT values specified in Section 3.4.2
included arsenic, lead and BaP. Samples representative of the LG2 area indicate no
exceedances of the maximum allowable leachate concentration (TCLP1) or specific
contaminant concentrations (SCC1) for General Solid Waste. Therefore the material in
LG2 is classified as General Solid Waste.
5.6.2 LG3 – Chemical Waste Classification
The only CoPC detected at a level greater than the CT values specified in Section 3.4.2
was BaP. Samples representative of the LG3 area indicate no exceedances of the
maximum allowable leachate concentration (TCLP1) or specific contaminant
concentrations (SCC1) for General Solid Waste. Therefore the material in LG3 is
classified as General Solid Waste.

- 58 -
ANSTO - COMMERCIAL IN CONFIDENCE -
5.7 Summary of Radiological Waste Classification
The waste classification of the material for the site collectively is based on radiological results
and is discussed in the following sections.
5.7.1 LG2 – Radiological Waste Classification
Radioactive material was detected at varying concentrations across the area. Of the 8
samples collected, 7 of the samples exceeded the criteria for classification as General
Solid Waste and 1 of the samples exceeded the criteria for Restricted Solid Waste
specified in Section 3.3.1.
Statistical assessment of the data resulted in a 95% UCL value less than the criterion of
100 Bq/g total activity. Therefore, the material in the collective area is classified as
Restricted Solid Waste.
5.7.2 LG3.1 – Radiological Waste Classification
Radioactive material was indistinguishable from background levels within the reduced
building footprint.
Therefore, the material in the reduced building footprint is classified as General Solid
Waste.
5.7.3 LG3.2 – Radiological Waste Classification
Radioactive material was detected at varying concentrations across the areas excluded
from the reduced building footprint. Of the 21 samples collected, 7 of the samples
exceeded the criteria for classification as General Solid Waste. None of the samples
exceeded the criteria for Restricted Solid Waste specified in Section 3.3.1.
Statistical assessment of the data resulted in a 95% UCL value less than the criterion of
100 Bq/g total activity. Therefore, the material in the collective area is classified as
Restricted Solid Waste.
- 59 -
ANSTO - COMMERCIAL IN CONFIDENCE -
6. Conclusions and Recommendations
The following conclusions and recommendations are provided based on the chemical and
radiological results reported in this investigation.
The fill material underneath the building footprint of No. 11 Nelson Parade is indistinguishable
from natural background levels of radioactivity.
The fill material in the property surrounding the building is elevated above natural background
radiation levels.
To provide a suitable level of information to enable decisions to be made with regard to the
management of this area, the site was analysed and compared against the State guidelines on
classification of the material for disposal. The following sub-sections provide summaries of both
the chemical and radiological results against the adopted assessment criteria for each of the
three areas. The waste classification of fill materials is included in this report to provide
additional guidance, only, if any future decisions are made to remediate any part of the site.
This inclusion does not imply that remediation of any part of the site is required.
6.1.1 Chemical Waste Classification
The nature of the fill materials across the Site appears to be consistent. Field
observations indicated that the only visual contamination is attributed to pockets of ash,
charcoal and suspected coking waste. Chemical results show that elevated
concentrations of heavy metals, BaP and Total PAH tend to correlate with these isolated
pockets of visually contaminated material.
Through an assessment of both total contaminant concentrations and TCLP results and
consideration of the DECC 1999/05 General Approval of the Immobilisation of
Contaminants in Waste, 1999, the following waste classifications have been
determined:
• LG2 and LG3 = General Solid Waste
6.1.2 Radiological Waste Classification
The nature of the fill materials across the site with regard to radiological content is
variable across the site. Localised concentrations of elevated radioactivity are present
on the site, often where historical back-filling behind walls has occurred. The spatial
extent of these hot spots has been qualified by the use of continuous walk over
radiological surveying. Through an assessment of total radioactive concentrations, the
following waste classifications have been determined:
• LG2 = Restricted Solid Waste
• LG3 (combined) = General Solid Waste
� LG3.1 (only) = General Solid Waste
� LG3.2 (only) = Restricted Solid Waste

- 60 -
ANSTO - COMMERCIAL IN CONFIDENCE -
7. References
ANSTO, Radiological survey of Nelson Parade, Hunters Hill – Stages 1 and 2, June
2009
ANSTO, Sampling and Analysis Quality Plan, In-Situ Classification of Fill Materials at
Nos 5 to 15 Nelson Parade, Hunters Hill for the Purpose of Waste Classification for
State Property Authority NSW, 2010
ERM, Radiological Contamination Assessment 11 Nelson Parade, Hunters Hill, NSW,
Australia, Henry York Davis, August 2008
GHD, Report for Foreshore Land Fronting 5 and 13 Nelson Parade, Hunters Hill, NSW,
Contamination Assessment, June 2009
MARSSIM, Multi-Agency Radiation Survey and Site Investigation Manual, August 2000.
NEPC, National Environment Protection Measure Schedule B(2) Guidelines on Data
Collection, Sample Design and Reporting, 1999
NSW Department of Health, Radiation Branch, radiation survey, 1966
NSW Department of Mineral Resources, Geological Series Sheet 9029-9129,
Wollongong-Port Hacking, 1985
NSW DEC, Contaminated Sites: Guidelines for the NSW Site Auditor Scheme (2nd
edition), April 2006
NSW EPA, Contaminated Sites: Sampling Design Guidelines, September 1995.
NSW EPA, Contaminated Sites: Guidelines for Consultants Reporting on Contaminated
Sites, November 1997
NSW DECC, General Approval of the Immobilisation of Contaminants in Waste,
1999/05, 1999
NSW DECC, Waste Classification Guidelines, Part 1: Classifying Waste, 2008
NSW DECC, ‘Waste Classification Guidelines, Part 3: Waste Containing Radioactive
Material’ (October 2008)
Scott, B. W., Investigation of Radioactive contamination at Nelson Parade Woolwich,
September 1977
Sinclair Knight and Partners, Radium waste clean up Nelson Parade, Hunters Hill,
Review of Environmental Factors, August 1987
US EPA, Calculating Upper Confidence Levels for Exposure Point Concentrations at
Hazardous Waste Sites, December 2002
U.S. Nuclear Regulatory Commission, A Nonparametric Statistical Methodology for the
Design and Analysis of Final Status Decommissioning Surveys, NUREG-1505, Rev. 1,
1998

- 61 -
ANSTO - COMMERCIAL IN CONFIDENCE -
8. Appendix A – Spatial Distribution of radioactive material
Area B: No11 Nelson Parade Backyard
Note: Contour scaling customised for this map to highlight variations in relative activity

- 62 -
ANSTO - COMMERCIAL IN CONFIDENCE -
9. Appendix B – Borehole Locations
Borehole locations No 11 Nelson Pde Exterior
B8
B6
B1
B3 B2
B4

ANSTO - COMMERCIAL IN CONFIDENCE -
L1 L2
L6
L10
L14
L4
L15
L17
L16
L13
L12
L11
L7 L9 L8
L5
L3
Borehole locations No 11 Nelson Parade Interior
Key
Sample location Insufficient material for sample

- 64 -
ANSTO - COMMERCIAL IN CONFIDENCE -
K1

- 65 -
ANSTO - COMMERCIAL IN CONFIDENCE -
J17
J1
J16
J12 J14
J4
J7 J8
J20
J9
J6
J3 J2
J15
J13 J10
J18 J19
J5
J11

ANSTO - COMMERCIAL IN CONFIDENCE -
10. Appendix C – Field Instruments Used
The Health Physics measurements, analysis and survey work was conducted using a number
of different systems to measure the different types of radiation emissions. These detection
systems are calibrated annually at ANSTO's dedicated instrument calibration facility. These
calibrations are traceable to primary and secondary standards. The following table details the
instruments used by ANSTO for the work.
Instrument MTE / Serial No.
Detector Use
Eberline E-600
2904
Calibration Due
2/3/2012
SSPA-3 High sensitivity γ detector, 2 x 2" NaI(Tl) detector
High sensitivity gamma measurements, for identifying localised elevated areas in the γ energy range from 60 keV to 2 MeV
Eberline E-600
2568
Calibration Due
25/5/2011
SSPA-3 High sensitivity γ detector, 2 x 2" NaI(Tl) detector
High sensitivity gamma measurements, for identifying localised elevated areas in the γ energy range from 60 keV to 2 MeV
Eberline E-600
2903
Calibration Due
2/3/2012
SSPA-3 High sensitivity γ detector, 2 x 2" NaI(Tl) detector
High sensitivity gamma measurements, for identifying localised elevated areas in the γ energy range from 60 keV to 2 MeV
NE Electra 1971
Calibration Due
1/3/2012
DP2/R4-A Scintillation detector - calibrated in cps
Contamination monitoring and for detecting a wide range of radiations. Used to initially identify areas of interest above background and for self monitoring for loose particles
Rotem R-200 2591
Calibration
due
1/3/2012
GM type Measures ionising radiation, (including
X-Rays) from 30keV to 2 MeV, over the
range of 0.1µSv/h to 1000mSv/h
Mini Instruments
2386
Calibration
due
14/3/2012
GM Environmental probe Environmental dose rate meter
sensitive to γ energy with extendable
count time
Eurisys Mesures Radiagem 2
1755
Calibration Due
3/11/2012
G.M. type (small tube- good for high intensity beams)
Measures ionising radiation, (including X-RAYS) from 30keV to 2 MeV, over
the range of 0.1µSv/h to 100mSv/h
Target Identifier
2327
Calibration due
1/3/2012
1" NaI detector and GM tube
Analysing gamma energies for comparison against internal libraries to determine radionuclide identity. Effective from 30keV to 1.5MeV
Sv Bleeper 3041
Calibration due
4/1/2012
GM Tube Used for recording real time radiation exposures to staff, and early warning of hazardous levels.
Sv Bleeper 3036
Calibration
GM Tube Used for recording real time radiation exposures Calibration due, and early

- 67 -
ANSTO - COMMERCIAL IN CONFIDENCE -
due
4/1/2012
warning of hazardous levels.
Sv Bleeper 3038
Calibration due
4/1/2012
GM Tube Used for recording real time radiation exposures to staff, and early warning of hazardous levels.
Sv Bleeper 3033
Calibration due
1/3/2012
GM Tube Used for recording real time radiation exposures to staff, and early warning of hazardous levels.
Sv Bleeper 3042
Calibration due
1/3/2012
GM Tube Used for recording real time radiation exposures to staff, and early warning of hazardous levels.
Sv Bleeper 3039
Calibration due
4/1/2012
GM Tube Used for recording real time radiation exposures to staff, and early warning of hazardous levels.

- 68 -
ANSTO - COMMERCIAL IN CONFIDENCE -
11. Appendix D – Sample Analysis Results

- 69 -
ANSTO - COMMERCIAL IN CONFIDENCE -
12. Appendix E – QA/QC Assessment

- 70 -
ANSTO - COMMERCIAL IN CONFIDENCE -
13. Appendix F – Soil Borehole Logs

- 71 -
ANSTO - COMMERCIAL IN CONFIDENCE -
14. Appendix G – Calibration Certificates

- 72 -
ANSTO - COMMERCIAL IN CONFIDENCE -
15. Appendix H – CoC and Laboratory Reports

- 73 -
ANSTO - COMMERCIAL IN CONFIDENCE -
16. Appendix I – Statistical Assessment