Embed Size (px)
Citation preview
IOP PUBLISHING PHYSICS IN MEDICINE AND BIOLOGY
Phys. Med. Biol. 55 (2010) 735–746 doi:10.1088/0031-9155/55/3/013
Radiation induced currents in MRI RF coils:application to linac/MRI integration
B Burke1, B G Fallone1,2,3 and S Rathee2,3
1 Department of Physics, University of Alberta, 11322-89th Avenue, Edmonton, Alberta,T6G 2G7, Canada2 Department of Medical Physics, Cross Cancer Institute, 11560 University Avenue, Edmonton,Alberta, T6G 1Z2, Canada3 Department of Oncology, University of Alberta, 11560 University Avenue, Edmonton, Alberta,T6G 1Z2, Canada
E-mail: [email protected]
Received 14 September 2009, in final form 9 December 2009Published 13 January 2010Online at stacks.iop.org/PMB/55/735
AbstractThe integration of medical linear accelerators (linac) with magnetic resonanceimaging (MRI) systems is advancing the current state of image-guidedradiotherapy. The MRI in these integrated units will provide real-time, accuratetumor locations for radiotherapy treatment, thus decreasing geometric marginsaround tumors and reducing normal tissue damage. In the real-time operationof these integrated systems, the radiofrequency (RF) coils of MRI will beirradiated with radiation pulses from the linac. The effect of pulsed radiationon MRI radio frequency (RF) coils is not known and must be studied. Theinstantaneous radiation induced current (RIC) in two different MRI RF coilswere measured and presented. The frequency spectra of the induced currentswere calculated. Some basic characterization of the RIC was also done:isolation of the RF coil component responsible for RIC, dependence of RIC ondose rate, and effect of wax buildup placed on coil on RIC. Both the time andfrequency characteristics of the RIC were seen to vary with the MRI RF coilused. The copper windings of the RF coils were isolated as the main sourceof RIC. A linear dependence on dose rate was seen. The RIC was decreasedwith wax buildup, suggesting an electronic disequilibrium as the cause of RIC.This study shows a measurable RIC present in MRI RF coils. This unwantedcurrent could be possibly detrimental to the signal to noise ratio in MRI andproduce image artifacts.
(Some figures in this article are in colour only in the electronic version)
1. Introduction
The integration of medical linear accelerators (linac) with magnetic resonance imaging (MRI)systems has recently become an exciting area of research in radiotherapy physics. Two groups
0031-9155/10/030735+12$30.00 © 2010 Institute of Physics and Engineering in Medicine Printed in the UK 735
736 B Burke et al
are at the forefront of this research into image-guided radiotherapy (IGRT) (Fallone et al2007, Lagendijk et al 2005). The MRI in these integrated units will provide real-time tumortracking during radiotherapy treatment, allowing for improved knowledge of tumor location.In current radiotherapy treatments, the geometric margin around the tumor is added to accountfor the day-to-day changes in tumor location during the course of fractionated radiotherapycaused by patient setup and internal tumor motion. IGRT uses daily imaging, at the time oftreatment, to more accurately locate the tumor in an effort to decrease the added geometricmargin around the tumor. Current IGRT techniques use megavoltage (MV) portal imaging,kilovoltage (kV) radiographic imaging, MV computed tomography (CT), MV cone beam CT,kV cone beam CT and ultrasound (Verellen et al 2007, Dawson and Jaffray 2007). However,the current 3D imaging methods that support IGRT suffer from poor soft-tissue contrast, whencompared to MRI, and are unable to provide real-time images during the treatment beam-ontime; thus significant margins around the tumor are still needed. MRI has exquisite soft tissuecontrast, utilizes non-ionizing radiation and can acquire images during the pulsing of theradiation beam; these properties make MRI ideal for its use in IGRT. These units will allowfor decreased geometric margins around the tumor resulting in the increased sparing of normaltissues and critical structures from irradiation.
The two research groups mentioned above have very different designs for their integratedsystems: our group at the Cross Cancer Institute (Edmonton, Canada) has a prototype thatuses a low field, bi-planar magnet integrated with a 6 MV linac (Fallone et al 2007), whileLagendijk’s group at the University Medical Center Utrecht (Utrecht, The Netherlands) uses ahigh field, cylindrical magnet integrated with a 6 MV linac (Lagendijk et al 2005). Preliminaryresults from both groups have been published in dosimetry simulation papers (Kirkby et al2008, Raaijmakers et al 2008) and more recently both groups have published MRI images takenwith prototype units while the linac is producing radiation (Fallone et al 2009, Raaymakerset al 2009). During the course of a typical treatment using one of these integrated units, theMRI radio frequency (RF) coils will be exposed to the pulsed radiation beam of the linaccausing unwanted radiation induced effects. There are different types of possible radiationinduced effects: (a) instantaneous—coincides with linac radiation pulses and includes theradiation induced current, (b) accumulative—occurs over time and could include damage tothe RF coil hardware and (c) dosimetric—modification of the patient skin dose caused by thepresence of the RF coil in the magnetic field. This work will focus solely on the instantaneousradiation induced effects.
When thin materials, such as the copper strips found in MRI RF coils, are irradiatedwith high-energy (megavoltage) photons, the high-energy electrons produced in Comptoninteractions are likely to escape the material. If there is no influx of electrons to balance thiseffect, a net positive charge is created in the material. If the material is part of an electricalcircuit, then a current will begin to flow in order to neutralize this charge imbalance. Thiscurrent is termed as the radiation induced current (RIC) and has been reported on by severalauthors. Meyer et al (1956) reported in 1956 on the RIC seen in polyethylene and Teflonupon exposure to x-rays from a 2 MeV Van de Graaff generator and a 60Co beam. Johns et al(1958) reported the RIC due to the 60Co beam in parallel plate ionization chambers providingRIC as the basis of the polarity effect observed in these chambers. Several authors havepublished reports on RIC in varying materials when exposed to pulsed radiation (Degenhartand Schlosser 1961, Sato et al 2004, Abdel-Rahman et al 2006), which are of particularrelevance to this work.
Since the premise of linac–MRI integration is based on simultaneous irradiation andMRI data acquisition, and MRI forms an image from the signals induced in RF coils, theRIC induced in the MRI RF coils could be detrimental to the MRI signal to noise ratio and
Radiation induced currents in MRI RF coils 737
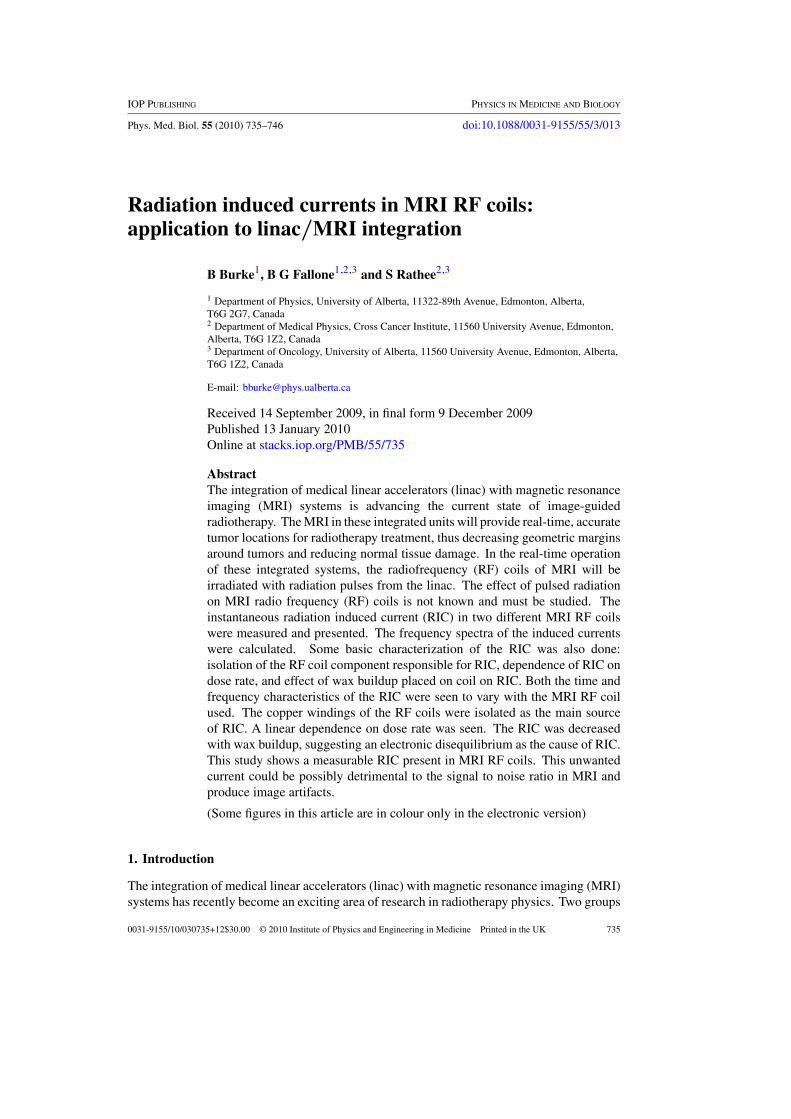
Figure 1. Schematic representation of the RF coil inside a Faraday cage (dotted line). The pulsedradiation beam is focused on the RF coil. The radiation induced current is amplified and thendetected by a digital oscilloscope, which is triggered by the linac magnetron/klystron current.
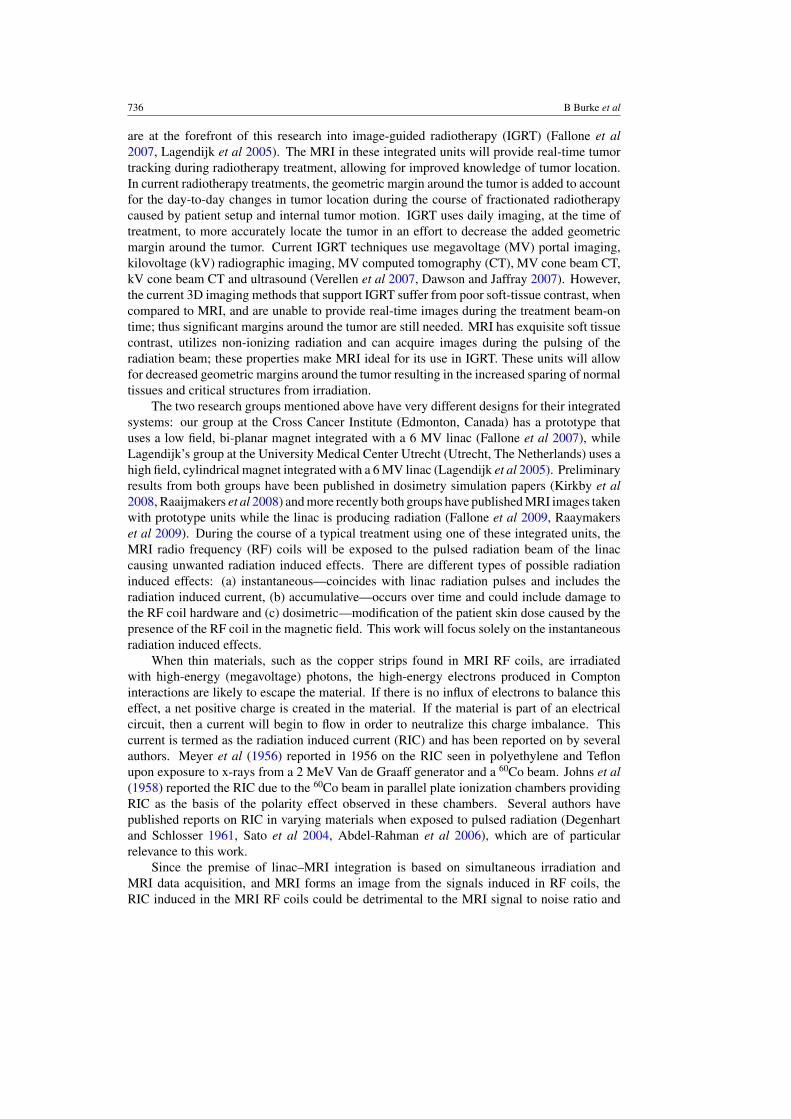
Figure 2. CAT solenoid coil (left) and black solenoid coil (right). The strips of copper windingcan be seen in the bore of the CAT coil, while the black coil has more cylindrical copper windings.
introduce image artifacts. These accurate images are necessary for the success of real-timeimage guidance. It is therefore imperative that the RIC in MRI RF coils be investigated. Theobjective of this work is to report on the measurement of the instantaneous RIC in two differentMRI RF coils exposed to linac pulsed radiation, to examine the frequency characteristics ofthe RIC and to determine some of the fundamental characteristics of the RIC.
2. Materials and methods
2.1. Dependence of the RIC on the RF coil and microwave power source
The experimental setup is shown schematically in figure 1. The RF coil is placed on a woodenstand inside a Faraday type RF cage (Model FC-10, LBA Technologies, Greenville, NC) toshield the RIC measurements from unwanted RF noise produced by the clinical linacs (Burkeet al 2009). Two different coils were used (figure 2). A CAT solenoid coil (National Research
738 B Burke et al
Council Canada) has copper strips as the windings with a resonant frequency at ∼8.5 MHz.It has an inner diameter of 9.5 cm, a length of 11.7 cm and five continuous windings of thin,1.2 cm wide copper sheet. The second coil was a black solenoid coil (National ResearchCouncil Canada) of 10.0 cm inner diameter and 12.0 cm length, and it is made of a0.64 cm diameter hollow copper pipe. Five concentric rings are connected in series toprovide a solenoid structure. A capacitor connects each concentric ring to the next. Aninductive matching network (a copper ring with an 820 pF capacitor) is employed to connectthe resonator with an active T/R switch incorporated with the coil. The tuning range forthe black solenoid coil is from 9.2 MHz to 9.4 MHz. These coils were designed for a0.2 T (CAT) and 0.22 T (black solenoid) magnets, respectively, and both have an impedanceof 50 � at resonance. The CAT coil is a receive-only coil, while the black solenoid coil is atransmit/receive coil. The coils were connected to a high-speed, low-current amplifier (Model59-179, Edmund Optics, Germany), with a 50 � input impedance, via a coaxial cable. All themeasurements were made with a nominal gain setting of 105 V A−1 and a nominal bandwidthof 10 MHz. The amplifier is not irradiated. The power supply and amplifier output connectionsare brought to the exterior of the RF cage through RF filters. A coaxial cable from the exteriorof the RF cage connects the amplifier output to an oscilloscope (Model DSO6104A, AgilentTechnologies, Santa Clara, CA) which measures the induced current. The RF cage is thenplaced on the treatment couch of the linac and exposed to pulsed radiation to induce currentin the RF coil. The center of the coil is placed at approximately 115 cm from the radiationsource and the field size was chosen to cover the entire coil. Two different linacs were used:a Varian 600C and a Varian Clinac 23iX (Varian Medical Systems, Palo Alto, CA), beingpowered by a magnetron microwave source and a klystron microwave source, respectively. Anominal 6 MV x-ray beam was used for irradiation in all experiments with an approximatedose of 0.04 cGy/pulse at 100 cm from the source. The signal voltage waveforms, sampledat 2 GHz and triggered using the magnetron/klystron current (available as a test signal at thelinac console), are transferred from the oscilloscope to a PC using a Keithley KUSB 488 GPIBinterface (Keithley Instruments Inc., Cleveland, OH) implemented with the software programDADiSP (DSP Development Corporation, Newton, MA). The 2 GHz sampling frequency isthe oscilloscope default that is not variable. This high sampling rate provides little benefitto the measured frequency spectrum of RIC since the amplifier bandwidth extends only to10 MHz. The frequency spectra of the measured signals were then calculated using DADiSPas follows:
S(f ) =√∑N
i=1 |DFTi (s(t))|2N
, (1)
where DFT is the discrete Fourier transform, s(t) is the time-dependent voltage waveform, Nis the number of signal acquisitions (1000) and S(f ) is the final frequency spectrum. Sincethe bandwidth selected for the current amplifier at the specified gain setting was 10 MHz,any frequencies above 10 MHz were ignored in the spectral data. The measured frequencyresponse of the current amplifier, G(f ), was used to correct the measured power spectrum toobtain appropriate current spectral density values, I(f ):
I (f ) = S(f )
G(f ). (2)
Using the methods just described, four different measurement scenarios will be presentedusing each of the two MRI RF coils exposed to radiation by each of the two linacs.
Radiation induced currents in MRI RF coils 739
2.2. Characterization of the RIC
Further experiments were performed to determine some characteristics of the RIC such asisolating the coil component responsible for the RIC, its dependence on the dose rate andthe effect of adding buildup material. These three experiments were performed on the CATcoil alone using the same setup as described above. The CAT coil was favored over theblack coil because of its continuous coil winding and simpler electronic circuitry. Also theCAT coil has a more uniform RIC curve which makes the interpretation of experimental datasimpler.
To isolate the source of the RIC, the coil/cage setup was placed as close to the linactreatment head as possible. A 2.5 cm wide beam, whose length was sufficient to cover the coildiameter, was stepped along the length of the coil. At each step, the RIC was measured. Ameasurement was also taken with the entire coil in the linac beam for comparison purposes.The linac used for this experiment was the Varian 600C producing a nominal 6 MV x-raybeam. A 10 μs acquisition window was used to display the oscilloscope traces.
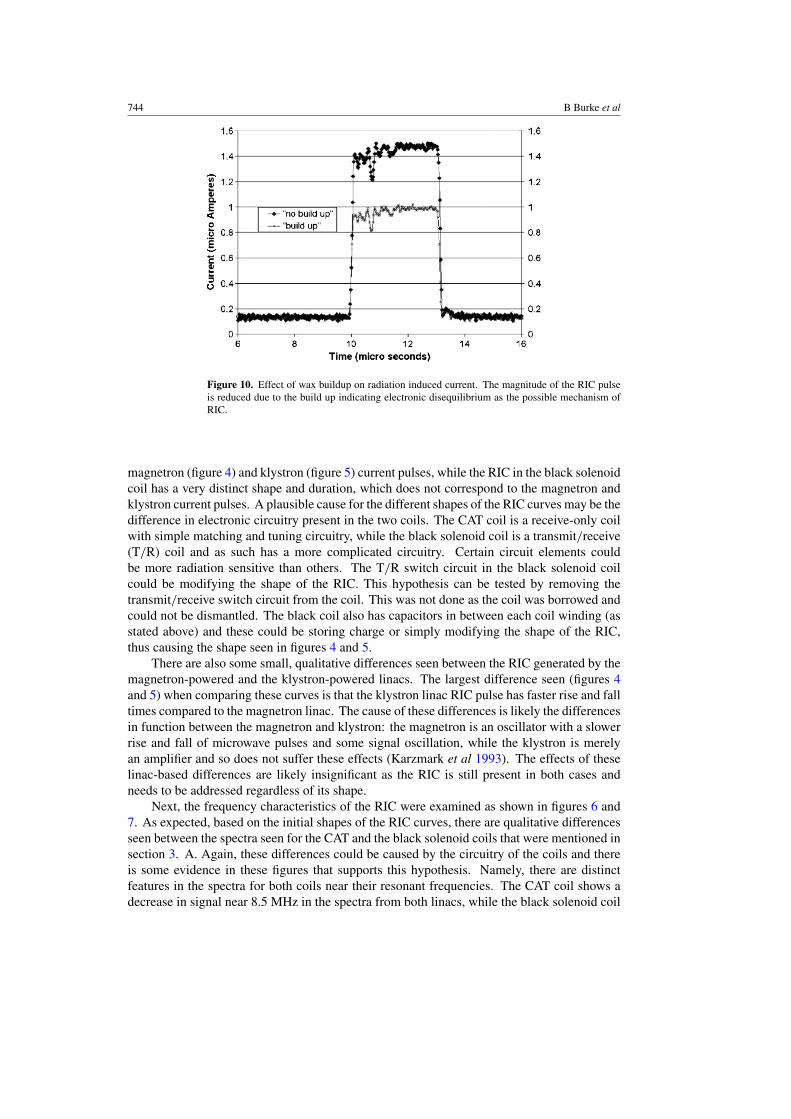
The effect of the dose rate on the RIC was determined by varying the distance betweenthe RF coil and the radiation source. For these RIC measurements, the linac average doserate (MU min−1) is not the quantity of interest. The dose per pulse of the linac will determinethe magnitude of the RIC in the measured pulses. The dose per pulse can easily be variedby varying the distance of the coil from the source. The distance was incremented by 5 cmsteps from an initial source-to-coil distance of 67.5 cm to a final source-to-coil distance of107.5 cm. At each distance the radiation beam covered the entire coil. Once acquired, anaverage signal was obtained at each distance by taking the mean of the uniform portion of theRIC curves, and this was then plotted against the inverse square of the source-to-coil distance.The linac used for the experiment was the Varian 600C, using a nominal 6 MV x-ray beam.
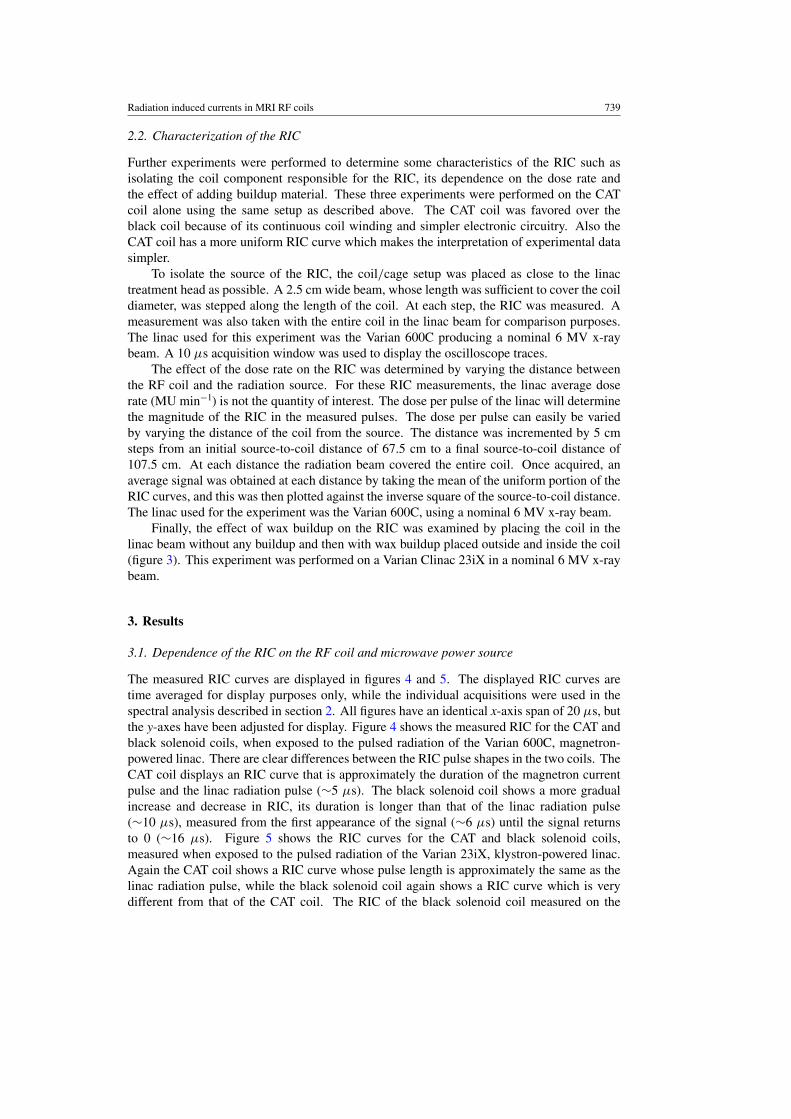
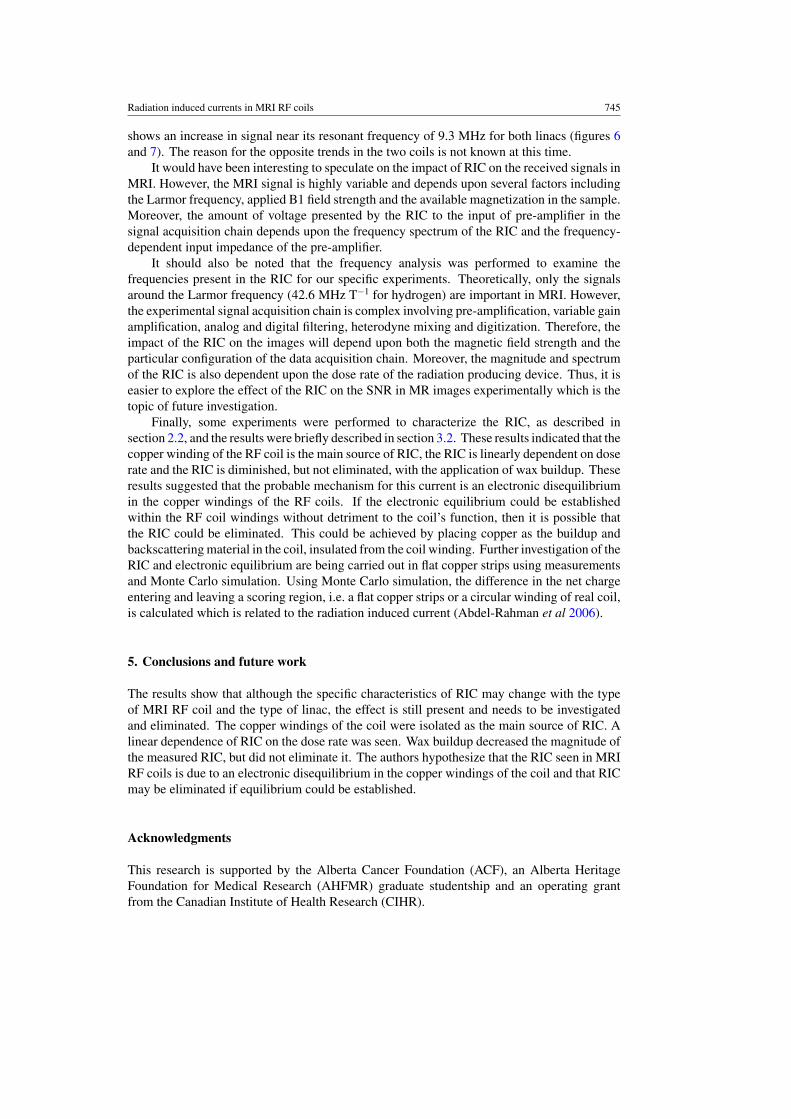
Finally, the effect of wax buildup on the RIC was examined by placing the coil in thelinac beam without any buildup and then with wax buildup placed outside and inside the coil(figure 3). This experiment was performed on a Varian Clinac 23iX in a nominal 6 MV x-raybeam.
3. Results
3.1. Dependence of the RIC on the RF coil and microwave power source
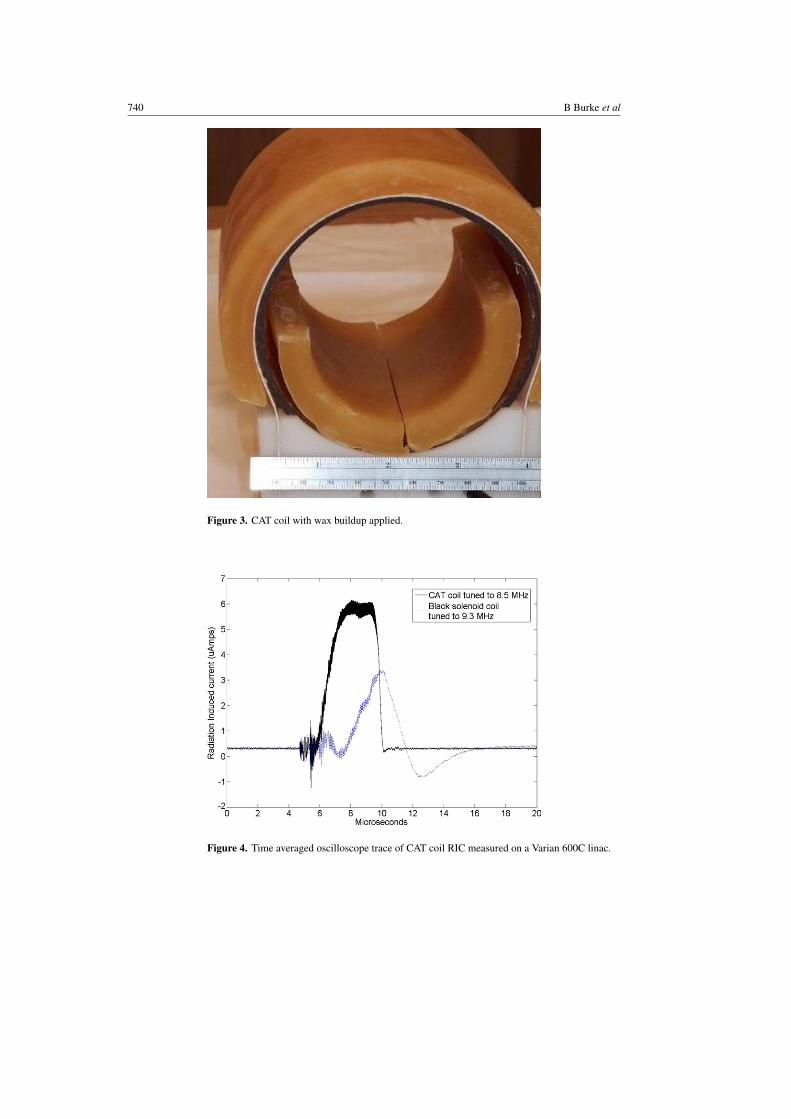
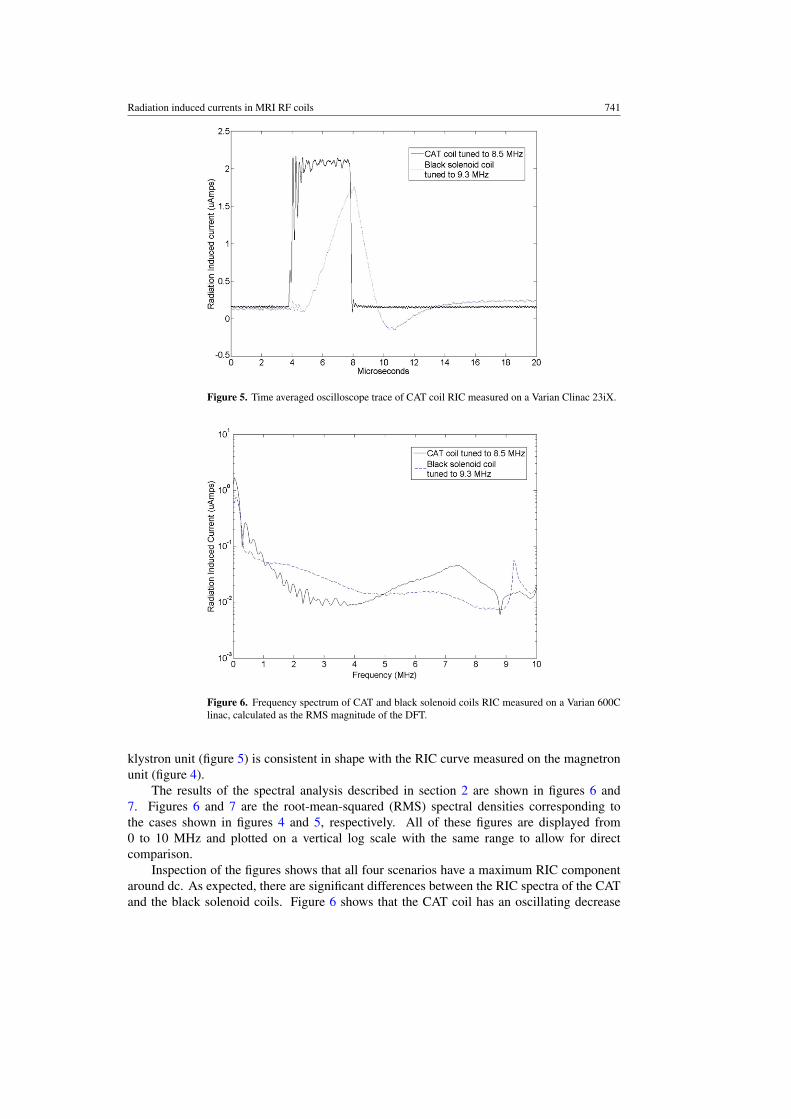
The measured RIC curves are displayed in figures 4 and 5. The displayed RIC curves aretime averaged for display purposes only, while the individual acquisitions were used in thespectral analysis described in section 2. All figures have an identical x-axis span of 20 μs, butthe y-axes have been adjusted for display. Figure 4 shows the measured RIC for the CAT andblack solenoid coils, when exposed to the pulsed radiation of the Varian 600C, magnetron-powered linac. There are clear differences between the RIC pulse shapes in the two coils. TheCAT coil displays an RIC curve that is approximately the duration of the magnetron currentpulse and the linac radiation pulse (∼5 μs). The black solenoid coil shows a more gradualincrease and decrease in RIC, its duration is longer than that of the linac radiation pulse(∼10 μs), measured from the first appearance of the signal (∼6 μs) until the signal returnsto 0 (∼16 μs). Figure 5 shows the RIC curves for the CAT and black solenoid coils,measured when exposed to the pulsed radiation of the Varian 23iX, klystron-powered linac.Again the CAT coil shows a RIC curve whose pulse length is approximately the same as thelinac radiation pulse, while the black solenoid coil again shows a RIC curve which is verydifferent from that of the CAT coil. The RIC of the black solenoid coil measured on the
740 B Burke et al
Figure 3. CAT coil with wax buildup applied.
Figure 4. Time averaged oscilloscope trace of CAT coil RIC measured on a Varian 600C linac.
Radiation induced currents in MRI RF coils 741
Figure 5. Time averaged oscilloscope trace of CAT coil RIC measured on a Varian Clinac 23iX.
Figure 6. Frequency spectrum of CAT and black solenoid coils RIC measured on a Varian 600Clinac, calculated as the RMS magnitude of the DFT.
klystron unit (figure 5) is consistent in shape with the RIC curve measured on the magnetronunit (figure 4).
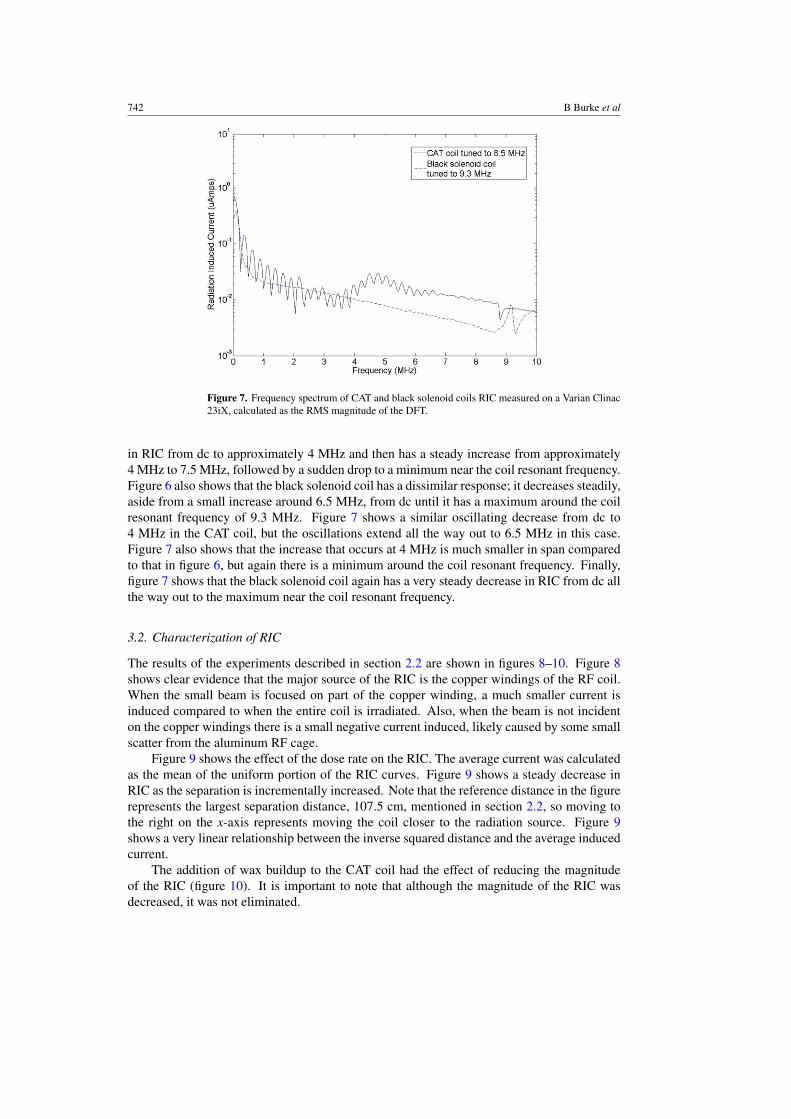
The results of the spectral analysis described in section 2 are shown in figures 6 and7. Figures 6 and 7 are the root-mean-squared (RMS) spectral densities corresponding tothe cases shown in figures 4 and 5, respectively. All of these figures are displayed from0 to 10 MHz and plotted on a vertical log scale with the same range to allow for directcomparison.
Inspection of the figures shows that all four scenarios have a maximum RIC componentaround dc. As expected, there are significant differences between the RIC spectra of the CATand the black solenoid coils. Figure 6 shows that the CAT coil has an oscillating decrease
742 B Burke et al
Figure 7. Frequency spectrum of CAT and black solenoid coils RIC measured on a Varian Clinac23iX, calculated as the RMS magnitude of the DFT.
in RIC from dc to approximately 4 MHz and then has a steady increase from approximately4 MHz to 7.5 MHz, followed by a sudden drop to a minimum near the coil resonant frequency.Figure 6 also shows that the black solenoid coil has a dissimilar response; it decreases steadily,aside from a small increase around 6.5 MHz, from dc until it has a maximum around the coilresonant frequency of 9.3 MHz. Figure 7 shows a similar oscillating decrease from dc to4 MHz in the CAT coil, but the oscillations extend all the way out to 6.5 MHz in this case.Figure 7 also shows that the increase that occurs at 4 MHz is much smaller in span comparedto that in figure 6, but again there is a minimum around the coil resonant frequency. Finally,figure 7 shows that the black solenoid coil again has a very steady decrease in RIC from dc allthe way out to the maximum near the coil resonant frequency.
3.2. Characterization of RIC
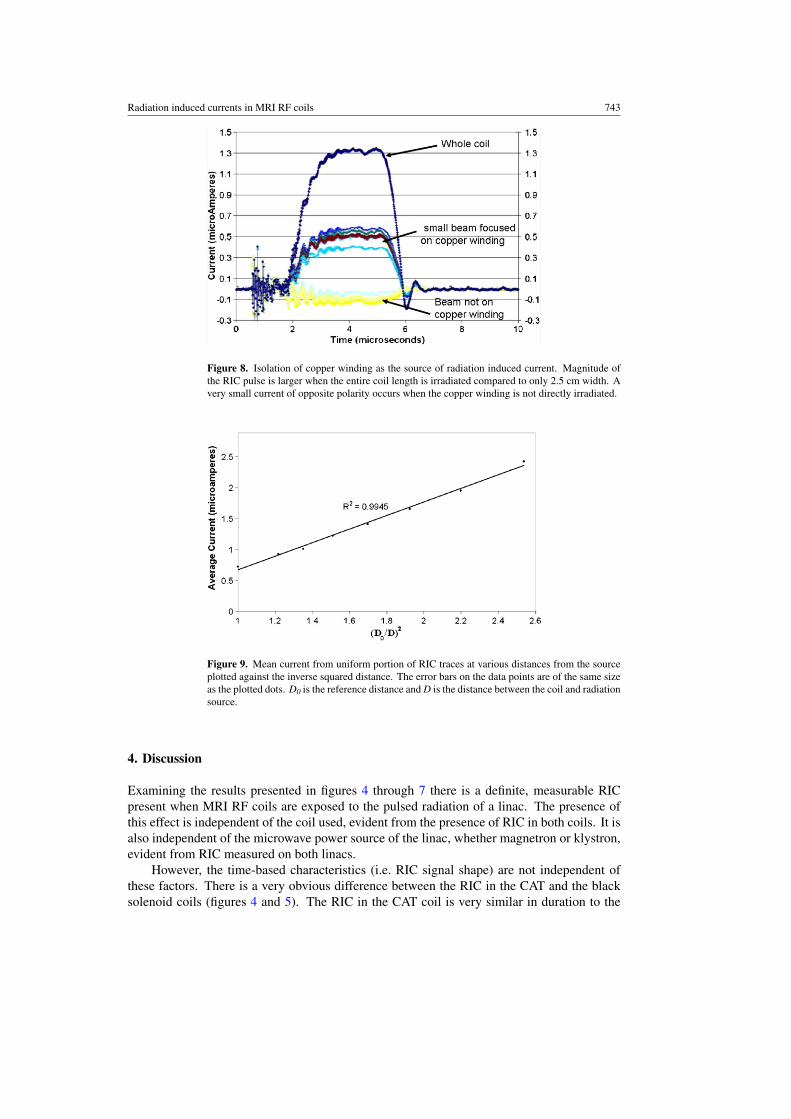
The results of the experiments described in section 2.2 are shown in figures 8–10. Figure 8shows clear evidence that the major source of the RIC is the copper windings of the RF coil.When the small beam is focused on part of the copper winding, a much smaller current isinduced compared to when the entire coil is irradiated. Also, when the beam is not incidenton the copper windings there is a small negative current induced, likely caused by some smallscatter from the aluminum RF cage.
Figure 9 shows the effect of the dose rate on the RIC. The average current was calculatedas the mean of the uniform portion of the RIC curves. Figure 9 shows a steady decrease inRIC as the separation is incrementally increased. Note that the reference distance in the figurerepresents the largest separation distance, 107.5 cm, mentioned in section 2.2, so moving tothe right on the x-axis represents moving the coil closer to the radiation source. Figure 9shows a very linear relationship between the inverse squared distance and the average inducedcurrent.
The addition of wax buildup to the CAT coil had the effect of reducing the magnitudeof the RIC (figure 10). It is important to note that although the magnitude of the RIC wasdecreased, it was not eliminated.
Radiation induced currents in MRI RF coils 743
Figure 8. Isolation of copper winding as the source of radiation induced current. Magnitude ofthe RIC pulse is larger when the entire coil length is irradiated compared to only 2.5 cm width. Avery small current of opposite polarity occurs when the copper winding is not directly irradiated.
Figure 9. Mean current from uniform portion of RIC traces at various distances from the sourceplotted against the inverse squared distance. The error bars on the data points are of the same sizeas the plotted dots. D0 is the reference distance and D is the distance between the coil and radiationsource.
4. Discussion
Examining the results presented in figures 4 through 7 there is a definite, measurable RICpresent when MRI RF coils are exposed to the pulsed radiation of a linac. The presence ofthis effect is independent of the coil used, evident from the presence of RIC in both coils. It isalso independent of the microwave power source of the linac, whether magnetron or klystron,evident from RIC measured on both linacs.
However, the time-based characteristics (i.e. RIC signal shape) are not independent ofthese factors. There is a very obvious difference between the RIC in the CAT and the blacksolenoid coils (figures 4 and 5). The RIC in the CAT coil is very similar in duration to the
744 B Burke et al
Figure 10. Effect of wax buildup on radiation induced current. The magnitude of the RIC pulseis reduced due to the build up indicating electronic disequilibrium as the possible mechanism ofRIC.
magnetron (figure 4) and klystron (figure 5) current pulses, while the RIC in the black solenoidcoil has a very distinct shape and duration, which does not correspond to the magnetron andklystron current pulses. A plausible cause for the different shapes of the RIC curves may be thedifference in electronic circuitry present in the two coils. The CAT coil is a receive-only coilwith simple matching and tuning circuitry, while the black solenoid coil is a transmit/receive(T/R) coil and as such has a more complicated circuitry. Certain circuit elements couldbe more radiation sensitive than others. The T/R switch circuit in the black solenoid coilcould be modifying the shape of the RIC. This hypothesis can be tested by removing thetransmit/receive switch circuit from the coil. This was not done as the coil was borrowed andcould not be dismantled. The black coil also has capacitors in between each coil winding (asstated above) and these could be storing charge or simply modifying the shape of the RIC,thus causing the shape seen in figures 4 and 5.
There are also some small, qualitative differences seen between the RIC generated by themagnetron-powered and the klystron-powered linacs. The largest difference seen (figures 4and 5) when comparing these curves is that the klystron linac RIC pulse has faster rise and falltimes compared to the magnetron linac. The cause of these differences is likely the differencesin function between the magnetron and klystron: the magnetron is an oscillator with a slowerrise and fall of microwave pulses and some signal oscillation, while the klystron is merelyan amplifier and so does not suffer these effects (Karzmark et al 1993). The effects of theselinac-based differences are likely insignificant as the RIC is still present in both cases andneeds to be addressed regardless of its shape.
Next, the frequency characteristics of the RIC were examined as shown in figures 6 and7. As expected, based on the initial shapes of the RIC curves, there are qualitative differencesseen between the spectra seen for the CAT and the black solenoid coils that were mentioned insection 3. A. Again, these differences could be caused by the circuitry of the coils and thereis some evidence in these figures that supports this hypothesis. Namely, there are distinctfeatures in the spectra for both coils near their resonant frequencies. The CAT coil shows adecrease in signal near 8.5 MHz in the spectra from both linacs, while the black solenoid coil
Radiation induced currents in MRI RF coils 745
shows an increase in signal near its resonant frequency of 9.3 MHz for both linacs (figures 6and 7). The reason for the opposite trends in the two coils is not known at this time.
It would have been interesting to speculate on the impact of RIC on the received signals inMRI. However, the MRI signal is highly variable and depends upon several factors includingthe Larmor frequency, applied B1 field strength and the available magnetization in the sample.Moreover, the amount of voltage presented by the RIC to the input of pre-amplifier in thesignal acquisition chain depends upon the frequency spectrum of the RIC and the frequency-dependent input impedance of the pre-amplifier.
It should also be noted that the frequency analysis was performed to examine thefrequencies present in the RIC for our specific experiments. Theoretically, only the signalsaround the Larmor frequency (42.6 MHz T−1 for hydrogen) are important in MRI. However,the experimental signal acquisition chain is complex involving pre-amplification, variable gainamplification, analog and digital filtering, heterodyne mixing and digitization. Therefore, theimpact of the RIC on the images will depend upon both the magnetic field strength and theparticular configuration of the data acquisition chain. Moreover, the magnitude and spectrumof the RIC is also dependent upon the dose rate of the radiation producing device. Thus, it iseasier to explore the effect of the RIC on the SNR in MR images experimentally which is thetopic of future investigation.
Finally, some experiments were performed to characterize the RIC, as described insection 2.2, and the results were briefly described in section 3.2. These results indicated that thecopper winding of the RF coil is the main source of RIC, the RIC is linearly dependent on doserate and the RIC is diminished, but not eliminated, with the application of wax buildup. Theseresults suggested that the probable mechanism for this current is an electronic disequilibriumin the copper windings of the RF coils. If the electronic equilibrium could be establishedwithin the RF coil windings without detriment to the coil’s function, then it is possible thatthe RIC could be eliminated. This could be achieved by placing copper as the buildup andbackscattering material in the coil, insulated from the coil winding. Further investigation of theRIC and electronic equilibrium are being carried out in flat copper strips using measurementsand Monte Carlo simulation. Using Monte Carlo simulation, the difference in the net chargeentering and leaving a scoring region, i.e. a flat copper strips or a circular winding of real coil,is calculated which is related to the radiation induced current (Abdel-Rahman et al 2006).
5. Conclusions and future work
The results show that although the specific characteristics of RIC may change with the typeof MRI RF coil and the type of linac, the effect is still present and needs to be investigatedand eliminated. The copper windings of the coil were isolated as the main source of RIC. Alinear dependence of RIC on the dose rate was seen. Wax buildup decreased the magnitude ofthe measured RIC, but did not eliminate it. The authors hypothesize that the RIC seen in MRIRF coils is due to an electronic disequilibrium in the copper windings of the coil and that RICmay be eliminated if equilibrium could be established.
Acknowledgments
This research is supported by the Alberta Cancer Foundation (ACF), an Alberta HeritageFoundation for Medical Research (AHFMR) graduate studentship and an operating grantfrom the Canadian Institute of Health Research (CIHR).
746 B Burke et al
References
Abdel-Rahman W, Seuntjens J P, Verhaegen F and Podgorsak E B 2006 Radiation induced currents in parallel plateionization chambers: measurement and Monte Carlo simulation for megavoltage photon and electron beamsMed. Phys. 33 3094–104
Burke B, Lamey M, Rathee S, Murray B and Fallone B G 2009 Radio frequency noise from clinical linear acceleratorsPhys. Med. Biol. 54 2483–92
Dawson L A and Jaffray D A 2007 Advances in image-guided radiation therapy J. Clin. Oncol. 25 938–46Degenhart H J and Schlosser W 1961 Transient effects of pulsed nuclear radiation on electronic parts and materials
IRE Trans. Compon. Parts 8 123–8Fallone B G, Carlone M, Murray B, Rathee S, Stanescu T, Steciw S, Wachowicz K and Kirkby C 2007 Development
of a linac-MRI system for real-time ART Med. Phys. 34 2547Fallone B G, Murray B, Rathee S, Stanescu T, Steciw S, Vidakovic S, Blosser E and Tymofichuk D 2009 First
MR images obtained during megavoltage photon irradiation from a prototype integrated linac-MR system Med.Phys. 36 2084–8
Johns H E, Aspin N and Baker R G 1958 Currents induced in the dielectrics of ionization chambers through the actionof high-energy radiation J. Radiat. Res. 9 573–88
Karzmark C J, Nunan C S and Tanabe E 1993 Medical Electron Accelerators (New York: McGraw-Hill)Kirkby C, Stanescu T, Rathee S, Carlone M, Murray B and Fallone B G 2008 Patient dosimetry for hybrid MRI-
radiotherapy systems Med. Phys. 35 1019–27Lagendijk J J, Raaymakers B W, Van Der Heide U A, Overweg J, Brown K J, Bakker C, Raaijmakers A J,
Vulpen M, Welleweerd J and Jurgenliemk-Schulz I 2005 In room magnetic resonance imaging guidedratiotherapy (MRIgRT) Med. Phys. 32 2067
Meyer R A, Bouquet F L and Alger R S 1956 Radiation induced conductivity in polyethylene and teflon J. Appl.Phys. 27 1012–8
Raaijmakers A J, Raaymakers B W and Lagendijk J J 2008 Magnetic field-induced dose effects in MR-guidedradiotherapy systems: dependence on the magnetic field strength Phys. Med. Biol. 53 909–23
Raaymakers B W et al 2009 Integrating a 1.5 T MRI scanner with a 6 MV accelerator: proof of concept Phys. Med.Biol. 54 N229–37
Sato F, Tanaka T, Kagawa T and Iida T 2004 Impedance measurements of thin film ceramics under ion beamirradiation J. Nucl. Mater. 329–333 1034–7
Verellen D, De Ridder M, Linthout N, Tournel K, Soete G and Storme G 2007 Innovations in image-guidedradiotherapy Nature Rev. Cancer 7 949–60