Embed Size (px)
Citation preview
Department of Health and Ageing
Radiation Oncology Workforce Planning
Final Report
Prepared by HealthConsult Pty Ltd
November 2009

Prepared by HealthConsult Pty Ltd (ACN 118 337 821) in association with Associate Professor
Deborah Schofield for the Department of Health and Ageing
Project Team: Joe Scuteri HealthConsult Project Director
Lisa Fodero HealthConsult Project Manager
Ashleigh O„Mahony HealthConsult Project Consultant
Associate Professor
Deborah Schofield University of Sydney Workforce Planning Model Development
HealthConsult Pty Ltd
Head Office: 4409/93 Liverpool Street, Sydney, New South Wales, 2000
Phone (02) 9261 3707: Fax (02) 9261 3705: Email: [email protected]
Table of Contents
Section Page
LIST OF ABBREVIATIONS AND ACRONYMS .................................................................................. I
GLOSSARY OF TERMS ................................................................................................................ II
EXECUTIVE SUMMARY ............................................................................................................... 1
LIST OF OPPORTUNITIES FOR WORKFORCE DEVELOPMENT ................................................... 17
INTRODUCTION......................................................................................................................... 20
1.1 BACKGROUND ........................................................................................................................................... 20
1.2 PROJECT SCOPE ......................................................................................................................................... 21
1.3 PROJECT METHODOLOGY .......................................................................................................................... 21
1.4 STRUCTURE OF THIS DOCUMENT ............................................................................................................... 23
RADIATION ONCOLOGY WORKFORCE ..................................................................................... 24
2.1 RADIATION ONCOLOGY WORKFORCE ........................................................................................................ 24
2.2 RADIATION ONCOLOGY WORKFORCE TRAINING ........................................................................................ 25
2.3 RADIATION ONCOLOGY WORKFORCE BENCHMARKS ................................................................................. 26
2.4 RADIATION ONCOLOGY WORKLOAD MEASURES ........................................................................................ 29
2.5 INTERNATIONAL RADIATION ONCOLOGY WORKFORCE PLANNING ............................................................. 31
2.6 RECRUITMENT AND RETENTION OF HEALTH PROFESSIONALS .................................................................... 33
DATA COLLECTION METHODOLOGY ....................................................................................... 36
3.1 FACILITIES SURVEY ................................................................................................................................... 36
3.2 PROFESSIONS SURVEY ............................................................................................................................... 38
3.3 CASE STUDIES ........................................................................................................................................... 39
3.4 STAKEHOLDER CONSULTATIONS ............................................................................................................... 41
RADIATION ONCOLOGY WORKFORCE PLANNING IN AUSTRALIA ......................................... 43
4.1 WHAT IS WORKFORCE PLANNING? ............................................................................................................ 43
4.2 PREVIOUS WORK ON RADIATION ONCOLOGY WORKFORCE PLANNING ...................................................... 44
4.3 STATE/TERRITORY APPROACHES TO WORKFORCE PLANNING ................................................................... 47
4.4 CONSULTATION WITH PROFESSIONAL BODY REPRESENTATIVES ................................................................ 59
ANALYSIS OF FACILITIES SURVEY .......................................................................................... 63
5.1 OVERVIEW OF RADIOTHERAPY FACILITIES ................................................................................................ 63
5.2 UTILISATION OF RADIOTHERAPY SERVICES ............................................................................................... 64
5.3 RADIOTHERAPY WORKFORCE .................................................................................................................... 67
5.4 RADIOTHERAPY FACILITIES STAFFING MODEL ........................................................................................... 69
5.5 WORKFORCE RECRUITMENT, RETENTION AND VACANCIES ....................................................................... 72
5.6 WORKFORCE RECRUITMENT AND RETENTION ISSUES ................................................................................ 75
ANALYSIS OF ROS SURVEY...................................................................................................... 78
6.1 SURVEY RESPONSE RATE ........................................................................................................................... 78
6.2 AGE DISTRIBUTION OF ROS ....................................................................................................................... 79
6.3 WORKING HOURS AND WORKLOAD OF ROS .............................................................................................. 79
6.4 RECRUITMENT, CHANGES IN WORK, AND RETIREMENT .............................................................................. 82
ANALYSIS OF RTS SURVEY ...................................................................................................... 85
7.1 SURVEY RESPONSE RATE ........................................................................................................................... 85
7.2 AGE DISTRIBUTION OF RTS ........................................................................................................................ 86
7.3 WORKING HOURS AND WORKLOAD OF RTS ............................................................................................... 86
7.4 RECRUITMENT, CHANGES IN WORK, AND RETIREMENT .............................................................................. 89
ANALYSIS OF ROMPS SURVEY ............................................................................................... 92
8.1 SURVEY RESPONSE RATE ........................................................................................................................... 92
8.2 AGE DISTRIBUTION OF ROMPS ................................................................................................................. 93
8.3 WORKING HOURS AND WORKLOAD OF ROMPS ......................................................................................... 93
8.4 RECRUITMENT, CHANGES IN WORK, AND RETIREMENT .............................................................................. 96
CASE STUDY ANALYSIS ........................................................................................................... 100
9.1 CURRENT WORKFORCE SITUATION .......................................................................................................... 100
9.2 LOCAL WORKFORCE BENCHMARKING AND PLANNING APPROACHES ....................................................... 106
9.3 CHANGES TO THE SERVICE MODEL .......................................................................................................... 109
9.4 EMERGING TECHNOLOGIES AND THE IMPACT ON WORKFORCE ................................................................ 111
9.5 DESIRED RADIATION ONCOLOGY SERVICE MODEL ................................................................................... 113
PROJECTING THE RADIATION ONCOLOGY WORKFORCE ...................................................... 116
10.1 OVERVIEW OF SUPPLY SIDE WORKFORCE MODELS ................................................................................. 116
10.2 OVERVIEW OF DEMAND SIDE WORKFORCE MODELS ............................................................................... 118
10.3 RO WORKFORCE PROJECTIONS TO 2019 ................................................................................................. 120
10.4 RT WORKFORCE PROJECTIONS TO 2019 ................................................................................................. 122
10.5 ROMP WORKFORCE PROJECTIONS TO 2019 ........................................................................................... 124
10.6 SENSITIVITY ANALYSIS ........................................................................................................................... 126
CONCLUSIONS AND OPPORTUNITIES FOR WORKFORCE DEVELOPMENT .............................. 129
11.1 MONITORING RADIATION ONCOLOGY WORKFORCE AND UTILISATION .................................................... 129
11.2 CURRENT RADIATION ONCOLOGY STAFFING PRACTICES ......................................................................... 129
11.3 METHODS FOR PROJECTING RADIATION ONCOLOGY WORKFORCE ........................................................... 131
11.4 IDEAL RADIATION ONCOLOGY WORKFORCE AND AFFORDABILITY .......................................................... 131
11.5 CURRENT RADIATION ONCOLOGY WORKFORCE VACANCIES .................................................................... 133
11.6 IMPACT OF NEW TECHNOLOGIES ON WORKFORCE ................................................................................... 134
11.7 IMPACT OF NEW SERVICE MODELS ON WORKFORCE................................................................................. 135
11.8 SHORT-TERM WORKFORCE REQUIRED TO SUPPORT NEW FACILITIES ........................................................ 135
11.9 WORKFORCE PROJECTIONS MODEL ......................................................................................................... 137
11.10 WORKFORCE DEVELOPMENT INITIATIVES ........................................................................................... 139
11.11 IMPLEMENTATION ACTIONS ................................................................................................................ 144
Appendices
APPENDIX A: OVERVIEW OF CANCER, CANCER SERVICES AND RADIOTHERAPY IN AUSTRALIA
APPENDIX B: RADIATION ONCOLOGY FACILITIES SURVEY
APPENDIX C: ROS PROFESSIONS SURVEY
APPENDIX D: RTS PROFESSIONS SURVEY
APPENDIX E: ROMP PROFESSIONS SURVEY
APPENDIX F: CASE STUDY FRAMEWORK

Radiation Oncology Workforce Planning
Final Report Page i
List of abbreviations and acronyms
AAPROP Australian Association of Private Radiation Oncology Practices
ABS Australian Bureau of Statistics
ACPSEM Australasian College of Physical Scientists and Engineers in Medicine
AHTAC Australian Health Technology Advisory Committee
AHMAC Australian Health Ministers Advisory Council
AIHW Australian Institute of Health and Welfare
AIR Australian Institute of Radiography
AMC Australian Medical Council
AMWAC Australian Medical Workforce Advisory Committee
APWG Advanced Practice Working Group
ARC Adelaide Radiotherapy Centre
ARECQA Accreditation in Radiotherapy Equipment Commissioning and Quality Assurance
AROMP Accreditation in Radiation Oncology Medical Physics
BTE Basic Treatment Equivalent
CARO Canadian Association of Radiation Oncologists
CPD Continued Professional Development
DHS Department of Human Services
DMLC Dynamic Multileaf Collimators
DoHA Department of Health and Ageing
FRO Faculty of Radiation Oncology
FTE Full Time Equivalent
GDP Gross Domestic Product
IGRT Image Guided Radiation Therapy
ICS Integrated Cancer Services
IMRT Intensity Modulated Radiation Therapy
HDR High Dose Rate
LDR Low Dose Rate
Linac Linear accelerator
MBS Medical Benefits Schedule
MRI Magnetic Resonance Imaging
MSAC Medical Services Advisory Committee
NHMRC National Health and Medical Research Council
NRAG National Radiotherapy Advisory Group
PDY Professional Development Year
PET Positron Emission Tomography
QA Quality Assurance
RAH Royal Adelaide Hospital
RANZCR Royal Australian and New Zealand College of Radiographers
RMIS Radiotherapy Management Information System
RO Radiation Oncologist
ROI Radiation Oncology Inquiry
ROMP Radiation Oncology Medical Physicist
RORIC Radiation Oncology Reform Implementation Committee
RPH Royal Perth Hospital
RT Radiation Therapist
RTAP Radiation Therapy Advisory Panel
SCGH Sir Charles Gardiner Hospital
TEAP Training, Education and Accreditation Program
VMAT Volumetric Modulated Arc Therapy
WHO World Health Organization
WWG Workforce Working Group
Radiation Oncology Workforce Planning
Final Report Page ii
Glossary of terms
ACPSEM Formula 2000: the formula developed by the ACPSEM to assess the radiation
oncology medical physicist requirements for an individual department based on available
technology and techniques. Formula 2000 calculates the requirements for all physics staff,
including physics technicians.
Adjuvant therapy: treatment given in addition to the primary treatment (e.g. surgery) to
enhance the effectiveness of the primary treatment.
Age standardisation: age standardisation is a statistical method that adjusts crude rates to
account for age differences between study populations. Age standardisation enables better
comparisons between different populations.
Area of Need: the program that enables the recruitment of suitably qualified overseas-trained
doctors into declared Area of Need positions on a temporary basis.
ARECQA: Accreditation in Radiotherapy Equipment Commissioning and Quality
Assurance; the accreditation program in radiation oncology medical physics offered by the
ACPSEM prior to the development and implementation of the Training Education and
Accreditation Program.
AROMP: Accreditation in Radiation Oncology Medical Physics; the accreditation awarded
by the ACPSEM after successful completion of the Training Education and Accreditation
Program.
Attendance: a single presentation by a patient for radiotherapy treatment; at each attendance
a fraction of the prescribed treatment course is delivered.
Brachytherapy: radiotherapy for cancers where the radiation source is placed directly in
contact with the malignancy.
Basic treatment equivalent: the BTE model was developed in 1996 in an attempt to improve
the measurement of linear accelerator throughput in radiotherapy. The BTE is a productivity
measure for radiation oncology linear accelerator treatment delivery that accounts for
variations in complexity. It is derived by measuring the fraction durations and the treatment
factors that affect fraction duration across a large number of radiation oncology departments.
Chemotherapy: refers to the use of anti-cancer drugs to destroy cancer cells. In most
treatments a number of drugs may be given at the same time. This process is referred to as
combination chemotherapy.
Clinical workload: comprises anything linked to patient care, including: new patient/follow
up clinics, multidisciplinary clinics, planning/simulation, contouring organs/voluming,
treatment review, multidisciplinary team meetings, remote case conferences, patient/clinician
phone calls, and ward rounds.
Radiation Oncology Workforce Planning
Final Report Page iii
College Fellow RANZCR: the postgraduate qualification awarded by the Royal Australian
and New Zealand College of Radiologists (RANZCR) after appropriate examinations and
training, approval of Council, and payment of the subscription.
Cone beam computed tomography (Cone beam CT): provides three-dimensional axial CT
slices of a patient‟s tumour(s), enabling clinicians to compare these images with initial
treatment planning images to determine how precisely focused the radiation set-up is. This
technique enables the clinician to make position adjustments if necessary to deliver a more
targeted therapy to the patient.
CyberKnife: frameless robotic radiosurgery system.
Dosimetry: measurement of radiation exposure from x-rays, gamma rays, or other types of
radiation used in the treatment or detection of diseases, including cancer.
Educational Affiliate of RANZCR: a person who is practising as a radiation oncologist in
Australia but is not a Fellow of RANZCR who, by paying a membership fee, establishes an
association with the College for the purposes of participating in educational activities,
meetings and seminars organised by the College.
Equipment commissioning and quality assurance workload: includes acquisition and
installation of new equipment; safety checks; initial radiation survey and acceptance testing;
commissioning of the machine for clinical use; establishment of the baseline quality assurance
parameters and schedule; and routine quality assurance activities.
Fields: exposures of radiation from a prescribed direction either alone or as part of a multi-
beam treatment technique; this includes exposures that are static in nature, or those delivered
dynamically as part of an IMRT technique, or those that are comprised of multiple control
points, or “fields within fields”.
Four dimensional computerised tomography (4DCT): uses technology to take images that
capture the tumour and also capture the movement of the body's organs or of the tumour over
time. This additional dimension is very important for tumours located on or near organs that
move, in that it makes treatment more accurate.
Fractions: the number of smaller doses (i.e. parts) required to deliver the total prescribed
treatment course.
FTE: the number of full-time equivalent professionals is defined as the number of
professionals multiplied by the average weekly hours worked, divided by the number of hours
in a 'standard' full-time working week. The „standard‟ hours in the Award under which staff
are employed is used in the calculation. In the absence of an Award, „standard‟ is defined as
45 hours for medical practitioners and 37.5 hours for radiation therapists and radiation
oncology medical physicists.
Gated delivery: refers to respiratory gating during free breathing, by limiting irradiation to
part of the breathing cycle. The motion of the tumour caused by breathing can be limited
during irradiation.
Radiation Oncology Workforce Planning
Final Report Page iv
Headcount: The number of individual persons employed by the facility irrespective of the
hours that they are paid to work.
HDR: High dose rate brachytherapy, uses a dose of 20 cGy per minute or above. HDR is an
alternative to LDR in cases where it can be administered without a large number of fractions.
Hypo-fractionation: The delivery of higher doses of radiation in fewer treatments than
conventional radiation therapy.
Image guided radiotherapy (IGRT): refers to the use of frequent imaging in the treatment
position during a course of radiotherapy to localise the tumour prior to or during each
treatment.
Image fusion for treatment planning: is the process of combining relevant information from
two or more images into a single image. Image fusion can be performed by using hybrid
scanners that combine two distinct medical imaging modalities such as positron emission
tomography (PET) and computed tomography (CT) into a single device. There is also a
software-based image fusion technique which can merge image datasets taken at different
times or with different medical imaging modalities.
Independent practice: used to refer to radiation oncologists who are no longer working
under supervision, generally characterised by the completion of specialised vocational
training to become a qualified radiation oncologist.
Intensity Modulated Radiotherapy (IMRT): A type of three-dimensional radiation therapy
that uses computer-generated images to show the size and shape of the tumour. Thin beams
of radiation of different intensities are aimed at the tumour from many angles. This type of
radiation therapy reduces the damage to healthy tissue near the tumour.
Intra-operative radiotherapy: radiation treatment aimed directly at a tumour during surgery.
LDR: or low dose rate brachytherapy, involves implanting radioactive material temporarily or
permanently. It is commonly used for cancer of the oral cavity and oropharynx and sarcoma,
as well as prostate cancer. LDR also refers to seed implantation.
Linear accelerator: A high energy machine that delivers external beam radiotherapy.
Mesothelioma: A benign or malignant (cancer) tumour affecting the lining of the chest or
abdomen. Exposure to asbestos particles in the air increases the risk of developing malignant
mesothelioma.
Metropolitan: includes areas within the city limits of Sydney, Melbourne, Brisbane, Perth,
Adelaide, Newcastle, Gold Coast, Canberra, Wollongong, Sunshine Coast, Hobart, Geelong,
Townsville and Cairns.
Management/Administration workload: includes quality assurance activities (except for
radiation oncology medical physicists, quality assurance activities are included in equipment
commissioning and quality assurance workload), dictating/correcting letters, management
director/associations, meetings, reports, guidelines, surveys.
Radiation Oncology Workforce Planning
Final Report Page v
Modulated arc therapy (includes VMAT and RapidArc): is a system for intensity
modulated radiotherapy incorporating capabilities such as variable dose-rate, variable gantry
speed, and accurate and fast dynamic multileaf collimators (DMLC), to deliver a highly
conformal dose to the tumour site.
New patients: patients presenting to a facility for the first course of treatment for a given
cancer diagnosis (i.e. they have not received a previous course of radiotherapy for the given
cancer diagnosis at any facility).
Number of days for commissioning or decommissioning: the integer number of days that
the linear accelerator is not available for at least half the day for treating patients because it is
being commissioned or de-commissioned. For days where time is exactly equally divided
between two functions, allocate the day in the preference order: treatment, maintenance,
commissioning or decommissioning then non-operating.
Number of days for maintenance or calibration: the integer number of days that the linear
accelerator is not available for at least half the day for treating patients because of planned or
unplanned maintenance or calibration. For days where time is exactly equally divided
between two functions, allocate the day in the preference order: treatment, maintenance,
commissioning or decommissioning then non-operating.
Number of non-operating days: the integer number of days that the linear accelerator is not
used for any purpose for at least half the day (i.e. the machine is available but not being used
because it is a weekend or public holiday day, suitable staff are not available, the machine is
unserviceable, etc.). For days where time is exactly equally divided between two functions,
allocate the day in the preference order: treatment, maintenance, commissioning or
decommissioning then non-operating.
Number of treatment days: the integer number of days that the linear accelerator is used to
treat patients for at least half the time it is operating on the day. For days where time is
exactly equally divided between two functions, allocate the day in the preference order:
treatment, maintenance, commissioning or decommissioning then non-operating.
Outreach services: are services provided by clinicians to patients in locations other than from
their usual/main workplace e.g. in the patient‟s home or place of work, or in clinics in other
hospital settings or community health centres; an outreach service involves the clinician
travelling to the patient.
Palliative treatment: cancer treatment to alleviate potential/actual symptoms due to the
underlying cancer, without the prospect of cure.
PDY: Professional Development Year: the vocationally based professional development year
that radiotherapy graduates are required to complete prior to being eligible for full
accreditation with the Australian Institute of Radiography.
Positron Emission Tomography (PET): is a nuclear medicine imaging technique which
produces a three-dimensional image or picture of functional processes in the body.
Radiation safety and protection workload: includes activities ensuring equipment is
functioning properly and according to applicable standards and that the equipment is installed
Radiation Oncology Workforce Planning
Final Report Page vi
and used in a way which provides maximum radiation safety for operators, patients and
others; and examination of protective equipment and shielding to ensure that they are present
and provide the required protection.
Radical treatment: cancer treatment with the aim of curing the cancer. Include all
treatments where the aim is to increase survival. The radiotherapy course could be either
primary or adjuvant treatment.
RapidArc: refer to Modulated arc therapy
Research workload: investigations/activities that are carried out as part of a recognised
research project and/or clinical trial for which a specific proposal has been prepared and
approved by a relevant body (e.g. work under a funded research grant, work approved by the
hospital‟s ethics committee).
Re-treatment patients: patients having a second or subsequent course of radiotherapy after
having previously received a course of radiotherapy for the same primary diagnosis (including
treating a second anatomical site for the same primary diagnosis) whether or not the previous
course(s) was delivered in the same facility.
Stereotactic radiosurgery: A type of external radiation therapy that uses special equipment
to position the patient and precisely give a single large dose of radiation to a tumour. It is
used to treat brain tumours and other brain disorders that cannot be treated by regular surgery.
Sub-specialist: a clinician who has an advanced knowledge of, expertise or experience in, a
particular area within their speciality.
Superficial/orthovoltage radiotherapy: a type of radiotherapy used to treat lesions that do
not require a dose of radiation to a great depth, such as skin and bone cancers or scars.
Teaching workload: supervising medical students, radiation oncology registrars, and/or other
registrars/students; and preparing lectures and presentations to be given in seminars, grand
rounds and related activities where the principal purpose is to educate students/trainees.
Tomography: A series of detailed pictures of areas inside the body. The pictures are created
by a computer linked to an x-ray machine.
Tomotherapy: uses a dynamic delivery in which the gantry, treatment couch, and multileaf
collimator leaves are all in motion during treatment. Tomotherapy is a type of intensity-
modulated radiation therapy, also called helical tomotherapy.
TEAP: Training, Education and Accreditation Program: this program addresses the training
of medical physicists to become accredited (be awarded the AROMP) as a ROMP by the
Australasian College of Physical Scientists and Engineers in Medicine (ACPSEM).
Total annual treatment hours: the aggregate in a one year period of the number of hours
that the linear accelerator is booked for treating patients.
Radiation Oncology Workforce Planning
Final Report Page vii
Vacant position: a position for which there are funds available, that is not currently occupied
(i.e. no-one is being paid from the funds available to fill the position), and there are active
processes in place and/or it is clearly intended to find a suitable person to fill the position.
VMAT: refer to Modulated arc therapy.
Working independently: used to refer to radiation oncology medical physicists who are no
longer working under direct supervision, generally characterised by the completion of the
ACPSEM Training Education and Accreditation Program or a similar program to become an
accredited radiation oncology medical physicist (i.e. no longer considered to be in training).
Radiation Oncology Workforce Planning
Final Report Page 1
Executive Summary
On 28th
January 2009, the Commonwealth Department of Health and Ageing (DoHA),
commissioned a project to:
„undertake a review of the current status and capacity of the three main professions
that make up the radiation oncology workforce (radiation oncologists (ROs),
radiation therapists (RTs) and radiation oncology medical physicists (ROMPs)) and
to identify opportunities for ensuring an adequate supply of a well trained radiation
oncology workforce‟
Radiotherapy is an important component of cancer treatment; it increases cure rates, and
lessens the suffering of patients and their families. Research has shown that over 52% of
cancer patients stand to benefit from the use of radiotherapy at some time during their disease
trajectory1, either for cure or for palliation of advanced disease. As a result of the data
collected for the purposes of this project, it is estimated that, in 2008, 38.1% of newly
diagnosed cancer patients received radiotherapy treatment indicating that additional service
delivery capacity is required to achieve the best practice treatment rate.
A key part of further increasing the capacity to provide radiotherapy services is to ensure that
there is an adequate balance between the supply of, and demand for, trained professionals in
the key radiotherapy disciplines, being ROs, RTs and ROMPs. DoHA, working with the
Radiation Oncology Reform Implementation Committee (RORIC), has recognised that
workforce planning is a key tool for addressing the supply demand balance and commissioned
this project with objectives to:
provide information on the current radiation oncology workforce profession numbers and
issues affecting radiation oncology service provision in Australia;
provide a methodology which will ensure reliable workforce planning can be conducted in
the future; and
identify opportunities to address workforce and skills shortages.
Project methodology and any need for change
The project methodology relied heavily on primary data collection. Its principal components
were a “facilities‟ survey” that collected data on equipment, service utilisation and workforce
from all radiation oncology facilities operating in Australia in 2008 and a “professions‟
survey” with three sub-components, one each for ROs, RTs and ROMPs. The facilities‟
survey was undertaken with the cooperation and support of the state/territory health
departments and the private radiation oncology providers. The professions‟ surveys were
undertaken with the cooperation and support of the Royal Australian and New Zealand
College of Radiologists (RANZCR) for ROs, the Australian Institute of Radiography (AIR)
for RTs, and the Australasian College of Physical Scientists and Engineers in Medicine
(ACPSEM) for ROMPs. Another part of the project was the use of case studies which
consisted of site visits to 20 radiation oncology facilities (11 public and nine private (one from
each ownership group)) around Australia by the project team to collect qualitative data on
workforce planning issues.
1 Delaney G, Jacob S, Featherstone C and Barton M (2005). The role of radiotherapy in cancer treatment: Estimating optimal utilization
from a review of evidence-based clinical guidelines. Cancer, Volume 104, Issue 6
Radiation Oncology Workforce Planning
Final Report Page 2
There was a 100% response rate to the facilities‟ survey and high levels of cooperation from
stakeholders participating in the case study process. The response rates for the professions‟
surveys were 53.2% for ROs, 50.4% for RTs and 80.1% for ROMPs. On this basis, it is
considered that the data generated by the project are suitable as a basis for the five and ten
year workforce projections for each of the professional groups. In particular, the 100%
response rate for the facilities‟ survey, which enabled the development of an accurate baseline
for the number in the workforce for each professional group, provides an assurance that the
results of the workforce projections model are robust and can be used with confidence.
Current radiation oncology workforce and utilisation
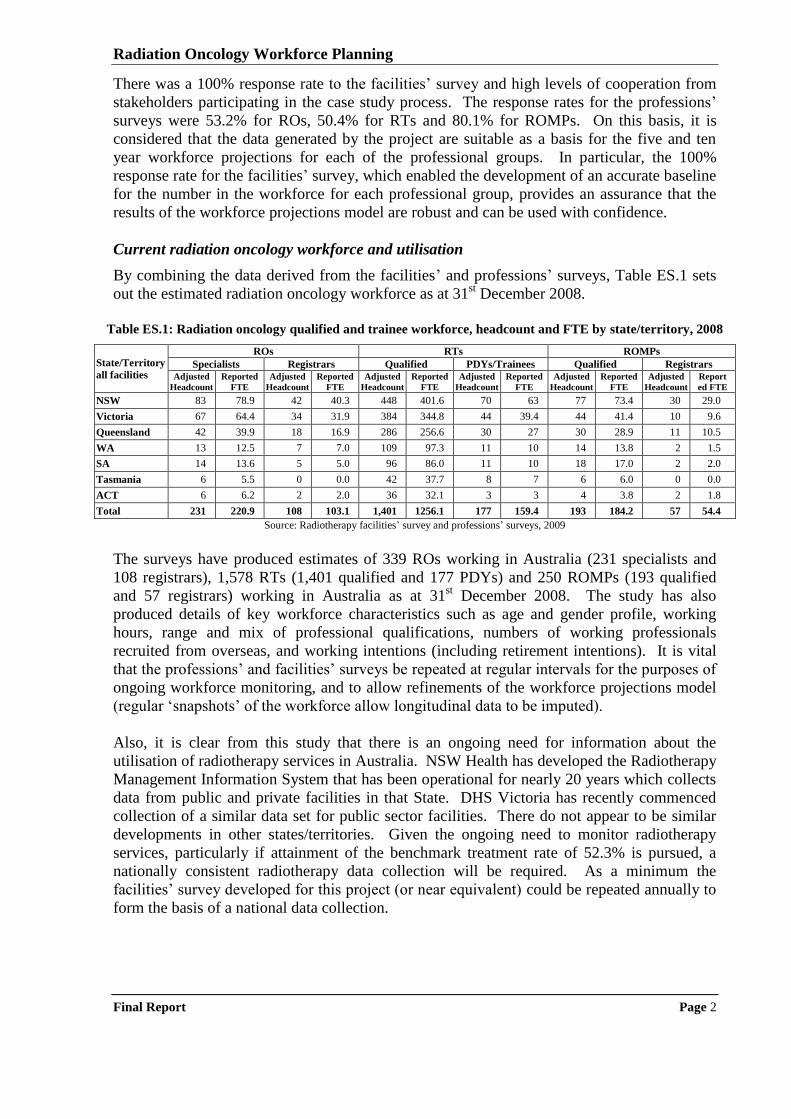
By combining the data derived from the facilities‟ and professions‟ surveys, Table ES.1 sets
out the estimated radiation oncology workforce as at 31st December 2008.
Table ES.1: Radiation oncology qualified and trainee workforce, headcount and FTE by state/territory, 2008
State/Territory
all facilities
ROs RTs ROMPs
Specialists Registrars Qualified PDYs/Trainees Qualified Registrars Adjusted
Headcount
Reported
FTE
Adjusted
Headcount
Reported
FTE
Adjusted
Headcount
Reported
FTE
Adjusted
Headcount
Reported
FTE
Adjusted
Headcount
Reported
FTE
Adjusted
Headcount
Report
ed FTE
NSW 83 78.9 42 40.3 448 401.6 70 63 77 73.4 30 29.0
Victoria 67 64.4 34 31.9 384 344.8 44 39.4 44 41.4 10 9.6
Queensland 42 39.9 18 16.9 286 256.6 30 27 30 28.9 11 10.5
WA 13 12.5 7 7.0 109 97.3 11 10 14 13.8 2 1.5
SA 14 13.6 5 5.0 96 86.0 11 10 18 17.0 2 2.0
Tasmania 6 5.5 0 0.0 42 37.7 8 7 6 6.0 0 0.0
ACT 6 6.2 2 2.0 36 32.1 3 3 4 3.8 2 1.8
Total 231 220.9 108 103.1 1,401 1256.1 177 159.4 193 184.2 57 54.4
Source: Radiotherapy facilities‟ survey and professions‟ surveys, 2009
The surveys have produced estimates of 339 ROs working in Australia (231 specialists and
108 registrars), 1,578 RTs (1,401 qualified and 177 PDYs) and 250 ROMPs (193 qualified
and 57 registrars) working in Australia as at 31st December 2008. The study has also
produced details of key workforce characteristics such as age and gender profile, working
hours, range and mix of professional qualifications, numbers of working professionals
recruited from overseas, and working intentions (including retirement intentions). It is vital
that the professions‟ and facilities‟ surveys be repeated at regular intervals for the purposes of
ongoing workforce monitoring, and to allow refinements of the workforce projections model
(regular „snapshots‟ of the workforce allow longitudinal data to be imputed).
Also, it is clear from this study that there is an ongoing need for information about the
utilisation of radiotherapy services in Australia. NSW Health has developed the Radiotherapy
Management Information System that has been operational for nearly 20 years which collects
data from public and private facilities in that State. DHS Victoria has recently commenced
collection of a similar data set for public sector facilities. There do not appear to be similar
developments in other states/territories. Given the ongoing need to monitor radiotherapy
services, particularly if attainment of the benchmark treatment rate of 52.3% is pursued, a
nationally consistent radiotherapy data collection will be required. As a minimum the
facilities‟ survey developed for this project (or near equivalent) could be repeated annually to
form the basis of a national data collection.
Radiation Oncology Workforce Planning
Final Report Page 3
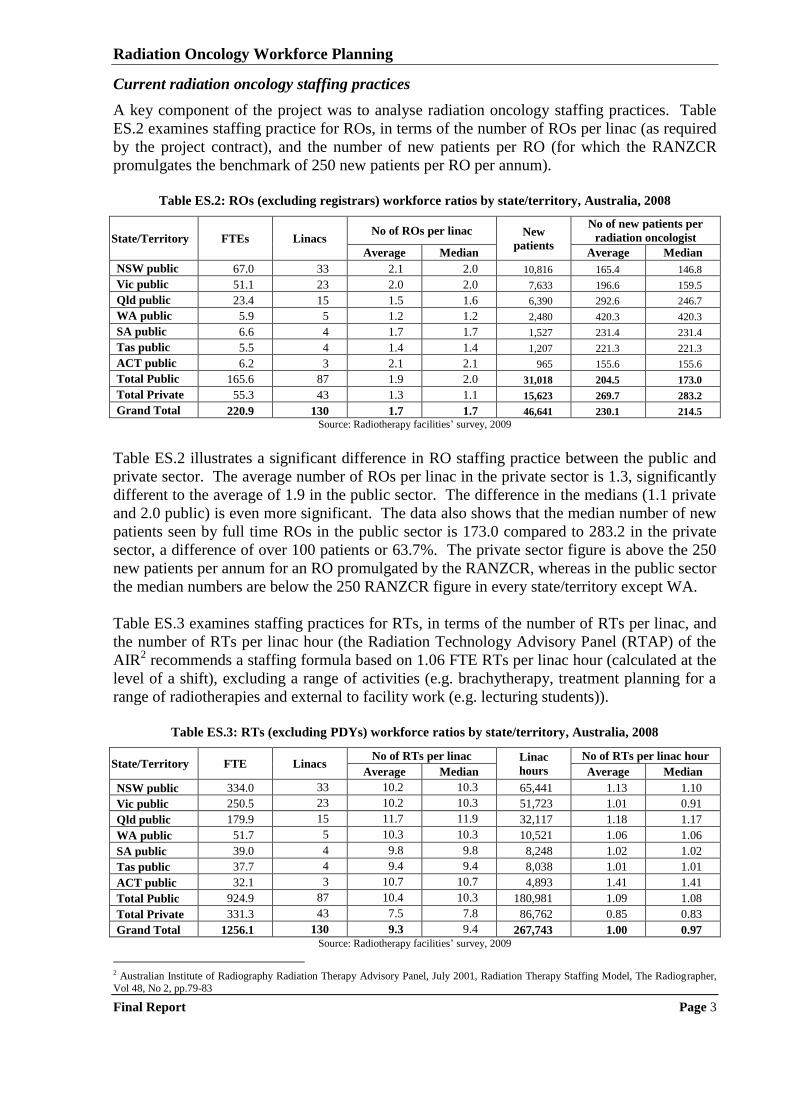
Current radiation oncology staffing practices
A key component of the project was to analyse radiation oncology staffing practices. Table
ES.2 examines staffing practice for ROs, in terms of the number of ROs per linac (as required
by the project contract), and the number of new patients per RO (for which the RANZCR
promulgates the benchmark of 250 new patients per RO per annum).
Table ES.2: ROs (excluding registrars) workforce ratios by state/territory, Australia, 2008
State/Territory FTEs Linacs No of ROs per linac New
patients
No of new patients per
radiation oncologist
Average Median Average Median
NSW public 67.0 33 2.1 2.0 10,816 165.4 146.8
Vic public 51.1 23 2.0 2.0 7,633 196.6 159.5
Qld public 23.4 15 1.5 1.6 6,390 292.6 246.7
WA public 5.9 5 1.2 1.2 2,480 420.3 420.3
SA public 6.6 4 1.7 1.7 1,527 231.4 231.4
Tas public 5.5 4 1.4 1.4 1,207 221.3 221.3
ACT public 6.2 3 2.1 2.1 965 155.6 155.6
Total Public 165.6 87 1.9 2.0 31,018 204.5 173.0
Total Private 55.3 43 1.3 1.1 15,623 269.7 283.2
Grand Total 220.9 130 1.7 1.7 46,641 230.1 214.5
Source: Radiotherapy facilities‟ survey, 2009
Table ES.2 illustrates a significant difference in RO staffing practice between the public and
private sector. The average number of ROs per linac in the private sector is 1.3, significantly
different to the average of 1.9 in the public sector. The difference in the medians (1.1 private
and 2.0 public) is even more significant. The data also shows that the median number of new
patients seen by full time ROs in the public sector is 173.0 compared to 283.2 in the private
sector, a difference of over 100 patients or 63.7%. The private sector figure is above the 250
new patients per annum for an RO promulgated by the RANZCR, whereas in the public sector
the median numbers are below the 250 RANZCR figure in every state/territory except WA.
Table ES.3 examines staffing practices for RTs, in terms of the number of RTs per linac, and
the number of RTs per linac hour (the Radiation Technology Advisory Panel (RTAP) of the
AIR2 recommends a staffing formula based on 1.06 FTE RTs per linac hour (calculated at the
level of a shift), excluding a range of activities (e.g. brachytherapy, treatment planning for a
range of radiotherapies and external to facility work (e.g. lecturing students)).
Table ES.3: RTs (excluding PDYs) workforce ratios by state/territory, Australia, 2008
State/Territory FTE Linacs No of RTs per linac Linac
hours
No of RTs per linac hour
Average Median Average Median
NSW public 334.0 33 10.2 10.3 65,441 1.13 1.10
Vic public 250.5 23 10.2 10.3 51,723 1.01 0.91
Qld public 179.9 15 11.7 11.9 32,117 1.18 1.17
WA public 51.7 5 10.3 10.3 10,521 1.06 1.06
SA public 39.0 4 9.8 9.8 8,248 1.02 1.02
Tas public 37.7 4 9.4 9.4 8,038 1.01 1.01
ACT public 32.1 3 10.7 10.7 4,893 1.41 1.41
Total Public 924.9 87 10.4 10.3 180,981 1.09 1.08
Total Private 331.3 43 7.5 7.8 86,762 0.85 0.83
Grand Total 1256.1 130 9.3 9.4 267,743 1.00 0.97 Source: Radiotherapy facilities‟ survey, 2009
2 Australian Institute of Radiography Radiation Therapy Advisory Panel, July 2001, Radiation Therapy Staffing Model, The Radiographer,
Vol 48, No 2, pp.79-83
Radiation Oncology Workforce Planning
Final Report Page 4
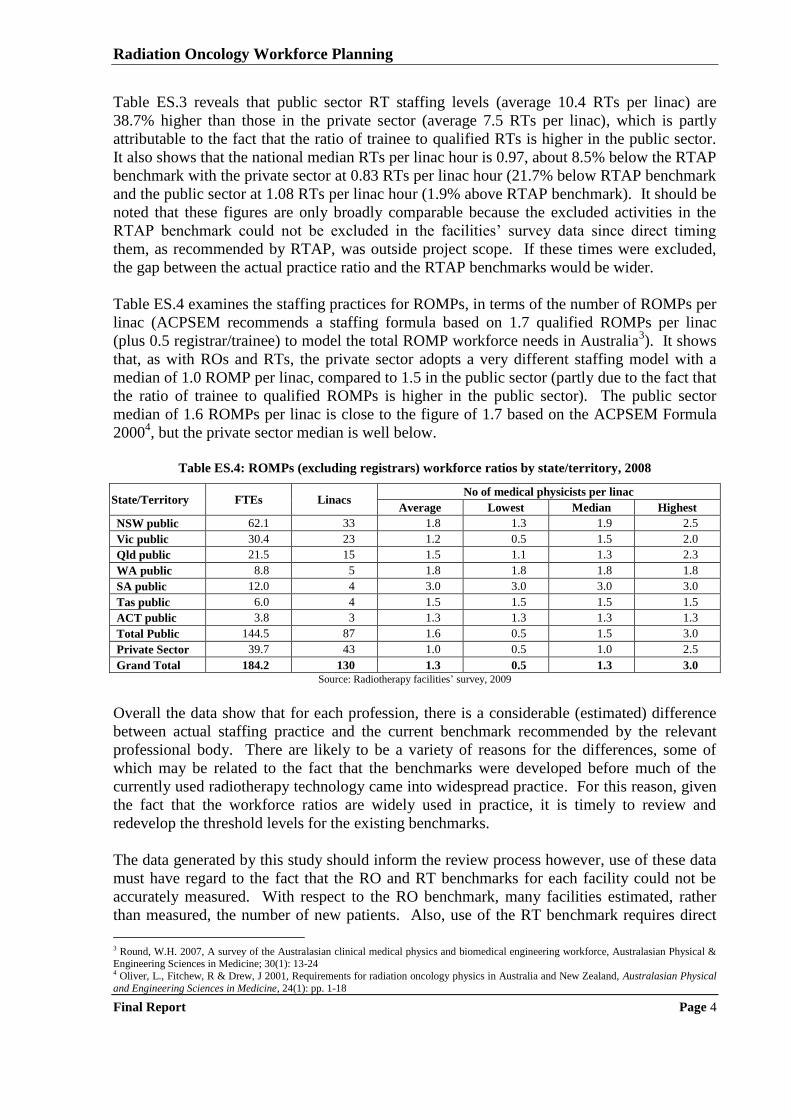
Table ES.3 reveals that public sector RT staffing levels (average 10.4 RTs per linac) are
38.7% higher than those in the private sector (average 7.5 RTs per linac), which is partly
attributable to the fact that the ratio of trainee to qualified RTs is higher in the public sector.
It also shows that the national median RTs per linac hour is 0.97, about 8.5% below the RTAP
benchmark with the private sector at 0.83 RTs per linac hour (21.7% below RTAP benchmark
and the public sector at 1.08 RTs per linac hour (1.9% above RTAP benchmark). It should be
noted that these figures are only broadly comparable because the excluded activities in the
RTAP benchmark could not be excluded in the facilities‟ survey data since direct timing
them, as recommended by RTAP, was outside project scope. If these times were excluded,
the gap between the actual practice ratio and the RTAP benchmarks would be wider.
Table ES.4 examines the staffing practices for ROMPs, in terms of the number of ROMPs per
linac (ACPSEM recommends a staffing formula based on 1.7 qualified ROMPs per linac
(plus 0.5 registrar/trainee) to model the total ROMP workforce needs in Australia3). It shows
that, as with ROs and RTs, the private sector adopts a very different staffing model with a
median of 1.0 ROMP per linac, compared to 1.5 in the public sector (partly due to the fact that
the ratio of trainee to qualified ROMPs is higher in the public sector). The public sector
median of 1.6 ROMPs per linac is close to the figure of 1.7 based on the ACPSEM Formula
20004, but the private sector median is well below.
Table ES.4: ROMPs (excluding registrars) workforce ratios by state/territory, 2008
State/Territory FTEs Linacs No of medical physicists per linac
Average Lowest Median Highest
NSW public 62.1 33 1.8 1.3 1.9 2.5
Vic public 30.4 23 1.2 0.5 1.5 2.0
Qld public 21.5 15 1.5 1.1 1.3 2.3
WA public 8.8 5 1.8 1.8 1.8 1.8
SA public 12.0 4 3.0 3.0 3.0 3.0
Tas public 6.0 4 1.5 1.5 1.5 1.5
ACT public 3.8 3 1.3 1.3 1.3 1.3
Total Public 144.5 87 1.6 0.5 1.5 3.0
Private Sector 39.7 43 1.0 0.5 1.0 2.5
Grand Total 184.2 130 1.3 0.5 1.3 3.0
Source: Radiotherapy facilities‟ survey, 2009
Overall the data show that for each profession, there is a considerable (estimated) difference
between actual staffing practice and the current benchmark recommended by the relevant
professional body. There are likely to be a variety of reasons for the differences, some of
which may be related to the fact that the benchmarks were developed before much of the
currently used radiotherapy technology came into widespread practice. For this reason, given
the fact that the workforce ratios are widely used in practice, it is timely to review and
redevelop the threshold levels for the existing benchmarks.
The data generated by this study should inform the review process however, use of these data
must have regard to the fact that the RO and RT benchmarks for each facility could not be
accurately measured. With respect to the RO benchmark, many facilities estimated, rather
than measured, the number of new patients. Also, use of the RT benchmark requires direct
3 Round, W.H. 2007, A survey of the Australasian clinical medical physics and biomedical engineering workforce, Australasian Physical & Engineering Sciences in Medicine; 30(1): 13-24 4 Oliver, L., Fitchew, R & Drew, J 2001, Requirements for radiation oncology physics in Australia and New Zealand, Australasian Physical
and Engineering Sciences in Medicine, 24(1): pp. 1-18
Radiation Oncology Workforce Planning
Final Report Page 5
timing of excluded tasks (e.g. brachytherapy, SRS and IMRT planning), which was beyond
the scope of this study. A review of threshold levels for the current benchmarks will be, at
best, of short term value. In the mid-term, better benchmarks are required which are not as
simplistic as having the number of linacs or the number of new patients as the denominator.
The study also found key differences exist between the public and private facilities regarding
the desired staffing model. For this reason, in the short term, it is better to have separate
benchmarks for the public and private sectors until the workload of facilities is more closely
aligned. Based on the information gathered in the case studies, it seems that that the patient
treatment processes are similar in the two sectors (there may be differences in casemix, which
could not be measured in the study as there is no agreed measure of patient complexity), but
the teaching, training and research workload is significantly greater in the public sector. Until
workload benchmarks are developed that can take these differences into account in the
formulae, separate public and private sector thresholds for the existing workforce benchmarks
would be most appropriate when considering the number of staff required for a facility.
Methods for projecting the radiation oncology workforce
The 20 case studies of radiation oncology facilities and consultations with other stakeholders
identified current approaches to staffing facilities and planning for the future workforce. At
the State/Territory Health authority level, workforce planning has been addressed as part of
the development of radiotherapy service plans (development of such plans was an initiative
that flowed from implementation of the Baume Inquiry). Not all states/territories have
completed these plans and not all are in the public domain, but for those that the project team
has had the opportunity to review it is clear that there is a propensity, in the public sector, to
adopt the RANZCR, AIR and ACPSEM workforce planning benchmarks of 250 new patients
per RO, 1.06 RTs per linac hour and 1.7 ROMPS per linac.
Operators of private sector facilities are aware of the professional body benchmarks but based
on the information derived from the cases studies, they make little use of them. They set
staffing levels based on what they consider financially sustainable given the revenue stream
generated from the MBS and patients. The general private sector view was that staffing to the
level recommended by the professional bodies was not financially sustainable nor was it
desirable. However, representatives of private sector facilities consistently stated that if
specific funding to support teaching, training and research activities was provided more staff
would be taken on to carry out these activities (hence moving private sector staffing levels
closer to the professional body benchmarks).
Ideal radiation oncology workforce and affordability
The project brief requested a determination of “the „ideal‟ supply of each profession to
operate existing linacs, including the basis for determination and an assessment of its
affordability”. Determining the „ideal‟ workforce level normally requires a set of data that
reflect a normative or best practice approach to carrying out the work. Typically, the work
would be broken down into tasks and the time required to complete each task would be
determined (either by direct measurement of a set of actual times leading to the determination
of the „efficient time‟ or by convening a focus group of practitioners to estimate the „efficient
time‟ using a process known as „magnitude estimation5,6
‟). „Ideal‟ staffing levels would then
5 Hsiao WC, Yntema D, Braun P, Dunn D and Spencer C (1988). Measurement and analysis of intraservice work. Journal of the American
Medical Association. Vol 260, (16), 2361-2370.
Radiation Oncology Workforce Planning
Final Report Page 6
be calculated by measuring the number of times each task needs to be carried out in the
radiation oncology facility, multiplying by the time required for each task, and aggregating to
obtain total time. However, the study methodology did not provide for either direct timing or
magnitude estimation so this methodology could not be followed.
The study only measured actual staffing levels and obtained a range of stakeholder opinion as
to what is „ideal‟. It has been found that actual staffing levels vary considerably, as do
stakeholder views on the level of staff required to operate a radiation oncology facility.
Certainly, it is possible to conclude that the current staffing levels are not „ideal‟ as there is
widespread agreement that more ROMPs would be recruited if qualified applicants were
available. The situation is less clear for the RTs and ROs. The study has determined that,
apart from problems in recruiting to some regional areas, overall, there is no current shortage
of ROs and RTs (given current radiotherapy treatment rates). This does not, however, mean
that the current RO and RT workforce is „ideal‟, there may be other reasons (e.g. available
funds) that better account for staffing levels.
It is also considered that the benchmarks promulgated by the professional bodies do not
reflect „ideal‟ staffing levels (even though they are often used as a reference point in the
public sector). The benchmarks are out-of-date. For the RT and ROMP benchmarks, the
project team reviewed the supporting papers which revealed that the threshold levels reflect
radiotherapy practice in the late 1990‟s. Consequently, the RT and ROMP benchmarks are
not considered to represent the „ideal‟ workforce levels. Despite repeated attempts through
liaison with RANZCR, a paper describing the basis for the RO benchmark could not be found.
However, it is also considered that the benchmark is out-of-date and stakeholder opinion is
that it certainly does not reflect the additional work required of a RO as a result of the
introduction of a range of therapies that require much more sophisticated treatment planning.
To address this problem, a comprehensive review of workforce benchmarks is needed. This
review would start by developing casemix adjusted measures of workloads that can be used in
the benchmarks. Due to the emergence of brachytherapy (not linac based) as a treatment
modality, and the wider range of radiotherapy delivery methods on the linacs (with their
associated differences in workload), simple benchmarks that use linacs (undifferentiated) as
the denominator are not adequate. Given the systematic differences in staffing practices
between the public and private sector for all three professional groups, any future analysis of
workforce needs to be based on benchmarks that reflect the mix of work, as well as patient
and treatment complexity in the two sectors (otherwise different thresholds need to be
developed for the two sectors, as has been suggested in the short term).
The project objectives also required investigation of the issue of „affordability‟ of the „ideal‟
staffing models. The question of affordability cannot be addressed without an assessment of
capacity to pay, which was not provided for in the project methodology. In the public sector
affordability can be interpreted as the capacity of governments to invest in radiotherapy
services relative to the other potential uses of public monies. By definition, the current
staffing models are affordable because they are funded. However, for the reasons already
discussed, the current staffing levels are not considered to be „ideal‟. Also the current staffing
levels result in a treatment rate of 38.1% whereas the project brief states that „RORIC has
established that 52% of cancer patients will need and/or benefit from radiotherapy and that
6 National Centre for Classification in Health (2000). Review of the literature on relative values carried out by NCCH in 1998 to inform the
PRS. Resource material C. Prepared for Medicare Schedule Review Board.
Radiation Oncology Workforce Planning
Final Report Page 7
about a quarter of these patients are not accessing treatment within the recommended
timeframes‟. The workforce modelling provides information on the staffing numbers that
would be required to deliver a 52.3% treatment rate, but governments will need to determine
whether these staffing levels are affordable.
In the private sector, affordability can be measured by the capacity of the facility to hire staff
to provide quality services whilst generating a commercial return for shareholders. Currently,
this equation results in lower staffing levels for private radiotherapy facilities relative to
public. Based on data derived from the facilities‟ survey these staffing levels, in turn, result in
a lower capacity of private services to bear the teaching, training and research workload.
Again, the current private sector staffing levels are „affordable‟, but they are not considered
„ideal‟. A full costing study of radiotherapy services would be required to determine what is
possible in terms of the mix of treatment services, teaching, training and research that can be
sustained at a given level of revenue for private facilities. The revenue level is a matter for
both government (through setting the MBS fee) and private providers (through policies on co-
payments, and required rate of return on investment). It is important to note that such a
costing study could also be used to develop casemix adjusted measures of workload.
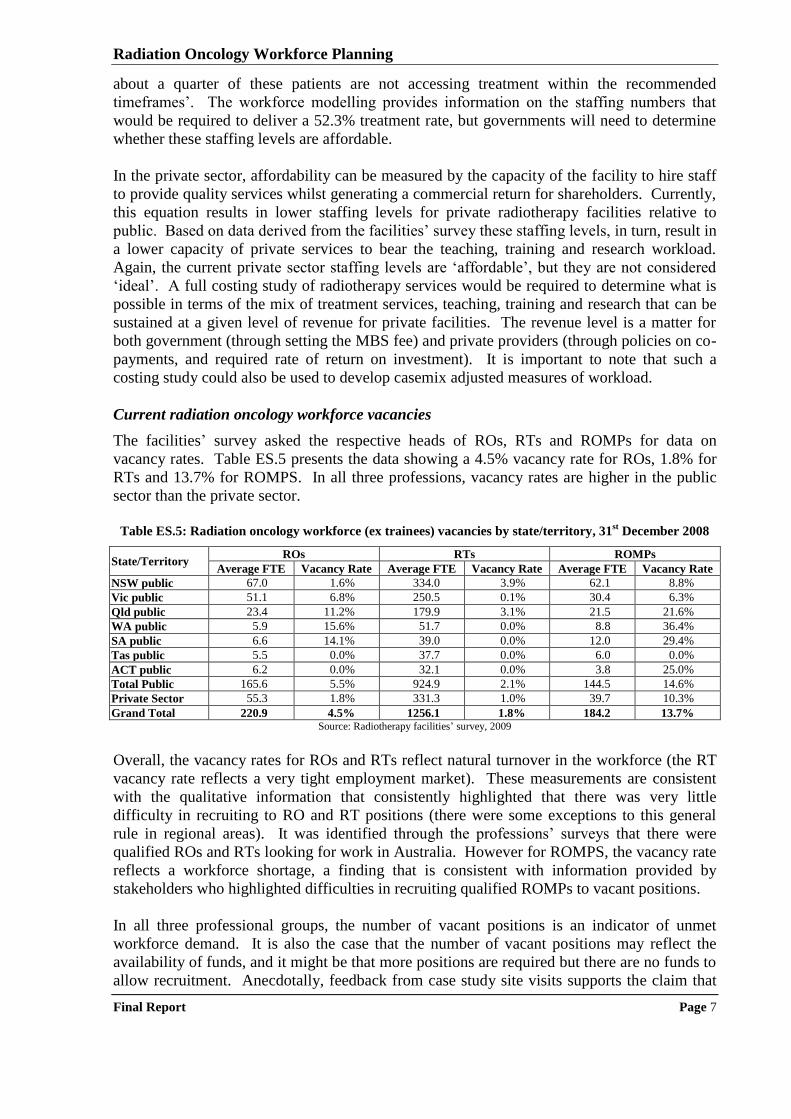
Current radiation oncology workforce vacancies
The facilities‟ survey asked the respective heads of ROs, RTs and ROMPs for data on
vacancy rates. Table ES.5 presents the data showing a 4.5% vacancy rate for ROs, 1.8% for
RTs and 13.7% for ROMPS. In all three professions, vacancy rates are higher in the public
sector than the private sector.
Table ES.5: Radiation oncology workforce (ex trainees) vacancies by state/territory, 31
st December 2008
State/Territory ROs RTs ROMPs
Average FTE Vacancy Rate Average FTE Vacancy Rate Average FTE Vacancy Rate
NSW public 67.0 1.6% 334.0 3.9% 62.1 8.8%
Vic public 51.1 6.8% 250.5 0.1% 30.4 6.3%
Qld public 23.4 11.2% 179.9 3.1% 21.5 21.6%
WA public 5.9 15.6% 51.7 0.0% 8.8 36.4%
SA public 6.6 14.1% 39.0 0.0% 12.0 29.4%
Tas public 5.5 0.0% 37.7 0.0% 6.0 0.0%
ACT public 6.2 0.0% 32.1 0.0% 3.8 25.0%
Total Public 165.6 5.5% 924.9 2.1% 144.5 14.6%
Private Sector 55.3 1.8% 331.3 1.0% 39.7 10.3%
Grand Total 220.9 4.5% 1256.1 1.8% 184.2 13.7% Source: Radiotherapy facilities‟ survey, 2009
Overall, the vacancy rates for ROs and RTs reflect natural turnover in the workforce (the RT
vacancy rate reflects a very tight employment market). These measurements are consistent
with the qualitative information that consistently highlighted that there was very little
difficulty in recruiting to RO and RT positions (there were some exceptions to this general
rule in regional areas). It was identified through the professions‟ surveys that there were
qualified ROs and RTs looking for work in Australia. However for ROMPS, the vacancy rate
reflects a workforce shortage, a finding that is consistent with information provided by
stakeholders who highlighted difficulties in recruiting qualified ROMPs to vacant positions.
In all three professional groups, the number of vacant positions is an indicator of unmet
workforce demand. It is also the case that the number of vacant positions may reflect the
availability of funds, and it might be that more positions are required but there are no funds to
allow recruitment. Anecdotally, feedback from case study site visits supports the claim that
Radiation Oncology Workforce Planning
Final Report Page 8
funding shortages, rather than the lack of need, restrict the number of positions. However, the
impact of funding shortages cannot be determined using the study methodology. The study
has shown that current staffing levels are below the benchmarks promulgated by the AIR and
ACPSEM, but consistent with the benchmarks promulgated by RANZCR. However, these
benchmarks are not considered to represent the „ideal‟ level of workforce.
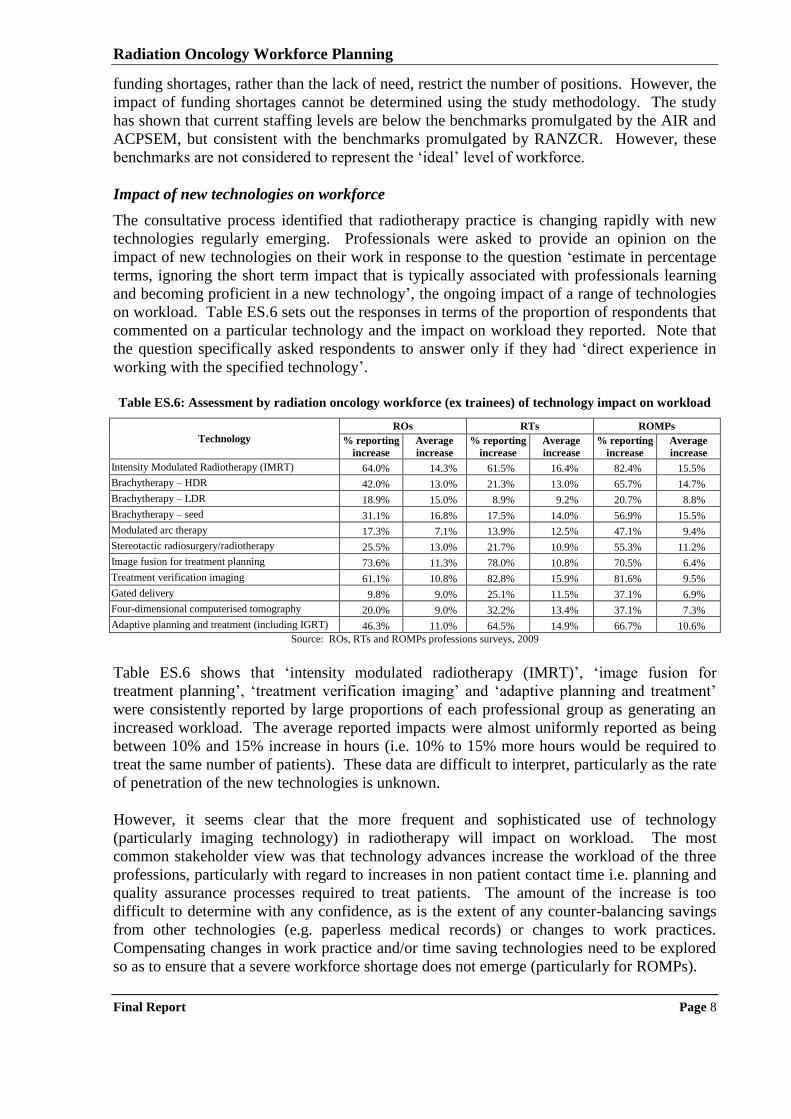
Impact of new technologies on workforce
The consultative process identified that radiotherapy practice is changing rapidly with new
technologies regularly emerging. Professionals were asked to provide an opinion on the
impact of new technologies on their work in response to the question „estimate in percentage
terms, ignoring the short term impact that is typically associated with professionals learning
and becoming proficient in a new technology‟, the ongoing impact of a range of technologies
on workload. Table ES.6 sets out the responses in terms of the proportion of respondents that
commented on a particular technology and the impact on workload they reported. Note that
the question specifically asked respondents to answer only if they had „direct experience in
working with the specified technology‟.
Table ES.6: Assessment by radiation oncology workforce (ex trainees) of technology impact on workload
Technology
ROs RTs ROMPs
% reporting
increase
Average
increase
% reporting
increase
Average
increase
% reporting
increase
Average
increase
Intensity Modulated Radiotherapy (IMRT) 64.0% 14.3% 61.5% 16.4% 82.4% 15.5%
Brachytherapy – HDR 42.0% 13.0% 21.3% 13.0% 65.7% 14.7%
Brachytherapy – LDR 18.9% 15.0% 8.9% 9.2% 20.7% 8.8%
Brachytherapy – seed 31.1% 16.8% 17.5% 14.0% 56.9% 15.5%
Modulated arc therapy 17.3% 7.1% 13.9% 12.5% 47.1% 9.4%
Stereotactic radiosurgery/radiotherapy 25.5% 13.0% 21.7% 10.9% 55.3% 11.2%
Image fusion for treatment planning 73.6% 11.3% 78.0% 10.8% 70.5% 6.4%
Treatment verification imaging 61.1% 10.8% 82.8% 15.9% 81.6% 9.5%
Gated delivery 9.8% 9.0% 25.1% 11.5% 37.1% 6.9%
Four-dimensional computerised tomography 20.0% 9.0% 32.2% 13.4% 37.1% 7.3%
Adaptive planning and treatment (including IGRT) 46.3% 11.0% 64.5% 14.9% 66.7% 10.6%
Source: ROs, RTs and ROMPs professions surveys, 2009
Table ES.6 shows that „intensity modulated radiotherapy (IMRT)‟, „image fusion for
treatment planning‟, „treatment verification imaging‟ and „adaptive planning and treatment‟
were consistently reported by large proportions of each professional group as generating an
increased workload. The average reported impacts were almost uniformly reported as being
between 10% and 15% increase in hours (i.e. 10% to 15% more hours would be required to
treat the same number of patients). These data are difficult to interpret, particularly as the rate
of penetration of the new technologies is unknown.
However, it seems clear that the more frequent and sophisticated use of technology
(particularly imaging technology) in radiotherapy will impact on workload. The most
common stakeholder view was that technology advances increase the workload of the three
professions, particularly with regard to increases in non patient contact time i.e. planning and
quality assurance processes required to treat patients. The amount of the increase is too
difficult to determine with any confidence, as is the extent of any counter-balancing savings
from other technologies (e.g. paperless medical records) or changes to work practices.
Compensating changes in work practice and/or time saving technologies need to be explored
so as to ensure that a severe workforce shortage does not emerge (particularly for ROMPs).
Radiation Oncology Workforce Planning
Final Report Page 9
The potential impact of technology is so significant that a further detailed study is warranted.
There is a history of such studies in radiation oncology, for example the establishment and
evaluation of trials of facilities with a single machine. Similar studies could be set up to
evaluate the impact on workload of the various emerging radiotherapy technologies. Such
studies could be at multiple sites and there could be a bias to involving facilities in regional
areas to provide an opportunity for staff to participate in research and development activities.
As necessary and appropriate the studies could have a broader focus, and include evaluation
of treatment outcomes (not a pre-requisite as studying workload impact alone would be
challenging, particularly establishing suitable baseline measures).
Impact of new service models on workforce
The case studies also examined the issue of the role of radiotherapy in cancer treatment and
how it might change over time. The majority stakeholder view was that radiotherapy would
continue to be an important component of cancer treatment and care. The pace of evolution in
clinical practice will determine the future role of radiotherapy in cancer treatment but, based
on the consultations carried out for this study, the goal of 52.3% of cancer patients receiving
radiotherapy treatment for either curative or palliative purposes at some stage in their cancer
journey remains relevant and should guide the development of radiotherapy facilities and
workforce for at least the next five years.
At the level of individual cancers, stakeholders cited the reduced incidence of gynaecological
cancers as a factor that may reduce radiotherapy workload and the increased detection and
treatment of prostate cancer was cited as a factor that could increase workload. There is
insufficient evidence to determine whether there will be a net effect, but stakeholders
consistently advised the number of patients needing radiotherapy treatment will not decrease
(either in absolute terms or as a proportion of patients diagnosed with cancer). Newer service
model developments such as intra-operative radiotherapy (one dose applied intra-operatively
as substitute for a course applied over 20 fractions) and hypo-fractionation (larger doses in
each fraction, thereby reducing the number of fractions) were seen as potential sources of
workload reductions but it is too early to be definitive about potential workforce impact.
These developments should be monitored.
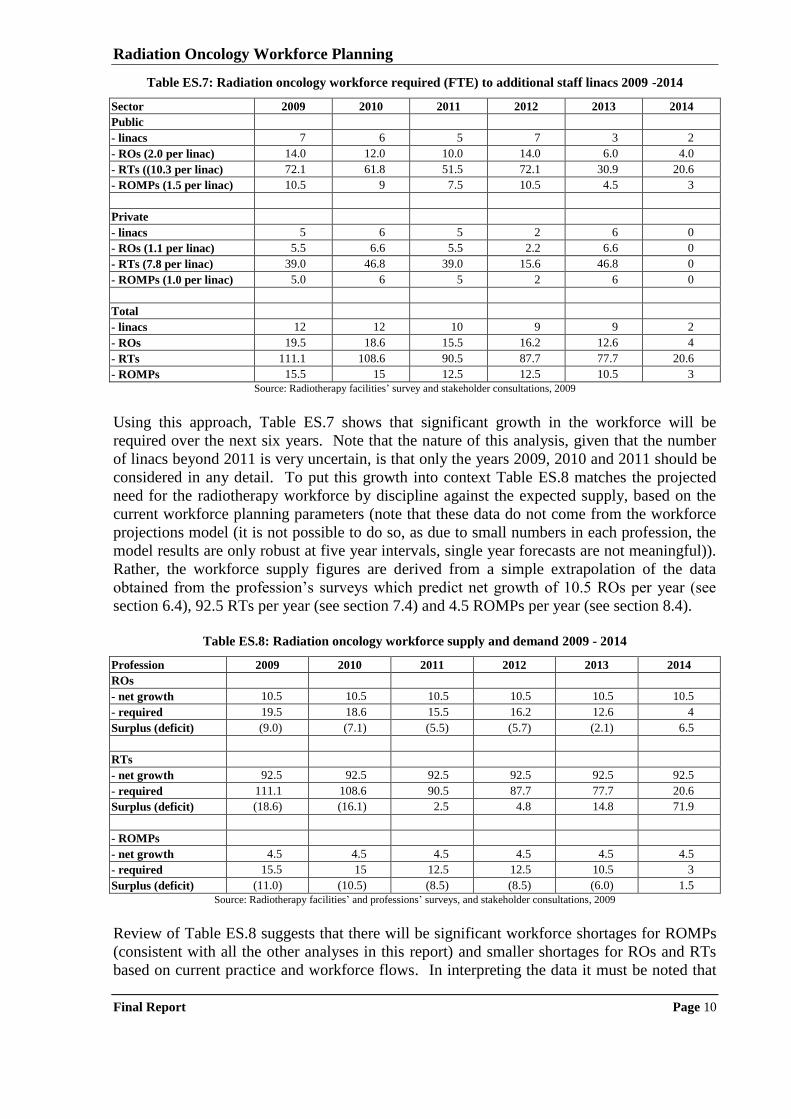
Short-term workforce required to support new facilities
There are two aspects to considering the workforce situation going forward. The first is the
short term situation, which is best examined by projecting the workforce requirements by
profession based on the estimated number of linacs that will be commissioned (drawn from
the information provided by stakeholders). Table ES.7 presents the workforce requirements
by sector based on the medians of the distributions derived from the facilities‟ survey of ROs
per linac, RTs per linac, and ROMPs per linac calculated separately for the public and private
sectors and then totalled. It should be noted that this analysis is based on current staffing
practice, which is not considered to be „ideal‟, particularly in the case of ROMPs.
Radiation Oncology Workforce Planning
Final Report Page 10
Table ES.7: Radiation oncology workforce required (FTE) to additional staff linacs 2009 -2014
Sector 2009 2010 2011 2012 2013 2014
Public
- linacs 7 6 5 7 3 2
- ROs (2.0 per linac) 14.0 12.0 10.0 14.0 6.0 4.0
- RTs ((10.3 per linac) 72.1 61.8 51.5 72.1 30.9 20.6
- ROMPs (1.5 per linac) 10.5 9 7.5 10.5 4.5 3
Private
- linacs 5 6 5 2 6 0
- ROs (1.1 per linac) 5.5 6.6 5.5 2.2 6.6 0
- RTs (7.8 per linac) 39.0 46.8 39.0 15.6 46.8 0
- ROMPs (1.0 per linac) 5.0 6 5 2 6 0
Total
- linacs 12 12 10 9 9 2
- ROs 19.5 18.6 15.5 16.2 12.6 4
- RTs 111.1 108.6 90.5 87.7 77.7 20.6
- ROMPs 15.5 15 12.5 12.5 10.5 3
Source: Radiotherapy facilities‟ survey and stakeholder consultations, 2009
Using this approach, Table ES.7 shows that significant growth in the workforce will be
required over the next six years. Note that the nature of this analysis, given that the number
of linacs beyond 2011 is very uncertain, is that only the years 2009, 2010 and 2011 should be
considered in any detail. To put this growth into context Table ES.8 matches the projected
need for the radiotherapy workforce by discipline against the expected supply, based on the
current workforce planning parameters (note that these data do not come from the workforce
projections model (it is not possible to do so, as due to small numbers in each profession, the
model results are only robust at five year intervals, single year forecasts are not meaningful)).
Rather, the workforce supply figures are derived from a simple extrapolation of the data
obtained from the profession‟s surveys which predict net growth of 10.5 ROs per year (see
section 6.4), 92.5 RTs per year (see section 7.4) and 4.5 ROMPs per year (see section 8.4).
Table ES.8: Radiation oncology workforce supply and demand 2009 - 2014
Profession 2009 2010 2011 2012 2013 2014
ROs
- net growth 10.5 10.5 10.5 10.5 10.5 10.5
- required 19.5 18.6 15.5 16.2 12.6 4
Surplus (deficit) (9.0) (7.1) (5.5) (5.7) (2.1) 6.5
RTs
- net growth 92.5 92.5 92.5 92.5 92.5 92.5
- required 111.1 108.6 90.5 87.7 77.7 20.6
Surplus (deficit) (18.6) (16.1) 2.5 4.8 14.8 71.9
- ROMPs
- net growth 4.5 4.5 4.5 4.5 4.5 4.5
- required 15.5 15 12.5 12.5 10.5 3
Surplus (deficit) (11.0) (10.5) (8.5) (8.5) (6.0) 1.5
Source: Radiotherapy facilities‟ and professions‟ surveys, and stakeholder consultations, 2009
Review of Table ES.8 suggests that there will be significant workforce shortages for ROMPs
(consistent with all the other analyses in this report) and smaller shortages for ROs and RTs
based on current practice and workforce flows. In interpreting the data it must be noted that
Radiation Oncology Workforce Planning
Final Report Page 11
the linac acquisition schedule (Table ES.7) is based in information reported by stakeholders,
therefore it may be somewhat optimistic. Linacs usually take longer to acquire and
commission than is predicted, so with only relatively small delays to the acquisition schedule
the shortfalls in respect of ROs and RTs could be fairly easily managed (particularly for RTs,
where there are currently qualified staff looking for work). Notwithstanding this initial
conclusion Table ES.8 should be interpreted cautiously, as there has been no attempt to
project linacs (the linacs shown are those advised to the project team by stakeholders).
Workforce projections model
The detailed workforce projections model allows a comparison of supply and demand for all
three professions, taking account of the current age profile of the workforce, expected new
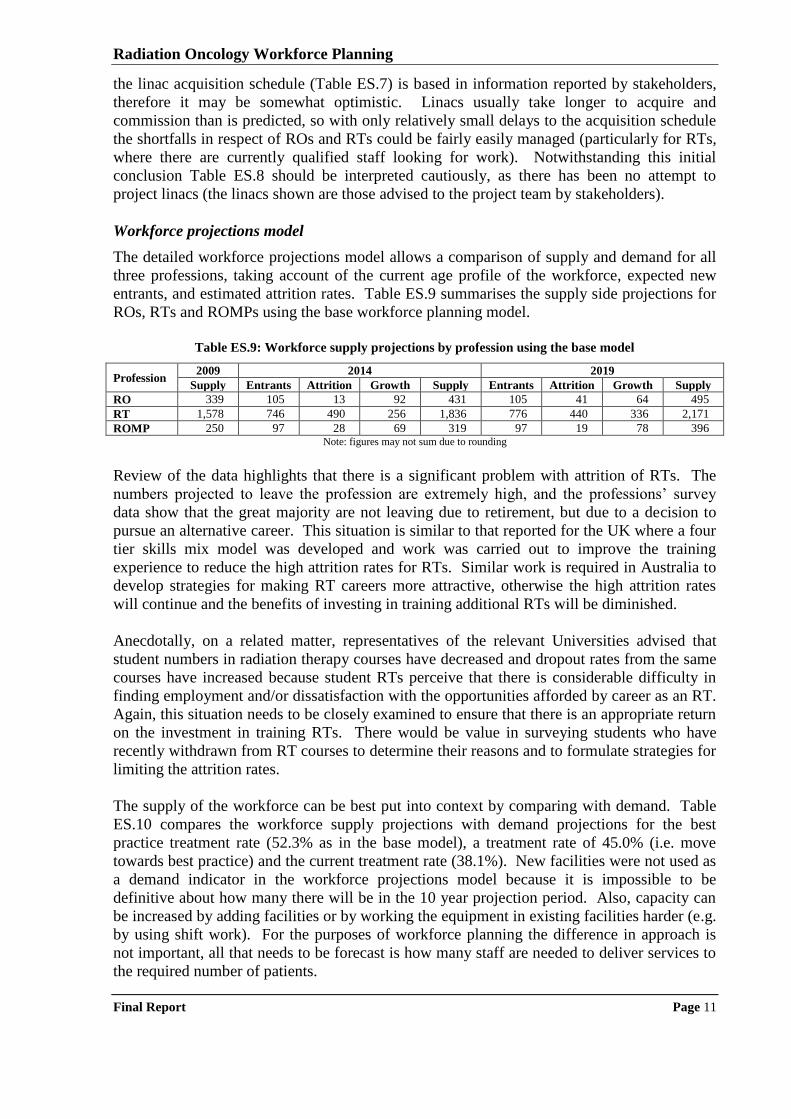
entrants, and estimated attrition rates. Table ES.9 summarises the supply side projections for
ROs, RTs and ROMPs using the base workforce planning model.
Table ES.9: Workforce supply projections by profession using the base model
Profession 2009 2014 2019
Supply Entrants Attrition Growth Supply Entrants Attrition Growth Supply
RO 339 105 13 92 431 105 41 64 495
RT 1,578 746 490 256 1,836 776 440 336 2,171
ROMP 250 97 28 69 319 97 19 78 396 Note: figures may not sum due to rounding
Review of the data highlights that there is a significant problem with attrition of RTs. The
numbers projected to leave the profession are extremely high, and the professions‟ survey
data show that the great majority are not leaving due to retirement, but due to a decision to
pursue an alternative career. This situation is similar to that reported for the UK where a four
tier skills mix model was developed and work was carried out to improve the training
experience to reduce the high attrition rates for RTs. Similar work is required in Australia to
develop strategies for making RT careers more attractive, otherwise the high attrition rates
will continue and the benefits of investing in training additional RTs will be diminished.
Anecdotally, on a related matter, representatives of the relevant Universities advised that
student numbers in radiation therapy courses have decreased and dropout rates from the same
courses have increased because student RTs perceive that there is considerable difficulty in
finding employment and/or dissatisfaction with the opportunities afforded by career as an RT.
Again, this situation needs to be closely examined to ensure that there is an appropriate return
on the investment in training RTs. There would be value in surveying students who have
recently withdrawn from RT courses to determine their reasons and to formulate strategies for
limiting the attrition rates.
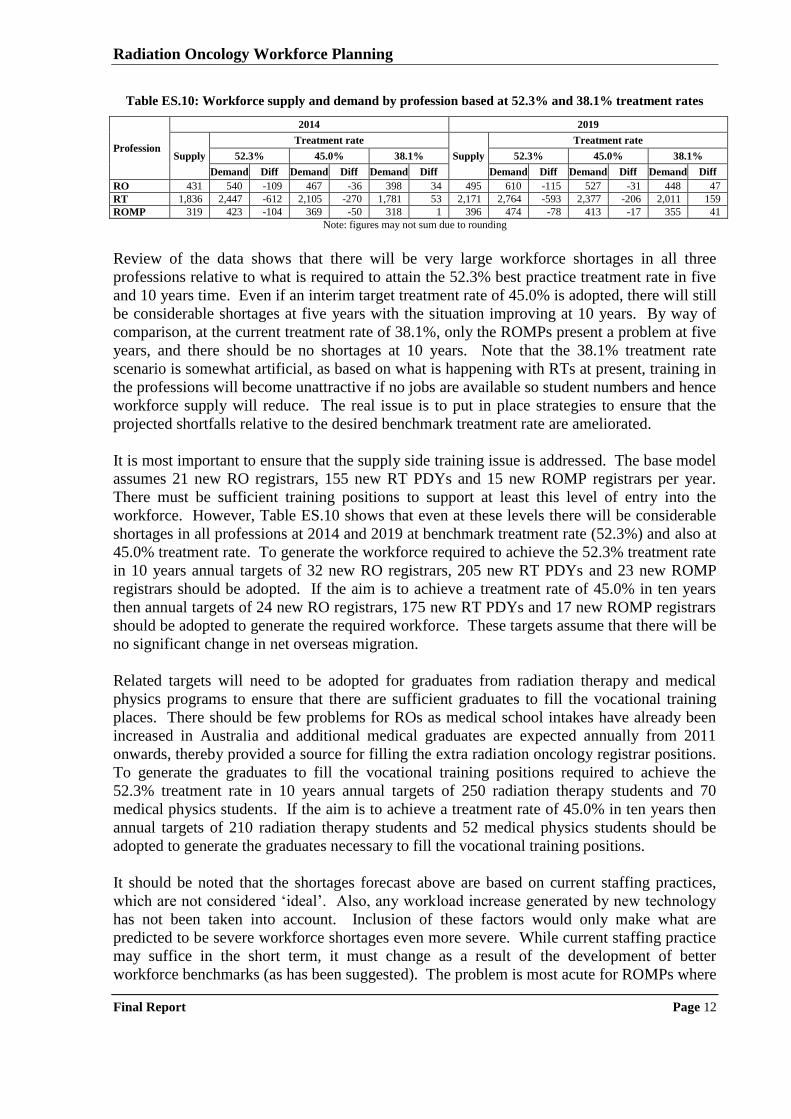
The supply of the workforce can be best put into context by comparing with demand. Table
ES.10 compares the workforce supply projections with demand projections for the best
practice treatment rate (52.3% as in the base model), a treatment rate of 45.0% (i.e. move
towards best practice) and the current treatment rate (38.1%). New facilities were not used as
a demand indicator in the workforce projections model because it is impossible to be
definitive about how many there will be in the 10 year projection period. Also, capacity can
be increased by adding facilities or by working the equipment in existing facilities harder (e.g.
by using shift work). For the purposes of workforce planning the difference in approach is
not important, all that needs to be forecast is how many staff are needed to deliver services to
the required number of patients.
Radiation Oncology Workforce Planning
Final Report Page 12
Table ES.10: Workforce supply and demand by profession based at 52.3% and 38.1% treatment rates
Profession
2014 2019
Supply
Treatment rate
Supply
Treatment rate
52.3% 45.0% 38.1% 52.3% 45.0% 38.1%
Demand Diff Demand Diff Demand Diff Demand Diff Demand Diff Demand Diff
RO 431 540 -109 467 -36 398 34 495 610 -115 527 -31 448 47
RT 1,836 2,447 -612 2,105 -270 1,781 53 2,171 2,764 -593 2,377 -206 2,011 159
ROMP 319 423 -104 369 -50 318 1 396 474 -78 413 -17 355 41
Note: figures may not sum due to rounding
Review of the data shows that there will be very large workforce shortages in all three
professions relative to what is required to attain the 52.3% best practice treatment rate in five
and 10 years time. Even if an interim target treatment rate of 45.0% is adopted, there will still
be considerable shortages at five years with the situation improving at 10 years. By way of
comparison, at the current treatment rate of 38.1%, only the ROMPs present a problem at five
years, and there should be no shortages at 10 years. Note that the 38.1% treatment rate
scenario is somewhat artificial, as based on what is happening with RTs at present, training in
the professions will become unattractive if no jobs are available so student numbers and hence
workforce supply will reduce. The real issue is to put in place strategies to ensure that the
projected shortfalls relative to the desired benchmark treatment rate are ameliorated.
It is most important to ensure that the supply side training issue is addressed. The base model
assumes 21 new RO registrars, 155 new RT PDYs and 15 new ROMP registrars per year.
There must be sufficient training positions to support at least this level of entry into the
workforce. However, Table ES.10 shows that even at these levels there will be considerable
shortages in all professions at 2014 and 2019 at benchmark treatment rate (52.3%) and also at
45.0% treatment rate. To generate the workforce required to achieve the 52.3% treatment rate
in 10 years annual targets of 32 new RO registrars, 205 new RT PDYs and 23 new ROMP
registrars should be adopted. If the aim is to achieve a treatment rate of 45.0% in ten years
then annual targets of 24 new RO registrars, 175 new RT PDYs and 17 new ROMP registrars
should be adopted to generate the required workforce. These targets assume that there will be
no significant change in net overseas migration.
Related targets will need to be adopted for graduates from radiation therapy and medical
physics programs to ensure that there are sufficient graduates to fill the vocational training
places. There should be few problems for ROs as medical school intakes have already been
increased in Australia and additional medical graduates are expected annually from 2011
onwards, thereby provided a source for filling the extra radiation oncology registrar positions.
To generate the graduates to fill the vocational training positions required to achieve the
52.3% treatment rate in 10 years annual targets of 250 radiation therapy students and 70
medical physics students. If the aim is to achieve a treatment rate of 45.0% in ten years then
annual targets of 210 radiation therapy students and 52 medical physics students should be
adopted to generate the graduates necessary to fill the vocational training positions.
It should be noted that the shortages forecast above are based on current staffing practices,
which are not considered „ideal‟. Also, any workload increase generated by new technology
has not been taken into account. Inclusion of these factors would only make what are
predicted to be severe workforce shortages even more severe. While current staffing practice
may suffice in the short term, it must change as a result of the development of better
workforce benchmarks (as has been suggested). The problem is most acute for ROMPs where
Radiation Oncology Workforce Planning
Final Report Page 13
current staffing practice appears to be inadequate to keep pace with the required work. The
gap will only widen as new and more complicated technologies are introduced into
radiotherapy service delivery. Thus, the suggested studies of technology impact on workload
would also provide an important input into the workforce planning process.
Workforce development initiatives
The workforce planning model demonstrates that there will be significant workforce shortages
of ROs, RTs and ROMPs if an increase in the radiotherapy treatment beyond the current level
of 38.1% is pursued. The position is best illustrated by the prediction that, if the current
workforce planning parameters are maintained, Australia will be 109 ROs, 612 RTs and 104
ROMPs short of achieving the 52.3% treatment rate in 2014, with no significant improvement
in the situation by 2019. Should the lower treatment rate of 45.0% be adopted as the target,
Australia will still be 36 ROs, 270 RTs and 50 ROMPs short in 2014 based on the current
workforce planning parameters. Immediate action on workforce development is required if
any increase in treatment rate is to be achieved within a reasonable time period.
The case study process and discussions with other stakeholders identified a range of existing
workforce development initiatives that have been successful in alleviating the shortages
identified by the Baume Inquiry in ROs and RTs and less successful in respect of ROMPs.
Many of these initiatives should be continued, however new initiatives are required to
generate the workforce necessary to increase the radiotherapy treatment rate. Table ES.11
summarises the issues, the strategies used to address them to date, and the opportunities to
take further action. To facilitate consideration of implementation actions, opportunities are
grouped into short-term and mid-term.
Of the initiatives identified in Table ES.11, it is most important to carry forward the
opportunities that sustain and expand the existing vocational training infrastructure, as
additional ROs, RTs and ROMPS will need to be trained every year to increase the
radiotherapy treatment rate. Currently, much of the funding for vocational training positions
for RT PDYs and ROMP registrars is short term (i.e. non-recurrent). Recurrent funding for
training positions would assist in ensuring that there will be an appropriate number of RTs
and ROMPs (much of the funding for medical registrar positions in the public sector is
already recurrent; funding of medical registrar positions in the private sector should be further
explored) to deliver radiotherapy services at the required rate in the future.
An important part of the vocational training infrastructure is support positions such as clinical
placement coordinators, tutors/educators, and preceptors. Funding for these positions has
been provided by the Commonwealth and state/territory health authorities. This funding
should continue. Similarly, DoHA has provided funding to support universities to attract
students to programs in radiation therapy. The results of the workforce projections model
demonstrate that it is important that these student numbers be maintained so this support
should also continue.
Notwithstanding the suggested investment in training positions and related infrastructure, the
workforce planning model shows that there will be a continuing requirement for recruitment
of ROMPs from overseas at the current level or greater for at least five years. Accordingly
the overseas recruitment process should be investigated and arrangements made to ensure that
ROMPs are allocated the highest priority for obtaining working visas so that any unnecessary
delays in overseas qualified ROMPs taking up positions in Australia are eliminated.
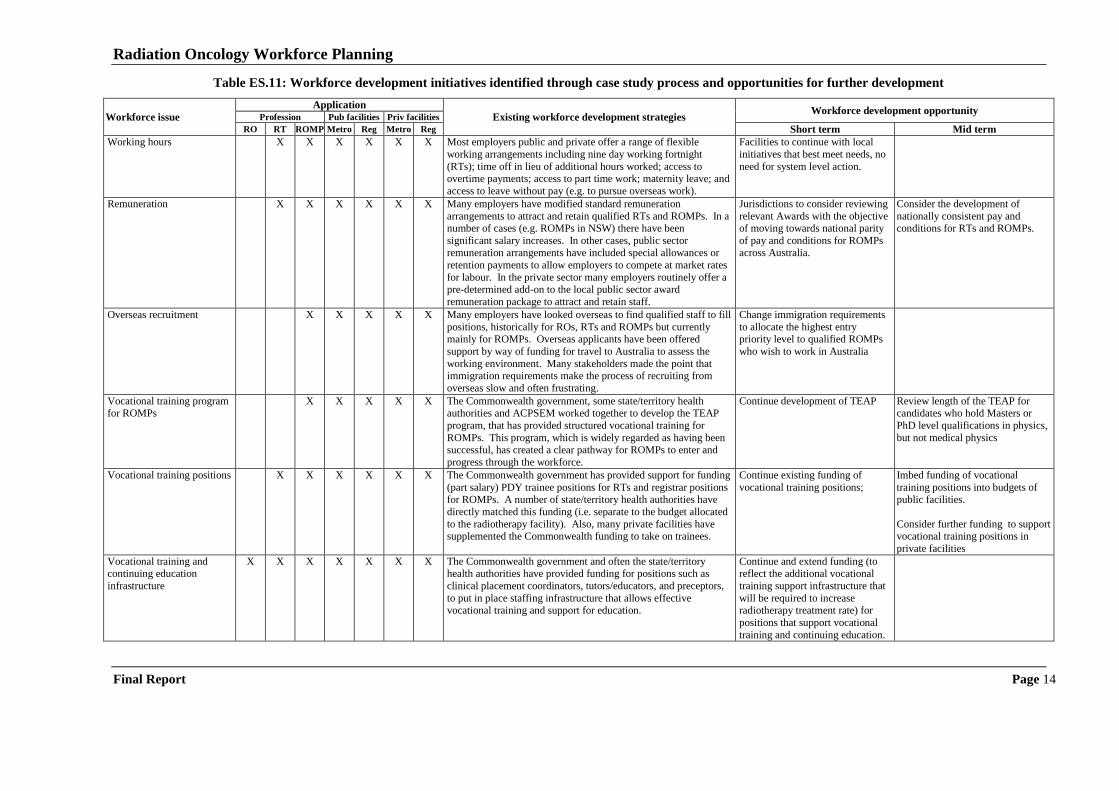
Radiation Oncology Workforce Planning
Final Report Page 14
Table ES.11: Workforce development initiatives identified through case study process and opportunities for further development
Workforce issue
Application
Existing workforce development strategies Workforce development opportunity
Profession Pub facilities Priv facilities
RO RT ROMP Metro Reg Metro Reg Short term Mid term
Working hours X X X X X X Most employers public and private offer a range of flexible
working arrangements including nine day working fortnight
(RTs); time off in lieu of additional hours worked; access to overtime payments; access to part time work; maternity leave; and
access to leave without pay (e.g. to pursue overseas work).
Facilities to continue with local
initiatives that best meet needs, no
need for system level action.
Remuneration X X X X X X Many employers have modified standard remuneration
arrangements to attract and retain qualified RTs and ROMPs. In a number of cases (e.g. ROMPs in NSW) there have been
significant salary increases. In other cases, public sector
remuneration arrangements have included special allowances or
retention payments to allow employers to compete at market rates
for labour. In the private sector many employers routinely offer a pre-determined add-on to the local public sector award
remuneration package to attract and retain staff.
Jurisdictions to consider reviewing
relevant Awards with the objective of moving towards national parity
of pay and conditions for ROMPs
across Australia.
Consider the development of
nationally consistent pay and conditions for RTs and ROMPs.
Overseas recruitment X X X X X Many employers have looked overseas to find qualified staff to fill
positions, historically for ROs, RTs and ROMPs but currently mainly for ROMPs. Overseas applicants have been offered
support by way of funding for travel to Australia to assess the
working environment. Many stakeholders made the point that immigration requirements make the process of recruiting from
overseas slow and often frustrating.
Change immigration requirements
to allocate the highest entry priority level to qualified ROMPs
who wish to work in Australia
Vocational training program for ROMPs
X X X X X The Commonwealth government, some state/territory health authorities and ACPSEM worked together to develop the TEAP
program, that has provided structured vocational training for
ROMPs. This program, which is widely regarded as having been successful, has created a clear pathway for ROMPs to enter and
progress through the workforce.
Continue development of TEAP
Review length of the TEAP for candidates who hold Masters or
PhD level qualifications in physics,
but not medical physics
Vocational training positions X X X X X X The Commonwealth government has provided support for funding
(part salary) PDY trainee positions for RTs and registrar positions for ROMPs. A number of state/territory health authorities have
directly matched this funding (i.e. separate to the budget allocated
to the radiotherapy facility). Also, many private facilities have supplemented the Commonwealth funding to take on trainees.
Continue existing funding of
vocational training positions;
Imbed funding of vocational
training positions into budgets of public facilities.
Consider further funding to support vocational training positions in
private facilities
Vocational training and continuing education
infrastructure
X X X X X X X The Commonwealth government and often the state/territory health authorities have provided funding for positions such as
clinical placement coordinators, tutors/educators, and preceptors,
to put in place staffing infrastructure that allows effective vocational training and support for education.
Continue and extend funding (to reflect the additional vocational
training support infrastructure that
will be required to increase radiotherapy treatment rate) for
positions that support vocational
training and continuing education.

Radiation Oncology Workforce Planning
Final Report Page 15
Workforce issue
Application
Existing workforce development strategies Workforce development opportunity
Profession Pub facilities Priv facilities
RO RT ROMP Metro Reg Metro Reg Short term Mid term
Role of private sector in vocational training
X X X X X Some private facilities have pursued opportunities to become more involved in training ROs, RTs and ROMPs, but there have
been barriers in terms of the requirements of existing training
programs and the need for financial support.
Review existing training programs to identify (and remove as
appropriate) any barriers to more
ROs, RTs and ROMPs being trained in the private sector
Review of the MB and assess the need to take into account CPD,
research and other costs to provide
and incentive for private facilities to offer these opportunities.
Access to professional
development opportunities
X X X X X X Many employers, public and private have provided staff with
access to professional development opportunities including attendance at national and international conferences. In the
Victorian public sector, a professional development allowance is
paid on top of salary, which can be accessed for any purpose. More commonly in the public and private sector a professional
development allowance is available to employees to attend an
overseas conference.
Facilities to continue with local
initiatives (consistent with jurisdictional requirements in the
public sector) that best meet needs,
no need for system level action.
Access to opportunities to
work conduct research and
development work
X X X X X X X Many employers (public and private) seek to provide staff with
opportunities undertake research and development work
opportunities, although in practical terms, research seems to take place more often in public sector facilities
Pursue suggested studies of the
impact of emerging technologies
on workload.
Access to opportunities to
develop and apply skills in
emerging technologies
X X X X X X X Many employers (public and private) aim to provide staff with
opportunities to train on and use the latest available radiotherapy
technologies as a method of attracting and retaining them. Nonetheless, professionals in all disciplines often expressed
concern about the pace of adoption of new radiotherapy
technologies relative to overseas countries.
Consider the barriers to the
adoption of new radiotherapy
technologies in Australian and, as may be appropriate, and develop
strategies for overcoming them.
Career progression
opportunities
X X X X X X The professional bodies, particularly for RTs and ROMPs, have
been examining role substitution and sub-specialisation
(practitioner roles) opportunities in order to make RT and ROMP careers more attractive and satisfying.
Undertake a review of the role of
the RT in Australia and consider
adopting the UK model to enhance job satisfaction of the Australian
workforce
Professional isolation in
regional facilities
X X X X X Some attempts at networking regional and metropolitan services
to provide collegial and backfill support were identified, but these were at an early stage of development.
Further develop cancer service
networks that include regional and metropolitan radiotherapy services.
Consider a program to that funds
short term rotation of regional radiotherapy service staff into
metropolitan centres
Support for undergraduate and postgraduate programs
X X The Commonwealth government and often the state/territory health authorities have provided funding to, and worked with, the
universities to support the provision of undergraduate and
postgraduate courses in radiation therapy. These initiatives have resulted in an increased flow of graduates in the discipline
Continue support to Universities, as significantly increased graduate
numbers will be required to
generate the workforce to increase the radiotherapy treatment rate.
Lack of awareness of
professions
X X X Some employers are taking initiatives to make school students
more aware of the career opportunities in radiation oncology. In Victoria, basic medical physics has been introduced into the year
11 curriculum as an elective with a view to generating interest in a
career in medical physics.
Consider national campaign to
raise the awareness of the three key professions involved in delivery of
radiation oncology services
Radiation Oncology Workforce Planning
Final Report Page 16
A range of other short-term (pursuit within six months) workforce development opportunities
are identified in Table ES.11. These opportunities include moving towards closer alignment
of pay and conditions for ROMPs across Australia, the continued development of the
ACPSEM TEAP, the further development of regional/metropolitan cancer services networks
to address the issue of professional isolation of practitioners in regional facilities, and the
conduct of a national campaign to promote the attractiveness of radiation oncologist, radiation
therapist and radiation oncology medical physicist careers.
Table ES.11 also identifies a range of workforce development opportunities that should be
pursued in the mid-term (between six months and two years). These opportunities include the
development of nationally consistent pay and conditions for RTs and ROMPs; a review of the
length of the ACPSEM TEAP for candidates who already hold Masters or PhD level
qualifications in physics but not medical physics; a review the radiation oncology items in the
MBS to assess the need to take into account CPD research and other costs to provide
incentives for private facilities to offer these opportunities, a consideration of the barriers to
the adoption of new radiotherapy technologies in Australia and, as may be appropriate,
development of strategies for overcoming them; and a consideration of a program that funds
short term rotation of regional radiotherapy staff into metropolitan centres.
Implementation actions
It is important to pursue all the opportunities identified in this project to prevent a recurrence
of the workforce shortages in ROs and RTs experienced earlier this decade and to address the
current shortage of medical physicists. There are significant risks if no action is taken. Not
only will Australia‟s radiotherapy treatment rate stagnate at round 38%, but careers in the
radiation oncology disciplines will become less attractive as the potential student perceive that
employment on graduation is difficult to obtain, thereby causing a return to workforce
shortages for RTs and ROMPs even at the 38% treatment rate. According to the information
gained from the case study process, a significant number of new facilities, and additional
linacs in existing facilities, are being planned so the current workforce planning parameters
must be changed to ensure there are qualified staff available to operate these new services.
Pursuit of an increase in the radiotherapy treatment rate to the 52.3% benchmark will require
very significant action. The workforce planning model predicts that an additional 11 ROs
(50% increase on current numbers), 205 RTs (33% increase on current number and 23
ROMPs (50% increase on current number) are needed each year for 10 years to produce
sufficient qualified staff to treat 52.3% of new cancer patients with radiotherapy in 2019. So
even with a very aggressive investment in training (i.e. training 50% more ROs and ROMPs
and 33% more RTs each year) it will take 10 years to attain the desired treatment rate.
Implementing the opportunities for workforce development identified in this project, which
have classified into priority groups in the List of Opportunities, is the key to moving forward.
Finally, as with any workforce planning study of this magnitude conducted at a point in time,
it is important to maintain the currency of the underlying information. Repetition of the
facilities‟ and professions‟ surveys at regular intervals has been proposed as an opportunity to
monitor changes in workforce characteristics. Repetition, in full, of this radiation oncology
workforce planning study in 2012 is also proposed as an opportunity to reset the planning
parameters having regard to the evolution of radiotherapy services and the associated
workforce in the intervening period.
Radiation Oncology Workforce Planning
Final Report Page 17
List of opportunities for workforce development
Priority Immediate – Action to commence within three months
O11: Closely monitor the pace of development and commissioning of new facilities over
the next three years to ensure that there are sufficient ROs, RTs and, in particular,
ROMPs to staff the new facilities.
O12: Undertake a study of the reasons for the high attrition rates from the RT
profession. The study should examine the career progression opportunities for
RTs and develop strategies for how they might be improved. The UK work on
developing the four tier skills mix model for RTs should be used as a reference.
O13: Undertake a study of RT students to determine the reasons for the high drop-out
rate from university training programs. The study should formulate strategies for
reducing the attrition rates.
O14: Adopt targets of 32 new RO registrars, 205 new RT PDYs and 23 new ROMP
registrars for each of the next ten years if the aim is to achieve a 52.3% treatment
rate in 2019 or targets of 24 new RO registrars, 175 new RT PDYs and 17 new
ROMP registrars for each of the next ten years if the aim is to achieve a 45.0%
treatment rate in 2019.
O15 Adopt targets of 250 new radiation therapy students and 70 new medical physics
students (masters level) for each of the next ten years, if the aim is achieve a 52.3%
treatment rate or 210 new radiation therapy students and 52 medical physics
students for each of the next ten years if the aim is to achieve a 45.0% treatment
rate, allowing for the fact that not all students will graduate and not all will pursue
careers in radiation oncology services in Australia.
O18: Continue to sustain the vocational training support infrastructure by DoHA and
state/territory health authorities funding positions such as clinical placement
coordinators, tutors/educators, and preceptors in radiation oncology facilities.
O19: Attract additional students to radiation therapy and medical physics programs by
DoHA continuing to provide funding support to Universities offering radiation
therapy and medical physicist undergraduate and postgraduate programs.
O20: Examine the overseas recruitment process for ROMPs and make arrangements to
ensure that ROMPs are allocated the highest priority for obtaining working visas
so that any unnecessary delays in overseas qualified ROMPs taking up positions in
Australia are eliminated.
Priority Short-term – Action to commence within six months
O3: Review, in the short term, the current threshold levels for the existing widely used
workforce benchmarks (new patients per RO, RTs per linac hour, and ROMPs per
linac) and reset them, as necessary, to make them relevant to current practice.
Radiation Oncology Workforce Planning
Final Report Page 18
O4: Develop, in the short term, separate public and private sector threshold levels for
the existing widely used workforce benchmarks (new patients per RO, RTs per
linac hour, and ROMPs per linac), pending the development of new benchmarks
that take account of the differences in service delivery (casemix), teaching, training
and research workloads in the two sectors.
O5: Review the role of the private sector in teaching, training and research activities
relating to radiation oncology services and assess the need for a specific source of
funds (in addition to current Commonwealth and state/territory government
initiatives to partly fund RT PDY and ROMP registrar positions) to support
further private sector participation in teaching training and research work.
O8: Establish studies to evaluate the impact of emerging imaging technologies on
workload, initially focusing on ‘IMRT’, ‘image fusion for treatment planning’,
‘treatment verification imaging’, and ‘adaptive planning and treatment’.
O9: Include a significant number of regional radiotherapy services in the ‘impact of
emerging technologies on workload studies’ to provide an additional opportunity
for staff of these services to be involved in research and development activities.
O16: Imbed the funding for vocational training positions for RT PDYs and ROMP
registrars into the staffing structures of public radiotherapy facilities. The current
situation where most funding for PDYs and ROMP registrars is provided on a
limited term basis creates uncertainty, and given that there will be a continuing
need to vocationally train RTs and ROMPs, recurrent funding would provide
facilities with a better opportunity to manage and plan their workforce.
O17: Determine, through a process of DoHA working with state/territory health
authorities, how best to support the private sector to participate in vocational
training for ROs, RTs and ROMPs having regard to the current, largely
Commonwealth government funded initiatives (see related opportunity 5).
O21: Pursue, in the short term (within six months), the further development of the
radiation oncology workforce by:
jurisdictions reviewing relevant Awards with the objective of moving towards
national parity of pay and conditions for ROMPs across Australia;
continuing the development of the ACPSEM TEAP;
further developing regional/metropolitan cancer services networks to address
the issue of professional isolation of practitioners in regional facilities; and
conducting a national campaign to promote careers as radiation oncologists,
radiation therapists and radiation oncology medical physicists.
Priority Mid-term – Action to commence within six months to two years
O1: Repeat the professions’ surveys at least every two years by working with the
relevant professional bodies.
O2: Repeat the facilities’ survey annually and consolidate the results as the basis of a
national radiotherapy services data collection.
Radiation Oncology Workforce Planning
Final Report Page 19
O6: Develop new workforce benchmarks ratios for ROs, RTs and ROMPs that
incorporate a casemix adjusted measure of workload in the denominator which
reflects both patient and treatment complexity.
O7: Undertake a full costing study of radiation oncology services to develop a better
basis for measuring radiation oncology services workload, which can be used to
design revised workforce benchmarks; and to develop a better understanding of
the need and basis for funding services.
O10: Monitor developments in radiotherapy service delivery models such as hypo-
fractionation and intra-operative radiotherapy to determine their impact on
workload and hence the required workforce.
O22: Pursue, in the mid-term (between six months and two years), the further
development of the radiation oncology workforce by:
developing nationally consistent pay and conditions for RTs and ROMPs;
reviewing the length of the ACPSEM TEAP program for candidates who hold
Masters or PhD level qualifications in physics but not medical physics;
reviewing the radiation oncology items in the MBS and assessing the need to
take into account CPD, research and other costs to provide incentives for
private facilities to offer these opportunities;
considering the barriers to the adoption of new radiotherapy technologies in
Australia and, as may be appropriate, strategies for overcoming them; and
considering a program that funds short term rotation of regional radiotherapy
staff into metropolitan centres.
O23: Repeat, in full, the radiation oncology workforce planning study in 2012 so that the
planning parameters can be reset having regard to the evolution of radiotherapy
services and the associated workforce in the intervening period.
Radiation Oncology Workforce Planning
Final Report Page 20
1 Introduction
On 28th
January 2009, the Commonwealth Department of Health and Ageing (DoHA),
commissioned a project to:
„undertake a review of the current status and capacity of the three main professions
that make up the radiation oncology workforce (radiation oncologists (ROs),
radiation therapists (RTs) and radiation oncology medical physicists (ROMPs)) and
to identify opportunities for ensuring an adequate supply of a well trained radiation
oncology workforce‟
This chapter presents the project background, objectives and scope; and the methodology used
by the project team to conduct the assignment.
1.1 BACKGROUND
Radiation treatment is an important component of cancer therapy; it increases cure rates, and
lessens the suffering of patients and their families. Research has shown that over 52% of
cancer patients stand to benefit from the use of radiotherapy at some time during their disease
trajectory7, either for cure or for palliation of advanced disease. In May 2008, the Royal
Australian and New Zealand College of Radiologists (RANZCR) stated that the national
uptake rates for radiotherapy remain on average about 35%, indicating that a third of cancer
patients who could benefit from radiotherapy are not receiving optimal care8.
A key part of further increasing the capacity to provide radiotherapy services is to ensure that
there is an adequate balance between the supply of, and demand for, trained professionals in
the key radiotherapy disciplines being ROs, RTs and ROMPs. DoHA, working with the
Radiation Oncology Reform Implementation Committee (RORIC), has recognised that
workforce planning is a key tool for addressing the supply demand balance and commissioned
this study, the objectives of which are to:
prepare information on the current radiation oncology workforce profession numbers and
issues affecting radiation oncology service provision in Australia;
formulate a methodology which will ensure reliable workforce planning can be conducted
in the future; and
identify opportunities to address workforce and skills shortages.
DoHA intends to use the information generated by the project to provide recommendations to
the Commonwealth Government on strategic workforce initiatives. State/Territory Health
Authorities intend to use the data on public sector facilities within their jurisdiction to develop
7 Delaney G, Jacob S, Featherstone C and Barton M (2005). The role of radiotherapy in cancer treatment: Estimating optimal utilization
from a review of evidence-based clinical guidelines. Cancer, Volume 104, Issue 6 8 RANZCR Faculty of Radiation Oncology Submission to The National Health and Hospitals Reform Commission (NHHRC) on its Terms of Reference and Draft Principles for Australia‟s Health System (May 2008)
http://www.nhhrc.org.au/internet/nhhrc/publishing.nsf/Content/159/$FILE/159%20RANZCR%20Faculty%20of%20Radiation%20Oncology
%20Submission.pdf
Radiation Oncology Workforce Planning
Final Report Page 21
further their radiation oncology workforce initiatives. The objective at both Government
levels is to ensure the delivery of timely, accessible and quality radiation oncology services.
1.2 PROJECT SCOPE
The scope of the study, as set out in the project contract, divides the work into two phases:
Phase 1: Conduct a census of the current radiation oncology workforce
Develop further the draft Project Work Plan provided with the RFQ response and deliver a
final Project Work Plan;
Design a staff survey in consultation with the professional bodies involved in the delivery
of radiation oncology and administer it through the professional bodies that takes into
account the following variables:
age profile of the workforce;
overseas recruitment; and
programs to recruit to regional and rural areas.
Conduct a census of the three main oncology workforce professions sorted by facility
including:
the current ratio of each profession per linear accelerator;
the current methodology used to project workforce supply requirements; and
the „ideal‟ supply of each profession to operate existing linear accelerators, including
the basis for determination and an assessment of its „affordability‟.
Provide an analysis of the current profile of the radiation oncology workforce noting
variances across public and private facilities. The analysis should also include current
numbers and shortfalls (vacant Full Time Equivalent (FTE) positions).
Provide analysis of the various methodologies currently used by state and territory health
departments, private providers and professional organisations to address current shortfalls
in workforce numbers and what will be required to meet the „ideal‟ supply (including an
assessment of the future position if the extant planning system is retained).
Phase 2: Undertake workforce projections for the radiation oncology workforce
Develop a workforce planning methodology that is able to accommodate different staffing
models to project workforce supply requirements;
Using the methodology, undertake a workforce projections exercise to project current
supply requirements with predictions for the next five to ten years; and
Using the information gathered, conduct a detailed analysis of the factors that might
influence the profile of the radiation oncology workforce into the next five to ten years to
identify possible opportunities to address current workforce shortages, meet future supply
requirements (five to ten years) and to maintain ideal numbers.
1.3 PROJECT METHODOLOGY
The methodology used by the project team to undertake the radiation oncology workforce
planning study involved eight stages as set out below:
Radiation Oncology Workforce Planning
Final Report Page 22
(1) Detailed project planning: the project team met with DoHA Project Officers, received
a briefing, and finalised the study parameters including communication process,
stakeholders to be consulted, consultative process to be used, and identification of
information sources. A detailed project plan was prepared and submitted to the DoHA
Project Officer for review and comment on 6th
February 2009. Amendments were
made, as required, and the final project plan was submitted on the 27th
February 2009.
(2) Situation analysis: the project team met with relevant DoHA staff (as part of the
project planning meeting) to develop our understanding of the project context. We
reviewed the documentation provided and searched the literature on best practice in
service development and workforce planning and projections relating to radiation
oncology services. The project team visited the RANZCR, AIR, and ACPSEM and had
discussions with key staff with the objective of introducing the study and obtaining
support for the survey and information gathering processes. All of the material obtained
was synthesised and used as the basis of the survey development process.
(3) Survey of radiation oncology professions: the project team worked with the
RANZCR, AIR and ACPSEM to develop a draft questionnaire and three key supporting
tools including guidelines, a web-based application and a database. The draft
questionnaire and other survey infrastructure were submitted to the Project Officer for
approval prior to being used. The professional bodies were asked to use their mailing
lists to distribute the questionnaire and guidelines to members working in radiation
oncology services. The survey period was three weeks with up to four rounds of
follow-up. The professions‟ survey data collection was completed by 30th
June 2009.
(4) Survey of radiation oncology facilities: the project team worked with representatives
of the State/Territory Health Authorities and private radiotherapy facilities to develop a
draft questionnaire and supporting tools including guidelines and a database. The draft
questionnaire and other survey infrastructure were submitted to the Project Officer for
approval prior to being used. The project team worked with the State/Territory Health
Authorities to distribute the public facilities questionnaire and directly emailed the
survey to private facilities. The survey period was eight weeks with six rounds of
follow-up. The facilities‟ survey data collection was completed by 30th
June 2009.
(5) Qualitative data collection: the project team visited 20 radiation oncology facilities
covering all private sector ownership groups and a sample of public services to discuss
the issues associated with the supply of, and demand for, ROs, RTs and ROMPs. A
case study framework was prepared and sent to the sites to guide the discussions. Two
members of the project team visited each site and conduct a series of meetings and, as
appropriate, a focus group with ROs, RTs and ROMPs. The remaining stakeholders on
the agreed list were contacted, and a meeting (face-to-face or teleconference) with the
project team was organised and held to discuss the workforce issues. The qualitative
data collection was completed on 13th
August, 2009.
(6) First Report: the project team analysed the professions‟ and facilities‟ survey data; and
the data from the consultation process. We consolidated the situation analysis paper;
and the analyses of the survey and consultation data to produce a preliminary draft First
Report which was provided to the Project Officer for review and comment by 17th
July.
We then meet with RORIC‟s Workforce Working Group on 22nd
July to present the
Radiation Oncology Workforce Planning
Final Report Page 23
preliminary draft First Report. Taking account of the comments received we conducted
further analysis to prepare the second draft First Report, which was discussed, by
teleconference, with the Workforce Working Group (WWG) on 10th
August. The
resulting comments were addressed and the final draft First Report was submitted to the
Project Officer for review and comment on 17th
August, 2009.
(7) Workforce planning and projections: the project team liaised with the identified data
custodians and obtained the data that were available to assist us to formulate workforce
projections (university graduates in relevant courses, cancer incidence, retirement rates
from the Australian Bureau of Statistics (ABS) and the Australian Institute of Health
and Welfare (AIHW) for relevant professional groups). Using the quantitative and
qualitative data a five and ten year workforce projections model was developed in
Microsoft Excel. Using the model, the impact of various changes in demand for, and
supply of, the radiation oncology workforce, for each of the three disciplines was
analysed. The workforce projections model was completed on 31st August, 2009.
(8) Final Report: using the outcomes of the workforce projections modelling and
associated workforce planning; and First Report, the project team prepared the draft
Final Report which was provided to the Project Officer for review and comment on 1st
September, 2009. The project team met with a subgroup of the WWG on 1st October to
discuss written comments provided by WWG members and the DoHA project officer.
The draft Final Report was then amended to take account of the comments received.
The Final Report, the professions‟ and facilities‟ survey databases, and the workforce
projections model were provided to the DoHA Project Officer on 26th
October 2009.
1.4 STRUCTURE OF THIS DOCUMENT
This document represents the Final Report of the project. The structure of the report is:
Chapter 2 provides details of the radiation oncology workforce including national and
international approaches to workforce planning.
Chapter 3 describes the data collection methodology.
Chapter 4 describes radiation oncology workforce planning activities in Australia.
Chapter 5 analyses the data collected from the facilities‟ survey.
Chapter 6 analyses the data collected from the ROs professions‟ survey.
Chapter 7 analyses the data collected from the RTs professions‟ survey.
Chapter 8 analyses the data collected from the ROMPs professions‟ survey.
Chapter 9 presents a thematic analysis of the information collected from the visits to 20
radiation oncology services around Australia.
Chapter 10 presents the workforce planning model and projections for 2014 and 2019.
Chapter 11 presents the conclusions and opportunities for workforce development.
Radiation Oncology Workforce Planning
Final Report Page 24
2 Radiation oncology workforce
This chapter provides background information to the radiation oncology workforce focussing
on the key disciplines that are the subject of this workforce planning study: ROs, RTs and
ROMPs. Details of both national and international workforce benchmarking and guidelines
are described along with a description of international approaches to workforce planning. The
chapter concludes with a short review of recruitment and retention strategies and issues.
More detailed background information on cancer incidence and mortality in Australia;
radiation oncology facilities and treatment modalities; available cancer services including
radiotherapy; and treatment activity is provided in Appendix A.
2.1 RADIATION ONCOLOGY WORKFORCE
The radiation oncology team is comprised of not only ROs, RTs and ROMPs but also
includes oncology nurses, social workers and other health professionals, counsellors,
engineers and technical personnel and administrative support. Consistent with the project
objectives, this study focused only workforce issues for ROs, RTs and ROMPs. The roles of
these professionals working in the multi-disciplinary team can be broadly described as:
ROs: the medical specialists responsible for the patient‟s cancer management and
radiotherapy treatment. The RO makes the decision to proceed with a course of
radiotherapy and, under existing arrangements, is responsible for the management of the
whole treatment process.
RTs: radiation treatment specialists who undertake treatment, simulation and planning,
deliver radiotherapy to patients according to a prescription and have an ongoing
relationship with patients throughout their course of treatment.
ROMPs: scientific specialists who establish, implement and monitor processes which
allow optimal treatment using radiation, taking account of the radiation protection of
patients and others.
The key professional bodies that represent these groups are:
Royal Australian and New Zealand College of Radiologists (RANZCR);
Australian Institute of Radiography (AIR); and
Australasian College of Physical Scientists and Engineers in Medicine (ACPSEM).
In 2002, the Baume Inquiry9 highlighted that the low rate of use of radiotherapy is linked to
shortages in the key professions, namely ROs, RTs and ROMPs, and recommendations to
overcome shortages were proposed. There have been a number of radiation oncology
workforce development strategies implemented since 2002 by the Commonwealth
government, state/territory governments and the professional bodies working together. This
study provided an important opportunity to assess the impact of the resultant initiatives to
assess the extent to which workforce shortages remain.
9 Baume P. Radiation Oncology Inquiry. A vision for radiotherapy. Canberra, ACT: Commonwealth of Australia, 2002
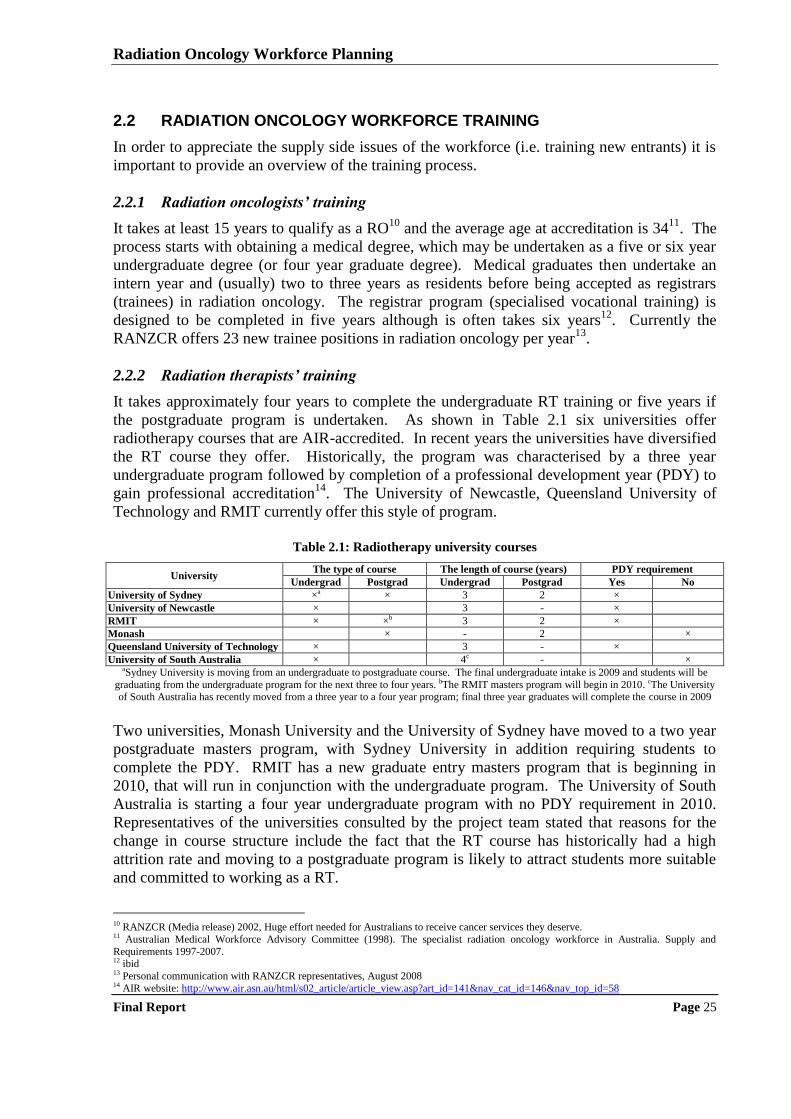
Radiation Oncology Workforce Planning
Final Report Page 25
2.2 RADIATION ONCOLOGY WORKFORCE TRAINING
In order to appreciate the supply side issues of the workforce (i.e. training new entrants) it is
important to provide an overview of the training process.
2.2.1 Radiation oncologists‟ training
It takes at least 15 years to qualify as a RO10
and the average age at accreditation is 3411
. The
process starts with obtaining a medical degree, which may be undertaken as a five or six year
undergraduate degree (or four year graduate degree). Medical graduates then undertake an
intern year and (usually) two to three years as residents before being accepted as registrars
(trainees) in radiation oncology. The registrar program (specialised vocational training) is
designed to be completed in five years although is often takes six years12
. Currently the
RANZCR offers 23 new trainee positions in radiation oncology per year13
.
2.2.2 Radiation therapists‟ training
It takes approximately four years to complete the undergraduate RT training or five years if
the postgraduate program is undertaken. As shown in Table 2.1 six universities offer
radiotherapy courses that are AIR-accredited. In recent years the universities have diversified
the RT course they offer. Historically, the program was characterised by a three year
undergraduate program followed by completion of a professional development year (PDY) to
gain professional accreditation14
. The University of Newcastle, Queensland University of
Technology and RMIT currently offer this style of program.
Table 2.1: Radiotherapy university courses
University The type of course The length of course (years) PDY requirement
Undergrad Postgrad Undergrad Postgrad Yes No
University of Sydney ×a × 3 2 ×
University of Newcastle × 3 - ×
RMIT × ×b 3 2 ×
Monash × - 2 ×
Queensland University of Technology × 3 - ×
University of South Australia × 4c - × aSydney University is moving from an undergraduate to postgraduate course. The final undergraduate intake is 2009 and students will be
graduating from the undergraduate program for the next three to four years. bThe RMIT masters program will begin in 2010. cThe University of South Australia has recently moved from a three year to a four year program; final three year graduates will complete the course in 2009
Two universities, Monash University and the University of Sydney have moved to a two year
postgraduate masters program, with Sydney University in addition requiring students to
complete the PDY. RMIT has a new graduate entry masters program that is beginning in
2010, that will run in conjunction with the undergraduate program. The University of South
Australia is starting a four year undergraduate program with no PDY requirement in 2010.
Representatives of the universities consulted by the project team stated that reasons for the
change in course structure include the fact that the RT course has historically had a high
attrition rate and moving to a postgraduate program is likely to attract students more suitable
and committed to working as a RT.
10 RANZCR (Media release) 2002, Huge effort needed for Australians to receive cancer services they deserve. 11 Australian Medical Workforce Advisory Committee (1998). The specialist radiation oncology workforce in Australia. Supply and
Requirements 1997-2007. 12 ibid 13 Personal communication with RANZCR representatives, August 2008 14 AIR website: http://www.air.asn.au/html/s02_article/article_view.asp?art_id=141&nav_cat_id=146&nav_top_id=58
Radiation Oncology Workforce Planning
Final Report Page 26
2.2.3 Radiation oncology medical physicists‟ training
It takes about nine years to become a qualified ROMP15
. There are about 160 student
enrolments in fourth-year physics each year, but few enter medical physics16
. Currently five
universities offer an ACPSEM accredited postgraduate masters program in medical physics:
The University of Sydney; RMIT; The University of Wollongong; Queensland University of
Technology; and the University of Adelaide. The programs range from 1.5 to two years full-
time (or part-time equivalent) with a blend of coursework and research programs offered.
Historically, the pathways to becoming a qualified ROMP varied across Australia; in some
states ACPSEM accreditation was required to work unsupervised, whereas in other states it
was not necessary. These national variations led to unstructured training pathways. The
Baume Inquiry recognised this problem and recommended that ACPSEM develop a national
five year training program to be implemented in 200517
. As a result, the Training, Education
and Accreditation Program (TEAP) was developed and is now well established.
TEAP now spans five years of vocational training including the completion of an ACPSEM
accredited Masters in Medical Physics course. Medical physicists who have already
completed an accredited masters program can complete the vocational training in two to three
years to gain accreditation. The development of the TEAP program has assisted in
streamlining the career pathway to becoming a ROMP as well as developing a nationally
consistent and recognised training program.
2.3 RADIATION ONCOLOGY WORKFORCE BENCHMARKS
This section examines current documentation about radiation oncology workforce planning,
benchmarks, starting with an overview of the workforce planning context. The different
standards and benchmarks that exist for the radiation oncology workforce (ROs, RTs and
ROMPs) in Australia and overseas are then discussed.
2.3.1 The radiation oncology workforce planning context
Radiotherapy is distinguished by a number of features18
, including:
the need for a large team of professionals, including ROs, RTs, ROMPs and engineers –
other professions such as oncology nurses may also be involved;
the length of a course of treatment, usually requiring repeated daily doses (or "fractions")
delivered over a number of weeks at a purpose-built facility;
a reliance on expensive equipment – establishing a basic radiation oncology facility with
two linacs can cost $8 million to $12 million for equipment alone, though capital costs are
not the majority of the costs per service, because of the lifespan of the equipment; and
the rapid changes in technology that impact on the service delivery model and therefore
the required workforce.
The RANZCR Faculty of Radiation Oncology established that a planning model for radiation
oncology services must be based on the number of people with cancer who need treatment19
.
15 RANZCR (Media release) 2002, Huge effort needed for Australians to receive cancer services they deserve. 16 The Australian Institute of Physics, The Physicist, 37(1), 2000 17 Baume P. Radiation Oncology Inquiry. A vision for radiotherapy. Canberra, ACT: Commonwealth of Australia, 2002. 18 DOHA, available at: http://www.health.gov.au
Radiation Oncology Workforce Planning
Final Report Page 27
The proportion of people with cancer who need radiotherapy is the determining factor, not the
capacity of the current infrastructure to provide services. According to the National Strategic
Plan for Radiation Oncology 200120
, any planning model must be able to determine:
the number of new cancers requiring radiotherapy;
the number of linear accelerators required; and
the number of specialist staff required to provide a safe, quality service.
Localisation, planning systems and quality assurance are also vital to modern radiation
oncology facilities and a methodology for determining the level of provision of these
resources needs to be developed21
. Trainee intake is also an important consideration in any
workforce projections. The number of trainees accepted into training programs should be
targeted to cover but not exceed the needs for future optimal staffing of departments22
. The
calculations should consider rates of retention of trainees. In addition, provision for teaching
the trainees needs to be factored into workload considerations23
.
2.3.2 Workforce benchmarks for radiation oncologists
There are two measures used in benchmarking the number of ROs required:
the number of new cases of cancer per year per RO; and
the number of ROs per million population.
In 1985 the WHO accepted the equivalent of 250 new courses of treatment per ROs per year
as a suitable guideline. The RANZCR endorsed these guidelines and further outlined that
there, „must be a minimum of three FTE consultant ROs employed in each department, each
of whom has RANZCR continuing medical education (CME) currency and who ideally sees
approximately 250 (range 150 - 350) new patients per annum24
. The Baume Inquiry advised
some caution when using this benchmark as, in practice, the number of new patients per RO
can vary from 150 to more than 400 new cases per year25
.
The Canadian Association of ROs report26
published in 1999 proposed a methodology to
project staffing benchmarks based on tumour site-specific patient care needs. They
recommended that, based on a 65% allocation of radiation oncology manpower to direct
patient care, a RO annual caseload should not exceed 185 new patients per year. Their
calculation was based on regional treatment protocols and referral patterns in Canada,
therefore it should not be automatically assumed that this is the correct result for Australian
centres, but provides some guide27
.
In the UK the Royal College of Radiologists recommended in 1998 that a consultant in
clinical oncology should have a workload that does not exceed 315 new patients per annum28
.
19 National Strategic Plan For Radiation Oncology (Australia) (2001) 20 ibid 21 Baume P, chairperson. Radiation Oncology Inquiry. A vision for radiotherapy. Canberra, Commonwealth of Australia, 2002. Available
at: www.health.gov.au/roi/inquiry/report.htm. 22 Tripartite Committee, 2005. Developing standards for radiation treatment services in Australia: Discussion Paper. 23 ibid, p. 23 24 RANZCR communication, Discussion paper (unpublished) „Recommendation on the number of new patients per RO per year.‟ Last
updated July 2008 25 Baume P. Radiation Oncology Inquiry. A vision for radiotherapy. Canberra, ACT: Commonwealth of Australia, 2002. p: 54 26 Canadian Association of ROs (CARO) 1999, Manpower study report. Agnew Peckman and Associates,
<online>availablefrom:http://www.caro-acro.ca/About_Us/Publications/CARO_Manpower_Report_1999.htm 27 Triparite Committee, 2005. Developing standards for radiation treatment services in Australia: Discussion Paper. p.23 28 The Royal College of Radiologists (2003). Good practice guide for clinical oncologists, 2nd edition, London. Available from:
http://www.rcr.ac.uk/docs/oncology/other/Good%20Practice%20Guide%20for%20Clinical%20Oncologists.htm
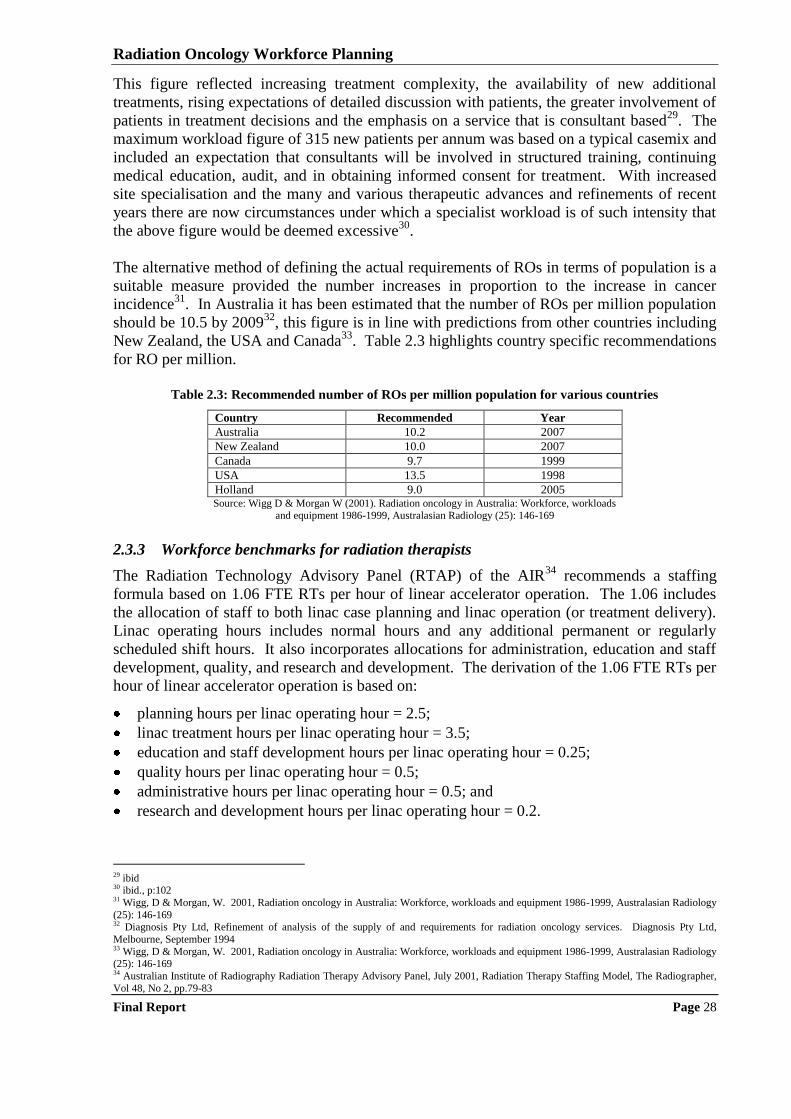
Radiation Oncology Workforce Planning
Final Report Page 28
This figure reflected increasing treatment complexity, the availability of new additional
treatments, rising expectations of detailed discussion with patients, the greater involvement of
patients in treatment decisions and the emphasis on a service that is consultant based29
. The
maximum workload figure of 315 new patients per annum was based on a typical casemix and
included an expectation that consultants will be involved in structured training, continuing
medical education, audit, and in obtaining informed consent for treatment. With increased
site specialisation and the many and various therapeutic advances and refinements of recent
years there are now circumstances under which a specialist workload is of such intensity that
the above figure would be deemed excessive30
.
The alternative method of defining the actual requirements of ROs in terms of population is a
suitable measure provided the number increases in proportion to the increase in cancer
incidence31
. In Australia it has been estimated that the number of ROs per million population
should be 10.5 by 200932
, this figure is in line with predictions from other countries including
New Zealand, the USA and Canada33
. Table 2.3 highlights country specific recommendations
for RO per million.
Table 2.3: Recommended number of ROs per million population for various countries
Country Recommended Year
Australia 10.2 2007
New Zealand 10.0 2007
Canada 9.7 1999
USA 13.5 1998
Holland 9.0 2005 Source: Wigg D & Morgan W (2001). Radiation oncology in Australia: Workforce, workloads
and equipment 1986-1999, Australasian Radiology (25): 146-169
2.3.3 Workforce benchmarks for radiation therapists
The Radiation Technology Advisory Panel (RTAP) of the AIR34
recommends a staffing
formula based on 1.06 FTE RTs per hour of linear accelerator operation. The 1.06 includes
the allocation of staff to both linac case planning and linac operation (or treatment delivery).
Linac operating hours includes normal hours and any additional permanent or regularly
scheduled shift hours. It also incorporates allocations for administration, education and staff
development, quality, and research and development. The derivation of the 1.06 FTE RTs per
hour of linear accelerator operation is based on:
planning hours per linac operating hour = 2.5;
linac treatment hours per linac operating hour = 3.5;
education and staff development hours per linac operating hour = 0.25;
quality hours per linac operating hour = 0.5;
administrative hours per linac operating hour = 0.5; and
research and development hours per linac operating hour = 0.2.
29 ibid 30 ibid., p:102 31 Wigg, D & Morgan, W. 2001, Radiation oncology in Australia: Workforce, workloads and equipment 1986-1999, Australasian Radiology
(25): 146-169 32 Diagnosis Pty Ltd, Refinement of analysis of the supply of and requirements for radiation oncology services. Diagnosis Pty Ltd,
Melbourne, September 1994 33 Wigg, D & Morgan, W. 2001, Radiation oncology in Australia: Workforce, workloads and equipment 1986-1999, Australasian Radiology (25): 146-169 34 Australian Institute of Radiography Radiation Therapy Advisory Panel, July 2001, Radiation Therapy Staffing Model, The Radiographer,
Vol 48, No 2, pp.79-83
Radiation Oncology Workforce Planning
Final Report Page 29
The calculation also builds in a relief factor of 1.04 hours per linac operating hour. All factors
total to 8.49 hours per eight hour shift and based on eight linac hours per shift equates to 1.06
FTE per hour of linac operation. It should be noted that the formula excludes the hours
required for kilovoltage and brachytherapy services (planning and treatment); stereotactic
radiosurgery/radiotherapy, total body irradiation, paediatrics, and intensity modulated
radiotherapy (planning only); and external commitments (e.g. giving lectures). RTAP
recommends that these activities be direct timed in each facility and added to the result of
applying the formula to give the total required staffing level.
A study conducted in Scotland assumes that each machine (linac, orthovoltage, or simulator)
requires four RTs per 9am-5pm working day (two per hour)35
. The College of Radiographers
in the UK has developed short term benchmarks for standard core functions within
radiotherapy36
. They propose that the staffing required per linac hour is 1.33 for a certain list
of core activities. Some activities were excluded from the benchmark including:
brachytherapy, research, mould room, volume delineation, physics, planning, dosimetry and
quality management.
2.3.4 Workforce benchmarks for radiation oncology medical physicists
Australasian and other international guidelines have recommended 2.2 ROMPs per linac37
.
The widely accepted guideline in Australia is 1.7 qualified (plus 0.5 trainee) ROMPs per
linac38
. This is a simplification of the more complicated ACPSEM formula 2000 that is used
when assessing the ROMP needs of an individual department. The formula calculates the
requirements for all physics staff, including physics technicians and caters for the most recent
radiation oncology advances in technology39,40
. The simpler formula (yielding the 1.7) can
only be used when averaging over a large number of departments and cannot be applied to
individual hospitals where the need may be higher41
.
For example, the simpler formula will grossly underestimate staffing requirements in
departments that use specialised techniques including brachytherapy and/or stereotactic
radiosurgery. The ACPSEM formula 2000 yields similar numbers to international
professional body recommendations42
. According to the Baume Inquiry no state in Australia
had the recommended level of ROMPs43
. An alternative workforce standard proposed for
European centres based on high GDP countries was for one ROMP per 400-450 patients44
.
2.4 RADIATION ONCOLOGY WORKLOAD MEASURES
This section examines current documentation about radiation oncology workload measures.
In assessing workforce requirements, it is necessary to have standards for the expected
workload of a radiation oncology facility.
35 The Royal College of Radiologists (2005) Equipment, workload and staffing for radiotherapy in Scotland 1997-2003. 36 The College of Radiographers 2005, Radiographic staffing: Short term guidance 2005 Benchmark for standard core functions within
radiotherapy, London 37 Ministry of Health, 2001. Improving non-surgical cancer treatment services in New Zealand 38 Baume P. Radiation Oncology Inquiry. A vision for radiotherapy. Canberra, ACT: Commonwealth of Australia, 2002. p: 54 39 Oliver, L., Fitchew, R & Drew, J 2001, Requirements for radiation oncology physics in Australia and New Zealand, Australasian Physical
and Engineering Sciences in Medicine, 24(1): pp. 1-18 40 Round, W.H. 2007, A survey of the Australasian clinical medical physics and biomedical engineering workforce, Australasian Physical &
Engineering Sciences in Medicine; 30(1): 13-24 41 ibid p 13-24 42 ibid p 13-24 43 ibid 44 Triparite Committee, 2005. Developing standards for radiation treatment services in Australia: Discussion Paper. p.23
Radiation Oncology Workforce Planning
Final Report Page 30
2.4.1 Linear accelerator throughput
A benchmark value of 450 treatment courses per linac per year was proposed by the
Australian Health Technology Advisory Committee (AHTAC) in 1996. More recently,
Barton et al examined cancer services in WA and determined that, based on 19 attendances
per course; 4.1 attendances per hour; eight operating hours per day; and 240 working days per
annum, linacs have a capacity to deliver 432 courses per year45
. This figure aligns with those
used in European countries where benchmarks range from 400 to 600 courses per year46
. A
European study that looked at developing evidence-based guidelines for radiotherapy
infrastructure and staffing needs in Europe used the 450 treatment courses per linac per year
as their benchmark47
.
2.4.2 Radiotherapy utilisation rate
In an often quoted study, Delaney et al 200548
estimated the optimal utilisation rate for
radiotherapy by reviewing evidence based clinical guidelines. The study concluded that the
proportion of patients with cancer that should receive external beam radiotherapy according to
the best available evidence is 52.3%, with a 25% re-treatment rate. A comparison with actual
radiotherapy utilisation data suggests a shortfall in actual radiotherapy delivery nationally,
with actual treatment in most states falling around 35%49,50
.
Other countries including the UK indicate an optimal utilisation rate of about 50%, but as is
the case in Australia actual utilisation falls below this benchmark. A European study looked
at developing evidence based guidelines for radiotherapy infrastructure and staffing needs51
.
The study used data from 25 European countries to estimate the average number of linacs
required per million population based on appropriate rates of radiotherapy utilisation for
different cancer types (using the Delaney et al52
paper as the main source of evidence based
radiotherapy utilisation). The average for the 25 countries was 5.9 linacs per million people.
2.4.3 Linking to workforce benchmarking
It is clear that four basic estimates are required to estimate the required number of linacs in a
country: the proportion of patients with a given type of cancer who present or develop an
indication for radiotherapy, the incidence of these cancer types in the country, the
radiotherapy re-treatment rate and the machine throughput in terms of number of treatment
courses per year for a linear accelerator. This process is interrelated with workforce planning,
as a given staffing level will be required to achieve the benchmark throughput for a linear
accelerator. The benchmark radiotherapy treatment rate of 52.3% has been used throughout
this study as input to the workforce planning process, reflecting the fact that it has been
adopted as a goal by the Commonwealth and State/Territory Governments.
45 Barton, M., Gabriel, S and Shafiq, J (2008). Overview of cancer treatment services in Western Australia. 46 Bentzen, S., Heeren, G., Cottier, B., Slotmsn, B., Glimelius, B., Lievens, Y & Bogaert, W (2005). Towards evidence-based guidelines for
radiotherapy infrastructure and staffing needs in Europe: the ESTRO QUARTS project. Radiotherapy and Oncology, 75: 355-365 47 ibid p355-365 48 Delaney, G., Jacob, S., Featherstone, C & Braton, M, 2005. The role of radiotherapy in cancer treatment: Estimating the optimal
utilization from a review of evidence-based clinical guidelines, Cancer, 104 (6): pp.1129-1137 49 ibid 50 Auditor-General‟s report, performance audit June 2009, Tackling cancer with radiotherapy: NSW Department of Health 51 Bentzen, S., Heeren, G., Cottier, B., Slotmsn, B., Glimelius, B., Lievens, Y & Bogaert, W (2005). Towards evidence-based guidelines for radiotherapy infrastructure and staffing needs in Europe: the ESTRO QUARTS project. Radiotherapy and Oncology, 75: 355-365 52 Delaney, G., Jacob, S., Featherstone, C & Braton, M, 2005. The role of radiotherapy in cancer treatment: Estimating the optimal
utilization from a review of evidence-based clinical guidelines, Cancer, 104 (6): pp.1129-1137
Radiation Oncology Workforce Planning
Final Report Page 31
2.5 INTERNATIONAL RADIATION ONCOLOGY WORKFORCE PLANNING
Radiation oncology under-utilisation is an issue worldwide. Many countries including the UK
and Canada find it difficult to meet the demand for radiation oncology. Slow uptake of
technology and shortages in equipment and workforce influence a country‟s ability to meet
service demand. Workforce planning has taken place in other countries aside from Australia
to address under-utilisation, through predicting optimal staffing levels and utilisation
benchmarks to ensure that departments have the adequate capacity to meet the future demand
for radiation oncology. Some country specific examples are highlighted in this section.
2.5.1 Workforce planning in the United Kingdom
A report published by the UK National Radiotherapy Advisory Group (NRAG) (2007) used a
similar model to that used by the Australian Medical Workforce Advisory Committee
(AMWAC) and the Australian Health Workforce Advisory Committee (AHWAC) to make
recommendations for the future radiotherapy workforce53
. The report came about after a large
gap (63%) between current activity levels and optimal treatment levels was identified. The
NRAG also noted that there was considerable variation in the number of fractions delivered
per million population between cancer networks. Recommendations to meet optimal
radiotherapy treatment levels included54
:
48,000 fractions per million population need to be delivered annually to meet demand, this
will increase to 54,000 fractions per million population by 2016 – the National Health
Service currently delivers around 30,000 fractions per million population;
each linac needs to deliver 4-4.5 fractions on average per hour;
linacs within radiotherapy departments need to work 9.2 hours per day;
radiotherapy departments require a service efficiency machine that is used 50-75% of the
time providing capacity to deal with peaks in workload and linac breakdowns;
all new and replacement machines need to be capable of image guided four-dimensional
adaptive radiotherapy;
linacs need to be replaced every 10 years; and
radiotherapy equipment needs to be supported with an adequate radiation oncology
workforce.
Based on their findings, NRAG made a number of workforce recommendations including55
:
a radical workforce re-design focused on skills over job titles, reducing high attrition from
training by improving the training experience for RTs and the four-tier skills mix model
(see below) for RTs to be introduced nationally; and
improving the RTs training experience, at the time of the report the attrition rate was 35%;
part of the improvement includes the development of laboratories with linacs and CT
simulators to reduce training demands on clinical departments.
The four-tier skills mix model was developed out of a need to reduce high attrition of RTs in
the UK56
. The model has been designed to encourage clinical role development, flexible
53 National Radiotherapy Advisory Group, 2007, Radiotherapy, developing a world class service for England <available online>:
http://www.cancerimprovement.nhs.uk/%5Cdocuments%5Cradiotherapy%5CNRAG_0507.pdf 54 ibid 55 ibid 56 Department of Health, 2003. Radiography Skills Mix: A report on the four-tier service delivery model. United Kingdom
Radiation Oncology Workforce Planning
Final Report Page 32
working within teams and lifelong learning in support of a career path that remains clinically
focused. The model has four levels that reflect escalating competencies and responsibilities57
:
Assistant practitioner – performs protocol-limited clinical tasks under the direction and
supervision of a state-registered practitioner;
Practitioner (state registered) – performs a wide-ranging and complex clinical role; is
accountable for his or her own actions and for the actions of those they direct;
Advanced practitioner (state registered) – autonomous in clinical practice, defines the
scope of practice of others and continuously develops clinical practice within a defined
field; and
Consultant practitioner (state registered) – provides clinical leadership within a
specialism, bringing strategic direction, innovation and influence through practice,
research and education.
2.5.2 Workforce planning in Canada
A report conducted by CARO 1999 stressed the need to factor all categories of professional
activity into a workforce calculation. The four health professional activity categories in the
CARO paper are clinical patient care service, clinical administration, teaching and education,
and research58
. They noted that variations in staffing and work mix figures have been cited
over the years but no recommendations have been standardised and accepted as a workable
guide59
. Australia‟s Tripartite Committee60
recommended that a similar project to that
performed by CARO (1999) could be conducted in Australia. This work would provide a
factual and region-specific basis to estimate workforce requirements and needs in Australia.
The Tripartite Committee argued that local studies employing local models that are adaptive
to changing technologies and delivery of health services need to be developed61
.
2.5.3 Workforce planning in Europe
A study conducted by Slotman et al (2005) collected information surrounding national
guidelines for infrastructure and workforce across 44 countries in Europe. The authors varied
their workforce estimations based on countries Gross Domestic Product (GDP) per capita.
For high GDP countries they suggested one linear accelerator per 450 patients, one RO per
200-250 patients and one physicist per 450-500 patients62
. Slotman et al stressed that these
are only crude guidelines and that the actual needs are heavily dependent on the population
structure, cancer incidence and treatment strategies, which differ between various countries.
2.5.4 Workforce planning in Scotland
Access to radiotherapy in Scotland continues to be limited by lack of linacs and staffing. The
Royal College of Radiologists in 2005 highlights that changes in skill mix and patterns of
working cannot solve the problem of staff under-provision63
. They recognise a need to
increase the number of ROs, RTs and ROMPs, particularly the later two. They also suggest
57 ibid 58 Canadian Association of ROs. (CARO). 1999. Manpower study report. 59 Triparite Committee, 2005. Developing standards for radiation treatment services in Australia: Discussion Paper. 60 ibid 61 ibid, p. 23 62 Slotman, B., Cottier, B., Bentzen, S., Heeren, G., Lievens, Y & Bogaert, W. 2004 (Abstract). Overview of national guidelines for
infrastructure and staffing of radiotherapy. ESTRO-QUARTS: Work package 1. Journal of the European Society for Therapeutic Radiology
and Oncology: 75(3). 63
The Royal College of Radiologists (2005) Equipment, workload and staffing for radiotherapy in Scotland 1997-2003.
Radiation Oncology Workforce Planning
Final Report Page 33
that a minimum annual 5% increase in workload should be built into future planning
assumptions. Further workforce planning initiatives included64
:
employment of radiotherapy helpers for non-clinical tasks;
increasing the intake of students into relevant radiotherapy and physics degrees;
increasing the number of medical physics training posts and improving the medical
physicist career structure;
medical students, medical physics students and radiographer students need to be exposed
to oncology services in their training; and
exploring ways to adjust the RTs skill mix to allow them to work in a way that will
facilitate modern technology.
Also in 2005, the Scottish Executive Health Department published a report of the
Radiotherapy Activity Planning Group65
. The report concentrated on facilities development
strategies for increasing service capacity by about 50%, with a specific focus on extending the
operating hours for existing equipment to reach more cost effective levels. In respect of
workforce, the report recommended identifying the funding required to increase the number
of medical physicists in training for four to six per year for therapy physics, and providing
pump-priming funding for advanced practitioners and/or consultant therapy radiographers in
at least the larger centres to enhance recruitment and retention66
.
2.6 RECRUITMENT AND RETENTION OF HEALTH PROFESSIONALS
Information regarding recruitment and retention strategies and issues specific to the radiation
oncology workforce is limited in the literature, particularly regarding recruitment and
retention in rural and regional areas. This section looks at rural recruitment and retention
issues for health professionals in general (as it is expected most workforce shortages will be in
rural and regional areas), followed by a discussion of issues that are specific to radiotherapy.
2.6.1 Recruitment and retention of health professionals to regional and rural areas
Rural recruitment and retention is effective when the rural location is a lifestyle choice. What
is difficult is attracting and retaining people that would not normally reside in a rural location
and providing the right incentives to keep them there. Increasingly more radiation oncology
facilities will be built in regional areas. It will be important to develop effective strategies to
recruit staff to these locations, particularly ROs and ROMPs where there are currently
difficulties in recruiting suitable staff to regional areas.
For allied health professionals, a study has shown that main reasons for working in
regional/rural areas are lifestyle, career and family ties while the main reasons for leaving are:
lack of career path, personal and social isolation67
. A Victorian study looking at workforce
recruitment and retention for allied professionals indicated that it is essential to target younger
professionals and those with young families. Recruitment strategies include the provision of
continuing professional development (CPD) and work exchange opportunities; teaching
64 ibid. 65 Scottish Executive Health Department (December 2005), Report of the Radiotherapy Activity Planning Group, Radiotherapy activity
planning for Scotland, 2011 – 2015 66 ibid. 67 Schoo, A., Stagnitti, K., Mercer., C & Dunbar, J. 2005, A conceptual model for recruitment and retention: Allied health workforce
enhancement in Western Victoria, Australia. The international electronic journal of rural and remote health research, education, practice and
policy <online> available from: http://www.rrh.org.au/publishedarticles/article_print_477.pdf
Radiation Oncology Workforce Planning
Final Report Page 34
managerial competencies; utilising the various health disciplines; enhancing student
placement; creating a supportive and creative work environment; and having an active and
supportive community68
. Other strategies have included retention payments as an incentive to
keep health professionals in rural and regional areas69
. The effectiveness of these payments is
still largely unknown.
A study conducted across rural NSW looked at strategies that local managers can use to
optimise recruitment and retention of mental health staff70
. Key attractions to rural areas were
identified as rural lifestyle and environment. Identified retention factors include family
reasons, the field of work and rural lifestyle, availability of support, supervision and good
management. The paper concluded that there is room for strategies to improve employment
incentives and there is considerable scope for managers at the local level to improve the
design and hence the attractiveness of jobs. A shortcoming of the study was that it did not
survey professionals who had left the rural setting.
A further study in 200271
looked at the factors that influence how long a GP will remain in a
rural area. The key workforce problem for rural doctors is an inability to get time away for
recreation leave and family considerations, particularly in smaller regional areas without
access to good on-call arrangements. Strategies to deal with these issues include recruiting
more rural doctors; an appropriate locum strategy; and the development of regional medical
practice models to enhance opportunities for professional support72
. Other workforce
retention issues include access to support staff, access to facilities, and access to technology.
2.6.2 Radiation oncology workforce specific strategies
An American paper has looked at radiologist recruitment and retention73
. On the recruitment
side they highlighted the need to develop strategies to sell the profession to students,
particularly students on clinical placements. On the retention side part time work as an
option, flexibility at work, employing a highly robust support staff and having a dedicated
departmental educator in IT were seen as strategies to retain staff.
Some specific strategies for RT recruitment and retention were highlighted in a paper by
Ahern et al 200774
which looked at radiation therapist subspecialisation. During the 1990‟s
radiotherapy staffing levels were historically low, job satisfaction was low and loss of RTs to
other countries with better remuneration was high75
. Subsequent to 2000, RTs have been
better remunerated and professional development has been funded by the Commonwealth
Government through the AIR. Anecdotally poor retention was linked to boredom because of
the repetitive nature of the some aspects of the profession and cynicism because of limited
opportunities for career progression and advancement to senior positions76
. Ahern et al
68
ibid 69
ibid 70 Perkins, D., Larsen, K., Lyle, D & Burns, P. 2007, Securing and retaining mental health workforce in far western New South Wales,
Australian Journal of Rural Health, 15: pp. 94-98 71 Humphreys, J., Jones,M., Jones, J & Mara, P, 2002. Workforce retention in rural and remote Australia: determining the factors that influence length of practice, Medical Journal of Australia, 176: pp. 472-476 72 Humphreys, J., Jones,M., Jones, J & Mara, P, 2002. Workforce retention in rural and remote Australia: determining the factors that
influence length of practice, Medical Journal of Australia, 176: pp. 472-476 73 Halstead, M., Donnelly, L &Strife, J. 2005, Radiologist recruitment and retention: How can we improve, Journal of American College of
Radiology, 2: pp. 369-375 74Ahern, V., Bull, C., Matthews, K & Willis, D. 2007, Subspecialization of RTs in Australia and New Zealand, Australasian Radiology, 51: pp. 104-105 75 ibid pp. 104-105 76 ibid pp. 104-105
Radiation Oncology Workforce Planning
Final Report Page 35
200777
exemplify that career development within radiotherapy is „required and essential if
RTs are to be retained for a longer term in the profession78
.‟
One solution and recommendation from the Baume Inquiry is to develop sub-specialties
within radiotherapy, possibly including specialities in IMRT, brachytherapy, stereotactic
radiotherapy as well as tumour site specialties, reflecting the practice of ROs and drawing the
RT into the multidisciplinary model of patient care. Similar models have been implemented
in the UK, as a response to job dissatisfaction, staff shortages and the need to provide more
recognition of a professional workforce.
Radiation oncology workforce planning needs to consider what attracts people to the
profession and what factors aid in supporting professionals throughout their career. A good
understanding of what the three key professions value in their career will aid in maintaining
and attracting staff to the profession.
77 ibid pp. 104-105 78 ibid pp. 104-105
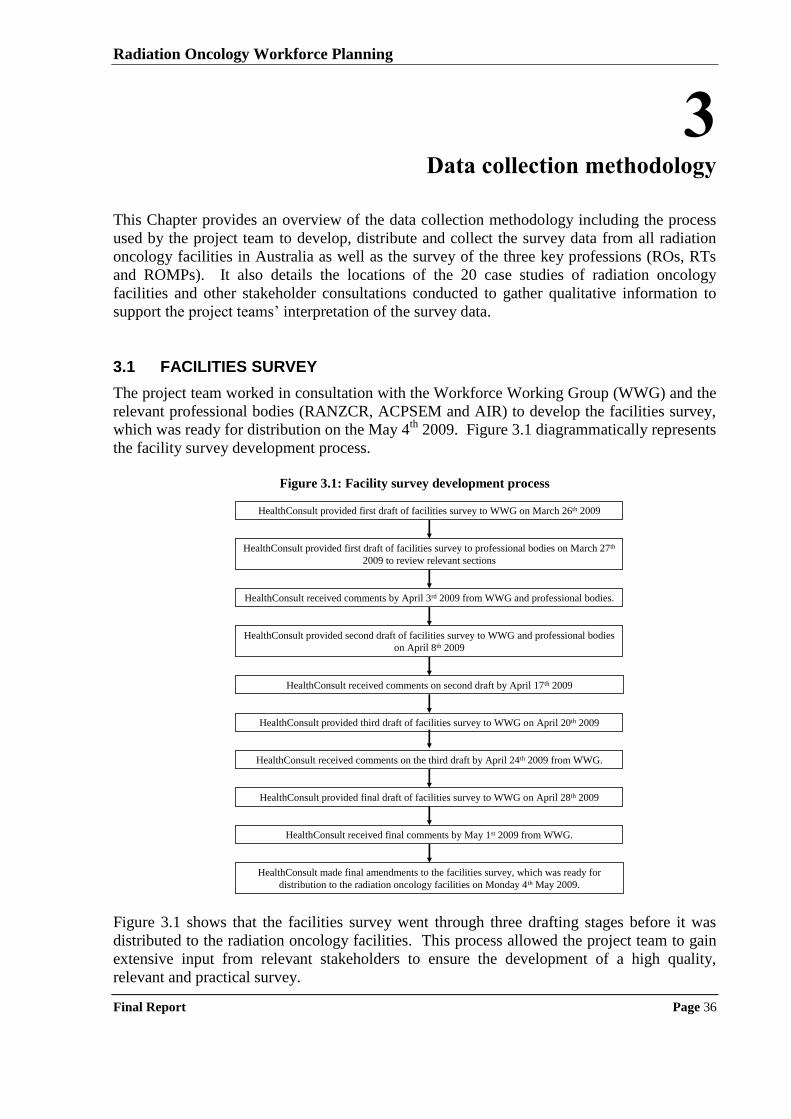
Radiation Oncology Workforce Planning
Final Report Page 36
3 Data collection methodology
This Chapter provides an overview of the data collection methodology including the process
used by the project team to develop, distribute and collect the survey data from all radiation
oncology facilities in Australia as well as the survey of the three key professions (ROs, RTs
and ROMPs). It also details the locations of the 20 case studies of radiation oncology
facilities and other stakeholder consultations conducted to gather qualitative information to
support the project teams‟ interpretation of the survey data.
3.1 FACILITIES SURVEY
The project team worked in consultation with the Workforce Working Group (WWG) and the
relevant professional bodies (RANZCR, ACPSEM and AIR) to develop the facilities survey,
which was ready for distribution on the May 4th
2009. Figure 3.1 diagrammatically represents
the facility survey development process.
Figure 3.1: Facility survey development process
HealthConsult provided first draft of facilities survey to WWG on March 26th 2009
HealthConsult provided first draft of facilities survey to professional bodies on March 27th
2009 to review relevant sections
HealthConsult received comments by April 3rd 2009 from WWG and professional bodies.
HealthConsult provided second draft of facilities survey to WWG and professional bodies
on April 8th 2009
HealthConsult received comments on second draft by April 17th 2009
HealthConsult provided third draft of facilities survey to WWG on April 20th 2009
HealthConsult received comments on the third draft by April 24th 2009 from WWG.
HealthConsult provided final draft of facilities survey to WWG on April 28th 2009
HealthConsult received final comments by May 1st 2009 from WWG.
HealthConsult made final amendments to the facilities survey, which was ready for
distribution to the radiation oncology facilities on Monday 4th May 2009.
Figure 3.1 shows that the facilities survey went through three drafting stages before it was
distributed to the radiation oncology facilities. This process allowed the project team to gain
extensive input from relevant stakeholders to ensure the development of a high quality,
relevant and practical survey.
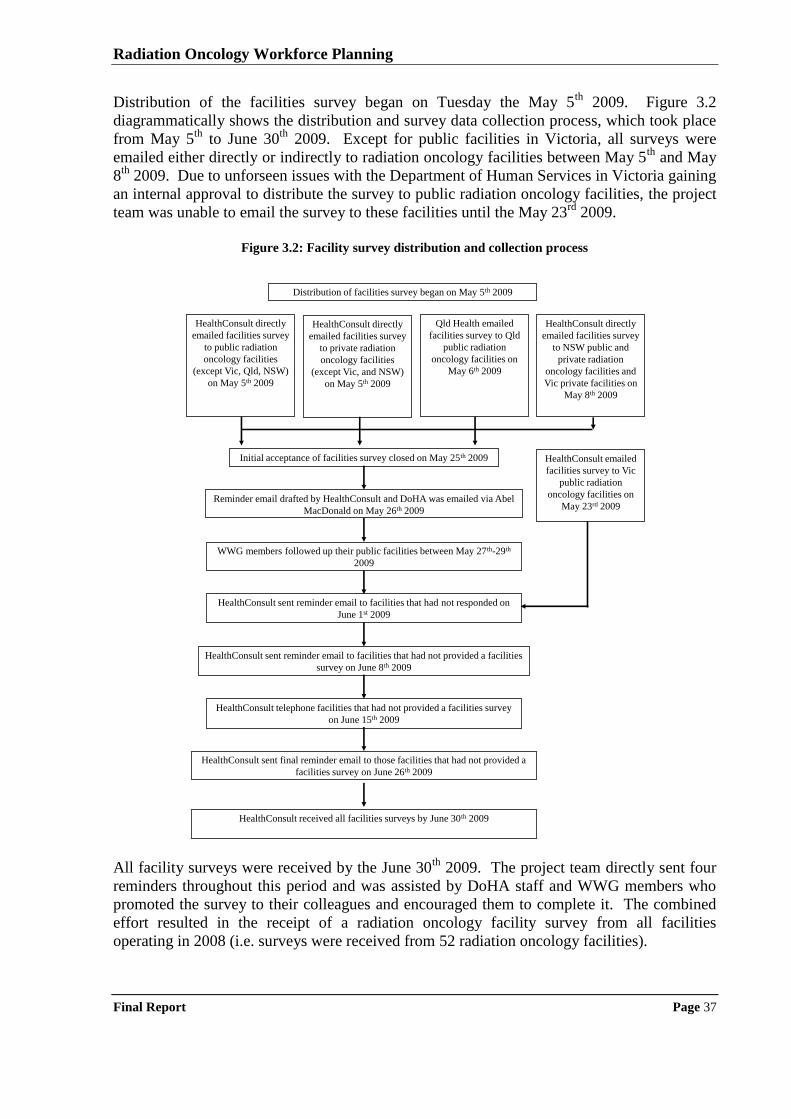
Radiation Oncology Workforce Planning
Final Report Page 37
Distribution of the facilities survey began on Tuesday the May 5th
2009. Figure 3.2
diagrammatically shows the distribution and survey data collection process, which took place
from May 5th
to June 30th
2009. Except for public facilities in Victoria, all surveys were
emailed either directly or indirectly to radiation oncology facilities between May 5th
and May
8th
2009. Due to unforseen issues with the Department of Human Services in Victoria gaining
an internal approval to distribute the survey to public radiation oncology facilities, the project
team was unable to email the survey to these facilities until the May 23rd
2009.
Figure 3.2: Facility survey distribution and collection process
Distribution of facilities survey began on May 5th 2009
HealthConsult directly
emailed facilities survey
to public radiation
oncology facilities
(except Vic, Qld, NSW)
on May 5th 2009
HealthConsult directly
emailed facilities survey
to NSW public and
private radiation
oncology facilities and
Vic private facilities on
May 8th 2009
Qld Health emailed
facilities survey to Qld
public radiation
oncology facilities on
May 6th 2009
Initial acceptance of facilities survey closed on May 25th 2009
Reminder email drafted by HealthConsult and DoHA was emailed via Abel
MacDonald on May 26th 2009
HealthConsult sent reminder email to facilities that had not responded on
June 1st 2009
WWG members followed up their public facilities between May 27th-29th
2009
HealthConsult sent reminder email to facilities that had not provided a facilities
survey on June 8th 2009
HealthConsult telephone facilities that had not provided a facilities survey
on June 15th 2009
HealthConsult sent final reminder email to those facilities that had not provided a
facilities survey on June 26th 2009
HealthConsult received all facilities surveys by June 30th 2009
HealthConsult emailed
facilities survey to Vic
public radiation
oncology facilities on
May 23rd 2009
HealthConsult directly
emailed facilities survey
to private radiation
oncology facilities
(except Vic, and NSW)
on May 5th 2009
All facility surveys were received by the June 30
th 2009. The project team directly sent four
reminders throughout this period and was assisted by DoHA staff and WWG members who
promoted the survey to their colleagues and encouraged them to complete it. The combined
effort resulted in the receipt of a radiation oncology facility survey from all facilities
operating in 2008 (i.e. surveys were received from 52 radiation oncology facilities).
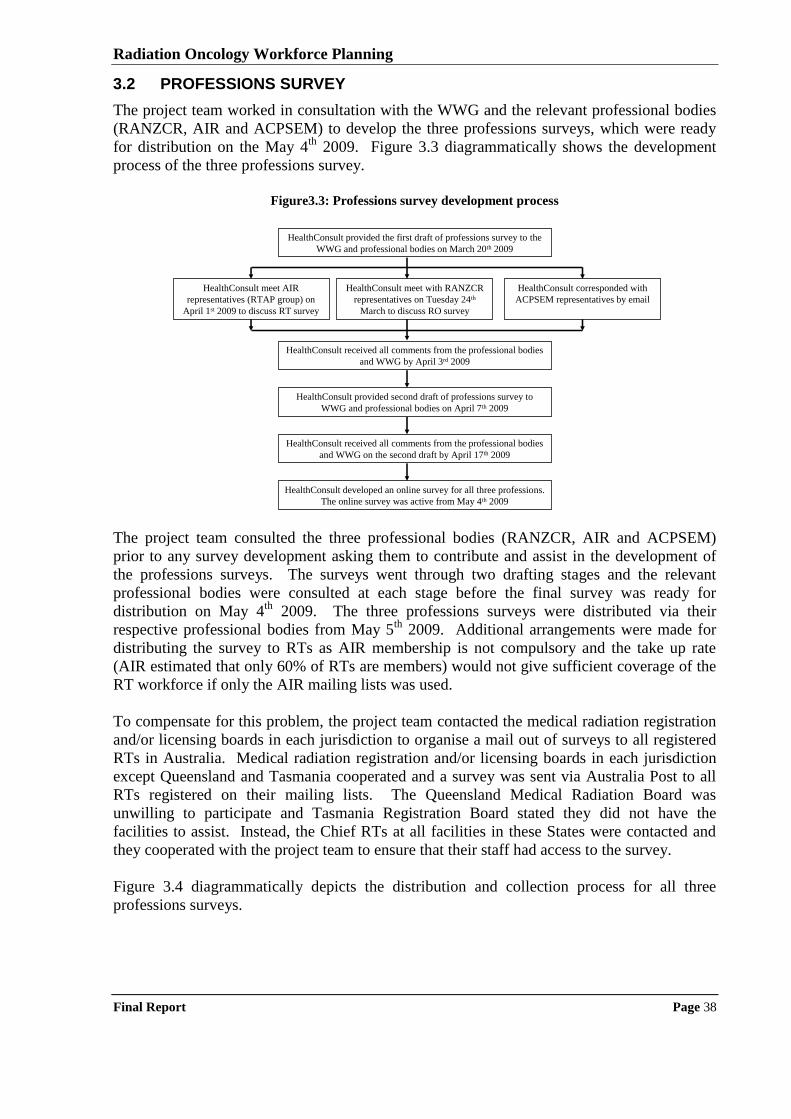
Radiation Oncology Workforce Planning
Final Report Page 38
3.2 PROFESSIONS SURVEY
The project team worked in consultation with the WWG and the relevant professional bodies
(RANZCR, AIR and ACPSEM) to develop the three professions surveys, which were ready
for distribution on the May 4th
2009. Figure 3.3 diagrammatically shows the development
process of the three professions survey.
Figure3.3: Professions survey development process
HealthConsult provided the first draft of professions survey to the
WWG and professional bodies on March 20th 2009
HealthConsult meet AIR
representatives (RTAP group) on
April 1st 2009 to discuss RT survey
HealthConsult meet with RANZCR
representatives on Tuesday 24th
March to discuss RO survey
HealthConsult corresponded with
ACPSEM representatives by email
HealthConsult received all comments from the professional bodies
and WWG on the second draft by April 17th 2009
HealthConsult developed an online survey for all three professions.
The online survey was active from May 4th 2009
HealthConsult provided second draft of professions survey to
WWG and professional bodies on April 7th 2009
HealthConsult received all comments from the professional bodies
and WWG by April 3rd 2009
The project team consulted the three professional bodies (RANZCR, AIR and ACPSEM)
prior to any survey development asking them to contribute and assist in the development of
the professions surveys. The surveys went through two drafting stages and the relevant
professional bodies were consulted at each stage before the final survey was ready for
distribution on May 4th
2009. The three professions surveys were distributed via their
respective professional bodies from May 5th
2009. Additional arrangements were made for
distributing the survey to RTs as AIR membership is not compulsory and the take up rate
(AIR estimated that only 60% of RTs are members) would not give sufficient coverage of the
RT workforce if only the AIR mailing lists was used.
To compensate for this problem, the project team contacted the medical radiation registration
and/or licensing boards in each jurisdiction to organise a mail out of surveys to all registered
RTs in Australia. Medical radiation registration and/or licensing boards in each jurisdiction
except Queensland and Tasmania cooperated and a survey was sent via Australia Post to all
RTs registered on their mailing lists. The Queensland Medical Radiation Board was
unwilling to participate and Tasmania Registration Board stated they did not have the
facilities to assist. Instead, the Chief RTs at all facilities in these States were contacted and
they cooperated with the project team to ensure that their staff had access to the survey.
Figure 3.4 diagrammatically depicts the distribution and collection process for all three
professions surveys.
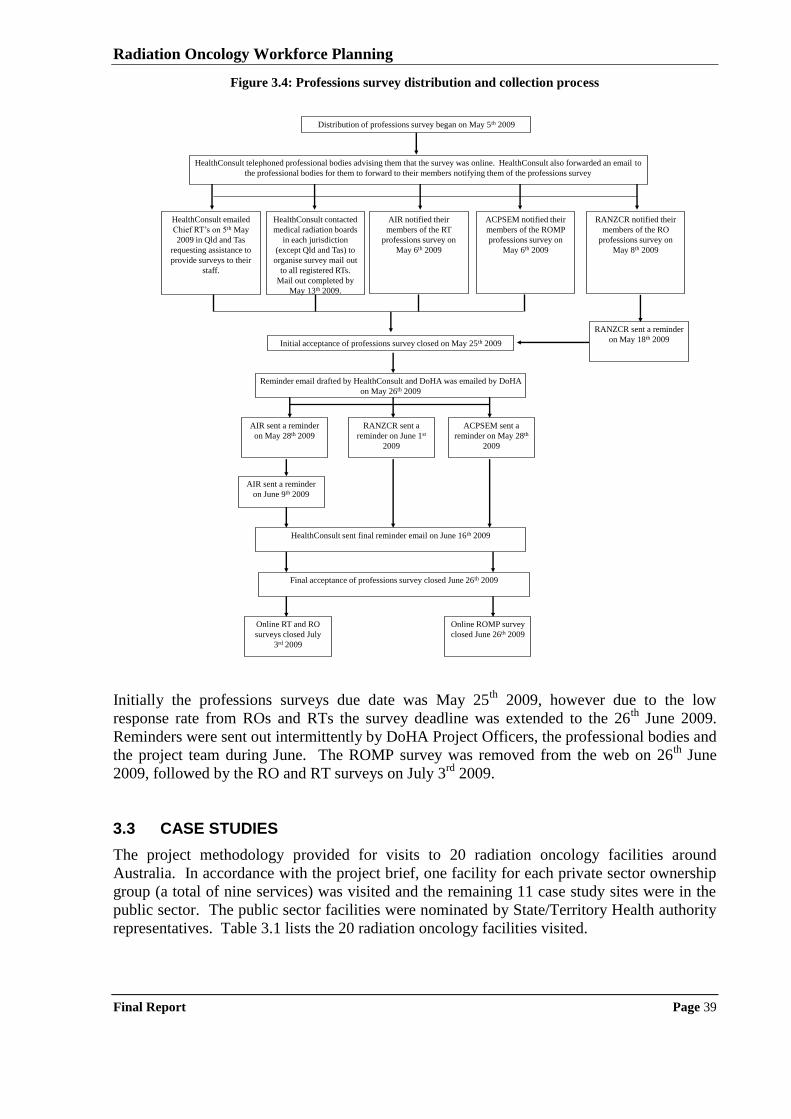
Radiation Oncology Workforce Planning
Final Report Page 39
Figure 3.4: Professions survey distribution and collection process
Distribution of professions survey began on May 5th 2009
HealthConsult telephoned professional bodies advising them that the survey was online. HealthConsult also forwarded an email to
the professional bodies for them to forward to their members notifying them of the professions survey
Initial acceptance of professions survey closed on May 25th 2009
Reminder email drafted by HealthConsult and DoHA was emailed by DoHA
on May 26th 2009
RANZCR notified their
members of the RO
professions survey on
May 8th 2009
AIR notified their
members of the RT
professions survey on
May 6th 2009
ACPSEM notified their
members of the ROMP
professions survey on
May 6th 2009
HealthConsult contacted
medical radiation boards
in each jurisdiction
(except Qld and Tas) to
organise survey mail out
to all registered RTs.
Mail out completed by
May 13th 2009.
RANZCR sent a
reminder on June 1st
2009
RANZCR sent a reminder
on May 18th 2009
ACPSEM sent a
reminder on May 28th
2009
AIR sent a reminder
on May 28th 2009
AIR sent a reminder
on June 9th 2009
HealthConsult sent final reminder email on June 16th 2009
Online RT and RO
surveys closed July
3rd 2009
Online ROMP survey
closed June 26th 2009
Final acceptance of professions survey closed June 26th 2009
HealthConsult emailed
Chief RT‟s on 5th May
2009 in Qld and Tas
requesting assistance to
provide surveys to their
staff.
Initially the professions surveys due date was May 25
th 2009, however due to the low
response rate from ROs and RTs the survey deadline was extended to the 26th
June 2009.
Reminders were sent out intermittently by DoHA Project Officers, the professional bodies and
the project team during June. The ROMP survey was removed from the web on 26th
June
2009, followed by the RO and RT surveys on July 3rd
2009.
3.3 CASE STUDIES
The project methodology provided for visits to 20 radiation oncology facilities around
Australia. In accordance with the project brief, one facility for each private sector ownership
group (a total of nine services) was visited and the remaining 11 case study sites were in the
public sector. The public sector facilities were nominated by State/Territory Health authority
representatives. Table 3.1 lists the 20 radiation oncology facilities visited.
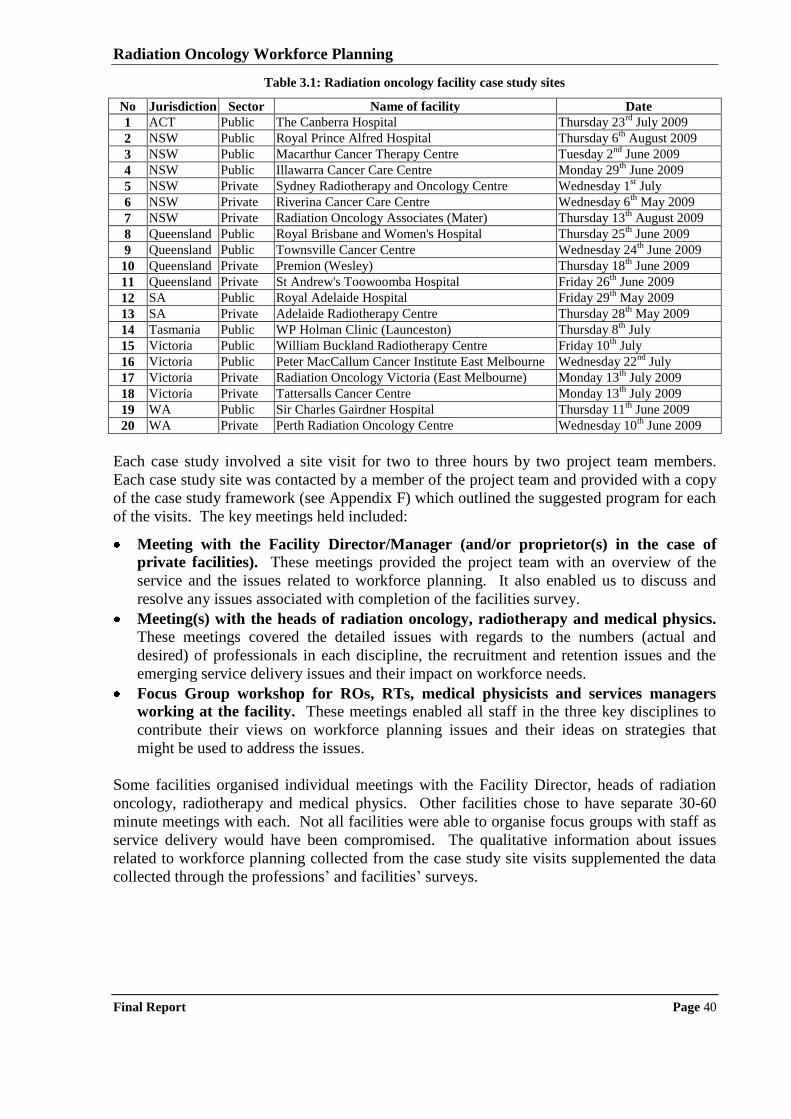
Radiation Oncology Workforce Planning
Final Report Page 40
Table 3.1: Radiation oncology facility case study sites
No Jurisdiction Sector Name of facility Date
1 ACT Public The Canberra Hospital Thursday 23rd
July 2009
2 NSW Public Royal Prince Alfred Hospital Thursday 6th
August 2009
3 NSW Public Macarthur Cancer Therapy Centre Tuesday 2nd
June 2009
4 NSW Public Illawarra Cancer Care Centre Monday 29th
June 2009
5 NSW Private Sydney Radiotherapy and Oncology Centre Wednesday 1st July
6 NSW Private Riverina Cancer Care Centre Wednesday 6th
May 2009
7 NSW Private Radiation Oncology Associates (Mater) Thursday 13th
August 2009
8 Queensland Public Royal Brisbane and Women's Hospital Thursday 25th
June 2009
9 Queensland Public Townsville Cancer Centre Wednesday 24th
June 2009
10 Queensland Private Premion (Wesley) Thursday 18th
June 2009
11 Queensland Private St Andrew's Toowoomba Hospital Friday 26th
June 2009
12 SA Public Royal Adelaide Hospital Friday 29th
May 2009
13 SA Private Adelaide Radiotherapy Centre Thursday 28th
May 2009
14 Tasmania Public WP Holman Clinic (Launceston) Thursday 8th
July
15 Victoria Public William Buckland Radiotherapy Centre Friday 10th
July
16 Victoria Public Peter MacCallum Cancer Institute East Melbourne Wednesday 22nd
July
17 Victoria Private Radiation Oncology Victoria (East Melbourne) Monday 13th
July 2009
18 Victoria Private Tattersalls Cancer Centre Monday 13th
July 2009
19 WA Public Sir Charles Gairdner Hospital Thursday 11th
June 2009
20 WA Private Perth Radiation Oncology Centre Wednesday 10th
June 2009
Each case study involved a site visit for two to three hours by two project team members.
Each case study site was contacted by a member of the project team and provided with a copy
of the case study framework (see Appendix F) which outlined the suggested program for each
of the visits. The key meetings held included:
Meeting with the Facility Director/Manager (and/or proprietor(s) in the case of
private facilities). These meetings provided the project team with an overview of the
service and the issues related to workforce planning. It also enabled us to discuss and
resolve any issues associated with completion of the facilities survey.
Meeting(s) with the heads of radiation oncology, radiotherapy and medical physics. These meetings covered the detailed issues with regards to the numbers (actual and
desired) of professionals in each discipline, the recruitment and retention issues and the
emerging service delivery issues and their impact on workforce needs.
Focus Group workshop for ROs, RTs, medical physicists and services managers
working at the facility. These meetings enabled all staff in the three key disciplines to
contribute their views on workforce planning issues and their ideas on strategies that
might be used to address the issues.
Some facilities organised individual meetings with the Facility Director, heads of radiation
oncology, radiotherapy and medical physics. Other facilities chose to have separate 30-60
minute meetings with each. Not all facilities were able to organise focus groups with staff as
service delivery would have been compromised. The qualitative information about issues
related to workforce planning collected from the case study site visits supplemented the data
collected through the professions‟ and facilities‟ surveys.
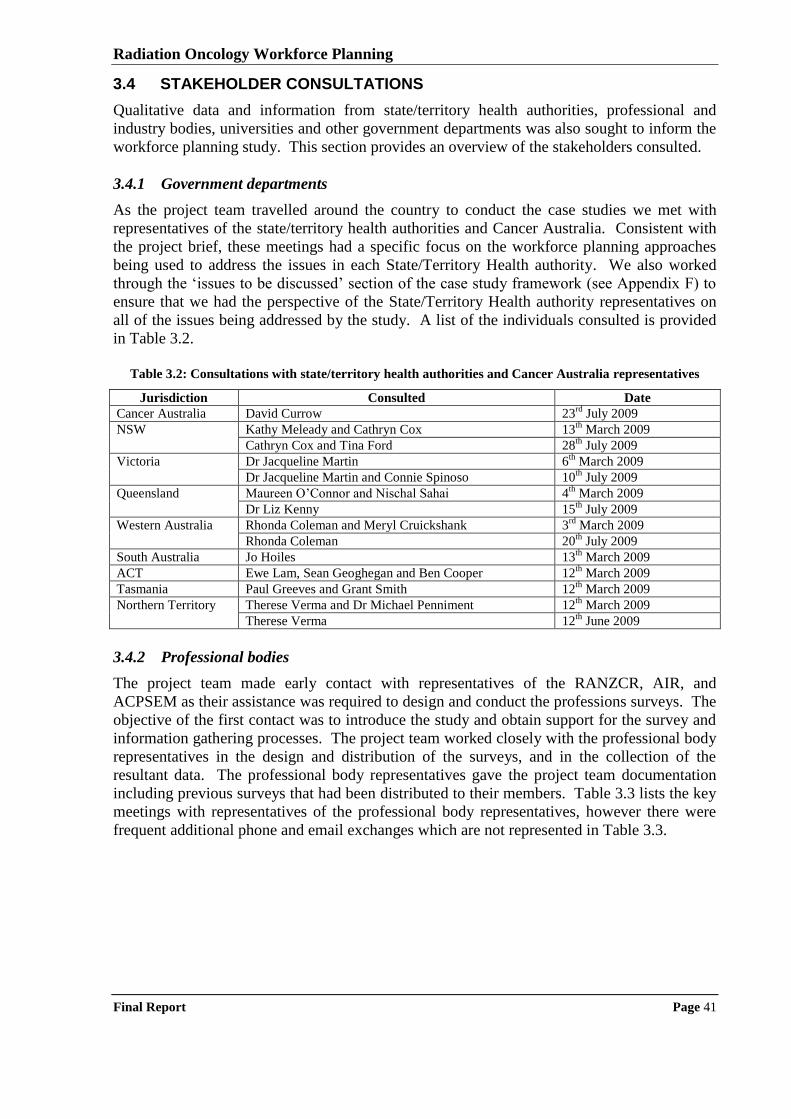
Radiation Oncology Workforce Planning
Final Report Page 41
3.4 STAKEHOLDER CONSULTATIONS
Qualitative data and information from state/territory health authorities, professional and
industry bodies, universities and other government departments was also sought to inform the
workforce planning study. This section provides an overview of the stakeholders consulted.
3.4.1 Government departments
As the project team travelled around the country to conduct the case studies we met with
representatives of the state/territory health authorities and Cancer Australia. Consistent with
the project brief, these meetings had a specific focus on the workforce planning approaches
being used to address the issues in each State/Territory Health authority. We also worked
through the „issues to be discussed‟ section of the case study framework (see Appendix F) to
ensure that we had the perspective of the State/Territory Health authority representatives on
all of the issues being addressed by the study. A list of the individuals consulted is provided
in Table 3.2.
Table 3.2: Consultations with state/territory health authorities and Cancer Australia representatives
Jurisdiction Consulted Date
Cancer Australia David Currow 23rd
July 2009
NSW Kathy Meleady and Cathryn Cox 13th
March 2009
Cathryn Cox and Tina Ford 28th
July 2009
Victoria Dr Jacqueline Martin 6th
March 2009
Dr Jacqueline Martin and Connie Spinoso 10th
July 2009
Queensland Maureen O‟Connor and Nischal Sahai 4th
March 2009
Dr Liz Kenny 15th
July 2009
Western Australia Rhonda Coleman and Meryl Cruickshank 3rd
March 2009
Rhonda Coleman 20th
July 2009
South Australia Jo Hoiles 13th
March 2009
ACT Ewe Lam, Sean Geoghegan and Ben Cooper 12th
March 2009
Tasmania Paul Greeves and Grant Smith 12th
March 2009
Northern Territory Therese Verma and Dr Michael Penniment 12th
March 2009
Therese Verma 12th
June 2009
3.4.2 Professional bodies
The project team made early contact with representatives of the RANZCR, AIR, and
ACPSEM as their assistance was required to design and conduct the professions surveys. The
objective of the first contact was to introduce the study and obtain support for the survey and
information gathering processes. The project team worked closely with the professional body
representatives in the design and distribution of the surveys, and in the collection of the
resultant data. The professional body representatives gave the project team documentation
including previous surveys that had been distributed to their members. Table 3.3 lists the key
meetings with representatives of the professional body representatives, however there were
frequent additional phone and email exchanges which are not represented in Table 3.3.
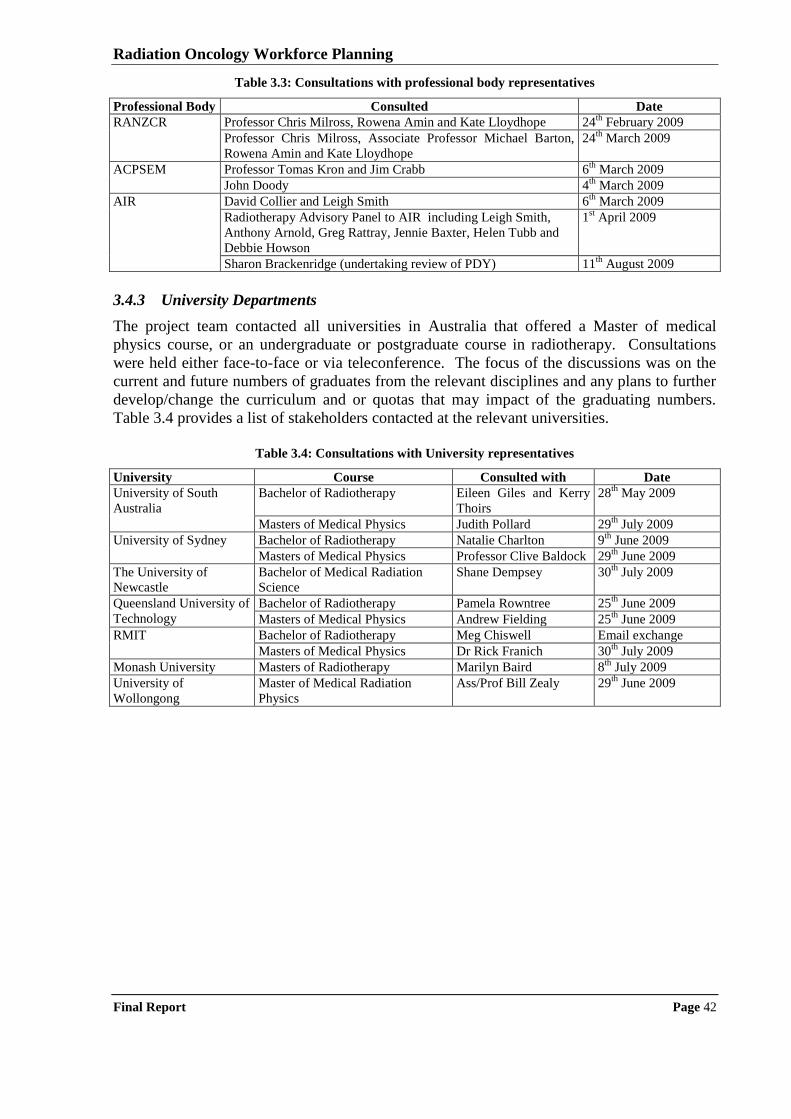
Radiation Oncology Workforce Planning
Final Report Page 42
Table 3.3: Consultations with professional body representatives
Professional Body Consulted Date
RANZCR Professor Chris Milross, Rowena Amin and Kate Lloydhope 24th
February 2009
Professor Chris Milross, Associate Professor Michael Barton,
Rowena Amin and Kate Lloydhope
24th
March 2009
ACPSEM Professor Tomas Kron and Jim Crabb 6th
March 2009
John Doody 4th
March 2009
AIR David Collier and Leigh Smith 6th
March 2009
Radiotherapy Advisory Panel to AIR including Leigh Smith,
Anthony Arnold, Greg Rattray, Jennie Baxter, Helen Tubb and
Debbie Howson
1st April 2009
Sharon Brackenridge (undertaking review of PDY) 11th
August 2009
3.4.3 University Departments
The project team contacted all universities in Australia that offered a Master of medical
physics course, or an undergraduate or postgraduate course in radiotherapy. Consultations
were held either face-to-face or via teleconference. The focus of the discussions was on the
current and future numbers of graduates from the relevant disciplines and any plans to further
develop/change the curriculum and or quotas that may impact of the graduating numbers.
Table 3.4 provides a list of stakeholders contacted at the relevant universities.
Table 3.4: Consultations with University representatives
University Course Consulted with Date
University of South
Australia
Bachelor of Radiotherapy Eileen Giles and Kerry
Thoirs
28th
May 2009
Masters of Medical Physics Judith Pollard 29th
July 2009
University of Sydney Bachelor of Radiotherapy Natalie Charlton 9th
June 2009
Masters of Medical Physics Professor Clive Baldock 29th
June 2009
The University of
Newcastle
Bachelor of Medical Radiation
Science
Shane Dempsey 30th
July 2009
Queensland University of
Technology
Bachelor of Radiotherapy Pamela Rowntree 25th
June 2009
Masters of Medical Physics Andrew Fielding 25th
June 2009
RMIT Bachelor of Radiotherapy Meg Chiswell Email exchange
Masters of Medical Physics Dr Rick Franich 30th
July 2009
Monash University Masters of Radiotherapy Marilyn Baird 8th
July 2009
University of
Wollongong
Master of Medical Radiation
Physics
Ass/Prof Bill Zealy 29th
June 2009
Radiation Oncology Workforce Planning
Final Report Page 43
4 Radiation Oncology Workforce Planning in Australia
This chapter examines the status, as at July 2009, of radiation oncology workforce planning in
Australia. As well as defining the concept of workforce planning, previous studies of the
radiation oncology workforce are summarised, as are the current initiatives of the State Health
Authorities, the professional colleges, and other stakeholders with respect to the radiation
oncology workforce.
4.1 WHAT IS WORKFORCE PLANNING?
Workforce planning is the systematic assessment of future human workforce needs and the
determination of the actions required to meet those needs79
. Workforce planning for health is
therefore the process of estimating the required health workforce to meet future health service
requirements and the development of strategies to meet that need. It may occur at many
levels; international, national, state or regional and organisational. The 2002 review of
national medical workforce planning in Australia defined health workforce planning as being
about planning for the future supply and distribution of properly educated and trained
practitioners to best meet the population‟s need for quality health services, which is part of the
broader continuum of overall health services planning and policy development80
.
Workforce planning in the health sector is not an exact science, but rather an attempt to
predict and determine the future on the basis of information available in the present81
. Nor,
in the health context, is it an easy task to determine the balance between the supply of labour
and the need for labour, or the policies and strategies that need to be employed to correct for
any imbalances, both current and expected. Factors such as the long lead time required to
produce a fully qualified health practitioner, the range of different occupations for which
health professionals can be trained, changes in national health policy, the various institutional
frameworks within which practitioners operate, the complexities associated with the
determination of need, the unknown effects of more and better health care technology, and a
lack of relevant, reliable information can all work to frustrate the workforce planning
process82,83,84,85
. Accordingly, health workforce planning is seen as an evolutionary activity
of constant assessment, analysis, validation and renewal.
79 Ripley, David E. (1995), „How to determine future workforce needs‟, Personnel Journal, January, pp 83-89 80 Australian Health Ministers‟ Advisory Council (2002), Tomorrow‟s Doctors – Review Of The Australian Medical Workforce Advisory
Committee, Canberra 81 ibid 82 Australian Medical Workforce Advisory Committee (2000), „Medical workforce planning in Australia‟, Australian Health Review, 23 (4),
pp. 8-26 83 Goldacre, M. (1998), „Planning the United Kingdom‟s medical workforce‟, British Medical Journal, 316, pp. 1846-47 84 Duckett, Stephen (2000), „The Australian health workforce: facts and figures‟, Australian Health Review, 23, (4), pp. 60-77 85 Borland, Jeff, (2002), „The markets for medical specialists in Australia‟ in Productivity Commission (Australia), Health Policy
Roundtable: Supplier–Induced Demand and Occupational Regulation, Melbourne, pp. 245-292
Radiation Oncology Workforce Planning
Final Report Page 44
4.2 PREVIOUS WORK ON RADIATION ONCOLOGY WORKFORCE PLANNING
Many reports86,87
and reviews have looked at radiation oncology in Australia over the past 20
years. These reports have highlighted the same issues, in particular workforce and equipment
shortages, a widespread lack of understanding of the effectiveness of radiotherapy, and a poor
access to radiation oncology facilities by rural Australians. Despite all these reports having
similar conclusions, many of the problems continue. This section provides a brief overview
of some of these reports and their findings and recommendations that are relevant to
workforce planning for radiation oncology.
4.2.1 AHTAC review of radiation oncology services
The Australian Health Technology Advisory Committee (AHTAC) undertook a major review
of radiation oncology services in 1996 and made a number of recommendations with respect
to infrastructure and specialist workforce requirements for a sustainable radiotherapy sector88
.
Among those recommendations were:
future planning to be based on a referral rate of 50 to 55%;
minimum equipment requirements for radiation oncology facilities to be revised regularly
in light of technological development;
progressive expansion of radiotherapy facilities to allow for continuing growth in need for
services;
increased RO and trainee positions to be established;
regular review of requirements for the RT workforce;
review of the staffing requirements for medical physicists in radiation oncology;
national minimum qualifications for medical physicists in radiation oncology; and
introduction of medical physics training positions.
The AHTAC report was endorsed by the National Health and Medical Research Council
(NH&MRC) in 1996, and subsequently endorsed by the Commonwealth Minister for Health
and Aged Care. As can be seen, many of the recommendations of that AHTAC report
continue to be relevant to the current issues in planning the radiation oncology workforce.
4.2.2 AMWAC review of the specialist radiation oncology workforce in Australia
The Australian Health Ministers' Advisory Council (AHMAC) established the Australian
Medical Workforce Advisory Committee (AMWAC) to advise on national medical workforce
matters, including workforce supply, distribution and future needs. As part of the 1997-98
AMWAC work plan, AHMAC requested a report on the specialist radiation oncology
workforce. An AMWAC Radiation Oncology Workforce Working Party was established as a
sub-committee of AMWAC and was asked to provide a report on the optimal supply and
appropriate distribution of radiation oncology specialists across Australia, including
projections for future requirements. The report was presented to AHMAC in 199889
.
The Working Party analysed existing data sources and undertook consultation with relevant
persons and organisations, in order to make informed comments on the factors affecting the
current and future market for radiation oncology services. The Working Party recommended:
86 Baume P. Radiation Oncology Inquiry. A vision for radiotherapy. Canberra, ACT: Commonwealth of Australia, 2002 87 National Strategic Plan For Radiation Oncology (Australia) (2001) 88 Beam and Isotope Radiotherapy, AHTAC Report, December 1996 89 Australian Medical Workforce Advisory Committee. (1998). The specialist radiation oncology workforce in Australia : supply and
requirements 1997-2007. Sydney, NSW.
Radiation Oncology Workforce Planning
Final Report Page 45
there be an increase in the number of funded radiation oncology training positions and
trainees;
that State/Territory health departments undertake negotiations with the RANZCR Faculty
of Radiation Oncology for the establishment of an additional 12 training positions;
that State/Territory health departments develop strategies for the provision of megavoltage
machines and other infrastructure requirements in the light of the recommended increase
in the workforce and taking account of the recommendations of the NHMRC AHTAC
report on Beam and Isotope Radiotherapy (1996);
that State/Territory health departments and the RANZCR Faculty of Radiation Oncology
co-ordinate the establishment of the new training positions and oversee the introduction of
any short term measures they may feel are necessary to meet localised service shortfalls;
that radiation oncology requirements and supply projections be monitored regularly so
that they can be amended if new trends emerge, particularly if the anticipated
infrastructure expansion is not met and that a full review of the workforce be conducted
again in five years; and
that this monitoring be coordinated by the RANZCR Faculty of Radiation Oncology and
AMWAC and the results incorporated into the AMWAC annual report to AHMAC.
Implementation of many of these recommendations has been an important part of the
foundation on which Australia‟s current radiation oncology services, and more specifically
RO workforce, is built.
4.2.3 National Strategic Plan for Radiation Oncology
The RANZCR Faculty of Radiation Oncology (FRO) commenced a national strategic
planning process for radiation oncology in November 2000 in conjunction with the ACPSEM
and the AIR. The report90 outlined the status of radiation oncology services within Australia
and recommended a national strategic plan to increase the infrastructure to allow for a 50%
treatment rate of cancer patients with radiotherapy. It also identified a number of trends in the
industry including:
the radiation oncologist, RT and radiation oncology physicist workforce is inadequate to
meet the benchmark levels of service provision;
existing training programs for ROs, RTs and radiation oncology physicists are inadequate
to meet present needs;
training programs in radiation oncology physics need to be more formally established and
recognised;
there are high vacancy rates amongst RTs and radiation oncology physicists with
indications of increasing attrition rates within both professions;
the equipment base is both inadequate and ageing with half of the linear accelerators in the
public sector requiring replacement now or in the next two years;
specific replacement policies for equipment in the public sector are uncommon;
there are substantial variations in levels of specialist staff and equipment across the nation;
a significant number of treatment machines are underutilised due to staff shortages; and
significant variations exist in the capacity of linear accelerators with regard to advanced
features designed to enhance safety, efficiency and quality of treatment: older equipment
is less likely to have these features.
90 National Strategic Plan for Radiation Oncology, 2001. The Tripartite Committee, The Royal Australian and New Zealand College of
Radiologists. Available at <http://www.ranzcr.edu.au/>
Radiation Oncology Workforce Planning
Final Report Page 46
The report stated that “over 10,000 people with cancer who could benefit from treatment did
not receive radiotherapy in 2000. If current infrastructure trends continue, this figure may
increase to 20,000 by 2005”91
. The report also identified strategies to create a sustainable
sector which included:
increasing the awareness of the benefits of radiation treatment among the medical
profession, and within the lay community and government;
promotion of a National Planning and Implementation Group networking with State and
Territory based planning groups;
linking the number of ROs, RTs and radiation oncology physicists to a population needs
basis as defined in the paper;
linking the equipment expansion with the growth in the workforce;
modernising the equipment infrastructure;
facilitate the development of processes that realise the expansion of the radiation oncology
trainee program in line with AMWAC recommendations;
advocate for reform and expansion of the training programs in radiotherapy and radiation
oncology physics;
facilitate the attraction of RTs and radiation oncology physicists back into the workforce;
advocate for the review of career structures to make it more attractive to retain staff within
the workforce;
remove the barriers to financial self-sustainability of the sector by revising the Price
Waterhouse Coopers cost model with appropriate staffing levels in line with an
accreditation model; and
removing the financial barriers to expansion of radiation oncology services into new sites
taking into account the cost of the physical establishment and start up period
(acknowledging the current moratorium on rural sites).
As can be seen, there is a degree of similarity in the issues covered, and the recommendations
made between the AHTAC, AMWAC and the RANZCR Tripartite Committee reports, with
the later document covering a broader range of issues.
4.2.4 Baume Inquiry - A vision for radiotherapy
In response to an announcement made by the Australian College of Radiologists claiming that
up to 10,000 cancer patients are missing out on radiotherapy the then Health Minister, Dr
Michael Wooldridge, announced a national inquiry into radiation treatment. The inquiry was
chaired by the Chancellor of the Australian National University - former Liberal Health
Minister - Professor Peter Baume. In June 2002, the Radiation Oncology Inquiry (ROI),
delivered its report, A vision for radiotherapy92
. The ROI made 96 recommendations, of
which there were five major recommendations. One of these related to workforce and was to
“take steps to improve workforce numbers by providing a better career path for RTs and
medical physicists, with better remuneration and recognition for their roles. The number of
entrants to these professions must also be increased. That is, we must increase simultaneously
recruitment to, and reduce attrition from, the workforce”.
91
ibid., p7 92 Baume P, chairperson. Radiation Oncology Inquiry. A vision for radiotherapy. Canberra, Commonwealth of Australia, 2002. Available at:
www.health.gov.au/roi/inquiry/report.htm.
Radiation Oncology Workforce Planning
Final Report Page 47
Many of the recommendations of the Baume Inquiry have been implemented, resulting in
considerable development in radiation oncology services around Australia. Nonetheless there
are still concerns that not all cancer patients who stand to benefit from the use of radiotherapy
at some time during their disease trajectory are receiving that treatment. Delaney et al93
have
estimated that based on current evidence, the best practice proportion is 52.3%, and the
RANZCR recently stated that the proportion of patients with cancer who receive radiotherapy
remains on average at about 35%94
. This workforce planning study and its associated data
collection provides an important opportunity to assess the situation some seven years on from
the Baume Inquiry and determine the exponent to which workforce issues are a barrier to
improving the access of patients with cancer to radiotherapy.
4.3 STATE/TERRITORY APPROACHES TO WORKFORCE PLANNING
This section presents information on the State/Territory Health Authorities plans and
initiatives relating to radiation oncology workforce planning. It was constructed by reviewing
publically available documentation, including State/Territory Cancer Plans, and consulting
with, and reviewing material provided by, State/Territory Health authority representatives.
4.3.1 New South Wales
Unlike other jurisdictions, NSW Health has for many years collected comprehensive data on
radiotherapy equipment, staffing, treatment and source of referral from all radiotherapy
facilities, both public and private, in NSW. Data are collected and processed using the NSW
Radiotherapy Management Information System (RMIS) which is managed by the Statewide
Services Development Branch within the NSW Health Department. Data from the
contributing centres is provided annually (calendar year). In addition, quarterly reports on
filled and vacant medical physicist positions and half yearly reports on filled and vacant RT
positions are submitted.
NSW Health accepts the nationally agreed planning parameter for radiotherapy services that
indicates that 52.3% of new cancer patients would benefit from treatment with radiotherapy.
The parameters used by NSW Health to inform radiotherapy service planning are a 25%
retreatment rate; 19 attendances per treatment course; 4.1 attendances per hour; 8 operating
hours per day; and 240 working days per annum. Use of these parameters results in an
expected throughput of 414 courses per linac per year, inclusive of 331 new courses per year.
As a result of the radiation oncology workforce shortages reported by the national Radiation
Oncology Inquiry in 2002, NSW Health has pursued a number of workforce development
strategies in the three key professions. The key strategies for ROs include:
funding a number of advanced trainees in RO positions since 2002 with the aim of
improving the recruitment and retention of the specialists; providing opportunities for
increased rotation and exposure to practice in a rural setting; and improving career
opportunities for trainees wishing to practice in a rural setting;
developing two Registrar Training Networks so registrar rotations will be more efficient;
93 Delaney G, Jacob S, Featherstone C and Barton M (2005). The role of radiotherapy in cancer treatment: Estimating optimal utilization
from a review of evidence-based clinical guidelines. Cancer, Volume 104, Issue 6 94 RANZCR Faculty of Radiation Oncology Submission to The National Health and Hospitals Reform Commission (NHHRC) on its Terms of Reference and Draft Principles for Australia‟s Health System (May 2008)
http://www.nhhrc.org.au/internet/nhhrc/publishing.nsf/Content/159/$FILE/159%20RANZCR%20Faculty%20of%20Radiation%20Oncology
%20Submission.pdf
Radiation Oncology Workforce Planning
Final Report Page 48
partnering regional facilities with metropolitan services to improve professional practice
and support networks (currently pursuing for the new Orange facility);
reviewing the area wide medical credentialing program (to ensure that ROs are
appropriately skilled for the local practice setting); and
recognising that continuing planning for the RO workforce will need to consider the
current age profile as well as the trend towards sub-specialisation.
For radiation therapists key strategies include:
overseas recruitment strategy in the early 2000‟s that assisted in dropping the RT vacancy
rate from about 25% to 2%;
funding 50 professional development year (PDY) positions and planning to continue with
the PDY support;
developing and embedding educator/tutor positions as part of the staffing complement in
each public facility;
improving salary packages and career structure;
supporting trained RTs to re-enter the workforce; and
supporting additional university places;
For radiation oncology medical physicists, NSW Health has been particularly active with the
key strategies including:
first Australian jurisdiction to implement the Training, Education and Accreditation
Program (TEAP) to ensure an adequately skilled and expert workforce;
providing funding to establish super numerary trainee positions for medical physicists
(currently looking to increase number of ROMP registrar positions);
increasing salary for accredited ROMPs (has improved retention rates);
establishing a clinical placement coordinator (for registrars);
funding a Chair of Medical Physics at University of Sydney (currently under review);
funding for scholarships and continuing professional development including supporting
attendance at overseas conferences;
overseas recruitment programs including funding for airfares and accommodation support;
currently examining the establishment of a peer support program with WA (would assist
in addressing shortage of ROMP staff in WA); and
developing a preceptor position with funding provided by DoHA (recruitment is in
progress, but proving difficult).
In addition NSW Health keeps in contact with relevant staff at the Universities through
having them participate on an Advisory Committee.
Through discussion with representatives of NSW Health a number of issues impacting on
workforce development and planning were identified including:
medical physicists are not currently on the “migration on demand” list which means there
are delays in recruiting overseas trained ROMPs into Australia;
there is a shortage of senior ROMPs in NSW, thereby increasing the risk of incidents;
there are current difficulties in recruiting ROMPs in some regional areas;
there are opportunities for RTs to get positions in NSW but many do not want to move
outside of Sydney; and
Radiation Oncology Workforce Planning
Final Report Page 49
the University of Sydney has changed their RTs course to a postgraduate program which
will result in a short term reduction in graduates that may be dealt with by University of
Newcastle increasing their intake.
It is also important to note that concurrent with this workforce planning study, the NSW
Auditor General undertook a performance review of radiotherapy services in NSW. In June
2009, NSW Health was presented with the Auditor General‟s report entitled95
„tackling cancer
with radiotherapy”. The objective of the audit was to determine how well NSW Health
manages the provision and delivery of radiotherapy services. The audit looked specifically at
whether services are located where they are needed and are adequately staffed, and that
resources are properly utilised. Specific conclusions relating to workforce planning included:
“generally there seemed to be enough staff, but that staffing levels varied considerably.
We found that there have been workforce shortages, both nationally and internationally,
that in the past have resulted in reduced productivity of radiotherapy machines. NSW
Health undertook a number of strategies to address the situation and in recent years
NSW vacancy rates have declined. These efforts need to be sustained to ensure
adequate staffing into the future.”
We observed that centres appear to have quite different staffing levels when related to
the throughput achieved. The reasons for such variations were not clear, but could be
due to more complex treatments, more training commitments and more involvement in
research. NSW Health needs a process to analyse this and establish the staffing
required at each centre.”
The report made 16 recommendations, four of which related directly to development of the
radiation oncology workforce in NSW. These recommendations are repeated below along
with the NSW Health response96
:
“develops a workload measure by June 2010 that facilitates comparison of centres with
different case-mixes and different techniques.”
NSW Health responded “Supported. A Basic Treatment Equivalent model has been
used previously with variable uptake by individual ROTCs”;
“analyses by December 2010 the variations of current staff levels between radiotherapy
centres and develops staffing profiles for each centre which reflect volume, case-mix and
complexity.”
NSW Health responded “Supported with qualification. Implementation will be
dependent on resources to undertake review”;
“establishes by June 2010 more realistic five year and 10 year treatment benchmarks for
each Area Health Service as a basis for assessing performance and planning the
expansion of facilities.”
NSW Health responded “Supported. Implementation will be facilitated through the
AHMAC Radiation Oncology Reform Implementation Committee”;
“develops and publishes by June 2010 a 10 year strategic plan for radiotherapy services,
noting that the progress of its implementation will be determined by resource and funding
availability.”
NSW Health responded “Supported.
95 Auditor-General‟s report (2009), Tackling cancer with radiotherapy, NSW Department of Health. 96 ibid., pp 12-13.
Radiation Oncology Workforce Planning
Final Report Page 50
4.3.2 Victoria
The Victorian Radiotherapy Service Plan97
was developed in 2006-07 as part of a national
initiative for all States/Territories to develop five-year strategic plans in radiotherapy. The
Plan takes the Integrated Cancer Services (ICS) as its focus and models demand for
radiotherapy across each ICS to 2011. The plan also seeks to identify longer-term
requirements for radiotherapy in Victoria by continuing forecasts at five-year intervals
through to 2021. Service requirements were modelled using parameters agreed upon by
Victorian radiotherapy service providers and forecasts of cancer incidence provided by the
Victorian Department of Human Services (DHS). Facilities in both the public and private
sectors were taken into account. The projections were based on the following parameters:
population projections to 2011 (calculated using a 1.8% annual increase in cancer
incidence – as calculated for the NSW population by Coory and Armstrong in 1998);
rate of 52% of new cases of cancer receiving radiotherapy;
rate of 25% of new cancers requiring re-treatment; and
average of 18.5 attendances per course; 4.1 attendances per hour; operating 8.5 hours per
day; working 240 days per year resulting in 450 courses per linac per year.
Application of these parameters resulted in a prediction of 39 linacs in 2006 and 44 linacs in
2011 being required in Victoria (note these projections can be compared to the actual number
of 36 linacs operating as at 31st December, 2008 derived from the facilities‟ survey). To
ensure that future radiotherapy service planning is based on accurate information, and to
inform ongoing quality and efficiency measures, one outcome of the planning process was a
decision that the Radiotherapy Minimum Dataset established for the National Radiotherapy
Single Machine Unit Trial Evaluation (at Ballarat) should be continued and expanded to
include all Victorian radiotherapy services. It is understood that data collection commenced
in December 2008 in the four public radiotherapy facilities.
Discussions with representatives of the DHS revealed that the Service and Workforce
Planning Branch in the Policy and Strategic Projects Division is currently undertaking a
project to inform workforce planning and policy in Victoria. The project aims to obtain a
better understanding of the workforce that delivers medical radiation services and develop
informed expectations about the workforce requirements to meet future demand for these
services. It is focusing on the medical physicist, medical radiation technologist, and medical
specialist workforces involved in the delivery of radiation oncology, diagnostic imaging and
nuclear medicine services, in both the public and private sectors, in Victoria. The project
includes the collection, analysis and modelling of comprehensive and accurate data on the
current and future demand and supply of medical specialists, medical radiation technologists
and medical physicists in the public and private sectors in Victoria.
DHS expects that the information collected will identify key workforce issues, demographics,
current shortages, and expected future challenges. An extensive environmental analysis is
also being conducted to investigate the factors that influence demand and supply for these
workforces. Projections that forecast the workforce market trends will be conducted to
understand the ongoing adequacy and capacity of the workforce to meet demand, and to guide
strategic workforce planning decisions now and into the future. The project completion date
is expected to be November 2009.
97 DHS (2007) Victorian Radiotherapy Service Plan http://www.health.vic.gov.au/radiotherapy/radiotherapy-service-plan06-11.pdf
Radiation Oncology Workforce Planning
Final Report Page 51
Discussions with DHS‟ representatives and other stakeholders (clinicians working in public
sector facilities and representatives of the relevant Universities) identified a number of other
radiation oncology workforce initiatives undertaken in Victoria including:
DHS funds RT intern year (equivalent to PDY in other jurisdictions) with “top up” from
hospital budgets;
funding for training wage for second year placements of the Monash University post
graduate RT program;
support for RT educator at each public facility to coordinate the training for clinical
placements and interns (PDYs), and to enable continuing professional development (CPD)
for staff;
CPD funding provided in 2005-06 so that RTs or ROMPs can undertake an education
activity e.g. attend conferences;
an allowance of $10K available to support relocation to work/train in some regional areas
(if all of $10K not needed to relocate balance can be used towards rental accommodation);
ROMPs provided with an extra 10% in remuneration if they work in some regional areas;
co-funding the ROMP registrar positions in public facilities so the registrar positions are
fully funded by government (balance funded by DoHA);
inclusion of some medical physics in the curriculum in the undergraduate physics course
at RMIT to make students aware of the specialty;
introduction of medical physics elective in the year 11 syllabus to assist in creating
awareness of career opportunities; and
investigations into the role of the nurse practitioner in radiation oncology.
Through discussion with stakeholders in Victorian radiotherapy facilities, it was identified
that the staffing for the RMIT masters of medical physics program has just been reduced due
to redundancies. This change had apparently placed pressure on the remaining university
staff and adjunct staff that deliver the course. As a result there may be some reduction in the
number of medical physics graduates from RMIT although in follow-up discussions RMIT
representatives, the project team was advised that the redundant position may be reinstated
next year. On that basis, the project team has not adjusted the forecasts of medical physics
graduates from La Trobe (developed by the project team working with La Trobe University
representatives using historical graduate numbers) used in the workforce planning model.
4.3.3 Queensland
The Queensland Statewide Cancer Treatment Services Plan states that “evidence indicates
52.3% of cancer patients may benefit from radiotherapy treatment”98. In the Plan it was
estimated that, as at 2007, only about 32% of cancer patients in Queensland receive radiation
treatment due to a lack of capacity and services. Given the recent expansion in statewide
capacity, particularly in the private sector, Queensland Health estimates that this ratio is
currently in the order of 40%. However, there remains a clear shortfall in the number of
linacs in Queensland. There is planned growth of six to eight linacs by 2012, which will
make a total of 34-36 linacs in Queensland.
As part of the Plan, Queensland Health has projected cancer services activity by area till 2016,
based on the level of activity in 2006 (number of courses and number of patient attendances)
98 Delaney GP, Jacob S, Featherstone C, Barton MB (2003) Radiotherapy in cancer care: estimating optimal utilisation from a review of
evidence-based clinical guidelines. Collaboration for Cancer Outcomes Research and Evaluation, Liverpool Hospital, Sydney, Australia.
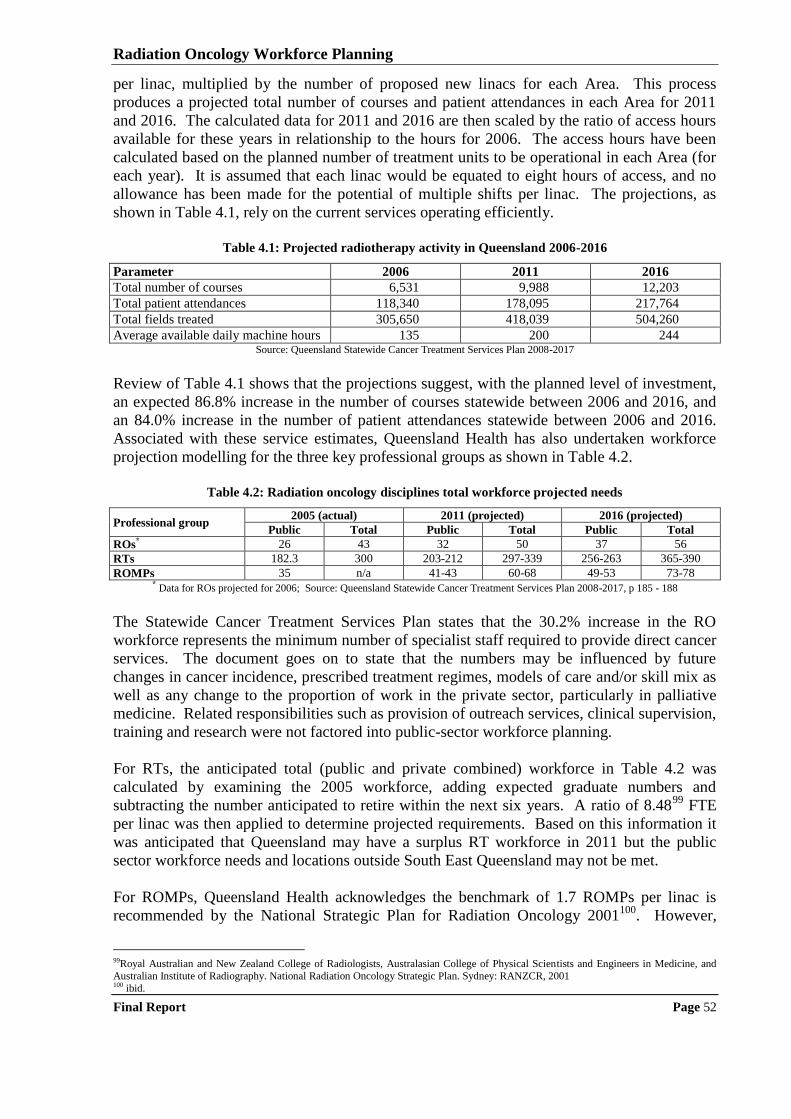
Radiation Oncology Workforce Planning
Final Report Page 52
per linac, multiplied by the number of proposed new linacs for each Area. This process
produces a projected total number of courses and patient attendances in each Area for 2011
and 2016. The calculated data for 2011 and 2016 are then scaled by the ratio of access hours
available for these years in relationship to the hours for 2006. The access hours have been
calculated based on the planned number of treatment units to be operational in each Area (for
each year). It is assumed that each linac would be equated to eight hours of access, and no
allowance has been made for the potential of multiple shifts per linac. The projections, as
shown in Table 4.1, rely on the current services operating efficiently.
Table 4.1: Projected radiotherapy activity in Queensland 2006-2016
Parameter 2006 2011 2016
Total number of courses 6,531 9,988 12,203
Total patient attendances 118,340 178,095 217,764
Total fields treated 305,650 418,039 504,260
Average available daily machine hours 135 200 244 Source: Queensland Statewide Cancer Treatment Services Plan 2008-2017
Review of Table 4.1 shows that the projections suggest, with the planned level of investment,
an expected 86.8% increase in the number of courses statewide between 2006 and 2016, and
an 84.0% increase in the number of patient attendances statewide between 2006 and 2016.
Associated with these service estimates, Queensland Health has also undertaken workforce
projection modelling for the three key professional groups as shown in Table 4.2.
Table 4.2: Radiation oncology disciplines total workforce projected needs
Professional group 2005 (actual) 2011 (projected) 2016 (projected)
Public Total Public Total Public Total
ROs* 26 43 32 50 37 56
RTs 182.3 300 203-212 297-339 256-263 365-390
ROMPs 35 n/a 41-43 60-68 49-53 73-78 * Data for ROs projected for 2006; Source: Queensland Statewide Cancer Treatment Services Plan 2008-2017, p 185 - 188
The Statewide Cancer Treatment Services Plan states that the 30.2% increase in the RO
workforce represents the minimum number of specialist staff required to provide direct cancer
services. The document goes on to state that the numbers may be influenced by future
changes in cancer incidence, prescribed treatment regimes, models of care and/or skill mix as
well as any change to the proportion of work in the private sector, particularly in palliative
medicine. Related responsibilities such as provision of outreach services, clinical supervision,
training and research were not factored into public-sector workforce planning.
For RTs, the anticipated total (public and private combined) workforce in Table 4.2 was
calculated by examining the 2005 workforce, adding expected graduate numbers and
subtracting the number anticipated to retire within the next six years. A ratio of 8.4899
FTE
per linac was then applied to determine projected requirements. Based on this information it
was anticipated that Queensland may have a surplus RT workforce in 2011 but the public
sector workforce needs and locations outside South East Queensland may not be met.
For ROMPs, Queensland Health acknowledges the benchmark of 1.7 ROMPs per linac is
recommended by the National Strategic Plan for Radiation Oncology 2001100
. However,
99Royal Australian and New Zealand College of Radiologists, Australasian College of Physical Scientists and Engineers in Medicine, and
Australian Institute of Radiography. National Radiation Oncology Strategic Plan. Sydney: RANZCR, 2001 100 ibid.
Radiation Oncology Workforce Planning
Final Report Page 53
although desirable, aiming for this figure was thought to be unachievable by the Queensland
Cancer Physics Collaborative in 2007 due to existing shortages and need to expand services.
Instead the Collaborative suggested planning for a current ratio of 1.2 ROMPs per linac whilst
aiming to steadily increase the ratio over the ensuing years. In line with this recommendation,
the projected workforce need for ROMPs in Table 4.2 is based on the existing workforce and
then applying the benchmark of 1.2 FTE ROMPs per linac. Even with this method, it was
forecast that an increase of more than 100% was needed from 2006 to 2016.
Discussions with representatives of Queensland Health indicate that current workforce
initiatives for ROs include:
creation of two radiation oncology advanced trainee (fellowship) positions since 2006
with the aim of improving the recruitment and retention of radiation oncology specialists;
15 Radiation Oncology registrars in training and two new positions created as at July 2009
– one of these new positions is for Townsville to support regional service development.
reviewing the medical specialist credentialing program;
overseas recruitment of ROs to strengthen the current workforce - two positions filled in
Townsville using this strategy; and
improved salary packages.
For RTs key strategies include:
permanent state funding to support up to 21 professional development year (PDY)
positions and plans to continue with the PDY support;
developing and embedding educator/tutor positions as part of the staffing complement in
each public facility;
improving salary packages and career structure;
developing a framework to support trained RTs to re-enter the workforce;
State funded RT research position established to build research capacity in the RT
profession; and
access to the Allied Health Learning and Development initiative which includes funding
for research fellowships, funding for attendance to present at international conferences
and mentoring programs.
For ROMPS key strategies include:
implementation of the TEAP to ensure an adequately skilled and expert workforce;
providing funding to establish three super numerary trainee medical physicist positions
from 2006 and increasing this number by an additional four positions as from 2010;
improving salary packages and career structure;
established and implemented a clinical placement coordinator position (for registrars);
funding a Cancer Physics Collaborative at Queensland University of Technology (to
promote clinical research amongst other activities);
funding for scholarships;
overseas recruitment programs as required;
appointment to a preceptor position with funding provided by DoHA; and
access to the Allied Health Learning and Development initiative which includes funding
for research fellowships, funding for attendance to present at international conferences
and mentoring programs.
Radiation Oncology Workforce Planning
Final Report Page 54
The discussions with Queensland Health representatives also revealed a number of issues
relating to workforce planning and development including:
difficulty in recruiting ROMPs to regional areas; and
difficulty in providing supervision for the ROMP training program due to supervisory
requirements and length of program – a strategy to address this issue is now being
implemented in partnership with ACPSEM.
4.3.4 Western Australia
The WA Health Cancer Services Framework (October 2005)101
states that “WA has some
strategies in place and has invested in a range of initiatives to promote retention and
recruitment to these professions” (referring to RTs, ROMPs and ROs). WA acknowledges
that the RANZCR has recommended 250 new cases a year as the acceptable workload for a
radiation oncologist, and has stated that each application for additional staff will be
considered based on current funding available taking the RANZCR benchmark staffing level
into consideration.
WA also acknowledges that the AIR has recommended 1.06 RTs per operating hour as a linac
staffing standard. The shortage of RTs in WA has been resolved by implementing a number
of initiatives including short, medium and long-term contracts to overseas RTs, Department of
Health (DOH) scholarships for WA students to train in South Australia; and some dedicated
PDY positions to facilitate new graduates obtaining their professional accreditation. A long-
term initiative for training RTs within WA in conjunction with Monash University in
Melbourne has proved very successful with students rotating between the public and private
facilities for their clinical practice while doing all their didactic work via distance learning.
WA also accepts the benchmark of 1.7 ROMPs per linac. The difficulty in WA is retaining
senior ROMPs due to many factors including workload, overseas salaries and research
opportunities in fully staffed centres interstate and overseas. A key factor in recruitment is
the access to research, teaching and new technologies. WA has implemented a recruitment
and retention allowance for senior qualified ROMPs in recognition of the essential role of this
profession in the radiation oncology team.
Discussions with representatives of the DOH in WA indicate that current workforce initiatives
for the three key professional groups include:
two additional radiation oncology registrars were added to the training establishment one
at RPH and one at SCGH;
one additional RO added to the staffing establishment in the public sector and one in the
private sector;
recruitment of RTs from overseas (mainly from Canada, England, Ireland and South
Africa) some coming on working visas and choosing to stay and successfully obtaining
permanent residency;
provision of a relocation costs reimbursement of $4,000 per RT as a short term incentive;
three PDY positions created and additional PDYs taken with the help of Commonwealth
funding many of which have been successful in obtaining permanent positions in WA.
101 WA Health Cancer Services Taskforce, (2005), WA Health Cancer Services Framework, Department of Health, Western Australia
Radiation Oncology Workforce Planning
Final Report Page 55
two part time RT clinical preceptors established with partial funding from the
Commonwealth to support students on undergraduate clinical placements from interstate,
PDYs and up skilling of qualified staff;
implementation of a career progression pathway for experienced RTs;
providing rotation opportunities for RTs through all clinical areas to make them more
likely to stay in WA; and
offering a 20% salary loading to medical physicists as a recruitment and retention
allowance, which also encouraged them to undertake ACPSEM accreditation.
The discussions with representatives of the DOH in WA also revealed a number of issues
relating to workforce planning and development including:
the remuneration in the collective agreement that can be offered is lower than that in other
jurisdictions;
long waiting lists for radiotherapy have been addressed by working extended hours;
there are difficulties in recruiting ROs because of heavier workload and lower
remuneration than in other jurisdictions;
private operators struggle to get ROs because they cannot offer the support provided
through having a registrar position or the resources to do research;
have to rely on overseas recruitment for WA facilities and recruiting from overseas is
slow due to Visa issues; and
no local undergraduate training program for RTs or ROMPs as they are not considered
financially viable in a geographically isolated state with a small population, however a
medical physics course will start at the University of Western Australia next year with the
support of DOH and the Commonwealth (DoHA).
4.3.5 South Australia
The SA Department of Health (SA Health) has developed a Radiation Oncology Service Plan.
The planning process included the development of a workforce planning model that is based
on assessing current workforce numbers against numbers of linacs to determine the workforce
ratio currently utilised within South Australia102
. This ratio can then be applied to future
service planning information regarding number of linacs (derived from population and cancer
incidence projections). Alternative staffing models were run based on benchmark ratios to
inform the work of the Cancer Network Group.
Issues considered by SA Health in determining the size of this workforce include103
:
training the required numbers, including consideration of attrition;
supervision of new graduates;
employment of new graduates (some may need to be supernumerary until other resources
are in place);
retention of new graduates in SA; and
integration of new technologies into the clinical setting.
As part of the development of the Radiation Oncology Service Plan, SA Health collated data
on current number of linacs, utilisation, operating times and staffing (FTE) for the two South
102 SA Department of Health, Unpublished Extract from Radiation Oncology Service Plan, provided by Jo Hoiles, SA Department of Health,
3rd March, 2009 103 ibid.
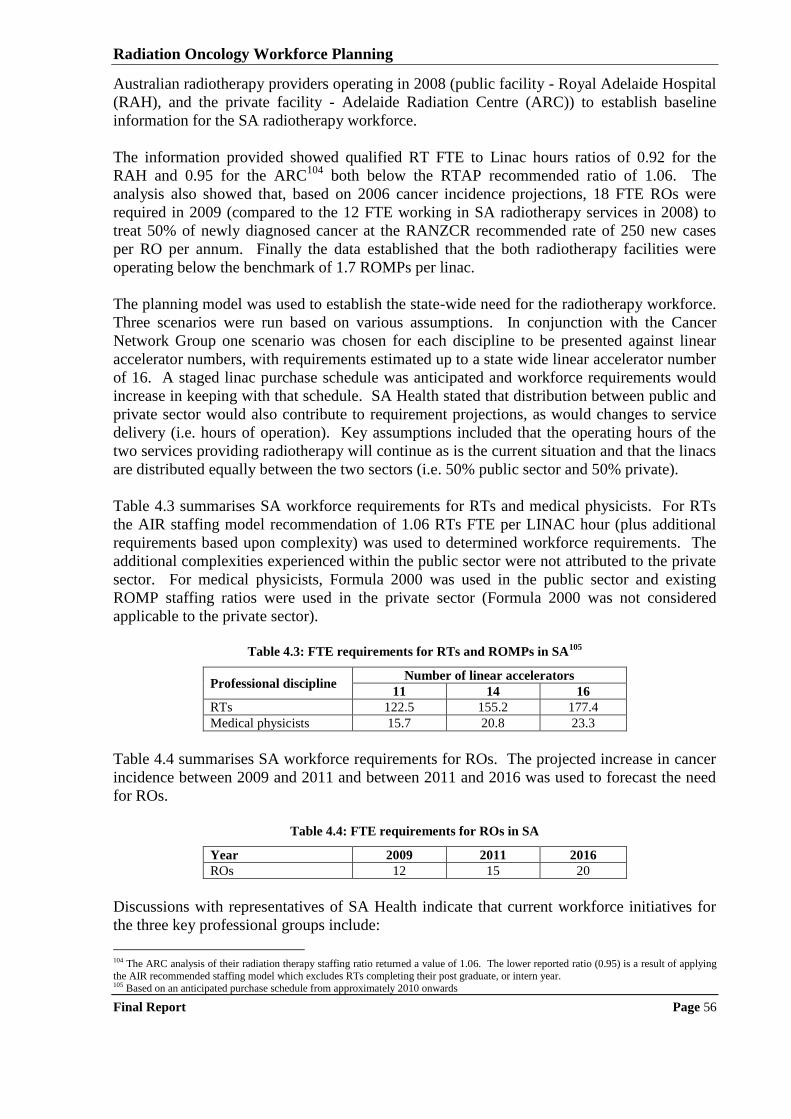
Radiation Oncology Workforce Planning
Final Report Page 56
Australian radiotherapy providers operating in 2008 (public facility - Royal Adelaide Hospital
(RAH), and the private facility - Adelaide Radiation Centre (ARC)) to establish baseline
information for the SA radiotherapy workforce.
The information provided showed qualified RT FTE to Linac hours ratios of 0.92 for the
RAH and 0.95 for the ARC104
both below the RTAP recommended ratio of 1.06. The
analysis also showed that, based on 2006 cancer incidence projections, 18 FTE ROs were
required in 2009 (compared to the 12 FTE working in SA radiotherapy services in 2008) to
treat 50% of newly diagnosed cancer at the RANZCR recommended rate of 250 new cases
per RO per annum. Finally the data established that the both radiotherapy facilities were
operating below the benchmark of 1.7 ROMPs per linac.
The planning model was used to establish the state-wide need for the radiotherapy workforce.
Three scenarios were run based on various assumptions. In conjunction with the Cancer
Network Group one scenario was chosen for each discipline to be presented against linear
accelerator numbers, with requirements estimated up to a state wide linear accelerator number
of 16. A staged linac purchase schedule was anticipated and workforce requirements would
increase in keeping with that schedule. SA Health stated that distribution between public and
private sector would also contribute to requirement projections, as would changes to service
delivery (i.e. hours of operation). Key assumptions included that the operating hours of the
two services providing radiotherapy will continue as is the current situation and that the linacs
are distributed equally between the two sectors (i.e. 50% public sector and 50% private).
Table 4.3 summarises SA workforce requirements for RTs and medical physicists. For RTs
the AIR staffing model recommendation of 1.06 RTs FTE per LINAC hour (plus additional
requirements based upon complexity) was used to determined workforce requirements. The
additional complexities experienced within the public sector were not attributed to the private
sector. For medical physicists, Formula 2000 was used in the public sector and existing
ROMP staffing ratios were used in the private sector (Formula 2000 was not considered
applicable to the private sector).
Table 4.3: FTE requirements for RTs and ROMPs in SA
105
Professional discipline Number of linear accelerators
11 14 16
RTs 122.5 155.2 177.4
Medical physicists 15.7 20.8 23.3
Table 4.4 summarises SA workforce requirements for ROs. The projected increase in cancer
incidence between 2009 and 2011 and between 2011 and 2016 was used to forecast the need
for ROs.
Table 4.4: FTE requirements for ROs in SA
Year 2009 2011 2016
ROs 12 15 20
Discussions with representatives of SA Health indicate that current workforce initiatives for
the three key professional groups include:
104 The ARC analysis of their radiation therapy staffing ratio returned a value of 1.06. The lower reported ratio (0.95) is a result of applying
the AIR recommended staffing model which excludes RTs completing their post graduate, or intern year. 105 Based on an anticipated purchase schedule from approximately 2010 onwards
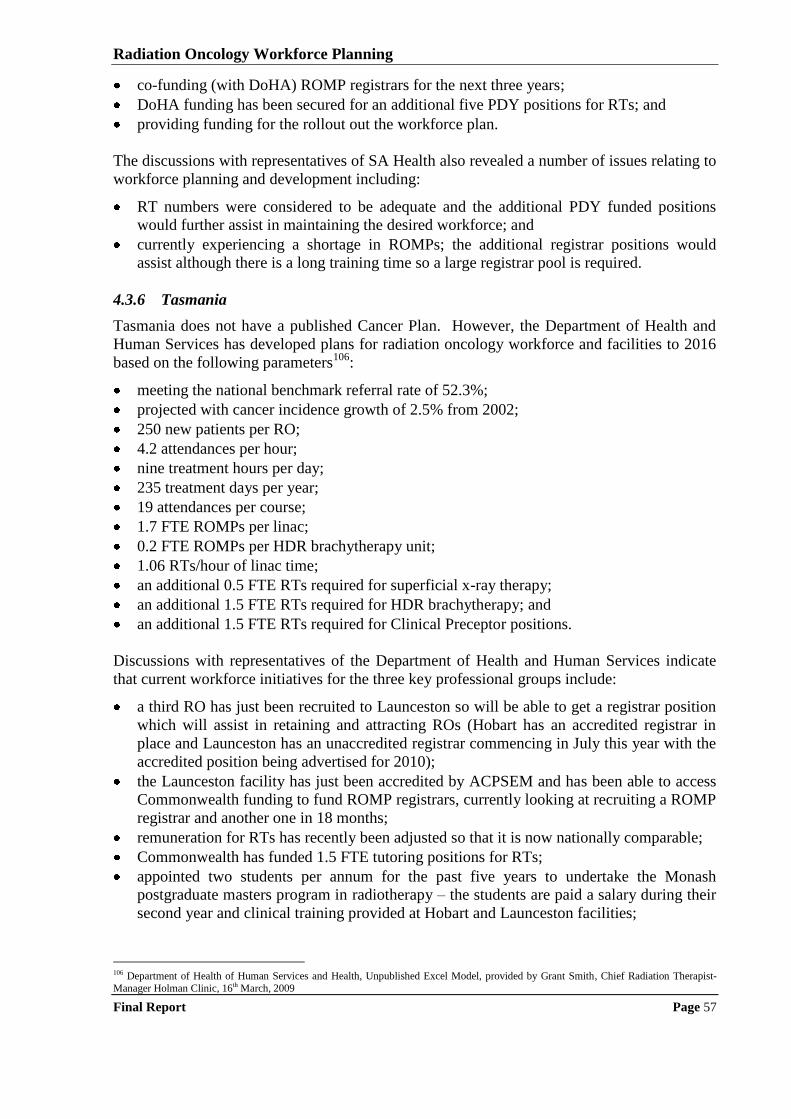
Radiation Oncology Workforce Planning
Final Report Page 57
co-funding (with DoHA) ROMP registrars for the next three years;
DoHA funding has been secured for an additional five PDY positions for RTs; and
providing funding for the rollout out the workforce plan.
The discussions with representatives of SA Health also revealed a number of issues relating to
workforce planning and development including:
RT numbers were considered to be adequate and the additional PDY funded positions
would further assist in maintaining the desired workforce; and
currently experiencing a shortage in ROMPs; the additional registrar positions would
assist although there is a long training time so a large registrar pool is required.
4.3.6 Tasmania
Tasmania does not have a published Cancer Plan. However, the Department of Health and
Human Services has developed plans for radiation oncology workforce and facilities to 2016
based on the following parameters106
:
meeting the national benchmark referral rate of 52.3%;
projected with cancer incidence growth of 2.5% from 2002;
250 new patients per RO;
4.2 attendances per hour;
nine treatment hours per day;
235 treatment days per year;
19 attendances per course;
1.7 FTE ROMPs per linac;
0.2 FTE ROMPs per HDR brachytherapy unit;
1.06 RTs/hour of linac time;
an additional 0.5 FTE RTs required for superficial x-ray therapy;
an additional 1.5 FTE RTs required for HDR brachytherapy; and
an additional 1.5 FTE RTs required for Clinical Preceptor positions.
Discussions with representatives of the Department of Health and Human Services indicate
that current workforce initiatives for the three key professional groups include:
a third RO has just been recruited to Launceston so will be able to get a registrar position
which will assist in retaining and attracting ROs (Hobart has an accredited registrar in
place and Launceston has an unaccredited registrar commencing in July this year with the
accredited position being advertised for 2010);
the Launceston facility has just been accredited by ACPSEM and has been able to access
Commonwealth funding to fund ROMP registrars, currently looking at recruiting a ROMP
registrar and another one in 18 months;
remuneration for RTs has recently been adjusted so that it is now nationally comparable;
Commonwealth has funded 1.5 FTE tutoring positions for RTs;
appointed two students per annum for the past five years to undertake the Monash
postgraduate masters program in radiotherapy – the students are paid a salary during their
second year and clinical training provided at Hobart and Launceston facilities;
106 Department of Health of Human Services and Health, Unpublished Excel Model, provided by Grant Smith, Chief Radiation Therapist-
Manager Holman Clinic, 16th March, 2009
Radiation Oncology Workforce Planning
Final Report Page 58
changed work practices so some radiotherapy nurses do clinical review work to relieve
workload pressure on ROs; and
also have trained RTs doing HDR brachytherapy planning whereas in other states this
work is typically done by ROMPs (RTs have always been involved with brachytherapy
planning at the Launceston Clinic).
The discussions with representatives of the Department of Health and Human Services also
revealed a number of issues relating to workforce planning and development including:
recruitment and retention issues for radiation oncology are similar to other regional areas;
once ROs are recruited to Tasmania they seem to stay and develop good arrangements
with private hospitals;
remuneration an issue for ROMPs, particularly given the recent changes in NSW;
currently have difficulty in recruiting ROMPs and are hoping that having ROMP
registrars will assist in attracting qualified ROMPs as well as contributing to the ongoing
development of the medical physicists workforce;
there is no local training program (University course) for RTs which impacts on
recruitment;
RT undergraduate clinical placements are available at both Launceston and Hobart which
has proven to be a good recruitment tool, however getting more difficult to attract students
because they are not earning while on placement and as they come from the mainland they
need to leave part time paid work which is not attractive for some;
specific funding for regional placements would assist in attracting and retaining staff in
regional facilities;
Tasmania has had dedicated PDY positions and have been able to recruit the incumbents
into permanent positions once they have fully qualified – with future expansion additional
qualified position will be created; and
there is a shortage of qualified (experienced) radiotherapists.
4.3.7 Australian Capital Territory
The ACT has one radiotherapy facility based at the Canberra Hospital. Over the last few
years, with the support of ACT Health, there has been a drive to recruit more ROs and
ROMPs to the service.
Discussions with representatives of the Canberra Hospital indicate that current workforce
initiatives for the three key professional groups include:
attempting to set up translational research and clinical trials and recruiting a data manager
to assist in the process and which will in turn attract staff;
implementation of the basic treatment equivalent (BTE) units as a tool for scheduling
patients which has assisted with staff stress levels;
an initiative to provide financial support to RTs ($1,250) for continuing professional
development (e.g. to attend conferences) is about to be implemented;
providing opportunity for RTs to work a nine day fortnight;
RTs and medical physicists have access to “study bank” which is a scheme provided by
ACT Health to support staff to undertake additional study; and
implementing separate pay scales for RTs and medical physicists that are above those
offered to other health professionals.
Radiation Oncology Workforce Planning
Final Report Page 59
The discussions with representatives of the Canberra Hospital also revealed a number of
issues relating to workforce planning and development including:
difficult to recruit because there is a perception that Canberra is isolated - once recruited
they seem to stay but difficult to attract initially;
unable to implement new technologies due to lack of staff time;
ageing RT staff, some are close to retirement; and
the remuneration that can be offered to medical physicists is lower than that in NSW
which is the direct competitor for medical physics staff.
4.3.8 Northern Territory
The Northern Territory does not currently have a radiotherapy service however a two bunker
radiation oncology facility is in the process of being built with opening scheduled for
February 2010. The facility will be privately run, however it will run on a hub and spoke
service model involving the staff from the Royal Adelaide Hospital (ROs RTs and ROMPs)
with support from the Royal Darwin Hospital (nursing, allied health and administrative staff).
The plan is for the Darwin facility to meet the radiation oncology needs for all Territorians so
the NT Government has purchased a 54 bed accommodation facility for patients who come to
Darwin for treatment. The facility will improve the access of patients with cancer to
radiotherapy treatment (currently about 22% of cancer patients receive radiotherapy).
Discussions with representatives of the Darwin radiation oncology service indicate that the
workforce will be based on the following parameters:
250 new patients per year per Radiation Oncologist;
six RTs plus practice manager/chief RT; and
one full-time physicist based in the NT with support from RAH.
The discussions with representatives of the Darwin radiation oncology service also revealed a
number of planned workforce initiatives including:
advertising for a ROMP worldwide;
offering six weeks annual leave and flights into and out of Darwin to attract staff;
paid accommodation for rotating staff (with SA and WA); and
working with the University for dual appointment opportunities (new medical school
opening in Darwin in 2012/13).
4.4 CONSULTATION WITH PROFESSIONAL BODY REPRESENTATIVES
The professional bodies (RANZCR, AIR and ACPSEM) not only assisted in the design,
distribution and follow-up of the survey of their members working in radiation oncology
services but were also consulted to discuss their approaches to workforce planning. This
section summarises the information gathered from the consultations with representatives of
the professional bodies.
4.4.1 The Royal Australian and New Zealand College of Radiologists (RANZCR)
The RANZCR is the oldest professional organisation for the promotion of the science and the
practice of the medical specialties of radiology and medical imaging (diagnostic and
interventional) and radiation oncology in Australia and New Zealand. The RANZCR‟s
mission is to promote, encourage and provide for the advancement of the study of radiology,
Radiation Oncology Workforce Planning
Final Report Page 60
radiation oncology and allied sciences and for the carrying out of research and experimental
work in connection with these sciences.
The RANZCR have recently implemented a new training curriculum which has not altered the
length of the training but provides more structure to the training of a radiation oncologist.
Representatives of the RANZCR advised that there is a change in demographic of radiation
oncology registrars with approximately 60% now being female. This change has resulted in
registrars taking longer (on average) to complete their training as female registrars often
undertake the fellowship program part time.
Representatives of RANZCR also advised that there has been an increase in competition for
registrar positions due to the increase in the number of medical graduates and the increasing
attraction of working as a radiation oncologist for females due to lifestyle factors.
Competition has also been heightened by the fact that there has also been no increase in
government funding available for registrar training positions. For this reason, representatives
of the RANZCR suggested that increased private sector involvement in training should be
encouraged as a strategy for increasing radiation oncologist numbers so long as private
facilities can deliver training to the standards set by the RANZCR.
Most radiation oncology registrars sit their fellowship exam at the end of their fourth year.
There has been no coordinated approach for finding placements for registrars to undertake
their fellowship year (final year) which has resulted in a number leaving Australia and going
to Canada, United Kingdom or the USA to complete their training and start their independent
practice careers. Representatives of RANZCR considered that a more coordinated approach
to fellowship year placements could see more registrars remaining in Australia.
The RANZCR consider that Australia is still heavily dependent on overseas radiation
oncology graduates. ROs are considered as an “area of need” for immigration purposes. To
alleviate the problem, representatives of RANZCR suggested that the development of a
network which places final year registrars would assist in retaining registrars in Australia and
also provide resources for regional/rural areas. The RANZCR supports training networks in
the new curriculum, thereby encouraging registrars to go to “less popular” facilities but there
is no compulsion as there is with some other Australian medical specialist training programs.
According to the RANZCR representative, some ROs are currently providing chemotherapy
services because the medical oncology workforce is in short supply, so radiation oncologists
fill this gap. This model is similar to the clinical oncologist role in the UK (where there is
dual training). If this model was to be adopted in Australia it could assist in filling the gap in
the medical oncology workforce but it could potentially create shortages in the radiation
oncologist workforce.
Overall, the RANZCR have no current workforce recruitment strategy in place. Demand for
registrar positions exceeds supply and there is no further funding available for registrar
positions. As already indicated, the RANZCR guidelines recommend a benchmark workload
of 250 new patients per RO per annum. Representatives of the RANZCR considered that the
figure may need review given the changes in methods of radiotherapy delivery and the fact
that equivalent overseas Colleges suggest the number should be less than 250.

Radiation Oncology Workforce Planning
Final Report Page 61
4.4.2 Australian Institute of Radiography
The Australian Institute of Radiography (AIR) is the national professional organisation
representing, radiographers, RTs (RTs) and sonographers in Australia. There were
approximately 5,000 AIR members in March 2009 and approximately 1,200 members were
RTs. The AIR advised that they believe that their membership list covers about 65% of
working RTs (including those undertaking their Professional Development Year (PDYs)).
This section summarises the views of the AIR on workforce planning for the RT profession.
The AIR stated that nationally Australia is well supplied with RTs. Their representatives
considered that the only recruitment difficulties with RTs were in some regional areas. As a
result of the Baume Inquiry additional funding was proved to Universities so more RTs could
be trained. AIR representatives considered that this strategy had been very successful and if
anything some states are verging on over supply. At the time, it was considered that perhaps
too many University places had been funded as there were more places in courses than the
number of available clinical placements in radiation oncology facilities.
In recent years the supply of RTs has not been an issue so there have been no workforce
planning projects initiated by the AIR. However the AIR suggests there should be
approximately 10 RTs per linac. This number can be used to estimate the needed RT
workforce if the number of linacs to be commissioned and year of commissioning is known.
However the supply of RTs needs to be well managed so as not to oversupply, otherwise
students will perceive there are no employment opportunities on completion of the degree and
will transfer into another course.
The AIR representatives observed that the current RT workforce is young, especially in
regional areas. Career development opportunities for the junior RTs appear to be limited as
the senior RTs are not moving out of the role. The AIR has focused working on investigating
substitution and advanced practitioner roles for RTs and has established the Advanced
Practice Working Group (APWG) in 2006. Advanced practitioner roles for RTs have been
developed in Canada and the UK. The APWG is currently in the consultation process with
both overseas advanced RT practitioners and RTs currently working in Australia.
Examples of advanced practitioner roles being considered include:
Quality Assessment/Quality Control/Quality Improvement Managers; and
Clinical Trials Liaison Officer – doctors don‟t have time to take patients through the
requirements of participating in a clinical trial and obtaining formal consent, so there is
the potential for a new role for an RT in Australia.
Examples of substitution roles being considered include:
adaptive radiotherapy 12 month course (funded by DHS) to train RTs to review images as
all machines are being equipped with imagining equipment and doctors will not have time
to review every image; and
treatment follow-up reviews currently being undertaken by ROs although already
undertaken by senior RT in some radiation oncology facilities around Australia.
Radiation Oncology Workforce Planning
Final Report Page 62
4.4.3 The Australasian College of Physical Scientists and Engineers in Medicine
The Australasian College of Physical Scientists and Engineers in Medicine (ACPSEM)
represents the professionals who provide a broad range of scientific and engineering services
to the medical community. The College‟s mission is to advance services and professional
standards in medical physics and biomedical engineering for the benefit and protection of the
community. The ACPSEM examines competencies in specialist areas and confers
accreditation in these fields.
One recommendation (no 63) of the Baume Inquiry was that ACPSEM develop a national
five year training program for ROMPs to be implemented in 2005. With support from DoHA
and some State Health Authorities, ACPSEM implemented the Training Education and
Accreditation Program (TEAP) in 2004. TEAP has provided a structured national training
pathway for ROMPs.
The ACPSEM representatives identified a number of workforce issues including:
there is an ageing workforce which means there will be a reduction in the average ROMP
experience in the next few years due to retirement – there is currently a high proportion of
younger ROMPs which is due to a failure to recruit in the past – this situation will
continue as there is a need to increase trainees to address the workforce shortages;
there are some mature age trainees, mainly people with Masters or PhDs in other areas of
physics coming into medical physics
higher levels of ROMP remuneration in NSW makes it difficult for public facilities in
other jurisdictions to recruit senior medical physicists – private facilities outside of NSW
have overcome this problem by offering the same remuneration levels;
a high proportion of medical physicists working in Australia are from overseas so
Australia could face a significant shortage if these individuals are attracted back to
practice in their home countries but as there are still vacancies in senior physicist
positions, more overseas ROMPs are needed; and
there is little professional recognition of ROMPs; they require the same number of years
in training as doctors but they are not a visible part of service provision; some progress is
being made through the Tripartite Committee valuing the work done by ROMPs but
national registration is needed to raise professional profile.
Attempts to address workforce shortages (many funded by the Commonwealth and/or State
Health Authorities) include:
Commonwealth, State and Private funded registrar training positions;
Commonwealth funded preceptor/trainer positions;
Commonwealth support to ACPSEM training program and CPD activities;
State support to ROMP CPD and educational opportunities;
Commonwealth funding support for external review of ROMP training;
Commonwealth funding support for undergraduate conference attendance and promotion
of medical physics;
ACPSEM have participated in ad-hoc university careers days but this needs to be more
firmly established; and
medical physicists automatically get 10 extra points on visa applications as identified as
“area of need”; ACPSEM reviews about 3 to 5 applications yearly;
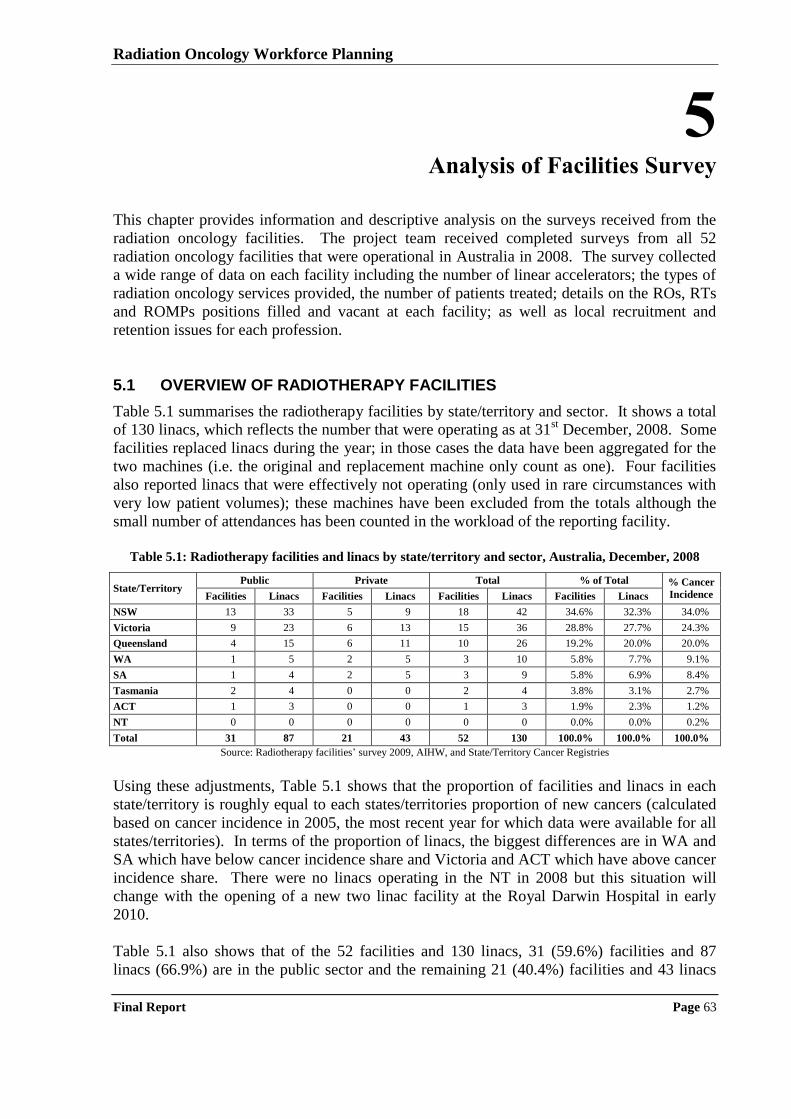
Radiation Oncology Workforce Planning
Final Report Page 63
5 Analysis of Facilities Survey
This chapter provides information and descriptive analysis on the surveys received from the
radiation oncology facilities. The project team received completed surveys from all 52
radiation oncology facilities that were operational in Australia in 2008. The survey collected
a wide range of data on each facility including the number of linear accelerators; the types of
radiation oncology services provided, the number of patients treated; details on the ROs, RTs
and ROMPs positions filled and vacant at each facility; as well as local recruitment and
retention issues for each profession.
5.1 OVERVIEW OF RADIOTHERAPY FACILITIES
Table 5.1 summarises the radiotherapy facilities by state/territory and sector. It shows a total
of 130 linacs, which reflects the number that were operating as at 31st December, 2008. Some
facilities replaced linacs during the year; in those cases the data have been aggregated for the
two machines (i.e. the original and replacement machine only count as one). Four facilities
also reported linacs that were effectively not operating (only used in rare circumstances with
very low patient volumes); these machines have been excluded from the totals although the
small number of attendances has been counted in the workload of the reporting facility.
Table 5.1: Radiotherapy facilities and linacs by state/territory and sector, Australia, December, 2008
State/Territory Public Private Total % of Total % Cancer
Incidence Facilities Linacs Facilities Linacs Facilities Linacs Facilities Linacs
NSW 13 33 5 9 18 42 34.6% 32.3% 34.0%
Victoria 9 23 6 13 15 36 28.8% 27.7% 24.3%
Queensland 4 15 6 11 10 26 19.2% 20.0% 20.0%
WA 1 5 2 5 3 10 5.8% 7.7% 9.1%
SA 1 4 2 5 3 9 5.8% 6.9% 8.4%
Tasmania 2 4 0 0 2 4 3.8% 3.1% 2.7%
ACT 1 3 0 0 1 3 1.9% 2.3% 1.2%
NT 0 0 0 0 0 0 0.0% 0.0% 0.2%
Total 31 87 21 43 52 130 100.0% 100.0% 100.0%
Source: Radiotherapy facilities‟ survey 2009, AIHW, and State/Territory Cancer Registries
Using these adjustments, Table 5.1 shows that the proportion of facilities and linacs in each
state/territory is roughly equal to each states/territories proportion of new cancers (calculated
based on cancer incidence in 2005, the most recent year for which data were available for all
states/territories). In terms of the proportion of linacs, the biggest differences are in WA and
SA which have below cancer incidence share and Victoria and ACT which have above cancer
incidence share. There were no linacs operating in the NT in 2008 but this situation will
change with the opening of a new two linac facility at the Royal Darwin Hospital in early
2010.
Table 5.1 also shows that of the 52 facilities and 130 linacs, 31 (59.6%) facilities and 87
linacs (66.9%) are in the public sector and the remaining 21 (40.4%) facilities and 43 linacs
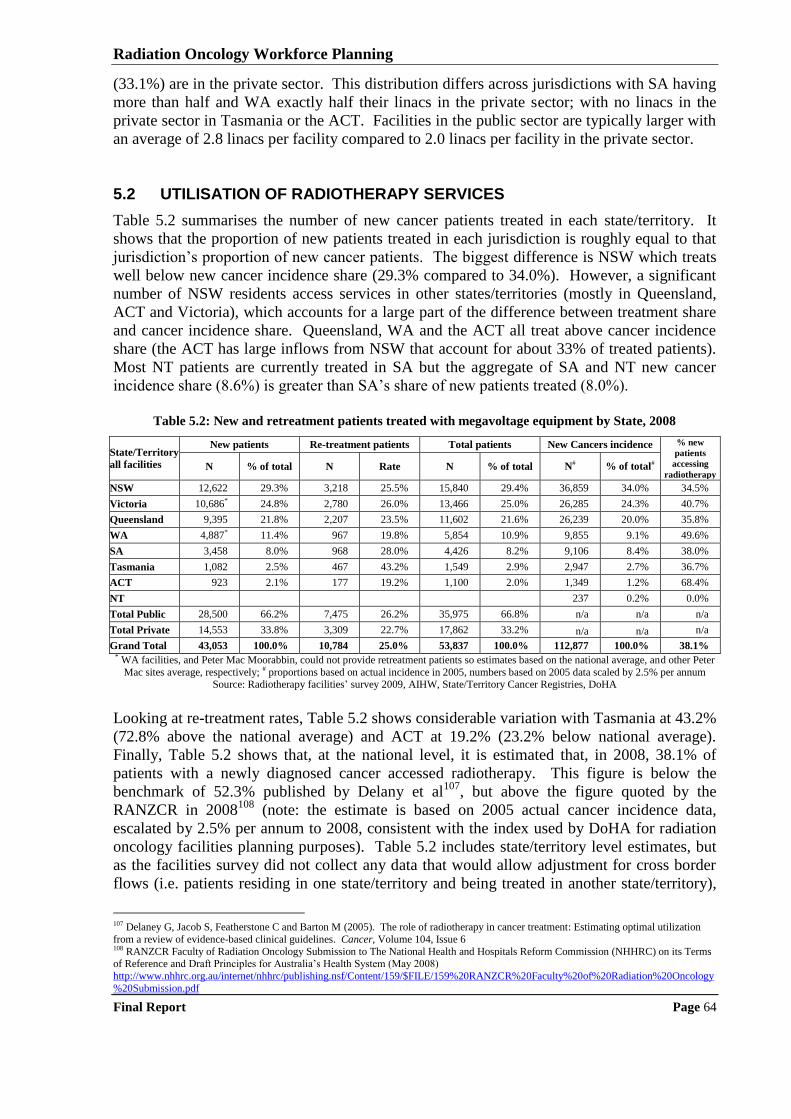
Radiation Oncology Workforce Planning
Final Report Page 64
(33.1%) are in the private sector. This distribution differs across jurisdictions with SA having
more than half and WA exactly half their linacs in the private sector; with no linacs in the
private sector in Tasmania or the ACT. Facilities in the public sector are typically larger with
an average of 2.8 linacs per facility compared to 2.0 linacs per facility in the private sector.
5.2 UTILISATION OF RADIOTHERAPY SERVICES
Table 5.2 summarises the number of new cancer patients treated in each state/territory. It
shows that the proportion of new patients treated in each jurisdiction is roughly equal to that
jurisdiction‟s proportion of new cancer patients. The biggest difference is NSW which treats
well below new cancer incidence share (29.3% compared to 34.0%). However, a significant
number of NSW residents access services in other states/territories (mostly in Queensland,
ACT and Victoria), which accounts for a large part of the difference between treatment share
and cancer incidence share. Queensland, WA and the ACT all treat above cancer incidence
share (the ACT has large inflows from NSW that account for about 33% of treated patients).
Most NT patients are currently treated in SA but the aggregate of SA and NT new cancer
incidence share (8.6%) is greater than SA‟s share of new patients treated (8.0%).
Table 5.2: New and retreatment patients treated with megavoltage equipment by State, 2008
State/Territory
all facilities
New patients Re-treatment patients Total patients New Cancers incidence % new
patients
accessing
radiotherapy N % of total N Rate N % of total N# % of total#
NSW 12,622 29.3% 3,218 25.5% 15,840 29.4% 36,859 34.0% 34.5%
Victoria 10,686* 24.8% 2,780 26.0% 13,466 25.0% 26,285 24.3% 40.7%
Queensland 9,395 21.8% 2,207 23.5% 11,602 21.6% 26,239 20.0% 35.8%
WA 4,887* 11.4% 967 19.8% 5,854 10.9% 9,855 9.1% 49.6%
SA 3,458 8.0% 968 28.0% 4,426 8.2% 9,106 8.4% 38.0%
Tasmania 1,082 2.5% 467 43.2% 1,549 2.9% 2,947 2.7% 36.7%
ACT 923 2.1% 177 19.2% 1,100 2.0% 1,349 1.2% 68.4%
NT 237 0.2% 0.0%
Total Public 28,500 66.2% 7,475 26.2% 35,975 66.8% n/a n/a n/a
Total Private 14,553 33.8% 3,309 22.7% 17,862 33.2% n/a n/a n/a
Grand Total 43,053 100.0% 10,784 25.0% 53,837 100.0% 112,877 100.0% 38.1% * WA facilities, and Peter Mac Moorabbin, could not provide retreatment patients so estimates based on the national average, and other Peter
Mac sites average, respectively; # proportions based on actual incidence in 2005, numbers based on 2005 data scaled by 2.5% per annum Source: Radiotherapy facilities‟ survey 2009, AIHW, State/Territory Cancer Registries, DoHA
Looking at re-treatment rates, Table 5.2 shows considerable variation with Tasmania at 43.2%
(72.8% above the national average) and ACT at 19.2% (23.2% below national average).
Finally, Table 5.2 shows that, at the national level, it is estimated that, in 2008, 38.1% of
patients with a newly diagnosed cancer accessed radiotherapy. This figure is below the
benchmark of 52.3% published by Delany et al107
, but above the figure quoted by the
RANZCR in 2008108
(note: the estimate is based on 2005 actual cancer incidence data,
escalated by 2.5% per annum to 2008, consistent with the index used by DoHA for radiation
oncology facilities planning purposes). Table 5.2 includes state/territory level estimates, but
as the facilities survey did not collect any data that would allow adjustment for cross border
flows (i.e. patients residing in one state/territory and being treated in another state/territory),
107 Delaney G, Jacob S, Featherstone C and Barton M (2005). The role of radiotherapy in cancer treatment: Estimating optimal utilization
from a review of evidence-based clinical guidelines. Cancer, Volume 104, Issue 6 108 RANZCR Faculty of Radiation Oncology Submission to The National Health and Hospitals Reform Commission (NHHRC) on its Terms of Reference and Draft Principles for Australia‟s Health System (May 2008)
http://www.nhhrc.org.au/internet/nhhrc/publishing.nsf/Content/159/$FILE/159%20RANZCR%20Faculty%20of%20Radiation%20Oncology
%20Submission.pdf
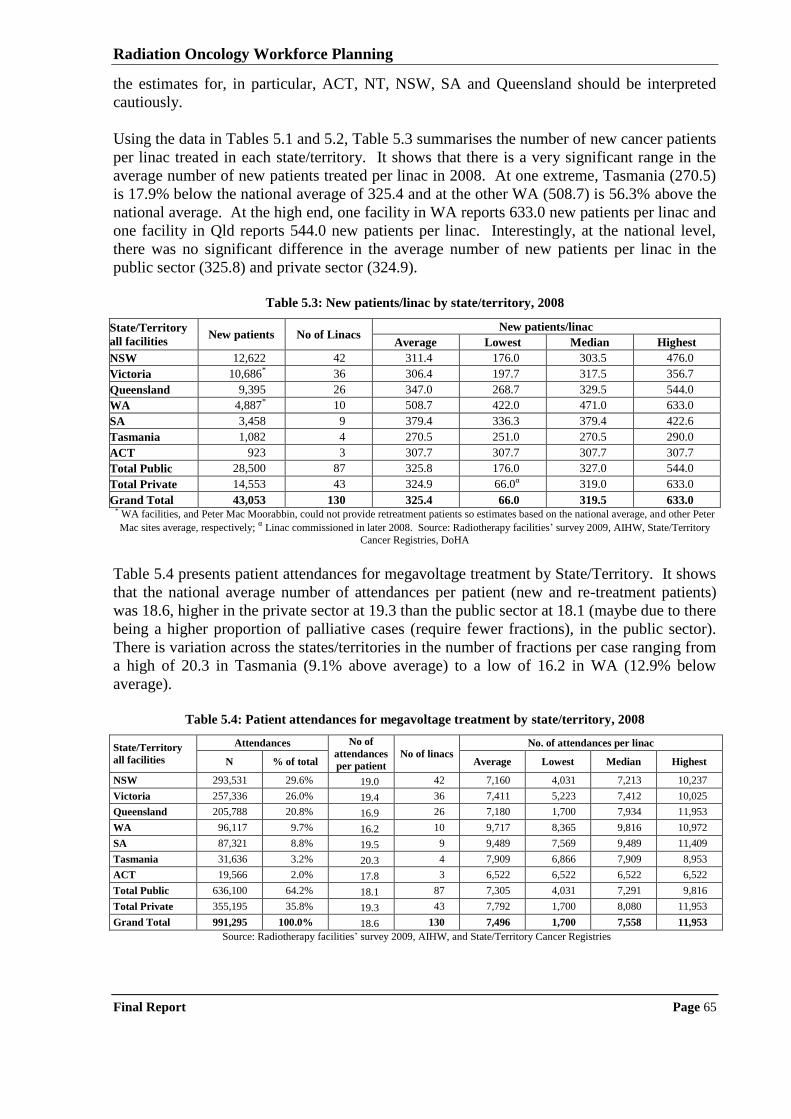
Radiation Oncology Workforce Planning
Final Report Page 65
the estimates for, in particular, ACT, NT, NSW, SA and Queensland should be interpreted
cautiously.
Using the data in Tables 5.1 and 5.2, Table 5.3 summarises the number of new cancer patients
per linac treated in each state/territory. It shows that there is a very significant range in the
average number of new patients treated per linac in 2008. At one extreme, Tasmania (270.5)
is 17.9% below the national average of 325.4 and at the other WA (508.7) is 56.3% above the
national average. At the high end, one facility in WA reports 633.0 new patients per linac and
one facility in Qld reports 544.0 new patients per linac. Interestingly, at the national level,
there was no significant difference in the average number of new patients per linac in the
public sector (325.8) and private sector (324.9).
Table 5.3: New patients/linac by state/territory, 2008
State/Territory
all facilities New patients No of Linacs
New patients/linac
Average Lowest Median Highest
NSW 12,622 42 311.4 176.0 303.5 476.0
Victoria 10,686* 36 306.4 197.7 317.5 356.7
Queensland 9,395 26 347.0 268.7 329.5 544.0
WA 4,887* 10 508.7 422.0 471.0 633.0
SA 3,458 9 379.4 336.3 379.4 422.6
Tasmania 1,082 4 270.5 251.0 270.5 290.0
ACT 923 3 307.7 307.7 307.7 307.7
Total Public 28,500 87 325.8 176.0 327.0 544.0
Total Private 14,553 43 324.9 66.0α 319.0 633.0
Grand Total 43,053 130 325.4 66.0 319.5 633.0 * WA facilities, and Peter Mac Moorabbin, could not provide retreatment patients so estimates based on the national average, and other Peter
Mac sites average, respectively; α Linac commissioned in later 2008. Source: Radiotherapy facilities‟ survey 2009, AIHW, State/Territory
Cancer Registries, DoHA
Table 5.4 presents patient attendances for megavoltage treatment by State/Territory. It shows
that the national average number of attendances per patient (new and re-treatment patients)
was 18.6, higher in the private sector at 19.3 than the public sector at 18.1 (maybe due to there
being a higher proportion of palliative cases (require fewer fractions), in the public sector).
There is variation across the states/territories in the number of fractions per case ranging from
a high of 20.3 in Tasmania (9.1% above average) to a low of 16.2 in WA (12.9% below
average).
Table 5.4: Patient attendances for megavoltage treatment by state/territory, 2008
State/Territory
all facilities
Attendances No of
attendances
per patient
No of linacs No. of attendances per linac
N % of total Average Lowest Median Highest
NSW 293,531 29.6% 19.0 42 7,160 4,031 7,213 10,237
Victoria 257,336 26.0% 19.4 36 7,411 5,223 7,412 10,025
Queensland 205,788 20.8% 16.9 26 7,180 1,700 7,934 11,953
WA 96,117 9.7% 16.2 10 9,717 8,365 9,816 10,972
SA 87,321 8.8% 19.5 9 9,489 7,569 9,489 11,409
Tasmania 31,636 3.2% 20.3 4 7,909 6,866 7,909 8,953
ACT 19,566 2.0% 17.8 3 6,522 6,522 6,522 6,522
Total Public 636,100 64.2% 18.1 87 7,305 4,031 7,291 9,816
Total Private 355,195 35.8% 19.3 43 7,792 1,700 8,080 11,953
Grand Total 991,295 100.0% 18.6 130 7,496 1,700 7,558 11,953
Source: Radiotherapy facilities‟ survey 2009, AIHW, and State/Territory Cancer Registries
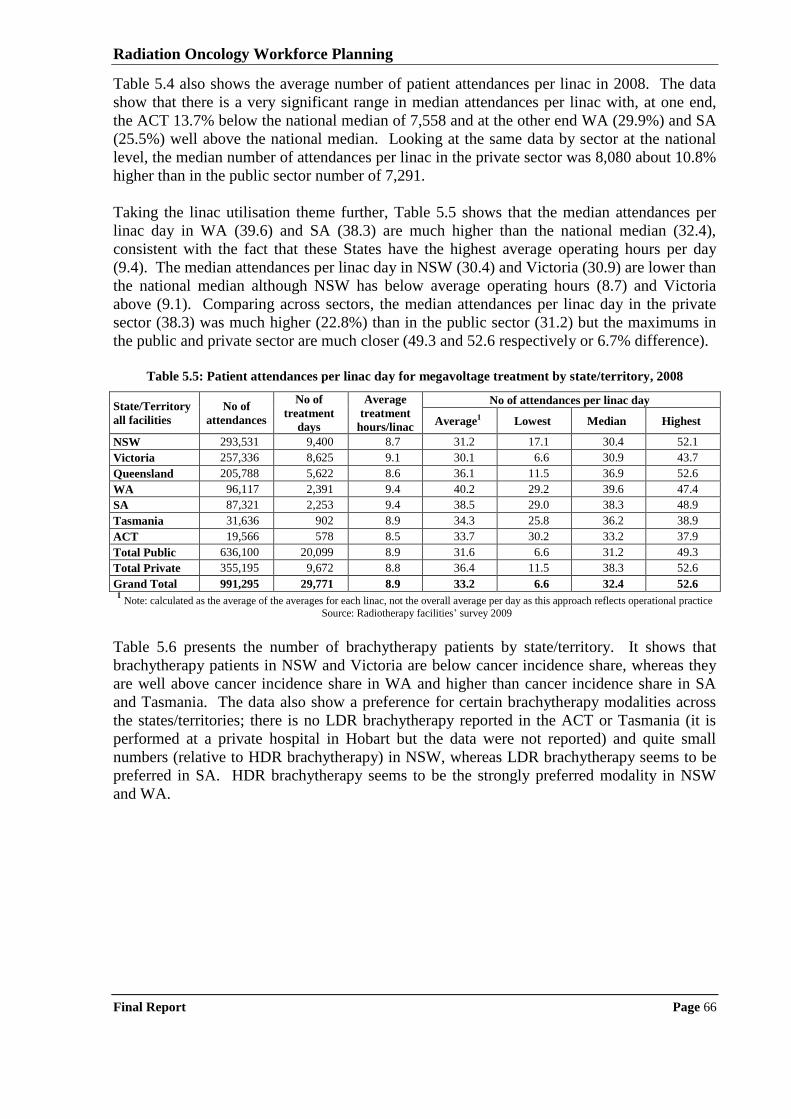
Radiation Oncology Workforce Planning
Final Report Page 66
Table 5.4 also shows the average number of patient attendances per linac in 2008. The data
show that there is a very significant range in median attendances per linac with, at one end,
the ACT 13.7% below the national median of 7,558 and at the other end WA (29.9%) and SA
(25.5%) well above the national median. Looking at the same data by sector at the national
level, the median number of attendances per linac in the private sector was 8,080 about 10.8%
higher than in the public sector number of 7,291.
Taking the linac utilisation theme further, Table 5.5 shows that the median attendances per
linac day in WA (39.6) and SA (38.3) are much higher than the national median (32.4),
consistent with the fact that these States have the highest average operating hours per day
(9.4). The median attendances per linac day in NSW (30.4) and Victoria (30.9) are lower than
the national median although NSW has below average operating hours (8.7) and Victoria
above (9.1). Comparing across sectors, the median attendances per linac day in the private
sector (38.3) was much higher (22.8%) than in the public sector (31.2) but the maximums in
the public and private sector are much closer (49.3 and 52.6 respectively or 6.7% difference).
Table 5.5: Patient attendances per linac day for megavoltage treatment by state/territory, 2008
State/Territory
all facilities
No of
attendances
No of
treatment
days
Average
treatment
hours/linac
No of attendances per linac day
Average1 Lowest Median Highest
NSW 293,531 9,400 8.7 31.2 17.1 30.4 52.1
Victoria 257,336 8,625 9.1 30.1 6.6 30.9 43.7
Queensland 205,788 5,622 8.6 36.1 11.5 36.9 52.6
WA 96,117 2,391 9.4 40.2 29.2 39.6 47.4
SA 87,321 2,253 9.4 38.5 29.0 38.3 48.9
Tasmania 31,636 902 8.9 34.3 25.8 36.2 38.9
ACT 19,566 578 8.5 33.7 30.2 33.2 37.9
Total Public 636,100 20,099 8.9 31.6 6.6 31.2 49.3
Total Private 355,195 9,672 8.8 36.4 11.5 38.3 52.6
Grand Total 991,295 29,771 8.9 33.2 6.6 32.4 52.6 1 Note: calculated as the average of the averages for each linac, not the overall average per day as this approach reflects operational practice
Source: Radiotherapy facilities‟ survey 2009
Table 5.6 presents the number of brachytherapy patients by state/territory. It shows that
brachytherapy patients in NSW and Victoria are below cancer incidence share, whereas they
are well above cancer incidence share in WA and higher than cancer incidence share in SA
and Tasmania. The data also show a preference for certain brachytherapy modalities across
the states/territories; there is no LDR brachytherapy reported in the ACT or Tasmania (it is
performed at a private hospital in Hobart but the data were not reported) and quite small
numbers (relative to HDR brachytherapy) in NSW, whereas LDR brachytherapy seems to be
preferred in SA. HDR brachytherapy seems to be the strongly preferred modality in NSW
and WA.
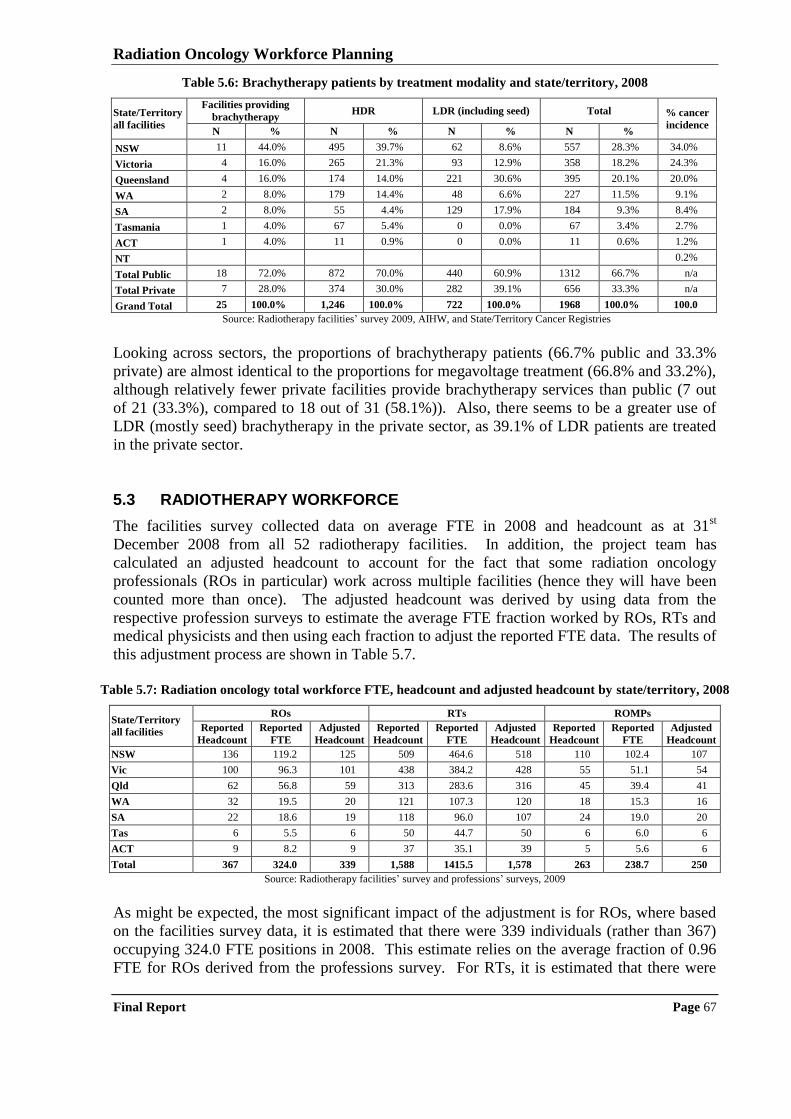
Radiation Oncology Workforce Planning
Final Report Page 67
Table 5.6: Brachytherapy patients by treatment modality and state/territory, 2008
State/Territory
all facilities
Facilities providing
brachytherapy HDR LDR (including seed) Total % cancer
incidence N % N % N % N %
NSW 11 44.0% 495 39.7% 62 8.6% 557 28.3% 34.0%
Victoria 4 16.0% 265 21.3% 93 12.9% 358 18.2% 24.3%
Queensland 4 16.0% 174 14.0% 221 30.6% 395 20.1% 20.0%
WA 2 8.0% 179 14.4% 48 6.6% 227 11.5% 9.1%
SA 2 8.0% 55 4.4% 129 17.9% 184 9.3% 8.4%
Tasmania 1 4.0% 67 5.4% 0 0.0% 67 3.4% 2.7%
ACT 1 4.0% 11 0.9% 0 0.0% 11 0.6% 1.2%
NT 0.2%
Total Public 18 72.0% 872 70.0% 440 60.9% 1312 66.7% n/a
Total Private 7 28.0% 374 30.0% 282 39.1% 656 33.3% n/a
Grand Total 25 100.0% 1,246 100.0% 722 100.0% 1968 100.0% 100.0
Source: Radiotherapy facilities‟ survey 2009, AIHW, and State/Territory Cancer Registries
Looking across sectors, the proportions of brachytherapy patients (66.7% public and 33.3%
private) are almost identical to the proportions for megavoltage treatment (66.8% and 33.2%),
although relatively fewer private facilities provide brachytherapy services than public (7 out
of 21 (33.3%), compared to 18 out of 31 (58.1%)). Also, there seems to be a greater use of
LDR (mostly seed) brachytherapy in the private sector, as 39.1% of LDR patients are treated
in the private sector.
5.3 RADIOTHERAPY WORKFORCE
The facilities survey collected data on average FTE in 2008 and headcount as at 31st
December 2008 from all 52 radiotherapy facilities. In addition, the project team has
calculated an adjusted headcount to account for the fact that some radiation oncology
professionals (ROs in particular) work across multiple facilities (hence they will have been
counted more than once). The adjusted headcount was derived by using data from the
respective profession surveys to estimate the average FTE fraction worked by ROs, RTs and
medical physicists and then using each fraction to adjust the reported FTE data. The results of
this adjustment process are shown in Table 5.7.
Table 5.7: Radiation oncology total workforce FTE, headcount and adjusted headcount by state/territory, 2008
State/Territory
all facilities
ROs RTs ROMPs
Reported
Headcount
Reported
FTE
Adjusted
Headcount
Reported
Headcount
Reported
FTE
Adjusted
Headcount
Reported
Headcount
Reported
FTE
Adjusted
Headcount
NSW 136 119.2 125 509 464.6 518 110 102.4 107
Vic 100 96.3 101 438 384.2 428 55 51.1 54
Qld 62 56.8 59 313 283.6 316 45 39.4 41
WA 32 19.5 20 121 107.3 120 18 15.3 16
SA 22 18.6 19 118 96.0 107 24 19.0 20
Tas 6 5.5 6 50 44.7 50 6 6.0 6
ACT 9 8.2 9 37 35.1 39 5 5.6 6
Total 367 324.0 339 1,588 1415.5 1,578 263 238.7 250
Source: Radiotherapy facilities‟ survey and professions‟ surveys, 2009
As might be expected, the most significant impact of the adjustment is for ROs, where based
on the facilities survey data, it is estimated that there were 339 individuals (rather than 367)
occupying 324.0 FTE positions in 2008. This estimate relies on the average fraction of 0.96
FTE for ROs derived from the professions survey. For RTs, it is estimated that there were
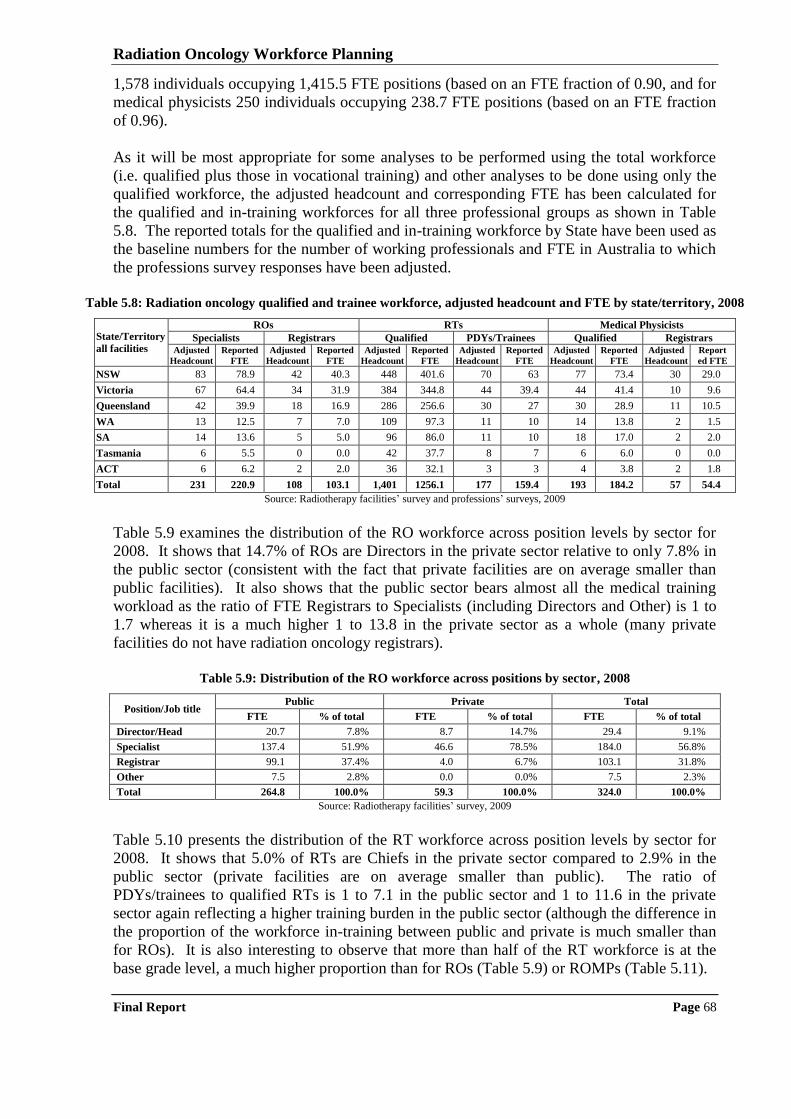
Radiation Oncology Workforce Planning
Final Report Page 68
1,578 individuals occupying 1,415.5 FTE positions (based on an FTE fraction of 0.90, and for
medical physicists 250 individuals occupying 238.7 FTE positions (based on an FTE fraction
of 0.96).
As it will be most appropriate for some analyses to be performed using the total workforce
(i.e. qualified plus those in vocational training) and other analyses to be done using only the
qualified workforce, the adjusted headcount and corresponding FTE has been calculated for
the qualified and in-training workforces for all three professional groups as shown in Table
5.8. The reported totals for the qualified and in-training workforce by State have been used as
the baseline numbers for the number of working professionals and FTE in Australia to which
the professions survey responses have been adjusted.
Table 5.8: Radiation oncology qualified and trainee workforce, adjusted headcount and FTE by state/territory, 2008
State/Territory
all facilities
ROs RTs Medical Physicists
Specialists Registrars Qualified PDYs/Trainees Qualified Registrars Adjusted
Headcount
Reported
FTE
Adjusted
Headcount
Reported
FTE
Adjusted
Headcount
Reported
FTE
Adjusted
Headcount
Reported
FTE
Adjusted
Headcount
Reported
FTE
Adjusted
Headcount
Report
ed FTE
NSW 83 78.9 42 40.3 448 401.6 70 63 77 73.4 30 29.0
Victoria 67 64.4 34 31.9 384 344.8 44 39.4 44 41.4 10 9.6
Queensland 42 39.9 18 16.9 286 256.6 30 27 30 28.9 11 10.5
WA 13 12.5 7 7.0 109 97.3 11 10 14 13.8 2 1.5
SA 14 13.6 5 5.0 96 86.0 11 10 18 17.0 2 2.0
Tasmania 6 5.5 0 0.0 42 37.7 8 7 6 6.0 0 0.0
ACT 6 6.2 2 2.0 36 32.1 3 3 4 3.8 2 1.8
Total 231 220.9 108 103.1 1,401 1256.1 177 159.4 193 184.2 57 54.4
Source: Radiotherapy facilities‟ survey and professions‟ surveys, 2009
Table 5.9 examines the distribution of the RO workforce across position levels by sector for
2008. It shows that 14.7% of ROs are Directors in the private sector relative to only 7.8% in
the public sector (consistent with the fact that private facilities are on average smaller than
public facilities). It also shows that the public sector bears almost all the medical training
workload as the ratio of FTE Registrars to Specialists (including Directors and Other) is 1 to
1.7 whereas it is a much higher 1 to 13.8 in the private sector as a whole (many private
facilities do not have radiation oncology registrars).
Table 5.9: Distribution of the RO workforce across positions by sector, 2008
Position/Job title Public Private Total
FTE % of total FTE % of total FTE % of total
Director/Head 20.7 7.8% 8.7 14.7% 29.4 9.1%
Specialist 137.4 51.9% 46.6 78.5% 184.0 56.8%
Registrar 99.1 37.4% 4.0 6.7% 103.1 31.8%
Other 7.5 2.8% 0.0 0.0% 7.5 2.3%
Total 264.8 100.0% 59.3 100.0% 324.0 100.0%
Source: Radiotherapy facilities‟ survey, 2009
Table 5.10 presents the distribution of the RT workforce across position levels by sector for
2008. It shows that 5.0% of RTs are Chiefs in the private sector compared to 2.9% in the
public sector (private facilities are on average smaller than public). The ratio of
PDYs/trainees to qualified RTs is 1 to 7.1 in the public sector and 1 to 11.6 in the private
sector again reflecting a higher training burden in the public sector (although the difference in
the proportion of the workforce in-training between public and private is much smaller than
for ROs). It is also interesting to observe that more than half of the RT workforce is at the
base grade level, a much higher proportion than for ROs (Table 5.9) or ROMPs (Table 5.11).
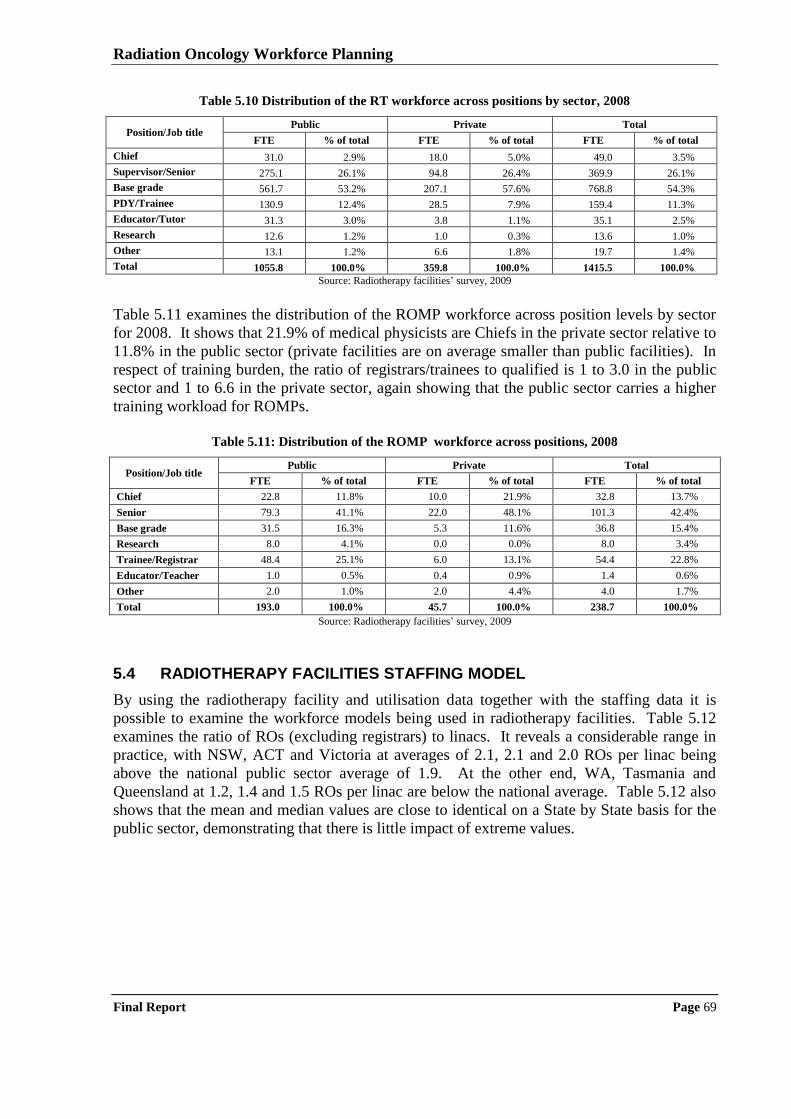
Radiation Oncology Workforce Planning
Final Report Page 69
Table 5.10 Distribution of the RT workforce across positions by sector, 2008
Position/Job title Public Private Total
FTE % of total FTE % of total FTE % of total
Chief 31.0 2.9% 18.0 5.0% 49.0 3.5%
Supervisor/Senior 275.1 26.1% 94.8 26.4% 369.9 26.1%
Base grade 561.7 53.2% 207.1 57.6% 768.8 54.3%
PDY/Trainee 130.9 12.4% 28.5 7.9% 159.4 11.3%
Educator/Tutor 31.3 3.0% 3.8 1.1% 35.1 2.5%
Research 12.6 1.2% 1.0 0.3% 13.6 1.0%
Other 13.1 1.2% 6.6 1.8% 19.7 1.4%
Total 1055.8 100.0% 359.8 100.0% 1415.5 100.0%
Source: Radiotherapy facilities‟ survey, 2009
Table 5.11 examines the distribution of the ROMP workforce across position levels by sector
for 2008. It shows that 21.9% of medical physicists are Chiefs in the private sector relative to
11.8% in the public sector (private facilities are on average smaller than public facilities). In
respect of training burden, the ratio of registrars/trainees to qualified is 1 to 3.0 in the public
sector and 1 to 6.6 in the private sector, again showing that the public sector carries a higher
training workload for ROMPs.
Table 5.11: Distribution of the ROMP workforce across positions, 2008
Position/Job title Public Private Total
FTE % of total FTE % of total FTE % of total
Chief 22.8 11.8% 10.0 21.9% 32.8 13.7%
Senior 79.3 41.1% 22.0 48.1% 101.3 42.4%
Base grade 31.5 16.3% 5.3 11.6% 36.8 15.4%
Research 8.0 4.1% 0.0 0.0% 8.0 3.4%
Trainee/Registrar 48.4 25.1% 6.0 13.1% 54.4 22.8%
Educator/Teacher 1.0 0.5% 0.4 0.9% 1.4 0.6%
Other 2.0 1.0% 2.0 4.4% 4.0 1.7%
Total 193.0 100.0% 45.7 100.0% 238.7 100.0%
Source: Radiotherapy facilities‟ survey, 2009
5.4 RADIOTHERAPY FACILITIES STAFFING MODEL
By using the radiotherapy facility and utilisation data together with the staffing data it is
possible to examine the workforce models being used in radiotherapy facilities. Table 5.12
examines the ratio of ROs (excluding registrars) to linacs. It reveals a considerable range in
practice, with NSW, ACT and Victoria at averages of 2.1, 2.1 and 2.0 ROs per linac being
above the national public sector average of 1.9. At the other end, WA, Tasmania and
Queensland at 1.2, 1.4 and 1.5 ROs per linac are below the national average. Table 5.12 also
shows that the mean and median values are close to identical on a State by State basis for the
public sector, demonstrating that there is little impact of extreme values.
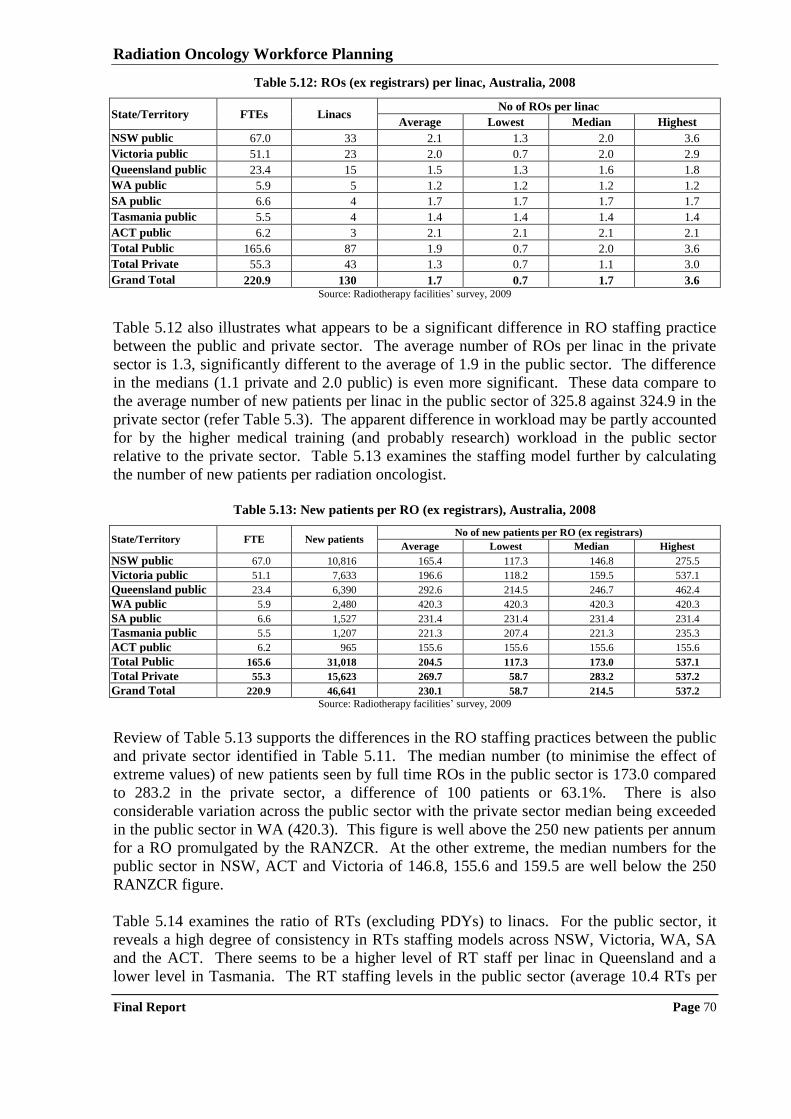
Radiation Oncology Workforce Planning
Final Report Page 70
Table 5.12: ROs (ex registrars) per linac, Australia, 2008
State/Territory FTEs Linacs No of ROs per linac
Average Lowest Median Highest
NSW public 67.0 33 2.1 1.3 2.0 3.6
Victoria public 51.1 23 2.0 0.7 2.0 2.9
Queensland public 23.4 15 1.5 1.3 1.6 1.8
WA public 5.9 5 1.2 1.2 1.2 1.2
SA public 6.6 4 1.7 1.7 1.7 1.7
Tasmania public 5.5 4 1.4 1.4 1.4 1.4
ACT public 6.2 3 2.1 2.1 2.1 2.1
Total Public 165.6 87 1.9 0.7 2.0 3.6
Total Private 55.3 43 1.3 0.7 1.1 3.0
Grand Total 220.9 130 1.7 0.7 1.7 3.6 Source: Radiotherapy facilities‟ survey, 2009
Table 5.12 also illustrates what appears to be a significant difference in RO staffing practice
between the public and private sector. The average number of ROs per linac in the private
sector is 1.3, significantly different to the average of 1.9 in the public sector. The difference
in the medians (1.1 private and 2.0 public) is even more significant. These data compare to
the average number of new patients per linac in the public sector of 325.8 against 324.9 in the
private sector (refer Table 5.3). The apparent difference in workload may be partly accounted
for by the higher medical training (and probably research) workload in the public sector
relative to the private sector. Table 5.13 examines the staffing model further by calculating
the number of new patients per radiation oncologist.
Table 5.13: New patients per RO (ex registrars), Australia, 2008
State/Territory FTE New patients No of new patients per RO (ex registrars)
Average Lowest Median Highest
NSW public 67.0 10,816 165.4 117.3 146.8 275.5
Victoria public 51.1 7,633 196.6 118.2 159.5 537.1
Queensland public 23.4 6,390 292.6 214.5 246.7 462.4
WA public 5.9 2,480 420.3 420.3 420.3 420.3
SA public 6.6 1,527 231.4 231.4 231.4 231.4
Tasmania public 5.5 1,207 221.3 207.4 221.3 235.3
ACT public 6.2 965 155.6 155.6 155.6 155.6
Total Public 165.6 31,018 204.5 117.3 173.0 537.1
Total Private 55.3 15,623 269.7 58.7 283.2 537.2
Grand Total 220.9 46,641 230.1 58.7 214.5 537.2
Source: Radiotherapy facilities‟ survey, 2009
Review of Table 5.13 supports the differences in the RO staffing practices between the public
and private sector identified in Table 5.11. The median number (to minimise the effect of
extreme values) of new patients seen by full time ROs in the public sector is 173.0 compared
to 283.2 in the private sector, a difference of 100 patients or 63.1%. There is also
considerable variation across the public sector with the private sector median being exceeded
in the public sector in WA (420.3). This figure is well above the 250 new patients per annum
for a RO promulgated by the RANZCR. At the other extreme, the median numbers for the
public sector in NSW, ACT and Victoria of 146.8, 155.6 and 159.5 are well below the 250
RANZCR figure.
Table 5.14 examines the ratio of RTs (excluding PDYs) to linacs. For the public sector, it
reveals a high degree of consistency in RTs staffing models across NSW, Victoria, WA, SA
and the ACT. There seems to be a higher level of RT staff per linac in Queensland and a
lower level in Tasmania. The RT staffing levels in the public sector (average 10.4 RTs per
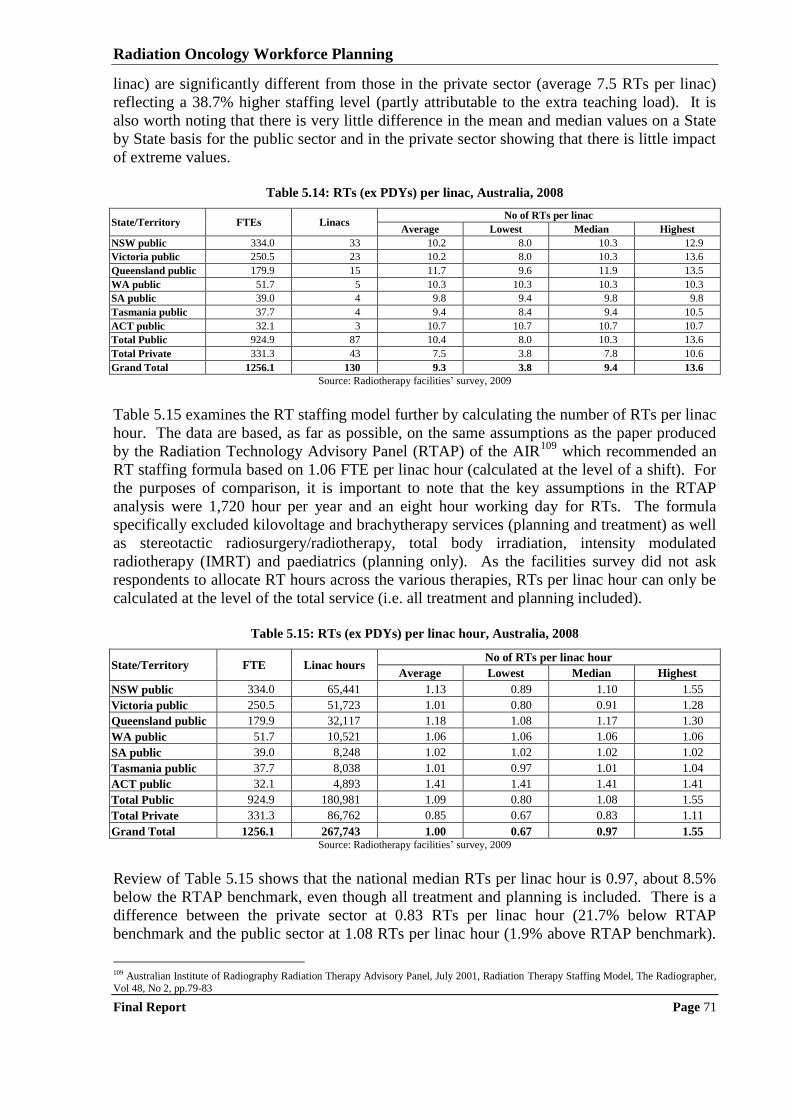
Radiation Oncology Workforce Planning
Final Report Page 71
linac) are significantly different from those in the private sector (average 7.5 RTs per linac)
reflecting a 38.7% higher staffing level (partly attributable to the extra teaching load). It is
also worth noting that there is very little difference in the mean and median values on a State
by State basis for the public sector and in the private sector showing that there is little impact
of extreme values.
Table 5.14: RTs (ex PDYs) per linac, Australia, 2008
State/Territory FTEs Linacs No of RTs per linac
Average Lowest Median Highest
NSW public 334.0 33 10.2 8.0 10.3 12.9
Victoria public 250.5 23 10.2 8.0 10.3 13.6
Queensland public 179.9 15 11.7 9.6 11.9 13.5
WA public 51.7 5 10.3 10.3 10.3 10.3
SA public 39.0 4 9.8 9.4 9.8 9.8
Tasmania public 37.7 4 9.4 8.4 9.4 10.5
ACT public 32.1 3 10.7 10.7 10.7 10.7
Total Public 924.9 87 10.4 8.0 10.3 13.6
Total Private 331.3 43 7.5 3.8 7.8 10.6
Grand Total 1256.1 130 9.3 3.8 9.4 13.6
Source: Radiotherapy facilities‟ survey, 2009
Table 5.15 examines the RT staffing model further by calculating the number of RTs per linac
hour. The data are based, as far as possible, on the same assumptions as the paper produced
by the Radiation Technology Advisory Panel (RTAP) of the AIR109
which recommended an
RT staffing formula based on 1.06 FTE per linac hour (calculated at the level of a shift). For
the purposes of comparison, it is important to note that the key assumptions in the RTAP
analysis were 1,720 hour per year and an eight hour working day for RTs. The formula
specifically excluded kilovoltage and brachytherapy services (planning and treatment) as well
as stereotactic radiosurgery/radiotherapy, total body irradiation, intensity modulated
radiotherapy (IMRT) and paediatrics (planning only). As the facilities survey did not ask
respondents to allocate RT hours across the various therapies, RTs per linac hour can only be
calculated at the level of the total service (i.e. all treatment and planning included).
Table 5.15: RTs (ex PDYs) per linac hour, Australia, 2008
State/Territory FTE Linac hours No of RTs per linac hour
Average Lowest Median Highest
NSW public 334.0 65,441 1.13 0.89 1.10 1.55
Victoria public 250.5 51,723 1.01 0.80 0.91 1.28
Queensland public 179.9 32,117 1.18 1.08 1.17 1.30
WA public 51.7 10,521 1.06 1.06 1.06 1.06
SA public 39.0 8,248 1.02 1.02 1.02 1.02
Tasmania public 37.7 8,038 1.01 0.97 1.01 1.04
ACT public 32.1 4,893 1.41 1.41 1.41 1.41
Total Public 924.9 180,981 1.09 0.80 1.08 1.55
Total Private 331.3 86,762 0.85 0.67 0.83 1.11
Grand Total 1256.1 267,743 1.00 0.67 0.97 1.55 Source: Radiotherapy facilities‟ survey, 2009
Review of Table 5.15 shows that the national median RTs per linac hour is 0.97, about 8.5%
below the RTAP benchmark, even though all treatment and planning is included. There is a
difference between the private sector at 0.83 RTs per linac hour (21.7% below RTAP
benchmark and the public sector at 1.08 RTs per linac hour (1.9% above RTAP benchmark).
109 Australian Institute of Radiography Radiation Therapy Advisory Panel, July 2001, Radiation Therapy Staffing Model, The Radiographer,
Vol 48, No 2, pp.79-83
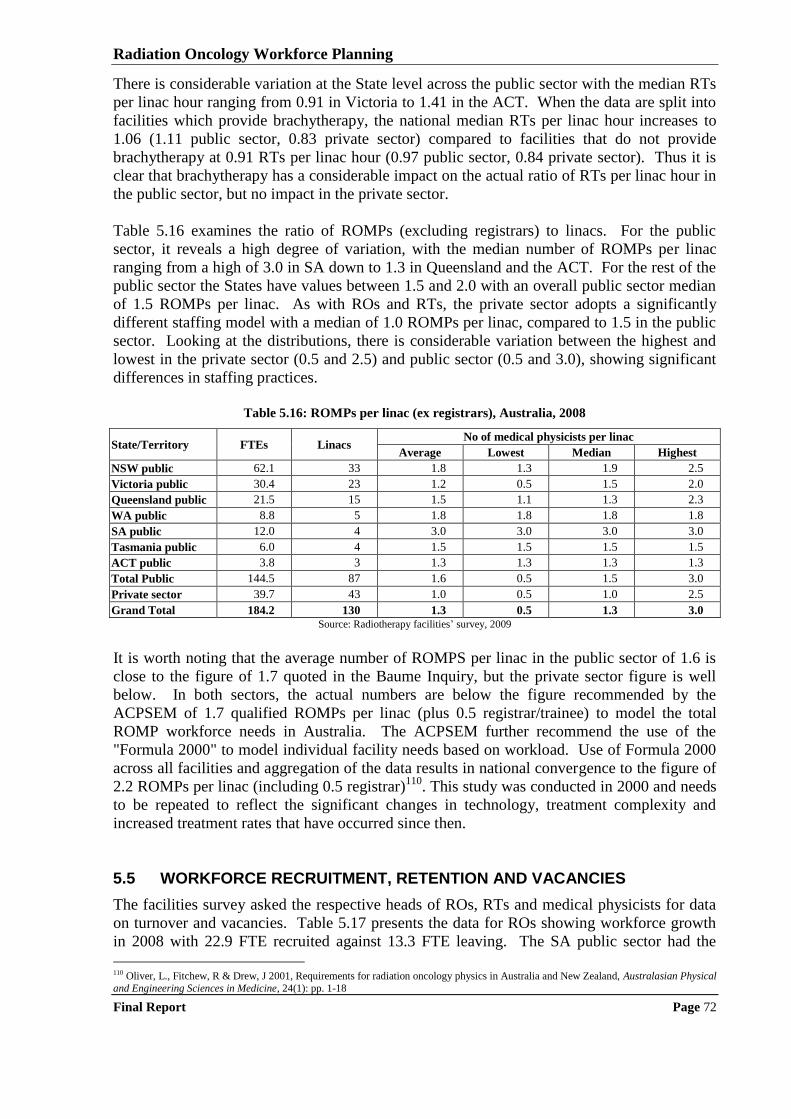
Radiation Oncology Workforce Planning
Final Report Page 72
There is considerable variation at the State level across the public sector with the median RTs
per linac hour ranging from 0.91 in Victoria to 1.41 in the ACT. When the data are split into
facilities which provide brachytherapy, the national median RTs per linac hour increases to
1.06 (1.11 public sector, 0.83 private sector) compared to facilities that do not provide
brachytherapy at 0.91 RTs per linac hour (0.97 public sector, 0.84 private sector). Thus it is
clear that brachytherapy has a considerable impact on the actual ratio of RTs per linac hour in
the public sector, but no impact in the private sector.
Table 5.16 examines the ratio of ROMPs (excluding registrars) to linacs. For the public
sector, it reveals a high degree of variation, with the median number of ROMPs per linac
ranging from a high of 3.0 in SA down to 1.3 in Queensland and the ACT. For the rest of the
public sector the States have values between 1.5 and 2.0 with an overall public sector median
of 1.5 ROMPs per linac. As with ROs and RTs, the private sector adopts a significantly
different staffing model with a median of 1.0 ROMPs per linac, compared to 1.5 in the public
sector. Looking at the distributions, there is considerable variation between the highest and
lowest in the private sector (0.5 and 2.5) and public sector (0.5 and 3.0), showing significant
differences in staffing practices.
Table 5.16: ROMPs per linac (ex registrars), Australia, 2008
State/Territory FTEs Linacs No of medical physicists per linac
Average Lowest Median Highest
NSW public 62.1 33 1.8 1.3 1.9 2.5
Victoria public 30.4 23 1.2 0.5 1.5 2.0
Queensland public 21.5 15 1.5 1.1 1.3 2.3
WA public 8.8 5 1.8 1.8 1.8 1.8
SA public 12.0 4 3.0 3.0 3.0 3.0
Tasmania public 6.0 4 1.5 1.5 1.5 1.5
ACT public 3.8 3 1.3 1.3 1.3 1.3
Total Public 144.5 87 1.6 0.5 1.5 3.0
Private sector 39.7 43 1.0 0.5 1.0 2.5
Grand Total 184.2 130 1.3 0.5 1.3 3.0
Source: Radiotherapy facilities‟ survey, 2009
It is worth noting that the average number of ROMPS per linac in the public sector of 1.6 is
close to the figure of 1.7 quoted in the Baume Inquiry, but the private sector figure is well
below. In both sectors, the actual numbers are below the figure recommended by the
ACPSEM of 1.7 qualified ROMPs per linac (plus 0.5 registrar/trainee) to model the total
ROMP workforce needs in Australia. The ACPSEM further recommend the use of the
"Formula 2000" to model individual facility needs based on workload. Use of Formula 2000
across all facilities and aggregation of the data results in national convergence to the figure of
2.2 ROMPs per linac (including 0.5 registrar)110
. This study was conducted in 2000 and needs
to be repeated to reflect the significant changes in technology, treatment complexity and
increased treatment rates that have occurred since then.
5.5 WORKFORCE RECRUITMENT, RETENTION AND VACANCIES
The facilities survey asked the respective heads of ROs, RTs and medical physicists for data
on turnover and vacancies. Table 5.17 presents the data for ROs showing workforce growth
in 2008 with 22.9 FTE recruited against 13.3 FTE leaving. The SA public sector had the
110 Oliver, L., Fitchew, R & Drew, J 2001, Requirements for radiation oncology physics in Australia and New Zealand, Australasian Physical
and Engineering Sciences in Medicine, 24(1): pp. 1-18
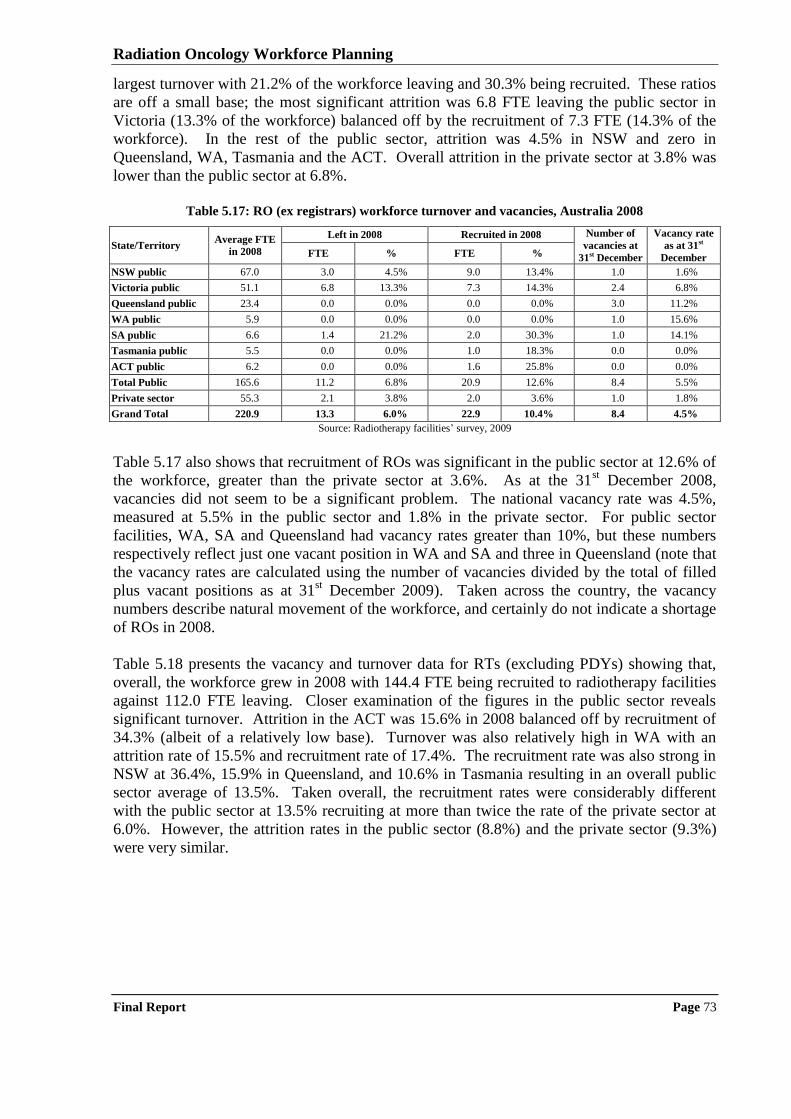
Radiation Oncology Workforce Planning
Final Report Page 73
largest turnover with 21.2% of the workforce leaving and 30.3% being recruited. These ratios
are off a small base; the most significant attrition was 6.8 FTE leaving the public sector in
Victoria (13.3% of the workforce) balanced off by the recruitment of 7.3 FTE (14.3% of the
workforce). In the rest of the public sector, attrition was 4.5% in NSW and zero in
Queensland, WA, Tasmania and the ACT. Overall attrition in the private sector at 3.8% was
lower than the public sector at 6.8%.
Table 5.17: RO (ex registrars) workforce turnover and vacancies, Australia 2008
State/Territory Average FTE
in 2008
Left in 2008 Recruited in 2008 Number of
vacancies at
31st December
Vacancy rate
as at 31st
December FTE % FTE %
NSW public 67.0 3.0 4.5% 9.0 13.4% 1.0 1.6%
Victoria public 51.1 6.8 13.3% 7.3 14.3% 2.4 6.8%
Queensland public 23.4 0.0 0.0% 0.0 0.0% 3.0 11.2%
WA public 5.9 0.0 0.0% 0.0 0.0% 1.0 15.6%
SA public 6.6 1.4 21.2% 2.0 30.3% 1.0 14.1%
Tasmania public 5.5 0.0 0.0% 1.0 18.3% 0.0 0.0%
ACT public 6.2 0.0 0.0% 1.6 25.8% 0.0 0.0%
Total Public 165.6 11.2 6.8% 20.9 12.6% 8.4 5.5%
Private sector 55.3 2.1 3.8% 2.0 3.6% 1.0 1.8%
Grand Total 220.9 13.3 6.0% 22.9 10.4% 8.4 4.5%
Source: Radiotherapy facilities‟ survey, 2009
Table 5.17 also shows that recruitment of ROs was significant in the public sector at 12.6% of
the workforce, greater than the private sector at 3.6%. As at the 31st December 2008,
vacancies did not seem to be a significant problem. The national vacancy rate was 4.5%,
measured at 5.5% in the public sector and 1.8% in the private sector. For public sector
facilities, WA, SA and Queensland had vacancy rates greater than 10%, but these numbers
respectively reflect just one vacant position in WA and SA and three in Queensland (note that
the vacancy rates are calculated using the number of vacancies divided by the total of filled
plus vacant positions as at 31st December 2009). Taken across the country, the vacancy
numbers describe natural movement of the workforce, and certainly do not indicate a shortage
of ROs in 2008.
Table 5.18 presents the vacancy and turnover data for RTs (excluding PDYs) showing that,
overall, the workforce grew in 2008 with 144.4 FTE being recruited to radiotherapy facilities
against 112.0 FTE leaving. Closer examination of the figures in the public sector reveals
significant turnover. Attrition in the ACT was 15.6% in 2008 balanced off by recruitment of
34.3% (albeit of a relatively low base). Turnover was also relatively high in WA with an
attrition rate of 15.5% and recruitment rate of 17.4%. The recruitment rate was also strong in
NSW at 36.4%, 15.9% in Queensland, and 10.6% in Tasmania resulting in an overall public
sector average of 13.5%. Taken overall, the recruitment rates were considerably different
with the public sector at 13.5% recruiting at more than twice the rate of the private sector at
6.0%. However, the attrition rates in the public sector (8.8%) and the private sector (9.3%)
were very similar.
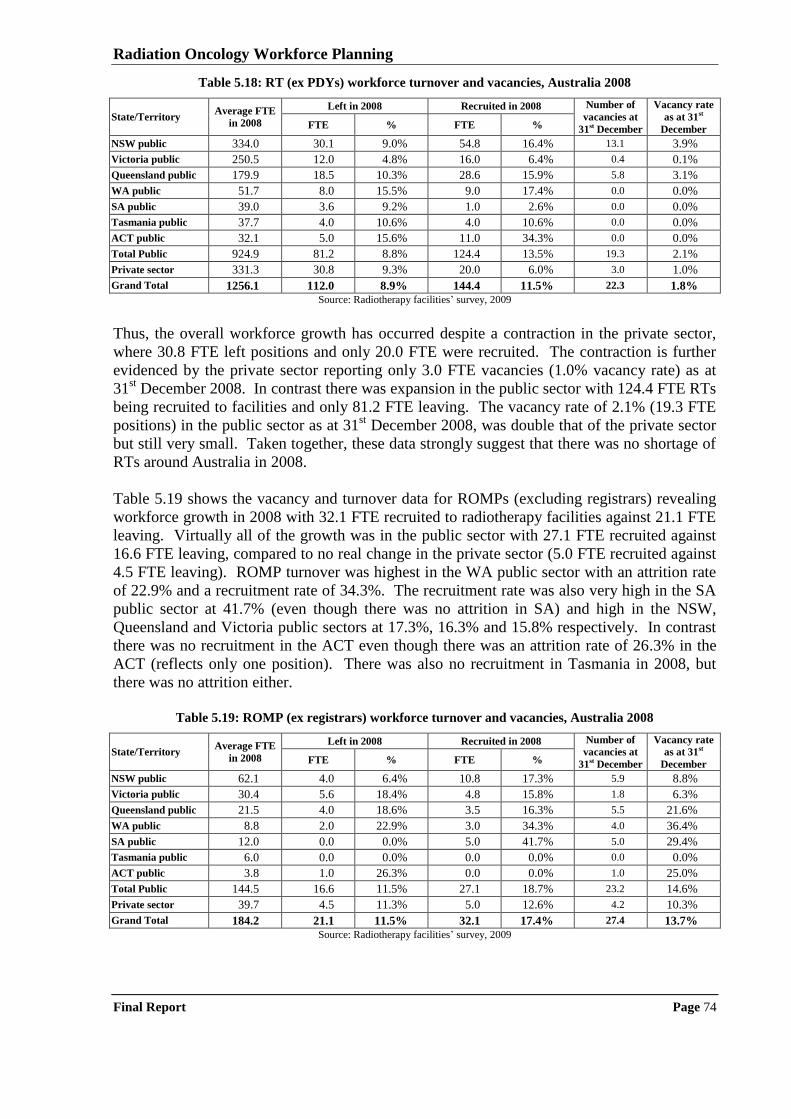
Radiation Oncology Workforce Planning
Final Report Page 74
Table 5.18: RT (ex PDYs) workforce turnover and vacancies, Australia 2008
State/Territory Average FTE
in 2008
Left in 2008 Recruited in 2008 Number of
vacancies at
31st December
Vacancy rate
as at 31st
December FTE % FTE %
NSW public 334.0 30.1 9.0% 54.8 16.4% 13.1 3.9%
Victoria public 250.5 12.0 4.8% 16.0 6.4% 0.4 0.1%
Queensland public 179.9 18.5 10.3% 28.6 15.9% 5.8 3.1%
WA public 51.7 8.0 15.5% 9.0 17.4% 0.0 0.0%
SA public 39.0 3.6 9.2% 1.0 2.6% 0.0 0.0%
Tasmania public 37.7 4.0 10.6% 4.0 10.6% 0.0 0.0%
ACT public 32.1 5.0 15.6% 11.0 34.3% 0.0 0.0%
Total Public 924.9 81.2 8.8% 124.4 13.5% 19.3 2.1%
Private sector 331.3 30.8 9.3% 20.0 6.0% 3.0 1.0%
Grand Total 1256.1 112.0 8.9% 144.4 11.5% 22.3 1.8%
Source: Radiotherapy facilities‟ survey, 2009
Thus, the overall workforce growth has occurred despite a contraction in the private sector,
where 30.8 FTE left positions and only 20.0 FTE were recruited. The contraction is further
evidenced by the private sector reporting only 3.0 FTE vacancies (1.0% vacancy rate) as at
31st December 2008. In contrast there was expansion in the public sector with 124.4 FTE RTs
being recruited to facilities and only 81.2 FTE leaving. The vacancy rate of 2.1% (19.3 FTE
positions) in the public sector as at 31st December 2008, was double that of the private sector
but still very small. Taken together, these data strongly suggest that there was no shortage of
RTs around Australia in 2008.
Table 5.19 shows the vacancy and turnover data for ROMPs (excluding registrars) revealing
workforce growth in 2008 with 32.1 FTE recruited to radiotherapy facilities against 21.1 FTE
leaving. Virtually all of the growth was in the public sector with 27.1 FTE recruited against
16.6 FTE leaving, compared to no real change in the private sector (5.0 FTE recruited against
4.5 FTE leaving). ROMP turnover was highest in the WA public sector with an attrition rate
of 22.9% and a recruitment rate of 34.3%. The recruitment rate was also very high in the SA
public sector at 41.7% (even though there was no attrition in SA) and high in the NSW,
Queensland and Victoria public sectors at 17.3%, 16.3% and 15.8% respectively. In contrast
there was no recruitment in the ACT even though there was an attrition rate of 26.3% in the
ACT (reflects only one position). There was also no recruitment in Tasmania in 2008, but
there was no attrition either.
Table 5.19: ROMP (ex registrars) workforce turnover and vacancies, Australia 2008
State/Territory Average FTE
in 2008
Left in 2008 Recruited in 2008 Number of
vacancies at
31st December
Vacancy rate
as at 31st
December FTE % FTE %
NSW public 62.1 4.0 6.4% 10.8 17.3% 5.9 8.8%
Victoria public 30.4 5.6 18.4% 4.8 15.8% 1.8 6.3%
Queensland public 21.5 4.0 18.6% 3.5 16.3% 5.5 21.6%
WA public 8.8 2.0 22.9% 3.0 34.3% 4.0 36.4%
SA public 12.0 0.0 0.0% 5.0 41.7% 5.0 29.4%
Tasmania public 6.0 0.0 0.0% 0.0 0.0% 0.0 0.0%
ACT public 3.8 1.0 26.3% 0.0 0.0% 1.0 25.0%
Total Public 144.5 16.6 11.5% 27.1 18.7% 23.2 14.6%
Private sector 39.7 4.5 11.3% 5.0 12.6% 4.2 10.3%
Grand Total 184.2 21.1 11.5% 32.1 17.4% 27.4 13.7%
Source: Radiotherapy facilities‟ survey, 2009
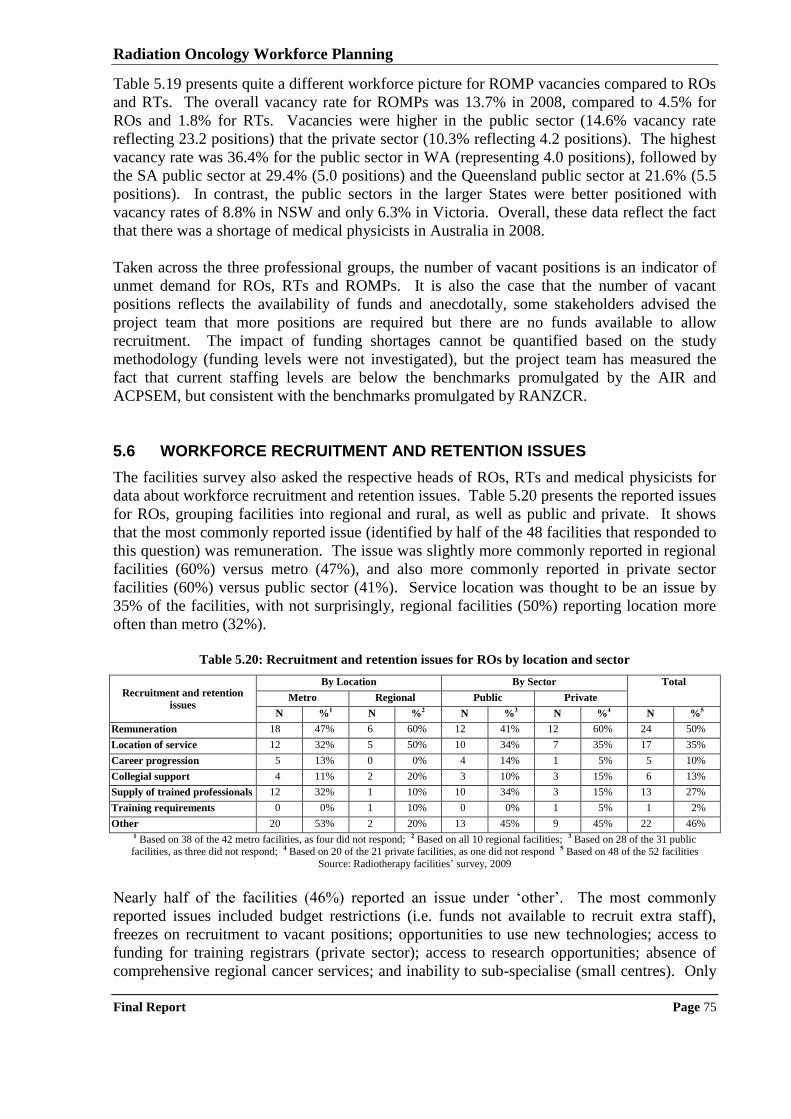
Radiation Oncology Workforce Planning
Final Report Page 75
Table 5.19 presents quite a different workforce picture for ROMP vacancies compared to ROs
and RTs. The overall vacancy rate for ROMPs was 13.7% in 2008, compared to 4.5% for
ROs and 1.8% for RTs. Vacancies were higher in the public sector (14.6% vacancy rate
reflecting 23.2 positions) that the private sector (10.3% reflecting 4.2 positions). The highest
vacancy rate was 36.4% for the public sector in WA (representing 4.0 positions), followed by
the SA public sector at 29.4% (5.0 positions) and the Queensland public sector at 21.6% (5.5
positions). In contrast, the public sectors in the larger States were better positioned with
vacancy rates of 8.8% in NSW and only 6.3% in Victoria. Overall, these data reflect the fact
that there was a shortage of medical physicists in Australia in 2008.
Taken across the three professional groups, the number of vacant positions is an indicator of
unmet demand for ROs, RTs and ROMPs. It is also the case that the number of vacant
positions reflects the availability of funds and anecdotally, some stakeholders advised the
project team that more positions are required but there are no funds available to allow
recruitment. The impact of funding shortages cannot be quantified based on the study
methodology (funding levels were not investigated), but the project team has measured the
fact that current staffing levels are below the benchmarks promulgated by the AIR and
ACPSEM, but consistent with the benchmarks promulgated by RANZCR.
5.6 WORKFORCE RECRUITMENT AND RETENTION ISSUES
The facilities survey also asked the respective heads of ROs, RTs and medical physicists for
data about workforce recruitment and retention issues. Table 5.20 presents the reported issues
for ROs, grouping facilities into regional and rural, as well as public and private. It shows
that the most commonly reported issue (identified by half of the 48 facilities that responded to
this question) was remuneration. The issue was slightly more commonly reported in regional
facilities (60%) versus metro (47%), and also more commonly reported in private sector
facilities (60%) versus public sector (41%). Service location was thought to be an issue by
35% of the facilities, with not surprisingly, regional facilities (50%) reporting location more
often than metro (32%).
Table 5.20: Recruitment and retention issues for ROs by location and sector
Recruitment and retention
issues
By Location By Sector Total
Metro Regional Public Private
N %1 N %2 N %3 N %4 N %5
Remuneration 18 47% 6 60% 12 41% 12 60% 24 50%
Location of service 12 32% 5 50% 10 34% 7 35% 17 35%
Career progression 5 13% 0 0% 4 14% 1 5% 5 10%
Collegial support 4 11% 2 20% 3 10% 3 15% 6 13%
Supply of trained professionals 12 32% 1 10% 10 34% 3 15% 13 27%
Training requirements 0 0% 1 10% 0 0% 1 5% 1 2%
Other 20 53% 2 20% 13 45% 9 45% 22 46% 1 Based on 38 of the 42 metro facilities, as four did not respond; 2 Based on all 10 regional facilities; 3 Based on 28 of the 31 public facilities, as three did not respond; 4 Based on 20 of the 21 private facilities, as one did not respond 5 Based on 48 of the 52 facilities
Source: Radiotherapy facilities‟ survey, 2009
Nearly half of the facilities (46%) reported an issue under „other‟. The most commonly
reported issues included budget restrictions (i.e. funds not available to recruit extra staff),
freezes on recruitment to vacant positions; opportunities to use new technologies; access to
funding for training registrars (private sector); access to research opportunities; absence of
comprehensive regional cancer services; and inability to sub-specialise (small centres). Only
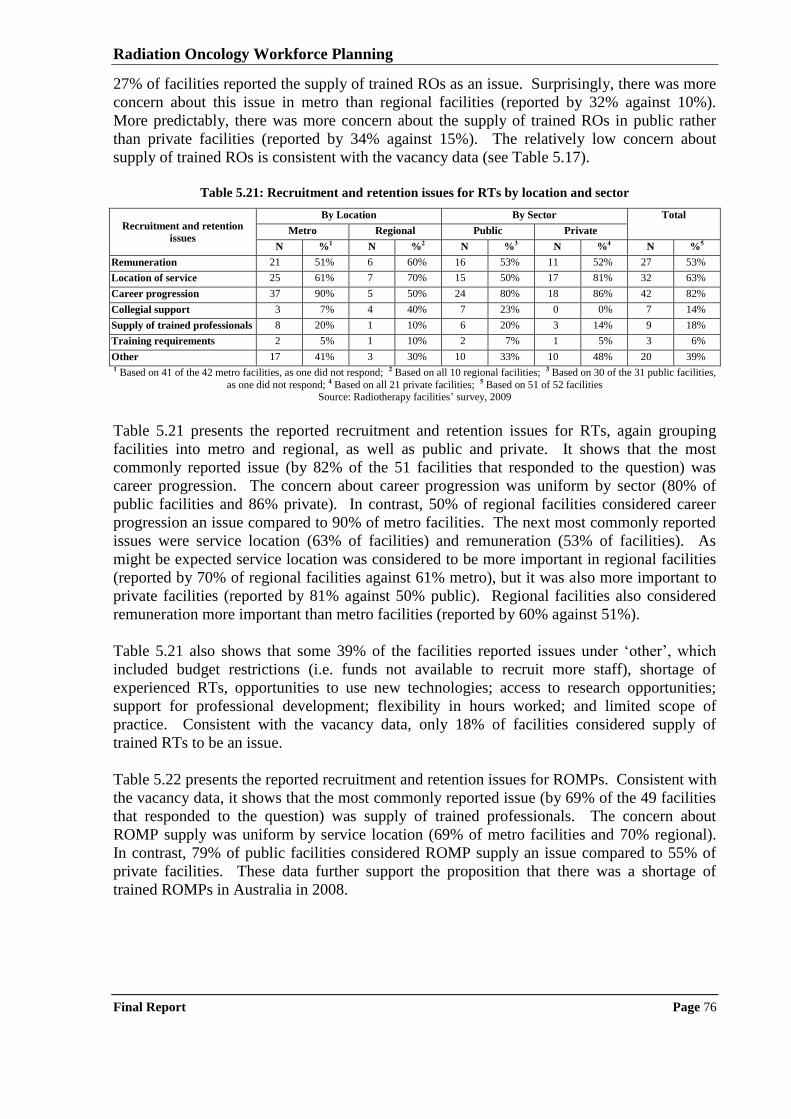
Radiation Oncology Workforce Planning
Final Report Page 76
27% of facilities reported the supply of trained ROs as an issue. Surprisingly, there was more
concern about this issue in metro than regional facilities (reported by 32% against 10%).
More predictably, there was more concern about the supply of trained ROs in public rather
than private facilities (reported by 34% against 15%). The relatively low concern about
supply of trained ROs is consistent with the vacancy data (see Table 5.17).
Table 5.21: Recruitment and retention issues for RTs by location and sector
Recruitment and retention
issues
By Location By Sector Total
Metro Regional Public Private
N %1 N %2 N %3 N %4 N %5
Remuneration 21 51% 6 60% 16 53% 11 52% 27 53%
Location of service 25 61% 7 70% 15 50% 17 81% 32 63%
Career progression 37 90% 5 50% 24 80% 18 86% 42 82%
Collegial support 3 7% 4 40% 7 23% 0 0% 7 14%
Supply of trained professionals 8 20% 1 10% 6 20% 3 14% 9 18%
Training requirements 2 5% 1 10% 2 7% 1 5% 3 6%
Other 17 41% 3 30% 10 33% 10 48% 20 39% 1 Based on 41 of the 42 metro facilities, as one did not respond; 2 Based on all 10 regional facilities; 3 Based on 30 of the 31 public facilities,
as one did not respond; 4 Based on all 21 private facilities; 5 Based on 51 of 52 facilities Source: Radiotherapy facilities‟ survey, 2009
Table 5.21 presents the reported recruitment and retention issues for RTs, again grouping
facilities into metro and regional, as well as public and private. It shows that the most
commonly reported issue (by 82% of the 51 facilities that responded to the question) was
career progression. The concern about career progression was uniform by sector (80% of
public facilities and 86% private). In contrast, 50% of regional facilities considered career
progression an issue compared to 90% of metro facilities. The next most commonly reported
issues were service location (63% of facilities) and remuneration (53% of facilities). As
might be expected service location was considered to be more important in regional facilities
(reported by 70% of regional facilities against 61% metro), but it was also more important to
private facilities (reported by 81% against 50% public). Regional facilities also considered
remuneration more important than metro facilities (reported by 60% against 51%).
Table 5.21 also shows that some 39% of the facilities reported issues under „other‟, which
included budget restrictions (i.e. funds not available to recruit more staff), shortage of
experienced RTs, opportunities to use new technologies; access to research opportunities;
support for professional development; flexibility in hours worked; and limited scope of
practice. Consistent with the vacancy data, only 18% of facilities considered supply of
trained RTs to be an issue.
Table 5.22 presents the reported recruitment and retention issues for ROMPs. Consistent with
the vacancy data, it shows that the most commonly reported issue (by 69% of the 49 facilities
that responded to the question) was supply of trained professionals. The concern about
ROMP supply was uniform by service location (69% of metro facilities and 70% regional).
In contrast, 79% of public facilities considered ROMP supply an issue compared to 55% of
private facilities. These data further support the proposition that there was a shortage of
trained ROMPs in Australia in 2008.
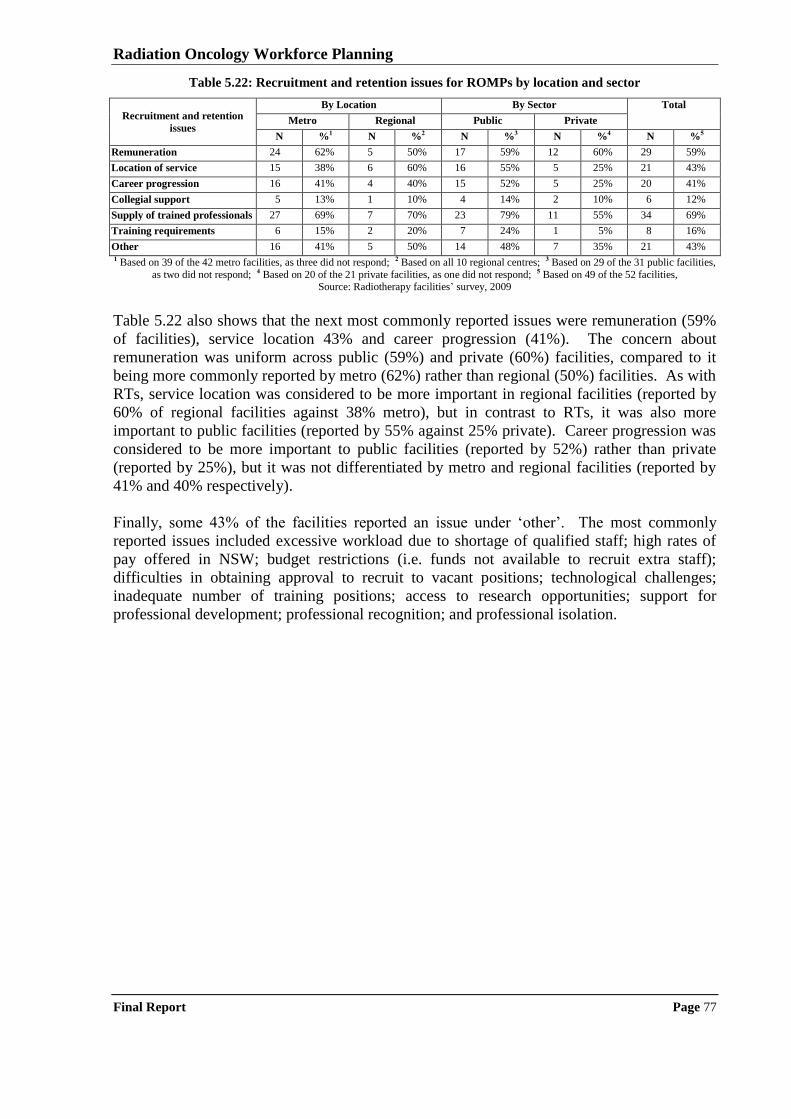
Radiation Oncology Workforce Planning
Final Report Page 77
Table 5.22: Recruitment and retention issues for ROMPs by location and sector
Recruitment and retention
issues
By Location By Sector Total
Metro Regional Public Private
N %1 N %2 N %3 N %4 N %5
Remuneration 24 62% 5 50% 17 59% 12 60% 29 59%
Location of service 15 38% 6 60% 16 55% 5 25% 21 43%
Career progression 16 41% 4 40% 15 52% 5 25% 20 41%
Collegial support 5 13% 1 10% 4 14% 2 10% 6 12%
Supply of trained professionals 27 69% 7 70% 23 79% 11 55% 34 69%
Training requirements 6 15% 2 20% 7 24% 1 5% 8 16%
Other 16 41% 5 50% 14 48% 7 35% 21 43% 1 Based on 39 of the 42 metro facilities, as three did not respond; 2 Based on all 10 regional centres; 3 Based on 29 of the 31 public facilities,
as two did not respond; 4 Based on 20 of the 21 private facilities, as one did not respond; 5 Based on 49 of the 52 facilities, Source: Radiotherapy facilities‟ survey, 2009
Table 5.22 also shows that the next most commonly reported issues were remuneration (59%
of facilities), service location 43% and career progression (41%). The concern about
remuneration was uniform across public (59%) and private (60%) facilities, compared to it
being more commonly reported by metro (62%) rather than regional (50%) facilities. As with
RTs, service location was considered to be more important in regional facilities (reported by
60% of regional facilities against 38% metro), but in contrast to RTs, it was also more
important to public facilities (reported by 55% against 25% private). Career progression was
considered to be more important to public facilities (reported by 52%) rather than private
(reported by 25%), but it was not differentiated by metro and regional facilities (reported by
41% and 40% respectively).
Finally, some 43% of the facilities reported an issue under „other‟. The most commonly
reported issues included excessive workload due to shortage of qualified staff; high rates of
pay offered in NSW; budget restrictions (i.e. funds not available to recruit extra staff);
difficulties in obtaining approval to recruit to vacant positions; technological challenges;
inadequate number of training positions; access to research opportunities; support for
professional development; professional recognition; and professional isolation.
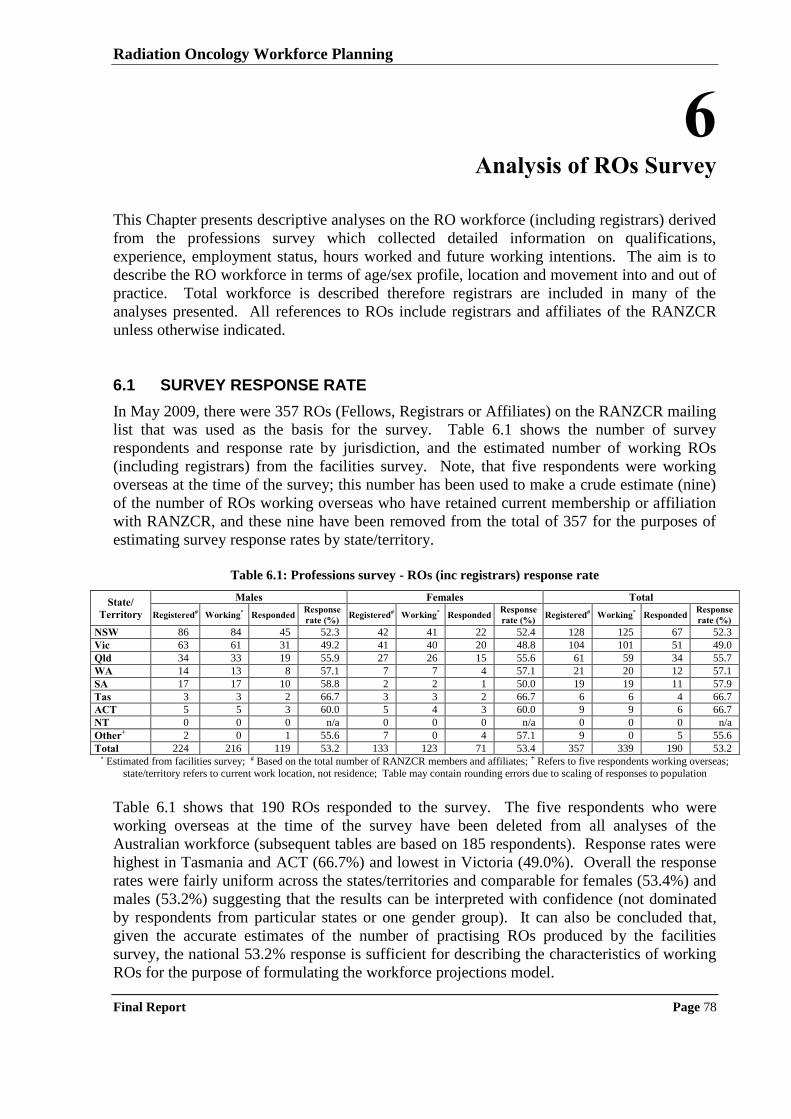
Radiation Oncology Workforce Planning
Final Report Page 78
6 Analysis of ROs Survey
This Chapter presents descriptive analyses on the RO workforce (including registrars) derived
from the professions survey which collected detailed information on qualifications,
experience, employment status, hours worked and future working intentions. The aim is to
describe the RO workforce in terms of age/sex profile, location and movement into and out of
practice. Total workforce is described therefore registrars are included in many of the
analyses presented. All references to ROs include registrars and affiliates of the RANZCR
unless otherwise indicated.
6.1 SURVEY RESPONSE RATE
In May 2009, there were 357 ROs (Fellows, Registrars or Affiliates) on the RANZCR mailing
list that was used as the basis for the survey. Table 6.1 shows the number of survey
respondents and response rate by jurisdiction, and the estimated number of working ROs
(including registrars) from the facilities survey. Note, that five respondents were working
overseas at the time of the survey; this number has been used to make a crude estimate (nine)
of the number of ROs working overseas who have retained current membership or affiliation
with RANZCR, and these nine have been removed from the total of 357 for the purposes of
estimating survey response rates by state/territory.
Table 6.1: Professions survey - ROs (inc registrars) response rate
State/
Territory
Males Females Total
Registered# Working* Responded Response
rate (%) Registered# Working* Responded
Response
rate (%) Registered# Working* Responded
Response
rate (%)
NSW 86 84 45 52.3 42 41 22 52.4 128 125 67 52.3
Vic 63 61 31 49.2 41 40 20 48.8 104 101 51 49.0
Qld 34 33 19 55.9 27 26 15 55.6 61 59 34 55.7
WA 14 13 8 57.1 7 7 4 57.1 21 20 12 57.1
SA 17 17 10 58.8 2 2 1 50.0 19 19 11 57.9
Tas 3 3 2 66.7 3 3 2 66.7 6 6 4 66.7
ACT 5 5 3 60.0 5 4 3 60.0 9 9 6 66.7
NT 0 0 0 n/a 0 0 0 n/a 0 0 0 n/a
Other+ 2 0 1 55.6 7 0 4 57.1 9 0 5 55.6
Total 224 216 119 53.2 133 123 71 53.4 357 339 190 53.2 * Estimated from facilities survey; # Based on the total number of RANZCR members and affiliates; + Refers to five respondents working overseas;
state/territory refers to current work location, not residence; Table may contain rounding errors due to scaling of responses to population
Table 6.1 shows that 190 ROs responded to the survey. The five respondents who were
working overseas at the time of the survey have been deleted from all analyses of the
Australian workforce (subsequent tables are based on 185 respondents). Response rates were
highest in Tasmania and ACT (66.7%) and lowest in Victoria (49.0%). Overall the response
rates were fairly uniform across the states/territories and comparable for females (53.4%) and
males (53.2%) suggesting that the results can be interpreted with confidence (not dominated
by respondents from particular states or one gender group). It can also be concluded that,
given the accurate estimates of the number of practising ROs produced by the facilities
survey, the national 53.2% response is sufficient for describing the characteristics of working
ROs for the purpose of formulating the workforce projections model.
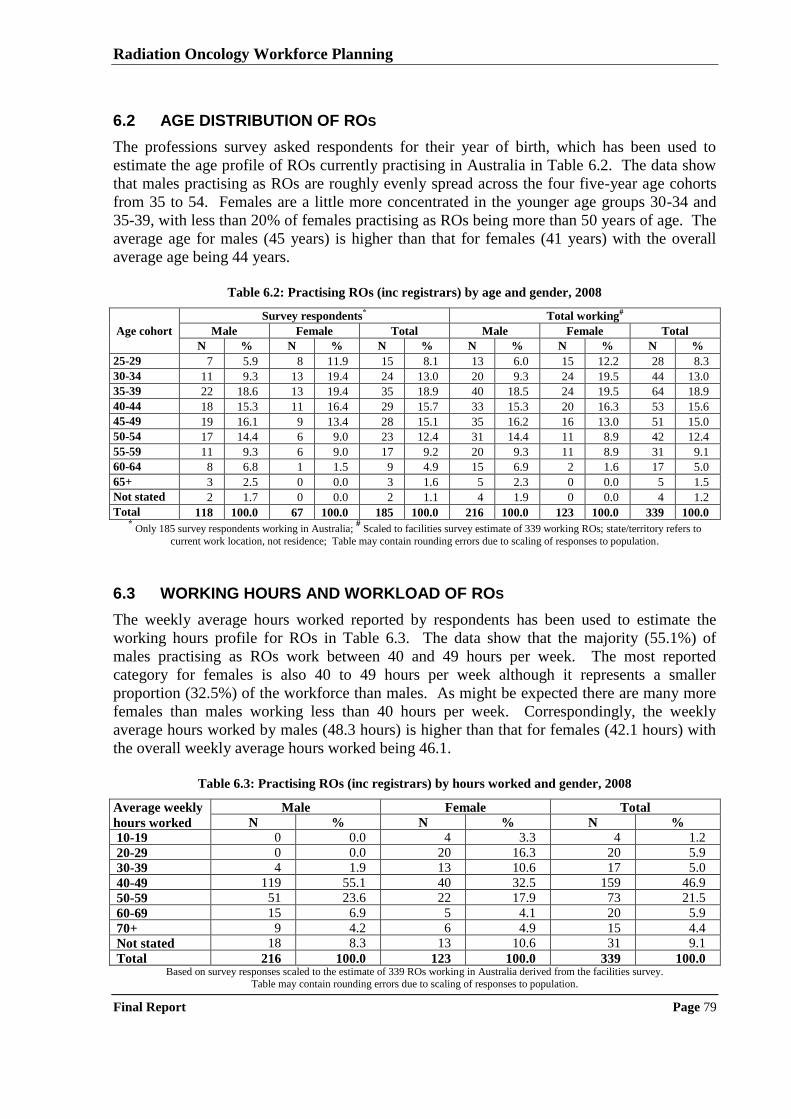
Radiation Oncology Workforce Planning
Final Report Page 79
6.2 AGE DISTRIBUTION OF ROS
The professions survey asked respondents for their year of birth, which has been used to
estimate the age profile of ROs currently practising in Australia in Table 6.2. The data show
that males practising as ROs are roughly evenly spread across the four five-year age cohorts
from 35 to 54. Females are a little more concentrated in the younger age groups 30-34 and
35-39, with less than 20% of females practising as ROs being more than 50 years of age. The
average age for males (45 years) is higher than that for females (41 years) with the overall
average age being 44 years.
Table 6.2: Practising ROs (inc registrars) by age and gender, 2008
Age cohort
Survey respondents* Total working#
Male Female Total Male Female Total
N % N % N % N % N % N %
25-29 7 5.9 8 11.9 15 8.1 13 6.0 15 12.2 28 8.3
30-34 11 9.3 13 19.4 24 13.0 20 9.3 24 19.5 44 13.0
35-39 22 18.6 13 19.4 35 18.9 40 18.5 24 19.5 64 18.9
40-44 18 15.3 11 16.4 29 15.7 33 15.3 20 16.3 53 15.6
45-49 19 16.1 9 13.4 28 15.1 35 16.2 16 13.0 51 15.0
50-54 17 14.4 6 9.0 23 12.4 31 14.4 11 8.9 42 12.4
55-59 11 9.3 6 9.0 17 9.2 20 9.3 11 8.9 31 9.1
60-64 8 6.8 1 1.5 9 4.9 15 6.9 2 1.6 17 5.0
65+ 3 2.5 0 0.0 3 1.6 5 2.3 0 0.0 5 1.5
Not stated 2 1.7 0 0.0 2 1.1 4 1.9 0 0.0 4 1.2
Total 118 100.0 67 100.0 185 100.0 216 100.0 123 100.0 339 100.0 * Only 185 survey respondents working in Australia;
# Scaled to facilities survey estimate of 339 working ROs; state/territory refers to
current work location, not residence; Table may contain rounding errors due to scaling of responses to population.
6.3 WORKING HOURS AND WORKLOAD OF ROS
The weekly average hours worked reported by respondents has been used to estimate the
working hours profile for ROs in Table 6.3. The data show that the majority (55.1%) of
males practising as ROs work between 40 and 49 hours per week. The most reported
category for females is also 40 to 49 hours per week although it represents a smaller
proportion (32.5%) of the workforce than males. As might be expected there are many more
females than males working less than 40 hours per week. Correspondingly, the weekly
average hours worked by males (48.3 hours) is higher than that for females (42.1 hours) with
the overall weekly average hours worked being 46.1.
Table 6.3: Practising ROs (inc registrars) by hours worked and gender, 2008
Average weekly
hours worked
Male Female Total
N % N % N %
10-19 0 0.0 4 3.3 4 1.2
20-29 0 0.0 20 16.3 20 5.9
30-39 4 1.9 13 10.6 17 5.0
40-49 119 55.1 40 32.5 159 46.9
50-59 51 23.6 22 17.9 73 21.5
60-69 15 6.9 5 4.1 20 5.9
70+ 9 4.2 6 4.9 15 4.4
Not stated 18 8.3 13 10.6 31 9.1
Total 216 100.0 123 100.0 339 100.0 Based on survey responses scaled to the estimate of 339 ROs working in Australia derived from the facilities survey.
Table may contain rounding errors due to scaling of responses to population.
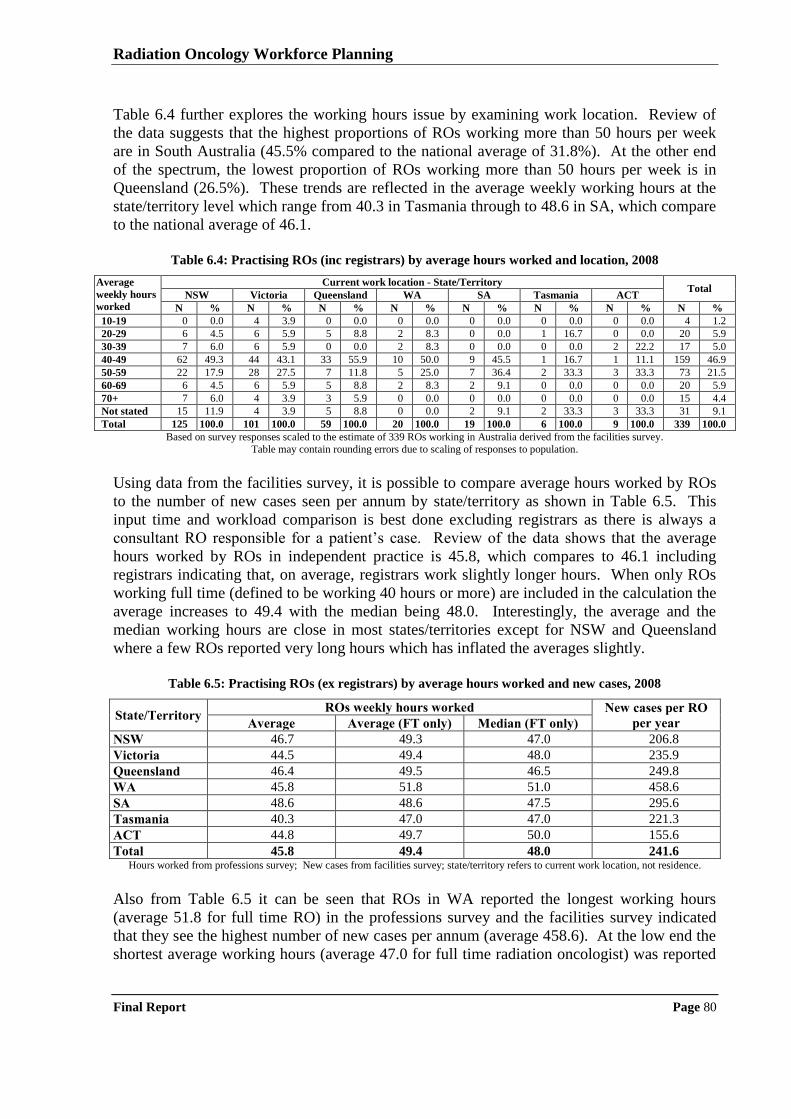
Radiation Oncology Workforce Planning
Final Report Page 80
Table 6.4 further explores the working hours issue by examining work location. Review of
the data suggests that the highest proportions of ROs working more than 50 hours per week
are in South Australia (45.5% compared to the national average of 31.8%). At the other end
of the spectrum, the lowest proportion of ROs working more than 50 hours per week is in
Queensland (26.5%). These trends are reflected in the average weekly working hours at the
state/territory level which range from 40.3 in Tasmania through to 48.6 in SA, which compare
to the national average of 46.1.
Table 6.4: Practising ROs (inc registrars) by average hours worked and location, 2008
Average
weekly hours
worked
Current work location - State/Territory Total
NSW Victoria Queensland WA SA Tasmania ACT
N % N % N % N % N % N % N % N %
10-19 0 0.0 4 3.9 0 0.0 0 0.0 0 0.0 0 0.0 0 0.0 4 1.2
20-29 6 4.5 6 5.9 5 8.8 2 8.3 0 0.0 1 16.7 0 0.0 20 5.9
30-39 7 6.0 6 5.9 0 0.0 2 8.3 0 0.0 0 0.0 2 22.2 17 5.0
40-49 62 49.3 44 43.1 33 55.9 10 50.0 9 45.5 1 16.7 1 11.1 159 46.9
50-59 22 17.9 28 27.5 7 11.8 5 25.0 7 36.4 2 33.3 3 33.3 73 21.5
60-69 6 4.5 6 5.9 5 8.8 2 8.3 2 9.1 0 0.0 0 0.0 20 5.9
70+ 7 6.0 4 3.9 3 5.9 0 0.0 0 0.0 0 0.0 0 0.0 15 4.4
Not stated 15 11.9 4 3.9 5 8.8 0 0.0 2 9.1 2 33.3 3 33.3 31 9.1
Total 125 100.0 101 100.0 59 100.0 20 100.0 19 100.0 6 100.0 9 100.0 339 100.0
Based on survey responses scaled to the estimate of 339 ROs working in Australia derived from the facilities survey.
Table may contain rounding errors due to scaling of responses to population.
Using data from the facilities survey, it is possible to compare average hours worked by ROs
to the number of new cases seen per annum by state/territory as shown in Table 6.5. This
input time and workload comparison is best done excluding registrars as there is always a
consultant RO responsible for a patient‟s case. Review of the data shows that the average
hours worked by ROs in independent practice is 45.8, which compares to 46.1 including
registrars indicating that, on average, registrars work slightly longer hours. When only ROs
working full time (defined to be working 40 hours or more) are included in the calculation the
average increases to 49.4 with the median being 48.0. Interestingly, the average and the
median working hours are close in most states/territories except for NSW and Queensland
where a few ROs reported very long hours which has inflated the averages slightly.
Table 6.5: Practising ROs (ex registrars) by average hours worked and new cases, 2008
State/Territory ROs weekly hours worked New cases per RO
per year Average Average (FT only) Median (FT only)
NSW 46.7 49.3 47.0 206.8
Victoria 44.5 49.4 48.0 235.9
Queensland 46.4 49.5 46.5 249.8
WA 45.8 51.8 51.0 458.6
SA 48.6 48.6 47.5 295.6
Tasmania 40.3 47.0 47.0 221.3
ACT 44.8 49.7 50.0 155.6
Total 45.8 49.4 48.0 241.6 Hours worked from professions survey; New cases from facilities survey; state/territory refers to current work location, not residence.
Also from Table 6.5 it can be seen that ROs in WA reported the longest working hours
(average 51.8 for full time RO) in the professions survey and the facilities survey indicated
that they see the highest number of new cases per annum (average 458.6). At the low end the
shortest average working hours (average 47.0 for full time radiation oncologist) was reported
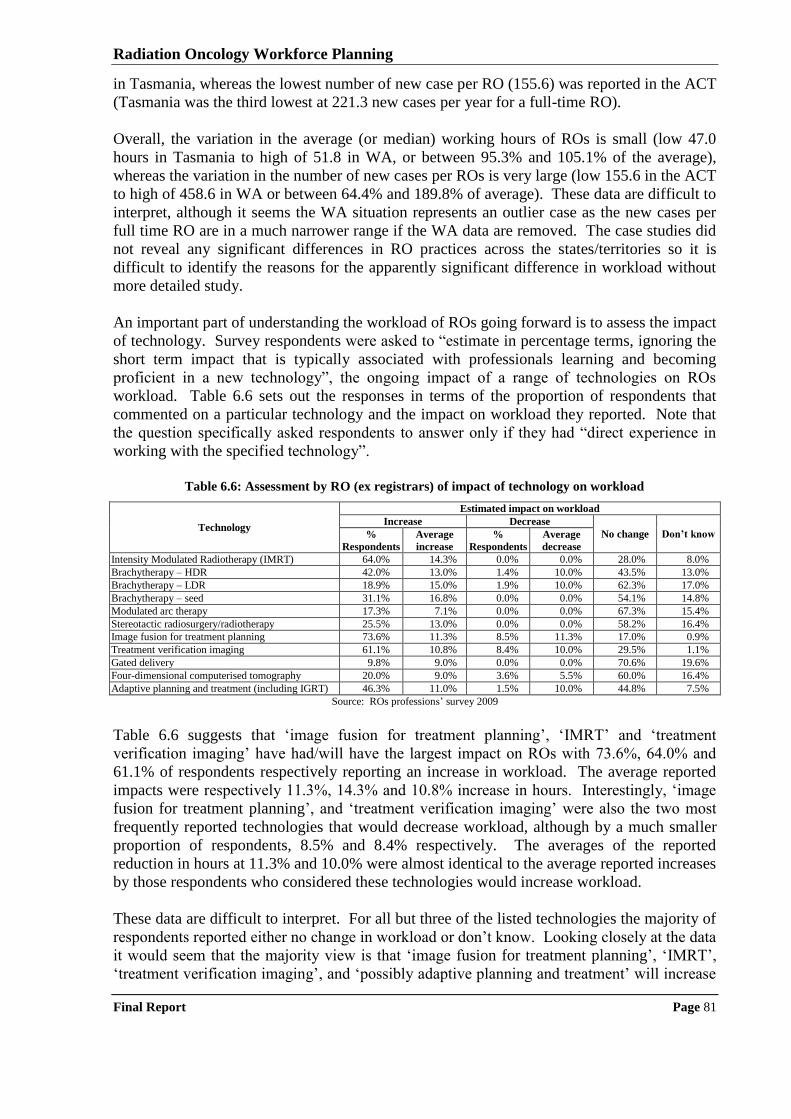
Radiation Oncology Workforce Planning
Final Report Page 81
in Tasmania, whereas the lowest number of new case per RO (155.6) was reported in the ACT
(Tasmania was the third lowest at 221.3 new cases per year for a full-time RO).
Overall, the variation in the average (or median) working hours of ROs is small (low 47.0
hours in Tasmania to high of 51.8 in WA, or between 95.3% and 105.1% of the average),
whereas the variation in the number of new cases per ROs is very large (low 155.6 in the ACT
to high of 458.6 in WA or between 64.4% and 189.8% of average). These data are difficult to
interpret, although it seems the WA situation represents an outlier case as the new cases per
full time RO are in a much narrower range if the WA data are removed. The case studies did
not reveal any significant differences in RO practices across the states/territories so it is
difficult to identify the reasons for the apparently significant difference in workload without
more detailed study.
An important part of understanding the workload of ROs going forward is to assess the impact
of technology. Survey respondents were asked to “estimate in percentage terms, ignoring the
short term impact that is typically associated with professionals learning and becoming
proficient in a new technology”, the ongoing impact of a range of technologies on ROs
workload. Table 6.6 sets out the responses in terms of the proportion of respondents that
commented on a particular technology and the impact on workload they reported. Note that
the question specifically asked respondents to answer only if they had “direct experience in
working with the specified technology”.
Table 6.6: Assessment by RO (ex registrars) of impact of technology on workload
Technology
Estimated impact on workload
Increase Decrease
No change Don’t know %
Respondents
Average
increase
%
Respondents
Average
decrease
Intensity Modulated Radiotherapy (IMRT) 64.0% 14.3% 0.0% 0.0% 28.0% 8.0%
Brachytherapy – HDR 42.0% 13.0% 1.4% 10.0% 43.5% 13.0%
Brachytherapy – LDR 18.9% 15.0% 1.9% 10.0% 62.3% 17.0%
Brachytherapy – seed 31.1% 16.8% 0.0% 0.0% 54.1% 14.8%
Modulated arc therapy 17.3% 7.1% 0.0% 0.0% 67.3% 15.4%
Stereotactic radiosurgery/radiotherapy 25.5% 13.0% 0.0% 0.0% 58.2% 16.4%
Image fusion for treatment planning 73.6% 11.3% 8.5% 11.3% 17.0% 0.9%
Treatment verification imaging 61.1% 10.8% 8.4% 10.0% 29.5% 1.1%
Gated delivery 9.8% 9.0% 0.0% 0.0% 70.6% 19.6%
Four-dimensional computerised tomography 20.0% 9.0% 3.6% 5.5% 60.0% 16.4%
Adaptive planning and treatment (including IGRT) 46.3% 11.0% 1.5% 10.0% 44.8% 7.5%
Source: ROs professions‟ survey 2009
Table 6.6 suggests that „image fusion for treatment planning‟, „IMRT‟ and „treatment
verification imaging‟ have had/will have the largest impact on ROs with 73.6%, 64.0% and
61.1% of respondents respectively reporting an increase in workload. The average reported
impacts were respectively 11.3%, 14.3% and 10.8% increase in hours. Interestingly, „image
fusion for treatment planning‟, and „treatment verification imaging‟ were also the two most
frequently reported technologies that would decrease workload, although by a much smaller
proportion of respondents, 8.5% and 8.4% respectively. The averages of the reported
reduction in hours at 11.3% and 10.0% were almost identical to the average reported increases
by those respondents who considered these technologies would increase workload.
These data are difficult to interpret. For all but three of the listed technologies the majority of
respondents reported either no change in workload or don‟t know. Looking closely at the data
it would seem that the majority view is that „image fusion for treatment planning‟, „IMRT‟,
„treatment verification imaging‟, and „possibly adaptive planning and treatment‟ will increase
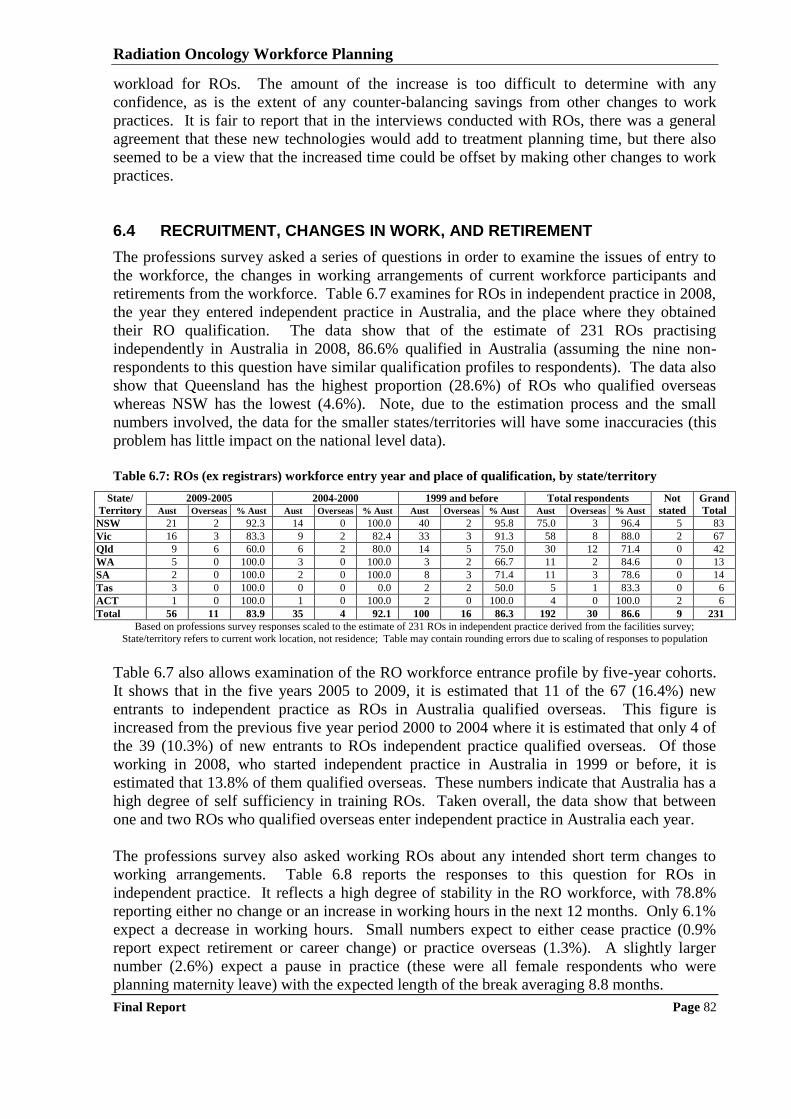
Radiation Oncology Workforce Planning
Final Report Page 82
workload for ROs. The amount of the increase is too difficult to determine with any
confidence, as is the extent of any counter-balancing savings from other changes to work
practices. It is fair to report that in the interviews conducted with ROs, there was a general
agreement that these new technologies would add to treatment planning time, but there also
seemed to be a view that the increased time could be offset by making other changes to work
practices.
6.4 RECRUITMENT, CHANGES IN WORK, AND RETIREMENT
The professions survey asked a series of questions in order to examine the issues of entry to
the workforce, the changes in working arrangements of current workforce participants and
retirements from the workforce. Table 6.7 examines for ROs in independent practice in 2008,
the year they entered independent practice in Australia, and the place where they obtained
their RO qualification. The data show that of the estimate of 231 ROs practising
independently in Australia in 2008, 86.6% qualified in Australia (assuming the nine non-
respondents to this question have similar qualification profiles to respondents). The data also
show that Queensland has the highest proportion (28.6%) of ROs who qualified overseas
whereas NSW has the lowest (4.6%). Note, due to the estimation process and the small
numbers involved, the data for the smaller states/territories will have some inaccuracies (this
problem has little impact on the national level data).
Table 6.7: ROs (ex registrars) workforce entry year and place of qualification, by state/territory
State/
Territory
2009-2005 2004-2000 1999 and before Total respondents Not
stated
Grand
Total Aust Overseas % Aust Aust Overseas % Aust Aust Overseas % Aust Aust Overseas % Aust
NSW 21 2 92.3 14 0 100.0 40 2 95.8 75.0 3 96.4 5 83
Vic 16 3 83.3 9 2 82.4 33 3 91.3 58 8 88.0 2 67
Qld 9 6 60.0 6 2 80.0 14 5 75.0 30 12 71.4 0 42
WA 5 0 100.0 3 0 100.0 3 2 66.7 11 2 84.6 0 13
SA 2 0 100.0 2 0 100.0 8 3 71.4 11 3 78.6 0 14
Tas 3 0 100.0 0 0 0.0 2 2 50.0 5 1 83.3 0 6
ACT 1 0 100.0 1 0 100.0 2 0 100.0 4 0 100.0 2 6
Total 56 11 83.9 35 4 92.1 100 16 86.3 192 30 86.6 9 231
Based on professions survey responses scaled to the estimate of 231 ROs in independent practice derived from the facilities survey;
State/territory refers to current work location, not residence; Table may contain rounding errors due to scaling of responses to population
Table 6.7 also allows examination of the RO workforce entrance profile by five-year cohorts.
It shows that in the five years 2005 to 2009, it is estimated that 11 of the 67 (16.4%) new
entrants to independent practice as ROs in Australia qualified overseas. This figure is
increased from the previous five year period 2000 to 2004 where it is estimated that only 4 of
the 39 (10.3%) of new entrants to ROs independent practice qualified overseas. Of those
working in 2008, who started independent practice in Australia in 1999 or before, it is
estimated that 13.8% of them qualified overseas. These numbers indicate that Australia has a
high degree of self sufficiency in training ROs. Taken overall, the data show that between
one and two ROs who qualified overseas enter independent practice in Australia each year.
The professions survey also asked working ROs about any intended short term changes to
working arrangements. Table 6.8 reports the responses to this question for ROs in
independent practice. It reflects a high degree of stability in the RO workforce, with 78.8%
reporting either no change or an increase in working hours in the next 12 months. Only 6.1%
expect a decrease in working hours. Small numbers expect to either cease practice (0.9%
report expect retirement or career change) or practice overseas (1.3%). A slightly larger
number (2.6%) expect a pause in practice (these were all female respondents who were
planning maternity leave) with the expected length of the break averaging 8.8 months.
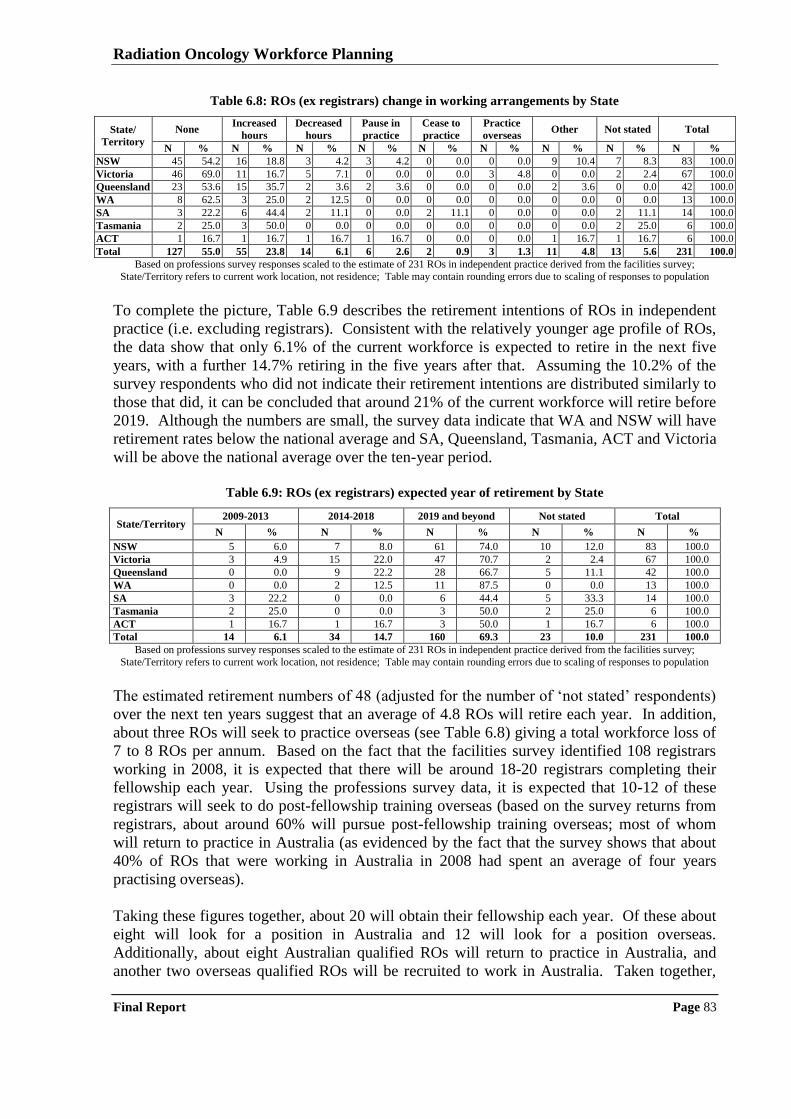
Radiation Oncology Workforce Planning
Final Report Page 83
Table 6.8: ROs (ex registrars) change in working arrangements by State
State/
Territory
None Increased
hours
Decreased
hours
Pause in
practice
Cease to
practice
Practice
overseas Other Not stated Total
N % N % N % N % N % N % N % N % N %
NSW 45 54.2 16 18.8 3 4.2 3 4.2 0 0.0 0 0.0 9 10.4 7 8.3 83 100.0
Victoria 46 69.0 11 16.7 5 7.1 0 0.0 0 0.0 3 4.8 0 0.0 2 2.4 67 100.0
Queensland 23 53.6 15 35.7 2 3.6 2 3.6 0 0.0 0 0.0 2 3.6 0 0.0 42 100.0
WA 8 62.5 3 25.0 2 12.5 0 0.0 0 0.0 0 0.0 0 0.0 0 0.0 13 100.0
SA 3 22.2 6 44.4 2 11.1 0 0.0 2 11.1 0 0.0 0 0.0 2 11.1 14 100.0
Tasmania 2 25.0 3 50.0 0 0.0 0 0.0 0 0.0 0 0.0 0 0.0 2 25.0 6 100.0
ACT 1 16.7 1 16.7 1 16.7 1 16.7 0 0.0 0 0.0 1 16.7 1 16.7 6 100.0
Total 127 55.0 55 23.8 14 6.1 6 2.6 2 0.9 3 1.3 11 4.8 13 5.6 231 100.0
Based on professions survey responses scaled to the estimate of 231 ROs in independent practice derived from the facilities survey;
State/Territory refers to current work location, not residence; Table may contain rounding errors due to scaling of responses to population
To complete the picture, Table 6.9 describes the retirement intentions of ROs in independent
practice (i.e. excluding registrars). Consistent with the relatively younger age profile of ROs,
the data show that only 6.1% of the current workforce is expected to retire in the next five
years, with a further 14.7% retiring in the five years after that. Assuming the 10.2% of the
survey respondents who did not indicate their retirement intentions are distributed similarly to
those that did, it can be concluded that around 21% of the current workforce will retire before
2019. Although the numbers are small, the survey data indicate that WA and NSW will have
retirement rates below the national average and SA, Queensland, Tasmania, ACT and Victoria
will be above the national average over the ten-year period.
Table 6.9: ROs (ex registrars) expected year of retirement by State
State/Territory 2009-2013 2014-2018 2019 and beyond Not stated Total
N % N % N % N % N %
NSW 5 6.0 7 8.0 61 74.0 10 12.0 83 100.0
Victoria 3 4.9 15 22.0 47 70.7 2 2.4 67 100.0
Queensland 0 0.0 9 22.2 28 66.7 5 11.1 42 100.0
WA 0 0.0 2 12.5 11 87.5 0 0.0 13 100.0
SA 3 22.2 0 0.0 6 44.4 5 33.3 14 100.0
Tasmania 2 25.0 0 0.0 3 50.0 2 25.0 6 100.0
ACT 1 16.7 1 16.7 3 50.0 1 16.7 6 100.0
Total 14 6.1 34 14.7 160 69.3 23 10.0 231 100.0
Based on professions survey responses scaled to the estimate of 231 ROs in independent practice derived from the facilities survey;
State/Territory refers to current work location, not residence; Table may contain rounding errors due to scaling of responses to population
The estimated retirement numbers of 48 (adjusted for the number of „not stated‟ respondents)
over the next ten years suggest that an average of 4.8 ROs will retire each year. In addition,
about three ROs will seek to practice overseas (see Table 6.8) giving a total workforce loss of
7 to 8 ROs per annum. Based on the fact that the facilities survey identified 108 registrars
working in 2008, it is expected that there will be around 18-20 registrars completing their
fellowship each year. Using the professions survey data, it is expected that 10-12 of these
registrars will seek to do post-fellowship training overseas (based on the survey returns from
registrars, about around 60% will pursue post-fellowship training overseas; most of whom
will return to practice in Australia (as evidenced by the fact that the survey shows that about
40% of ROs that were working in Australia in 2008 had spent an average of four years
practising overseas).
Taking these figures together, about 20 will obtain their fellowship each year. Of these about
eight will look for a position in Australia and 12 will look for a position overseas.
Additionally, about eight Australian qualified ROs will return to practice in Australia, and
another two overseas qualified ROs will be recruited to work in Australia. Taken together,
Radiation Oncology Workforce Planning
Final Report Page 84
these streams will result in a net inflow of 18 qualified ROs per year. This balances against
the outflow of 7-8 per year suggesting that there will still be net growth in the workforce at
the rate of about 10 to 11 ROs in each of the next ten years.

Radiation Oncology Workforce Planning
Final Report Page 85
7 Analysis of RTs Survey
This Chapter presents descriptive analyses on the RTs workforce (including those undertaking
their professional development year, “PDYs”) derived from the professions survey which
collected detailed information on qualifications, experience, employment status, hours worked
and future working intentions. The aim is to describe the RTs workforce in terms of age/sex
profile, location and movement into and out of practice. Total workforce is described
therefore PDYs are included in many of the analyses presented. All references to RTs include
PDYs unless otherwise stated.
7.1 SURVEY RESPONSE RATE
By combining information derived from the AIR (they advised 1,050 RT members), the
Medical Radiation and/or Licensing Boards in each State, and the facilities‟ survey it is
estimated that there were 1,824 RTs in Australia in May 2009 who received the professions‟
survey. Table 7.1 shows the number of survey respondents and response rate by jurisdiction,
and the estimated number of working RTs (including PDYs) from the facilities survey.
According to the facilities survey there are 1,578 employed RTs in Australia. Note, that 11
respondents were working overseas at the time of the survey; this number has been used to
make a crude estimate (22) of the number of RTs working overseas who have retained current
membership of the AIR and/or Australian radiation practice license, and these 11 have been
removed from the total of 920 for the purposes of estimating survey response rates by State.
Table 7.1: Professions survey – RT (inc PDYs) response rate
State/
Territory
Males Females Total
Registered# Working* Responded Response
rate (%) Registered# Working* Responded
Response
rate (%) Registered# Working* Responded
Response
rate (%)
NSW 142 125 57 40.1 450 393 180 40.0 592 518 237 40.0
Vic 110 96 72 65.5 379 332 248 65.4 489 428 320 65.4
Qld 112 98 55 49.1 249 218 122 49.0 361 316 177 49.0
WA 29 25 15 51.7 108 95 56 51.9 137 120 71 51.8
SA 27 24 14 51.9 95 83 49 51.6 122 107 63 51.6
Tas 28 24 14 50.0 29 26 15 51.7 57 50 29 50.9
ACT 4 3 1 25.0 40 36 11 27.5 44 39 12 27.3
NT 0 0 0 n/a 0 0 0 n/a 0 0 0 n/a
Other+ 4 0 2 0.0 18 0 9 50.0 22 0 11 50.0
Total 456 396 230 50.5 1,368 1,182 690 50.4 1,824 1,578 920 50.4 * Estimated from facilities survey; # Based on the number of AIR members and radiation license holders; + Refers to 11 respondents working
overseas; State/Territory refers to current work location, not residence; Table may contain rounding errors due to scaling of responses to population
Table 7.1 shows that 920 RTs responded to the survey. The 11 respondents who were
working overseas at the time of the survey have been deleted from all analyses of the
Australian workforce (subsequent tables are based on 909 respondents). Response rates were
highest in Victoria (65.4%) and lowest in the ACT (27.3%). Overall, apart from the ACT, the
response rate was fairly uniform across the states and comparable for females (50.4%) and
males (50.5%) suggesting that the results can be interpreted with confidence (not dominated
by respondents from particular states or one gender group). It can also be concluded that,
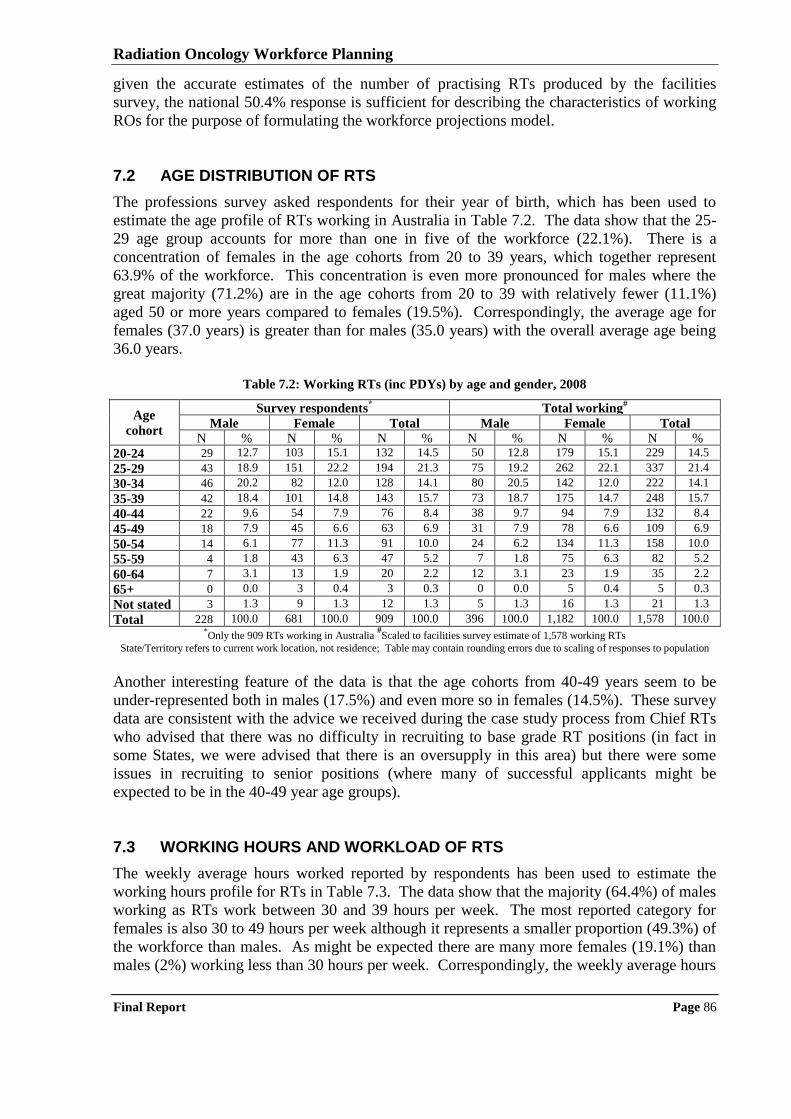
Radiation Oncology Workforce Planning
Final Report Page 86
given the accurate estimates of the number of practising RTs produced by the facilities
survey, the national 50.4% response is sufficient for describing the characteristics of working
ROs for the purpose of formulating the workforce projections model.
7.2 AGE DISTRIBUTION OF RTS
The professions survey asked respondents for their year of birth, which has been used to
estimate the age profile of RTs working in Australia in Table 7.2. The data show that the 25-
29 age group accounts for more than one in five of the workforce (22.1%). There is a
concentration of females in the age cohorts from 20 to 39 years, which together represent
63.9% of the workforce. This concentration is even more pronounced for males where the
great majority (71.2%) are in the age cohorts from 20 to 39 with relatively fewer (11.1%)
aged 50 or more years compared to females (19.5%). Correspondingly, the average age for
females (37.0 years) is greater than for males (35.0 years) with the overall average age being
36.0 years.
Table 7.2: Working RTs (inc PDYs) by age and gender, 2008
Age
cohort
Survey respondents* Total working
#
Male Female Total Male Female Total
N % N % N % N % N % N %
20-24 29 12.7 103 15.1 132 14.5 50 12.8 179 15.1 229 14.5
25-29 43 18.9 151 22.2 194 21.3 75 19.2 262 22.1 337 21.4
30-34 46 20.2 82 12.0 128 14.1 80 20.5 142 12.0 222 14.1
35-39 42 18.4 101 14.8 143 15.7 73 18.7 175 14.7 248 15.7
40-44 22 9.6 54 7.9 76 8.4 38 9.7 94 7.9 132 8.4
45-49 18 7.9 45 6.6 63 6.9 31 7.9 78 6.6 109 6.9
50-54 14 6.1 77 11.3 91 10.0 24 6.2 134 11.3 158 10.0
55-59 4 1.8 43 6.3 47 5.2 7 1.8 75 6.3 82 5.2
60-64 7 3.1 13 1.9 20 2.2 12 3.1 23 1.9 35 2.2
65+ 0 0.0 3 0.4 3 0.3 0 0.0 5 0.4 5 0.3
Not stated 3 1.3 9 1.3 12 1.3 5 1.3 16 1.3 21 1.3
Total 228 100.0 681 100.0 909 100.0 396 100.0 1,182 100.0 1,578 100.0 *Only the 909 RTs working in Australia
#Scaled to facilities survey estimate of 1,578 working RTs
State/Territory refers to current work location, not residence; Table may contain rounding errors due to scaling of responses to population
Another interesting feature of the data is that the age cohorts from 40-49 years seem to be
under-represented both in males (17.5%) and even more so in females (14.5%). These survey
data are consistent with the advice we received during the case study process from Chief RTs
who advised that there was no difficulty in recruiting to base grade RT positions (in fact in
some States, we were advised that there is an oversupply in this area) but there were some
issues in recruiting to senior positions (where many of successful applicants might be
expected to be in the 40-49 year age groups).
7.3 WORKING HOURS AND WORKLOAD OF RTS
The weekly average hours worked reported by respondents has been used to estimate the
working hours profile for RTs in Table 7.3. The data show that the majority (64.4%) of males
working as RTs work between 30 and 39 hours per week. The most reported category for
females is also 30 to 49 hours per week although it represents a smaller proportion (49.3%) of
the workforce than males. As might be expected there are many more females (19.1%) than
males (2%) working less than 30 hours per week. Correspondingly, the weekly average hours
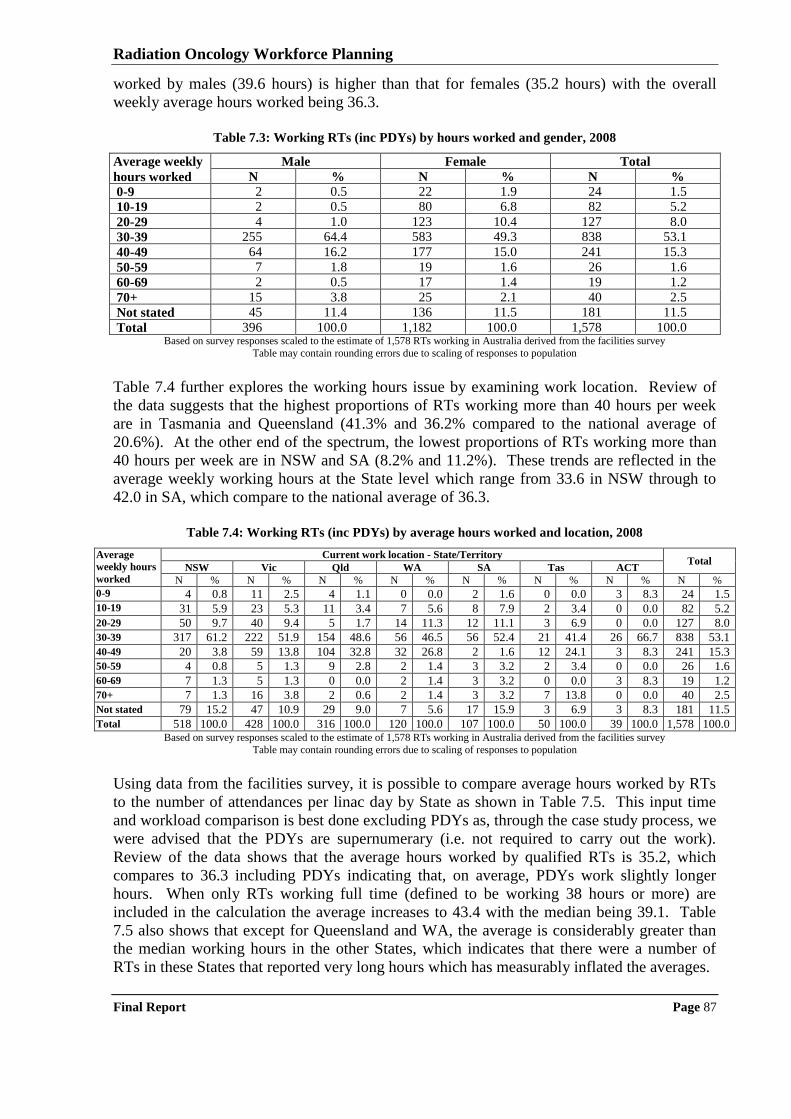
Radiation Oncology Workforce Planning
Final Report Page 87
worked by males (39.6 hours) is higher than that for females (35.2 hours) with the overall
weekly average hours worked being 36.3.
Table 7.3: Working RTs (inc PDYs) by hours worked and gender, 2008
Average weekly
hours worked
Male Female Total
N % N % N %
0-9 2 0.5 22 1.9 24 1.5
10-19 2 0.5 80 6.8 82 5.2
20-29 4 1.0 123 10.4 127 8.0
30-39 255 64.4 583 49.3 838 53.1
40-49 64 16.2 177 15.0 241 15.3
50-59 7 1.8 19 1.6 26 1.6
60-69 2 0.5 17 1.4 19 1.2
70+ 15 3.8 25 2.1 40 2.5
Not stated 45 11.4 136 11.5 181 11.5
Total 396 100.0 1,182 100.0 1,578 100.0 Based on survey responses scaled to the estimate of 1,578 RTs working in Australia derived from the facilities survey
Table may contain rounding errors due to scaling of responses to population
Table 7.4 further explores the working hours issue by examining work location. Review of
the data suggests that the highest proportions of RTs working more than 40 hours per week
are in Tasmania and Queensland (41.3% and 36.2% compared to the national average of
20.6%). At the other end of the spectrum, the lowest proportions of RTs working more than
40 hours per week are in NSW and SA (8.2% and 11.2%). These trends are reflected in the
average weekly working hours at the State level which range from 33.6 in NSW through to
42.0 in SA, which compare to the national average of 36.3.
Table 7.4: Working RTs (inc PDYs) by average hours worked and location, 2008
Average
weekly hours
worked
Current work location - State/Territory Total
NSW Vic Qld WA SA Tas ACT
N % N % N % N % N % N % N % N %
0-9 4 0.8 11 2.5 4 1.1 0 0.0 2 1.6 0 0.0 3 8.3 24 1.5 10-19 31 5.9 23 5.3 11 3.4 7 5.6 8 7.9 2 3.4 0 0.0 82 5.2
20-29 50 9.7 40 9.4 5 1.7 14 11.3 12 11.1 3 6.9 0 0.0 127 8.0
30-39 317 61.2 222 51.9 154 48.6 56 46.5 56 52.4 21 41.4 26 66.7 838 53.1
40-49 20 3.8 59 13.8 104 32.8 32 26.8 2 1.6 12 24.1 3 8.3 241 15.3
50-59 4 0.8 5 1.3 9 2.8 2 1.4 3 3.2 2 3.4 0 0.0 26 1.6
60-69 7 1.3 5 1.3 0 0.0 2 1.4 3 3.2 0 0.0 3 8.3 19 1.2
70+ 7 1.3 16 3.8 2 0.6 2 1.4 3 3.2 7 13.8 0 0.0 40 2.5
Not stated 79 15.2 47 10.9 29 9.0 7 5.6 17 15.9 3 6.9 3 8.3 181 11.5
Total 518 100.0 428 100.0 316 100.0 120 100.0 107 100.0 50 100.0 39 100.0 1,578 100.0 Based on survey responses scaled to the estimate of 1,578 RTs working in Australia derived from the facilities survey
Table may contain rounding errors due to scaling of responses to population
Using data from the facilities survey, it is possible to compare average hours worked by RTs
to the number of attendances per linac day by State as shown in Table 7.5. This input time
and workload comparison is best done excluding PDYs as, through the case study process, we
were advised that the PDYs are supernumerary (i.e. not required to carry out the work).
Review of the data shows that the average hours worked by qualified RTs is 35.2, which
compares to 36.3 including PDYs indicating that, on average, PDYs work slightly longer
hours. When only RTs working full time (defined to be working 38 hours or more) are
included in the calculation the average increases to 43.4 with the median being 39.1. Table
7.5 also shows that except for Queensland and WA, the average is considerably greater than
the median working hours in the other States, which indicates that there were a number of
RTs in these States that reported very long hours which has measurably inflated the averages.
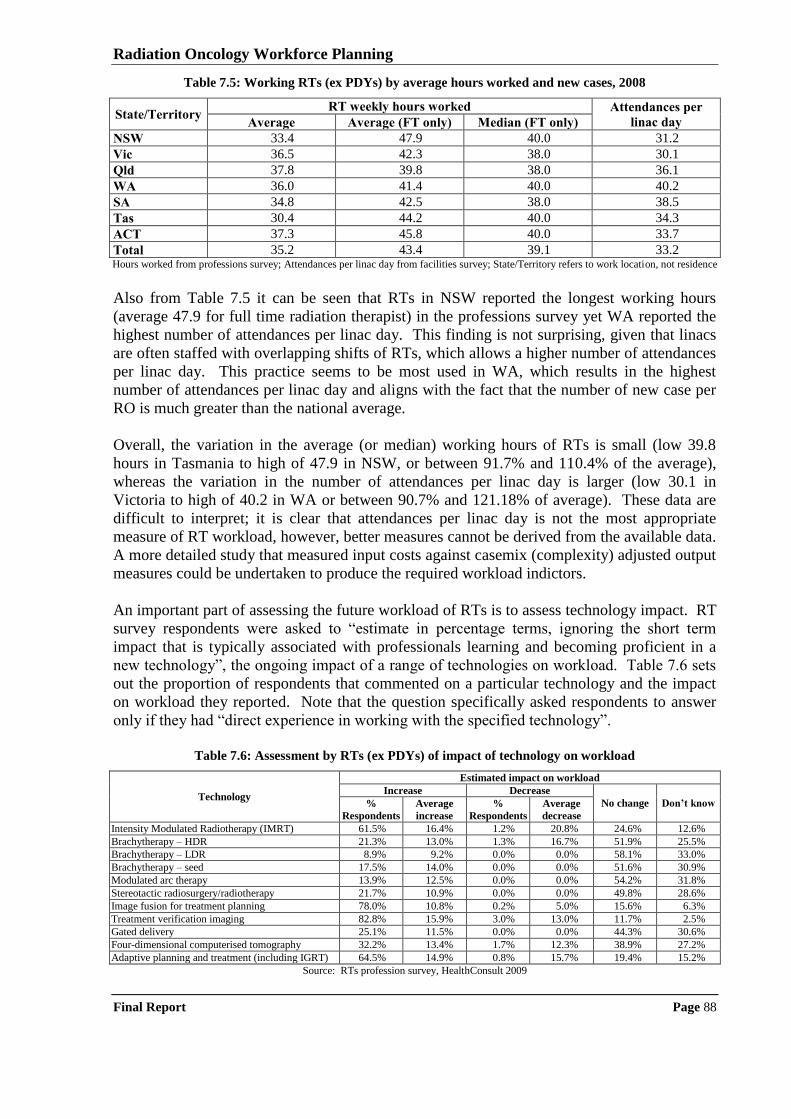
Radiation Oncology Workforce Planning
Final Report Page 88
Table 7.5: Working RTs (ex PDYs) by average hours worked and new cases, 2008
State/Territory RT weekly hours worked Attendances per
linac day Average Average (FT only) Median (FT only)
NSW 33.4 47.9 40.0 31.2
Vic 36.5 42.3 38.0 30.1
Qld 37.8 39.8 38.0 36.1
WA 36.0 41.4 40.0 40.2
SA 34.8 42.5 38.0 38.5
Tas 30.4 44.2 40.0 34.3
ACT 37.3 45.8 40.0 33.7
Total 35.2 43.4 39.1 33.2 Hours worked from professions survey; Attendances per linac day from facilities survey; State/Territory refers to work location, not residence
Also from Table 7.5 it can be seen that RTs in NSW reported the longest working hours
(average 47.9 for full time radiation therapist) in the professions survey yet WA reported the
highest number of attendances per linac day. This finding is not surprising, given that linacs
are often staffed with overlapping shifts of RTs, which allows a higher number of attendances
per linac day. This practice seems to be most used in WA, which results in the highest
number of attendances per linac day and aligns with the fact that the number of new case per
RO is much greater than the national average.
Overall, the variation in the average (or median) working hours of RTs is small (low 39.8
hours in Tasmania to high of 47.9 in NSW, or between 91.7% and 110.4% of the average),
whereas the variation in the number of attendances per linac day is larger (low 30.1 in
Victoria to high of 40.2 in WA or between 90.7% and 121.18% of average). These data are
difficult to interpret; it is clear that attendances per linac day is not the most appropriate
measure of RT workload, however, better measures cannot be derived from the available data.
A more detailed study that measured input costs against casemix (complexity) adjusted output
measures could be undertaken to produce the required workload indictors.
An important part of assessing the future workload of RTs is to assess technology impact. RT
survey respondents were asked to “estimate in percentage terms, ignoring the short term
impact that is typically associated with professionals learning and becoming proficient in a
new technology”, the ongoing impact of a range of technologies on workload. Table 7.6 sets
out the proportion of respondents that commented on a particular technology and the impact
on workload they reported. Note that the question specifically asked respondents to answer
only if they had “direct experience in working with the specified technology”.
Table 7.6: Assessment by RTs (ex PDYs) of impact of technology on workload
Technology
Estimated impact on workload
Increase Decrease
No change Don’t know %
Respondents
Average
increase
%
Respondents
Average
decrease
Intensity Modulated Radiotherapy (IMRT) 61.5% 16.4% 1.2% 20.8% 24.6% 12.6%
Brachytherapy – HDR 21.3% 13.0% 1.3% 16.7% 51.9% 25.5%
Brachytherapy – LDR 8.9% 9.2% 0.0% 0.0% 58.1% 33.0%
Brachytherapy – seed 17.5% 14.0% 0.0% 0.0% 51.6% 30.9%
Modulated arc therapy 13.9% 12.5% 0.0% 0.0% 54.2% 31.8%
Stereotactic radiosurgery/radiotherapy 21.7% 10.9% 0.0% 0.0% 49.8% 28.6%
Image fusion for treatment planning 78.0% 10.8% 0.2% 5.0% 15.6% 6.3%
Treatment verification imaging 82.8% 15.9% 3.0% 13.0% 11.7% 2.5%
Gated delivery 25.1% 11.5% 0.0% 0.0% 44.3% 30.6%
Four-dimensional computerised tomography 32.2% 13.4% 1.7% 12.3% 38.9% 27.2%
Adaptive planning and treatment (including IGRT) 64.5% 14.9% 0.8% 15.7% 19.4% 15.2%
Source: RTs profession survey, HealthConsult 2009
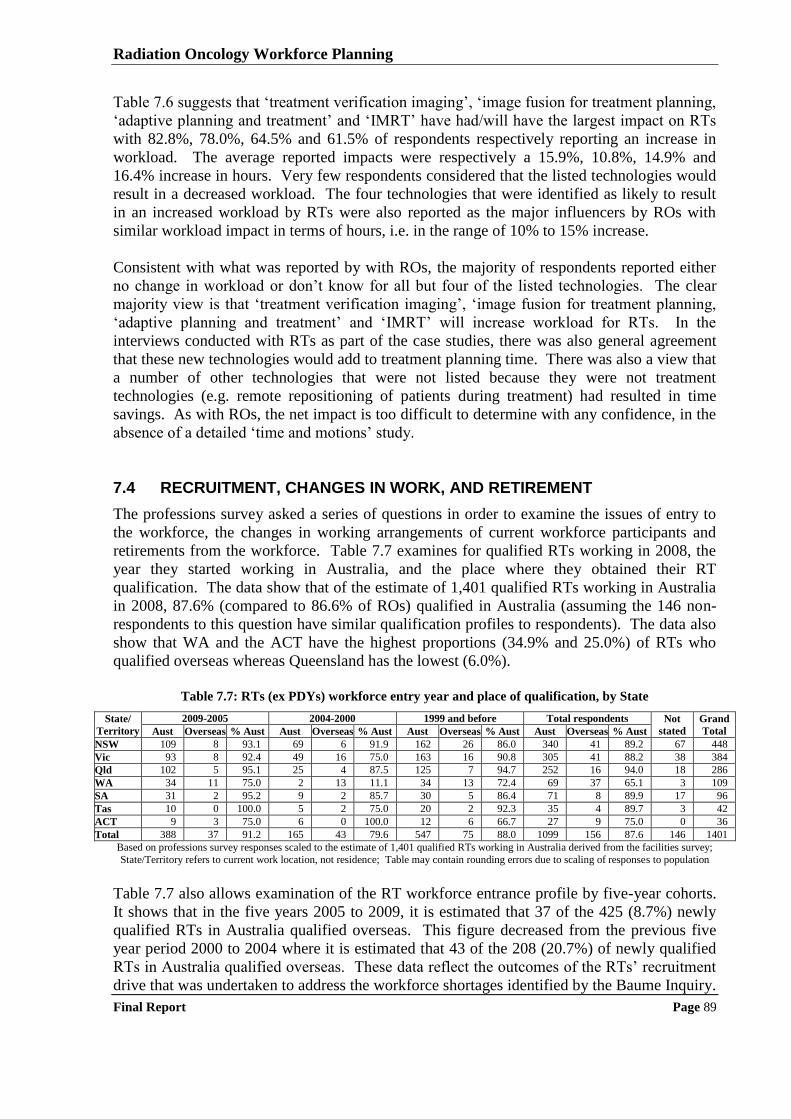
Radiation Oncology Workforce Planning
Final Report Page 89
Table 7.6 suggests that „treatment verification imaging‟, „image fusion for treatment planning,
„adaptive planning and treatment‟ and „IMRT‟ have had/will have the largest impact on RTs
with 82.8%, 78.0%, 64.5% and 61.5% of respondents respectively reporting an increase in
workload. The average reported impacts were respectively a 15.9%, 10.8%, 14.9% and
16.4% increase in hours. Very few respondents considered that the listed technologies would
result in a decreased workload. The four technologies that were identified as likely to result
in an increased workload by RTs were also reported as the major influencers by ROs with
similar workload impact in terms of hours, i.e. in the range of 10% to 15% increase.
Consistent with what was reported by with ROs, the majority of respondents reported either
no change in workload or don‟t know for all but four of the listed technologies. The clear
majority view is that „treatment verification imaging‟, „image fusion for treatment planning,
„adaptive planning and treatment‟ and „IMRT‟ will increase workload for RTs. In the
interviews conducted with RTs as part of the case studies, there was also general agreement
that these new technologies would add to treatment planning time. There was also a view that
a number of other technologies that were not listed because they were not treatment
technologies (e.g. remote repositioning of patients during treatment) had resulted in time
savings. As with ROs, the net impact is too difficult to determine with any confidence, in the
absence of a detailed „time and motions‟ study.
7.4 RECRUITMENT, CHANGES IN WORK, AND RETIREMENT
The professions survey asked a series of questions in order to examine the issues of entry to
the workforce, the changes in working arrangements of current workforce participants and
retirements from the workforce. Table 7.7 examines for qualified RTs working in 2008, the
year they started working in Australia, and the place where they obtained their RT
qualification. The data show that of the estimate of 1,401 qualified RTs working in Australia
in 2008, 87.6% (compared to 86.6% of ROs) qualified in Australia (assuming the 146 non-
respondents to this question have similar qualification profiles to respondents). The data also
show that WA and the ACT have the highest proportions (34.9% and 25.0%) of RTs who
qualified overseas whereas Queensland has the lowest (6.0%).
Table 7.7: RTs (ex PDYs) workforce entry year and place of qualification, by State
State/
Territory
2009-2005 2004-2000 1999 and before Total respondents Not
stated
Grand
Total Aust Overseas % Aust Aust Overseas % Aust Aust Overseas % Aust Aust Overseas % Aust
NSW 109 8 93.1 69 6 91.9 162 26 86.0 340 41 89.2 67 448
Vic 93 8 92.4 49 16 75.0 163 16 90.8 305 41 88.2 38 384
Qld 102 5 95.1 25 4 87.5 125 7 94.7 252 16 94.0 18 286
WA 34 11 75.0 2 13 11.1 34 13 72.4 69 37 65.1 3 109
SA 31 2 95.2 9 2 85.7 30 5 86.4 71 8 89.9 17 96
Tas 10 0 100.0 5 2 75.0 20 2 92.3 35 4 89.7 3 42
ACT 9 3 75.0 6 0 100.0 12 6 66.7 27 9 75.0 0 36
Total 388 37 91.2 165 43 79.6 547 75 88.0 1099 156 87.6 146 1401
Based on professions survey responses scaled to the estimate of 1,401 qualified RTs working in Australia derived from the facilities survey;
State/Territory refers to current work location, not residence; Table may contain rounding errors due to scaling of responses to population
Table 7.7 also allows examination of the RT workforce entrance profile by five-year cohorts.
It shows that in the five years 2005 to 2009, it is estimated that 37 of the 425 (8.7%) newly
qualified RTs in Australia qualified overseas. This figure decreased from the previous five
year period 2000 to 2004 where it is estimated that 43 of the 208 (20.7%) of newly qualified
RTs in Australia qualified overseas. These data reflect the outcomes of the RTs‟ recruitment
drive that was undertaken to address the workforce shortages identified by the Baume Inquiry.
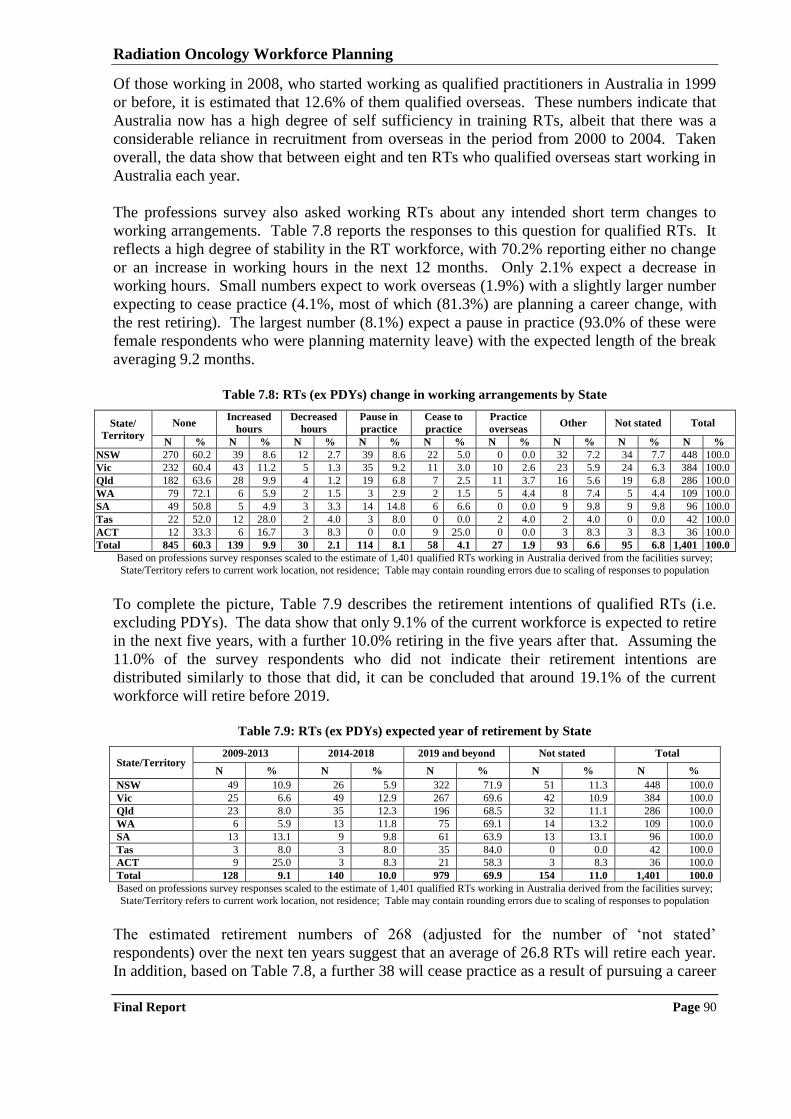
Radiation Oncology Workforce Planning
Final Report Page 90
Of those working in 2008, who started working as qualified practitioners in Australia in 1999
or before, it is estimated that 12.6% of them qualified overseas. These numbers indicate that
Australia now has a high degree of self sufficiency in training RTs, albeit that there was a
considerable reliance in recruitment from overseas in the period from 2000 to 2004. Taken
overall, the data show that between eight and ten RTs who qualified overseas start working in
Australia each year.
The professions survey also asked working RTs about any intended short term changes to
working arrangements. Table 7.8 reports the responses to this question for qualified RTs. It
reflects a high degree of stability in the RT workforce, with 70.2% reporting either no change
or an increase in working hours in the next 12 months. Only 2.1% expect a decrease in
working hours. Small numbers expect to work overseas (1.9%) with a slightly larger number
expecting to cease practice (4.1%, most of which (81.3%) are planning a career change, with
the rest retiring). The largest number (8.1%) expect a pause in practice (93.0% of these were
female respondents who were planning maternity leave) with the expected length of the break
averaging 9.2 months.
Table 7.8: RTs (ex PDYs) change in working arrangements by State
State/
Territory
None Increased
hours
Decreased
hours
Pause in
practice
Cease to
practice
Practice
overseas Other Not stated Total
N % N % N % N % N % N % N % N % N %
NSW 270 60.2 39 8.6 12 2.7 39 8.6 22 5.0 0 0.0 32 7.2 34 7.7 448 100.0
Vic 232 60.4 43 11.2 5 1.3 35 9.2 11 3.0 10 2.6 23 5.9 24 6.3 384 100.0
Qld 182 63.6 28 9.9 4 1.2 19 6.8 7 2.5 11 3.7 16 5.6 19 6.8 286 100.0
WA 79 72.1 6 5.9 2 1.5 3 2.9 2 1.5 5 4.4 8 7.4 5 4.4 109 100.0
SA 49 50.8 5 4.9 3 3.3 14 14.8 6 6.6 0 0.0 9 9.8 9 9.8 96 100.0
Tas 22 52.0 12 28.0 2 4.0 3 8.0 0 0.0 2 4.0 2 4.0 0 0.0 42 100.0
ACT 12 33.3 6 16.7 3 8.3 0 0.0 9 25.0 0 0.0 3 8.3 3 8.3 36 100.0
Total 845 60.3 139 9.9 30 2.1 114 8.1 58 4.1 27 1.9 93 6.6 95 6.8 1,401 100.0
Based on professions survey responses scaled to the estimate of 1,401 qualified RTs working in Australia derived from the facilities survey;
State/Territory refers to current work location, not residence; Table may contain rounding errors due to scaling of responses to population
To complete the picture, Table 7.9 describes the retirement intentions of qualified RTs (i.e.
excluding PDYs). The data show that only 9.1% of the current workforce is expected to retire
in the next five years, with a further 10.0% retiring in the five years after that. Assuming the
11.0% of the survey respondents who did not indicate their retirement intentions are
distributed similarly to those that did, it can be concluded that around 19.1% of the current
workforce will retire before 2019.
Table 7.9: RTs (ex PDYs) expected year of retirement by State
State/Territory 2009-2013 2014-2018 2019 and beyond Not stated Total
N % N % N % N % N %
NSW 49 10.9 26 5.9 322 71.9 51 11.3 448 100.0
Vic 25 6.6 49 12.9 267 69.6 42 10.9 384 100.0
Qld 23 8.0 35 12.3 196 68.5 32 11.1 286 100.0
WA 6 5.9 13 11.8 75 69.1 14 13.2 109 100.0
SA 13 13.1 9 9.8 61 63.9 13 13.1 96 100.0
Tas 3 8.0 3 8.0 35 84.0 0 0.0 42 100.0
ACT 9 25.0 3 8.3 21 58.3 3 8.3 36 100.0
Total 128 9.1 140 10.0 979 69.9 154 11.0 1,401 100.0
Based on professions survey responses scaled to the estimate of 1,401 qualified RTs working in Australia derived from the facilities survey;
State/Territory refers to current work location, not residence; Table may contain rounding errors due to scaling of responses to population
The estimated retirement numbers of 268 (adjusted for the number of „not stated‟
respondents) over the next ten years suggest that an average of 26.8 RTs will retire each year.
In addition, based on Table 7.8, a further 38 will cease practice as a result of pursuing a career
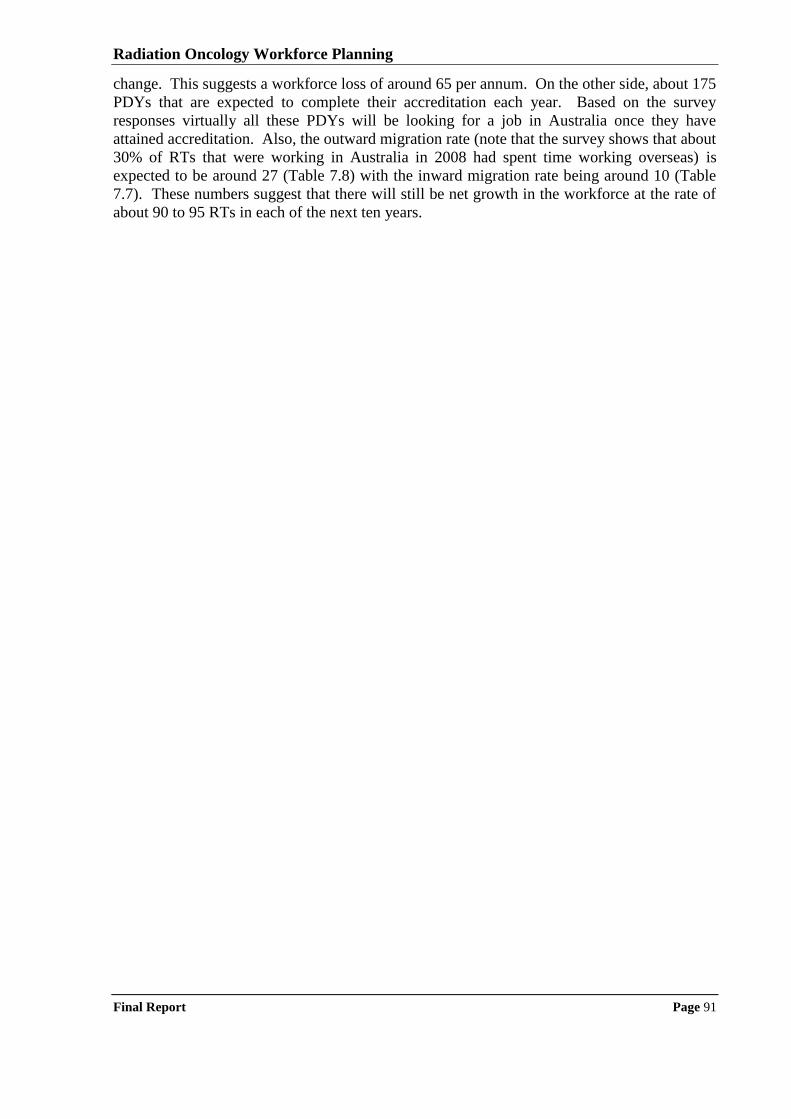
Radiation Oncology Workforce Planning
Final Report Page 91
change. This suggests a workforce loss of around 65 per annum. On the other side, about 175
PDYs that are expected to complete their accreditation each year. Based on the survey
responses virtually all these PDYs will be looking for a job in Australia once they have
attained accreditation. Also, the outward migration rate (note that the survey shows that about
30% of RTs that were working in Australia in 2008 had spent time working overseas) is
expected to be around 27 (Table 7.8) with the inward migration rate being around 10 (Table
7.7). These numbers suggest that there will still be net growth in the workforce at the rate of
about 90 to 95 RTs in each of the next ten years.
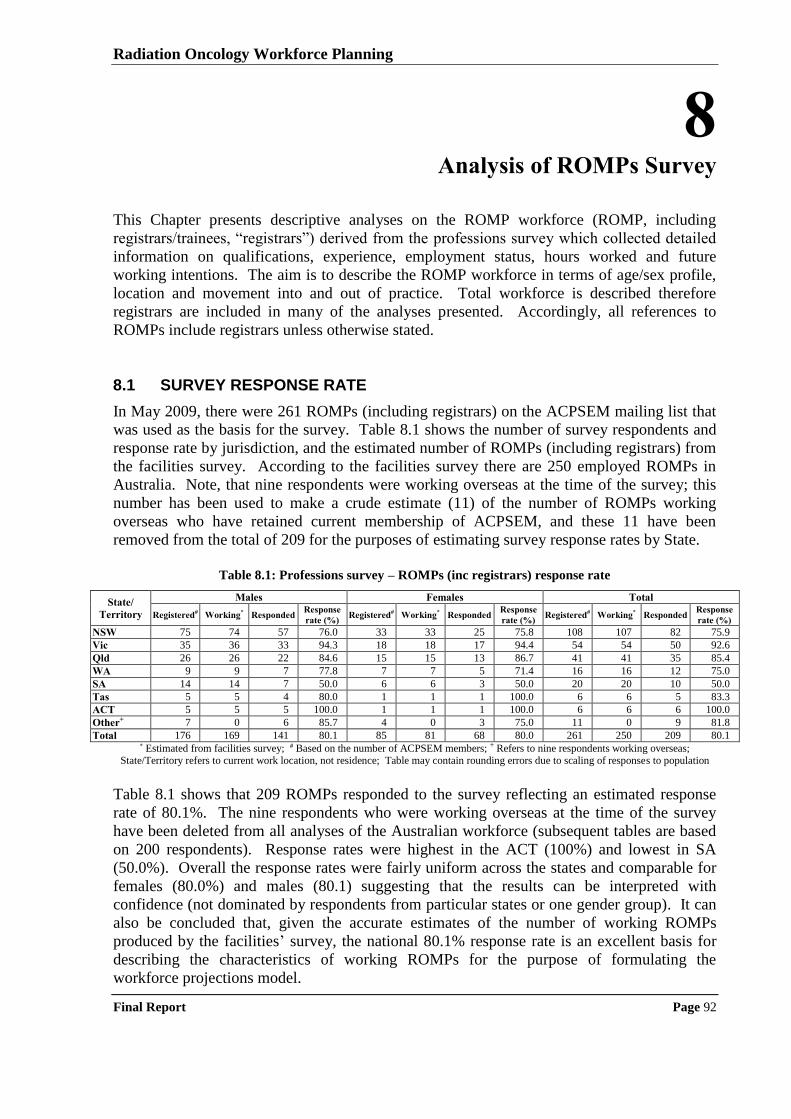
Radiation Oncology Workforce Planning
Final Report Page 92
8 Analysis of ROMPs Survey
This Chapter presents descriptive analyses on the ROMP workforce (ROMP, including
registrars/trainees, “registrars”) derived from the professions survey which collected detailed
information on qualifications, experience, employment status, hours worked and future
working intentions. The aim is to describe the ROMP workforce in terms of age/sex profile,
location and movement into and out of practice. Total workforce is described therefore
registrars are included in many of the analyses presented. Accordingly, all references to
ROMPs include registrars unless otherwise stated.
8.1 SURVEY RESPONSE RATE
In May 2009, there were 261 ROMPs (including registrars) on the ACPSEM mailing list that
was used as the basis for the survey. Table 8.1 shows the number of survey respondents and
response rate by jurisdiction, and the estimated number of ROMPs (including registrars) from
the facilities survey. According to the facilities survey there are 250 employed ROMPs in
Australia. Note, that nine respondents were working overseas at the time of the survey; this
number has been used to make a crude estimate (11) of the number of ROMPs working
overseas who have retained current membership of ACPSEM, and these 11 have been
removed from the total of 209 for the purposes of estimating survey response rates by State.
Table 8.1: Professions survey – ROMPs (inc registrars) response rate
State/
Territory
Males Females Total
Registered# Working* Responded Response
rate (%) Registered# Working* Responded
Response
rate (%) Registered# Working* Responded
Response
rate (%)
NSW 75 74 57 76.0 33 33 25 75.8 108 107 82 75.9
Vic 35 36 33 94.3 18 18 17 94.4 54 54 50 92.6
Qld 26 26 22 84.6 15 15 13 86.7 41 41 35 85.4
WA 9 9 7 77.8 7 7 5 71.4 16 16 12 75.0
SA 14 14 7 50.0 6 6 3 50.0 20 20 10 50.0
Tas 5 5 4 80.0 1 1 1 100.0 6 6 5 83.3
ACT 5 5 5 100.0 1 1 1 100.0 6 6 6 100.0
Other+ 7 0 6 85.7 4 0 3 75.0 11 0 9 81.8
Total 176 169 141 80.1 85 81 68 80.0 261 250 209 80.1 * Estimated from facilities survey; # Based on the number of ACPSEM members; + Refers to nine respondents working overseas;
State/Territory refers to current work location, not residence; Table may contain rounding errors due to scaling of responses to population
Table 8.1 shows that 209 ROMPs responded to the survey reflecting an estimated response
rate of 80.1%. The nine respondents who were working overseas at the time of the survey
have been deleted from all analyses of the Australian workforce (subsequent tables are based
on 200 respondents). Response rates were highest in the ACT (100%) and lowest in SA
(50.0%). Overall the response rates were fairly uniform across the states and comparable for
females (80.0%) and males (80.1) suggesting that the results can be interpreted with
confidence (not dominated by respondents from particular states or one gender group). It can
also be concluded that, given the accurate estimates of the number of working ROMPs
produced by the facilities‟ survey, the national 80.1% response rate is an excellent basis for
describing the characteristics of working ROMPs for the purpose of formulating the
workforce projections model.
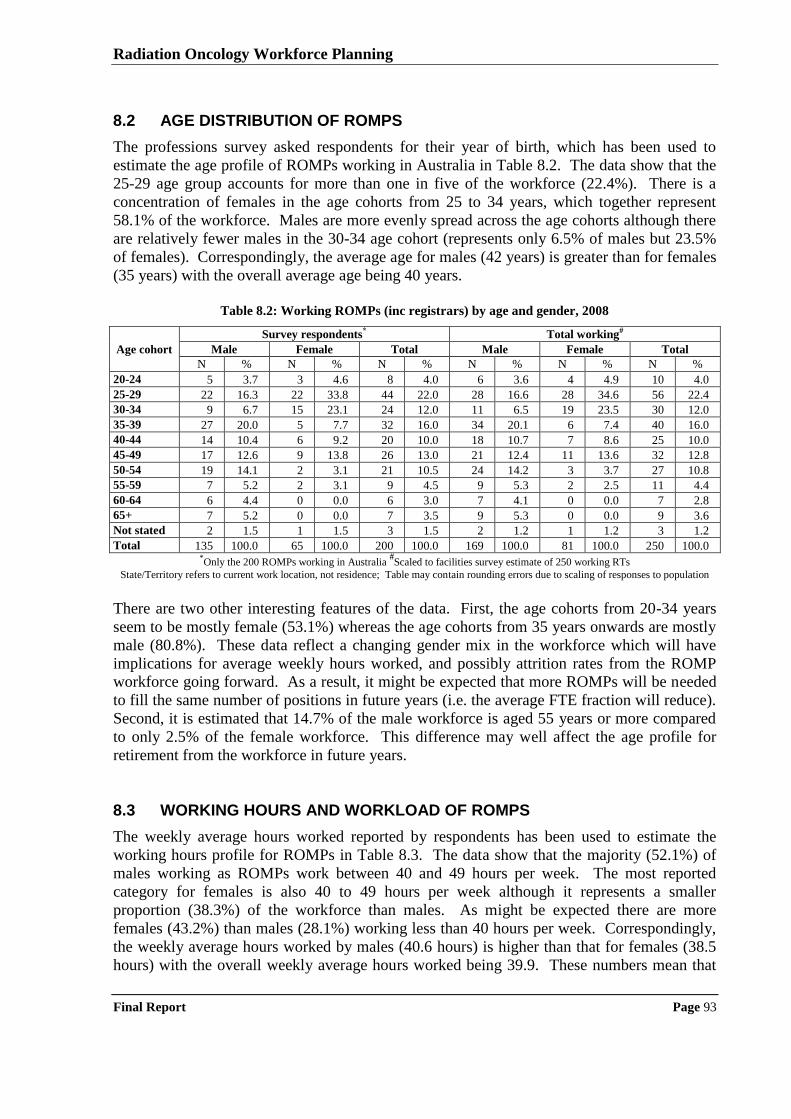
Radiation Oncology Workforce Planning
Final Report Page 93
8.2 AGE DISTRIBUTION OF ROMPS
The professions survey asked respondents for their year of birth, which has been used to
estimate the age profile of ROMPs working in Australia in Table 8.2. The data show that the
25-29 age group accounts for more than one in five of the workforce (22.4%). There is a
concentration of females in the age cohorts from 25 to 34 years, which together represent
58.1% of the workforce. Males are more evenly spread across the age cohorts although there
are relatively fewer males in the 30-34 age cohort (represents only 6.5% of males but 23.5%
of females). Correspondingly, the average age for males (42 years) is greater than for females
(35 years) with the overall average age being 40 years.
Table 8.2: Working ROMPs (inc registrars) by age and gender, 2008
Age cohort
Survey respondents* Total working#
Male Female Total Male Female Total
N % N % N % N % N % N %
20-24 5 3.7 3 4.6 8 4.0 6 3.6 4 4.9 10 4.0
25-29 22 16.3 22 33.8 44 22.0 28 16.6 28 34.6 56 22.4
30-34 9 6.7 15 23.1 24 12.0 11 6.5 19 23.5 30 12.0
35-39 27 20.0 5 7.7 32 16.0 34 20.1 6 7.4 40 16.0
40-44 14 10.4 6 9.2 20 10.0 18 10.7 7 8.6 25 10.0
45-49 17 12.6 9 13.8 26 13.0 21 12.4 11 13.6 32 12.8
50-54 19 14.1 2 3.1 21 10.5 24 14.2 3 3.7 27 10.8
55-59 7 5.2 2 3.1 9 4.5 9 5.3 2 2.5 11 4.4
60-64 6 4.4 0 0.0 6 3.0 7 4.1 0 0.0 7 2.8
65+ 7 5.2 0 0.0 7 3.5 9 5.3 0 0.0 9 3.6
Not stated 2 1.5 1 1.5 3 1.5 2 1.2 1 1.2 3 1.2
Total 135 100.0 65 100.0 200 100.0 169 100.0 81 100.0 250 100.0 *Only the 200 ROMPs working in Australia
#Scaled to facilities survey estimate of 250 working RTs
State/Territory refers to current work location, not residence; Table may contain rounding errors due to scaling of responses to population
There are two other interesting features of the data. First, the age cohorts from 20-34 years
seem to be mostly female (53.1%) whereas the age cohorts from 35 years onwards are mostly
male (80.8%). These data reflect a changing gender mix in the workforce which will have
implications for average weekly hours worked, and possibly attrition rates from the ROMP
workforce going forward. As a result, it might be expected that more ROMPs will be needed
to fill the same number of positions in future years (i.e. the average FTE fraction will reduce).
Second, it is estimated that 14.7% of the male workforce is aged 55 years or more compared
to only 2.5% of the female workforce. This difference may well affect the age profile for
retirement from the workforce in future years.
8.3 WORKING HOURS AND WORKLOAD OF ROMPS
The weekly average hours worked reported by respondents has been used to estimate the
working hours profile for ROMPs in Table 8.3. The data show that the majority (52.1%) of
males working as ROMPs work between 40 and 49 hours per week. The most reported
category for females is also 40 to 49 hours per week although it represents a smaller
proportion (38.3%) of the workforce than males. As might be expected there are more
females (43.2%) than males (28.1%) working less than 40 hours per week. Correspondingly,
the weekly average hours worked by males (40.6 hours) is higher than that for females (38.5
hours) with the overall weekly average hours worked being 39.9. These numbers mean that
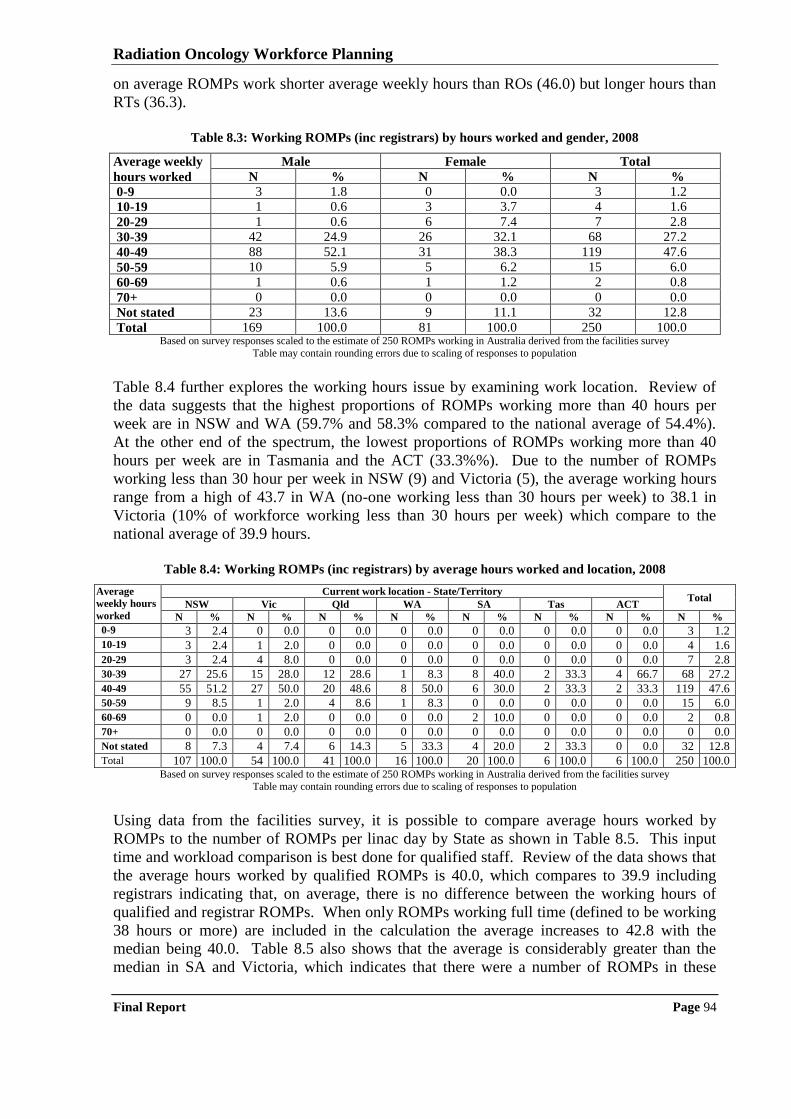
Radiation Oncology Workforce Planning
Final Report Page 94
on average ROMPs work shorter average weekly hours than ROs (46.0) but longer hours than
RTs (36.3).
Table 8.3: Working ROMPs (inc registrars) by hours worked and gender, 2008
Average weekly
hours worked
Male Female Total
N % N % N %
0-9 3 1.8 0 0.0 3 1.2
10-19 1 0.6 3 3.7 4 1.6
20-29 1 0.6 6 7.4 7 2.8
30-39 42 24.9 26 32.1 68 27.2
40-49 88 52.1 31 38.3 119 47.6
50-59 10 5.9 5 6.2 15 6.0
60-69 1 0.6 1 1.2 2 0.8
70+ 0 0.0 0 0.0 0 0.0
Not stated 23 13.6 9 11.1 32 12.8
Total 169 100.0 81 100.0 250 100.0 Based on survey responses scaled to the estimate of 250 ROMPs working in Australia derived from the facilities survey
Table may contain rounding errors due to scaling of responses to population
Table 8.4 further explores the working hours issue by examining work location. Review of
the data suggests that the highest proportions of ROMPs working more than 40 hours per
week are in NSW and WA (59.7% and 58.3% compared to the national average of 54.4%).
At the other end of the spectrum, the lowest proportions of ROMPs working more than 40
hours per week are in Tasmania and the ACT (33.3%%). Due to the number of ROMPs
working less than 30 hour per week in NSW (9) and Victoria (5), the average working hours
range from a high of 43.7 in WA (no-one working less than 30 hours per week) to 38.1 in
Victoria (10% of workforce working less than 30 hours per week) which compare to the
national average of 39.9 hours.
Table 8.4: Working ROMPs (inc registrars) by average hours worked and location, 2008
Average
weekly hours
worked
Current work location - State/Territory Total
NSW Vic Qld WA SA Tas ACT
N % N % N % N % N % N % N % N %
0-9 3 2.4 0 0.0 0 0.0 0 0.0 0 0.0 0 0.0 0 0.0 3 1.2 10-19 3 2.4 1 2.0 0 0.0 0 0.0 0 0.0 0 0.0 0 0.0 4 1.6
20-29 3 2.4 4 8.0 0 0.0 0 0.0 0 0.0 0 0.0 0 0.0 7 2.8
30-39 27 25.6 15 28.0 12 28.6 1 8.3 8 40.0 2 33.3 4 66.7 68 27.2
40-49 55 51.2 27 50.0 20 48.6 8 50.0 6 30.0 2 33.3 2 33.3 119 47.6
50-59 9 8.5 1 2.0 4 8.6 1 8.3 0 0.0 0 0.0 0 0.0 15 6.0
60-69 0 0.0 1 2.0 0 0.0 0 0.0 2 10.0 0 0.0 0 0.0 2 0.8
70+ 0 0.0 0 0.0 0 0.0 0 0.0 0 0.0 0 0.0 0 0.0 0 0.0
Not stated 8 7.3 4 7.4 6 14.3 5 33.3 4 20.0 2 33.3 0 0.0 32 12.8
Total 107 100.0 54 100.0 41 100.0 16 100.0 20 100.0 6 100.0 6 100.0 250 100.0 Based on survey responses scaled to the estimate of 250 ROMPs working in Australia derived from the facilities survey
Table may contain rounding errors due to scaling of responses to population
Using data from the facilities survey, it is possible to compare average hours worked by
ROMPs to the number of ROMPs per linac day by State as shown in Table 8.5. This input
time and workload comparison is best done for qualified staff. Review of the data shows that
the average hours worked by qualified ROMPs is 40.0, which compares to 39.9 including
registrars indicating that, on average, there is no difference between the working hours of
qualified and registrar ROMPs. When only ROMPs working full time (defined to be working
38 hours or more) are included in the calculation the average increases to 42.8 with the
median being 40.0. Table 8.5 also shows that the average is considerably greater than the
median in SA and Victoria, which indicates that there were a number of ROMPs in these
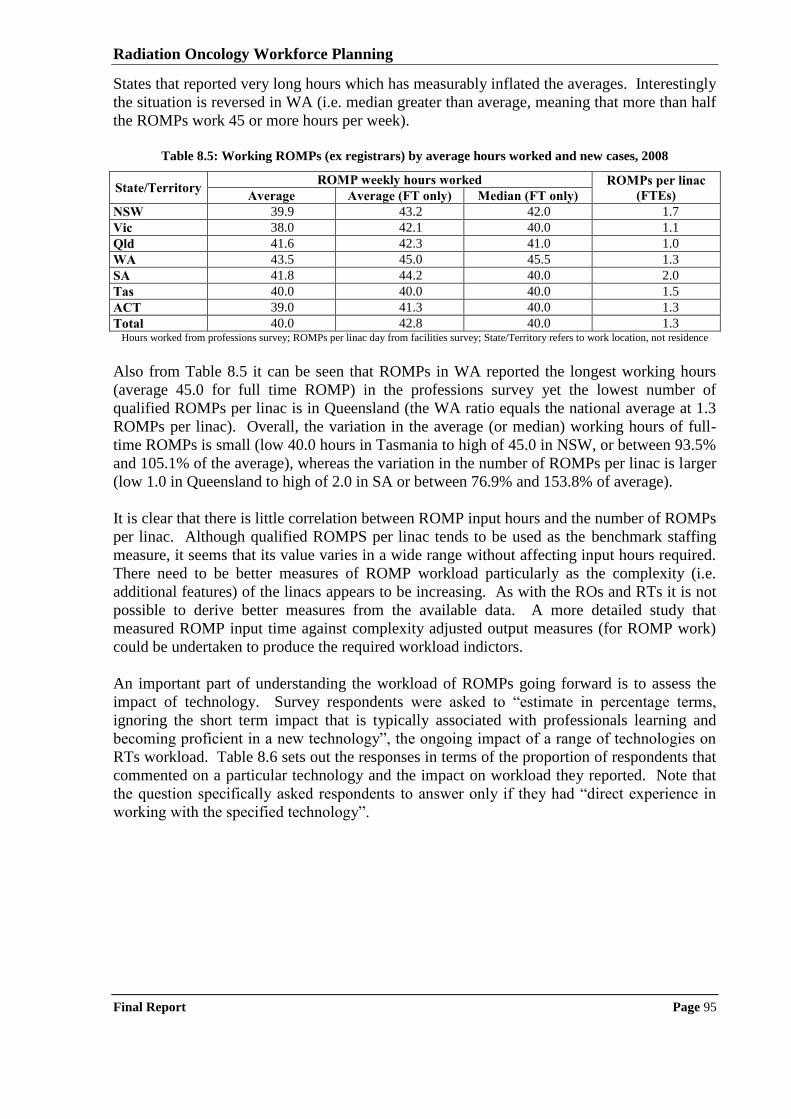
Radiation Oncology Workforce Planning
Final Report Page 95
States that reported very long hours which has measurably inflated the averages. Interestingly
the situation is reversed in WA (i.e. median greater than average, meaning that more than half
the ROMPs work 45 or more hours per week).
Table 8.5: Working ROMPs (ex registrars) by average hours worked and new cases, 2008
State/Territory ROMP weekly hours worked ROMPs per linac
(FTEs) Average Average (FT only) Median (FT only)
NSW 39.9 43.2 42.0 1.7
Vic 38.0 42.1 40.0 1.1
Qld 41.6 42.3 41.0 1.0
WA 43.5 45.0 45.5 1.3
SA 41.8 44.2 40.0 2.0
Tas 40.0 40.0 40.0 1.5
ACT 39.0 41.3 40.0 1.3
Total 40.0 42.8 40.0 1.3 Hours worked from professions survey; ROMPs per linac day from facilities survey; State/Territory refers to work location, not residence
Also from Table 8.5 it can be seen that ROMPs in WA reported the longest working hours
(average 45.0 for full time ROMP) in the professions survey yet the lowest number of
qualified ROMPs per linac is in Queensland (the WA ratio equals the national average at 1.3
ROMPs per linac). Overall, the variation in the average (or median) working hours of full-
time ROMPs is small (low 40.0 hours in Tasmania to high of 45.0 in NSW, or between 93.5%
and 105.1% of the average), whereas the variation in the number of ROMPs per linac is larger
(low 1.0 in Queensland to high of 2.0 in SA or between 76.9% and 153.8% of average).
It is clear that there is little correlation between ROMP input hours and the number of ROMPs
per linac. Although qualified ROMPS per linac tends to be used as the benchmark staffing
measure, it seems that its value varies in a wide range without affecting input hours required.
There need to be better measures of ROMP workload particularly as the complexity (i.e.
additional features) of the linacs appears to be increasing. As with the ROs and RTs it is not
possible to derive better measures from the available data. A more detailed study that
measured ROMP input time against complexity adjusted output measures (for ROMP work)
could be undertaken to produce the required workload indictors.
An important part of understanding the workload of ROMPs going forward is to assess the
impact of technology. Survey respondents were asked to “estimate in percentage terms,
ignoring the short term impact that is typically associated with professionals learning and
becoming proficient in a new technology”, the ongoing impact of a range of technologies on
RTs workload. Table 8.6 sets out the responses in terms of the proportion of respondents that
commented on a particular technology and the impact on workload they reported. Note that
the question specifically asked respondents to answer only if they had “direct experience in
working with the specified technology”.
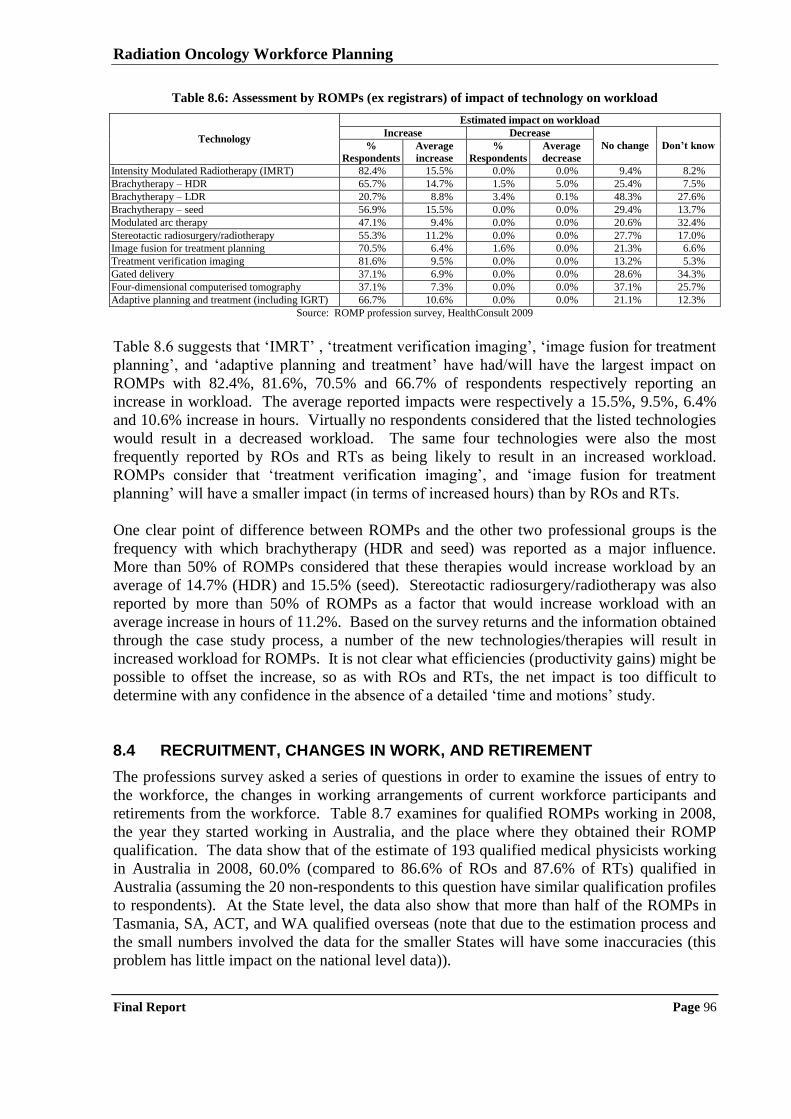
Radiation Oncology Workforce Planning
Final Report Page 96
Table 8.6: Assessment by ROMPs (ex registrars) of impact of technology on workload
Technology
Estimated impact on workload
Increase Decrease
No change Don’t know %
Respondents
Average
increase
%
Respondents
Average
decrease
Intensity Modulated Radiotherapy (IMRT) 82.4% 15.5% 0.0% 0.0% 9.4% 8.2%
Brachytherapy – HDR 65.7% 14.7% 1.5% 5.0% 25.4% 7.5%
Brachytherapy – LDR 20.7% 8.8% 3.4% 0.1% 48.3% 27.6%
Brachytherapy – seed 56.9% 15.5% 0.0% 0.0% 29.4% 13.7%
Modulated arc therapy 47.1% 9.4% 0.0% 0.0% 20.6% 32.4%
Stereotactic radiosurgery/radiotherapy 55.3% 11.2% 0.0% 0.0% 27.7% 17.0%
Image fusion for treatment planning 70.5% 6.4% 1.6% 0.0% 21.3% 6.6%
Treatment verification imaging 81.6% 9.5% 0.0% 0.0% 13.2% 5.3%
Gated delivery 37.1% 6.9% 0.0% 0.0% 28.6% 34.3%
Four-dimensional computerised tomography 37.1% 7.3% 0.0% 0.0% 37.1% 25.7%
Adaptive planning and treatment (including IGRT) 66.7% 10.6% 0.0% 0.0% 21.1% 12.3%
Source: ROMP profession survey, HealthConsult 2009
Table 8.6 suggests that „IMRT‟ , „treatment verification imaging‟, „image fusion for treatment
planning‟, and „adaptive planning and treatment‟ have had/will have the largest impact on
ROMPs with 82.4%, 81.6%, 70.5% and 66.7% of respondents respectively reporting an
increase in workload. The average reported impacts were respectively a 15.5%, 9.5%, 6.4%
and 10.6% increase in hours. Virtually no respondents considered that the listed technologies
would result in a decreased workload. The same four technologies were also the most
frequently reported by ROs and RTs as being likely to result in an increased workload.
ROMPs consider that „treatment verification imaging‟, and „image fusion for treatment
planning‟ will have a smaller impact (in terms of increased hours) than by ROs and RTs.
One clear point of difference between ROMPs and the other two professional groups is the
frequency with which brachytherapy (HDR and seed) was reported as a major influence.
More than 50% of ROMPs considered that these therapies would increase workload by an
average of 14.7% (HDR) and 15.5% (seed). Stereotactic radiosurgery/radiotherapy was also
reported by more than 50% of ROMPs as a factor that would increase workload with an
average increase in hours of 11.2%. Based on the survey returns and the information obtained
through the case study process, a number of the new technologies/therapies will result in
increased workload for ROMPs. It is not clear what efficiencies (productivity gains) might be
possible to offset the increase, so as with ROs and RTs, the net impact is too difficult to
determine with any confidence in the absence of a detailed „time and motions‟ study.
8.4 RECRUITMENT, CHANGES IN WORK, AND RETIREMENT
The professions survey asked a series of questions in order to examine the issues of entry to
the workforce, the changes in working arrangements of current workforce participants and
retirements from the workforce. Table 8.7 examines for qualified ROMPs working in 2008,
the year they started working in Australia, and the place where they obtained their ROMP
qualification. The data show that of the estimate of 193 qualified medical physicists working
in Australia in 2008, 60.0% (compared to 86.6% of ROs and 87.6% of RTs) qualified in
Australia (assuming the 20 non-respondents to this question have similar qualification profiles
to respondents). At the State level, the data also show that more than half of the ROMPs in
Tasmania, SA, ACT, and WA qualified overseas (note that due to the estimation process and
the small numbers involved the data for the smaller States will have some inaccuracies (this
problem has little impact on the national level data)).
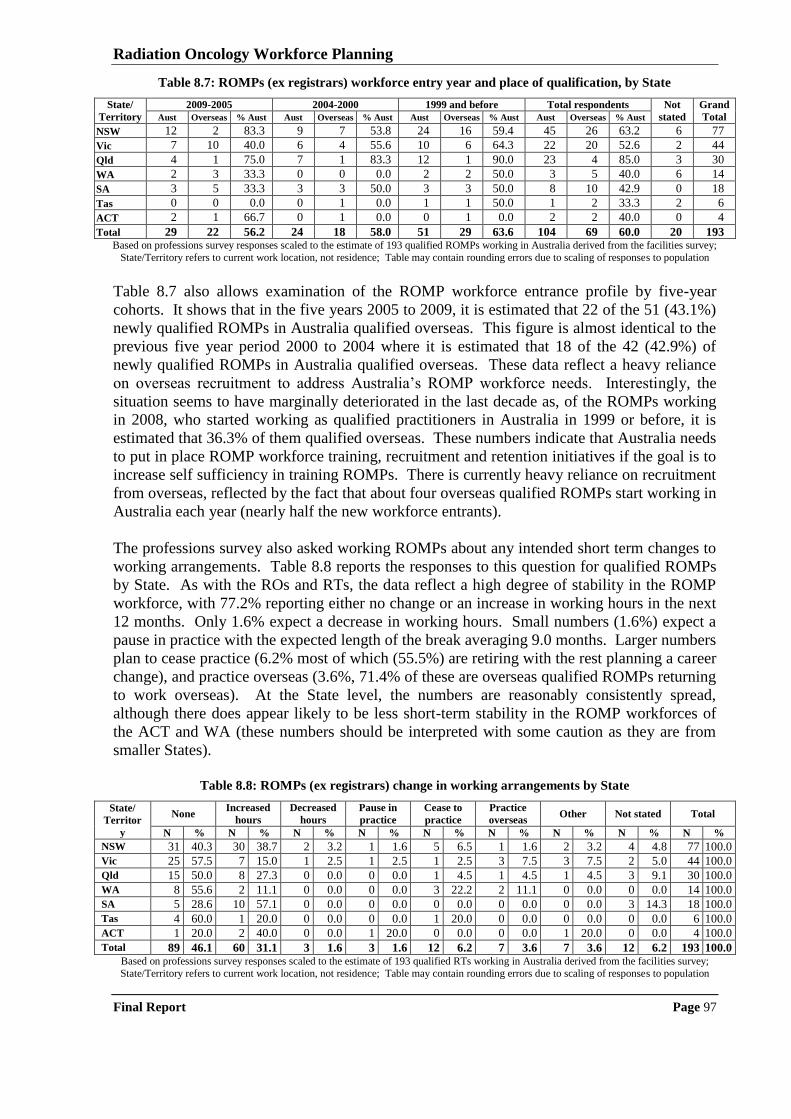
Radiation Oncology Workforce Planning
Final Report Page 97
Table 8.7: ROMPs (ex registrars) workforce entry year and place of qualification, by State
State/
Territory
2009-2005 2004-2000 1999 and before Total respondents Not
stated
Grand
Total Aust Overseas % Aust Aust Overseas % Aust Aust Overseas % Aust Aust Overseas % Aust
NSW 12 2 83.3 9 7 53.8 24 16 59.4 45 26 63.2 6 77
Vic 7 10 40.0 6 4 55.6 10 6 64.3 22 20 52.6 2 44
Qld 4 1 75.0 7 1 83.3 12 1 90.0 23 4 85.0 3 30
WA 2 3 33.3 0 0 0.0 2 2 50.0 3 5 40.0 6 14
SA 3 5 33.3 3 3 50.0 3 3 50.0 8 10 42.9 0 18
Tas 0 0 0.0 0 1 0.0 1 1 50.0 1 2 33.3 2 6
ACT 2 1 66.7 0 1 0.0 0 1 0.0 2 2 40.0 0 4
Total 29 22 56.2 24 18 58.0 51 29 63.6 104 69 60.0 20 193 Based on professions survey responses scaled to the estimate of 193 qualified ROMPs working in Australia derived from the facilities survey;
State/Territory refers to current work location, not residence; Table may contain rounding errors due to scaling of responses to population
Table 8.7 also allows examination of the ROMP workforce entrance profile by five-year
cohorts. It shows that in the five years 2005 to 2009, it is estimated that 22 of the 51 (43.1%)
newly qualified ROMPs in Australia qualified overseas. This figure is almost identical to the
previous five year period 2000 to 2004 where it is estimated that 18 of the 42 (42.9%) of
newly qualified ROMPs in Australia qualified overseas. These data reflect a heavy reliance
on overseas recruitment to address Australia‟s ROMP workforce needs. Interestingly, the
situation seems to have marginally deteriorated in the last decade as, of the ROMPs working
in 2008, who started working as qualified practitioners in Australia in 1999 or before, it is
estimated that 36.3% of them qualified overseas. These numbers indicate that Australia needs
to put in place ROMP workforce training, recruitment and retention initiatives if the goal is to
increase self sufficiency in training ROMPs. There is currently heavy reliance on recruitment
from overseas, reflected by the fact that about four overseas qualified ROMPs start working in
Australia each year (nearly half the new workforce entrants).
The professions survey also asked working ROMPs about any intended short term changes to
working arrangements. Table 8.8 reports the responses to this question for qualified ROMPs
by State. As with the ROs and RTs, the data reflect a high degree of stability in the ROMP
workforce, with 77.2% reporting either no change or an increase in working hours in the next
12 months. Only 1.6% expect a decrease in working hours. Small numbers (1.6%) expect a
pause in practice with the expected length of the break averaging 9.0 months. Larger numbers
plan to cease practice (6.2% most of which (55.5%) are retiring with the rest planning a career
change), and practice overseas (3.6%, 71.4% of these are overseas qualified ROMPs returning
to work overseas). At the State level, the numbers are reasonably consistently spread,
although there does appear likely to be less short-term stability in the ROMP workforces of
the ACT and WA (these numbers should be interpreted with some caution as they are from
smaller States).
Table 8.8: ROMPs (ex registrars) change in working arrangements by State
State/
Territor
y
None Increased
hours
Decreased
hours
Pause in
practice
Cease to
practice
Practice
overseas Other Not stated Total
N % N % N % N % N % N % N % N % N %
NSW 31 40.3 30 38.7 2 3.2 1 1.6 5 6.5 1 1.6 2 3.2 4 4.8 77 100.0
Vic 25 57.5 7 15.0 1 2.5 1 2.5 1 2.5 3 7.5 3 7.5 2 5.0 44 100.0
Qld 15 50.0 8 27.3 0 0.0 0 0.0 1 4.5 1 4.5 1 4.5 3 9.1 30 100.0
WA 8 55.6 2 11.1 0 0.0 0 0.0 3 22.2 2 11.1 0 0.0 0 0.0 14 100.0
SA 5 28.6 10 57.1 0 0.0 0 0.0 0 0.0 0 0.0 0 0.0 3 14.3 18 100.0
Tas 4 60.0 1 20.0 0 0.0 0 0.0 1 20.0 0 0.0 0 0.0 0 0.0 6 100.0
ACT 1 20.0 2 40.0 0 0.0 1 20.0 0 0.0 0 0.0 1 20.0 0 0.0 4 100.0
Total 89 46.1 60 31.1 3 1.6 3 1.6 12 6.2 7 3.6 7 3.6 12 6.2 193 100.0 Based on professions survey responses scaled to the estimate of 193 qualified RTs working in Australia derived from the facilities survey;
State/Territory refers to current work location, not residence; Table may contain rounding errors due to scaling of responses to population
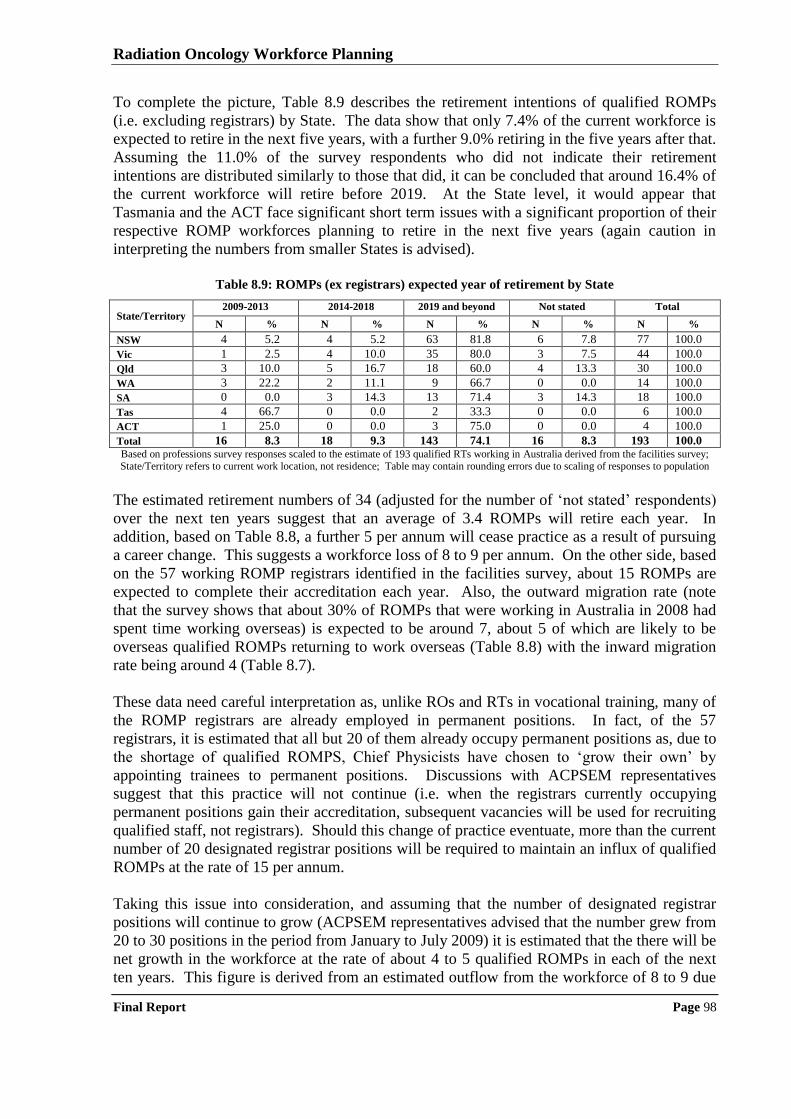
Radiation Oncology Workforce Planning
Final Report Page 98
To complete the picture, Table 8.9 describes the retirement intentions of qualified ROMPs
(i.e. excluding registrars) by State. The data show that only 7.4% of the current workforce is
expected to retire in the next five years, with a further 9.0% retiring in the five years after that.
Assuming the 11.0% of the survey respondents who did not indicate their retirement
intentions are distributed similarly to those that did, it can be concluded that around 16.4% of
the current workforce will retire before 2019. At the State level, it would appear that
Tasmania and the ACT face significant short term issues with a significant proportion of their
respective ROMP workforces planning to retire in the next five years (again caution in
interpreting the numbers from smaller States is advised).
Table 8.9: ROMPs (ex registrars) expected year of retirement by State
State/Territory 2009-2013 2014-2018 2019 and beyond Not stated Total
N % N % N % N % N %
NSW 4 5.2 4 5.2 63 81.8 6 7.8 77 100.0
Vic 1 2.5 4 10.0 35 80.0 3 7.5 44 100.0
Qld 3 10.0 5 16.7 18 60.0 4 13.3 30 100.0
WA 3 22.2 2 11.1 9 66.7 0 0.0 14 100.0
SA 0 0.0 3 14.3 13 71.4 3 14.3 18 100.0
Tas 4 66.7 0 0.0 2 33.3 0 0.0 6 100.0
ACT 1 25.0 0 0.0 3 75.0 0 0.0 4 100.0
Total 16 8.3 18 9.3 143 74.1 16 8.3 193 100.0 Based on professions survey responses scaled to the estimate of 193 qualified RTs working in Australia derived from the facilities survey; State/Territory refers to current work location, not residence; Table may contain rounding errors due to scaling of responses to population
The estimated retirement numbers of 34 (adjusted for the number of „not stated‟ respondents)
over the next ten years suggest that an average of 3.4 ROMPs will retire each year. In
addition, based on Table 8.8, a further 5 per annum will cease practice as a result of pursuing
a career change. This suggests a workforce loss of 8 to 9 per annum. On the other side, based
on the 57 working ROMP registrars identified in the facilities survey, about 15 ROMPs are
expected to complete their accreditation each year. Also, the outward migration rate (note
that the survey shows that about 30% of ROMPs that were working in Australia in 2008 had
spent time working overseas) is expected to be around 7, about 5 of which are likely to be
overseas qualified ROMPs returning to work overseas (Table 8.8) with the inward migration
rate being around 4 (Table 8.7).
These data need careful interpretation as, unlike ROs and RTs in vocational training, many of
the ROMP registrars are already employed in permanent positions. In fact, of the 57
registrars, it is estimated that all but 20 of them already occupy permanent positions as, due to
the shortage of qualified ROMPS, Chief Physicists have chosen to „grow their own‟ by
appointing trainees to permanent positions. Discussions with ACPSEM representatives
suggest that this practice will not continue (i.e. when the registrars currently occupying
permanent positions gain their accreditation, subsequent vacancies will be used for recruiting
qualified staff, not registrars). Should this change of practice eventuate, more than the current
number of 20 designated registrar positions will be required to maintain an influx of qualified
ROMPs at the rate of 15 per annum.
Taking this issue into consideration, and assuming that the number of designated registrar
positions will continue to grow (ACPSEM representatives advised that the number grew from
20 to 30 positions in the period from January to July 2009) it is estimated that the there will be
net growth in the workforce at the rate of about 4 to 5 qualified ROMPs in each of the next
ten years. This figure is derived from an estimated outflow from the workforce of 8 to 9 due
Radiation Oncology Workforce Planning
Final Report Page 99
to retirement and withdrawal from practice plus 6 to 7 going overseas (i.e. 14 to 16 going out)
against an inflow of 15 registrars completing accreditation plus 4 to 5 qualified ROMPS
coming from overseas to work in Australia (i.e. 19 to 20 coming in).
Radiation Oncology Workforce Planning
Final Report Page 100
9 Case study analysis
This Chapter provides a thematic analysis of the information collected from the visits to 20
radiation oncology services around Australia. The focus of the case studies was on workforce
recruitment and retention issues and strategies; as well as gaining information about possible
changes in workload that may affect workforce needs in the near future. As part of the
thematic analysis information from public sector sites was compared to private sector sites;
and metropolitan sites were compared to regional sites. Where differences were identified the
themes and patterns have been presented separately.
9.1 CURRENT WORKFORCE SITUATION
This section presents stakeholder views (in relatively raw form) about the current workforce
issues, and strategies that have been developed to address the issues. It starts by presenting
the general issues and then those that are specific to public metropolitan, public regional and
private facilities (there were not sufficient private regional facilities case studies to separate
private sector views into metropolitan and regional). A summary of the findings is provided
following presentation of the stakeholders‟ comments.
9.1.1 Comments common to all radiation oncology services
Commonly expressed workforce recruitment and retention strategies included:
flexible working arrangements (including study leave, nine day fortnights, four day
working weeks, conference leave and leave without pay) are highly valued by staff
(although management stated this flexibility makes roster scheduling difficult);
providing staff with opportunities to train on, and apply, the latest technologies is
important for effective recruitment and retention;
a good training environment assists in attracting staff to facilities;
supporting conference attendance and continuing professional development activities
assists in retaining staff (i.e. conference and training allowances as part of package); and
supporting staff to participate in research and clinical trials increases job satisfaction.
Commonly expressed workforce recruitment and retention issues included:
additional positions and time are needed to commission, and train staff to use, new
technology; most facilities only have the workforce to do the minimum (i.e. service
delivery), which can be very frustrating for staff;
there is a shortage of experienced staff (particularly RTs and ROMPs) which means more
work for staff in senior positions;
public and private facilities compete for the same workforce, this creates particular
difficulties in some areas of Australia;
many facilities have purchased linacs with various advanced capabilities e.g. cone beam
CT, however the funds are not available to commission and use the technology;
Radiation Oncology Workforce Planning
Final Report Page 101
there should be more cross disciplinary training (i.e. all three professions coming together
in a conference/training setting) to encourage networking and better collaboration;
it is difficult to recruit ROs and ROMPs to regional areas, it is a location issue, they feel
professional isolation in regional areas; and
there is a common perception that regional facilities have smaller staff numbers; more
basic technology; fewer career opportunities; less support to maintain skills and work
longer hours which creates a barrier to recruitment.
Some of the workforce recruitment and retention strategies and issues were specific to
particular disciplines. The common themes by professional discipline are summarised below.
Workforce recruitment and retention strategies specific to ROs include:
smaller states and regional areas find that the best way to recruit ROs is by training locally
(i.e. getting accredited registrars positions) – they do not tend to get applicants from
interstate unless these are for senior positions; and
ensuring collegial support to prevent professional isolation (e.g. by developing
collaborative arrangements with larger facilities).
Workforce recruitment and retention issues specific to ROs include:
the work of a RO does not get much exposure; it does not feature much on the medical
curriculum, which makes it more difficult to attract registrars;
there is a need for more registrar positions; there are enough new cancer cases to train
more ROs, however more funds are required; and
often there are no vacancies purely because there is no funding for positions.
Workforce recruitment and retention strategies specific to RTs include:
the option to take leave without pay is attractive to RTs, however this practice creates
more temporary positions and temporary positions are harder to fill;
the ability to be able to work part time particularly when returning from maternity leave
assists in retaining staff;
shift work has an effect on retention, as mainly the younger and more senior staff are not
interested in working shifts, however it is liked by many part time staff;
diversification of RTs role (i.e. role expansion opportunities) whether it includes more
responsibility or sub-specialisation makes the RT career more attractive; and
retention is linked to challenging staff, particularly the younger generation.
Workforce recruitment and retention issues specific to RTs include:
at present, in general, it is not difficult to recruit RTs; there are enough experienced RTs
and junior RTs but the middle age group is under-represented in the profession;
there are more RTs than jobs in major cities, but they are not willing to go to regional
areas or smaller states;
there is difficulty in managing part time RTs, particularly those with considerable
experience who leave full time positions (e.g. maternity leave) and come back part time;
there is a current shortage of permanent RT positions to recruit to, which is an outcome of
a high proportion of staff taking leave (mainly maternity leave);
there is little opportunity for RTs to move into senior management; career progression is
limited and RTs are being lost to other professions as a result;
Radiation Oncology Workforce Planning
Final Report Page 102
some facilities are having trouble dealing with the career expectations of ambitious junior
RTs and as a consequence they are being lost to other professions;
a lack of professional identity creates a retention problem; there is no avenue to pursue
specialised RT roles;
unable to retain PDYs after their training year unless temporary contracts of varying
lengths can be offered; and
Sydney University dropping its undergraduate RT program will impact on the workforce.
Workforce recruitment and retention strategies specific to ROMPs include:
overseas recruitment is used to deal with ROMP shortages in Australia;
the main recruitment drawcard for ROMPs is technology; having access to PET, CT, MRI
and a modern linac is attractive to ROMPs;
competency based career progression, matched to better remuneration has improved the
ROMP career pathway;
a good training environment is an important component of retaining ROMPs; and
the introduction of the TEAP program and ROMP registrars has bought more ROMPs into
the profession.
Workforce recruitment and retention issues specific to ROMPs include:
machines run with less than required ROMPs across the public and private sector, where
the average number of physicists per linac is below the benchmark of 1.7;
it is difficult to recruit senior ROMPs at the moment but registrars and base grades are
easier to recruit;
recruitment, particularly from overseas, can be difficult and lengthy;
ROMPs are not on the list for „occupations in need‟ – changing this would speed up
overseas recruitment;
Australia is losing staff overseas due to better technology and remuneration (e.g. Canada);
the amount of „out of hours‟ work that is required is not attractive to ROMPs;
on the job training is expensive;
the NSW award does not impact on junior staff, but impacts on the ability to recruit senior
staff to locations outside NSW, a national award is needed;
facilities cannot afford to have inexperienced staff with sophisticated equipment; and
individuals who have completed a PhD in physics are still expected to complete TEAP
including the Masters which prevents some senior physicists from entering the profession.
9.1.2 Comments from public metropolitan facilities
Workforce recruitment and retention issues specific to public metropolitan facilities include:
staff prefer to work in a city location because there is the perception of better access to
technology; collegial support; access to training; and education; and
a number of facilities indicated a preference for a national award, particularly for RTs and
ROMPs.
Workforce recruitment and retention strategies specific to ROs working in public
metropolitan facilities include:
ROs are attracted to work in academic departments; and
the ability to sub-specialise, even in smaller, centres is attractive to ROs.
Radiation Oncology Workforce Planning
Final Report Page 103
Workforce recruitment and retention issues that are specific to RTs working in public
metropolitan facilities include:
not enough funding for educator and research positions;
there is more scope for role diversification and specialisation in larger facilities; and
there is a currently an oversupply of RTs in large metropolitan areas; if the number being
trained increases then there needs to be places to put them in post-training.
Workforce recruitment and retention strategies that are specific to ROMPs working in public
metropolitan facilities include:
smaller states train their own staff then try to retain them; and
additional remuneration from retention payments helps smaller states attract staff.
9.1.3 Comments from public regional facilities
There were a number of workforce and retention strategies and issues that specifically impact
on public facilities located in regional areas.
Workforce recruitment and retention strategies specific to regional public facilities include:
more opportunities for role diversification in regional relative to metropolitan facilities,
e.g. RTs do more quality assessment work (i.e. role of ROMP) or treatment review (i.e.
role of ROs);
facilities have found that incentives (e.g. rent and/or relocation allowance, conference
allowance, taxation incentives) assist in recruiting staff; and
it is easier to find work in regional facilities as there is a lot of competition for positions in
the metropolitan facilities.
Workforce and retention issues specific to regional public facilities include:
regional facilities often work with a small number of staff and consequently staff are
usually under more workload pressure;
research and professional development activities attract staff, however it is harder to find
time to do research in regional areas, particularly due to smaller/inadequate staff numbers;
funding is not sufficient to attract staff to regional areas; and
it is hard to recruit experienced staff to regional facilities unless salaries are at a very
competitive level.
Workforce recruitment and retention issues specific to ROs in public regional facilities
include:
the location of a facility is often a big draw card for ROs, therefore it can be difficult to
recruit them to regional areas;
regional ROs spend a lot of time travelling;
registrars add to an already tight workload in regional areas; and
professional isolation is a problem for ROs working in regional areas
Workforce recruitment and retention issues specific to RTs in public regional facilities
include:
younger staff find the remuneration too low – not an incentive;
Radiation Oncology Workforce Planning
Final Report Page 104
location of the facility plays a big part in being able to recruit staff; generally RTs want
city jobs so as soon as a city job is advertised they leave regional areas;
many consider that remuneration is not the issue in regional areas, rather the desirability
of working in the location is the issue; and
in regional areas there is a large proportion of junior RTs, meaning that more
responsibility falls to those with less experience.
Workforce recruitment and retention strategies specific to ROMPs in public regional facilities
include:
there is considerable value with having the service tied to a university, PhD and Masters
students come and study at the facility and some end up working there;
development of special training programs and scholarships for rural students;
linking of regional facilities with a larger metropolitan service (collegial and back fill
support provided from larger centres);
funding for ROMPs from other centres to provide independent dosimetry audits; and
funding for rural ROMPs to rotate with other centres to gain experience in using new
equipment or introducing new techniques.
Workforce recruitment and retention issues that were specific to ROMPs in public regional
facilities include:
there is a shortage of ROMPs and recruitment to regional and isolated regions is even
more difficult; and
in regional facilities there is no time for ROMPs to do research; therefore they have to be
generalist which influences recruitment and also limits the ability of the service to
implement new technology.
9.1.4 Comments from private facilities
Workforce recruitment and retention strategies specific to private facilities include:
the private sector has a strong culture of performance management which assists with
delivering an efficient service and providing feedback to staff; and
there is less bureaucracy in the private sector which is very attractive to some staff.
Workforce recruitment and retention issues specific to private facilities include:
the private facility workload pressure is greater than in public facilities, there is more
pressure to treat a certain number of patients per day;
development of a paperless, efficient system would provide more time for research and
continuing professional development;
income in private sector is only derived from the Medicare Benefits Schedule (MBS) and
MBS fees are not calculated to include CPD and other costs;
the MBS does not accurately reflect the cost of providing radiation oncology treatment
which means private facilities are restricted in terms of what they can offer to staff;
public sector funding is extremely generous, the resourcing and the career options in the
public sector have an impact on private recruitment options, particularly in regional areas;
there needs to be big incentives to draw professionals to private facilities in regional areas
including, new technologies, access to research, CPD training, flexible working hours,
competitive remuneration, and rental/relocation allowances; and
Radiation Oncology Workforce Planning
Final Report Page 105
the private sector loses some staff because they cannot access research opportunities.
Workforce recruitment and retention strategies specific to ROs in private facilities include;
providing ample opportunities for direct patient contact and a good mix of technology
assists in recruiting and retaining staff;
working in a team orientated way, with collaboration across the three professions; and
offering sabbaticals to retain staff.
Workforce recruitment and retention issues specific to ROs in private facilities include:
remuneration in the public sector is better than in the private sector;
unlike the public facilities, the private facilities are not funded to train staff and most ROs
enjoy training;
more city positions are required to keep ROs in Australia; and
having a registrar in private practice is difficult as patients expect to see the consultant; the
registrar slows down the consultant; and complications arise when it comes to billing – if
registrars could raise bills then it would just be about educating the patients.
Workforce recruitment and retention strategies specific to RTs in private facilities include:
RTs take on more responsibility in the private sector, with more role sharing;
there is more flexibility with part time arrangements in the private sector compared to the
public sector; and
the planning department is seen as the „prime work‟ and rotating staff through planning is
essential.
Workforce recruitment and retention issues specific to RTs in private facilities include:
to train staff properly they need to be taken offline which is costly to the private sector;
PDYs are generally not super numerary in the private sector and funding for the positions
is limited, although the Commonwealth funding assists; and
there is a mix of experience at facilities with staff at senior levels and entry levels with a
gap in the middle, which puts more pressure on senior staff and raises concerns as to who
will fill the senior positions when senior staff retire.
Workforce recruitment and retention strategies specific to ROMPs in private facilities include:
private facilities offer good exposure for ROMPs, they are able to work more
independently and take on more responsibility; and
Commonwealth funding for registrar positions in the private sector is greatly appreciated.
Workforce recruitment and retention issues specific to ROMPs in private facilities include:
once a ROMP is experienced working in a public hospital becomes more attractive due to
better remuneration;
ROMPs working in private facilities will be doing more and more out of hours work – this
may detract physicists from coming into the profession;
the TEAP training program is five years and this is considered long, after three years
ROMPs are likely to have enough experience to work independently; and
private facilities find it difficult to bear the cost of training positions; they need to be
better funded.
Radiation Oncology Workforce Planning
Final Report Page 106
9.1.5 Workforce recruitment and retention strategies and issues summary
An overall consensus, based on the 20 site visits is that there are no current shortages of ROs
and RTs in Australia. However, regional facilities and some facilities in small states often
comment that it can be difficult to recruit staff to these locations. With regard to ROMPs,
there is a current shortage of qualified ROMPs, however facilities are not having problems
recruiting ROMP registrars. The concern lies in being able to adequately train the registrars
given current shortfalls in experienced ROMPs.
Across both private and public facilities there is a sense that services have the workforce to
achieve only service delivery leaving little or no time particularly for research, training and
CPD; this issue is particularly prevalent in private facilities. Additional funded positions
would allow facilities to commission and implement new technologies and offer staff time to
undertake research, training and CPD, all of which lead to continued service improvements
and advancements. It is clear from our consultation that all three professions highly value
opportunities to access new technologies and research, having these built into the service
model makes the facility attractive and aids in both recruitment and retention.
In general ROs, RTs and ROMPs have a preference for working in a city location. There is a
perception of better access to technology, collegial support and better research and training
opportunities. Staff in regional centres argue that the workforce pressures are greater due to a
smaller workforce (the facilities are always smaller in regional areas). However, the smaller
staffing base does provide the opportunity for role expansion, where for example, RTs have
reported being able to take on more responsibility in regional locations.
Stakeholders always stated that it is imperative that regional centres offer attractive salary
packages to attract qualified staff, particularly for ROs and ROMPs who are harder to recruit
to non-city areas. We found that many regional centres currently offer attractive
remuneration packages with additional incentives such as relocation, rental or retention
allowances. We also found that remuneration is not the only drawcard and access to
technology, research and other CPD opportunities are highly valued.
9.2 LOCAL WORKFORCE BENCHMARKING AND PLANNING APPROACHES
The information from the case studies showed that local approaches to workforce planning
centre around the benchmark recommendations from the relevant professional bodies. There
were different opinions regarding the suitability of the benchmarks. This section presents the
views of stakeholders in regards to workforce planning initiatives they suggested have, or will
impact, on workforce planning. Again stakeholder views are presented in relatively raw form
followed by a summary of findings.
9.2.1 Comments from public metropolitan facilities
The benchmarks which the majority of public metropolitan facilities are working towards or
currently attain were:
the RANZCR recommendation of 250 new patients per RO per annum – even though
some facilities have not attained the benchmark most are working towards it;
Radiation Oncology Workforce Planning
Final Report Page 107
the AIR RT staffing model (1.06 RTs per linac hour) plus research and teaching positions
– most facilities stated that this model is outdated as it does not take into account recent
changes in technology and changes in the role and responsibility of RTs; and
the 1.7 ROMPs per linac benchmark derived from the ACPSEM‟s Formula 2000 is
aspired to by most public facilities, however ROMP workforce shortages and/or budget
constraints usually prevent attainment.
Workforce planning initiatives suggested by public metropolitan facilities included:
the introduction of a medical physics elective in the year 11 syllabus helps with giving the
profession exposure and an increasing number of students are choosing this elective;
developing good networking relationships with other departments, as well as developing
good relationships with the universities and taking on undergraduate students for clinical
placements and work experience;
a strong commitment to radiation oncology research and academic excellence and
allocating either specific staff or specific staff time to these functions;
creation of more RTs educator and research positions; and
taking account of the increasing proportions of females (particularly in ROs and ROMPs)
in determining future workforce requirements including the number of training positions.
9.2.2 Comments from public regional facilities
The common radiation oncology benchmarks for workforce planning in public regional
facilities were:
the majority use the RANZCR recommendation of 250 new patients per RO per year
although some facilities indicated that they plan around two ROs per linac with a
caseload of 450 courses per linac per annum;
the AIR RT staffing model (1.06 RTs per linac hour) plus research and teaching
positions was generally accepted as an appropriate benchmark; and
facilities try to implement the ACPSEM‟s Formula 2000 with ROMPs per linac ranging
from 1.5 – 2.0 FTE although there was a view that Formula 2000 may overstate needs.
Workforce planning initiatives suggested by public regional facilities included:
further consideration of the opportunities for role sharing across the three professions
when planning the workforce;
better remuneration, research capability and collegial support need to be factored into
workforce planning;
increasing the number of supernumerary ROMP registrar positions;
streamlining the processes for immigration of experienced medical physicists;
better recognition of the importance of appropriate levels of qualified physics staffing in a
radiation oncology department and how it relates to equipment complexity;
joint appointments (metropolitan and regional) for RO registrar positions;
opportunities for research and development built into staffing levels, with less emphasis
on pure patient throughput;
staffing levels should be set based on a better recognition of the increased complexity of
treatments; the need for research, trials and ongoing development activities; plus the need
to maintain activity levels and minimise waiting lists; and
Radiation Oncology Workforce Planning
Final Report Page 108
staffing levels should also be set recognising jurisdictional service delivery requirements
which vary and lead to differences in work practice that result in major disparities in the
number of staff required for each profession.
9.2.3 Comments from private facilities
The common radiation oncology benchmarks for workforce planning in private metropolitan
facilities were:
private sector ROs set their benchmarks higher than those in the public sector –
benchmarks vary between the private operators from 400 new patients per FTE per annum
to 400-450 initial consultations per annum to 300-350 new patients per annum;
the AIR benchmark is referred to for workforce planning across most sites with the
common view being that it is too high; most facilities work with less than the
recommended 1.06 RTs per linac hour; and
most private facilities work on between 1.0-1.5 FTE qualified ROMP per linac, most
commonly closer to 1.0 FTE, including brachytherapy where applicable.
Suggested workforce planning initiatives included:
using medical engineers to do some medical physics work;
taking on more PDYs to try and deal with high attrition rate from the profession;
the development of better leave and funding support for teaching, education activities and
time for conducting research;
making medical registrars more accessible to private radiation oncology practices;
the establishment of local teaching programs provided by practising clinical professionals;
full Commonwealth funding of PDY positions in private facilities;
more flexibility with the RANZCR registrar training program, particularly by reducing the
training ratios in regional settings where current ratios are very difficult to achieve; and
developing a grade of physicists that are pre-TEAP i.e. a technical officer, for facilities
that find meeting the training requirements difficult.
9.2.4 Workforce benchmarking and planning approaches summary
There is reasonable support in the public sector for the existing workforce benchmarks but
there is also a widespread view that they do not accurately reflect the current service
environment. Clearly with the introduction of a number of new technologies simple linac
benchmarks will be less useful. Feedback from the 20 facilities highlighted the different
staffing practices in the public and private sector, which was also reflected in the facilities
survey results (Chapter 5). In general private facilities see more patients with fewer staff
compared to public facilities, whereas public facilities tend to have more opportunities for
research and development and less emphasis on patient throughput.
Public facilities have a bigger focus on research and have funding for more training positions
(medical registrars, ROMP registrars and PDY positions) compared to private facilities.
Public facility initiatives have involved the establishment of educator and research positions,
where private facilities have been more inclined to share educator and research related work
amongst the staff. Public regional centres and private facilities are more inclined to role share
between the three professions, something that is not as common in public metropolitan
facilities. This may partly be a reflection of private facilities deriving efficiency gains from
role sharing and regional facilities role sharing as a result of a smaller staff base.
Radiation Oncology Workforce Planning
Final Report Page 109
Most facilities recognise that treatment and planning has increased in complexity, which
requires that more training, more development and more research time needs to be factored
into workforce benchmarking and planning approaches. Workforce benchmarks would be
better set using a denominator that was casemix adjusted (rather than simply a linac, or a new
patient). There have been some attempts in this regard with the development of BTEs, but
this system is not widely used and it needs to be updated to reflect current practices.
Development of better workforce benchmarks is an important area for further work.
9.3 CHANGES TO THE SERVICE MODEL
The case study site visits included asking facility staff to identify ways in which the
radiotherapy service model might change in the future including planned developments in
services at the facility (i.e. additional linacs, additional features on existing linacs, additional
staff recruited in key disciplines, role substitution amongst staff in key disciplines, etc.). This
section presents the views of stakeholders in regards to service model changes that they
suggested have, or will, impact on workforce planning. Again stakeholder views are
presented in relatively raw form followed by a summary of findings.
9.3.1 Comments on cancer incidence and treatment changes that impact on radiotherapy
Stakeholder comments relating to changes in cancer incidence and changes in the proportion
of patients which specific cancers who are treated with radiotherapy included:
there will be more demand for radiation oncology services over the next 10 years as a
result of population ageing;
the provision of radiotherapy services will increase in the future, therefore more of the
three key professions will be needed – at present there is an oversupply of RTs but this
will not be the case in two to three years;
more facilities are considering brachytherapy suites in the future, this will increase the
work required by all three professions;
with the continued early diagnosis of cancers, radiotherapy will only increase;
mesothelioma is increasing which will add to demand for radiotherapy;
facilities will see more and more metastasis as people are living longer and radiotherapy is
currently being underutilised;
more patients are having curative surgery or being treated by combining modalities (i.e.
surgery and radiotherapy or chemotherapy and radiotherapy) so adjuvant radiotherapy is
more often prescribed;
the number of older patients coming through will increase – older patients require multiple
fields and are generally a lot more complicated;
the decrease in cervical cancer will have an impact on workload i.e. the 52.3% treatment
benchmark will likely come down over time;
radiation for palliation will decrease because now treating with curative intent;
there will be a decrease in cervical cancer, decrease in lung cancer, decrease in breast
cancer (more surgical) and a decrease in prostate cancer (more surgical) treatments;
a breakthrough in treatment would not be expected in the next 10 years, but an
improvement in access will occur;
there is a trend towards greater use of brachytherapy seeds for prostate as it delivers much
more dose with reduced side effects; and
Radiation Oncology Workforce Planning
Final Report Page 110
the viability of brachytherapy HDR is questioned, particularly given that the main targets
are cervix and prostate - cervical cancer cases are decreasing and seed implants and
robotic surgery are being increasingly used for prostate, decreasing the need for HDR.
9.3.2 Comments on service model changes that will impact on workforce needs
Stakeholder comments on service model changes that will impact on staffing needs include:
the number of breast treatments has decreased as a result of requiring fewer fractions (i.e.
16 instead of 30);
if the number of fractions decreases for prostate cancer (trial using hypo-fractionation is in
progress comparing four week treatments against eight week treatments) the number of
patients that are treated will increase;
hypo-fractionation allows fewer fractions, meaning less visits but longer time on bed –
will result in the RO spending more time in the treatment/planning area;
if the results of overseas studies using intraoperative radiotherapy are positive there will
be a large impact on the workforce e.g. moving from four to six weeks of radiotherapy
treatment for breast cancer to one intra-operative treatment;
if more stressors are introduced i.e. new machines, new technology, more patients, then
current staffing levels will not be sufficient;
future RTs will need to be skilled in image review and advanced practitioner roles;
the sophistication and complexity of both planning and treatment delivery systems in
radiotherapy now require recognition of a need for specific consultant/specialist RT skills
– there should be provision for these types of positions;
there is a perception that junior new RTs are more taken with the technology than patient
contact, this will have an influence on how the profession evolves in the future;
with technology developing so rapidly there is a need for research ROMPs positions; and
RTs are developing more information technology skills as new technology bring with it
complicated software and so skills in managing IT in radiotherapy is required;
more and more machine automation will change how work is done at facilities; and
the increased need and demand for good data management and IT skills and employing
people with appropriate skills to manage these systems will be required.
9.3.3 Cancer incidence and service model changes summary
Based on feedback from the 20 facilities the radiation oncology service model is evolving and
changing in response to a number of key factors. This increase in cancer incidence means that
there is pressure on services to treat more patients. Also, a number of stakeholders argued
that there is further scope for the use of radiotherapy as curative and palliative treatment for
patients with cancer. There are some specific cancers where early detection and/or reduced
incidence have reduced the demand for radiotherapy (e.g. gynaecological cancers). Also there
are mixed views in a number of areas e.g. some stakeholders thought there would be a
reduction in radiotherapy need for prostate cancer patients (more patients would have surgery)
whereas others considered that brachytherapy would become the treatment of choice.
In respect of the service model, the potential for major changes as a result of intra operative
radiotherapy and hypo-fractionation were highlighted, but there is insufficient evidence at this
stage to predict that there will be a short-term impact on workforce. Most service model
changes in the short term will be around the routine and more frequent use of imaging
technologies as part of the process of radiotherapy treatment. This trend has implications in
Radiation Oncology Workforce Planning
Final Report Page 111
terms of the skills required in the workforce as well as the number of professionals in each of
the three key disciplines to deal with the processes of capturing and using the images as part
of planning and treatment. Related to this trend, there is an increasing need for the workforce
to have improved information technology and data management skills.
9.4 EMERGING TECHNOLOGIES AND THE IMPACT ON WORKFORCE
Stakeholders at the case study site visits were asked their views on emerging radiation
oncology technologies and the impact that they will have on workforce requirements in the
key disciplines. This section presents the views of stakeholders in regards technology
changes that they suggested have, or will, impact on workforce planning. Again stakeholder
views are presented in relatively raw form followed by a summary of findings.
9.4.1 General comments on technology and the associated workforce impact
Stakeholder comments about the impact of new technologies include:
there is increasing pressure to implement new technologies – patients want the best
treatment and staff want to work with the best technology;
it is well understood that new technologies tend not to increase patient survival rates, but
increase patient quality of life, that is new technologies reduce toxicity and allow for
better symptom control;
inexperience with new technologies means it is difficult to estimate accurately how long it
will take to implement and what issues will arise;
a barrier to implementing new technology is the number of staff – even though new
equipment has been purchased there are not enough staff to commission and train the
remaining staff so new technology is not utilised;
imaging has been the biggest change in radiation oncology and these skills need to be
maintained and taught across all three professions;
the need for servicing of linacs is increasing because there are more parts to a modern
linac, so there is more down time as new machines tend to require more part
replacements; and
technology advancements will create more work for the three professions, they may not
affect (or they may even reduce) patient treatment time, but they increase indirect time
(i.e. non patient contact) required to meet the increasing demand for services.
9.4.2 Comments about technology advances which increase staff workload
The nature of the consultative process is that stakeholder comments about the impact of new
technologies on workload tend to be mainly about increases. Comments included:
new linacs have more capabilities including using more fields which means that the
amount of new work done per case has gone up, the time spent contouring, planning, and
doing QA has doubled, resulting in increased workload;
new technologies increase time, mainly in planning time which has already, and will
continue to, increase thereby placing more time pressure on all three key professions;
unless more staff are recruited in each profession at each facility;
IMRT has a huge start up process, but offers a big saving in the long run (as experience
grows planning time will be reduced) – it is generally considered to be a good therapy,
however it is very time consuming and at least initially is very labour intensive;
Radiation Oncology Workforce Planning
Final Report Page 112
keeping up to date with the latest technologies and techniques keeps professionals
interested but more resources and time needs to be allocated to implementing new
technology, training staff and conducting research;
when implementing new technology it is important to appreciate that documentation,
application software and interfaces tend to be less well developed than the mature product,
so good supplier support, strong links to other users of technology, adequate staffing
levels and time to support implementation are needed;
there has been exponential change in workload in the last 12 months as a result of
technology change (e.g. IGRT, IMRT (brain lab and rapid arc)) which has increased
training requirements e.g. for cone beam CT staff need to be competent to interpret the
image (radiobiologist), this requires training;
IGRT, Exactrac (patient positioning verification system) and Cone Beam CT are
compulsory in this day and age;
gated delivery will increase treatment time as the machine needs to be stopped for
different respiratory flows;
growth in molecular imaging will have an impact on the radiation oncology workload –
there will need to be more interaction between nuclear imaging and radiation oncology,
and ROMPs will need to have more input into radiology and nuclear medicine;
VMAT, CyberKnife and Rapid Arc offer more accuracy and customised treatment and
will increase throughput, as well as increasing QA and planning, which will result in
increasing the workload intensity for professionals, particularly ROMPs; and
the technological change that will have the biggest impact will be the move to robotics –
facilities need to plan to change and increase education to staff and everyone will need to
be moved up in their roles.
9.4.3 Comments about technology advances which decrease staff workload
There were a few stakeholder comments about technologies that created efficiencies (i.e.
reduced workload). Comments included:
there is software and hardware available that can inform RTs if the patient is not correctly
positioned – patients can be moved automatically (instead of manually) which decreases
patient treatment time (as RTs do not need to re-enter the bunker for re-positioning);
radiation oncology facilities software systems can be integrated with the hospitals within
which they were based in and/or with the imaging software to improve efficiency (e.g.
time saved by not needed to locate patient files or films);
multi-leaf collimators is an example of an efficient technology, it saves time and also
improves the quality of outcomes;
cone beam CT might slightly reduce time taken to treat patients;
some facilities will not be implementing IMRT as they are willing to wait for Rapid Arc
which will have shorter treatment time compared to both IMRT and conventional
treatment modalities;
the efficiency gains from Rapid Arc are generally considered to be high – the initial QA
required will increase dramatically for ROMPS, partly for RTs and ROs, but in the long
run there will be efficiency gains; and
there is growing interest in Tomotherapy as it is more efficient than IMRT; it has benefits
for surrounding structures, and it goes well with stereotactic IGRT – Tomotherapy would
increase treatment quality and potentially throughput.
Radiation Oncology Workforce Planning
Final Report Page 113
9.4.4 Impact of emerging technologies of workforce summary
Overall the view amongst professionals was that new technology, although it results in better
patient outcomes, and may save patient contact time, generally requires more planning time
(by ROs and RTs) and more quality assessment time (by ROMPs or RTs). Stakeholders‟
views about the impact of technological advancements on staff workload were mixed. Some
stakeholders argued that even though there are efficiency gains on the time taken to treat a
patient, there is an increase in time taken for planning and QA processes leading to an overall
increase in required time. Other stakeholders argued that over time the planning and QA
processes will be more efficient and the net effect will be no net change in the required time
but a better outcome for the patient.
Many stakeholders expressed the concern that Australia‟s uptake of new technology is slow.
It was argued that Australia is slow at looking for it, slow at implementing it and slow at
funding it. Students are being taught about the new technologies and their capabilities but
unable to use it in Australia as it has not been implemented. For this reason Australian trained
ROMPs are seeking employment in more technological advanced countries. According to
stakeholders the cause of the slow uptake of technology is MSAC, which wants evidence
before equipment is funded. Stakeholders argued that there is not time for this evidence to be
accumulated in Australia, so we are heavily reliant on overseas trials, meaning that Australia
always follows not leads even though there is local expertise. Some stakeholders stated that
Australia is 10 years behind the rest of the world with regard to the implementation of IMRT.
9.5 DESIRED RADIATION ONCOLOGY SERVICE MODEL
Stakeholders at the case study site visits were asked their views on the desired service model
in terms of linear accelerators and staffing levels for the service, and its feasibility and
affordability in the location. This section presents the views of stakeholders in regards to the
desired service model. Consistent with previous sections, stakeholder views are presented in
relatively raw form followed by a summary of findings.
9.5.1 Comments from public facilities
Stakeholder comments about the desired service model in public facilities included:
resources are needed to develop non-clinical roles/positions for RTs and ROMPs e.g.
research positions, educator positions, sub-speciality positions, role expansion and
practitioner roles – the RT role should evolve and for ROMPs if research roles are not
available research and development time needs to be included in the service model;
the ancillary needs of the department need to be met i.e. IT support, radiotherapy
information system software, application specialists, data managers, clinical trials
personnel, nursing, allied health and clerical/administration support;
there is a need for improved information systems – in the past funding has been given to
centres to improve their software which was very helpful, however it needs to be provided
on a more consistent basis – more IT support is required, time is wasted troubleshooting so
an IT administrator and IT support needs to be factored into the service model;
planning equipment needs to be aligned with the number of machines, technology and
staff – having too few planning computers slows throughput;
there needs to be better access to PET and MRI;
BTE needs to be used across all facilities;
Radiation Oncology Workforce Planning
Final Report Page 114
there should always be an extra machine installed that is not dedicated to treatment, but is
used for planning and research;
there needs to be consistency in the provision of staff across services, based on what
services are providing;
facilities should be built with a minimum of two bunkers; and
the best way to bridge the gap (i.e. to reach 52.3%) is to take treatment to the people by
adding services in regional centres – location is an issue if you need treatment every day –
many new machines are going into the cities resulting in the cities being over serviced.
Comments about the desired RO service model from public facilities were;
no more than 250 new patients per RO as time for training and research is required in the
public sector; and
a locum service for ROs would be ideal to help deal with people taking leave as ROs build
up annual leave because there is no relief – funding a locum position would take the
pressure off many ROs.
Comments about the desired RT service model from public facilities were;
super numerary funded PDY positions in all facilities;
a better system to cope with maternity leave; and
the AIR benchmark of 1.06 RTs per linac hour is a dated, it should be 1.3.
Comments about the desired ROMP service model from public facilities were;
some facilities would like to see most ROMPs with conjoint appointments, there is
currently no mechanism for this;
there needs to be enough ROMPs to ensure the burden of out of hours work is shared;
there should be a minimum 1.7 FTE ROMPs per linac; and
facilities need quality managers who provide a high level of assurance and are able to
explain all procedures (also supports training and quality intervention).
9.5.2 Comments from private facilities
Stakeholder comments about the desired service model in private facilities included:
the private sector needs to be embraced and supported in training all three disciplines –
there is Commonwealth funding to support training but not state funding, meaning there
are always salary shortfalls;
there needs to be a revision of the guidelines for RT and ROMP staffing levels, modern
machinery is now considerably less labour intensive and far more automated;
there is a need for more highly specialised professionals;
a national baseline level of QA that the physics community agrees on needs to be
developed;
BTE is considered to be a waste of time – staff requirements should be based on machine
hours and patient numbers;
radiation oncology facilities should be in outer metropolitan areas (population growth
areas), they should be one stop shops as its likely patients are on more than one treatment;
new regional centres need easy access to PET and MRI facilities; and
MBS item numbers need to be reviewed – the MBS should more accurately reflect what is
done and what it costs.
Radiation Oncology Workforce Planning
Final Report Page 115
Comments about the desired RO service model from private facilities were;
between 300-350 new patients per radiation oncologist; and
at least one medical registrar in each private radiation oncology facility (which sees a
minimum volume of new patients).
Comments about the desired RT service model from private facilities were;
three-four RTs per linac (treatment only) with overall ratio lower than the AIR
recommendation of 1.06 RTs per linac hour;
more funding to assist in training PDYs;
funding to train staff in using new technology; and
a national system for accreditation, registration, training and education of RTs.
Comments about the desired ROMP service model from private facilities were;
1.0 – 1.5 FTE ROMPs per linac is the desired staffing ratio.
9.5.3 Desired service and staffing model summary
There is a sense across both public and private facilities that staffing levels and benchmarks
for all three professions need to be revised to reflect the current nature of the profession.
Also, further consideration needs to be given to the evolving roles of RTs and ROMPs and
how changes in their roles will be factored into the service model. Both public and private
facilities make comments regarding the need for more centres to be located in outer-
metropolitan or regional areas in order to provide better access for patients.
Some key differences exist between the public and private facilities regarding the desired
staffing model. Public facilities desire that ROs see no more than 250 new patients per year
whereas private facilities generally work on a basis of about 300-350 new patients per year.
Similarly the desired RT and ROMP staffing ratios are higher for public facilities relative to
private facilities; this divergence partly reflects the variation in the mix of work in the two
groups (both groups treat patients, but there is more emphasis on teaching, training and
research in the public sector) and partly reflects the difference in organisational culture in the
two sectors.
The key conclusion is that although it might be possible to set one staffing benchmark for
each of the professional groups, the benchmarks will be interpreted differently in the public
and private sector. Should there be initiatives to distribute the teaching, training and research
workloads more evenly between the two sectors (specific funding to the private sector for
these activities would probably be required to make any significant changes to the current
take up of teaching, training and research activities in the private sector) then a common set of
workload benchmarks for the public and private sectors would be more relevant.
Radiation Oncology Workforce Planning
Final Report Page 116
10 Projecting the radiation oncology workforce
This chapter describes the RO, RT and ROMP workforce projections models and the key
assumptions used to develop them. It is important to note that the models project the entire
workforce, which includes the fully qualified workforce plus those in vocational training (i.e.
RO registrars, RT PDYs, and ROMP registrars). The models are developed at the national
level, and given the relatively small RO, RT and ROMP workforces, use of the models at
jurisdiction level is not recommended. No jurisdiction-specific data have been used to
develop the models. This chapter also presents the results of using the models to project
national workforce supply and demand for 2014 and 2019 and the related sensitivity analyses.
10.1 OVERVIEW OF SUPPLY SIDE WORKFORCE MODELS
This section describes the key data sources and assumptions used to develop the three supply
side workforce projections models. All three supply side models are based primarily on the
data collected using the professions‟ surveys of the RO, RT, and ROMP workforces
undertaken for this project.
10.1.1 Overall workforce numbers and age distribution
The professions‟ survey data provide a range of workforce characteristics including age
distribution, working hours, year obtained qualifications, and retirement/workforce exit
intentions as described in chapters 6, 7 and 8. Although the response rates to the professions‟
surveys were high, they were not 100% and therefore a separate estimate of the number of
professionals in the workforce was required. For this purpose, the facilities‟ survey data was
used to “gross up” the professions survey figures and thereby provide a representation of the
whole workforce assuming that the distribution of non non-respondents‟ characteristics (e.g.
age) would have been similar to the distribution for respondents.
10.1.2 Attrition from the workforce
For all the workforce groups the professions‟ surveys also provided data on the number of
practitioners planning on leaving the workforce (e.g. maternity leave, leaving the profession,
or travelling overseas). The relevant question on the professions‟ survey was about the
respondent‟s intentions to change their work arrangements over the next 12 months. Being
only for 12 months, the numbers were multiplied by five to represent each of the five year
future time periods projected. These data were used to estimate attrition for persons aged
under 45 years of age for RTs and ROMPs111,112
. For ROs, the professions‟ survey data
showed that the number of ROs planning to leave the Australian workforce was about equal to
111 For RTs it was assumed that 95% of those planning on taking maternity leave or extended travel within the next 12 months would return within five years. For those who went to work overseas, it was assumed that two out of three would return within five years - based on the
short duration most predicted they would be travelling in the professions‟ survey. 112 For ROMPs, three professions‟ survey respondents reported that they would be going on maternity leave/extended overseas travel, but they were offset by two who reported returning from maternity leave, thus no net gain or loss was assumed for maternity leave/extended
overseas travel. For those ROMPs who responded that they planned to move overseas to work, it was assumed they did not return as a large
proportion of them were returning to their country of origin.
Radiation Oncology Workforce Planning
Final Report Page 117
the number of inward migrants so a net zero impact was modelled over five and 10 years for
maternity leave and/or extended travel and/or overseas work.
The ROMPs professions‟ survey was also used to estimate the number of retirees because
there was no other suitable longitudinal data available. For RTs and ROs, ABS Census data
and AIHW medical workforce survey data were used to estimate attrition from the workforce
through retirement for persons aged 45 years and over113
. This option was chosen mainly
because expected retirement (as gauged by the responses to the professions‟ survey) can be
very different to actual retirement over a 10 year period. This difference is due to factors
leading to early unplanned retirement such as a practitioner‟s own ill health or death, the ill
health of a family member or a need to work longer for financial or other reasons as
retirement approaches.
ABS Census data was used for the RT workforce and attrition was calculated over the five
yearly period that the data were available (this was a new occupation group added to later
ABS Census surveys so 10 year data were not available, as they were for ROs). It was
assumed that retirement rates would be the same as the available data in the following five
years except that respondents would then be in an age group five years older. For ROs, the
AIHW medical workforce survey data for radiologists was used as there is no separate RO
category (included in radiologists) but they have a similar age/sex distribution to radiologists
and they train in the same College, thereby justifying the use of the radiologist‟s data.
Attrition rates were calculated as the percentage reduction in each age cohort over the
previous five years. Retirement rates after five years and 10 years were calculated for each
five year age cohort. Net attrition114
is the sum of the attrition for all previous periods. The
calculation of cumulative attrition rates is as follows:
NAR = 1-Nt(i)/Nt(1)
where: NAR = net attrition rate;
N = number in workforce;
t(i) = projection time period (i = 5 at 2014 and i = 10 at 2019); and
t(1) = the first year of data in series (in this case 2009)
10.1.3 Entrants to the workforce
New entrants to the workforce were modelled in a way that reflected the differences in
arrangements for training the respective professionals groups. For ROs, the RANZCR
provided data on current registrars that indicated that there were 108 registrars in training in
2009. This number exactly matched the facility survey estimate of 108 medical registrar
positions. The data were used, along with the age/sex profile of respondents to the
professions survey to derive an estimate of 21 new medical registrars per year with an
associated age distribution in five year cohorts and an assumption that 53% would be female.
For RT, the relevant Universities provided a projection of the number of new graduates,
which was used to estimate that about 155 students each year would be looking for a RT
position. This number compared favourably to the estimated number of PDY positions in
2008 of 177, as through the case studies we became aware that a lower number of PDY
113 The professions‟ surveys designed for this project are cross-sectional and therefore do not provide data on the historical pattern of actual
retirement rates. 114 Net attrition accounts for movement both in and out of the workforce.
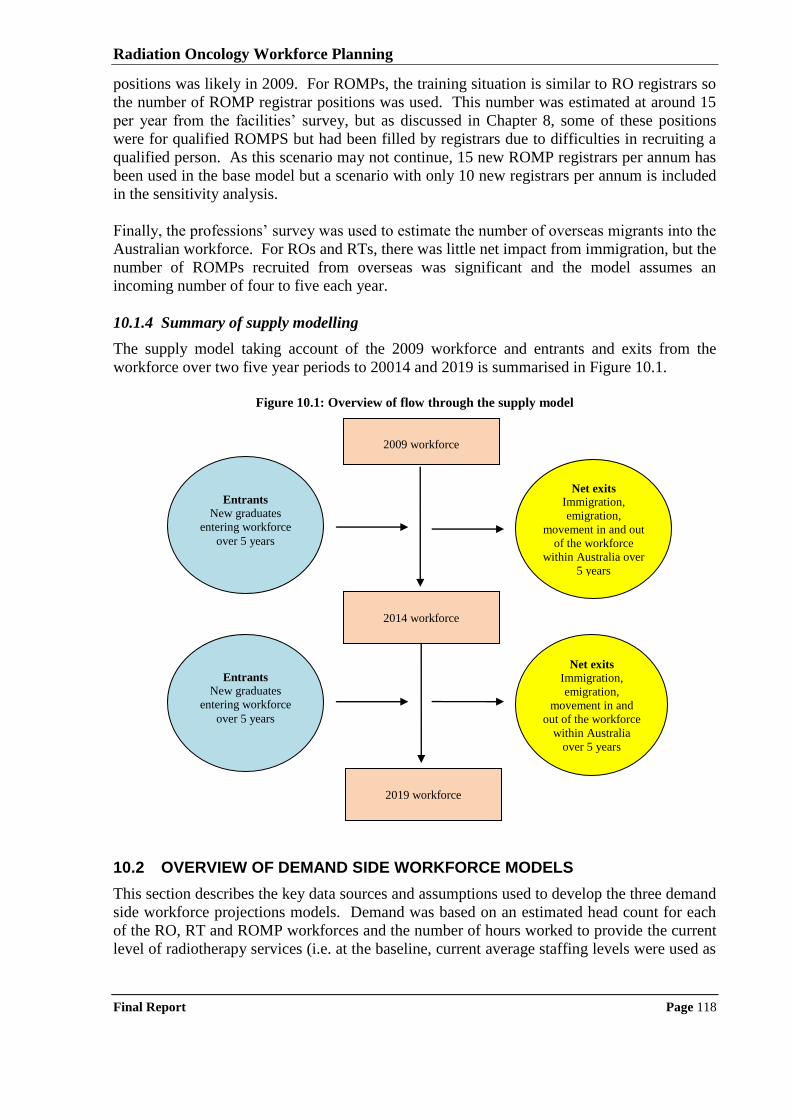
Radiation Oncology Workforce Planning
Final Report Page 118
positions was likely in 2009. For ROMPs, the training situation is similar to RO registrars so
the number of ROMP registrar positions was used. This number was estimated at around 15
per year from the facilities‟ survey, but as discussed in Chapter 8, some of these positions
were for qualified ROMPS but had been filled by registrars due to difficulties in recruiting a
qualified person. As this scenario may not continue, 15 new ROMP registrars per annum has
been used in the base model but a scenario with only 10 new registrars per annum is included
in the sensitivity analysis.
Finally, the professions‟ survey was used to estimate the number of overseas migrants into the
Australian workforce. For ROs and RTs, there was little net impact from immigration, but the
number of ROMPs recruited from overseas was significant and the model assumes an
incoming number of four to five each year.
10.1.4 Summary of supply modelling
The supply model taking account of the 2009 workforce and entrants and exits from the
workforce over two five year periods to 20014 and 2019 is summarised in Figure 10.1.
Figure 10.1: Overview of flow through the supply model
10.2 OVERVIEW OF DEMAND SIDE WORKFORCE MODELS
This section describes the key data sources and assumptions used to develop the three demand
side workforce projections models. Demand was based on an estimated head count for each
of the RO, RT and ROMP workforces and the number of hours worked to provide the current
level of radiotherapy services (i.e. at the baseline, current average staffing levels were used as
2009 workforce
2014 workforce
2019 workforce
Entrants
New graduates
entering workforce
over 5 years
Net exits
Immigration,
emigration,
movement in and
out of the workforce
within Australia
over 5 years
Net exits
Immigration,
emigration,
movement in and out
of the workforce
within Australia over
5 years
Entrants
New graduates
entering workforce
over 5 years
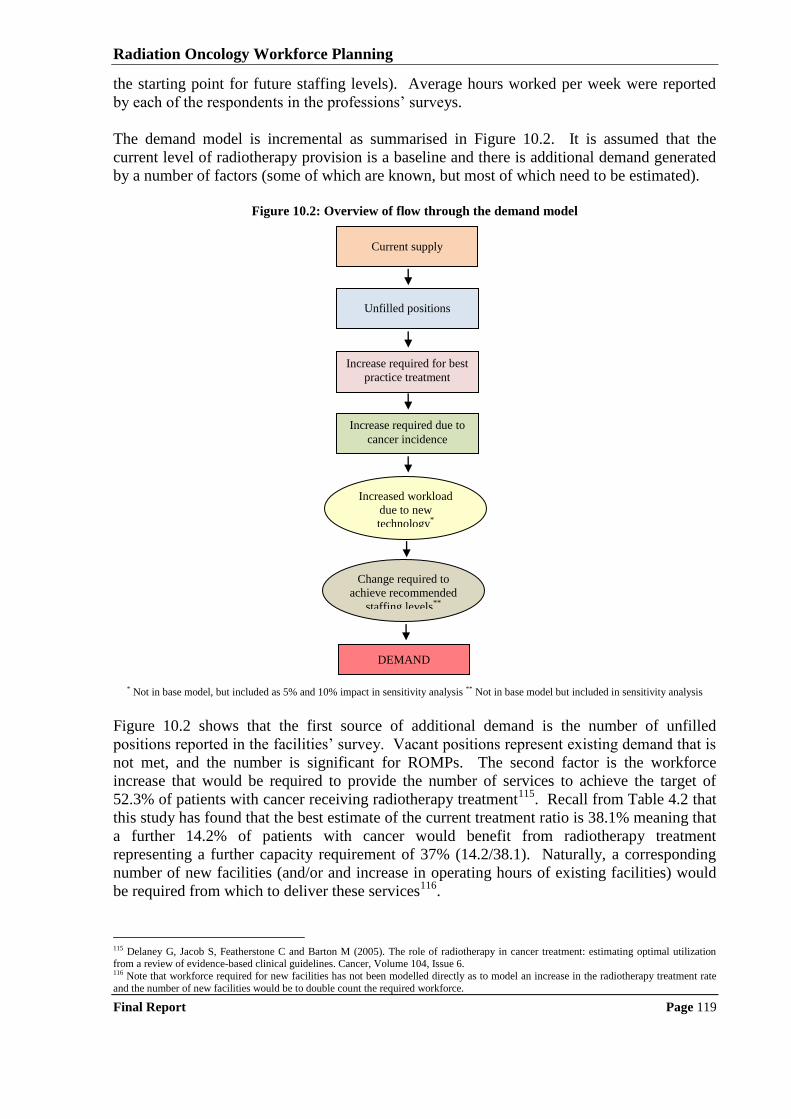
Radiation Oncology Workforce Planning
Final Report Page 119
the starting point for future staffing levels). Average hours worked per week were reported
by each of the respondents in the professions‟ surveys.
The demand model is incremental as summarised in Figure 10.2. It is assumed that the
current level of radiotherapy provision is a baseline and there is additional demand generated
by a number of factors (some of which are known, but most of which need to be estimated).
Figure 10.2: Overview of flow through the demand model
* Not in base model, but included as 5% and 10% impact in sensitivity analysis ** Not in base model but included in sensitivity analysis
Figure 10.2 shows that the first source of additional demand is the number of unfilled
positions reported in the facilities‟ survey. Vacant positions represent existing demand that is
not met, and the number is significant for ROMPs. The second factor is the workforce
increase that would be required to provide the number of services to achieve the target of
52.3% of patients with cancer receiving radiotherapy treatment115
. Recall from Table 4.2 that
this study has found that the best estimate of the current treatment ratio is 38.1% meaning that
a further 14.2% of patients with cancer would benefit from radiotherapy treatment
representing a further capacity requirement of 37% (14.2/38.1). Naturally, a corresponding
number of new facilities (and/or and increase in operating hours of existing facilities) would
be required from which to deliver these services116
.
115 Delaney G, Jacob S, Featherstone C and Barton M (2005). The role of radiotherapy in cancer treatment: estimating optimal utilization from a review of evidence-based clinical guidelines. Cancer, Volume 104, Issue 6. 116 Note that workforce required for new facilities has not been modelled directly as to model an increase in the radiotherapy treatment rate
and the number of new facilities would be to double count the required workforce.
Unfilled positions
Increase required for best
practice treatment
Increased workload
due to new
technology*
Change required to
achieve recommended
staffing levels**
DEMAND
Increase required due to
cancer incidence
Current supply
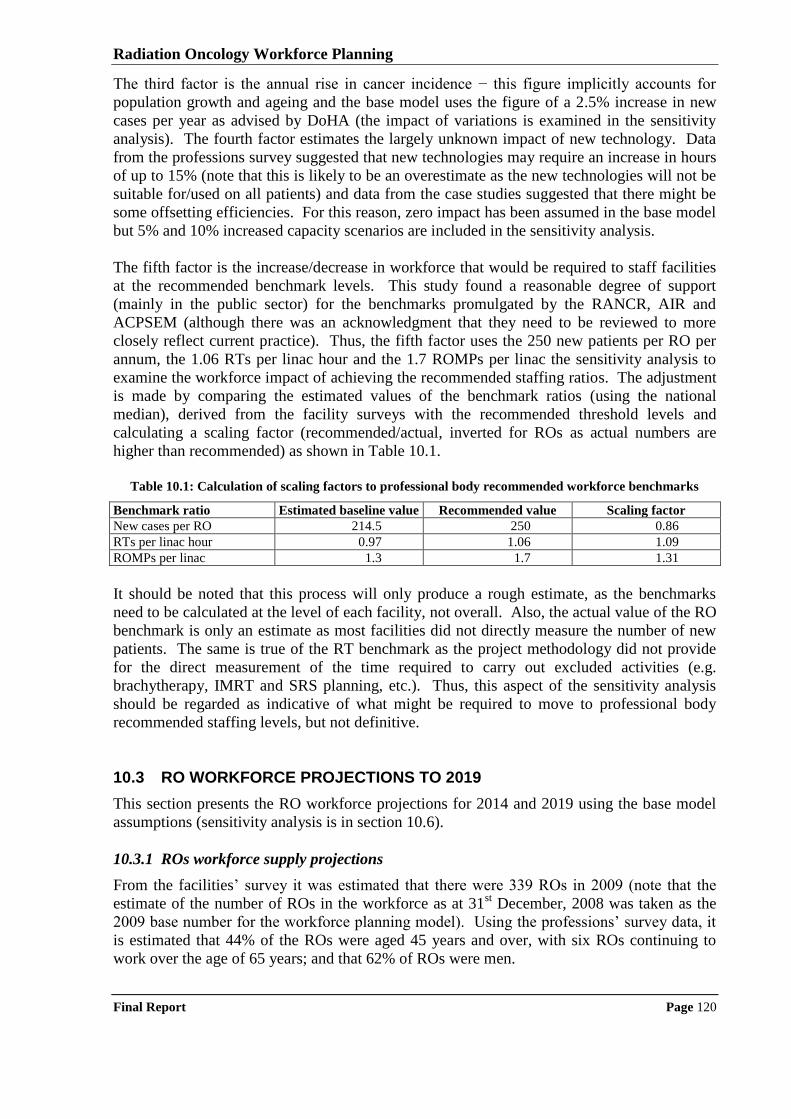
Radiation Oncology Workforce Planning
Final Report Page 120
The third factor is the annual rise in cancer incidence − this figure implicitly accounts for
population growth and ageing and the base model uses the figure of a 2.5% increase in new
cases per year as advised by DoHA (the impact of variations is examined in the sensitivity
analysis). The fourth factor estimates the largely unknown impact of new technology. Data
from the professions survey suggested that new technologies may require an increase in hours
of up to 15% (note that this is likely to be an overestimate as the new technologies will not be
suitable for/used on all patients) and data from the case studies suggested that there might be
some offsetting efficiencies. For this reason, zero impact has been assumed in the base model
but 5% and 10% increased capacity scenarios are included in the sensitivity analysis.
The fifth factor is the increase/decrease in workforce that would be required to staff facilities
at the recommended benchmark levels. This study found a reasonable degree of support
(mainly in the public sector) for the benchmarks promulgated by the RANCR, AIR and
ACPSEM (although there was an acknowledgment that they need to be reviewed to more
closely reflect current practice). Thus, the fifth factor uses the 250 new patients per RO per
annum, the 1.06 RTs per linac hour and the 1.7 ROMPs per linac the sensitivity analysis to
examine the workforce impact of achieving the recommended staffing ratios. The adjustment
is made by comparing the estimated values of the benchmark ratios (using the national
median), derived from the facility surveys with the recommended threshold levels and
calculating a scaling factor (recommended/actual, inverted for ROs as actual numbers are
higher than recommended) as shown in Table 10.1.
Table 10.1: Calculation of scaling factors to professional body recommended workforce benchmarks
Benchmark ratio Estimated baseline value Recommended value Scaling factor
New cases per RO 214.5 250 0.86
RTs per linac hour 0.97 1.06 1.09
ROMPs per linac 1.3 1.7 1.31
It should be noted that this process will only produce a rough estimate, as the benchmarks
need to be calculated at the level of each facility, not overall. Also, the actual value of the RO
benchmark is only an estimate as most facilities did not directly measure the number of new
patients. The same is true of the RT benchmark as the project methodology did not provide
for the direct measurement of the time required to carry out excluded activities (e.g.
brachytherapy, IMRT and SRS planning, etc.). Thus, this aspect of the sensitivity analysis
should be regarded as indicative of what might be required to move to professional body
recommended staffing levels, but not definitive.
10.3 RO WORKFORCE PROJECTIONS TO 2019
This section presents the RO workforce projections for 2014 and 2019 using the base model
assumptions (sensitivity analysis is in section 10.6).
10.3.1 ROs workforce supply projections
From the facilities‟ survey it was estimated that there were 339 ROs in 2009 (note that the
estimate of the number of ROs in the workforce as at 31st December, 2008 was taken as the
2009 base number for the workforce planning model). Using the professions‟ survey data, it
is estimated that 44% of the ROs were aged 45 years and over, with six ROs continuing to
work over the age of 65 years; and that 62% of ROs were men.
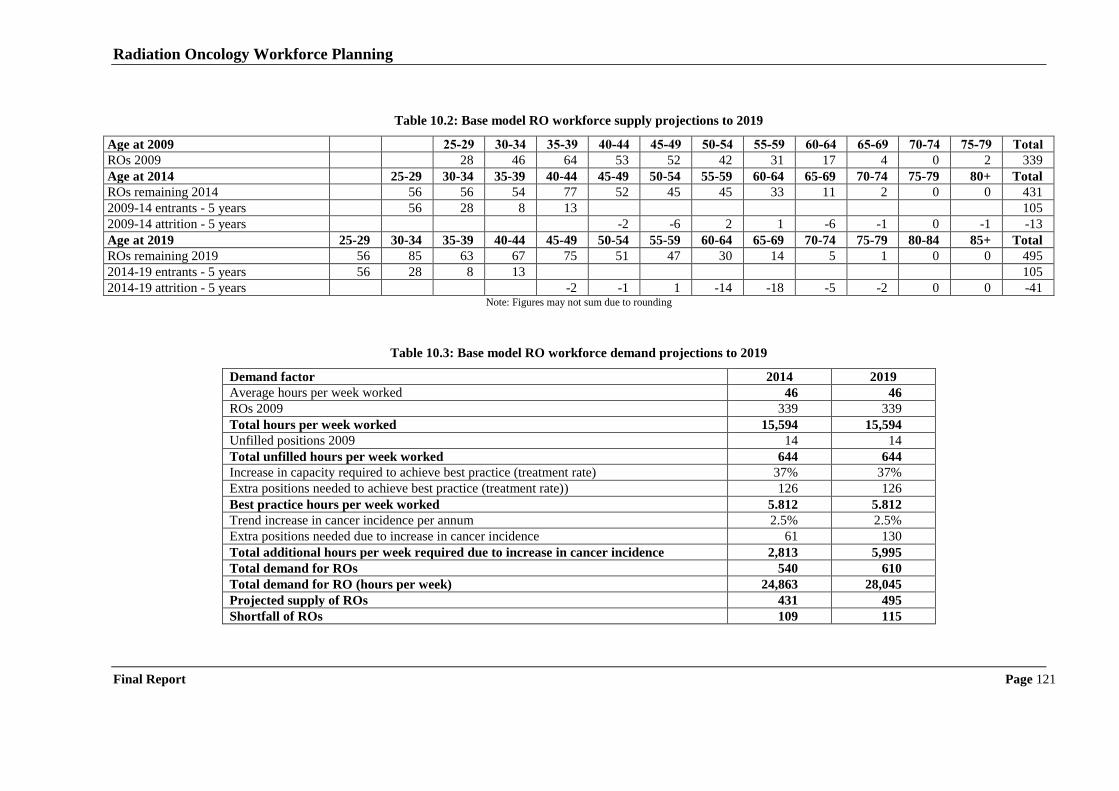
Radiation Oncology Workforce Planning
Final Report Page 121
Table 10.2: Base model RO workforce supply projections to 2019
Age at 2009 25-29 30-34 35-39 40-44 45-49 50-54 55-59 60-64 65-69 70-74 75-79 Total
ROs 2009 28 46 64 53 52 42 31 17 4 0 2 339
Age at 2014 25-29 30-34 35-39 40-44 45-49 50-54 55-59 60-64 65-69 70-74 75-79 80+ Total
ROs remaining 2014 56 56 54 77 52 45 45 33 11 2 0 0 431
2009-14 entrants - 5 years 56 28 8 13 105
2009-14 attrition - 5 years -2 -6 2 1 -6 -1 0 -1 -13
Age at 2019 25-29 30-34 35-39 40-44 45-49 50-54 55-59 60-64 65-69 70-74 75-79 80-84 85+ Total
ROs remaining 2019 56 85 63 67 75 51 47 30 14 5 1 0 0 495
2014-19 entrants - 5 years 56 28 8 13 105
2014-19 attrition - 5 years -2 -1 1 -14 -18 -5 -2 0 0 -41 Note: Figures may not sum due to rounding
Table 10.3: Base model RO workforce demand projections to 2019
Demand factor 2014 2019
Average hours per week worked 46 46
ROs 2009 339 339
Total hours per week worked 15,594 15,594
Unfilled positions 2009 14 14
Total unfilled hours per week worked 644 644
Increase in capacity required to achieve best practice (treatment rate) 37% 37%
Extra positions needed to achieve best practice (treatment rate)) 126 126
Best practice hours per week worked 5.812 5.812
Trend increase in cancer incidence per annum 2.5% 2.5%
Extra positions needed due to increase in cancer incidence 61 130
Total additional hours per week required due to increase in cancer incidence 2,813 5,995
Total demand for ROs 540 610
Total demand for RO (hours per week) 24,863 28,045
Projected supply of ROs 431 495
Shortfall of ROs 109 115
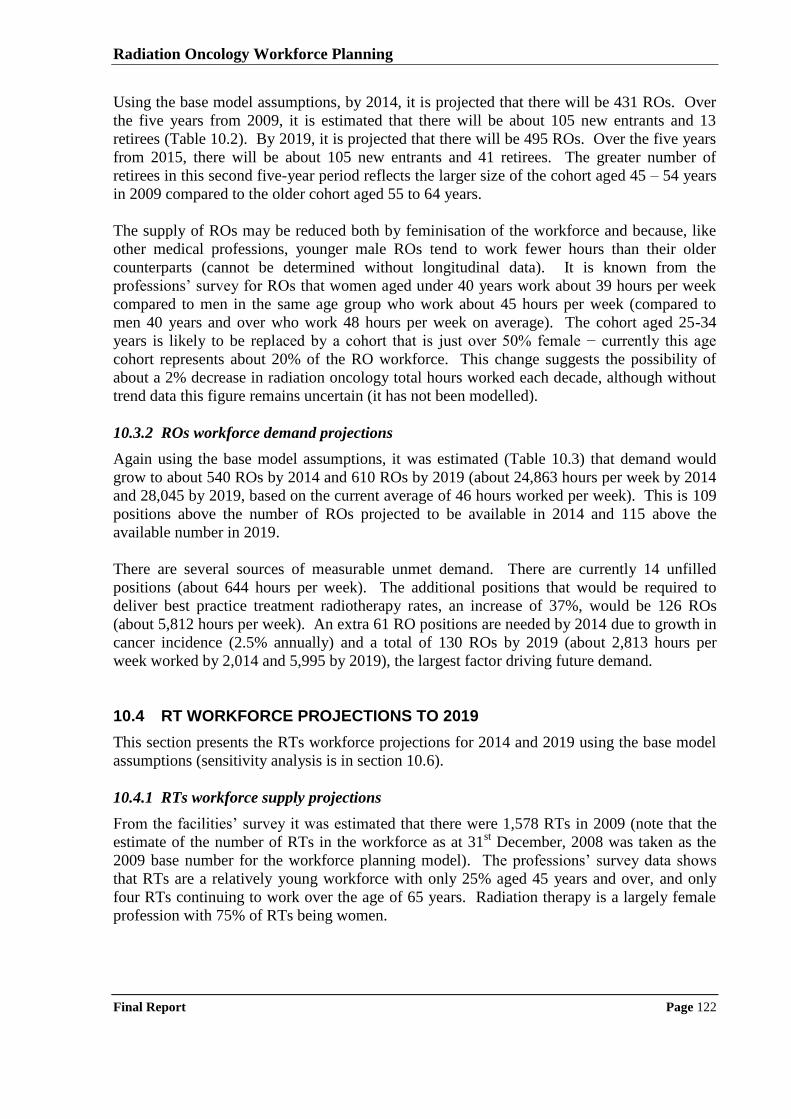
Radiation Oncology Workforce Planning
Final Report Page 122
Using the base model assumptions, by 2014, it is projected that there will be 431 ROs. Over
the five years from 2009, it is estimated that there will be about 105 new entrants and 13
retirees (Table 10.2). By 2019, it is projected that there will be 495 ROs. Over the five years
from 2015, there will be about 105 new entrants and 41 retirees. The greater number of
retirees in this second five-year period reflects the larger size of the cohort aged 45 – 54 years
in 2009 compared to the older cohort aged 55 to 64 years.
The supply of ROs may be reduced both by feminisation of the workforce and because, like
other medical professions, younger male ROs tend to work fewer hours than their older
counterparts (cannot be determined without longitudinal data). It is known from the
professions‟ survey for ROs that women aged under 40 years work about 39 hours per week
compared to men in the same age group who work about 45 hours per week (compared to
men 40 years and over who work 48 hours per week on average). The cohort aged 25-34
years is likely to be replaced by a cohort that is just over 50% female − currently this age
cohort represents about 20% of the RO workforce. This change suggests the possibility of
about a 2% decrease in radiation oncology total hours worked each decade, although without
trend data this figure remains uncertain (it has not been modelled).
10.3.2 ROs workforce demand projections
Again using the base model assumptions, it was estimated (Table 10.3) that demand would
grow to about 540 ROs by 2014 and 610 ROs by 2019 (about 24,863 hours per week by 2014
and 28,045 by 2019, based on the current average of 46 hours worked per week). This is 109
positions above the number of ROs projected to be available in 2014 and 115 above the
available number in 2019.
There are several sources of measurable unmet demand. There are currently 14 unfilled
positions (about 644 hours per week). The additional positions that would be required to
deliver best practice treatment radiotherapy rates, an increase of 37%, would be 126 ROs
(about 5,812 hours per week). An extra 61 RO positions are needed by 2014 due to growth in
cancer incidence (2.5% annually) and a total of 130 ROs by 2019 (about 2,813 hours per
week worked by 2,014 and 5,995 by 2019), the largest factor driving future demand.
10.4 RT WORKFORCE PROJECTIONS TO 2019
This section presents the RTs workforce projections for 2014 and 2019 using the base model
assumptions (sensitivity analysis is in section 10.6).
10.4.1 RTs workforce supply projections
From the facilities‟ survey it was estimated that there were 1,578 RTs in 2009 (note that the
estimate of the number of RTs in the workforce as at 31st December, 2008 was taken as the
2009 base number for the workforce planning model). The professions‟ survey data shows
that RTs are a relatively young workforce with only 25% aged 45 years and over, and only
four RTs continuing to work over the age of 65 years. Radiation therapy is a largely female
profession with 75% of RTs being women.
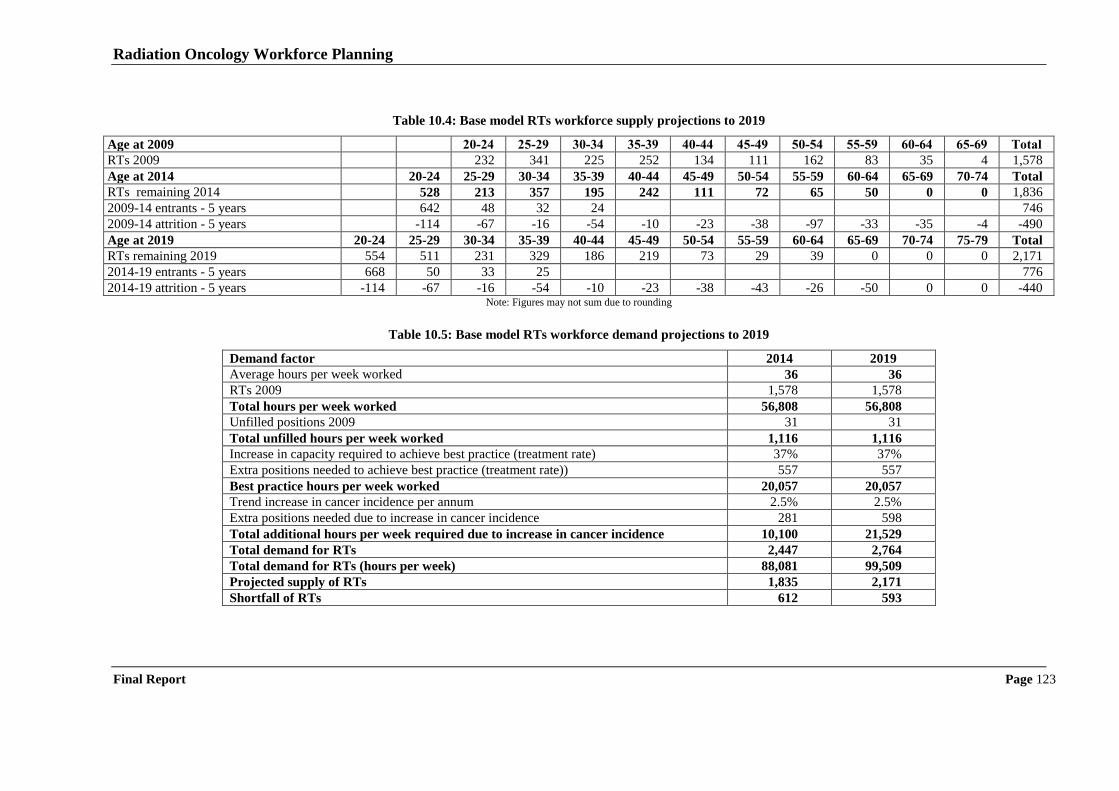
Radiation Oncology Workforce Planning
Final Report Page 123
Table 10.4: Base model RTs workforce supply projections to 2019
Age at 2009 20-24 25-29 30-34 35-39 40-44 45-49 50-54 55-59 60-64 65-69 Total
RTs 2009 232 341 225 252 134 111 162 83 35 4 1,578
Age at 2014 20-24 25-29 30-34 35-39 40-44 45-49 50-54 55-59 60-64 65-69 70-74 Total
RTs remaining 2014 528 213 357 195 242 111 72 65 50 0 0 1,836
2009-14 entrants - 5 years 642 48 32 24 746
2009-14 attrition - 5 years -114 -67 -16 -54 -10 -23 -38 -97 -33 -35 -4 -490
Age at 2019 20-24 25-29 30-34 35-39 40-44 45-49 50-54 55-59 60-64 65-69 70-74 75-79 Total
RTs remaining 2019 554 511 231 329 186 219 73 29 39 0 0 0 2,171
2014-19 entrants - 5 years 668 50 33 25 776
2014-19 attrition - 5 years -114 -67 -16 -54 -10 -23 -38 -43 -26 -50 0 0 -440 Note: Figures may not sum due to rounding
Table 10.5: Base model RTs workforce demand projections to 2019
Demand factor 2014 2019
Average hours per week worked 36 36
RTs 2009 1,578 1,578
Total hours per week worked 56,808 56,808
Unfilled positions 2009 31 31
Total unfilled hours per week worked 1,116 1,116
Increase in capacity required to achieve best practice (treatment rate) 37% 37%
Extra positions needed to achieve best practice (treatment rate)) 557 557
Best practice hours per week worked 20,057 20,057
Trend increase in cancer incidence per annum 2.5% 2.5%
Extra positions needed due to increase in cancer incidence 281 598
Total additional hours per week required due to increase in cancer incidence 10,100 21,529
Total demand for RTs 2,447 2,764
Total demand for RTs (hours per week) 88,081 99,509
Projected supply of RTs 1,835 2,171
Shortfall of RTs 612 593
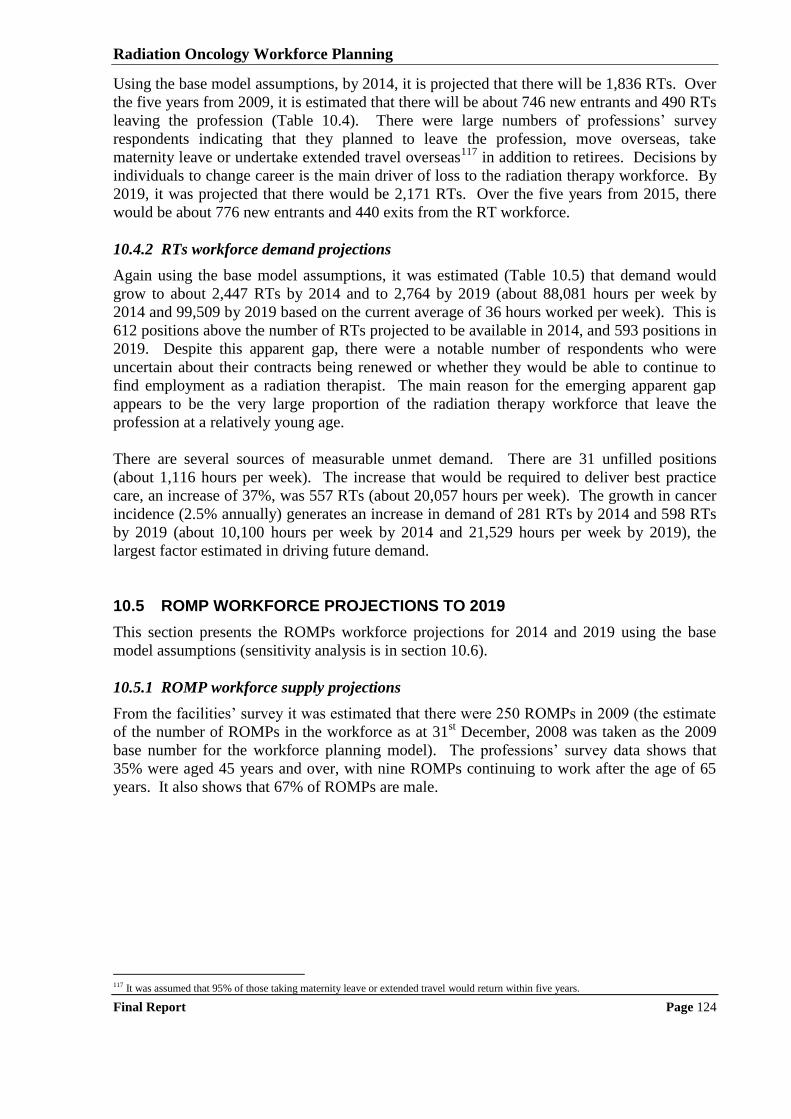
Radiation Oncology Workforce Planning
Final Report Page 124
Using the base model assumptions, by 2014, it is projected that there will be 1,836 RTs. Over
the five years from 2009, it is estimated that there will be about 746 new entrants and 490 RTs
leaving the profession (Table 10.4). There were large numbers of professions‟ survey
respondents indicating that they planned to leave the profession, move overseas, take
maternity leave or undertake extended travel overseas117
in addition to retirees. Decisions by
individuals to change career is the main driver of loss to the radiation therapy workforce. By
2019, it was projected that there would be 2,171 RTs. Over the five years from 2015, there
would be about 776 new entrants and 440 exits from the RT workforce.
10.4.2 RTs workforce demand projections
Again using the base model assumptions, it was estimated (Table 10.5) that demand would
grow to about 2,447 RTs by 2014 and to 2,764 by 2019 (about 88,081 hours per week by
2014 and 99,509 by 2019 based on the current average of 36 hours worked per week). This is
612 positions above the number of RTs projected to be available in 2014, and 593 positions in
2019. Despite this apparent gap, there were a notable number of respondents who were
uncertain about their contracts being renewed or whether they would be able to continue to
find employment as a radiation therapist. The main reason for the emerging apparent gap
appears to be the very large proportion of the radiation therapy workforce that leave the
profession at a relatively young age.
There are several sources of measurable unmet demand. There are 31 unfilled positions
(about 1,116 hours per week). The increase that would be required to deliver best practice
care, an increase of 37%, was 557 RTs (about 20,057 hours per week). The growth in cancer
incidence (2.5% annually) generates an increase in demand of 281 RTs by 2014 and 598 RTs
by 2019 (about 10,100 hours per week by 2014 and 21,529 hours per week by 2019), the
largest factor estimated in driving future demand.
10.5 ROMP WORKFORCE PROJECTIONS TO 2019
This section presents the ROMPs workforce projections for 2014 and 2019 using the base
model assumptions (sensitivity analysis is in section 10.6).
10.5.1 ROMP workforce supply projections
From the facilities‟ survey it was estimated that there were 250 ROMPs in 2009 (the estimate
of the number of ROMPs in the workforce as at 31st December, 2008 was taken as the 2009
base number for the workforce planning model). The professions‟ survey data shows that
35% were aged 45 years and over, with nine ROMPs continuing to work after the age of 65
years. It also shows that 67% of ROMPs are male.
117 It was assumed that 95% of those taking maternity leave or extended travel would return within five years.
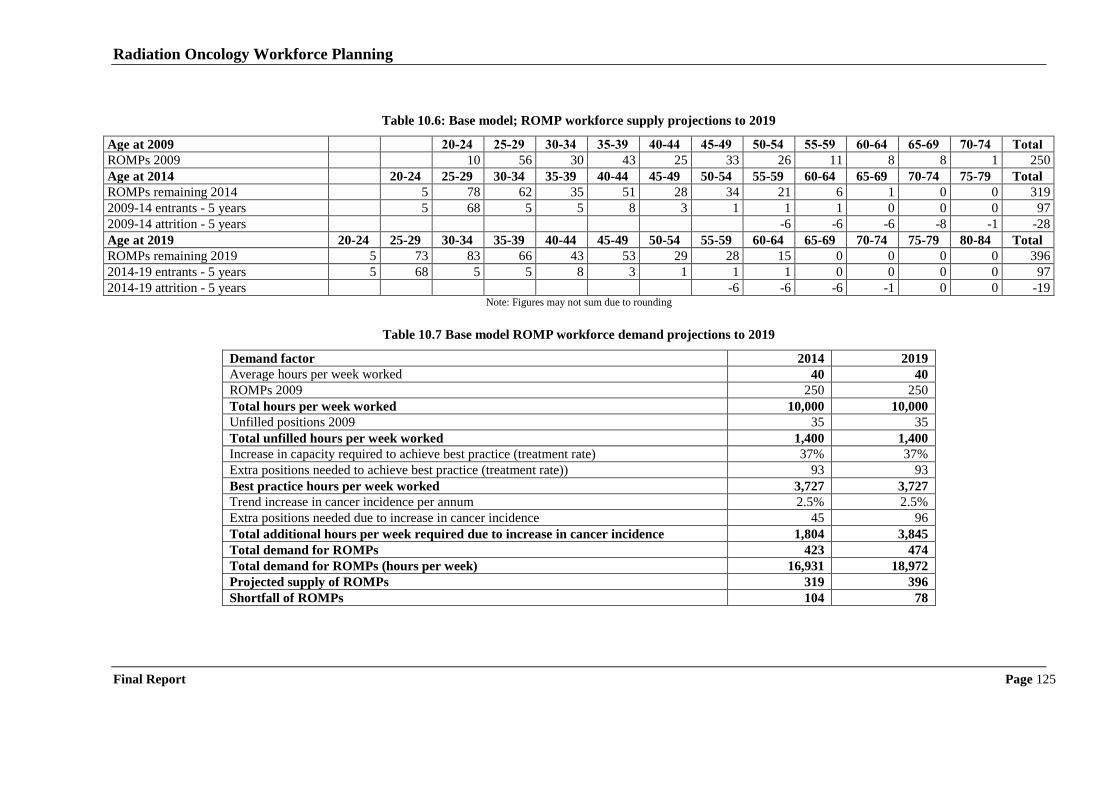
Radiation Oncology Workforce Planning
Final Report Page 125
Table 10.6: Base model; ROMP workforce supply projections to 2019
Age at 2009 20-24 25-29 30-34 35-39 40-44 45-49 50-54 55-59 60-64 65-69 70-74 Total
ROMPs 2009 10 56 30 43 25 33 26 11 8 8 1 250
Age at 2014 20-24 25-29 30-34 35-39 40-44 45-49 50-54 55-59 60-64 65-69 70-74 75-79 Total
ROMPs remaining 2014 5 78 62 35 51 28 34 21 6 1 0 0 319
2009-14 entrants - 5 years 5 68 5 5 8 3 1 1 1 0 0 0 97
2009-14 attrition - 5 years -6 -6 -6 -8 -1 -28
Age at 2019 20-24 25-29 30-34 35-39 40-44 45-49 50-54 55-59 60-64 65-69 70-74 75-79 80-84 Total
ROMPs remaining 2019 5 73 83 66 43 53 29 28 15 0 0 0 0 396
2014-19 entrants - 5 years 5 68 5 5 8 3 1 1 1 0 0 0 0 97
2014-19 attrition - 5 years -6 -6 -6 -1 0 0 -19 Note: Figures may not sum due to rounding
Table 10.7 Base model ROMP workforce demand projections to 2019
Demand factor 2014 2019
Average hours per week worked 40 40
ROMPs 2009 250 250
Total hours per week worked 10,000 10,000
Unfilled positions 2009 35 35
Total unfilled hours per week worked 1,400 1,400
Increase in capacity required to achieve best practice (treatment rate) 37% 37%
Extra positions needed to achieve best practice (treatment rate)) 93 93
Best practice hours per week worked 3,727 3,727
Trend increase in cancer incidence per annum 2.5% 2.5%
Extra positions needed due to increase in cancer incidence 45 96
Total additional hours per week required due to increase in cancer incidence 1,804 3,845
Total demand for ROMPs 423 474
Total demand for ROMPs (hours per week) 16,931 18,972
Projected supply of ROMPs 319 396
Shortfall of ROMPs 104 78
Radiation Oncology Workforce Planning
Final Report Page 126
Using the base model assumptions, by 2014, it was projected that there would be 319
ROMPs. Over the five years from 2009, it is estimated that there will be about 97 new
entrants (including migrants entering the Australian workforce net of those planning on
leaving the Australian workforce118
) and 28 retirees119
(Table 10.6). By 2019, it was
projected that there would be 396 ROMPs. Over the five years from 2015, it was estimated
that there would be about 97 new entrants and 19 retirees. These figures assume that the
number of ROMPs migrating from overseas to Australia will be maintained.
10.5.2 ROMP workforce demand projections
Again using the base model assumptions, it was estimated (Table 10.7) that demand would
grow to about 423 ROMPs by 2014 and 474 by 2019 (about 16,931 hours per week in 2014
and 18,972 in 2019 based on the current average of 40 hours worked per week) (Table 9.4).
By 2014, this is 104 positions above the number of ROMPS that is projected to be available
and 78 positions in 2019.
There are several sources of measurable unmet demand. There are currently a number of
unfilled ROMP positions, 35 in all (about 1,400 hours per week) or about 15%, the highest
proportion of any of the three professions included in this study. The increase that would be
required to deliver best practice care, an increase of 37% over current provision of radiation
oncology, accounts for a further 93 positions. The growth in cancer incidence (2.5%
annually) is projected to result in an increase in demand of 45 ROMPs by 2014 and 96
ROMPs by 2019, the largest factor estimated in driving future demand.
10.6 SENSITIVITY ANALYSIS
The workforce model is designed to allow the impact of varying a number of assumptions to
be tested. In so doing, it is important to note that some factors were modelled as one off
changes to current practice. These factors include changes to best practice treatment rates,
impacts of new technology, and changes to recommended staffing levels. This is the correct
treatment of such factors as once staffing levels have been adjusted to absorb the one-off
impact then the models project staffing needs going forward from the new base. That is the
impact of the factor does not compound each year, like say the growth in cancer incidence.
Using the models, we found that the estimates of demand were particularly sensitive to the
rate of growth in cancer incidence. Table 10.8 shows that an increase of 0.5% over the base
estimate of 2.5% per annum to 3.0% per annum would result in an additional workforce
demand for 13 ROs, 59 RTs and 10 ROMPs over five years and 29 ROs, 136 RTs, and 22
ROMPs over the ten years when compared to the base scenario. A decrease of 0.5% to 2%
per annum would reduce workforce demand by 12 ROs, 59 RTs and nine ROMPs and 29
ROs, 130 RTs, and 21 ROMPs over 10 years.
118
The impacts of policy changes such as priority on the immigration list would depend on the number, timing and the age of the
immigrants. 119 It is likely that the number of ROMPs indicating in the professions survey that they would retire in the 12 months from 2009 is slightly
higher than the annual average. Projecting these figures forward suggests that by 2019 all ROMPs over the age of 65 years would have retired when there would have been expected to have been about 10-15 in this age group still in the workforce based on the 2009 age
distribution. As a result, total supply in 2019 may be underestimated by about 10-15 ROMPs. However, if the high rate of migration of
ROMPs was to decline this potential underestimate would be would quickly offset.
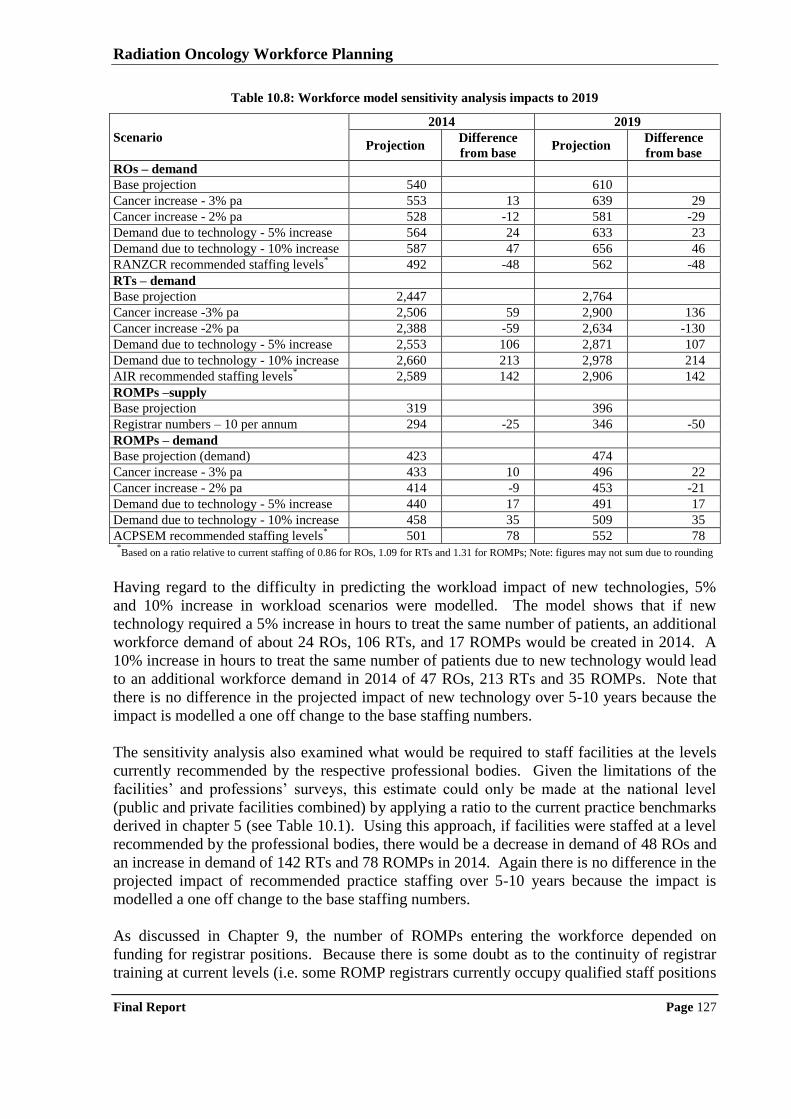
Radiation Oncology Workforce Planning
Final Report Page 127
Table 10.8: Workforce model sensitivity analysis impacts to 2019
Scenario
2014 2019
Projection Difference
from base Projection
Difference
from base
ROs – demand
Base projection 540 610
Cancer increase - 3% pa 553 13 639 29
Cancer increase - 2% pa 528 -12 581 -29
Demand due to technology - 5% increase 564 24 633 23
Demand due to technology - 10% increase 587 47 656 46
RANZCR recommended staffing levels* 492 -48 562 -48
RTs – demand
Base projection 2,447 2,764
Cancer increase -3% pa 2,506 59 2,900 136
Cancer increase -2% pa 2,388 -59 2,634 -130
Demand due to technology - 5% increase 2,553 106 2,871 107
Demand due to technology - 10% increase 2,660 213 2,978 214
AIR recommended staffing levels* 2,589 142 2,906 142
ROMPs –supply
Base projection 319 396
Registrar numbers – 10 per annum 294 -25 346 -50
ROMPs – demand
Base projection (demand) 423 474
Cancer increase - 3% pa 433 10 496 22
Cancer increase - 2% pa 414 -9 453 -21
Demand due to technology - 5% increase 440 17 491 17
Demand due to technology - 10% increase 458 35 509 35
ACPSEM recommended staffing levels* 501 78 552 78
*Based on a ratio relative to current staffing of 0.86 for ROs, 1.09 for RTs and 1.31 for ROMPs; Note: figures may not sum due to rounding
Having regard to the difficulty in predicting the workload impact of new technologies, 5%
and 10% increase in workload scenarios were modelled. The model shows that if new
technology required a 5% increase in hours to treat the same number of patients, an additional
workforce demand of about 24 ROs, 106 RTs, and 17 ROMPs would be created in 2014. A
10% increase in hours to treat the same number of patients due to new technology would lead
to an additional workforce demand in 2014 of 47 ROs, 213 RTs and 35 ROMPs. Note that
there is no difference in the projected impact of new technology over 5-10 years because the
impact is modelled a one off change to the base staffing numbers.
The sensitivity analysis also examined what would be required to staff facilities at the levels
currently recommended by the respective professional bodies. Given the limitations of the
facilities‟ and professions‟ surveys, this estimate could only be made at the national level
(public and private facilities combined) by applying a ratio to the current practice benchmarks
derived in chapter 5 (see Table 10.1). Using this approach, if facilities were staffed at a level
recommended by the professional bodies, there would be a decrease in demand of 48 ROs and
an increase in demand of 142 RTs and 78 ROMPs in 2014. Again there is no difference in the
projected impact of recommended practice staffing over 5-10 years because the impact is
modelled a one off change to the base staffing numbers.
As discussed in Chapter 9, the number of ROMPs entering the workforce depended on
funding for registrar positions. Because there is some doubt as to the continuity of registrar
training at current levels (i.e. some ROMP registrars currently occupy qualified staff positions
Radiation Oncology Workforce Planning
Final Report Page 128
and it is argued that this situation will not be repeated), a lower scenario of 10 new ROMP
registrars per year was also modelled. At this level, the ROMP supply would fall to 294 in
214, 25 fewer than if there were 15 new ROMP registrars per year and 346 ROMPs in 2019,
50 fewer than if there were 15 new ROMP registrars per year. Clearly, this outcome would
accentuate the already severe shortage of ROMPs that is predicted by the workforce model
(i.e. moving from a shortage of 74 ROMPs in 2014 in the base model to a shortage of 99
ROMPs in 2014, i.e. 25% less than what is required).
Radiation Oncology Workforce Planning
Final Report Page 129
11 Conclusions and opportunities for workforce development
This chapter sets out our conclusions and identifies a number of opportunities to address the
workforce planning issues identified in the study consistent with the requirements set out in
the project terms of reference. Key findings are summarised, and opportunities identified
(O1, O2, etc.) for further developing radiation oncology workforce planning.
11.1 MONITORING RADIATION ONCOLOGY WORKFORCE AND UTILISATION
By combining the data derived from the facilities‟ and professions‟ surveys, this project has
produced estimates of 339 ROs (231 specialists and 108 registrars), 1,578 RTs (1,401
qualified and 177 PDYs) and 250 ROMPs (193 qualified and 57 registrars) working in
Australia as at 31st December 2008. The study has also produced details of key workforce
characteristics such as age and gender profile, working hours, range and mix of professional
qualifications, numbers of working professionals recruited from overseas, and working
intentions (including retirement intentions). It is vital that the professions‟ and facilities‟
surveys be repeated at regular intervals both for the purposes of ongoing workforce
monitoring, and to allow refinements of the workforce projections model (regular „snapshots‟
of the workforce allow longitudinal data to be imputed).
O1: Repeat the professions’ surveys at least every two years by working with the
relevant professional bodies.
Also, it is clear from this study that there is an ongoing need for information about the
utilisation of radiotherapy services in Australia. NSW Health has developed the Radiotherapy
Management Information System that has been operational for nearly 20 years which collects
data from public and private facilities in that State. DHS Victoria has recently commenced
collection of a similar data set for public sector facilities. There do not appear to be similar
developments in other states/territories. Given the ongoing need to monitor radiotherapy
services, particularly if attainment of the benchmark treatment rate of 52.3% is pursued, a
nationally consistent radiotherapy data collection will be required. As a minimum the
facilities‟ survey developed for this project (or near equivalent) should be repeated annually to
form the basis of a national data collection.
O2: Repeat the facilities’ survey annually and consolidate the results as the basis of a
national radiotherapy services data collection.
11.2 CURRENT RADIATION ONCOLOGY STAFFING PRACTICES
A key component of the project was to analyse current radiation oncology staffing practices.
Table 11.1 uses the data from the facilities‟ survey to produce a consolidated picture of
current staffing practices by presenting the averages for the calculated workforce ratios
(including, as required by the contract, the number of ROs, RTs, and ROMPs per linac).
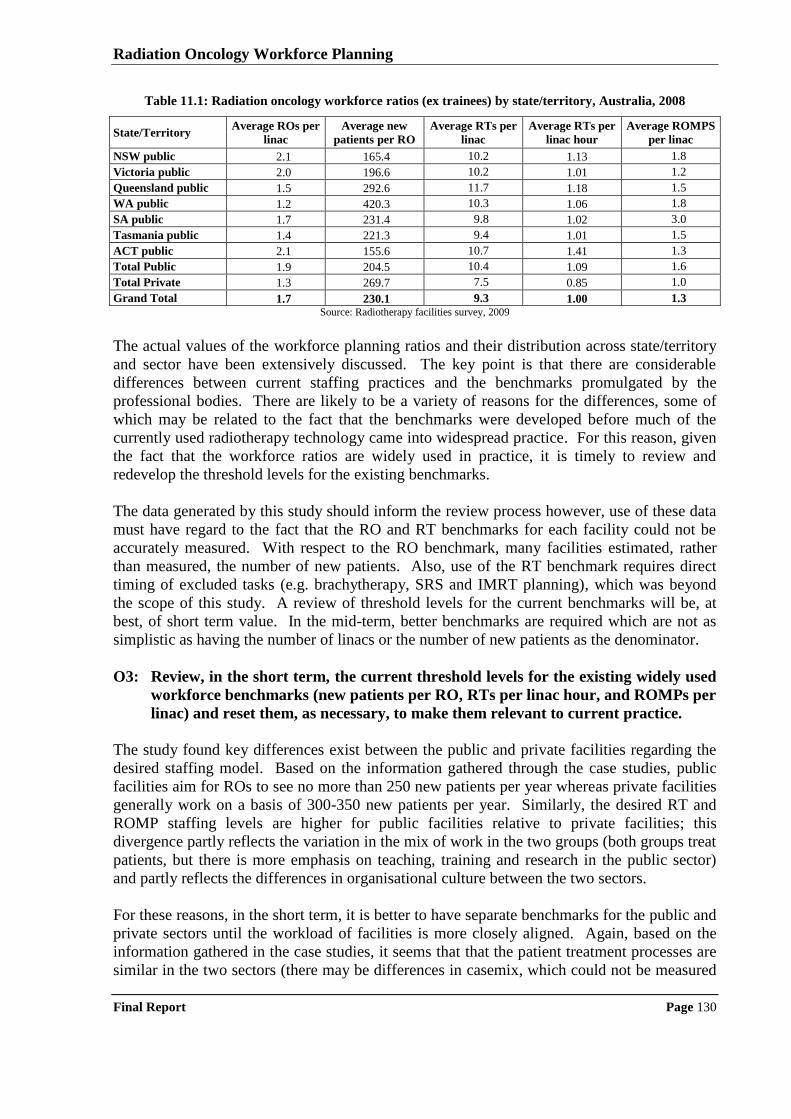
Radiation Oncology Workforce Planning
Final Report Page 130
Table 11.1: Radiation oncology workforce ratios (ex trainees) by state/territory, Australia, 2008
State/Territory Average ROs per
linac
Average new
patients per RO
Average RTs per
linac
Average RTs per
linac hour
Average ROMPS
per linac
NSW public 2.1 165.4 10.2 1.13 1.8
Victoria public 2.0 196.6 10.2 1.01 1.2
Queensland public 1.5 292.6 11.7 1.18 1.5
WA public 1.2 420.3 10.3 1.06 1.8
SA public 1.7 231.4 9.8 1.02 3.0
Tasmania public 1.4 221.3 9.4 1.01 1.5
ACT public 2.1 155.6 10.7 1.41 1.3
Total Public 1.9 204.5 10.4 1.09 1.6
Total Private 1.3 269.7 7.5 0.85 1.0
Grand Total 1.7 230.1 9.3 1.00 1.3
Source: Radiotherapy facilities survey, 2009
The actual values of the workforce planning ratios and their distribution across state/territory
and sector have been extensively discussed. The key point is that there are considerable
differences between current staffing practices and the benchmarks promulgated by the
professional bodies. There are likely to be a variety of reasons for the differences, some of
which may be related to the fact that the benchmarks were developed before much of the
currently used radiotherapy technology came into widespread practice. For this reason, given
the fact that the workforce ratios are widely used in practice, it is timely to review and
redevelop the threshold levels for the existing benchmarks.
The data generated by this study should inform the review process however, use of these data
must have regard to the fact that the RO and RT benchmarks for each facility could not be
accurately measured. With respect to the RO benchmark, many facilities estimated, rather
than measured, the number of new patients. Also, use of the RT benchmark requires direct
timing of excluded tasks (e.g. brachytherapy, SRS and IMRT planning), which was beyond
the scope of this study. A review of threshold levels for the current benchmarks will be, at
best, of short term value. In the mid-term, better benchmarks are required which are not as
simplistic as having the number of linacs or the number of new patients as the denominator.
O3: Review, in the short term, the current threshold levels for the existing widely used
workforce benchmarks (new patients per RO, RTs per linac hour, and ROMPs per
linac) and reset them, as necessary, to make them relevant to current practice.
The study found key differences exist between the public and private facilities regarding the
desired staffing model. Based on the information gathered through the case studies, public
facilities aim for ROs to see no more than 250 new patients per year whereas private facilities
generally work on a basis of 300-350 new patients per year. Similarly, the desired RT and
ROMP staffing levels are higher for public facilities relative to private facilities; this
divergence partly reflects the variation in the mix of work in the two groups (both groups treat
patients, but there is more emphasis on teaching, training and research in the public sector)
and partly reflects the differences in organisational culture between the two sectors.
For these reasons, in the short term, it is better to have separate benchmarks for the public and
private sectors until the workload of facilities is more closely aligned. Again, based on the
information gathered in the case studies, it seems that that the patient treatment processes are
similar in the two sectors (there may be differences in casemix, which could not be measured
Radiation Oncology Workforce Planning
Final Report Page 131
in the study as there is no agreed measure of patient complexity), but the teaching, training
and research workload is significantly greater in the public sector. Until workload
benchmarks are developed that can take these differences into account in the formulae,
separate thresholds for the existing workforce benchmarks would be most appropriate when
considering the number of staff required for a facility.
O4: Develop, in the short term, separate public and private sector threshold levels for
the existing widely used workforce benchmarks (new patients per RO, RTs per
linac hour, and ROMPs per linac), pending the development of new benchmarks
that take account of the differences in service delivery (casemix), teaching, training
and research workloads in the two sectors.
11.3 METHODS FOR PROJECTING RADIATION ONCOLOGY WORKFORCE
The 20 case studies of radiotherapy facilities and consultations with other stakeholders
identified current approaches to staffing facilities and planning for the future workforce. At
the State/Territory Health authority level, workforce planning has been addressed as part of
the development of radiotherapy service plans (development of such plans was an initiative
that flowed from implementation of the Baume Inquiry). Not all states/territories have
completed these plans and not all are in the public domain, but for those that the project team
has had the opportunity to review it is clear that there is a propensity, in the public sector, to
adopt the RANZCR, AIR and ACPSEM workforce planning benchmarks of 250 new patients
per RO, 1.06 RTs per linac hour and 1.7 ROMPS per linac.
Operators of private sector facilities are aware of the professional body benchmarks but based
on the information derived from the cases studies, they make little use of them. They set
staffing levels based on what they consider financially sustainable given the revenue stream
generated from the MBS and patients. The general private sector view was that staffing to the
level recommended by the professional bodies was not financially sustainable nor was it
desirable. However, representatives of private sector facilities consistently stated that if
specific funding to support teaching, training and research activities was provided more staff
would be taken on to carry out these activities (hence moving private sector staffing levels
closer to the professional body benchmarks).
O5: Review the role of the private sector in teaching, training and research activities
relating to radiation oncology services and assess the need for a specific source of
funds (in addition to current Commonwealth and state/territory government
initiatives to partly fund RT PDY and ROMP registrar positions) to support
further private sector participation in teaching training and research work.
11.4 IDEAL RADIATION ONCOLOGY WORKFORCE AND AFFORDABILITY
The project brief requested a determination of “the „ideal‟ supply of each profession to
operate existing linacs, including the basis for determination and an assessment of its
affordability”. Determining the „ideal‟ workforce level normally requires a set of data that
reflect a normative or best practice approach to carrying out the work. Typically, the work
would be broken down into tasks and the time required to complete each task would be
determined (either by direct measurement of a set of actual times leading to the determination
of the „efficient time‟ or by convening a focus group of practitioners to estimate the „efficient
Radiation Oncology Workforce Planning
Final Report Page 132
time‟ using a process known as „magnitude estimation120,121
‟). „Ideal‟ staffing levels would
then be calculated by measuring the number of times each task needs to be carried out in the
radiation oncology facility, multiplying by the time required for each task, and aggregating to
obtain total time. However, the study methodology did not provide for either direct timing or
magnitude estimation so this methodology could not be followed.
The study only measured actual staffing levels and obtained a range of stakeholder opinion as
to what is „ideal‟. As has been reported, actual staffing levels vary considerably, as do
stakeholder views on the level of staff required to operate a radiation oncology facility.
Certainly, it is possible to conclude that the current staffing levels are not „ideal‟ as there is
widespread agreement that more ROMPs would be recruited if qualified applicants were
available. This fact is reflected by the 13.7% vacancy rate as at 31st December 2008. The
situation is less clear for the RTs and ROs. The study has determined that, apart from
problems in recruiting to some regional areas, overall, there is no current shortage of ROs and
RTs (given current radiotherapy treatment rates). This does not, however, mean that the
current RT and RO workforce is „ideal‟, there may be other reasons (e.g. available funds) that
better account for staffing levels.
It is also considered that the benchmarks promulgated by the professional bodies do not
reflect „ideal‟ staffing levels (even though they are often used as a reference point in the
public sector). The benchmarks are out-of-date. For the RT and ROMP benchmarks, the
project team reviewed the supporting papers which revealed that the threshold levels reflect
radiotherapy practice in the late 1990‟s. Consequently, the RT and ROMP benchmarks are
not considered to represent the „ideal‟ workforce levels. Despite repeated attempts through
liaison with RANZCR, a paper describing the basis for the RO benchmark could not be found.
However, it is also considered that the benchmark is out-of-date and stakeholder opinion is
that it certainly does not reflect the additional work required of a RO as a result of the
introduction of a range of therapies that require much more sophisticated treatment planning.
To address this problem, a comprehensive review of workforce benchmarks is needed. This
review would start by developing casemix adjusted measures of workloads that can be used in
the benchmarks. Due to the emergence of brachytherapy (not linac based) as a treatment
modality, and the wider range of radiotherapy delivery methods on the linacs (with their
associated differences in workload), simple benchmarks that use linacs (undifferentiated) as
the denominator are not adequate. Given the systematic differences in staffing practices
between the public and private sector for all three professional groups, any future analysis of
workforce needs to be based on benchmarks that reflect the mix of work, as well as patient
and treatment complexity (otherwise different thresholds need to be developed for the two
sectors, as has been suggested in the short term).
O6: Develop new workforce benchmarks ratios for ROs, RTs and ROMPs that
incorporate a casemix adjusted measure of workload in the denominator which
reflects both patient and treatment complexity.
The project objectives also required investigation of the issue of „affordability‟ of the „ideal‟
staffing models. The question of affordability cannot be addressed without an assessment of
120 Hsiao WC, Yntema D, Braun P, Dunn D and Spencer C (1988). Measurement and analysis of intraservice work. Journal of the American Medical Association. Vol 260, (16), 2361-2370. 121 National Centre for Classification in Health (2000). Review of the literature on relative values carried out by NCCH in 1998 to inform the
PRS. Resource material C. Prepared for Medicare Schedule Review Board.
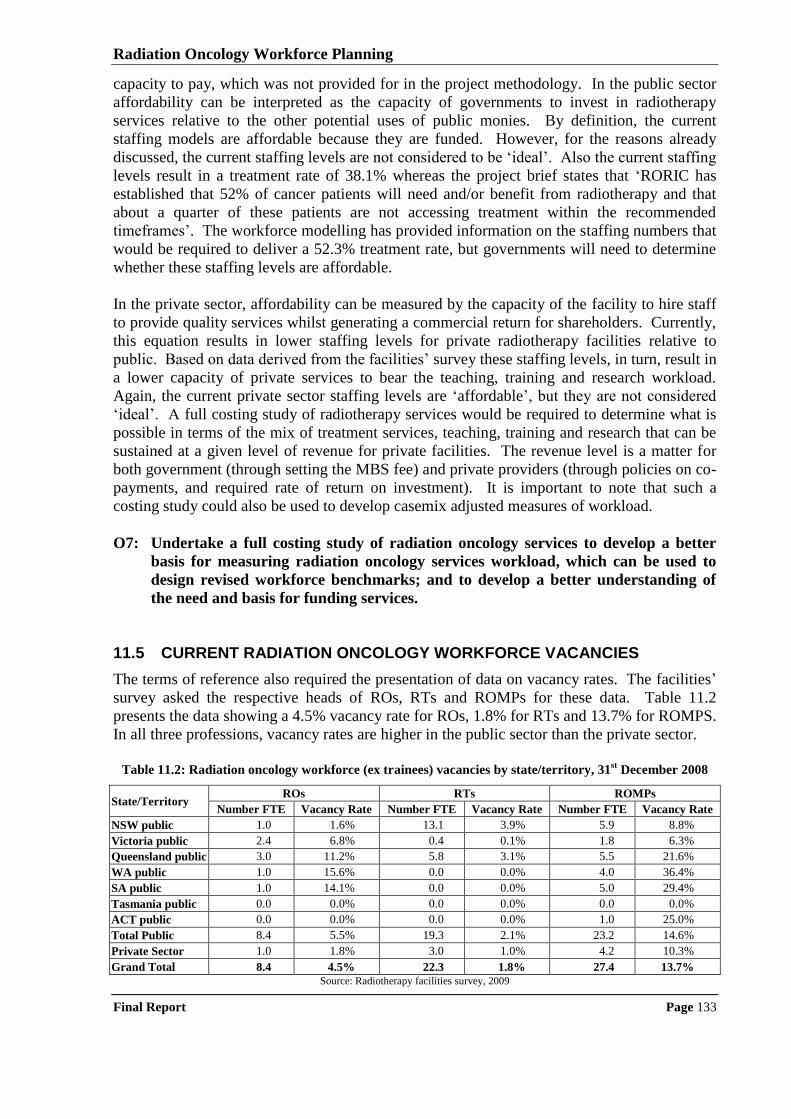
Radiation Oncology Workforce Planning
Final Report Page 133
capacity to pay, which was not provided for in the project methodology. In the public sector
affordability can be interpreted as the capacity of governments to invest in radiotherapy
services relative to the other potential uses of public monies. By definition, the current
staffing models are affordable because they are funded. However, for the reasons already
discussed, the current staffing levels are not considered to be „ideal‟. Also the current staffing
levels result in a treatment rate of 38.1% whereas the project brief states that „RORIC has
established that 52% of cancer patients will need and/or benefit from radiotherapy and that
about a quarter of these patients are not accessing treatment within the recommended
timeframes‟. The workforce modelling has provided information on the staffing numbers that
would be required to deliver a 52.3% treatment rate, but governments will need to determine
whether these staffing levels are affordable.
In the private sector, affordability can be measured by the capacity of the facility to hire staff
to provide quality services whilst generating a commercial return for shareholders. Currently,
this equation results in lower staffing levels for private radiotherapy facilities relative to
public. Based on data derived from the facilities‟ survey these staffing levels, in turn, result in
a lower capacity of private services to bear the teaching, training and research workload.
Again, the current private sector staffing levels are „affordable‟, but they are not considered
„ideal‟. A full costing study of radiotherapy services would be required to determine what is
possible in terms of the mix of treatment services, teaching, training and research that can be
sustained at a given level of revenue for private facilities. The revenue level is a matter for
both government (through setting the MBS fee) and private providers (through policies on co-
payments, and required rate of return on investment). It is important to note that such a
costing study could also be used to develop casemix adjusted measures of workload.
O7: Undertake a full costing study of radiation oncology services to develop a better
basis for measuring radiation oncology services workload, which can be used to
design revised workforce benchmarks; and to develop a better understanding of
the need and basis for funding services.
11.5 CURRENT RADIATION ONCOLOGY WORKFORCE VACANCIES
The terms of reference also required the presentation of data on vacancy rates. The facilities‟
survey asked the respective heads of ROs, RTs and ROMPs for these data. Table 11.2
presents the data showing a 4.5% vacancy rate for ROs, 1.8% for RTs and 13.7% for ROMPS.
In all three professions, vacancy rates are higher in the public sector than the private sector.
Table 11.2: Radiation oncology workforce (ex trainees) vacancies by state/territory, 31
st December 2008
State/Territory ROs RTs ROMPs
Number FTE Vacancy Rate Number FTE Vacancy Rate Number FTE Vacancy Rate
NSW public 1.0 1.6% 13.1 3.9% 5.9 8.8%
Victoria public 2.4 6.8% 0.4 0.1% 1.8 6.3%
Queensland public 3.0 11.2% 5.8 3.1% 5.5 21.6%
WA public 1.0 15.6% 0.0 0.0% 4.0 36.4%
SA public 1.0 14.1% 0.0 0.0% 5.0 29.4%
Tasmania public 0.0 0.0% 0.0 0.0% 0.0 0.0%
ACT public 0.0 0.0% 0.0 0.0% 1.0 25.0%
Total Public 8.4 5.5% 19.3 2.1% 23.2 14.6%
Private Sector 1.0 1.8% 3.0 1.0% 4.2 10.3%
Grand Total 8.4 4.5% 22.3 1.8% 27.4 13.7%
Source: Radiotherapy facilities survey, 2009
Radiation Oncology Workforce Planning
Final Report Page 134
Overall, the vacancy rates for ROs and RTs reflect natural turnover in the workforce (the RT
vacancy rate reflects a very tight employment market). These measurements are consistent
with the qualitative information that consistently highlighted that there was very little
difficulty in recruiting to RO and RT positions (there were some exceptions to this general
rule in regional areas). It was identified through the professions‟ surveys that there were
qualified ROs and RTs looking for work in Australia. However for ROMPS, the vacancy rate
reflects a workforce shortage, a finding that is consistent with information provided by
stakeholders who highlighted difficulties in recruiting qualified ROMPs to vacant positions.
In all three professional groups, the number of vacant positions is an indicator of unmet
workforce demand. It is also the case that the number of vacant positions may reflect the
availability of funds, and it might be that more positions are required but there are no funds to
allow recruitment. Anecdotally, feedback from case study site visits supports the claim that
funding shortages, rather than the lack of need, restrict the number of positions. However, the
impact of funding shortages cannot be determined using the study methodology. The study
has shown that current staffing levels are below the benchmarks promulgated by the AIR and
ACPSEM, but consistent with the benchmarks promulgated by RANZCR. However, these
benchmarks are not considered to represent the „ideal‟ level of workforce.
11.6 IMPACT OF NEW TECHNOLOGIES ON WORKFORCE
The consultative process identified that radiotherapy practice is changing rapidly with new
technologies regularly emerging. A number of technologies, „IMRT‟ „image fusion for
treatment planning, „treatment verification imaging‟ and „adaptive planning and treatment‟
were consistently reported by large proportions of each professional group as generating an
increased workload. The average impacts were almost uniformly reported as being between
10% and 15% increase in hours (i.e. 10% to 15% more hours would be required to treat the
same number of patients). These data are difficult to interpret, particularly as the rate of
penetration of the new technologies is unknown.
However, it seems clear that the more frequent and sophisticated use of technology
(particularly imaging technology) in radiotherapy will impact on workload. The most
common stakeholder view was that technology advances increase the workload of the three
professions, particularly with regard to increases in non patient contact time i.e. planning and
QA processes required to treat patients. The amount of the increase is too difficult to
determine with any confidence, as is the extent of any counter-balancing savings from other
technologies (e.g. paperless medical records) or changes to work practices. Compensating
changes in work practice and/or time saving technologies need to be explored so as to ensure
that a severe workforce shortage does not emerge (particularly for ROMPs).
The potential impact of technology is so significant that a further detailed study is warranted.
There is a history of such studies in radiation oncology, for example the establishment and
evaluation of trials of facilities with a single machine. Similar studies could be set up to
evaluate the impact on workload of the various emerging radiotherapy technologies. Such
studies could be at multiple sites and there could be a bias to involving facilities in regional
areas to provide an opportunity for staff to participate in research and development activities.
As necessary and appropriate the studies could have a broader focus, and include evaluation
Radiation Oncology Workforce Planning
Final Report Page 135
of treatment outcomes (not a pre-requisite as studying workload impact alone would be
challenging, particularly establishing suitable baseline measures).
O8: Establish studies to evaluate the impact of emerging imaging technologies on
workload, initially focusing on ‘intensity modulated radiotherapy’, ‘image fusion
for treatment planning’, ‘treatment verification imaging’, and ‘adaptive planning
and treatment’.
O9: Include a significant number of regional radiotherapy services in the ‘impact of
emerging technologies on workload studies’ to provide an additional opportunity
for staff of these services to be involved in research and development activities.
11.7 IMPACT OF NEW SERVICE MODELS ON WORKFORCE
The case studies also examined the issue of the role of radiotherapy in cancer treatment and
how that might change over time. The majority stakeholder view was that radiotherapy would
continue to be an important component of cancer treatment and care. The pace of evolution in
clinical practice will determine the future role of radiotherapy in cancer treatment but, based
on the consultations carried out for this study, the goal of 52.3% of cancer patients receiving
radiotherapy treatment for either curative or palliative purposes at some stage in their cancer
journey remains relevant and should guide the development of radiotherapy facilities and
workforce for at least the next five years.
At the level of individual cancers, stakeholders cited the reduced incidence of gynaecological
cancers as a factor that may reduce radiotherapy workload and the increased detection and
treatment of prostate cancer was cited as a factor that could increase workload. There is
insufficient evidence to determine whether there will be a net effect, but stakeholders
consistently advised the number of patients needing radiotherapy treatment will not decrease
(either in absolute terms or as a proportion of patients diagnosed with cancer). Newer service
model developments such as intra-operative radiotherapy (one dose applied intra-operatively
as substitute for a course applied over 20 fractions) and hypo-fractionation (larger doses in
each fraction, thereby reducing the number of fractions) were seen as potential sources of
workload reductions but it is too early to be definitive about potential workforce impact.
These developments should be monitored.
O10: Monitor developments in radiotherapy service delivery models such as hypo-
fractionation and intra-operative radiotherapy to determine their impact on
workload and hence the required workforce.
11.8 SHORT-TERM WORKFORCE REQUIRED TO SUPPORT NEW FACILITIES
There are two aspects to considering the workforce situation going forward. The first is the
short term situation, which is best examined by projecting the workforce requirements by
profession based on the estimated number of linacs that will be commissioned (drawn from
the information provided by stakeholders). Table 11.3 presents the workforce requirements
by sector based on the medians of the distributions derived from the facilities‟ survey of ROs
per linac, RTs per linac, and ROMPs per linac calculated separately for the public and private
sectors and then totalled. It should be noted that this analysis is based on current staffing
practice, which is not considered to be „ideal‟, particularly in the case of ROMPs.
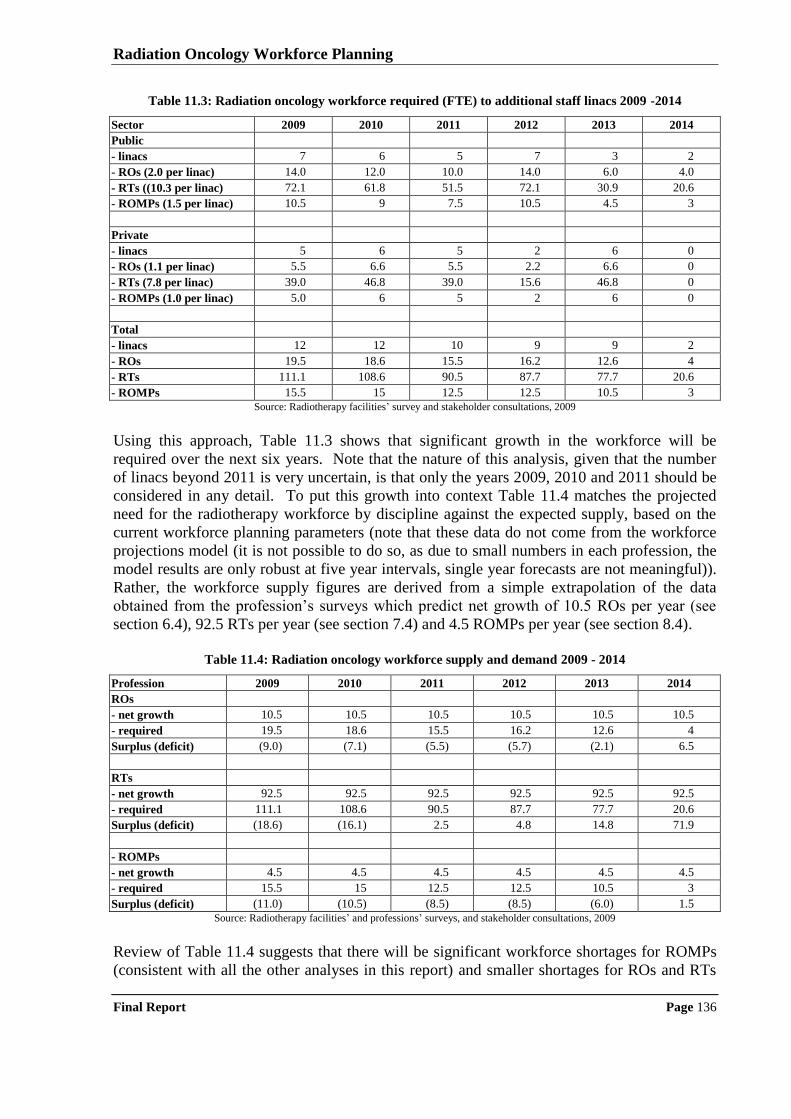
Radiation Oncology Workforce Planning
Final Report Page 136
Table 11.3: Radiation oncology workforce required (FTE) to additional staff linacs 2009 -2014
Sector 2009 2010 2011 2012 2013 2014
Public
- linacs 7 6 5 7 3 2
- ROs (2.0 per linac) 14.0 12.0 10.0 14.0 6.0 4.0
- RTs ((10.3 per linac) 72.1 61.8 51.5 72.1 30.9 20.6
- ROMPs (1.5 per linac) 10.5 9 7.5 10.5 4.5 3
Private
- linacs 5 6 5 2 6 0
- ROs (1.1 per linac) 5.5 6.6 5.5 2.2 6.6 0
- RTs (7.8 per linac) 39.0 46.8 39.0 15.6 46.8 0
- ROMPs (1.0 per linac) 5.0 6 5 2 6 0
Total
- linacs 12 12 10 9 9 2
- ROs 19.5 18.6 15.5 16.2 12.6 4
- RTs 111.1 108.6 90.5 87.7 77.7 20.6
- ROMPs 15.5 15 12.5 12.5 10.5 3
Source: Radiotherapy facilities‟ survey and stakeholder consultations, 2009
Using this approach, Table 11.3 shows that significant growth in the workforce will be
required over the next six years. Note that the nature of this analysis, given that the number
of linacs beyond 2011 is very uncertain, is that only the years 2009, 2010 and 2011 should be
considered in any detail. To put this growth into context Table 11.4 matches the projected
need for the radiotherapy workforce by discipline against the expected supply, based on the
current workforce planning parameters (note that these data do not come from the workforce
projections model (it is not possible to do so, as due to small numbers in each profession, the
model results are only robust at five year intervals, single year forecasts are not meaningful)).
Rather, the workforce supply figures are derived from a simple extrapolation of the data
obtained from the profession‟s surveys which predict net growth of 10.5 ROs per year (see
section 6.4), 92.5 RTs per year (see section 7.4) and 4.5 ROMPs per year (see section 8.4).
Table 11.4: Radiation oncology workforce supply and demand 2009 - 2014
Profession 2009 2010 2011 2012 2013 2014
ROs
- net growth 10.5 10.5 10.5 10.5 10.5 10.5
- required 19.5 18.6 15.5 16.2 12.6 4
Surplus (deficit) (9.0) (7.1) (5.5) (5.7) (2.1) 6.5
RTs
- net growth 92.5 92.5 92.5 92.5 92.5 92.5
- required 111.1 108.6 90.5 87.7 77.7 20.6
Surplus (deficit) (18.6) (16.1) 2.5 4.8 14.8 71.9
- ROMPs
- net growth 4.5 4.5 4.5 4.5 4.5 4.5
- required 15.5 15 12.5 12.5 10.5 3
Surplus (deficit) (11.0) (10.5) (8.5) (8.5) (6.0) 1.5
Source: Radiotherapy facilities‟ and professions‟ surveys, and stakeholder consultations, 2009
Review of Table 11.4 suggests that there will be significant workforce shortages for ROMPs
(consistent with all the other analyses in this report) and smaller shortages for ROs and RTs
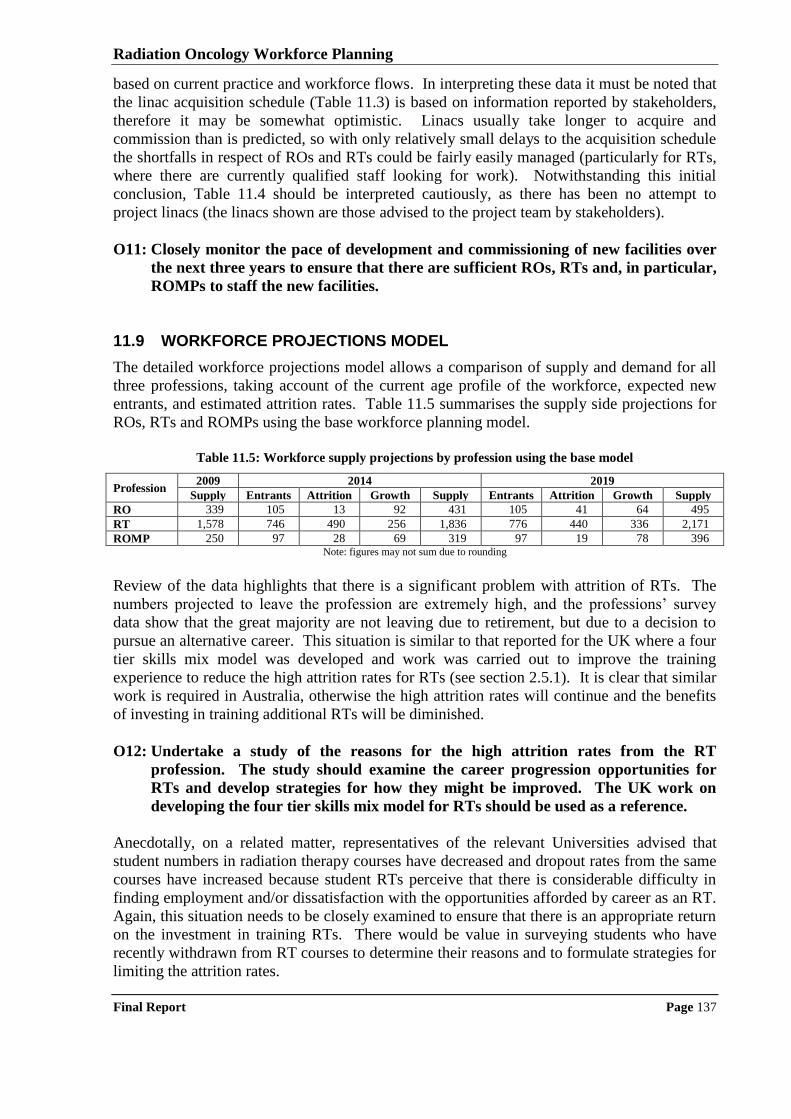
Radiation Oncology Workforce Planning
Final Report Page 137
based on current practice and workforce flows. In interpreting these data it must be noted that
the linac acquisition schedule (Table 11.3) is based on information reported by stakeholders,
therefore it may be somewhat optimistic. Linacs usually take longer to acquire and
commission than is predicted, so with only relatively small delays to the acquisition schedule
the shortfalls in respect of ROs and RTs could be fairly easily managed (particularly for RTs,
where there are currently qualified staff looking for work). Notwithstanding this initial
conclusion, Table 11.4 should be interpreted cautiously, as there has been no attempt to
project linacs (the linacs shown are those advised to the project team by stakeholders).
O11: Closely monitor the pace of development and commissioning of new facilities over
the next three years to ensure that there are sufficient ROs, RTs and, in particular,
ROMPs to staff the new facilities.
11.9 WORKFORCE PROJECTIONS MODEL
The detailed workforce projections model allows a comparison of supply and demand for all
three professions, taking account of the current age profile of the workforce, expected new
entrants, and estimated attrition rates. Table 11.5 summarises the supply side projections for
ROs, RTs and ROMPs using the base workforce planning model.
Table 11.5: Workforce supply projections by profession using the base model
Profession 2009 2014 2019
Supply Entrants Attrition Growth Supply Entrants Attrition Growth Supply
RO 339 105 13 92 431 105 41 64 495
RT 1,578 746 490 256 1,836 776 440 336 2,171
ROMP 250 97 28 69 319 97 19 78 396 Note: figures may not sum due to rounding
Review of the data highlights that there is a significant problem with attrition of RTs. The
numbers projected to leave the profession are extremely high, and the professions‟ survey
data show that the great majority are not leaving due to retirement, but due to a decision to
pursue an alternative career. This situation is similar to that reported for the UK where a four
tier skills mix model was developed and work was carried out to improve the training
experience to reduce the high attrition rates for RTs (see section 2.5.1). It is clear that similar
work is required in Australia, otherwise the high attrition rates will continue and the benefits
of investing in training additional RTs will be diminished.
O12: Undertake a study of the reasons for the high attrition rates from the RT
profession. The study should examine the career progression opportunities for
RTs and develop strategies for how they might be improved. The UK work on
developing the four tier skills mix model for RTs should be used as a reference.
Anecdotally, on a related matter, representatives of the relevant Universities advised that
student numbers in radiation therapy courses have decreased and dropout rates from the same
courses have increased because student RTs perceive that there is considerable difficulty in
finding employment and/or dissatisfaction with the opportunities afforded by career as an RT.
Again, this situation needs to be closely examined to ensure that there is an appropriate return
on the investment in training RTs. There would be value in surveying students who have
recently withdrawn from RT courses to determine their reasons and to formulate strategies for
limiting the attrition rates.
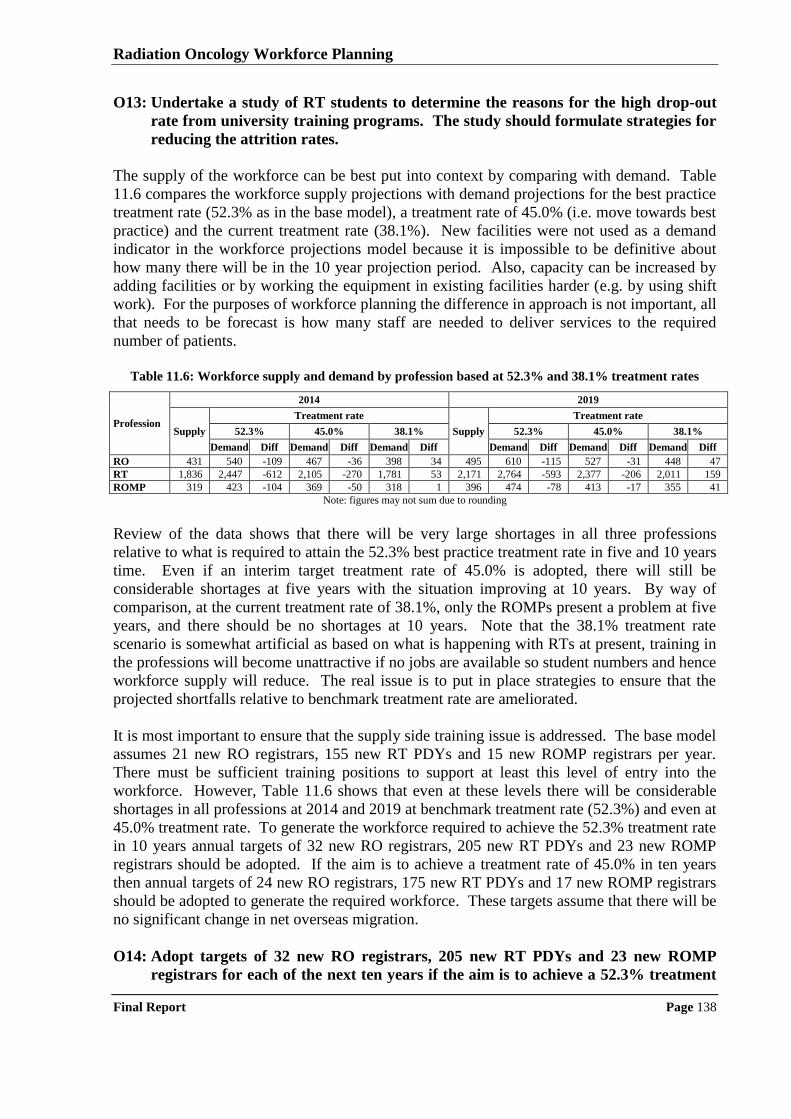
Radiation Oncology Workforce Planning
Final Report Page 138
O13: Undertake a study of RT students to determine the reasons for the high drop-out
rate from university training programs. The study should formulate strategies for
reducing the attrition rates.
The supply of the workforce can be best put into context by comparing with demand. Table
11.6 compares the workforce supply projections with demand projections for the best practice
treatment rate (52.3% as in the base model), a treatment rate of 45.0% (i.e. move towards best
practice) and the current treatment rate (38.1%). New facilities were not used as a demand
indicator in the workforce projections model because it is impossible to be definitive about
how many there will be in the 10 year projection period. Also, capacity can be increased by
adding facilities or by working the equipment in existing facilities harder (e.g. by using shift
work). For the purposes of workforce planning the difference in approach is not important, all
that needs to be forecast is how many staff are needed to deliver services to the required
number of patients.
Table 11.6: Workforce supply and demand by profession based at 52.3% and 38.1% treatment rates
Profession
2014 2019
Supply
Treatment rate
Supply
Treatment rate
52.3% 45.0% 38.1% 52.3% 45.0% 38.1%
Demand Diff Demand Diff Demand Diff Demand Diff Demand Diff Demand Diff
RO 431 540 -109 467 -36 398 34 495 610 -115 527 -31 448 47
RT 1,836 2,447 -612 2,105 -270 1,781 53 2,171 2,764 -593 2,377 -206 2,011 159
ROMP 319 423 -104 369 -50 318 1 396 474 -78 413 -17 355 41
Note: figures may not sum due to rounding
Review of the data shows that there will be very large shortages in all three professions
relative to what is required to attain the 52.3% best practice treatment rate in five and 10 years
time. Even if an interim target treatment rate of 45.0% is adopted, there will still be
considerable shortages at five years with the situation improving at 10 years. By way of
comparison, at the current treatment rate of 38.1%, only the ROMPs present a problem at five
years, and there should be no shortages at 10 years. Note that the 38.1% treatment rate
scenario is somewhat artificial as based on what is happening with RTs at present, training in
the professions will become unattractive if no jobs are available so student numbers and hence
workforce supply will reduce. The real issue is to put in place strategies to ensure that the
projected shortfalls relative to benchmark treatment rate are ameliorated.
It is most important to ensure that the supply side training issue is addressed. The base model
assumes 21 new RO registrars, 155 new RT PDYs and 15 new ROMP registrars per year.
There must be sufficient training positions to support at least this level of entry into the
workforce. However, Table 11.6 shows that even at these levels there will be considerable
shortages in all professions at 2014 and 2019 at benchmark treatment rate (52.3%) and even at
45.0% treatment rate. To generate the workforce required to achieve the 52.3% treatment rate
in 10 years annual targets of 32 new RO registrars, 205 new RT PDYs and 23 new ROMP
registrars should be adopted. If the aim is to achieve a treatment rate of 45.0% in ten years
then annual targets of 24 new RO registrars, 175 new RT PDYs and 17 new ROMP registrars
should be adopted to generate the required workforce. These targets assume that there will be
no significant change in net overseas migration.
O14: Adopt targets of 32 new RO registrars, 205 new RT PDYs and 23 new ROMP
registrars for each of the next ten years if the aim is to achieve a 52.3% treatment
Radiation Oncology Workforce Planning
Final Report Page 139
rate in 2019 or targets of 24 new RO registrars, 175 new RT PDYs and 17 new
ROMP registrars for each of the next ten years if the aim is to achieve a 45.0%
treatment rate in 2019.
Related targets will need to be adopted for graduates from radiation therapy and medical
physics programs to ensure that there are sufficient graduates to fill the vocational training
places. There should be few problems for ROs as medical school intakes have already been
increased in Australia and additional medical graduates are expected annually from 2011
onwards, thereby provided a source for filling the extra radiation oncology registrar positions.
To generate the graduates to fill the vocational training positions required to achieve the
52.3% treatment rate in 10 years annual targets of 250 radiation therapy students and 70
medical physics students. If the aim is to achieve a treatment rate of 45.0% in ten years then
annual targets of 210 radiation therapy students and 52 medical physics students should be
adopted to generate the graduates necessary to fill the vocational training positions.
O15 Adopt targets of 250 new radiation therapy students and 70 new medical physics
students (masters level) for each of the next ten years, if the aim is achieve a 52.3%
treatment rate or 210 new radiation therapy students and 52 medical physics
students for each of the next ten years if the aim is to achieve a 45.0% treatment
rate, allowing for the fact that not all students will graduate and not all will pursue
careers in radiation oncology services in Australia.
It should be noted that shortages forecast above are based on current staffing practices, which
are not considered „ideal‟. Also, any workload increase generated by new technology has not
been taken into account. Inclusion of these factors would only make what are predicted to be
severe workforce shortages even more severe. While current staffing practice may suffice in
the short term, it must change as a result of the development of better workforce benchmarks
(as has been suggested). The problem is most acute for ROMPs where current staffing
practice appears to be inadequate to keep pace with the required work. The gap will only
widen as new and more complicated technologies are introduced into radiotherapy service
delivery. Thus, the suggested studies of technology impact on workload would also provide
an important input into the workforce planning process.
11.10 WORKFORCE DEVELOPMENT INITIATIVES
The workforce planning model demonstrates that there will be significant workforce shortages
of ROs, RTs and ROMPs if an increase in the radiotherapy treatment beyond the current level
of 38.1% is pursued. The position is best illustrated by the prediction that, if the current
workforce planning parameters are maintained, Australia will be 109 ROs, 612 RTs and 104
ROMPs short of achieving the 52.3% treatment rate in 2014, with no significant improvement
in the situation by 2019. Should the lower treatment rate of 45.0% be adopted as the target,
Australia will still be 36 ROs, 270 RTs and 50 ROMPs short in 2014 based on the current
workforce planning parameters. Immediate action on workforce development is required if
any increase in treatment rate is to be achieved within a reasonable time period.
The case study process and discussions with other stakeholders identified a range of existing
workforce development initiatives. These initiatives have been successful in alleviating the
critical shortages identified by the Baume Inquiry in ROs and RTs and somewhat less
successful in respect of ROMPs. Many of these initiatives should be continued, however new
Radiation Oncology Workforce Planning
Final Report Page 140
initiatives are also required to generate the workforce necessary to increase the radiotherapy
treatment rate. Table 11.7 summarises the issues, the strategies used to address them to date,
and the opportunities to take further action based on the information gathered from case study
process. To facilitate consideration of implementation actions, opportunities are grouped into
short-term and mid-term.
Of the initiatives identified in Table 11.7, it is most important to carry forward the
opportunities that sustain and expand the existing vocational training infrastructure, as
additional ROs, RTs and ROMPS will need to be trained every year to increase the
radiotherapy treatment rate. Currently, much of the funding for vocational training positions
for RT PDYs and ROMP registrars is short term (i.e. non-recurrent). This funding should be
put onto a recurrent basis to ensure that there will be an appropriate number of RTs and
ROMPs (much of the funding for medical registrar positions in the public sector is already
recurrent; funding of medical registrar positions in the private sector should be further
explored) to deliver radiotherapy services at the requires rate in the future.
O16: Imbed the funding for vocational training positions for RT PDYs and ROMP
registrars into the staffing structures of public radiotherapy facilities. The current
situation where most funding for PDYs and ROMP registrars is provided on a
limited term basis creates uncertainty, and given that there will be a continuing
need to vocationally train RTs and ROMPs, recurrent funding would provide
facilities with a better opportunity to manage and plan their workforce.
O17: Determine, through a process of DoHA working with state/territory health
authorities, how best to support the private sector to participate in vocational
training for ROs, RTs and ROMPs having regard to the current, largely
Commonwealth government funded initiatives (see related opportunity 5).
An important part of the vocational training infrastructure is support positions such as clinical
placement coordinators, tutors/educators, and preceptors. Funding for these positions has
been provided by the DoHA and state/territory health authorities. This funding should
continue. Similarly DoHA has provided funding to support universities to attract students to
programs in radiation therapy and medical physics. The results of the workforce projections
model demonstrate that it is important that these student numbers be maintained so this
support should also continue.
O18: Continue to sustain the vocational training support infrastructure by DoHA and
state/territory health authorities funding positions such as clinical placement
coordinators, tutors/educators, and preceptors in radiation oncology facilities.
O19: Attract additional students to radiation therapy and medical physics programs by
DoHA continuing to provide funding support to Universities offering radiation
therapy and medical physicist undergraduate and postgraduate programs.
Notwithstanding the suggested investment in training positions and related infrastructure, the
workforce planning model shows that there will be a continuing requirement for recruitment
of ROMPs from overseas at the current level or greater for at least five years. Accordingly
the overseas recruitment process should be investigated and arrangements made to ensure that
ROMPs are allocated the highest priority for obtaining working visas so that any unnecessary
delays in overseas qualified ROMPs taking up positions in Australia are eliminated.

Radiation Oncology Workforce Planning
Final Report Page 141
Table 11.7: Workforce development initiatives identified through case study process and opportunities for further development
Workforce issue
Application
Existing workforce development strategies Workforce development opportunity
Profession Pub facilities Priv facilities
RO RT ROMP Metro Reg Metro Reg Short term Mid term
Working hours X X X X X X Most employers public and private offer a range of flexible
working arrangements including nine day working fortnight
(RTs); time off in lieu of additional hours worked; access to overtime payments; access to part time work; maternity leave; and
access to leave without pay (e.g. to pursue overseas work).
Facilities to continue with local
initiatives that best meet needs, no
need for system level action.
Remuneration X X X X X X Many employers have modified standard remuneration
arrangements to attract and retain qualified RTs and ROMPs. In a number of cases (e.g. ROMPs in NSW) there have been
significant salary increases. In other cases, public sector
remuneration arrangements have included special allowances or
retention payments to allow employers to compete at market rates
for labour. In the private sector many employers routinely offer a pre-determined add-on to the local public sector award
remuneration package to attract and retain staff.
Jurisdictions to consider reviewing
relevant Awards with the objective of moving towards national parity
of pay and conditions for ROMPs
across Australia.
Consider the development of
nationally consistent pay and conditions for RTs and ROMPs.
Overseas recruitment X X X X X Many employers have looked overseas to find qualified staff to fill
positions, historically for ROs, RTs and ROMPs but currently mainly for ROMPs. Overseas applicants have been offered
support by way of funding for travel to Australia to assess the
working environment. Many stakeholders made the point that immigration requirements make the process of recruiting from
overseas slow and often frustrating..
Change immigration requirements
to allocate the highest entry priority level to qualified ROMPs
who wish to work in Australia
Vocational training program for ROMPs
X X X X X The Commonwealth government, some state/territory health authorities and ACPSEM worked together to develop the TEAP
program, that has provided structured vocational training for
ROMPs. This program, which is widely regarded as having been successful, has created a clear pathway for ROMPs to enter and
progress through the workforce.
Continue development of TEAP
Review length of the TEAP for candidates who hold Masters or
PhD level qualifications in physics,
but not medical physics
Vocational training positions X X X X X X The Commonwealth government has provided support for funding
(part salary) PDY trainee positions for RTs and registrar positions for ROMPs. A number of state/territory health authorities have
directly matched this funding (i.e. separate to the budget allocated
to the radiotherapy facility). Also, many private facilities have supplemented the Commonwealth funding to take on trainees.
Continue existing funding of
vocational training positions;
Imbed funding of vocational
training positions into budgets of public facilities.
Consider further funding to support vocational training positions in
private facilities
Vocational training and continuing education
infrastructure
X X X X X X X The Commonwealth government and often the state/territory health authorities have provided funding for positions such as
clinical placement coordinators, tutors/educators, and preceptors,
to put in place staffing infrastructure that allows effective vocational training and support for education.
Continue and extend funding (to reflect the additional vocational
training support infrastructure that
will be required to increase radiotherapy treatment rate) for
positions that support vocational
training and continuing education.
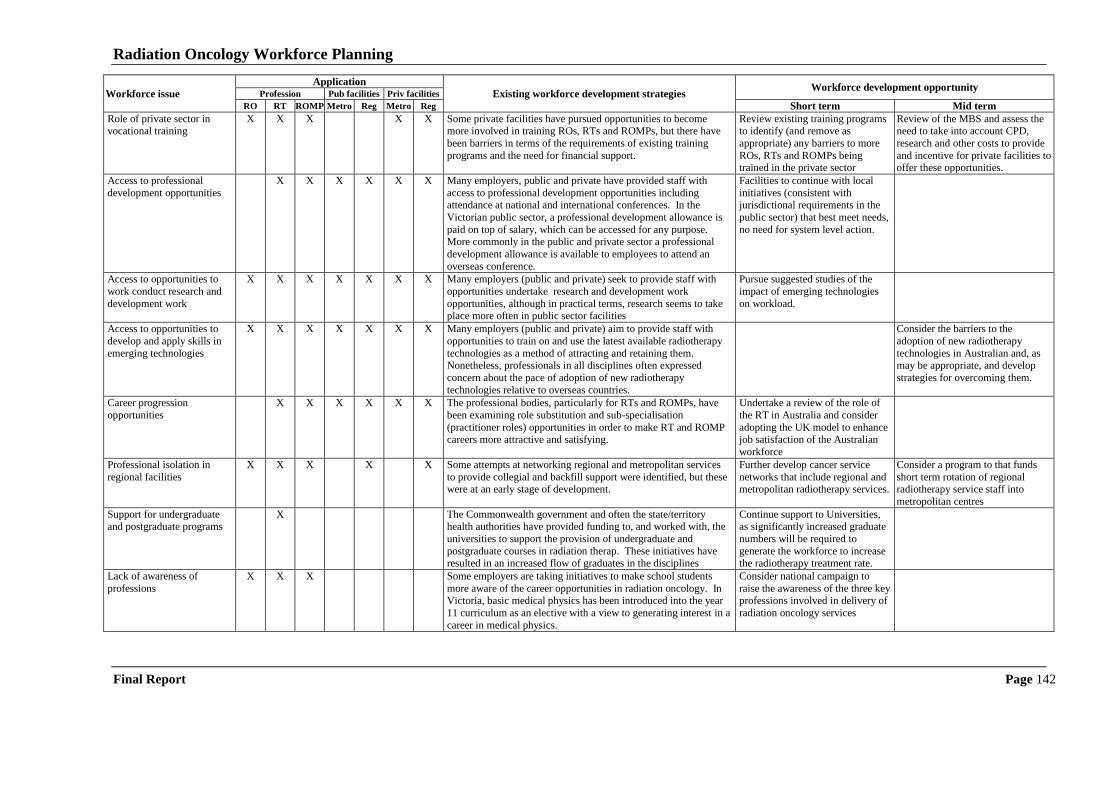
Radiation Oncology Workforce Planning
Final Report Page 142
Workforce issue
Application
Existing workforce development strategies Workforce development opportunity
Profession Pub facilities Priv facilities
RO RT ROMP Metro Reg Metro Reg Short term Mid term
Role of private sector in vocational training
X X X X X Some private facilities have pursued opportunities to become more involved in training ROs, RTs and ROMPs, but there have
been barriers in terms of the requirements of existing training
programs and the need for financial support.
Review existing training programs to identify (and remove as
appropriate) any barriers to more
ROs, RTs and ROMPs being trained in the private sector
Review of the MBS and assess the need to take into account CPD,
research and other costs to provide
and incentive for private facilities to offer these opportunities.
Access to professional
development opportunities
X X X X X X Many employers, public and private have provided staff with
access to professional development opportunities including attendance at national and international conferences. In the
Victorian public sector, a professional development allowance is
paid on top of salary, which can be accessed for any purpose. More commonly in the public and private sector a professional
development allowance is available to employees to attend an
overseas conference.
Facilities to continue with local
initiatives (consistent with jurisdictional requirements in the
public sector) that best meet needs,
no need for system level action.
Access to opportunities to
work conduct research and
development work
X X X X X X X Many employers (public and private) seek to provide staff with
opportunities undertake research and development work
opportunities, although in practical terms, research seems to take place more often in public sector facilities
Pursue suggested studies of the
impact of emerging technologies
on workload.
Access to opportunities to
develop and apply skills in
emerging technologies
X X X X X X X Many employers (public and private) aim to provide staff with
opportunities to train on and use the latest available radiotherapy
technologies as a method of attracting and retaining them. Nonetheless, professionals in all disciplines often expressed
concern about the pace of adoption of new radiotherapy
technologies relative to overseas countries.
Consider the barriers to the
adoption of new radiotherapy
technologies in Australian and, as may be appropriate, and develop
strategies for overcoming them.
Career progression
opportunities
X X X X X X The professional bodies, particularly for RTs and ROMPs, have
been examining role substitution and sub-specialisation
(practitioner roles) opportunities in order to make RT and ROMP careers more attractive and satisfying.
Undertake a review of the role of
the RT in Australia and consider
adopting the UK model to enhance job satisfaction of the Australian
workforce
Professional isolation in
regional facilities
X X X X X Some attempts at networking regional and metropolitan services
to provide collegial and backfill support were identified, but these were at an early stage of development.
Further develop cancer service
networks that include regional and metropolitan radiotherapy services.
Consider a program to that funds
short term rotation of regional radiotherapy service staff into
metropolitan centres
Support for undergraduate and postgraduate programs
X The Commonwealth government and often the state/territory health authorities have provided funding to, and worked with, the
universities to support the provision of undergraduate and
postgraduate courses in radiation therap. These initiatives have resulted in an increased flow of graduates in the disciplines
Continue support to Universities, as significantly increased graduate
numbers will be required to
generate the workforce to increase the radiotherapy treatment rate.
Lack of awareness of
professions
X X X Some employers are taking initiatives to make school students
more aware of the career opportunities in radiation oncology. In Victoria, basic medical physics has been introduced into the year
11 curriculum as an elective with a view to generating interest in a
career in medical physics.
Consider national campaign to
raise the awareness of the three key professions involved in delivery of
radiation oncology services
Radiation Oncology Workforce Planning
Final Report Page 143
O20: Examine the overseas recruitment process for ROMPs and make arrangements to
ensure that ROMPs are allocated the highest priority for obtaining working visas
so that any unnecessary delays in overseas qualified ROMPs taking up positions in
Australia are eliminated.
A range of other short-term (pursuit within six months) workforce development opportunities
are identified in Table 11.7. These opportunities include moving towards closer alignment of
pay and conditions for ROMPs across Australia, the continued development of the ACPSEM
TEAP, the further development of regional/metropolitan cancer services networks to address
the issue of professional isolation of practitioners in regional facilities, and the conduct of a
national campaign to promote the attractiveness of radiation oncologist, radiation therapist
and radiation oncology medical physicist careers.
O21: Pursue, in the short term (within six months), the further development of the
radiation oncology workforce by:
jurisdictions reviewing relevant Awards with the objective of moving towards
national parity of pay and conditions for ROMPs across Australia;
continuing the development of the ACPSEM TEAP;
further developing regional/metropolitan cancer services networks to address
the issue of professional isolation of practitioners in regional facilities; and
conducting a national campaign to promote careers as radiation oncologists,
radiation therapists and radiation oncology medical physicists.
Table 11.7 also identifies a range of workforce development opportunities that should be
pursued in the mid-term (between six months and two years). These opportunities include the
development of nationally consistent pay and conditions for RTs and ROMPs; a review of the
length of the ACPSEM TEAP for candidates who already hold Masters or PhD level
qualifications in physics but not medical physics; a review the radiation oncology items in the
MBS to assess the need to take into account CPD research and other costs to provide
incentives for private facilities to offer these opportunities, a consideration of the barriers to
the adoption of new radiotherapy technologies in Australia and, as may be appropriate,
development of strategies for overcoming them; and a consideration of a program that funds
short term rotation of regional radiotherapy staff into metropolitan centres.
O22: Pursue, in the mid-term (between six months and two years), the further
development of the radiation oncology workforce by:
developing nationally consistent pay and conditions for RTs and ROMPs;
reviewing the length of the ACPSEM TEAP program for candidates who hold
Masters or PhD level qualifications in physics but not medical physics;
reviewing the radiation oncology items in the MBS and assessing the need to
take into account CPD, research and other costs to provide incentives for
private facilities to offer these opportunities;
considering the barriers to the adoption of new radiotherapy technologies in
Australia and, as may be appropriate, strategies for overcoming them; and
considering a program that funds short term rotation of regional radiotherapy
staff into metropolitan centres.
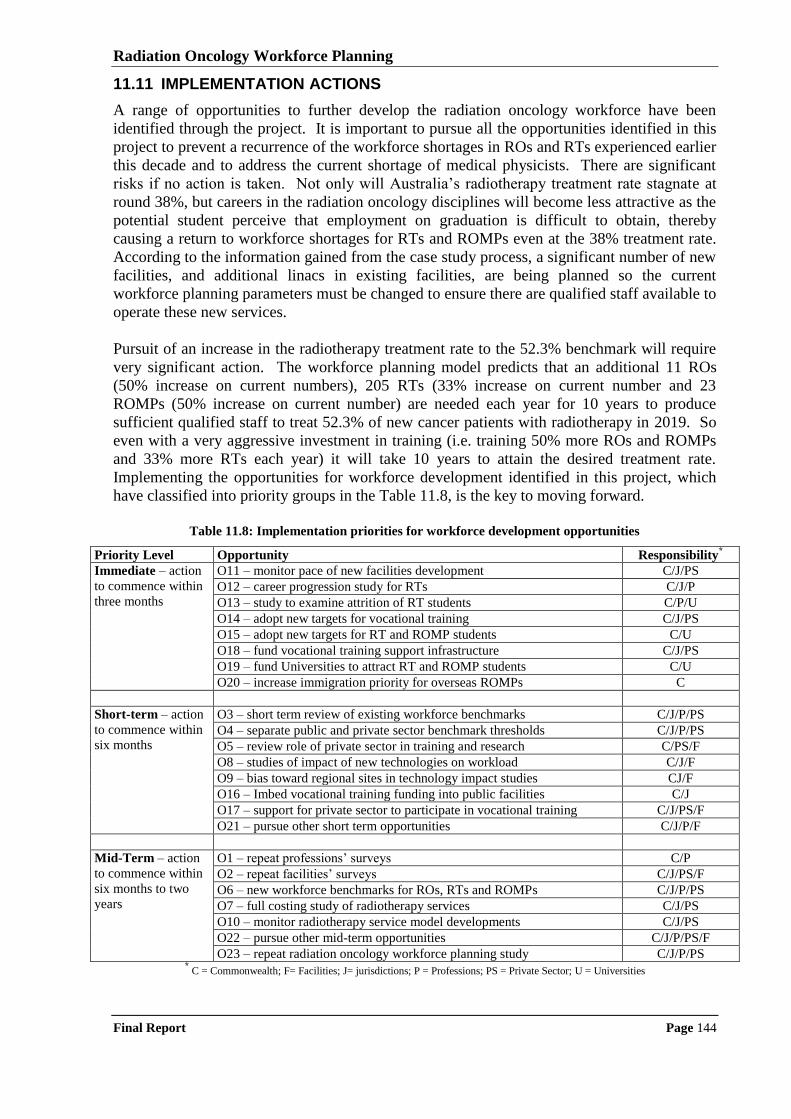
Radiation Oncology Workforce Planning
Final Report Page 144
11.11 IMPLEMENTATION ACTIONS
A range of opportunities to further develop the radiation oncology workforce have been
identified through the project. It is important to pursue all the opportunities identified in this
project to prevent a recurrence of the workforce shortages in ROs and RTs experienced earlier
this decade and to address the current shortage of medical physicists. There are significant
risks if no action is taken. Not only will Australia‟s radiotherapy treatment rate stagnate at
round 38%, but careers in the radiation oncology disciplines will become less attractive as the
potential student perceive that employment on graduation is difficult to obtain, thereby
causing a return to workforce shortages for RTs and ROMPs even at the 38% treatment rate.
According to the information gained from the case study process, a significant number of new
facilities, and additional linacs in existing facilities, are being planned so the current
workforce planning parameters must be changed to ensure there are qualified staff available to
operate these new services.
Pursuit of an increase in the radiotherapy treatment rate to the 52.3% benchmark will require
very significant action. The workforce planning model predicts that an additional 11 ROs
(50% increase on current numbers), 205 RTs (33% increase on current number and 23
ROMPs (50% increase on current number) are needed each year for 10 years to produce
sufficient qualified staff to treat 52.3% of new cancer patients with radiotherapy in 2019. So
even with a very aggressive investment in training (i.e. training 50% more ROs and ROMPs
and 33% more RTs each year) it will take 10 years to attain the desired treatment rate.
Implementing the opportunities for workforce development identified in this project, which
have classified into priority groups in the Table 11.8, is the key to moving forward.
Table 11.8: Implementation priorities for workforce development opportunities
Priority Level Opportunity Responsibility*
Immediate – action
to commence within
three months
O11 – monitor pace of new facilities development C/J/PS
O12 – career progression study for RTs C/J/P
O13 – study to examine attrition of RT students C/P/U
O14 – adopt new targets for vocational training C/J/PS
O15 – adopt new targets for RT and ROMP students C/U
O18 – fund vocational training support infrastructure C/J/PS
O19 – fund Universities to attract RT and ROMP students C/U
O20 – increase immigration priority for overseas ROMPs C
Short-term – action
to commence within
six months
O3 – short term review of existing workforce benchmarks C/J/P/PS
O4 – separate public and private sector benchmark thresholds C/J/P/PS
O5 – review role of private sector in training and research C/PS/F
O8 – studies of impact of new technologies on workload C/J/F
O9 – bias toward regional sites in technology impact studies CJ/F
O16 – Imbed vocational training funding into public facilities C/J
O17 – support for private sector to participate in vocational training C/J/PS/F
O21 – pursue other short term opportunities C/J/P/F
Mid-Term – action
to commence within
six months to two
years
O1 – repeat professions‟ surveys C/P
O2 – repeat facilities‟ surveys C/J/PS/F
O6 – new workforce benchmarks for ROs, RTs and ROMPs C/J/P/PS
O7 – full costing study of radiotherapy services C/J/PS
O10 – monitor radiotherapy service model developments C/J/PS
O22 – pursue other mid-term opportunities C/J/P/PS/F
O23 – repeat radiation oncology workforce planning study C/J/P/PS * C = Commonwealth; F= Facilities; J= jurisdictions; P = Professions; PS = Private Sector; U = Universities
Radiation Oncology Workforce Planning
Final Report Page 145
Finally, as with any workforce planning study of this magnitude conducted at a point in time,
it is important to maintain the currency of the underlying information. Repetition of the
facilities‟ and professions‟ surveys at regular intervals has been proposed as an opportunity to
monitor changes in workforce characteristics. Repetition, in full, of this radiation oncology
workforce planning study in 2012 is also proposed as an opportunity to reset the planning
parameters having regard to the evolution of radiotherapy services and the associated
workforce in the intervening period.
O23: Repeat, in full, the radiation oncology workforce planning study in 2012 so that the
planning parameters can be reset having regard to the evolution of radiotherapy
services and the associated workforce in the intervening period.
Appendix A
AN OVERVIEW OF CANCER, CANCER SERVICES AND
RADIOTHERAPY IN AUSTRALIA

A Cancer services and radiotherapy
This Appendix provides an overview of the cancer services landscape in Australia with a
particular focus on the radiotherapy modalities and their use.
A.1 CANCER IN AUSTRALIA
Cancer is a leading cause of death in the Australia with more than 39,000 deaths and over
100,000 people diagnosed every year122
. However, over the last decade improved early
detection and treatment have resulted in better survival rates, despite the absolute numbers of
sufferers and deaths continuing to increase by 2% to 3% per year as the population ages123
.
This section presents some high level statistics on cancer incidence and mortality.
A.1.1 Cancer incidence
Table A.1 shows that in 2005, 100,514 (56,158 males and 44,356 females) people were
diagnosed with cancer. The five most common cancers were: prostate cancer (16,349 or
16.2% of all cancers), colorectal cancer (13.0%), breast cancer (12.2%), melanoma of the skin
(10.6%) and lung cancer (9.1%), in aggregate accounting for over 61% of all cancers.
Table A.1: Cancer incidence by tumour stream and sex, 2005, Australia
Cancer Type Number % of total Risk to age 75 Risk to age 85
Male
Prostate 16,349 29.1 1 in 8 1 in 5
Colorectal 7,181 12.8 1 in 19 1 in 10
Melanoma 6,044 10.8 1 in 23 1 in 14
Lung 5,738 10.2 1 in 24 1 in 12
Lymphoma 2,373 4.2 1 in 56 1 in 34
All cancers* 56,158 100 1 in 3 1 in 2
Female
Breast 12,170 27.4 1 in 11 1 in 9
Colorectal 5,895 13.3 1 in 28 1 in 15
Melanoma 4,640 27.4 1 in 31 1 in 22
Lung 3,444 7.8 1 in 42 1 in 24
Lymphoma 2,057 4.6 1 in 75 1 in 44
All cancers* 44,356 100 1 in 4 1 in 3
Persons
Prostate 16,349 16.3 - -
Colorectal 13,076 13.0 1 in 23 1 in 12
Breast 12,265 12.2 - -
Melanoma 10,684 10.6 1 in 26 1 in 17
Lung 9,182 9.1 1 in 30 1 in 16
All cancers* 100,514 100 1 in 3 1 in 2 Source: AIHW (2008), Cancer in Australia: An overview 2008. Canberra. * Excluding non-melanocytic skin cancer.
Table A.1 also shows that the most common cancers for males and females are largely the
same, and occur in mostly the same frequency of incidence order, except for the sex-specific
cancers. Almost all cancers occur at a higher rate in males, with an overall male to female
122 AIHW (2008), Cancer in Australia: An overview 2008. Canberra: ACT 123 ibid, p:176
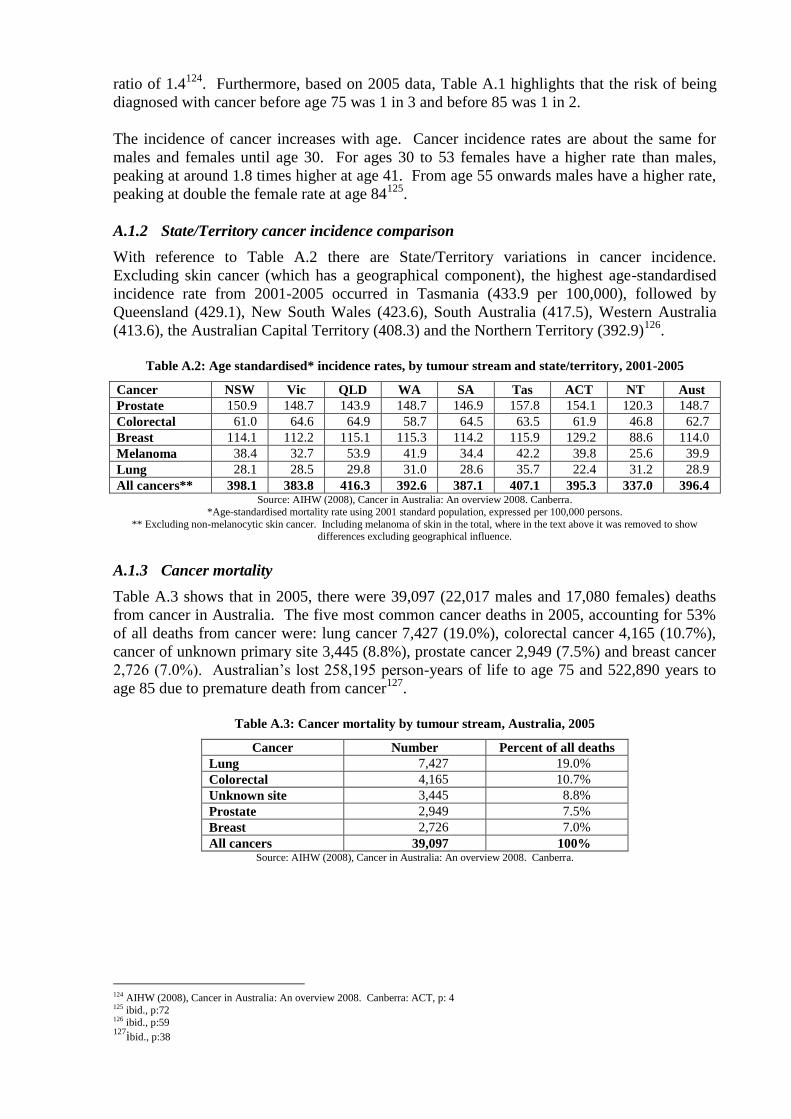
ratio of 1.4124
. Furthermore, based on 2005 data, Table A.1 highlights that the risk of being
diagnosed with cancer before age 75 was 1 in 3 and before 85 was 1 in 2.
The incidence of cancer increases with age. Cancer incidence rates are about the same for
males and females until age 30. For ages 30 to 53 females have a higher rate than males,
peaking at around 1.8 times higher at age 41. From age 55 onwards males have a higher rate,
peaking at double the female rate at age 84125
.
A.1.2 State/Territory cancer incidence comparison
With reference to Table A.2 there are State/Territory variations in cancer incidence.
Excluding skin cancer (which has a geographical component), the highest age-standardised
incidence rate from 2001-2005 occurred in Tasmania (433.9 per 100,000), followed by
Queensland (429.1), New South Wales (423.6), South Australia (417.5), Western Australia
(413.6), the Australian Capital Territory (408.3) and the Northern Territory (392.9)126
.
Table A.2: Age standardised* incidence rates, by tumour stream and state/territory, 2001-2005
Cancer NSW Vic QLD WA SA Tas ACT NT Aust
Prostate 150.9 148.7 143.9 148.7 146.9 157.8 154.1 120.3 148.7
Colorectal 61.0 64.6 64.9 58.7 64.5 63.5 61.9 46.8 62.7
Breast 114.1 112.2 115.1 115.3 114.2 115.9 129.2 88.6 114.0
Melanoma 38.4 32.7 53.9 41.9 34.4 42.2 39.8 25.6 39.9
Lung 28.1 28.5 29.8 31.0 28.6 35.7 22.4 31.2 28.9
All cancers** 398.1 383.8 416.3 392.6 387.1 407.1 395.3 337.0 396.4 Source: AIHW (2008), Cancer in Australia: An overview 2008. Canberra.
*Age-standardised mortality rate using 2001 standard population, expressed per 100,000 persons.
** Excluding non-melanocytic skin cancer. Including melanoma of skin in the total, where in the text above it was removed to show differences excluding geographical influence.
A.1.3 Cancer mortality
Table A.3 shows that in 2005, there were 39,097 (22,017 males and 17,080 females) deaths
from cancer in Australia. The five most common cancer deaths in 2005, accounting for 53%
of all deaths from cancer were: lung cancer 7,427 (19.0%), colorectal cancer 4,165 (10.7%),
cancer of unknown primary site 3,445 (8.8%), prostate cancer 2,949 (7.5%) and breast cancer
2,726 (7.0%). Australian‟s lost 258,195 person-years of life to age 75 and 522,890 years to
age 85 due to premature death from cancer127
.
Table A.3: Cancer mortality by tumour stream, Australia, 2005
Cancer Number Percent of all deaths
Lung 7,427 19.0%
Colorectal 4,165 10.7%
Unknown site 3,445 8.8%
Prostate 2,949 7.5%
Breast 2,726 7.0%
All cancers 39,097 100% Source: AIHW (2008), Cancer in Australia: An overview 2008. Canberra.
124 AIHW (2008), Cancer in Australia: An overview 2008. Canberra: ACT, p: 4 125 ibid., p:72 126 ibid., p:59 127
ibid., p:38
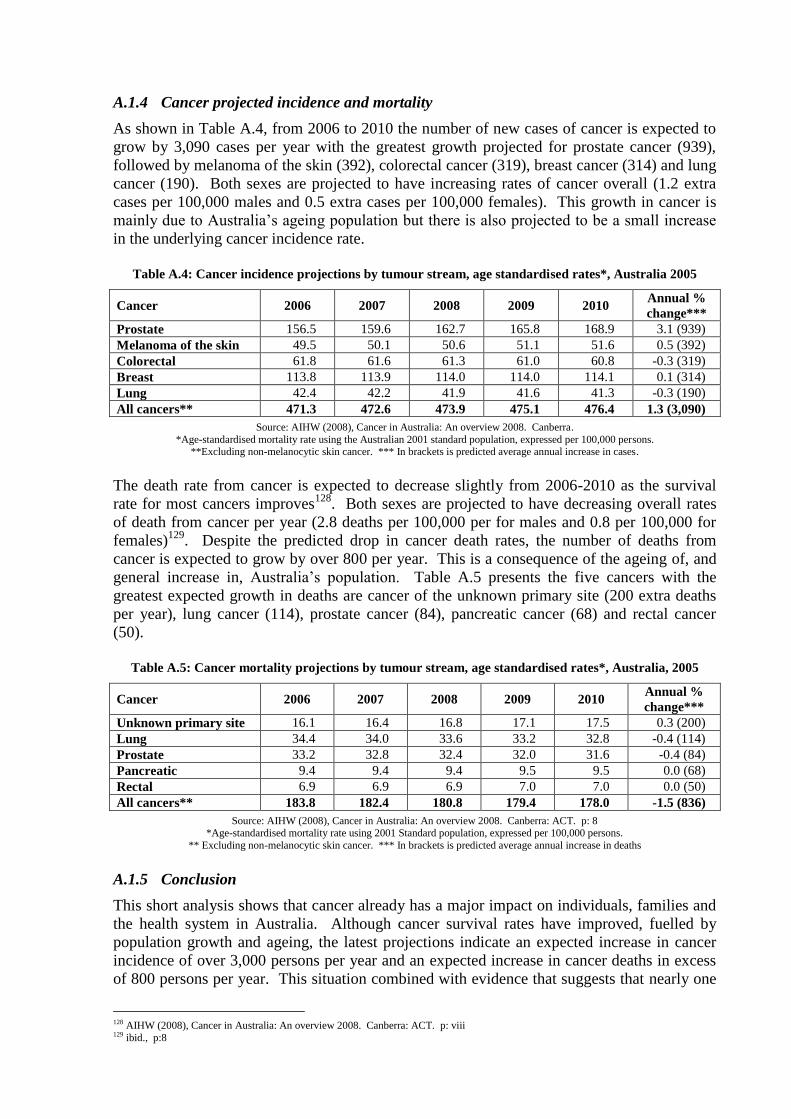
A.1.4 Cancer projected incidence and mortality
As shown in Table A.4, from 2006 to 2010 the number of new cases of cancer is expected to
grow by 3,090 cases per year with the greatest growth projected for prostate cancer (939),
followed by melanoma of the skin (392), colorectal cancer (319), breast cancer (314) and lung
cancer (190). Both sexes are projected to have increasing rates of cancer overall (1.2 extra
cases per 100,000 males and 0.5 extra cases per 100,000 females). This growth in cancer is
mainly due to Australia‟s ageing population but there is also projected to be a small increase
in the underlying cancer incidence rate.
Table A.4: Cancer incidence projections by tumour stream, age standardised rates*, Australia 2005
Cancer 2006 2007 2008 2009 2010 Annual %
change***
Prostate 156.5 159.6 162.7 165.8 168.9 3.1 (939)
Melanoma of the skin 49.5 50.1 50.6 51.1 51.6 0.5 (392)
Colorectal 61.8 61.6 61.3 61.0 60.8 -0.3 (319)
Breast 113.8 113.9 114.0 114.0 114.1 0.1 (314)
Lung 42.4 42.2 41.9 41.6 41.3 -0.3 (190)
All cancers** 471.3 472.6 473.9 475.1 476.4 1.3 (3,090)
Source: AIHW (2008), Cancer in Australia: An overview 2008. Canberra.
*Age-standardised mortality rate using the Australian 2001 standard population, expressed per 100,000 persons. **Excluding non-melanocytic skin cancer. *** In brackets is predicted average annual increase in cases.
The death rate from cancer is expected to decrease slightly from 2006-2010 as the survival
rate for most cancers improves128
. Both sexes are projected to have decreasing overall rates
of death from cancer per year (2.8 deaths per 100,000 per for males and 0.8 per 100,000 for
females)129
. Despite the predicted drop in cancer death rates, the number of deaths from
cancer is expected to grow by over 800 per year. This is a consequence of the ageing of, and
general increase in, Australia‟s population. Table A.5 presents the five cancers with the
greatest expected growth in deaths are cancer of the unknown primary site (200 extra deaths
per year), lung cancer (114), prostate cancer (84), pancreatic cancer (68) and rectal cancer
(50).
Table A.5: Cancer mortality projections by tumour stream, age standardised rates*, Australia, 2005
Cancer 2006 2007 2008 2009 2010 Annual %
change***
Unknown primary site 16.1 16.4 16.8 17.1 17.5 0.3 (200)
Lung 34.4 34.0 33.6 33.2 32.8 -0.4 (114)
Prostate 33.2 32.8 32.4 32.0 31.6 -0.4 (84)
Pancreatic 9.4 9.4 9.4 9.5 9.5 0.0 (68)
Rectal 6.9 6.9 6.9 7.0 7.0 0.0 (50)
All cancers** 183.8 182.4 180.8 179.4 178.0 -1.5 (836)
Source: AIHW (2008), Cancer in Australia: An overview 2008. Canberra: ACT. p: 8
*Age-standardised mortality rate using 2001 Standard population, expressed per 100,000 persons.
** Excluding non-melanocytic skin cancer. *** In brackets is predicted average annual increase in deaths
A.1.5 Conclusion
This short analysis shows that cancer already has a major impact on individuals, families and
the health system in Australia. Although cancer survival rates have improved, fuelled by
population growth and ageing, the latest projections indicate an expected increase in cancer
incidence of over 3,000 persons per year and an expected increase in cancer deaths in excess
of 800 persons per year. This situation combined with evidence that suggests that nearly one
128 AIHW (2008), Cancer in Australia: An overview 2008. Canberra: ACT. p: viii 129 ibid., p:8
third of patients with cancer (around 17% of all patients with cancer) who would benefit from
radiotherapy are not receiving it130
demonstrates that there is still considerable work to be
done in developing radiation oncology services in Australia.
A.2 RADIATION ONCOLOGY SERVICES IN AUSTRALIA
Radiation oncology is the discipline of treating malignant disease with radiation. The
treatment is referred to as radiotherapy or radiation therapy. Radiation oncology is a complex
specialty involving the delivery of therapy in a series of attendances which form part of a
treatment regimen designed according to the site and stage of the cancer, the health and well-
being of the patient, and on the basis of past history and treatments (surgical,
chemotherapeutic and other radiation). Actual radiation treatment follows a complex process
of consultation, planning and simulation in order that the radiation dose delivered to the site
can be as closely targeted as possible to achieve the maximum delivery to the cancer while
minimising potential damage to surrounding tissues and organs. This section presents an
overview of radiotherapy facilities and treatment modalities in Australia.
A.2.1 Radiotherapy facilities
Radiation oncology services are provided through both public and private sectors in
Australia131
and all States/Territories have radiation oncology treatment facilities (the
Northern Territory site will open in early 2010). These facilities vary in size from small
clinics to specialist departments in public hospitals and comprehensive cancer care centres.
The modern treatment approach to cancer care is multidisciplinary, with surgical, medical and
radiation oncology treatments playing significant roles132
. Radiotherapy treatment is provided
in specialised facilities using mainly linear accelerators (linacs).
Radiation oncology divides into two main types: external beam radiotherapy (which uses high
energy machines); and brachytherapy (which uses radioisotopes). 'Megavoltage' services, an
external beam therapy, delivered by linear accelerators, represent the vast majority of
services. Other types of radiation oncology, such as superficial and orthovoltage
radiotherapy, paediatric, total skin irradiation and stereotactic radiosurgery together form only
a small part of services133
.
A.2.2 External beam radiotherapy
As mentioned above external beam radiotherapy is delivered by linear accelerators, which fall
into two categories: single energy linear accelerators (SPLA) which produce a high energy X-
ray with specific physical properties while dual mode linear accelerators (DMLA) which have
X-ray and electron beams with different energies and physical properties providing flexible
treatment options134
. Megavoltage equipment replacement is recommended at 10 years135
.
After 10 years machines are considered to become technically out of date and there is
mechanical wear so they are less accurate and less reliable136
. The Quality Program Survey137
130
Barton, M., Gabriel, S & Shafiq, J (2008). Overview of cancer treatment services in Western Australia. p.30-31 131 The Australian health care system comprises public and private sectors. There are essentially three categories of radiation oncology
patient in Australia at present; public patients treated in public facilities, private patients treated in public facilities and private patients
treated in private facilities. ROs employed in the public sector in Australia generally have rights to private practice, which they negotiate with the employing institution, and while these patients are classified as private they use the same treatment and planning facilities as the
public patients. 132 Rubin P, Williams JP. Clinical oncology: a multidisciplinary approach for physicians and students, 8th ed. Philadelphia, PA: WB Saunders, 2001. 133 http://www.health.gov.au/internet/main/Publishing.nsf/Content/health-roi-radiother-index.htm 134 RANZCR 2001, National Strategic Plan for Radiation Oncology (Australia) 135 RANZCR 2000, Provision and replacement of radiotherapy equipment 136National Radiotherapy Advisory Group, 2007, Radiotherapy, developing a world class service for England <available online>:
http://www.cancerimprovement.nhs.uk/%5Cdocuments%5Cradiotherapy%5CNRAG_0507.pdf
in 2006 reported that at least one linear accelerator at 12 separate facilities was reported to be
older than 12 years, and at least 12 others were older than 10 years, although at least some of
these were to be replaced in 2006. In order to provide a quality service, it is desirable for
radiation equipment to be efficient and state of the art.
The number of available linear accelerators gives an indication of the total treatment capacity,
however the operational hours of each linear accelerator is a more useful measure. In 2002,
the Baume Inquiry138
noted that current operating hours were insufficient to meet patient
demands. Given the reported relative under-use of radiotherapy compared to evidence based
practice it would appear that there are still insufficient available operating hours.
A.2.3 Brachytherapy
Brachytherapy is radiotherapy for cancers where the radiation source is placed directly in
contact with the malignancy. Brachytherapy divides into two modalities high dose rate
(HDR) and low dose rate (LDR). LDR also referred to as „seed‟ involves radioactive „seeds‟
being carefully placed inside the cancerous tissue139
.
In the United States brachytherapy has become the most prominent form of treatment for
localised prostate cancer140
. Reports from some European countries indicate that
brachytherapy services account for approximately 10% of the total number of radiotherapy
treatments, with this ratio reaching as high as 25% in some countries141
. A study conducted in
the UK found that, in 1998, gynaecological treatments made up 68% of brachytherapy
services142
. The Royal College of Radiologists in the UK143
recommended that a total of 60
patients per year are taken as a minimum workload in each radiography centre for
gynaecological treatments. They recommended a minimum of two members from each
discipline within the brachytherapy team (clinical oncologists, physicists and
radiographers)144
. More recently, prostate cancer is increasingly being treated with
brachytherapy. In 2004, Thomson et al145
stated that in Australia, the optimum utilisation rate
for low dose rate prostate is 2.7% of all new cases of prostate cancer and 10.7% for high dose
rate boost.
A.2.4 Other treatment modalities
Stereotactic radiosurgery and superficial/orthovoltage treatments are other treatment
modalities that form a small part of radiation oncology services in Australia. The number of
superficial and orthovoltage treatments have declined in recent years as megavoltage
workloads have increased. Declines are believed to be due to skin cancer being treated by
other means. Stereotactic radiosurgery treats brain disorders with a precise delivery of a
single, high dose of radiation in a one-day session.
A.2.5 Emerging technologies and modalities that may influence workforce requirements
There are a number of new and emerging technologies and shifts in practice that will impact
on the future workforce requirements. Some of the new and emerging technologies include:
137 The Tripartite Committee, 2007. Radiation oncology treatment services quality program: report of the quality program survey. 138 ibid., 94-95 139 American Brachytherapy Society <online> available from: www.abs.org.au 140 Doust, J., Miller, E., Duchesnes, G., Kitchener, M & Weller, D. 2004, A systematic review of brachytherapy: Is it an effective and safe
treatment for localised prostate cancer. Australian Family Physician, 33(7): 525-531 141 The Royal College of Radiologists (2001) The role and development of brachytherapy services in the United Kingdom 142 ibid., p: 7 143 ibid., p:12 144 ibid., p: 11 145 Thompson, S., Barton, M & Delaney, G , 2004. Estimating the optimal utilisation of brachytherapy for the treatment of cancer. Sydney,
CCORE
Image guided radiotherapy (IGRT): refers to the use of frequent imaging in the
treatment position during a course of radiotherapy to localize the tumour prior to or
during each treatment. IGRT improves the accuracy and delivery of radiation by
reducing the volume of normal tissue that needs to be irradiated and facilitating dose
escalation to the tumour, reducing the risk of toxicity146
;
Intensity modulated radiotherapy (IMRT): offers an additional dimension of freedom
as compared with field shaping in three-dimensional conformal radiotherapy. This added
freedom allows the treatment planning system to better shape the radiation doses to
conform to the target volume while sparing surrounding normal structures, offering better
dose escalation to tumours and reduced toxicity to surrounding tissue147
;
RapidArc: is a system for IMRT incorporating capabilities such as variable dose-rate,
variable gantry speed, and accurate and fast dynamic multileaf collimators (DMLC), to
optimize dose conformality, delivery efficiency, accuracy and reliability148
;
TomoTherapy: uses a dynamic delivery in which the gantry, treatment couch, and
multileaf collimator leaves are all in motion during treatment. Radiotherapy is delivered
„slice-by-slice‟, this results in highly conformal radiotherapy. This method of radiation
delivery differs from other forms of external beam radiotherapy in which the entire
tumour volume is irradiated at one time149
;
Other technologies include: PET/CT, CyberKnife and MammoSite.
More detail regarding the perceived workforce impact of these technologies has been derived
from HealthConsult‟s consultation process and is available in Chapter 4 and 9.
A.3 RADIOTHERAPY AND CANCER CARE
Radiation treatment is a powerful weapon against cancer, it increases cure rates and is used
for palliation and symptom control in cases of advanced cancer. It is used to treat a range of
cancers as a primary or adjuvant therapy. This section highlights some of the key cancers that
benefit from radiotherapy and provides an overview of radiotherapy utilisation rates for
specific cancers.
A.3.1 Radiation treatment for different cancer types
If used appropriately, radiotherapy is a very effective treatment for cancer, second only to
surgery in contributing to the cure of cancer. At least half of all patients whom radiotherapy
is prescribed, either alone or combined with surgery and/or chemotherapy, are treated with the
goal of achieving a cure150
. Most advances in the range of treatable cancers and their cure
have been achieved as a result of combined treatments. Radiotherapy is used by itself when it
is the best treatment for the condition because of the known cure rate or because it is likely to
have fewer side-effects than other treatments151
. As normal tissues recover better than
tumours, it is possible to treat cancer without destroying the host organ. Surgery is one of the
most effective treatments of cancer. However, even where surgery is an option it is often not
possible to remove all the tissues potentially harbouring cancer cells because of the disability
146Lee, M., Brock, K & Dawson, L, 2008. Multimodality image-guided radiotherapy of the liver, Imaging in Liver Radiation Therapy 147 Yu, C., Amies, C & Svatos, M, 2008. Planning and delivery of intensity-modulated radiation therapy, Medical Physics, 35(12): pp.5233-5241 148
Ling, C., Zhang, P., Archambault, Y., Bocanek., J., Tang, G., Phil, M & LaSasso, T, 2008 (Abstract), Commissioning Quality Assurance
of RapidArc Radiotherapy Delivery System, International Journal of Radiation Oncology, Biology, Physics, 72(2): pp.575-581 149 Balog, J & Soisson, E, 2008 (Abstract). Helical tomotherapy quality assurance, International Journal of Radiation Oncology, Biology, Physics, 71(1): pp. 113-117 150 The Faculty of Radiation Oncology, 2002. Clinicians Guide to Radiation Oncology, RANZCR. 151 ibid
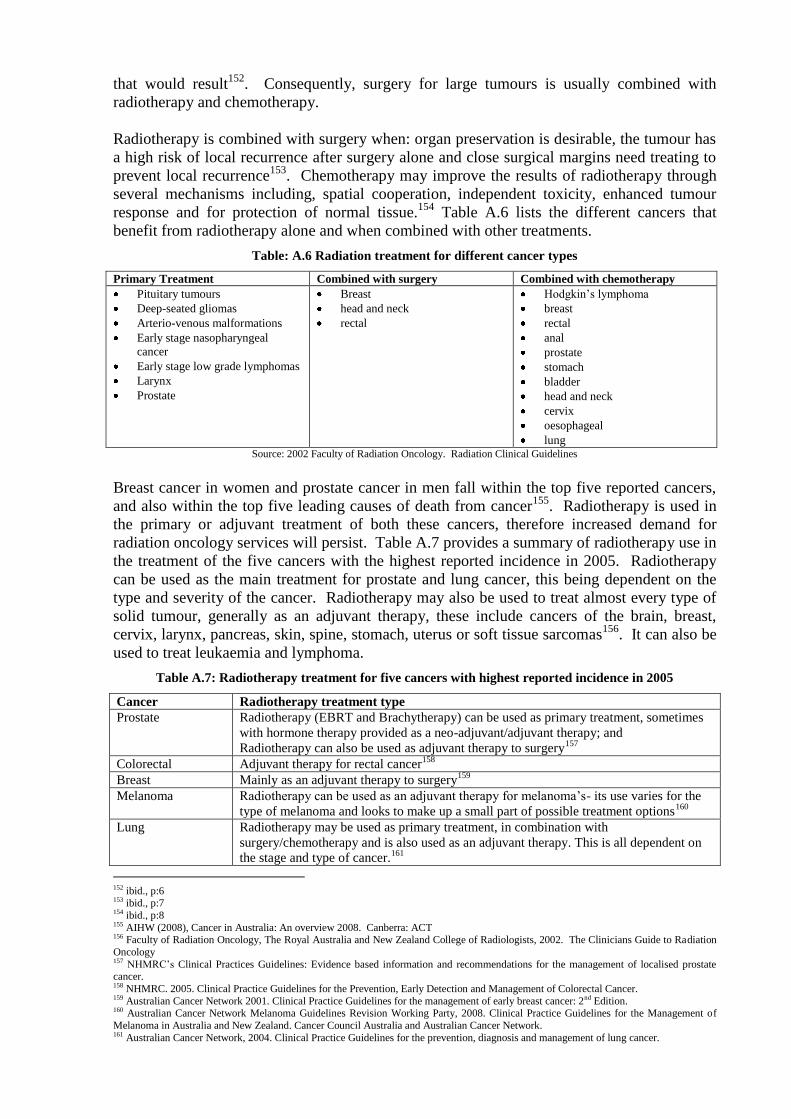
that would result152
. Consequently, surgery for large tumours is usually combined with
radiotherapy and chemotherapy.
Radiotherapy is combined with surgery when: organ preservation is desirable, the tumour has
a high risk of local recurrence after surgery alone and close surgical margins need treating to
prevent local recurrence153
. Chemotherapy may improve the results of radiotherapy through
several mechanisms including, spatial cooperation, independent toxicity, enhanced tumour
response and for protection of normal tissue.154
Table A.6 lists the different cancers that
benefit from radiotherapy alone and when combined with other treatments.
Table: A.6 Radiation treatment for different cancer types
Primary Treatment Combined with surgery Combined with chemotherapy
Pituitary tumours
Deep-seated gliomas
Arterio-venous malformations
Early stage nasopharyngeal
cancer
Early stage low grade lymphomas
Larynx
Prostate
Breast
head and neck
rectal
Hodgkin‟s lymphoma
breast
rectal
anal
prostate
stomach
bladder
head and neck
cervix
oesophageal
lung Source: 2002 Faculty of Radiation Oncology. Radiation Clinical Guidelines
Breast cancer in women and prostate cancer in men fall within the top five reported cancers,
and also within the top five leading causes of death from cancer155
. Radiotherapy is used in
the primary or adjuvant treatment of both these cancers, therefore increased demand for
radiation oncology services will persist. Table A.7 provides a summary of radiotherapy use in
the treatment of the five cancers with the highest reported incidence in 2005. Radiotherapy
can be used as the main treatment for prostate and lung cancer, this being dependent on the
type and severity of the cancer. Radiotherapy may also be used to treat almost every type of
solid tumour, generally as an adjuvant therapy, these include cancers of the brain, breast,
cervix, larynx, pancreas, skin, spine, stomach, uterus or soft tissue sarcomas156
. It can also be
used to treat leukaemia and lymphoma.
Table A.7: Radiotherapy treatment for five cancers with highest reported incidence in 2005
Cancer Radiotherapy treatment type
Prostate Radiotherapy (EBRT and Brachytherapy) can be used as primary treatment, sometimes
with hormone therapy provided as a neo-adjuvant/adjuvant therapy; and
Radiotherapy can also be used as adjuvant therapy to surgery157
Colorectal Adjuvant therapy for rectal cancer158
Breast Mainly as an adjuvant therapy to surgery159
Melanoma Radiotherapy can be used as an adjuvant therapy for melanoma‟s- its use varies for the
type of melanoma and looks to make up a small part of possible treatment options160
Lung Radiotherapy may be used as primary treatment, in combination with
surgery/chemotherapy and is also used as an adjuvant therapy. This is all dependent on
the stage and type of cancer.161
152 ibid., p:6 153 ibid., p:7 154 ibid., p:8 155 AIHW (2008), Cancer in Australia: An overview 2008. Canberra: ACT 156 Faculty of Radiation Oncology, The Royal Australia and New Zealand College of Radiologists, 2002. The Clinicians Guide to Radiation
Oncology 157 NHMRC‟s Clinical Practices Guidelines: Evidence based information and recommendations for the management of localised prostate cancer. 158 NHMRC. 2005. Clinical Practice Guidelines for the Prevention, Early Detection and Management of Colorectal Cancer. 159 Australian Cancer Network 2001. Clinical Practice Guidelines for the management of early breast cancer: 2nd Edition. 160 Australian Cancer Network Melanoma Guidelines Revision Working Party, 2008. Clinical Practice Guidelines for the Management of
Melanoma in Australia and New Zealand. Cancer Council Australia and Australian Cancer Network. 161 Australian Cancer Network, 2004. Clinical Practice Guidelines for the prevention, diagnosis and management of lung cancer.
A.3.2 Optimal radiotherapy utilisation and actual underutilisation for different cancer
types
Studies on optimal utilization rates for radiotherapy across the five cancers listed in Table 3.7
have been conducted nationally and internationally. Some studies have suggested that this
may be a better way to estimate radiotherapy requirements162
. Across all five cancers there
appears to be a shortfall in radiotherapy utilization. Some of the following information has
been identified:
Prostate cancer- A Canadian study looked at utilization rates for a typical North
American population and estimated that 61.2% of prostate cancer cases develop one or
more indications for radiotherapy at some point in the course of the illness163
. An
Australia study164
found similar results recommending that 60% of patients with prostate
cancer should receive radiotherapy. This was restricted to external-beam radiotherapy,
therefore may under-estimate total need. Actual utilization rates based on the South
Australian Hospital-Based Cancer Registry are 26%165
;
Breast cancer- A similar study was conducted in Canada for breast cancer where it was
estimated that 66.4% of breast cancer patients develop one or more indications for
radiotherapy at some point in the course of the illness166
. In Australia recommended
radiotherapy utilization is higher at 83% of all patients with a breast carcinoma167
. Actual
utilization rates vary from 24% to 71% across Australia;
Colorectal cancer- In an Australian study the optimal utilization rate for radiotherapy,
based on assessing treatment guidelines and incidence, was 61% for rectal cancer with an
actual utilization rate of 38%168
. Other studies have indicated that a 69% utilization rate
would be optimal;
Melanoma- The proportion of patients for whom radiotherapy is indicated at some point
in their illness was calculated at 23% of all melanoma patients. The utilization rates of
radiotherapy for melanoma recorded in actual practice were 13% in New South Wales and
6% in data from the American College of Surgeons169
; and
Lung cancer- The proportion of patients with lung cancer in whom radiotherapy is
indicated (according to the best available evidence) is 76%170
. This ideal rate was
compared to the actual rates of use of radiotherapy for lung cancer in Australia, and
internationally, in the past decade. A substantial discrepancy was found between the
evidence-based recommended rate of use and the actual rates reported in clinical practice.
One study conducted in the South-Western Sydney Area Health Service 56% of patients
with lung cancer received radiotherapy171
.
162 Slotman, B., Cottier, B., Bentzen, S., Heeren, G., Lievens, Y & Bogaert, W. 2004 (Abstract). Overview of national guidelines for
infrastructure and staffing of radiotherapy. ESTRO-QUARTS: Work package 1. Journal of the European Society for Therapeutic Radiology
and Oncology: 75(3). 163 Foroudi, F., Tyldesley, S., Barbera, L., Huang, J & Mackillop, W (Abstract) (2003). Evidence-based estimate of the appropriate
radiotherapy utilization rate for prostate cancer, International Journal of Radiation Oncology, biology, physics, 55 (1). 164 Delaney, G., Jacob, S & Barton, M (2004). Estimating the optimal external-beam radiotherapy utilization rate for genitourinary
malignancies, Cancer, 103 (3) 462-470 165 ibid 166 Foroudi, F., Tyldesley, S., Walker, H & MacKillop, W (Abstract) (2002). An evidence-based estimate of appropriate radiotherapy
utilization rate for breast cancer, International Journal of Radiation Oncology, biology, physics, 53 (5). 167 Delaney, G., Barton, M & Jacobs, S (2003). Estimation of optimal radiotherapy utilization rate for breast carcinoma: A review of the evidence, Cancer, 98 (9): p. 1977-1986 168 Delaney, G., Barton, M & Jacobs, S (Abstract) (2004). Estimation of an optimal radiotherapy utilization rate for gastrointestinal
carcinoma: A review of the evidence, Cancer: 101 (4): 657-70 169 Delaney, G., Barton, M & Jacobs, S (Abstract) (2004). Estimation of an optimal radiotherapy utilization rate for melanoma: A review of
the evidence, Cancer: 100 (6): 1293-1301 170 Delaney, G., Barton, M., Jacobs, S & Jalaludin, B (Abstract) (2003), A model for decision making for the use of radiotherapy in lung cancer, Lancet Oncology, 4 (2): 120-8 171 Vinod, S & Barton, M (Abstract) (2007), Actual versus optimal utilization of radiotherapy in lung cancer: Where is the shortfall, Asia-
Pacific Journal of Clinical Oncology, 3 (1): 30-36
A survey conducted by Stevens and Berry (1996) of ROs revealed that three types/sites of
cancer account for approximately 50% of ROs‟ clinical time, namely, breast cancer (24.5%),
urology (14.5%) and head/neck cancers (10.5%). According to a recent AIHW172
report these
three types of cancer combined are projected to increase at a rate of nearly 1500 new cases per
year from 2006 to 2010. This information is based on 1996 data, therefore technological
advancements in radiotherapy along with better clinical guidelines for the treatment of cancer
may provide a different more up to date analysis of the current situation.
Research has shown that just over 52% of cancer patients stand to benefit from the use of
radiotherapy as part of their management at some time during their disease trajectory, either
for cure or for palliation of advanced disease173,174.
As discussed in Chapter 2 nationally the
uptake rates for radiotherapy remain on average about 35%175,
indicating that a third of cancer
patients who could benefit from radiotherapy are not receiving that treatment. The problem is
worst for people over 55 and those not in metropolitan areas. 83% of women with breast
cancer should have radiotherapy, but in Australia only 71% do so. With lung cancer the
optimal figure is 76% but only half receive radiation176
. The reasons for the low uptake of
radiotherapy are described as being multiple and complex. As stated in the National Strategic
Plan for Radiation Oncology177
low referral rates are due to:
ignorance regarding the role of radiotherapy in cancer treatment;
lack of undergraduate teaching and postgraduate education amongst doctors resulting in
'gate keeping 'actions178
;
access to treatment, and delays between referral and commencement of treatment179
;
specialist staff shortages in all disciplines180
; and
inadequate equipment infrastructure base.
In many centres the demand for services has outstripped available resources, leading to the
development of waiting lists for radiotherapy. Delays in accessing treatment are a concern in
Australia, both in terms of the proportion of patients who are actually able to access care, and
in the timeliness of starting treatment. A study conducted by Kenny & Lehman 2004181
,
found that in 2002 more than 15,000 Australians who potentially could have benefited from
radiotherapy, did not receive this treatment. For those who are able to access radiotherapy
treatment, one in three patients experience an unacceptable delay in starting treatment and one
in four patients starts within standard good practice times. Delays of up to 151 days were
experienced in Australia. Delays in starting radiotherapy are also common place in other
developed nations including the United Kingdom, Canada and New Zealand182
The Baume Inquiry recognised factors contributing to increased cancer incidence and the
increasing need for more radiation oncology in the future to meet demand. These factors
include183
:
172 AIHW (2008), Cancer in Australia: An overview 2008. Canberra: ACT 173 Delaney G, Jacob S, Featherstone C and Barton M, Cancer, Volume 104, Issue 6 (2005) The role of radiotherapy in cancer treatment:
Estimating optimal utilization from a review of evidence-based clinical guidelines 174 Baume P. Radiation Oncology Inquiry. A vision for radiotherapy. Canberra, ACT: Commonwealth of Australia, 2002. 175 The Tripartite Committee pp.6–7. 176 RANZCR (Media release), 2002. Huge effort needed for Australians to receive the cancer services they deserve 177 ibid. 177 National Strategic Plan For Radiation Oncology (Australia) (2001) p14 178 Milross C G & Boyle F M, 'Better To Ensure Equal Access To Excellent Care Than Acceptable Access To Barely Adequate Care' paper presented at the NSW Cancer Summit November 2000 179 AHTAC Report 1996 180 Barton M, 'Radiotherapy Utilization In New South Wales From 1996 To 1998', Australasian Radiology (2000) p44 181 Kenny, L & Lehman, M 2004. Sequential audits of unacceptable delays in radiation therapy in Australia and New Zealand. Australasian
Radiology (48):29-34 182
ibid 183
Baume P. Radiation Oncology Inquiry. A vision for radiotherapy. Canberra, ACT: Commonwealth of Australia, 2002
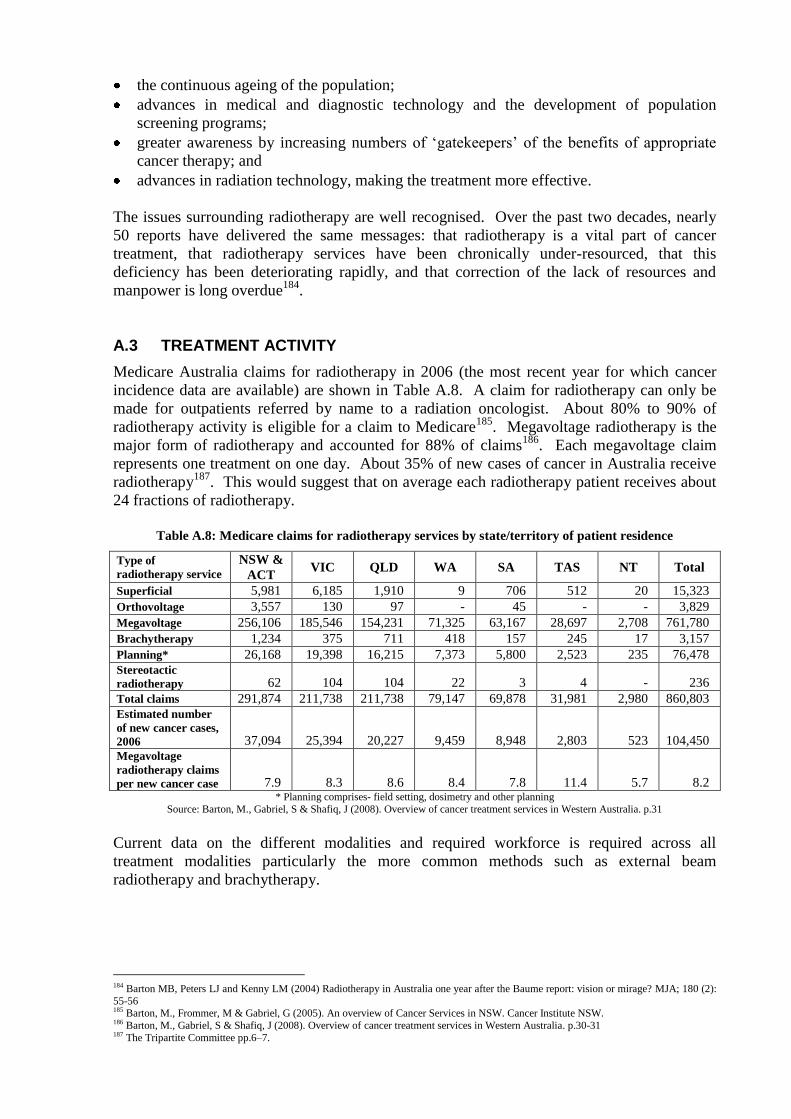
the continuous ageing of the population;
advances in medical and diagnostic technology and the development of population
screening programs;
greater awareness by increasing numbers of „gatekeepers‟ of the benefits of appropriate
cancer therapy; and
advances in radiation technology, making the treatment more effective.
The issues surrounding radiotherapy are well recognised. Over the past two decades, nearly
50 reports have delivered the same messages: that radiotherapy is a vital part of cancer
treatment, that radiotherapy services have been chronically under-resourced, that this
deficiency has been deteriorating rapidly, and that correction of the lack of resources and
manpower is long overdue184
.
A.3 TREATMENT ACTIVITY
Medicare Australia claims for radiotherapy in 2006 (the most recent year for which cancer
incidence data are available) are shown in Table A.8. A claim for radiotherapy can only be
made for outpatients referred by name to a radiation oncologist. About 80% to 90% of
radiotherapy activity is eligible for a claim to Medicare185
. Megavoltage radiotherapy is the
major form of radiotherapy and accounted for 88% of claims186
. Each megavoltage claim
represents one treatment on one day. About 35% of new cases of cancer in Australia receive
radiotherapy187
. This would suggest that on average each radiotherapy patient receives about
24 fractions of radiotherapy.
Table A.8: Medicare claims for radiotherapy services by state/territory of patient residence
Type of
radiotherapy service
NSW &
ACT VIC QLD WA SA TAS NT Total
Superficial 5,981 6,185 1,910 9 706 512 20 15,323
Orthovoltage 3,557 130 97 - 45 - - 3,829
Megavoltage 256,106 185,546 154,231 71,325 63,167 28,697 2,708 761,780
Brachytherapy 1,234 375 711 418 157 245 17 3,157
Planning* 26,168 19,398 16,215 7,373 5,800 2,523 235 76,478
Stereotactic
radiotherapy 62 104 104 22 3 4 - 236
Total claims 291,874 211,738 211,738 79,147 69,878 31,981 2,980 860,803
Estimated number
of new cancer cases,
2006 37,094 25,394 20,227 9,459 8,948 2,803 523 104,450
Megavoltage
radiotherapy claims
per new cancer case 7.9 8.3 8.6 8.4 7.8 11.4 5.7 8.2 * Planning comprises- field setting, dosimetry and other planning
Source: Barton, M., Gabriel, S & Shafiq, J (2008). Overview of cancer treatment services in Western Australia. p.31
Current data on the different modalities and required workforce is required across all
treatment modalities particularly the more common methods such as external beam
radiotherapy and brachytherapy.
184 Barton MB, Peters LJ and Kenny LM (2004) Radiotherapy in Australia one year after the Baume report: vision or mirage? MJA; 180 (2):
55-56 185 Barton, M., Frommer, M & Gabriel, G (2005). An overview of Cancer Services in NSW. Cancer Institute NSW. 186 Barton, M., Gabriel, S & Shafiq, J (2008). Overview of cancer treatment services in Western Australia. p.30-31 187 The Tripartite Committee pp.6–7.
Appendix B
RADIATION ONCOLOGY FACILITIES SURVEY
FOREWORD
Dear Colleague
As you would be aware, there has been considerable recent focus on the development of radiation
oncology services in Australia. A key part of further increasing the capacity to provide radiotherapy
services is to ensure that there is an adequate supply of an appropriately skilled workforce. The
Commonwealth Government Department of Health and Ageing (DoHA) working with the Radiation
Oncology Reform Implementation Committee (RORIC) has recognised that workforce planning is a
key tool for addressing the workforce issues and has engaged HealthConsult to:
“undertake a review of the current status and capacity of three main professions that make
up the radiation oncology workforce (ROs, RTs and medical physicists) and to identify
opportunities for ensuing an adequate supply of well trained radiation oncology workforce”
DoHA intends to use the information generated by the project to provide recommendations to the
Commonwealth Government on strategic workforce initiatives. State/Territory Health Authorities
intend to use the data provided by public sector facilities within their jurisdiction to develop further
their radiation oncology workforce initiatives. The objective at both levels of Government is to ensure
the delivery of timely, accessible and quality radiation oncology services. The specific project
objectives are to:
prepare information on the current radiation oncology workforce profession numbers and issues
affecting radiation oncology service provision in Australia;
formulate a methodology which will ensure reliable workforce planning can be conducted in the
future; and
identify opportunities to address workforce and skills shortages.
This survey of all public and private radiation oncology facilities is a key part of the data collection
process for the project. HealthConsult has developed the survey by working in consultation with
representatives of the professional bodies for ROs, RTs, medical physicists; representatives of the
State/Territory Health Authorities; and with the Workforce Working Group of the RORIC (which
includes representatives of private sector radiation oncology services).
Although we have asked you to provide reasonably detailed data about your facility, I can assure you
that all the data you provide will be strictly confidential. For public sector facilities, ownership of
the data rests with the Jurisdictional Health Authority. For private sector facilities ownership of the
data remains with individual facilities. At the conclusion of the project, HealthConsult will give
DoHA all the data generated by the survey and, for public sector facilities only, give the data to the
relevant Jurisdictional Health Authority. For the purposes of HeathConsult‟s workforce planning
project, the survey analysis will only be reported in aggregate form.
We at HealthConsult urge you and your key staff to take the time that will be required to complete
each section of the survey, as it is only by having accurate information on the current workforce that
we can develop reliable workforce planning models. Your time is greatly appreciated.
Joe Scuteri
Director
HealthConsult
GUIDELINES FOR COMPLETION
The survey is targeted at individual radiation oncology facilities (site). We are aware that
there are facilities in both the public and private sectors that are under common management
(and/or ownership). The intention is that a survey form is completed for each physical site
where at least one linear accelerator is located. For any sites where a public radiation
oncology service is co-located with a private radiation oncology service, one survey should be
completed for the public service and one for the private service.
The survey form contains 41 questions grouped logically into seven sections. Sections 1, 2, 3
and 7 are general and could be completed by the head of service, the business manager or
equivalent person. Sections 4, 5 and 6 are designed to be completed respectively by the heads
of radiation oncology, radiation oncology medical physics and radiotherapy at each site.
Every question should be answered. To assist respondents to complete the survey a Glossary
that explains and defines the terms used in the survey is provided below.
We are happy to accept the completed surveys by return email [email protected],
by fax (02) 9261-3705, or in the post 4409/93 Liverpool Street, Sydney, NSW 2000. Please
submit your completed response so it arrives at HealthConsult by 12th
June 2009. Please
contact Lisa Fodero on (02) 9261-3707 or [email protected] should you
require any assistance.
GLOSSARY OF TERMS
Attendances: a single presentation by a patient for radiotherapy treatment; at each attendance
a fraction of the prescribed treatment course is delivered.
Fields: exposures of radiation from a prescribed direction either alone or as part of a multi-
beam treatment technique; this includes exposures that are static in nature, or those delivered
dynamically as part of an IMRT technique, or those that are comprised of multiple control
points, or “fields within fields”.
Fractions: the number of smaller doses (i.e. parts) required to deliver the total prescribed
treatment course.
FTEs: the number of full-time equivalent professionals equals the number of professionals
multiplied by the average weekly hours worked, divided by the number of hours in a
'standard' full-time working week. Use the „standard‟ hours in the Award under which your
staff are employed in the calculation and in the absence of an Award „standard‟ use 45 hours
for medical practitioners and 37.5 hours for RTs and medical physicists.
Headcount: The number of individual persons employed by the facility irrespective of the
hours that they are paid to work.
New patients: patients presenting to your facility for the first course of treatment for a given
cancer diagnosis (i.e. they have not received a previous course of radiotherapy for the given
cancer diagnosis at any facility).
Number of days for commissioning or decommissioning: the integer number of days that
the linear accelerator is not available for at least half the day for treating patients because it is
being commissioned or de-commissioned. For days where time is exactly equally divided
between two functions, allocate the day in the preference order: treatment, maintenance,
commissioning or decommissioning then non-operating.
Number of days for maintenance or calibration: the integer number of days that the linear
accelerator is not available for at least half the day for treating patients because of planned or
unplanned maintenance or calibration. For days where time is exactly equally divided
between two functions, allocate the day in the preference order: treatment, maintenance,
commissioning or decommissioning then non-operating.
Number of non-operating days: the integer number of days that the linear accelerator is not
used for any purpose for at least half the day (i.e. the machine is available but not being used
because it is a weekend or public holiday day, suitable staff are not available, the machine is
unserviceable, etc.). For days where time is exactly equally divided between two functions,
allocate the day in the preference order: treatment, maintenance, commissioning or
decommissioning then non-operating.
Number of treatment days: the integer number of days that the linear accelerator is used to
treat patients for at least half the time it is operating on the day. For days where time is
exactly equally divided between two functions, allocate the day in the preference order:
treatment, maintenance, commissioning or decommissioning then non-operating.
Palliative treatment: cancer treatment to alleviate potential/actual symptoms due to the
underlying cancer, without the prospect of cure.
Radical treatment: cancer treatment with the aim of curing the cancer. Include all
treatments where the aim is to increase survival. The radiotherapy course could be either
primary or adjuvant treatment.
Re-treatment patients: patients having a second or subsequent course of radiotherapy after
having previously received a course of radiotherapy for the same primary diagnosis (including
treating a second anatomical site for the same primary diagnosis) whether or not the previous
course(s) was delivered in your facility.
Total annual treatment hours: the aggregate in a one year period of the number of hours
that the linear accelerator is booked for treating patients.
Vacant position: a position for which there are funds available, that is not currently occupied
(i.e. no-one is being paid from the funds available to fill the position), and there are active
processes in place and/or it is clearly intended to find a suitable person to fill the position.
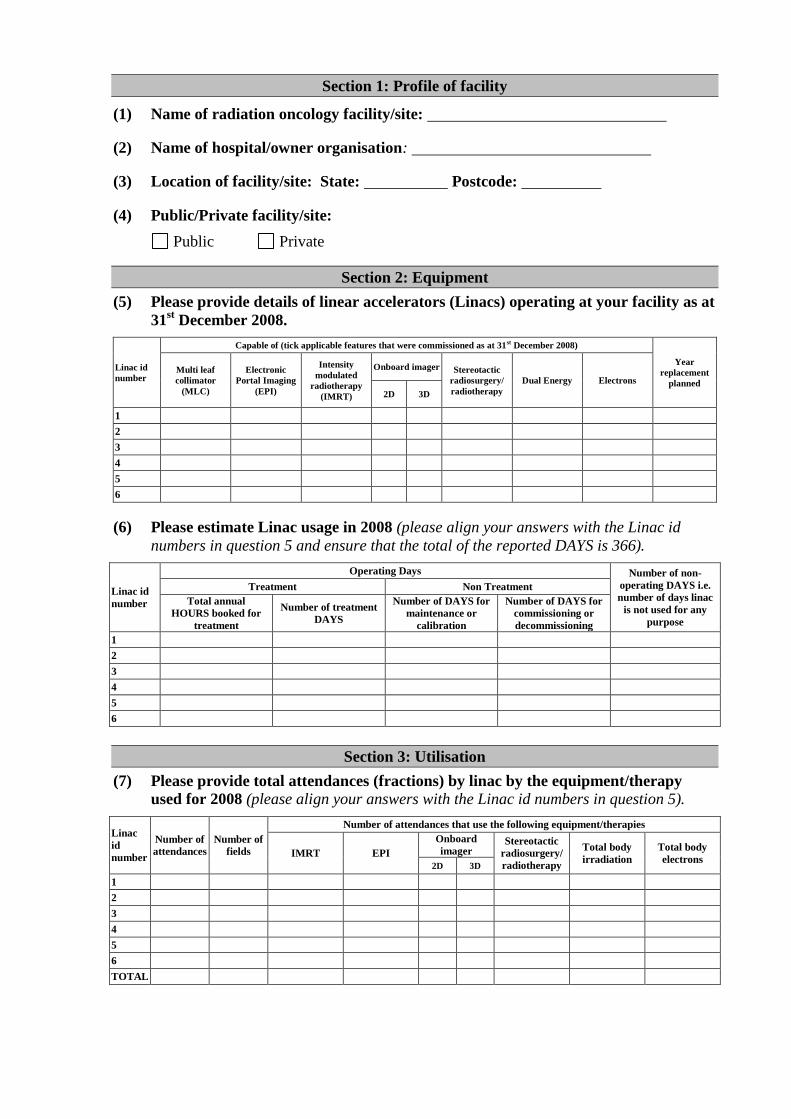
Section 1: Profile of facility
(1) Name of radiation oncology facility/site:
(2) Name of hospital/owner organisation:
(3) Location of facility/site: State: Postcode:
(4) Public/Private facility/site:
Public Private
Section 2: Equipment
(5) Please provide details of linear accelerators (Linacs) operating at your facility as at
31st December 2008.
Linac id
number
Capable of (tick applicable features that were commissioned as at 31st December 2008)
Year
replacement
planned
Multi leaf
collimator
(MLC)
Electronic
Portal Imaging
(EPI)
Intensity
modulated
radiotherapy
(IMRT)
Onboard imager Stereotactic
radiosurgery/
radiotherapy
Dual Energy Electrons
2D 3D
1
2
3
4
5
6
(6) Please estimate Linac usage in 2008 (please align your answers with the Linac id
numbers in question 5 and ensure that the total of the reported DAYS is 366).
Linac id
number
Operating Days Number of non-
operating DAYS i.e.
number of days linac
is not used for any
purpose
Treatment Non Treatment
Total annual
HOURS booked for
treatment
Number of treatment
DAYS
Number of DAYS for
maintenance or
calibration
Number of DAYS for
commissioning or
decommissioning
1
2
3
4
5
6
Section 3: Utilisation
(7) Please provide total attendances (fractions) by linac by the equipment/therapy
used for 2008 (please align your answers with the Linac id numbers in question 5).
Linac
id
number
Number of
attendances
Number of
fields
Number of attendances that use the following equipment/therapies
IMRT EPI
Onboard
imager Stereotactic
radiosurgery/
radiotherapy
Total body
irradiation
Total body
electrons 2D 3D
1
2
3
4
5
6
TOTAL
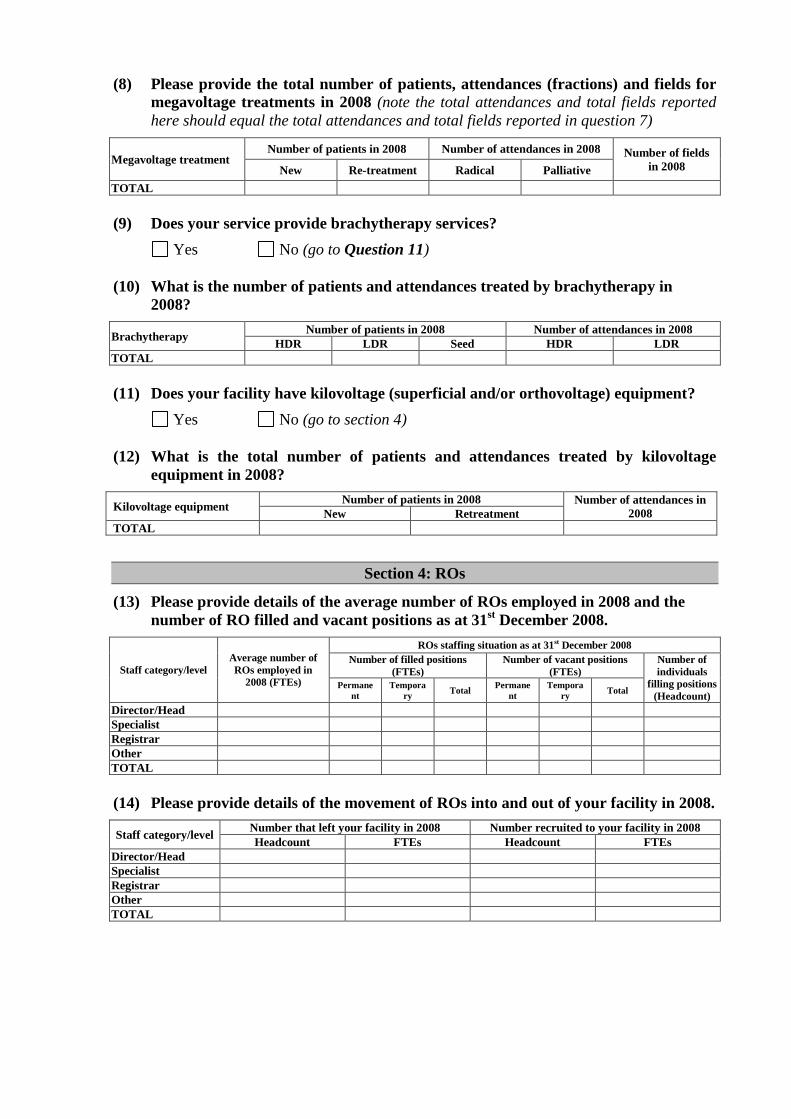
(8) Please provide the total number of patients, attendances (fractions) and fields for
megavoltage treatments in 2008 (note the total attendances and total fields reported
here should equal the total attendances and total fields reported in question 7)
Megavoltage treatment Number of patients in 2008 Number of attendances in 2008 Number of fields
in 2008 New Re-treatment Radical Palliative
TOTAL
(9) Does your service provide brachytherapy services?
Yes No (go to Question 11)
(10) What is the number of patients and attendances treated by brachytherapy in
2008?
Brachytherapy Number of patients in 2008 Number of attendances in 2008
HDR LDR Seed HDR LDR
TOTAL
(11) Does your facility have kilovoltage (superficial and/or orthovoltage) equipment?
Yes No (go to section 4)
(12) What is the total number of patients and attendances treated by kilovoltage
equipment in 2008?
Kilovoltage equipment Number of patients in 2008 Number of attendances in
2008 New Retreatment
TOTAL
Section 4: ROs
(13) Please provide details of the average number of ROs employed in 2008 and the
number of RO filled and vacant positions as at 31st December 2008.
Staff category/level
Average number of
ROs employed in
2008 (FTEs)
ROs staffing situation as at 31st December 2008
Number of filled positions
(FTEs)
Number of vacant positions
(FTEs)
Number of
individuals
filling positions
(Headcount) Permane
nt
Tempora
ry Total
Permane
nt
Tempora
ry Total
Director/Head
Specialist
Registrar
Other
TOTAL
(14) Please provide details of the movement of ROs into and out of your facility in 2008.
Staff category/level Number that left your facility in 2008 Number recruited to your facility in 2008
Headcount FTEs Headcount FTEs
Director/Head
Specialist
Registrar
Other
TOTAL
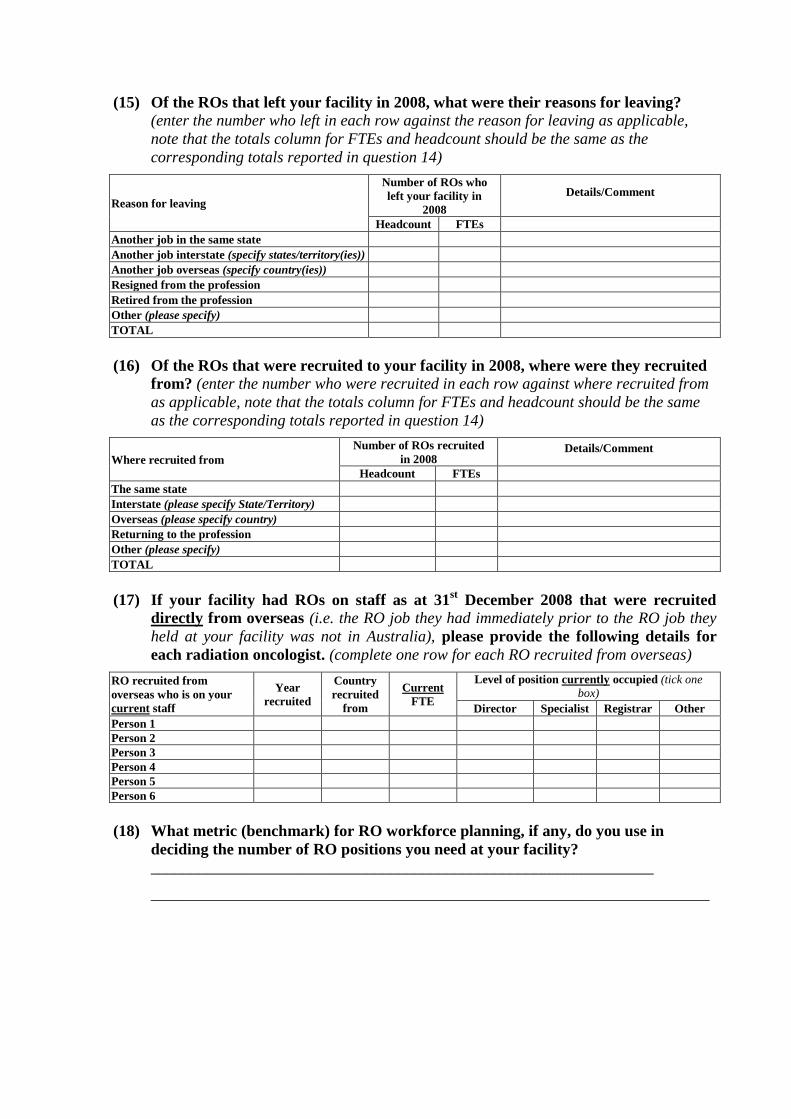
(15) Of the ROs that left your facility in 2008, what were their reasons for leaving?
(enter the number who left in each row against the reason for leaving as applicable,
note that the totals column for FTEs and headcount should be the same as the
corresponding totals reported in question 14)
Reason for leaving
Number of ROs who
left your facility in
2008
Details/Comment
Headcount FTEs
Another job in the same state
Another job interstate (specify states/territory(ies))
Another job overseas (specify country(ies))
Resigned from the profession
Retired from the profession
Other (please specify)
TOTAL
(16) Of the ROs that were recruited to your facility in 2008, where were they recruited
from? (enter the number who were recruited in each row against where recruited from
as applicable, note that the totals column for FTEs and headcount should be the same
as the corresponding totals reported in question 14)
Where recruited from
Number of ROs recruited
in 2008 Details/Comment
Headcount FTEs
The same state
Interstate (please specify State/Territory)
Overseas (please specify country)
Returning to the profession
Other (please specify)
TOTAL
(17) If your facility had ROs on staff as at 31st December 2008 that were recruited
directly from overseas (i.e. the RO job they had immediately prior to the RO job they
held at your facility was not in Australia), please provide the following details for
each radiation oncologist. (complete one row for each RO recruited from overseas)
RO recruited from
overseas who is on your
current staff
Year
recruited
Country
recruited
from
Current
FTE
Level of position currently occupied (tick one
box)
Director Specialist Registrar Other
Person 1
Person 2
Person 3
Person 4
Person 5
Person 6
(18) What metric (benchmark) for RO workforce planning, if any, do you use in
deciding the number of RO positions you need at your facility?
_______________________________________________________________
______________________________________________________________________
(19) What are the main recruitment and retention issues relating to ROs experienced at
your facility? (please tick more than one response as appropriate)
Remuneration
Location of service
Career progression
Collegial support
Supply of trained professionals
Training requirements (i.e. length of training)
Other (please specify) __________________________________________________
(20) What initiatives do you consider have worked well in addressing the balance
between demand and supply for the RO workforce?
_______________________________________________________________________
_______________________________________________________________________
_______________________________________________________________________
_______________________________________________________________________
(21) What further initiatives do you believe could be taken to improve the balance
between demand and supply for the RO workforce?
_______________________________________________________________________
_______________________________________________________________________
_______________________________________________________________________
_______________________________________________________________________
Section 5: ROMPs (ROMPs)
(22) Please provide details of the average number of ROMPs employed in 2008 and the
number of ROMP filled and vacant positions as at 31st December 2008.
Staff category/level
Average number of
ROMPS employed in
2008 (FTEs)
ROMP staffing situation as at 31st December 2008
Number of filled positions
(FTEs)
Number of vacant positions
(FTEs)
Number of
individuals
filling positions
(Headcount) Permane
nt
Tempora
ry Total
Permane
nt
Tempora
ry Total
Chief
Senior
Base grade
Trainee/Registrar
Educator/Teacher
Research
Other
TOTAL
(23) Please provide details of the movement of ROMPs into and out of your facility in
2008.
Staff category/level Number that left your facility in 2008 Number recruited to your facility in 2008
Headcount FTEs Headcount FTEs
Chief
Senior
Base grade
Trainee/Registrar
Educator/Teacher
Research
Other
TOTAL
(24) Of the ROMPs that left your facility in 2008, what were their reasons for leaving?
(enter the number who left in each row against the reason for leaving as applicable,
totals column for FTEs and headcount should be the same as the corresponding totals
reported in question 23)
Reason for leaving
Number of ROMPs
who left facility in
2008
Details/Comment
Headcount FTEs
Another job in the same state
Another job interstate (specify states/territory(ies))
Another job overseas (specify country(ies))
Resigned from the profession
Retired from the profession
Other (please specify)
TOTAL
(25) Of the ROMPs that were recruited to your facility in 2008, where were they
recruited from? (enter the number who were recruited in each row against where
recruited from as applicable, note that the totals column for FTEs and headcount
should be the same as the corresponding totals reported in question 23)
Where recruited from
Number of ROMPS
recruited in 2008 Details/Comment
Headcount FTEs
The same state
Interstate (please specify State/Territory)
Overseas (please specify country)
Returning to the profession
Other (please specify)
TOTAL
(26) If your facility had ROMPs on staff as at 31st December 2008 that were recruited
directly from overseas (i.e. the medical physics job they had immediately prior to the
medical physics job they held at your facility was not in Australia), please provide the
following details for each ROMP (complete one row for each medical physicist
recruited from overseas)
ROMP recruited
from overseas who
is on current staff
Year
recruited
Country
recruited
from
Current
FTE
Level of position currently occupied (tick one box)
Chief Senior Base
grade
Trainee
/Registra
r
Other
Person 1
Person 2
Person 3
Person 4
Person 5
Person 6
(27) What metric (benchmark) for ROMPs workforce planning, if any, do you use in
deciding the number of ROMP positions you need at your facility? ______________________________________________________________________
______________________________________________________________________
(28) What are the main recruitment and retention issues relating to ROMPs
experienced at your facility (please tick more than one response as appropriate)?
Remuneration
Location of service
Career progression
Collegial support
Supply of trained professionals
Training requirements (i.e. length of training)
Other (please specify) __________________________________________________
(29) What initiatives do you consider have worked well in addressing the balance
between demand and supply for the ROMP workforce?
______________________________________________________________________
______________________________________________________________________
______________________________________________________________________
(30) What further initiatives do you believe could be taken to improve the balance
between demand and supply for the ROMP workforce?
______________________________________________________________________
______________________________________________________________________
______________________________________________________________________
Section 6: RTs
(31) Please provide details of the average number of RTs employed in 2008 and the
number of RT filled and vacant positions as at 31st December 2008.
Staff category/level
Average number of
RTs employed in
2008 (FTEs)
RTs staffing situation as at 31st December 2008
Number of filled positions
(FTEs)
Number of vacant positions
(FTEs)
Number of
individuals
filling positions
(Headcount) Permane
nt
Tempora
ry Total
Permane
nt
Tempora
ry Total
Chief
Supervisor/Senior
Base grade
PDY/Trainee
Educator/Tutor
Research
Other
TOTAL
(32) Please provide details of the movement of RTs into and out of your facility in 2008.
Staff category/level Number that left your facility in 2008 Number recruited to your facility in 2008
Headcount FTEs Headcount FTEs
Chief
Supervisor/senior
Base Grade
PDY/Trainee
Educator/Tutor
Research
Other
TOTAL
(33) Of the RTs that left your facility in 2008, what were their reasons for leaving?
(enter the number who left in each row against the reason for leaving as applicable,
note that the totals column for FTEs and headcount should be the same as the
corresponding totals reported in question 32)
Reason for leaving
Number of RTs who left
facility in 2008 Details/Comment
Headcount FTEs
Another job in the same state
Another job interstate (specify states/territory(ies))
Another job overseas (specify country(ies))
Resigned from the profession
Retired from the profession
Other (please specify)
TOTAL
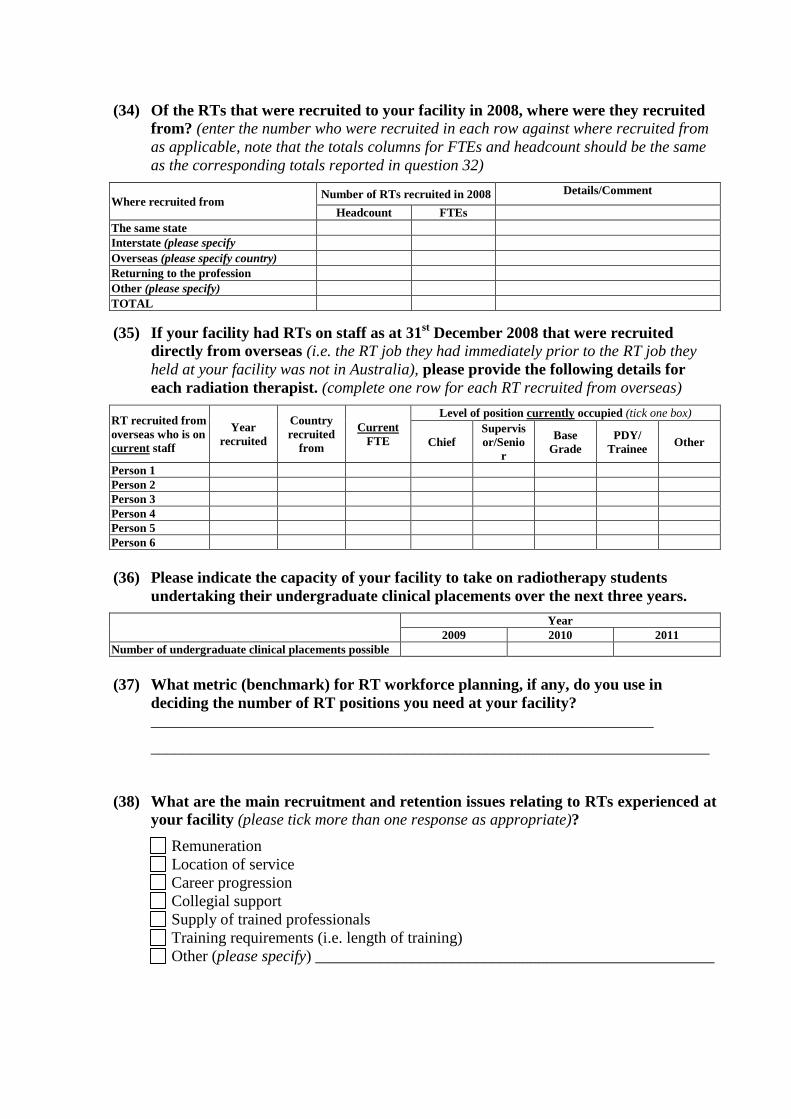
(34) Of the RTs that were recruited to your facility in 2008, where were they recruited
from? (enter the number who were recruited in each row against where recruited from
as applicable, note that the totals columns for FTEs and headcount should be the same
as the corresponding totals reported in question 32)
Where recruited from Number of RTs recruited in 2008 Details/Comment
Headcount FTEs
The same state
Interstate (please specify
State/Territory)
Overseas (please specify country)
Returning to the profession
Other (please specify)
TOTAL
(35) If your facility had RTs on staff as at 31st December 2008 that were recruited
directly from overseas (i.e. the RT job they had immediately prior to the RT job they
held at your facility was not in Australia), please provide the following details for
each radiation therapist. (complete one row for each RT recruited from overseas)
RT recruited from
overseas who is on
current staff
Year
recruited
Country
recruited
from
Current
FTE
Level of position currently occupied (tick one box)
Chief
Supervis
or/Senio
r
Base
Grade
PDY/
Trainee Other
Person 1
Person 2
Person 3
Person 4
Person 5
Person 6
(36) Please indicate the capacity of your facility to take on radiotherapy students
undertaking their undergraduate clinical placements over the next three years.
Year
2009 2010 2011
Number of undergraduate clinical placements possible
(37) What metric (benchmark) for RT workforce planning, if any, do you use in
deciding the number of RT positions you need at your facility?
_______________________________________________________________
______________________________________________________________________
(38) What are the main recruitment and retention issues relating to RTs experienced at
your facility (please tick more than one response as appropriate)?
Remuneration
Location of service
Career progression
Collegial support
Supply of trained professionals
Training requirements (i.e. length of training)
Other (please specify) __________________________________________________

(39) What initiatives do you consider have worked well in addressing the balance
between demand and supply for the RT workforce?
_______________________________________________________________________
_______________________________________________________________________
_______________________________________________________________________
(40) What further initiatives do you believe could be taken to improve the balance
between demand and supply for the RT workforce?
_______________________________________________________________________
_______________________________________________________________________
Section 7: Other comments
(41) Please provide any other comments that you believe are relevant to planning for
the radiation oncology workforce in Australia
_______________________________________________________________________
_______________________________________________________________________
_______________________________________________________________________
_______________________________________________________________________
The end – thank you for your assistance in this project
Appendix C
RADIATION ONCOLOGISTS PROFESSIONS SURVEY
FOREWORD
Dear Colleague
As you would be aware, there has been considerable recent focus on the development of
radiation oncology services in Australia. A key part of further increasing the capacity to
provide radiotherapy services is to ensure that there is an adequate supply of an appropriately
skilled workforce. The Commonwealth Government Department of Health and Ageing
(DoHA), amongst other stakeholders, has recognised that workforce planning is a key tool for
addressing the workforce issues and has engaged the Firm „HealthConsult‟ to:
“undertake a review of the current status and capacity of three main professions that
make up the radiation oncology workforce (ROs, RTs and medical physicists) and to
identify opportunities for ensuing an adequate supply of well trained radiation
oncology workforce”
DoHA intends to use the information generated by the project to provide recommendations to
the Commonwealth Government on strategic workforce initiatives to ensure the delivery of
timely, accessible and quality radiation oncology services. The project objectives are to:
prepare information on the current radiation oncology workforce profession numbers and
issues affecting radiation oncology service provision in Australia;
formulate a methodology which will ensure reliable workforce planning can be conducted
in the future; and
identify opportunities to address workforce and skills shortages.
This survey of ROs and radiation oncology registrars is a key part of the data collection
process for the project. HealthConsult has developed the survey by working in consultation
with the Faculty of Radiation Oncology of the Royal Australian and New Zealand College of
Radiologists (RANZCR). Completion of the survey is strongly supported by the RANZCR,
which is why you have received the survey directly from the College.
I urge you to take the time required to complete the survey, as it is only by having accurate
information on the current workforce that reliable workforce planning models can be
developed. Although you have been asked to (optionally) provide your name, it will only be
used it to follow up any responses you make that cannot be understood. All the data you
provide will be strictly confidential and anonymous. The survey analysis will only be
reported in aggregate form. Your time is greatly appreciated.
A/Professor Christopher Milross
Dean
Faculty of Radiation Oncology
Royal Australian and New Zealand College of Radiologists
GUIDELINES FOR COMPLETION
The survey form contains 33 questions grouped logically into seven sections. Please answer
every applicable question. To assist you to complete the survey a Glossary that explains and
defines the terms used in the survey is provided below.
It would be greatly appreciated if you could make your colleagues who are qualified as, or in
training to be, ROs aware of the survey. Some of them may not have personally received the
survey due to the fact that they are not members of, nor do they have any affiliation with, the
RANZCR, but their response would be greatly valued and we ask you to encourage them to
complete the survey. A better, more reliable, and therefore more useful, workforce planning
model will be produced if we have data on everyone qualified as, or in training to be, a RO in
Australia, not just those whose details are accurate on the available mailing lists.
Please complete the survey online at www.surveymonkey.com/RadOncWS by 12th
June
2009. If you wish to complete the survey offline please visit www.healthconsult.com.au to
download a Microsoft Word version. Once completed we are happy to accept the survey by
email to [email protected] or by fax (02) 9261-3705, or in the post to Reply
Paid 84861, HealthConsult, Sydney, NSW 2000. If you use any of these methods, please
submit your completed response so it arrives at HealthConsult by 12th
June 2009. Please
contact Lisa Fodero on (02) 9261-3707 or [email protected] should you
require any assistance.
GLOSSARY OF TERMS
AMC: Australian Medical Council.
Area of Need: the program that enables the recruitment of suitably qualified overseas-trained
doctors into declared Area of Need positions on a temporary basis.
College Fellow RANZCR: the postgraduate qualification awarded by the Royal Australian
and New Zealand College of Radiologists (RANZCR) after appropriate examinations and
training, approval of Council, and payment of the subscription.
Clinical workload: comprises anything linked to patient care, including: new patient/follow
up clinics, multidisciplinary clinics, planning/simulation, contouring organs/voluming,
treatment review, multidisciplinary team meetings, remote case conferences, patient/clinician
phone calls, and ward rounds.
Educational Affiliate of RANZCR: a person who is practising as a RO in Australia but is
not a Fellow of RANZCR who, by paying a membership fee, establishes an association with
the College for the purposes of participating in educational activities, meetings and seminars
organised by the College.
Independent practice: no longer working under supervision, generally characterised by the
completion of specialised vocational training to become a qualified radiation oncologist.
Management/Administration workload: quality assurance activities, dictating/correcting
letters, management director/associations, meetings, reports, guidelines, surveys.
Metropolitan: includes areas within the city limits of Sydney, Melbourne, Brisbane, Perth,
Adelaide, Newcastle, Gold Coast, Canberra, Wollongong, Sunshine Coast, Hobart, Geelong,
Townsville and Cairns.
New patients: patients presenting to your facility for the first course of treatment for a given
cancer diagnosis.
Outreach services: are services provided by clinicians to patients in locations other than from
their usual/main workplace e.g. in the patient‟s home or place of work, or in clinics in other
hospital settings or community health centres; an outreach service involves the clinician
travelling to the patient.
Research workload: investigations/activities that are carried out as part of a recognised
research project and/or clinical trial for which a specific proposal has been prepared and
approved by a relevant body (e.g. work under a funded research grant, work approved by the
hospital‟s ethics committee).
Sub-specialist: a clinician who has an advanced knowledge of, expertise or experience in, a
particular area within their speciality.
Teaching workload: supervising medical students, radiation oncology registrars, and/or other
registrars/students; and preparing lectures and presentations to be given in seminars, grand
rounds and related activities where the principal purpose is to educate students/trainees.
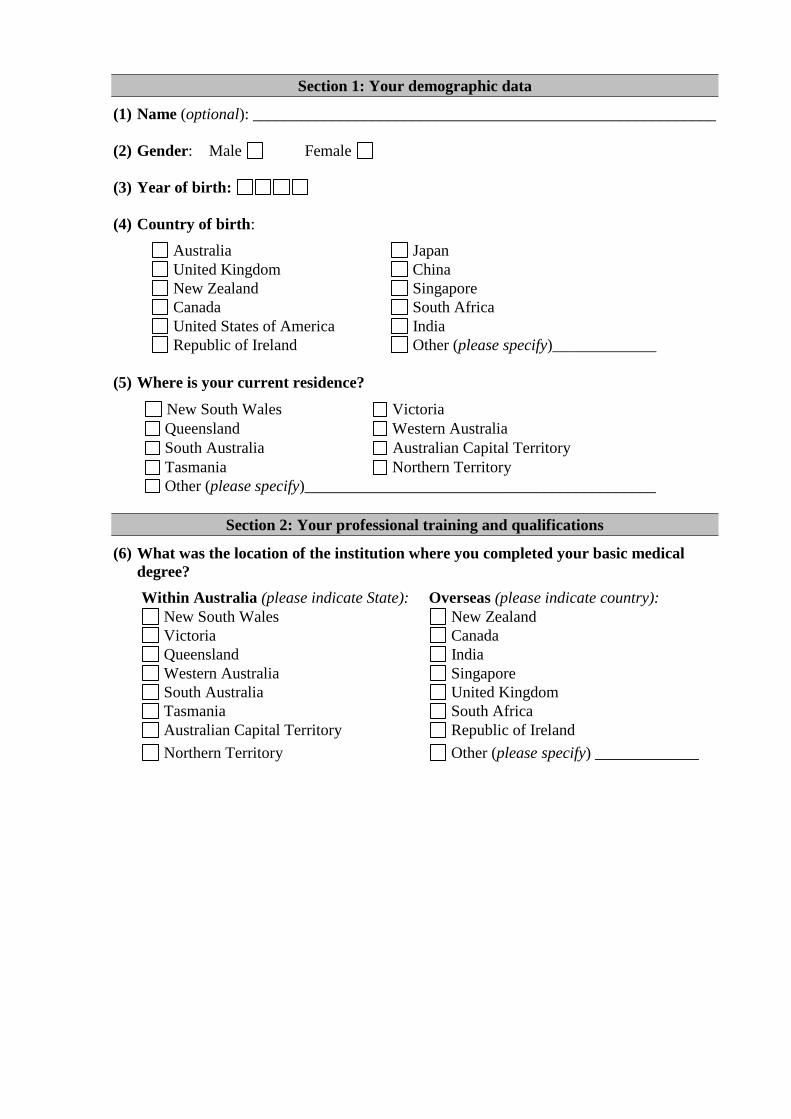
Section 1: Your demographic data
(1) Name (optional): __________________________________________________________
(2) Gender: Male Female
(3) Year of birth:
(4) Country of birth:
Australia Japan
United Kingdom China
New Zealand Singapore
Canada South Africa
United States of America India
Republic of Ireland Other (please specify)_____________
(5) Where is your current residence?
New South Wales Victoria
Queensland Western Australia
South Australia Australian Capital Territory
Tasmania Northern Territory
Other (please specify)____________________________________________
Section 2: Your professional training and qualifications
(6) What was the location of the institution where you completed your basic medical
degree?
Within Australia (please indicate State): Overseas (please indicate country):
New South Wales New Zealand
Victoria Canada
Queensland India
Western Australia Singapore
South Australia United Kingdom
Tasmania South Africa
Australian Capital Territory Republic of Ireland
Northern Territory Other (please specify) _____________
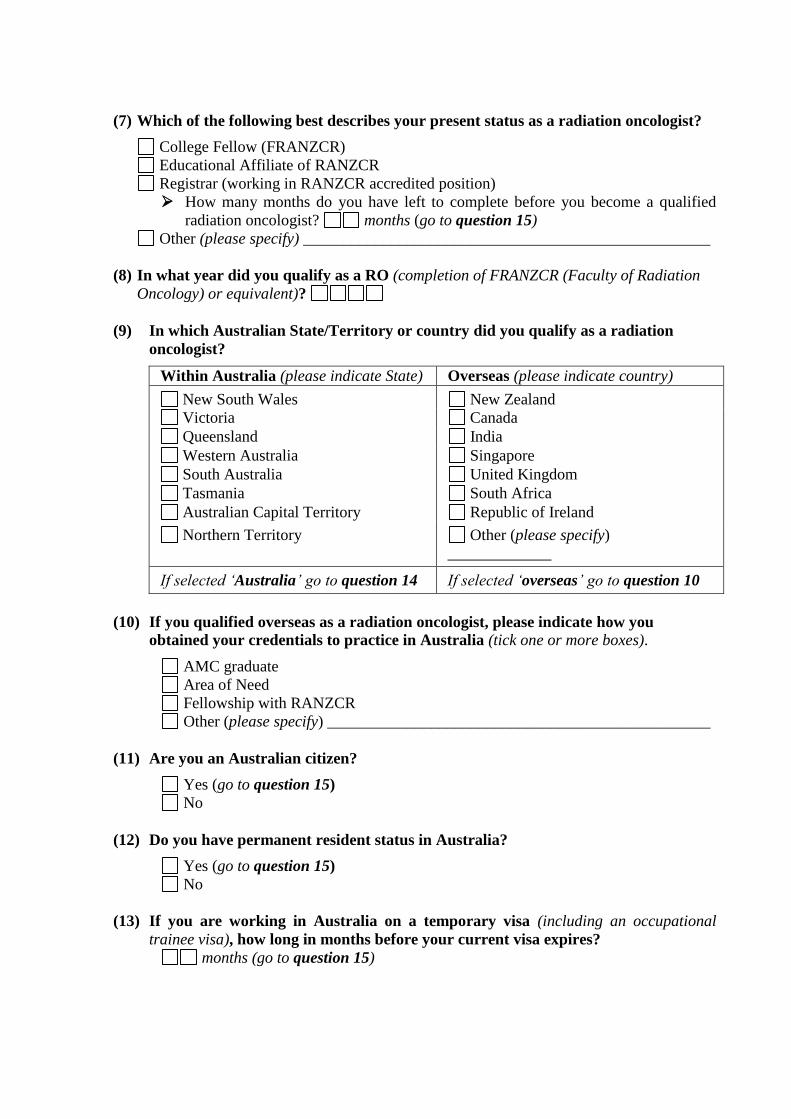
(7) Which of the following best describes your present status as a radiation oncologist?
College Fellow (FRANZCR)
Educational Affiliate of RANZCR
Registrar (working in RANZCR accredited position)
How many months do you have left to complete before you become a qualified
radiation oncologist? months (go to question 15)
Other (please specify) ___________________________________________________
(8) In what year did you qualify as a RO (completion of FRANZCR (Faculty of Radiation
Oncology) or equivalent)?
(9) In which Australian State/Territory or country did you qualify as a radiation
oncologist?
Within Australia (please indicate State) Overseas (please indicate country)
New South Wales New Zealand
Victoria Canada
Queensland India
Western Australia Singapore
South Australia United Kingdom
Tasmania South Africa
Australian Capital Territory Republic of Ireland
Northern Territory Other (please specify)
_____________
If selected „Australia‟ go to question 14 If selected „overseas‟ go to question 10
(10) If you qualified overseas as a radiation oncologist, please indicate how you
obtained your credentials to practice in Australia (tick one or more boxes).
AMC graduate
Area of Need
Fellowship with RANZCR
Other (please specify) ________________________________________________
(11) Are you an Australian citizen?
Yes (go to question 15)
No
(12) Do you have permanent resident status in Australia?
Yes (go to question 15)
No
(13) If you are working in Australia on a temporary visa (including an occupational
trainee visa), how long in months before your current visa expires?
months (go to question 15)
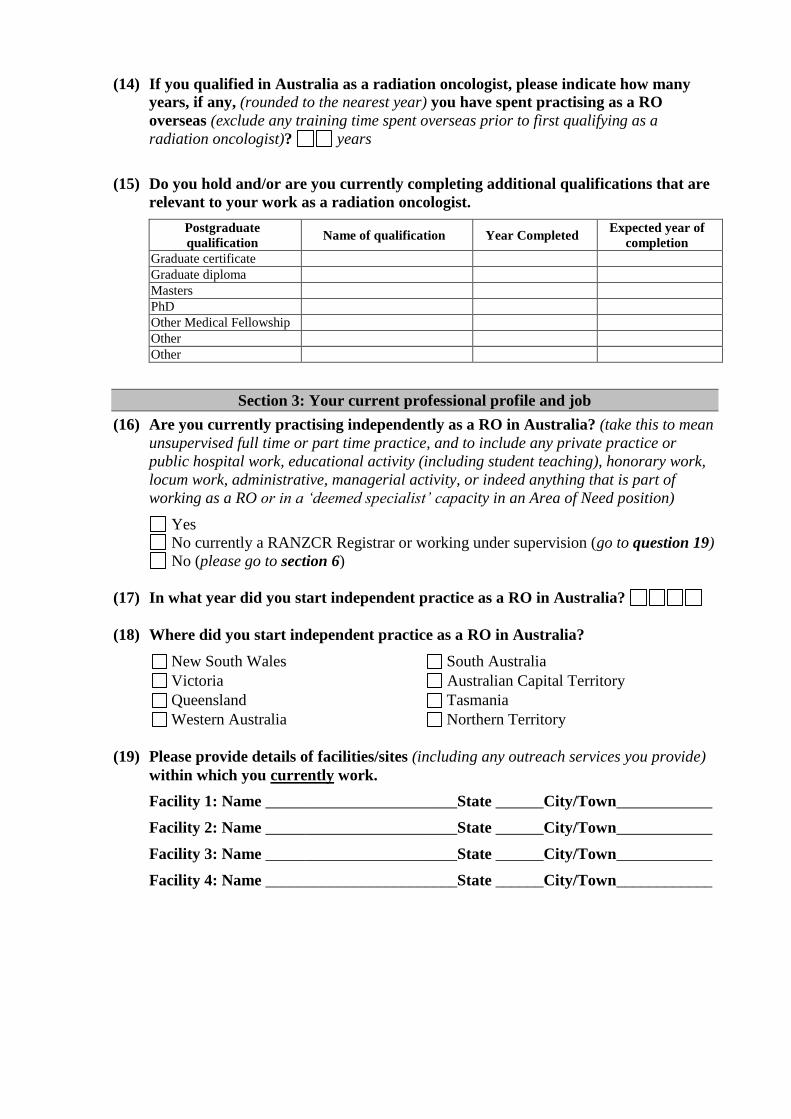
(14) If you qualified in Australia as a radiation oncologist, please indicate how many
years, if any, (rounded to the nearest year) you have spent practising as a RO
overseas (exclude any training time spent overseas prior to first qualifying as a
radiation oncologist)? years
(15) Do you hold and/or are you currently completing additional qualifications that are
relevant to your work as a radiation oncologist.
Postgraduate
qualification Name of qualification Year Completed
Expected year of
completion
Graduate certificate
Graduate diploma
Masters
PhD
Other Medical Fellowship
Other
Other
Section 3: Your current professional profile and job
(16) Are you currently practising independently as a RO in Australia? (take this to mean
unsupervised full time or part time practice, and to include any private practice or
public hospital work, educational activity (including student teaching), honorary work,
locum work, administrative, managerial activity, or indeed anything that is part of
working as a RO or in a „deemed specialist‟ capacity in an Area of Need position)
Yes
No currently a RANZCR Registrar or working under supervision (go to question 19)
No (please go to section 6)
(17) In what year did you start independent practice as a RO in Australia?
(18) Where did you start independent practice as a RO in Australia?
New South Wales South Australia
Victoria Australian Capital Territory
Queensland Tasmania
Western Australia Northern Territory
(19) Please provide details of facilities/sites (including any outreach services you provide)
within which you currently work.
Facility 1: Name ________________________State ______City/Town____________
Facility 2: Name ________________________State ______City/Town____________
Facility 3: Name ________________________State ______City/Town____________
Facility 4: Name ________________________State ______City/Town____________

(20) Please select which position category/job title accounts for most of your working
time as a radiation oncologist?
Director/Head of Service
Staff Specialist in Public Hospital
Visiting Medical Officer in Public Hospital
Specialist in Private Practice
Registrar
Other (please specify)_________________________________________________________
Section 4: Your current work practices
(21) Based on your current working arrangements, please estimate the number of
weeks that you expect to be on leave this year. (these weeks would include vacation,
conference, study, long service, maternity, sick leave and such) weeks
(22) Based on your current working arrangements, please breakdown your weekly
average hours worked as a RO across the following categories:
Work breakdown Hours
Clinical
Management/Administration
Teaching/Education
Research/Clinical Trials
Other
TOTAL
(23) Based on your current working arrangements and the total weekly average
working hours reported in question 22, please estimate the average hours per week
you spend working in various organisations and/or institutions.
Organisations/institutions Hours
Private radiation oncology practice
Public hospital
Universities
Other private sector
Other public sector
TOTAL
(24) Please estimate the number of new patients (public and/or private) that you see in a
12 month period (refer to the last 12 months).
50 or fewer 251 – 300
51 – 100 301 − 350
101 – 150 350 − 400
151 – 200 401 − 450
201 – 250 451+
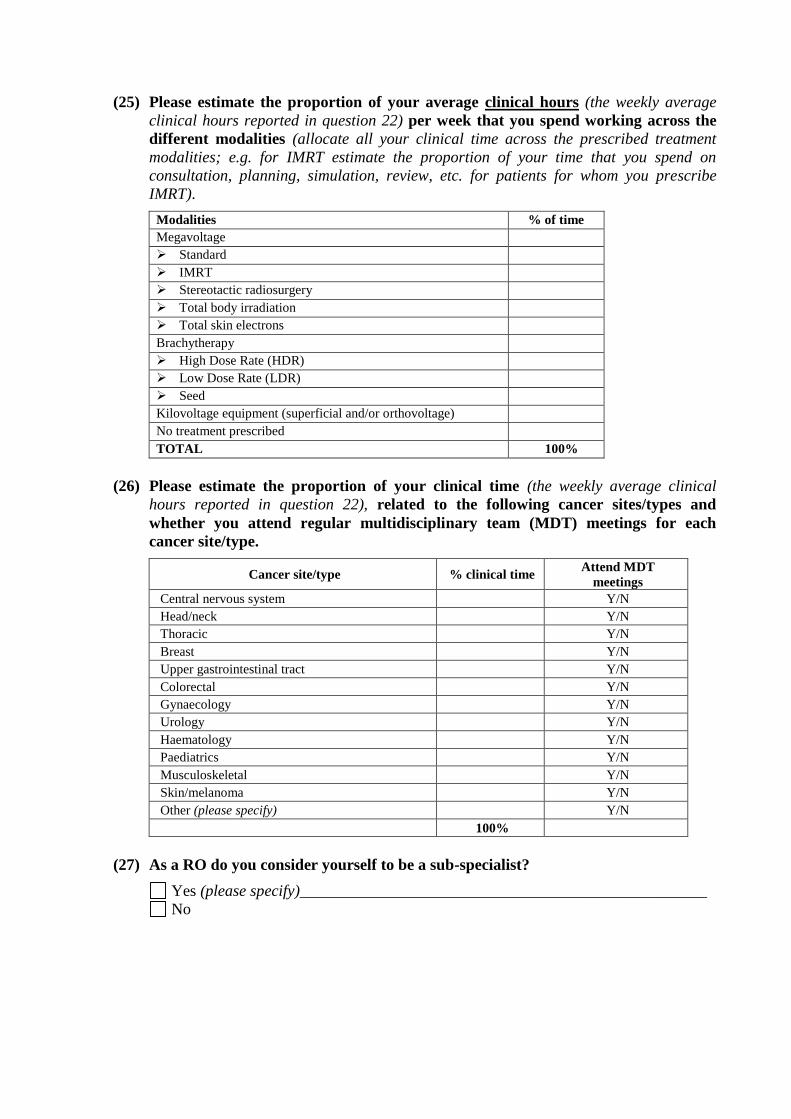
(25) Please estimate the proportion of your average clinical hours (the weekly average
clinical hours reported in question 22) per week that you spend working across the
different modalities (allocate all your clinical time across the prescribed treatment
modalities; e.g. for IMRT estimate the proportion of your time that you spend on
consultation, planning, simulation, review, etc. for patients for whom you prescribe
IMRT).
Modalities % of time
Megavoltage
Standard
IMRT
Stereotactic radiosurgery
Total body irradiation
Total skin electrons
Brachytherapy
High Dose Rate (HDR)
Low Dose Rate (LDR)
Seed
Kilovoltage equipment (superficial and/or orthovoltage)
No treatment prescribed
TOTAL 100%
(26) Please estimate the proportion of your clinical time (the weekly average clinical
hours reported in question 22), related to the following cancer sites/types and
whether you attend regular multidisciplinary team (MDT) meetings for each
cancer site/type.
Cancer site/type % clinical time Attend MDT
meetings
Central nervous system Y/N
Head/neck Y/N
Thoracic Y/N
Breast Y/N
Upper gastrointestinal tract Y/N
Colorectal Y/N
Gynaecology Y/N
Urology Y/N
Haematology Y/N
Paediatrics Y/N
Musculoskeletal Y/N
Skin/melanoma Y/N
Other (please specify) Y/N
100%
(27) As a RO do you consider yourself to be a sub-specialist?
Yes (please specify)___________________________________________________
No

Section 5: Impact of new/emerging technologies on your work
(28) What ongoing impact (estimate in percentage terms, ignoring the short term impact
that is typically associated with professionals learning and becoming proficient in a new
technology) has the introduction of any of the following technologies had on your
workload? (only respond if you have had direct experience in working with the
specified technology and please complete only one box in each row)
Technology
Estimated impact on workload (%)
Increase No
change
Decreas
e
Don’t
know
Intensity Modulated Radiotherapy (IMRT)
Brachytherapy – HDR
Brachytherapy – LDR
Brachytherapy – Seed
Modulated arc therapy
Stereotactic radiosurgery/radiotherapy
Image fusion for treatment planning
Treatment verification imaging
Gated delivery
Four-dimensional computerised tomography
Adaptive planning and treatment (including
IGRT)
Other (please specify)
Other (please specify)
(29) Please describe any other new/emerging technologies that you believe will influence
your workload in the future and their perceived impact
Section 6: Your view on changing your work arrangements
(30) What changes, if any, do you anticipate in your working arrangements as a RO
over the next 12 months?
None
Increase working hours by hours
Decrease working hours by hours
Taking a break from radiation oncology practice (e.g. maternity leave, extended travel)
What is the intended length of your break? months
Change in career (ceasing to practice as a radiation oncologist)
Retirement
Other (please specify) _____________________________________________________

(31) Please indicate your current work location (if more than one please choose the one
which accounts for most of your radiation oncology work) and your anticipated work
location in 12 months time?
Current work location Expected work location (in 12 months)
Within current State of residence
Metropolitan
Non-metropolitan
Within current State of residence
Metropolitan
Non-metropolitan
Within Australia, but outside current State
of residence
Metropolitan
Non-metropolitan
Within Australia but outside current State of
residence
Metropolitan
Non-metropolitan
Overseas (please specify): Overseas (please specify):
(32) At what age do you expect to retire completely from radiation oncology practice?
years
Section 7: Other comments
(33) Please provide any other comments that you believe are relevant to planning for
the radiation oncology workforce in Australia
The end – thank you for your assistance in this project
Appendix D
RADIATION THERAPISTS PROFESSIONS SURVEY
FOREWORD
Dear Colleague
As you would be aware, there has been considerable recent focus on the development of
radiation oncology services in Australia. A key part of further increasing the capacity to
provide radiotherapy services is to ensure that there is an adequate supply of an appropriately
skilled workforce. The Commonwealth Government Department of Health and Ageing
(DoHA), amongst other stakeholders, has recognised that workforce planning is a key tool for
addressing the workforce issues and has engaged the Firm „HealthConsult‟ to:
“undertake a review of the current status and capacity of three main professions that
make up the radiation oncology workforce (ROs, RTs and medical physicists) and to
identify opportunities for ensuing an adequate supply of well trained radiation
oncology workforce”
DoHA intends to use the information generated by the project to provide recommendations to
the Commonwealth Government on strategic workforce initiatives to ensure the delivery of
timely, accessible and quality radiation oncology services. The project objectives are to:
prepare information on the current radiation oncology workforce profession numbers and
issues affecting radiation oncology service provision in Australia;
formulate a methodology which will ensure reliable workforce planning can be conducted
in the future; and
identify opportunities to address workforce and skills shortages.
This survey of RTs and trainees is a key part of the data collection process for the project.
HealthConsult has developed the survey by working in consultation with the Radiotherapy
Advisory Panel of the Australian Institute of Radiography (AIR). The AIR supports and
endorses the radiation oncology workforce surveys being conducted by HealthConsult
believing that they are part of an important initiative essential to ensuring a viable
radiotherapy workforce into the future.
Accordingly, the AIR accordingly urges all RTs to participate in the surveys, whether
currently practising or not. Please take the time that will be required to complete the survey
which will be evaluated by HealthConsult, as it is only by having accurate information on the
current workforce that we can develop reliable workforce planning models. Although you
have been asked to (optionally) provide your name, it will only be used to follow up any
responses you make that cannot be understand. All the data you provide will be strictly
confidential and anonymous. The survey analysis will only be reported in aggregate form.
Your time is greatly appreciated.
David Collier Executive Officer
Australian Institute of Radiography
GUIDELINES FOR COMPLETION
The survey form contains 28 questions grouped logically into seven sections. Please answer
every applicable question. To assist you to complete the survey a Glossary that explains and
defines the terms used in the survey is provided below.
It would be greatly appreciated if you could make your colleagues who are qualified as, or in
training to be, RTs aware of the survey. Some of them may not have personally received the
survey due to incompleteness of the mailing lists but their response would be greatly valued
and we ask you to encourage them to complete the survey. A better, more reliable, and
therefore more useful, workforce planning model will be produced if we have data on
everyone qualified as, or in training to be, a RT in Australia, not just those whose details are
accurate on current mailing lists.
Please complete the survey online at www.surveymonkey.com/RTsWS by 12th June
2009. If you wish to complete the survey offline please visit www.healthconsult.com.au to
download a Microsoft Word version. Once completed we are happy to accept the survey by
email to [email protected] or by fax (02) 9261-3705, or in the post to Reply
Paid 84861, HealthConsult, Sydney, NSW 2000. If you use any of these methods, please
submit your completed response so it arrives at HealthConsult by 12th June 2009. Please
contact Lisa Fodero on (02) 9261-3707 or [email protected] should you
require any assistance.
GLOSSARY OF TERMS
Clinical workload: comprises anything linked to patient care, including new patient/follow
up clinics; multidisciplinary clinics; planning/simulation; contouring organs/voluming;
treatment review; and multi-disciplinary team meetings.
Independent practice: no longer working under supervision, generally characterised by the
completion of professional development year (PDY) or equivalent to become a qualified RT
(i.e. no longer considered to be in training).
Management/Administration workload: includes quality assurance activities; professional
development activities; team meetings; report writing; surveys; and so on.
Metropolitan: includes areas with the city limits of Sydney, Melbourne, Brisbane, Perth,
Adelaide, Newcastle, Gold Coast, Canberra, Wollongong, Sunshine Coast, Hobart, Geelong,
Townsville and Cairns.
PDY: Professional Development Year: the vocationally based professional development year
that radiotherapy graduates are required to complete prior to being eligible for full
accreditation with the Australian Institute of Radiography.
Research workload: includes investigations/activities that are carried out as part of
recognised research project and/or clinical trial for which a specific proposal has been
prepared and approved by a relevant body (e.g. work under a funded research grant, work
approved by the hospital‟s ethics committee).
Teaching workload: includes supervising registrars/trainees in radiotherapy; preparing
lectures and presentations to be given in seminars, formal courses and related activities where
the principal purpose is to educate students/trainees in any discipline.
Section 1: Your demographic data
(1) Name (optional):
__________________________________________________________
(2) Gender: Male Female
(3) Year of birth:
(4) Country of birth:
Australia Japan
United Kingdom China
New Zealand Singapore
Canada South Africa
United States of America India
Republic of Ireland Other (please specify) _____________
(5) Where is your current residence?
New South Wales Victoria
Queensland Western Australia
South Australia Australian Capital Territory
Tasmania Northern Territory
Other (please specify) ______________________________________
Section 2: Your professional training and qualifications
(6) What was the location of the institution where you completed your base
radiotherapy certificate/diploma/degree?
Within Australia (please indicate
State):
Overseas (please indicate
country):
New South Wales New Zealand
Victoria Canada
Queensland India
Western Australia Singapore
South Australia United Kingdom
Tasmania South Africa
Australian Capital Territory Republic of Ireland
Northern Territory Other (please specify)
____________

(7) Which of the following best describes your present status as a radiation therapist?
Accredited by the AIR or another RT accreditation body
What is the accreditation? AIR
Other (specify) _____________________________
In which year was it awarded?
Enrolled in a training program that will lead to accreditation
What is the program? PDY/intern
Other (specify) _____________________________
How long until you complete the program? months (go to Question 13)
Other (please specify) _________________________________ (go to Question 9)
(8) In which Australian State/Territory or country did you complete your training?
Within Australia (please indicate State): Overseas (please indicate country):
New South Wales New Zealand
Victoria Canada
Queensland India
Western Australia Singapore
South Australia United Kingdom
Tasmania South Africa
Australian Capital Territory Republic of Ireland
Northern Territory Other (please specify)____________
If selected „Australia‟ go to question 12 If selected „overseas‟ go to question 9
(9) Are you an Australian citizen?
Yes (go to question 13)
No
(10) Do you have permanent resident status in Australia?
Yes (go to question 13)
No
(11) If you are working in Australia on a temporary visa (including an occupational
trainee visa), how long in months before your current visa expires?
months (go to question 13)
(12) If you qualified in Australia as a radiation therapist, please indicate how many
years, if any, (rounded to the nearest year) you have spent practising as a RT
overseas (excluding any training time spent overseas prior to first qualifying as a
radiation therapist)? years

(13) Do you hold and/or are you currently completing additional qualifications that are
relevant to your work as a radiation therapist?
Postgraduate qualification Name of qualification Year
Completed
Expected year
of completion
Graduate certificate
Graduate diploma
Masters
PhD
Other undergraduate degree
Other
Other
Section 3: Your current professional profile and job
(14) Are you currently practising independently as a RT in Australia? (take this to mean
unsupervised full time or part time practice (i.e. following the completion of your
training), and to include any private practice or public hospital work, educational
activity (including student teaching), honorary work, locum work, administrative,
managerial activity, or indeed anything that is part of working as a radiation
therapist)?
Yes
No currently training/PDY (please go to question 17)
No (please go to section 6)
(15) In what year did you start practising independently as a RT in Australia?
(16) Where did you start practising independently as a RT in Australia? New South
Wales Victoria
Queensland Western Australia
South Australia Australian Capital Territory
Tasmania Northern Territory
Other (please specify)
______________________________________________
(17) Please provide details of facilities/sites within which you currently work.
Facility 1: Name ________________________State _____City/Town _____________
Facility 2: Name ________________________State _____City/Town _____________
Facility 3: Name ________________________State _____City/Town _____________
(18) Please select which position category/job title accounts for most of your working
time as a radiation therapist?
Professional development year (PDY/intern)
Base grade
Intermediate grade
Senior in charge
Chief or Manager
Educator/Tutor
Research
Other (please specify) _________________________________________
Section 4: Your current work practices
(19) Based on your current working arrangements, please estimate the number of
weeks that you expect to be on leave, this year (these weeks would include vacation,
conference, study, long service, maternity, sick leave and such) weeks
(20) Based on your current working arrangements, please breakdown your weekly
average hours worked as a RT across the following categories:
Work breakdown Hours
Clinical
Management/Administration
Teaching/Education
Research/Clinical Trials
Other
TOTAL
(21) Based on your current working arrangements and the total weekly average
working hours reported in question 20, please estimate the average hours per week
you spend in various organisations and/or institutions.
Organisations/institutions Hours
Private radiation oncology practice
Public hospital
Universities
Other private sector
Other public sector
TOTAL
(22) Please estimate the proportion of your average clinical hours (the weekly average
clinical hours reported in question 20) per week that you spend working across the
different modalities (allocate all your clinical time across the prescribed treatment
modalities; e.g. for IMRT estimate the proportion of your time that you spend on
planning, simulation, mould room, consultation, treatment, review, etc. for patients for
whom IMRT is prescribed).
Modalities % of time
Megavoltage
Standard
IMRT
Stereotactic radiosurgery
Total body irradiation
Total skin electrons
Brachytherapy
High Dose Rate (HDR)
Low Dose Rate (LDR)
Seed
Kilovoltage equipment (superficial and orthovoltage)
Other
TOTAL 100%
Section 5: Impact of new/emerging technologies on your work
(23) What ongoing impact (estimate in percentage terms, ignoring the short term impact
that is typically associated with professionals learning and becoming proficient in a
new technology) has the introduction of any of the following technologies had on
your workload? (only respond if you have had direct experience in working with the
specified technology and please complete only one box in each row)
Technology
Estimated impact on workload (%)
Increase No
change Decrease
Don’t
know
Intensity Modulated Radiotherapy (IMRT)
Brachytherapy – HDR
Brachytherapy – LDR
Brachytherapy – Seed
Modulated arc therapy
Stereotactic radiosurgery/radiotherapy
Image fusion for treatment planning
Treatment verification imaging
Gated delivery
Four-dimensional computerised tomography
Adaptive planning and treatment (including
IGRT)
Other (please specify)
Other (please specify)
(24) Please describe any other new/emerging technologies that you believe will influence
your workload in the future and their perceived impact
Section 6: Your view on changing your work arrangements
(25) What changes, if any, do you anticipate in your working arrangements as a RT
over the next 12 months?
None
Increase working hours by hours
Decrease working hours by hours
Taking a break from radiotherapy practice (e.g. maternity leave, extended travel)
What is the intended length of your break? months
Change in career (ceasing to practice as a radiation therapist)
Retirement
Other (please specify) ______________________________________________________
(26) Please indicate your current work location (if more than one please choose the one
which accounts for most of your radiotherapy work) and your anticipated work
location in 12 months time?
Current work location Expected work location (in 12 months)
Within current State of residence
Metropolitan
Non-metropolitan
Within current State of residence
Metropolitan
Non-metropolitan
Within Australia, but outside current State
of residence
Metropolitan
Non-metropolitan
Within Australia but outside current State of
residence
Metropolitan
Non-metropolitan
Overseas (please specify): Overseas (please specify):
(27) At what age do you expect to retire completely from radiotherapy practice?
years
Section 7: Other comments
(28) Please provide any other comments that you believe are relevant to planning for
RT workforce in Australia.
The end – thank you for your assistance in this project
Appendix E
RADIATION ONCOLOGY MEDICAL PHYSICISTS
PROFESSIONS SURVEY
FOREWORD
Dear Colleague
As you would be aware, there has been considerable recent focus on the development of
radiation oncology services in Australia. A key part of further increasing the capacity to
provide radiotherapy services is to ensure that there is an adequate supply of an appropriately
skilled workforce. The Commonwealth Government Department of Health and Ageing
(DoHA), amongst other stakeholders, has recognised that workforce planning is a key tool for
addressing the workforce issues and has engaged HealthConsult to:
“undertake a review of the current status and capacity of three main professions that
make up the radiation oncology workforce (ROs, RTs and medical physicists) and to
identify opportunities for ensuring an adequate supply of well trained radiation
oncology workforce”
DoHA intends to use the information generated by the project to provide recommendations to
the Commonwealth Government on strategic workforce initiatives to ensure the delivery of
timely, accessible and quality radiation oncology services. The project objectives are to:
prepare information on the current radiation oncology workforce profession numbers and
issues affecting radiation oncology service provision in Australia;
formulate a methodology which will ensure reliable workforce planning can be conducted
in the future; and
identify opportunities to address workforce and skills shortages.
This survey of ROMPs and registrars is a key part of the data collection process for the
project. HealthConsult has developed the survey by working in consultation with the
Australian College of Physical Scientists and Engineers in Medicine (ACPSEM). Completion
of the survey is strongly supported by the ACPSEM, which is why you have received the
survey directly from the College.
Please take the time that will be required to complete the survey which will be evaluated by
HealthConsult, as it is only by having accurate information on the current workforce that we
can develop reliable workforce planning models. Although we have asked you to (optionally)
provide your name, it will only be used to follow up any responses you make that we cannot
understand. All the data you provide will be strictly confidential and anonymous. The
survey analysis will only be reported in aggregate form. Your time is greatly appreciated.
Tomas Kron
President ACPSEM
GUIDELINES FOR COMPLETION
The survey form contains 31 questions grouped logically into seven sections. Please answer
every applicable question. To assist you to complete the survey a Glossary that explains and
defines the terms used in the survey is provided below.
It would be greatly appreciated if you could make your colleagues who are qualified as, or in
training to be, ROMPs aware of the survey. Some of them may not have personally received
the survey due to the fact that they are not members of, nor do they have any affiliation with,
the ACPSEM, but their response would be greatly valued and we ask you to encourage them
to complete the survey. A better, more reliable, and therefore more useful, workforce planning
model will be produced if we have data on everyone qualified as, or in training to be, a
ROMP in Australia, not just those whose details are accurate on the available mailing lists.
Please complete the survey online at www.surveymonkey.com/ROMPWS by 25th
May
2009. If you wish to complete the survey offline please visit www.healthconsult.com.au to
download a Microsoft Word version. Once completed we are happy to accept the survey by
email to [email protected] or by fax (02) 9261-3705, or in the post to Reply
Paid 84861, HealthConsult, Sydney, NSW 2000. If you use any of these methods, please
submit your completed response so it arrives at HealthConsult by 25th May 2009. Please
contact Lisa Fodero on (02) 9261-3707 or [email protected] should you
require any assistance.
GLOSSARY OF TERMS
ARECQA: Accreditation in Radiotherapy Equipment Commissioning and Quality
Assurance; the accreditation program in radiation oncology medical physics offered by the
ACPSEM prior to the development and implementation of the TEAP.
AROMP: Accreditation in Radiation Oncology Medical Physics; the accreditation awarded
by the ACPSEM after successful completion of the TEAP program.
Clinical (patient-related activities) workload: comprises anything linked to patient care,
including direct contact with the patient as part of service delivery; treatment planning and/or
simulation; and treatment plan review.
Equipment commissioning and quality assurance workload: includes acquisition and
installation of new equipment; safety checks; initial radiation survey and acceptance testing;
commissioning of the machine for clinical use; establishment of the baseline quality assurance
parameters and schedule; and routine quality assurance activities.
Management/Administration workload: includes professional development activities; team
meetings; report writing; surveys and so on but excludes quality assurance activities (include
quality assurance activities under equipment commissioning and quality assurance).
Metropolitan: includes areas with the city limits of Sydney, Melbourne, Brisbane, Perth,
Adelaide, Newcastle, Gold Coast, Canberra, Wollongong, Sunshine Coast, Hobart, Geelong,
Townsville and Cairns.
Radiation safety and protection workload: includes activities ensuring equipment is
functioning properly and according to applicable standards and that the equipment is installed
and used in a way which provides maximum radiation safety for operators, patients and
others; and examination of protective equipment and shielding to ensure that they are present
and provide the required protection.
Research workload: includes investigations/activities that are carried out as part of
recognised research project and/or clinical trial for which a specific proposal has been
prepared and approved by a relevant body (e.g. work under a funded research grant, work
approved by the hospital‟s ethics committee).
Teaching workload: includes supervising registrars/trainees in radiation oncology medical
physics; preparing lectures and presentations to be given in seminars, formal courses and
related activities where the principal purpose is to educate students/trainees in any discipline.
TEAP: Training, Education and Accreditation Program: this program addresses the training
of medical physicists to become accredited (be awarded the AROMP) as a ROMP by the
Australasian College of Physical Scientists and Engineers in Medicine (ACPSEM).
Working independently: no longer working under direct supervision, generally characterised
by the completion of the ACPSEM TEAP or a similar program to become an accredited
ROMP (i.e. no longer considered to be in training).

Section 1: Your demographic data
(1) Name (optional):
__________________________________________________________
(2) Gender: Male Female
(3) Year of birth:
(4) Country of birth:
Australia Japan
United Kingdom China
New Zealand Singapore
Canada South Africa
United States of America India
Republic of Ireland Other (please specify) ________________
(5) Where is your current residence?
New South Wales Victoria
Queensland Western Australia
South Australia Australian Capital Territory
Tasmania Northern Territory
Other (please specify) ______________________________________________
Section 2: Your professional training and qualifications
(6) What was the location of the institution where you completed your base
undergraduate degree?
Within Australia (please indicate State): Overseas (please indicate country):
New South Wales New Zealand
Victoria Canada
Queensland India
Western Australia Singapore
South Australia United Kingdom
Tasmania South Africa
Australian Capital Territory Republic of Ireland
Northern Territory Other (please specify)
____________
(7) How many years of radiation oncology medical physics experience have you had
since completing your base undergraduate degree?
0 – 3 years 11 – 15 years
4 – 5 years 16 – 20 years
6 – 10 years 20 + years

(8) Which of the following best describes your present status as a radiation oncology
medical physicist?
Accredited by ACPSEM or another medical physics accreditation body
What is the accreditation? ACPSEM ARECQA
ACPSEM AROMP
Other (specify)________________________
In which year was it awarded?
Enrolled in a training program, or intending to sit an exam, that will lead to an
accreditation
What is the program or exam? ACPSEM TEAP
ACPSEM ARECQA
Other (specify)_______________________
How long until you complete the program or sit the exam? months (go to
Question 14)
Not accredited and not in formal training program (go to Question 10)
(9) Where did you complete your accreditation program?
Within Australia (please indicate state): Overseas (please indicate country):
New South Wales New Zealand
Victoria Canada
Queensland India
Western Australia Singapore
South Australia United Kingdom
Tasmania South Africa
Australian Capital Territory Republic of Ireland
Northern Territory Other (please specify)
_____________
If selected „Australia‟ go to question 13 If selected „overseas‟ go to question 10
(10) Are you an Australian citizen?
Yes (go to question 14)
No
(11) Do you have permanent resident status in Australia?
Yes (got to question 14)
No
(12) If you are working in Australia on a temporary visa (including an occupational
trainee visa), how long in months before your current visa expires?
months (go to question 14)
(13) If you qualified in Australia as a radiation oncology medical physicist, please
indicate how many years, if any, (rounded to the nearest year) you have spent
practising as a ROMP overseas (exclude any training time spent overseas prior to first
qualifying as a RO medical physicist)? years

(14) Do you hold and/or are you currently completing additional qualifications that are
relevant to your work as a radiation oncology medical physicist?
Postgraduate
qualification Name of qualification
Year
Completed
Expected
year of
completion
Graduate certificate
Graduate diploma
Masters
PhD
Other Fellowship
Other
Other
Section 3: Your professional profile and job
(15) Are you currently working independently as a ROMP in Australia? (take this to
mean unsupervised full time or part time work (i.e. following the completion of your
training), and to include any private practice or public hospital work, educational
activity (including student teaching), honorary work, locum work, administrative,
managerial activity, or indeed anything that is part of working as a radiation oncology
medical physicist)?
Yes
No, currently in training (go to question 18)
No (go to section 6)
(16) In what year did you start working independently as a ROMP in Australia?
(17) Where did you start working independently as a ROMP in Australia?
New South Wales Victoria
Queensland Western Australia
South Australia Australian Capital Territory
Tasmania Northern Territory
Other (please specify) ____________________________________________
(18) Please provide details of facilities/sites within which you currently work.
Facility 1: Name ________________________State _____City/Town_____________
Facility 2: Name ________________________State _____City/Town_____________
Facility 3: Name ________________________State _____City/Town_____________
(19) Please select which position category/job title accounts for most of your working
time as a radiation oncology medical physicist?
Chief physicist
Senior medical physicist
Base grade medical physicist
Trainee/Registrar
Educator/Teacher
Research
Other (please specify) ____________________________________________
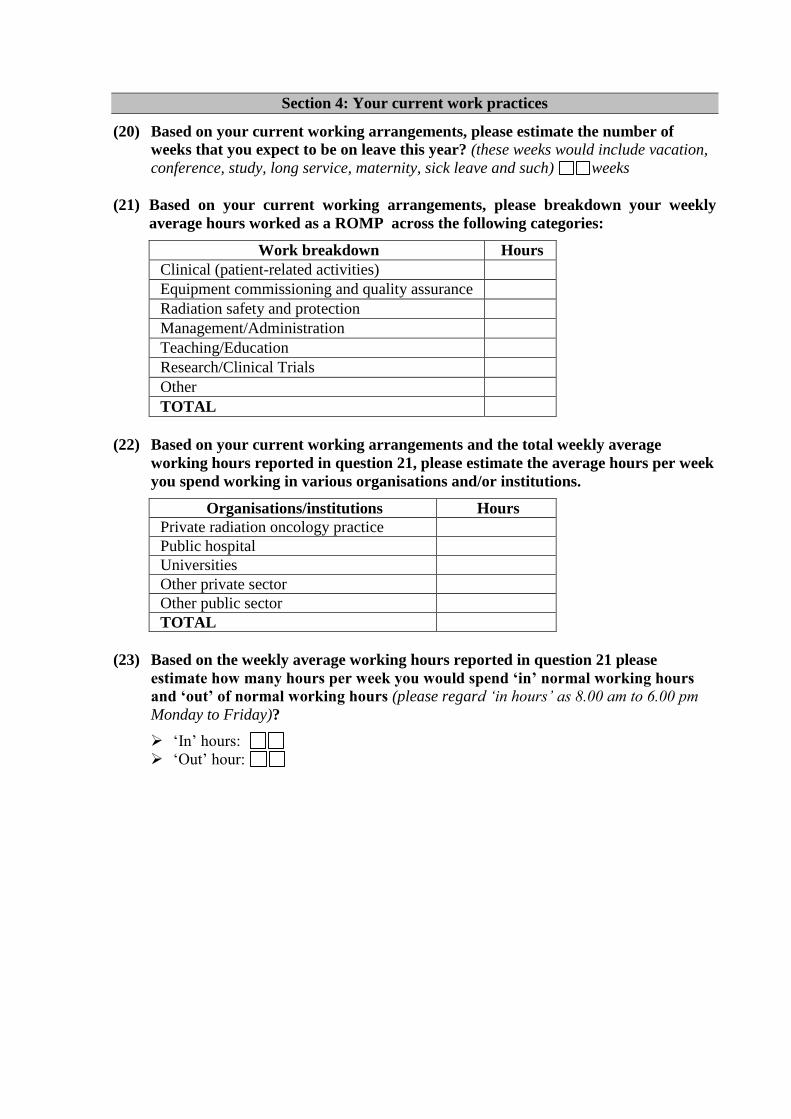
Section 4: Your current work practices
(20) Based on your current working arrangements, please estimate the number of
weeks that you expect to be on leave this year? (these weeks would include vacation,
conference, study, long service, maternity, sick leave and such) weeks
(21) Based on your current working arrangements, please breakdown your weekly
average hours worked as a ROMP across the following categories:
Work breakdown Hours
Clinical (patient-related activities)
Equipment commissioning and quality assurance
Radiation safety and protection
Management/Administration
Teaching/Education
Research/Clinical Trials
Other
TOTAL
(22) Based on your current working arrangements and the total weekly average
working hours reported in question 21, please estimate the average hours per week
you spend working in various organisations and/or institutions.
Organisations/institutions Hours
Private radiation oncology practice
Public hospital
Universities
Other private sector
Other public sector
TOTAL
(23) Based on the weekly average working hours reported in question 21 please
estimate how many hours per week you would spend ‘in’ normal working hours
and ‘out’ of normal working hours (please regard „in hours‟ as 8.00 am to 6.00 pm
Monday to Friday)?
„In‟ hours:
„Out‟ hour:
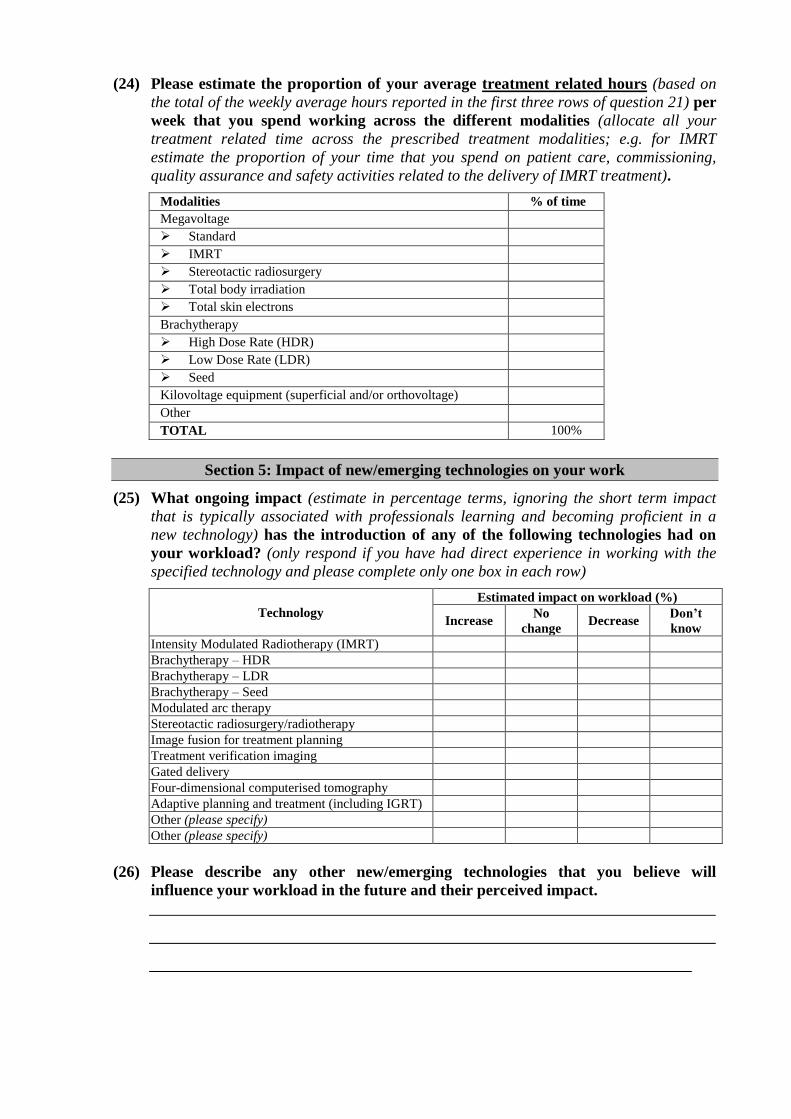
(24) Please estimate the proportion of your average treatment related hours (based on
the total of the weekly average hours reported in the first three rows of question 21) per
week that you spend working across the different modalities (allocate all your
treatment related time across the prescribed treatment modalities; e.g. for IMRT
estimate the proportion of your time that you spend on patient care, commissioning,
quality assurance and safety activities related to the delivery of IMRT treatment).
Modalities % of time
Megavoltage
Standard
IMRT
Stereotactic radiosurgery
Total body irradiation
Total skin electrons
Brachytherapy
High Dose Rate (HDR)
Low Dose Rate (LDR)
Seed
Kilovoltage equipment (superficial and/or orthovoltage)
Other
TOTAL 100%
Section 5: Impact of new/emerging technologies on your work
(25) What ongoing impact (estimate in percentage terms, ignoring the short term impact
that is typically associated with professionals learning and becoming proficient in a
new technology) has the introduction of any of the following technologies had on
your workload? (only respond if you have had direct experience in working with the
specified technology and please complete only one box in each row)
Technology
Estimated impact on workload (%)
Increase No
change Decrease
Don’t
know
Intensity Modulated Radiotherapy (IMRT)
Brachytherapy – HDR
Brachytherapy – LDR
Brachytherapy – Seed
Modulated arc therapy
Stereotactic radiosurgery/radiotherapy
Image fusion for treatment planning
Treatment verification imaging
Gated delivery
Four-dimensional computerised tomography
Adaptive planning and treatment (including IGRT)
Other (please specify)
Other (please specify)
(26) Please describe any other new/emerging technologies that you believe will
influence your workload in the future and their perceived impact.
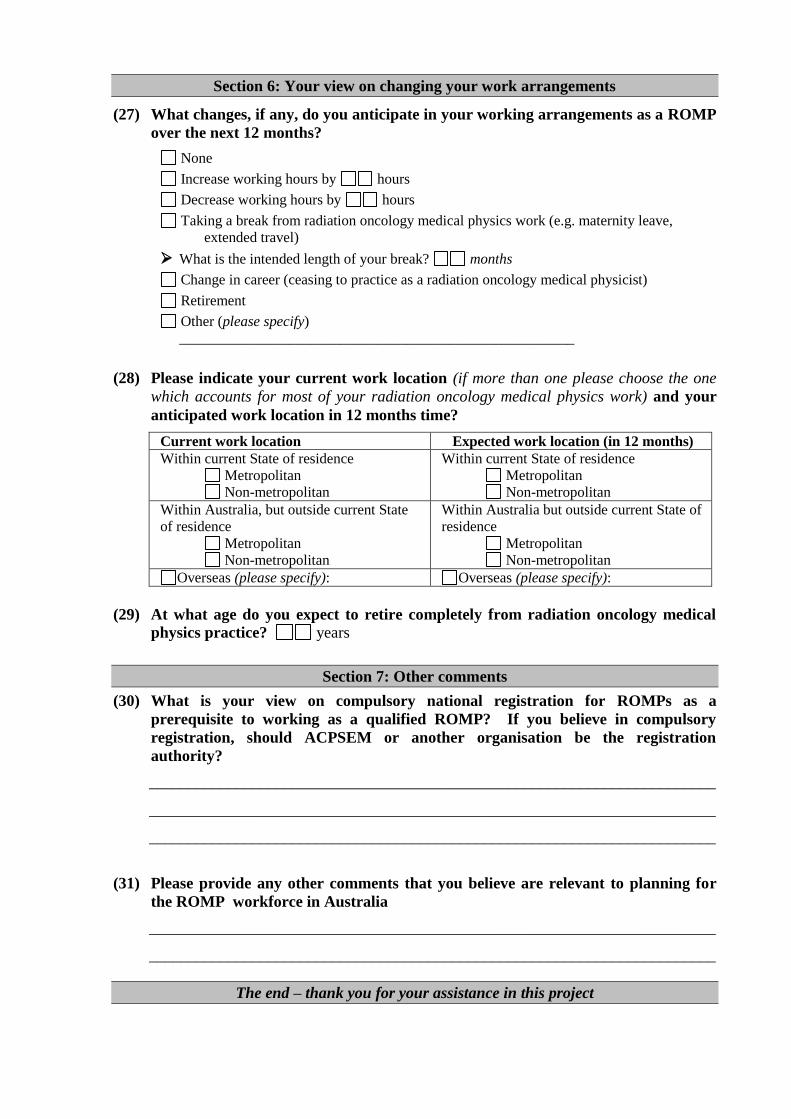
Section 6: Your view on changing your work arrangements
(27) What changes, if any, do you anticipate in your working arrangements as a ROMP
over the next 12 months?
None
Increase working hours by hours
Decrease working hours by hours
Taking a break from radiation oncology medical physics work (e.g. maternity leave,
extended travel)
What is the intended length of your break? months
Change in career (ceasing to practice as a radiation oncology medical physicist)
Retirement
Other (please specify)
______________________________________________________
(28) Please indicate your current work location (if more than one please choose the one
which accounts for most of your radiation oncology medical physics work) and your
anticipated work location in 12 months time?
Current work location Expected work location (in 12 months)
Within current State of residence
Metropolitan
Non-metropolitan
Within current State of residence
Metropolitan
Non-metropolitan
Within Australia, but outside current State
of residence
Metropolitan
Non-metropolitan
Within Australia but outside current State of
residence
Metropolitan
Non-metropolitan
Overseas (please specify): Overseas (please specify):
(29) At what age do you expect to retire completely from radiation oncology medical
physics practice? years
Section 7: Other comments
(30) What is your view on compulsory national registration for ROMPs as a
prerequisite to working as a qualified ROMP? If you believe in compulsory
registration, should ACPSEM or another organisation be the registration
authority?
_______________________________________________________________________
_______________________________________________________________________
_______________________________________________________________________
(31) Please provide any other comments that you believe are relevant to planning for
the ROMP workforce in Australia
_______________________________________________________________________
_______________________________________________________________________
The end – thank you for your assistance in this project

Appendix F
CASE STUDY FRAMEWORK
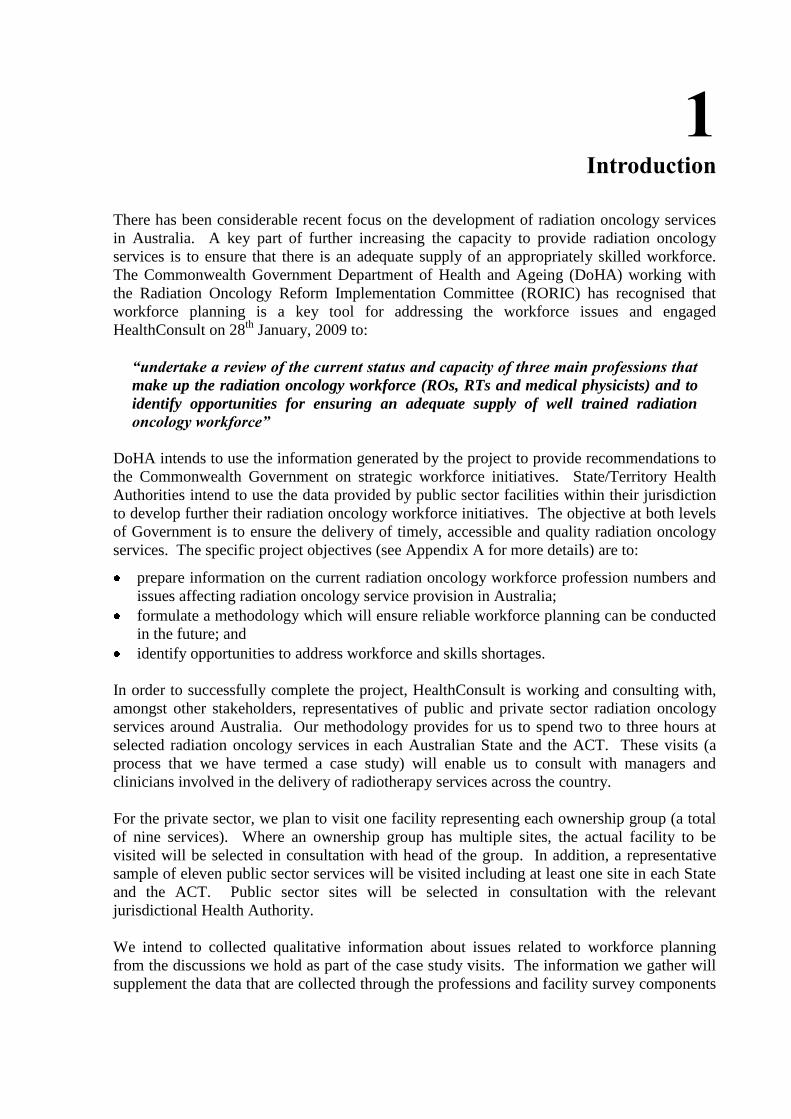
1 Introduction
There has been considerable recent focus on the development of radiation oncology services
in Australia. A key part of further increasing the capacity to provide radiation oncology
services is to ensure that there is an adequate supply of an appropriately skilled workforce.
The Commonwealth Government Department of Health and Ageing (DoHA) working with
the Radiation Oncology Reform Implementation Committee (RORIC) has recognised that
workforce planning is a key tool for addressing the workforce issues and engaged
HealthConsult on 28th
January, 2009 to:
“undertake a review of the current status and capacity of three main professions that
make up the radiation oncology workforce (ROs, RTs and medical physicists) and to
identify opportunities for ensuring an adequate supply of well trained radiation
oncology workforce”
DoHA intends to use the information generated by the project to provide recommendations to
the Commonwealth Government on strategic workforce initiatives. State/Territory Health
Authorities intend to use the data provided by public sector facilities within their jurisdiction
to develop further their radiation oncology workforce initiatives. The objective at both levels
of Government is to ensure the delivery of timely, accessible and quality radiation oncology
services. The specific project objectives (see Appendix A for more details) are to:
prepare information on the current radiation oncology workforce profession numbers and
issues affecting radiation oncology service provision in Australia;
formulate a methodology which will ensure reliable workforce planning can be conducted
in the future; and
identify opportunities to address workforce and skills shortages.
In order to successfully complete the project, HealthConsult is working and consulting with,
amongst other stakeholders, representatives of public and private sector radiation oncology
services around Australia. Our methodology provides for us to spend two to three hours at
selected radiation oncology services in each Australian State and the ACT. These visits (a
process that we have termed a case study) will enable us to consult with managers and
clinicians involved in the delivery of radiotherapy services across the country.
For the private sector, we plan to visit one facility representing each ownership group (a total
of nine services). Where an ownership group has multiple sites, the actual facility to be
visited will be selected in consultation with head of the group. In addition, a representative
sample of eleven public sector services will be visited including at least one site in each State
and the ACT. Public sector sites will be selected in consultation with the relevant
jurisdictional Health Authority.
We intend to collected qualitative information about issues related to workforce planning
from the discussions we hold as part of the case study visits. The information we gather will
supplement the data that are collected through the professions and facility survey components
of the project. Each radiation oncology facility around Australia should have received a
request to complete the facility survey (a copy of the facility survey form, along with a copy
of the professions survey for ROs, RTs and medical physicists can be downloaded at
www.healthconsult.com.au)
This document sets out the framework for the twenty case studies that will be undertaken in
the period from May to June 2009. It is targeted at managers and clinicians working in the
case study sites to assist them in to prepare for the case study discussions.
We also want to assure you that the views expressed through the case study process will
be strictly confidential. HealthConsult will analyse themes and patterns emerging from the
information collected through case studies but we will not attribute views to specific
individuals or services. The information will be used to assist us to interpret the data gathered
through the professions and facilities surveys as well as to contribute to the identification of
strategies for further development of the radiation oncology workforce.
Joe Scuteri or Lisa Fodero will be pleased to provide any further information that may be
required prior to the case study site visits.
Joe Scuteri
Director
HealthConsult
Phone: (02) 9261 3707
Mobile: 0418 819795
Fax: (02) 9261 3705
Email: [email protected]
Lisa Fodero
Associate Director
HealthConsult
Phone: (02) 9261 3707
Mobile: 0414 185711
Fax: (02) 9261 3705
Email: [email protected]
We would also greatly appreciate it if each site could nominate a case study coordinator with
whom we may liaise to work through the specific details of the process at each site. We will
ask the case study coordinators to assist us with the identification of the relevant managers
and clinicians to be involved in interviews and with the logistics associated with achieving the
required meetings in a two to three hour period that does not cause undue disruption to the
patient treatment work of the service.
2 Issues to be discussed
The issues to be discussed through the case study process come from the project terms of
reference (see Appendix A). As previously stated, we will be conducting approximately two
to three hour visits to the selected 20 radiation oncology services. The objective of the visit is
to have a series of discussions with personnel involved in the management and delivery of the
services. Key areas we expect to cover are:
any issues associated with the completion of the facility survey, including the provision of
explanation and assistance by HealthConsult as required;
overview of the service model used by the radiation oncology facility (i.e. number of
linacs, key therapies in use; number of clinicians in the various disciplines, etc);
overview of the key cancer sites/types treated a the facility and the specific therapies that
are used for the major cancer sites/types (i.e. specific service profiles);
discussion of how the service model might need to change in response to trends in cancer
incidence including planned developments in services at the facility (i.e. additional linacs,
additional features on existing linacs, additional staff recruited in key disciplines, role
substitution amongst staff in key disciplines, etc.);
the current workforce situation of the service covering the issues related to any perceived
shortfall in staff, the recruitment and retention strategies used, and any location (metro vs.
non-metro) or sector (public vs. private) specific concerns;
the desired service model in terms of linear accelerators and staffing levels for the service
and its feasibility/affordability in the location;
views on emerging radiation oncology technologies and the impact that they will have on
workforce requirements in the key disciplines; and
the local approaches to workforce planning (including recruitment and retention) and
ideas on workforce solutions that may be used to deal with identified issues.
3 Case Study Format
Each case study will involve a site visit for two to three hours by Joe Scuteri and Lisa Fodero
(the HealthConsult team). Whilst the precise scope of the visits will vary from site to site, we
have outlined a program for each of the visits. We anticipate that we will need to speak to a
range of stakeholders who will be in a position to discuss details of issues relating to
workforce planning. The key meetings to be held in the consultations include:
Meeting with the Facility Director/Manager (and/or proprietor(s) in the case of private
facilities). The meeting will provide us with an overview of the services and the issues
related to workforce planning. It will also enable us to discuss and resolve any issues
associated with completion of the facilities survey.
Meeting(s) with the heads of radiation oncology, radiotherapy and medical physics. This
meeting (or meetings if it is more convenient to meet with the three individuals separately)
will cover the detailed issues with regards to the numbers (actual and desired) of professionals
in each discipline, the recruitment and retention issues and the emerging service delivery
issues and their impact on workforce needs.
Focus Group workshop for ROs, RTs, medical physicists and services managers
working at the facility. This meeting will enable all staff in the three key disciplines to
contribute their views on the workforce planning issues and their ideas on strategies that
might be used to address the issues.
We expect that the maximum length of time for any one meeting will be one hour but most
meetings should be able to be completed within 30 to 45 minutes. It is likely that there will
be somewhere between three to four meetings (to be determined in consultation with the
nominated case study coordinator) at each site to allow all stakeholders to be engaged.